Recently Published Bulletin Reports
Manam (Papua New Guinea) Few ash plumes during November-December 2022
Krakatau (Indonesia) Strombolian activity and ash plumes during November 2022-April 2023
Stromboli (Italy) Strombolian explosions and lava flows continue during January-April 2023
Nishinoshima (Japan) Small ash plumes and fumarolic activity during November 2022 through April 2023
Karangetang (Indonesia) Lava flows, incandescent avalanches, and ash plumes during January-June 2023
Ahyi (United States) Intermittent hydroacoustic signals and discolored plumes during November 2022-June 2023
Kadovar (Papua New Guinea) An ash plume and weak thermal anomaly during May 2023
San Miguel (El Salvador) Small gas-and-ash explosions during March and May 2023
Semisopochnoi (United States) Occasional explosions, ash deposits, and gas-and-steam plumes during December 2022-May 2023
Ebeko (Russia) Continued explosions, ash plumes, and ashfall during October 2022-May 2023
Home Reef (Tonga) Discolored plumes continued during November 2022-April 2023
Ambae (Vanuatu) New lava flow, ash plumes, and sulfur dioxide plumes during February-May 2023
Manam (Papua New Guinea) — July 2023  Cite this Report
Manam
Papua New Guinea
4.08°S, 145.037°E; summit elev. 1807 m
All times are local (unless otherwise noted)
Few ash plumes during November-December 2022
Manam is a 10-km-wide island that consists of two active summit craters: the Main summit crater and the South summit crater and is located 13 km off the northern coast of mainland Papua New Guinea. Frequent mild-to-moderate eruptions have been recorded since 1616. The current eruption period began during June 2014 and has more recently been characterized by intermittent ash plumes and thermal activity (BGVN 47:11). This report updates activity that occurred from November 2022 through May 2023 based on information from the Darwin Volcanic Ash Advisory Center (VAAC) and various satellite data.
Ash plumes were reported during November and December 2022 by the Darwin VAAC. On 7 November an ash plume rose to 2.1 km altitude and drifted NE based on satellite images and weather models. On 14 November an ash plume rose to 2.1 km altitude and drifted W based on RVO webcam images. On 20 November ash plumes rose to 1.8 km altitude and drifted NW. On 26 December an ash plume rose to 3 km altitude and drifted S and SSE.
Intermittent sulfur dioxide plumes were detected using the TROPOMI instrument on the Sentinel-5P satellite, some of which exceeded at least two Dobson Units (DU) and drifted in different directions (figure 93). Occasional low-to-moderate power thermal anomalies were recorded by the MIROVA (Middle InfraRed Observation of Volcanic Activity) system; less than five anomalies were recorded each month during November 2022 through May 2023 (figure 94). Two thermal hotspots were detected by the MODVOLC thermal alerts system on 10 December 2022. On clear weather days, thermal activity was also captured in infrared satellite imagery in both the Main and South summit craters, accompanied by gas-and-steam emissions (figure 95).
Geologic Background. The 10-km-wide island of Manam, lying 13 km off the northern coast of mainland Papua New Guinea, is one of the country's most active volcanoes. Four large radial valleys extend from the unvegetated summit of the conical basaltic-andesitic stratovolcano to its lower flanks. These valleys channel lava flows and pyroclastic avalanches that have sometimes reached the coast. Five small satellitic centers are located near the island's shoreline on the northern, southern, and western sides. Two summit craters are present; both are active, although most observed eruptions have originated from the southern crater, concentrating eruptive products during much of the past century into the SE valley. Frequent eruptions, typically of mild-to-moderate scale, have been recorded since 1616. Occasional larger eruptions have produced pyroclastic flows and lava flows that reached flat-lying coastal areas and entered the sea, sometimes impacting populated areas.
Information Contacts: Rabaul Volcano Observatory (RVO), Geohazards Management Division, Department of Mineral Policy and Geohazards Management (DMPGM), PO Box 3386, Kokopo, East New Britain Province, Papua New Guinea; Darwin Volcanic Ash Advisory Centre (VAAC), Bureau of Meteorology, Northern Territory Regional Office, PO Box 40050, Casuarina, NT 0811, Australia (URL: http://www.bom.gov.au/info/vaac/); MIROVA (Middle InfraRed Observation of Volcanic Activity), a collaborative project between the Universities of Turin and Florence (Italy) supported by the Centre for Volcanic Risk of the Italian Civil Protection Department (URL: http://www.mirovaweb.it/); Hawai'i Institute of Geophysics and Planetology (HIGP) - MODVOLC Thermal Alerts System, School of Ocean and Earth Science and Technology (SOEST), Univ. of Hawai'i, 2525 Correa Road, Honolulu, HI 96822, USA (URL: http://modis.higp.hawaii.edu/); NASA Global Sulfur Dioxide Monitoring Page, Atmospheric Chemistry and Dynamics Laboratory, NASA Goddard Space Flight Center (NASA/GSFC), 8800 Greenbelt Road, Goddard, Maryland, USA (URL: https://so2.gsfc.nasa.gov/); Copernicus Browser, Copernicus Data Space Ecosystem, European Space Agency (URL: https://dataspace.copernicus.eu/browser/).
Krakatau (Indonesia) — July 2023 Cite this Report
Krakatau
Indonesia
6.1009°S, 105.4233°E; summit elev. 285 m
All times are local (unless otherwise noted)
Strombolian activity and ash plumes during November 2022-April 2023
Krakatau is located in the Sunda Strait between Java and Sumatra, Indonesia. Caldera collapse during the catastrophic 1883 eruption destroyed Danan and Perbuwatan cones and left only a remnant of Rakata. The post-collapse cone of Anak Krakatau (Child of Krakatau) was constructed within the 1883 caldera at a point between the former Danan and Perbuwatan cones; it has been the site of frequent eruptions since 1927. The current eruption period began in May 2021 and has recently consisted of explosions, ash plumes, and thermal activity (BGVN 47:11). This report covers activity during November 2022 through April 2023 based on information provided by the Indonesian Center for Volcanology and Geological Hazard Mitigation, referred to as Pusat Vulkanologi dan Mitigasi Bencana Geologi (PVMBG), MAGMA Indonesia, the Darwin Volcanic Ash Advisory Center (VAAC), and several sources of satellite data.
Activity was relatively low during November and December 2022. Daily white gas-and-steam plumes rose 25-100 m above the summit and drifted in different directions. Gray ash plumes rose 200 m above the summit and drifted NE at 1047 and at 2343 on 11 November. On 14 November at 0933 ash plumes rose 300 m above the summit and drifted E. An ash plume was reported at 0935 on 15 December that rose 100 m above the summit and drifted NE. An eruptive event at 1031 later that day generated an ash plume that rose 700 m above the summit and drifted NE. A gray ash plume at 1910 rose 100 m above the summit and drifted E. Incandescent material was ejected above the vent based on an image taken at 1936.
During January 2023 daily white gas-and-steam plumes rose 25-300 m above the summit and drifted in multiple directions. Gray-to-brown ash plumes were reported at 1638 on 3 January, at 1410 and 1509 on 4 January, and at 0013 on 5 January that rose 100-750 m above the summit and drifted NE and E; the gray-to-black ash plume at 1509 on 4 January rose as high as 3 km above the summit and drifted E. Gray ash plumes were recorded at 1754, 2241, and 2325 on 11 January and at 0046 on 12 January and rose 200-300 m above the summit and drifted NE. Toward the end of January, PVMBG reported that activity had intensified; Strombolian activity was visible in webcam images taken at 0041, 0043, and 0450 on 23 January. Multiple gray ash plumes throughout the day rose 200-500 m above the summit and drifted E and SE (figure 135). Webcam images showed progressively intensifying Strombolian activity at 1919, 1958, and 2113 on 24 January; a gray ash plume at 1957 rose 300 m above the summit and drifted E (figure 135). Eruptive events at 0231 and 2256 on 25 January and at 0003 on 26 January ejected incandescent material from the vent, based on webcam images. Gray ash plumes observed during 26-27 January rose 300-500 m above the summit and drifted NE, E, and SE.
Low levels of activity were reported during February and March. Daily white gas-and-steam plumes rose 25-300 m above the summit and drifted in different directions. The Darwin VAAC reported that continuous ash emissions rose to 1.5-1.8 km altitude and drifted W and NW during 1240-1300 on 10 March, based on satellite images, weather models, and PVMBG webcams. White-and-gray ash plumes rose 500 m and 300 m above the summit and drifted SW at 1446 and 1846 on 18 March, respectively. An eruptive event was recorded at 2143, though it was not visible due to darkness. Multiple ash plumes were reported during 27-29 March that rose as high as 2.5 km above the summit and drifted NE, W, and SW (figure 136). Webcam images captured incandescent ejecta above the vent at 0415 and around the summit area at 2003 on 28 March and at 0047 above the vent on 29 March.
Daily white gas-and-steam plumes rose 25-300 m above the summit and drifted in multiple directions during April and May. White-and-gray and black plumes rose 50-300 m above the summit on 2 and 9 April. On 11 May at 1241 a gray ash plume rose 1-3 km above the summit and drifted SW. On 12 May at 0920 a gray ash plume rose 2.5 km above the summit and drifted SW and at 2320 an ash plume rose 1.5 km above the summit and drifted SW. An accompanying webcam image showed incandescent ejecta. On 13 May at 0710 a gray ash plume rose 2 km above the summit and drifted SW (figure 137).
The MIROVA (Middle InfraRed Observation of Volcanic Activity) graph of MODIS thermal anomaly data showed intermittent low-to-moderate power thermal anomalies during November 2022 through April 2023 (figure 138). Some of this thermal activity was also visible in infrared satellite imagery at the crater, accompanied by gas-and-steam and ash plumes that drifted in different directions (figure 139).
Geologic Background. The renowned Krakatau (frequently mis-named as Krakatoa) volcano lies in the Sunda Strait between Java and Sumatra. Collapse of an older edifice, perhaps in 416 or 535 CE, formed a 7-km-wide caldera. Remnants of that volcano are preserved in Verlaten and Lang Islands; subsequently the Rakata, Danan, and Perbuwatan cones were formed, coalescing to create the pre-1883 Krakatau Island. Caldera collapse during the catastrophic 1883 eruption destroyed Danan and Perbuwatan, and left only a remnant of Rakata. This eruption caused more than 36,000 fatalities, most as a result of tsunamis that swept the adjacent coastlines of Sumatra and Java. Pyroclastic surges traveled 40 km across the Sunda Strait and reached the Sumatra coast. After a quiescence of less than a half century, the post-collapse cone of Anak Krakatau (Child of Krakatau) was constructed within the 1883 caldera at a point between the former Danan and Perbuwatan cones. Anak Krakatau has been the site of frequent eruptions since 1927.
Information Contacts: Pusat Vulkanologi dan Mitigasi Bencana Geologi (PVMBG, also known as Indonesian Center for Volcanology and Geological Hazard Mitigation, CVGHM), Jalan Diponegoro 57, Bandung 40122, Indonesia (URL: http://www.vsi.esdm.go.id/); MAGMA Indonesia, Kementerian Energi dan Sumber Daya Mineral (URL: https://magma.esdm.go.id/v1); Darwin Volcanic Ash Advisory Centre (VAAC), Bureau of Meteorology, Northern Territory Regional Office, PO Box 40050, Casuarina, NT 0811, Australia (URL: http://www.bom.gov.au/info/vaac/); MIROVA (Middle InfraRed Observation of Volcanic Activity), a collaborative project between the Universities of Turin and Florence (Italy) supported by the Centre for Volcanic Risk of the Italian Civil Protection Department (URL: http://www.mirovaweb.it/); Copernicus Browser, Copernicus Data Space Ecosystem, European Space Agency (URL: https://dataspace.copernicus.eu/browser/).
Stromboli
Italy
38.789°N, 15.213°E; summit elev. 924 m
All times are local (unless otherwise noted)
Strombolian explosions and lava flows continue during January-April 2023
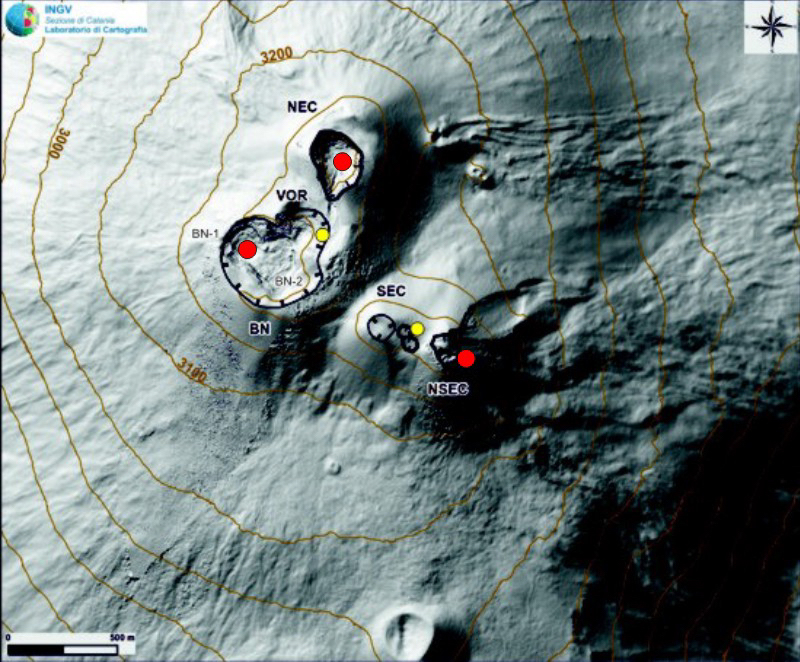
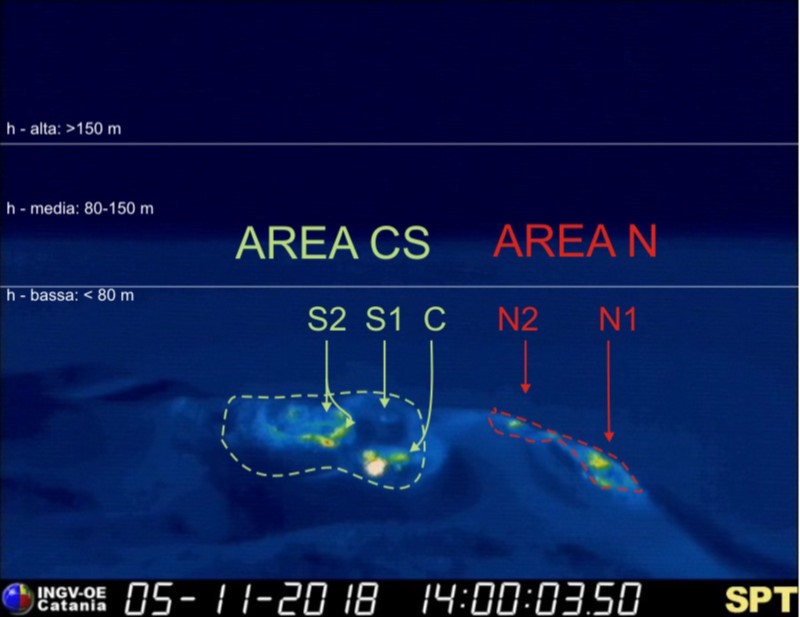
Stromboli, located in Italy, has exhibited nearly constant lava fountains for the past 2,000 years; recorded eruptions date back to 350 BCE. Eruptive activity occurs at the summit from multiple vents, which include a north crater area (N area) and a central-southern crater (CS area) on a terrace known as the ‘terrazza craterica’ at the head of the Sciara del Fuoco, a large scarp that runs from the summit down the NW side of the volcano-island. Activity typically consists of Strombolian explosions, incandescent ejecta, lava flows, and pyroclastic flows. Thermal and visual monitoring cameras are located on the nearby Pizzo Sopra La Fossa, above the terrazza craterica, and at multiple flank locations. The current eruption period has been ongoing since 1934 and recent activity has consisted of frequent Strombolian explosions and lava flows (BGVN 48:02). This report updates activity during January through April 2023 primarily characterized by Strombolian explosions and lava flows based on reports from Italy's Istituto Nazionale di Geofisica e Vulcanologia (INGV) and various satellite data.
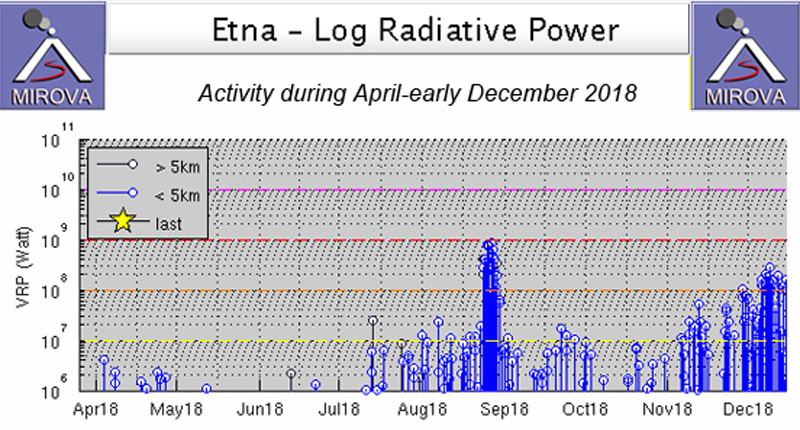
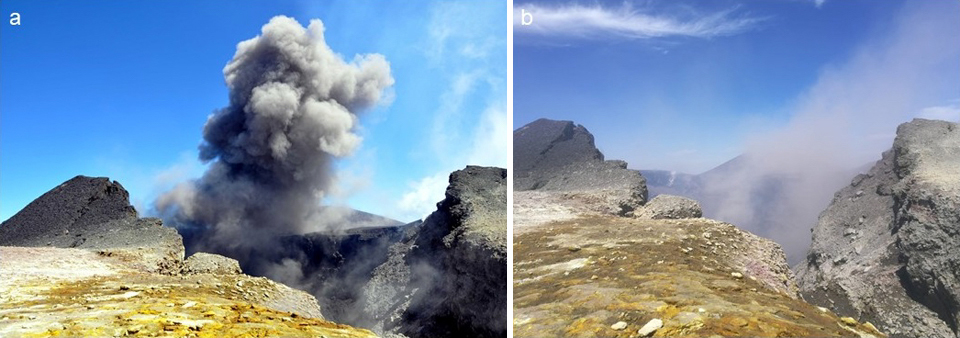
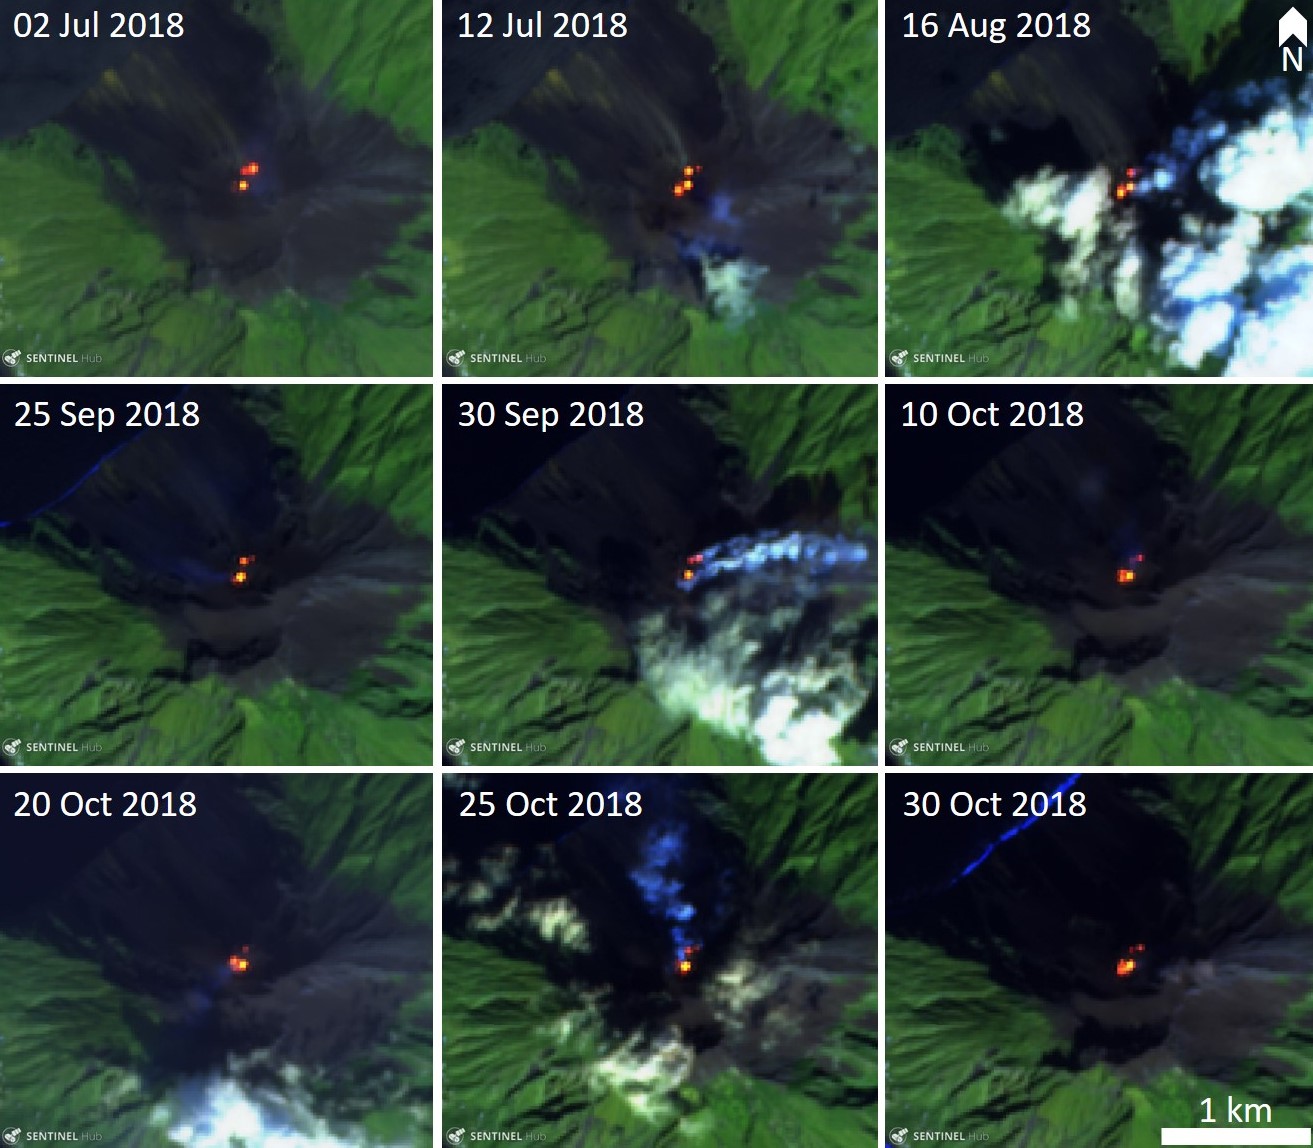
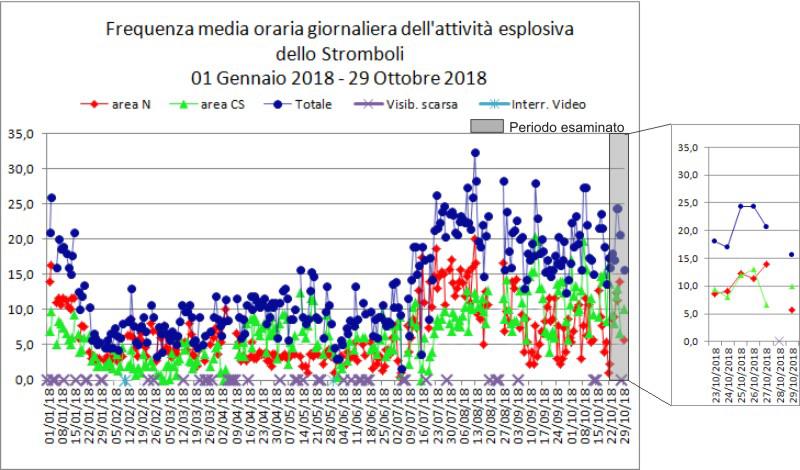
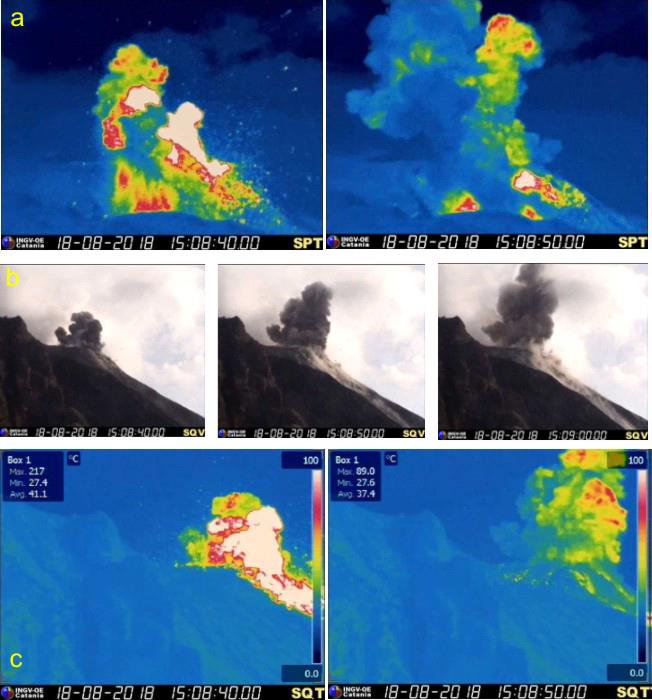
Frequent explosive activity continued throughout the reporting period, generally in the low-to-medium range, based on the number of hourly explosions in the summit crater (figure 253, table 16). Intermittent thermal activity was recorded by the MIROVA (Middle InfraRed Observation of Volcanic Activity) analysis of MODIS satellite data (figure 254). According to data collected by the MODVOLC thermal algorithm, a total of 9 thermal alerts were detected: one on 2 January 2023, one on 1 February, five on 24 March, and two on 26 March. The stronger pulses of thermal activity likely reflected lava flow events. Infrared satellite imagery captured relatively strong thermal hotspots at the two active summit craters on clear weather days, showing an especially strong event on 8 March (figure 255).
Table 16. Summary of type, frequency, and intensity of explosive activity at Stromboli by month during January-April 2023; information from webcam observations. Courtesy of INGV weekly reports.
| Month |
Explosive Activity |
| Jan 2023 |
Typical Strombolian activity with spattering and lava overflows in the N crater area. Explosions were reported from 4 vents in the N area and 1-2 vents in the CS area. The average hourly frequency of explosions was low-to-medium (1-12 events/hour). The intensity of the explosions varied from low (less than 80 m high) to medium (less than 150 m high) in the N crater area and up to high (greater than 150 m high) in the CS crater area. |
| Feb 2023 |
Typical Strombolian activity with spattering in the N crater area. Explosions were reported from 2-3 vents in the N area and 1-4 vents in the CS area. The average hourly frequency of explosions was low-to-medium (1-14 events/hour). The intensity of the explosions varied from low (less than 80 m high) to medium (less than 150 m high) in the N crater area and up to high (greater than 150 m high) in the CS crater area. |
| Mar 2023 |
Typical Strombolian activity with spattering and lava overflows in the N crater area. Explosions were reported from 2-3 vents in the N area and 2-4 vents in the CS area. The average hourly frequency of explosions was low-to-medium (1-18 events/hour). The intensity of the explosions varied from low (less than 80 m high) to medium (less than 150 m high) in the N crater area and up to high (greater than 150 m high) in the CS crater area. |
| Apr 2023 |
Typical Strombolian activity. Explosions were reported from 2 vents in the N area and 2-3 vents in the CS area. The average hourly frequency of explosions was low-to-high (1-16 events/hour). The intensity of the explosions varied from low (less than 80 m high) to medium (less than 150 m high) in both the N and CS crater areas. |
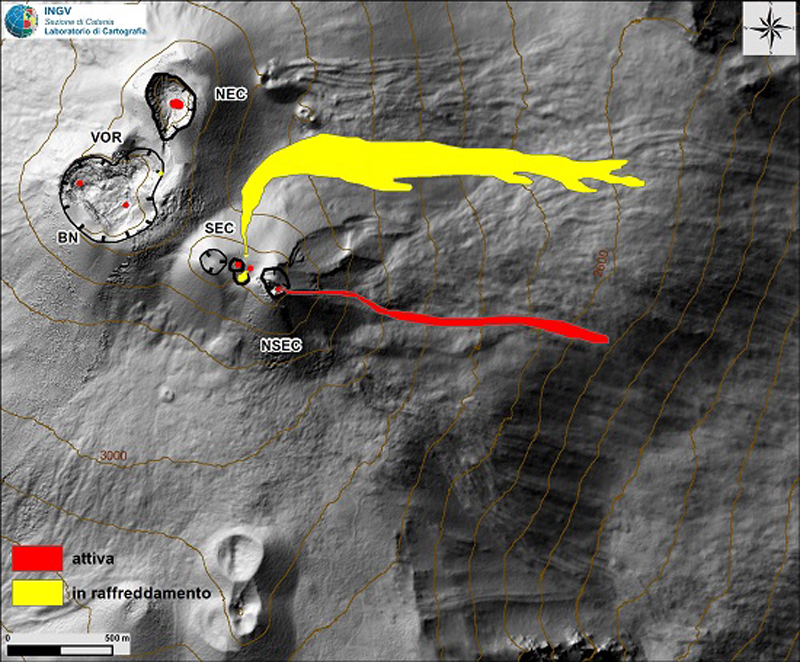
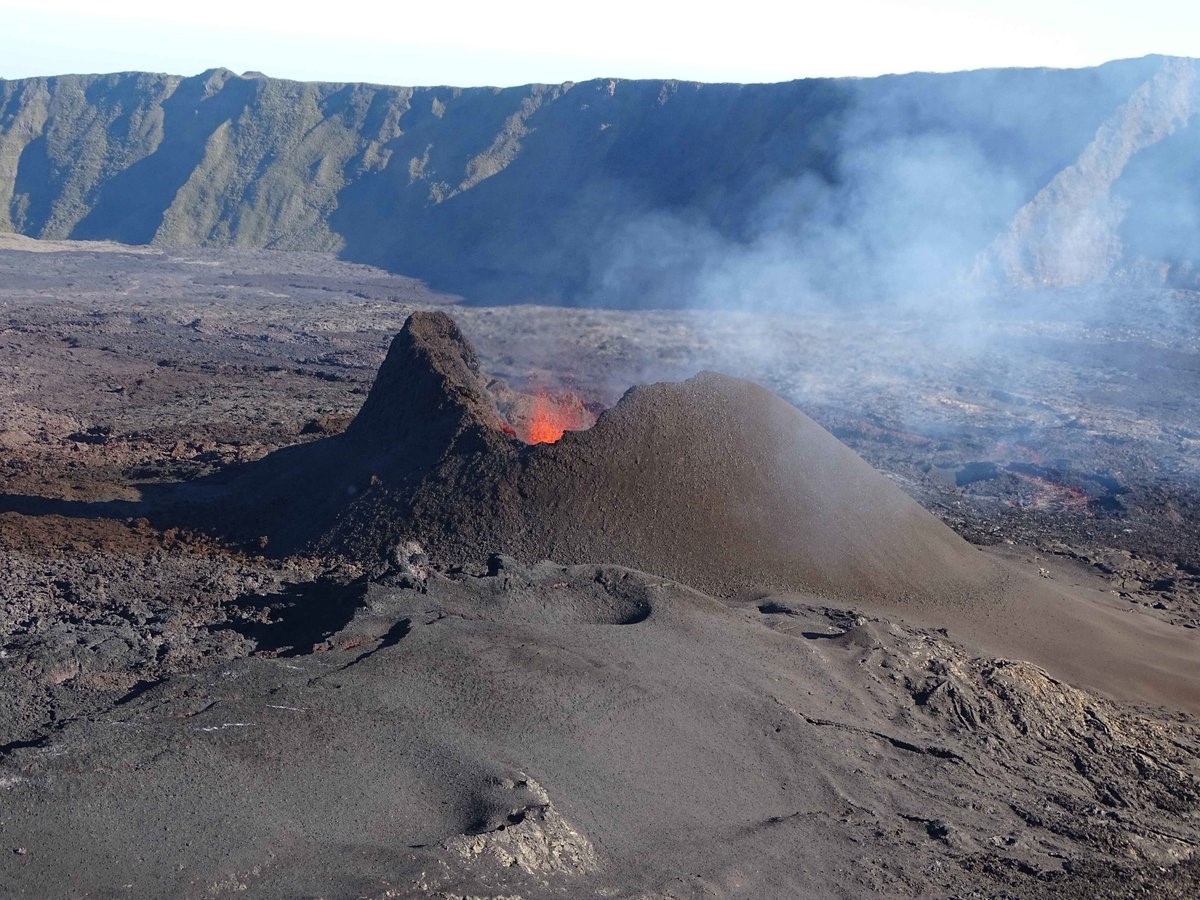
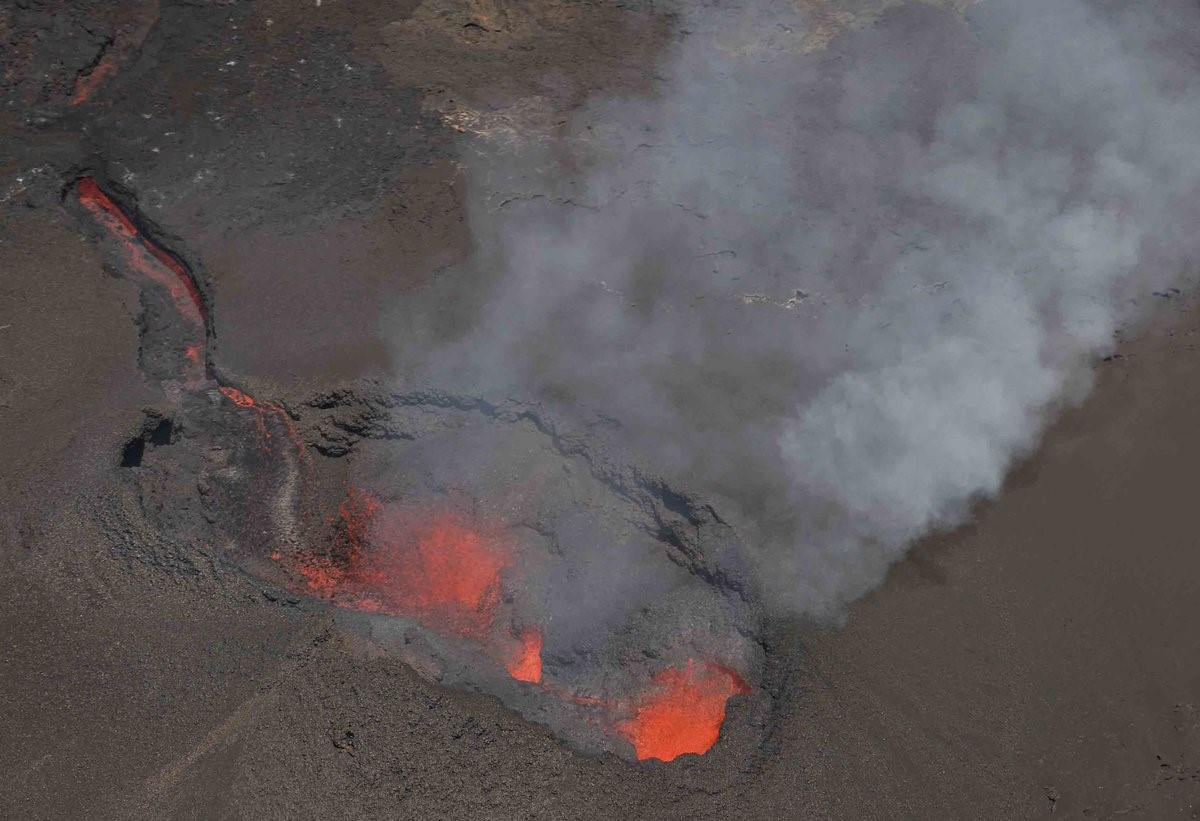
Activity during January-February 2023. Strombolian explosions were reported in the N crater area, as well as lava effusion. Explosive activity in the N crater area ejected coarse material (bombs and lapilli). Intense spattering was observed in both the N1 and N2 craters. In the CS crater area, explosions generally ejected fine material (ash), sometimes to heights greater than 250 m. The intensity of the explosions was characterized as low-to-medium in the N crater and medium-to-high in the CS crater. After intense spattering activity from the N crater area, a lava overflow began at 2136 on 2 January that flowed part way down the Sciara del Fuoco, possibly moving down the drainage that formed in October, out of view from webcams. The flow remained active for a couple of hours before stopping and beginning to cool. A second lava flow was reported at 0224 on 4 January that similarly remained active for a few hours before stopping and cooling. Intense spattering was observed on 11 and 13 January from the N1 crater. After intense spattering activity at the N2 crater at 1052 on 17 January another lava flow started to flow into the upper part of the Sciara del Fuoco (figure 256), dividing into two: one that traveled in the direction of the drainage formed in October, and the other one moving parallel to the point of emission. By the afternoon, the rate of the flow began to decrease, and at 1900 it started to cool. A lava flow was reported at 1519 on 24 January following intense spattering in the N2 area, which began to flow into the upper part of the Sciara del Fuoco. By the morning of 25 January, the lava flow had begun to cool. During 27 January the frequency of eruption in the CS crater area increased to 6-7 events/hour compared to the typical 1-7 events/hour; the following two days showed a decrease in frequency to less than 1 event/hour. Starting at 1007 on 30 January a high-energy explosive sequence was produced by vents in the CS crater area. The sequence began with an initial energetic pulse that lasted 45 seconds, ejecting predominantly coarse products 300 m above the crater that fell in an ESE direction. Subsequent and less intense explosions ejected material 100 m above the crater. The total duration of this event lasted approximately two minutes. During 31 January through 6, 13, and 24 February spattering activity was particularly intense for short periods in the N2 crater.
An explosive sequence was reported on 16 February that was characterized by a major explosion in the CS crater area (figure 257). The sequence began at 1817 near the S2 crater that ejected material radially. A few seconds later, lava fountains were observed in the central part of the crater. Three explosions of medium intensity (material was ejected less than 150 m high) were recorded at the S2 crater. The first part of this sequence lasted approximately one minute, according to INGV, and material rose 300 m above the crater and then was deposited along the Sciara del Fuoco. The second phase began at 1818 at the S1 crater; it lasted seven seconds and material was ejected 150 m above the crater. Another event 20 seconds later lasted 12 seconds, also ejecting material 150 m above the crater. The sequence ended with at least three explosions of mostly fine material from the S1 crater. The total duration of this sequence was about two minutes.
Short, intense spattering activity was noted above the N1 crater on 27 and 28 February. A lava overflow was first reported at 0657 from the N2 crater on 27 February that flowed into the October 2022 drainage. By 1900 the flow had stopped. A second lava overflow also in the N crater area occurred at 2149, which overlapped the first flow and then stopped by 0150 on 28 February. Material detached from both the lava overflows rolled down the Sciara del Fuoco, some of which was visible in webcam images.
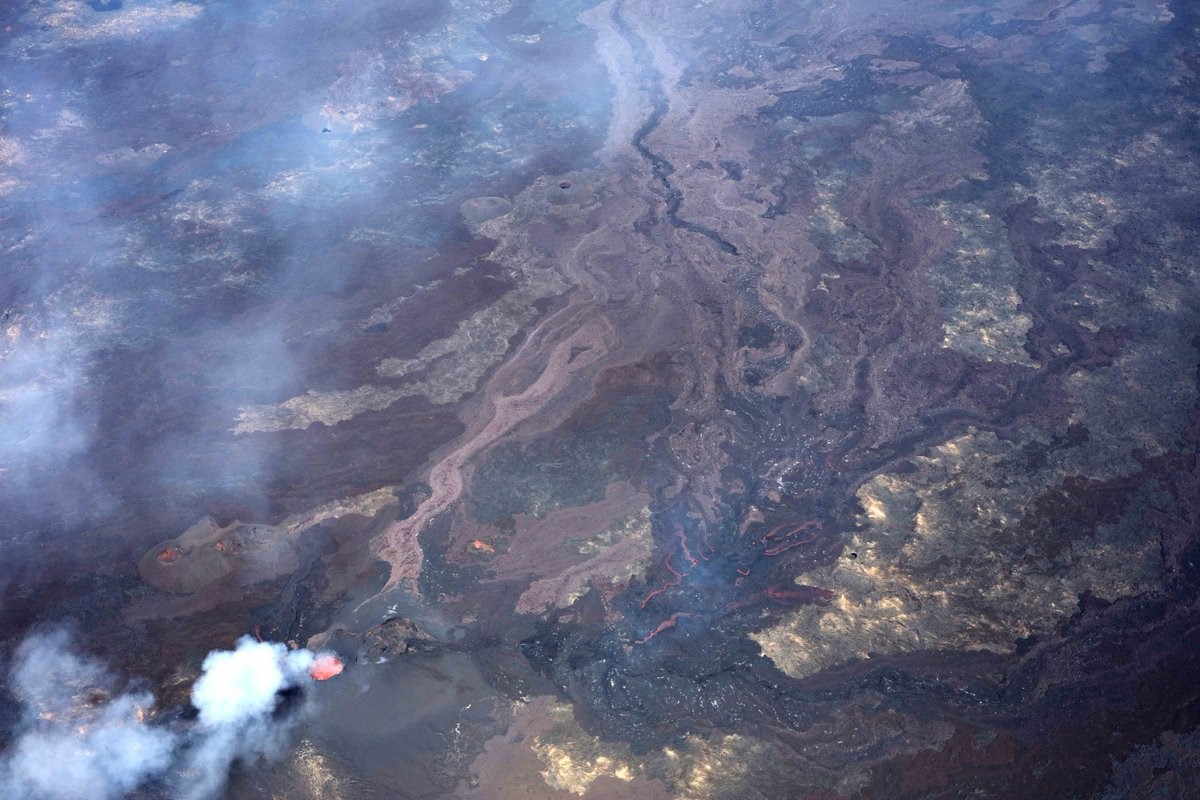
Activity during March-April 2023. Strombolian activity continued with spattering activity and lava overflows in the N crater area during March. Explosive activity at the N crater area varied from low (less than 80 m high) to medium (less than 150 m high) and ejected coarse material, such as bombs and lapilli. Spattering was observed above the N1 crater, while explosive activity at the CS crater area varied from medium to high (greater than 150 m high) and ejected coarse material. Intense spattering activity was observed for short periods on 6 March above the N1 crater. At approximately 0610 a lava overflow was reported around the N2 crater on 8 March, which then flowed into the October 2022 drainage. By 1700 the flow started to cool. A second overflow began at 1712 on 9 March and overlapped the previous flow. It had stopped by 2100. Material from both flows was deposited along the Sciara del Fuoco, though much of the activity was not visible in webcam images. On 11 March a lava overflow was observed at 0215 that overlapped the two previous flows in the October 2022 drainage. By late afternoon on 12 March, it had stopped.
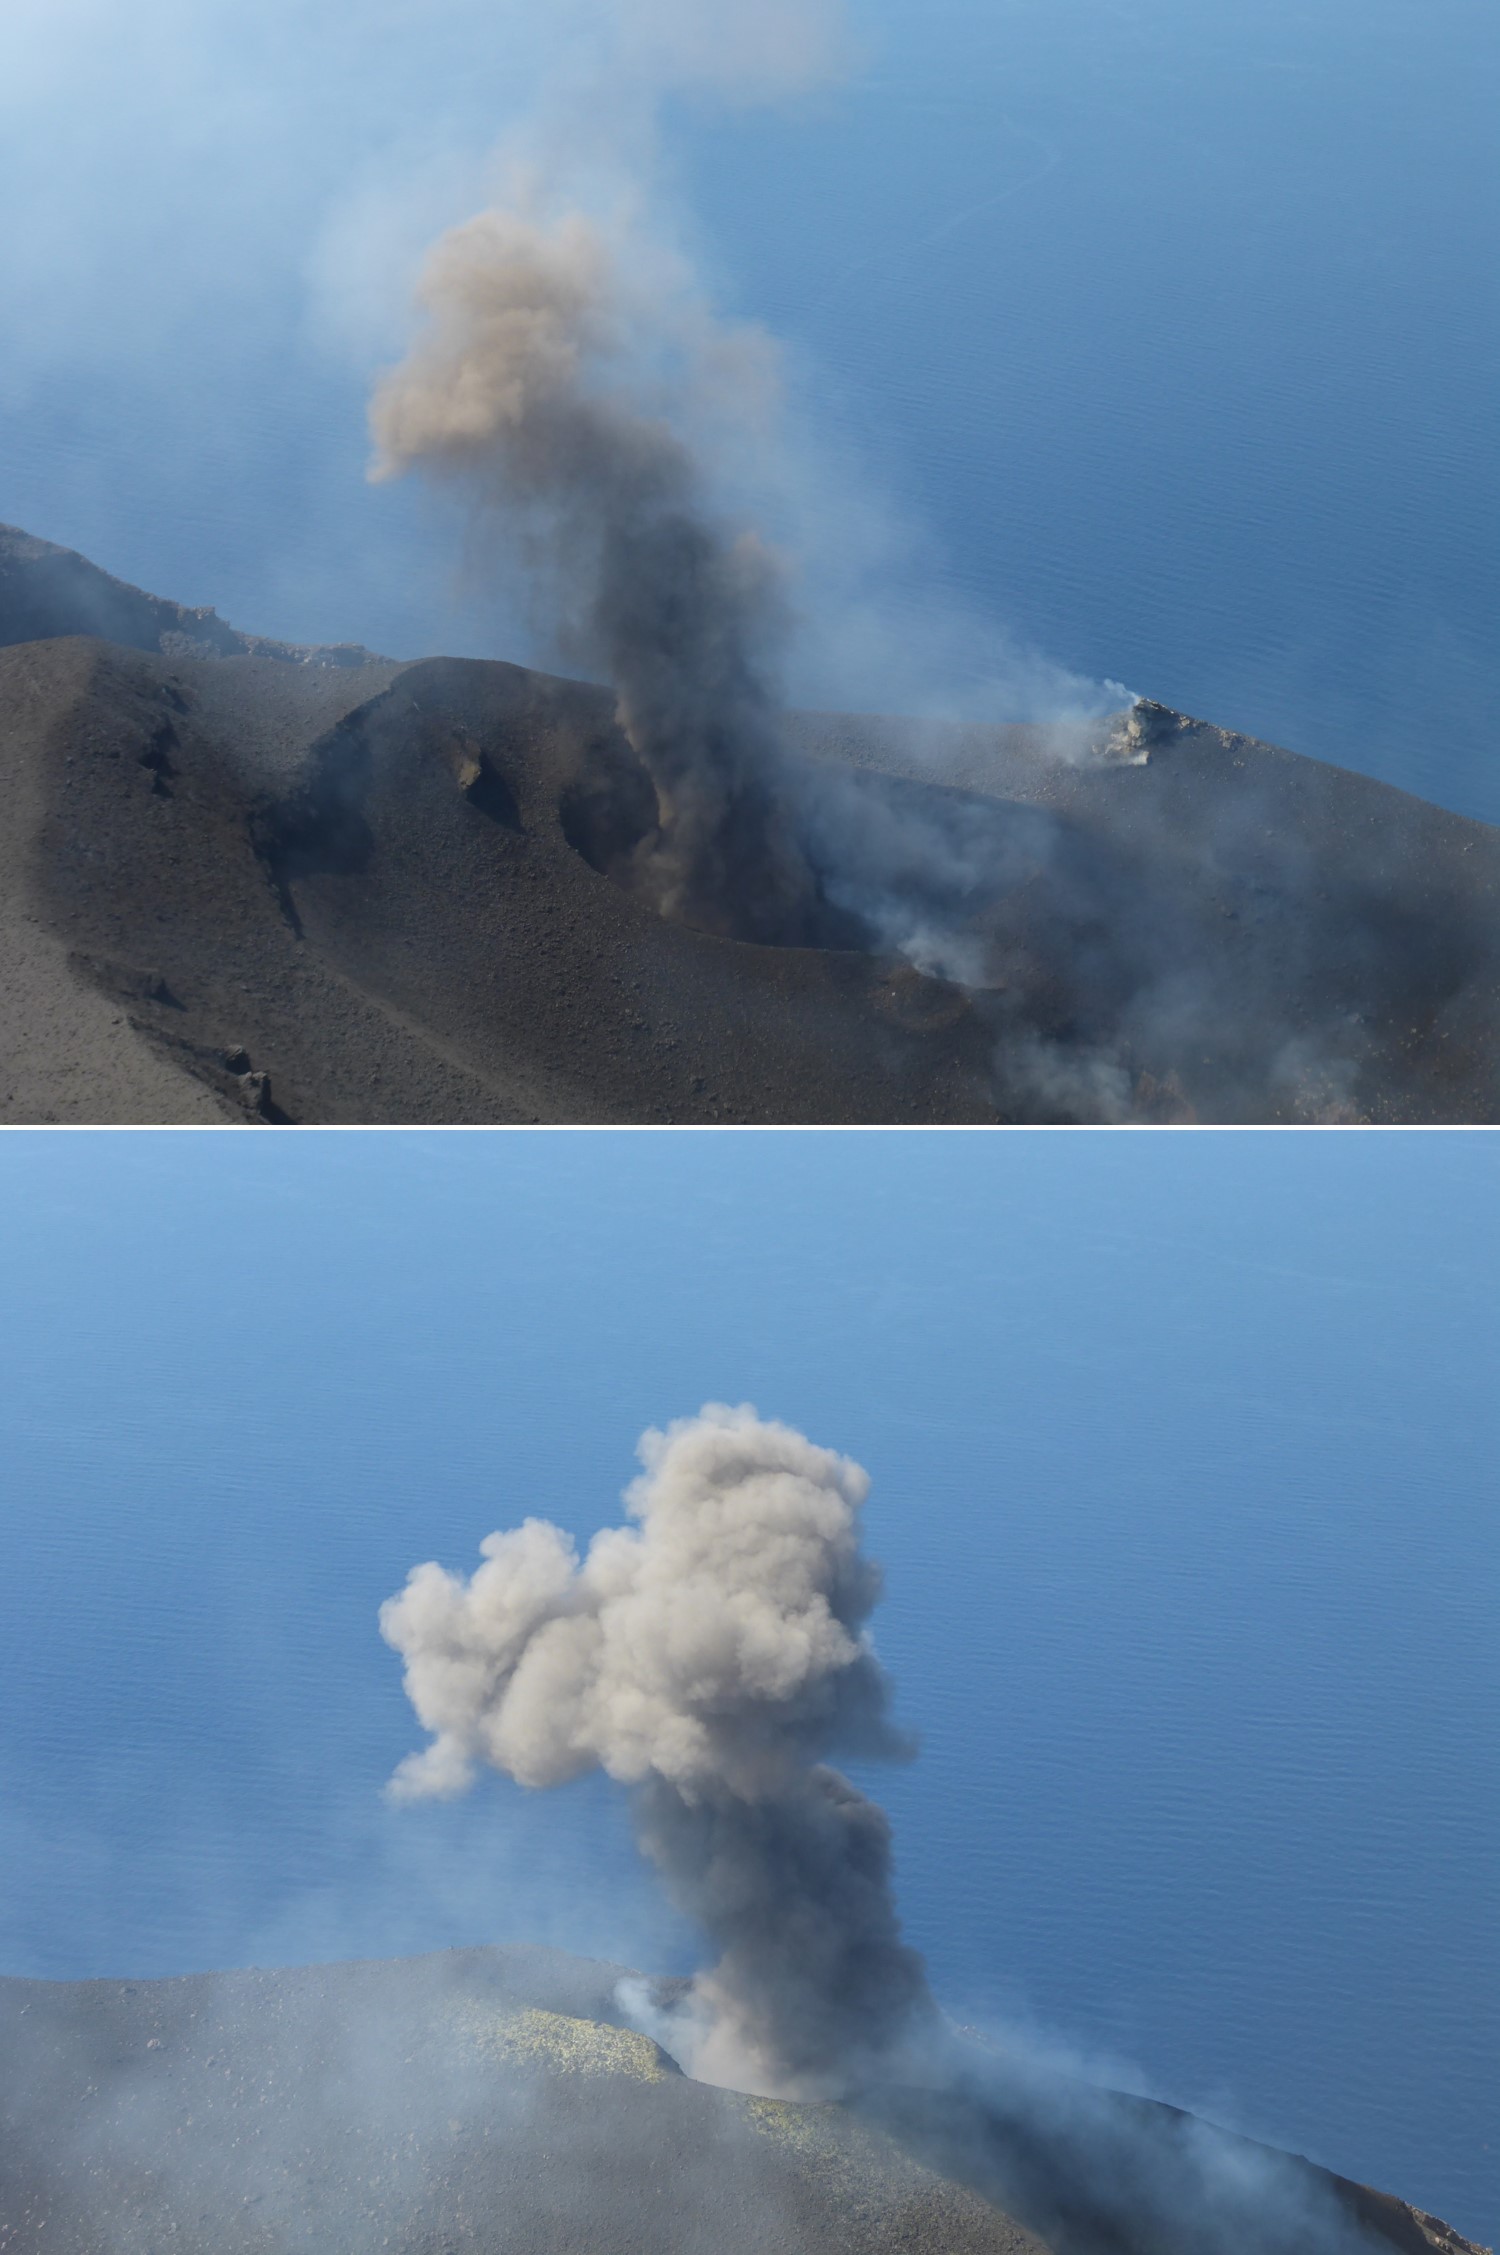
During a field excursion on 16 March, scientists noted that a vent in the central crater area was degassing. Another vent showed occasional Strombolian activity that emitted ash and lapilli. During 1200-1430 low-to-medium intense activity was reported; the N1 crater emitted ash emissions and the N2 crater emitted both ash and coarse material. Some explosions also occurred in the CS crater area that ejected coarse material. The C crater in the CS crater area occasionally showed gas jetting and low intensity explosions on 17 and 22 March; no activity was observed at the S1 crater. Intense, longer periods of spattering were reported in the N1 crater on 19, 24, and 25 March. Around 2242 on 23 March a lava overflow began from the N1 crater that, after about an hour, began moving down the October 2022 drainage and flow along the Sciara del Fuoco (figure 258). Between 0200 and 0400 on 26 March the flow rate increased, which generated avalanches of material from collapses at the advancing flow front. By early afternoon, the flow began to cool. On 25 March at 1548 an explosive sequence began from one of the vents at S2 in the CS crater area (figure 258). Fine ash mixed with coarse material was ejected 300 m above the crater rim and drifted SSE. Some modest explosions around Vent C were detected at 1549 on 25 March, which included an explosion at 1551 that ejected coarse material. The entire explosive sequence lasted approximately three minutes.
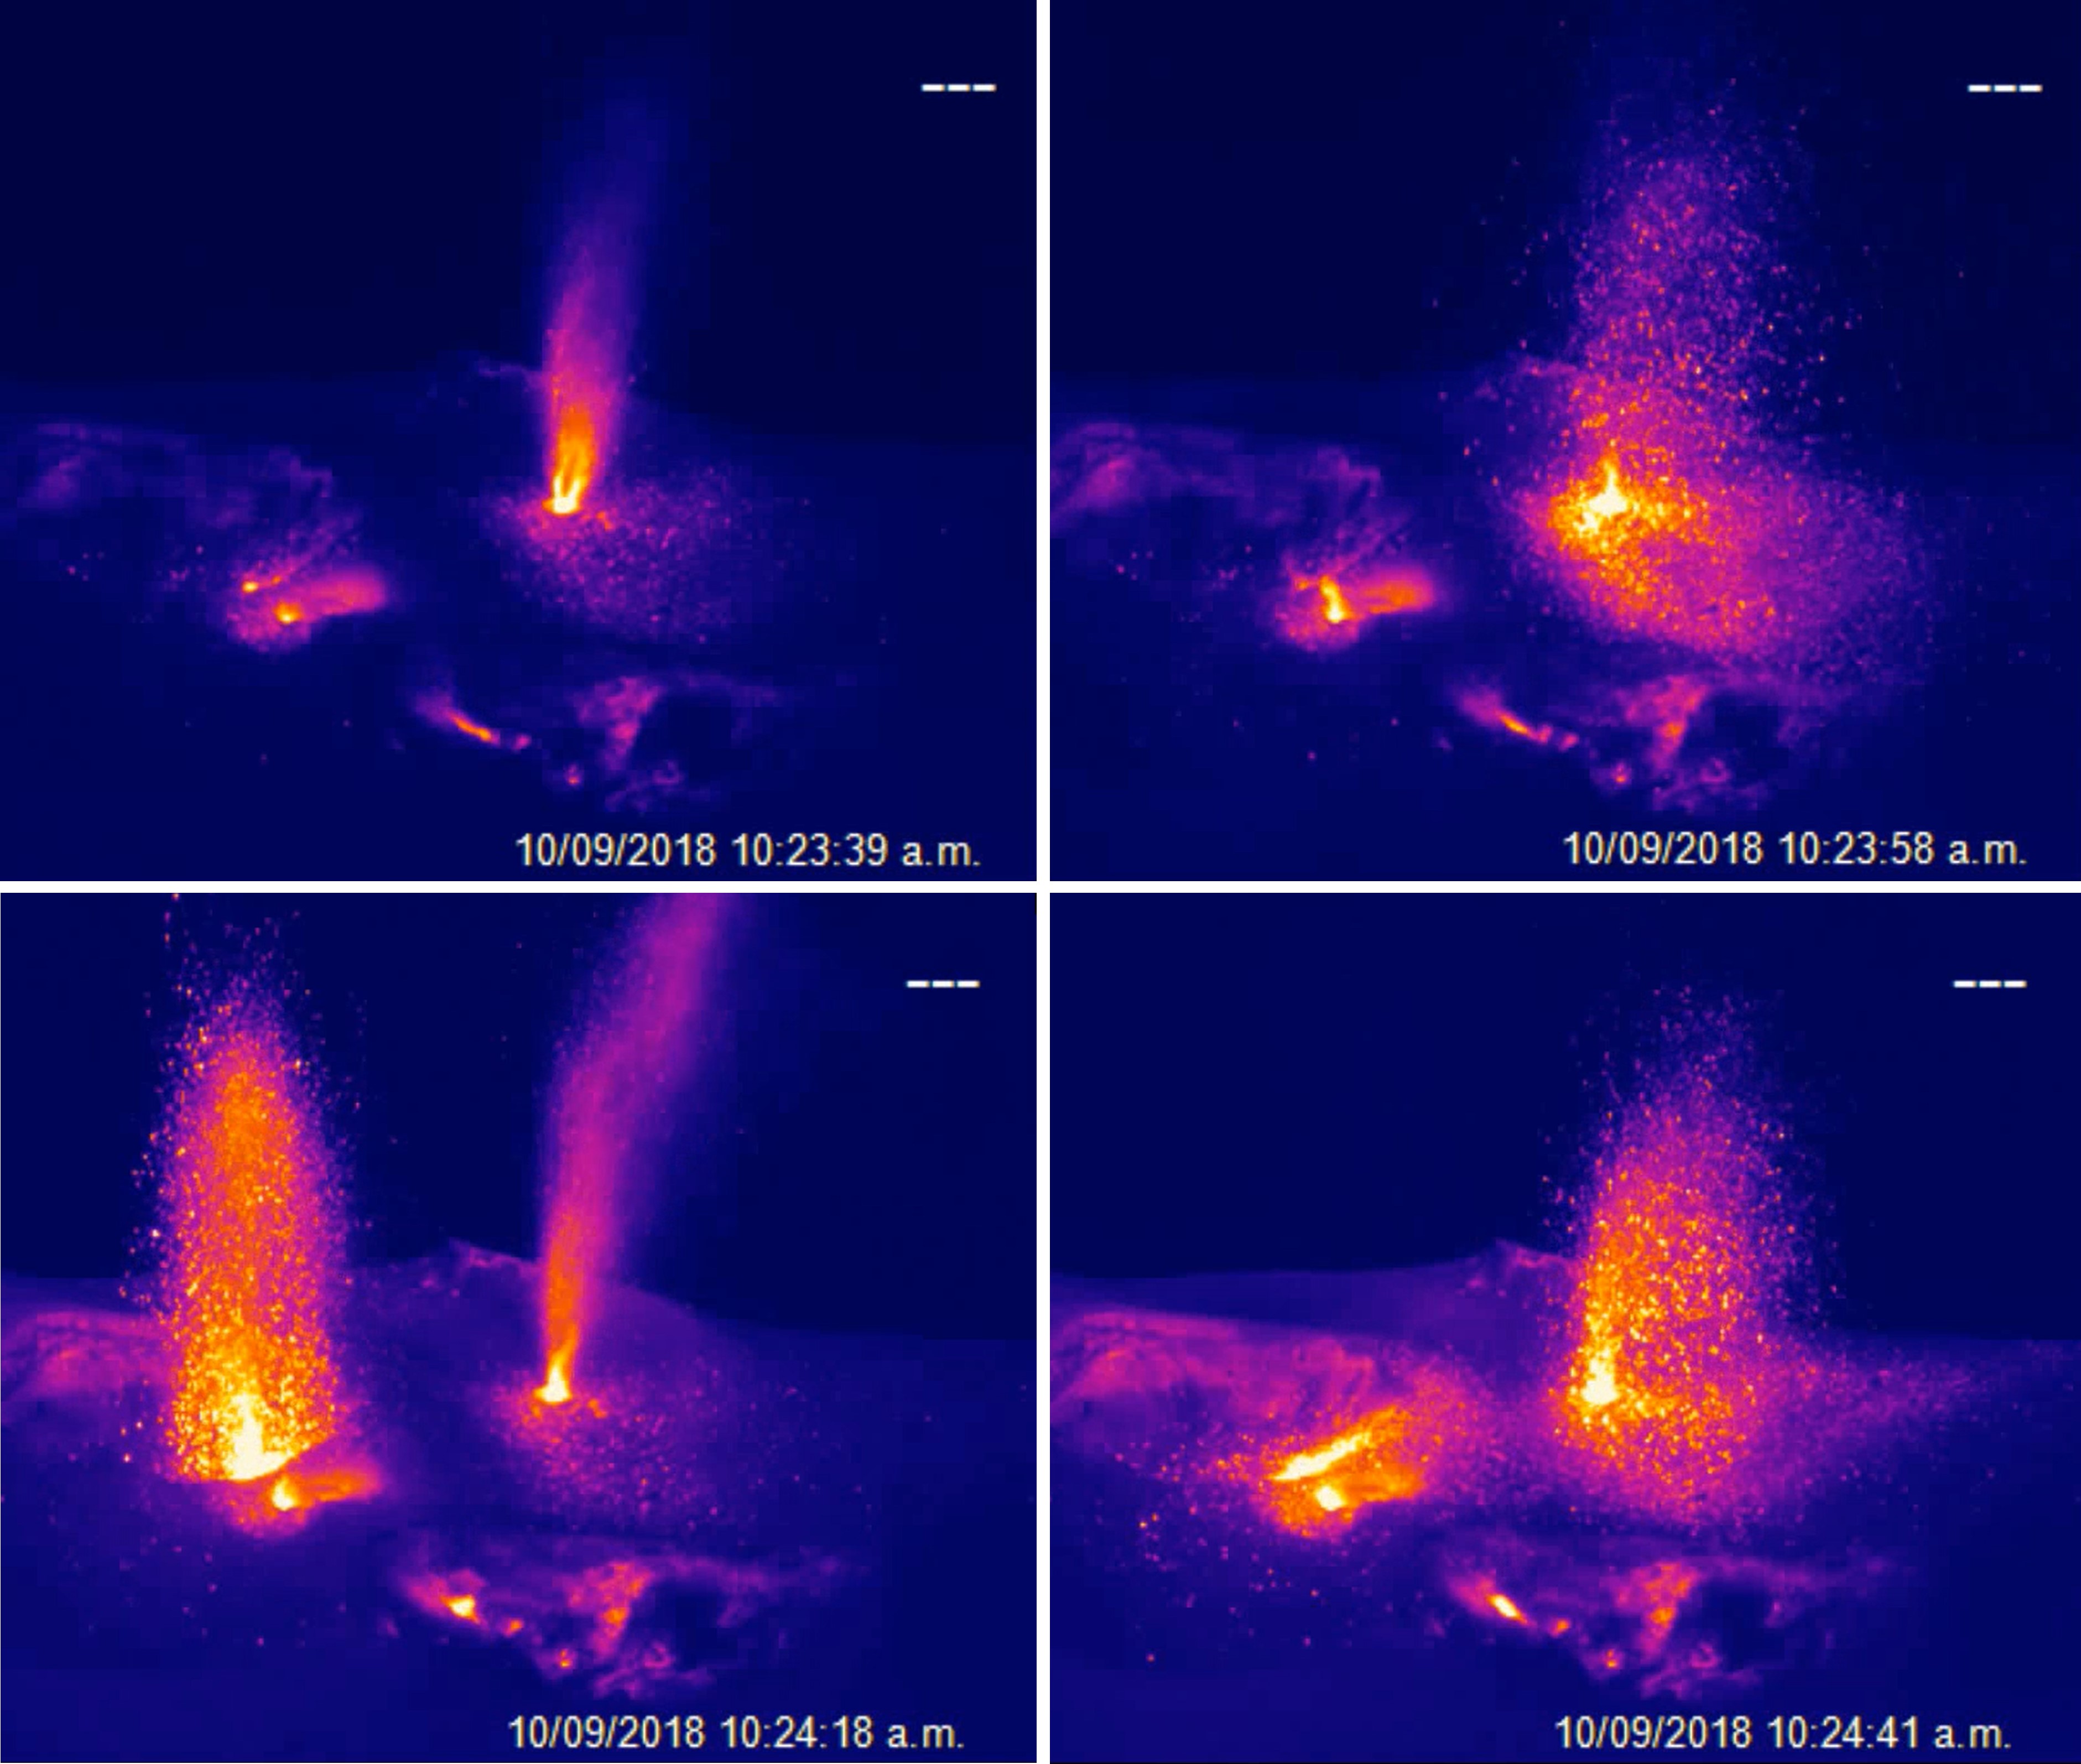
During April explosions persisted in both the N and CS crater areas. Fine material was ejected less than 80 m above the N crater rim until 6 April, followed by ejection of coarser material. Fine material was also ejected less than 80 m above the CS crater rim. The C and S2 crater did not show significant eruptive activity. On 7 April an explosive sequence was detected in the CS crater area at 1203 (figure 259). The first explosion lasted approximately 18 seconds and ejected material 400 m above the crater rim, depositing pyroclastic material in the upper part of the Sciara del Fuoco. At 1204 a second, less intense explosion lasted approximately four seconds and deposited pyroclastic products outside the crater area and near Pizzo Sopra La Fossa. A third explosion at 1205 was mainly composed of ash that rose about 150 m above the crater and lasted roughly 20 seconds. A fourth explosion occurred at 1205 about 28 seconds after the third explosion and ejected a mixture of coarse and fine material about 200 m above the crater; the explosion lasted roughly seven seconds. Overall, the entire explosive sequence lasted about two minutes and 20 seconds. After the explosive sequence on 7 April, explosions in both the N and CS crater areas ejected material as high as 150 m above the crater.
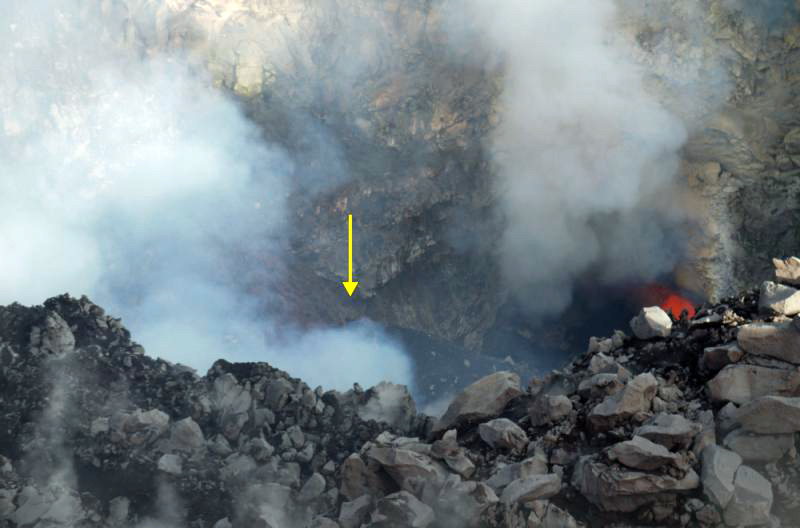
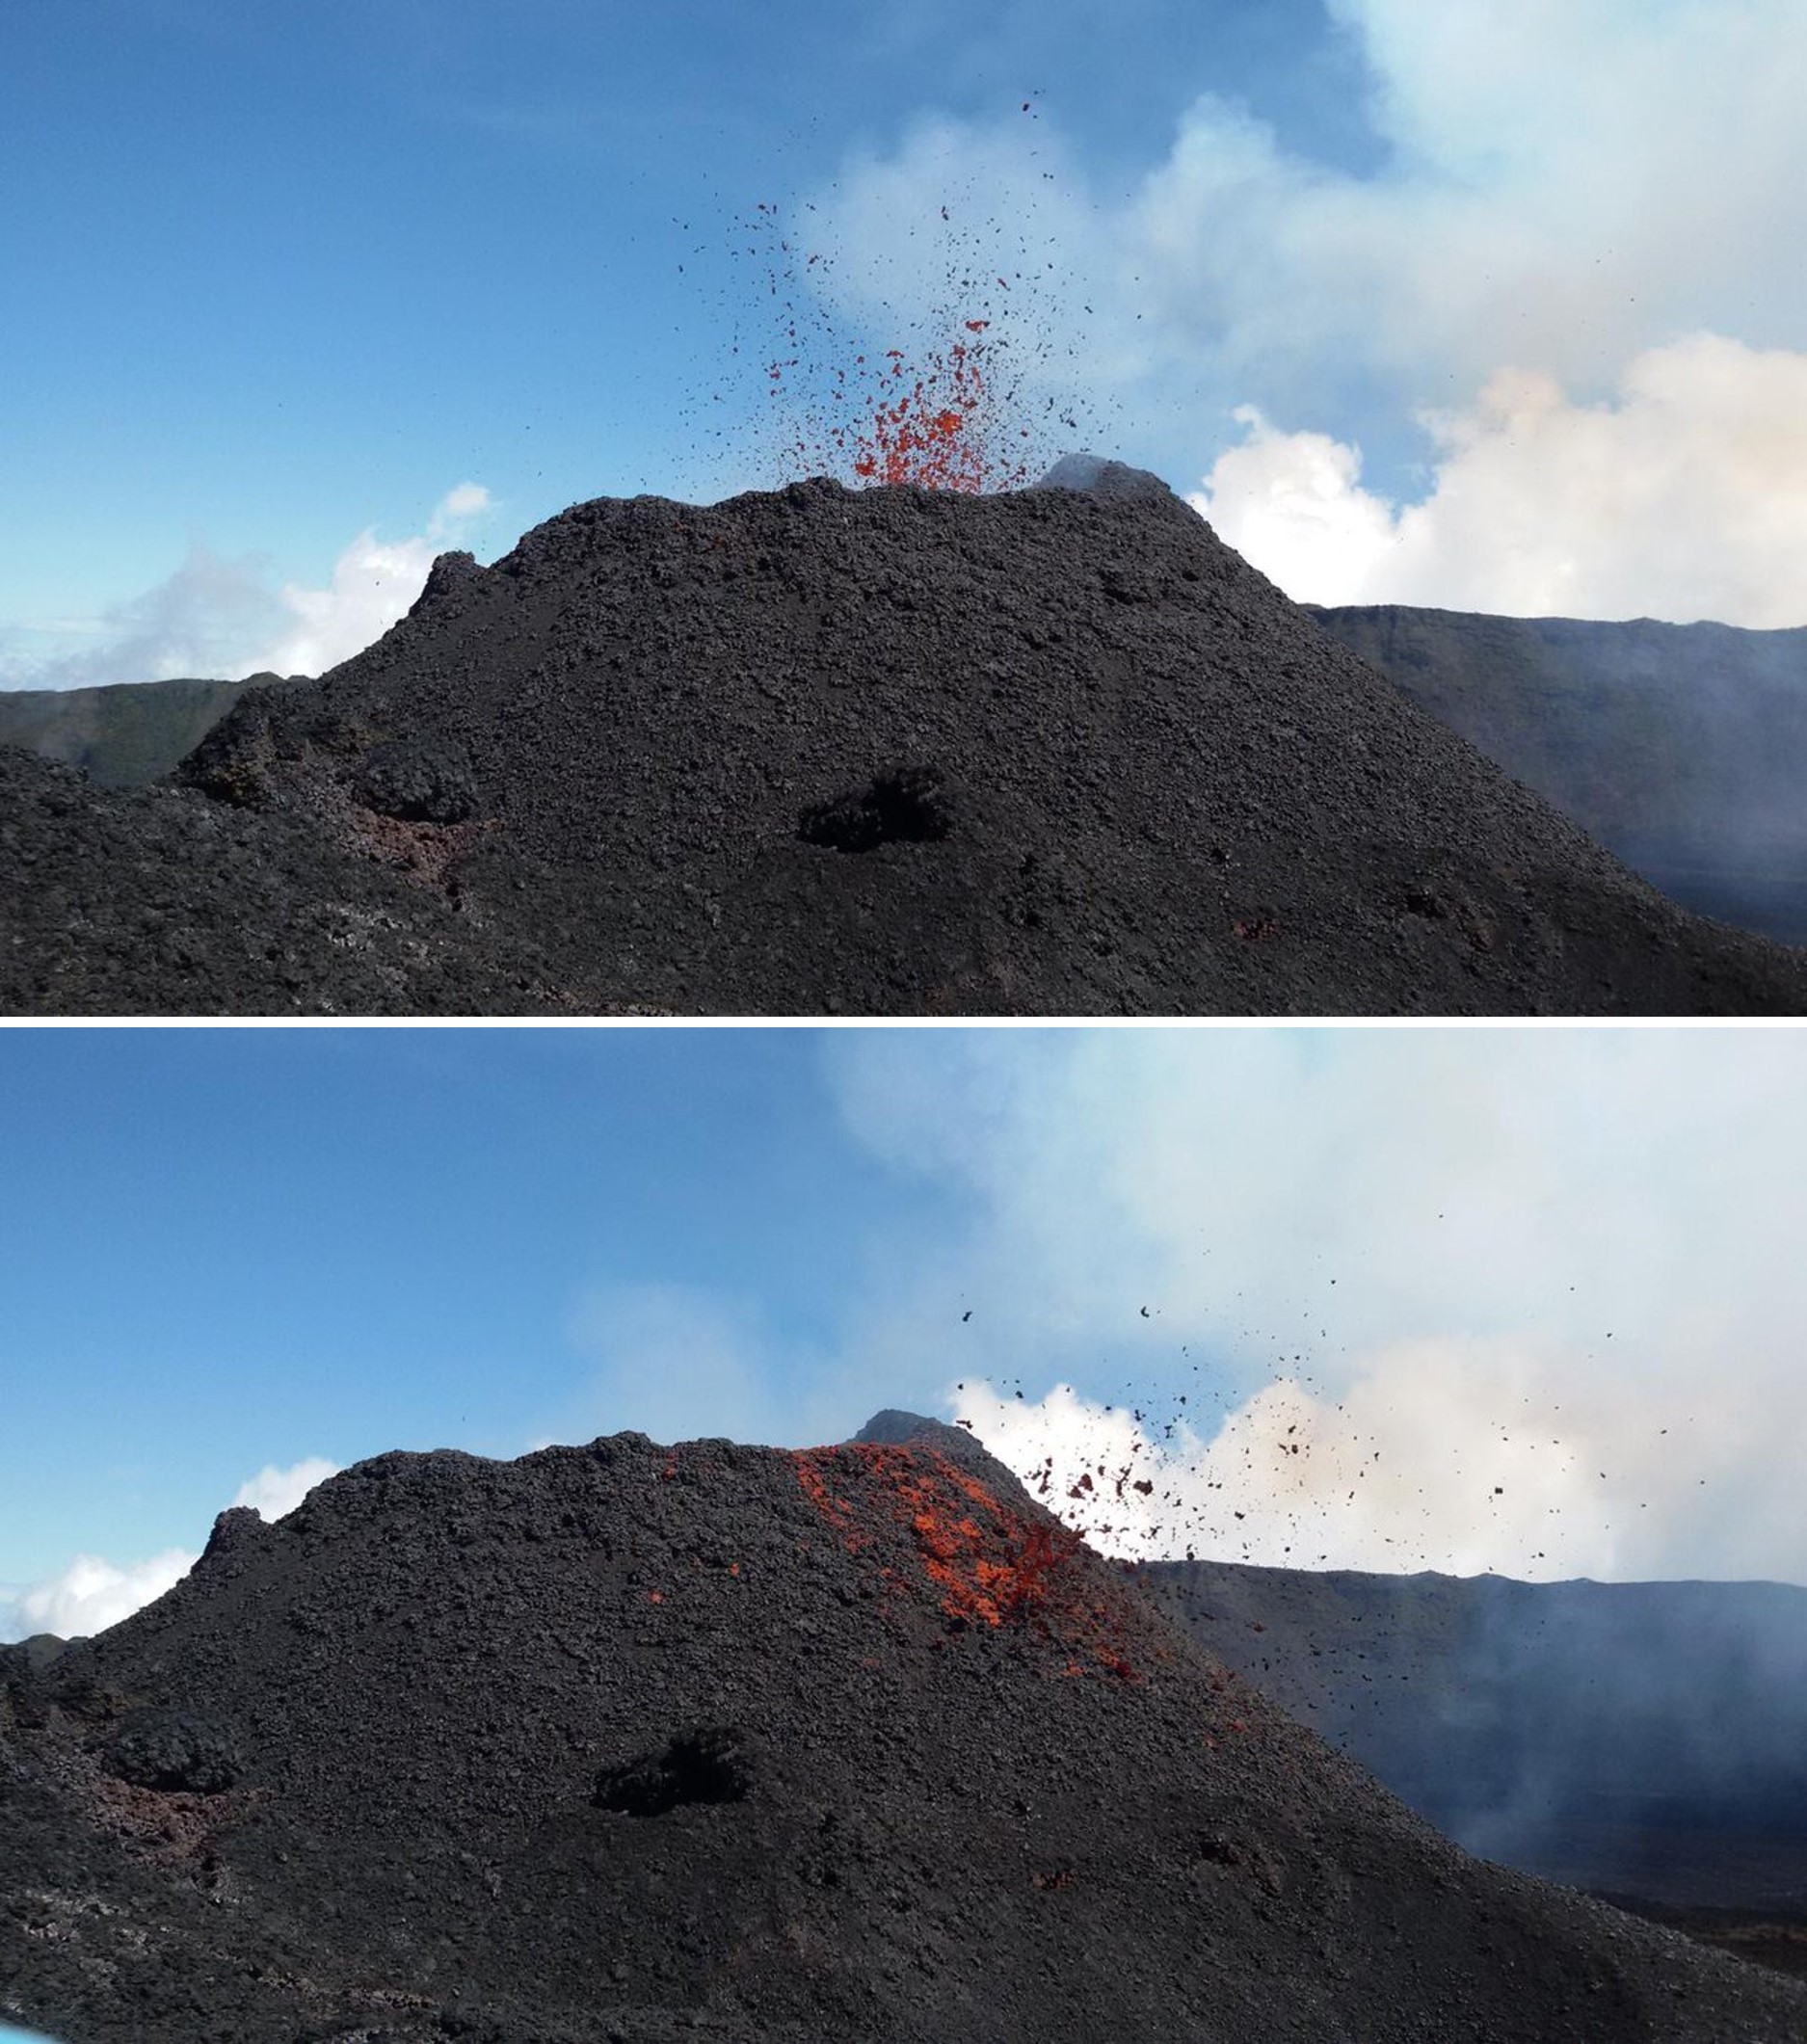
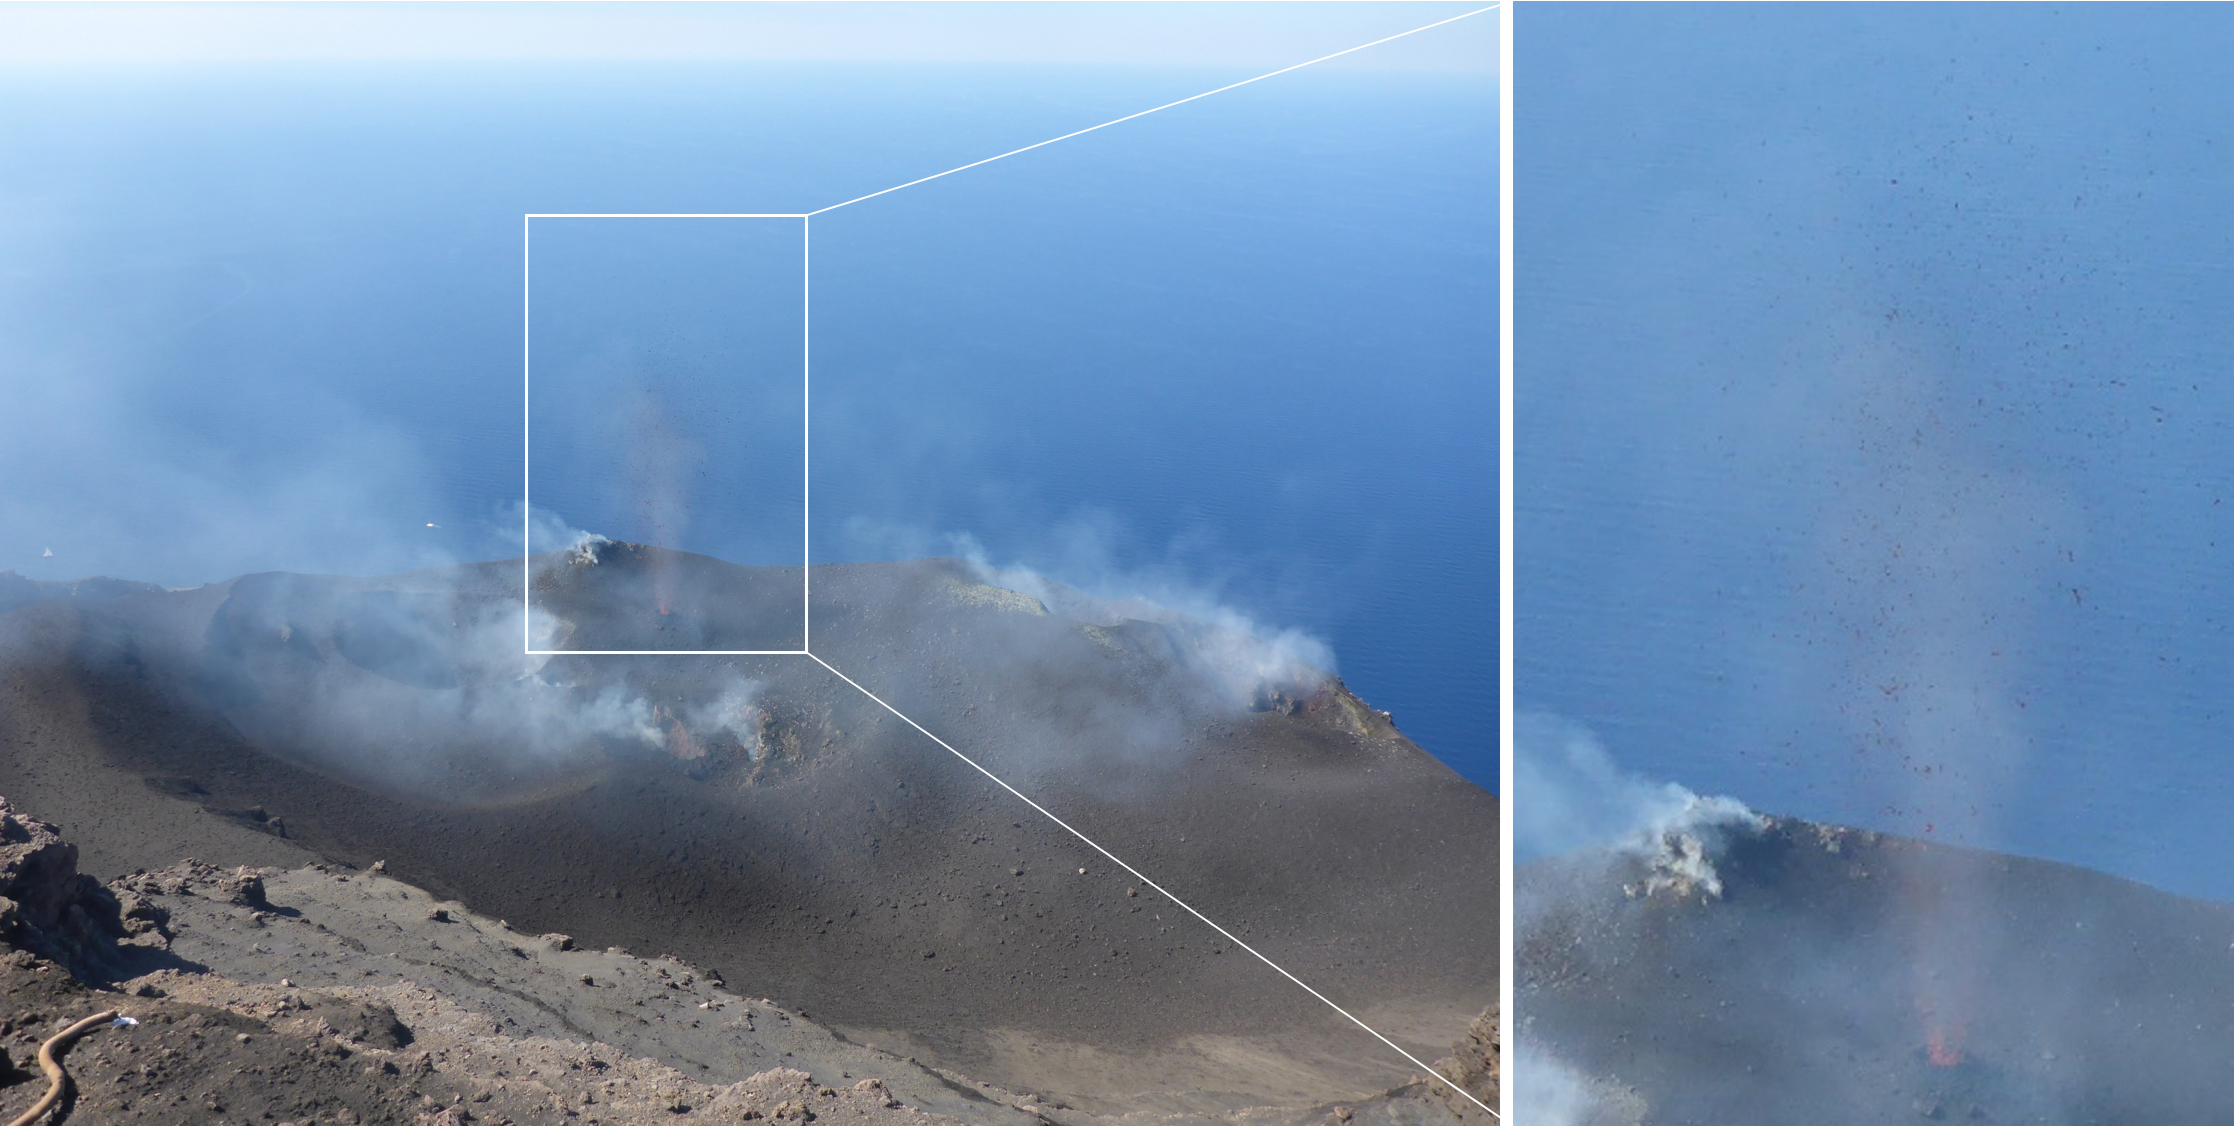
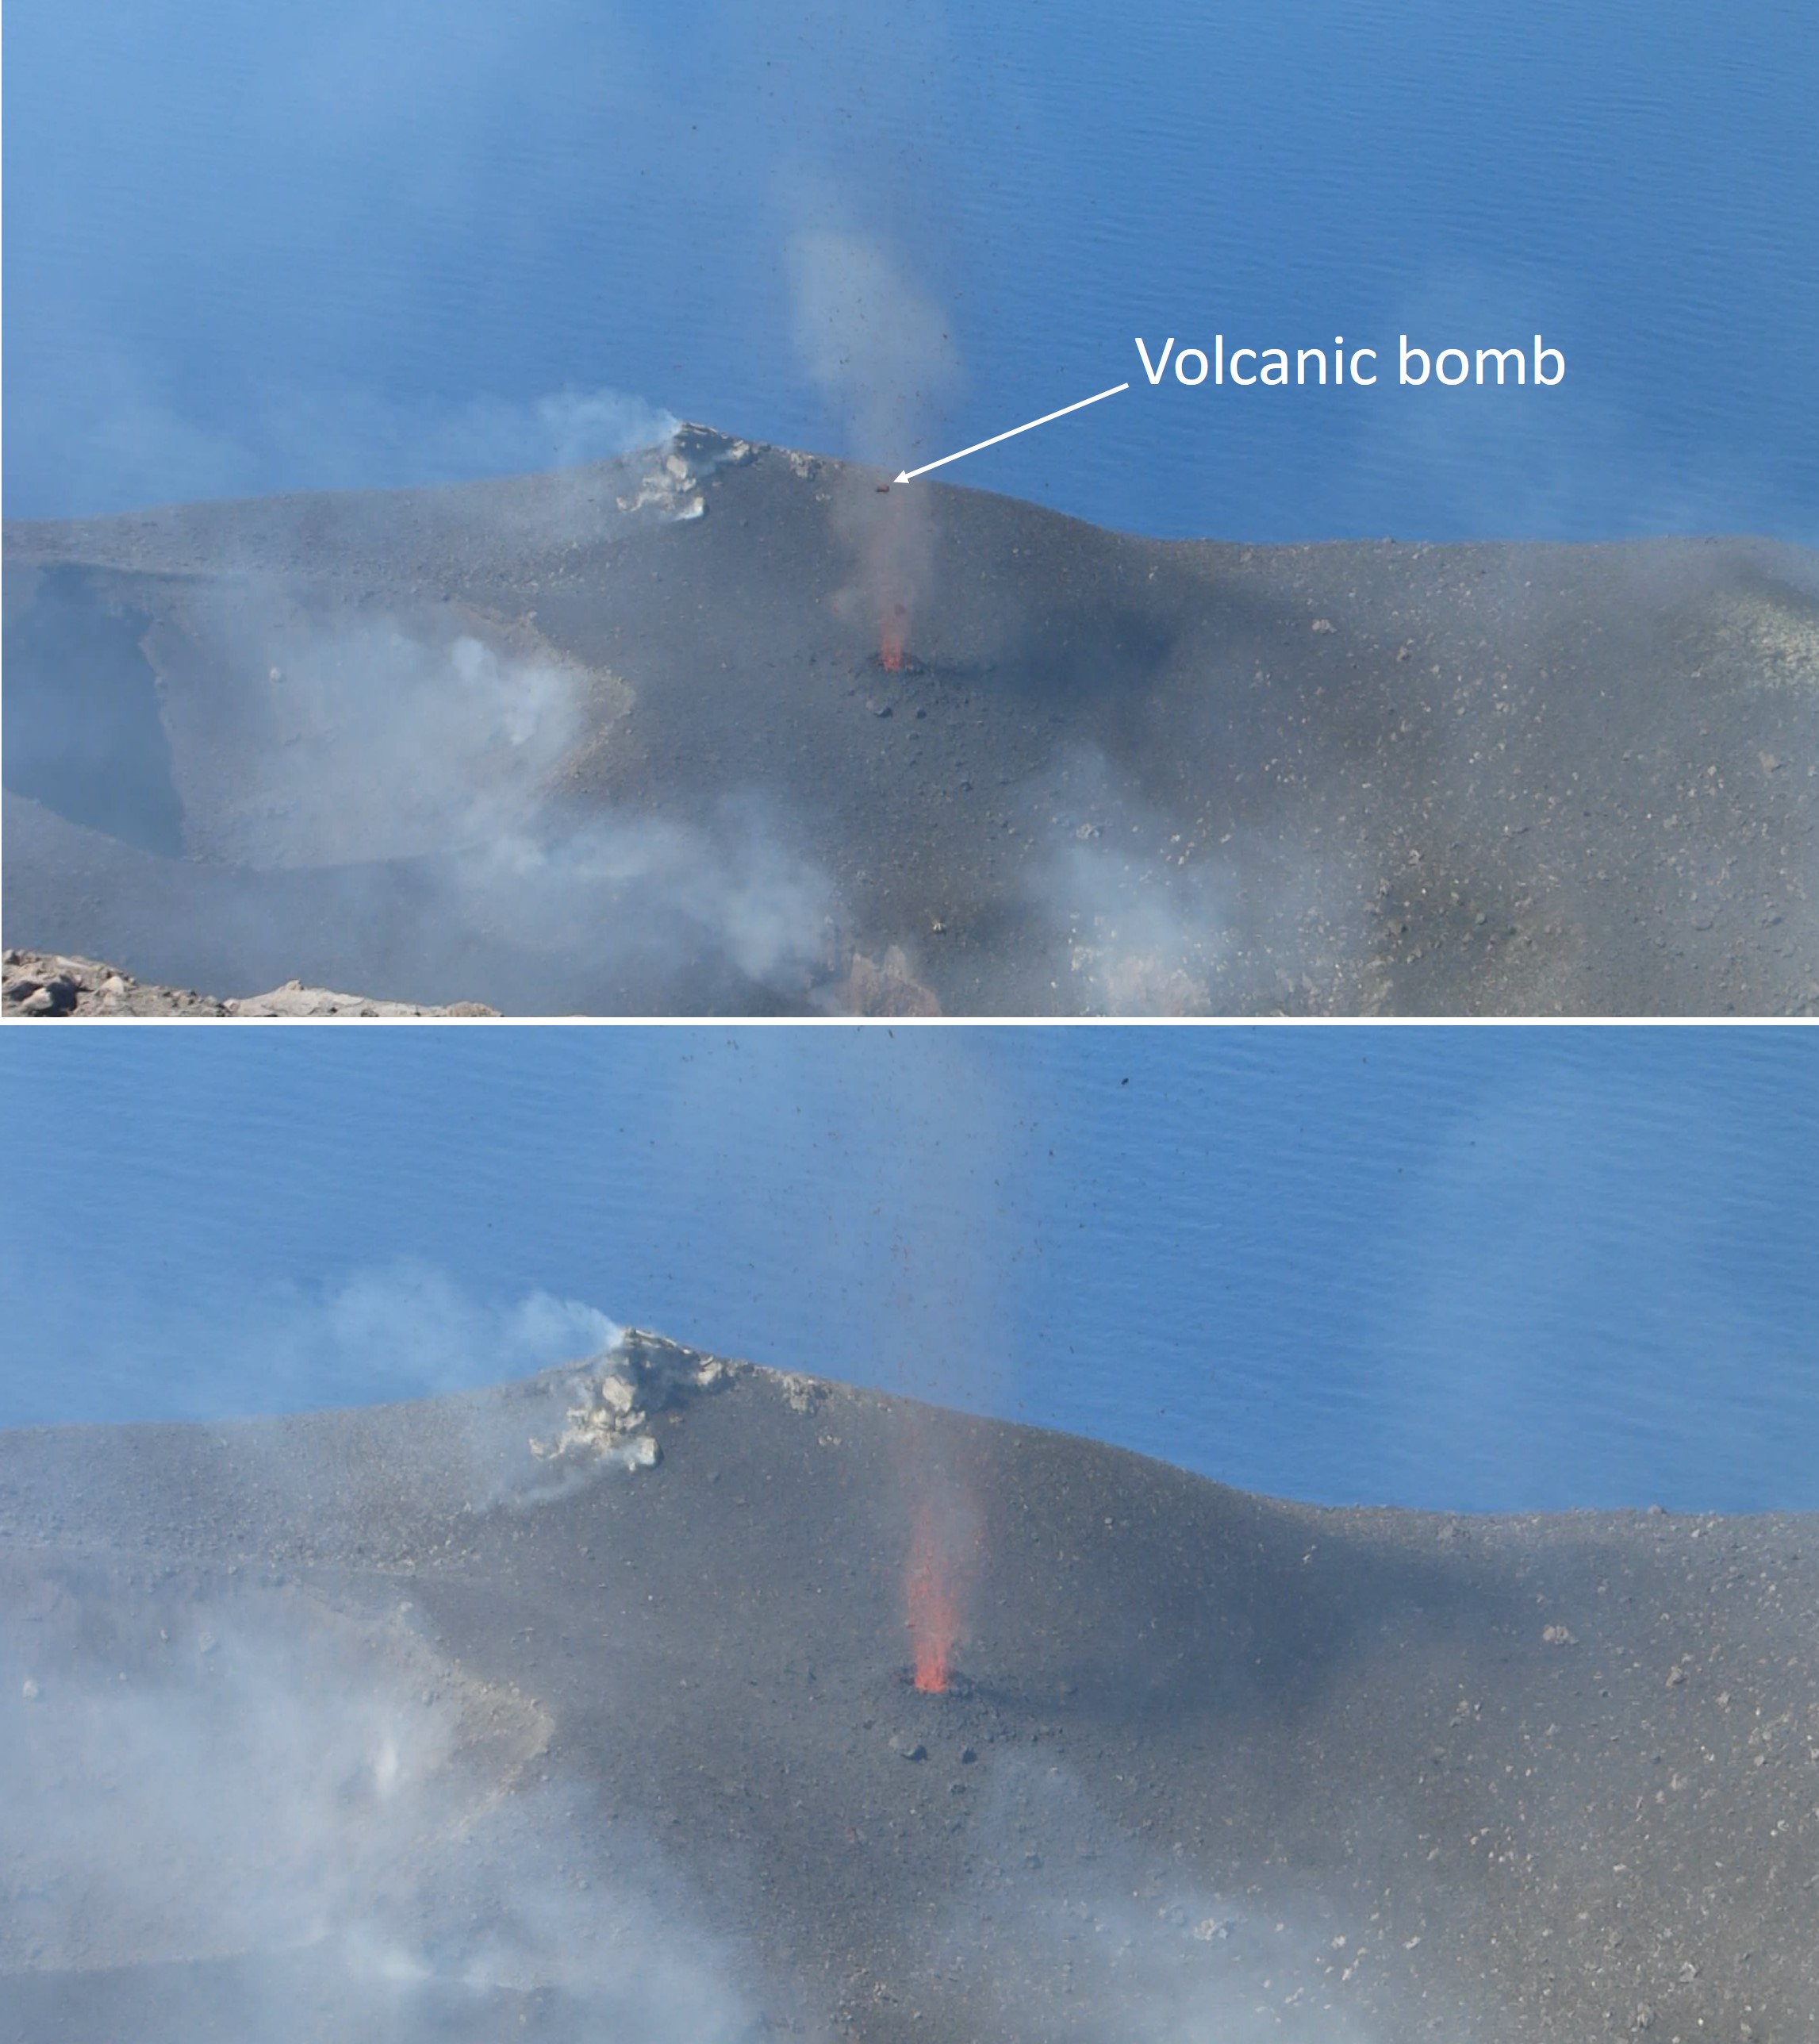
On 21 April research scientists from INGV made field observations in the summit area of Stromboli, and some lapilli samples were collected. In the N crater area near the N1 crater, a small cone was observed with at least two active vents, one of which was characterized by Strombolian explosions. The other vent produced explosions that ejected ash and chunks of cooled lava. At the N2 crater at least one vent was active and frequently emitted ash. In the CS crater area, a small cone contained 2-3 degassing vents and a smaller, possible fissure area also showed signs of degassing close to the Pizzo Sopra La Fossa. In the S part of the crater, three vents were active: a small hornito was characterized by modest and rare explosions, a vent that intermittently produced weak Strombolian explosions, and a vent at the end of the terrace that produced frequent ash emissions. Near the S1 crater there was a hornito that generally emitted weak gas-and-steam emissions, sometimes associated with “gas rings”. On 22 April another field inspection was carried out that reported two large sliding surfaces on the Sciara del Fuoco that showed where blocks frequently descended toward the sea. A thermal anomaly was detected at 0150 on 29 April.
Geologic Background. Spectacular incandescent nighttime explosions at Stromboli have long attracted visitors to the "Lighthouse of the Mediterranean" in the NE Aeolian Islands. This volcano has lent its name to the frequent mild explosive activity that has characterized its eruptions throughout much of historical time. The small island is the emergent summit of a volcano that grew in two main eruptive cycles, the last of which formed the western portion of the island. The Neostromboli eruptive period took place between about 13,000 and 5,000 years ago. The active summit vents are located at the head of the Sciara del Fuoco, a prominent scarp that formed about 5,000 years ago due to a series of slope failures which extends to below sea level. The modern volcano has been constructed within this scarp, which funnels pyroclastic ejecta and lava flows to the NW. Essentially continuous mild Strombolian explosions, sometimes accompanied by lava flows, have been recorded for more than a millennium.
Information Contacts: Istituto Nazionale di Geofisica e Vulcanologia (INGV), Sezione di Catania, Piazza Roma 2, 95123 Catania, Italy, (URL: http://www.ct.ingv.it/en/); MIROVA (Middle InfraRed Observation of Volcanic Activity), a collaborative project between the Universities of Turin and Florence (Italy) supported by the Centre for Volcanic Risk of the Italian Civil Protection Department (URL: http://www.mirovaweb.it/); Hawai'i Institute of Geophysics and Planetology (HIGP) - MODVOLC Thermal Alerts System, School of Ocean and Earth Science and Technology (SOEST), Univ. of Hawai'i, 2525 Correa Road, Honolulu, HI 96822, USA (URL: http://modis.higp.hawaii.edu/); Copernicus Browser, Copernicus Data Space Ecosystem, European Space Agency (URL: https://dataspace.copernicus.eu/browser/).
Nishinoshima (Japan) — July 2023 Cite this Report
Nishinoshima
Japan
27.247°N, 140.874°E; summit elev. 100 m
All times are local (unless otherwise noted)
Small ash plumes and fumarolic activity during November 2022 through April 2023
Nishinoshima is a small island located about 1,000 km S of Tokyo in the Ogasawara Arc in Japan. The island is the summit of a massive submarine volcano that has prominent peaks to the S, W, and NE. Eruptions date back to 1973; the most recent eruption period began in October 2022 and was characterized by ash plumes and fumarolic activity (BGVN 47:12). This report describes ash plumes and fumarolic activity during November 2022 through April 2023 based on monthly reports from the Japan Meteorological Agency (JMA) monthly reports and satellite data.
The most recent eruptive activity prior to the reporting internal occurred on 12 October 2022, when an ash plume rose 3.5 km above the crater rim. An aerial observation conducted by the Japan Coast Guard (JCG) on 25 November reported that white fumaroles rose approximately 200 m above the central crater of a pyroclastic cone (figure 119), and multiple plumes were observed on the ESE flank of the cone. Discolored water ranging from reddish-brown to brown and yellowish-green were visible around the perimeter of the island (figure 119). No significant activity was reported in December.
During an overflight conducted by JCG on 25 January 2023 intermittent activity and small, blackish-gray plumes rose 900 m above the central part of the crater were observed (figure 120). The fumarolic zone of the E flank and base of the cone had expanded and emissions had intensified. Dark brown discolored water was visible around the perimeter of the island.
No significant activity was reported during February through March. Ash plumes at 1050 and 1420 on 11 April rose 1.9 km above the crater rim and drifted NW and N. These were the first ash plumes observed since 12 October 2022. On 14 April JCG carried out an overflight and reported that no further eruptive activity was visible, although white gas-and-steam plumes were visible from the central crater and rose 900 m high (figure 121). Brownish and yellow-green discolored water surrounded the island.
Intermittent low-to-moderate power thermal anomalies were recorded in the MIROVA graph (Middle InfraRed Observation of Volcanic Activity) during November 2022 through April 2023 (figure 123). A cluster of six to eight anomalies were detected during November while a smaller number were detected during the following months: two to three during December, one during mid-January 2023, one during February, five during March, and two during April. Thermal activity was also reflected in infrared satellite data at the summit crater, accompanied by occasional gas-and-steam plumes (figure 124).
Geologic Background. The small island of Nishinoshima was enlarged when several new islands coalesced during an eruption in 1973-74. Multiple eruptions that began in 2013 completely covered the previous exposed surface and continued to enlarge the island. The island is the summit of a massive submarine volcano that has prominent peaks to the S, W, and NE. The summit of the southern cone rises to within 214 m of the ocean surface 9 km SSE.
Information Contacts: Japan Meteorological Agency (JMA), 1-3-4 Otemachi, Chiyoda-ku, Tokyo 100-8122, Japan (URL: http://www.jma.go.jp/jma/indexe.html); MIROVA (Middle InfraRed Observation of Volcanic Activity), a collaborative project between the Universities of Turin and Florence (Italy) supported by the Centre for Volcanic Risk of the Italian Civil Protection Department (URL: http://www.mirovaweb.it/); Copernicus Browser, Copernicus Data Space Ecosystem, European Space Agency (URL: https://dataspace.copernicus.eu/browser/).
Karangetang (Indonesia) — July 2023 Cite this Report
Karangetang
Indonesia
2.781°N, 125.407°E; summit elev. 1797 m
All times are local (unless otherwise noted)
Lava flows, incandescent avalanches, and ash plumes during January-June 2023
Karangetang (also known as Api Siau), at the northern end of the island of Siau, Indonesia, contains five summit craters along a N-S line. More than 40 eruptions have been recorded since 1675; recent eruptions have included frequent explosive activity, sometimes accompanied by pyroclastic flows and lahars. Lava dome growth has occurred in the summit craters and collapses of lava flow fronts have produced pyroclastic flows. The two active summit craters are Kawah Dua (the N crater) and Kawah Utama (the S crater, also referred to as the “Main Crater”). The most recent eruption began in late November 2018 and has more recently consisted of weak thermal activity and gas-and-steam emissions (BGVN 48:01). This report updates activity characterized by lava flows, incandescent avalanches, and ash plumes during January through June 2023 using reports from Pusat Vulkanologi dan Mitigasi Bencana Geologi (PVMBG, also known as CVGHM, or the Center of Volcanology and Geological Hazard Mitigation), MAGMA Indonesia, the Darwin VAAC (Volcano Ash Advisory Center), and satellite data.
Activity during January was relatively low and mainly consisted of white gas-and-steam emissions that rose 25-150 m above Main Crater (S crater) and drifted in different directions. Incandescence was visible from the lava dome in Kawah Dua (the N crater). Weather conditions often prevented clear views of the summit. On 18 January the number of seismic signals that indicated avalanches of material began to increase. In addition, there were a total of 71 earthquakes detected during the month.
Activity continued to increase during the first week of February. Material from Main Crater traveled as far as 800 m down the Batuawang (S) and Batang (W) drainages and as far as 1 km W down the Beha (W) drainage on 4 February. On 6 February 43 earthquake events were recorded, and on 7 February, 62 events were recorded. White gas-and-steam emissions rose 25-250 m above both summit craters throughout the month. PVMBG reported an eruption began during the evening of 8 February around 1700. Photos showed incandescent material at Main Crater. Incandescent material had also descended the flank in at least two unconfirmed directions as far as 2 km from Main Crater, accompanied by ash plumes (figure 60). As a result, PVMBG increased the Volcano Alert Level (VAL) to 3 (the second highest level on a 1-4 scale).
Occasional nighttime webcam images showed three main incandescent lava flows of differing lengths traveling down the S, SW, and W flanks (figure 61). Incandescent rocks were visible on the upper flanks, possibly from ejected or collapsed material from the crater, and incandescence was the most intense at the summit. Based on analyses of satellite imagery and weather models, the Darwin VAAC reported that daily ash plumes during 16-20 February rose to 2.1-3 km altitude and drifted NNE, E, and SE. BNPB reported on 16 February that as many as 77 people were evacuated and relocated to the East Siau Museum. A webcam image taken at 2156 on 17 February possibly showed incandescent material descending the SE flank. Ash plumes rose to 2.1 km altitude and drifted SE during 22-23 February, according to the Darwin VAAC.
Incandescent avalanches of material and summit incandescence at Main Crater continued during March. White gas-and-steam emissions during March generally rose 25-150 m above the summit crater; on 31 March gas-and-steam emissions rose 200-400 m high. An ash plume rose to 2.4 km altitude and drifted S at 1710 on 9 March and a large thermal anomaly was visible in images taken at 0550 and 0930 on 10 March. Incandescent material was visible at the summit and on the flanks based on webcam images taken at 0007 and 2345 on 16 March, at 1828 on 17 March, at 1940 on 18 March, at 2311 on 19 March, and at 2351 on 20 March. Incandescence was most intense on 18 and 20 March and webcam images showed possible Strombolian explosions (figure 62). An ash plume rose to 2.4 km altitude and drifted SW on 18 March, accompanied by a thermal anomaly.
Summit crater incandescence at Main Crater and on the flanks persisted during April. Incandescent material at the S crater and on the flanks was reported at 0016 on 1 April. The lava flows had stopped by 1 April according to PVMBG, although incandescence was still visible up to 10 m high. Seismic signals indicating effusion decreased and by 6 April they were no longer detected. Incandescence was visible from both summit craters. On 26 April the VAL was lowered to 2 (the second lowest level on a 1-4 scale). White gas-and-steam emissions rose 25-200 m above the summit crater.
During May white gas-and-steam emissions generally rose 50-250 m above the summit, though it was often cloudy, which prevented clear views; on 21 May gas-and-steam emissions rose 50-400 m high. Nighttime N summit crater incandescence rose 10-25 m above the lava dome, and less intense incandescence was noted above Main Crater, which reached about 10 m above the dome. Sounds of falling rocks at Main Crater were heard on 15 May and the seismic network recorded 32 rockfall events in the crater on 17 May. Avalanches traveled as far as 1.5 km down the SW and S flanks, accompanied by rumbling sounds on 18 May. Incandescent material descending the flanks was captured in a webcam image at 2025 on 19 May (figure 63) and on 29 May; summit crater incandescence was observed in webcam images at 2332 on 26 May and at 2304 on 29 May. On 19 May the VAL was again raised to 3.
Occasional Main Crater incandescence was reported during June, as well as incandescent material on the flanks. White gas-and-steam emissions rose 10-200 m above the summit crater. Ash plumes rose to 2.1 km altitude and drifted SE and E during 2-4 June, according to the Darwin VAAC. Material on the flanks of Main Crater were observed at 2225 on 7 June, at 2051 on 9 June, at 0007 on 17 June, and at 0440 on 18 June. Webcam images taken on 21, 25, and 27 June showed incandescence at Main Crater and from material on the flanks.
MIROVA (Middle InfraRed Observation of Volcanic Activity) analysis of MODIS satellite data showed strong thermal activity during mid-February through March and mid-May through June, which represented incandescent avalanches and lava flows (figure 64). During April through mid-May the power of the anomalies decreased but frequent anomalies were still detected. Brief gaps in activity occurred during late March through early April and during mid-June. Infrared satellite images showed strong lava flows mainly affecting the SW and S flanks, accompanied by gas-and-steam emissions (figure 65). According to data recorded by the MODVOLC thermal algorithm, there were a total of 79 thermal hotspots detected: 28 during February, 24 during March, one during April, five during May, and 21 during June.
Geologic Background. Karangetang (Api Siau) volcano lies at the northern end of the island of Siau, about 125 km NNE of the NE-most point of Sulawesi. The stratovolcano contains five summit craters along a N-S line. It is one of Indonesia's most active volcanoes, with more than 40 eruptions recorded since 1675 and many additional small eruptions that were not documented (Neumann van Padang, 1951). Twentieth-century eruptions have included frequent explosive activity sometimes accompanied by pyroclastic flows and lahars. Lava dome growth has occurred in the summit craters; collapse of lava flow fronts have produced pyroclastic flows.
Information Contacts: Pusat Vulkanologi dan Mitigasi Bencana Geologi (PVMBG, also known as Indonesian Center for Volcanology and Geological Hazard Mitigation, CVGHM), Jalan Diponegoro 57, Bandung 40122, Indonesia (URL: http://www.vsi.esdm.go.id/); MAGMA Indonesia, Kementerian Energi dan Sumber Daya Mineral (URL: https://magma.esdm.go.id/v1); Badan Nasional Penanggulangan Bencana (BNPB), National Disaster Management Agency, Graha BNPB - Jl. Scout Kav.38, East Jakarta 13120, Indonesia (URL: http://www.bnpb.go.id/); Darwin Volcanic Ash Advisory Centre (VAAC), Bureau of Meteorology, Northern Territory Regional Office, PO Box 40050, Casuarina, NT 0811, Australia (URL: http://www.bom.gov.au/info/vaac/); MIROVA (Middle InfraRed Observation of Volcanic Activity), a collaborative project between the Universities of Turin and Florence (Italy) supported by the Centre for Volcanic Risk of the Italian Civil Protection Department (URL: http://www.mirovaweb.it/); Hawai'i Institute of Geophysics and Planetology (HIGP) - MODVOLC Thermal Alerts System, School of Ocean and Earth Science and Technology (SOEST), Univ. of Hawai'i, 2525 Correa Road, Honolulu, HI 96822, USA (URL: http://modis.higp.hawaii.edu/); Copernicus Browser, Copernicus Data Space Ecosystem, European Space Agency (URL: https://dataspace.copernicus.eu/browser/); IDN Times, Jl. Jend. Gatot Subroto Kav. 27 3rd Floor Kuningan, Jakarta, Indonesia 12950, Status of Karangetang Volcano in Sitaro Islands Increases (URL: https://sulsel.idntimes.com/news/indonesia/savi/status-gunung-api-karangetang-di-kepulauan-sitaro-meningkat?page=all).
Ahyi (United States) — July 2023 Cite this Report
Ahyi
United States
20.42°N, 145.03°E; summit elev. -75 m
All times are local (unless otherwise noted)
Intermittent hydroacoustic signals and discolored plumes during November 2022-June 2023
Ahyi seamount is a large, conical submarine volcano that rises to within 75 m of the ocean surface about 18 km SE of the island of Farallon de Pajaros in the Northern Marianas. The remote location of the seamount has made eruptions difficult to document, but seismic stations installed in the region confirmed an eruption in the vicinity in 2001. No new activity was detected until April-May 2014 when an eruption was detected by NOAA (National Oceanic and Atmospheric Administration) divers, hydroacoustic sensors, and seismic stations (BGVN 42:04). New activity was first detected on 15 November by hydroacoustic sensors that were consistent with submarine volcanic activity. This report covers activity during November 2022 through June 2023 based on daily and weekly reports from the US Geological Survey.
Starting in mid-October, hydroacoustic sensors at Wake Island (2.2 km E) recorded signals consistent with submarine volcanic activity, according to a report from the USGS issued on 15 November 2022. A combined analysis of the hydroacoustic signals and seismic stations located at Guam and Chichijima Island, Japan, suggested that the source of this activity was at or near the Ahyi seamount. After a re-analysis of a satellite image of the area that was captured on 6 November, USGS confirmed that there was no evidence of discoloration at the ocean surface. Few hydroacoustic and seismic signals continued through November, including on 18 November, which USGS suggested signified a decline or pause in unrest. A VONA (Volcano Observatory Notice for Aviation) reported that a discolored water plume was persistently visible in satellite data starting on 18 November (figure 6). Though clouds often obscured clear views of the volcano, another discolored water plume was captured in a satellite image on 26 November. The Aviation Color Code (ACC) was raised to Yellow (the second lowest level on a four-color scale) and the Volcano Alert Level (VAL) was raised to Advisory (the second lowest level on a four-level scale) on 29 November.
During December, occasional detections were recorded on the Wake Island hydrophone sensors and discolored water over the seamount remained visible. During 2-7, 10-12, and 16-31 December possible explosion signals were detected. A small area of discolored water was observed in high-resolution Sentinel-2 satellite images during 1-6 December (figure 7). High-resolution satellite images recorded discolored water plumes on 13 December that originated from the summit region; no observations indicated that activity breached the ocean surface. A possible underwater plume was visible in satellite images on 18 December, and during 19-20 December a definite but diffuse underwater plume located SSE from the main vent was reported. An underwater plume was visible in a satellite image taken on 26 December (figure 7).
Hydrophone sensors continued to detect signals consistent with possible explosions during 1-8 January 2023. USGS reported that the number of detections decreased during 4-5 January. The hydrophone sensors experienced a data outage that started at 0118 on 8 January and continued through 10 January, though according to USGS, possible explosions were recorded prior to the data outage and likely continued during the outage. A discolored water plume originating from the summit region was detected in a partly cloudy satellite image on 8 January. On 11-12 and 15-17 January possible explosion signals were recorded again. One small signal was detected during 22-23 January and several signals were recorded on 25 and 31 January. During 27-31 January a plume of discolored water was observed above the seamount in satellite imagery (figure 8).
Low levels of activity continued during February and March, based on data from pressure sensors on Wake Island. During 1 and 4-6 February activity was reported, and a submarine plume was observed on 4 February (figure 8). Possible explosion signals were detected during 7-8, 10, 13-14, and 24 February. During 1-2 and 3-5 March a plume of discolored water was observed in satellite imagery (figure 8). Almost continuous hydroacoustic signals were detected in remote pressure sensor data on Wake Island 2,270 km E from the volcano during 7-13 March. During 12-13 March water discoloration around the seamount was observed in satellite imagery, despite cloudy weather. By 14 March discolored water extended about 35 km, but no direction was noted. USGS reported that the continuous hydroacoustic signals detected during 13-14 March stopped abruptly on 14 March and no new detections were observed. Three 30 second hydroacoustic detections were reported during 17-19 March, but no activity was visible due to cloudy weather. A data outage was reported during 21-22 March, making pressure sensor data unavailable; a discolored water plume was, however, visible in satellite data. A possible underwater explosion signal was detected by pressure sensors at Wake Island on 26, 29, and 31 March, though the cause and origin of these events were unclear.
Similar low activity continued during April, May, and June. Several signals were detected during 1-3 April in pressure sensors at Wake Island. USGS suggested that these may be related to underwater explosions or earthquakes at the volcano, but no underwater plumes were visible in clear satellite images. The pressure sensors had data outages during 12-13 April and no data were recorded; no underwater plumes were visible in satellite images, although cloudy weather obscured most clear views. Eruptive activity was reported starting at 2210 on 21 May. On 22 May a discolored water plume that extended 4 km was visible in satellite images, though no direction was recorded. During 23-24 May some signals were detected by the underwater pressure sensors. Possible hydroacoustic signals were detected during 2-3 and 6-8 June. Multiple hydroacoustic signals were detected during 9-11 and 16-17 June, although no activity was visible in satellite images. One hydroacoustic signal was detected during 23-24 June, but there was some uncertainty about its association with volcanic activity. A single possible hydroacoustic signal was detected during 30 June to 1 July.
Geologic Background. Ahyi seamount is a large conical submarine volcano that rises to within 75 m of the ocean surface ~18 km SE of the island of Farallon de Pajaros in the northern Marianas. Water discoloration has been observed there, and in 1979 the crew of a fishing boat felt shocks over the summit area, followed by upwelling of sulfur-bearing water. On 24-25 April 2001 an explosive eruption was detected seismically by a station on Rangiroa Atoll, Tuamotu Archipelago. The event was well constrained (+/- 15 km) at a location near the southern base of Ahyi. An eruption in April-May 2014 was detected by NOAA divers, hydroacoustic sensors, and seismic stations.
Information Contacts: US Geological Survey, Volcano Hazards Program (USGS-VHP), 12201 Sunrise Valley Drive, Reston, VA, USA, https://volcanoes.usgs.gov/index.html; Copernicus Browser, Copernicus Data Space Ecosystem, European Space Agency (URL: https://dataspace.copernicus.eu/browser/).
Kadovar (Papua New Guinea) — June 2023 Cite this Report
Kadovar
Papua New Guinea
3.608°S, 144.588°E; summit elev. 365 m
All times are local (unless otherwise noted)
An ash plume and weak thermal anomaly during May 2023
Kadovar is a 2-km-wide island that is the emergent summit of a Bismarck Sea stratovolcano. It lies off the coast of New Guinea, about 25 km N of the mouth of the Sepik River. Prior to an eruption that began in 2018, a lava dome formed the high point of the volcano, filling an arcuate landslide scarp open to the S. Submarine debris-avalanche deposits occur to the S of the island. The current eruption began in January 2018 and has comprised lava effusion from vents at the summit and at the E coast; more recent activity has consisted of ash plumes, weak thermal activity, and gas-and-steam plumes (BGVN 48:02). This report covers activity during February through May 2023 using information from the Darwin Volcanic Ash Advisory Center (VAAC) and satellite data.
Activity during the reporting period was relatively low and mainly consisted of white gas-and-steam plumes that were visible in natural color satellite images on clear weather days (figure 67). According to a Darwin VAAC report, at 2040 on 6 May an ash plume rose to 4.6 km altitude and drifted W; by 2300 the plume had dissipated. MODIS satellite instruments using the MODVOLC thermal algorithm detected a single thermal hotspot on the SE side of the island on 7 May. Weak thermal activity was also detected in a satellite image on the E side of the island on 14 May, accompanied by a white gas-and-steam plume that drifted SE (figure 68).
Geologic Background. The 2-km-wide island of Kadovar is the emergent summit of a Bismarck Sea stratovolcano of Holocene age. It is part of the Schouten Islands, and lies off the coast of New Guinea, about 25 km N of the mouth of the Sepik River. Prior to an eruption that began in 2018, a lava dome formed the high point of the andesitic volcano, filling an arcuate landslide scarp open to the south; submarine debris-avalanche deposits occur in that direction. Thick lava flows with columnar jointing forms low cliffs along the coast. The youthful island lacks fringing or offshore reefs. A period of heightened thermal phenomena took place in 1976. An eruption began in January 2018 that included lava effusion from vents at the summit and at the E coast.
Information Contacts: Darwin Volcanic Ash Advisory Centre (VAAC), Bureau of Meteorology, Northern Territory Regional Office, PO Box 40050, Casuarina, NT 0811, Australia (URL: http://www.bom.gov.au/info/vaac/); Hawai'i Institute of Geophysics and Planetology (HIGP) - MODVOLC Thermal Alerts System, School of Ocean and Earth Science and Technology (SOEST), Univ. of Hawai'i, 2525 Correa Road, Honolulu, HI 96822, USA (URL: http://modis.higp.hawaii.edu/); Copernicus Browser, Copernicus Data Space Ecosystem, European Space Agency (URL: https://dataspace.copernicus.eu/browser/).
San Miguel (El Salvador) — June 2023 Cite this Report
San Miguel
El Salvador
13.434°N, 88.269°W; summit elev. 2130 m
All times are local (unless otherwise noted)
Small gas-and-ash explosions during March and May 2023
San Miguel in El Salvador is a broad, deep crater complex that has been frequently modified by eruptions recorded since the early 16th century and consists of the summit known locally as Chaparrastique. Flank eruptions have produced lava flows that extended to the N, NE, and SE during the 17-19th centuries. The most recent activity has consisted of minor ash eruptions from the summit crater. The current eruption period began in November 2022 and has been characterized by frequent phreatic explosions, gas-and-ash emissions, and sulfur dioxide plumes (BGVN 47:12). This report describes small gas-and-ash explosions during December 2022 through May 2023 based on special reports from the Ministero de Medio Ambiente y Recursos Naturales (MARN).
Activity has been relatively low since the last recorded explosions on 29 November 2022. Seismicity recorded by the San Miguel Volcano Station (VSM) located on the N flank at 1.7 km elevation had decreased by 7 December. Sulfur dioxide gas measurements taken with DOAS (Differential Optical Absorption Spectroscopy) mobile equipment were below typical previously recorded values: 300 tons per day (t/d). During December, small explosions were recorded by the seismic network and manifested as gas-and-steam emissions.
Gas-and-ash explosions in the crater occurred during January 2023, which were recorded by the seismic network. Sulfur dioxide values remained low, between 300-400 t/d through 10 March. At 0817 on 14 January a gas-and-ash emission was visible in webcam images, rising just above the crater rim. Some mornings during February, small gas-and-steam plumes were visible in the crater. On 7 March at 2252 MARN noted an increase in degassing from the central crater; gas emissions were constantly observed through the early morning hours on 8 March. During the early morning of 8 March through the afternoon on 9 March, 12 emissions were registered, some accompanied by ash. The last gas-and-ash emission was recorded at 1210 on 9 March; very fine ashfall was reported in El Tránsito (10 km S), La Morita (6 km W), and La Piedrita (3 km W). The smell of sulfur was reported in Piedra Azul (5 km SW). On 16 March MARN reported that gas-and-steam emissions decreased.
Low degassing and very low seismicity were reported during April; no explosions have been detected between 9 March and 27 May. The sulfur dioxide emissions remained between 350-400 t/d; during 13-20 April sulfur dioxide values fluctuated between 30-300 t/d. Activity remained low through most of May; on 23 May seismicity increased. An explosion was detected at 1647 on 27 May generated a gas-and-ash plume that rose 700 m high (figure 32); a decrease in seismicity and gas emissions followed. The DOAS station installed on the W flank recorded sulfur dioxide values that reached 400 t/d on 27 May; subsequent measurements showed a decrease to 268 t/d on 28 May and 100 t/d on 29 May.
Geologic Background. The symmetrical cone of San Miguel, one of the most active volcanoes in El Salvador, rises from near sea level to form one of the country's most prominent landmarks. A broad, deep, crater complex that has been frequently modified by eruptions recorded since the early 16th century caps the truncated unvegetated summit, also known locally as Chaparrastique. Flanks eruptions of the basaltic-andesitic volcano have produced many lava flows, including several during the 17th-19th centuries that extended to the N, NE, and SE. The SE-flank flows are the largest and form broad, sparsely vegetated lava fields crossed by highways and a railroad skirting the base of the volcano. Flank vent locations have migrated higher on the edifice during historical time, and the most recent activity has consisted of minor ash eruptions from the summit crater.
Information Contacts: Ministero de Medio Ambiente y Recursos Naturales (MARN), Km. 5½ Carretera a Nueva San Salvador, Avenida las Mercedes, San Salvador, El Salvador (URL: http://www.snet.gob.sv/ver/vulcanologia).
Semisopochnoi (United States) — June 2023 Cite this Report
Semisopochnoi
United States
51.93°N, 179.58°E; summit elev. 1221 m
All times are local (unless otherwise noted)
Occasional explosions, ash deposits, and gas-and-steam plumes during December 2022-May 2023
Semisopochnoi is located in the western Aleutians, is 20-km-wide at sea level, and contains an 8-km-wide caldera. The three-peaked Mount Young (formerly Cerberus) was constructed within the caldera during the Holocene. Each of these peaks contains a summit crater; the lava flows on the N flank appear younger than those on the S side. The current eruption period began in early February 2021 and has more recently consisted of intermittent explosions and ash emissions (BGVN 47:12). This report updates activity during December 2022 through May 2023 using daily, weekly, and special reports from the Alaska Volcano Observatory (AVO). AVO monitors the volcano using local seismic and infrasound sensors, satellite data, web cameras, and remote infrasound and lightning networks.
Activity during most of December 2022 was relatively quiet; according to AVO no eruptive or explosive activity was observed since 7 November 2022. Intermittent tremor and occasional small earthquakes were observed in geophysical data. Continuous gas-and-steam emissions were observed from the N crater of Mount Young in webcam images on clear weather days (figure 25). On 24 December, there was a slight increase in earthquake activity and several small possible explosion signals were detected in infrasound data. Eruptive activity resumed on 27 December at the N crater of Mount Young; AVO issued a Volcano Activity Notice (VAN) that reported minor ash deposits on the flanks of Mount Young that extended as far as 1 km from the vent, according to webcam images taken during 27-28 December (figure 26). No ash plumes were observed in webcam or satellite imagery, but a persistent gas-and-steam plume that might have contained some ash rose to 1.5 km altitude. As a result, AVO raised the Aviation Color Code (ACC) to Orange (the second highest level on a four-color scale) and the Volcano Alert Level (VAL) to Watch (the second highest level on a four-level scale). Possible explosions were detected during 21 December 2022 through 1 January 2023 and seismic tremor was recorded during 30-31 December.
During January 2023 eruptive activity continued at the active N crater of Mount Young. Minor ash deposits were observed on the flanks, extending about 2 km SSW, based on webcam images from 1 and 3 January. A possible explosion occurred during 1-2 January based on elevated seismicity recorded on local seismometers and an infrasound signal recorded minutes later by an array at Adak. Though no ash plumes were observed in webcam or satellite imagery, a persistent gas-and-steam plume rose to 1.5 km altitude that might have carried minor traces of ash. Ash deposits were accompanied by periods of elevated seismicity and infrasound signals from the local geophysical network, which AVO reported were likely due to weak explosive activity. Low-level explosive activity was also detected during 2-3 January, with minor gas-and-steam emissions and a new ash deposit that was visible in webcam images. Low-level explosive activity was detected in geophysical data during 4-5 January, with elevated seismicity and infrasound signals observed on local stations. Volcanic tremor was detected during 7-9 January and very weak explosive activity was detected in seismic and infrasound data on 9 January. Weak seismic and infrasound signals were recorded on 17 January, which indicated minor explosive activity, but no ash emissions were observed in clear webcam images; a gas-and-steam plume continued to rise to 1.5 km altitude. During 29-30 January, ash deposits near the summit were observed on fresh snow, according to webcam images.
The active N cone at Mount Young continued to produce a gas-and-steam plume during February, but no ash emissions or explosive events were detected. Seismicity remained elevated with faint tremor during early February. Gas-and-steam emissions from the N crater were observed in clear webcam images on 11-13 and 16 February; no explosive activity was detected in seismic, infrasound, or satellite data. Seismicity has also decreased, with no significant seismic tremor observed since 25 January. Therefore, the ACC was lowered to Yellow (the second lowest level on a four-color scale) and the VAL was lowered to Advisory (the second lowest level on a four-color scale) on 22 February.
Gas-and-steam emissions persisted during March from the N cone of Mount Young, based on clear webcam images. A few brief episodes of weak tremor were detected in seismic data, although seismicity decreased over the month. A gas-and-steam plume detected in satellite data extended 150 km on 18 March. Low-level ash emissions from the N cone at Mount Young were observed in several webcam images during 18-19 March, in addition to small explosions and volcanic tremor. The ACC was raised to Orange and the VAL increased to Watch on 19 March. A small explosion was detected in seismic and infrasound data on 21 March.
Low-level unrest continued during April, although cloudy weather often obscured views of the summit; periods of seismic tremor and local earthquakes were recorded. During 3-4 April a gas-and-steam plume was visible traveling more than 200 km overnight; no ash was evident in the plume, according to AVO. A gas-and-steam plume was observed during 4-6 April that extended 400 km but did not seem to contain ash. Small explosions were detected in seismic and infrasound data on 5 April. Occasional clear webcam images showed continuing gas-and-steam emissions rose from Mount Young, but no ash deposits were observed on the snow. On 19 April small explosions and tremor were detected in seismic and infrasound data. A period of seismic tremor was detected during 22-25 April, with possible weak explosions on 25 April. Ash deposits were visible near the crater rim, but it was unclear if these deposits were recent or due to older deposits.
Occasional small earthquakes were recorded during May, but there were no signs of explosive activity seen in geophysical data. Gas-and-steam emissions continued from the N crater of Mount Young, based on webcam images, and seismicity remained slightly elevated. A new, light ash deposit was visible during the morning of 5 May on fresh snow on the NW flank of Mount Young. During 10 May periods of volcanic tremor were observed. The ACC was lowered to Yellow and the VAL to Advisory on 17 May due to no additional evidence of activity.
Geologic Background. Semisopochnoi, the largest subaerial volcano of the western Aleutians, is 20 km wide at sea level and contains an 8-km-wide caldera. It formed as a result of collapse of a low-angle, dominantly basaltic volcano following the eruption of a large volume of dacitic pumice. The high point of the island is Anvil Peak, a double-peaked late-Pleistocene cone that forms much of the island's northern part. The three-peaked Mount Cerberus (renamed Mount Young in 2023) was constructed within the caldera during the Holocene. Each of the peaks contains a summit crater; lava flows on the N flank appear younger than those on the south side. Other post-caldera volcanoes include the symmetrical Sugarloaf Peak SSE of the caldera and Lakeshore Cone, a small cinder cone at the edge of Fenner Lake in the NE part of the caldera. Most documented eruptions have originated from Young, although Coats (1950) considered that both Sugarloaf and Lakeshore Cone could have been recently active.
Information Contacts: Alaska Volcano Observatory (AVO), a cooperative program of a) U.S. Geological Survey, 4200 University Drive, Anchorage, AK 99508-4667 USA (URL: https://avo.alaska.edu/), b) Geophysical Institute, University of Alaska, PO Box 757320, Fairbanks, AK 99775-7320, USA, and c) Alaska Division of Geological & Geophysical Surveys, 794 University Ave., Suite 200, Fairbanks, AK 99709, USA (URL: http://dggs.alaska.gov/).
Ebeko
Russia
50.686°N, 156.014°E; summit elev. 1103 m
All times are local (unless otherwise noted)
Continued explosions, ash plumes, and ashfall during October 2022-May 2023
Ebeko, located on the N end of Paramushir Island in the Kuril Islands, consists of three summit craters along a SSW-NNE line at the northern end of a complex of five volcanic cones. Eruptions date back to the late 18th century and have been characterized as small-to-moderate explosions from the summit crater, accompanied by intense fumarolic activity. The current eruption period began in June 2022 and has recently consisted of frequent explosions, ash plumes, and thermal activity (BGVN 47:10). This report covers similar activity during October 2022 through May 2023, based on information from the Kamchatka Volcanic Eruptions Response Team (KVERT) and satellite data.
Activity during October consisted of explosive activity, ash plumes, and occasional thermal anomalies. Visual data by volcanologists from Severo-Kurilsk showed explosions producing ash clouds up to 2.1-3 km altitude which drifted E, N, NE, and SE during 1-8, 10, 16, and 18 October. KVERT issued several Volcano Observatory Notices for Aviation (VONA) on 7, 13-15, and 27 October 2022, stating that explosions generated ash plumes that rose to 2.3-4 km altitude and drifted 5 km E, NE, and SE. Ashfall was reported in Severo-Kurilsk (Paramushir Island, about 7 km E) on 7 and 13 October. Satellite data showed a thermal anomaly over the volcano on 15-16 October. Visual data showed ash plumes rising to 2.5-3.6 km altitude on 22, 25-29, and 31 October and moving NE due to constant explosions.
Similar activity continued during November, with explosions, ash plumes, and ashfall occurring. KVERT issued VONAs on 1-2, 4, 6-7, 9, 13, and 16 November that reported explosions and resulting ash plumes that rose to 1.7-3.6 km altitude and drifted 3-5 km SE, ESE, E, and NE. On 1 November ash plumes extended as far as 110 km SE. On 5, 8, 12, and 24-25 November explosions and ash plumes rose to 2-3.1 km altitude and drifted N and E. Ashfall was observed in Severo-Kurilsk on 7 and 16 November. A thermal anomaly was visible during 1-4, 16, and 20 November. Explosions during 26 November rose as high as 2.7 km altitude and drifted NE (figure 45).
Explosions and ash plumes continued to occur in December. During 1-2 and 4 December volcanologists from Severo-Kurilsk observed explosions that sent ash to 1.9-2.5 km altitude and drifted NE and SE (figure 46). VONAs were issued on 5, 9, and 16 December reporting that explosions generated ash plumes rising to 1.9 km, 2.6 km, and 2.4 km altitude and drifted 5 km SE, E, and NE, respectively. A thermal anomaly was visible in satellite imagery on 16 December. On 18 and 27-28 December explosions produced ash plumes that rose to 2.5 km altitude and drifted NE and SE. On 31 December an ash plume rose to 2 km altitude and drifted NE.
Explosions continued during January 2023, based on visual observations by volcanologists from Severo-Kurilsk. During 1-7 January explosions generated ash plumes that rose to 4 km altitude and drifted NE, E, W, and SE. According to VONAs issued by KVERT on 2, 4, 10, and 23 January, explosions produced ash plumes that rose to 2-4 km altitude and drifted 5 km N, NE, E, and ENE; the ash plume that rose to 4 km altitude occurred on 10 January (figure 47). Satellite data showed a thermal anomaly during 3-4, 10, 13, 16, 21, 22, and 31 January. KVERT reported that an ash cloud on 4 January moved 12 km NE. On 6 and 9-11 January explosions sent ash plumes to 4.5 km altitude and drifted W and ESE. On 13 January an ash plume rose to 3 km altitude and drifted SE. During 20-24 January ash plumes from explosions rose to 3.7 km altitude and drifted SE, N, and NE. On 21 January the ash plume drifted as far as 40 km NE. During 28-29 and 31 January and 1 February ash plumes rose to 4 km altitude and drifted NE.
During February, explosions, ash plumes, and ashfall were reported. During 1, 4-5 and 7-8 February explosions generated ash plumes that rose to 4.5 km altitude and drifted E and NE; ashfall was observed on 5 and 8 February. On 6 February an explosion produced an ash plume that rose to 3 km altitude and drifted 7 km E, causing ashfall in Severo-Kurilsk. A thermal anomaly was visible in satellite data on 8, 9, 13, and 21 February. Explosions on 9 and 12-13 February produced ash plumes that rose to 4 km altitude and drifted E and NE; the ash cloud on 12 February extended as far as 45 km E. On 22 February explosions sent ash to 3 km altitude that drifted E. During 24 and 26-27 February ash plumes rose to 4 km altitude and drifted E. On 28 February an explosion sent ash to 2.5-3 km altitude and drifted 5 km E; ashfall was observed in Severo-Kurilsk.
Activity continued during March; visual observations showed that explosions generated ash plumes that rose to 3.6 km altitude on 3, 5-7, and 9-12 March and drifted E, NE, and NW. Thermal anomalies were visible on 10, 13, and 29-30 March in satellite imagery. On 18, 21-23, 26, and 29-30 March explosions produced ash plumes that rose to 2.8 km altitude and drifted NE and E; the ash plumes during 22-23 March extended up to 76 km E. A VONA issued on 21 March reported an explosion that produced an ash plume that rose to 2.8 km altitude and drifted 5 km E. Another VONA issued on 23 March reported that satellite data showed an ash plume rising to 3 km altitude and drifted 14 km E.
Explosions during April continued to generate ash plumes. On 1 and 4 April an ash plume rose to 2.8-3.5 km altitude and drifted SE and NE. A thermal anomaly was visible in satellite imagery during 1-6 April. Satellite data showed ash plumes and clouds rising to 2-3 km altitude and drifting up to 12 km SW and E on 3 and 6 April (figure 48). KVERT issued VONAs on 3, 5, 14, 16 April describing explosions that produced ash plumes rising to 3 km, 3.5 km, 3.5 km, and 3 km altitude and drifting 5 km S, 5 km NE and SE, 72 km NNE, and 5 km NE, respectively. According to satellite data, the resulting ash cloud from the explosion on 14 April was 25 x 7 km in size and drifted 72-104 km NNE during 14-15 April. According to visual data by volcanologists from Severo-Kurilsk explosions sent ash up to 3.5 km altitude that drifted NE and E during 15-16, 22, 25-26, and 29 April.
The explosive eruption continued during May. Explosions during 3-4, 6-7, and 9-10 May generated ash plumes that rose to 4 km altitude and drifted SW and E. Satellite data showed a thermal anomaly on 3, 9, 13-14, and 24 May. During 12-16, 23-25, and 27-28 May ash plumes rose to 3.5 km altitude and drifted in different directions due to explosions. Two VONA notices were issued on 16 and 25 May, describing explosions that generated ash plumes rising to 3 km and 3.5 km altitude, respectively and extending 5 km E. The ash cloud on 25 May drifted 75 km SE.
Thermal activity in the summit crater, occasionally accompanied by ash plumes and ash deposits on the SE and E flanks due to frequent explosions, were visible in infrared and true color satellite images (figure 49).
Geologic Background. The flat-topped summit of the central cone of Ebeko volcano, one of the most active in the Kuril Islands, occupies the northern end of Paramushir Island. Three summit craters located along a SSW-NNE line form Ebeko volcano proper, at the northern end of a complex of five volcanic cones. Blocky lava flows extend west from Ebeko and SE from the neighboring Nezametnyi cone. The eastern part of the southern crater contains strong solfataras and a large boiling spring. The central crater is filled by a lake about 20 m deep whose shores are lined with steaming solfataras; the northern crater lies across a narrow, low barrier from the central crater and contains a small, cold crescentic lake. Historical activity, recorded since the late-18th century, has been restricted to small-to-moderate explosive eruptions from the summit craters. Intense fumarolic activity occurs in the summit craters, on the outer flanks of the cone, and in lateral explosion craters.
Information Contacts: Kamchatka Volcanic Eruptions Response Team (KVERT), Far Eastern Branch, Russian Academy of Sciences, 9 Piip Blvd., Petropavlovsk-Kamchatsky, 683006, Russia (URL: http://www.kscnet.ru/ivs/kvert/); MIROVA (Middle InfraRed Observation of Volcanic Activity), a collaborative project between the Universities of Turin and Florence (Italy) supported by the Centre for Volcanic Risk of the Italian Civil Protection Department (URL: http://www.mirovaweb.it/); Copernicus Browser, Copernicus Data Space Ecosystem, European Space Agency (URL: https://dataspace.copernicus.eu/browser/).
Home Reef
Tonga
18.992°S, 174.775°W; summit elev. -10 m
All times are local (unless otherwise noted)
Discolored plumes continued during November 2022-April 2023
Home Reef is a submarine volcano located in the central Tonga islands between Lateiki (Metis Shoal) and Late Island. The first recorded eruption occurred in the mid-19th century, when an ephemeral island formed. An eruption in 1984 produced a 12-km-high eruption plume, a large volume of floating pumice, and an ephemeral island 500 x 1,500 m wide, with cliffs 30-50 m high that enclosed a water-filled crater. Another island-forming eruption in 2006 produced widespread pumice rafts that drifted as far as Australia; by 2008 the island had eroded below sea level. The previous eruption occurred during October 2022 and was characterized by a new island-forming eruption, lava effusion, ash plumes, discolored water, and gas-and-steam plumes (BGVN 47:11). This report covers discolored water plumes during November 2022 through April 2023 using satellite data.
Discolored plumes continued during the reporting period and were observed in true color satellite images on clear weather days. Satellite images show light green-yellow discolored water extending W on 8 and 28 November 2022 (figure 31), and SW on 18 November. Light green-yellow plumes extended W on 3 December, S on 13 December, SW on 18 December, and W and S on 23 December (figure 31). On 12 January 2023 discolored green-yellow plumes extended to the NE, E, SE, and N. The plume moved SE on 17 January and NW on 22 January. Faint discolored water in February was visible moving NE on 1 February. A discolored plume extended NW on 8 and 28 March and NW on 13 March (figure 31). During April, clear weather showed green-blue discolored plumes moving S on 2 April, W on 7 April, and NE and S on 12 April. A strong green-yellow discolored plume extended E and NE on 22 April for several kilometers (figure 31).
Geologic Background. Home Reef, a submarine volcano midway between Metis Shoal and Late Island in the central Tonga islands, was first reported active in the mid-19th century, when an ephemeral island formed. An eruption in 1984 produced a 12-km-high eruption plume, large amounts of floating pumice, and an ephemeral 500 x 1,500 m island, with cliffs 30-50 m high that enclosed a water-filled crater. In 2006 an island-forming eruption produced widespread dacitic pumice rafts that drifted as far as Australia. Another island was built during a September-October 2022 eruption.
Information Contacts: Copernicus Browser, Copernicus Data Space Ecosystem, European Space Agency (URL: https://dataspace.copernicus.eu/browser/).
Ambae
Vanuatu
15.389°S, 167.835°E; summit elev. 1496 m
All times are local (unless otherwise noted)
New lava flow, ash plumes, and sulfur dioxide plumes during February-May 2023
Ambae, also known as Aoba, is a large basaltic shield volcano in Vanuatu. A broad pyroclastic cone containing three crater lakes (Manaro Ngoru, Voui, and Manaro Lakua) is located at the summit within the youngest of at least two nested calderas. Periodic phreatic and pyroclastic explosions have been reported since the 16th century. A large eruption more than 400 years ago resulted in a volcanic cone within the summit crater that is now filled by Lake Voui; the similarly sized Lake Manaro fills the western third of the caldera. The previous eruption ended in August 2022 that was characterized by gas-and-steam and ash emissions and explosions of wet tephra (BGVN 47:10). This report covers a new eruption during February through May 2023 that consisted of a new lava flow, ash plumes, and sulfur dioxide emissions, using information from the Vanuatu Meteorology and Geo-Hazards Department (VMGD) and satellite data.
During the reporting period, the Alert Level remained at a 2 (on a scale of 0-5), which has been in place since December 2021. Activity during October 2022 through March 2023 remained relatively low and mostly consisted of gas-and-steam emissions in Lake Voui. VMGD reported that at 1300 on 15 November a satellite image captured a strong amount of sulfur dioxide rising above the volcano (figure 99), and that seismicity slightly increased. The southern and northern part of the island reported a strong sulfur dioxide smell and heard explosions. On 20 February 2023 a gas-and-ash plume rose 1.3 km above the summit and drifted SSW, according to a webcam image (figure 100). Gas-and-steam and possibly ash emissions continued on 23 February and volcanic earthquakes were recorded by the seismic network.
During April, volcanic earthquakes and gas-and-steam and ash emissions were reported from the cone in Lake Voui. VMGD reported that activity increased during 5-7 April; high gas-and-steam and ash plumes were visible, accompanied by nighttime incandescence. According to a Wellington VAAC report, a low-level ash plume rose as high as 2.5 km above the summit and drifted W and SW on 5 April, based on satellite imagery. Reports in Saratamata stated that a dark ash plume drifted to the WSW, but no loud explosion was heard. Webcam images from 2100 showed incandescence above the crater and reflected in the clouds. According to an aerial survey, field observations, and satellite data, water was no longer present in the lake. A lava flow was reported effusing from the vent and traveling N into the dry Lake Voui, which lasted three days. The next morning at 0745 on 6 April a gas-and-steam and ash plume rose 5.4 km above the summit and drifted ESE, based on information from VMGD (figure 101). The Wellington VAAC also reported that light ashfall was observed on the island. Intermittent gas-and-steam and ash emissions were visible on 7 April, some of which rose to an estimated 3 km above the summit and drifted E. Webcam images during 0107-0730 on 7 April showed continuing ash emissions. A gas-and-steam and ash plume rose 695 m above the summit crater at 0730 on 19 April and drifted ESE, based on a webcam image (figure 102).
According to visual and infrared satellite data, water was visible in Lake Voui as late as 24 March 2023 (figure 103). The vent in the caldera showed a gas-and-steam plume drifted SE. On 3 April thermal activity was first detected, accompanied by a gas-and-ash plume that drifted W (figure 103). The lava flow moved N within the dry lake and was shown cooling by 8 April. By 23 April much of the water in the lake had returned. Occasional sulfur dioxide plumes were detected by the TROPOMI instrument on the Sentinel-5P satellite that exceeded 2 Dobson Units (DU) and drifted in different directions (figure 104).
Geologic Background. The island of Ambae, also known as Aoba, is a massive 2,500 km3 basaltic shield that is the most voluminous volcano of the New Hebrides archipelago. A pronounced NE-SW-trending rift zone with numerous scoria cones gives the 16 x 38 km island an elongated form. A broad pyroclastic cone containing three crater lakes (Manaro Ngoru, Voui, and Manaro Lakua) is located at the summit within the youngest of at least two nested calderas, the largest of which is 6 km in diameter. That large central edifice is also called Manaro Voui or Lombenben volcano. Post-caldera explosive eruptions formed the summit craters about 360 years ago. A tuff cone was constructed within Lake Voui (or Vui) about 60 years later. The latest known flank eruption, about 300 years ago, destroyed the population of the Nduindui area near the western coast.
Information Contacts: Geo-Hazards Division, Vanuatu Meteorology and Geo-Hazards Department (VMGD), Ministry of Climate Change Adaptation, Meteorology, Geo-Hazards, Energy, Environment and Disaster Management, Private Mail Bag 9054, Lini Highway, Port Vila, Vanuatu (URL: http://www.vmgd.gov.vu/, https://www.facebook.com/VanuatuGeohazardsObservatory/); Wellington Volcanic Ash Advisory Centre (VAAC), Meteorological Service of New Zealand Ltd (MetService), PO Box 722, Wellington, New Zealand (URL: http://www.metservice.com/vaac/, http://www.ssd.noaa.gov/VAAC/OTH/NZ/messages.html); MIROVA (Middle InfraRed Observation of Volcanic Activity), a collaborative project between the Universities of Turin and Florence (Italy) supported by the Centre for Volcanic Risk of the Italian Civil Protection Department (URL: http://www.mirovaweb.it/); Global Sulfur Dioxide Monitoring Page, Atmospheric Chemistry and Dynamics Laboratory, NASA Goddard Space Flight Center (NASA/GSFC), 8800 Greenbelt Road, Goddard, Maryland, USA (URL: https://so2.gsfc.nasa.gov/); Copernicus Browser, Copernicus Data Space Ecosystem, European Space Agency (URL: https://dataspace.copernicus.eu/browser/).
Search Bulletin Archive by Publication Date
Select a month and year from the drop-downs and click "Show Issue" to have that issue displayed in this tab.
The default month and year is the latest issue available.
Bulletin of the Global Volcanism Network - Volume 43, Number 12 (December 2018)
Managing Editor: Edward Venzke
Chillan, Nevados de (Chile)
Dome growth and destruction with several explosive events, June-November 2018
Dukono (Indonesia)
Regular ash explosions continuing as of September 2018
Ebeko (Russia)
Frequent ash explosions continue during June-November 2018
Etna (Italy)
Lava flows emerge from NSEC in late August and late November 2018; Strombolian activity continues from multiple vents
Fournaise, Piton de la (France)
Eruption from 15 September to 1 November produced a lava flow to the E
Ibu (Indonesia)
Thermal anomalies and ash explosions from the crater continue during May-November 2018
Kilauea (United States)
Lava fountains on the Lower East Rift Zone build 50-m-high pyroclastic cone and 13-km-long lava flow that engulfs Kapoho Bay during June 2018; 533 homes destroyed since 1 May
Sabancaya (Peru)
Frequent ash plumes continued during June-November 2018
Santa Maria (Guatemala)
Ash plumes, degassing, and avalanches continue during May-October 2018 with occasional lahars
Stromboli (Italy)
Explosive activity produced ash, lapilli, and bombs, with occasional spattering during July-October 2018
Nevados de Chillan (Chile) — December 2018 Cite this Report
Nevados de Chillan
Chile
36.868°S, 71.378°W; summit elev. 3180 m
All times are local (unless otherwise noted)
Dome growth and destruction with several explosive events, June-November 2018
Nevados de Chillán is a complex of late-Pleistocene to Holocene stratovolcanoes in the Chilean Central Andes. An eruption started with a phreatic explosion and ash emission on 8 January 2016 from a new crater (Nicanor) on the E flank of the Nuevo crater, which lies on the NW flank of the cone of the large stratovolcano referred to as Volcán Viejo. Strombolian explosions and ash emissions continued throughout 2016 and 2017. The presence of a lava dome within the Nicanor crater was confirmed in early January 2018; it continued to grow through May 2018. This report covers continuing activity from June-November 2018 when growth and destruction of the dome alternated in a series of explosive events. Information for this report is provided primarily by Chile's Servicio Nacional de Geología y Minería (SERNAGEOMIN)-Observatorio Volcanológico de Los Andes del Sur (OVDAS), and by the Buenos Aires Volcanic Ash Advisory Center (VAAC).
Activity at the Nevados de Chillán volcanic complex from June-November 2018 consisted of continued steam-and-gas emissions and periodic explosions with ash plumes and incandescent ejecta; these caused frequent changes to the size and shape of the Gil-Cruz dome within the Nicanor crater. Incandescent material as far as 300 m down the flank was seen in nighttime and thermal webcam images on multiple occasions. Larger explosive events during 13-15 July, 7-8 August, 11-12 September, 13 October, and 7 November produced significant ash plumes that rose a few kilometers above the summit, covered much of the area around the crater with fresh ash and blocks as large as a meter in diameter, and caused noticeable changes to the size and shape of the dome. A 400-m-long pyroclastic flow traveled down the E flank on 12 September 2018. The highest ash plume, on 7 November, rose almost 4 km above the summit and drifted SE.
Intermittent seismic and effusive activity continued during June 2018. Seismicity consisted of long-period earthquakes (LP) and tremor episodes (TR) related to the growth of the viscous lava dome located in the Nicanor crater, and occasional volcano-tectonic (VT) seismic events. Gray emissions and dark ash covering the snow were reported several times during the month. The dome was visible on clear days from the webcam located in Portezuelo (70 km NW); the thermal camera there showed intermittent evidence of emissions as well, usually as nighttime incandescence and ejecta scattered around the crater. Incandescent material traveled 300 m down the slope on 22 June. The Buenos Aires VAAC reported a brief emission on 23 June that rose to 4.6 km altitude and drifted NE before dissipating. It was accompanied briefly by a hotspot detected in thermal imagery.
Low-altitude steam and gas plumes were visible throughout July 2018 with periodic nighttime incandescence and ejecta blocks occasionally visible around the crater. Three explosions on 13, 14, and 15 July produced seismic events and significant ejecta, and resulted in partial destruction of the dome (figure 26). The event on 13 July was recorded as a M 3.7 located 430 m below the summit. During the night of 13-14 July images showed incandescence and ejecta on the NE flank near the crater ranging from centimeter to meter in size. The thermal webcam measured temperatures around 300?C. The second explosion on 14 July was recorded as a M 3.9 event located 1.4 km below the summit; webcam images in clear weather the following afternoon showed the extent of the new material on the NNE flank (figure 27). The third explosion in the early morning of 15 July was measured as a M 3.8 event and produced an incandescent column 340 m high. Additional ejecta on the NNE slope was visible in the webcam that afternoon. The Buenos Aires VAAC reported a pulse of ash moving ESE on 15 July at 6.4 km altitude. A video taken by SERNAGEOMIN during an overflight on 16 July showed ejecta around the flanks and steam rising from the partly destroyed dome. Intermittent, low-altitude steam-and-gas emissions continued for the rest of the month; light gray emissions were reported from 26 July through the end of the month.
An explosion midday on 7 August 2018 produced abundant high-temperature ejecta around the crater and a 1.5 km high ash plume, according to SERNAGEOMIN. Intermittent gray plumes were reported the next day and for the remainder of August, along with incandescence at night from high-temperature degassing and smaller explosive events (figure 28). The Buenos Aires VAAC reported sporadic and small puffs of ash visible in the webcam on 27 August.
Intermittent gray emissions and minor incandescence at night were typical of the activity during September 2018, except for a series of explosive events during 11-13 September (figures 29). An explosion on 11 September produced ejecta that traveled 300 m down the slope. The largest event, on 12 September, produced a 2.5-km-high dense ash plume and a pyroclastic flow that went 400 m down the E slope. Communities within 1 km of the crater reported ashfall. Drone video footage from 13 September posted by Nicolas Luengo V. showed the path of a block-and-ash flow down the flank and dense steam emissions with ash rising from the partially destroyed dome (figure 30) (Luengo and Palma, 2018). The Buenos Aires VAAC reported a small ash plume at 4.3-4.9 km altitude drifting SSW on 14 September. Satellite images from 16 September again showed partial destruction of the growing dome at the summit from the explosive events.
The Buenos Aires VAAC reported an ash emission to 6.1 km altitude on 13 October 2018 seen in multispectral imagery under mostly clear skies moving SSE, and another isolated emission at the same altitude moving SE on 31 October. SERNAGEOMIN reported abundant ejecta scattered around the crater after the 13 October event. Another explosive event on 7-8 November produced incandescent ejecta and ash plumes that were the highest of the reporting period, rising to 7 km altitude and moving SE as reported by the Buenos Aires VAAC (figure 31).
For most of November 2018, pulsating emissions from the crater were accompanied by nighttime incandescence with small explosions and short-range ejecta. The SERNAGEOMIN webcam captured images of explosions on 23, 27, and 29 November. The Buenos Aires VAAC observed weak pulses of ash in satellite imagery at 3.9 km altitude on 23 and 27 November. The intermittent explosions with incandescent blocks and ash from June through November 2018 produced occasional low to moderate thermal anomalies that were captured by the MIROVA project (figure 32).
Reference: Luengo, Nicolas and Palma, Jose Luis, 2018, Morfometría y tasas de extrusión del domo de lava del Complejo Volcánico Nevados de Chillán mediante el uso de drones eimágenes satelitales, Concepción, Chile, XV Congreso Geológico Chileno, University of Concepción, DOI:10.13140/RG.2.2.35386.64966/1.
Geologic Background. The compound volcano of Nevados de Chillán is one of the most active of the Central Andes. Three late-Pleistocene to Holocene stratovolcanoes were constructed along a NNW-SSE line within three nested Pleistocene calderas, which produced ignimbrite sheets extending more than 100 km into the Central Depression of Chile. The dominantly andesitic Cerro Blanco (Volcán Nevado) stratovolcano is located at the NW end of the massif. Volcán Viejo (Volcán Chillán), which was the main active vent during the 17th-19th centuries, occupies the SE end. The Volcán Nuevo lava-dome complex formed during 1906-1945 on the NW flank of Viejo. The Volcán Arrau dome complex was then constructed on the SE side of Volcán Nuevo between 1973 and 1986, and eventually exceeded its height. Smaller domes or cones are present in the 5-km valley between the two major edifices.
Information Contacts: Servicio Nacional de Geología y Minería (SERNAGEOMIN), Observatorio Volcanológico de Los Andes del Sur (OVDAS), Avda Sta María No. 0104, Santiago, Chile (URL: http://www.sernageomin.cl/), 16 July 2018 overflight video on YouTube (https://www.youtube.com/watch?v=SVFklfEnWXI); MIROVA (Middle InfraRed Observation of Volcanic Activity), a collaborative project between the Universities of Turin and Florence (Italy) supported by the Centre for Volcanic Risk of the Italian Civil Protection Department (URL: http://www.mirovaweb.it/); Nicolas Luengo, University of Concepcion (Twitter: @nluengov), 13 September drone video footage on YouTube (https://www.youtube.com/watch?v=BZt5X3rWoFM); Jaime S. Sincioco (Twitter: @jaimessincioco); Samuel Opazo T (Twitter: @OpazoSamuel).
Dukono (Indonesia) — December 2018 Cite this Report
Dukono
Indonesia
1.6992°N, 127.8783°E; summit elev. 1273 m
All times are local (unless otherwise noted)
Regular ash explosions continuing as of September 2018
The long-term eruption at Dukono has been characterized by frequent ash explosions through at least March 2018 (BGVN 43:04). The current report shows that this pattern continued through at least September 2018. The data below were provided by the Pusat Vulkanologi dan Mitigasi Bencana Geologi (PVMBG), also known as the Center for Volcanology and Geological Hazard Mitigation (CVGHM), and the Darwin Volcanic Ash Advisory Centre (VAAC).
Between April and September 2018 there were about five reports per month about ash plumes. Altitudes generally ranged from 1.4-2.1 km, although 3 km was reported during 2-8 May and 3.4 km was reported during 25-31 July (table 18).
Table 18. Monthly summary of reported ash plumes from Dukono for April-September 2018. The direction of drift for the ash plume through each month was highly variable. Data courtesy of the Darwin VAAC and PVMBG.
| Month |
Plume Altitude (km) |
Notable Plume Drift |
| Apr 2018 |
1.5-2.1 |
-- |
| May 2018 |
1.5-3 |
Ash plumes drifted as far as 225 km NW on 28 May |
| Jun 2018 |
1.4-2.1 |
-- |
| Jul 2018 |
1.8-3.4 |
-- |
| Aug 2018 |
1.8-2.4 |
-- |
| Sep 2018 |
1.8-2.1 |
-- |
No thermal anomalies at Dukono, based on MODIS satellite instruments analyzed using the MODVOLC algorithm, were detected during the reporting period. The MIROVA (Middle InfraRed Observation of Volcanic Activity) volcano hotspot detection system, also based on analysis of MODIS data, detected a low-power hotspot in early April (about 2.5 km from the volcano) and a possible low-power hotspot in late August 2018 (about 5 km from the volcano).
Geologic Background. Reports from this remote volcano in northernmost Halmahera are rare, but Dukono has been one of Indonesia's most active volcanoes. More-or-less continuous explosive eruptions, sometimes accompanied by lava flows, have occurred since 1933. During a major eruption in 1550 CE, a lava flow filled in the strait between Halmahera and the N-flank Gunung Mamuya cone. This complex volcano presents a broad, low profile with multiple summit peaks and overlapping craters. Malupang Wariang, 1 km SW of the summit crater complex, contains a 700 x 570 m crater that has also been active during historical time.
Information Contacts: Pusat Vulkanologi dan Mitigasi Bencana Geologi (PVMBG, also known as Indonesian Center for Volcanology and Geological Hazard Mitigation, CVGHM), Jalan Diponegoro 57, Bandung 40122, Indonesia (URL: http://www.vsi.esdm.go.id/); Darwin Volcanic Ash Advisory Centre (VAAC), Bureau of Meteorology, Northern Territory Regional Office, PO Box 40050, Casuarina, NT 0811, Australia (URL: http://www.bom.gov.au/info/vaac/); Hawai'i Institute of Geophysics and Planetology (HIGP) - MODVOLC Thermal Alerts System, School of Ocean and Earth Science and Technology (SOEST), Univ. of Hawai'i, 2525 Correa Road, Honolulu, HI 96822, USA (URL: http://modis.higp.hawaii.edu/); MIROVA (Middle InfraRed Observation of Volcanic Activity), a collaborative project between the Universities of Turin and Florence (Italy) supported by the Centre for Volcanic Risk of the Italian Civil Protection Department (URL: http://www.mirovaweb.it/).
Ebeko
Russia
50.686°N, 156.014°E; summit elev. 1103 m
All times are local (unless otherwise noted)
Frequent ash explosions continue during June-November 2018
Typical activity during the current eruption at Ebeko that began in October 2016 consists of numerous explosions and associated ash plumes (BGVN 43:06). The Kamchatkan Volcanic Eruption Response Team (KVERT) is responsible for monitoring this remote volcano, and has an observation site at Severo-Kurilsk, 7 km E. The current report reviews events from June through November 2018. During the reporting period, the Aviation Color Code remained at Orange, the second highest level of the four-color scale.
According to KVERT, numerous moderate explosions every month generated ash plumes (figure 18 an d19) that rose between 2.5-6 km in altitude, with most between 3 and 4.5 km (table 7). Occasionally, ashfall was reported in Severo-Kurilsk. KVERT reported that thermal anomalies began about mid-August and continued through November.
Table 7. Summary of activity at Ebeko from June-November 2018. TA is thermal anomaly, S-K is Severo-Kurilsk (7 km E of the volcano). Data courtesy of KVERT.
| Date |
Plume Altitude |
Plume Distance |
Plume Direction |
Other observations |
| 05 Jun 2018 |
-- |
8 km |
E |
Diffuse ash plume. |
| 15 Jun 2018 |
-- |
14 km |
SE |
-- |
| 17-18 Jun 2018 |
2.5-3 km |
-- |
-- |
Explosions. |
| 26-27 Jun 2018 |
3 km |
-- |
-- |
Explosions. |
| 30 Jun-01 Jul 2018 |
3.2 km |
57 km |
SE |
Explosions. |
| 08-12 Jul 2018 |
4 km |
37 km |
W |
Explosions. |
| 13-20 Jul 2018 |
3.4 km |
-- |
-- |
Explosions. |
| 20-21, 25-26 Jul 2018 |
4 km |
15 km |
E |
Explosions. |
| 29 Jul-01 Aug 2018 |
6 km |
-- |
-- |
Explosions. |
| 03-10 Aug 2018 |
3.7 km |
65 km |
E |
Explosions. |
| 11-17 Aug 2018 |
4.5 km |
52 km |
SE |
Explosions. TA on 12 Aug. |
| 17-24 Aug 2018 |
5.2 km |
235 km |
SE |
Explosions. TA on 21-23 Aug. |
| 24-31 Aug 2018 |
3.6 km |
135 km |
SE, S, SW |
Explosions. TA 24-25, 30 Aug. Ashfall on 29-30 Aug. |
| 31 Aug-07 Sep 2018 |
4.5 km |
75 km |
N, S |
Explosions. TA on 4-5 Sep. |
| 07-13 Sep 2018 |
3.4 km |
113 km |
SE, NE |
Explosions. TA on 7, 9, 12-13 Sep. Occasional incandescence on 10-13 Sep. |
| 14-21 Sep 2018 |
4.2 km |
80 km |
E |
Explosions. TA occasionally visible. |
| 21-28 Sep 2018 |
4 km |
68 km |
SE |
Explosions. TA on 23, 27 Sep. |
| 28 Sep-05 Oct 2018 |
4.5 km |
80 km |
SW, SE, E |
Explosions. TA on 27-28 Sep. |
| 05-12 Oct 2018 |
4.5 km |
125 km |
SE |
Explosions. TA on 8 Oct. |
| 12-19 Oct 2018 |
4.5 km |
Multiple |
Explosions. Ashfall in S-K. |
| 19-26 Oct 2018 |
4.7 km |
80 km |
E |
Explosions. TA on 24 Oct. Ashfall in S-K. |
| 26 Oct-02 Nov 2018 |
3.7 km |
-- |
Multiple |
Explosions. TA on 24, 29 Oct. Ashfall in S-K on 29-31 Oct. |
| 02-09 Nov 2018 |
3.7 km |
-- |
Multiple |
Explosions. Ashfall in S-K. |
| 09-15 Nov 2018 |
4.5 km |
-- |
E |
Explosions. Weak TA on 12-13 Nov. |
| 15-23 Nov 2018 |
3.2 km |
-- |
NE, S |
Explosions. |
| 23-30 Nov 2018 |
4 km |
-- |
E |
Explosions. Weak TA on 24 Nov. Ashfall in S-K on 27, 29 Nov. |
Thermal anomalies, based on MODIS satellite instruments analyzed using the MODVOLC algorithm, were observed only twice during the reporting period, on 30 August and 29 September 2018. The MIROVA (Middle InfraRed Observation of Volcanic Activity) volcano hotspot detection system, also based on analysis of MODIS data, detected a few scattered anomalies, almost all of which were concentrated during the latter half of August through September. These data are consistent with KVERT's observations of thermal anomalies beginning in mid-August.
Geologic Background. The flat-topped summit of the central cone of Ebeko volcano, one of the most active in the Kuril Islands, occupies the northern end of Paramushir Island. Three summit craters located along a SSW-NNE line form Ebeko volcano proper, at the northern end of a complex of five volcanic cones. Blocky lava flows extend west from Ebeko and SE from the neighboring Nezametnyi cone. The eastern part of the southern crater contains strong solfataras and a large boiling spring. The central crater is filled by a lake about 20 m deep whose shores are lined with steaming solfataras; the northern crater lies across a narrow, low barrier from the central crater and contains a small, cold crescentic lake. Historical activity, recorded since the late-18th century, has been restricted to small-to-moderate explosive eruptions from the summit craters. Intense fumarolic activity occurs in the summit craters, on the outer flanks of the cone, and in lateral explosion craters.
Information Contacts: Kamchatka Volcanic Eruptions Response Team (KVERT), Far Eastern Branch, Russian Academy of Sciences, 9 Piip Blvd., Petropavlovsk-Kamchatsky, 683006, Russia (URL: http://www.kscnet.ru/ivs/kvert/); Institute of Volcanology and Seismology, Far Eastern Branch, Russian Academy of Sciences (IVS FEB RAS), 9 Piip Blvd., Petropavlovsk-Kamchatsky 683006, Russia (URL: http://www.kscnet.ru/ivs/eng/); Hawai'i Institute of Geophysics and Planetology (HIGP) - MODVOLC Thermal Alerts System, School of Ocean and Earth Science and Technology (SOEST), Univ. of Hawai'i, 2525 Correa Road, Honolulu, HI 96822, USA (URL: http://modis.higp.hawaii.edu/); MIROVA (Middle InfraRed Observation of Volcanic Activity), a collaborative project between the Universities of Turin and Florence (Italy) supported by the Centre for Volcanic Risk of the Italian Civil Protection Department (URL: http://www.mirovaweb.it/).
Etna
Italy
37.748°N, 14.999°E; summit elev. 3357 m
All times are local (unless otherwise noted)
Lava flows emerge from NSEC in late August and late November 2018; Strombolian activity continues from multiple vents
Italy's Mount Etna on the island of Sicily has had historically recorded eruptions for the past 3,500 years and has been erupting continuously since September 2013 through at least November 2018. Lava flows, explosive eruptions with ash plumes, and Strombolian lava fountains commonly occur from its summit areas that include the Northeast Crater (NEC), the Voragine-Bocca Nuova (or Central) complex (VOR-BN), the Southeast Crater (SEC) (formed in 1978), and the New Southeast Crater (NSEC) (formed in 2011). A new crater, referred to as the "cono della sella" (saddle cone), emerged during early 2017 in the area between SEC and NSEC and has become the highest part of the SEC-NSEC complex. Activity during late 2017 and early 2018 consisted mostly of sporadic Strombolian activity with infrequent minor ash emissions from multiple vents at various summit craters. Lava flow activity resumed in late August 2018 and again in late November and is covered in this report with information provided primarily by the Osservatorio Etneo (OE), part of the Catania Branch of Italy's Istituo Nazionale di Geofisica e Vulcanologica (INGV).
After several months of low-level activity in early 2018, increases in Strombolian activity at several vents began in mid-July (BGVN 43:08). This was followed by new lava flows emerging from the saddle cone and the E vent of the NSEC complex in late August. Discontinuous low-intensity Strombolian activity and intermittent ash emissions were reported from multiple vents at various summit craters during September through November. In late November, renewed Strombolian activity and a new, small flow emerged from a small scoria cone inside the E vent of the NSEC crater and persisted through the end of the month. The MIROVA thermal anomaly correspond to ground observations of increased thermal activity at Etna beginning in mid-July, peaking in late August, and increasing again at the end of November 2018 (figure 222).
Low-energy Strombolian activity resumed at both of the Bocca Nuova BN-1 vents as well as the vents in the Northeast Crater (NEC) during the second week of July 2018 and continued throughout the month. The activity from BN-1 was nearly continuous, but not always visible; occasionally, lava fragments rose 100 m and could be seen outside of the crater rim. Intermittent ash emissions accompanied the Strombolian activity. Activity at NEC was characterized by strong and prolonged explosions (up to several tens of seconds), sometimes with reddish-brown ash emissions (figure 223). Three vents on the floor of NEC continued to widen due to collapse of the inner walls. A seismic swarm on 18-19 July was located between 4 and 9 km depth.
During a field inspection on 30 July INGV personnel noted activity at the three vents at the bottom of Northeast Crater; the farthest west produced ash emissions, the center produced steam, and the vent under the NE crater wall produced Strombolian activity that sent ejecta as high as the crater rim. Frequent ash emissions from NEC were observed on 3, 4, and 5 August. During the first week of August 2018 Strombolian activity also continued at BN-1 (figure 224). The webcam at Montagnola (EMOH) recorded incandescence at night from Bocca Nuova.
After several months of calm, explosive activity also resumed at the E vent of the of the New Southeast Crater, high on the E flank, in early August. An explosion in the early morning of 1 August 2018 generated a gray-brown ash plume that rose several hundred meters above the summit (figure 225). Smaller emissions occurred throughout the day, and the EMOH camera recorded sporadic Strombolian explosions at night, which continued through the first week of August.
Similar activity at BN-1, NEC, and the reactivated vent at NSEC continued through the second and third weeks of August. On 16 August 2018 a new vent opened in the BN-2 area on the E side of the Voragine (inactive since December 2015) and exhibited both degassing and Strombolian activity (figure 226). During that week Strombolian activity also continued at the NEC, but activity became more sporadic at the E vent of NSEC. During the last week of August, Strombolian activity and intense degassing continued in the western sector of Bocca Nuova (BN-1). Occasionally, lapilli fragments a few centimeters in diameter were ejected onto the S rim of the crater. Strombolian activity also continued from multiple vents at the bottom of NEC. The frequency and intensity of explosions was variable and increased significantly during 22 August, ejecting coarse pyroclastic material outside the crater rim.
Beginning on 23 August 2018 about 1800 UTC, activity resumed at the saddle cone located between the old cone of the Southeast Crater (SEC) and the new cone (NSEC). Strombolian activity, initially modest, quickly became more intense, producing almost continuous explosions with the launch of coarse ejecta up to a height of 100-150 m. At 1830 UTC, while Strombolian explosions of modest intensity were also taking place at the E vent of NSEC, a small lava flow emerged from the E vent and traveled a few hundred meters E towards the Valle del Bove. Shortly after 1830 UTC another lava overflow was also observed moving N from the saddle cone (figures 227 and 228).
Strombolian explosions of moderate intensity continued throughout the night from the saddle cone. The following morning (24 August) a small lava overflow emerged from the vent and stopped after traveling a few tens of meters towards the S flank of the NSEC cone (figure 228, small orange flow within saddle, and figure 229b). The Strombolian activity was accompanied by an abundant and continuous emission of ash, whichformed a small plume that rose a few hundred meters from the vent (figure 229c). The Strombolian activity at the saddle cone decreased gradually on 25 August.
Strombolian activity was continuing on 27 August 2018 at NSEC, and the flow to the N into the Valle del Leone began cooling after lava stopped feeding it that evening. The same day, a new lava overflow emerged from the E vent of NSEC (figure 230) and flowed E towards the Valle del Bove for about 24 hours (figure 231).
Discontinuous Strombolian activity continued from NSEC after the effusive activity ended in late August. Several loud explosions from NSEC were reported by people living near the E flank of Etna during the first week of September. Strombolian activity, modest ash emissions, and significant gas emissions were also produced by BN-1; BN-2 exhibited only continuous degassing activity. Explosive activity declined during the second week of September. Discontinuous low-intensity Strombolian activity and intermittent ash emissions from Bocca Nuova, New Southeast Crater, and Northeast Crater characterized activity for the remainder of September. During the last week of the month, NEC produced frequent gray-brown ash emissions from a vent located in the western part of the crater floor, and included jets of ash, blocks, and volcanic bombs (figure 232).
Discontinuous low-intensity Strombolian activity and intermittent ash emissions from the Bocca Nuova, the New Southeast Crater, and Northeast Crater characterized activity during all of October 2018. Two vents remained active at the bottom of Bocca Nuova (BN-1). During a visit on 16 October, INGV-OE geologists noted that the northernmost vent produced nearly continuous Strombolian activity with frequent explosions; occasionally fragments exceeded the crater rim in height but still fell within the crater. The southernmost vent, on the crater floor about 130 m from the edge, was characterized by explosive activity that produced mainly spattering which covered both the crater floor and walls (figure 233). On 25 October the webcam at Bronte recorded an ash emission from Bocca Nuova that resulted from three closely-spaced explosions. The ash was red and dispersed rapidly to the S causing ashfall near Torre del Filosofo and Rifugio Sapienza.
Strombolian activity at NSEC gradually intensified during the first week of November 2018 and was sometimes accompanied by ash emissions that rapidly dispersed, falling mainly near the vent and in the Valle del Bove to the E. Audible explosions from the activity were heard in Zafferana Etnea on the E flank. Several clear views of the summit and details of the active vents were well exposed during an overflight on a clear 9 November day (figure 234).
Three vents were visible at BN-1 during the 9 November 2018 overflight (figure 235); continuous Strombolian activity occurred at vent 1, whose fallout of pyroclastic debris remained within the crater; discontinuous Strombolian activity was observed at vent 2 associated with weak, pulsing ash emissions; only degassing activities were observed at vent 3. At BN-2, intense degassing accompanied discontinuous Strombolian activity that was associated with weak pulsating ash emissions, and several high temperature gas emission points. Scientists also observed a collapse on a portion of the northern inner wall of BN-1 from the explosion on 25 October.
Modest outgassing continued at Voragine (VOR) from the 7 August 2016 vent near the rim during November. At NEC, continuous and intense Strombolian activity from the crater floor caused pyroclastic ejecta to land outside the crater rim (figure 236). At the NSEC complex, high-temperature anomalies were visible at the NW crater edge, and the E vent of NSEC had a small scoria cone that produced discontinuous Strombolian explosions and minor ash emissions (figure 237).
A seismic swarm with over 40 events affected the W flank of Etna on 20 November 2018; the hypocenters were located between 15 and 27 km depth. A small lava flow also emerged on 20 November from the scoria cone inside the E vent at NSEC. The flow lasted for a few hours and remained inside the E vent. A new flow from the same scoria cone at the NSEC east vent appeared on 26 November accompanied by continued Strombolian activity. The flow remained high on the E flank at an elevation of about 3,200 m. Flow activity continued into the first days of December with frequent incandescent blocks moving down the NSEC E flank (figure 238). Elsewhere at Etna, Strombolian activity continued accompanied by sporadic and modest ash emissions from Bocca Nuova, the New Southeast Crater and the Northeast Crater through the end of November (figure 239).
Geologic Background. Mount Etna, towering above Catania on the island of Sicily, has one of the world's longest documented records of volcanism, dating back to 1500 BCE. Historical lava flows of basaltic composition cover much of the surface of this massive volcano, whose edifice is the highest and most voluminous in Italy. The Mongibello stratovolcano, truncated by several small calderas, was constructed during the late Pleistocene and Holocene over an older shield volcano. The most prominent morphological feature of Etna is the Valle del Bove, a 5 x 10 km caldera open to the east. Two styles of eruptive activity typically occur, sometimes simultaneously. Persistent explosive eruptions, sometimes with minor lava emissions, take place from one or more summit craters. Flank vents, typically with higher effusion rates, are less frequently active and originate from fissures that open progressively downward from near the summit (usually accompanied by Strombolian eruptions at the upper end). Cinder cones are commonly constructed over the vents of lower-flank lava flows. Lava flows extend to the foot of the volcano on all sides and have reached the sea over a broad area on the SE flank.
Information Contacts: Sezione di Catania - Osservatorio Etneo, Istituto Nazionale di Geofisica e Vulcanologia (INGV), Sezione di Catania, Piazza Roma 2, 95123 Catania, Italy (URL: http://www.ct.ingv.it/it/ ); MIROVA (Middle InfraRed Observation of Volcanic Activity), a collaborative project between the Universities of Turin and Florence (Italy) supported by the Centre for Volcanic Risk of the Italian Civil Protection Department (URL: http://www.mirovaweb.it/).
Piton de la Fournaise (France) — December 2018 Cite this Report
Piton de la Fournaise
France
21.244°S, 55.708°E; summit elev. 2632 m
All times are local (unless otherwise noted)
Eruption from 15 September to 1 November produced a lava flow to the E
Piton de la Fournaise, located in the SE part of La Réunion Island in the Indian Ocean, has been producing frequent effusive basaltic eruptions on average twice a year since 1998. The activity is characterized by lava fountains and lava flows, and occasional explosive eruptions that shower blocks over the summit area and produce ash plumes. Almost all of the recent activity has occurred within the Enclos Fouqué caldera, with recent eruptions in 1977, 1986, and 1998 at vents outside of the caldera. The most recent eruptive episode lasted 18 hours on 13 July 2018. This report summarizes activity during September-November 2018 and is based on reports by Observatoire Volcanologique du Piton de la Fournaise (OVPF) and satellite data.
After deformation had ceased in early August, inflation resumed in the beginning of September (figure 145) accompanied by low-level seismicity. From 1 to 12 September CO2 concentrations at the summit had decreased, followed by an increase during 12-20 September. A seismic crisis was reported on 0145 on 15 September that included 995 shallow (less than 2 km depth) volcano-tectonic earthquakes recorded in less than four hours. This was accompanied by rapid deformation of up to 24 cm.
The eruption began at 0435 on 15 September with a fissure opening and erupting lava on the SW flank near Rivals crater. This new fissure was about 300 m downstream, and was a continuation of, the 27 April-1 June 2018 fissure. Volcanic tremor rapidly and steadily declined once the eruption began, which is commonly observed during eruptions of Piton de la Fournaise. An observation flight that day showed five fissures with lava fountains reaching 30 m high in the center of the fissure system (figure 146). By 1100 two main lava flows had merged further downflow and traveled 2 km from the fissures. During the first hours of the eruption the estimated time-averaged discharge rate was 22.7 and 44.7 m3/s.
A survey on the 15th recorded multiple lobes at the end of the lava flow and flow rates of 1-5 m3/s (figures 147 and 148). Three vents remained active on 16 September and a spatter cone was being constructed around them. The lava effusion rate was measured at 2.5-7 m3/s. SO2 levels were elevated and the resulting gas plume was dispersed towards the W. On the 17th the lava flow was still high on the flank and moving E.
By 18 September a cone had developed and was open to the south, producing lava fountaining and feeding the lava flow (figure 149). The lava flow had extended to 2.8 km from the vent, with the active flow front about 500 m from the southern wall of the caldera. The flows advanced several hundred meters by the 21st and the height of the cone was 30 m on the eastern side where a near-vertical wall had formed (figure 150). The cone contained three active lava fountains.
Fallout of Pele's hair was reported in the Grand Coude area on 22 September. The cone remained open to the south and a deep channel had formed with lava tubes observed close to the cone (figure 151). Three lava fountains continued to feed the lava flow towards the S, then the SE, with a flow rate of 1-3 m3/s.
By 26 September the fissure system had evolved into a single cone and the opening towards the south had closed, leaving a circular vent and a lava lake (figure 152). Observations on the 26th showed that lava tubes were developing and feeding outbreak flows 150-300 m away from the cone. During 24-30 September the surface lava flow rate varied from 0.5 to 5.3 m/s, but this was expected to be higher in the lava tubes. By the 27th the majority of the lava was feeding from within the vent area into lava tubes that continued to feed breakout flows several hundred meters from the cone. On the 30th a small lava flow was also visible at the foot of the cone and spattering was seen low above the cone (figure 153).
The surface lava flow rate ranged from less than 1 and up to 4 m3/s on 1-2 October, with the majority of the activity still taking place in lava tubes with some small breakout flows (figure 154). There was a reduction in surface activity on 2-3 October along with a change from continuous degassing to the emission of discrete gas plumes ("gas pistons") that were accompanied by a sharp increase in tremor (figure 155). Observations on the 4th noted that spattering at the vent was minor and rare. No breakouts were observed.
Limited activity continued from the 5 to 7 October surface activity remained low, with minor spattering and few breakouts. Lava continued to flow within the lava tubes and degassing was visible at the surface above them. From 30 September to 8 October the lava had traveled 1.8 km E within lava tubes and emerged as a breakout along the northern flow (figure 156). The south and central flow-fronts had not advanced during this time.
On 14 October no lava channels were visible on the surface and only small breakouts were observed (figure 157). Activity continued in lava tubes and strong degassing persisted from both the vent and main lava tubes (figure 158). On the 18th OVPF/IPGP reported continued strong degassing and a small lava channel that had formed out to a few tens of meters from the cone (figures 159 and 160).
By 25 October the lava flow rate was still low with no further extension of the flow boundary, SO2 emission from the vent were low (close to or below the detection limit), CO2 levels were decreasing, and the intensity of the tremor had stabilized at a very low level for about 24 hours (figure 161). At this point the lava field was essentially composed of lava tubes with a maximum recorded surface temperature (maximum integrated pixel temperature) of 71°C (figure 162). This low level of activity continued during the 26-28th with a small amount of surface lava activity about 1 km from the vent. Over 29-31 October the surface activity was extremely low with no fresh lava observed and only degassing at the vent. The eruption was declared over at 0400 on 1 November after 47 days of activity.
Thermal observations during the September-November eruption showed the evolution of the lava flow and the reduction in surface temperatures when the activity was dominated by lava tubes (figure 163). The sharp increase in thermal anomalies detected by the MIROVA algorithm showed the onset of lava effusion, and the anomalies tapered off as the flow field cooled down (figure 164). The estimated volume of lava produced from 15 September to 17 October was 9-19 million m3, but this is lower than the actual erupted volume due to the lava tube activity. There were 459 MODVOLC thermal alerts from 15 September to 25 October.
Geologic Background. Piton de la Fournaise is a massive basaltic shield volcano on the French island of Réunion in the western Indian Ocean. Much of its more than 530,000-year history overlapped with eruptions of the deeply dissected Piton des Neiges shield volcano to the NW. Three scarps formed at about 250,000, 65,000, and less than 5,000 years ago by progressive eastward slumping, leaving caldera-sized embayments open to the E and SE. Numerous pyroclastic cones are present on the floor of the scarps and their outer flanks. Most recorded eruptions have originated from the summit and flanks of Dolomieu, a 400-m-high lava shield that has grown within the youngest scarp, which is about 9 km wide and about 13 km from the western wall to the ocean on the E side. More than 150 eruptions, most of which have produced fluid basaltic lava flows, have occurred since the 17th century. Only six eruptions, in 1708, 1774, 1776, 1800, 1977, and 1986, have originated from fissures outside the scarps.
Information Contacts: Observatoire Volcanologique du Piton de la Fournaise, Institut de Physique du Globe de Paris, 14 route nationale 3, 27 ème km, 97418 La Plaine des Cafres, La Réunion, France (URL: http://www.ipgp.fr/fr; Twitter: https://twitter.com/ObsFournaise); MIROVA (Middle InfraRed Observation of Volcanic Activity), a collaborative project between the Universities of Turin and Florence (Italy) supported by the Centre for Volcanic Risk of the Italian Civil Protection Department (URL: http://www.mirovaweb.it/); Hawai'i Institute of Geophysics and Planetology (HIGP) - MODVOLC Thermal Alerts System, School of Ocean and Earth Science and Technology (SOEST), Univ. of Hawai'i, 2525 Correa Road, Honolulu, HI 96822, USA (URL: http://modis.higp.hawaii.edu/); Sentinel Hub Playground (URL: https://www.sentinel-hub.com/explore/sentinel-playground).
Ibu
Indonesia
1.488°N, 127.63°E; summit elev. 1325 m
All times are local (unless otherwise noted)
Thermal anomalies and ash explosions from the crater continue during May-November 2018
Continuing activity at Ibu has consisted of numerous thermal anomalies and, except apparently for the period from September 2017 through early March 2018, intermittent ash explosions (BGVN 43:05). This activity continued through November 2018. The Alert Level has remained at 2 (on a scale of 1-4), and the public was warned to stay at least 2 km away from the active crater, and 3.5 km away on the N side.
Ash plumes were seen frequently during May-November 2018 (table 4). Plume heights above the crater were generally 400-80 m. However, ash plumes on 28 and 29 July rose 5.5 and 4.8 km, respectively. Seismicity associated with ash plumes were characterized by explosion and avalanche signals.
Table 4. Ash explosions reported at Ibu, May-November 2018. Data courtesy of PVMBG and Darwin VAAC.
| Date |
Time |
Ash plume (height above crater rim) |
Plume Drift |
| 05 May 2018 |
0622 |
600 m |
N, NE |
| 06 Jun 2018 |
1206 |
500 m |
N |
| 12 Jun 2018 |
1750 |
600 m |
N |
| 14-19 Jun 2018 |
-- |
200-600 m |
N |
| 21 Jun 2018 |
0857 |
600 m |
N |
| 22-26 Jun 2018 |
-- |
850 m |
WNW, W |
| 27 Jun 2018 |
-- |
500 m |
W |
| 06 Jul 2018 |
-- |
800 m |
N |
| 10-15 Jul 2018 |
-- |
200-800 m |
-- |
| 28 Jul 2018 |
1852 |
5.5 km |
SE |
| 29 Jul 2018 |
1612 |
4.8 km |
N, SE |
| 13 Aug 2018 |
0259 |
600 m |
-- |
| 20 Aug 2018 |
1742 |
1.2 km |
-- |
| 24 Aug 2018 |
0838 |
800 m |
S |
| 28, 30 Sep 2018 |
-- |
500 m |
N, NE |
| 06 Oct 2018 |
-- |
500 m |
WSW |
| 19 Oct 2018 |
1223 |
400 m |
N |
| 26 Nov 2018 |
-- |
500 m |
SE |
The number of thermal anomalies during this time, based on MODIS satellite instruments analyzed using the MODVOLC algorithm, ranged from 2 days/month (July) to 9 days/month (September); some events were two pixels. Days with anomalies and ash explosions were not well correlated. The MIROVA (Middle InfraRed Observation of Volcanic Activity) volcano hotspot detection system, also based on analysis of MODIS data, detected numerous hotspots every month of the reporting period, almost all of which were within 5 km of the volcano and of low-to-moderate power. Infrared satellite imagery showed that the volcano had at least two, and sometimes three, active dome or vent locations (figure 14).
Geologic Background. The truncated summit of Gunung Ibu stratovolcano along the NW coast of Halmahera Island has large nested summit craters. The inner crater, 1 km wide and 400 m deep, has contained several small crater lakes. The 1.2-km-wide outer crater is breached on the N, creating a steep-walled valley. A large cone grew ENE of the summit, and a smaller one to the WSW has fed a lava flow down the W flank. A group of maars is located below the N and W flanks. The first observed and recorded eruption was a small explosion from the summit crater in 1911. Eruptive activity began again in December 1998, producing a lava dome that eventually covered much of the floor of the inner summit crater along with ongoing explosive ash emissions.
Information Contacts: Pusat Vulkanologi dan Mitigasi Bencana Geologi (PVMBG, also known as Indonesian Center for Volcanology and Geological Hazard Mitigation, CVGHM), Jalan Diponegoro 57, Bandung 40122, Indonesia (URL: http://www.vsi.esdm.go.id/); Darwin Volcanic Ash Advisory Centre (VAAC), Bureau of Meteorology, Northern Territory Regional Office, PO Box 40050, Casuarina, NT 0811, Australia (URL: http://www.bom.gov.au/info/vaac/); Hawai'i Institute of Geophysics and Planetology (HIGP) - MODVOLC Thermal Alerts System, School of Ocean and Earth Science and Technology (SOEST), Univ. of Hawai'i, 2525 Correa Road, Honolulu, HI 96822, USA (URL: http://modis.higp.hawaii.edu/); MIROVA (Middle InfraRed Observation of Volcanic Activity), a collaborative project between the Universities of Turin and Florence (Italy) supported by the Centre for Volcanic Risk of the Italian Civil Protection Department (URL: http://www.mirovaweb.it/); Sentinel Hub Playground (URL: https://www.sentinel-hub.com/explore/sentinel-playground).
Kilauea (United States) — December 2018 Cite this Report
Kilauea
United States
19.421°N, 155.287°W; summit elev. 1222 m
All times are local (unless otherwise noted)
Lava fountains on the Lower East Rift Zone build 50-m-high pyroclastic cone and 13-km-long lava flow that engulfs Kapoho Bay during June 2018; 533 homes destroyed since 1 May
Kīlauea's East Rift Zone (ERZ) has been intermittently active for at least two thousand years. Open lava lakes and flows from the summit caldera and East Rift Zone have been almost continuously active since the current eruption began in 1983. A marked increase in seismicity and ground deformation at Pu'u 'O'o Cone on the upper East Rift Zone on 30 April 2018 and the subsequent collapse of its crater floor marked the beginning of the largest lower East Rift Zone eruptive episode in at least 200 years.
During the month of May 2018 there were 24 fissures that opened along a 6-km-long NE-trending fracture zone on the lower East Rift Zone spawning lava flows in multiple directions, including several that traveled about 5 km SE to the coast; at least 94 structures were destroyed in the Leilani Estates subdivision and adjacent areas (BGVN 43:10). As lava emerged from the fissures, the lava lake at Halema'uma'u drained and explosions produced plumes that spread minor amounts of ash to downwind communities. At the end of May eruptive activity refocused around fissure 8, which began fountaining lava tens of meters into the air and creating a voluminous incandescent flow that headed downslope to the NE. The eruptive events of June 2018 (figure 386), the second month of this episode, are described below with information provided primarily from the US Geological Survey's (USGS) Hawaiian Volcano Observatory (HVO) in the form of daily reports, volcanic activity notices, and abundant photo, map, and video data.
Summary of events during June 2018. Lava fountains from fissure 8 were reaching 60 m in height on 29 May 2018 and producing a vigorous stream of lava that traveled rapidly downslope. Several lobes of lava advanced ENE, some at rates of several hundred meters per hour. Fissure 18 was also generating a narrow flow that headed SE for 3 km before stopping. A spatter cone began growing at fissure 8 and reached 30 m in height in just a few days. On the morning of 2 June the fissure 8 flow covered the Four Corners Intersection of Highways 132 and 137, and continued E and then SE around Kapoho Crater; lava flowed into the crater and evaporated the fresh water lake inside. Traveling at a rate of about 75 m per hour, the flow moved towards the shore and reached Kapoho Bay late on 3 June, where it began building a delta. In just a few days the delta was a kilometer in width, and lava was entering the ocean in many streams along the flow front, generating dense plumes of steam and laze.
By 15 June the fissure 8 cone had reached just over 50 m in height. Fissure 8 lava fountains persisted at 40-70 m high for all of June, feeding the 13-km-long channel to Kapoho Bay. Periodic overflows along the channel built up the levees on either side of the fast-moving river of lava; they were short-lived and traveled only a few meters. Flow speeds slowed as the lava spread out over the delta, which reached 150 hectares (380 acres) in size by 20 June. The ocean-entry points migrated north and south along the delta over the course of the month, expanding the width of the ocean entry area to over 3 km. Towards the end of June, lava was crusted over in the delta up to 1 km back from the ocean, and molten material was traveling within the interior of the earlier flows to the ocean. Minor oozing of lava was reported from a few other fissures during the month, but no other significant flow activity was observed.
Within Halema`uma`u crater at the summit a near-daily pattern of collapse explosion events was due to the subsidence caused by the magma withdrawal. As the crater subsided, its rim and walls slumped inward and large blocks dropped down along growing fractures around the caldera with seismic energy releases greater than M 5.0 almost every day. The deepest part of the crater had reached 400 m below the caldera floor by late June.
Activity at the Lower East Rift Zone during 29 May-4 June 2018. By 29 May, activity on Kīlauea's lower East Rift Zone was focused on the vigorous eruption of lava from fissure 8 advancing rapidly downslope towards Highway 132. Lava fountains from fissure 8 reached 60 m in height on 29 May, feeding a flow that advanced NE over a flow from a few days earlier. The first lobe of the flow crossed Highway 132 just before 1400 that afternoon and continued NE. Most of the flow remained on the S side of the highway as it moved downslope. Visual observations in the early afternoon also confirmed continued weak activity at fissures 18 and 16. Fissure 18 had produced channelized flows which advanced about 2.6 km toward the coast during the previous day. At the ocean entry on the SE coast, only a few small channels of lava were still entering the ocean. Fissure 8 maintained high fountains throughout the day and into the overnight of 29-30 May with sustained heights exceeding 60 m and multiple secondary fountains that reached 20 m. As the flow moved downslope along the highway, the advance rates accelerated overnight, reaching approximately 550 m/hour. Overnight, sporadic bursts of activity were also observed from fissures 7 and 15.
Fissure 8 maintained fountains that rose 60-75 m high on 30 May. The flow split into three lobes; the two easternmost lobes advanced in a more ENE direction while the westernmost lobe advanced in a NE direction (figure 387). The flow rate had dropped to around 90 m/hour by late afternoon and slowed further to 45 m/hour by late evening. The fissure 18 flow also remained active, moving downslope toward Highway 137 at rates of less than 90 m/hour. By late afternoon, the front of the fissure 18 flow was about 1 km from Highway 137 and was spreading and slowing (figure 388). In the late afternoon, a new flow lobe began branching from the S side of the fissure 18 flow approximately 2 km upslope from the flow front. Throughout the day, sporadic bursts of activity were also observed from fissures 22, 6, and 13.
Four lobes of the fissure 8 flow advanced on 31 May (figure 389), fed by persistent fountaining that reached heights up to 80 m. A spatter cone was forming on the downwind side of the fountain and was approximately 30 m high. The fountains were feeding the flow to the NE, and minor overflows from the growing fissure 8 channel were occurring along its length, covering several of the remaining roads in Leilani Estates. The front of the flow advanced at about 90 m/hour through agricultural lands and was within 1.7 km of the Four Corners area (the intersection of Highways 132 and 137) by the evening. The fissure 18 flow that had advanced to within 1 km of Highway 137 had stalled. The new flow that branched from the fissure 18 channel 2 km upslope appeared to have captured most of the lava output from fissure 18. It descended downslope just to the S of the previous flow. Lava was pooling around the vent of fissure 22 throughout the day.
The advance rates of the distal part of the fissure 8 flow were low overnight on 31 May-1 June as lava ponded in a flat area, but flow continued throughout the day to within 0.5 km of the Four Corners intersection of Highways 132 and 137 by evening; fissures 18 and 22 were inactive. By 0645 on 2 June it was about 100 m from the intersection (figure 390). Around 0930 on 2 June a broad front over 275 m in width extending both north and south of Highway 132 (figures 391) crossed the intersection and continued advancing into Kapoho Crater (sometimes called Green Lake Crater) and Kapoho Beach Lots. It entered Green Lake within the crater, creating a large steam plume that was visible until 1330. The Hawaii County Fire Department reported around 1500, after an overflight, that lava had filled the lake and apparently boiled away all the water.
The flow continued to advance overnight on 2-3 June along an 800-m-wide front towards the ocean at Kapoho Bay between Kapoho Beach Road and Kapoho Kai Drive. As of 0700 on 3 June, the lava flow was around 450 m from the ocean (figures 392 and 393) traveling at a rate of about 75 m/hour. By 1745 it had advanced to within 225 m of the ocean at its closest approach point. The other branches of the fissure 8 lava flow were inactive, and all other fissures were inactive, although observers on the late afternoon overflight noted abundant gas emission from fissures 9 and 10 and incandescence without fountaining at fissures 16 and 18.
Fountaining lava 45-75 m high at fissure 8 continued overnight on 3-4 June, feeding the growing lava channel flowing NE along Highway 132 to the Kapoho area. Throughout 30 May-3 June tephra landing downwind from the fountaining produced a growing pyroclastic cone at fissure 8 (figure 394). Local videographers reported that lava entered the ocean at Kapoho Bay at about 2230 HST on 3 June and began constructing a delta (figure 395); by late afternoon the next day the delta extended about 640 m into the bay. A laze plume (a corrosive seawater steam plume laden with hydrochloric acid and fine volcanic particles) was blowing inland from the ocean entry but dissipating quickly. The lava flow front was about 800 m wide. A lava breakout was also occurring upslope (N) of the Kapoho cone cinder pit. A lava breakout from the S margin of the flow near the intersection of Highway 132 and Railroad Avenue had completely encircled Kapoho Cone by the end of the day.
Activity at the Lower East Rift Zone during 5-12 June 2018. The intensity of the fountaining at fissure 8 declined overnight on 4-5 June to between 40-50 m in height, not far above the top of the cone formed during the previous several days (figure 396). By the early morning of 5 June the fissure 8 flow had completely filled Kapoho Bay, extending 1.1 km from the former coastline (figure 397). On the south side of the ocean entry, lava was entering the water at the Vacationland tidepools, having inundated most of that subdivision. To the north, lava had covered all but the northern part of Kapoho Beach Lots. The northernmost lobe of the fissure 8 flow, in the Noni Farms Road area, advanced downslope about 180 m overnight (figure 398) and continued to slowly advance during the day on 5 June.
By the morning of 6 June 2018, the lava fountaining at fissure 8 continued to reach heights of 45-55 m and feed a stable channel to the NE and E (figure 399) to the ocean entry in the Kapoho Bay area. The lava delta that formed at the bay had also extended slightly outward overnight; during the day on 6 June a lateral lobe of the flow pushed slowly N through what remained of the Kapaho Beach Lots subdivision. Overnight on 6-7 June and throughout the following day the fountain heights from fissure 8 fluctuated between 58 and 70 m feeding the channel with vigorous flow (figure 400). The delta was about 1.9 km wide in the Vacationland/Waopae area and the flow was expanding northward (figure 401). By the late afternoon overflight on 8 June, two vigorous steam plumes were rising from the ocean flow front and being blown inland. Strong thermal upwelling was noted in the ocean extending up to 900 m out to sea from the visible lava front. Heavy gas and steam emissions were noted at fissures 9 and 10, but lava emission was occurring only at fissure 8.
Overnight on 8-9 July the fountains at fissure 8 were slightly lower, reaching heights of 40-55 m. Fissure 22 was incandescent and there was minor lava activity at fissures 16/18 while the fuming from fissures 24, 9, and 10 had decreased from the previous day. The fissure 8 flow had created a lava delta approximately 80 hectares (200 acres) in size by the morning of 9 June, filling Kapoho Bay and covering shallow reefs along the nearby coastline (figure 402); observers that night also noted vigorous convection taking place up to 1.5 km offshore from the entry points. Minor levee overflows along the upper part of the channel occurred on 10 June from the strong channelized flow (figure 403). Near the Four Corners region the channel was incandescent and flowing vigorously.
By the evening on 10 June, three closely spaced lava fountains at fissure 8 were erupting with maximum heights reaching 35-40 m (figure 404), feeding the fast moving channelized and braided flow that now traveled 13 km to the ocean at Kapoho Bay (figure 405). A strong steam plume was observed on the S end of the ocean entry with frequent steam explosions at the flow front. Weak lava activity continued during 10-12 June at fissures 16/18 as it had for the previous several days (figure 406). Incandescence was noted at fissures 15 and 22 on 12 June. Lava was entering the ocean over a broader area than before with several minor incandescent points and small plumes, and two larger entries and corresponding plumes. The fissure 8 cinder cone had reached about 43 m in height by the evening of 12 June.
Activity on the Lower East Rift Zone during 13-19 June 2018. Lava fountaining at fissure 8 during 13-19 June generally rose 30-50 m with intermittent bursts as high as 60 m. The growing cone was 52 m at its highest point on 15 June (figure 407). From fissure 8, lava flowed freely over small cascades (rapids) into a well-established channel (figure 408). Near the vent, channel lava was traveling about 24 km/hour; it slowed as it traveled the 13 km-long-channel (figure 409) to about 2 km/hour near the ocean entry at Kapoho Bay. Minor amounts of lava periodically spilled over the channel levees.
Several laze plumes rose along the ocean entry margin as break outs fed many small and large flows during mid-June. The largest pahoehoe breakout area was on the northern margin of the flow (figure 410). A small amount of expansion continued at the southern boundary of the flow near the coast and south of Vacationland. By 17 June, lava flowing into the ocean had built a delta of flows, rock rubble, and black sand, which was over 121 hectares (320 acres) in size. The flow front at the coast was about 2.4 km wide by 18 June. Limited spattering and small flows were also observed at fissures 16 and 18 during 13-19 June; mild spattering from fissure 15 was observed late in the day on 16 June, and incandescence and mild spattering were observed from fissure 6 on 17 June.
Fissure 8 lava fountains 52-70 m tall showered spatter onto the cone overnight into 19 June (figure 411). Small overflows were observed on the N side of the channel near Pohoiki Road overnight and in the morning, with one breakout spreading slowly beyond the flow boundary. Field crews on the ground near fissure 8 midday on 19 June observed a still-vigorous channelized lava flow being fed by fountains at the vent. Standing waves were visible within the channel and cascades/rapids were visible near the base of the 50-m-high cone. The maximum flow velocity in the channel was measured at 28 km/hour. During the morning overflight, several small overflows could be seen along the channel margins. The flow of lava was faster in the center of the channel and decreased in speed toward the margins where friction with the channel walls increased. A small, sluggish overflow along a section of Luana Street was advancing NW. Fissures 6, 15, 16 were still oozing lava and fuming.
Activity at Halema'uma'u crater during June 2018. Throughout June intermittent explosions and earthquakes continued at Halema'uma'u crater as the summit area subsided and adjusted to the withdrawal of magma from below. Inward slumping of the rim and walls of Halema`uma`u continued in response to the persistent subsidence. A near-daily pattern of explosive events was characterized by seismicity at the summit that would gradually increase to tens of events per hour, culminating with a larger explosion, often with an energy release equivalent magnitude greater than M 5.0. Seismicity would usually then drop significantly before gradually rising until the next explosion. Ash plumes from the explosions often rose to altitudes of 2.4-4.6 km. With each explosion, Halema'uma'u crater subsided, generating fractures and down-dropped blocks within and around the crater floor, dramatically reshaping the morphology of the summit caldera in just a few weeks (figures 412 and 413).
Overnight on 10-11 June there were two explosions at the summit separated by about four hours, followed by a decrease in seismicity. Video recorded during a UAS (Unmanned Aircraft Systems) flight HVO on 24 June 2018 revealed details of the extensive changes occurring within Halema'uma'u crater since explosive eruptions of ash and gas and ongoing wall collapse had begun in mid-May. Clearly visible were the steep crater walls that continued to slump inward and downward with ongoing subsidence. The deepest part of Halema'uma'u had dropped over 400 m below the caldera floor. There were two obvious flat surfaces within the crater that had slumped downward as nearly intact blocks; the shallower one was the former caldera floor and the deeper one was the former Halema'uma'u crater floor. HVO reduced the Aviation Color code from Red to Orange on 24 June, citing the fact that the episodic plumes from the summit rarely exceeded 3 km altitude where the might pose a risk to aviation.
Activity on the Lower East Rift Zone during 20-30 June 2018. For the remainder of June, vigorous fountaining nearly 60 m high from fissure 8 fed the established channel that transported incandescent lava to the ocean at the Kapoho coastline where several entries were active (figure 414). The largest entry area was at the S end of the flow front, but the locations of the ocean entry points migrated back and forth along the delta over time. Periodic overflows from the channel were short-lived and produced sluggish pahoehoe flows that only traveled a few meters (figure 415). Minor effusion of lava was observed from fissures 6, 15, and 16. Activity ceased at fissure 6 by 22 June. During an overflight in the early morning of 23 June, only incandescence was noted at fissure 22.
The spatter cone grew to 55 m tall by 24 June, after which the lava fountains only occasionally rose above its highest point. Geologists measured lava entering the channel traveling as fast as 30 km/hour. By 25 June, most of the lava was entering the sea on the southern side of the flow front along a 1-km wide area marked by billowing laze plumes, although the lava front extended for more than 3 km along the coast (figure 416). Beginning on 27 June geologists observed fresh lava oozing at several points along the northern margin of the flow field in the area of the Kapoho Beach Lots. By then, the lava channel had crusted over about 0.8 km inland of the ocean entry; lava was moving beneath the crust and into the still-molten interior of earlier flows before it entered the sea (figure 417). The same day, small overflows on both sides of the channel occurred in the uppermost part of channel, but none of these overflows extended past the existing flow field (figure 418).
The northern margin of the ocean entry flow field was the most active during the last few days of the month with lava entering the sea over a broad area (figure 419). A few burning areas were also observed on the S side of the flow and W of Highway 137. Field crews were able to make rough estimates of the velocity of the flow in the channel by timing the large blocks in the flow as they passed by islands within the channel and known points along the edges (figure 420). Volcanic gas emissions were very high from fissure 8 eruptions throughout June 2018 causing trade winds to bring Vog (volcanic air pollution, a hazy mixture of SO2 gas and aerosols) to the central, south, and western parts of the Island of Hawaii on many occasions. Substantial SO2 plumes were recorded daily (figure 421).
Thermal observations during May-June 2018. The MODVOLC thermal alert system captures infrared data from satellite instruments (MODIS) that indicate the location of hot-spots around the planet. The data collected for Kīlauea for May and June 2018 clearly indicated the size and scope of the eruptive episode (figures 422 and 423). At the end of April, infrared data indicated strong activity at Halema'uma'u and weak activity from the episode 61g flow that originated on the flank of Pu'u 'O'o (figure 422). The first MODVOLC thermal alert of activity on the LERZ appeared 6 May; even though the lava lake had begun to drop, there was still a strong thermal signal at Halema'uma'u that day as well. As the eruption progressed during May, the increasing size of the effusive activity that included lava flows reaching the SE coast was apparent.
By early June, just a few days after the flow-volume increase on the LERZ from the channel emerging from fissure 8, the new pattern of heat flow to the N and NE around Kapoho Cone was recorded in the satellite data. The growing delta filling Kapoho Bay generated a strong infrared signal throughout the month. Although the fissure 8 flow was essentially unchanged in its thermal output on 22 and 23 June based on ground observations, the infrared data for those two days was significantly different, likely reflecting atmospheric conditions that blocked satellite views. In spite of this, the general nature of the flow activity is still clear in the data. By the end of June, the extent of the MODVOLC thermal alert pixels clearly indicated the robust nature of the continuing eruption.
Geologic Background. Kilauea overlaps the E flank of the massive Mauna Loa shield volcano in the island of Hawaii. Eruptions are prominent in Polynesian legends; written documentation since 1820 records frequent summit and flank lava flow eruptions interspersed with periods of long-term lava lake activity at Halemaumau crater in the summit caldera until 1924. The 3 x 5 km caldera was formed in several stages about 1,500 years ago and during the 18th century; eruptions have also originated from the lengthy East and Southwest rift zones, which extend to the ocean in both directions. About 90% of the surface of the basaltic shield volcano is formed of lava flows less than about 1,100 years old; 70% of the surface is younger than 600 years. The long-term eruption from the East rift zone between 1983 and 2018 produced lava flows covering more than 100 km2, destroyed hundreds of houses, and added new coastline.
Information Contacts: Hawaiian Volcano Observatory (HVO), U.S. Geological Survey, PO Box 51, Hawai'i National Park, HI 96718, USA (URL: http://hvo.wr.usgs.gov/); NASA Goddard Space Flight Center (NASA/GSFC), Global Sulfur Dioxide Monitoring Page, Atmospheric Chemistry and Dynamics Laboratory, 8800 Greenbelt Road, Goddard, Maryland, USA (URL: https://so2.gsfc.nasa.gov/); Hawai'i Institute of Geophysics and Planetology (HIGP) - MODVOLC Thermal Alerts System, School of Ocean and Earth Science and Technology (SOEST), Univ. of Hawai'i, 2525 Correa Road, Honolulu, HI 96822, USA (URL: http://modis.higp.hawaii.edu/).
Sabancaya (Peru) — December 2018 Cite this Report
Sabancaya
Peru
15.787°S, 71.857°W; summit elev. 5960 m
All times are local (unless otherwise noted)
Frequent ash plumes continued during June-November 2018
Sabancaya has been continuously active in recent years after renewed unrest began in February 2013 following almost 10 years of quiescence. After an increase in seismicity and an increase in the volume and frequency of fumarole emissions, the first explosion of the current eruption occurred in November 2016. Since then, activity has largely consisted of ash plumes and fumarolic activity.
This report summarizes activity during June-November 2018 (table 3) and is based on reports by the Observatorio Vulcanológico division of El Instituto Geológico, Minero y Metalúrgico (OVI-INGEMMET) and Instituto Geofísico del Perú (IGP), and satellite data. During this time the average daily number of explosions was 22, and ranged from 13 to 30. Maximum ash plume heights varied between 1.3 to 4.5 km above the crater, with the maximum plume heights each month usually between 2.5 and 3.7 km. SO2 emissions were variable and reached a maximum of 14,859 tons per day and the drift directions were wind dependent (figure 51).
Table 3. Summary of eruptive activity at Sabancaya during June-November 2018 based on OVI-INGEMMET weekly reports and the HIGP MODVOLC hotspot monitoring algorithm.
| Month |
Avg. Daily Explosions by week |
Max Plume Heights (m above crater) |
Plume Drift |
MODVOLC Alerts |
Max SO2 tons/day |
| Jun 2018 |
24, 19, 29, 24 |
1,300-2,500 |
20-30 km, E, S, SE |
19 |
3,000-5,600 |
| Jul 2018 |
22, 23, 25, 24 |
1,300-2,500 |
20-30 km, S, SE, E |
12 |
4,715-14,859 |
| Aug 2018 |
19, 23, 27, 25, 25 |
2,600-4,500 |
30-50 km, N, NE, S, SE |
27 |
2,230-5,000 |
| Sep 2018 |
17, 13, 16, 21 |
2,500-3,700 |
30-50 km, N, NE, S, SE, NW |
28 |
1,600-3,970 |
| Oct 2018 |
24, 17, 23, 30 |
2,500-3,500 |
30-50 km, N, NE, SE, S, SW, W |
21 |
2,200-5,027 |
| Nov 2018 |
30, 18, 20, 20, 21 |
2,500-3,700 |
30-40 km, N, E, SE, S, SW, W, NW |
35 |
2,300-4,600 |
During June, Sabancaya produced 19-29 explosions per day that ejected ash plumes up to heights of 1.3-2.5 km above the crater (figure 52). These ash plumes extended to 20-30 km away from the volcano. The maximum emissions of SO2 throughout the month ranged from 3,500 to 5,600 tons per day. There was a total of 19 MIROVA thermal anomalies.
Throughout July there were on average 22-25 explosions per day. Ash plumes reached heights of 1.3-2.5 km above the crater, and drifted 20-30 km to the S, SE, and E (figure 53). On 23 July, Sabancaya produced a continuous ash plume that traveled over 100 km to the SE (figure 54). SO2 emissions were higher this month, with maximum emissions reaching 14,859 tons per day. Twelve MODVOLC thermal alerts were issued.
There were an average of 19-27 explosions per day throughout August (figure 55). Ash plumes reached maximum heights of 2.6-4.5 km, and drifted 30-50 km away in various directions. Activity generated two ash plumes on 24 August, one to 4 km above the crater at 0800 and the other to 4.5 km at 0945 (figure 56). The ash was dispersed to the NE, N, and E for 30 km over the towns of Chivay, Yanque, Coporaque, Ichupampa, Achoma, Maca and Pinchollo. On the 25th, an explosion at 1020 produced an ash plume to over 3 km above the crater that resulted in ashfall in the towns of Achoma, Maca and Pinchollo. There were 28 MODVOLC thermal alerts throughout the month. The maximum SO2 emissions reached 2,230-5,000 tons per day.
There was an average of 13-21 explosions per day during September, with ash plumes reaching 2.5-3.5 km above the crater. The ash traveled 30-50 km away in different directions (figure 57). There were 28 MODVOLC thermal alerts issued throughout the month, consistent with elevated thermal activity that is visible in Sentinel-2 satellite images (figure 58). The maximum measured SO2 emissions were 1,600-3,970 tons per day. A drone overflight by the IGP and the Pontifical Catholic University of Peru (PUCP) in the third week of September gave the first view of the crater since the eruption began in 2016 (figure 59), revealing lava in the crater and at least six ash emission points.
Similar activity continued through October, with an average of 17-30 reported explosions per day. Ash plumes reached maximum heights of 2.5-3.5 km and dispersed 30-50 km in various directions (figure 60). Ashfall was reported in the Huanca area during the week of 1-7 October. Maximum SO2 emissions were 2,200-5,027 tons per day. There were 21 MODVOLC thermal alerts issued for the month.
November 2018 marked two years of uninterrupted activity at Sabancaya (figure 61). Between November 2016 and November 2017 there were 14,000 registered explosions with an average of 39 per day. From November 2017 to November 2018 there were more than 9,800 explosions recorded with an average of 27 per day. During the month there was an average of 18-30 explosions per day, with ash plumes reaching maximum heights of 2.5-3.7 km above the crater and dispersing 30-40 km in all directions. This month saw the highest number of MODVOLC thermal alerts with a total of 35. The maximum detected SO2 emissions were 2,300-4,600 tons per day.
Geologic Background. Sabancaya, located in the saddle NE of Ampato and SE of Hualca Hualca volcanoes, is the youngest of these volcanic centers and the only one to have erupted in historical time. The oldest of the three, Nevado Hualca Hualca, is of probable late-Pliocene to early Pleistocene age. The name Sabancaya (meaning "tongue of fire" in the Quechua language) first appeared in records in 1595 CE, suggesting activity prior to that date. Holocene activity has consisted of Plinian eruptions followed by emission of voluminous andesitic and dacitic lava flows, which form an extensive apron around the volcano on all sides but the south. Records of observed eruptions date back to 1750 CE.
Information Contacts: Observatorio Volcanologico del INGEMMET, (Instituto Geológical Minero y Metalúrgico), Barrio Magisterial Nro. 2 B-16 Umacollo - Yanahuara Arequipa, Peru (URL: http://ovi.ingemmet.gob.pe; video URL: https://www.youtube.com/watch?v=CpLhruMwuxQ); Instituto Geofisico del Peru, Observatoria Vulcanologico del Sur (IGP-OVS), Arequipa Regional Office, Urb La Marina B-19, Cayma, Arequipa, Peru (URL: http://ovs.igp.gob.pe/); NASA Goddard Space Flight Center (NASA/GSFC), Global Sulfur Dioxide Monitoring Page, Atmospheric Chemistry and Dynamics Laboratory, 8800 Greenbelt Road, Goddard, Maryland, USA (URL: https://so2.gsfc.nasa.gov/); Sentinel Hub Playground (URL: https://www.sentinel-hub.com/explore/sentinel-playground).
Santa Maria (Guatemala) — December 2018 Cite this Report
Santa Maria
Guatemala
14.757°N, 91.552°W; summit elev. 3745 m
All times are local (unless otherwise noted)
Ash plumes, degassing, and avalanches continue during May-October 2018 with occasional lahars
Santa Maria is one of the most active volcanoes of Guatemala. The volcano is composed of a large edifice that reaches over 3.7 km above sea level; the Santiaguito dacitic dome complex to the SW, with the active Caliente dome, rises to a height of over 2.5 km (figure 77). The Santiaguito dome complex is situated in a large crater that formed during a catastrophic eruption in 1902. Growing since 1922, this complex has recently been characterized by dome-growth activity that includes degassing, ash plumes, avalanches, pyroclastic flows, lava flows, and lahars. This report summarizes activity from May through October 2018, and is based on reports by Guatemala's INSIVUMEH (Instituto Nacional de Sismologia, Vulcanologia, Meterologia e Hidrologia) and satellite data. During this period, activity consisted of degassing, ash plumes, and avalanches at the Caliente dome, and lahars in multiple tributaries. Intermittent low-power thermal anomalies were detected throughout this period (figure 78).
Throughout May, active degassing of the dome produced white plumes up to 3.2 km above sea level. Frequent weak to moderate explosions produced white and gray ash plumes up to 3.3 km that were dispersed to the SW, W, and SE. As many as 15 explosions were recorded per day. Avalanches frequently occurred on the SE flank of the Caliente dome. The first lahar of the year was generated by rainfall on 10 May and traveled down the Cabello de Angel-Nimá I river. The lahar was composed of abundant fine material with larger branches and blocks up to 1 m in diameter, and it smelled of sulfur. The lahar deposit was 15 m wide and 1.2 m thick. A second lahar descended along the same path on 24 May and emplaced a deposit with a width of 18 m, a depth of 2 m, and blocks up to 2 m in diameter.
During June, white plumes associated with degassing of the Caliente dome often reached altitudes of 2.9 km, with a maximum of 3.9 km on 5 June. An average of 9-11 weak to moderate explosions per day ejected white and gray ash plumes up to 3.1-3.3 km altitude that were dispersed to the SW, W, and SE (figures 79 and 80). Ashfall was reported in Monte Claro on 26 June. Avalanches were recorded most days on the SE side of the dome due to ongoing growth. Lahars were reported on 13, 14, and 16 June down the Nimá I and Cabello de Ángel tributaries of the Samalá River (figures 81 and 82).
Throughout July, degassing of the dome and fumarolic activity produced white plumes reaching 3 km. These plumes were dominantly directed towards the SW and SE, and on a few days towards the N and W. Explosions frequently produced white and gray ash plumes up to 11 times per day (figure 83). Ash plumes often reached approximately 3.2 km altitude, drifted SE, SW, and W, and frequently deposited ash on the flanks. On 4 July an explosion produced incandescent material up to 150 m above the crater and the accompanying sound was heard in areas including El Palmar, Pueblo Nuevo, and San Felipe Retalhuleu. Avalanches most often occurred on the SE flank of the dome, with some occurring on the N, NE, and W flanks (figure 84). Incandescence was observed on the 11 July.
Through August, degassing of the dome regularly produced white plumes up to a maximum observed altitude of 3.2 km (figure 85). Explosions generated white and gray ash plumes up to 3.1-3.3 km on most days, with a maximum of 13 explosions recorded per day. Gas-and-steam and ash plumes were often dispersed to the SE and sometimes towards the W. Ashfall often occurred on the slopes. Avalanches on the dome were recorded most days on the SE flank and sometimes on the E, NE, and W flanks. On 17 August at 1330 a lahar emplaced a deposit 18 m wide and 2.5 m thick, with blocks up to 3 m in diameter.
Throughout September, degassing and fumarole activity of the Caliente dome produced white plumes up to 3.1 km. Explosions produced ash plumes that reached altitudes of 3.3 km up to 13 times per day. Degassing and ash plumes were most often dispersed to the SW, and sometimes to the W and SE. Red discoloration of ash was noted on 4 September due to the oxidation of the dome rock where the explosion was generated (figure 86). Ashfall often occurred within the proximity of the volcano. Avalanches were often reported as constant on the SE flank of the dome and sometimes occurring on the NE and E flanks. On 12 September a lahar was recorded traveling down both tributaries of the Samalá River. A larger lahar was generated on 20 September in the San Isidro-Tambor tributaries of the Samala River with a width of 25 m and a thickness of 2 m. The lahar carried tree trunks and branches, and blocks up to 2 m in diameter. A third lahar occurred on 24 September down the Cabello de Ángel River, with a width of 15 m, a thickness of 1.5 m, and carrying blocks up to 2 m in diameter.
Degassing at the dome during October produced white plumes to a maximum altitude of 3.2 km (figure 87). Explosions generated white and gray ash plumes up to 3.2 km, with up to 11 explosions recorded per day and an average of 8-9 per day. Plumes were often directed towards the SE, and sometimes to the W and NW. Ashfall frequently occurred on the slopes and was reported in Monte Claro on 16 and 26 October. Avalanches were frequent on the SE flank of the dome, and sometimes occurred on the W and NE flanks (figure 88). Incandescent material was observed during explosions on the 23rd. Two lahars were generated on 9 October; one traveled down the Cabello de Ángel river channel with a width of 20 m, a thickness of 2 m, and carrying blocks as large as 3 m in diameter. The second was 15-m-wide with a thickness of 1 m and blocks as large as 2 m in diameter which traveled down the San Isidro River.
Geologic Background. Symmetrical, forest-covered Santa María volcano is part of a chain of large stratovolcanoes that rise above the Pacific coastal plain of Guatemala. The sharp-topped, conical profile is cut on the SW flank by a 1.5-km-wide crater. The oval-shaped crater extends from just below the summit to the lower flank, and was formed during a catastrophic eruption in 1902. The renowned Plinian eruption of 1902 that devastated much of SW Guatemala followed a long repose period after construction of the large basaltic-andesite stratovolcano. The massive dacitic Santiaguito lava-dome complex has been growing at the base of the 1902 crater since 1922. Compound dome growth at Santiaguito has occurred episodically from four vents, with activity progressing E towards the most recent, Caliente. Dome growth has been accompanied by almost continuous minor explosions, with periodic lava extrusion, larger explosions, pyroclastic flows, and lahars.
Information Contacts: Instituto Nacional de Sismologia, Vulcanologia, Meteorologia e Hydrologia (INSIVUMEH), Unit of Volcanology, Geologic Department of Investigation and Services, 7a Av. 14-57, Zona 13, Guatemala City, Guatemala (URL: http://www.insivumeh.gob.gt/ ); MIROVA (Middle InfraRed Observation of Volcanic Activity), a collaborative project between the Universities of Turin and Florence (Italy) supported by the Centre for Volcanic Risk of the Italian Civil Protection Department (URL: http://www.mirovaweb.it/).
Stromboli (Italy) — December 2018 Cite this Report
Stromboli
Italy
38.789°N, 15.213°E; summit elev. 924 m
All times are local (unless otherwise noted)
Explosive activity produced ash, lapilli, and bombs, with occasional spattering during July-October 2018
Stromboli is a persistently-active volcano that currently has five active vents in the crater terrace area that sits above the steep slope of the Sciara del Fuoco. For several decades, activity has been focused at three main craters, the North crater (N area) and the Central and South craters (CS area), each with multiple frequently-active vents.
This report summarizes activity for July-October 2018 (table 4) and is based on reports by Istituto Nazionale di Geofisica e Vulcanologia (INGV) and satellite data. Intensities associated with explosions are based on the following heights of material ejected from the crater and are as follows. Very low is less than 40 m; low is 40-80 m; medium is 80-150 m; and high is greater than 150 m (figure 131). Overall, the intensity of all vents ranged from very low to medium, with variations in the eruption of ash and lapilli to bomb-sized material (less than 2 mm, 2-64 mm, and over 64 mm, respectively). The variations in activity of the five active vents during July-October is seen in Sentinel-2 thermal satellite data (figure 132).
Table 4. Activity at Stromboli during July-October 2018 summarized by vent areas: N Area (North) with vents N1 and N2; CS Area (central-south) with vents C, S1, and S2. Maximum reported heights for each month are given as meters above the crater. Data courtesy of INGV weekly reports.
| Month |
N Area Activity |
CS Area Activity |
| Jul 2018 |
N1: Explosions ejected lapilli and bombs with some ash up to heights of 200 m. N2: Explosions ejected ash, lapilli, and bombs up to 200 m. The average explosion frequency for the N-Area was 1-19 per hour. |
C: Continuous degassing with intense Spattering on the 26th. S1: Gas jets with some ash, lapilli, blocks up to 80 m. S2: Explosions with ash, lapilli, blocks up to 150 m. The average explosion frequency for the CS-Area was 1-11 per hour. |
| Aug 2018 |
N1: Explosions ejected lapilli and bombs with some ash up to 140 m. N2: Explosions ejected lapilli and bombs with occasional spattering up to 140 m. The average explosion frequency for the N-Area was 2-20 per hour. |
C: Continuous degassing at two points, intense spattering on the 27th. Some explosions ejected material up to 120 m. S1: Explosive activity and gas jets, incandescent material up to 150 m. S2: Explosive activity ejected material up to 80 m. Major explosion occurred at the CS area on the 18th.The average explosion frequency for the CS-Area was 1-15 per hour. |
| Sep 2018 |
N1: Explosions ejected lapilli and bombs with some ash up to 140 m. N2: Explosions ejected mainly ash with some lapilli and bombs up to 150 m. The average explosion frequency for the N-Area was 2-12 per hour. |
C: Two emission points with continuous degassing, interrupted by explosions and spattering. S1: Jets of incandescent material up to 120 m. S2: Explosive activity with some ash and lapilli up to 120 m, two active vents from the 10th. The average explosion frequency for the CS-Area was 4-20 per hour. |
| Oct 2018 |
N1: Explosions ejected lapilli and bombs with some ash up to 150 m. N2: Explosions ejected mostly ash with some lapilli and bombs up to 150 m. The average explosion frequency for the N-Area was 1-13 per hour. |
C: Two emission points with continuous degassing interrupted by occasional spattering and explosions. S1: Jets of incandescent material up to 120 m. S2: Variable explosive activity ejecting material up to.120 m. The average explosion frequency for the CS-Area was 6-20 per hour. |
During July Strombolian activity continued with explosions of low to medium-low intensity in the N Area; variable explosions ejected mainly lapilli and bombs along with some ash at the N1 vent, and mainly ash with lapilli and bombs at the N2 vent. Explosive activity was absent or sporadic at the N2 vent during 4-5 July. There was a rapid increase in explosion frequency at the N1 vent on the 14th, and on the 16th lapilli and bombs were ejected. During 16-29 July explosive activity in the N Area was focused at the N2 vent. The average frequency of explosions in the N area ranged from 1-19 per hour. Explosion intensity in the CS Area ranged from low to medium at both the S1 and S2 vents. The C vent produced continuous degassing that was interrupted by intense spattering on the 26th. Activity at the S1 vent was characterized as jets with some ash, lapilli, and blocks, and explosions with ash, lapilli, and blocks occurred at the S2 vent. The average frequency of explosions in the CS area ranged from 1 to 11 per hour during July. The total number of explosions at Stromboli increased in mid-July and remained elevated compared to previous months through the end of October (figure 133).
Similar activity continued through August with the exception of a strong explosion at the C vent that lasted approximately one minute at 1508 on 18 August (figure 134). The explosion ejected an ash plume that rapidly dissipated. Coarse pyroclastic material fell on the crater terrace area and the upper part of the Sciara del Fuoco, and rolled down to the ocean. Occasional intense spattering at the C vent was also observed on the 27th, interrupting the continuous degassing from two vents. Medium to low, and occasionally high-intensity gas jets that incorporated incandescent material were frequent at the S1 vent through August. Low- to medium-intensity explosive activity occurred at the S2 event throughout the month. Explosions averaged 1-11 per hour for the entire CS area during August. The N area produced variable explosions that ejected lapilli and bombs with some ash at the N1 vent. During 8-12 August most of the activity in the N area continued to be focused at the N2 vent, and during this time it produced intense spattering activity. During the rest of the month activity at the N2 vent was characterized by variable explosive activity that produced lapilli and bombs with occasional spattering. The average frequency of explosions for the month was 2-20 per hour.
The typical activity persisted through September with explosions producing ash, lapilli, and blocks (figures 135 and 136), gas jets with incandescent material (figures 137 and 138), and degassing. Over the month there was an average of 2-12 explosive events per hour at the N area, and an average of 4-20 events per hour at the CS area. Variable explosions that ejected lapilli and bombs with some ash characterized activity at the N2 vent, and mainly ash with some lapilli and bombs were typically ejected at the N1 vent. Continuous emissions originated from two points within the C vent and was occasionally interrupted by explosions and spattering. Jets of gas and incandescent material continued at the S1 vent and explosive activity with some ash and lapilli occurred at the S2 vent. The S2 vent had two active points from the 10 September onwards.
During October variable explosions continued to produce low-to medium-intensity explosions that ejected lapilli and bombs, and sometimes ash, at the N1 vent, and very low- to low-intensity explosions that produced mostly ash with some lapilli and bombs at the N2 vent. Explosions averaged 1-13 events per hour through the month. The CS area produced a higher average of 6-20 explosions per hour for October. Sustained degassing continued at two points in the C vent. Low- to medium-low-intensity jets on incandescent material occurred at the S1 vent, and the same intensity of explosive activity was reported at the S2 vent.
Geologic Background. Spectacular incandescent nighttime explosions at Stromboli have long attracted visitors to the "Lighthouse of the Mediterranean" in the NE Aeolian Islands. This volcano has lent its name to the frequent mild explosive activity that has characterized its eruptions throughout much of historical time. The small island is the emergent summit of a volcano that grew in two main eruptive cycles, the last of which formed the western portion of the island. The Neostromboli eruptive period took place between about 13,000 and 5,000 years ago. The active summit vents are located at the head of the Sciara del Fuoco, a prominent scarp that formed about 5,000 years ago due to a series of slope failures which extends to below sea level. The modern volcano has been constructed within this scarp, which funnels pyroclastic ejecta and lava flows to the NW. Essentially continuous mild Strombolian explosions, sometimes accompanied by lava flows, have been recorded for more than a millennium.
Information Contacts: Istituto Nazionale di Geofisica e Vulcanologia (INGV), Sezione di Catania, Piazza Roma 2, 95123 Catania, Italy (URL: http://www.ct.ingv.it/en/); Benjamin Simons, The University of Auckland, 23 Symonds Street, Auckland, 1010, New Zealand (URL: https://unidirectory.auckland.ac.nz/people/profile/bsim836); Sentinel Hub Playground (URL: https://www.sentinel-hub.com/explore/sentinel-playground).