Recently Published Bulletin Reports
Erebus (Antarctica) Lava lake remains active; most thermal alerts recorded since 2019
Rincon de la Vieja (Costa Rica) Frequent phreatic explosions during July-December 2023
Bezymianny (Russia) Explosion on 18 October 2023 sends ash plume 8 km high; lava flows and incandescent avalanches
Kilauea (United States) Low-level lava effusions in the lava lake at Halema’uma’u during July-December 2022
Nyamulagira (DR Congo) Lava flows and thermal activity during May-October 2023
Bagana (Papua New Guinea) Explosions, ash plumes, ashfall, and lava flows during April-September 2023
Mayon (Philippines) Lava flows, pyroclastic flows, ash emissions, and seismicity during April-September 2023
Nishinoshima (Japan) Eruption plumes and gas-and-steam plumes during May-August 2023
Krakatau (Indonesia) White gas-and-steam plumes and occasional ash plumes during May-August 2023
Villarrica (Chile) Strombolian activity, gas-and-ash emissions, and crater incandescence during April-September 2023
Merapi (Indonesia) Frequent incandescent avalanches during April-September 2023
Ebeko (Russia) Moderate explosive activity with ash plumes continued during June-November 2023
Erebus (Antarctica) — January 2024  Cite this Report
Erebus
Antarctica
77.53°S, 167.17°E; summit elev. 3794 m
All times are local (unless otherwise noted)
Lava lake remains active; most thermal alerts recorded since 2019
The lava lake in the summit crater of Erebus has been active since at least 1972. Located in Antarctica overlooking the McMurdo Station on Ross Island, it is the southernmost active volcano on the planet. Because of the remote location, activity is primarily monitored by satellites. This report covers activity during 2023.
The number of thermal alerts recorded by the Hawai'i Institute of Geophysics and Planetology’s MODVOLC Thermal Alerts System increased considerably in 2023 compared to the years 2020-2022 (table 9). In contrast to previous years, the MODIS instruments aboard the Aqua and Terra satellites captured data from Erebus every month during 2023. Consistent with previous years, the lowest number of anomalous pixels were recorded in January, November, and December.
Table 9. Number of monthly MODIS-MODVOLC thermal alert pixels recorded at Erebus during 2017-2023. See BGVN 42:06 for data from 2000 through 2016. The table was compiled using data provided by the HIGP – MODVOLC Thermal Alerts System.
| Year |
Jan |
Feb |
Mar |
Apr |
May |
Jun |
Jul |
Aug |
Sep |
Oct |
Nov |
Dec |
SUM |
| 2017 |
0 |
21 |
9 |
0 |
0 |
1 |
11 |
61 |
76 |
52 |
0 |
3 |
234 |
| 2018 |
0 |
21 |
58 |
182 |
55 |
17 |
137 |
172 |
103 |
29 |
0 |
0 |
774 |
| 2019 |
2 |
21 |
162 |
151 |
55 |
56 |
75 |
53 |
29 |
19 |
1 |
0 |
624 |
| 2020 |
0 |
2 |
16 |
18 |
4 |
4 |
1 |
3 |
18 |
3 |
1 |
6 |
76 |
| 2021 |
0 |
9 |
1 |
0 |
2 |
56 |
46 |
47 |
35 |
52 |
5 |
3 |
256 |
| 2022 |
1 |
13 |
55 |
22 |
15 |
32 |
39 |
19 |
31 |
11 |
0 |
0 |
238 |
| 2023 |
2 |
33 |
49 |
82 |
41 |
32 |
70 |
64 |
42 |
17 |
5 |
11 |
448 |
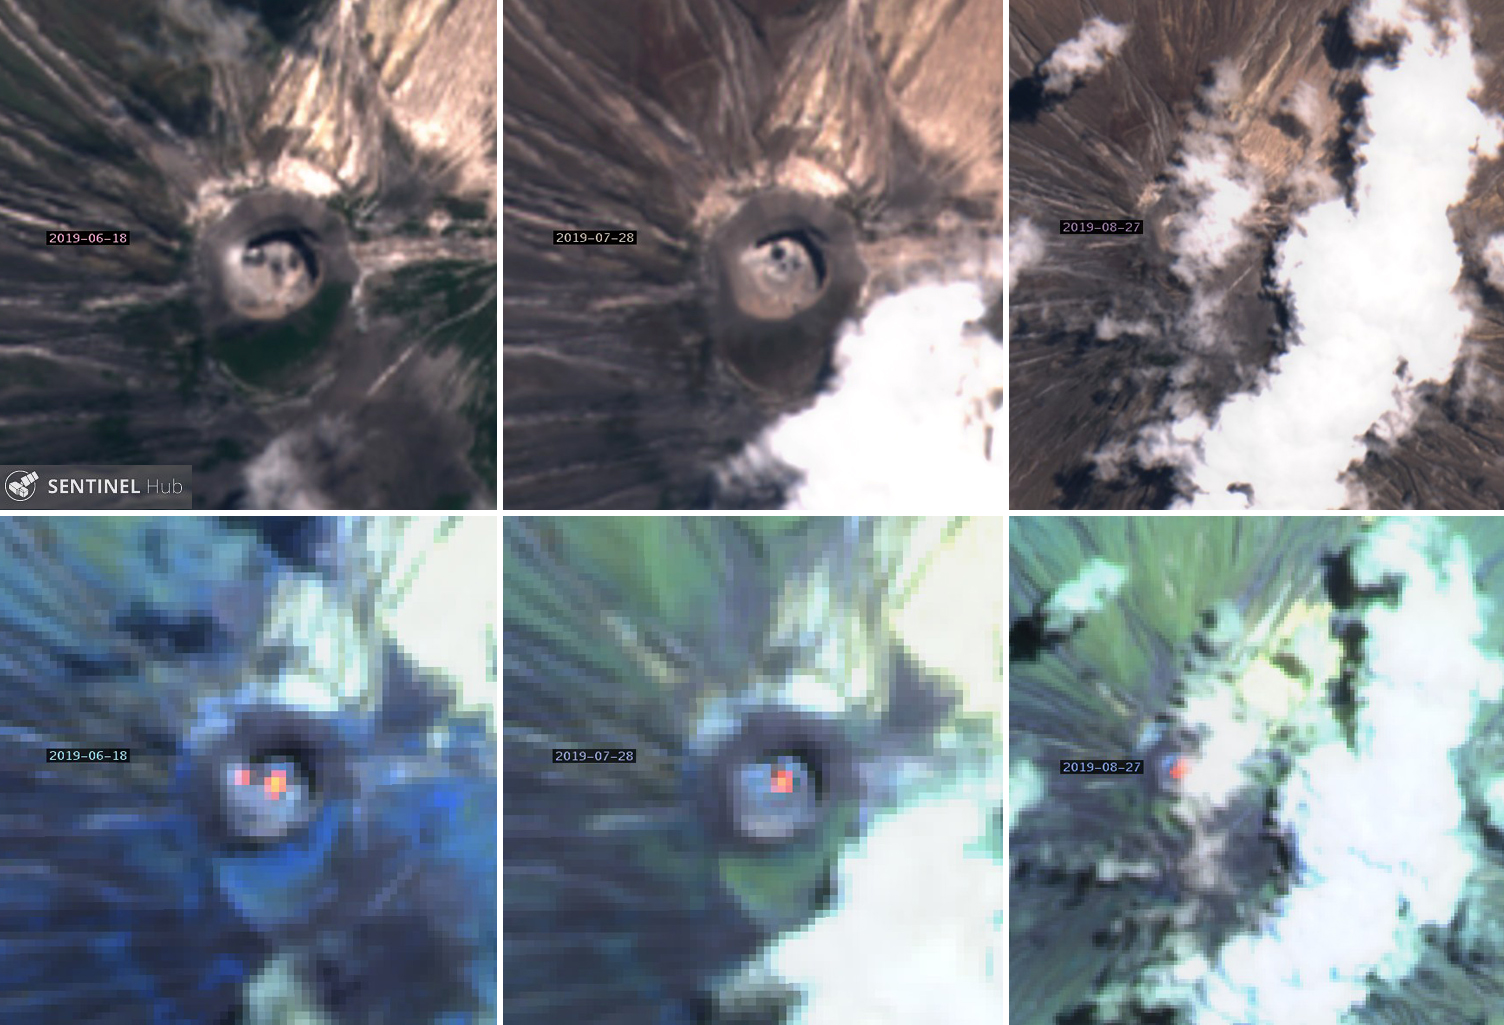
Sentinel-2 infrared images showed one or two prominent heat sources within the summit crater, accompanied by adjacent smaller sources, similar to recent years (see BGVN 46:01, 47:02, and 48:01). A unique image was obtained on 25 November 2023 by the OLI-2 (Operational Land Imager-2) on Landsat 9, showing the upper part of the volcano surrounded by clouds (figure 32).
Geologic Background. Mount Erebus, the world's southernmost historically active volcano, overlooks the McMurdo research station on Ross Island. It is the largest of three major volcanoes forming the crudely triangular Ross Island. The summit of the dominantly phonolitic volcano has been modified by one or two generations of caldera formation. A summit plateau at about 3,200 m elevation marks the rim of the youngest caldera, which formed during the late-Pleistocene and within which the modern cone was constructed. An elliptical 500 x 600 m wide, 110-m-deep crater truncates the summit and contains an active lava lake within a 250-m-wide, 100-m-deep inner crater; other lava lakes are sometimes present. The glacier-covered volcano was erupting when first sighted by Captain James Ross in 1841. Continuous lava-lake activity with minor explosions, punctuated by occasional larger Strombolian explosions that eject bombs onto the crater rim, has been documented since 1972, but has probably been occurring for much of the volcano's recent history.
Information Contacts: Hawai'i Institute of Geophysics and Planetology (HIGP) - MODVOLC Thermal Alerts System, School of Ocean and Earth Science and Technology (SOEST), Univ. of Hawai'i, 2525 Correa Road, Honolulu, HI 96822, USA (URL: http://modis.higp.hawaii.edu/); Copernicus Browser, Copernicus Data Space Ecosystem, European Space Agency (URL: https://dataspace.copernicus.eu/browser/); NASA Earth Observatory, EOS Project Science Office, NASA Goddard Space Flight Center, Goddard, Maryland, USA (URL: https://earthobservatory.nasa.gov/images/152134/erebus-breaks-through).
Rincon de la Vieja (Costa Rica) — January 2024 Cite this Report
Rincon de la Vieja
Costa Rica
10.83°N, 85.324°W; summit elev. 1916 m
All times are local (unless otherwise noted)
Frequent phreatic explosions during July-December 2023
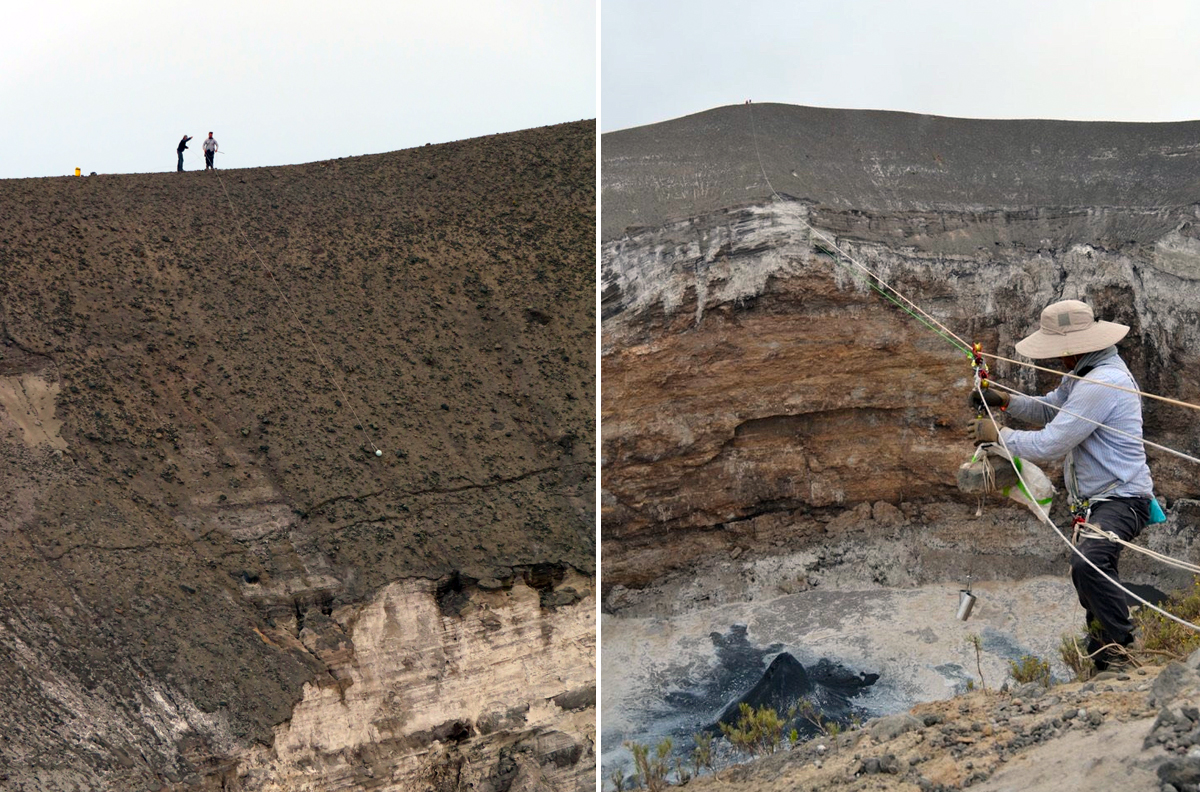
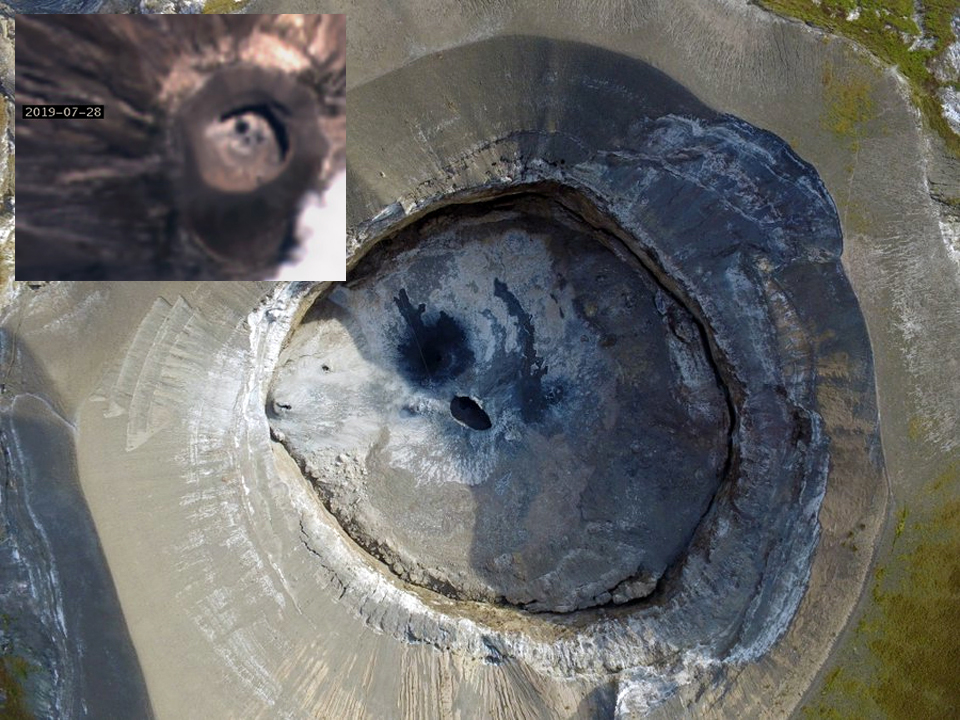
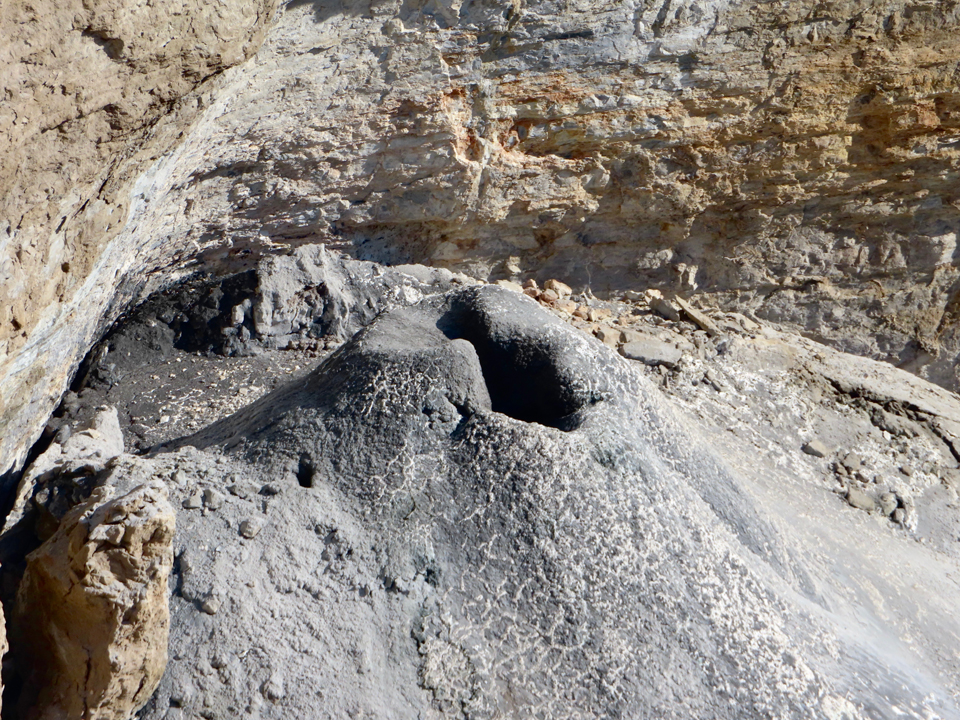
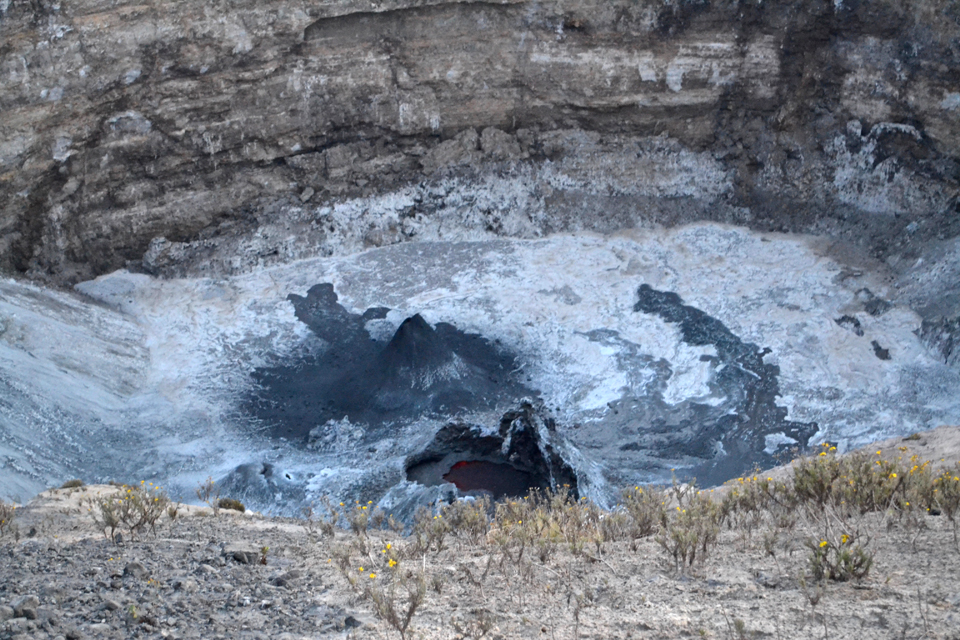
Rincón de la Vieja is a volcanic complex in Costa Rica with a hot convecting acid lake that exhibits frequent weak phreatic explosions, gas-and-steam emissions, and occasional elevated sulfur dioxide levels (BGVN 45:10, 46:03, 46:11). The current eruption period began June 2021. This report covers activity during July-December 2023 and is based on weekly bulletins and occasional daily reports from the Observatorio Vulcanologico Sismologica de Costa Rica-Universidad Nacional (OVSICORI-UNA).
Numerous weak phreatic explosions continued during July-December 2023, along with gas-and-steam emissions and plumes that rose as high as 3 km above the crater rim. Many weekly OVSICORI-UNA bulletins included the previous week's number of explosions and emissions (table 9). For many explosions, the time of explosion was given (table 10). Frequent seismic activity (long-period earthquakes, volcano-tectonic earthquakes, and tremor) accompanied the phreatic activity.
Table 9. Number of reported weekly phreatic explosions and gas-and-steam emissions at Rincón de la Vieja, July-December 2023. Counts are reported for the week before the Weekly Bulletin date; not all reports included these data. Courtesy of OVSICORI-UNA.
| OVSICORI Weekly Bulletin |
Number of explosions |
Number of emissions |
| 28 Jul 2023 |
6 |
14 |
| 4 Aug 2023 |
10 |
12 |
| 1 Sep 2023 |
13 |
11 |
| 22 Sep 2023 |
12 |
13 |
| 29 Sep 2023 |
6 |
11 |
| 6 Oct 2023 |
12 |
5 |
| 13 Oct 2023 |
7 |
9 |
| 20 Oct 2023 |
1 |
15 |
| 27 Oct 2023 |
3 |
23 |
| 3 Nov 2023 |
3 |
10 |
| 17 Nov 2023 |
0 |
Some |
| 24 Nov 2023 |
0 |
14 |
| 8 Dec 2023 |
4 |
16 |
| 22 Dec 2023 |
8 |
18 |
Table 10. Summary of activity at Rincón de la Vieja during July-December 2023. Weak phreatic explosions and gas emissions are noted where the time of explosion was indicated in the weekly or daily bulletins. Height of plumes or emissions are distance above the crater rim. Courtesy of OVSICORI-UNA.
| Date |
Time |
Description of Activity |
| 1 Jul 2023 |
0156 |
Explosion. |
| 2 Jul 2023 |
0305 |
Explosion. |
| 4 Jul 2023 |
0229, 0635 |
Event at 0635 produced a gas-and-steam plume that rose 700 m and drifted W; seen by residents in Liberia (21 km SW). |
| 9 Jul 2023 |
1843 |
Explosion. |
| 21 Jul 2023 |
0705 |
Explosion. |
| 26 Jul 2023 |
1807 |
Explosion. |
| 28 Jul 2023 |
0802 |
Explosion generated a gas-and-steam plume that rose 500 m. |
| 30 Jul 2023 |
1250 |
Explosion. |
| 31 Jul 2023 |
2136 |
Explosion. |
| 11 Aug 2023 |
0828 |
Explosion. |
| 18 Aug 2023 |
1304 |
Explosion. |
| 21 Aug 2023 |
1224 |
Explosion generated gas-and-steam plumes rose 500-600 m. |
| 22 Aug 2023 |
0749 |
Explosion generated gas-and-steam plumes rose 500-600 m. |
| 24 Aug 2023 |
1900 |
Explosion. |
| 25 Aug 2023 |
0828 |
Event produced a steam-and-gas plume that rose 3 km and drifted NW. |
| 27-28 Aug 2023 |
0813 |
Four small events; the event at 0813 on 28 August lasted two minutes and generated a steam-and-gas plume that rose 2.5 km. |
| 1 Sep 2023 |
1526 |
Explosion generated plume that rose 2 km and ejected material onto the flanks. |
| 2-3 Sep 2023 |
- |
Small explosions detected in infrasound data. |
| 4 Sep 2023 |
1251 |
Gas-and-steam plume rose 1 km and drifted W. |
| 7 Nov 2023 |
1113 |
Explosion. |
| 8 Nov 2023 |
0722 |
Explosion. |
| 12 Nov 2023 |
0136 |
Small gas emissions. |
| 14 Nov 2023 |
0415 |
Small gas emissions. |
According to OVSICORI-UNA, during July-October the average weekly sulfur dioxide (SO2) flux ranged from 68 to 240 tonnes/day. However, in mid-November the flux increased to as high as 334 tonnes/day, the highest value measured in recent years. The high SO2 flux in mid-November was also detected by the TROPOMI instrument on the Sentinel-5P satellite (figure 43).
Geologic Background. Rincón de la Vieja, the largest volcano in NW Costa Rica, is a remote volcanic complex in the Guanacaste Range. The volcano consists of an elongated, arcuate NW-SE-trending ridge constructed within the 15-km-wide early Pleistocene Guachipelín caldera, whose rim is exposed on the south side. Sometimes known as the "Colossus of Guanacaste," it has an estimated volume of 130 km3 and contains at least nine major eruptive centers. Activity has migrated to the SE, where the youngest-looking craters are located. The twin cone of Santa María volcano, the highest peak of the complex, is located at the eastern end of a smaller, 5-km-wide caldera and has a 500-m-wide crater. A Plinian eruption producing the 0.25 km3 Río Blanca tephra about 3,500 years ago was the last major magmatic eruption. All subsequent eruptions, including numerous historical eruptions possibly dating back to the 16th century, have been from the prominent active crater containing a 500-m-wide acid lake located ENE of Von Seebach crater.
Information Contacts: Observatorio Vulcanológico Sismológica de Costa Rica-Universidad Nacional (OVSICORI-UNA), Apartado 86-3000, Heredia, Costa Rica (URL: http://www.ovsicori.una.ac.cr/); NASA Global Sulfur Dioxide Monitoring Page, Atmospheric Chemistry and Dynamics Laboratory, NASA Goddard Space Flight Center (NASA/GSFC), 8800 Greenbelt Road, Goddard MD 20771, USA (URL: https://so2.gsfc.nasa.gov/).
Bezymianny (Russia) — November 2023 Cite this Report
Bezymianny
Russia
55.972°N, 160.595°E; summit elev. 2882 m
All times are local (unless otherwise noted)
Explosion on 18 October 2023 sends ash plume 8 km high; lava flows and incandescent avalanches
Bezymianny, located on Russia’s Kamchatka Peninsula, has had eruptions since 1955 characterized by dome growth, explosions, pyroclastic flows, ash plumes, and ashfall. Activity during November 2022-April 2023 included gas-and-steam emissions, lava dome collapses generating avalanches, and persistent thermal activity. Similar eruptive activity continued from May through October 2023, described here based on information from weekly and daily reports of the Kamchatka Volcano Eruptions Response Team (KVERT), notices from Tokyo VAAC (Volcanic Ash Advisory Center), and from satellite data.
Overall activity decreased after the strong period of activity in late March through April 2023, which included ash explosions during 29 March and 7-8 April 2023 that sent plumes as high as 10-12 km altitude, along with dome growth and lava flows (BGVN 48:05). This reduced activity can be seen in the MIROVA thermal detection system graph (figure 56), which was consistent with data from the MODVOLC thermal detection system and with Sentinel-2 satellite images that showed persistent hotspots in the summit crater when conditions allowed observations. A renewed period of strong activity began in mid-October 2023.
Activity increased significantly on 17 October 2023 when large collapses began during 0700-0830 on the E flanks of the lava dome and continued to after 0930 the next day (figure 57). Ash plumes rose to an altitude of 4.5-5 km, extending 220 km NNE by 18 October. A large explosion at 1630 on 18 October produced an ash plume that rose to an altitude of 11 km (8 km above the summit) and drifted NNE and then NW, extending 900 km NW within two days at an altitude of 8 km. Minor ashfall was noted in Kozyrevsk (45 km WNW). At 0820 on 20 October an ash plume was identified in satellite images drifting 100 km ENE at altitudes of 4-4.5 km.
Lava flows and hot avalanches from the dome down the SE flank continued over the next few days, including 23 October when clear conditions allowed good observations (figures 58 and 59). A large thermal anomaly was observed over the volcano through 24 October, and in the summit crater on 30 October (figure 60). Strong fumarolic activity continued, with numerous avalanches and occasional incandescence. By the last week of October, volcanic activity had decreased to a level consistent with that earlier in the reporting period.
Aviation warnings were frequently updated during 17-20 October. KVERT issued a Volcano Observatory Notice for Aviation (VONA) on 17 October at 1419 and 1727 (0219 and 0527 UTC) raising the Aviation Color Code (ACC) from Yellow to Orange (second highest level). The next day, KVERT issued a VONA at 1705 (0505 UTC) raising the ACC to Red (highest level) but lowered it back to Orange at 2117 (0917 UTC). After another decrease to Yellow and back to Orange, the ACC was reduced to Yellow on 20 October at 1204 (0004 UTC). In addition, the Tokyo VAAC issued a series of Volcanic Ash Advisories beginning on 16 October and continuing through 30 October.
Geologic Background. The modern Bezymianny, much smaller than its massive neighbors Kamen and Kliuchevskoi on the Kamchatka Peninsula, was formed about 4,700 years ago over a late-Pleistocene lava-dome complex and an edifice built about 11,000-7,000 years ago. Three periods of intensified activity have occurred during the past 3,000 years. The latest period, which was preceded by a 1,000-year quiescence, began with the dramatic 1955-56 eruption. This eruption, similar to that of St. Helens in 1980, produced a large open crater that was formed by collapse of the summit and an associated lateral blast. Subsequent episodic but ongoing lava-dome growth, accompanied by intermittent explosive activity and pyroclastic flows, has largely filled the 1956 crater.
Information Contacts: Kamchatka Volcanic Eruptions Response Team (KVERT), Far Eastern Branch, Russian Academy of Sciences, 9 Piip Blvd., Petropavlovsk-Kamchatsky, 683006, Russia (URL: http://www.kscnet.ru/ivs/kvert/); Kamchatka Volcanological Station, Kamchatka Branch of Geophysical Survey, (KB GS RAS), Klyuchi, Kamchatka Krai, Russia (URL: http://volkstat.ru/); Tokyo Volcanic Ash Advisory Center (VAAC), 1-3-4 Otemachi, Chiyoda-ku, Tokyo 100-8122, Japan (URL: http://ds.data.jma.go.jp/svd/vaac/data/); Hawai'i Institute of Geophysics and Planetology (HIGP) - MODVOLC Thermal Alerts System, School of Ocean and Earth Science and Technology (SOEST), Univ. of Hawai'i, 2525 Correa Road, Honolulu, HI 96822, USA (URL: http://modis.higp.hawaii.edu/); MIROVA (Middle InfraRed Observation of Volcanic Activity), a collaborative project between the Universities of Turin and Florence (Italy) supported by the Centre for Volcanic Risk of the Italian Civil Protection Department (URL: http://www.mirovaweb.it/); Copernicus Browser, Copernicus Data Space Ecosystem, European Space Agency (URL: https://dataspace.copernicus.eu/browser/).chr
Kilauea (United States) — January 2023 Cite this Report
Kilauea
United States
19.421°N, 155.287°W; summit elev. 1222 m
All times are local (unless otherwise noted)
Low-level lava effusions in the lava lake at Halema’uma’u during July-December 2022
Kīlauea is the southeastern-most volcano in Hawaii and overlaps the E flank of the Mauna Loa volcano. Its East Rift Zone (ERZ) has been intermittently active for at least 2,000 years. An extended eruption period began in January 1983 and was characterized by open lava lakes and lava flows from the summit caldera and the East Rift Zone. During May 2018 magma migrated into the Lower East Rift Zone (LERZ) and opened 24 fissures along a 6-km-long NE-trending fracture zone that produced lava flows traveling in multiple directions. As lava emerged from the fissures, the lava lake at Halema'uma'u drained and explosions sent ash plumes to several kilometers altitude (BGVN 43:10).
The current eruption period started during September 2021 and has recently been characterized by lava effusions, spatter, and sulfur dioxide emissions in the active Halema’uma’u lava lake (BGVN 47:08). Lava effusions, some spatter, and sulfur dioxide emissions have continued during this reporting period of July through December 2022 using daily reports, volcanic activity notices, and abundant photo, map, and video data from the US Geological Survey's (USGS) Hawaiian Volcano Observatory (HVO).
Summary of activity during July-December 2022. Low-level effusions have continued at the western vent of the Halema’uma’u crater during July through early December 2022. Occasional weak ooze-outs (also called lava break outs) would occur along the margins of the crater floor. The overall level of the active lava lake throughout the reporting period gradually increased due to infilling, however it stagnated in mid-September (table 13). During September through November, activity began to decline, though lava effusions persisted at the western vent. By 9 December, the active part of the lava lake had completely crusted over, and incandescence was no longer visible.
Table 13. Summary of measurements taken during overflights at Kīlauea that show a gradual increase in the active lava lake level and the volume of lava effused since 29 September 2021. Lower activity was reported during September-October. Data collected during July-December 2022. Courtesy of HVO.
| Date: |
Level of the active lava lake (m): |
Cumulative volume of lava effused (million cubic meters): |
| 7 Jul 2022 |
130 |
95 |
| 19 Jul 2022 |
133 |
98 |
| 4 Aug 2022 |
136 |
102 |
| 16 Aug 2022 |
137 |
104 |
| 12 Sep 2022 |
143 |
111 |
| 5 Oct 2022 |
143 |
111 |
| 28 Oct 2022 |
143 |
111 |
Activity during July 2022. Lava effusions were reported from the western vent in the Halema’uma’u crater, along with occasional weak ooze-outs along the margins of the crater floor. The height of the lava lake was variable due to deflation-inflation tilt events; for example, the lake level dropped approximately 3-4 m during a summit deflation-inflation event reported on 1 July. Webcam images taken during the night of 6-12 July showed intermittent low-level spattering at the western vent that rose less than 10 m above the vent (figure 519). Measurements made during an overflight on 7 July indicated that the crater floor was infilled about 130 m and that 95 million cubic meters of lava had been effused since 29 September 2021. A single, relatively small lava ooze-out was active to the S of the lava lake. Around midnight on 8 July there were two brief periods of lava overflow onto the lake margins. On 9 July lava ooze-outs were reported near the SE and NE edges of the crater floor and during 10-11 July they occurred near the E, NE, and NW edges. On 16 July crater incandescence was reported, though the ooze-outs and spattering were not visible. On 18 July overnight webcam images showed incandescence in the western vent complex and two ooze-outs were reported around 0000 and 0200 on 19 July. By 0900 there were active ooze-outs along the SW edge of the crater floor. Measurements made from an overflight on 19 July indicated that the crater floor was infilled about 133 m and 98 million cubic meters of lava had erupted since 29 September 2021 (figure 520). On 20 July around 1600 active ooze-outs were visible along the N edge of the crater, which continued through the next day. Extensive ooze-outs occurred along the W margin during 24 July until 1900; on 26 July minor ooze-outs were noted along the N margin. Minor spattering was visible on 29 July along the E margin of the lake. The sulfur dioxide emission rates ranged 650-2,800 tons per day (t/d), the higher of which was measured on 8 July (figure 519).
Activity during August 2022. The eruption continued in the Halema’uma’u crater at the western vent. According to HVO the lava in the active lake remained at the level of the bounding levees. Occasional minor ooze-outs were observed along the margins of the crater floor. Strong nighttime crater incandescence was visible after midnight on 6 August over the western vent cone. During 6-7 August scattered small lava lobes were active along the crater floor and incandescence persisted above the western vent through 9 August. During 7-9 August HVO reported a single lava effusion source was active along the NW margin of the crater floor. Measurements from an overflight on 4 August indicated that the crater floor was infilled about 136 m total and that 102 million cubic meters of lava had been erupted since the start of the eruption. Lava breakouts were reported along the N, NE, E, S, and W margins of the crater during 10-16 August. Another overflight survey conducted on 16 August indicated that the crater floor infilled about 137 m and 104 million cubic meters of lava had been erupted since September 2021. Measured sulfur dioxide emissions rates ranged 1,150-2,450 t/d, the higher of which occurred on 8 August.
Activity during September 2022. During September, lava effusion continued from the western vent into the active lava lake and onto the crater floor. Intermittent minor ooze-outs were reported through the month. A small ooze-out was visible on the W crater floor margin at 0220 on 2 September, which showed decreasing surface activity throughout the day, but remained active through 3 September. On 3 September around 1900 a lava outbreak occurred along the NW margin of the crater floor but had stopped by the evening of 4 September. Field crews monitoring the summit lava lake on 9 September observed spattering on the NE margin of the lake that rose no higher than 10 m, before falling back onto the lava lake crust (figure 521). Overflight measurements on 12 September indicated that the crater floor was infilled a total of 143 m and 111 million cubic meters of lava had been erupted since September 2021. Extensive breakouts in the W and N part of the crater floor were reported at 1600 on 20 September and continued into 26 September. The active part of the lava lake dropped by 10 m while other parts of the crater floor dropped by several meters. Summit tiltmeters recorded a summit seismic swarm of more than 80 earthquakes during 1500-1800 on 21 September, which occurred about 1.5 km below Halema’uma’u; a majority of these were less than Mw 2. By 22 September the active part of the lava lake was infilled about 2 m. On 23 September the western vent areas exhibited several small spatter cones with incandescent openings, along with weak, sporadic spattering (figure 522). The sulfur dioxide emission rate ranged from 930 t/d to 2,000 t/d, the higher of which was measured on 6 September.
Activity during October 2022. Activity during October declined slightly compared to previous months, though lava effusions persisted from the western vent into the active lava lake and onto the crater floor during October (figure 523). Slight variations in the lava lake were noted throughout the month. HVO reported that around 0600 on 3 October the level of the lava lake has lowered slightly. Overflight measurements taken on 5 October indicated that the crater floor was infilled a total of about 143 m and that 111 million cubic meters of lava had been effused since September 2021. During 6-7 October the lake gradually rose 0.5 m. Sulfur dioxide measurements made on 22 October had an emission rate of 700 t/d. Another overflight taken on 28 October showed that there was little to no change in the elevation of the crater floor: the crater floor was infilled a total of 143 m and 111 million cubic meters of lava had erupted since the start of the eruption.
Activity during November 2022. Activity remained low during November, though HVO reported that lava from the western vent continued to effuse into the active lava lake and onto the crater floor throughout the month. The rate of sulfur dioxide emissions during November ranged from 300-600 t/d, the higher amount of which occurred on 9 November.
Activity during December 2022. Similar low activity was reported during December, with lava effusing from the western vent into the active lava lake and onto the crater floor. During 4-5 December the active part of the lava lake was slightly variable in elevation and fluctuated within 1 m. On 9 December HVO reported that lava was no longer erupting from the western vent in the Halema’uma’u crater and that sulfur dioxide emissions had returned to near pre-eruption background levels; during 10-11 December, the lava lake had completely crusted over, and no incandescence was visible (figure 524). Time lapse camera images covering the 4-10 December showed that the crater floor showed weak deflation and no inflation. Some passive events of crustal overturning were reported during 14-15 December, which brought fresh incandescent lava to the lake surface. The sulfur dioxide emission rate was approximately 200 t/d on 14 December. A smaller overturn event on 17 December and another that occurred around 0000 and into the morning of 20 December were also detected. A small seismic swarm was later detected on 30 December.
Geologic Background. Kilauea overlaps the E flank of the massive Mauna Loa shield volcano in the island of Hawaii. Eruptions are prominent in Polynesian legends; written documentation since 1820 records frequent summit and flank lava flow eruptions interspersed with periods of long-term lava lake activity at Halemaumau crater in the summit caldera until 1924. The 3 x 5 km caldera was formed in several stages about 1,500 years ago and during the 18th century; eruptions have also originated from the lengthy East and Southwest rift zones, which extend to the ocean in both directions. About 90% of the surface of the basaltic shield volcano is formed of lava flows less than about 1,100 years old; 70% of the surface is younger than 600 years. The long-term eruption from the East rift zone between 1983 and 2018 produced lava flows covering more than 100 km2, destroyed hundreds of houses, and added new coastline.
Information Contacts: Hawaiian Volcano Observatory (HVO), U.S. Geological Survey, PO Box 51, Hawai'i National Park, HI 96718, USA (URL: http://hvo.wr.usgs.gov/).
Nyamulagira (DR Congo) — November 2023 Cite this Report
Nyamulagira
DR Congo
1.408°S, 29.2°E; summit elev. 3058 m
All times are local (unless otherwise noted)
Lava flows and thermal activity during May-October 2023
Nyamulagira (also known as Nyamuragira) is a shield volcano in the Democratic Republic of Congo with the summit truncated by a small 2 x 2.3 km caldera with walls up to about 100 m high. Documented eruptions have occurred within the summit caldera, as well as from numerous flank fissures and cinder cones. The current eruption period began in April 2018 and has more recently been characterized by summit crater lava flows and thermal activity (BGVN 48:05). This report describes lava flows and variable thermal activity during May through October 2023, based on information from the Observatoire Volcanologique de Goma (OVG) and various satellite data.
Lava lake activity continued during May. The MIROVA (Middle InfraRed Observation of Volcanic Activity) system recorded moderate-to-strong thermal activity throughout the reporting period; activity was more intense during May and October and relatively weaker from June through September (figure 95). The MODVOLC thermal algorithm, detected a total of 209 thermal alerts. There were 143 hotspots detected during May, eight during June, nine during September, and 49 during October. This activity was also reflected in infrared satellite images, where a lava flow was visible in the NW part of the crater on 7 May and strong activity was seen in the center of the crater on 4 October (figure 96). Another infrared satellite image taken on 12 May showed still active lava flows along the NW margin of the crater. According to OVG lava effusions were active during 7-29 May and moved to the N and NW parts of the crater beginning on 9 May. Strong summit crater incandescence was visible from Goma (27 km S) during the nights of 17, 19, and 20 May (figure 97). On 17 May there was an increase in eruptive activity, which peaked at 0100 on 20 May. Notable sulfur dioxide plumes drifted NW and W during 19-20 May (figure 98). Drone footage acquired in partnership with the USGS (United States Geological Survey) on 20 May captured images of narrow lava flows that traveled about 100 m down the W flank (figure 99). Data from the Rumangabo seismic station indicated a decreasing trend in activity during 17-21 May. Although weather clouds prevented clear views of the summit, a strong thermal signature on the NW flank was visible in an infrared satellite image on 22 May, based on an infrared satellite image. On 28 May the lava flows on the upper W flank began to cool and solidify. By 29 May seismicity returned to levels similar to those recorded before the 17 May increase. Lava effusion continued but was confined to the summit crater; periodic crater incandescence was observed.
Low-level activity was noted during June through October. On 1 June OVG reported that seismicity remained at lower levels and that crater incandescence had been absent for three days, though infrared satellite imagery showed continued lava effusion in the summit crater. The lava flows on the flanks covered an estimated 0.6 km2. Satellite imagery continued to show thermal activity confined to the lava lake through October (figure 96), although no lava flows or significant sulfur dioxide emissions were reported.
Geologic Background. Africa's most active volcano, Nyamulagira (also known as Nyamuragira), is a massive high-potassium basaltic shield about 25 km N of Lake Kivu and 13 km NNW of the steep-sided Nyiragongo volcano. The summit is truncated by a small 2 x 2.3 km caldera that has walls up to about 100 m high. Documented eruptions have occurred within the summit caldera, as well as from the numerous flank fissures and cinder cones. A lava lake in the summit crater, active since at least 1921, drained in 1938, at the time of a major flank eruption. Recent lava flows extend down the flanks more than 30 km from the summit as far as Lake Kivu; extensive lava flows from this volcano have covered 1,500 km2 of the western branch of the East African Rift.
Information Contacts: Observatoire Volcanologique de Goma (OVG), Departement de Geophysique, Centre de Recherche en Sciences Naturelles, Lwiro, D.S. Bukavu, DR Congo; Hawai'i Institute of Geophysics and Planetology (HIGP) - MODVOLC Thermal Alerts System, School of Ocean and Earth Science and Technology (SOEST), Univ. of Hawai'i, 2525 Correa Road, Honolulu, HI 96822, USA (URL: http://modis.higp.hawaii.edu/); MIROVA (Middle InfraRed Observation of Volcanic Activity), a collaborative project between the Universities of Turin and Florence (Italy) supported by the Centre for Volcanic Risk of the Italian Civil Protection Department (URL: http://www.mirovaweb.it/); NASA Global Sulfur Dioxide Monitoring Page, Atmospheric Chemistry and Dynamics Laboratory, NASA Goddard Space Flight Center (NASA/GSFC), 8800 Greenbelt Road, Goddard, Maryland, USA (URL: https://so2.gsfc.nasa.gov/); Copernicus Browser, Copernicus Data Space Ecosystem, European Space Agency (URL: https://dataspace.copernicus.eu/browser/); Charles Balagizi, Goma Volcano Observatory, Departement de Geophysique, Centre de Recherche en Sciences Naturelles, Lwiro, D.S. Bukavu, DR Congo.
Bagana (Papua New Guinea) — October 2023 Cite this Report
Bagana
Papua New Guinea
6.137°S, 155.196°E; summit elev. 1855 m
All times are local (unless otherwise noted)
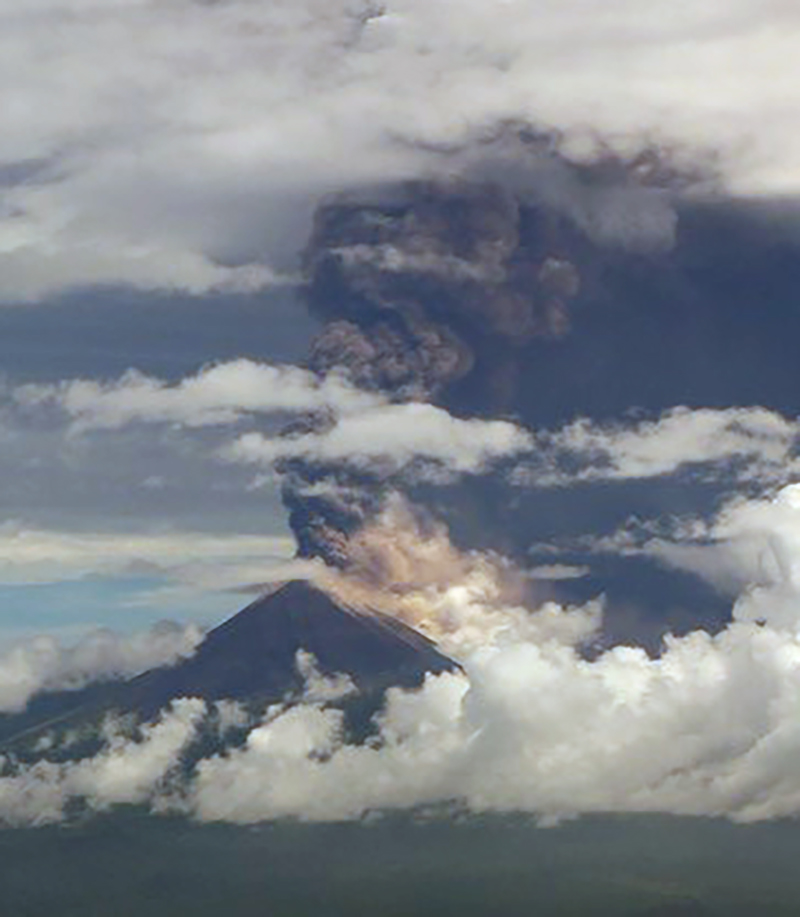
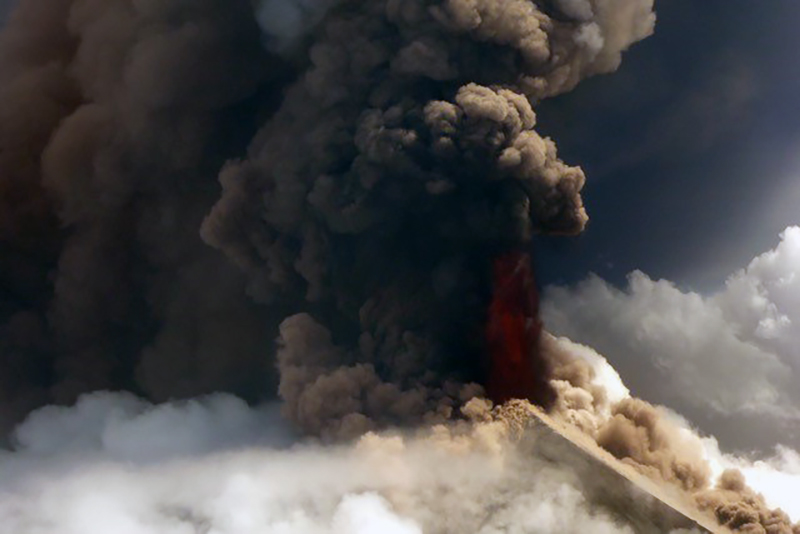
Explosions, ash plumes, ashfall, and lava flows during April-September 2023
The remote volcano of Bagana is located in central Bougainville Island, Papua New Guinea. Recorded eruptions date back to 1842 and activity has consisted of effusive activity that has built a small lava dome in the summit crater and occasional explosions that produced pyroclastic flows. The most recent eruption has been ongoing since February 2000 and has produced occasional explosions, ash plumes, and lava flows. More recently, activity has been characterized by ongoing effusive activity and ash emissions (BGVN 48:04). This report updates activity from April through September 2023 that has consisted of explosions, ash plumes, ashfall, and lava flows, using information from the Darwin Volcanic Ash Advisory Center (VAAC) and satellite data.
An explosive eruption was reported on 7 July that generated a large gas-and-ash plume to high altitudes and caused significant ashfall in local communities; the eruption plume had reached upper tropospheric (16-18 km altitude) altitudes by 2200, according to satellite images. Sulfur dioxide plumes were detected in satellite images on 8 July and indicated that the plume was likely a mixture of gas, ice, and ash. A report issued by the Autonomous Bougainville Government (ABG) (Torokina District, Education Section) on 10 July noted that significant ash began falling during 2000-2100 on 7 July and covered most areas in the Vuakovi, Gotana (9 km SW), Koromaketo, Laruma (25 km W) and Atsilima (27 km NW) villages. Pyroclastic flows also occurred, according to ground-based reports; small deposits confined to one drainage were inspected by RVO during an overflight on 17 July and were confirmed to be from the 7 July event. Ashfall continued until 10 July and covered vegetation, which destroyed bushes and gardens and contaminated rivers and streams.
RVO reported another eruption on 14 July. The Darwin VAAC stated that an explosive event started around 0830 on 15 July and produced an ash plume that rose to 16.5 km altitude by 1000 and drifted N, according to satellite images. The plume continued to drift N and remained visible through 1900, and by 2150 it had dissipated.
Ashfall likely from both the 7 and 15 July events impacted about 8,111 people in Torokina (20 km SW), including Tsito/Vuakovi, Gotana, Koromaketo, Kenaia, Longkogari, Kenbaki, Piva (13 km SW), and Atsinima, and in the Tsitovi district, according to ABG. Significant ashfall was also reported in Ruruvu (22 km N) in the Wakunai District of Central Bougainville, though the thickness of these deposits could not be confirmed. An evacuation was called for the villages in Wakunai, where heavy ashfall had contaminated water sources; the communities of Ruruvu, Togarau, Kakarapaia, Karauturi, Atao, and Kuritaturi were asked to evacuate to a disaster center at the Wakunai District Station, and communities in Torokina were asked to evacuate to the Piva District station. According to a news article, more than 7,000 people needed temporary accommodations, with about 1,000 people in evacuation shelters. Ashfall had deposited over a broad area, contaminating water supplies, affecting crops, and collapsing some roofs and houses in rural areas. Schools were temporarily shut down. Intermittent ash emissions continued through the end of July and drifted NNW, NW, and SW. Fine ashfall was reported on the coast of Torokina, and ash plumes also drifted toward Laruma and Atsilima.
A small explosive eruption occurred at 2130 on 28 July that ejected material from the crater vents, according to reports from Torokina, in addition to a lava flow that contained two lobes. A second explosion was detected at 2157. Incandescence from the lava flow was visible from Piva as it descended the W flank around 2000 on 29 July (figure 47). The Darwin VAAC reported that a strong thermal anomaly was visible in satellite images during 30-31 July and that ash emissions rose to 2.4 km altitude and drifted WSW on 30 July. A ground report from RVO described localized emissions at 0900 on 31 July.
The Darwin VAAC reported that ash plumes were identified in satellite imagery at 0800 and 1220 on 12 August and rose to 2.1 km and 3 km altitude and drifted NW and W, respectively. A news report stated that aid was sent to more than 6,300 people that were adversely affected by the eruption. Photos taken during 17-19 August showed ash emissions rising no higher than 1 km above the summit and drifting SE. A small explosion generated an ash plume during the morning of 19 August. Deposits from small pyroclastic flows were also captured in the photos. Satellite images captured lava flows and pyroclastic flow deposits. Two temporary seismic stations were installed near Bagana on 17 August at distances of 7 km WSW (Vakovi station) and 11 km SW (Kepox station). The Kepox station immediately started to record continuous, low-frequency background seismicity.
Satellite data. Little to no thermal activity was detected during April through mid-July 2023; only one anomaly was recorded during early April and one during early June, according to MIROVA (Middle InfraRed Observation of Volcanic Activity) data (figure 48). Thermal activity increased in both power and frequency during mid-July through September, although there were still some short gaps in detected activity. MODVOLC also detected increased thermal activity during August; thermal hotspots were detected a total of five times on 19, 20, and 27 August. Weak thermal anomalies were also captured in infrared satellite images on clear weather days throughout the reporting period on 7, 12, and 17 April, 27 May, 1, 6, 16, and 31 July, and 19 September (figure 48); a strong thermal anomaly was visible on 31 July. Distinct sulfur dioxide plumes that drifted generally NW were intermittently captured by the TROPOMI instrument on the Sentinel-5P satellite and sometimes exceeded two Dobson Units (DUs) (figure 49).
Geologic Background. Bagana volcano, in a remote portion of central Bougainville Island, is frequently active. This massive symmetrical cone was largely constructed by an accumulation of viscous andesitic lava flows. The entire edifice could have been constructed in about 300 years at its present rate of lava production. Eruptive activity is characterized by non-explosive effusion of viscous lava that maintains a small lava dome in the summit crater, although occasional explosive activity produces pyroclastic flows. Lava flows with tongue-shaped lobes up to 50 m thick and prominent levees descend the flanks on all sides.
Information Contacts: Rabaul Volcano Observatory (RVO), Geohazards Management Division, Department of Mineral Policy and Geohazards Management (DMPGM), PO Box 3386, Kokopo, East New Britain Province, Papua New Guinea; Darwin Volcanic Ash Advisory Centre (VAAC), Bureau of Meteorology, Northern Territory Regional Office, PO Box 40050, Casuarina, NT 0811, Australia (URL: http://www.bom.gov.au/info/vaac/); MIROVA (Middle InfraRed Observation of Volcanic Activity), a collaborative project between the Universities of Turin and Florence (Italy) supported by the Centre for Volcanic Risk of the Italian Civil Protection Department (URL: http://www.mirovaweb.it/); Hawai'i Institute of Geophysics and Planetology (HIGP) - MODVOLC Thermal Alerts System, School of Ocean and Earth Science and Technology (SOEST), Univ. of Hawai'i, 2525 Correa Road, Honolulu, HI 96822, USA (URL: http://modis.higp.hawaii.edu/); NASA Global Sulfur Dioxide Monitoring Page, Atmospheric Chemistry and Dynamics Laboratory, NASA Goddard Space Flight Center (NASA/GSFC), 8800 Greenbelt Road, Goddard, Maryland, USA (URL: https://so2.gsfc.nasa.gov/); Copernicus Browser, Copernicus Data Space Ecosystem, European Space Agency (URL: https://dataspace.copernicus.eu/browser/); Autonomous Bougainville Government, P.O Box 322, Buka, AROB, PNG (URL: https://abg.gov.pg/); Andrew Tupper (Twitter: @andrewcraigtupp); Simon Carn, Geological and Mining Engineering and Sciences, Michigan Technological University, 1400 Townsend Drive, Houghton, MI 49931, USA (URL: http://www.volcarno.com/, Twitter: @simoncarn); Radio NZ (URL: https://www.rnz.co.nz/news/pacific/494464/more-than-7-000-people-in-bougainville-need-temporary-accommodation-after-eruption); USAID, 1300 Pennsylvania Ave, NW, Washington DC 20004, USA (URL: https://www.usaid.gov/pacific-islands/press-releases/aug-08-2023-united-states-provides-immediate-emergency-assistance-support-communities-affected-mount-bagana-volcanic-eruptions).
Mayon (Philippines) — October 2023 Cite this Report
Mayon
Philippines
13.257°N, 123.685°E; summit elev. 2462 m
All times are local (unless otherwise noted)
Lava flows, pyroclastic flows, ash emissions, and seismicity during April-September 2023
Mayon is located in the Philippines and has steep upper slopes capped by a small summit crater. Historical eruptions date back to 1616 CE that have been characterized by Strombolian eruptions, lava flows, pyroclastic flows, and mudflows. Eruptions mostly originated from a central conduit. Pyroclastic flows and mudflows have commonly descended many of the approximately 40 drainages that surround the volcano. The most recent eruption occurred during June through October 2022 and consisted of lava dome growth and gas-and-steam emissions (BGVN 47:12). A new eruption was reported during late April 2023 and has included lava flows, pyroclastic density currents, ash emissions, and seismicity. This report covers activity during April through September 2023 based on daily bulletins from the Philippine Institute of Volcanology and Seismology (PHIVOLCS).
During April through September 2023, PHIVOLCS reported near-daily rockfall events, frequent volcanic earthquakes, and sulfur dioxide measurements. Gas-and-steam emissions rose 100-900 m above the crater and drifted in different directions. Nighttime crater incandescence was often visible during clear weather and was accompanied by incandescent avalanches of material. Activity notably increased during June when lava flows were reported on the S, SE, and E flanks (figure 52). The MIROVA graph (Middle InfraRed Observation of Volcanic Activity) showed strong thermal activity coincident with these lava flows, which remained active through September (figure 53). According to the MODVOLC thermal algorithm, a total of 110 thermal alerts were detected during the reporting period: 17 during June, 40 during July, 27 during August, and 26 during September. During early June, pyroclastic density currents (PDCs) started to occur more frequently.
Low activity was reported during much of April and May; gas-and-steam emissions rose 100-900 m above the crater and generally drifted in different directions. A total of 52 rockfall events and 18 volcanic earthquakes were detected during April and 147 rockfall events and 13 volcanic events during May. Sulfur dioxide flux measurements ranged between 400-576 tons per day (t/d) during April, the latter of which was measured on 29 April and between 162-343 t/d during May, the latter of which was measured on 13 May.
Activity during June increased, characterized by lava flows, pyroclastic density currents (PDCs), crater incandescence and incandescent rockfall events, gas-and-steam emissions, and continued seismicity. Weather clouds often prevented clear views of the summit, but during clear days, moderate gas-and-steam emissions rose 100-2,500 m above the crater and drifted in multiple directions. A total of 6,237 rockfall events and 288 volcanic earthquakes were detected. The rockfall events often deposited material on the S and SE flanks within 700-1,500 m of the summit crater and ash from the events drifted SW, S, SE, NE, and E. Sulfur dioxide emissions ranged between 149-1,205 t/d, the latter of which was measured on 10 June. Short-term observations from EDM and electronic tiltmeter monitoring indicated that the upper slopes were inflating since February 2023. Longer-term ground deformation parameters based on EDM, precise leveling, continuous GPS, and electronic tilt monitoring indicated that the volcano remained inflated, especially on the NW and SE flanks. At 1000 on 5 June the Volcano Alert Level (VAL) was raised to 2 (on a 0-5 scale). PHIVOLCS noted that although low-level volcanic earthquakes, ground deformation, and volcanic gas emissions indicated unrest, the steep increase in rockfall frequency may indicate increased dome activity.
A total of 151 dome-collapse PDCs occurred during 8-9 and 11-30 June, traveled 500-2,000 m, and deposited material on the S flank within 2 km of the summit crater. During 8-9 June the VAL was raised to 3. At approximately 1947 on 11 June lava flow activity was reported; two lobes traveled within 500 m from the crater and deposited material on the S (Mi-isi), SE (Bonga), and E (Basud) flanks. Weak seismicity accompanied the lava flow and slight inflation on the upper flanks. This lava flow remained active through 30 June, moving down the S and SE flank as far as 2.5 km and 1.8 km, respectively and depositing material up to 3.3 km from the crater. During 15-16 June traces of ashfall from the PDCs were reported in Sitio Buga, Nabonton, City of Ligao and Purok, and San Francisco, Municipality of Guinobatan. During 28-29 June there were two PDCs generated by the collapse of the lava flow front, which generated a light-brown ash plume 1 km high. Satellite monitors detected significant concentrations of sulfur dioxide beginning on 29 June. On 30 June PDCs primarily affected the Basud Gully on the E flank, the largest of which occurred at 1301 and lasted eight minutes, based on the seismic record. Four PDCs generated between 1800 and 2000 that lasted approximately four minutes each traveled 3-4 km on the E flank and generated an ash plume that rose 1 km above the crater and drifted N and NW. Ashfall was recorded in Tabaco City.
Similar strong activity continued during July; slow lava effusion remained active on the S and SE flanks and traveled as far as 2.8 km and 2.8 km, respectively and material was deposited as far as 4 km from the crater. There was a total of 6,983 rockfall events and 189 PDCs that affected the S, SE, and E flanks. The volcano network detected a total of 2,124 volcanic earthquakes. Continuous gas-and-steam emissions rose 200-2,000 m above the crater and drifted in multiple directions. Sulfur dioxide emissions averaged 792-4,113 t/d, the latter of which was measured on 28 July. During 2-4 July three PDCs were generated from the collapse of the lava flow and resulting light brown plumes rose 200-300 m above the crater. Continuous tremor pulses were reported beginning at 1547 on 3 July through 7 July at 1200, at 2300 on 8 July and going through 0300 on 10 July, and at 2300 on 16 July, as recorded by the seismic network. During 6-9 July there were 10 lava flow-collapse-related PDCs that generated light brown plumes 300-500 m above the crater. During 10-11 July light ashfall was reported in some areas of Mabinit, Legazpi City, Budiao and Salvacion, Daraga, and Camalig, Albay. By 18 July the lava flow advanced 600 m on the E flank as well.
During 1733 on 18 July and 0434 on 19 July PHIVOLCS reported 30 “ashing” events, which are degassing events accompanied by audible thunder-like sounds and entrained ash at the crater, which produced short, dark plumes that drifted SW. These events each lasted 20-40 seconds, and plume heights ranged from 150-300 m above the crater, as recorded by seismic, infrasound, visual, and thermal monitors. Three more ashing events occurred during 19-20 July. Short-term observations from electronic tilt and GPS monitoring indicate deflation on the E lower flanks in early July and inflation on the NW middle flanks during the third week of July. Longer-term ground deformation parameters from EDM, precise leveling, continuous GPS, and electronic tilt monitoring indicated that the volcano was still generally inflated relative to baseline levels. A short-lived lava pulse lasted 28 seconds at 1956 on 21 July, which was accompanied by seismic and infrasound signals. By 22 July, the only lava flow that remained active was on the SE flank, and continued to extend 3.4 km, while those on the S and E flanks weakened markedly. One ashing event was detected during 30-31 July, whereas there were 57 detected during 31 July-1 August; according to PHIVOLCS beginning at approximately 1800 on 31 July eruptive activity was dominated by phases of intermittent ashing, as well as increased in the apparent rates of lava effusion from the summit crater. The ashing phases consisted of discrete events recorded as low-frequency volcanic earthquakes (LFVQ) typically 30 seconds in duration, based on seismic and infrasound signals. Gray ash plume rose 100 m above the crater and generally drifted NE. Shortly after these ashing events began, new lava began to effuse rapidly from the crater, feeding the established flowed on the SE, E, and E flanks and generating frequent rockfall events.
Intensified unrest persisted during August. There was a total of 4,141 rockfall events, 2,881 volcanic earthquakes, which included volcanic tremor events, 32 ashing events, and 101 PDCs detected throughout the month. On clear weather days, gas-and-steam emissions rose 300-1,500 m above the crater and drifted in different directions (figure 54). Sulfur dioxide emissions averaged 735-4,756 t/d, the higher value of which was measured on 16 August. During 1-2 August the rate of lava effusion decreased, but continued to feed the flows on the SE, S, and E flanks, maintaining their advances to 3.4 km, 2.8 km, and 1.1 km from the crater, respectively (figure 55). Rockfall and PDCs generated by collapses at the lava flow margins and from the summit dome deposited material within 4 km of the crater. During 3-4 August there were 10 tremor events detected that lasted 1-4 minutes. Short-lived lava pulse lasted 35 seconds and was accompanied by seismic and infrasound signals at 0442 on 6 August. Seven collapses were recorded at the front of the lava flow during 12-14 August.
During September, similar activity of slow lava effusion, PDCs, gas-and-steam emissions, and seismicity continued. There was a total of 4,452 rockfall events, 329 volcanic earthquakes, which included volcanic tremor events, two ashing events, and 85 PDCs recorded throughout the month. On clear weather days, gas-and-steam emissions rose 100-1,500 m above the crater and drifted in multiple directions. Sulfur dioxide emissions averaged 609-2,252 t/d, the higher average of which was measured on 6 September. Slow lava effusion continued advancing on the SE, S, and E flanks, maintaining lengths of 3.4 km, 2.8 km, and 1.1 km, respectively. Rockfall and PDC events generated by collapses along the lava flow margins and at the summit dome deposited material within 4 km of the crater.
Geologic Background. Symmetrical Mayon, which rises above the Albay Gulf NW of Legazpi City, is the most active volcano of the Philippines. The steep upper slopes are capped by a small summit crater. Recorded eruptions since 1616 CE range from Strombolian to basaltic Plinian, with cyclical activity beginning with basaltic eruptions, followed by longer periods of andesitic lava flows. Eruptions occur predominately from the central conduit and have also produced lava flows that travel far down the flanks. Pyroclastic density currents and mudflows have commonly swept down many of the approximately 40 ravines that radiate from the summit and have often damaged populated lowland areas. A violent eruption in 1814 killed more than 1,200 people and devastated several towns.
Information Contacts: Philippine Institute of Volcanology and Seismology (PHIVOLCS), Department of Science and Technology, University of the Philippines Campus, Diliman, Quezon City, Philippines (URL: http://www.phivolcs.dost.gov.ph/); MIROVA (Middle InfraRed Observation of Volcanic Activity), a collaborative project between the Universities of Turin and Florence (Italy) supported by the Centre for Volcanic Risk of the Italian Civil Protection Department (URL: http://www.mirovaweb.it/); Hawai'i Institute of Geophysics and Planetology (HIGP) - MODVOLC Thermal Alerts System, School of Ocean and Earth Science and Technology (SOEST), Univ. of Hawai'i, 2525 Correa Road, Honolulu, HI 96822, USA (URL: http://modis.higp.hawaii.edu/); Copernicus Browser, Copernicus Data Space Ecosystem, European Space Agency (URL: https://dataspace.copernicus.eu/browser/); William Rogers, Legazpi City, Albay Province, Philippines.
Nishinoshima (Japan) — October 2023 Cite this Report
Nishinoshima
Japan
27.247°N, 140.874°E; summit elev. 100 m
All times are local (unless otherwise noted)
Eruption plumes and gas-and-steam plumes during May-August 2023
Nishinoshima, located about 1,000 km S of Tokyo, is a small island in the Ogasawara Arc in Japan. The island is the summit of a massive submarine volcano that has prominent submarine peaks to the S, W, and NE. Eruptions date back to 1973 and the current eruption period began in October 2022. Recent activity has consisted of small ash plumes and fumarolic activity (BGVN 48:07). This report covers activity during May through August 2023, using information from monthly reports of the Japan Meteorological Agency (JMA) monthly reports and satellite data.
Activity during May through June was relatively low. The Japan Coast Guard (JCG) did overflights on 14 and 22 June and reported white gas-and-steam emissions rising 600 m and 1,200 m from the central crater of the pyroclastic cone, respectively (figure 125). In addition, multiple white gas-and-steam emissions rose from the inner rim of the W side of the crater and from the SE flank of the pyroclastic cone. Discolored brown-to-green water was observed around almost the entire perimeter of the island; on 22 June light green discolored water was observed off the S coast of the island.
Observations from the Himawari meteorological satellite confirmed an eruption on 9 and 10 July. An eruption plume rose 1.6 km above the crater and drifted N around 1300 on 9 July. Satellite images acquired at 1420 and 2020 on 9 July and at 0220 on 10 July showed continuing emissions that rose 1.3-1.6 km above the crater and drifted NE and N. The Tokyo VAAC reported that an ash plume seen by a pilot and identified in a satellite image at 0630 on 21 July rose to 3 km altitude and drifted S.
Aerial observations conducted by JCG on 8 August showed a white-and-gray plume rising from the central crater of the pyroclastic cone, and multiple white gas-and-steam emissions were rising from the inner edge of the western crater and along the NW-SE flanks of the island (figure 126). Brown-to-green discolored water was also noted around the perimeter of the island.
Intermittent low-to-moderate power thermal anomalies were recorded in the MIROVA graph (Middle InfraRed Observation of Volcanic Activity), showing an increase in both frequency and power beginning in July (figure 127). This increase in activity coincides with eruptive activity on 9 and 10 July, characterized by eruption plumes. According to the MODVOLC thermal alert algorithm, one thermal hotspot was recorded on 20 July. Weak thermal anomalies were also detected in infrared satellite imagery, accompanied by strong gas-and-steam plumes (figure 128).
Geologic Background. The small island of Nishinoshima was enlarged when several new islands coalesced during an eruption in 1973-74. Multiple eruptions that began in 2013 completely covered the previous exposed surface and continued to enlarge the island. The island is the summit of a massive submarine volcano that has prominent peaks to the S, W, and NE. The summit of the southern cone rises to within 214 m of the ocean surface 9 km SSE.
Information Contacts: Japan Meteorological Agency (JMA), 1-3-4 Otemachi, Chiyoda-ku, Tokyo 100-8122, Japan (URL: http://www.jma.go.jp/jma/indexe.html); Tokyo Volcanic Ash Advisory Center (VAAC), 1-3-4 Otemachi, Chiyoda-ku, Tokyo 100-8122, Japan (URL: http://ds.data.jma.go.jp/svd/vaac/data/); MIROVA (Middle InfraRed Observation of Volcanic Activity), a collaborative project between the Universities of Turin and Florence (Italy) supported by the Centre for Volcanic Risk of the Italian Civil Protection Department (URL: http://www.mirovaweb.it/); Copernicus Browser, Copernicus Data Space Ecosystem, European Space Agency (URL: https://dataspace.copernicus.eu/browser/).
Krakatau (Indonesia) — October 2023 Cite this Report
Krakatau
Indonesia
6.1009°S, 105.4233°E; summit elev. 285 m
All times are local (unless otherwise noted)
White gas-and-steam plumes and occasional ash plumes during May-August 2023
Krakatau is located in the Sunda Strait between Java and Sumatra, Indonesia. Caldera collapse during the catastrophic 1883 eruption destroyed Danan and Perbuwatan cones and left only a remnant of Rakata. The post-collapse cone of Anak Krakatau (Child of Krakatau) was constructed within the 1883 caldera at a point between the former Danan and Perbuwatan cones; it has been the site of frequent eruptions since 1927. The current eruption period began in May 2021 and has recently consisted of Strombolian eruptions and ash plumes (BGVN 48:07). This report describes lower levels of activity consisting of ash and white gas-and-steam plumes during May through August 2023, based on information provided by the Indonesian Center for Volcanology and Geological Hazard Mitigation, referred to as Pusat Vulkanologi dan Mitigasi Bencana Geologi (PVMBG), MAGMA Indonesia, and satellite data.
Activity was relatively low during May and June. Daily white gas-and-steam emissions rose 25-200 m above the crater and drifted in different directions. Five ash plumes were detected at 0519 on 10 May, 1241 on 11 May, 0920 on 12 May, 2320 on 12 May, and at 0710 on 13 May, and rose 1-2.5 km above the crater and drifted SW. A webcam image taken on 12 May showed ejection of incandescent material above the vent. A total of nine ash plumes were detected during 6-11 June: at 1434 and 00220 on 6 and 7 June the ash plumes rose 500 m above the crater and drifted NW, at 1537 on 8 June the ash plume rose 1 km above the crater and drifted SW, at 0746 and at 0846 on 9 June the ash plumes rose 800 m and 3 km above the crater and drifted SW, respectively, at 0423, 1431, and 1750 on 10 June the ash plumes rose 2 km, 1.5 km, and 3.5 km above the crater and drifted NW, respectively, and at 0030 on 11 June an ash plume rose 2 km above the crater and drifted NW. Webcam images taken on 10 and 11 June at 0455 and 0102, respectively, showed incandescent material ejected above the vent. On 19 June an ash plume at 0822 rose 1.5 km above the crater and drifted SE.
Similar low activity of white gas-and-steam emissions and few ash plumes were reported during July and August. Daily white gas-and-steam emissions rose 25-300 m above the crater and drifted in multiple directions. Three ash plumes were reported at 0843, 0851, and 0852 on 20 July that rose 500-2,000 m above the crater and drifted NW.
The MIROVA (Middle InfraRed Observation of Volcanic Activity) graph of MODIS thermal anomaly data showed intermittent low-to-moderate power thermal anomalies during May through August 2023 (figure 140). Although activity was often obscured by weather clouds, a thermal anomaly was visible in an infrared satellite image of the crater on 12 May, accompanied by an eruption plume that drifted SW (figure 141).
Geologic Background. The renowned Krakatau (frequently mis-named as Krakatoa) volcano lies in the Sunda Strait between Java and Sumatra. Collapse of an older edifice, perhaps in 416 or 535 CE, formed a 7-km-wide caldera. Remnants of that volcano are preserved in Verlaten and Lang Islands; subsequently the Rakata, Danan, and Perbuwatan cones were formed, coalescing to create the pre-1883 Krakatau Island. Caldera collapse during the catastrophic 1883 eruption destroyed Danan and Perbuwatan, and left only a remnant of Rakata. This eruption caused more than 36,000 fatalities, most as a result of tsunamis that swept the adjacent coastlines of Sumatra and Java. Pyroclastic surges traveled 40 km across the Sunda Strait and reached the Sumatra coast. After a quiescence of less than a half century, the post-collapse cone of Anak Krakatau (Child of Krakatau) was constructed within the 1883 caldera at a point between the former Danan and Perbuwatan cones. Anak Krakatau has been the site of frequent eruptions since 1927.
Information Contacts: Pusat Vulkanologi dan Mitigasi Bencana Geologi (PVMBG, also known as Indonesian Center for Volcanology and Geological Hazard Mitigation, CVGHM), Jalan Diponegoro 57, Bandung 40122, Indonesia (URL: http://www.vsi.esdm.go.id/); MAGMA Indonesia, Kementerian Energi dan Sumber Daya Mineral (URL: https://magma.esdm.go.id/v1); MIROVA (Middle InfraRed Observation of Volcanic Activity), a collaborative project between the Universities of Turin and Florence (Italy) supported by the Centre for Volcanic Risk of the Italian Civil Protection Department (URL: http://www.mirovaweb.it/); Copernicus Browser, Copernicus Data Space Ecosystem, European Space Agency (URL: https://dataspace.copernicus.eu/browser/).
Villarrica (Chile) — October 2023 Cite this Report
Villarrica
Chile
39.42°S, 71.93°W; summit elev. 2847 m
All times are local (unless otherwise noted)
Strombolian activity, gas-and-ash emissions, and crater incandescence during April-September 2023
Villarrica, in central Chile, consists of a 2-km-wide caldera that formed about 3,500 years ago and is located at the base of the presently active cone at the NW margin of a 6-km-wide caldera. Historical eruptions eruptions date back to 1558 and have been characterized by mild-to-moderate explosive activity with occasional lava effusions. The current eruption period began in December 2014 and has recently consisted of nighttime crater incandescence, ash emissions, and seismicity (BGVN 48:04). This report covers activity during April through September 2023 and describes occasional Strombolian activity, gas-and-ash emissions, and nighttime crater incandescence. Information for this report primarily comes from the Southern Andes Volcano Observatory (Observatorio Volcanológico de Los Andes del Sur, OVDAS), part of Chile's National Service of Geology and Mining (Servicio Nacional de Geología y Minería, SERNAGEOMIN) and satellite data.
Seismicity during April consisted of long period (LP) events and tremor (TRE); a total of 9,413 LP-type events and 759 TR-type events were detected throughout the month. Nighttime crater incandescence persisted and was visible in the degassing column. Sulfur dioxide data was obtained using Differential Absorption Optical Spectroscopy Equipment (DOAS) that showed an average value of 1,450 ± 198 tons per day (t/d) during 1-15 April and 1,129 ± 201 t/d during 16-30 April, with a maximum daily value of 2,784 t/d on 9 April. Gas-and-steam emissions of variable intensities rose above the active crater as high as 1.3 km above the crater on 13 April. Strombolian explosions were not observed and there was a slight decrease in the lava lake level.
There were 14,123 LP-type events and 727 TR-type events detected during May. According to sulfur dioxide measurements taken with DOAS equipment, the active crater emitted an average value of 1,826 ± 482 t/d during 1-15 May and 912 ± 41 t/d during 16-30 May, with a daily maximum value of 5,155 t/d on 13 May. Surveillance cameras showed continuous white gas-and-steam emissions that rose as high as 430 m above the crater on 27 May. Nighttime incandescence illuminated the gas column less than 300 m above the crater rim was and no pyroclastic emissions were reported. A landslide was identified on 13 May on the E flank of the volcano 50 m from the crater rim and extending 300 m away; SERNAGEOMIN noted that this event may have occurred on 12 May. During the morning of 27 and 28 May minor Strombolian explosions characterized by incandescent ejecta were recorded at the crater rim; the last reported Strombolian explosions had occurred at the end of March.
Seismic activity during June consisted of five volcano-tectonic (VT)-type events, 21,606 LP-type events, and 2,085 TR-type events. The average value of sulfur dioxide flux obtained by DOAS equipment was 1,420 ± 217 t/d during 1-15 June and 2,562 ± 804 t/d, with a maximum daily value of 4,810 t/d on 17 June. White gas-and-steam emissions rose less than 480 m above the crater; frequent nighttime crater incandescence was reflected in the degassing plume. On 12 June an emission rose 100 m above the crater and drifted NNW. On 15 June one or several emissions resulted in ashfall to the NE as far as 5.5 km from the crater, based on a Skysat satellite image. Several Strombolian explosions occurred within the crater; activity on 15 June was higher energy and ejected blocks 200-300 m on the NE slope. Surveillance cameras showed white gas-and-steam emissions rising 480 m above the crater on 16 June. On 19 and 24 June low-intensity Strombolian activity was observed, ejecting material as far as 200 m from the center of the crater to the E.
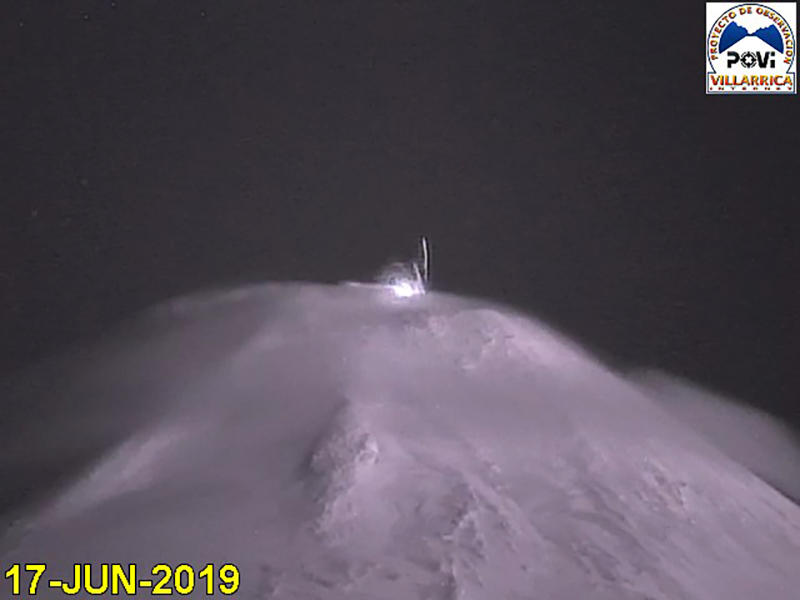
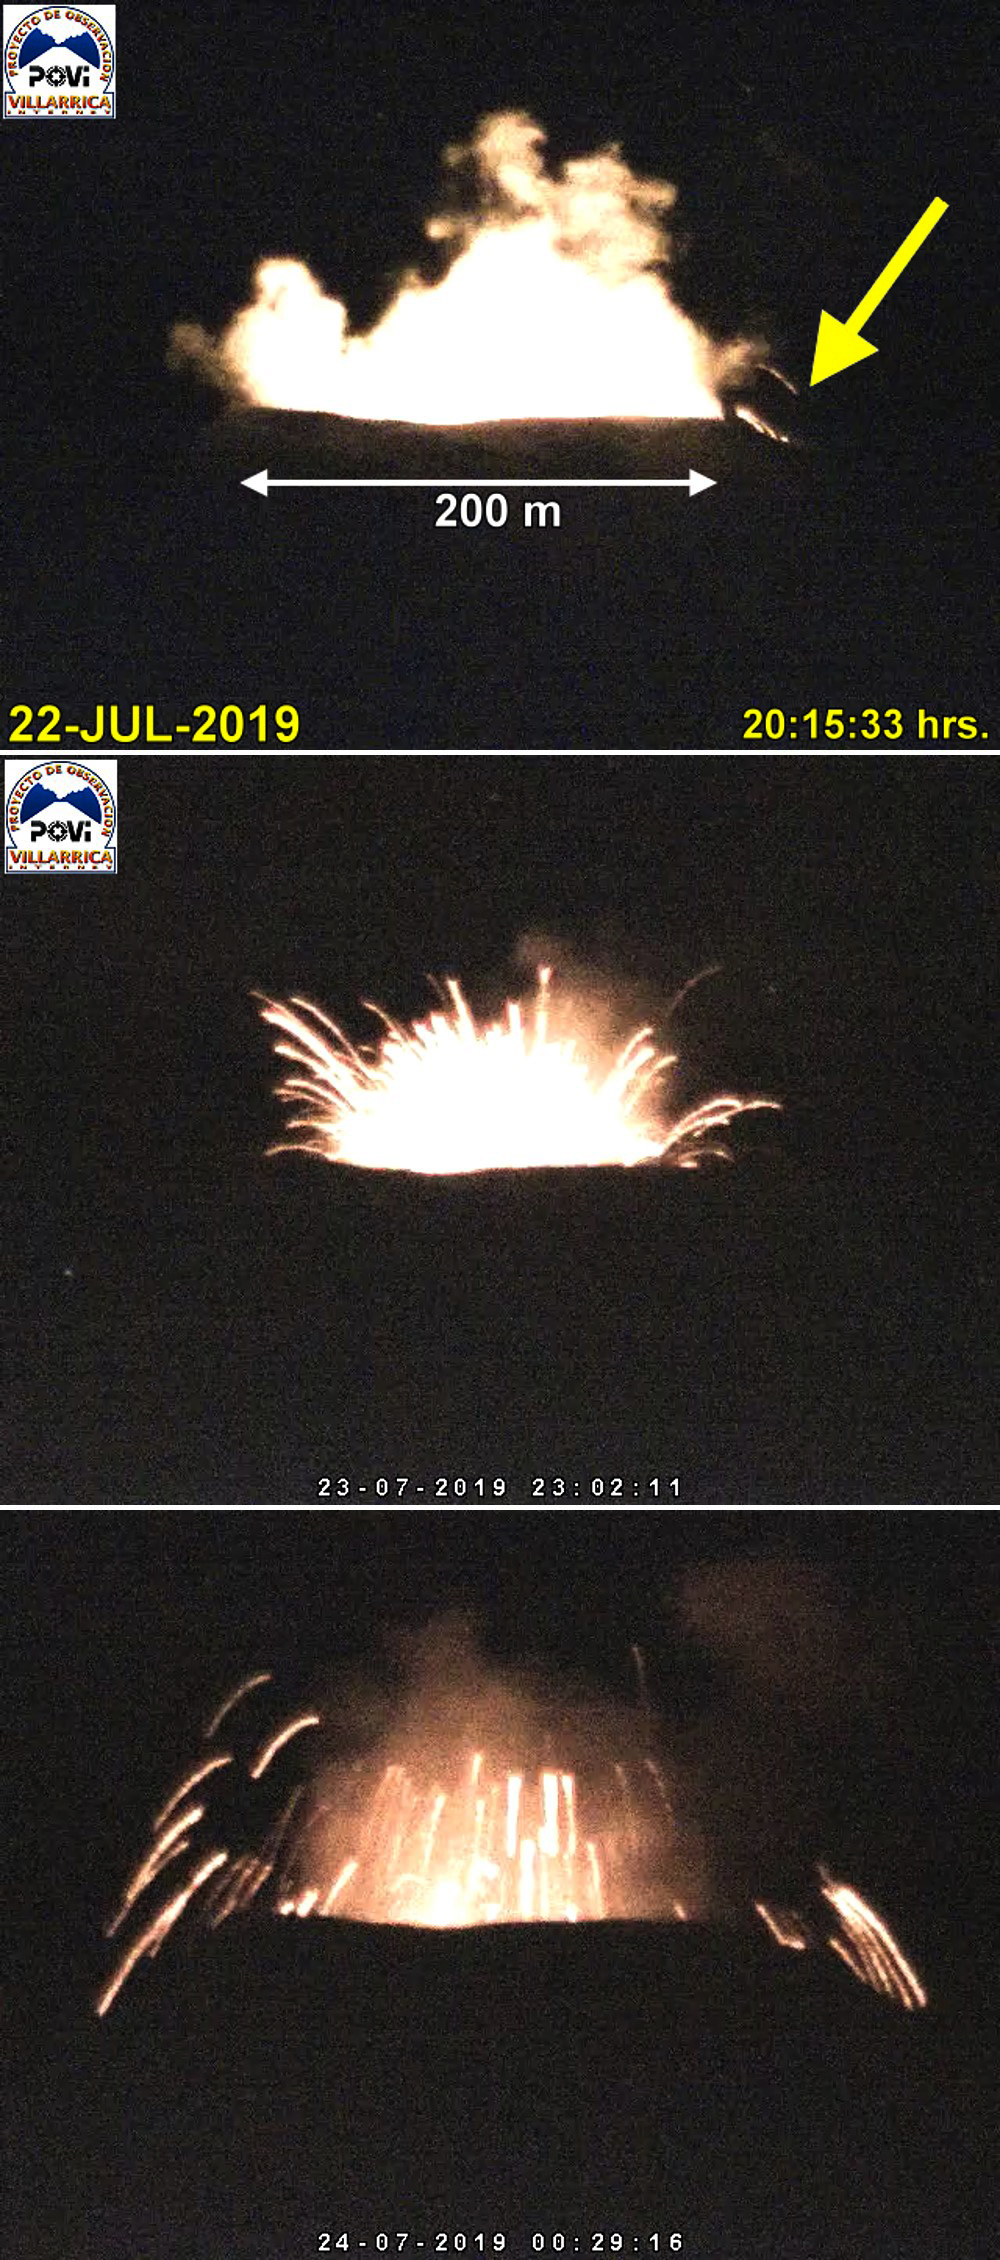
During July, seismicity included 29,319 LP-type events, 3,736 TR-type events, and two VT-type events. DOAS equipment recorded two days of sulfur dioxide emissions of 4,220 t/d and 1,009 t/d on 1 and 13 July, respectively. Constant nighttime incandescence was also recorded and was particularly noticeable when accompanied by eruptive columns on 12 and 16 July. Minor explosive events were detected in the crater. According to Skysat satellite images taken on 12, 13, and 16 July, ashfall deposits were identified 155 m S of the crater. According to POVI, incandescence was visible from two vents on the crater floor around 0336 on 12 July. Gas-and-ash emissions rose as high as 1.2 km above the crater on 13 July and drifted E and NW. A series of gas-and-steam pulses containing some ash deposited material on the upper E flank around 1551 on 13 July. During 16-31 July, average sulfur dioxide emissions of 1,679 ± 406 t/d were recorded, with a maximum daily value of 2,343 t/d on 28 July. Fine ash emissions were also reported on 16, 17, and 23 July.
Seismicity persisted during August, characterized by 27,011 LP-type events, 3,323 TR-type events, and three VT-type events. The average value of sulfur dioxide measurements taken during 1-15 August was 1,642 ± 270 t/d and 2,207 ± 4,549 t/d during 16-31 August, with a maximum daily value of 3,294 t/d on 27 August. Nighttime crater incandescence remained visible in degassing columns. White gas-and-steam emissions rose 480 m above the crater on 6 August. According to a Skysat satellite image from 6 August, ash accumulation was observed proximal to the crater and was mainly distributed toward the E slope. White gas-and-steam emissions rose 320 m above the crater on 26 August. Nighttime incandescence and Strombolian activity that generated ash emissions were reported on 27 August.
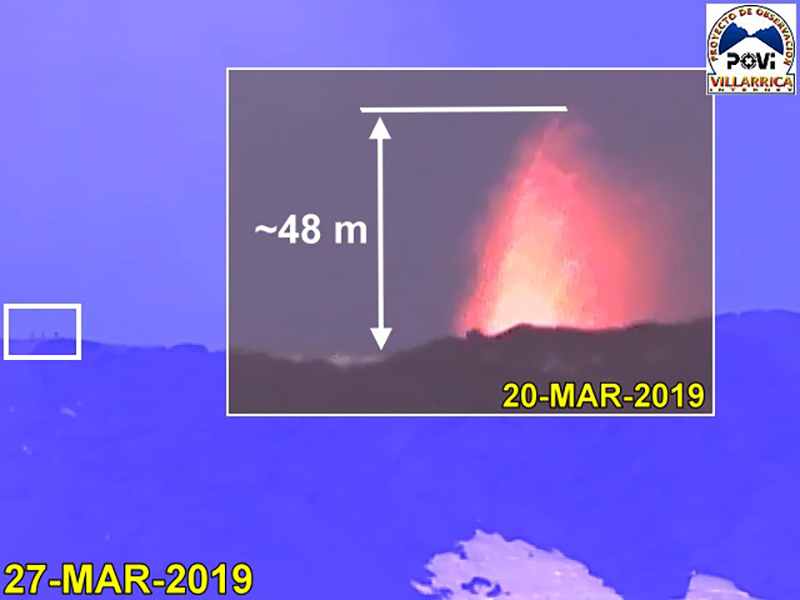
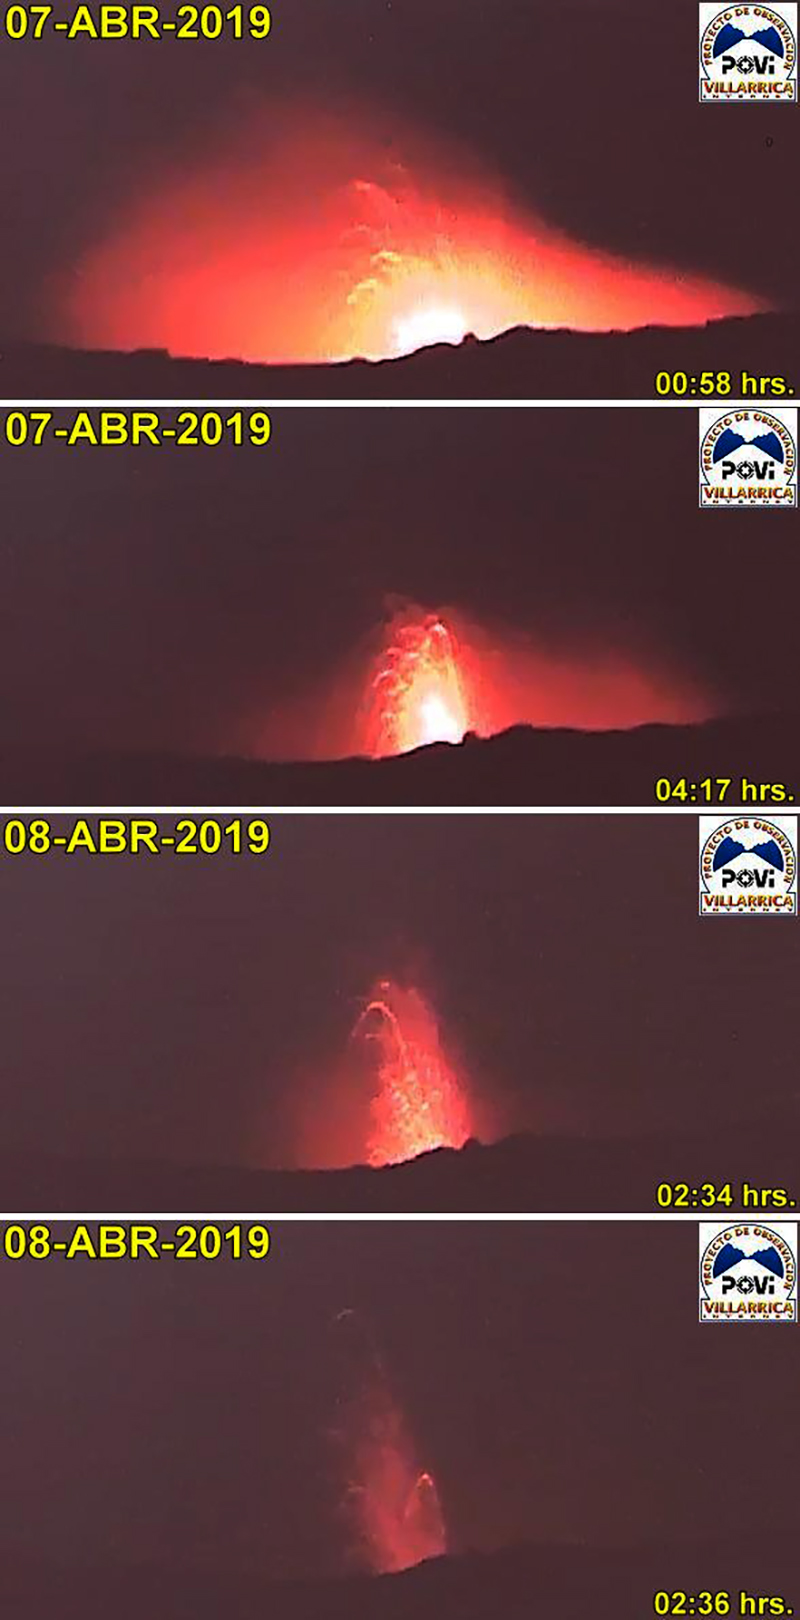
Seismicity during September was characterized by five VT-type events, 12,057 LP-type events, and 2,058 TR-type events. Nighttime incandescence persisted. On 2 September an ash emission rose 180 m above the crater and drifted SE at 1643 (figure 125) and a white gas-and-steam plume rose 320 m above the crater. According to the Buenos Aires VAAC, periods of continuous gas-and-ash emissions were visible in webcam images from 1830 on 2 September to 0110 on 3 September. Strombolian activity was observed on 2 September and during the early morning of 3 September, the latter event of which generated an ash emission that rose 60 m above the crater and drifted 100 m from the center of the crater to the NE and SW. Ashfall was reported to the SE and S as far as 750 m from the crater. The lava lake was active during 3-4 September and lava fountaining was visible for the first time since 26 March 2023, according to POVI. Fountains captured in webcam images at 2133 on 3 September and at 0054 on 4 September rose as high as 60 m above the crater rim and ejected material onto the upper W flank. Sulfur dioxide flux of 1,730 t/d and 1,281 t/d was measured on 3 and 4 September, respectively, according to data obtained by DOAS equipment.
Strong Strombolian activity and larger gas-and-ash plumes were reported during 18-20 September. On 18 September activity was also associated with energetic LP-type events and notable sulfur dioxide fluxes (as high as 4,277 t/d). On 19 September Strombolian activity and incandescence were observed. On 20 September at 0914 ash emissions rose 50 m above the crater and drifted SSE, accompanied by Strombolian activity that ejected material less than 100 m SSE, causing fall deposits on that respective flank. SERNAGEOMIN reported that a Planet Scope satellite image taken on 20 September showed the lava lake in the crater, measuring 32 m x 35 m and an area of 0.001 km2. Several ash emissions were recorded at 0841, 0910, 1251, 1306, 1312, 1315, and 1324 on 23 September and rose less than 150 m above the crater. The sulfur dioxide flux value was 698 t/d on 23 September and 1,097 t/d on 24 September. On 24 September the Volcanic Alert Level (VAL) was raised to Orange (the third level on a four-color scale). SENAPRED maintained the Alert Level at Yellow (the middle level on a three-color scale) for the communities of Villarrica, Pucón (16 km N), Curarrehue, and Panguipulli.
During 24-25 September there was an increase in seismic energy (observed at TR-events) and acoustic signals, characterized by 1 VT-type event, 213 LP-type events, and 124 TR-type events. Mainly white gas-and-steam emissions, in addition to occasional fine ash emissions were recorded. During the early morning of 25 September Strombolian explosions were reported and ejected material 250 m in all directions, though dominantly toward the NW. On 25 September the average value of sulfur dioxide flux was 760 t/d. Seismicity during 25-30 September consisted of five VT-type events, 1,937 LP-type events, and 456 TR-type events.
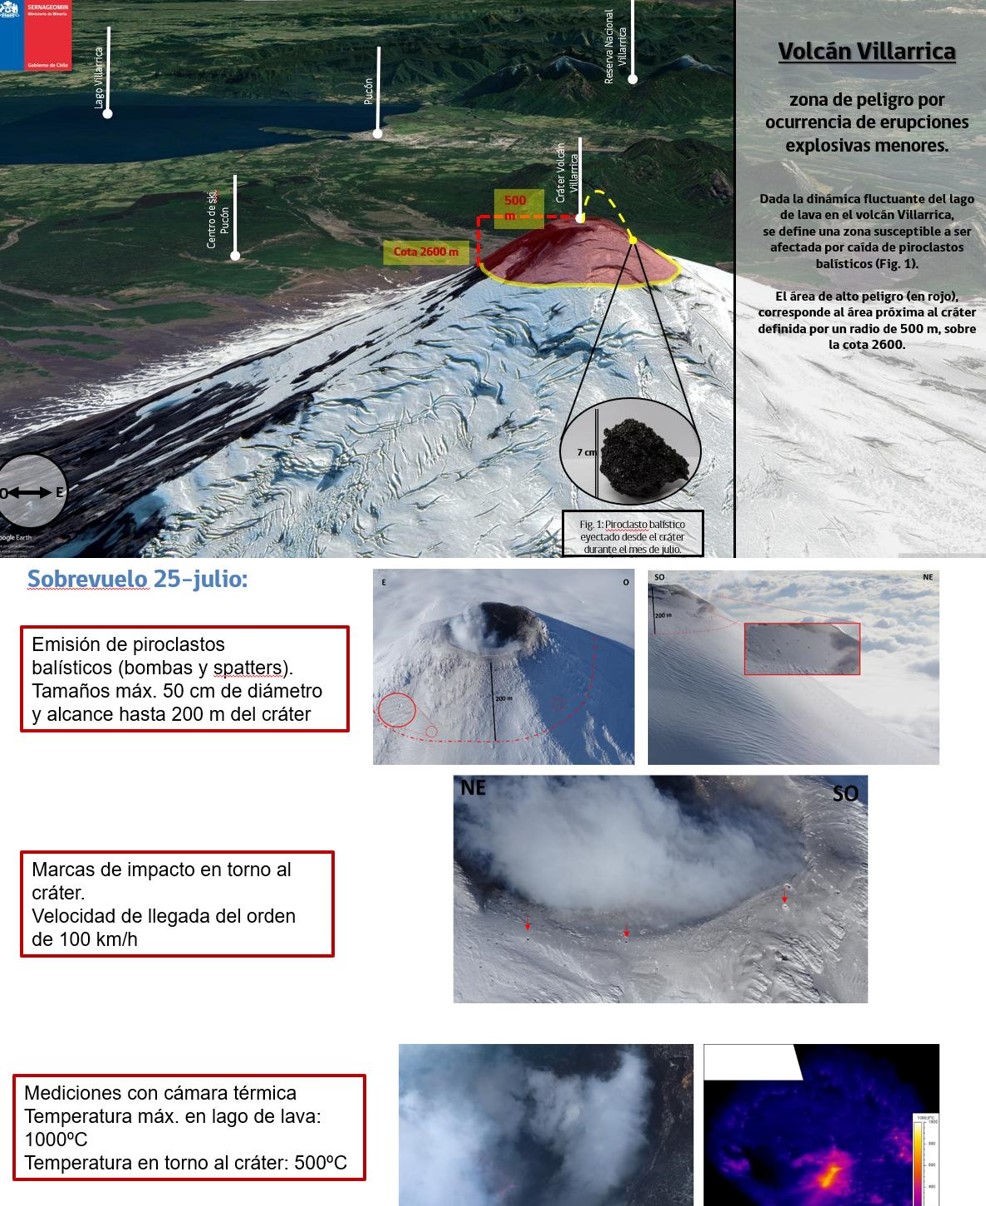
During 25-29 September moderate Strombolian activity was observed and ejected material as far as the crater rim. In addition, ash pulses lasting roughly 50 minutes were observed around 0700 and dispersed ENE. During 26-27 September a TR episode lasted 6.5 hours and was accompanied by discrete acoustic signals. Satellite images from 26 September showed a spatter cone on the crater floor with one vent that measured 10 x 14 m and a smaller vent about 35 m NE of the cone. SERNAGEOMIN reported an abundant number of bomb-sized blocks up to 150 m from the crater, as well as impact marks on the snow, which indicated explosive activity. A low-altitude ash emission was observed drifting NW around 1140 on 28 September, based on webcam images. Between 0620 and 0850 on 29 September an ash emission rose 60 m above the crater and drifted NW. During an overflight taken around 1000 on 29 September scientists observed molten material in the vent, a large accumulation of pyroclasts inside the crater, and energetic degassing, some of which contained a small amount of ash. Block-sized pyroclasts were deposited on the internal walls and near the crater, and a distal ash deposit was also visible. The average sulfur dioxide flux measured on 28 September was 344 t/d. Satellite images taken on 29 September ashfall was deposited roughly 3 km WNW from the crater and nighttime crater incandescence remained visible. The average sulfur dioxide flux value from 29 September was 199 t/d. On 30 September at 0740 a pulsating ash emission rose 1.1 km above the crater and drifted NNW (figure 126). Deposits on the S flank extended as far as 4.5 km from the crater rim, based on satellite images from 30 September.
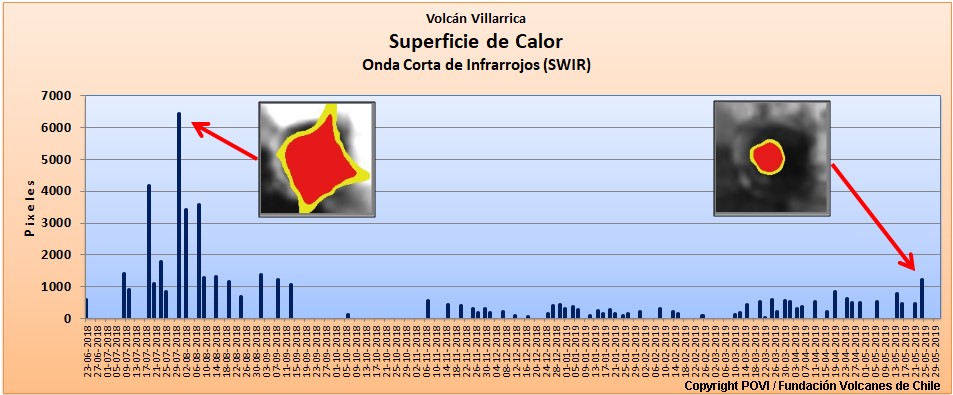
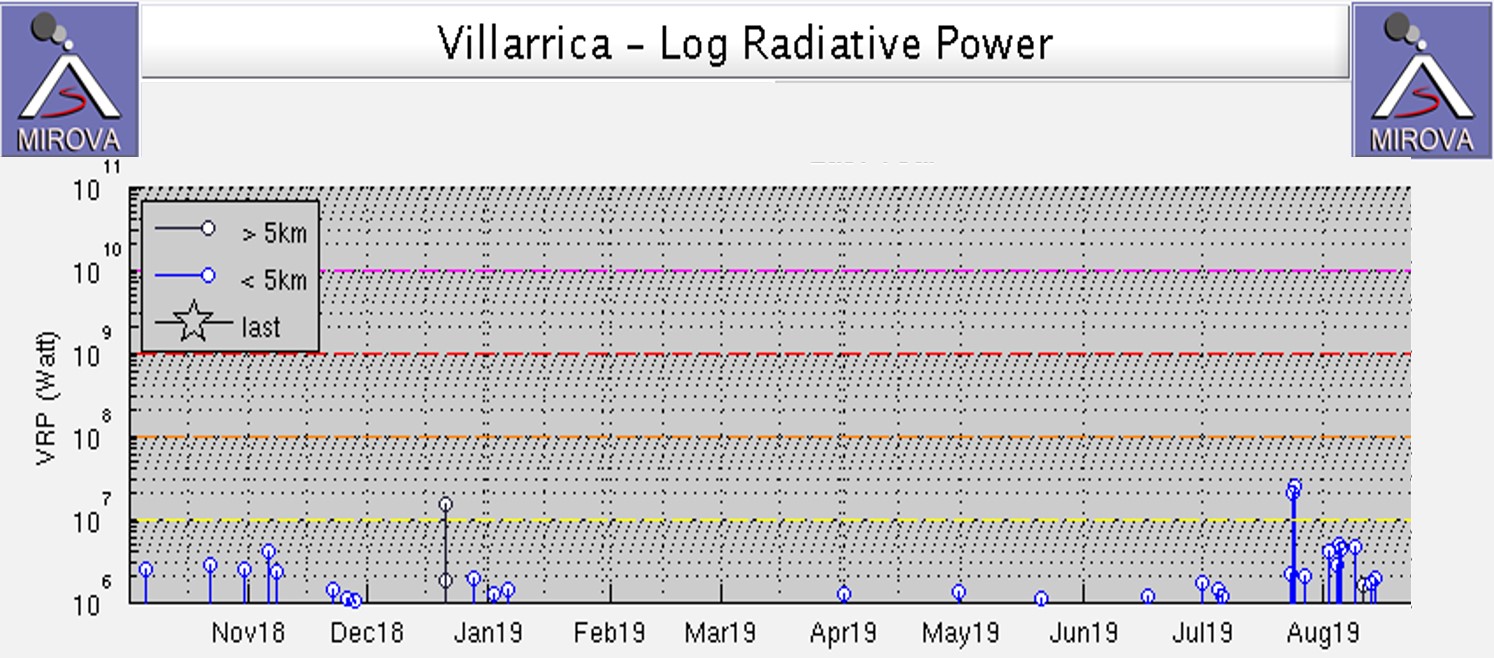
Infrared MODIS satellite data processed by MIROVA (Middle InfraRed Observation of Volcanic Activity) showed intermittent thermal activity during April through September, with slightly stronger activity detected during late September (figure 127). Small clusters of thermal activity were detected during mid-June, early July, early August, and late September. According to the MODVOLC thermal alert system, a total of four thermal hotspots were detected on 7 July and 3 and 23 September. This activity was also intermittently captured in infrared satellite imagery on clear weather days (figure 128).
Geologic Background. The glacier-covered Villarrica stratovolcano, in the northern Lakes District of central Chile, is ~15 km south of the city of Pucon. A 2-km-wide caldera that formed about 3,500 years ago is located at the base of the presently active, dominantly basaltic to basaltic andesite cone at the NW margin of a 6-km-wide Pleistocene caldera. More than 30 scoria cones and fissure vents are present on the flanks. Plinian eruptions and pyroclastic flows that have extended up to 20 km from the volcano were produced during the Holocene. Lava flows up to 18 km long have issued from summit and flank vents. Eruptions documented since 1558 CE have consisted largely of mild-to-moderate explosive activity with occasional lava effusion. Glaciers cover 40 km2 of the volcano, and lahars have damaged towns on its flanks.
Information Contacts: Servicio Nacional de Geología y Minería (SERNAGEOMIN), Observatorio Volcanológico de Los Andes del Sur (OVDAS), Avda Sta María No. 0104, Santiago, Chile (URL: http://www.sernageomin.cl/); Proyecto Observación Villarrica Internet (POVI) (URL: http://www.povi.cl/); Sistema y Servicio Nacional de Prevención y Repuesta Ante Desastres (SENAPRED), Av. Beauchef 1671, Santiago, Chile (URL: https://web.senapred.cl/); Buenos Aires Volcanic Ash Advisory Center (VAAC), Servicio Meteorológico Nacional-Fuerza Aérea Argentina, 25 de mayo 658, Buenos Aires, Argentina (URL: http://www.smn.gov.ar/vaac/buenosaires/inicio.php); MIROVA (Middle InfraRed Observation of Volcanic Activity), a collaborative project between the Universities of Turin and Florence (Italy) supported by the Centre for Volcanic Risk of the Italian Civil Protection Department (URL: http://www.mirovaweb.it/); Hawai'i Institute of Geophysics and Planetology (HIGP) - MODVOLC Thermal Alerts System, School of Ocean and Earth Science and Technology (SOEST), Univ. of Hawai'i, 2525 Correa Road, Honolulu, HI 96822, USA (URL: http://modis.higp.hawaii.edu/); Copernicus Browser, Copernicus Data Space Ecosystem, European Space Agency (URL: https://dataspace.copernicus.eu/browser/).
Merapi (Indonesia) — October 2023 Cite this Report
Merapi
Indonesia
7.54°S, 110.446°E; summit elev. 2910 m
All times are local (unless otherwise noted)
Frequent incandescent avalanches during April-September 2023
Merapi, located just north of the major city of Yogyakarta in central Java, Indonesia, has had activity within the last 20 years characterized by pyroclastic flows and lahars accompanying growth and collapse of the steep-sided active summit lava dome. The current eruption period began in late December 2020 and has more recently consisted of ash plumes, intermittent incandescent avalanches of material, and pyroclastic flows (BGVN 48:04). This report covers activity during April through September 2023, based on information from Balai Penyelidikan dan Pengembangan Teknologi Kebencanaan Geologi (BPPTKG), the Center for Research and Development of Geological Disaster Technology, a branch of PVMBG which specifically monitors Merapi. Additional information comes from the Pusat Vulkanologi dan Mitigasi Bencana Geologi (PVMBG, also known as Indonesian Center for Volcanology and Geological Hazard Mitigation, CVGHM), MAGMA Indonesia, the Darwin Volcanic Ash Advisory Centre (VAAC), and various satellite data.
Activity during April through September 2023 primarily consisted of incandescent avalanches of material that mainly affected the SW and W flanks and traveled as far as 2.3 km from the summit (table 25) and white gas-and-steam emissions that rose 10-1,000 m above the crater.
Table 25. Monthly summary of avalanches and avalanche distances recorded at Merapi during April through September 2023. The number of reported avalanches does not include instances where possible avalanches were heard but could not be visually confirmed as a result of inclement weather. Data courtesy of BPPTKG (April-September 2023 daily reports).
| Month |
Average number of avalanches per day |
Distance avalanches traveled (m) |
| Apr 2023 |
19 |
1,200-2,000 |
| May 2023 |
22 |
500-2,000 |
| Jun 2023 |
18 |
1,200-2,000 |
| Jul 2023 |
30 |
300-2,000 |
| Aug 2023 |
25 |
400-2,300 |
| Sep 2023 |
23 |
600-2,000 |
BPPTKG reported that during April and May white gas-and-steam emissions rose 10-750 m above the crater, incandescent avalanches descended 500-2,000 m on the SW and W flanks (figure 135). Cloudy weather often prevented clear views of the summit, and sometimes avalanches could not be confirmed. According to a webcam image, a pyroclastic flow was visible on 17 April at 0531. During the week of 28 April and 4 May a pyroclastic flow was reported on the SW flank, traveling up to 2.5 km. According to a drone overflight taken on 17 May the SW lava dome volume was an estimated 2,372,800 cubic meters and the dome in the main crater was an estimated 2,337,300 cubic meters.
During June and July similar activity persisted with white gas-and-steam emissions rising 10-350 m above the crater and frequent incandescent avalanches that traveled 300-2,000 m down the SW, W, and S flanks (figure 136). Based on an analysis of aerial photos taken on 24 June the volume of the SW lava dome was approximately 2.5 million cubic meters. A pyroclastic flow was observed on 5 July that traveled 2.7 km on the SW flank. According to the Darwin VAAC multiple minor ash plumes were identified in satellite images on 19 July that rose to 3.7 km altitude and drifted S and SW. During 22, 25, and 26 July a total of 17 avalanches descended as far as 1.8 km on the S flank.
Frequent white gas-and-steam emissions continued during August and September, rising 10-450 m above the crater. Incandescent avalanches mainly affected the SW and W flanks and traveled 400-2,300 m from the vent (figure 137). An aerial survey conducted on 10 August was analyzed and reported that estimates of the SW dome volume was 2,764,300 cubic meters and the dome in the main crater was 2,369,800 cubic meters.
Frequent and moderate-power thermal activity continued throughout the reporting period, according to a MIROVA (Middle InfraRed Observation of Volcanic Activity) analysis of MODIS satellite data (figure 138). There was an increase in the number of detected anomalies during mid-May. The MODVOLC thermal algorithm recorded a total of 47 thermal hotspots: six during April, nine during May, eight during June, 15 during July, four during August, and five during September. Some of this activity was captured in infrared satellite imagery on clear weather days, sometimes accompanied by incandescent material on the SW flank (figure 139).
Geologic Background. Merapi, one of Indonesia's most active volcanoes, lies in one of the world's most densely populated areas and dominates the landscape immediately north of the major city of Yogyakarta. It is the youngest and southernmost of a volcanic chain extending NNW to Ungaran volcano. Growth of Old Merapi during the Pleistocene ended with major edifice collapse perhaps about 2,000 years ago, leaving a large arcuate scarp cutting the eroded older Batulawang volcano. Subsequent growth of the steep-sided Young Merapi edifice, its upper part unvegetated due to frequent activity, began SW of the earlier collapse scarp. Pyroclastic flows and lahars accompanying growth and collapse of the steep-sided active summit lava dome have devastated cultivated lands on the western-to-southern flanks and caused many fatalities.
Information Contacts: Balai Penyelidikan dan Pengembangan Teknologi Kebencanaan Geologi (BPPTKG), Center for Research and Development of Geological Disaster Technology (URL: http://merapi.bgl.esdm.go.id/, Twitter: @BPPTKG); MAGMA Indonesia, Kementerian Energi dan Sumber Daya Mineral (URL: https://magma.esdm.go.id/v1); Pusat Vulkanologi dan Mitigasi Bencana Geologi (PVMBG, also known as Indonesian Center for Volcanology and Geological Hazard Mitigation, CVGHM), Jalan Diponegoro 57, Bandung 40122, Indonesia (URL: http://www.vsi.esdm.go.id/); Darwin Volcanic Ash Advisory Centre (VAAC), Bureau of Meteorology, Northern Territory Regional Office, PO Box 40050, Casuarina, NT 0811, Australia (URL: http://www.bom.gov.au/info/vaac/); MIROVA (Middle InfraRed Observation of Volcanic Activity), a collaborative project between the Universities of Turin and Florence (Italy) supported by the Centre for Volcanic Risk of the Italian Civil Protection Department (URL: http://www.mirovaweb.it/); Hawai'i Institute of Geophysics and Planetology (HIGP) - MODVOLC Thermal Alerts System, School of Ocean and Earth Science and Technology (SOEST), Univ. of Hawai'i, 2525 Correa Road, Honolulu, HI 96822, USA (URL: http://modis.higp.hawaii.edu/); Copernicus Browser, Copernicus Data Space Ecosystem, European Space Agency (URL: https://dataspace.copernicus.eu/browser/); Øystein Lund Andersen (URL: https://www.oysteinlundandersen.com/, https://twitter.com/oysteinvolcano).
Ebeko
Russia
50.686°N, 156.014°E; summit elev. 1103 m
All times are local (unless otherwise noted)
Moderate explosive activity with ash plumes continued during June-November 2023
Ebeko, located on the N end of Paramushir Island in Russia’s Kuril Islands just S of the Kamchatka Peninsula, consists of three summit craters along a SSW-NNE line at the northern end of a complex of five volcanic cones. Observed eruptions date back to the late 18th century and have been characterized as small-to-moderate explosions from the summit crater, accompanied by intense fumarolic activity. The current eruptive period began in June 2022, consisting of frequent explosions, ash plumes, and thermal activity (BGVN 47:10, 48:06). This report covers similar activity during June-November 2023, based on information from the Kamchatka Volcanic Eruptions Response Team (KVERT) and satellite data.
Moderate explosive activity continued during June-November 2023 (figures 50 and 51). According to visual data from Severo-Kurilsk, explosions sent ash 2-3.5 km above the summit (3-4.5 km altitude) during most days during June through mid-September. Activity after mid-September was slightly weaker, with ash usually reaching less than 2 km above the summit. According to KVERT the volcano in October and November was, with a few exceptions, either quiet or obscured by clouds that prevented satellite observations. KVERT issued Volcano Observatory Notices for Aviation (VONA) on 8 and 12 June, 13 and 22 July, 3 and 21 August, and 31 October warning of potential aviation hazards from ash plumes drifting 3-15 km from the volcano. Based on satellite data, KVERT reported a persistent thermal anomaly whenever weather clouds permitted viewing.
Geologic Background. The flat-topped summit of the central cone of Ebeko volcano, one of the most active in the Kuril Islands, occupies the northern end of Paramushir Island. Three summit craters located along a SSW-NNE line form Ebeko volcano proper, at the northern end of a complex of five volcanic cones. Blocky lava flows extend west from Ebeko and SE from the neighboring Nezametnyi cone. The eastern part of the southern crater contains strong solfataras and a large boiling spring. The central crater is filled by a lake about 20 m deep whose shores are lined with steaming solfataras; the northern crater lies across a narrow, low barrier from the central crater and contains a small, cold crescentic lake. Historical activity, recorded since the late-18th century, has been restricted to small-to-moderate explosive eruptions from the summit craters. Intense fumarolic activity occurs in the summit craters, on the outer flanks of the cone, and in lateral explosion craters.
Information Contacts: Kamchatka Volcanic Eruptions Response Team (KVERT), Far Eastern Branch, Russian Academy of Sciences, 9 Piip Blvd., Petropavlovsk-Kamchatsky, 683006, Russia (URL: http://www.kscnet.ru/ivs/kvert/).
Search Bulletin Archive by Publication Date
Select a month and year from the drop-downs and click "Show Issue" to have that issue displayed in this tab.
The default month and year is the latest issue available.
Bulletin of the Global Volcanism Network - Volume 44, Number 09 (September 2019)
Managing Editor: Edward Venzke
Asamayama (Japan)
Ashfall from phreatic eruptions on 7 and 25 August 2019
Lengai, Ol Doinyo (Tanzania)
Multiple lava flows within the summit crater, September 2018-August 2019
Popocatepetl (Mexico)
Frequent explosions continue during March-August 2019
Santa Maria (Guatemala)
Persistent explosions with local ashfall, March-August 2019; frequent lahars during June; increased explosions in early July
Semeru (Indonesia)
Intermittent activity continues during March-August 2019; ash plumes and thermal anomalies
Semisopochnoi (United States)
Small explosions detected between 16 July and 24 August 2019
Stromboli (Italy)
Major explosions on 3 July and 28 August 2019; hiker killed by ejecta
Ubinas (Peru)
Intermittent ash explosions in June-August 2019
Ulawun (Papua New Guinea)
Explosions on 26 June and 3 August 2019 send plumes above 19 km altitude
Villarrica (Chile)
Strombolian activity continued during March-August 2019 with an increase in July
Asamayama (Japan) — September 2019 Cite this Report
Asamayama
Japan
36.406°N, 138.523°E; summit elev. 2568 m
All times are local (unless otherwise noted)
Ashfall from phreatic eruptions on 7 and 25 August 2019
Asamayama (also known as Asama), located in the Kanto-Chubu Region of Japan, previously erupted in June 2015. Activity included increased volcanic seismicity, small eruptions which occasionally resulted in ashfall, and SO2 gas emissions (BGVN 41:10). This report covers activity through August 2019, which describes small phreatic eruptions, volcanic seismicity, faint incandescence and commonly white gas plumes, and fluctuating SO2 emissions. The primary source of information for this report is provided by the Japan Meteorological Agency (JMA).
Activity during October 2016-May 2019. From October 2016 through December 2017, a high-sensitivity camera captured faint incandescence at night accompanied by white gas plumes rising above the crater to an altitude ranging 100-800 m (figure 44). A thermal anomaly and faint incandescence accompanied by a white plume near the summit was observed at night on 6-7 and 21 January 2017. These thermal anomalies were recorded near the central part of the crater bottom in January, February, and November 2017, and in May 2019. After December 2017 the faint incandescence was not observed, with an exception on 18 July 2018.
Field surveys on 6, 16, and 28 December 2016 reported an increased amount of SO2 gas emissions from November 2016 (100-600 tons/day) to March 2017 (1,300-3,200 tons/day). In April 2017 the SO2 emissions decreased (600-1,500 tons/day). Low-frequency shallow volcanic tremors decreased in December 2016; none were observed in January 2017. From February 2017 through June 2018 volcanic tremors occurred more intermittently. According to the monthly JMA Reports on February 2017 and December 2018 and data from the Geographical Survey Institute's Global Navigation Satellite Systems (GNSS), a slight inflation between the north and south baseline was recorded starting in fall 2016 through December 2018. This growth become stagnant at some of the baselines in October 2017.
Activity during August 2019. On 7 August 2019 a small phreatic eruption occurred at the summit crater and continued for about 20 minutes, resulting in an ash plume that rose to a maximum altitude of 1.8 km, drifting N and an associated earthquake and volcanic tremor (figure 45). According to the Tokyo Volcanic Ash Advisory (VAAC), this plume rose 4.6 km, based on satellite data from HIMAWARI-8. A surveillance camera observed a large volcanic block was ejected roughly 200 m from the crater. According to an ashfall survey conducted by the Mobile Observation Team on 8 August, slight ashfall occurred in the Tsumagoi Village (12 km N) and Naganohara Town (19 km NE), Gunma Prefecture (figure 46 and 47). About 2 g/m2 of ash deposit was measured by the Tokyo Institute of Technology. Immediately after the eruption on 7 August, seismicity, volcanism, and SO2 emissions temporarily increased and then decreased that same day.
Another eruption at the summit crater on 25 August 2019 was smaller than the one on 7 August. JMA reported the resulting ash plume rose to an altitude of 600 m and drifted E. However, the Tokyo VAAC reported that the altitude of the plume up to 3.4 km, according to satellite data from HIMAWARI-8. A small amount of ashfall occurred in Karuizawa-machi, Nagano (4 km E), according to interview surveys and the Tokyo Institute of Technology.
Geologic Background. Asamayama, Honshu's most active volcano, overlooks the resort town of Karuizawa, 140 km NW of Tokyo. The volcano is located at the junction of the Izu-Marianas and NE Japan volcanic arcs. The modern Maekake cone forms the summit and is situated east of the remnant of an older andesitic volcano, Kurofuyama, which was destroyed by a late-Pleistocene landslide about 20,000 years before present (BP). Growth of a dacitic shield volcano was accompanied by pumiceous pyroclastic flows, the largest of which occurred about 14,000-11,000 BP, and by growth of the Ko-Asamayama lava dome on the east flank. Maekake, capped by the Kamayama pyroclastic cone that forms the present summit, is probably only a few thousand years old and has observed activity dating back at least to the 11th century CE. Maekake has had several major Plinian eruptions, the last two of which occurred in 1108 (Asamayama's largest Holocene eruption) and 1783 CE.
Information Contacts: Japan Meteorological Agency (JMA), 1-3-4 Otemachi, Chiyoda-ku, Tokyo 100-8122, Japan (URL: http://www.jma.go.jp/jma/indexe.html); Tokyo Volcanic Ash Advisory Center (VAAC), 1-3-4 Otemachi, Chiyoda-ku, Tokyo 100-8122, Japan (URL: http://ds.data.jma.go.jp/svd/vaac/data/).
Ol Doinyo Lengai (Tanzania) — September 2019 Cite this Report
Ol Doinyo Lengai
Tanzania
2.764°S, 35.914°E; summit elev. 2962 m
All times are local (unless otherwise noted)
Multiple lava flows within the summit crater, September 2018-August 2019
Frequent historical eruptions from Tanzania's Ol Doinyo Lengai have been recorded since the late 19th century. Located near the southern end of the East African Rift in the Gregory Rift Valley, the unique low-temperature carbonatitic lavas have been the focus of numerous volcanological studies; the volcano has also long been a cultural icon central to the Maasai people who live in the region. Following explosive eruptions in the mid-1960s and early 1980s the volcano entered a phase of effusive activity with the effusion of small, fluid, natrocarbonatitic lava flows within its active north summit crater. From 1983 to early 2007 the summit crater was the site of numerous often-changing hornitos (or spatter cones) and lava flows that slowly filled the crater. Lava began overflowing various flanks of the crater in 1993; by 2007 most flanks had been exposed to flows from the crater.
Seismic and effusive activity increased in mid-2007, and a new phase of explosive activity resumed in September of that year. The explosive activity formed a new pyroclastic cone inside the crater; repeated ash emissions reached altitudes greater than 10 km during March 2008, causing relocation of several thousand nearby villagers. Explosive activity diminished by mid-April 2008; by September new hornitos with small lava flows were again forming on the crater floor. Periodic eruptions of lava from fissures, spatter cones, and hornitos within the crater were witnessed throughout the next decade by scientists and others occasionally visiting the summit. Beginning in 2017, satellite imagery has become a valuable data source, providing information about both the thermal activity and the lava flows in the form of infrared imagery and the color contrast of black fresh lava and whiter cooled lava that is detectable in visible imagery (BGVN 43:10). The latest expeditions in 2018 and 2019 have added drone technology to the research tools. This report covers activity from September 2018 through August 2019 with data and images provided from satellite information and from researchers and visitors to the volcano.
Summary and data from satellite imagery. Throughout September 2018 to August 2019, evidence for repeated small lava flows was recorded in thermal data, satellite imagery, and from a few visits to or overflights of the summit crater by researchers. Intermittent low-level pulses of thermal activity appeared in MIROVA data a few times during the period (figure 187). Most months, Sentinel-2 satellite imagery generated six images with varying numbers of days that had a clear view of the summit and showed black and white color contrasts from fresh and cooled lava and/or thermal anomalies (table 27, figures 188-191). Lava flows came from multiple source vents within the crater, produced linear flows, and covered large areas of the crater floor. Thermal anomalies were located in different areas of the crater; multiple anomalies from different source vents were visible many months.
Table 27. The number of days each month with Sentinel-2 images of Ol Doinyo Lengai, days with clear views of the summit showing detectable color contrasts between black and white lava, and days with detectable thermal anomalies within the summit crater. A clear summit means more than half the summit visible or features identifiable through diffuse cloud cover. Information courtesy of Sentinel Hub Playground.
| Month |
Sentinel-2 Images |
Clear Summit with Lava Color Contrasts |
Thermal anomalies |
| Sep 2018 |
6 |
5 |
5 |
| Oct 2018 |
7 |
4 |
3 |
| Nov 2018 |
6 |
2 |
0 |
| Dec 2018 |
5 |
1 |
1 |
| Jan 2019 |
6 |
5 |
3 |
| Feb 2019 |
6 |
5 |
6 |
| Mar 2019 |
6 |
5 |
5 |
| Apr 2019 |
6 |
1 |
0 |
| May 2019 |
6 |
3 |
2 |
| Jun 2019 |
6 |
3 |
3 |
| Jul 2019 |
6 |
5 |
5 |
| Aug 2019 |
6 |
5 |
3 |
Information from site visits and overflights. Minor steam and gas emissions were visible from the summit crater during an overflight on 29 September 2018. Geologist Cin-Ty Lee captured excellent images of the W flank on 20 October 2018 (figure 192). The large circular crater at the base of the flank is the 'Oldoinyo' Maar (Graettinger, 2018a and 2018b). A view into the crater from an overflight that day (figure 193) showed clear evidence of at least five areas of dark, fresh lava. An effusive eruption was visible on the crater floor on 2 March 2019 (figure 194).
Research expedition in July-August 2019. In late July and early August 2019 an expedition, sponsored by the Deep Carbon Observatory (DCO) and led by researchers Kate Laxton and Emma Liu (University College London), made gas measurements, collected lava samples for the first time in 12 years, and deployed drones to gather data and images. The Ol Doinyo Lengai sampling team included Papkinye Lemolo, Boni Kicha, Ignas Mtui, Boni Mawe, Amedeus Mtui, Emma Liu, Arno Van Zyl, Kate Laxton, and their driver, Baraka. They collected samples by lowering devices via ropes and pulleys into the crater and photographed numerous active flows emerging from vents and hornitos on the crater floor (figure 195). By analyzing the composition of the first lava samples collected since the volcano's latest explosive activity in 2007, they hope to learn about recent changes to its underground plumbing system. A comparison of the satellite image taken on 28 July with a drone image of the summit crater taken by them the next day (figure 196) confirms the effectiveness of both the satellite imagery in identifying new flow features on the crater floor, and the drone imagery in providing outstanding details of activity.
With the drone technology, they were able to make close-up observations of features on the north crater floor such as the large hornito on the inner W wall of the crater (figure 197), an active lava pond near the center of the crater (figure 198), and several flows resurfacing the floor of the crater while they were there (figure 199). A large crack that rings the base of the N cone had enlarged significantly since last measured in 2014 (figure 200).
The color of the flows on the crater floor changed from grays and browns to blues and greens after a night of rainfall on 31 July 2019 (figure 201). Much of the lava pond surface was crusted over that day, but the large hornito in the NW quadrant was still active (figure 202), and both the pond and another hornito produced flows that merged onto the crater floor (figure 203).
On 1 August 2019 much of the crater floor was resurfaced by a brown lava that flowed from a hornito E of the lava pond (figure 204). Images of unusual, ephemeral features such as "spatter pots," "frozen jets," and "frothy flows" (figure 205) help to characterize the unusual magmatic activity at this unique volcano (figure 206).
References: Graettinger, A. H., 2018a, MaarVLS database version 1, (URL: https://vhub.org/resources/4365).
Graettinger, A. H., 2018b, Trends in maar crater size and shape using the global Maar Volcano Location and Shape (MaarVLS) database. Journal of Volcanology and Geothermal Research, v. 357, p. 1-13. https://doi.org/10.1016/j.jvolgeores.2018.04.002.
Geologic Background. The symmetrical Ol Doinyo Lengai is the only volcano known to have erupted carbonatite tephras and lavas in historical time. The prominent stratovolcano, known to the Maasai as "The Mountain of God," rises abruptly above the broad plain south of Lake Natron in the Gregory Rift Valley. The cone-building stage ended about 15,000 years ago and was followed by periodic ejection of natrocarbonatitic and nephelinite tephra during the Holocene. Historical eruptions have consisted of smaller tephra ejections and emission of numerous natrocarbonatitic lava flows on the floor of the summit crater and occasionally down the upper flanks. The depth and morphology of the northern crater have changed dramatically during the course of historical eruptions, ranging from steep crater walls about 200 m deep in the mid-20th century to shallow platforms mostly filling the crater. Long-term lava effusion in the summit crater beginning in 1983 had by the turn of the century mostly filled the northern crater; by late 1998 lava had begun overflowing the crater rim.
Information Contacts: Cin-Ty Lee, Department of Earth, Environmental and Planetary Sciences, Rice University, 6100 Main St., Houston, TX 77005-1827, USA (URL: https://twitter.com/CinTyLee1, images at https://twitter.com/CinTyLee1/status/1054337204577812480, https://earthscience.rice.edu/directory/user/106/); Emma Liu, University College London, UCL Hazards Centre (Volcanology), Gower Street, London, WC1E 6BT, United Kingdom (URL: https://twitter.com/EmmaLiu31, https://www.ucl.ac.uk/earth-sciences/people/academic/dr-emma-liu); Kate Laxton, University College London, UCL Earth Sciences, Gower Street, London, WC1E 6BT, United Kingdom (URL: https://twitter.com/KateLaxton, https://www.ucl.ac.uk/earth-sciences/people/research-students/kate-laxton); Deep Carbon Observatory, Carnegie Institution for Science, 5251 Broad Branch Road NW, Washington, DC 20015-1305, USA (URL: https://deepcarbon.net/field-report-ol-doinyo-lengai-volcano-tanzania); Sentinel Hub Playground (URL: https://www.sentinel-hub.com/explore/sentinel-playground); MIROVA (Middle InfraRed Observation of Volcanic Activity), a collaborative project between the Universities of Turin and Florence (Italy) supported by the Centre for Volcanic Risk of the Italian Civil Protection Department (URL: http://www.mirovaweb.it/); Aman Laizer, Volcanologist, Arusha, Tanzania (URL: https://twitter.com/amanlaizerr, image at https://twitter.com/amanlaizerr/status/1102483717384216576).
Popocatepetl (Mexico) — September 2019 Cite this Report
Popocatepetl
Mexico
19.023°N, 98.622°W; summit elev. 5393 m
All times are local (unless otherwise noted)
Frequent explosions continue during March-August 2019
The current eruptive period of Popocatépetl began on 9 January 2005 and it has since been producing frequent explosions accompanied by ash plumes, gas emissions, and ballistic ejecta that can impact several kilometers away from the crater, as well as dome growth and destruction. This activity continued through March-August 2019 with an increase in volcano alert level during 28 March-6 May. This report summarizes activity during this period and is based on information from Centro Nacional de Prevención de Desastres (CENAPRED), Universidad Nacional Autónoma de México (UNAM), and various webcam and remote sensing data.
An overflight on 28 February confirmed that dome 82, which was first observed on 14 February, was still present and was 200 m in diameter. During March there were 3,291 observed low-intensity emissions, and 33 larger explosions that produced ash plumes to a maximum height of 5 km, accompanied by near-continuous emission of water vapor and volcanic gases. Explosions ejected blocks that fell on the flanks out to 1.2-2 km on 1, 10, 13, 17, 26, 27, and 29 March. The events on the 17th and 27th resulted in vegetation fires. Frequent sulfur dioxide (SO2) plumes were detected by TropOMI (figure 130). An overflight on 7 March showed intense degassing and an ash plume at 1142, preventing visibility into the crater (figure 131). On 13 March Strombolian activity was observed for approximately 15 minutes at 0500, accompanied by incandescent ejecta that deposited mainly on the ESE flank.
An overflight on 15 March was taken by CENAPRED and UNAM personnel to observe changes to the crater after explosions on the 13th and 14th. They reported that dome 82 had been destroyed and the crater maintained its previous dimensions of 300 m in diameter and 130 m deep. An explosion on the 27th ejected incandescent rocks out to 2 km from the crater and produced a 3-km-high ash plume that dispersed to the NE. Ashfall was reported in Santa Cruz, Atlixco, San Pedro, San Andrés, Santa Isabel Cholula, San Pedro Benito Juárez, and in the municipalities of Puebla, Hueyapan, Tetela del Volcán, and Morelos.
On 28 March an explosion at 0650 generated a 2.5-km-high ash plume and ejecta out to 1 km from the crater, and a 130-minute-long event produced gas and ah plumes (figure 132). On this day the volcano alert level was increased from Yellow Phase 2 to Yellow Phase 3. On the 29th an ash plume rose to 3 km and was accompanied by ejecta that reached 2 km away from the crater. Later that day a 20-minute-long event produced ash and gas. During a surveillance flight on 30 March a view into the crater showed no dome present, and the crater size had increased to 350 m in width and 250-300 m in depth after recent explosions (figure 131). On this day Strombolian activity was also observed lasting for 14 minutes, producing an ash plume to 800 m and ejecta out to 300 m from the crater. Incandescence at the crater was often seen during nighttime throughout the month.
There was a decrease in events during the next two months with 1,119 recorded low-intensity emissions and no larger ash explosions throughout April, followed by 1,210 low-intensity emissions and seven larger ash explosions through May (figure 133). Water vapor and volcanic gas emissions were frequently observed through this time and incandescence was observed some nights. A surveillance overflight on 26 April noted no new dome within the crater. On 6 May the alert level was lowered back to Yellow Phase 2. Another overflight on 9 May showed no change in the crater. An explosion at 1910 on 22 May produced an ash plume to 3.5 km above the crater with ashfall reported in Ozumba, Temamatla, Atlautla, Cocotitlán, Ayapango, Ecatzingo, Tenango del Aire and Tepetlixpa.
Through the month of June there were 2,820 low-intensity emissions and 21 larger ash explosions recorded. Gas emissions were observed throughout the month. Two explosions on 3 June produced ash plumes up to 3.5 and 2.8 km, with ejecta out to 2 km S during the first explosion. On 11 June an explosion produced an ash plume to 1 km above the crater and ballistic ejecta out to 1 km E. Observers on a surveillance overflight on the 12th reported no changes within the crater
Explosions with estimated plume heights of 5 km occurred on the 14th and 15th, with the latter producing ashfall in the municipalities of San Pablo del Monte, Tenancingo, Papantla, San Cosme Mazatencocho, San Luis Teolocholco, Acuamanala, Nativitas, Tepetitla, Santa Apolonia Teacalco, Santa Isabel Tetlatlahuaca, and Huamantla, in the state of Tlaxcala, as well as in Nealtican, San Nicolás de los Ranchos, Calpan, San Pedro Cholula, Juan C. Bonilla, Coronango, Atoyatempan, and Coatzingo, in the state of Puebla.
On 17 June an explosion produced an ash plume that reached 8 km above the crater and dispersed towards the SW. An ash plume rising 2.5 km high was accompanied by incandescent ejecta impacting a short distance from the crater on the 21st, and another ash plume reached 2.5 km on the 22nd. Explosions on 26, 29, and 30 June resulted in ash plumes reaching 1.5 km above the crater and ballistic ejecta impacting on the flanks out to 1 km.
For the month of July there was an increased total of 5,637 recorded low-intensity emissions, and 173 larger ash explosions (figure 134). On 8 July an explosion produced ballistic ejecta out to 1.5 km and an ash plume up to 1 km above the crater. An ash plume up to 2.6 km was produced on the 12th. On 19 July a surveillance overflight observed a new dome (dome 83) with a diameter of 70 m and a thickness of 15 m (figure 135). Explosions on 20 July produced ashfall, and minor explosions that ejected incandescent ballistics onto the slopes. An event on the 24th produced an ash plume that reached 1.2 km, and ash plumes the following day reached 1 km. An overflight on 27 July confirmed that these explosions destroyed dome 83, and the crater dimensions remained the same (figure 136). The following day, ash plumes reached up to 1.6 km above the crater, and up to 2 km on the 29th. Minor ashfall was reported in the municipality of Ozumba on 30 June.
Throughout August the number of recorded events was higher than previous months, with 5,091 low-intensity emissions and 204 larger ash explosions (figure 137). Two explosions generated ash plumes and incandescent ejecta on 2 August, the first with a plume up to 1.5 km with ejecta impacting the slopes, and the second with an 800 m plume and ejecta landing back in the crater. Ashfall from the events was reported in in the municipalities of Tenango del Aire, Ayapango and Amecameca. On the 14th ashfall was reported in Juchitepec, Ayapango, and Ozumba. Explosions on 16 August produced ash plumes up to 2 km that dispersed to the WSW. Over the following two days ash plumes reached 1.2 km and resulted in ashfall in Cuernavaca, Tepoztlán, Tlalnepantla, Morelos, Ozumba, and Ecatzingo. Over 30-31 August ash plumes reached between 1-2 km above the crater and ashfall was reported in Amecameca, Atlautla, Ozumba, and Tlalmanalco. Incandescence was sometimes observed at the crater through the month.
The MODVOLC algorithm for MODIS thermal anomalies registered thermal alerts through this period, with 22 in March, three in May, five in July, and one in August. The MIROVA system showed that the frequency of thermal anomalies at Popocatépetl was higher in March, sporadic in April and May, low in June, and had increased again in July and August (figure 138). Elevated temperatures were frequently visible in Sentinel-2 thermal satellite data when clouds and plumes were not covering the crater (figure 139).
Geologic Background. Volcán Popocatépetl, whose name is the Aztec word for smoking mountain, rises 70 km SE of Mexico City to form North America's 2nd-highest volcano. The glacier-clad stratovolcano contains a steep-walled, 400 x 600 m wide crater. The generally symmetrical volcano is modified by the sharp-peaked Ventorrillo on the NW, a remnant of an earlier volcano. At least three previous major cones were destroyed by gravitational failure during the Pleistocene, producing massive debris-avalanche deposits covering broad areas to the south. The modern volcano was constructed south of the late-Pleistocene to Holocene El Fraile cone. Three major Plinian eruptions, the most recent of which took place about 800 CE, have occurred since the mid-Holocene, accompanied by pyroclastic flows and voluminous lahars that swept basins below the volcano. Frequent historical eruptions, first recorded in Aztec codices, have occurred since Pre-Columbian time.
Information Contacts: Centro Nacional de Prevención de Desastres (CENAPRED), Av. Delfín Madrigal No.665. Coyoacan, México D.F. 04360, México (URL: http://www.cenapred.unam.mx/); Universidad Nacional Autónoma de México (UNAM), University City, 04510 Mexico City, Mexico (URL: https://www.unam.mx/); MIROVA (Middle InfraRed Observation of Volcanic Activity), a collaborative project between the Universities of Turin and Florence (Italy) supported by the Centre for Volcanic Risk of the Italian Civil Protection Department (URL: http://www.mirovaweb.it/); Hawai'i Institute of Geophysics and Planetology (HIGP) - MODVOLC Thermal Alerts System, School of Ocean and Earth Science and Technology (SOEST), Univ. of Hawai'i, 2525 Correa Road, Honolulu, HI 96822, USA (URL: http://modis.higp.hawaii.edu/); Global Sulfur Dioxide Monitoring Page, Atmospheric Chemistry and Dynamics Laboratory, NASA Goddard Space Flight Center (NASA/GSFC), 8800 Greenbelt Road, Goddard, Maryland, USA (URL: https://SO2.gsfc.nasa.gov/); Sentinel Hub Playground (URL: https://www.sentinel-hub.com/explore/sentinel-playground); Webcams de Mexico (URL: http://www.webcamsdemexico.com/); Agence France-Presse (URL: http://www.afp.com/).
Santa Maria (Guatemala) — September 2019 Cite this Report
Santa Maria
Guatemala
14.757°N, 91.552°W; summit elev. 3745 m
All times are local (unless otherwise noted)
Persistent explosions with local ashfall, March-August 2019; frequent lahars during June; increased explosions in early July
The dacitic Santiaguito lava-dome complex on the W flank of Guatemala's Santa María volcano has been growing and actively erupting since 1922. The youngest of the four vents in the complex, Caliente, has been erupting with ash explosions, pyroclastic, and lava flows for more than 40 years. A lava dome that appeared within the summit crater of Caliente in October 2016 has continued to grow, producing frequent block avalanches down the flanks. Daily explosions of steam and ash also continued during March-August 2019, the period covered in this report, with information primarily from Guatemala's INSIVUMEH (Instituto Nacional de Sismologia, Vulcanologia, Meterologia e Hidrologia) and the Washington VAAC (Volcanic Ash Advisory Center).
Activity at Santa Maria continued with little variation from previous months during March-August 2019, except for a short-lived increase in the frequency and intensity of explosions during early July that produced minor pyroclastic flows. Plumes of steam with minor magmatic gases rose continuously from both the S rim of the Caliente crater and from the summit of the growing dome throughout the period. They usually rose 100-700 m above the summit, generally drifting W or SW, and occasionally SE, before dissipating. In addition, daily explosions with varying amounts of ash rose to altitudes of around 2.8-3.5 km and usually extended no more than 25 km before dissipating. Most of the plumes drifted SW or SE; minor ashfall occurred in the adjacent hills almost daily and was reported at the fincas located within 10 km in those directions several times each month. Continued growth of the Caliente lava dome resulted in daily block avalanches descending its flanks to the base of the dome. The MIROVA plot of thermal energy during this time shows a consistent level of heat from early December 2018 through April 2019, very little activity during May and June, and a short-lived spike in activity from late June through early July that coincides with the increase in explosion rate and intensity. Activity decreased later in July and into August (figure 95).
Explosive activity increased slightly during March 2019 to 474 events from 409 events during February, averaging about 15 per day; the majority of explosions were weak to moderate in strength. The moderate explosions generated small block avalanches daily that sent debris 300 m down the flanks of Caliente dome; the explosions contained low levels of ash and large quantities of steam. Daily activity consisted mostly of degassing around the southern rim of the crater and within the central dome, with plumes rising about 100 m from the S rim, and pulsating between 100-400 m above the central dome, usually white and sometimes blue with gases; steam plumes drifted as far as 10 km. The weak ash emissions resulted in ashfall close to the volcano, primarily to the W and SW in the mountainous areas of El Faro, Patzulín, La Florida, and Monte Bello farms. During mid-March, residents of the villages of Las Marías and El Viejo Palmar, located S of the dome, reported the smell of sulfur. The seismic station STG3 registered 8-23 explosions daily that produced ash plumes which rose to altitudes between 2.7 and 3.3 km altitude. Explosions from the S rim were usually steam rich, while reddish oxidized ash was more common from the NE edge of the growing dome in the summit crater (figure 96). The constant block avalanches were generated by viscous lava slowly emerging from the growing summit dome, and also from the explosive activity. On the steep S flank of Santa Maria, blocks up to 3 m in diameter often produce small plumes of ash and debris as they fall.
Late on 4 March 2019 an explosion was heard 10 km away that generated incandescence 100 m above the crater and block avalanches that descended to the base of the Caliente dome; it also resulted in ashfall around the perimeter of the volcano. Powerful block avalanches were reported in Santa María creek on 8 March. Ashfall was reported in the villages of San Marcos and Loma Linda Palajunoj on 14 March. Ash plumes on 18 March drifted W and caused ashfall in the villages of Santa María de Jesús and Calaguache. A small amount of ashfall was reported on 26 March around San Marcos Palajunoj. The Washington VAAC reported volcanic ash drifting W from the summit on 8 March at 4.6 km altitude. A small ash plume was visible in satellite imagery moving WSW on 11 March at 4.6 km altitude. On 20 March a plume was detected drifting SW at 3.9 km altitude for a short time before dissipating.
Explosion rates of 10-14 per day were typical for April 2019. Ash plumes rose to 2.7-3.2 km altitude. Block avalanches reached the base of the Caliente dome each day. Steam and gas plumes pulsated 100-400 m above the S rim of the crater (figure 97). Ashfall in the immediate vicinity of the volcano, generally on the W and SW flanks was also a daily feature. The Washington VAAC reported multiple small ash emissions on 2 April moving W and dissipating quickly at 4.9 km altitude. An ash plume from two emissions drifted WSW at 4.3 km altitude on 10 April, and on 22 April two small discrete emissions were observed in satellite images moving SE at 4.6 km altitude. Ashfall was reported on 13 and 14 April in the nearby mountains and areas around Finca San José to the SE. On 15 and 23 April, ash plumes drifted W and ashfall was reported in the area of San Marcos and Loma Lina Palajunoj.
Constant degassing continued from the S rim of the crater during May 2019 while pulses of steam and gas rose 100-500 m from the dome at the center of the summit crater. Weak to moderate explosions continued at a rate of 8-12 per day. White and gray plumes of steam and ash rose 300-700 m above the crater daily. A moderate-size lahar on 16 May descended the Rio San Isisdro; it was 20 m wide and carried blocks 2 m in diameter. Ashfall was reported on the W flank around the area of San Marcos and Loma Lina Palajunoj on 21 and 24 May. INSIVIUMEH reported on 29 and 30 May that seismic station STG8 recorded moderate lahars descending the Rio San Isidro (a drainage to the Rio Tambor). The thick, pasty lahars transported blocks 1-3 m in diameter, branches, and tree trunks. They were 20 m wide and 1.5-2 m deep.
Weak to moderate explosions continued during June 2019 at a rate of 9-12 per day, producing plumes of ash and steam that rose 300-700 m above the Caliente crater. On 1 June explosions produced ashfall to the E over the areas of Calaguache, Las Marías and other nearby communities. Ash plumes commonly reached 3.0-3.3 km altitude and drifted W and SW, and block avalanches constantly descended the E and SE flanks from the dome at the top of Caliente. Ashfall was reported at the Santa María de Jesús community on 7 June. Ashfall to the W in San Marcos and Loma Linda Palajunoj was reported on 10, 15, 18, 20, and 22 June. Ashfall to the SE in Fincas Monte Claro and El Patrocinio was reported on 26 June. A few of the explosions on 28 June were heard up to 10 km away. On 29 June ash dispersed to the W again over the farms of San Marcos, Monte Claro, and El Patrocinio in the area of Palajunoj; the next day, ash was reported in Loma Linda and finca Monte Bello to the SW. The Washington VAAC reported ash emissions on 29 June that rose to 4.3 km and drifted W; two ash clouds were observed, one was 35 km from Santa Maria and the second drifted 55 km before dissipating.
With the onset of the rainy season, eight lahars were reported during June. The Rio Cabello de Ángel, a tributary of Río Nimá I (which flows into Rio Samalá) on the SE flank experienced lahars on 3, 5, 11, 12, 21, and 30 June (figure 98). The lahars were 15-20 m wide, 1-2 m deep, and carried branches, tree trunks and blocks 1-3 m in diameter. On 12 and 15 June, lahars descended the Río San Isidro on the SW flank. They were 1.5 m deep, 15-20 m wide and carried tree trunks and blocks up to 2 m in diameter.
An increase in the frequency and intensity of seismic events was noted beginning on 28 June that lasted through 6 July 2019. Explosions occurred at a rate of 5-6 per hour, reaching 40-45 events per day instead of the 12-15 typical of previous months. Ash plumes rose to 3.5-3.8 km altitude and drifted W, SW, and S as far as 10 km, and ashfall was reported in San Marcos Palajunoj, Loma Linda villages, Monte Bello farms, El Faro, La Mosqueta, La Florida, and Monte Claro. Activity decreased after 7 July back to similar levels of the previous months. As a result of the increased activity during the first week of July, several small pyroclastic flows (also known as pyroclastic density currents or PDC's) were generated that traveled up to 1 km down the S, SE, and E flanks during 2-5 and 13 July, in addition to the constant block avalanches from the dome extrusion and explosions (figure 99). As activity levels decreased after 6 July, the ash plume heights lowered to 3.3 km altitude, while pulsating degassing continued from the summit dome, rising 100-500 m.
The Washington VAAC reported an ash plume on 2 July from a series of emissions that rose to 3.9 km altitude and drifted W. Satellite imagery on 4 July showed a puff of ash moving W from the summit at 4.3 km altitude. The next day an ash emission was observed in satellite imagery moving W at 4.9 km altitude. A plume on 11 July drifted W at 4.3 km for several hours before dissipating. Ashfall was reported on 2 July at the San Marcos farm and in the villages of Monte Claro and El Patrocinio in the Palajunoj area. On 4 and 6 July ash fell to the SW and W in San Marcos and Loma Linda Palajunoj. On 5 July there were reports of ashfall in Monte Claro and areas around San Marcos Palajunoj and some explosions were heard 5 km away. In Monte Claro to the SW ash fell on 7 July and sounds were heard 5 km away every three minutes. Incandescence was observed in the early morning on the SE and NE flanks of the dome. During 8 and 9 July, four to eight weak explosions per hour were noted and ash dispersed SW, especially over Monte Claro; pulsating degassing noises were heard every two minutes. Monte Bello and Loma Linda reported ashfall on 12, 16, 17, 19, and 20 July. On 15, 22, 26, and 29 July ash was reported in San Marcos and Loma Linda Palajunoj; 33 explosions occurred on 25 July. Two lahars were reported on 8 July. A strong one in the Rio San Isidro was more than 2 m deep, and 20-25 m wide with blocks as large as 3 m in diameter. A more moderate lahar affected Rio Cabello de Angel and was also 2 m deep. It was 15-20 m wide and had blocks 1-2 m in diameter.
Activity declined further during August 2019. Constant degassing continued from the S rim of the crater, but only occasional pulses of steam and gas rose from the central dome. Weak to moderate explosions occurred at a rate of 15-20 per day. White and gray plumes with small amounts of ash rose 300-800 m above the summit daily. Block avalanches descended to the base of the dome and sent fine ash particles down the SE and S flanks. Ashfall was common within 5 km of the summit, generally on the SW flank, near Monte Bello farm, Loma Linda village and San Marcos Palajunoj. Explosions rates decreased to 10-11 per day during the last week of the month. Degassing and ash plumes rose to 2.9-3.2 km altitude throughout the month.
On 1 August ash plumes drifted 10-15 km SW, causing ashfall in that direction. On 3 and 27 August ashfall occurred at Monte Claro and El Patrocinio in the Palajunoj area to the SW. On 7 and 31 August ashfall was reported in Monte Claro. San Marcos and Loma Linda Palajunoj reported ash on 11, 16, 19, and 23 August. On 21 August ashfall was reported to the SE around Finca San José. The Washington VAAC reported an ash plume visible in satellite imagery on 10 August 2019 drifting W at 4.3 km altitude a few kilometers from the summit which dissipated quickly. On 27 August a plume was observed 25 km W of the summit at 3.9 km altitude, dissipating rapidly. On 3 August a moderate lahar descended the Rio Cabello de Ángel that was 1 m deep, 15 m wide and carried blocks up to 1 m in diameter along with branches and tree trunks. A large lahar on 20 August descended Río Cabello de Ángel; it was 2-3 m high, 15 m wide and carried blocks 1-2 m diameter, causing erosion along the flanks of the drainage (figure 100).
Geologic Background. Symmetrical, forest-covered Santa María volcano is part of a chain of large stratovolcanoes that rise above the Pacific coastal plain of Guatemala. The sharp-topped, conical profile is cut on the SW flank by a 1.5-km-wide crater. The oval-shaped crater extends from just below the summit to the lower flank, and was formed during a catastrophic eruption in 1902. The renowned Plinian eruption of 1902 that devastated much of SW Guatemala followed a long repose period after construction of the large basaltic andesite stratovolcano. The massive dacitic Santiaguito lava-dome complex has been growing at the base of the 1902 crater since 1922. Compound dome growth at Santiaguito has occurred episodically from four vents, with activity progressing E towards the most recent, Caliente. Dome growth has been accompanied by almost continuous minor explosions, with periodic lava extrusion, larger explosions, pyroclastic flows, and lahars.
Information Contacts: Instituto Nacional de Sismologia, Vulcanologia, Meteorologia e Hydrologia (INSIVUMEH), Unit of Volcanology, Geologic Department of Investigation and Services, 7a Av. 14-57, Zona 13, Guatemala City, Guatemala (URL: http://www.insivumeh.gob.gt/); MIROVA (Middle InfraRed Observation of Volcanic Activity), a collaborative project between the Universities of Turin and Florence (Italy) supported by the Centre for Volcanic Risk of the Italian Civil Protection Department (URL: http://www.mirovaweb.it/); Washington Volcanic Ash Advisory Center (VAAC), Satellite Analysis Branch (SAB), NOAA/NESDIS OSPO, NOAA Science Center Room 401, 5200 Auth Rd, Camp Springs, MD 20746, USA (URL: www.ospo.noaa.gov/Products/atmosphere/vaac, archive at: http://www.ssd.noaa.gov/VAAC/archive.html).
Semeru (Indonesia) — September 2019 Cite this Report
Semeru
Indonesia
8.108°S, 112.922°E; summit elev. 3657 m
All times are local (unless otherwise noted)
Intermittent activity continues during March-August 2019; ash plumes and thermal anomalies
The ongoing eruption at Semeru weakened in intensity during 2018, with occasional ash plumes and thermal anomalies (BGVN 44:04); this reduced but ongoing level of activity continued through August 2019. The volcano is monitored by the Pusat Vulkanologi dan Mitigasi Bencana Geologi (PVMBG, also known as Indonesian Center for Volcanology and Geological Hazard Mitigation, CVGHM) and the Darwin Volcanic Ash Advisory Centre (VAAC). The current report summarizes activity from 1 March to 31 August 2019. The Alert Level remained at 2 (on a scale from 1-4); the public was warned to stay 1 km away from the active crater and 4 km away on the SSE flank.
Based on analysis of satellite images, the Darwin VAAC reported that ash plumes rose to an altitude of 4-4.3 km on 19 April, 20 June, 10 July, and 13 July, drifting in various directions. In addition, PVMBG reported that at 0830 on 26 June an explosion produced an ash plume that rose around 600 m above the summit and drifted SW. A news article (Tempo.com) dated 12 August cited PVMBG as stating that the volcano had erupted 17 times since 8 August.
During March-August 2019 thermal anomalies were detected with the MODIS satellite instruments analyzed using the MODVOLC algorithm only on 5 July and 22 August. No explosions were recorded on those two days. Scattered thermal anomalies within 5 km of the volcano were detected by the MIROVA (Middle InfraRed Observation of Volcanic Activity) system, also based on analysis of MODIS data: one at the end of March and 3-6 hotspots over the following months, almost all of low radiative power. Satellite imagery intermittently showed thermal activity in the Jonggring-Seloko crater (figure 37), sometimes with material moving down the SE-flank ravine.
Geologic Background. Semeru, the highest volcano on Java, and one of its most active, lies at the southern end of a volcanic massif extending north to the Tengger caldera. The steep-sided volcano, also referred to as Mahameru (Great Mountain), rises above coastal plains to the south. Gunung Semeru was constructed south of the overlapping Ajek-ajek and Jambangan calderas. A line of lake-filled maars was constructed along a N-S trend cutting through the summit, and cinder cones and lava domes occupy the eastern and NE flanks. Summit topography is complicated by the shifting of craters from NW to SE. Frequent 19th and 20th century eruptions were dominated by small-to-moderate explosions from the summit crater, with occasional lava flows and larger explosive eruptions accompanied by pyroclastic flows that have reached the lower flanks of the volcano.
Information Contacts: Pusat Vulkanologi dan Mitigasi Bencana Geologi (PVMBG, also known as Indonesian Center for Volcanology and Geological Hazard Mitigation, CVGHM), Jalan Diponegoro 57, Bandung 40122, Indonesia (URL: http://www.vsi.esdm.go.id/); Darwin Volcanic Ash Advisory Centre (VAAC), Bureau of Meteorology, Northern Territory Regional Office, PO Box 40050, Casuarina, NT 0811, Australia (URL: http://www.bom.gov.au/info/vaac/); MIROVA (Middle InfraRed Observation of Volcanic Activity), a collaborative project between the Universities of Turin and Florence (Italy) supported by the Centre for Volcanic Risk of the Italian Civil Protection Department (URL: http://www.mirovaweb.it/); Hawai'i Institute of Geophysics and Planetology (HIGP) - MODVOLC Thermal Alerts System, School of Ocean and Earth Science and Technology (SOEST), Univ. of Hawai'i, 2525 Correa Road, Honolulu, HI 96822, USA (URL: http://modis.higp.hawaii.edu/); Sentinel Hub Playground (URL: https://www.sentinel-hub.com/explore/sentinel-playground); Tempo.com (URL: https://www.tempo.com/).
Semisopochnoi (United States) — September 2019 Cite this Report
Semisopochnoi
United States
51.93°N, 179.58°E; summit elev. 1221 m
All times are local (unless otherwise noted)
Small explosions detected between 16 July and 24 August 2019
The remote island of Semisopochnoi in the western Aleutians is dominated by a caldera measuring 8 km in diameter that contains a small lake (Fenner Lake) and a number of post-caldera cones and craters. A small (100 m diameter) crater lake in the N cone of Semisopochnoi's Cerberus three-cone cluster has persisted since January 2019. An eruption at Sugarloaf Peak in 1987 included an ash plume (SEAN 12:04). Activity during September-October 2018 included increased seismicity and small explosions (BGVN 44:02). The primary source of information for this reporting period of July-August 2019 comes from the Alaska Volcano Observatory (AVO), when there were two low-level eruptions.
Seismicity rose above background levels on 5 July 2019. AVO reported that data from local seismic and infrasound sensors likely detected a small explosion on 16 July. A strong tremor on 17 July generated airwaves that were detected on an infrasound array 260 km E on Adak Island. In addition to this, a small plume extended 18 km WSW from the Cerberus vent, but no ash signals were detected in satellite data. Seismicity decreased abruptly on 18 July after a short-lived eruption. Seismicity increased slightly on 23 July and remained elevated through August.
On 24 July 2019 AVO reported that satellite data showed that the crater lake was gone and a new, shallow inner crater measuring 80 m in diameter had formed on the crater floor, though no lava was identified. Satellite imagery indicated that the crater of the Cerberus N cone had been replaced by a smooth, featureless area of either tephra or water at a level several meters below the previous floor. Satellite imagery detected faint steam plumes rising to 5-10 km altitude and minor SO2 emissions on 27 July. Satellite data showed a steam plume rising from Semisopochnoi on 18 August and SO2 emissions on 21-22 August. Ground-coupled airwaves identified in seismic data on 23-24 August was indicative of additional explosive activity.
Geologic Background. Semisopochnoi, the largest subaerial volcano of the western Aleutians, is 20 km wide at sea level and contains an 8-km-wide caldera. It formed as a result of collapse of a low-angle, dominantly basaltic volcano following the eruption of a large volume of dacitic pumice. The high point of the island is Anvil Peak, a double-peaked late-Pleistocene cone that forms much of the island's northern part. The three-peaked Mount Cerberus (renamed Mount Young in 2023) was constructed within the caldera during the Holocene. Each of the peaks contains a summit crater; lava flows on the N flank appear younger than those on the south side. Other post-caldera volcanoes include the symmetrical Sugarloaf Peak SSE of the caldera and Lakeshore Cone, a small cinder cone at the edge of Fenner Lake in the NE part of the caldera. Most documented eruptions have originated from Young, although Coats (1950) considered that both Sugarloaf and Lakeshore Cone could have been recently active.
Information Contacts: Alaska Volcano Observatory (AVO), a cooperative program of a) U.S. Geological Survey, 4200 University Drive, Anchorage, AK 99508-4667 USA (URL: https://avo.alaska.edu/), b) Geophysical Institute, University of Alaska, PO Box 757320, Fairbanks, AK 99775-7320, USA, and c) Alaska Division of Geological & Geophysical Surveys, 794 University Ave., Suite 200, Fairbanks, AK 99709, USA (URL: http://dggs.alaska.gov/).
Stromboli (Italy) — September 2019 Cite this Report
Stromboli
Italy
38.789°N, 15.213°E; summit elev. 924 m
All times are local (unless otherwise noted)
Major explosions on 3 July and 28 August 2019; hiker killed by ejecta
Near-constant fountains of lava at Stromboli have served as a natural beacon in the Tyrrhenian Sea for at least 2,000 years. Eruptive activity at the summit consistently occurs from multiple vents at both a north crater area (N area) and a southern crater group (CS area) on the Terrazza Craterica at the head of the Sciara del Fuoco, a large scarp that runs from the summit down the NW side of the volcano-island. Periodic lava flows emerge from the vents and flow down the scarp, sometimes reaching the sea; occasional large explosions produce ash plumes and pyroclastic flows. Thermal and visual cameras that monitor activity at the vents are located on the nearby Pizzo Sopra La Fossa, above the Terrazza Craterica, and at multiple locations on the flanks of the volcano. Detailed information for Stromboli is provided by Italy's Istituto Nazionale di Geofisica e Vulcanologia (INGV) as well as other satellite sources of data; March-August 2019 is covered in this report.
Typical eruptive activity recorded at Stromboli by INGV during March-June 2019 was similar to activity of the past few years (table 6); two major explosions occurred in July and August with a fatality during the 3 July event. In the north crater area, both vents N1 and N2 emitted fine (ash) ejecta, occasionally mixed with coarser lapilli and bombs; most explosions rose less than 80 m above the vents, some reached 150 m. Average explosion rates ranged from 1 to 12 per hour. In the CS crater area continuous degassing and occasional intense spattering were typical at vent C, vent S1 was a low-intensity incandescent jet throughout the period. Explosions from vent S2 produced 80-150 m high ejecta of ash, lapilli, and bombs at average rates of 2-17 per hour.
After a high-energy explosion and lava flow on 25 June, a major explosion with an ash plume and pyroclastic flow occurred on 3 July 2019; ejecta was responsible for the death of a hiker lower down on the flank and destroyed monitoring equipment near the summit. After the explosion on 3 July, coarse ejecta and multiple lava flows and spatter cones emerged from the N area, and explosion rates increased to 4-19 per hour. At the CS area, lava flows emerged from all the vents and spatter cones formed. Explosion intensity ranged from low to very high with the finer ash ejecta rising over 250 m from the vents and causing ashfall in multiple places on the island. This was followed by about 7 weeks of heightened unrest and lava flows from multiple vents. A second major explosion with an ash plume and pyroclastic flow on 28 August reshaped the summit area yet again and scattered pyroclastic debris over the communities on the SW flank near the ocean.
Table 6. Summary of activity levels at Stromboli, March-August 2019. Low-intensity activity indicates ejecta rising less than 80 m, medium-intensity is ejecta rising less than 150 m, and high-intensity is ejecta rising over 200 m above the vent. Data courtesy of INGV.
| Month |
North (N) Area Activity |
Central-South (CS) Area Activity |
| Mar 2019 |
Low- to medium-intensity explosions at both N1 and N2. Coarse-grained ejecta (lapilli and bombs) from N1, fine-grained ash mixed with coarse material from N2. Explosion rates of 3-12 per hour. |
Medium-intensity explosions from both S area vents, lapilli and bombs mixed with ash, 2-9 explosions per hour. |
| Apr 2019 |
Low- to medium-intensity explosions at both N1 and N2. Coarse-grained ejecta (lapilli and bombs) from N1, fine-grained ash from N2. Explosion rates of 5-12 per hour. |
Continuous degassing from C, low-intensity incandescent jets form S1, up to 4 emission points from S2, mostly fine-grained ejecta, 4-15 explosions per hour. |
| May 2019 |
Low- to medium-intensity explosions at both N1 and N2. Mostly fine-grained ejecta, occasionally mixed with coarser material. Explosion rates of 2-8 per hour. |
Continuous degassing from C, low-intensity incandescent jets form S1, low- to medium-intensity explosions from C, S1, and S2. Mostly fine-grained ejecta, occasionally mixed with coarser material. Explosion rates of 5-16 per hour. |
| June 2019 |
Low- to medium-intensity explosions at both N1 and N2. Mostly fine-grained ejecta, occasionally mixed with coarser material. Explosion rates of 1-12 per hour. |
Continuous degassing at C and sporadic short duration spattering events, low- to medium-intensity incandescent jets at S1, multiple emission points from S2. Ejecta of larger lapilli and bombs mixed with ash. Explosion rates of 2-17 per hour. High-energy explosion on 25 June. |
| Jul 2019 |
Low- to medium-intensity explosions at both N1 and N2. Coarse ejecta after major explosion on 3 July. Intermittent intense spattering. Explosions rates of 4-19 per hour. Lava flows from all vents. |
Major explosion and pyroclastic flow, 3 July, with fatality from falling ejecta. Lava flows from all vents. Continuous degassing and variable intensity explosions from low to very high (over 200 m). Coarse ejecta until 20 July; followed by mostly ash. |
| Aug 2019 |
Low- to medium-intensity explosions from the N area, coarse ejecta and occasional intense spattering. Explosion rates of 7-17 per hour. Lava flows. |
Low- to high-intensity explosions; ash ejecta over 200 m; ashfall during week 1 in S. Bartolo area, Scari, and Piscità. Major explosion on 28 August, with 4-km-high ash plume and pyroclastic flow; lava flows. Explosion rates of 4-16 per hour. |
Thermal activity was low from March through early June 2019 as recorded in the MIROVA Log Radiative Power data from MODIS infrared satellite information. A sharp increase in thermal energy coincided with a large explosion and the emergence of numerous lava flows from the summit beginning in late June (figure 144). High heat-flow continued through the end of August and dropped back down at the beginning of September 2019 after the major 28 August explosion.
Activity during March-June 2019. Activity was low during March 2019. Low- to medium-intensity explosions occurred at both vents N1 and N2 in the north area. Ejecta was mostly coarse grained (lapilli and bombs) from N1 and fine-grained ash mixed with some coarse material from N2. Intense spattering activity was reported from N2 on 29 March. Explosion rates were reported at 5-12 per hour. At the CS area, medium-intensity explosions from both south area vents produced lapilli and bombs mixed with ash at a rate of 2-9 explosions per hour.
During a visit to the Terrazza Craterica on 2 April 2019, degassing was visible from vents N1, N2, C, and S2; activity continued at similar levels to March throughout the month. Low- and medium-intensity explosions with coarse ejecta, averaging 3-12 per hour, were typical at vent N1 while low-intensity explosions with fine-grained (ash) ejecta occurred at a similar rate from N2. Continuous degassing was observed at the C vent, and low-intensity incandescent jets were present at S1 throughout the month. Multiple emission points from S2 (as many as 4) produced low- to medium-intensity explosions at rates of 4-14 explosions per hour; the ejecta was mostly fine-grained mixed with some coarse material. Frequent explosions on 19 April produced abundant pyroclastic material in the summit area.
Low to medium levels of explosive activity at all of the vents continued during May 2019. Emissions consisted mostly of ash occasionally mixed with coarser material (lapilli and bombs). Rates of explosion were 2-8 per hour in the north area, and 5-16 per hour in the CS Area. Explosions of low-intensity continued from all the vents during the first part of June at rates averaging 2-12 per hour, although brief periods of high-frequency explosions (more than 21 events per hour) were reported during the week of 10 June. Strong degassing was observed from crater C during an inspection on 12 June (figure 145); by the third week, continuous degassing was interrupted at C by sporadic short-duration spattering events.
Late on 25 June 2019, a high-energy explosion that lasted for 28 seconds affected vent C in the CS area. The ejecta covered a large part of the Terrazza Craterica, with abundant material landing in the Valle della Luna. An ash plume rose over 250 m after the explosion and drifted S. After that, explosion frequency varied from medium-high (17/hour) on 25 June to high (25/hour) on 28 June. On 29 June researchers inspected the summit and noted changes from the explosive events. Thermal imagery indicated that the magma level at N1 was almost at the crater rim. The magma level at N2 was lower and explosive activity was less intense. At vent C, near-constant Strombolian activity with sporadic, more intense explosions produced black ash around the enlarged vent. At vent S2, a pyroclastic cone at the center of the crater produced vertical jets of gas, lapilli, and bombs that exceeded 100 m in height (figure 146).
Activity during July 2019. A large explosion accompanied by lava and pyroclastic flows affected the summit and western flank of Stromboli on 3 July 2019. Around 1400 local time an explosion from the CS area generated a lava flow that spilled onto the upper part of the Sciara del Fuoco. Just under an hour later several events took place: lava flows emerged from the C vent and headed E, from the N1 and N2 vents and flowed N towards Bastimento, and from vent S2 (figure 147). The emergence of the flows was followed a minute later by two lateral blasts from the CS area, and a major explosion that involved the entire Terrazza Craterica lasted for about one minute (figure 148). Within seconds, the pyroclastic debris had engulfed and destroyed the thermal camera located above the Terrazza Craterica on the Pizzo Sopra La Fossa and sent a plume of debris across the W flank of the island (figure 149). Two seismic stations were also destroyed in the event. The Toulouse VAAC reported a plume composed mostly of SO2 at 9.1 km altitude shortly after the explosion. They noted that ash was present in the vicinity of the volcano, but no significant ashfall was expected. INGV scientists observed the ash plume at 4 km above the summit.
Two pyroclastic flows were produced as a result of the explosions; they traveled down the Sciara and across the water for about 1 km before collapsing into the sea (figure 150). A hiker from Sicily was killed in the eruption and a Brazilian friend who was with him was badly injured, according to a Sicilian news source, ANSA, and the New York Post. They were hit by flying ejecta while hiking in the Punta dei Corvi area, due W of the summit and slightly N of Ginostra, about 100 m above sea level according to INGV. Most of the ejecta from the explosion dispersed to the WSW of the summit. Fallout also ignited vegetation on the slopes which narrowly missed destroying structures in the town. Ejecta blocks and bombs tens of centimeters to meters in diameter were scattered over a large area around the Pizzo Sopra La Fossa and the Valle della Luna in the direction of Ginostra. Smaller material landed in Ginostra and was composed largely of blonde pumice, that floated in the bay (figure 151). The breccia front of the lava flows produced incandescent blocks that reached the coastline. High on the SE flank, the abundant spatter of hot pyroclastic ejecta coalesced into a flow that moved 200-300 m down the flank before cooling, crossing the path normally used by visitors to the summit (figure 152).
INGV scientists inspected the summit on 4 and 5 July 2019 and noted that the rim of the Terrazza Craterica facing the Sciara del Fuoco in both the S and N areas had been destroyed, but the crater edge near the central area was not affected. In addition, the N area appeared significantly enlarged and deepened, forming a single crater where the former N1 and N2 vents had been located; an incandescent jet was active in the CS area (figure 153). Explosive activity declined significantly after the major explosions, although moderate overflows of lava continued from multiple vents, especially the CS area where the flows traveled about halfway down the southern part of the Sciara del Fuoco; lava also flowed E towards Rina Grande (about 0.5 km E of the summit). The main lava flows active between 3 and 4 July produced a small lava field along the Sciara del Fuoco which flowed down to an elevation of 210 m in four flows along the S edge of the scarp (figure 154). Additional block avalanches rolled to the coastline.
During the second week of July lava flows continued; on 8 July volcanologists reported two small lava flows from the CS area flowing towards the Sciara del Fuoco. A third flow was noted the following day. The farthest flow front was at about 500 m elevation on 10 July, and the flow at the center of the Sciara del Fuoco was at about 680 m. An overflow from the N area during the evening of 12 July produced two small flows that remained high on the N side of the scarp; lava continued flowing from the CS area into the next day. A new flow from the N area late on 14 July traveled down the N part of the scarp (figure 155).
A new video station with a thermal camera was installed at Punta dei Corvi, a short distance N of Ginostra on the SW coast, during 17-20 July 2019. During the third week of July lava continued to flow from the CS crater area onto the southern part of the Sciara del Fuoco, but the active flow area remained on the upper part of the scarp; block avalanches continuously rolled down to the coastline (figure 156). During visits to the summit area on 26 July and 1 August activity at the Terrazza Craterica was observed by INGV scientists. There were at least six active vents in the N area, including a scoria cone and an intensely spattering hornito; the other vents were ejecting coarse material in jets of Strombolian activity. In the CS area, a large scoria cone was clearly visible from the Pizzo, with two active vents generating medium- to high-intensity explosions rich in volcanic ash mixed with coarse ejecta (figures 157 and 158). Some of the finer-grained material in the jets reached 200 m above the vents. A second smaller cone in the CS area faced the southernmost part of the Sciara del Fuoco and produced sporadic low-intensity "bubble explosions." Effusive activity decreased during the last week of July; the active lava front was located at about 600 m elevation. Blocks continued to roll down the scarp, mostly from the explosive activity, and were visible from Punta dei Corvi.
Activity during August 2019. A small overflow of lava on 4 August 2019 from the N area lasted for about 20 minutes and formed a flow that went a few hundred meters down the Sciara del Fuoco. Observations made at the summit on 7 and 8 August 2019 indicated that nine vents were active in the N crater area, three of which had scoria cones built around them (figure 159). They all produced low- to medium-intensity Strombolian activity. In the CS area, a large scoria cone was visible from the summit that generated medium- to high-intensity explosions rich in volcanic ash, which sometimes rose more than 200 m above the vent. Lava overflowing from the CS area on 8 August was confined to the upper part of the Sciara del Fuoco, at an elevation between 500 and 600 m (figure 160). Occasional block avalanches from the active lava fronts traveled down the scarp. Ashfall was reported in the S. Bartolo area, Scari, and Piscità during the first week of August.
Drone surveys on 13 and 14 August 2019 confirmed that sustained Strombolian activity continued both in the N area and the CS area. Lava flows continued from two vents in the CS area; they ceased briefly on 16 and 17 August but resumed on the 18th, with the lava fronts reaching 500-600 m elevation (figure 161). A fracture field located in the southern part of the Sciara del Fuoco was first identified in drone imagery on 9 July. Repeated surveys through mid-August indicated that about ten fractures were identifiable trending approximately N-S and ranged in length from 2.5 to 21 m; they did not change significantly during the period. An overflight on 23 August identified the main areas of activity at the summit. A NE-SW alignment of 13 vents within the N area was located along the crater edge that overlooks the Sciara del Fuoco. At the CS area, the large scoria cone had two active vents, there was a pit crater, and two smaller scoria cones. A 50-m-long lava tube emerged from one of the smaller lava cones and fed two small flows that emerged at the top of the Sciara del Fuoco (figure 162).
INGV reported a strong explosion from the CS area at 1217 (local time) on 28 August 2019. Ejecta covered the Terrazza Craterica and sent debris rolling down the Sciara del Fuoco to the coastline. A strong seismic signal was recorded, and a large ash plume rose more than 2 km above the summit (figure 163). The Toulouse VAAC reported the ash plume at 3.7-4.6 km altitude, moving E and rapidly dissipating, shortly after the event. Once again, a pyroclastic flow traveled down the Sciara and several hundred meters out to sea (figures 164). The entire summit was covered with debris. The complex of small scoria cones within the N area that had formed since the 3 July explosion was destroyed; part of the N area crater rim was also destroyed allowing lava to flow down the Sciara where it reached the coastline by early evening.
At 1923 UTC on 29 August a lava flow was reported emerging from the N area onto the upper part of the Sciara del Fuoco; it stopped at mid-elevation on the slope. About 90 minutes later, an explosive sequence from the CS area resulted in the fallout of pyroclastic debris around Ginostra. Shortly after midnight, a lava flow from the CS area traveled down the scarp and reached the coast by dawn, but the lava entry into the sea only lasted for a short time (figure 165).
An overflight on 30 August 2019 revealed that after the explosions of 28-29 August the N area had collapsed and now contained an explosive vent producing Strombolian activity and two smaller vents with low-intensity explosive activity. In the CS area, Strombolian activity occurred at a single large crater (figure 166). INGV reported an explosion frequency of about 32 events per hour during 31 August-1 September. The TROPOMI instrument on the Sentinel-5P satellite captured small but distinct SO2 plumes from Stromboli during 28 August-1 September, even though they were challenging to distinguish from the larger signal originating at Etna (figure 167).
Geologic Background. Spectacular incandescent nighttime explosions at Stromboli have long attracted visitors to the "Lighthouse of the Mediterranean" in the NE Aeolian Islands. This volcano has lent its name to the frequent mild explosive activity that has characterized its eruptions throughout much of historical time. The small island is the emergent summit of a volcano that grew in two main eruptive cycles, the last of which formed the western portion of the island. The Neostromboli eruptive period took place between about 13,000 and 5,000 years ago. The active summit vents are located at the head of the Sciara del Fuoco, a prominent scarp that formed about 5,000 years ago due to a series of slope failures which extends to below sea level. The modern volcano has been constructed within this scarp, which funnels pyroclastic ejecta and lava flows to the NW. Essentially continuous mild Strombolian explosions, sometimes accompanied by lava flows, have been recorded for more than a millennium.
Information Contacts: Istituto Nazionale di Geofisica e Vulcanologia (INGV), Sezione di Catania, Piazza Roma 2, 95123 Catania, Italy, (URL: http://www.ct.ingv.it/en/); MIROVA (Middle InfraRed Observation of Volcanic Activity), a collaborative project between the Universities of Turin and Florence (Italy) supported by the Centre for Volcanic Risk of the Italian Civil Protection Department (URL: http://www.mirovaweb.it/); Global Sulfur Dioxide Monitoring Page, Atmospheric Chemistry and Dynamics Laboratory, NASA Goddard Space Flight Center (NASA/GSFC), 8800 Greenbelt Road, Goddard, Maryland, USA (URL: https://so2.gsfc.nasa.gov/); Toulouse Volcanic Ash Advisory Center (VAAC), Météo-France, 42 Avenue Gaspard Coriolis, F-31057 Toulouse cedex, France (URL: http://www.meteo.fr/aeroweb/info/vaac/); AIV, Associazione Italiana di Vulcanologia (URL: https://www.facebook.com/aivulc/photos/a.459897477519939/1267357436773935; ANSA.it, (URL: http://www.ansa.it/sicilia/notizie/2019/07/03/-stromboli-esplosioni-da-cratere-turisti-in-mare); The New York Post, (URL: https://nypost.com/2019/07/03/dozens-of-people-dive-into-sea-to-escape-stromboli-volcano-eruption-in-italy/).
Ubinas
Peru
16.345°S, 70.8972°W; summit elev. 5608 m
All times are local (unless otherwise noted)
Intermittent ash explosions in June-August 2019
Prior to renewed activity in June 2019, the most recent eruptive episode at Ubinas occurred between 13 September 2016 and 2 March 2017, with ash explosions that generated plumes that rose up to 1.5-2 km above the summit crater (BGVN 42:10). The volcano remained relatively quiet between April 2017 and May 2019. This report discusses an eruption that began in June 2019 and continued through at least August 2019. Most of the Information was provided by the Instituto Geofísico del Perú (IGP), Observatoria Vulcanologico del Sur (IGP-OVS), the Observatorio Volcanológico del INGEMMET (Instituto Geológical Minero y Metalúrgico) (OVI-INGEMMET), and the Buenos Aires Volcanic Ash Advisory Center (VAAC).
Activity during June 2019. According to IGP, seismic activity increased suddenly on 18 June 2019 with signals indicating rock fracturing. During 21-24 June, signals indicating fluid movement emerged and, beginning at 0700 on 24 June, webcams recorded ash, gas, and steam plumes rising from the crater. Plumes were visible in satellite images rising to an altitude of 6.1 km and drifting N, NE, and E.
IGP and INGEMMET reported that seismic activity remained elevated during 24-30 June; volcano-tectonic (VT) events averaged 200 per day and signals indicating fluid movement averaged 38 events per day. Emissions of gas, water vapor, and ash rose from the crater and drifted N and NE, based on webcam views and corroborated with satellite data. According to a news article, a plume rose 400 m above the crater rim and drifted 10 km NE. Weather clouds often obscured views of the volcano, but an ash plume was visible in satellite imagery on 24 June 2019 (figure 49). On 27 June the Alert Level was raised to Yellow (second lowest on a 4-level scale).
Activity during July 2019. IGP reported that seismic activity remained elevated during 1-15 July; VT events averaged 279 per day and long-period (LP) events (indicating fluid movement) averaged 116 events per day. Minor bluish emissions (magmatic gas) rose from the crater. Infrared imagery obtained by Sentinel-2 first showed a hotspot in the summit crater on 4 July.
According to IGP, during 17-19 July, gas-and-ash emissions occasionally rose from Ubinas's summit crater and drifted N, E, and SE. Beginning at 0227 on 19 July, as many as three explosions (two were recorded at 0227 and 0235) generated ash plumes that rose to 5.8 km above the crater rim. The Buenos Aires VAAC reported that, based on satellite images, ash plumes rose to an altitude as high as 12 km. The Alert Level was raised to Orange and the public were warned to stay beyond a 15-km radius. Ash plumes drifted as far as 250 km E and SE, reaching Bolivia. Ashfall was reported in areas downwind, including the towns of Ubinas (6.5 km SSE), Escacha, Anascapa (11 km SE), Tonohaya (7 km SSE), Sacohaya, San Miguel (10 km SE), Huarina, and Matalaque, causing some families to evacuate. The Buenos Aires VAAC reported that during 20-23 July ash plumes rose to an altitude of 7.3-9.5 km and drifted E, ESE, and SE.
IGP reported that activity remained elevated after the 19 July explosions. A total of 1,522 earthquakes, all with magnitudes under 2.2, were recorded during 20-24 July. Explosions were detected at 0718 and 2325 on 22 July, the last ones until 3 September. The Buenos Aires VAAC reported that an ash plume rising to an altitude of 9.4 km. and drifting SE was identified in satellite data at 0040 on 22 July (figure 50). Continuous steam-and-gas emissions with sporadic pulses of ash were visible in webcam views during the rest of the day. Ash emissions near the summit crater were periodically visible on 24 July though often partially hidden by weather clouds. Ash plumes were visible in satellite images rising to an altitude of 7 km. Diffuse ash emissions near the crater were visible on 25 July, and a thermal anomaly was identified in satellite images. During 26-28 July, there were 503 people evacuated from areas affected by ashfall.
Activity during August 2019. IGP reported that during 13-19 August blue-colored gas plumes rose to heights of less than 1.5 km above the base of the crater. The number of seismic events was 1,716 (all under M 2.4), a decrease from the total recorded the previous week.
According to IGP, blue-colored gas plumes rose above the crater and eight thermal anomalies were recorded by the MIROVA system during 20-26 August. The number of seismic events was 1,736 (all under M 2.4), and there was an increase in the magnitude and number of hybrid and LP events. Around 1030 on 26 August an ash emission rose less than 2 km above the crater rim. Continuous ash emissions on 27 August were recorded by satellite and webcam images drifting S and SW.
IGP reported that during the week of 27 August, gas-and-water-vapor plumes rose to heights less than 1 km above the summit. The number of seismic events was 2,828 (all under M 2.3), with VT signals being the most numerous. There was a slight increase in the number of LP, hybrid, and VT events compared to the previous week. The Alert Level remained at Orange.
Thermal anomalies. The MIROVA (Middle InfraRed Observation of Volcanic Activity) system detected a large concentration of anomalies between 19 July until almost the end of August 2019, all of which were of low radiative power (figure 51). Infrared satellite imagery (figure 52) also showed the strong thermal anomaly associated with the explosive activity on 19 July and then the continuing hot spot inside the crater through the end of August.
Geologic Background. The truncated appearance of Ubinas, Perú's most active volcano, is a result of a 1.4-km-wide crater at the summit. It is the northernmost of three young volcanoes located along a regional structural lineament about 50 km behind the main volcanic front. The growth and destruction of Ubinas I was followed by construction of Ubinas II beginning in the mid-Pleistocene. The upper slopes of the andesitic-to-rhyolitic Ubinas II stratovolcano are composed primarily of andesitic and trachyandesitic lava flows and steepen to nearly 45°. The steep-walled, 150-m-deep summit crater contains an ash cone with a 500-m-wide funnel-shaped vent that is 200 m deep. Debris-avalanche deposits from the collapse of the SE flank about 3,700 years ago extend 10 km from the volcano. Widespread Plinian pumice-fall deposits include one from about 1,000 years ago. Holocene lava flows are visible on the flanks, but activity documented since the 16th century has consisted of intermittent minor-to-moderate explosive eruptions.
Information Contacts: Instituto Geofisico del Peru (IGP), Observatoria Vulcanologico del Sur (IGP-OVS), Arequipa Regional Office, Urb La Marina B-19, Cayma, Arequipa, Peru (URL: http://ovs.igp.gob.pe/); Observatorio Volcanologico del INGEMMET (Instituto Geológical Minero y Metalúrgico), Barrio Magisterial Nro. 2 B-16 Umacollo - Yanahuara Arequipa (URL: http://ovi.ingemmet.gob.pe); Buenos Aires Volcanic Ash Advisory Center (VAAC), Servicio Meteorológico Nacional-Fuerza Aérea Argentina, 25 de mayo 658, Buenos Aires, Argentina (URL: http://www.smn.gov.ar/vaac/buenosaires/inicio.php?lang=es); MIROVA (Middle InfraRed Observation of Volcanic Activity), a collaborative project between the Universities of Turin and Florence (Italy) supported by the Centre for Volcanic Risk of the Italian Civil Protection Department (URL: http://www.mirovaweb.it/); Sentinel Hub Playground (URL: https://www.sentinel-hub.com/explore/sentinel-playground); Instituto Nacional de Defensa Civil Perú (INDECI) (URL: https://www.indeci.gob.pe/); Gobierno Regional de Moquegua (URL: http://www.regionmoquegua.gob.pe/web13/); La Republica (URL: https://larepublica.pe/); NASA Earth Observatory, EOS Project Science Office, NASA Goddard Space Flight Center, Goddard, Maryland, USA (URL: http://earthobservatory.nasa.gov/).
Ulawun (Papua New Guinea) — September 2019 Cite this Report
Ulawun
Papua New Guinea
5.05°S, 151.33°E; summit elev. 2334 m
All times are local (unless otherwise noted)
Explosions on 26 June and 3 August 2019 send plumes above 19 km altitude
Typical activity at Ulawun consists of occasional weak explosions with ash plumes. During 2018 explosions occurred on 8 June, 21 September, and 5 October (BGVN 43:11). The volcano is monitored primarily by the Rabaul Volcano Observatory (RVO) and Darwin Volcanic Ash Advisory Centre (VAAC). This report describes activity from November 2018 through August 2019; no volcanism was noted during this period until late June 2019.
Activity during June-July 2019. RVO reported that Real-time Seismic-Amplitude Measurement (RSAM) values steadily increased during 24-25 June, and then sharply increased at around 0330 on 26 June. The RSAM values reflect an increase in seismicity dominated by volcanic tremor. An eruption began in the morning hours of 26 June with emissions of gray ash (figure 17) that over time became darker and more energetic. The plumes rose 1 km and caused minor ashfall to the NW and SW. Local residents heard roaring and rumbling during 0600-0800.
The Darwin VAAC issued several notices about ash plumes visible in satellite data. These stated that during 1130-1155 ash plumes rose to altitudes of 6.7-8.5 km and drifted W, while ash plumes that rose to 12.8-13.4 km drifted S and SW. A new pulse of activity (figures 17 and 18) generated ash plumes that by 1512 rose to an altitude of 16.8 km and drifted S and SE. By 1730 the ash plume had risen to 19.2 km and spread over 90 km in all directions. Ash from earlier ejections continued to drift S at an altitude of 13.4 km and W at an altitude of 8.5 km. RVO stated that RSAM values peaked at about 2,500 units during 1330-1600, and then dropped to 1,600 units as the eruption subsided.
According to RVO, parts of the ash plume at lower altitudes drifted W, causing variable amounts of ashfall in areas to the NW and SW. A pyroclastic flow descended the N flank. Residents evacuated to areas to the NE and W; a news article (Radio New Zealand) noted that around 3,000 people had gathered at a local church. According to another news source (phys.org), an observer in a helicopter reported a column of incandescent material rising from the crater, residents noted that the sky had turned black, and a main road in the N part of the island was blocked by volcanic material. Residents also reported a lava flow near Noau village and Eana Valley. RVO reported that the eruption ceased between 1800 and 1900. Incandescence visible on the N flank was from either a lava flow or pyroclastic flow deposits.
On 27 June diffuse white plumes were reported by RVO as rising from the summit crater and incandescence was visible from pyroclastic or lava flow deposits on the N flank from the activity the day before. The seismic station 11 km NW of the volcano recorded low RSAM values of between 2 and 50. According to the Darwin VAAC a strong thermal anomaly was visible in satellite images, though not after 1200. Ash from 26 June explosions continued to disperse and became difficult to discern in satellite images by 1300, though a sulfur dioxide signal persisted. Ash at an altitude of 13.7 km drifted SW to SE and dissipated by 1620, and ash at 16.8 km drifted NW to NE and dissipated by 1857. RVO noted that at 1300 on 27 June satellite images captured an ash explosion not reported by ground-based observers, likely due to cloudy weather conditions. The Alert Level was lowered to Stage 1 (the lowest level on a four-stage scale).
RSAM values slightly increased at 0600 on 28 June and fluctuated between 80 to 150 units afterwards. During 28-29 June diffuse white plumes continued to rise from the crater (figure 20) and from the North Valley vent. On 29 June a ReliefWeb update stated that around 11,000 evacuated people remained in shelters.
According to RVO, diffuse white plumes rose from Ulawun's summit crater and the North Valley vent during 1-4 July and from the summit only during 5-9 July. The seismic station located 11 km NW of the volcano recorded three volcanic earthquakes and some sporadic, short-duration, volcanic tremors during 1-3 July. The seismic station 2.9 km W of the volcano was restored on 4 July and recorded small sub-continuous tremors. Some discrete high-frequency volcanic earthquakes were also recorded on most days. Sulfur dioxide emissions were 100 tonnes per day on 4 July. According to the United Nations in Papua New Guinea, 7,318 people remained displaced within seven sites because of the 26 June eruption.
Activity during August 2019. During 1-2 August RVO reported that white-to-gray vapor plumes rose from the summit crater and drifted NW. Incandescence from the summit crater was visible at night and jetting noises were audible for a short interval. RSAM values fluctuated but peaked at high levels. During the night of 2-3 August crater incandescence strengthened and roaring noises became louder around 0400. An explosion began between 0430 and 0500 on 3 August; booming noises commenced around 0445. By 0600 dense light-gray ash emissions were drifting NW, causing ashfall in areas downwind, including Ulamona Mission (10 km NW). Ash emissions continued through the day and changed from light to dark gray with time.
The eruption intensified at 1900 and a lava fountain rose more than 100 m above the crater rim. A Plinian ash plume rose 19 km and drifted W and SW, causing ashfall in areas downwind such as Navo and Kabaya, and as far as Kimbe Town (142 km SW). The Darwin VAAC reported that the ash plume expanded radially and reached the stratosphere, rising to an altitude of 19.2 km. The plume then detached and drifted S and then SE.
The Alert Level was raised to Stage 3. The areas most affected by ash and scoria fall were between Navo (W) and Saltamana Estate (NW). Two classrooms at the Navo Primary School and a church in Navo collapsed from the weight of the ash and scoria; one of the classroom roofs had already partially collapsed during the 26 June eruption. Evacuees in tents because of the 26 June explosion reported damage. Rabaul town (132 km NE) also reported ashfall. Seismicity declined rapidly within two hours of the event, though continued to fluctuate at moderate levels. According to a news source (Radio New Zealand, flights in and out of Hoskins airport in Port Moresby were cancelled on 4 August due to tephra fall. The Alert Level was lowered to Stage 1. Small amounts of white and gray vapor were emitted from the summit crater during 4-6 August. RVO reported that during 7-8 August minor emissions of white vapor rose from the summit crater.
Additional observations. Seismicity was dominated by low-level volcanic tremor and remained at low-to-moderate levels. RSAM values fluctuated between 400 and 550 units; peaks did not go above 700. Instruments aboard NASA satellites detected high levels of sulfur dioxide near or directly above the volcano on 26-29 June and 4-6 August 2019.
Thermal anomalies, based on MODIS satellite instruments analyzed using the MODVOLC algorithm, were observed at Ulawun only on 26 June 2019 (8 pixels by the Terra satellite, 4 pixels by the Aqua satellite). The MIROVA (Middle InfraRed Observation of Volcanic Activity) system detected three anomalies during the reporting period, one during the last week of June 2019 and two during the first week of August, all three within 3 km of the volcano and of low to moderate energy.
Geologic Background. The symmetrical basaltic-to-andesitic Ulawun stratovolcano is the highest volcano of the Bismarck arc, and one of Papua New Guinea's most frequently active. The volcano, also known as the Father, rises above the N coast of the island of New Britain across a low saddle NE of Bamus volcano, the South Son. The upper 1,000 m is unvegetated. A prominent E-W escarpment on the south may be the result of large-scale slumping. Satellitic cones occupy the NW and E flanks. A steep-walled valley cuts the NW side, and a flank lava-flow complex lies to the south of this valley. Historical eruptions date back to the beginning of the 18th century. Twentieth-century eruptions were mildly explosive until 1967, but after 1970 several larger eruptions produced lava flows and basaltic pyroclastic flows, greatly modifying the summit crater.
Information Contacts: Rabaul Volcano Observatory (RVO), Geohazards Management Division, Department of Mineral Policy and Geohazards Management (DMPGM), PO Box 3386, Kokopo, East New Britain Province, Papua New Guinea; Darwin Volcanic Ash Advisory Centre (VAAC), Bureau of Meteorology, Northern Territory Regional Office, PO Box 40050, Casuarina, NT 0811, Australia (URL: http://www.bom.gov.au/info/vaac/); Global Sulfur Dioxide Monitoring Page, Atmospheric Chemistry and Dynamics Laboratory, NASA Goddard Space Flight Center (NASA/GSFC), 8800 Greenbelt Road, Goddard, Maryland, USA (URL: https://so2.gsfc.nasa.gov/); Hawai'i Institute of Geophysics and Planetology (HIGP) - MODVOLC Thermal Alerts System, School of Ocean and Earth Science and Technology (SOEST), Univ. of Hawai'i, 2525 Correa Road, Honolulu, HI 96822, USA (URL: http://modis.higp.hawaii.edu/); MIROVA (Middle InfraRed Observation of Volcanic Activity), a collaborative project between the Universities of Turin and Florence (Italy) supported by the Centre for Volcanic Risk of the Italian Civil Protection Department (URL: http://www.mirovaweb.it); ReliefWeb (URL: https://reliefweb.int/); Radio New Zealand (URL: https://www.rnz.co.nz); phys.org (URL: https://phys.org); United Nations in Papua New Guinea (URL: http://pg.one.un.org/content/unct/papua_new_guinea/en/home.html).
Villarrica (Chile) — September 2019 Cite this Report
Villarrica
Chile
39.42°S, 71.93°W; summit elev. 2847 m
All times are local (unless otherwise noted)
Strombolian activity continued during March-August 2019 with an increase in July
Villarrica is a frequently active volcano in Chile with an active lava lake in the deep summit crater. It has been producing intermittent Strombolian activity since February 2015, soon after the latest reactivation of the lava lake; similar activity continued into 2019. This report summarizes activity during March-August 2019 and is based on reports from the Southern Andes Volcano Observatory (Observatorio Volcanológico de Los Andes del Sur, OVDAS), part of Chile's National Service of Geology and Mining (Servicio Nacional de Geología y Minería, SERNAGEOMIN), Projecto Observación Villarrica Internet (POVI), part of the Fundacion Volcanes de Chile research group, and satellite data.
OVDAS-SERNAGEOMIN reported that degassing continued through March with a plume reaching 150 m above the crater with visible incandescence through the nights. The lava lake activity continued to fluctuate and deformation was also recorded. POVI reported sporadic Strombolian activity throughout the month with incandescent ejecta reaching around 25 m above the crater on 17 and 24 March, and nearly 50 m above the crater on the 20th (figure 75).
There was a slight increase in Strombolian activity reported on 7-8 April, with incandescent ballistic ejecta reaching around 50 m above the crater (figure 76). Although seismicity was low during 14-15 April, Strombolian activity produced lava fountains up to 70 m above the crater over those two days (figure 77). Activity continued into May with approximately 12 Strombolian explosions recorded on the night of 5-6 May erupting incandescent ejecta up to 50 m above the crater rim. Another lava fountaining episode was observed reaching around 70 m above the crater on 14 May (figure 78). POVI also noted that while this was one of the largest events since 2015, no significant changes in activity had been observed over the last five months. Throughout May, OVDAS-SERNAGEOMIN reported that the gas plume height did not exceed 170 m above the crater and incandescence was sporadically observed when weather allowed. SWIR (short-wave infrared) thermal data showed an increase in energy towards the end of May (figure 79).
Ballistic ejecta were observed above the crater rim on 17 and 20 June 2019 (figure 80), and activity was heard on 20 and 21 June. Activity throughout the month remained similar to previous months, with a fluctuating lava lake and minor explosions. On 15 July a thermal camera imaged a ballistic bomb landing over 300 m from the crater and disintegrating upon impact. Incandescent material was sporadically observed on 16 July. Strombolian activity increased on 22 July with the highest intensity activity in four years continuing through the 25th (figure 81).
On 6 August the Alert Level was raised by SERNAGEOMIN from Green to Yellow (on a scale of Green, Yellow, Orange, and Red indicating the greatest level of activity) due to activity being above the usual background level, including ejecta confirmed out to 200 m from the crater with velocities on the order of 100 km/hour (figure 82). The temperature of the lava lake was measured at a maximum of 1,000°C on 25 July. POVI reported the collapse of a segment of the eastern crater rim, possibly due to snow weight, between 9 and 12 August. The MIROVA system showed an increase in thermal energy in August (figure 83) and there was one MODVOLC thermal alert on 24 July.
Geologic Background. The glacier-covered Villarrica stratovolcano, in the northern Lakes District of central Chile, is ~15 km south of the city of Pucon. A 2-km-wide caldera that formed about 3,500 years ago is located at the base of the presently active, dominantly basaltic to basaltic andesite cone at the NW margin of a 6-km-wide Pleistocene caldera. More than 30 scoria cones and fissure vents are present on the flanks. Plinian eruptions and pyroclastic flows that have extended up to 20 km from the volcano were produced during the Holocene. Lava flows up to 18 km long have issued from summit and flank vents. Eruptions documented since 1558 CE have consisted largely of mild-to-moderate explosive activity with occasional lava effusion. Glaciers cover 40 km2 of the volcano, and lahars have damaged towns on its flanks.
Information Contacts: Proyecto Observación Villarrica Internet (POVI) (URL: http://www.povi.cl/); Servicio Nacional de Geología y Minería (SERNAGEOMIN), Observatorio Volcanológico de Los Andes del Sur (OVDAS), Avda Sta María No. 0104, Santiago, Chile (URL: http://www.sernageomin.cl/); MIROVA (Middle InfraRed Observation of Volcanic Activity), a collaborative project between the Universities of Turin and Florence (Italy) supported by the Centre for Volcanic Risk of the Italian Civil Protection Department (URL: http://www.mirovaweb.it/); Hawai'i Institute of Geophysics and Planetology (HIGP) - MODVOLC Thermal Alerts System, School of Ocean and Earth Science and Technology (SOEST), Univ. of Hawai'i, 2525 Correa Road, Honolulu, HI 96822, USA (URL: http://modis.higp.hawaii.edu/).