Recently Published Bulletin Reports
Erebus (Antarctica) Lava lake remains active; most thermal alerts recorded since 2019
Rincon de la Vieja (Costa Rica) Frequent phreatic explosions during July-December 2023
Bezymianny (Russia) Explosion on 18 October 2023 sends ash plume 8 km high; lava flows and incandescent avalanches
Kilauea (United States) Low-level lava effusions in the lava lake at Halema’uma’u during July-December 2022
Nyamulagira (DR Congo) Lava flows and thermal activity during May-October 2023
Bagana (Papua New Guinea) Explosions, ash plumes, ashfall, and lava flows during April-September 2023
Mayon (Philippines) Lava flows, pyroclastic flows, ash emissions, and seismicity during April-September 2023
Nishinoshima (Japan) Eruption plumes and gas-and-steam plumes during May-August 2023
Krakatau (Indonesia) White gas-and-steam plumes and occasional ash plumes during May-August 2023
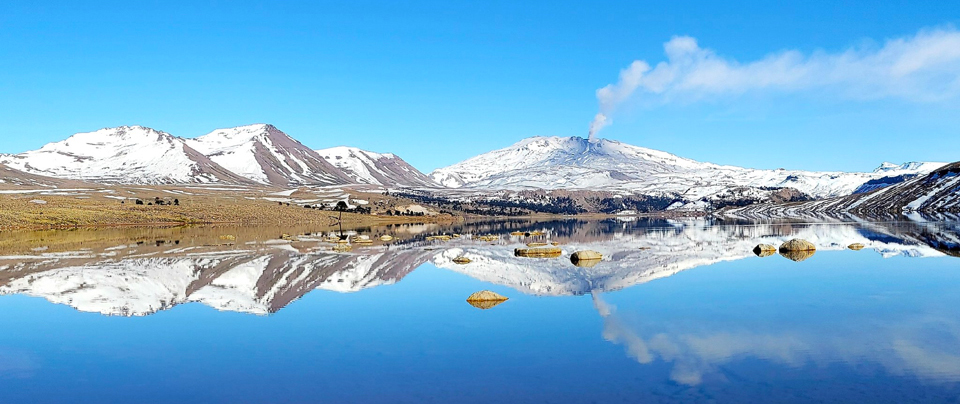
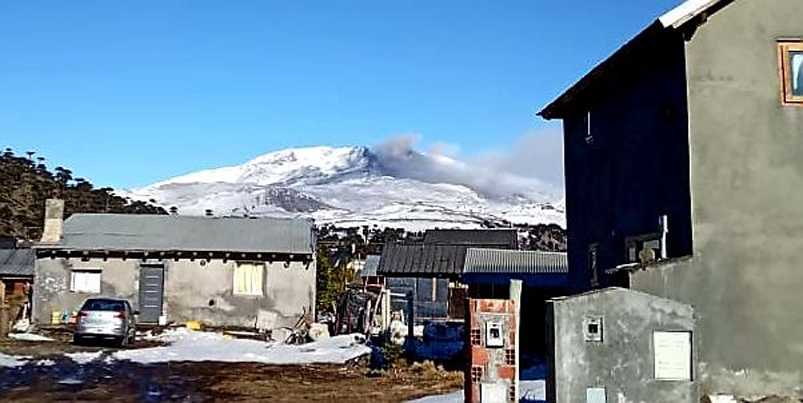
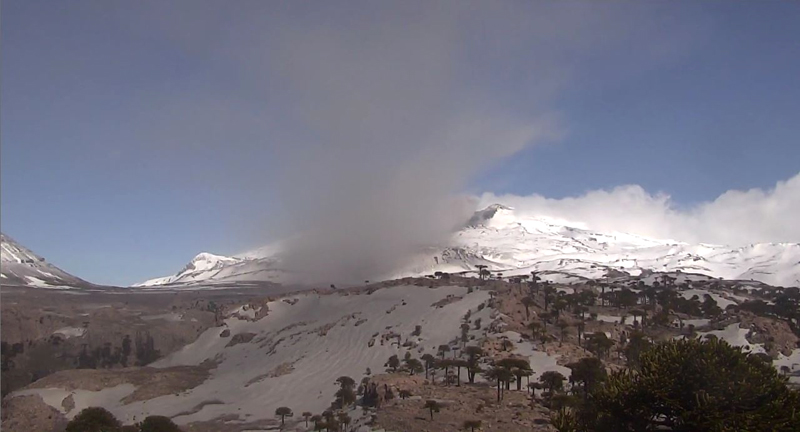
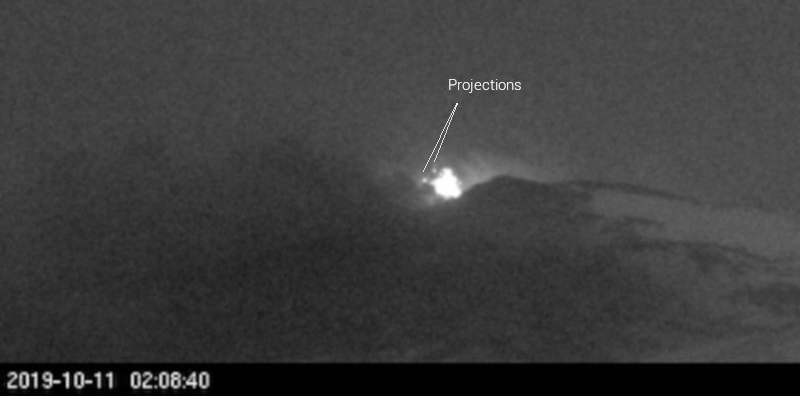
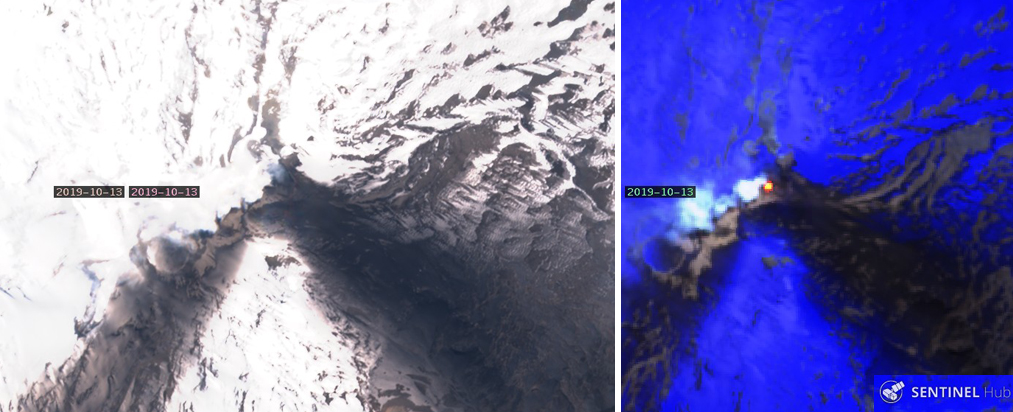
Villarrica (Chile) Strombolian activity, gas-and-ash emissions, and crater incandescence during April-September 2023
Merapi (Indonesia) Frequent incandescent avalanches during April-September 2023
Ebeko (Russia) Moderate explosive activity with ash plumes continued during June-November 2023
Erebus (Antarctica) — January 2024  Cite this Report
Erebus
Antarctica
77.53°S, 167.17°E; summit elev. 3794 m
All times are local (unless otherwise noted)
Lava lake remains active; most thermal alerts recorded since 2019
The lava lake in the summit crater of Erebus has been active since at least 1972. Located in Antarctica overlooking the McMurdo Station on Ross Island, it is the southernmost active volcano on the planet. Because of the remote location, activity is primarily monitored by satellites. This report covers activity during 2023.
The number of thermal alerts recorded by the Hawai'i Institute of Geophysics and Planetology’s MODVOLC Thermal Alerts System increased considerably in 2023 compared to the years 2020-2022 (table 9). In contrast to previous years, the MODIS instruments aboard the Aqua and Terra satellites captured data from Erebus every month during 2023. Consistent with previous years, the lowest number of anomalous pixels were recorded in January, November, and December.
Table 9. Number of monthly MODIS-MODVOLC thermal alert pixels recorded at Erebus during 2017-2023. See BGVN 42:06 for data from 2000 through 2016. The table was compiled using data provided by the HIGP – MODVOLC Thermal Alerts System.
| Year |
Jan |
Feb |
Mar |
Apr |
May |
Jun |
Jul |
Aug |
Sep |
Oct |
Nov |
Dec |
SUM |
| 2017 |
0 |
21 |
9 |
0 |
0 |
1 |
11 |
61 |
76 |
52 |
0 |
3 |
234 |
| 2018 |
0 |
21 |
58 |
182 |
55 |
17 |
137 |
172 |
103 |
29 |
0 |
0 |
774 |
| 2019 |
2 |
21 |
162 |
151 |
55 |
56 |
75 |
53 |
29 |
19 |
1 |
0 |
624 |
| 2020 |
0 |
2 |
16 |
18 |
4 |
4 |
1 |
3 |
18 |
3 |
1 |
6 |
76 |
| 2021 |
0 |
9 |
1 |
0 |
2 |
56 |
46 |
47 |
35 |
52 |
5 |
3 |
256 |
| 2022 |
1 |
13 |
55 |
22 |
15 |
32 |
39 |
19 |
31 |
11 |
0 |
0 |
238 |
| 2023 |
2 |
33 |
49 |
82 |
41 |
32 |
70 |
64 |
42 |
17 |
5 |
11 |
448 |
Sentinel-2 infrared images showed one or two prominent heat sources within the summit crater, accompanied by adjacent smaller sources, similar to recent years (see BGVN 46:01, 47:02, and 48:01). A unique image was obtained on 25 November 2023 by the OLI-2 (Operational Land Imager-2) on Landsat 9, showing the upper part of the volcano surrounded by clouds (figure 32).
Geologic Background. Mount Erebus, the world's southernmost historically active volcano, overlooks the McMurdo research station on Ross Island. It is the largest of three major volcanoes forming the crudely triangular Ross Island. The summit of the dominantly phonolitic volcano has been modified by one or two generations of caldera formation. A summit plateau at about 3,200 m elevation marks the rim of the youngest caldera, which formed during the late-Pleistocene and within which the modern cone was constructed. An elliptical 500 x 600 m wide, 110-m-deep crater truncates the summit and contains an active lava lake within a 250-m-wide, 100-m-deep inner crater; other lava lakes are sometimes present. The glacier-covered volcano was erupting when first sighted by Captain James Ross in 1841. Continuous lava-lake activity with minor explosions, punctuated by occasional larger Strombolian explosions that eject bombs onto the crater rim, has been documented since 1972, but has probably been occurring for much of the volcano's recent history.
Information Contacts: Hawai'i Institute of Geophysics and Planetology (HIGP) - MODVOLC Thermal Alerts System, School of Ocean and Earth Science and Technology (SOEST), Univ. of Hawai'i, 2525 Correa Road, Honolulu, HI 96822, USA (URL: http://modis.higp.hawaii.edu/); Copernicus Browser, Copernicus Data Space Ecosystem, European Space Agency (URL: https://dataspace.copernicus.eu/browser/); NASA Earth Observatory, EOS Project Science Office, NASA Goddard Space Flight Center, Goddard, Maryland, USA (URL: https://earthobservatory.nasa.gov/images/152134/erebus-breaks-through).
Rincon de la Vieja (Costa Rica) — January 2024 Cite this Report
Rincon de la Vieja
Costa Rica
10.83°N, 85.324°W; summit elev. 1916 m
All times are local (unless otherwise noted)
Frequent phreatic explosions during July-December 2023
Rincón de la Vieja is a volcanic complex in Costa Rica with a hot convecting acid lake that exhibits frequent weak phreatic explosions, gas-and-steam emissions, and occasional elevated sulfur dioxide levels (BGVN 45:10, 46:03, 46:11). The current eruption period began June 2021. This report covers activity during July-December 2023 and is based on weekly bulletins and occasional daily reports from the Observatorio Vulcanologico Sismologica de Costa Rica-Universidad Nacional (OVSICORI-UNA).
Numerous weak phreatic explosions continued during July-December 2023, along with gas-and-steam emissions and plumes that rose as high as 3 km above the crater rim. Many weekly OVSICORI-UNA bulletins included the previous week's number of explosions and emissions (table 9). For many explosions, the time of explosion was given (table 10). Frequent seismic activity (long-period earthquakes, volcano-tectonic earthquakes, and tremor) accompanied the phreatic activity.
Table 9. Number of reported weekly phreatic explosions and gas-and-steam emissions at Rincón de la Vieja, July-December 2023. Counts are reported for the week before the Weekly Bulletin date; not all reports included these data. Courtesy of OVSICORI-UNA.
| OVSICORI Weekly Bulletin |
Number of explosions |
Number of emissions |
| 28 Jul 2023 |
6 |
14 |
| 4 Aug 2023 |
10 |
12 |
| 1 Sep 2023 |
13 |
11 |
| 22 Sep 2023 |
12 |
13 |
| 29 Sep 2023 |
6 |
11 |
| 6 Oct 2023 |
12 |
5 |
| 13 Oct 2023 |
7 |
9 |
| 20 Oct 2023 |
1 |
15 |
| 27 Oct 2023 |
3 |
23 |
| 3 Nov 2023 |
3 |
10 |
| 17 Nov 2023 |
0 |
Some |
| 24 Nov 2023 |
0 |
14 |
| 8 Dec 2023 |
4 |
16 |
| 22 Dec 2023 |
8 |
18 |
Table 10. Summary of activity at Rincón de la Vieja during July-December 2023. Weak phreatic explosions and gas emissions are noted where the time of explosion was indicated in the weekly or daily bulletins. Height of plumes or emissions are distance above the crater rim. Courtesy of OVSICORI-UNA.
| Date |
Time |
Description of Activity |
| 1 Jul 2023 |
0156 |
Explosion. |
| 2 Jul 2023 |
0305 |
Explosion. |
| 4 Jul 2023 |
0229, 0635 |
Event at 0635 produced a gas-and-steam plume that rose 700 m and drifted W; seen by residents in Liberia (21 km SW). |
| 9 Jul 2023 |
1843 |
Explosion. |
| 21 Jul 2023 |
0705 |
Explosion. |
| 26 Jul 2023 |
1807 |
Explosion. |
| 28 Jul 2023 |
0802 |
Explosion generated a gas-and-steam plume that rose 500 m. |
| 30 Jul 2023 |
1250 |
Explosion. |
| 31 Jul 2023 |
2136 |
Explosion. |
| 11 Aug 2023 |
0828 |
Explosion. |
| 18 Aug 2023 |
1304 |
Explosion. |
| 21 Aug 2023 |
1224 |
Explosion generated gas-and-steam plumes rose 500-600 m. |
| 22 Aug 2023 |
0749 |
Explosion generated gas-and-steam plumes rose 500-600 m. |
| 24 Aug 2023 |
1900 |
Explosion. |
| 25 Aug 2023 |
0828 |
Event produced a steam-and-gas plume that rose 3 km and drifted NW. |
| 27-28 Aug 2023 |
0813 |
Four small events; the event at 0813 on 28 August lasted two minutes and generated a steam-and-gas plume that rose 2.5 km. |
| 1 Sep 2023 |
1526 |
Explosion generated plume that rose 2 km and ejected material onto the flanks. |
| 2-3 Sep 2023 |
- |
Small explosions detected in infrasound data. |
| 4 Sep 2023 |
1251 |
Gas-and-steam plume rose 1 km and drifted W. |
| 7 Nov 2023 |
1113 |
Explosion. |
| 8 Nov 2023 |
0722 |
Explosion. |
| 12 Nov 2023 |
0136 |
Small gas emissions. |
| 14 Nov 2023 |
0415 |
Small gas emissions. |
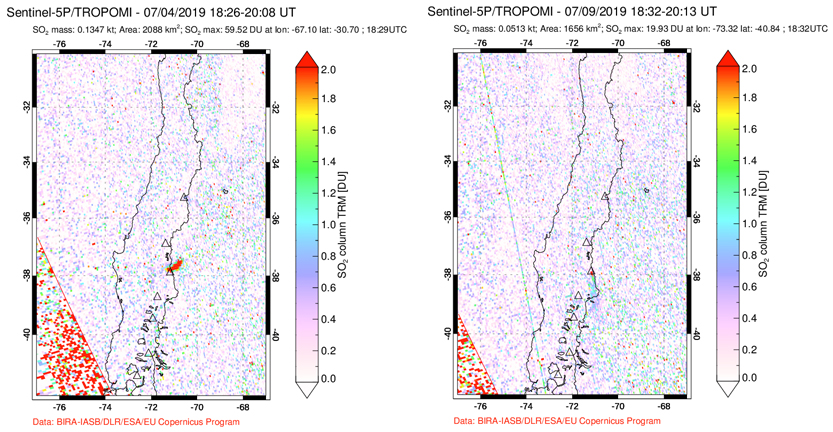
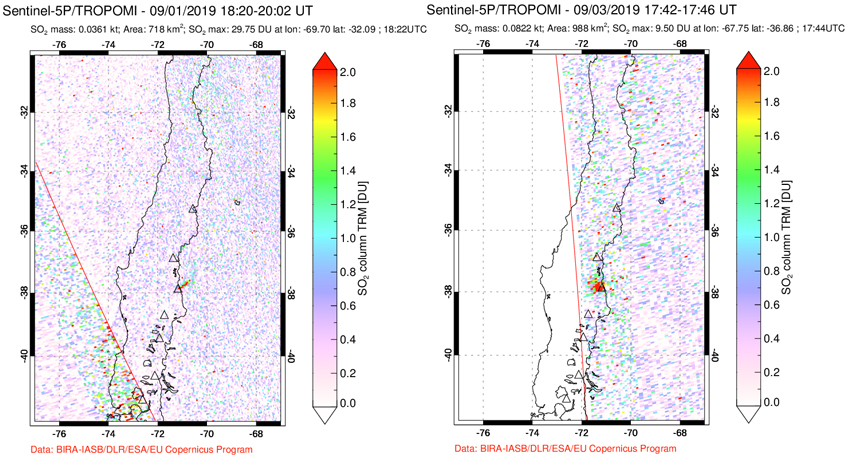
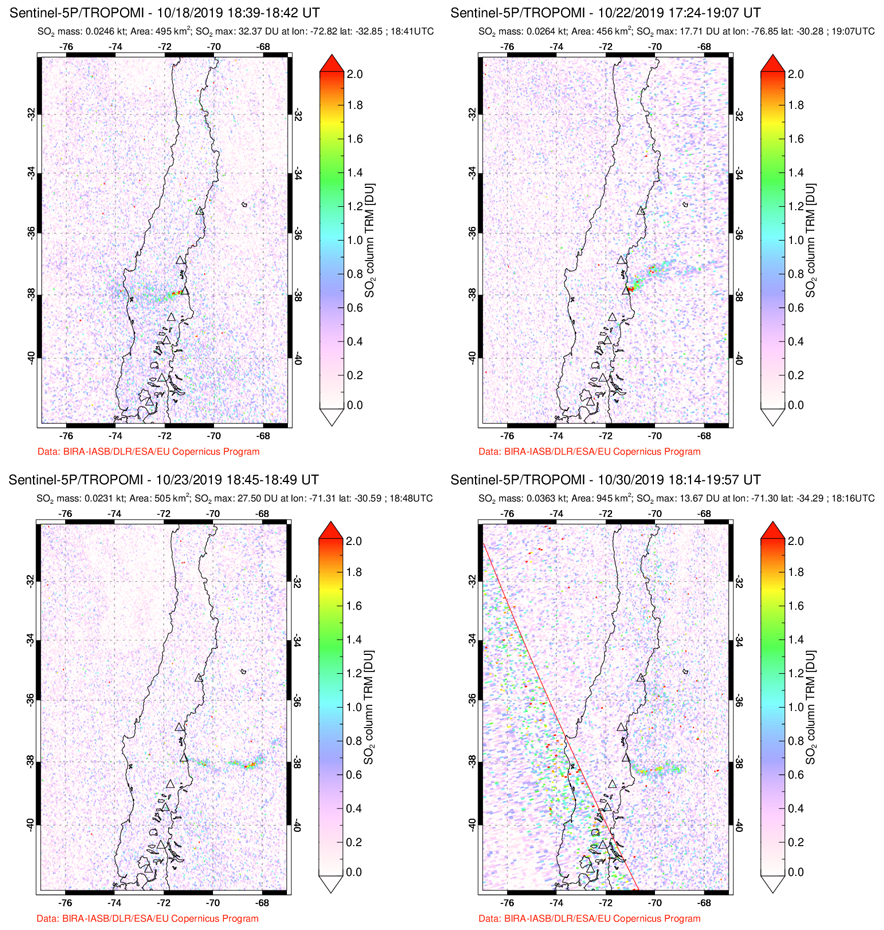
According to OVSICORI-UNA, during July-October the average weekly sulfur dioxide (SO2) flux ranged from 68 to 240 tonnes/day. However, in mid-November the flux increased to as high as 334 tonnes/day, the highest value measured in recent years. The high SO2 flux in mid-November was also detected by the TROPOMI instrument on the Sentinel-5P satellite (figure 43).
Geologic Background. Rincón de la Vieja, the largest volcano in NW Costa Rica, is a remote volcanic complex in the Guanacaste Range. The volcano consists of an elongated, arcuate NW-SE-trending ridge constructed within the 15-km-wide early Pleistocene Guachipelín caldera, whose rim is exposed on the south side. Sometimes known as the "Colossus of Guanacaste," it has an estimated volume of 130 km3 and contains at least nine major eruptive centers. Activity has migrated to the SE, where the youngest-looking craters are located. The twin cone of Santa María volcano, the highest peak of the complex, is located at the eastern end of a smaller, 5-km-wide caldera and has a 500-m-wide crater. A Plinian eruption producing the 0.25 km3 Río Blanca tephra about 3,500 years ago was the last major magmatic eruption. All subsequent eruptions, including numerous historical eruptions possibly dating back to the 16th century, have been from the prominent active crater containing a 500-m-wide acid lake located ENE of Von Seebach crater.
Information Contacts: Observatorio Vulcanológico Sismológica de Costa Rica-Universidad Nacional (OVSICORI-UNA), Apartado 86-3000, Heredia, Costa Rica (URL: http://www.ovsicori.una.ac.cr/); NASA Global Sulfur Dioxide Monitoring Page, Atmospheric Chemistry and Dynamics Laboratory, NASA Goddard Space Flight Center (NASA/GSFC), 8800 Greenbelt Road, Goddard MD 20771, USA (URL: https://so2.gsfc.nasa.gov/).
Bezymianny (Russia) — November 2023 Cite this Report
Bezymianny
Russia
55.972°N, 160.595°E; summit elev. 2882 m
All times are local (unless otherwise noted)
Explosion on 18 October 2023 sends ash plume 8 km high; lava flows and incandescent avalanches
Bezymianny, located on Russia’s Kamchatka Peninsula, has had eruptions since 1955 characterized by dome growth, explosions, pyroclastic flows, ash plumes, and ashfall. Activity during November 2022-April 2023 included gas-and-steam emissions, lava dome collapses generating avalanches, and persistent thermal activity. Similar eruptive activity continued from May through October 2023, described here based on information from weekly and daily reports of the Kamchatka Volcano Eruptions Response Team (KVERT), notices from Tokyo VAAC (Volcanic Ash Advisory Center), and from satellite data.
Overall activity decreased after the strong period of activity in late March through April 2023, which included ash explosions during 29 March and 7-8 April 2023 that sent plumes as high as 10-12 km altitude, along with dome growth and lava flows (BGVN 48:05). This reduced activity can be seen in the MIROVA thermal detection system graph (figure 56), which was consistent with data from the MODVOLC thermal detection system and with Sentinel-2 satellite images that showed persistent hotspots in the summit crater when conditions allowed observations. A renewed period of strong activity began in mid-October 2023.
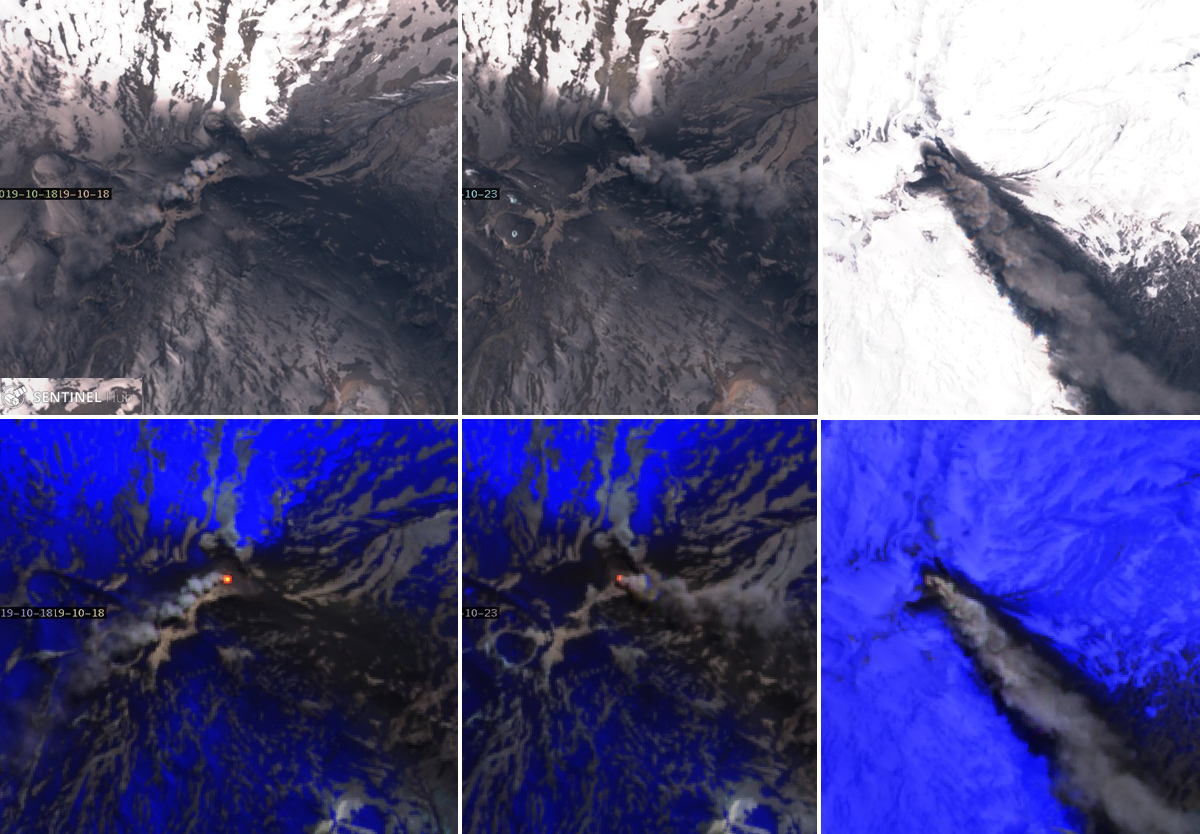
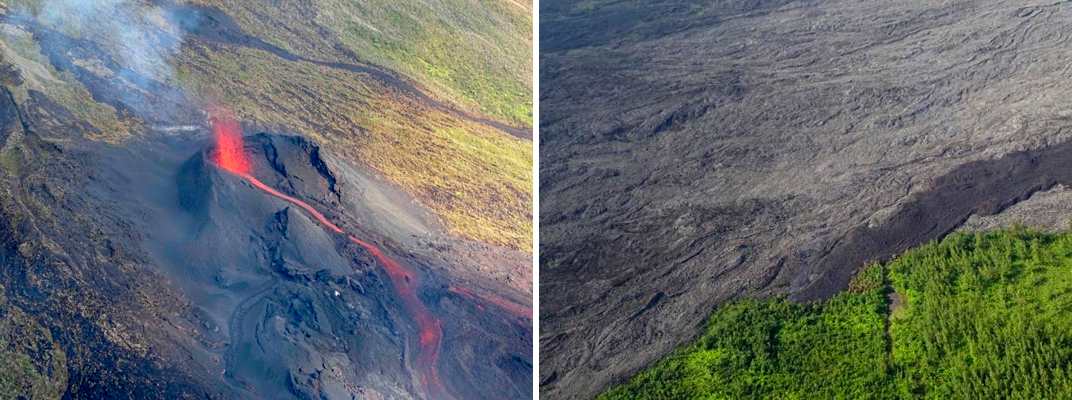
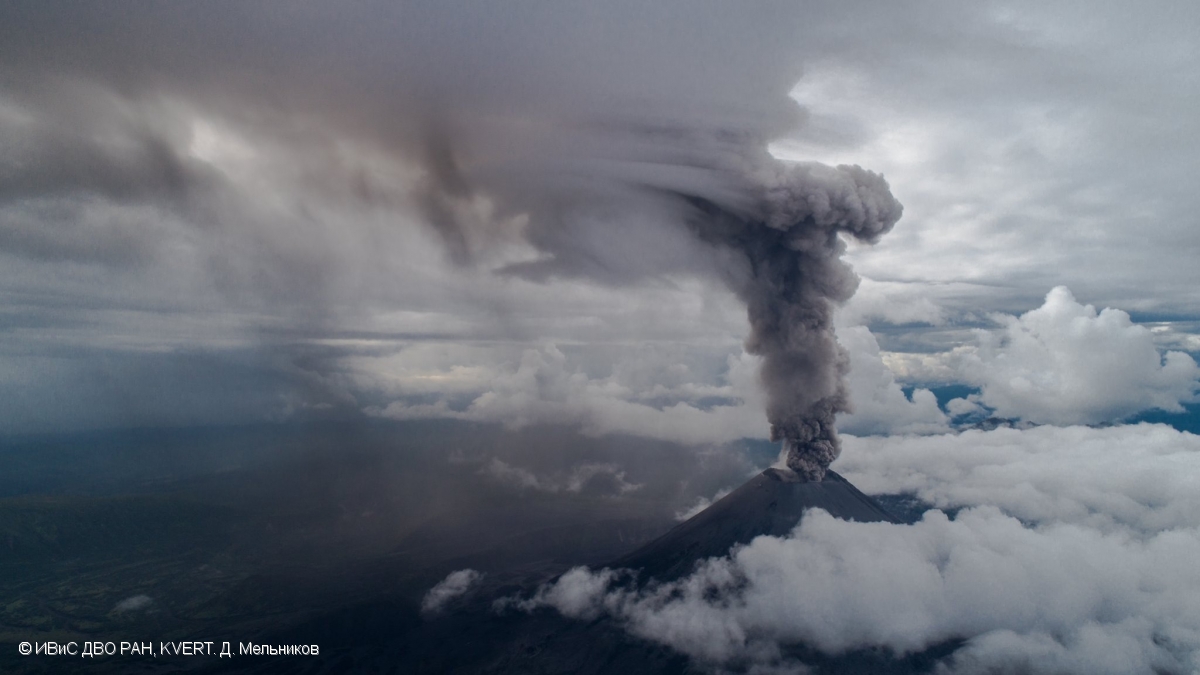
Activity increased significantly on 17 October 2023 when large collapses began during 0700-0830 on the E flanks of the lava dome and continued to after 0930 the next day (figure 57). Ash plumes rose to an altitude of 4.5-5 km, extending 220 km NNE by 18 October. A large explosion at 1630 on 18 October produced an ash plume that rose to an altitude of 11 km (8 km above the summit) and drifted NNE and then NW, extending 900 km NW within two days at an altitude of 8 km. Minor ashfall was noted in Kozyrevsk (45 km WNW). At 0820 on 20 October an ash plume was identified in satellite images drifting 100 km ENE at altitudes of 4-4.5 km.
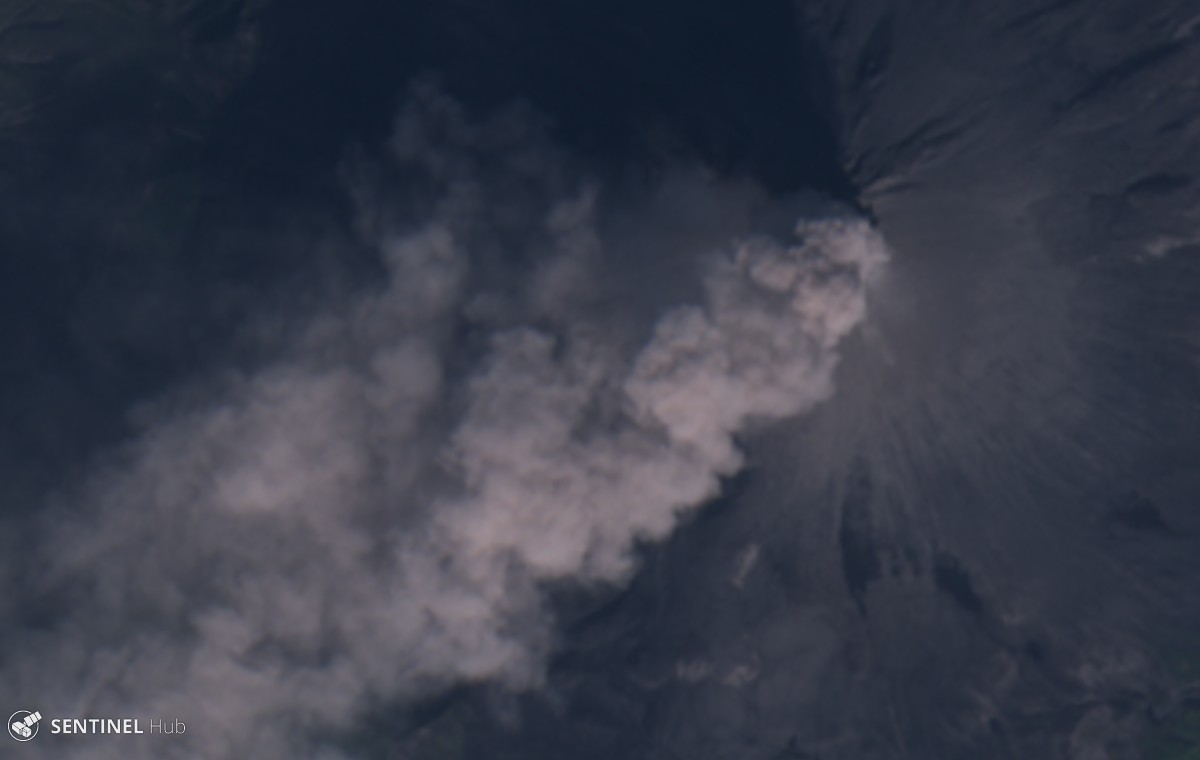
Lava flows and hot avalanches from the dome down the SE flank continued over the next few days, including 23 October when clear conditions allowed good observations (figures 58 and 59). A large thermal anomaly was observed over the volcano through 24 October, and in the summit crater on 30 October (figure 60). Strong fumarolic activity continued, with numerous avalanches and occasional incandescence. By the last week of October, volcanic activity had decreased to a level consistent with that earlier in the reporting period.
Aviation warnings were frequently updated during 17-20 October. KVERT issued a Volcano Observatory Notice for Aviation (VONA) on 17 October at 1419 and 1727 (0219 and 0527 UTC) raising the Aviation Color Code (ACC) from Yellow to Orange (second highest level). The next day, KVERT issued a VONA at 1705 (0505 UTC) raising the ACC to Red (highest level) but lowered it back to Orange at 2117 (0917 UTC). After another decrease to Yellow and back to Orange, the ACC was reduced to Yellow on 20 October at 1204 (0004 UTC). In addition, the Tokyo VAAC issued a series of Volcanic Ash Advisories beginning on 16 October and continuing through 30 October.
Geologic Background. The modern Bezymianny, much smaller than its massive neighbors Kamen and Kliuchevskoi on the Kamchatka Peninsula, was formed about 4,700 years ago over a late-Pleistocene lava-dome complex and an edifice built about 11,000-7,000 years ago. Three periods of intensified activity have occurred during the past 3,000 years. The latest period, which was preceded by a 1,000-year quiescence, began with the dramatic 1955-56 eruption. This eruption, similar to that of St. Helens in 1980, produced a large open crater that was formed by collapse of the summit and an associated lateral blast. Subsequent episodic but ongoing lava-dome growth, accompanied by intermittent explosive activity and pyroclastic flows, has largely filled the 1956 crater.
Information Contacts: Kamchatka Volcanic Eruptions Response Team (KVERT), Far Eastern Branch, Russian Academy of Sciences, 9 Piip Blvd., Petropavlovsk-Kamchatsky, 683006, Russia (URL: http://www.kscnet.ru/ivs/kvert/); Kamchatka Volcanological Station, Kamchatka Branch of Geophysical Survey, (KB GS RAS), Klyuchi, Kamchatka Krai, Russia (URL: http://volkstat.ru/); Tokyo Volcanic Ash Advisory Center (VAAC), 1-3-4 Otemachi, Chiyoda-ku, Tokyo 100-8122, Japan (URL: http://ds.data.jma.go.jp/svd/vaac/data/); Hawai'i Institute of Geophysics and Planetology (HIGP) - MODVOLC Thermal Alerts System, School of Ocean and Earth Science and Technology (SOEST), Univ. of Hawai'i, 2525 Correa Road, Honolulu, HI 96822, USA (URL: http://modis.higp.hawaii.edu/); MIROVA (Middle InfraRed Observation of Volcanic Activity), a collaborative project between the Universities of Turin and Florence (Italy) supported by the Centre for Volcanic Risk of the Italian Civil Protection Department (URL: http://www.mirovaweb.it/); Copernicus Browser, Copernicus Data Space Ecosystem, European Space Agency (URL: https://dataspace.copernicus.eu/browser/).chr
Kilauea (United States) — January 2023 Cite this Report
Kilauea
United States
19.421°N, 155.287°W; summit elev. 1222 m
All times are local (unless otherwise noted)
Low-level lava effusions in the lava lake at Halema’uma’u during July-December 2022
Kīlauea is the southeastern-most volcano in Hawaii and overlaps the E flank of the Mauna Loa volcano. Its East Rift Zone (ERZ) has been intermittently active for at least 2,000 years. An extended eruption period began in January 1983 and was characterized by open lava lakes and lava flows from the summit caldera and the East Rift Zone. During May 2018 magma migrated into the Lower East Rift Zone (LERZ) and opened 24 fissures along a 6-km-long NE-trending fracture zone that produced lava flows traveling in multiple directions. As lava emerged from the fissures, the lava lake at Halema'uma'u drained and explosions sent ash plumes to several kilometers altitude (BGVN 43:10).
The current eruption period started during September 2021 and has recently been characterized by lava effusions, spatter, and sulfur dioxide emissions in the active Halema’uma’u lava lake (BGVN 47:08). Lava effusions, some spatter, and sulfur dioxide emissions have continued during this reporting period of July through December 2022 using daily reports, volcanic activity notices, and abundant photo, map, and video data from the US Geological Survey's (USGS) Hawaiian Volcano Observatory (HVO).
Summary of activity during July-December 2022. Low-level effusions have continued at the western vent of the Halema’uma’u crater during July through early December 2022. Occasional weak ooze-outs (also called lava break outs) would occur along the margins of the crater floor. The overall level of the active lava lake throughout the reporting period gradually increased due to infilling, however it stagnated in mid-September (table 13). During September through November, activity began to decline, though lava effusions persisted at the western vent. By 9 December, the active part of the lava lake had completely crusted over, and incandescence was no longer visible.
Table 13. Summary of measurements taken during overflights at Kīlauea that show a gradual increase in the active lava lake level and the volume of lava effused since 29 September 2021. Lower activity was reported during September-October. Data collected during July-December 2022. Courtesy of HVO.
| Date: |
Level of the active lava lake (m): |
Cumulative volume of lava effused (million cubic meters): |
| 7 Jul 2022 |
130 |
95 |
| 19 Jul 2022 |
133 |
98 |
| 4 Aug 2022 |
136 |
102 |
| 16 Aug 2022 |
137 |
104 |
| 12 Sep 2022 |
143 |
111 |
| 5 Oct 2022 |
143 |
111 |
| 28 Oct 2022 |
143 |
111 |
Activity during July 2022. Lava effusions were reported from the western vent in the Halema’uma’u crater, along with occasional weak ooze-outs along the margins of the crater floor. The height of the lava lake was variable due to deflation-inflation tilt events; for example, the lake level dropped approximately 3-4 m during a summit deflation-inflation event reported on 1 July. Webcam images taken during the night of 6-12 July showed intermittent low-level spattering at the western vent that rose less than 10 m above the vent (figure 519). Measurements made during an overflight on 7 July indicated that the crater floor was infilled about 130 m and that 95 million cubic meters of lava had been effused since 29 September 2021. A single, relatively small lava ooze-out was active to the S of the lava lake. Around midnight on 8 July there were two brief periods of lava overflow onto the lake margins. On 9 July lava ooze-outs were reported near the SE and NE edges of the crater floor and during 10-11 July they occurred near the E, NE, and NW edges. On 16 July crater incandescence was reported, though the ooze-outs and spattering were not visible. On 18 July overnight webcam images showed incandescence in the western vent complex and two ooze-outs were reported around 0000 and 0200 on 19 July. By 0900 there were active ooze-outs along the SW edge of the crater floor. Measurements made from an overflight on 19 July indicated that the crater floor was infilled about 133 m and 98 million cubic meters of lava had erupted since 29 September 2021 (figure 520). On 20 July around 1600 active ooze-outs were visible along the N edge of the crater, which continued through the next day. Extensive ooze-outs occurred along the W margin during 24 July until 1900; on 26 July minor ooze-outs were noted along the N margin. Minor spattering was visible on 29 July along the E margin of the lake. The sulfur dioxide emission rates ranged 650-2,800 tons per day (t/d), the higher of which was measured on 8 July (figure 519).
Activity during August 2022. The eruption continued in the Halema’uma’u crater at the western vent. According to HVO the lava in the active lake remained at the level of the bounding levees. Occasional minor ooze-outs were observed along the margins of the crater floor. Strong nighttime crater incandescence was visible after midnight on 6 August over the western vent cone. During 6-7 August scattered small lava lobes were active along the crater floor and incandescence persisted above the western vent through 9 August. During 7-9 August HVO reported a single lava effusion source was active along the NW margin of the crater floor. Measurements from an overflight on 4 August indicated that the crater floor was infilled about 136 m total and that 102 million cubic meters of lava had been erupted since the start of the eruption. Lava breakouts were reported along the N, NE, E, S, and W margins of the crater during 10-16 August. Another overflight survey conducted on 16 August indicated that the crater floor infilled about 137 m and 104 million cubic meters of lava had been erupted since September 2021. Measured sulfur dioxide emissions rates ranged 1,150-2,450 t/d, the higher of which occurred on 8 August.
Activity during September 2022. During September, lava effusion continued from the western vent into the active lava lake and onto the crater floor. Intermittent minor ooze-outs were reported through the month. A small ooze-out was visible on the W crater floor margin at 0220 on 2 September, which showed decreasing surface activity throughout the day, but remained active through 3 September. On 3 September around 1900 a lava outbreak occurred along the NW margin of the crater floor but had stopped by the evening of 4 September. Field crews monitoring the summit lava lake on 9 September observed spattering on the NE margin of the lake that rose no higher than 10 m, before falling back onto the lava lake crust (figure 521). Overflight measurements on 12 September indicated that the crater floor was infilled a total of 143 m and 111 million cubic meters of lava had been erupted since September 2021. Extensive breakouts in the W and N part of the crater floor were reported at 1600 on 20 September and continued into 26 September. The active part of the lava lake dropped by 10 m while other parts of the crater floor dropped by several meters. Summit tiltmeters recorded a summit seismic swarm of more than 80 earthquakes during 1500-1800 on 21 September, which occurred about 1.5 km below Halema’uma’u; a majority of these were less than Mw 2. By 22 September the active part of the lava lake was infilled about 2 m. On 23 September the western vent areas exhibited several small spatter cones with incandescent openings, along with weak, sporadic spattering (figure 522). The sulfur dioxide emission rate ranged from 930 t/d to 2,000 t/d, the higher of which was measured on 6 September.
Activity during October 2022. Activity during October declined slightly compared to previous months, though lava effusions persisted from the western vent into the active lava lake and onto the crater floor during October (figure 523). Slight variations in the lava lake were noted throughout the month. HVO reported that around 0600 on 3 October the level of the lava lake has lowered slightly. Overflight measurements taken on 5 October indicated that the crater floor was infilled a total of about 143 m and that 111 million cubic meters of lava had been effused since September 2021. During 6-7 October the lake gradually rose 0.5 m. Sulfur dioxide measurements made on 22 October had an emission rate of 700 t/d. Another overflight taken on 28 October showed that there was little to no change in the elevation of the crater floor: the crater floor was infilled a total of 143 m and 111 million cubic meters of lava had erupted since the start of the eruption.
Activity during November 2022. Activity remained low during November, though HVO reported that lava from the western vent continued to effuse into the active lava lake and onto the crater floor throughout the month. The rate of sulfur dioxide emissions during November ranged from 300-600 t/d, the higher amount of which occurred on 9 November.
Activity during December 2022. Similar low activity was reported during December, with lava effusing from the western vent into the active lava lake and onto the crater floor. During 4-5 December the active part of the lava lake was slightly variable in elevation and fluctuated within 1 m. On 9 December HVO reported that lava was no longer erupting from the western vent in the Halema’uma’u crater and that sulfur dioxide emissions had returned to near pre-eruption background levels; during 10-11 December, the lava lake had completely crusted over, and no incandescence was visible (figure 524). Time lapse camera images covering the 4-10 December showed that the crater floor showed weak deflation and no inflation. Some passive events of crustal overturning were reported during 14-15 December, which brought fresh incandescent lava to the lake surface. The sulfur dioxide emission rate was approximately 200 t/d on 14 December. A smaller overturn event on 17 December and another that occurred around 0000 and into the morning of 20 December were also detected. A small seismic swarm was later detected on 30 December.
Geologic Background. Kilauea overlaps the E flank of the massive Mauna Loa shield volcano in the island of Hawaii. Eruptions are prominent in Polynesian legends; written documentation since 1820 records frequent summit and flank lava flow eruptions interspersed with periods of long-term lava lake activity at Halemaumau crater in the summit caldera until 1924. The 3 x 5 km caldera was formed in several stages about 1,500 years ago and during the 18th century; eruptions have also originated from the lengthy East and Southwest rift zones, which extend to the ocean in both directions. About 90% of the surface of the basaltic shield volcano is formed of lava flows less than about 1,100 years old; 70% of the surface is younger than 600 years. The long-term eruption from the East rift zone between 1983 and 2018 produced lava flows covering more than 100 km2, destroyed hundreds of houses, and added new coastline.
Information Contacts: Hawaiian Volcano Observatory (HVO), U.S. Geological Survey, PO Box 51, Hawai'i National Park, HI 96718, USA (URL: http://hvo.wr.usgs.gov/).
Nyamulagira (DR Congo) — November 2023 Cite this Report
Nyamulagira
DR Congo
1.408°S, 29.2°E; summit elev. 3058 m
All times are local (unless otherwise noted)
Lava flows and thermal activity during May-October 2023
Nyamulagira (also known as Nyamuragira) is a shield volcano in the Democratic Republic of Congo with the summit truncated by a small 2 x 2.3 km caldera with walls up to about 100 m high. Documented eruptions have occurred within the summit caldera, as well as from numerous flank fissures and cinder cones. The current eruption period began in April 2018 and has more recently been characterized by summit crater lava flows and thermal activity (BGVN 48:05). This report describes lava flows and variable thermal activity during May through October 2023, based on information from the Observatoire Volcanologique de Goma (OVG) and various satellite data.
Lava lake activity continued during May. The MIROVA (Middle InfraRed Observation of Volcanic Activity) system recorded moderate-to-strong thermal activity throughout the reporting period; activity was more intense during May and October and relatively weaker from June through September (figure 95). The MODVOLC thermal algorithm, detected a total of 209 thermal alerts. There were 143 hotspots detected during May, eight during June, nine during September, and 49 during October. This activity was also reflected in infrared satellite images, where a lava flow was visible in the NW part of the crater on 7 May and strong activity was seen in the center of the crater on 4 October (figure 96). Another infrared satellite image taken on 12 May showed still active lava flows along the NW margin of the crater. According to OVG lava effusions were active during 7-29 May and moved to the N and NW parts of the crater beginning on 9 May. Strong summit crater incandescence was visible from Goma (27 km S) during the nights of 17, 19, and 20 May (figure 97). On 17 May there was an increase in eruptive activity, which peaked at 0100 on 20 May. Notable sulfur dioxide plumes drifted NW and W during 19-20 May (figure 98). Drone footage acquired in partnership with the USGS (United States Geological Survey) on 20 May captured images of narrow lava flows that traveled about 100 m down the W flank (figure 99). Data from the Rumangabo seismic station indicated a decreasing trend in activity during 17-21 May. Although weather clouds prevented clear views of the summit, a strong thermal signature on the NW flank was visible in an infrared satellite image on 22 May, based on an infrared satellite image. On 28 May the lava flows on the upper W flank began to cool and solidify. By 29 May seismicity returned to levels similar to those recorded before the 17 May increase. Lava effusion continued but was confined to the summit crater; periodic crater incandescence was observed.
Low-level activity was noted during June through October. On 1 June OVG reported that seismicity remained at lower levels and that crater incandescence had been absent for three days, though infrared satellite imagery showed continued lava effusion in the summit crater. The lava flows on the flanks covered an estimated 0.6 km2. Satellite imagery continued to show thermal activity confined to the lava lake through October (figure 96), although no lava flows or significant sulfur dioxide emissions were reported.
Geologic Background. Africa's most active volcano, Nyamulagira (also known as Nyamuragira), is a massive high-potassium basaltic shield about 25 km N of Lake Kivu and 13 km NNW of the steep-sided Nyiragongo volcano. The summit is truncated by a small 2 x 2.3 km caldera that has walls up to about 100 m high. Documented eruptions have occurred within the summit caldera, as well as from the numerous flank fissures and cinder cones. A lava lake in the summit crater, active since at least 1921, drained in 1938, at the time of a major flank eruption. Recent lava flows extend down the flanks more than 30 km from the summit as far as Lake Kivu; extensive lava flows from this volcano have covered 1,500 km2 of the western branch of the East African Rift.
Information Contacts: Observatoire Volcanologique de Goma (OVG), Departement de Geophysique, Centre de Recherche en Sciences Naturelles, Lwiro, D.S. Bukavu, DR Congo; Hawai'i Institute of Geophysics and Planetology (HIGP) - MODVOLC Thermal Alerts System, School of Ocean and Earth Science and Technology (SOEST), Univ. of Hawai'i, 2525 Correa Road, Honolulu, HI 96822, USA (URL: http://modis.higp.hawaii.edu/); MIROVA (Middle InfraRed Observation of Volcanic Activity), a collaborative project between the Universities of Turin and Florence (Italy) supported by the Centre for Volcanic Risk of the Italian Civil Protection Department (URL: http://www.mirovaweb.it/); NASA Global Sulfur Dioxide Monitoring Page, Atmospheric Chemistry and Dynamics Laboratory, NASA Goddard Space Flight Center (NASA/GSFC), 8800 Greenbelt Road, Goddard, Maryland, USA (URL: https://so2.gsfc.nasa.gov/); Copernicus Browser, Copernicus Data Space Ecosystem, European Space Agency (URL: https://dataspace.copernicus.eu/browser/); Charles Balagizi, Goma Volcano Observatory, Departement de Geophysique, Centre de Recherche en Sciences Naturelles, Lwiro, D.S. Bukavu, DR Congo.
Bagana (Papua New Guinea) — October 2023 Cite this Report
Bagana
Papua New Guinea
6.137°S, 155.196°E; summit elev. 1855 m
All times are local (unless otherwise noted)
Explosions, ash plumes, ashfall, and lava flows during April-September 2023
The remote volcano of Bagana is located in central Bougainville Island, Papua New Guinea. Recorded eruptions date back to 1842 and activity has consisted of effusive activity that has built a small lava dome in the summit crater and occasional explosions that produced pyroclastic flows. The most recent eruption has been ongoing since February 2000 and has produced occasional explosions, ash plumes, and lava flows. More recently, activity has been characterized by ongoing effusive activity and ash emissions (BGVN 48:04). This report updates activity from April through September 2023 that has consisted of explosions, ash plumes, ashfall, and lava flows, using information from the Darwin Volcanic Ash Advisory Center (VAAC) and satellite data.
An explosive eruption was reported on 7 July that generated a large gas-and-ash plume to high altitudes and caused significant ashfall in local communities; the eruption plume had reached upper tropospheric (16-18 km altitude) altitudes by 2200, according to satellite images. Sulfur dioxide plumes were detected in satellite images on 8 July and indicated that the plume was likely a mixture of gas, ice, and ash. A report issued by the Autonomous Bougainville Government (ABG) (Torokina District, Education Section) on 10 July noted that significant ash began falling during 2000-2100 on 7 July and covered most areas in the Vuakovi, Gotana (9 km SW), Koromaketo, Laruma (25 km W) and Atsilima (27 km NW) villages. Pyroclastic flows also occurred, according to ground-based reports; small deposits confined to one drainage were inspected by RVO during an overflight on 17 July and were confirmed to be from the 7 July event. Ashfall continued until 10 July and covered vegetation, which destroyed bushes and gardens and contaminated rivers and streams.
RVO reported another eruption on 14 July. The Darwin VAAC stated that an explosive event started around 0830 on 15 July and produced an ash plume that rose to 16.5 km altitude by 1000 and drifted N, according to satellite images. The plume continued to drift N and remained visible through 1900, and by 2150 it had dissipated.
Ashfall likely from both the 7 and 15 July events impacted about 8,111 people in Torokina (20 km SW), including Tsito/Vuakovi, Gotana, Koromaketo, Kenaia, Longkogari, Kenbaki, Piva (13 km SW), and Atsinima, and in the Tsitovi district, according to ABG. Significant ashfall was also reported in Ruruvu (22 km N) in the Wakunai District of Central Bougainville, though the thickness of these deposits could not be confirmed. An evacuation was called for the villages in Wakunai, where heavy ashfall had contaminated water sources; the communities of Ruruvu, Togarau, Kakarapaia, Karauturi, Atao, and Kuritaturi were asked to evacuate to a disaster center at the Wakunai District Station, and communities in Torokina were asked to evacuate to the Piva District station. According to a news article, more than 7,000 people needed temporary accommodations, with about 1,000 people in evacuation shelters. Ashfall had deposited over a broad area, contaminating water supplies, affecting crops, and collapsing some roofs and houses in rural areas. Schools were temporarily shut down. Intermittent ash emissions continued through the end of July and drifted NNW, NW, and SW. Fine ashfall was reported on the coast of Torokina, and ash plumes also drifted toward Laruma and Atsilima.
A small explosive eruption occurred at 2130 on 28 July that ejected material from the crater vents, according to reports from Torokina, in addition to a lava flow that contained two lobes. A second explosion was detected at 2157. Incandescence from the lava flow was visible from Piva as it descended the W flank around 2000 on 29 July (figure 47). The Darwin VAAC reported that a strong thermal anomaly was visible in satellite images during 30-31 July and that ash emissions rose to 2.4 km altitude and drifted WSW on 30 July. A ground report from RVO described localized emissions at 0900 on 31 July.
The Darwin VAAC reported that ash plumes were identified in satellite imagery at 0800 and 1220 on 12 August and rose to 2.1 km and 3 km altitude and drifted NW and W, respectively. A news report stated that aid was sent to more than 6,300 people that were adversely affected by the eruption. Photos taken during 17-19 August showed ash emissions rising no higher than 1 km above the summit and drifting SE. A small explosion generated an ash plume during the morning of 19 August. Deposits from small pyroclastic flows were also captured in the photos. Satellite images captured lava flows and pyroclastic flow deposits. Two temporary seismic stations were installed near Bagana on 17 August at distances of 7 km WSW (Vakovi station) and 11 km SW (Kepox station). The Kepox station immediately started to record continuous, low-frequency background seismicity.
Satellite data. Little to no thermal activity was detected during April through mid-July 2023; only one anomaly was recorded during early April and one during early June, according to MIROVA (Middle InfraRed Observation of Volcanic Activity) data (figure 48). Thermal activity increased in both power and frequency during mid-July through September, although there were still some short gaps in detected activity. MODVOLC also detected increased thermal activity during August; thermal hotspots were detected a total of five times on 19, 20, and 27 August. Weak thermal anomalies were also captured in infrared satellite images on clear weather days throughout the reporting period on 7, 12, and 17 April, 27 May, 1, 6, 16, and 31 July, and 19 September (figure 48); a strong thermal anomaly was visible on 31 July. Distinct sulfur dioxide plumes that drifted generally NW were intermittently captured by the TROPOMI instrument on the Sentinel-5P satellite and sometimes exceeded two Dobson Units (DUs) (figure 49).
Geologic Background. Bagana volcano, in a remote portion of central Bougainville Island, is frequently active. This massive symmetrical cone was largely constructed by an accumulation of viscous andesitic lava flows. The entire edifice could have been constructed in about 300 years at its present rate of lava production. Eruptive activity is characterized by non-explosive effusion of viscous lava that maintains a small lava dome in the summit crater, although occasional explosive activity produces pyroclastic flows. Lava flows with tongue-shaped lobes up to 50 m thick and prominent levees descend the flanks on all sides.
Information Contacts: Rabaul Volcano Observatory (RVO), Geohazards Management Division, Department of Mineral Policy and Geohazards Management (DMPGM), PO Box 3386, Kokopo, East New Britain Province, Papua New Guinea; Darwin Volcanic Ash Advisory Centre (VAAC), Bureau of Meteorology, Northern Territory Regional Office, PO Box 40050, Casuarina, NT 0811, Australia (URL: http://www.bom.gov.au/info/vaac/); MIROVA (Middle InfraRed Observation of Volcanic Activity), a collaborative project between the Universities of Turin and Florence (Italy) supported by the Centre for Volcanic Risk of the Italian Civil Protection Department (URL: http://www.mirovaweb.it/); Hawai'i Institute of Geophysics and Planetology (HIGP) - MODVOLC Thermal Alerts System, School of Ocean and Earth Science and Technology (SOEST), Univ. of Hawai'i, 2525 Correa Road, Honolulu, HI 96822, USA (URL: http://modis.higp.hawaii.edu/); NASA Global Sulfur Dioxide Monitoring Page, Atmospheric Chemistry and Dynamics Laboratory, NASA Goddard Space Flight Center (NASA/GSFC), 8800 Greenbelt Road, Goddard, Maryland, USA (URL: https://so2.gsfc.nasa.gov/); Copernicus Browser, Copernicus Data Space Ecosystem, European Space Agency (URL: https://dataspace.copernicus.eu/browser/); Autonomous Bougainville Government, P.O Box 322, Buka, AROB, PNG (URL: https://abg.gov.pg/); Andrew Tupper (Twitter: @andrewcraigtupp); Simon Carn, Geological and Mining Engineering and Sciences, Michigan Technological University, 1400 Townsend Drive, Houghton, MI 49931, USA (URL: http://www.volcarno.com/, Twitter: @simoncarn); Radio NZ (URL: https://www.rnz.co.nz/news/pacific/494464/more-than-7-000-people-in-bougainville-need-temporary-accommodation-after-eruption); USAID, 1300 Pennsylvania Ave, NW, Washington DC 20004, USA (URL: https://www.usaid.gov/pacific-islands/press-releases/aug-08-2023-united-states-provides-immediate-emergency-assistance-support-communities-affected-mount-bagana-volcanic-eruptions).
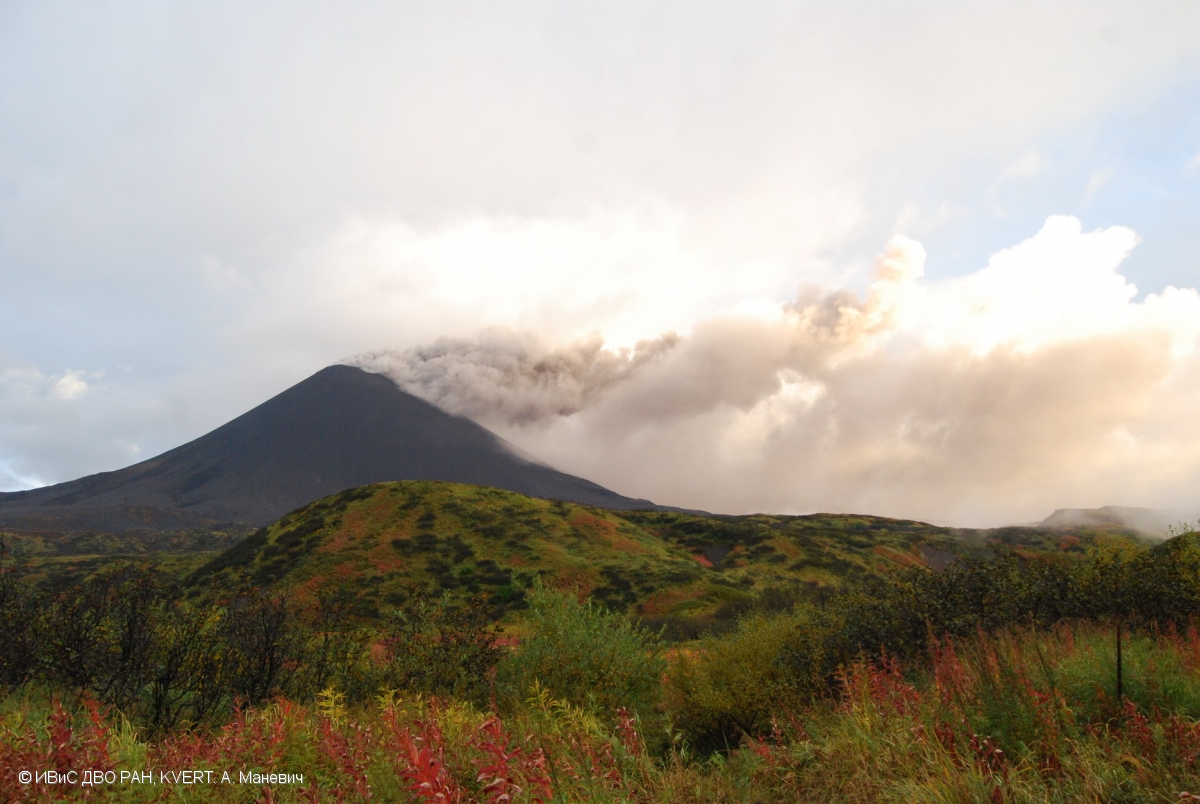
Mayon (Philippines) — October 2023 Cite this Report
Mayon
Philippines
13.257°N, 123.685°E; summit elev. 2462 m
All times are local (unless otherwise noted)
Lava flows, pyroclastic flows, ash emissions, and seismicity during April-September 2023
Mayon is located in the Philippines and has steep upper slopes capped by a small summit crater. Historical eruptions date back to 1616 CE that have been characterized by Strombolian eruptions, lava flows, pyroclastic flows, and mudflows. Eruptions mostly originated from a central conduit. Pyroclastic flows and mudflows have commonly descended many of the approximately 40 drainages that surround the volcano. The most recent eruption occurred during June through October 2022 and consisted of lava dome growth and gas-and-steam emissions (BGVN 47:12). A new eruption was reported during late April 2023 and has included lava flows, pyroclastic density currents, ash emissions, and seismicity. This report covers activity during April through September 2023 based on daily bulletins from the Philippine Institute of Volcanology and Seismology (PHIVOLCS).
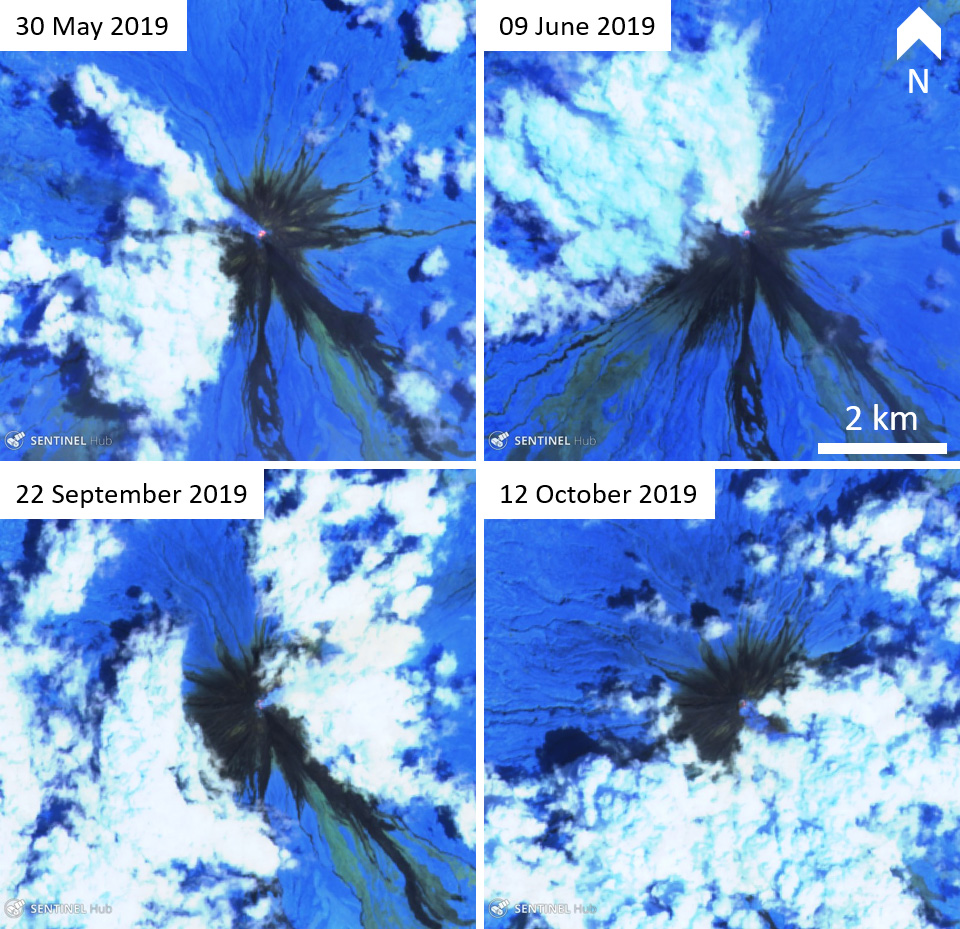
During April through September 2023, PHIVOLCS reported near-daily rockfall events, frequent volcanic earthquakes, and sulfur dioxide measurements. Gas-and-steam emissions rose 100-900 m above the crater and drifted in different directions. Nighttime crater incandescence was often visible during clear weather and was accompanied by incandescent avalanches of material. Activity notably increased during June when lava flows were reported on the S, SE, and E flanks (figure 52). The MIROVA graph (Middle InfraRed Observation of Volcanic Activity) showed strong thermal activity coincident with these lava flows, which remained active through September (figure 53). According to the MODVOLC thermal algorithm, a total of 110 thermal alerts were detected during the reporting period: 17 during June, 40 during July, 27 during August, and 26 during September. During early June, pyroclastic density currents (PDCs) started to occur more frequently.
Low activity was reported during much of April and May; gas-and-steam emissions rose 100-900 m above the crater and generally drifted in different directions. A total of 52 rockfall events and 18 volcanic earthquakes were detected during April and 147 rockfall events and 13 volcanic events during May. Sulfur dioxide flux measurements ranged between 400-576 tons per day (t/d) during April, the latter of which was measured on 29 April and between 162-343 t/d during May, the latter of which was measured on 13 May.
Activity during June increased, characterized by lava flows, pyroclastic density currents (PDCs), crater incandescence and incandescent rockfall events, gas-and-steam emissions, and continued seismicity. Weather clouds often prevented clear views of the summit, but during clear days, moderate gas-and-steam emissions rose 100-2,500 m above the crater and drifted in multiple directions. A total of 6,237 rockfall events and 288 volcanic earthquakes were detected. The rockfall events often deposited material on the S and SE flanks within 700-1,500 m of the summit crater and ash from the events drifted SW, S, SE, NE, and E. Sulfur dioxide emissions ranged between 149-1,205 t/d, the latter of which was measured on 10 June. Short-term observations from EDM and electronic tiltmeter monitoring indicated that the upper slopes were inflating since February 2023. Longer-term ground deformation parameters based on EDM, precise leveling, continuous GPS, and electronic tilt monitoring indicated that the volcano remained inflated, especially on the NW and SE flanks. At 1000 on 5 June the Volcano Alert Level (VAL) was raised to 2 (on a 0-5 scale). PHIVOLCS noted that although low-level volcanic earthquakes, ground deformation, and volcanic gas emissions indicated unrest, the steep increase in rockfall frequency may indicate increased dome activity.
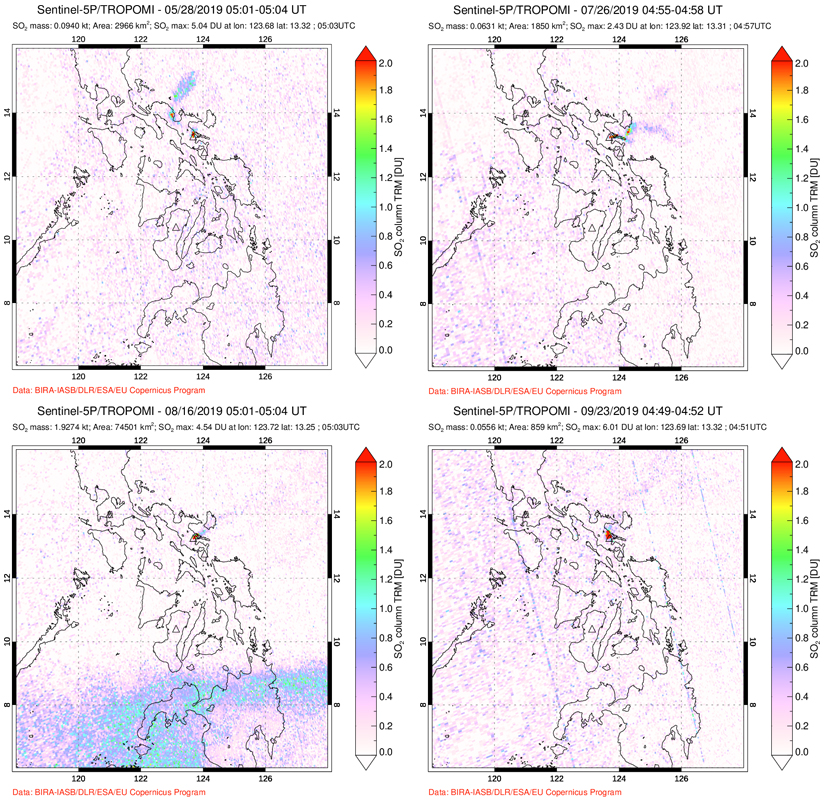
A total of 151 dome-collapse PDCs occurred during 8-9 and 11-30 June, traveled 500-2,000 m, and deposited material on the S flank within 2 km of the summit crater. During 8-9 June the VAL was raised to 3. At approximately 1947 on 11 June lava flow activity was reported; two lobes traveled within 500 m from the crater and deposited material on the S (Mi-isi), SE (Bonga), and E (Basud) flanks. Weak seismicity accompanied the lava flow and slight inflation on the upper flanks. This lava flow remained active through 30 June, moving down the S and SE flank as far as 2.5 km and 1.8 km, respectively and depositing material up to 3.3 km from the crater. During 15-16 June traces of ashfall from the PDCs were reported in Sitio Buga, Nabonton, City of Ligao and Purok, and San Francisco, Municipality of Guinobatan. During 28-29 June there were two PDCs generated by the collapse of the lava flow front, which generated a light-brown ash plume 1 km high. Satellite monitors detected significant concentrations of sulfur dioxide beginning on 29 June. On 30 June PDCs primarily affected the Basud Gully on the E flank, the largest of which occurred at 1301 and lasted eight minutes, based on the seismic record. Four PDCs generated between 1800 and 2000 that lasted approximately four minutes each traveled 3-4 km on the E flank and generated an ash plume that rose 1 km above the crater and drifted N and NW. Ashfall was recorded in Tabaco City.
Similar strong activity continued during July; slow lava effusion remained active on the S and SE flanks and traveled as far as 2.8 km and 2.8 km, respectively and material was deposited as far as 4 km from the crater. There was a total of 6,983 rockfall events and 189 PDCs that affected the S, SE, and E flanks. The volcano network detected a total of 2,124 volcanic earthquakes. Continuous gas-and-steam emissions rose 200-2,000 m above the crater and drifted in multiple directions. Sulfur dioxide emissions averaged 792-4,113 t/d, the latter of which was measured on 28 July. During 2-4 July three PDCs were generated from the collapse of the lava flow and resulting light brown plumes rose 200-300 m above the crater. Continuous tremor pulses were reported beginning at 1547 on 3 July through 7 July at 1200, at 2300 on 8 July and going through 0300 on 10 July, and at 2300 on 16 July, as recorded by the seismic network. During 6-9 July there were 10 lava flow-collapse-related PDCs that generated light brown plumes 300-500 m above the crater. During 10-11 July light ashfall was reported in some areas of Mabinit, Legazpi City, Budiao and Salvacion, Daraga, and Camalig, Albay. By 18 July the lava flow advanced 600 m on the E flank as well.
During 1733 on 18 July and 0434 on 19 July PHIVOLCS reported 30 “ashing” events, which are degassing events accompanied by audible thunder-like sounds and entrained ash at the crater, which produced short, dark plumes that drifted SW. These events each lasted 20-40 seconds, and plume heights ranged from 150-300 m above the crater, as recorded by seismic, infrasound, visual, and thermal monitors. Three more ashing events occurred during 19-20 July. Short-term observations from electronic tilt and GPS monitoring indicate deflation on the E lower flanks in early July and inflation on the NW middle flanks during the third week of July. Longer-term ground deformation parameters from EDM, precise leveling, continuous GPS, and electronic tilt monitoring indicated that the volcano was still generally inflated relative to baseline levels. A short-lived lava pulse lasted 28 seconds at 1956 on 21 July, which was accompanied by seismic and infrasound signals. By 22 July, the only lava flow that remained active was on the SE flank, and continued to extend 3.4 km, while those on the S and E flanks weakened markedly. One ashing event was detected during 30-31 July, whereas there were 57 detected during 31 July-1 August; according to PHIVOLCS beginning at approximately 1800 on 31 July eruptive activity was dominated by phases of intermittent ashing, as well as increased in the apparent rates of lava effusion from the summit crater. The ashing phases consisted of discrete events recorded as low-frequency volcanic earthquakes (LFVQ) typically 30 seconds in duration, based on seismic and infrasound signals. Gray ash plume rose 100 m above the crater and generally drifted NE. Shortly after these ashing events began, new lava began to effuse rapidly from the crater, feeding the established flowed on the SE, E, and E flanks and generating frequent rockfall events.
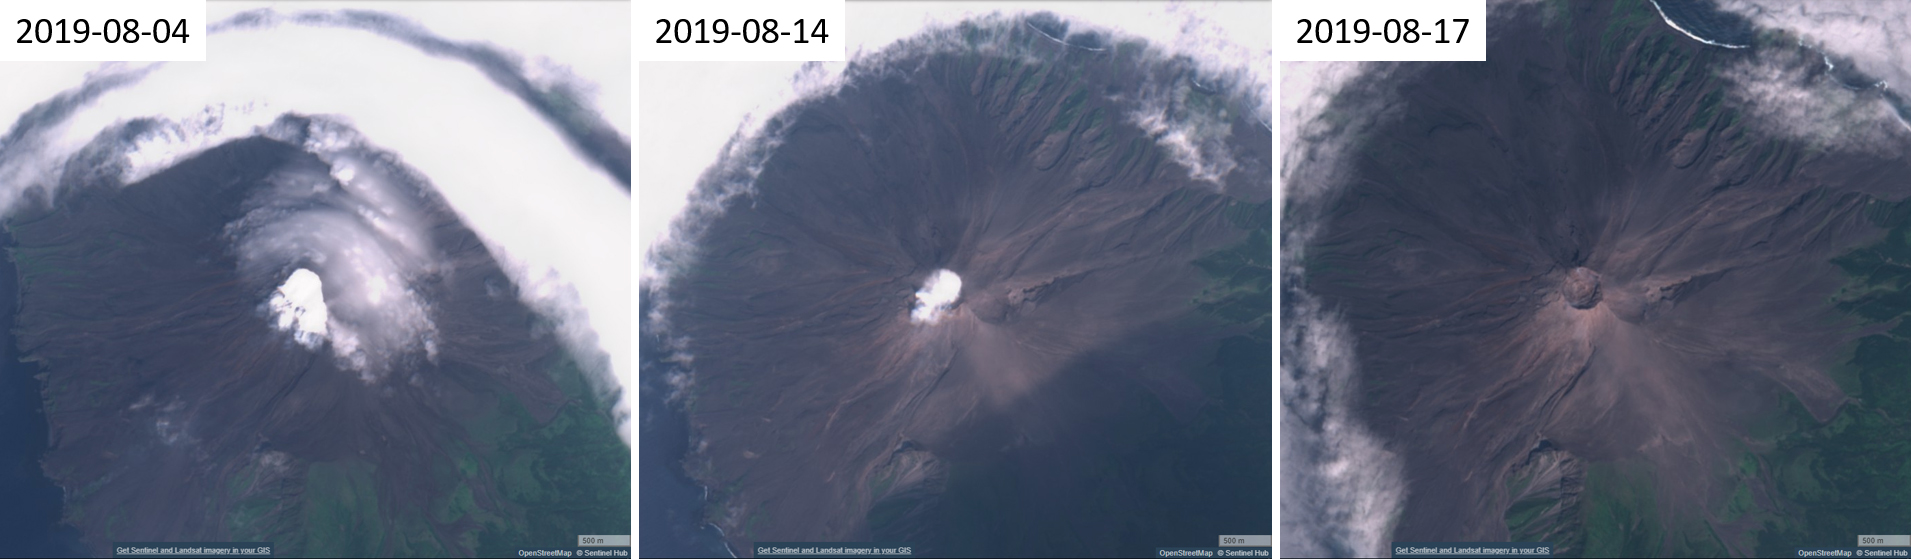
Intensified unrest persisted during August. There was a total of 4,141 rockfall events, 2,881 volcanic earthquakes, which included volcanic tremor events, 32 ashing events, and 101 PDCs detected throughout the month. On clear weather days, gas-and-steam emissions rose 300-1,500 m above the crater and drifted in different directions (figure 54). Sulfur dioxide emissions averaged 735-4,756 t/d, the higher value of which was measured on 16 August. During 1-2 August the rate of lava effusion decreased, but continued to feed the flows on the SE, S, and E flanks, maintaining their advances to 3.4 km, 2.8 km, and 1.1 km from the crater, respectively (figure 55). Rockfall and PDCs generated by collapses at the lava flow margins and from the summit dome deposited material within 4 km of the crater. During 3-4 August there were 10 tremor events detected that lasted 1-4 minutes. Short-lived lava pulse lasted 35 seconds and was accompanied by seismic and infrasound signals at 0442 on 6 August. Seven collapses were recorded at the front of the lava flow during 12-14 August.
During September, similar activity of slow lava effusion, PDCs, gas-and-steam emissions, and seismicity continued. There was a total of 4,452 rockfall events, 329 volcanic earthquakes, which included volcanic tremor events, two ashing events, and 85 PDCs recorded throughout the month. On clear weather days, gas-and-steam emissions rose 100-1,500 m above the crater and drifted in multiple directions. Sulfur dioxide emissions averaged 609-2,252 t/d, the higher average of which was measured on 6 September. Slow lava effusion continued advancing on the SE, S, and E flanks, maintaining lengths of 3.4 km, 2.8 km, and 1.1 km, respectively. Rockfall and PDC events generated by collapses along the lava flow margins and at the summit dome deposited material within 4 km of the crater.
Geologic Background. Symmetrical Mayon, which rises above the Albay Gulf NW of Legazpi City, is the most active volcano of the Philippines. The steep upper slopes are capped by a small summit crater. Recorded eruptions since 1616 CE range from Strombolian to basaltic Plinian, with cyclical activity beginning with basaltic eruptions, followed by longer periods of andesitic lava flows. Eruptions occur predominately from the central conduit and have also produced lava flows that travel far down the flanks. Pyroclastic density currents and mudflows have commonly swept down many of the approximately 40 ravines that radiate from the summit and have often damaged populated lowland areas. A violent eruption in 1814 killed more than 1,200 people and devastated several towns.
Information Contacts: Philippine Institute of Volcanology and Seismology (PHIVOLCS), Department of Science and Technology, University of the Philippines Campus, Diliman, Quezon City, Philippines (URL: http://www.phivolcs.dost.gov.ph/); MIROVA (Middle InfraRed Observation of Volcanic Activity), a collaborative project between the Universities of Turin and Florence (Italy) supported by the Centre for Volcanic Risk of the Italian Civil Protection Department (URL: http://www.mirovaweb.it/); Hawai'i Institute of Geophysics and Planetology (HIGP) - MODVOLC Thermal Alerts System, School of Ocean and Earth Science and Technology (SOEST), Univ. of Hawai'i, 2525 Correa Road, Honolulu, HI 96822, USA (URL: http://modis.higp.hawaii.edu/); Copernicus Browser, Copernicus Data Space Ecosystem, European Space Agency (URL: https://dataspace.copernicus.eu/browser/); William Rogers, Legazpi City, Albay Province, Philippines.
Nishinoshima (Japan) — October 2023 Cite this Report
Nishinoshima
Japan
27.247°N, 140.874°E; summit elev. 100 m
All times are local (unless otherwise noted)
Eruption plumes and gas-and-steam plumes during May-August 2023
Nishinoshima, located about 1,000 km S of Tokyo, is a small island in the Ogasawara Arc in Japan. The island is the summit of a massive submarine volcano that has prominent submarine peaks to the S, W, and NE. Eruptions date back to 1973 and the current eruption period began in October 2022. Recent activity has consisted of small ash plumes and fumarolic activity (BGVN 48:07). This report covers activity during May through August 2023, using information from monthly reports of the Japan Meteorological Agency (JMA) monthly reports and satellite data.
Activity during May through June was relatively low. The Japan Coast Guard (JCG) did overflights on 14 and 22 June and reported white gas-and-steam emissions rising 600 m and 1,200 m from the central crater of the pyroclastic cone, respectively (figure 125). In addition, multiple white gas-and-steam emissions rose from the inner rim of the W side of the crater and from the SE flank of the pyroclastic cone. Discolored brown-to-green water was observed around almost the entire perimeter of the island; on 22 June light green discolored water was observed off the S coast of the island.
Observations from the Himawari meteorological satellite confirmed an eruption on 9 and 10 July. An eruption plume rose 1.6 km above the crater and drifted N around 1300 on 9 July. Satellite images acquired at 1420 and 2020 on 9 July and at 0220 on 10 July showed continuing emissions that rose 1.3-1.6 km above the crater and drifted NE and N. The Tokyo VAAC reported that an ash plume seen by a pilot and identified in a satellite image at 0630 on 21 July rose to 3 km altitude and drifted S.
Aerial observations conducted by JCG on 8 August showed a white-and-gray plume rising from the central crater of the pyroclastic cone, and multiple white gas-and-steam emissions were rising from the inner edge of the western crater and along the NW-SE flanks of the island (figure 126). Brown-to-green discolored water was also noted around the perimeter of the island.
Intermittent low-to-moderate power thermal anomalies were recorded in the MIROVA graph (Middle InfraRed Observation of Volcanic Activity), showing an increase in both frequency and power beginning in July (figure 127). This increase in activity coincides with eruptive activity on 9 and 10 July, characterized by eruption plumes. According to the MODVOLC thermal alert algorithm, one thermal hotspot was recorded on 20 July. Weak thermal anomalies were also detected in infrared satellite imagery, accompanied by strong gas-and-steam plumes (figure 128).
Geologic Background. The small island of Nishinoshima was enlarged when several new islands coalesced during an eruption in 1973-74. Multiple eruptions that began in 2013 completely covered the previous exposed surface and continued to enlarge the island. The island is the summit of a massive submarine volcano that has prominent peaks to the S, W, and NE. The summit of the southern cone rises to within 214 m of the ocean surface 9 km SSE.
Information Contacts: Japan Meteorological Agency (JMA), 1-3-4 Otemachi, Chiyoda-ku, Tokyo 100-8122, Japan (URL: http://www.jma.go.jp/jma/indexe.html); Tokyo Volcanic Ash Advisory Center (VAAC), 1-3-4 Otemachi, Chiyoda-ku, Tokyo 100-8122, Japan (URL: http://ds.data.jma.go.jp/svd/vaac/data/); MIROVA (Middle InfraRed Observation of Volcanic Activity), a collaborative project between the Universities of Turin and Florence (Italy) supported by the Centre for Volcanic Risk of the Italian Civil Protection Department (URL: http://www.mirovaweb.it/); Copernicus Browser, Copernicus Data Space Ecosystem, European Space Agency (URL: https://dataspace.copernicus.eu/browser/).
Krakatau (Indonesia) — October 2023 Cite this Report
Krakatau
Indonesia
6.1009°S, 105.4233°E; summit elev. 285 m
All times are local (unless otherwise noted)
White gas-and-steam plumes and occasional ash plumes during May-August 2023
Krakatau is located in the Sunda Strait between Java and Sumatra, Indonesia. Caldera collapse during the catastrophic 1883 eruption destroyed Danan and Perbuwatan cones and left only a remnant of Rakata. The post-collapse cone of Anak Krakatau (Child of Krakatau) was constructed within the 1883 caldera at a point between the former Danan and Perbuwatan cones; it has been the site of frequent eruptions since 1927. The current eruption period began in May 2021 and has recently consisted of Strombolian eruptions and ash plumes (BGVN 48:07). This report describes lower levels of activity consisting of ash and white gas-and-steam plumes during May through August 2023, based on information provided by the Indonesian Center for Volcanology and Geological Hazard Mitigation, referred to as Pusat Vulkanologi dan Mitigasi Bencana Geologi (PVMBG), MAGMA Indonesia, and satellite data.
Activity was relatively low during May and June. Daily white gas-and-steam emissions rose 25-200 m above the crater and drifted in different directions. Five ash plumes were detected at 0519 on 10 May, 1241 on 11 May, 0920 on 12 May, 2320 on 12 May, and at 0710 on 13 May, and rose 1-2.5 km above the crater and drifted SW. A webcam image taken on 12 May showed ejection of incandescent material above the vent. A total of nine ash plumes were detected during 6-11 June: at 1434 and 00220 on 6 and 7 June the ash plumes rose 500 m above the crater and drifted NW, at 1537 on 8 June the ash plume rose 1 km above the crater and drifted SW, at 0746 and at 0846 on 9 June the ash plumes rose 800 m and 3 km above the crater and drifted SW, respectively, at 0423, 1431, and 1750 on 10 June the ash plumes rose 2 km, 1.5 km, and 3.5 km above the crater and drifted NW, respectively, and at 0030 on 11 June an ash plume rose 2 km above the crater and drifted NW. Webcam images taken on 10 and 11 June at 0455 and 0102, respectively, showed incandescent material ejected above the vent. On 19 June an ash plume at 0822 rose 1.5 km above the crater and drifted SE.
Similar low activity of white gas-and-steam emissions and few ash plumes were reported during July and August. Daily white gas-and-steam emissions rose 25-300 m above the crater and drifted in multiple directions. Three ash plumes were reported at 0843, 0851, and 0852 on 20 July that rose 500-2,000 m above the crater and drifted NW.
The MIROVA (Middle InfraRed Observation of Volcanic Activity) graph of MODIS thermal anomaly data showed intermittent low-to-moderate power thermal anomalies during May through August 2023 (figure 140). Although activity was often obscured by weather clouds, a thermal anomaly was visible in an infrared satellite image of the crater on 12 May, accompanied by an eruption plume that drifted SW (figure 141).
Geologic Background. The renowned Krakatau (frequently mis-named as Krakatoa) volcano lies in the Sunda Strait between Java and Sumatra. Collapse of an older edifice, perhaps in 416 or 535 CE, formed a 7-km-wide caldera. Remnants of that volcano are preserved in Verlaten and Lang Islands; subsequently the Rakata, Danan, and Perbuwatan cones were formed, coalescing to create the pre-1883 Krakatau Island. Caldera collapse during the catastrophic 1883 eruption destroyed Danan and Perbuwatan, and left only a remnant of Rakata. This eruption caused more than 36,000 fatalities, most as a result of tsunamis that swept the adjacent coastlines of Sumatra and Java. Pyroclastic surges traveled 40 km across the Sunda Strait and reached the Sumatra coast. After a quiescence of less than a half century, the post-collapse cone of Anak Krakatau (Child of Krakatau) was constructed within the 1883 caldera at a point between the former Danan and Perbuwatan cones. Anak Krakatau has been the site of frequent eruptions since 1927.
Information Contacts: Pusat Vulkanologi dan Mitigasi Bencana Geologi (PVMBG, also known as Indonesian Center for Volcanology and Geological Hazard Mitigation, CVGHM), Jalan Diponegoro 57, Bandung 40122, Indonesia (URL: http://www.vsi.esdm.go.id/); MAGMA Indonesia, Kementerian Energi dan Sumber Daya Mineral (URL: https://magma.esdm.go.id/v1); MIROVA (Middle InfraRed Observation of Volcanic Activity), a collaborative project between the Universities of Turin and Florence (Italy) supported by the Centre for Volcanic Risk of the Italian Civil Protection Department (URL: http://www.mirovaweb.it/); Copernicus Browser, Copernicus Data Space Ecosystem, European Space Agency (URL: https://dataspace.copernicus.eu/browser/).
Villarrica (Chile) — October 2023 Cite this Report
Villarrica
Chile
39.42°S, 71.93°W; summit elev. 2847 m
All times are local (unless otherwise noted)
Strombolian activity, gas-and-ash emissions, and crater incandescence during April-September 2023
Villarrica, in central Chile, consists of a 2-km-wide caldera that formed about 3,500 years ago and is located at the base of the presently active cone at the NW margin of a 6-km-wide caldera. Historical eruptions eruptions date back to 1558 and have been characterized by mild-to-moderate explosive activity with occasional lava effusions. The current eruption period began in December 2014 and has recently consisted of nighttime crater incandescence, ash emissions, and seismicity (BGVN 48:04). This report covers activity during April through September 2023 and describes occasional Strombolian activity, gas-and-ash emissions, and nighttime crater incandescence. Information for this report primarily comes from the Southern Andes Volcano Observatory (Observatorio Volcanológico de Los Andes del Sur, OVDAS), part of Chile's National Service of Geology and Mining (Servicio Nacional de Geología y Minería, SERNAGEOMIN) and satellite data.
Seismicity during April consisted of long period (LP) events and tremor (TRE); a total of 9,413 LP-type events and 759 TR-type events were detected throughout the month. Nighttime crater incandescence persisted and was visible in the degassing column. Sulfur dioxide data was obtained using Differential Absorption Optical Spectroscopy Equipment (DOAS) that showed an average value of 1,450 ± 198 tons per day (t/d) during 1-15 April and 1,129 ± 201 t/d during 16-30 April, with a maximum daily value of 2,784 t/d on 9 April. Gas-and-steam emissions of variable intensities rose above the active crater as high as 1.3 km above the crater on 13 April. Strombolian explosions were not observed and there was a slight decrease in the lava lake level.
There were 14,123 LP-type events and 727 TR-type events detected during May. According to sulfur dioxide measurements taken with DOAS equipment, the active crater emitted an average value of 1,826 ± 482 t/d during 1-15 May and 912 ± 41 t/d during 16-30 May, with a daily maximum value of 5,155 t/d on 13 May. Surveillance cameras showed continuous white gas-and-steam emissions that rose as high as 430 m above the crater on 27 May. Nighttime incandescence illuminated the gas column less than 300 m above the crater rim was and no pyroclastic emissions were reported. A landslide was identified on 13 May on the E flank of the volcano 50 m from the crater rim and extending 300 m away; SERNAGEOMIN noted that this event may have occurred on 12 May. During the morning of 27 and 28 May minor Strombolian explosions characterized by incandescent ejecta were recorded at the crater rim; the last reported Strombolian explosions had occurred at the end of March.
Seismic activity during June consisted of five volcano-tectonic (VT)-type events, 21,606 LP-type events, and 2,085 TR-type events. The average value of sulfur dioxide flux obtained by DOAS equipment was 1,420 ± 217 t/d during 1-15 June and 2,562 ± 804 t/d, with a maximum daily value of 4,810 t/d on 17 June. White gas-and-steam emissions rose less than 480 m above the crater; frequent nighttime crater incandescence was reflected in the degassing plume. On 12 June an emission rose 100 m above the crater and drifted NNW. On 15 June one or several emissions resulted in ashfall to the NE as far as 5.5 km from the crater, based on a Skysat satellite image. Several Strombolian explosions occurred within the crater; activity on 15 June was higher energy and ejected blocks 200-300 m on the NE slope. Surveillance cameras showed white gas-and-steam emissions rising 480 m above the crater on 16 June. On 19 and 24 June low-intensity Strombolian activity was observed, ejecting material as far as 200 m from the center of the crater to the E.
During July, seismicity included 29,319 LP-type events, 3,736 TR-type events, and two VT-type events. DOAS equipment recorded two days of sulfur dioxide emissions of 4,220 t/d and 1,009 t/d on 1 and 13 July, respectively. Constant nighttime incandescence was also recorded and was particularly noticeable when accompanied by eruptive columns on 12 and 16 July. Minor explosive events were detected in the crater. According to Skysat satellite images taken on 12, 13, and 16 July, ashfall deposits were identified 155 m S of the crater. According to POVI, incandescence was visible from two vents on the crater floor around 0336 on 12 July. Gas-and-ash emissions rose as high as 1.2 km above the crater on 13 July and drifted E and NW. A series of gas-and-steam pulses containing some ash deposited material on the upper E flank around 1551 on 13 July. During 16-31 July, average sulfur dioxide emissions of 1,679 ± 406 t/d were recorded, with a maximum daily value of 2,343 t/d on 28 July. Fine ash emissions were also reported on 16, 17, and 23 July.
Seismicity persisted during August, characterized by 27,011 LP-type events, 3,323 TR-type events, and three VT-type events. The average value of sulfur dioxide measurements taken during 1-15 August was 1,642 ± 270 t/d and 2,207 ± 4,549 t/d during 16-31 August, with a maximum daily value of 3,294 t/d on 27 August. Nighttime crater incandescence remained visible in degassing columns. White gas-and-steam emissions rose 480 m above the crater on 6 August. According to a Skysat satellite image from 6 August, ash accumulation was observed proximal to the crater and was mainly distributed toward the E slope. White gas-and-steam emissions rose 320 m above the crater on 26 August. Nighttime incandescence and Strombolian activity that generated ash emissions were reported on 27 August.
Seismicity during September was characterized by five VT-type events, 12,057 LP-type events, and 2,058 TR-type events. Nighttime incandescence persisted. On 2 September an ash emission rose 180 m above the crater and drifted SE at 1643 (figure 125) and a white gas-and-steam plume rose 320 m above the crater. According to the Buenos Aires VAAC, periods of continuous gas-and-ash emissions were visible in webcam images from 1830 on 2 September to 0110 on 3 September. Strombolian activity was observed on 2 September and during the early morning of 3 September, the latter event of which generated an ash emission that rose 60 m above the crater and drifted 100 m from the center of the crater to the NE and SW. Ashfall was reported to the SE and S as far as 750 m from the crater. The lava lake was active during 3-4 September and lava fountaining was visible for the first time since 26 March 2023, according to POVI. Fountains captured in webcam images at 2133 on 3 September and at 0054 on 4 September rose as high as 60 m above the crater rim and ejected material onto the upper W flank. Sulfur dioxide flux of 1,730 t/d and 1,281 t/d was measured on 3 and 4 September, respectively, according to data obtained by DOAS equipment.
Strong Strombolian activity and larger gas-and-ash plumes were reported during 18-20 September. On 18 September activity was also associated with energetic LP-type events and notable sulfur dioxide fluxes (as high as 4,277 t/d). On 19 September Strombolian activity and incandescence were observed. On 20 September at 0914 ash emissions rose 50 m above the crater and drifted SSE, accompanied by Strombolian activity that ejected material less than 100 m SSE, causing fall deposits on that respective flank. SERNAGEOMIN reported that a Planet Scope satellite image taken on 20 September showed the lava lake in the crater, measuring 32 m x 35 m and an area of 0.001 km2. Several ash emissions were recorded at 0841, 0910, 1251, 1306, 1312, 1315, and 1324 on 23 September and rose less than 150 m above the crater. The sulfur dioxide flux value was 698 t/d on 23 September and 1,097 t/d on 24 September. On 24 September the Volcanic Alert Level (VAL) was raised to Orange (the third level on a four-color scale). SENAPRED maintained the Alert Level at Yellow (the middle level on a three-color scale) for the communities of Villarrica, Pucón (16 km N), Curarrehue, and Panguipulli.
During 24-25 September there was an increase in seismic energy (observed at TR-events) and acoustic signals, characterized by 1 VT-type event, 213 LP-type events, and 124 TR-type events. Mainly white gas-and-steam emissions, in addition to occasional fine ash emissions were recorded. During the early morning of 25 September Strombolian explosions were reported and ejected material 250 m in all directions, though dominantly toward the NW. On 25 September the average value of sulfur dioxide flux was 760 t/d. Seismicity during 25-30 September consisted of five VT-type events, 1,937 LP-type events, and 456 TR-type events.
During 25-29 September moderate Strombolian activity was observed and ejected material as far as the crater rim. In addition, ash pulses lasting roughly 50 minutes were observed around 0700 and dispersed ENE. During 26-27 September a TR episode lasted 6.5 hours and was accompanied by discrete acoustic signals. Satellite images from 26 September showed a spatter cone on the crater floor with one vent that measured 10 x 14 m and a smaller vent about 35 m NE of the cone. SERNAGEOMIN reported an abundant number of bomb-sized blocks up to 150 m from the crater, as well as impact marks on the snow, which indicated explosive activity. A low-altitude ash emission was observed drifting NW around 1140 on 28 September, based on webcam images. Between 0620 and 0850 on 29 September an ash emission rose 60 m above the crater and drifted NW. During an overflight taken around 1000 on 29 September scientists observed molten material in the vent, a large accumulation of pyroclasts inside the crater, and energetic degassing, some of which contained a small amount of ash. Block-sized pyroclasts were deposited on the internal walls and near the crater, and a distal ash deposit was also visible. The average sulfur dioxide flux measured on 28 September was 344 t/d. Satellite images taken on 29 September ashfall was deposited roughly 3 km WNW from the crater and nighttime crater incandescence remained visible. The average sulfur dioxide flux value from 29 September was 199 t/d. On 30 September at 0740 a pulsating ash emission rose 1.1 km above the crater and drifted NNW (figure 126). Deposits on the S flank extended as far as 4.5 km from the crater rim, based on satellite images from 30 September.
Infrared MODIS satellite data processed by MIROVA (Middle InfraRed Observation of Volcanic Activity) showed intermittent thermal activity during April through September, with slightly stronger activity detected during late September (figure 127). Small clusters of thermal activity were detected during mid-June, early July, early August, and late September. According to the MODVOLC thermal alert system, a total of four thermal hotspots were detected on 7 July and 3 and 23 September. This activity was also intermittently captured in infrared satellite imagery on clear weather days (figure 128).
Geologic Background. The glacier-covered Villarrica stratovolcano, in the northern Lakes District of central Chile, is ~15 km south of the city of Pucon. A 2-km-wide caldera that formed about 3,500 years ago is located at the base of the presently active, dominantly basaltic to basaltic andesite cone at the NW margin of a 6-km-wide Pleistocene caldera. More than 30 scoria cones and fissure vents are present on the flanks. Plinian eruptions and pyroclastic flows that have extended up to 20 km from the volcano were produced during the Holocene. Lava flows up to 18 km long have issued from summit and flank vents. Eruptions documented since 1558 CE have consisted largely of mild-to-moderate explosive activity with occasional lava effusion. Glaciers cover 40 km2 of the volcano, and lahars have damaged towns on its flanks.
Information Contacts: Servicio Nacional de Geología y Minería (SERNAGEOMIN), Observatorio Volcanológico de Los Andes del Sur (OVDAS), Avda Sta María No. 0104, Santiago, Chile (URL: http://www.sernageomin.cl/); Proyecto Observación Villarrica Internet (POVI) (URL: http://www.povi.cl/); Sistema y Servicio Nacional de Prevención y Repuesta Ante Desastres (SENAPRED), Av. Beauchef 1671, Santiago, Chile (URL: https://web.senapred.cl/); Buenos Aires Volcanic Ash Advisory Center (VAAC), Servicio Meteorológico Nacional-Fuerza Aérea Argentina, 25 de mayo 658, Buenos Aires, Argentina (URL: http://www.smn.gov.ar/vaac/buenosaires/inicio.php); MIROVA (Middle InfraRed Observation of Volcanic Activity), a collaborative project between the Universities of Turin and Florence (Italy) supported by the Centre for Volcanic Risk of the Italian Civil Protection Department (URL: http://www.mirovaweb.it/); Hawai'i Institute of Geophysics and Planetology (HIGP) - MODVOLC Thermal Alerts System, School of Ocean and Earth Science and Technology (SOEST), Univ. of Hawai'i, 2525 Correa Road, Honolulu, HI 96822, USA (URL: http://modis.higp.hawaii.edu/); Copernicus Browser, Copernicus Data Space Ecosystem, European Space Agency (URL: https://dataspace.copernicus.eu/browser/).
Merapi (Indonesia) — October 2023 Cite this Report
Merapi
Indonesia
7.54°S, 110.446°E; summit elev. 2910 m
All times are local (unless otherwise noted)
Frequent incandescent avalanches during April-September 2023
Merapi, located just north of the major city of Yogyakarta in central Java, Indonesia, has had activity within the last 20 years characterized by pyroclastic flows and lahars accompanying growth and collapse of the steep-sided active summit lava dome. The current eruption period began in late December 2020 and has more recently consisted of ash plumes, intermittent incandescent avalanches of material, and pyroclastic flows (BGVN 48:04). This report covers activity during April through September 2023, based on information from Balai Penyelidikan dan Pengembangan Teknologi Kebencanaan Geologi (BPPTKG), the Center for Research and Development of Geological Disaster Technology, a branch of PVMBG which specifically monitors Merapi. Additional information comes from the Pusat Vulkanologi dan Mitigasi Bencana Geologi (PVMBG, also known as Indonesian Center for Volcanology and Geological Hazard Mitigation, CVGHM), MAGMA Indonesia, the Darwin Volcanic Ash Advisory Centre (VAAC), and various satellite data.
Activity during April through September 2023 primarily consisted of incandescent avalanches of material that mainly affected the SW and W flanks and traveled as far as 2.3 km from the summit (table 25) and white gas-and-steam emissions that rose 10-1,000 m above the crater.
Table 25. Monthly summary of avalanches and avalanche distances recorded at Merapi during April through September 2023. The number of reported avalanches does not include instances where possible avalanches were heard but could not be visually confirmed as a result of inclement weather. Data courtesy of BPPTKG (April-September 2023 daily reports).
| Month |
Average number of avalanches per day |
Distance avalanches traveled (m) |
| Apr 2023 |
19 |
1,200-2,000 |
| May 2023 |
22 |
500-2,000 |
| Jun 2023 |
18 |
1,200-2,000 |
| Jul 2023 |
30 |
300-2,000 |
| Aug 2023 |
25 |
400-2,300 |
| Sep 2023 |
23 |
600-2,000 |
BPPTKG reported that during April and May white gas-and-steam emissions rose 10-750 m above the crater, incandescent avalanches descended 500-2,000 m on the SW and W flanks (figure 135). Cloudy weather often prevented clear views of the summit, and sometimes avalanches could not be confirmed. According to a webcam image, a pyroclastic flow was visible on 17 April at 0531. During the week of 28 April and 4 May a pyroclastic flow was reported on the SW flank, traveling up to 2.5 km. According to a drone overflight taken on 17 May the SW lava dome volume was an estimated 2,372,800 cubic meters and the dome in the main crater was an estimated 2,337,300 cubic meters.
During June and July similar activity persisted with white gas-and-steam emissions rising 10-350 m above the crater and frequent incandescent avalanches that traveled 300-2,000 m down the SW, W, and S flanks (figure 136). Based on an analysis of aerial photos taken on 24 June the volume of the SW lava dome was approximately 2.5 million cubic meters. A pyroclastic flow was observed on 5 July that traveled 2.7 km on the SW flank. According to the Darwin VAAC multiple minor ash plumes were identified in satellite images on 19 July that rose to 3.7 km altitude and drifted S and SW. During 22, 25, and 26 July a total of 17 avalanches descended as far as 1.8 km on the S flank.
Frequent white gas-and-steam emissions continued during August and September, rising 10-450 m above the crater. Incandescent avalanches mainly affected the SW and W flanks and traveled 400-2,300 m from the vent (figure 137). An aerial survey conducted on 10 August was analyzed and reported that estimates of the SW dome volume was 2,764,300 cubic meters and the dome in the main crater was 2,369,800 cubic meters.
Frequent and moderate-power thermal activity continued throughout the reporting period, according to a MIROVA (Middle InfraRed Observation of Volcanic Activity) analysis of MODIS satellite data (figure 138). There was an increase in the number of detected anomalies during mid-May. The MODVOLC thermal algorithm recorded a total of 47 thermal hotspots: six during April, nine during May, eight during June, 15 during July, four during August, and five during September. Some of this activity was captured in infrared satellite imagery on clear weather days, sometimes accompanied by incandescent material on the SW flank (figure 139).
Geologic Background. Merapi, one of Indonesia's most active volcanoes, lies in one of the world's most densely populated areas and dominates the landscape immediately north of the major city of Yogyakarta. It is the youngest and southernmost of a volcanic chain extending NNW to Ungaran volcano. Growth of Old Merapi during the Pleistocene ended with major edifice collapse perhaps about 2,000 years ago, leaving a large arcuate scarp cutting the eroded older Batulawang volcano. Subsequent growth of the steep-sided Young Merapi edifice, its upper part unvegetated due to frequent activity, began SW of the earlier collapse scarp. Pyroclastic flows and lahars accompanying growth and collapse of the steep-sided active summit lava dome have devastated cultivated lands on the western-to-southern flanks and caused many fatalities.
Information Contacts: Balai Penyelidikan dan Pengembangan Teknologi Kebencanaan Geologi (BPPTKG), Center for Research and Development of Geological Disaster Technology (URL: http://merapi.bgl.esdm.go.id/, Twitter: @BPPTKG); MAGMA Indonesia, Kementerian Energi dan Sumber Daya Mineral (URL: https://magma.esdm.go.id/v1); Pusat Vulkanologi dan Mitigasi Bencana Geologi (PVMBG, also known as Indonesian Center for Volcanology and Geological Hazard Mitigation, CVGHM), Jalan Diponegoro 57, Bandung 40122, Indonesia (URL: http://www.vsi.esdm.go.id/); Darwin Volcanic Ash Advisory Centre (VAAC), Bureau of Meteorology, Northern Territory Regional Office, PO Box 40050, Casuarina, NT 0811, Australia (URL: http://www.bom.gov.au/info/vaac/); MIROVA (Middle InfraRed Observation of Volcanic Activity), a collaborative project between the Universities of Turin and Florence (Italy) supported by the Centre for Volcanic Risk of the Italian Civil Protection Department (URL: http://www.mirovaweb.it/); Hawai'i Institute of Geophysics and Planetology (HIGP) - MODVOLC Thermal Alerts System, School of Ocean and Earth Science and Technology (SOEST), Univ. of Hawai'i, 2525 Correa Road, Honolulu, HI 96822, USA (URL: http://modis.higp.hawaii.edu/); Copernicus Browser, Copernicus Data Space Ecosystem, European Space Agency (URL: https://dataspace.copernicus.eu/browser/); Øystein Lund Andersen (URL: https://www.oysteinlundandersen.com/, https://twitter.com/oysteinvolcano).
Ebeko
Russia
50.686°N, 156.014°E; summit elev. 1103 m
All times are local (unless otherwise noted)
Moderate explosive activity with ash plumes continued during June-November 2023
Ebeko, located on the N end of Paramushir Island in Russia’s Kuril Islands just S of the Kamchatka Peninsula, consists of three summit craters along a SSW-NNE line at the northern end of a complex of five volcanic cones. Observed eruptions date back to the late 18th century and have been characterized as small-to-moderate explosions from the summit crater, accompanied by intense fumarolic activity. The current eruptive period began in June 2022, consisting of frequent explosions, ash plumes, and thermal activity (BGVN 47:10, 48:06). This report covers similar activity during June-November 2023, based on information from the Kamchatka Volcanic Eruptions Response Team (KVERT) and satellite data.
Moderate explosive activity continued during June-November 2023 (figures 50 and 51). According to visual data from Severo-Kurilsk, explosions sent ash 2-3.5 km above the summit (3-4.5 km altitude) during most days during June through mid-September. Activity after mid-September was slightly weaker, with ash usually reaching less than 2 km above the summit. According to KVERT the volcano in October and November was, with a few exceptions, either quiet or obscured by clouds that prevented satellite observations. KVERT issued Volcano Observatory Notices for Aviation (VONA) on 8 and 12 June, 13 and 22 July, 3 and 21 August, and 31 October warning of potential aviation hazards from ash plumes drifting 3-15 km from the volcano. Based on satellite data, KVERT reported a persistent thermal anomaly whenever weather clouds permitted viewing.
Geologic Background. The flat-topped summit of the central cone of Ebeko volcano, one of the most active in the Kuril Islands, occupies the northern end of Paramushir Island. Three summit craters located along a SSW-NNE line form Ebeko volcano proper, at the northern end of a complex of five volcanic cones. Blocky lava flows extend west from Ebeko and SE from the neighboring Nezametnyi cone. The eastern part of the southern crater contains strong solfataras and a large boiling spring. The central crater is filled by a lake about 20 m deep whose shores are lined with steaming solfataras; the northern crater lies across a narrow, low barrier from the central crater and contains a small, cold crescentic lake. Historical activity, recorded since the late-18th century, has been restricted to small-to-moderate explosive eruptions from the summit craters. Intense fumarolic activity occurs in the summit craters, on the outer flanks of the cone, and in lateral explosion craters.
Information Contacts: Kamchatka Volcanic Eruptions Response Team (KVERT), Far Eastern Branch, Russian Academy of Sciences, 9 Piip Blvd., Petropavlovsk-Kamchatsky, 683006, Russia (URL: http://www.kscnet.ru/ivs/kvert/).
Search Bulletin Archive by Publication Date
Select a month and year from the drop-downs and click "Show Issue" to have that issue displayed in this tab.
The default month and year is the latest issue available.
Bulletin of the Global Volcanism Network - Volume 44, Number 11 (November 2019)
Managing Editor: Edward Venzke
Agung (Indonesia)
Quiet returns after explosions on 10 and 13 June 2019
Copahue (Chile-Argentina)
New ash emissions begin in early August; intermittent and ongoing through October 2019
Erta Ale (Ethiopia)
Continued summit activity and lava flow outbreaks during April-October 2019
Fournaise, Piton de la (France)
Three brief eruptive events in July, August, and October 2019
Karymsky (Russia)
Moderate explosive activity with ash plumes through 24 September 2019
Mayon (Philippines)
Gas-and-steam plumes and summit incandescence during May-October 2019
Sarychev Peak (Russia)
Ash plume on 11 August; thermal anomalies from late May to early October 2019
Sheveluch (Russia)
Frequent ash explosions and lava dome growth continue through October 2019
Turrialba (Costa Rica)
Activity diminishes during March-October 2019, but small ash emissions continue
Unnamed (Tonga)
Submarine eruption in early August creates pumice rafts that drifted west to Fiji
Agung (Indonesia) — November 2019 Cite this Report
Agung
Indonesia
8.343°S, 115.508°E; summit elev. 2997 m
All times are local (unless otherwise noted)
Quiet returns after explosions on 10 and 13 June 2019
After a large, deadly explosive and effusive eruption during 1963-64, Indonesia's Mount Agung on Bali remained quiet until a new eruption began in November 2017 (BGVN 43:01). Activity continued throughout 2018 with explosions that produced ash plumes rising multiple kilometers above the summit, and the slow effusion of the lava within the summit crater. Increasingly frequent and intense explosions with ash emissions and incandescent ejecta characterized activity during February through May 2019 (BGVN 44:06). Two more explosions in June 2019 produced significant ash plumes; no further explosive activity occurred through October 2019. Information about Agung comes from Pusat Vulkanologi dan Mitigasi Bencana Geologi (PVMBG), also known as the Indonesian Center for Volcanology and Geological Hazard Mitigation (CVGHM), the Darwin Volcanic Ash Advisory Center (VAAC), and multiple sources of satellite data. This report covers the end of the eruption in June and observations through October 2019.
After a large explosion on 31 May 2019, a smaller event occurred on 10 June. Another large explosion with an ash plume that rose to 9.1 km altitude was recorded on 13 June (local time). It drifted hundreds of kilometers before dissipating. No further explosive activity was reported through October 2019, only diffuse white steam plumes rising at most a few hundred meters above the summit. The Alert Level remained at III (of four levels) throughout the period. The record of thermal activity showed an increase during the explosive events of late May and June, but then decreased significantly (figure 57). There was no obvious thermal signature in satellite images that explained the small increase in thermal energy recorded by the MIROVA data at the end of August 2019.
On 31 May 2019 a large explosion produced an ash plume that rose more than 2 km above the summit (BGVN 44:06, figure 56). The Darwin VAAC reported that it split into two plumes, one drifted E at 8.2 km and the other ESE at 6.1 km altitude, dissipating after about 20 hours early on 1 June. A small eruption with an ash plume that rose to 3.9 km altitude was reported the next day by the Darwin VAAC. It was detected in the webcam and pilot reports confirmed that it drifted E for a few hours before dissipating. PVMBG reported gray emissions to 300 m above the peak on 1 June and 100 m above the summit on 2 June. By 6 June the emissions were white, rising only 50 m above the summit. For several subsequent days, the summit was covered in fog with no observations of emissions.
On 10 June 2019 an explosion lasting 90 seconds was reported at 1212 local time; PVMBG noted a gray ash plume 1,000 m above the summit (figure 58). The Darwin VAAC confirmed the emission in satellite imagery and by pilot report; it was moving SW at 4.3 km altitude and then drifted S before dissipating by the end of the day. Early on 13 June local time (12 June UTC) a new explosion that was clearly visible in the webcam produced a large ash plume that drifted W and SW (figure 59). The explosion was recorded on the seismogram for almost four minutes and sent incandescent ejecta in all directions up to 700 m from the summit. The first satellite imagery of the plume reported by the Darwin VAAC suggested the altitude to be 9.1 km. A secondary plume was drifting W from the summit at 5.5 km altitude a few hours later. By six hours after the eruption, the 9.1 km altitude plume was about 90 km SSW of the Denpassar airport and the 5.5 km altitude plume was about 110 km W of the airport. By the time the higher altitude plume dissipated after about 14 hours, it had reached 300 km S of the airport. For the remainder of June, only diffuse white steam plumes were reported, rising generally 30-50 m above the summit, with brief pulses to 150-200 m during 27-29 June.
Although no further surface activity was reported at Agung during July through October 2019, PVMBG kept the Alert Level at III throughout the period. Only steam plumes were reported from the summit usually rising 50 m before dissipating. Steam emissions rose to 150 m a few times each month. Plumes were reported at 300 m above the summit on 6 July and 15 August. No thermal anomalies were visible in Sentinel 2 satellite images during the period.
Geologic Background. Symmetrical Agung stratovolcano, Bali's highest and most sacred mountain, towers over the eastern end of the island. The volcano, whose name means "Paramount," rises above the SE rim of the Batur caldera, and the northern and southern flanks extend to the coast. The summit area extends 1.5 km E-W, with the high point on the W and a steep-walled 800-m-wide crater on the E. The Pawon cone is located low on the SE flank. Only a few eruptions dating back to the early 19th century have been recorded in historical time. The 1963-64 eruption, one of the largest in the 20th century, produced voluminous ashfall along with devastating pyroclastic flows and lahars that caused extensive damage and many fatalities.
Information Contacts: Pusat Vulkanologi dan Mitigasi Bencana Geologi (PVMBG, also known as Indonesian Center for Volcanology and Geological Hazard Mitigation, CVGHM), Jalan Diponegoro 57, Bandung 40122, Indonesia (URL: http://www.vsi.esdm.go.id/); MIROVA (Middle InfraRed Observation of Volcanic Activity), a collaborative project between the Universities of Turin and Florence (Italy) supported by the Centre for Volcanic Risk of the Italian Civil Protection Department (URL: http://www.mirovaweb.it/); Rita Bauer, Volcano Verse (Twitter @wischweg, URL: https://twitter.com/wischweg/status/1137956367258570752); Jamie S. Sincioco, Philippines (Twitter @jaimessincioco, URL: https://twitter.com/jaimessincioco/status/1139109685796020224).
Copahue (Chile-Argentina) — November 2019 Cite this Report
Copahue
Chile-Argentina
37.856°S, 71.183°W; summit elev. 2953 m
All times are local (unless otherwise noted)
New ash emissions begin in early August; intermittent and ongoing through October 2019
Most of the large edifice of Copahue lies high in the central Chilean Andes, but the active, acidic-lake filled El Agrio crater lies on the Argentinian side of the border at the W edge of the Pliocene Caviahue caldera. Infrequent mild-to-moderate explosive eruptions have been recorded since the 18th century. The most recent eruptive episode with ash plumes lasted from early June 2017 to early December 2018. After 8 months of quiet, renewed phreatic explosions and ash emissions began in August 2019 and were ongoing through October 2019. This report summarizes activity from January through October 2019 and is based on reports issued by Servicio Nacional de Geología y Minería (SERNAGEOMIN) Observatorio Volcanológico de Los Andes del Sur (OVDAS), Buenos Aires Volcanic Ash Advisory Center (VAAC), satellite data, and photographs from nearby residents.
Intermittent steam plumes were reported from the El Agrio crater at the summit during January-July 2019, but no ash emissions were seen. An increase in seismicity and changes in the crater lake level during March led SERNAGEOMIN to increase the Alert Level from Green to Yellow at the beginning of April. Fluctuating tremor signals in the first week of August coincided with satellite imagery that showed the appearance of dark material, possibly ash, on the snow around the summit crater. The first thermal anomaly appeared on 3 September and the first clear ash explosions were recorded on 11 September. Eruptive activity was intermittent through the end of the month; a series of larger explosions beginning on 30 September caused SERNAGEOMIN to raise the Alert Level from Yellow to Orange. A period of more intense explosive activity lasted through the first week of October. The larger explosions then ceased, but during the rest of October there were continuing observations of seismicity, ash emissions, and incandescent ejecta, along with multiple thermal anomalies in the summit area.
Observations during January-April 2019. Copahue remained at Alert Level Yellow with a 1-km exclusion radius during January 2019 after ash emission in December 2018. Ongoing degassing was reported with white plumes from El Agrio crater rising to 355 m (figure 25). The Alert Level was lowered to Green at the end of the month, and the exclusion radius was reduced to 500 m, although intermittent low-level seismicity in the region continued. SERNAGEOMIN reported a M 3.2 earthquake about 10 km NE of the summit, 2 km deep, on 29 January 2019. The acidic lake inside El Agrio crater was quiet at the end of the month (figure 26).
Steam plumes occasionally rose to 180 m above the crater during February 2019. A swarm of 117 volcano-tectonic (VT) seismic events on 22-23 February 2019 was located about 14 km NE of the volcano, with the largest events around a M 3.5. Steam plumes rose to about 280 m above the crater during March. SERNAGEOMIN noted an increase in seismicity during the month, and a decrease in the lake level within El Agrio crater. This led them to increase the Alert Level to Yellow (second on a four-level scale) at the beginning of April. Emissions remained minimal during April (figure 27); an 80 m high steam plume was reported on 4 April. The lake level continued to fall, based on satellite imagery, and a M 3.1 earthquake was reported on 29 April located about 10 km NE of the summit about 10 km deep.
Observations during May-July 2019. Sporadic episodes of low-altitude steam plume degassing were noted during May 2019, but otherwise very little surface activity was reported (figure 28). On 13 May, a steam plume reached 160 m above the crater rim, and on 28 May, the tallest plume rose 200 m above the crater. Hybrid-type earthquakes were recorded early in the month, followed by a slow increase in the amplitude of the tremor signal. Seismicity increased slightly during the second half of the month with activity concentrated closer to the summit crater. A weak SO2 plume was recorded by satellite instruments on 23 May. The level of the lake began increasing during the second half of the month.
SERNAGEOMIN reported tremor signals with fluctuating amplitude throughout June 2019. Repeated episodes of low-altitude white degassing occurred around the El Agrio crater. On 7 June, a 300 m plume was observed above the crater; the level of the crater lake was variable. On 17 June a 400-m-tall white plume was observed above the crater. Seismicity, although low, increased during the second half of the month. Multiple episodes of low-altitude white degassing occurred around the active crater all during July 2019 (figure 29). On 9 July a plume rose about 450 m above the crater. On 16 July a white plume rose 250 m above the crater. SENAGEOMIN noted a rise in the rate of seismicity during the first half of the month; the tremor signal continued with fluctuating amplitude. Satellite instruments detected small SO2 plumes on 4 and 9 July (figure 30).
Activity during August-October 2019. Sentinel-2 satellite imagery from 2, 4, 7, and 9 August suggested the ejection of particulate material (figure 31), with dark streaks in the snow extending a few hundred meters E and SE from the crater. Images from the community of Caviahue on 3 and 4 August show distinct discoloration of the snow around the E side of the summit crater (figures 32 and 33). Small but discernible SO2 plumes were detected by satellite instruments on 2, 3, 16, 19, 30, and 31 August. Fluctuating tremor signals continued during August with several episodes of low-altitude white degassing from the El Agrio crater; a white plume on 5 August rose 380 m above the crater. The lake level continued to drop and the Alert Level remained at Yellow.
Distinct SO2 plumes were again captured by satellite instruments on 1, 3, and 5-7 September 2019 (figure 34). The first thermal signature in nine months also appeared in Sentinel-2 satellite imagery on 3 September (figure 35). Midday on 9 September, seismometers recorded an increase in the amplitude of a continuous tremor. High clouds prevented clear views of the crater and no ash emissions were observed. Beginning on 11 September, low-energy long-period (LP) events were associated with infrasound signals and low-energy explosions that produced small ash plumes. The largest explosion produced a plume 250 m above the crater. Incandescence and high-temperature ejecta were observed around the emission point. The ash drifted ESE about 3 km. Ten explosions were reported between 11 and 12 September, associated with low-intensity acoustic signals and ash emissions. Plumes reached 430 m above the crater rim on 12 September. Ash deposits on the snow were visible in in Sentinel-2 images on 11 and 13 September, extending about 6 km E from El Agrio crater (figure 35). Images from the ground on 12 September indicated fresh ash on the E flank (figure 36).
Although fresh snow had covered any ash deposits by 16 September 2019 (figure 37), small thermal anomalies appeared in Sentinel-2 imagery on 16 and 21 September. SO2 plumes were measured by satellite instruments on 21 and 25 September. Photos from Caviahue on 25 September showed ash on the E flank and a steam-and-ash plume drifting NE (figure 38). Ashfall on the snow was visible in satellite imagery on 26 September, and covered a larger area on 28 September; there was also a substantial thermal anomaly that day (figure 39).
During the late afternoon of 30 September, three high-energy LP earthquakes were reported located 5.8 km NE of the El Agrio crater. They were accompanied by abundant lower energy earthquakes in the same area. The VT earthquakes were equivalent to a M 3.5. Inhabitants of Caviahue (12 km E) reported feeling several of the events; atmospheric conditions prevented observation of the summit. This sudden increase in seismicity prompted SERNGEOMIN to raise the Alert Level to Orange and increase the radius of the area of potential impact to 5 km. Seismicity (VT, LP and tremor earthquakes) continued at a high rate into 1 October. Argentina's geologic hazards and mining agency, Servicio Geologico Minero Argentino (SEGEMAR) also issued a notice of the increased warning level on 30 September (figure 40).
Cameras near the volcano detected ash plumes associated with explosions around the crater at 0945 on 1 October 2019 which continued throughout the first week of the month. Satellite imagery showed streaks of dark ash over snow trending SE and E and from the summit on 1 and 8 October (figure 41). Five separate explosions were recorded during 1-2 October. Persistent degassing was accompanied by episodes of ash emissions and incandescence at night. Seismicity continued during 2-3 October, but poor weather mostly obscured visual evidence of activity; a few pulses of white and gray emissions were observed. Seismic events were located 5-7 km NE at a depths of 0.7-1.7 km, and continued for several days. Clearer skies on 4 October revealed steam plumes and pulses of ash rising from El Agrio crater. Incandescence was visible at night. A ground-based image showed ash covering the E flank and an ash plume drifting NE down the flank (figure 42). The Buenos Aires VAAC reported weak ash emissions on 4 October moving NE at 3.4 km altitude. The webcam showed continuous ash emission from the summit during 4-5 October.
White steam plumes with pulses of ash and incandescence at night were observed on 5 and 6 October. Seismic activity decreased on 6 October. The following day, SERNAGEOMIN lowered the Alert Level to Yellow and reduced the restricted zone to 1,000 m around the summit crater. While seismicity had decreased, ash emissions continued from low-level pulsating explosions which produced ash plumes that drifted E (figure 43). They observed that the total area to that date affected by ashfall was about 24.5 km2, extending up to 5 km W and 6 km E from the summit. They also noted that a pyroclastic cone about 130 m across had appeared inside the crater. Ash emissions and explosions with incandescent ejecta continued during the second week of October (figure 44). A change in wind direction created a several-kilometer-long streak of ash trending SW from the summit by 13 October; a strong thermal anomaly that day indicated continued activity (figure 45). SO2 plumes were recorded by satellite instruments on 1, 3, 4, and 13 October.
Seismicity continued for the rest of October, but no explosions were recorded. Sulfur dioxide emissions were recorded by satellite instruments on 18, 22, 23, and 30 October (figure 46). When weather permitted, constant degassing with episodes of ash emissions from the crater were visible during the day and incandescence appeared at night. Satellite imagery on 18, 23, and 28 October showed substantial ash plumes drifting in different directions from the summit. A large area around the summit crater was covered with dark ash on 18 and 23 October. Fresh snowfall had covered most of the area by 28 October, and the narrow dark streak trending SE underneath the ongoing ash plume was the only surface covered with material (figure 47). Distinct thermal anomalies appeared in satellite images on 16, 18, 23, and 31 October. A number of thermal alerts were recorded by the MIROVA system as well during the second half of the month.
The highest plume noted by SERNAGEOMIN during the second half of the month rose 1,200 m above the crater on 22 October 2019 (figure 48). The Buenos Aires VAAC reported ash emissions from the summit visible in webcams almost every day in October. On 16 October, an ash plume was seen in satellite imagery moving SE at 3.4 km altitude under mostly clear skies; the webcam showed continuous ash emission. A faint plume was barely seen moving S in satellite imagery at 3.4 km altitude on 18 October; the webcam revealed continuous emission of gases and possible dilute volcanic ash. The VAAC reported ash emissions daily from 18-25 October. Drift directions varied from SE, moving to NE on 21-23 October, and back to E and SE the following days. The altitudes ranged from 3.0 to 4.3 km. On 20 October, the plume extended about 80 km SE. The ash appeared as pulses moving NE on 22 and 23 October at 4.3 km altitude. Emissions reappeared in satellite imagery on 28 and 30-31 October, drifting SE and NE at 3.4-3.7 km altitude; incandescence was visible overnight on 30-31 October from the webcam.
Geologic Background. Volcán Copahue is an elongated composite cone constructed along the Chile-Argentina border within the 6.5 x 8.5 km wide Trapa-Trapa caldera that formed between 0.6 and 0.4 million years ago near the NW margin of the 20 x 15 km Pliocene Caviahue (Del Agrio) caldera. The eastern summit crater, part of a 2-km-long, ENE-WSW line of nine craters, contains a briny, acidic 300-m-wide crater lake (also referred to as El Agrio or Del Agrio) and displays intense fumarolic activity. Acidic hot springs occur below the eastern outlet of the crater lake, contributing to the acidity of the Río Agrio, and another geothermal zone is located within Caviahue caldera about 7 km NE of the summit. Infrequent mild-to-moderate explosive eruptions have been recorded since the 18th century. Twentieth-century eruptions from the crater lake have ejected pyroclastic rocks and chilled liquid sulfur fragments.
Information Contacts: Servicio Nacional de Geología y Minería (SERNAGEOMIN), Observatorio Volcanológico de Los Andes del Sur (OVDAS), Avda Sta María No. 0104, Santiago, Chile (URL: http://www.sernageomin.cl/); OPTIC Neuquén, Oficina Provincial de Tecnologías de la Información y la Comunicación- Gobierno de la Provincia del Neuquén, Neuquén, Argentina (URL: https://www.neuqueninforma.gob.ar/tag/optic/, Twitter: @OPTIC_Nqn, https://twitter.com/OPTIC_Nqn); Global Sulfur Dioxide Monitoring Page, Atmospheric Chemistry and Dynamics Laboratory, NASA Goddard Space Flight Center (NASA/GSFC), 8800 Greenbelt Road, Goddard, Maryland, USA (URL: https://so2.gsfc.nasa.gov/); Sentinel Hub Playground (URL: https://www.sentinel-hub.com/explore/sentinel-playground); Valentina Sepulveda, Hotel Caviahue, Caviahue, Argentina (URL: https://twitter.com/valecaviahue, Twitter:@valecaviahue); Cultur Volcan, Journal d'un volcanophile, (URL: https://laculturevolcan.blogspot.com, Twitter: @CulturVolcan); EveLyn, Twitter: @EveCaCid (URL: https://twitter.com/EveCaCid/status/1186663015271321601).
Erta Ale (Ethiopia) — November 2019 Cite this Report
Erta Ale
Ethiopia
13.601°N, 40.666°E; summit elev. 585 m
All times are local (unless otherwise noted)
Continued summit activity and lava flow outbreaks during April-October 2019
Erta Ale, located in Ethiopia, contains multiple active pit craters both within the summit and the southeast calderas. On 17 January 2017 the active lava lake displayed intense spattering, fountaining, and rim overflows with lava flows that traveled as far as 1 km, forming a lava flow field. During April 2018 through March 2019 minor activity continued in both the summit and southeast calderas, and along the active lava flow to the E (BGVN 44:04). This report updates volcanism from April through October 2019. Information primarily comes from infrared satellite images and MODIS data.
Continued lava flow breakouts occurred from April through October 2019. On 4 May 2019 a lava flow outbreak was observed in satellite imagery NE of the summit caldera (figure 92). This outbreak continued to appear in clear-weather thermal satellite images through 13 June when it was seen south of its original location (figure 93). Faint incandescence is observed at the summit caldera between June and October 2019, though it is more pronounced in the months of August through October. On 28 June a second smaller lava flow outbreak occurred within 3.8 km of the summit location. The two lava flow outbreaks remained active at least through 18 June. The distal NE lava flow does not appear in very similar images from 17 August or 16 September 2019, but three proximal thermal anomalies are seen in the southeastern caldera within 4 km of the summit. The thermal anomalies remained within 5 km through October 2019.
MIROVA (Middle InfraRed Observation of Volcanic Activity) analysis of MODIS satellite data showed consistently high-power thermal anomalies during this reporting period (figure 94). Through July 2019 these thermal anomalies were detected at distances greater than 5 km from the summit. In early August 2019 there was an abrupt decrease in the distance that continued through late October 2019 (figure 94); this likely indicates when the distal NE outbreak ended and lava emissions from the closer SE locations increased (see satellite images in figure 93). The distance changes of MODIS thermal anomalies from the summit seen in MIROVA are corroborated by MODVOLC data, which show no distal NE thermal alert pixels after July 2019 (figure 95).
Geologic Background. The Erta Ale basaltic shield volcano in Ethiopia has a 50-km-wide edifice that rises more than 600 m from below sea level in the Danakil depression. The volcano includes a 0.7 x 1.6 km summit crater hosting steep-sided pit craters. Another larger 1.8 x 3.1 km wide depression elongated parallel to the trend of the Erta Ale range is located SE of the summit and is bounded by curvilinear fault scarps on the SE side. Basaltic lava flows from these fissures have poured into the caldera and locally overflowed its rim. The summit caldera usually also holds at least one long-term lava lake that has been active since at least 1967, and possibly since 1906. Recent fissure eruptions have occurred on the N flank.
Information Contacts: Sentinel Hub Playground (URL: https://www.sentinel-hub.com/explore/sentinel-playground); MIROVA (Middle InfraRed Observation of Volcanic Activity), a collaborative project between the Universities of Turin and Florence (Italy) supported by the Centre for Volcanic Risk of the Italian Civil Protection Department (URL: http://www.mirovaweb.it/); Hawai'i Institute of Geophysics and Planetology (HIGP) - MODVOLC Thermal Alerts System, School of Ocean and Earth Science and Technology (SOEST), Univ. of Hawai'i, 2525 Correa Road, Honolulu, HI 96822, USA (URL: http://modis.higp.hawaii.edu/).
Piton de la Fournaise (France) — November 2019 Cite this Report
Piton de la Fournaise
France
21.244°S, 55.708°E; summit elev. 2632 m
All times are local (unless otherwise noted)
Three brief eruptive events in July, August, and October 2019
Short pulses of intermittent eruptive activity have been common at Piton de la Fournaise, the large basaltic shield volcano on La Réunion Island in the western Indian Ocean, for several thousand years. Over the last 20 years effusive basaltic eruptions have occurred on average twice per year. The activity is characterized by lava fountains and lava flows, and occasional explosive eruptions that shower blocks over the summit area and produce ash plumes. Almost all of the recent activity has occurred within the Enclos Fouqué caldera around the flanks of the central cone which has the Dolomieu Crater at its summit, although past eruptions in 1977, 1986, and 1998 have occurred at vents outside the caldera. Two eruptive episodes were reported during January-June 2019; from 18 February to 10 March, and from 11 to 13 June (BGVN 44:07). Three episodes during July-October 2019 are covered in this report, with information provided primarily by the Observatoire Volcanologique du Piton de la Fournaise (OVPF) as well as satellite instruments.
Three brief eruptive episodes took place during July-October 2019. In each case, slow ground inflation in the weeks leading up to the eruption was followed by sudden inflation at the time of the fissure opening and lava flow event. This was followed by a resumption of inflation days or weeks later. The first event took place during 29-30 July and consisted of three fissures opening on the N flank of the Dolomieu cone. It lasted for less than 24 hours, and the maximum flow length was about 730 m. The second event began on 11 August with two fissures opening on the S flank of the Dolomieu cone. The flows traveled downhill almost 3 km; activity ended on 15 August. Two new fissures opened during 25-27 October on the SSE flank of the cone; one was active only briefly while the second created a 3.6-km-long flow that stopped a few hundred meters before the major highway. The sudden surges of thermal energy from the eruptions are clearly visible in the MIROVA thermal data (figure 182). Each of the eruptive episodes was also accompanied by SO2 emissions that were detected by satellite instruments (figure 183).
Activity during July 2019. The last eruption, a series of flows from several fissures on the SSE flank of Dolomieu Crater near the crater rim (at the center of the Enclos Fouqué caldera), lasted from 11 to 13 June 2019 (figure 184). Ground deformation after the eruption indicated renewed inflation of the edifice which had been ongoing since May. OVPF reported an increase in seismicity beginning on 21 June which continued throughout July; the earthquakes were located near the NW rim of the Dolomieu Crater and on its NW flank. Four centimeters of elongation were recorded between two GNSS stations within the Enclos during late June and July prior to the next eruption. The next short-lived eruption took place during 29-30 July, near the location of the seismicity on the NW flank of the Dolomieu cone about 600 m E of the Formica Leo cone. The onset of the eruption was accompanied by rapid ground deformation of about 12-13 cm, recorded at a station that is located west of the Dolomieu Crater (figure 185).
The late July eruption began around 1200 local time on 29 July 2019 with the opening of three fissures over a distance of about 450 m on the N flank of Dolomieu cone, close to the tourist trail to the summit (figure 186). Lava fountains 20-30 m high were reported. Thermal measurements indicated flow temperatures of about 1,100°C at the base of the lava fountains; samples were collected for analysis (figure 187). Average discharge rates of 11.6 m3s were estimated for the eruption which ended less than 24 hours later, around 0430 on 30 July. The maximum flow length was about 730 m.
Eruption of 11-15 August 2019. During 1-10 August there were 33 shallow volcano-tectonic (VT) earthquakes located under the SE flank of Dolomieu cone; a new eruption began over this area on 11 August (figure 188). Two centimeters of inflation were recorded between the 29-30 July eruption and the 11-15 August event; this was followed by a rapid burst of inflation (tens of centimeters) at the onset of the eruption. Inflation resumed shortly after the eruption ended. The eruption began around 1620 local time on 11 August. Two fissures opened, one at 1,700 m elevation, and one at 1,500 m elevation on the SE flank, about 1,400 m apart (figure 189). Due to the steep slopes in the area, the lava flow quickly reached the "Grande Pentes" area before slowing down at the flatter "Piton Tremblet" area. The farthest traveled flow was cooling at an elevation of about 560 m, about 2 km from the National Road (RN2) on 14 August. The maximum effusion rate was measured at 9 m3/s. The eruption stopped on 15 August 2019 at 2200 local time after more than 6 hours of "piston gas" activity, and a brief pause in flow activity earlier in the day. About 3 million m3of lava were emitted, according to OVPF-IPGP. The flows from the 1,700 m and 1500 m altitude fissures reached maximum lengths of 2.9 and 2.7 km, respectively.
Activity during September-October 2019. Very little activity was reported during September 2019. Seismicity remained low with only 32 earthquakes reported during the month, and inflation, which had continued after the 11-15 August eruption, stopped at the beginning of September. Inflation resumed on 11 October. Two seismic swarms were recorded during October 2019. The first, on 21 October (207 events), lasted for about 40 minutes, and did not result in an eruption. The second began on 25 October and consisted of 827 events. It was followed by an eruption during 25-27 October located on the SSE flank of the Dolomieu cone. Deformation followed a similar pattern as it had during and prior to the eruptive events of July and August. Inflation of a few centimeters between 11 and 24 October was followed by rapid inflation of about 10 cm at the onset of the new eruption. Inflation resumed again after this eruption as well.
Two fissures opened during the 25-27 October eruption, one at 1,060 m elevation and one at 990 m. The first fissure was no longer active when viewed during an overflight 2.5 hours after it had opened. The flows moved rapidly until reaching the lower slope areas of the Grand Brule about 1.5-2 km downstream of the "Piton Tremblet" area. On 26 October only one vent was active with fountains 10-20 m high (figure 190). The lava discharge rates during the eruption averaged about 14 m3/s. The eruption ended at 1630 local time on 27 October after one hour of "gas piston" activity (figure 191). A total of about 1.8 million m3 of lava was emitted. The flows from the 990 m elevation site reached a maximum length of 3.6 km, and the lava flow front stopped about 230 m before reaching the RN2 National road (figure 192).
Geologic Background. Piton de la Fournaise is a massive basaltic shield volcano on the French island of Réunion in the western Indian Ocean. Much of its more than 530,000-year history overlapped with eruptions of the deeply dissected Piton des Neiges shield volcano to the NW. Three scarps formed at about 250,000, 65,000, and less than 5,000 years ago by progressive eastward slumping, leaving caldera-sized embayments open to the E and SE. Numerous pyroclastic cones are present on the floor of the scarps and their outer flanks. Most recorded eruptions have originated from the summit and flanks of Dolomieu, a 400-m-high lava shield that has grown within the youngest scarp, which is about 9 km wide and about 13 km from the western wall to the ocean on the E side. More than 150 eruptions, most of which have produced fluid basaltic lava flows, have occurred since the 17th century. Only six eruptions, in 1708, 1774, 1776, 1800, 1977, and 1986, have originated from fissures outside the scarps.
Information Contacts: Observatoire Volcanologique du Piton de la Fournaise, Institut de Physique du Globe de Paris (OVPF-IPGP), 14 route nationale 3, 27 ème km, 97418 La Plaine des Cafres, La Réunion, France (URL: http://www.ipgp.fr/fr); MIROVA (Middle InfraRed Observation of Volcanic Activity), a collaborative project between the Universities of Turin and Florence (Italy) supported by the Centre for Volcanic Risk of the Italian Civil Protection Department (URL: http://www.mirovaweb.it/); Global Sulfur Dioxide Monitoring Page, Atmospheric Chemistry and Dynamics Laboratory, NASA Goddard Space Flight Center (NASA/GSFC), 8800 Greenbelt Road, Goddard, Maryland, USA (URL: https://so2.gsfc.nasa.gov/).
Karymsky (Russia) — November 2019 Cite this Report
Karymsky
Russia
54.049°N, 159.443°E; summit elev. 1513 m
All times are local (unless otherwise noted)
Moderate explosive activity with ash plumes through 24 September 2019
Eruptive activity at Karymsky has been frequent since 1996, with moderate ash explosions, gas-and-steam emissions, and thermal anomalies. The latest eruptive period began in mid-February 2019 (BGVN 44:05) when explosions resumed after more than four months of quiet, producing an ash plume that extended 55 km downwind. Intermittent explosive activity continued until 24 September 2019. The volcano is monitored by the Kamchatka Volcanic Eruptions Response Team (KVERT).
Ash plumes were reported during the second half of February and the first half of March 2019 (BGVN 44:05). During May-September 2019 similar activity continued, with ash plumes being generated at least every few days (table 12). Though not included in the weekly KVERT report as notable events, obvious ash plumes were also seen in Sentinel-2 imagery on 22 July and photographed from an aircraft on 23 July. Volcanologists doing fieldwork on 14 August observed an ash plume rising to 5 km altitude (figure 44). A week later, during 20-22 August, explosions generated ash plumes as high as 6 km altitude that were visible in satellite imagery (figure 45). Although not noted in KVERT reports, a photo from 9 September showed a plume blowing downwind directly from the summit crater (figure 46). No significant ash plumes were reported by KVERT after 24 August, but the last ash explosion was recorded on 24 September.
Table 12. Notable ash plumes reported from Karymsky during May-October 2019. All dates are in UTC. Courtesy of KVERT.
| Date |
Observations |
| 06-07 May 2019 |
Gas-and-steam plume containing ash rose to 2-2.2 km in altitude and drifted 105 km SE and SW. |
| 21 May 2019 |
Ash plume drifted 9 km SW. |
| 24 May 2019 |
Ash plume identified in satellite images drifted 45 km NE. |
| 13-17 Jul 2019 |
Ash plumes drifted 60 km in multiple directions. |
| 25 Jul 2019 |
Ash plume drifted 134 km SE. |
| 26 Jul 2019 |
Ash plume drifted 60 km SE. |
| 03-05 Aug 2019 |
Ash plumes drifted 180 km SE and NW. |
| 06 Aug 2019 |
Ash plume rose 2-2.5 km in altitude and drifted about 17 km NW. |
| 14 Aug 2019 |
Volcanologists observed explosions and ash plumes that rose to 5 km altitude. Satellite images showed ash plumes drifting E and SSE that same day. |
| 20-22 Aug 2019 |
Ash plumes visible in satellite images drifted 500 km SW. Explosions on 21 August produced ash plumes to 6 km altitude. |
| 23-24 Aug 2019 |
Ash plumes drifted 51 km SE. |
During May-October 2019, thermal anomalies were detected with the MODIS satellite instruments analyzed using the MODVOLC algorithm only on 25 July (2 pixels) and 21 August (10 pixels). Consistent with both observations, KVERT noted ash explosions on those dates. The MIROVA (Middle InfraRed Observation of Volcanic Activity) volcano hotspot detection system, also based on analysis of MODIS data, detected numerous hotspots in May, none in June, 3 in July, 5 in August, and none in September or October. KVERT reported that a thermal anomaly was visible in satellite images on most, if not all, days when not obscured by clouds.
The Aviation Color Code remained at Orange (the second highest level on a four-color scale) until 3 October, when KVERT reduced it to Yellow, after which moderate gas-and-steam activity continued.
Geologic Background. Karymsky, the most active volcano of Kamchatka's eastern volcanic zone, is a symmetrical stratovolcano constructed within a 5-km-wide caldera that formed during the early Holocene. The caldera cuts the south side of the Pleistocene Dvor volcano and is located outside the north margin of the large mid-Pleistocene Polovinka caldera, which contains the smaller Akademia Nauk and Odnoboky calderas. Most seismicity preceding Karymsky eruptions originated beneath Akademia Nauk caldera, located immediately south. The caldera enclosing Karymsky formed about 7600-7700 radiocarbon years ago; construction of the stratovolcano began about 2000 years later. The latest eruptive period began about 500 years ago, following a 2300-year quiescence. Much of the cone is mantled by lava flows less than 200 years old. Historical eruptions have been vulcanian or vulcanian-strombolian with moderate explosive activity and occasional lava flows from the summit crater.
Information Contacts: Kamchatka Volcanic Eruptions Response Team (KVERT), Far Eastern Branch, Russian Academy of Sciences, 9 Piip Blvd., Petropavlovsk-Kamchatsky, 683006, Russia (URL: http://www.kscnet.ru/ivs/kvert/); Institute of Volcanology and Seismology, Far Eastern Branch, Russian Academy of Sciences (IVS FEB RAS), 9 Piip Blvd., Petropavlovsk-Kamchatsky 683006, Russia (URL: http://www.kscnet.ru/ivs/eng/); Hawai'i Institute of Geophysics and Planetology (HIGP) - MODVOLC Thermal Alerts System, School of Ocean and Earth Science and Technology (SOEST), Univ. of Hawai'i, 2525 Correa Road, Honolulu, HI 96822, USA (URL: http://modis.higp.hawaii.edu/); MIROVA (Middle InfraRed Observation of Volcanic Activity), a collaborative project between the Universities of Turin and Florence (Italy) supported by the Centre for Volcanic Risk of the Italian Civil Protection Department (URL: http://www.mirovaweb.it/); Sentinel Hub Playground (URL: https://www.sentinel-hub.com/explore/sentinel-playground).
Mayon (Philippines) — November 2019 Cite this Report
Mayon
Philippines
13.257°N, 123.685°E; summit elev. 2462 m
All times are local (unless otherwise noted)
Gas-and-steam plumes and summit incandescence during May-October 2019
Mayon, located in the Philippines, is a highly active stratovolcano with recorded historical eruptions dating back to 1616. The most recent eruptive episode began in early January 2018 that consisted of phreatic explosions, steam-and-ash plumes, lava fountaining, and pyroclastic flows (BGVN 43:04). The previous report noted small but distinct thermal anomalies, gas-and-steam plumes, and slight inflation (BGVN 44:05) that continued to occur from May into mid-October 2019. This report includes information based on daily bulletins from the Philippine Institute of Volcanology and Seismology (PHIVOLCS) and Sentinel-2 satellite imagery.
Between May and October 2019, white gas-and-steam plumes rose to a maximum altitude of 800 m on 17 May. PHIVOLCS reported that faint summit incandescence was frequently observed at night from May-July and Sentinel-2 thermal satellite imagery showed weaker thermal anomalies in September and October (figure 49); the last anomaly was identified on 12 October. Average SO2 emissions as measured by PHIVOLCS generally varied between 469-774 tons/day; the high value of the period was on 25 July, with 1,171 tons/day. Small SO2 plumes were detected by the TROPOMI satellite instrument a few times during May-September 2019 (figure 50).
Continuous GPS data has shown slight inflation since June 2018, corroborated by precise leveling data taken on 9-17 April, 16-25 July, and 23-30 October 2019. Elevated seismicity and occasional rockfall events were detected by the seismic monitoring network from PHIVOLCS from May to July; recorded activity decreased in August. Activity reported by PHIVOLCS in September-October 2019 consisted of frequent gas-and-steam emissions, two volcanic earthquakes, and no summit incandescence.
Geologic Background. Symmetrical Mayon, which rises above the Albay Gulf NW of Legazpi City, is the most active volcano of the Philippines. The steep upper slopes are capped by a small summit crater. Recorded eruptions since 1616 CE range from Strombolian to basaltic Plinian, with cyclical activity beginning with basaltic eruptions, followed by longer periods of andesitic lava flows. Eruptions occur predominately from the central conduit and have also produced lava flows that travel far down the flanks. Pyroclastic density currents and mudflows have commonly swept down many of the approximately 40 ravines that radiate from the summit and have often damaged populated lowland areas. A violent eruption in 1814 killed more than 1,200 people and devastated several towns.
Information Contacts: Philippine Institute of Volcanology and Seismology (PHIVOLCS), Department of Science and Technology, University of the Philippines Campus, Diliman, Quezon City, Philippines (URL: http://www.phivolcs.dost.gov.ph/); Sentinel Hub Playground (URL: https://www.sentinel-hub.com/explore/sentinel-playground); Global Sulfur Dioxide Monitoring Page, Atmospheric Chemistry and Dynamics Laboratory, NASA Goddard Space Flight Center (NASA/GSFC), 8800 Greenbelt Road, Goddard, Maryland, USA (URL: https://SO2.gsfc.nasa.gov/).
Sarychev Peak (Russia) — November 2019 Cite this Report
Sarychev Peak
Russia
48.092°N, 153.2°E; summit elev. 1496 m
All times are local (unless otherwise noted)
Ash plume on 11 August; thermal anomalies from late May to early October 2019
Sarychev Peak, located on Matua Island in the central Kurile Islands of Russia, has had eruptions reported since 1765. Renewed activity began in October 2017, followed by a major eruption in June 2009 that included pyroclastic flows and ash plumes (BGVN 43:11 and 34:06). Thermal anomalies, explosions, and ash plumes took place between September and October 2018. A single ash explosion occurred in May 2019. Another ash plume was seen on 11 August, and small thermal anomalies were present in infrared imagery during June-October 2019. Information is provided by the Sakhalin Volcanic Eruption Response Team (SVERT) and the Tokyo Volcanic Ash Advisory Center (VAAC), with satellite imagery from Sentinel-2.
Satellite images from Sentinel-2 showed small white plumes from Sarychev Peak during clear weather on 4 and 14 August 2019 (figure 27); similar plumes were observed on a total of nine clear weather days between late June and October 2019. According to SVERT and the Tokyo VAAC, satellite data from HIMAWARI-8 showed an ash plume rising to an altitude of 2.7 km and drifting 50 km SE on 11 August. It was visible for a few days before dissipating. No further volcanism was detected by SVERT, and no activity was evident in a 17 August Sentinel-2 image (figure 27).
Intermittent weak thermal anomalies were detected by the MIROVA system using MODIS data from late May through 7 October 2019 (figure 28). Sentinel-2 satellite imagery from 28 June, 13 and 23 July, 9 August, and 21 October showed a very small thermal anomaly, but on 28 September a pronounced thermal anomaly was visible (figure 29). No additional thermal anomalies were identified from any source after 7 October through the end of the month.
Geologic Background. Sarychev Peak, one of the most active volcanoes of the Kuril Islands, occupies the NW end of Matua Island in the central Kuriles. The andesitic central cone was constructed within a 3-3.5-km-wide caldera, whose rim is exposed only on the SW side. A dramatic 250-m-wide, very steep-walled crater with a jagged rim caps the volcano. The substantially higher SE rim forms the 1496 m high point of the island. Fresh-looking lava flows, prior to activity in 2009, had descended in all directions, often forming capes along the coast. Much of the lower-angle outer flanks of the volcano are overlain by pyroclastic-flow deposits. Eruptions have been recorded since the 1760s and include both quiet lava effusion and violent explosions. Large eruptions in 1946 and 2009 produced pyroclastic flows that reached the sea.
Information Contacts: Sakhalin Volcanic Eruption Response Team (SVERT), Institute of Marine Geology and Geophysics, Far Eastern Branch, Russian Academy of Science, Nauki st., 1B, Yuzhno-Sakhalinsk, Russia, 693022 (URL: http://www.imgg.ru/en/, http://www.imgg.ru/ru/svert/reports); Tokyo Volcanic Ash Advisory Center (VAAC), 1-3-4 Otemachi, Chiyoda-ku, Tokyo, Japan (URL: http://ds.data.jma.go.jp/svd/vaac/data/); MIROVA (Middle InfraRed Observation of Volcanic Activity), a collaborative project between the Universities of Turin and Florence (Italy) supported by the Centre for Volcanic Risk of the Italian Civil Protection Department (URL: http://www.mirovaweb.it/); Sentinel Hub Playground (URL: https://www.sentinel-hub.com/explore/sentinel-playground).
Sheveluch (Russia) — November 2019 Cite this Report
Sheveluch
Russia
56.653°N, 161.36°E; summit elev. 3283 m
All times are local (unless otherwise noted)
Frequent ash explosions and lava dome growth continue through October 2019
After a lull in activity at Sheveluch, levels intensified again in mid-December 2018 and remained high through April 2019, with lava dome growth, strong explosions that produced ash plumes, incandescent lava flows, hot avalanches, numerous thermal anomalies, and strong fumarolic activity (BGVN 44:05). This report summarizes activity between May and October 2019. The volcano is monitored by the Kamchatka Volcanic Eruptions Response Team (KVERT).
According to KVERT, explosive activity continued to generate ash plumes during May-October 2019 (table 13). Strong fumarolic activity, incandescence and growth of the lava dome, and hot avalanches accompanied this process. There were also reports of plumes caused by re-suspended ash rather than new explosions. Plumes frequently extended a few hundred kilometers downwind, with the longest ones remaining visible in imagery as much as 1,000-1,400 km away. One of the larger explosions, on 1 October (figure 52), also generated a pyroclastic flow. Some of the stronger explosions sent the plume to an altitude of 10-11 km, or more than 7 km above the summit. The Aviation Color Code remained at Orange (the second highest level on a four-color scale) throughout the reporting period, except for several hours on 6 October when it was raised to Red (the highest level).
Table 13. Explosions and ash plumes at Sheveluch during May-October 2019. Dates and times are UTC, not local. Data courtesy of KVERT.
| Dates |
Plume altitude (km) |
Drift Distance and Direction |
Remarks |
| 30 Apr-02 May 2019 |
-- |
200 km SE |
Resuspended ash. |
| 03-10 May 2019 |
-- |
50 km SE, SW |
Gas-and-steam plumes containing some ash. |
| 13 May 2019 |
-- |
16 km SE |
Resuspended ash. |
| 11-12 Jun 2019 |
-- |
60 km WNW |
Explosions and hot avalanches seen in video and satellite images. |
| 24, 27 Jun 2019 |
4.5 E, W |
Ash plumes. |
| 05 Aug 2019 |
2.5 |
40 km NW |
Diffuse ash plume. |
| 25 Aug 2019 |
4.5-5 |
500 km NW |
Ash plumes. |
| 29 Aug 2019 |
10 |
Various; 550 km N |
Explosions at 1510 produced ash plumes. |
| 30 Aug 2019 |
7-7.5 |
50 km SSE |
Explosions at 1957 produced ash plumes. |
| 03 Sep 2019 |
5.5 |
SE |
-- |
| 02-03, 05 Sep 2019 |
10 |
660 km SE |
Ash plumes seen in satellite images. |
| 05 Sep 2019 |
-- |
-- |
Resuspended ash. |
| 11-12 Sep 2019 |
-- |
250 km ESE |
Resuspended ash plumes. Satellite and webcam data recorded ash emissions and a gas-and-steam plume with some ash drifting 50 km ESE on 12 Sep. |
| 12-15, 17, 19 Sep 2019 |
-- |
200 km SW, SE, NE |
Ash plumes. |
| 20-21, 23, 26 Sep 2019 |
7 |
580 km ESE |
Explosions produced ash plumes. |
| 29 Sep, 01-02 Oct 2019 |
9 |
1,400 km SE, E |
Explosions produced ash plumes. Notable pyroclastic flow traveled SE on 1 Oct. |
| 04 Oct 2019 |
-- |
170 km E |
Resuspended ash. |
| 06 Oct 2019 |
10 |
430 km NE; 1,080 km ENE |
Ash plumes. Aviation Color Code raised to Red for several hours. |
| 08 Oct 2019 |
-- |
170 km E |
Resuspended ash. |
| 06, 09 Oct 2019 |
6.5-11 |
1,100 km E |
-- |
| 11-13, 15 Oct 2019 |
6.5-7 |
620 km E, SE |
Explosions produced ash plumes. |
| 16-17 Oct 2019 |
-- |
125 km E |
Resuspended ash. |
| 19-20 Oct 2019 |
-- |
110 km SE |
Resuspended ash. |
| 21 Oct 2019 |
10-11 |
1,300 km SE |
Explosions produced ash plumes. |
Numerous thermal anomalies, based on MODIS satellite instruments analyzed using the MODVOLC algorithm, were observed every month. Consistent with this, the MIROVA (Middle InfraRed Observation of Volcanic Activity) system recorded thermal anomalies almost daily. According to KVERT, a thermal anomaly over Sheveluch was identified in satellite images during the entire reporting period, although cloudy weather sometimes obscured observations.
Geologic Background. The high, isolated massif of Sheveluch volcano (also spelled Shiveluch) rises above the lowlands NNE of the Kliuchevskaya volcano group. The 1,300 km3 andesitic volcano is one of Kamchatka's largest and most active volcanic structures, with at least 60 large eruptions during the Holocene. The summit of roughly 65,000-year-old Stary Shiveluch is truncated by a broad 9-km-wide late-Pleistocene caldera breached to the south. Many lava domes occur on its outer flanks. The Molodoy Shiveluch lava dome complex was constructed during the Holocene within the large open caldera; Holocene lava dome extrusion also took place on the flanks of Stary Shiveluch. Widespread tephra layers from these eruptions have provided valuable time markers for dating volcanic events in Kamchatka. Frequent collapses of dome complexes, most recently in 1964, have produced debris avalanches whose deposits cover much of the floor of the breached caldera.
Information Contacts: Kamchatka Volcanic Eruptions Response Team (KVERT), Far Eastern Branch, Russian Academy of Sciences, 9 Piip Blvd., Petropavlovsk-Kamchatsky, 683006, Russia (URL: http://www.kscnet.ru/ivs/kvert/); Institute of Volcanology and Seismology, Far Eastern Branch, Russian Academy of Sciences (IVS FEB RAS), 9 Piip Blvd., Petropavlovsk-Kamchatsky 683006, Russia (URL: http://www.kscnet.ru/ivs/eng/); Hawai'i Institute of Geophysics and Planetology (HIGP) - MODVOLC Thermal Alerts System, School of Ocean and Earth Science and Technology (SOEST), Univ. of Hawai'i, 2525 Correa Road, Honolulu, HI 96822, USA (URL: http://modis.higp.hawaii.edu/); MIROVA (Middle InfraRed Observation of Volcanic Activity), a collaborative project between the Universities of Turin and Florence (Italy) supported by the Centre for Volcanic Risk of the Italian Civil Protection Department (URL: http://www.mirovaweb.it/).
Turrialba (Costa Rica) — November 2019 Cite this Report
Turrialba
Costa Rica
10.025°N, 83.767°W; summit elev. 3340 m
All times are local (unless otherwise noted)
Activity diminishes during March-October 2019, but small ash emissions continue
This report summarizes activity at Turrialba during March-October 2019. Typical activity similar to that reported in late 2018 and early 2019 (BGVN 44:04) included periodic weak ash explosions and numerous emissions containing some ash. However, during this period activity appeared to diminish with time. Data were provided by weekly reports by the Observatorio Vulcanologico Sismologica de Costa Rica-Universidad Nacional (OVSICORI-UNA).
According to OVSICORI-UNA, only highly diluted ash emissions were recorded from 22 April to 27 May (note that no reports were available online from the last week of March until 22 April). Weak ash explosions were again noted on 28 July, 4 August, and possibly on 20 October. OVSICORI-UNA reported more explosions or emissions containing ash on 25 and 28 October (table 9).
Table 9. Summary of reported activity at Turrialba, March-October 2019. Cloudy weather sometimes obscured observations. Maximum plume height is above the crater rim. Information courtesy of OVSICORI-UNA.
| Date |
Time |
Max plume height |
Plume drift |
Remarks |
| 01 Mar 2019 |
0444 |
200 m |
NE |
-- |
| 02-04 Mar 2019 |
-- |
200-300 m |
-- |
Continuous emissions with minor amounts of ash. |
| 09-12 Mar 2019 |
-- |
1,000 m |
-- |
Gas plumes containing minor amounts of ash. |
| 16-17 Mar 2019 |
-- |
-- |
-- |
Frequent and discontinuous emissions, but no visual confirmation due to poor visibility. |
| 20-22 Mar 2019 |
-- |
300 m |
W, SW |
Continuous emissions of steam with periodic pulses of diffuse ash; sulfur odor noted in Tierra Blanca de Cartago on 22 March. |
| 23-26 Mar 2019 |
-- |
-- |
-- |
Steam plumes with low concentration of magmatic gases. |
| 24 Mar 2019 |
0503 |
500 m |
-- |
Series of four pulses with ash. |
| 31 Mar 2019 |
0735 |
-- |
-- |
Explosion followed by passive emissions with low concentration of magmatic gases. Seismicity dominated by low-frequency events. |
| 08 Apr 2019 |
-- |
-- |
-- |
Minor ash emissions. |
| 24 Apr 2019 |
-- |
-- |
-- |
Diffuse ash emission. |
| 26 Apr 2019 |
-- |
-- |
N |
Emission with low ash content. |
| 27 Apr 2019 |
0722 |
below 100 m |
-- |
Weak, brief explosion with ash plume. |
| 04 May 2019 |
0524 |
-- |
-- |
Emission of very diluted ash. |
| 12-19 May 2019 |
-- |
-- |
-- |
Passive, short-duration emissions with small amounts of ash occurred sporadically. |
| 19-20 May 2019 |
-- |
-- |
-- |
Prolonged and intermittent periods of emissions with minor amounts of ash. |
| 28 Jul 2019 |
1441 |
-- |
-- |
Weak explosion and ash emission after 30 minutes of heavy rain. Inclement weather prevented visual confirmation. Ashfall in La Picada (N) and El Retiro farms. |
| 03-04 Aug 2019 |
-- |
-- |
-- |
Two small explosions, with some ash in the second. |
| 11 Aug 2019 |
-- |
-- |
-- |
Weak emission during night, identified by its seismic signal. No ash emission observed. |
| 05 Aug-19 Oct 2019 |
-- |
-- |
-- |
No ash detected. |
| 20 Oct 2019 |
2100 |
-- |
-- |
Explosion identified with seismicity; weather conditions prevented visual observation. No ashfall reported. |
| 25 Oct 2019 |
0400, 0700 |
-- |
-- |
Weak explosion at 0400, with ash. Ash at 0700 not associated with seismic signal, so could be a small intra-crater collapse. |
| 28 Oct 2019 |
1500 |
-- |
-- |
Weak emission containing ash. |
A report from Red Sismologica Nacional (RSN) about the 28 October ash explosion noted that it occurred at 1501 local time and lasted about 5 minutes. There were no reports of ashfall, but the crater webcam captured the small plume rising from the active vent. Incandescence in the active crater continued to be seen on the monitoring cameras.
Geologic Background. Turrialba, the easternmost of Costa Rica's Holocene volcanoes, is a large vegetated basaltic-to-dacitic stratovolcano located across a broad saddle NE of Irazú volcano overlooking the city of Cartago. The massive edifice covers an area of 500 km2. Three well-defined craters occur at the upper SW end of a broad 800 x 2200 m summit depression that is breached to the NE. Most activity originated from the summit vent complex, but two pyroclastic cones are located on the SW flank. Five major explosive eruptions have occurred during the past 3500 years. A series of explosive eruptions during the 19th century were sometimes accompanied by pyroclastic flows. Fumarolic activity continues at the central and SW summit craters.
Information Contacts: Observatorio Vulcanologico Sismologica de Costa Rica-Universidad Nacional (OVSICORI-UNA), Apartado 86-3000, Heredia, Costa Rica (URL: http://www.ovsicori.una.ac.cr/); Red Sismologica Nacional (RSN) a collaboration between a) the Sección de Sismología, Vulcanología y Exploración Geofísica de la Escuela Centroamericana de Geología de la Universidad de Costa Rica (UCR), and b) the Área de Amenazas y Auscultación Sismológica y Volcánica del Instituto Costarricense de Electricidad (ICE), Costa Rica (URL: https://rsn.ucr.ac.cr/).
Unnamed
Tonga
18.325°S, 174.365°W; summit elev. -40 m
All times are local (unless otherwise noted)
Submarine eruption in early August creates pumice rafts that drifted west to Fiji
Large areas of floating pumice, termed rafts, were encountered by sailors in the northern Tonga region approximately 80 km NW of Vava'u starting around 9 August 2019; the pumice reached the western islands of Fiji by 9 October (figure 7). Pumice rafts are floating masses of individual clasts ranging from millimeters to meters in diameter. The pumice clasts form when silicic magma is degassing, forming bubbles as it rises to the surface, which then rapidly cools to form solid rock. The isolated vesicles formed by the bubbles provide buoyancy to the rock and in turn, the entire pumice raft. These rafts are spread and carried by currents across the ocean; rafts originating in the Tonga area can eventually reach Australia. This report summarizes the pumice raft eruption from early August 2019 using witness accounts and satellite images (acquisition dates are given in UTC). Pending further research, the presumed source is the unnamed Tongan seamount (volcano number 243091) about 45 km NW of Vava'u, the origin of an earlier pumice raft produced during an eruption in 2001.
The first sighting of pumice was around 1430 on 9 August NW of Vava'u in Tonga (18° 22.068' S, 174° 50.800' W), when Shannon Lenz and Tom Whitehead on board SV Finely Finished initially encountered isolated rocks and smaller streaks of pumice clasts. The area covered by rock increasing to a raft with an estimated thickness of at least 15 cm that extended to the horizon in different directions, and which took 6-8 hours to cross (figure 8). There was no sulfur smell and the sound was described as a "cement mixer, especially below deck." There was also no plume or incandescence observed. Their video, posted to YouTube on 17 August, showed a thin surface layer of cohesive interconnected irregular streaks of pumice with the ocean surface still visible between them. Later footage showed a continuous, undulating mass of pumice entirely covering the ocean surface. Larger clasts are visible scattered throughout the raft. The pumice raft was visible in satellite imagery on this day NW of Late Island (figure 9). By 11 August the raft had evolved into a largely linear feature with smaller rafts to the SW (figure 10). Approximately four hours later, about 15 km to the WSW, Rachel Mackie encountered the pumice. Initially the pumice was "ribbons several hundred meters long and up to 20m wide. It was quite fine and like a slick across the surface of the water." By 2130 they were surrounded by the pumice, and around 25 km away the smell of sulfur was noted.
Michael and Larissa Hoult aboard the catamaran ROAM encountered the raft on 15 August (figure 11). They initially saw isolated clasts ranging from marble to tennis ball size (15-70 mm) at 18° 46′S, 174° 55'W. At around 0700 UTC (1900 local time) they noted the smell of sulfur at 18° 55′S, 175° 21′W, and by 0800 UTC they were immersed in the raft with visible clasts ranging from marble to basketball (25 cm) sizes. At this point the raft was entirely obscuring the ocean surface. On 16 and 21 August the pumice continued to disperse and drift NW (figures 12 and 13). On 20 August Scott Bryan calculated an average drift rate of around 13 km/day, with the pumice on this date about 164 km W of the unnamed seamount.
An online article published by Brad Scott at GeoNet on 9 September reported the preliminary size of the raft to be 60 km2, significantly smaller than the 2012 Havre seamount pumice raft that was 400 km2. Satellite identification of pumice-covered areas by GNS scientists showed the material moving SSW through 14 August (figure 14).
On 5 September the Maritime Safety Authority of Fiji (MSAF) issued a notice to mariners stating that the pumice was sighted in the vicinity of Lakeba, Oneata, and Aiwa Islands and was moving to the W. On 6 September a Planet Labs satellite image shows pumice encompassing the Fijian island of Lakeba over 450 km W of the Tongan islands (figure 15). The pumice entered the lagoon within the barrier reef and drifted around the island to continue towards the W. The pumice was imaged by the Landsat 8 satellite on 26 September as it moved through the Fijian islands, approximately 760 km away from its source (figure 16). The pumice is segmented into numerous smaller rafts of varying sizes that stretch over at least 140 km. On 12 September the Fiji Sun reported that the pumice had reached some of the Lau islands and was thick enough near the shore for people to stand on it.
Pumice had reached the Yasawa islands in western Fiji by 29 September and was beginning to fill the eastern bays (figure 17). By 9 October bays had been filled out to 500-600 m from the shore, and pumice had also passed through the islands to continue towards the W (figure 18). At this point the pumice beyond the islands had broken up into linear segments that continued towards the NW.
Geologic Background. A submarine volcano along the Tofua volcanic arc ~45 km NW of Vava'u Island was first observed in September 2001, ~35 km S of Fonualei and 60 km NE of Late volcano. The site of the eruption is at an approximate bathymetric depth of 300 m. T-phase waves were recorded on 27-28 September 2001, and on the 27th local fishermen observed an ash-rich eruption column that rose above the ocean surface. No eruptive activity was reported after the 28th, but water discoloration was documented the following month. In early November rafts and strandings of dacitic pumice were reported along the coasts of Kadavu and Viti Levu in Fiji. The depth of the summit of the submarine cone following the eruption was determined to be 40 m during a 2007 survey; the crater of the 2001 eruption was open to the E.
Information Contacts: GNS Science, Wairakei Research Centre, Private Bag 2000, Taupo 3352, New Zealand (URL: http://www.gns.cri.nz/); Salman Ashraf, GNS Science, Wairakei Research Centre, Private Bag 2000, Taupo 3352, New Zealand (URL: http://www.gns.cri.nz/, https://www.geonet.org.nz/news/8RnSKdhaWOEABBIh0bHDj); Brad Scott, New Zealand GeoNet Project, a collaboration between the Earthquake Commission and GNS Science, Wairakei Research Centre, Private Bag 2000, Taupo 3352, New Zealand (URL: http://www.geonet.org.nz/, https://www.geonet.org.nz/news/8RnSKdhaWOEABBIh0bHDj); Scott Bryan, School of Earth, Environmental & Biological Sciences, Science and Engineering Faculty, Queensland University of Technology, R Block Level 2, 204, Gardens Point (URL: https://staff.qut.edu.au/staff/scott.bryan); Shannon Lenz and Tom Whitehead, SV Finely Finished (URL: https://www.noonsite.com/news/south-pacific-tonga-to-fiji-navigation-alert-dangerous-slick-of-volcanic-rubble/, YouTube: https://www.youtube.com/watch?v=PEsHLSFFQhQ); Michael and Larissa Hoult, Sail Surf ROAM (URL: https://www.facebook.com/sailsurfroam/); Rachel Mackie, OLIVE (URL: http://www.oliveocean.com/, https://www.facebook.com/rachel.mackie.718); Sentinel Hub Playground (URL: https://www.sentinel-hub.com/explore/sentinel-playground); Planet Labs, Inc. (URL: https://www.planet.com/); Fiji Sun (URL: https://fijisun.com.fj/2019/09/12/pumice-menace-hits-parts-of-lau-group/).