Recently Published Bulletin Reports
Erebus (Antarctica) Lava lake remains active; most thermal alerts recorded since 2019
Rincon de la Vieja (Costa Rica) Frequent phreatic explosions during July-December 2023
Bezymianny (Russia) Explosion on 18 October 2023 sends ash plume 8 km high; lava flows and incandescent avalanches
Kilauea (United States) Low-level lava effusions in the lava lake at Halema’uma’u during July-December 2022
Nyamulagira (DR Congo) Lava flows and thermal activity during May-October 2023
Bagana (Papua New Guinea) Explosions, ash plumes, ashfall, and lava flows during April-September 2023
Mayon (Philippines) Lava flows, pyroclastic flows, ash emissions, and seismicity during April-September 2023
Nishinoshima (Japan) Eruption plumes and gas-and-steam plumes during May-August 2023
Krakatau (Indonesia) White gas-and-steam plumes and occasional ash plumes during May-August 2023
Villarrica (Chile) Strombolian activity, gas-and-ash emissions, and crater incandescence during April-September 2023
Merapi (Indonesia) Frequent incandescent avalanches during April-September 2023
Ebeko (Russia) Moderate explosive activity with ash plumes continued during June-November 2023
Erebus (Antarctica) — January 2024  Cite this Report
Erebus
Antarctica
77.53°S, 167.17°E; summit elev. 3794 m
All times are local (unless otherwise noted)
Lava lake remains active; most thermal alerts recorded since 2019
The lava lake in the summit crater of Erebus has been active since at least 1972. Located in Antarctica overlooking the McMurdo Station on Ross Island, it is the southernmost active volcano on the planet. Because of the remote location, activity is primarily monitored by satellites. This report covers activity during 2023.
The number of thermal alerts recorded by the Hawai'i Institute of Geophysics and Planetology’s MODVOLC Thermal Alerts System increased considerably in 2023 compared to the years 2020-2022 (table 9). In contrast to previous years, the MODIS instruments aboard the Aqua and Terra satellites captured data from Erebus every month during 2023. Consistent with previous years, the lowest number of anomalous pixels were recorded in January, November, and December.
Table 9. Number of monthly MODIS-MODVOLC thermal alert pixels recorded at Erebus during 2017-2023. See BGVN 42:06 for data from 2000 through 2016. The table was compiled using data provided by the HIGP – MODVOLC Thermal Alerts System.
| Year |
Jan |
Feb |
Mar |
Apr |
May |
Jun |
Jul |
Aug |
Sep |
Oct |
Nov |
Dec |
SUM |
| 2017 |
0 |
21 |
9 |
0 |
0 |
1 |
11 |
61 |
76 |
52 |
0 |
3 |
234 |
| 2018 |
0 |
21 |
58 |
182 |
55 |
17 |
137 |
172 |
103 |
29 |
0 |
0 |
774 |
| 2019 |
2 |
21 |
162 |
151 |
55 |
56 |
75 |
53 |
29 |
19 |
1 |
0 |
624 |
| 2020 |
0 |
2 |
16 |
18 |
4 |
4 |
1 |
3 |
18 |
3 |
1 |
6 |
76 |
| 2021 |
0 |
9 |
1 |
0 |
2 |
56 |
46 |
47 |
35 |
52 |
5 |
3 |
256 |
| 2022 |
1 |
13 |
55 |
22 |
15 |
32 |
39 |
19 |
31 |
11 |
0 |
0 |
238 |
| 2023 |
2 |
33 |
49 |
82 |
41 |
32 |
70 |
64 |
42 |
17 |
5 |
11 |
448 |
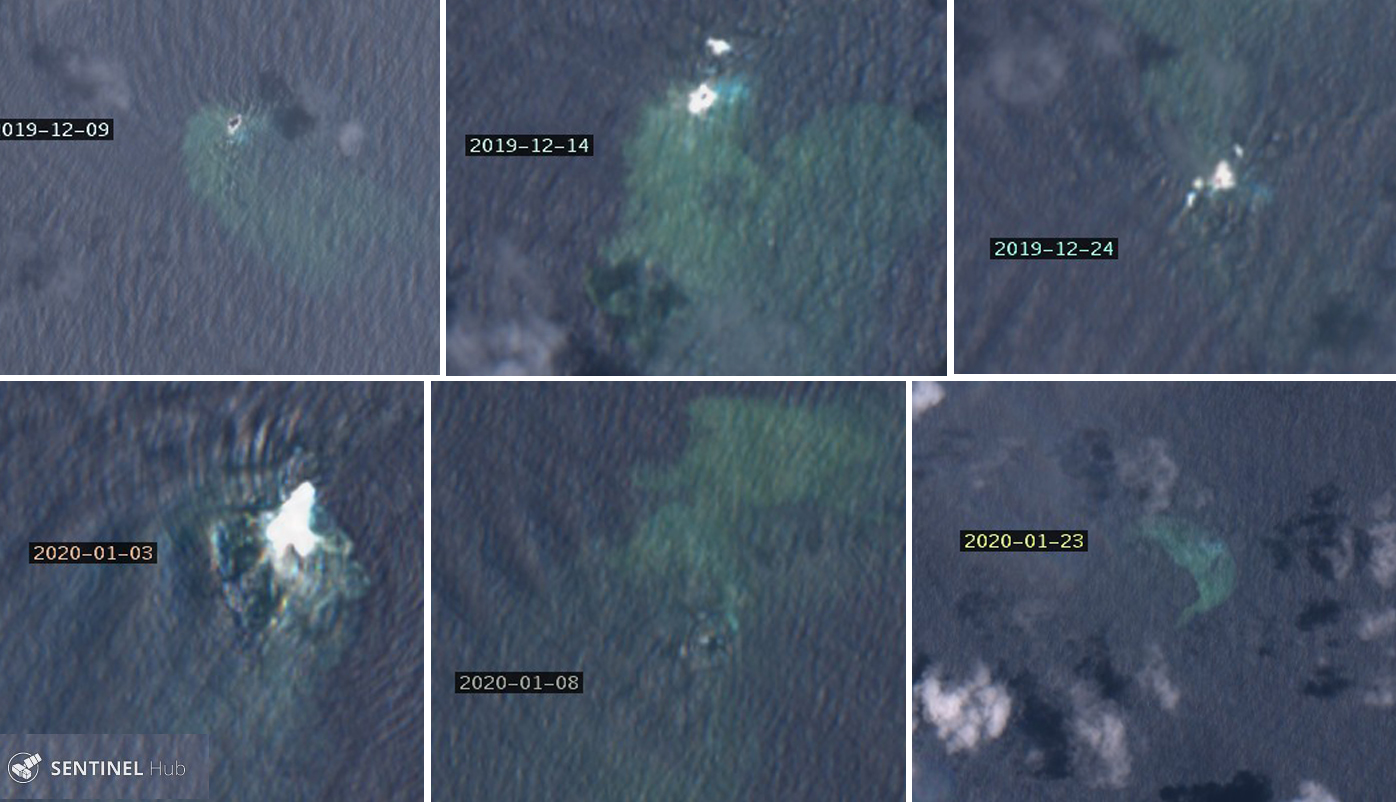
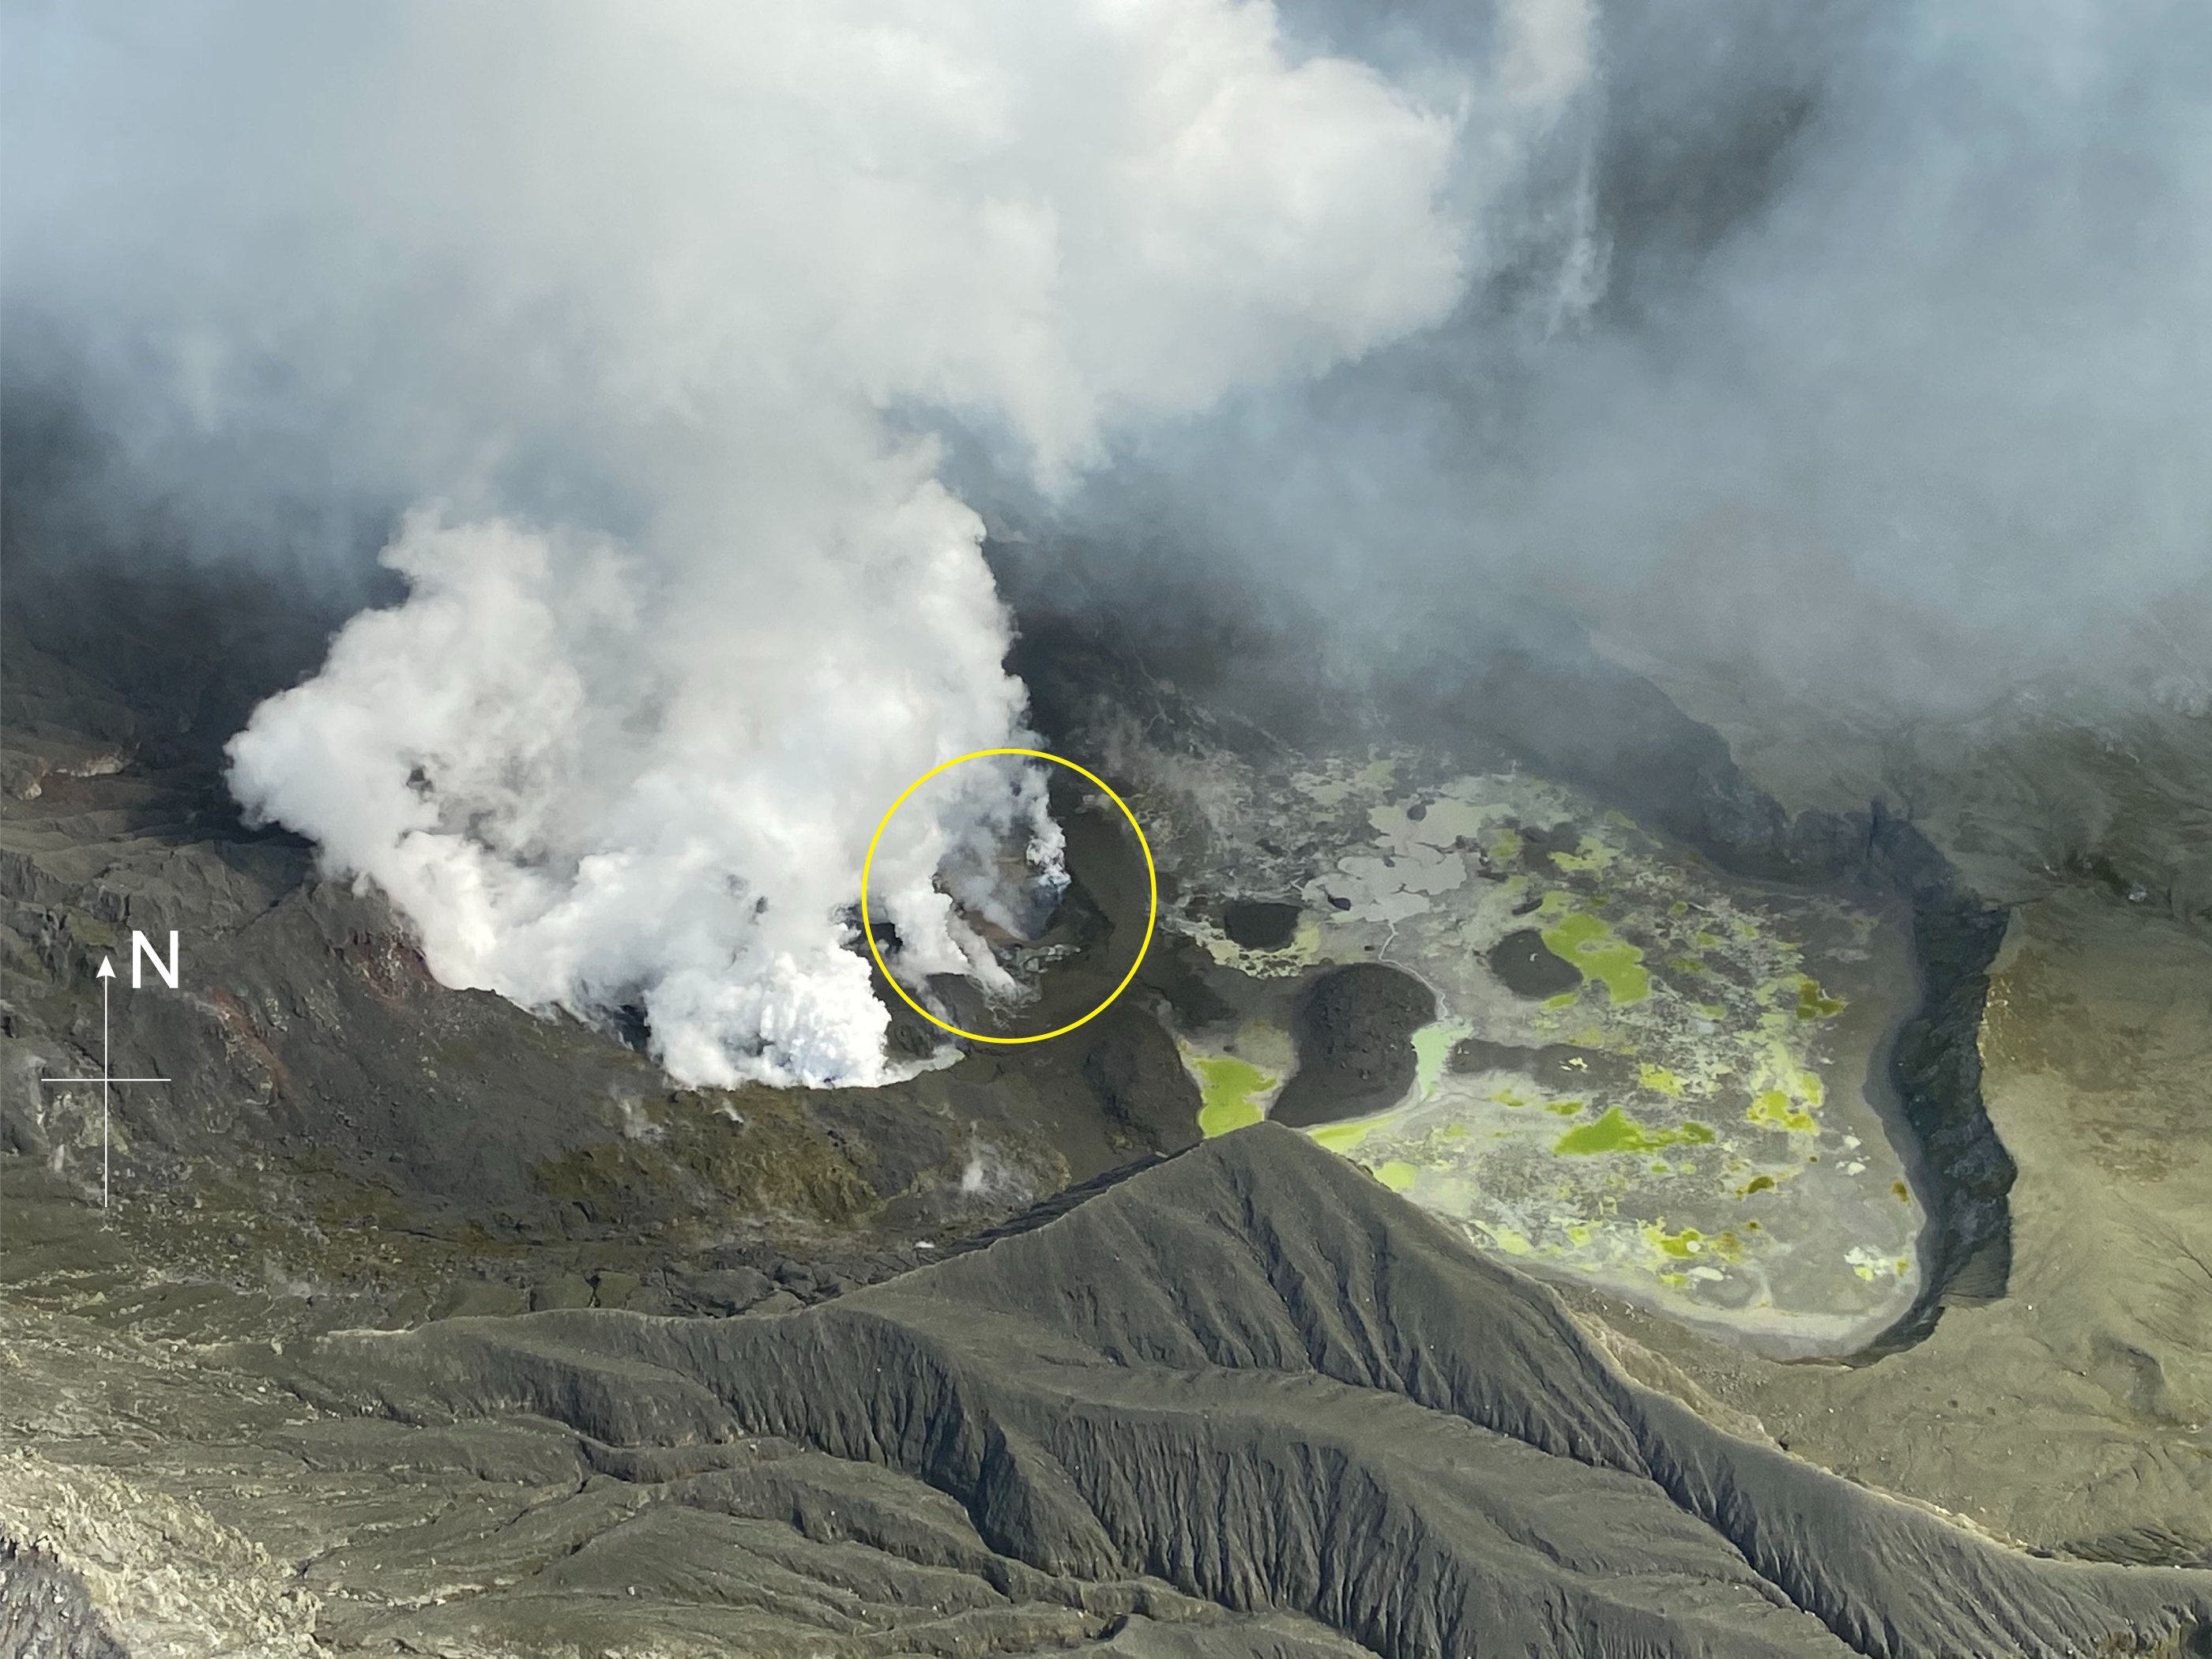
Sentinel-2 infrared images showed one or two prominent heat sources within the summit crater, accompanied by adjacent smaller sources, similar to recent years (see BGVN 46:01, 47:02, and 48:01). A unique image was obtained on 25 November 2023 by the OLI-2 (Operational Land Imager-2) on Landsat 9, showing the upper part of the volcano surrounded by clouds (figure 32).
Geologic Background. Mount Erebus, the world's southernmost historically active volcano, overlooks the McMurdo research station on Ross Island. It is the largest of three major volcanoes forming the crudely triangular Ross Island. The summit of the dominantly phonolitic volcano has been modified by one or two generations of caldera formation. A summit plateau at about 3,200 m elevation marks the rim of the youngest caldera, which formed during the late-Pleistocene and within which the modern cone was constructed. An elliptical 500 x 600 m wide, 110-m-deep crater truncates the summit and contains an active lava lake within a 250-m-wide, 100-m-deep inner crater; other lava lakes are sometimes present. The glacier-covered volcano was erupting when first sighted by Captain James Ross in 1841. Continuous lava-lake activity with minor explosions, punctuated by occasional larger Strombolian explosions that eject bombs onto the crater rim, has been documented since 1972, but has probably been occurring for much of the volcano's recent history.
Information Contacts: Hawai'i Institute of Geophysics and Planetology (HIGP) - MODVOLC Thermal Alerts System, School of Ocean and Earth Science and Technology (SOEST), Univ. of Hawai'i, 2525 Correa Road, Honolulu, HI 96822, USA (URL: http://modis.higp.hawaii.edu/); Copernicus Browser, Copernicus Data Space Ecosystem, European Space Agency (URL: https://dataspace.copernicus.eu/browser/); NASA Earth Observatory, EOS Project Science Office, NASA Goddard Space Flight Center, Goddard, Maryland, USA (URL: https://earthobservatory.nasa.gov/images/152134/erebus-breaks-through).
Rincon de la Vieja (Costa Rica) — January 2024 Cite this Report
Rincon de la Vieja
Costa Rica
10.83°N, 85.324°W; summit elev. 1916 m
All times are local (unless otherwise noted)
Frequent phreatic explosions during July-December 2023
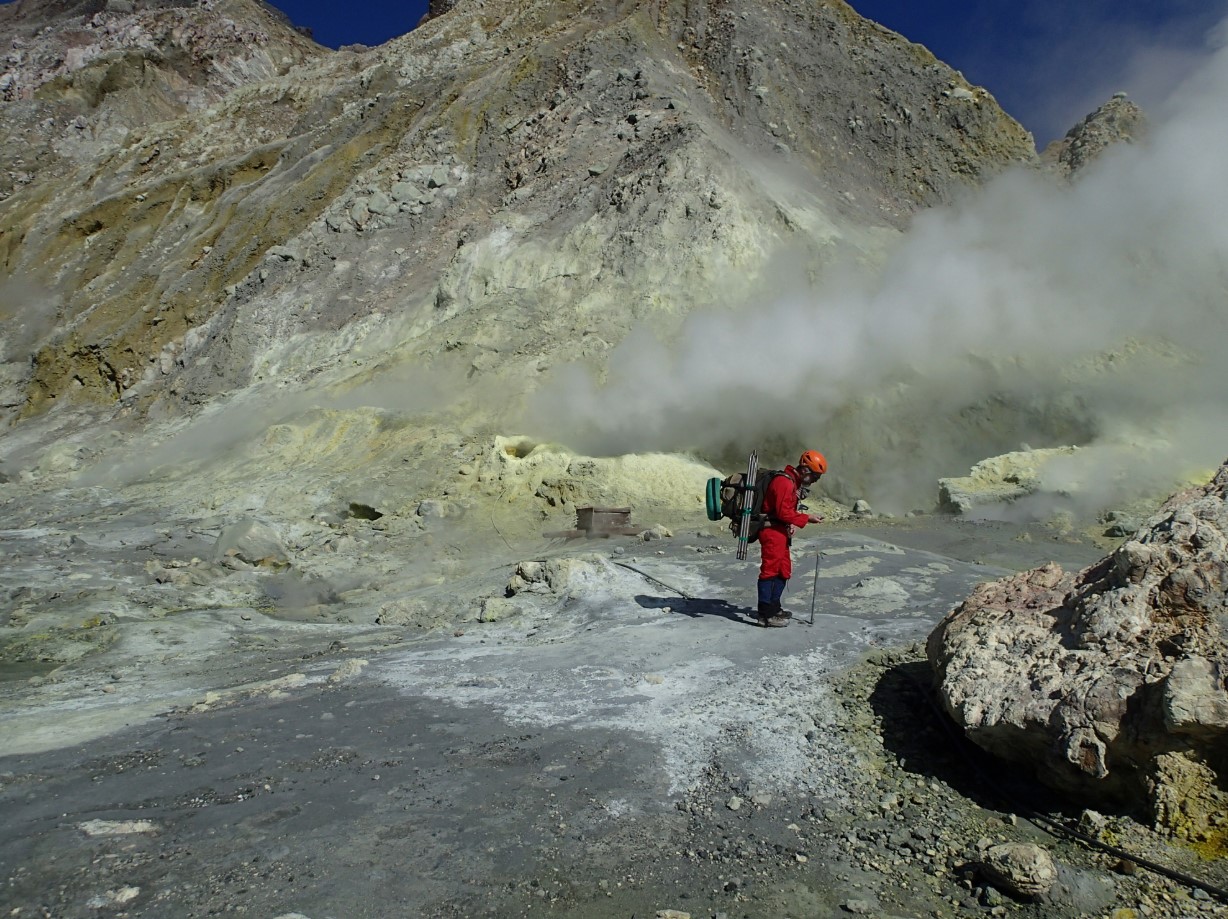
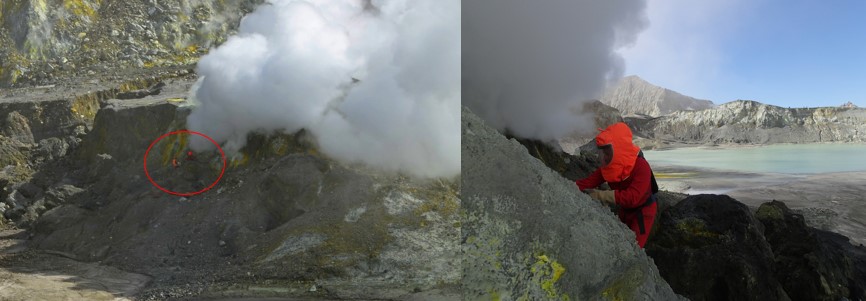
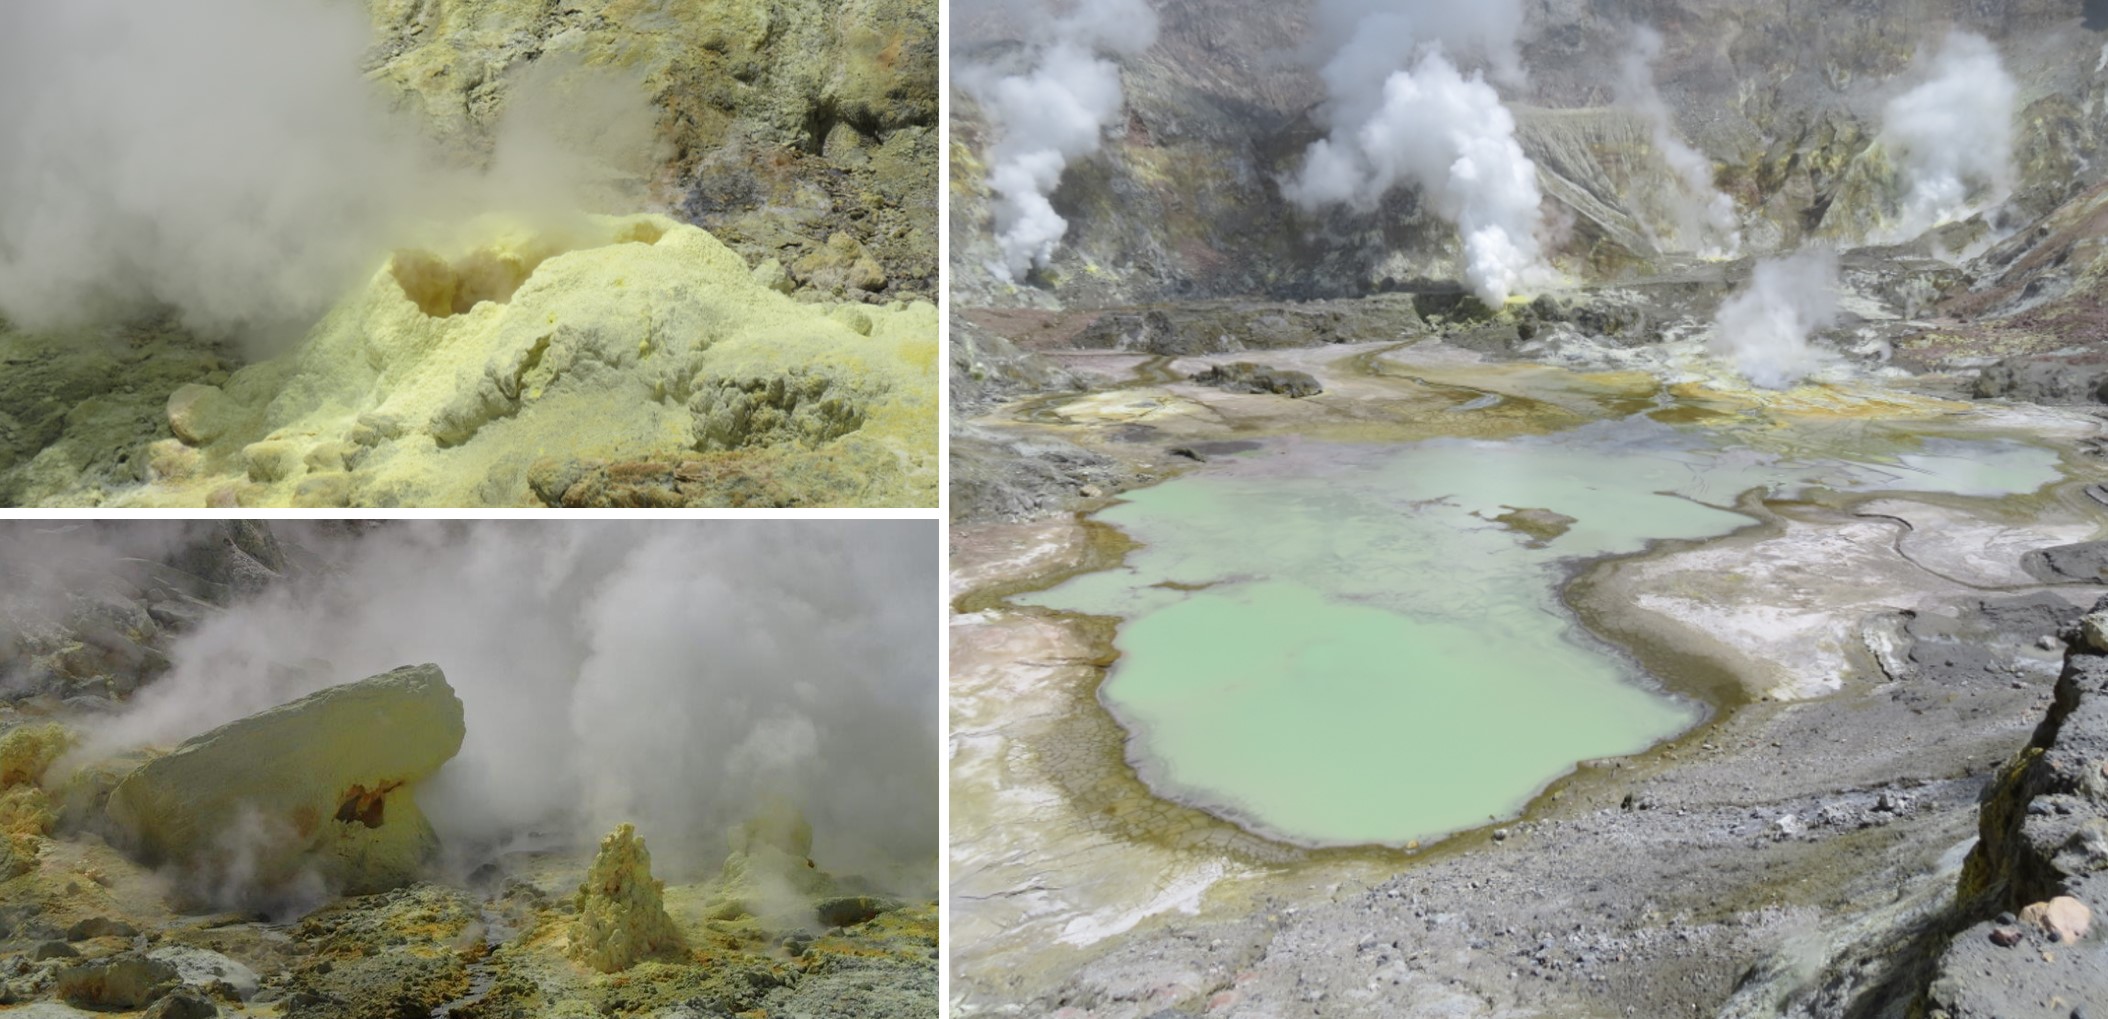
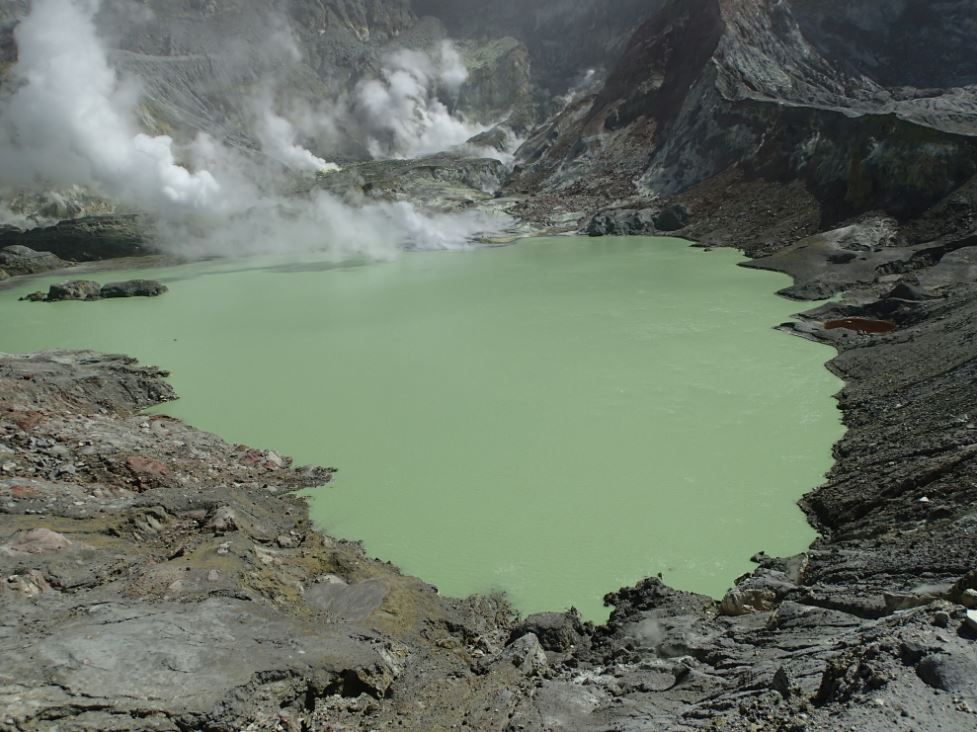
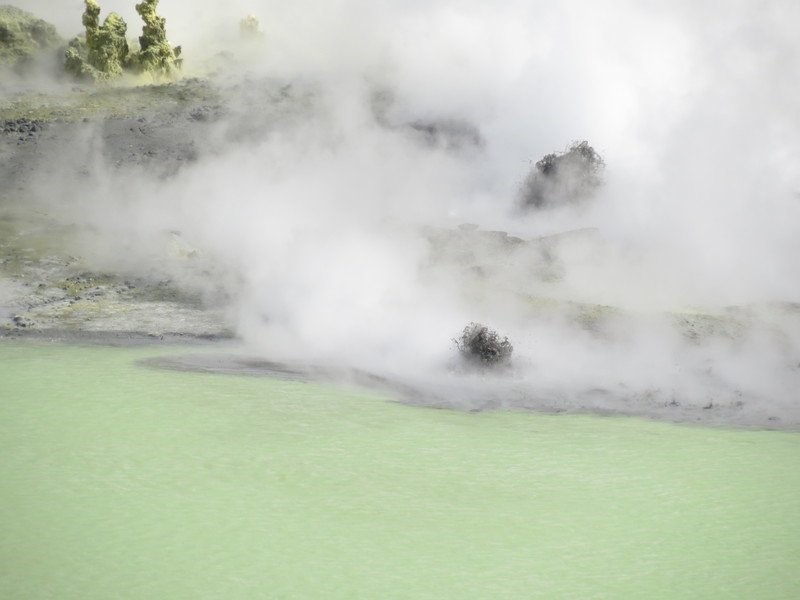
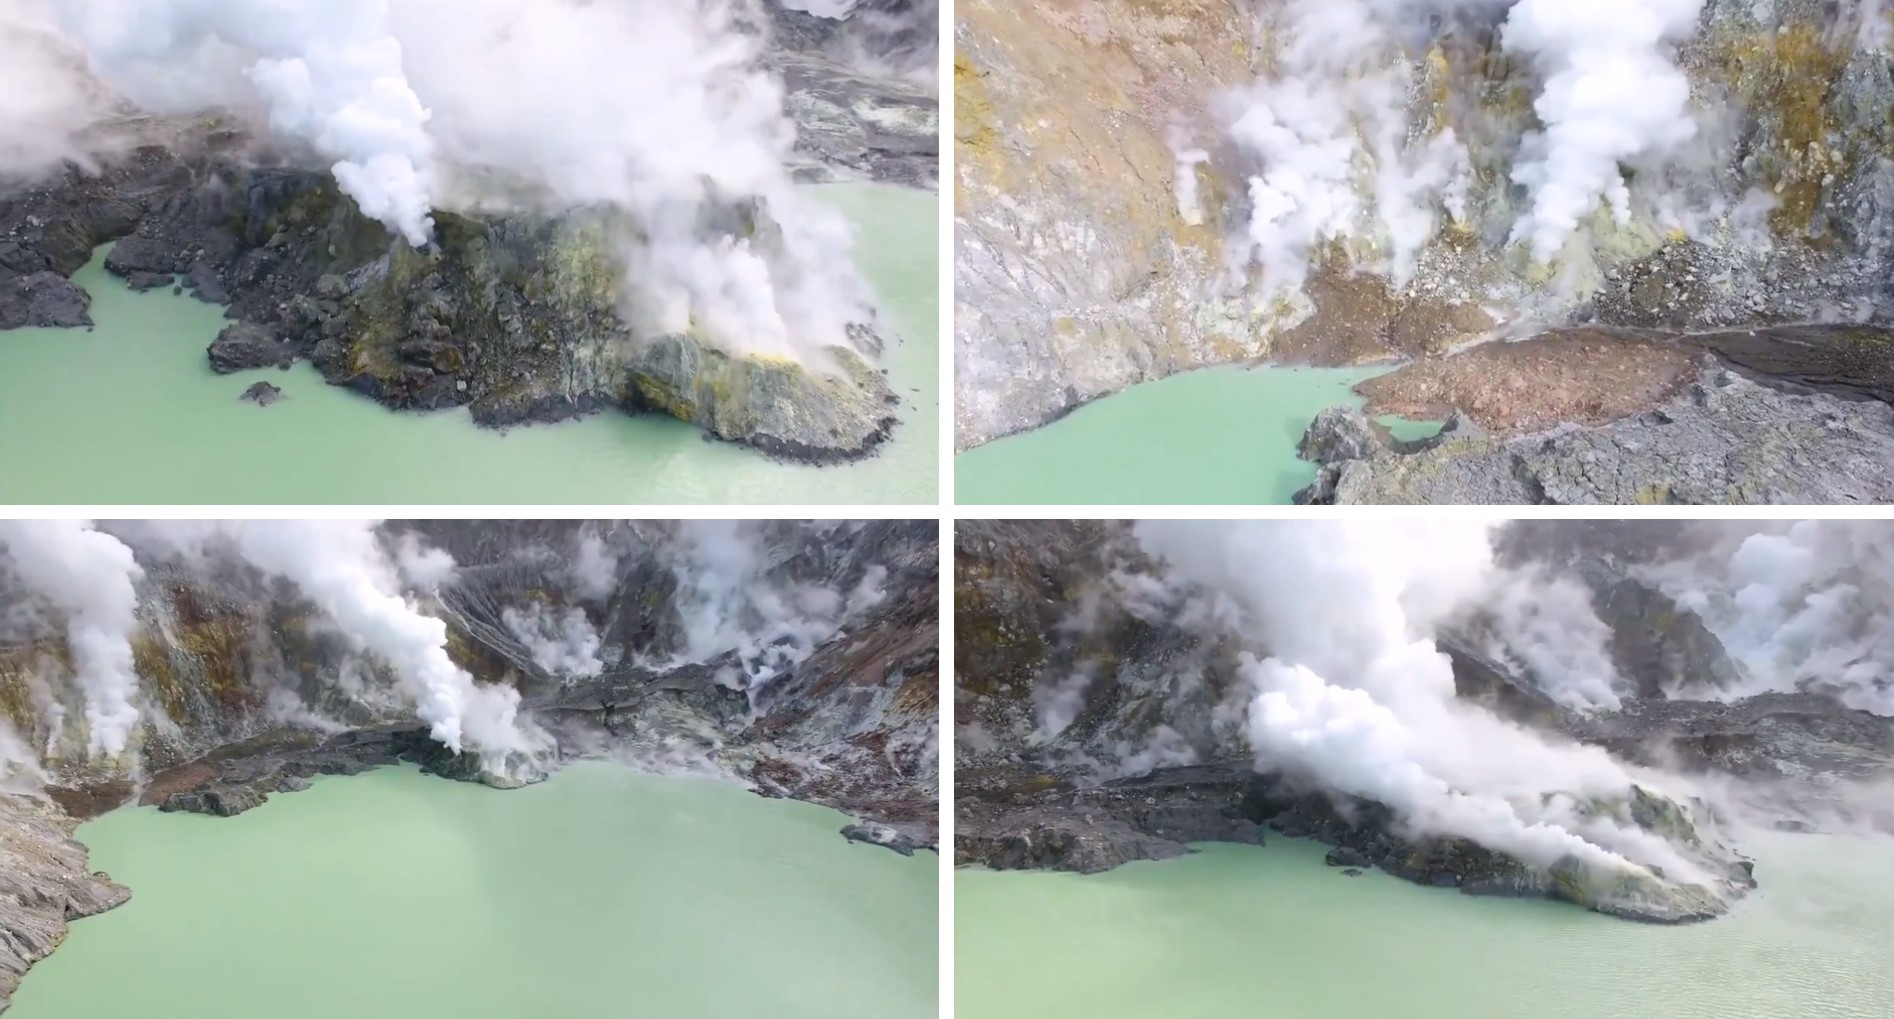
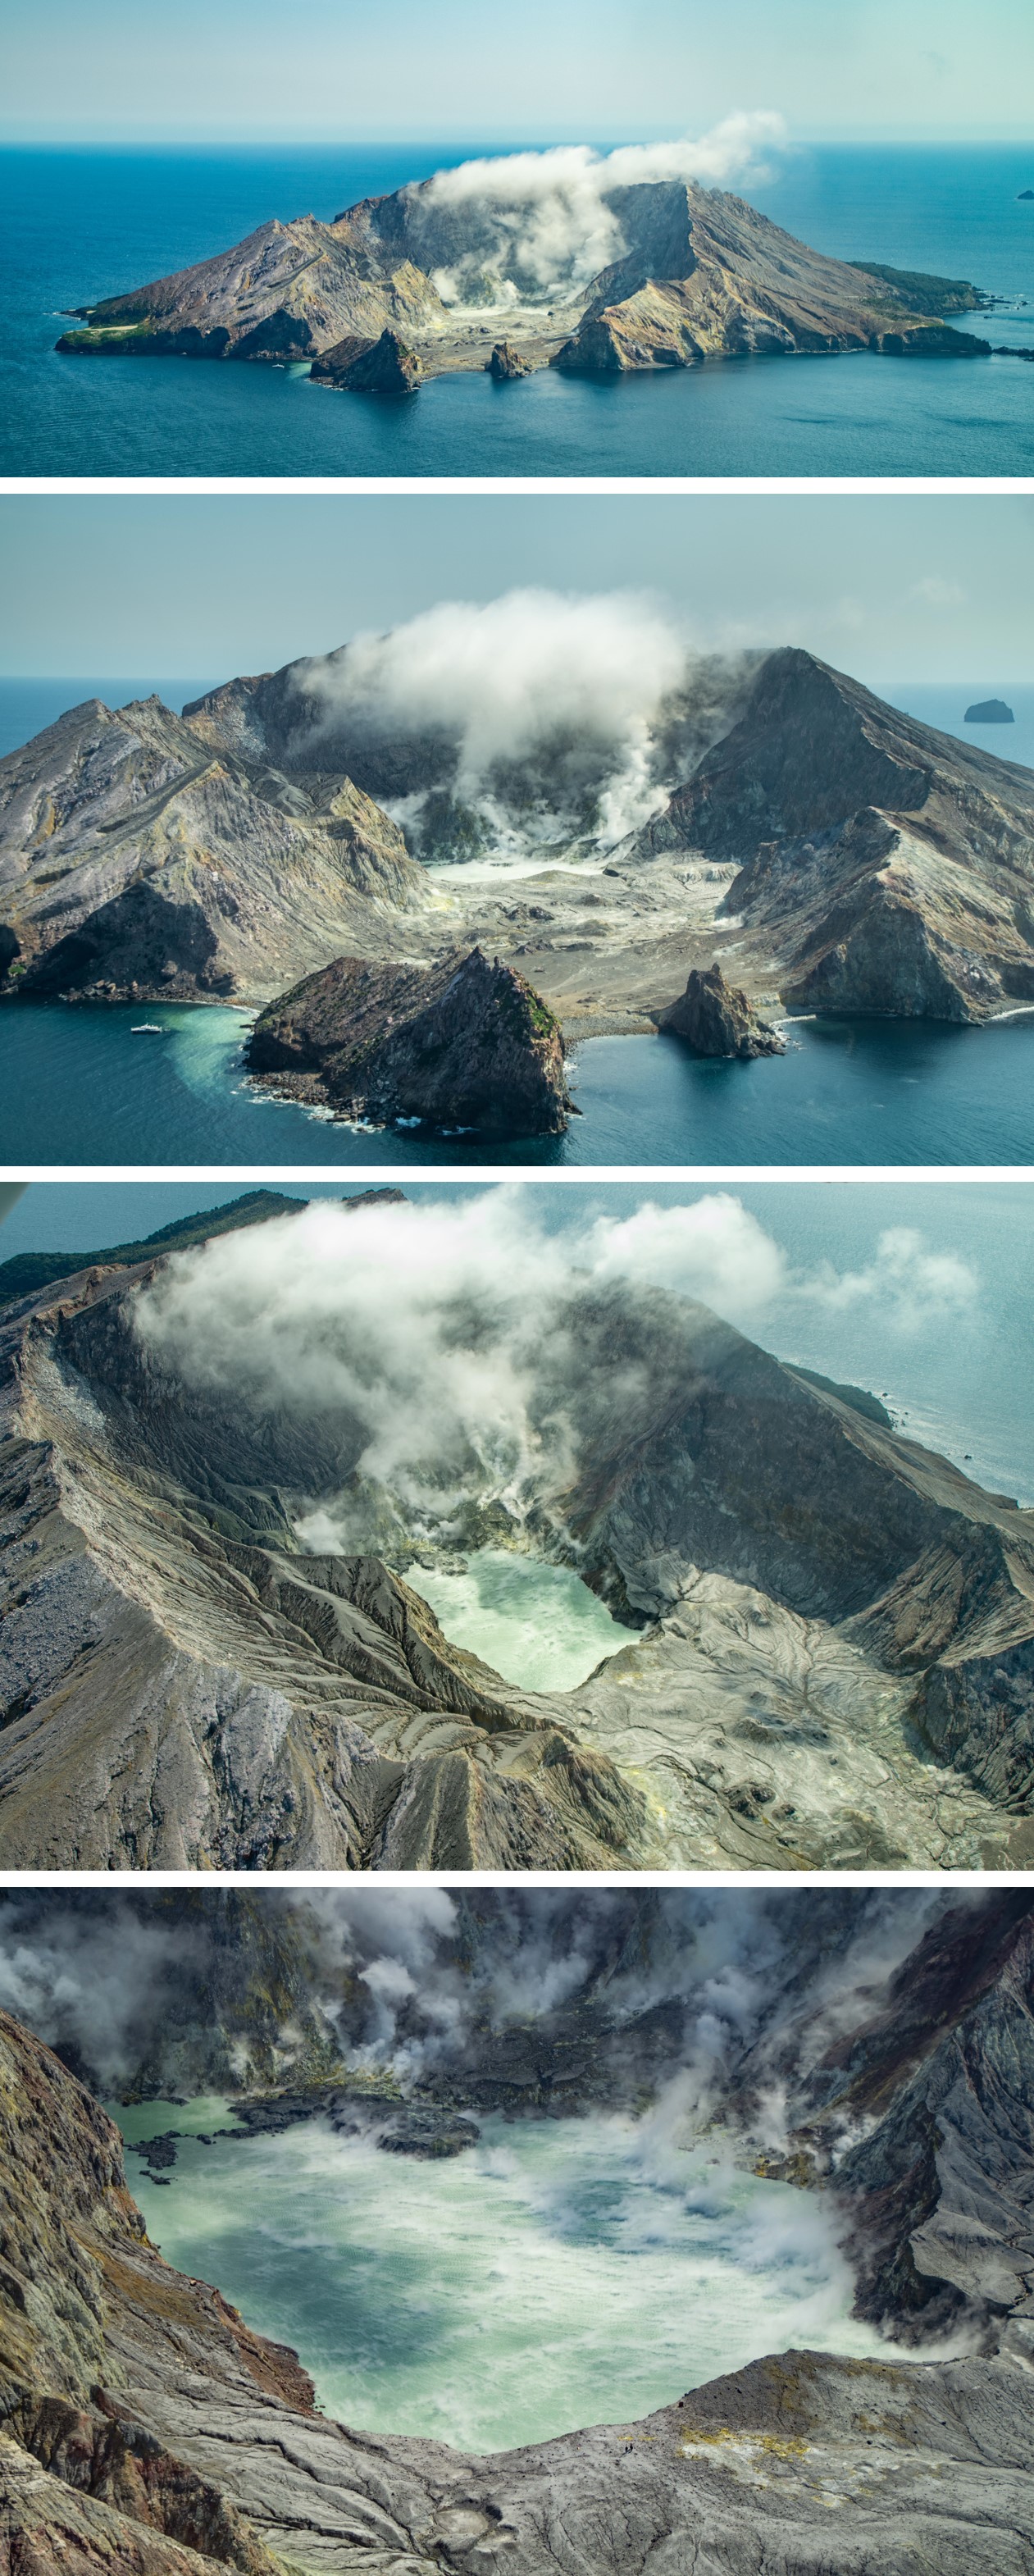
Rincón de la Vieja is a volcanic complex in Costa Rica with a hot convecting acid lake that exhibits frequent weak phreatic explosions, gas-and-steam emissions, and occasional elevated sulfur dioxide levels (BGVN 45:10, 46:03, 46:11). The current eruption period began June 2021. This report covers activity during July-December 2023 and is based on weekly bulletins and occasional daily reports from the Observatorio Vulcanologico Sismologica de Costa Rica-Universidad Nacional (OVSICORI-UNA).
Numerous weak phreatic explosions continued during July-December 2023, along with gas-and-steam emissions and plumes that rose as high as 3 km above the crater rim. Many weekly OVSICORI-UNA bulletins included the previous week's number of explosions and emissions (table 9). For many explosions, the time of explosion was given (table 10). Frequent seismic activity (long-period earthquakes, volcano-tectonic earthquakes, and tremor) accompanied the phreatic activity.
Table 9. Number of reported weekly phreatic explosions and gas-and-steam emissions at Rincón de la Vieja, July-December 2023. Counts are reported for the week before the Weekly Bulletin date; not all reports included these data. Courtesy of OVSICORI-UNA.
| OVSICORI Weekly Bulletin |
Number of explosions |
Number of emissions |
| 28 Jul 2023 |
6 |
14 |
| 4 Aug 2023 |
10 |
12 |
| 1 Sep 2023 |
13 |
11 |
| 22 Sep 2023 |
12 |
13 |
| 29 Sep 2023 |
6 |
11 |
| 6 Oct 2023 |
12 |
5 |
| 13 Oct 2023 |
7 |
9 |
| 20 Oct 2023 |
1 |
15 |
| 27 Oct 2023 |
3 |
23 |
| 3 Nov 2023 |
3 |
10 |
| 17 Nov 2023 |
0 |
Some |
| 24 Nov 2023 |
0 |
14 |
| 8 Dec 2023 |
4 |
16 |
| 22 Dec 2023 |
8 |
18 |
Table 10. Summary of activity at Rincón de la Vieja during July-December 2023. Weak phreatic explosions and gas emissions are noted where the time of explosion was indicated in the weekly or daily bulletins. Height of plumes or emissions are distance above the crater rim. Courtesy of OVSICORI-UNA.
| Date |
Time |
Description of Activity |
| 1 Jul 2023 |
0156 |
Explosion. |
| 2 Jul 2023 |
0305 |
Explosion. |
| 4 Jul 2023 |
0229, 0635 |
Event at 0635 produced a gas-and-steam plume that rose 700 m and drifted W; seen by residents in Liberia (21 km SW). |
| 9 Jul 2023 |
1843 |
Explosion. |
| 21 Jul 2023 |
0705 |
Explosion. |
| 26 Jul 2023 |
1807 |
Explosion. |
| 28 Jul 2023 |
0802 |
Explosion generated a gas-and-steam plume that rose 500 m. |
| 30 Jul 2023 |
1250 |
Explosion. |
| 31 Jul 2023 |
2136 |
Explosion. |
| 11 Aug 2023 |
0828 |
Explosion. |
| 18 Aug 2023 |
1304 |
Explosion. |
| 21 Aug 2023 |
1224 |
Explosion generated gas-and-steam plumes rose 500-600 m. |
| 22 Aug 2023 |
0749 |
Explosion generated gas-and-steam plumes rose 500-600 m. |
| 24 Aug 2023 |
1900 |
Explosion. |
| 25 Aug 2023 |
0828 |
Event produced a steam-and-gas plume that rose 3 km and drifted NW. |
| 27-28 Aug 2023 |
0813 |
Four small events; the event at 0813 on 28 August lasted two minutes and generated a steam-and-gas plume that rose 2.5 km. |
| 1 Sep 2023 |
1526 |
Explosion generated plume that rose 2 km and ejected material onto the flanks. |
| 2-3 Sep 2023 |
- |
Small explosions detected in infrasound data. |
| 4 Sep 2023 |
1251 |
Gas-and-steam plume rose 1 km and drifted W. |
| 7 Nov 2023 |
1113 |
Explosion. |
| 8 Nov 2023 |
0722 |
Explosion. |
| 12 Nov 2023 |
0136 |
Small gas emissions. |
| 14 Nov 2023 |
0415 |
Small gas emissions. |
According to OVSICORI-UNA, during July-October the average weekly sulfur dioxide (SO2) flux ranged from 68 to 240 tonnes/day. However, in mid-November the flux increased to as high as 334 tonnes/day, the highest value measured in recent years. The high SO2 flux in mid-November was also detected by the TROPOMI instrument on the Sentinel-5P satellite (figure 43).
Geologic Background. Rincón de la Vieja, the largest volcano in NW Costa Rica, is a remote volcanic complex in the Guanacaste Range. The volcano consists of an elongated, arcuate NW-SE-trending ridge constructed within the 15-km-wide early Pleistocene Guachipelín caldera, whose rim is exposed on the south side. Sometimes known as the "Colossus of Guanacaste," it has an estimated volume of 130 km3 and contains at least nine major eruptive centers. Activity has migrated to the SE, where the youngest-looking craters are located. The twin cone of Santa María volcano, the highest peak of the complex, is located at the eastern end of a smaller, 5-km-wide caldera and has a 500-m-wide crater. A Plinian eruption producing the 0.25 km3 Río Blanca tephra about 3,500 years ago was the last major magmatic eruption. All subsequent eruptions, including numerous historical eruptions possibly dating back to the 16th century, have been from the prominent active crater containing a 500-m-wide acid lake located ENE of Von Seebach crater.
Information Contacts: Observatorio Vulcanológico Sismológica de Costa Rica-Universidad Nacional (OVSICORI-UNA), Apartado 86-3000, Heredia, Costa Rica (URL: http://www.ovsicori.una.ac.cr/); NASA Global Sulfur Dioxide Monitoring Page, Atmospheric Chemistry and Dynamics Laboratory, NASA Goddard Space Flight Center (NASA/GSFC), 8800 Greenbelt Road, Goddard MD 20771, USA (URL: https://so2.gsfc.nasa.gov/).
Bezymianny (Russia) — November 2023 Cite this Report
Bezymianny
Russia
55.972°N, 160.595°E; summit elev. 2882 m
All times are local (unless otherwise noted)
Explosion on 18 October 2023 sends ash plume 8 km high; lava flows and incandescent avalanches
Bezymianny, located on Russia’s Kamchatka Peninsula, has had eruptions since 1955 characterized by dome growth, explosions, pyroclastic flows, ash plumes, and ashfall. Activity during November 2022-April 2023 included gas-and-steam emissions, lava dome collapses generating avalanches, and persistent thermal activity. Similar eruptive activity continued from May through October 2023, described here based on information from weekly and daily reports of the Kamchatka Volcano Eruptions Response Team (KVERT), notices from Tokyo VAAC (Volcanic Ash Advisory Center), and from satellite data.
Overall activity decreased after the strong period of activity in late March through April 2023, which included ash explosions during 29 March and 7-8 April 2023 that sent plumes as high as 10-12 km altitude, along with dome growth and lava flows (BGVN 48:05). This reduced activity can be seen in the MIROVA thermal detection system graph (figure 56), which was consistent with data from the MODVOLC thermal detection system and with Sentinel-2 satellite images that showed persistent hotspots in the summit crater when conditions allowed observations. A renewed period of strong activity began in mid-October 2023.
Activity increased significantly on 17 October 2023 when large collapses began during 0700-0830 on the E flanks of the lava dome and continued to after 0930 the next day (figure 57). Ash plumes rose to an altitude of 4.5-5 km, extending 220 km NNE by 18 October. A large explosion at 1630 on 18 October produced an ash plume that rose to an altitude of 11 km (8 km above the summit) and drifted NNE and then NW, extending 900 km NW within two days at an altitude of 8 km. Minor ashfall was noted in Kozyrevsk (45 km WNW). At 0820 on 20 October an ash plume was identified in satellite images drifting 100 km ENE at altitudes of 4-4.5 km.
Lava flows and hot avalanches from the dome down the SE flank continued over the next few days, including 23 October when clear conditions allowed good observations (figures 58 and 59). A large thermal anomaly was observed over the volcano through 24 October, and in the summit crater on 30 October (figure 60). Strong fumarolic activity continued, with numerous avalanches and occasional incandescence. By the last week of October, volcanic activity had decreased to a level consistent with that earlier in the reporting period.
Aviation warnings were frequently updated during 17-20 October. KVERT issued a Volcano Observatory Notice for Aviation (VONA) on 17 October at 1419 and 1727 (0219 and 0527 UTC) raising the Aviation Color Code (ACC) from Yellow to Orange (second highest level). The next day, KVERT issued a VONA at 1705 (0505 UTC) raising the ACC to Red (highest level) but lowered it back to Orange at 2117 (0917 UTC). After another decrease to Yellow and back to Orange, the ACC was reduced to Yellow on 20 October at 1204 (0004 UTC). In addition, the Tokyo VAAC issued a series of Volcanic Ash Advisories beginning on 16 October and continuing through 30 October.
Geologic Background. The modern Bezymianny, much smaller than its massive neighbors Kamen and Kliuchevskoi on the Kamchatka Peninsula, was formed about 4,700 years ago over a late-Pleistocene lava-dome complex and an edifice built about 11,000-7,000 years ago. Three periods of intensified activity have occurred during the past 3,000 years. The latest period, which was preceded by a 1,000-year quiescence, began with the dramatic 1955-56 eruption. This eruption, similar to that of St. Helens in 1980, produced a large open crater that was formed by collapse of the summit and an associated lateral blast. Subsequent episodic but ongoing lava-dome growth, accompanied by intermittent explosive activity and pyroclastic flows, has largely filled the 1956 crater.
Information Contacts: Kamchatka Volcanic Eruptions Response Team (KVERT), Far Eastern Branch, Russian Academy of Sciences, 9 Piip Blvd., Petropavlovsk-Kamchatsky, 683006, Russia (URL: http://www.kscnet.ru/ivs/kvert/); Kamchatka Volcanological Station, Kamchatka Branch of Geophysical Survey, (KB GS RAS), Klyuchi, Kamchatka Krai, Russia (URL: http://volkstat.ru/); Tokyo Volcanic Ash Advisory Center (VAAC), 1-3-4 Otemachi, Chiyoda-ku, Tokyo 100-8122, Japan (URL: http://ds.data.jma.go.jp/svd/vaac/data/); Hawai'i Institute of Geophysics and Planetology (HIGP) - MODVOLC Thermal Alerts System, School of Ocean and Earth Science and Technology (SOEST), Univ. of Hawai'i, 2525 Correa Road, Honolulu, HI 96822, USA (URL: http://modis.higp.hawaii.edu/); MIROVA (Middle InfraRed Observation of Volcanic Activity), a collaborative project between the Universities of Turin and Florence (Italy) supported by the Centre for Volcanic Risk of the Italian Civil Protection Department (URL: http://www.mirovaweb.it/); Copernicus Browser, Copernicus Data Space Ecosystem, European Space Agency (URL: https://dataspace.copernicus.eu/browser/).chr
Kilauea (United States) — January 2023 Cite this Report
Kilauea
United States
19.421°N, 155.287°W; summit elev. 1222 m
All times are local (unless otherwise noted)
Low-level lava effusions in the lava lake at Halema’uma’u during July-December 2022
Kīlauea is the southeastern-most volcano in Hawaii and overlaps the E flank of the Mauna Loa volcano. Its East Rift Zone (ERZ) has been intermittently active for at least 2,000 years. An extended eruption period began in January 1983 and was characterized by open lava lakes and lava flows from the summit caldera and the East Rift Zone. During May 2018 magma migrated into the Lower East Rift Zone (LERZ) and opened 24 fissures along a 6-km-long NE-trending fracture zone that produced lava flows traveling in multiple directions. As lava emerged from the fissures, the lava lake at Halema'uma'u drained and explosions sent ash plumes to several kilometers altitude (BGVN 43:10).
The current eruption period started during September 2021 and has recently been characterized by lava effusions, spatter, and sulfur dioxide emissions in the active Halema’uma’u lava lake (BGVN 47:08). Lava effusions, some spatter, and sulfur dioxide emissions have continued during this reporting period of July through December 2022 using daily reports, volcanic activity notices, and abundant photo, map, and video data from the US Geological Survey's (USGS) Hawaiian Volcano Observatory (HVO).
Summary of activity during July-December 2022. Low-level effusions have continued at the western vent of the Halema’uma’u crater during July through early December 2022. Occasional weak ooze-outs (also called lava break outs) would occur along the margins of the crater floor. The overall level of the active lava lake throughout the reporting period gradually increased due to infilling, however it stagnated in mid-September (table 13). During September through November, activity began to decline, though lava effusions persisted at the western vent. By 9 December, the active part of the lava lake had completely crusted over, and incandescence was no longer visible.
Table 13. Summary of measurements taken during overflights at Kīlauea that show a gradual increase in the active lava lake level and the volume of lava effused since 29 September 2021. Lower activity was reported during September-October. Data collected during July-December 2022. Courtesy of HVO.
| Date: |
Level of the active lava lake (m): |
Cumulative volume of lava effused (million cubic meters): |
| 7 Jul 2022 |
130 |
95 |
| 19 Jul 2022 |
133 |
98 |
| 4 Aug 2022 |
136 |
102 |
| 16 Aug 2022 |
137 |
104 |
| 12 Sep 2022 |
143 |
111 |
| 5 Oct 2022 |
143 |
111 |
| 28 Oct 2022 |
143 |
111 |
Activity during July 2022. Lava effusions were reported from the western vent in the Halema’uma’u crater, along with occasional weak ooze-outs along the margins of the crater floor. The height of the lava lake was variable due to deflation-inflation tilt events; for example, the lake level dropped approximately 3-4 m during a summit deflation-inflation event reported on 1 July. Webcam images taken during the night of 6-12 July showed intermittent low-level spattering at the western vent that rose less than 10 m above the vent (figure 519). Measurements made during an overflight on 7 July indicated that the crater floor was infilled about 130 m and that 95 million cubic meters of lava had been effused since 29 September 2021. A single, relatively small lava ooze-out was active to the S of the lava lake. Around midnight on 8 July there were two brief periods of lava overflow onto the lake margins. On 9 July lava ooze-outs were reported near the SE and NE edges of the crater floor and during 10-11 July they occurred near the E, NE, and NW edges. On 16 July crater incandescence was reported, though the ooze-outs and spattering were not visible. On 18 July overnight webcam images showed incandescence in the western vent complex and two ooze-outs were reported around 0000 and 0200 on 19 July. By 0900 there were active ooze-outs along the SW edge of the crater floor. Measurements made from an overflight on 19 July indicated that the crater floor was infilled about 133 m and 98 million cubic meters of lava had erupted since 29 September 2021 (figure 520). On 20 July around 1600 active ooze-outs were visible along the N edge of the crater, which continued through the next day. Extensive ooze-outs occurred along the W margin during 24 July until 1900; on 26 July minor ooze-outs were noted along the N margin. Minor spattering was visible on 29 July along the E margin of the lake. The sulfur dioxide emission rates ranged 650-2,800 tons per day (t/d), the higher of which was measured on 8 July (figure 519).
Activity during August 2022. The eruption continued in the Halema’uma’u crater at the western vent. According to HVO the lava in the active lake remained at the level of the bounding levees. Occasional minor ooze-outs were observed along the margins of the crater floor. Strong nighttime crater incandescence was visible after midnight on 6 August over the western vent cone. During 6-7 August scattered small lava lobes were active along the crater floor and incandescence persisted above the western vent through 9 August. During 7-9 August HVO reported a single lava effusion source was active along the NW margin of the crater floor. Measurements from an overflight on 4 August indicated that the crater floor was infilled about 136 m total and that 102 million cubic meters of lava had been erupted since the start of the eruption. Lava breakouts were reported along the N, NE, E, S, and W margins of the crater during 10-16 August. Another overflight survey conducted on 16 August indicated that the crater floor infilled about 137 m and 104 million cubic meters of lava had been erupted since September 2021. Measured sulfur dioxide emissions rates ranged 1,150-2,450 t/d, the higher of which occurred on 8 August.
Activity during September 2022. During September, lava effusion continued from the western vent into the active lava lake and onto the crater floor. Intermittent minor ooze-outs were reported through the month. A small ooze-out was visible on the W crater floor margin at 0220 on 2 September, which showed decreasing surface activity throughout the day, but remained active through 3 September. On 3 September around 1900 a lava outbreak occurred along the NW margin of the crater floor but had stopped by the evening of 4 September. Field crews monitoring the summit lava lake on 9 September observed spattering on the NE margin of the lake that rose no higher than 10 m, before falling back onto the lava lake crust (figure 521). Overflight measurements on 12 September indicated that the crater floor was infilled a total of 143 m and 111 million cubic meters of lava had been erupted since September 2021. Extensive breakouts in the W and N part of the crater floor were reported at 1600 on 20 September and continued into 26 September. The active part of the lava lake dropped by 10 m while other parts of the crater floor dropped by several meters. Summit tiltmeters recorded a summit seismic swarm of more than 80 earthquakes during 1500-1800 on 21 September, which occurred about 1.5 km below Halema’uma’u; a majority of these were less than Mw 2. By 22 September the active part of the lava lake was infilled about 2 m. On 23 September the western vent areas exhibited several small spatter cones with incandescent openings, along with weak, sporadic spattering (figure 522). The sulfur dioxide emission rate ranged from 930 t/d to 2,000 t/d, the higher of which was measured on 6 September.
Activity during October 2022. Activity during October declined slightly compared to previous months, though lava effusions persisted from the western vent into the active lava lake and onto the crater floor during October (figure 523). Slight variations in the lava lake were noted throughout the month. HVO reported that around 0600 on 3 October the level of the lava lake has lowered slightly. Overflight measurements taken on 5 October indicated that the crater floor was infilled a total of about 143 m and that 111 million cubic meters of lava had been effused since September 2021. During 6-7 October the lake gradually rose 0.5 m. Sulfur dioxide measurements made on 22 October had an emission rate of 700 t/d. Another overflight taken on 28 October showed that there was little to no change in the elevation of the crater floor: the crater floor was infilled a total of 143 m and 111 million cubic meters of lava had erupted since the start of the eruption.
Activity during November 2022. Activity remained low during November, though HVO reported that lava from the western vent continued to effuse into the active lava lake and onto the crater floor throughout the month. The rate of sulfur dioxide emissions during November ranged from 300-600 t/d, the higher amount of which occurred on 9 November.
Activity during December 2022. Similar low activity was reported during December, with lava effusing from the western vent into the active lava lake and onto the crater floor. During 4-5 December the active part of the lava lake was slightly variable in elevation and fluctuated within 1 m. On 9 December HVO reported that lava was no longer erupting from the western vent in the Halema’uma’u crater and that sulfur dioxide emissions had returned to near pre-eruption background levels; during 10-11 December, the lava lake had completely crusted over, and no incandescence was visible (figure 524). Time lapse camera images covering the 4-10 December showed that the crater floor showed weak deflation and no inflation. Some passive events of crustal overturning were reported during 14-15 December, which brought fresh incandescent lava to the lake surface. The sulfur dioxide emission rate was approximately 200 t/d on 14 December. A smaller overturn event on 17 December and another that occurred around 0000 and into the morning of 20 December were also detected. A small seismic swarm was later detected on 30 December.
Geologic Background. Kilauea overlaps the E flank of the massive Mauna Loa shield volcano in the island of Hawaii. Eruptions are prominent in Polynesian legends; written documentation since 1820 records frequent summit and flank lava flow eruptions interspersed with periods of long-term lava lake activity at Halemaumau crater in the summit caldera until 1924. The 3 x 5 km caldera was formed in several stages about 1,500 years ago and during the 18th century; eruptions have also originated from the lengthy East and Southwest rift zones, which extend to the ocean in both directions. About 90% of the surface of the basaltic shield volcano is formed of lava flows less than about 1,100 years old; 70% of the surface is younger than 600 years. The long-term eruption from the East rift zone between 1983 and 2018 produced lava flows covering more than 100 km2, destroyed hundreds of houses, and added new coastline.
Information Contacts: Hawaiian Volcano Observatory (HVO), U.S. Geological Survey, PO Box 51, Hawai'i National Park, HI 96718, USA (URL: http://hvo.wr.usgs.gov/).
Nyamulagira (DR Congo) — November 2023 Cite this Report
Nyamulagira
DR Congo
1.408°S, 29.2°E; summit elev. 3058 m
All times are local (unless otherwise noted)
Lava flows and thermal activity during May-October 2023
Nyamulagira (also known as Nyamuragira) is a shield volcano in the Democratic Republic of Congo with the summit truncated by a small 2 x 2.3 km caldera with walls up to about 100 m high. Documented eruptions have occurred within the summit caldera, as well as from numerous flank fissures and cinder cones. The current eruption period began in April 2018 and has more recently been characterized by summit crater lava flows and thermal activity (BGVN 48:05). This report describes lava flows and variable thermal activity during May through October 2023, based on information from the Observatoire Volcanologique de Goma (OVG) and various satellite data.
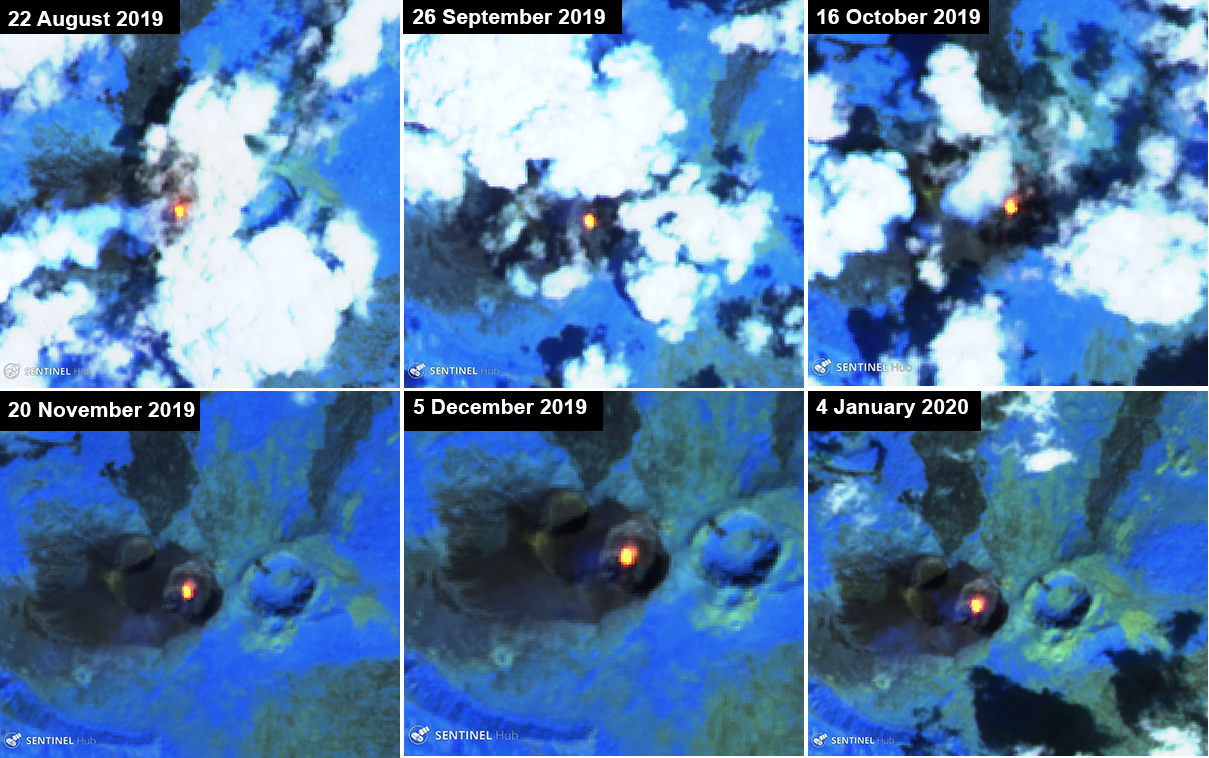
Lava lake activity continued during May. The MIROVA (Middle InfraRed Observation of Volcanic Activity) system recorded moderate-to-strong thermal activity throughout the reporting period; activity was more intense during May and October and relatively weaker from June through September (figure 95). The MODVOLC thermal algorithm, detected a total of 209 thermal alerts. There were 143 hotspots detected during May, eight during June, nine during September, and 49 during October. This activity was also reflected in infrared satellite images, where a lava flow was visible in the NW part of the crater on 7 May and strong activity was seen in the center of the crater on 4 October (figure 96). Another infrared satellite image taken on 12 May showed still active lava flows along the NW margin of the crater. According to OVG lava effusions were active during 7-29 May and moved to the N and NW parts of the crater beginning on 9 May. Strong summit crater incandescence was visible from Goma (27 km S) during the nights of 17, 19, and 20 May (figure 97). On 17 May there was an increase in eruptive activity, which peaked at 0100 on 20 May. Notable sulfur dioxide plumes drifted NW and W during 19-20 May (figure 98). Drone footage acquired in partnership with the USGS (United States Geological Survey) on 20 May captured images of narrow lava flows that traveled about 100 m down the W flank (figure 99). Data from the Rumangabo seismic station indicated a decreasing trend in activity during 17-21 May. Although weather clouds prevented clear views of the summit, a strong thermal signature on the NW flank was visible in an infrared satellite image on 22 May, based on an infrared satellite image. On 28 May the lava flows on the upper W flank began to cool and solidify. By 29 May seismicity returned to levels similar to those recorded before the 17 May increase. Lava effusion continued but was confined to the summit crater; periodic crater incandescence was observed.
Low-level activity was noted during June through October. On 1 June OVG reported that seismicity remained at lower levels and that crater incandescence had been absent for three days, though infrared satellite imagery showed continued lava effusion in the summit crater. The lava flows on the flanks covered an estimated 0.6 km2. Satellite imagery continued to show thermal activity confined to the lava lake through October (figure 96), although no lava flows or significant sulfur dioxide emissions were reported.
Geologic Background. Africa's most active volcano, Nyamulagira (also known as Nyamuragira), is a massive high-potassium basaltic shield about 25 km N of Lake Kivu and 13 km NNW of the steep-sided Nyiragongo volcano. The summit is truncated by a small 2 x 2.3 km caldera that has walls up to about 100 m high. Documented eruptions have occurred within the summit caldera, as well as from the numerous flank fissures and cinder cones. A lava lake in the summit crater, active since at least 1921, drained in 1938, at the time of a major flank eruption. Recent lava flows extend down the flanks more than 30 km from the summit as far as Lake Kivu; extensive lava flows from this volcano have covered 1,500 km2 of the western branch of the East African Rift.
Information Contacts: Observatoire Volcanologique de Goma (OVG), Departement de Geophysique, Centre de Recherche en Sciences Naturelles, Lwiro, D.S. Bukavu, DR Congo; Hawai'i Institute of Geophysics and Planetology (HIGP) - MODVOLC Thermal Alerts System, School of Ocean and Earth Science and Technology (SOEST), Univ. of Hawai'i, 2525 Correa Road, Honolulu, HI 96822, USA (URL: http://modis.higp.hawaii.edu/); MIROVA (Middle InfraRed Observation of Volcanic Activity), a collaborative project between the Universities of Turin and Florence (Italy) supported by the Centre for Volcanic Risk of the Italian Civil Protection Department (URL: http://www.mirovaweb.it/); NASA Global Sulfur Dioxide Monitoring Page, Atmospheric Chemistry and Dynamics Laboratory, NASA Goddard Space Flight Center (NASA/GSFC), 8800 Greenbelt Road, Goddard, Maryland, USA (URL: https://so2.gsfc.nasa.gov/); Copernicus Browser, Copernicus Data Space Ecosystem, European Space Agency (URL: https://dataspace.copernicus.eu/browser/); Charles Balagizi, Goma Volcano Observatory, Departement de Geophysique, Centre de Recherche en Sciences Naturelles, Lwiro, D.S. Bukavu, DR Congo.
Bagana (Papua New Guinea) — October 2023 Cite this Report
Bagana
Papua New Guinea
6.137°S, 155.196°E; summit elev. 1855 m
All times are local (unless otherwise noted)
Explosions, ash plumes, ashfall, and lava flows during April-September 2023
The remote volcano of Bagana is located in central Bougainville Island, Papua New Guinea. Recorded eruptions date back to 1842 and activity has consisted of effusive activity that has built a small lava dome in the summit crater and occasional explosions that produced pyroclastic flows. The most recent eruption has been ongoing since February 2000 and has produced occasional explosions, ash plumes, and lava flows. More recently, activity has been characterized by ongoing effusive activity and ash emissions (BGVN 48:04). This report updates activity from April through September 2023 that has consisted of explosions, ash plumes, ashfall, and lava flows, using information from the Darwin Volcanic Ash Advisory Center (VAAC) and satellite data.
An explosive eruption was reported on 7 July that generated a large gas-and-ash plume to high altitudes and caused significant ashfall in local communities; the eruption plume had reached upper tropospheric (16-18 km altitude) altitudes by 2200, according to satellite images. Sulfur dioxide plumes were detected in satellite images on 8 July and indicated that the plume was likely a mixture of gas, ice, and ash. A report issued by the Autonomous Bougainville Government (ABG) (Torokina District, Education Section) on 10 July noted that significant ash began falling during 2000-2100 on 7 July and covered most areas in the Vuakovi, Gotana (9 km SW), Koromaketo, Laruma (25 km W) and Atsilima (27 km NW) villages. Pyroclastic flows also occurred, according to ground-based reports; small deposits confined to one drainage were inspected by RVO during an overflight on 17 July and were confirmed to be from the 7 July event. Ashfall continued until 10 July and covered vegetation, which destroyed bushes and gardens and contaminated rivers and streams.
RVO reported another eruption on 14 July. The Darwin VAAC stated that an explosive event started around 0830 on 15 July and produced an ash plume that rose to 16.5 km altitude by 1000 and drifted N, according to satellite images. The plume continued to drift N and remained visible through 1900, and by 2150 it had dissipated.
Ashfall likely from both the 7 and 15 July events impacted about 8,111 people in Torokina (20 km SW), including Tsito/Vuakovi, Gotana, Koromaketo, Kenaia, Longkogari, Kenbaki, Piva (13 km SW), and Atsinima, and in the Tsitovi district, according to ABG. Significant ashfall was also reported in Ruruvu (22 km N) in the Wakunai District of Central Bougainville, though the thickness of these deposits could not be confirmed. An evacuation was called for the villages in Wakunai, where heavy ashfall had contaminated water sources; the communities of Ruruvu, Togarau, Kakarapaia, Karauturi, Atao, and Kuritaturi were asked to evacuate to a disaster center at the Wakunai District Station, and communities in Torokina were asked to evacuate to the Piva District station. According to a news article, more than 7,000 people needed temporary accommodations, with about 1,000 people in evacuation shelters. Ashfall had deposited over a broad area, contaminating water supplies, affecting crops, and collapsing some roofs and houses in rural areas. Schools were temporarily shut down. Intermittent ash emissions continued through the end of July and drifted NNW, NW, and SW. Fine ashfall was reported on the coast of Torokina, and ash plumes also drifted toward Laruma and Atsilima.
A small explosive eruption occurred at 2130 on 28 July that ejected material from the crater vents, according to reports from Torokina, in addition to a lava flow that contained two lobes. A second explosion was detected at 2157. Incandescence from the lava flow was visible from Piva as it descended the W flank around 2000 on 29 July (figure 47). The Darwin VAAC reported that a strong thermal anomaly was visible in satellite images during 30-31 July and that ash emissions rose to 2.4 km altitude and drifted WSW on 30 July. A ground report from RVO described localized emissions at 0900 on 31 July.
The Darwin VAAC reported that ash plumes were identified in satellite imagery at 0800 and 1220 on 12 August and rose to 2.1 km and 3 km altitude and drifted NW and W, respectively. A news report stated that aid was sent to more than 6,300 people that were adversely affected by the eruption. Photos taken during 17-19 August showed ash emissions rising no higher than 1 km above the summit and drifting SE. A small explosion generated an ash plume during the morning of 19 August. Deposits from small pyroclastic flows were also captured in the photos. Satellite images captured lava flows and pyroclastic flow deposits. Two temporary seismic stations were installed near Bagana on 17 August at distances of 7 km WSW (Vakovi station) and 11 km SW (Kepox station). The Kepox station immediately started to record continuous, low-frequency background seismicity.
Satellite data. Little to no thermal activity was detected during April through mid-July 2023; only one anomaly was recorded during early April and one during early June, according to MIROVA (Middle InfraRed Observation of Volcanic Activity) data (figure 48). Thermal activity increased in both power and frequency during mid-July through September, although there were still some short gaps in detected activity. MODVOLC also detected increased thermal activity during August; thermal hotspots were detected a total of five times on 19, 20, and 27 August. Weak thermal anomalies were also captured in infrared satellite images on clear weather days throughout the reporting period on 7, 12, and 17 April, 27 May, 1, 6, 16, and 31 July, and 19 September (figure 48); a strong thermal anomaly was visible on 31 July. Distinct sulfur dioxide plumes that drifted generally NW were intermittently captured by the TROPOMI instrument on the Sentinel-5P satellite and sometimes exceeded two Dobson Units (DUs) (figure 49).
Geologic Background. Bagana volcano, in a remote portion of central Bougainville Island, is frequently active. This massive symmetrical cone was largely constructed by an accumulation of viscous andesitic lava flows. The entire edifice could have been constructed in about 300 years at its present rate of lava production. Eruptive activity is characterized by non-explosive effusion of viscous lava that maintains a small lava dome in the summit crater, although occasional explosive activity produces pyroclastic flows. Lava flows with tongue-shaped lobes up to 50 m thick and prominent levees descend the flanks on all sides.
Information Contacts: Rabaul Volcano Observatory (RVO), Geohazards Management Division, Department of Mineral Policy and Geohazards Management (DMPGM), PO Box 3386, Kokopo, East New Britain Province, Papua New Guinea; Darwin Volcanic Ash Advisory Centre (VAAC), Bureau of Meteorology, Northern Territory Regional Office, PO Box 40050, Casuarina, NT 0811, Australia (URL: http://www.bom.gov.au/info/vaac/); MIROVA (Middle InfraRed Observation of Volcanic Activity), a collaborative project between the Universities of Turin and Florence (Italy) supported by the Centre for Volcanic Risk of the Italian Civil Protection Department (URL: http://www.mirovaweb.it/); Hawai'i Institute of Geophysics and Planetology (HIGP) - MODVOLC Thermal Alerts System, School of Ocean and Earth Science and Technology (SOEST), Univ. of Hawai'i, 2525 Correa Road, Honolulu, HI 96822, USA (URL: http://modis.higp.hawaii.edu/); NASA Global Sulfur Dioxide Monitoring Page, Atmospheric Chemistry and Dynamics Laboratory, NASA Goddard Space Flight Center (NASA/GSFC), 8800 Greenbelt Road, Goddard, Maryland, USA (URL: https://so2.gsfc.nasa.gov/); Copernicus Browser, Copernicus Data Space Ecosystem, European Space Agency (URL: https://dataspace.copernicus.eu/browser/); Autonomous Bougainville Government, P.O Box 322, Buka, AROB, PNG (URL: https://abg.gov.pg/); Andrew Tupper (Twitter: @andrewcraigtupp); Simon Carn, Geological and Mining Engineering and Sciences, Michigan Technological University, 1400 Townsend Drive, Houghton, MI 49931, USA (URL: http://www.volcarno.com/, Twitter: @simoncarn); Radio NZ (URL: https://www.rnz.co.nz/news/pacific/494464/more-than-7-000-people-in-bougainville-need-temporary-accommodation-after-eruption); USAID, 1300 Pennsylvania Ave, NW, Washington DC 20004, USA (URL: https://www.usaid.gov/pacific-islands/press-releases/aug-08-2023-united-states-provides-immediate-emergency-assistance-support-communities-affected-mount-bagana-volcanic-eruptions).
Mayon (Philippines) — October 2023 Cite this Report
Mayon
Philippines
13.257°N, 123.685°E; summit elev. 2462 m
All times are local (unless otherwise noted)
Lava flows, pyroclastic flows, ash emissions, and seismicity during April-September 2023
Mayon is located in the Philippines and has steep upper slopes capped by a small summit crater. Historical eruptions date back to 1616 CE that have been characterized by Strombolian eruptions, lava flows, pyroclastic flows, and mudflows. Eruptions mostly originated from a central conduit. Pyroclastic flows and mudflows have commonly descended many of the approximately 40 drainages that surround the volcano. The most recent eruption occurred during June through October 2022 and consisted of lava dome growth and gas-and-steam emissions (BGVN 47:12). A new eruption was reported during late April 2023 and has included lava flows, pyroclastic density currents, ash emissions, and seismicity. This report covers activity during April through September 2023 based on daily bulletins from the Philippine Institute of Volcanology and Seismology (PHIVOLCS).
During April through September 2023, PHIVOLCS reported near-daily rockfall events, frequent volcanic earthquakes, and sulfur dioxide measurements. Gas-and-steam emissions rose 100-900 m above the crater and drifted in different directions. Nighttime crater incandescence was often visible during clear weather and was accompanied by incandescent avalanches of material. Activity notably increased during June when lava flows were reported on the S, SE, and E flanks (figure 52). The MIROVA graph (Middle InfraRed Observation of Volcanic Activity) showed strong thermal activity coincident with these lava flows, which remained active through September (figure 53). According to the MODVOLC thermal algorithm, a total of 110 thermal alerts were detected during the reporting period: 17 during June, 40 during July, 27 during August, and 26 during September. During early June, pyroclastic density currents (PDCs) started to occur more frequently.
Low activity was reported during much of April and May; gas-and-steam emissions rose 100-900 m above the crater and generally drifted in different directions. A total of 52 rockfall events and 18 volcanic earthquakes were detected during April and 147 rockfall events and 13 volcanic events during May. Sulfur dioxide flux measurements ranged between 400-576 tons per day (t/d) during April, the latter of which was measured on 29 April and between 162-343 t/d during May, the latter of which was measured on 13 May.
Activity during June increased, characterized by lava flows, pyroclastic density currents (PDCs), crater incandescence and incandescent rockfall events, gas-and-steam emissions, and continued seismicity. Weather clouds often prevented clear views of the summit, but during clear days, moderate gas-and-steam emissions rose 100-2,500 m above the crater and drifted in multiple directions. A total of 6,237 rockfall events and 288 volcanic earthquakes were detected. The rockfall events often deposited material on the S and SE flanks within 700-1,500 m of the summit crater and ash from the events drifted SW, S, SE, NE, and E. Sulfur dioxide emissions ranged between 149-1,205 t/d, the latter of which was measured on 10 June. Short-term observations from EDM and electronic tiltmeter monitoring indicated that the upper slopes were inflating since February 2023. Longer-term ground deformation parameters based on EDM, precise leveling, continuous GPS, and electronic tilt monitoring indicated that the volcano remained inflated, especially on the NW and SE flanks. At 1000 on 5 June the Volcano Alert Level (VAL) was raised to 2 (on a 0-5 scale). PHIVOLCS noted that although low-level volcanic earthquakes, ground deformation, and volcanic gas emissions indicated unrest, the steep increase in rockfall frequency may indicate increased dome activity.
A total of 151 dome-collapse PDCs occurred during 8-9 and 11-30 June, traveled 500-2,000 m, and deposited material on the S flank within 2 km of the summit crater. During 8-9 June the VAL was raised to 3. At approximately 1947 on 11 June lava flow activity was reported; two lobes traveled within 500 m from the crater and deposited material on the S (Mi-isi), SE (Bonga), and E (Basud) flanks. Weak seismicity accompanied the lava flow and slight inflation on the upper flanks. This lava flow remained active through 30 June, moving down the S and SE flank as far as 2.5 km and 1.8 km, respectively and depositing material up to 3.3 km from the crater. During 15-16 June traces of ashfall from the PDCs were reported in Sitio Buga, Nabonton, City of Ligao and Purok, and San Francisco, Municipality of Guinobatan. During 28-29 June there were two PDCs generated by the collapse of the lava flow front, which generated a light-brown ash plume 1 km high. Satellite monitors detected significant concentrations of sulfur dioxide beginning on 29 June. On 30 June PDCs primarily affected the Basud Gully on the E flank, the largest of which occurred at 1301 and lasted eight minutes, based on the seismic record. Four PDCs generated between 1800 and 2000 that lasted approximately four minutes each traveled 3-4 km on the E flank and generated an ash plume that rose 1 km above the crater and drifted N and NW. Ashfall was recorded in Tabaco City.
Similar strong activity continued during July; slow lava effusion remained active on the S and SE flanks and traveled as far as 2.8 km and 2.8 km, respectively and material was deposited as far as 4 km from the crater. There was a total of 6,983 rockfall events and 189 PDCs that affected the S, SE, and E flanks. The volcano network detected a total of 2,124 volcanic earthquakes. Continuous gas-and-steam emissions rose 200-2,000 m above the crater and drifted in multiple directions. Sulfur dioxide emissions averaged 792-4,113 t/d, the latter of which was measured on 28 July. During 2-4 July three PDCs were generated from the collapse of the lava flow and resulting light brown plumes rose 200-300 m above the crater. Continuous tremor pulses were reported beginning at 1547 on 3 July through 7 July at 1200, at 2300 on 8 July and going through 0300 on 10 July, and at 2300 on 16 July, as recorded by the seismic network. During 6-9 July there were 10 lava flow-collapse-related PDCs that generated light brown plumes 300-500 m above the crater. During 10-11 July light ashfall was reported in some areas of Mabinit, Legazpi City, Budiao and Salvacion, Daraga, and Camalig, Albay. By 18 July the lava flow advanced 600 m on the E flank as well.
During 1733 on 18 July and 0434 on 19 July PHIVOLCS reported 30 “ashing” events, which are degassing events accompanied by audible thunder-like sounds and entrained ash at the crater, which produced short, dark plumes that drifted SW. These events each lasted 20-40 seconds, and plume heights ranged from 150-300 m above the crater, as recorded by seismic, infrasound, visual, and thermal monitors. Three more ashing events occurred during 19-20 July. Short-term observations from electronic tilt and GPS monitoring indicate deflation on the E lower flanks in early July and inflation on the NW middle flanks during the third week of July. Longer-term ground deformation parameters from EDM, precise leveling, continuous GPS, and electronic tilt monitoring indicated that the volcano was still generally inflated relative to baseline levels. A short-lived lava pulse lasted 28 seconds at 1956 on 21 July, which was accompanied by seismic and infrasound signals. By 22 July, the only lava flow that remained active was on the SE flank, and continued to extend 3.4 km, while those on the S and E flanks weakened markedly. One ashing event was detected during 30-31 July, whereas there were 57 detected during 31 July-1 August; according to PHIVOLCS beginning at approximately 1800 on 31 July eruptive activity was dominated by phases of intermittent ashing, as well as increased in the apparent rates of lava effusion from the summit crater. The ashing phases consisted of discrete events recorded as low-frequency volcanic earthquakes (LFVQ) typically 30 seconds in duration, based on seismic and infrasound signals. Gray ash plume rose 100 m above the crater and generally drifted NE. Shortly after these ashing events began, new lava began to effuse rapidly from the crater, feeding the established flowed on the SE, E, and E flanks and generating frequent rockfall events.
Intensified unrest persisted during August. There was a total of 4,141 rockfall events, 2,881 volcanic earthquakes, which included volcanic tremor events, 32 ashing events, and 101 PDCs detected throughout the month. On clear weather days, gas-and-steam emissions rose 300-1,500 m above the crater and drifted in different directions (figure 54). Sulfur dioxide emissions averaged 735-4,756 t/d, the higher value of which was measured on 16 August. During 1-2 August the rate of lava effusion decreased, but continued to feed the flows on the SE, S, and E flanks, maintaining their advances to 3.4 km, 2.8 km, and 1.1 km from the crater, respectively (figure 55). Rockfall and PDCs generated by collapses at the lava flow margins and from the summit dome deposited material within 4 km of the crater. During 3-4 August there were 10 tremor events detected that lasted 1-4 minutes. Short-lived lava pulse lasted 35 seconds and was accompanied by seismic and infrasound signals at 0442 on 6 August. Seven collapses were recorded at the front of the lava flow during 12-14 August.
During September, similar activity of slow lava effusion, PDCs, gas-and-steam emissions, and seismicity continued. There was a total of 4,452 rockfall events, 329 volcanic earthquakes, which included volcanic tremor events, two ashing events, and 85 PDCs recorded throughout the month. On clear weather days, gas-and-steam emissions rose 100-1,500 m above the crater and drifted in multiple directions. Sulfur dioxide emissions averaged 609-2,252 t/d, the higher average of which was measured on 6 September. Slow lava effusion continued advancing on the SE, S, and E flanks, maintaining lengths of 3.4 km, 2.8 km, and 1.1 km, respectively. Rockfall and PDC events generated by collapses along the lava flow margins and at the summit dome deposited material within 4 km of the crater.
Geologic Background. Symmetrical Mayon, which rises above the Albay Gulf NW of Legazpi City, is the most active volcano of the Philippines. The steep upper slopes are capped by a small summit crater. Recorded eruptions since 1616 CE range from Strombolian to basaltic Plinian, with cyclical activity beginning with basaltic eruptions, followed by longer periods of andesitic lava flows. Eruptions occur predominately from the central conduit and have also produced lava flows that travel far down the flanks. Pyroclastic density currents and mudflows have commonly swept down many of the approximately 40 ravines that radiate from the summit and have often damaged populated lowland areas. A violent eruption in 1814 killed more than 1,200 people and devastated several towns.
Information Contacts: Philippine Institute of Volcanology and Seismology (PHIVOLCS), Department of Science and Technology, University of the Philippines Campus, Diliman, Quezon City, Philippines (URL: http://www.phivolcs.dost.gov.ph/); MIROVA (Middle InfraRed Observation of Volcanic Activity), a collaborative project between the Universities of Turin and Florence (Italy) supported by the Centre for Volcanic Risk of the Italian Civil Protection Department (URL: http://www.mirovaweb.it/); Hawai'i Institute of Geophysics and Planetology (HIGP) - MODVOLC Thermal Alerts System, School of Ocean and Earth Science and Technology (SOEST), Univ. of Hawai'i, 2525 Correa Road, Honolulu, HI 96822, USA (URL: http://modis.higp.hawaii.edu/); Copernicus Browser, Copernicus Data Space Ecosystem, European Space Agency (URL: https://dataspace.copernicus.eu/browser/); William Rogers, Legazpi City, Albay Province, Philippines.
Nishinoshima (Japan) — October 2023 Cite this Report
Nishinoshima
Japan
27.247°N, 140.874°E; summit elev. 100 m
All times are local (unless otherwise noted)
Eruption plumes and gas-and-steam plumes during May-August 2023
Nishinoshima, located about 1,000 km S of Tokyo, is a small island in the Ogasawara Arc in Japan. The island is the summit of a massive submarine volcano that has prominent submarine peaks to the S, W, and NE. Eruptions date back to 1973 and the current eruption period began in October 2022. Recent activity has consisted of small ash plumes and fumarolic activity (BGVN 48:07). This report covers activity during May through August 2023, using information from monthly reports of the Japan Meteorological Agency (JMA) monthly reports and satellite data.
Activity during May through June was relatively low. The Japan Coast Guard (JCG) did overflights on 14 and 22 June and reported white gas-and-steam emissions rising 600 m and 1,200 m from the central crater of the pyroclastic cone, respectively (figure 125). In addition, multiple white gas-and-steam emissions rose from the inner rim of the W side of the crater and from the SE flank of the pyroclastic cone. Discolored brown-to-green water was observed around almost the entire perimeter of the island; on 22 June light green discolored water was observed off the S coast of the island.
Observations from the Himawari meteorological satellite confirmed an eruption on 9 and 10 July. An eruption plume rose 1.6 km above the crater and drifted N around 1300 on 9 July. Satellite images acquired at 1420 and 2020 on 9 July and at 0220 on 10 July showed continuing emissions that rose 1.3-1.6 km above the crater and drifted NE and N. The Tokyo VAAC reported that an ash plume seen by a pilot and identified in a satellite image at 0630 on 21 July rose to 3 km altitude and drifted S.
Aerial observations conducted by JCG on 8 August showed a white-and-gray plume rising from the central crater of the pyroclastic cone, and multiple white gas-and-steam emissions were rising from the inner edge of the western crater and along the NW-SE flanks of the island (figure 126). Brown-to-green discolored water was also noted around the perimeter of the island.
Intermittent low-to-moderate power thermal anomalies were recorded in the MIROVA graph (Middle InfraRed Observation of Volcanic Activity), showing an increase in both frequency and power beginning in July (figure 127). This increase in activity coincides with eruptive activity on 9 and 10 July, characterized by eruption plumes. According to the MODVOLC thermal alert algorithm, one thermal hotspot was recorded on 20 July. Weak thermal anomalies were also detected in infrared satellite imagery, accompanied by strong gas-and-steam plumes (figure 128).
Geologic Background. The small island of Nishinoshima was enlarged when several new islands coalesced during an eruption in 1973-74. Multiple eruptions that began in 2013 completely covered the previous exposed surface and continued to enlarge the island. The island is the summit of a massive submarine volcano that has prominent peaks to the S, W, and NE. The summit of the southern cone rises to within 214 m of the ocean surface 9 km SSE.
Information Contacts: Japan Meteorological Agency (JMA), 1-3-4 Otemachi, Chiyoda-ku, Tokyo 100-8122, Japan (URL: http://www.jma.go.jp/jma/indexe.html); Tokyo Volcanic Ash Advisory Center (VAAC), 1-3-4 Otemachi, Chiyoda-ku, Tokyo 100-8122, Japan (URL: http://ds.data.jma.go.jp/svd/vaac/data/); MIROVA (Middle InfraRed Observation of Volcanic Activity), a collaborative project between the Universities of Turin and Florence (Italy) supported by the Centre for Volcanic Risk of the Italian Civil Protection Department (URL: http://www.mirovaweb.it/); Copernicus Browser, Copernicus Data Space Ecosystem, European Space Agency (URL: https://dataspace.copernicus.eu/browser/).
Krakatau (Indonesia) — October 2023 Cite this Report
Krakatau
Indonesia
6.1009°S, 105.4233°E; summit elev. 285 m
All times are local (unless otherwise noted)
White gas-and-steam plumes and occasional ash plumes during May-August 2023
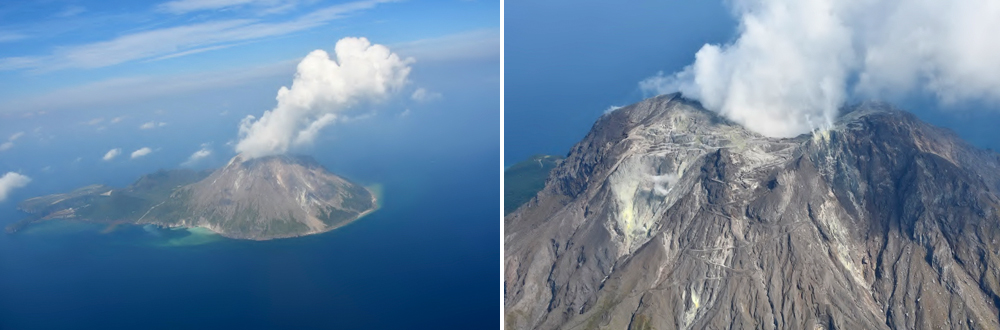
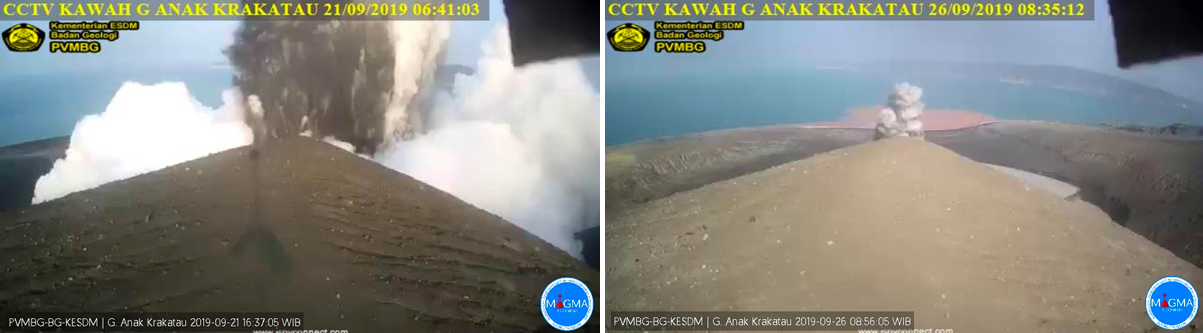
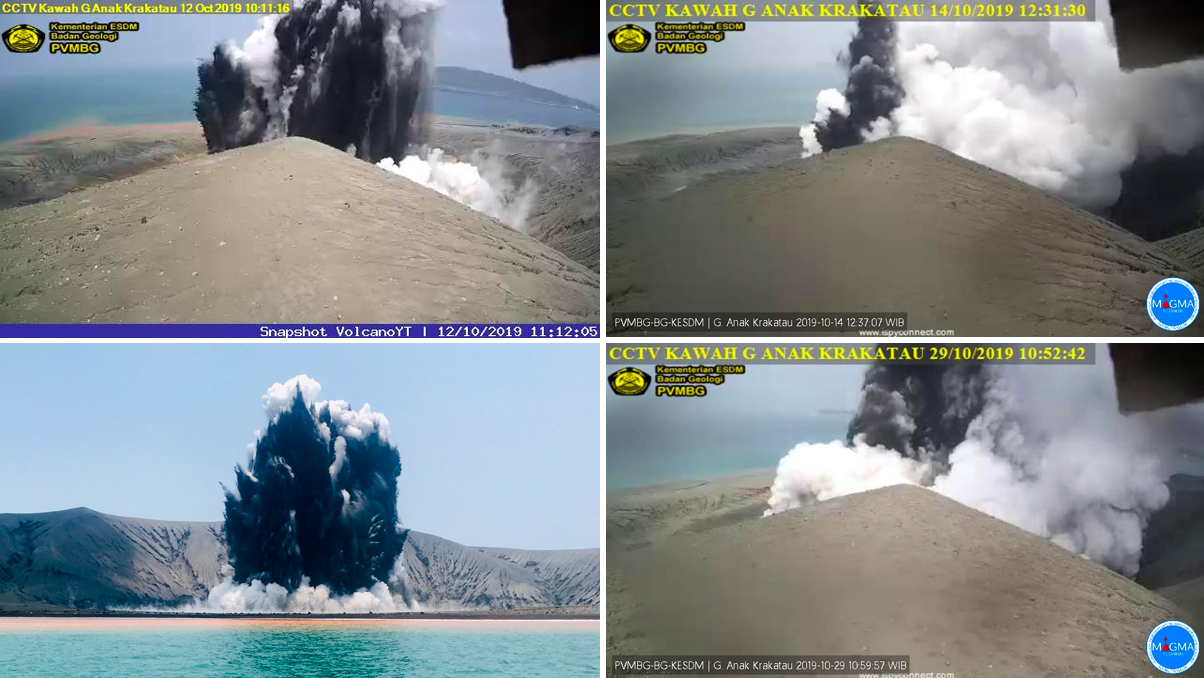
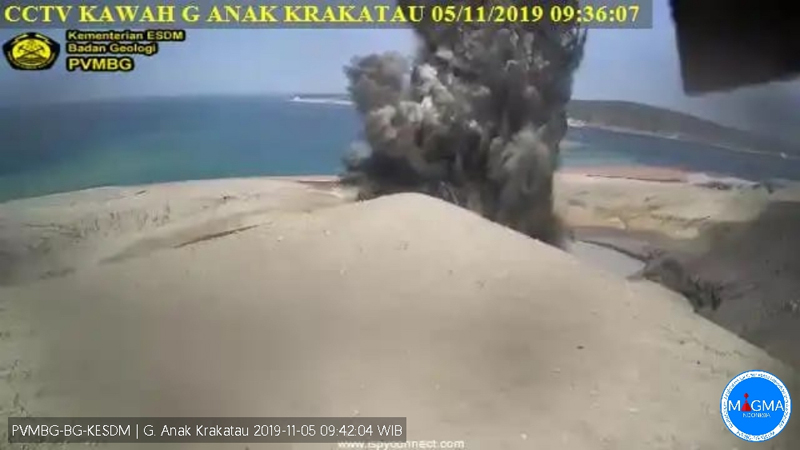
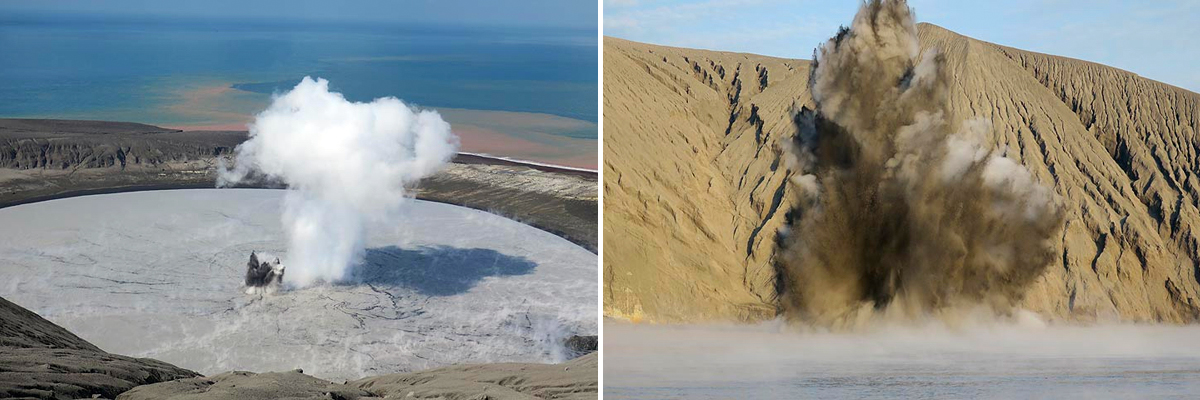
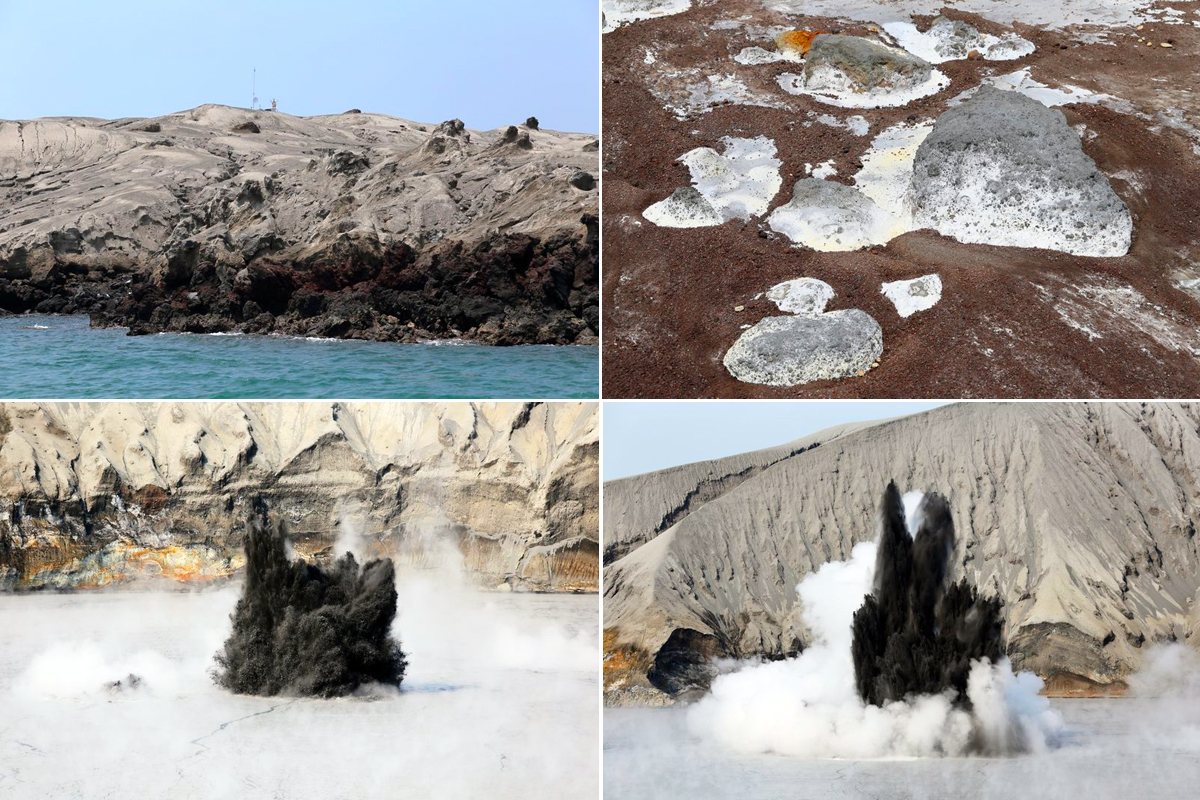
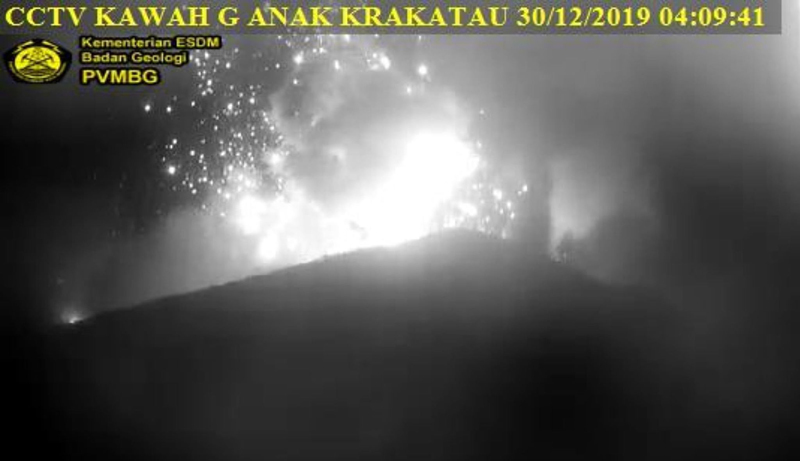
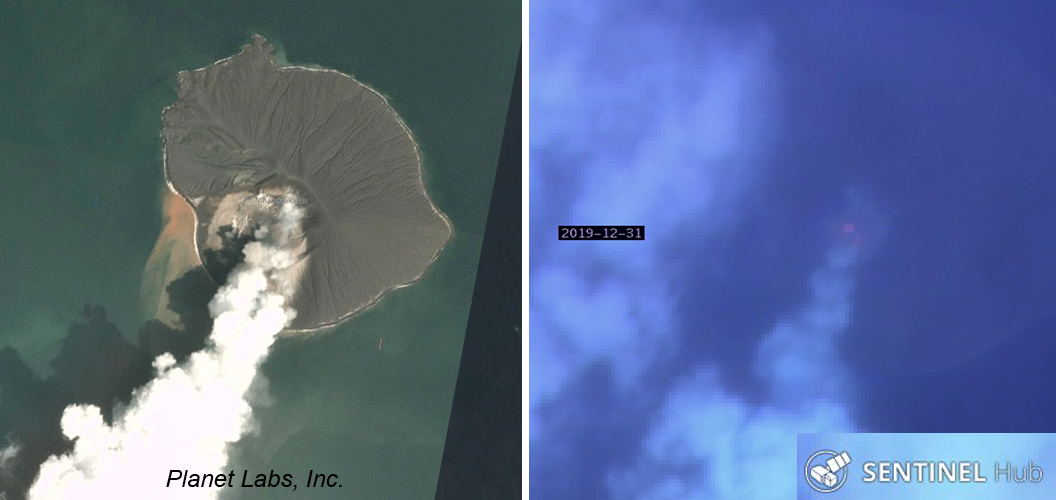
Krakatau is located in the Sunda Strait between Java and Sumatra, Indonesia. Caldera collapse during the catastrophic 1883 eruption destroyed Danan and Perbuwatan cones and left only a remnant of Rakata. The post-collapse cone of Anak Krakatau (Child of Krakatau) was constructed within the 1883 caldera at a point between the former Danan and Perbuwatan cones; it has been the site of frequent eruptions since 1927. The current eruption period began in May 2021 and has recently consisted of Strombolian eruptions and ash plumes (BGVN 48:07). This report describes lower levels of activity consisting of ash and white gas-and-steam plumes during May through August 2023, based on information provided by the Indonesian Center for Volcanology and Geological Hazard Mitigation, referred to as Pusat Vulkanologi dan Mitigasi Bencana Geologi (PVMBG), MAGMA Indonesia, and satellite data.
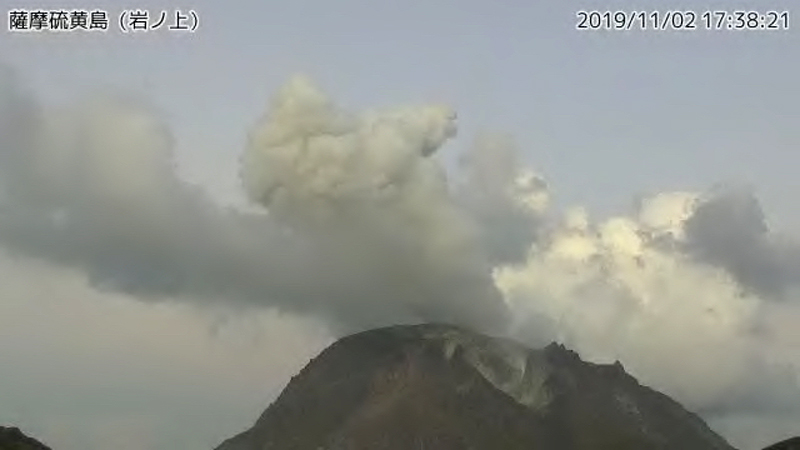
Activity was relatively low during May and June. Daily white gas-and-steam emissions rose 25-200 m above the crater and drifted in different directions. Five ash plumes were detected at 0519 on 10 May, 1241 on 11 May, 0920 on 12 May, 2320 on 12 May, and at 0710 on 13 May, and rose 1-2.5 km above the crater and drifted SW. A webcam image taken on 12 May showed ejection of incandescent material above the vent. A total of nine ash plumes were detected during 6-11 June: at 1434 and 00220 on 6 and 7 June the ash plumes rose 500 m above the crater and drifted NW, at 1537 on 8 June the ash plume rose 1 km above the crater and drifted SW, at 0746 and at 0846 on 9 June the ash plumes rose 800 m and 3 km above the crater and drifted SW, respectively, at 0423, 1431, and 1750 on 10 June the ash plumes rose 2 km, 1.5 km, and 3.5 km above the crater and drifted NW, respectively, and at 0030 on 11 June an ash plume rose 2 km above the crater and drifted NW. Webcam images taken on 10 and 11 June at 0455 and 0102, respectively, showed incandescent material ejected above the vent. On 19 June an ash plume at 0822 rose 1.5 km above the crater and drifted SE.
Similar low activity of white gas-and-steam emissions and few ash plumes were reported during July and August. Daily white gas-and-steam emissions rose 25-300 m above the crater and drifted in multiple directions. Three ash plumes were reported at 0843, 0851, and 0852 on 20 July that rose 500-2,000 m above the crater and drifted NW.
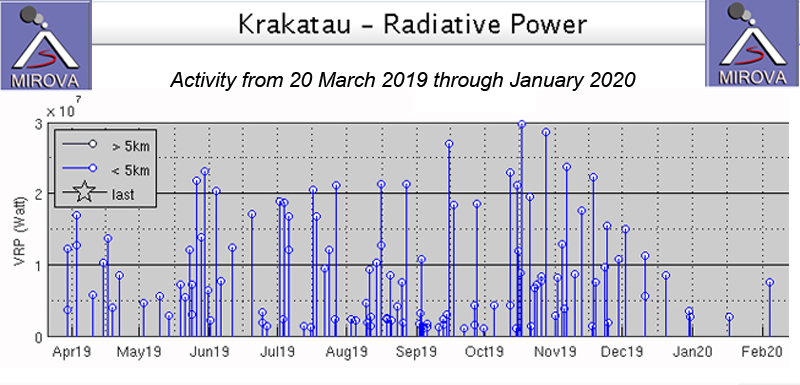
The MIROVA (Middle InfraRed Observation of Volcanic Activity) graph of MODIS thermal anomaly data showed intermittent low-to-moderate power thermal anomalies during May through August 2023 (figure 140). Although activity was often obscured by weather clouds, a thermal anomaly was visible in an infrared satellite image of the crater on 12 May, accompanied by an eruption plume that drifted SW (figure 141).
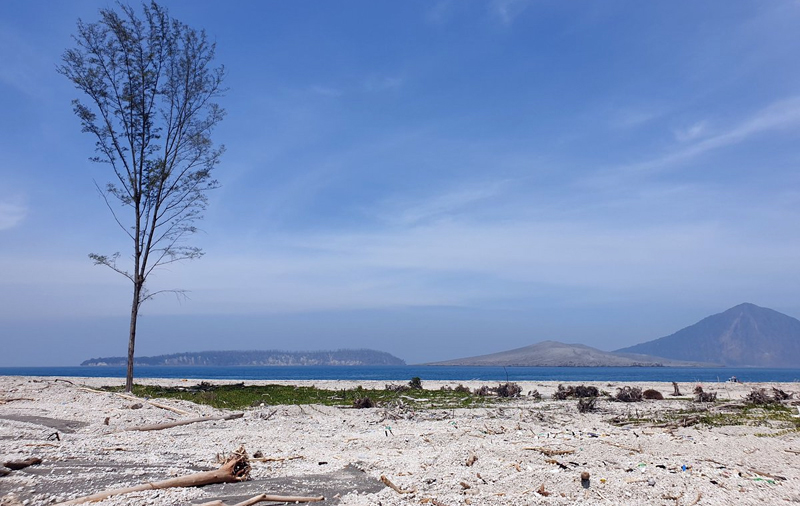
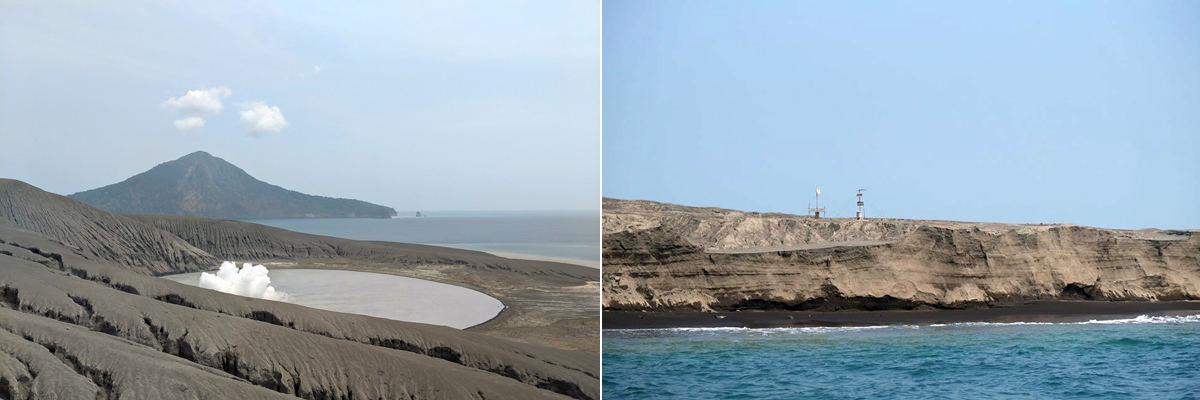
Geologic Background. The renowned Krakatau (frequently mis-named as Krakatoa) volcano lies in the Sunda Strait between Java and Sumatra. Collapse of an older edifice, perhaps in 416 or 535 CE, formed a 7-km-wide caldera. Remnants of that volcano are preserved in Verlaten and Lang Islands; subsequently the Rakata, Danan, and Perbuwatan cones were formed, coalescing to create the pre-1883 Krakatau Island. Caldera collapse during the catastrophic 1883 eruption destroyed Danan and Perbuwatan, and left only a remnant of Rakata. This eruption caused more than 36,000 fatalities, most as a result of tsunamis that swept the adjacent coastlines of Sumatra and Java. Pyroclastic surges traveled 40 km across the Sunda Strait and reached the Sumatra coast. After a quiescence of less than a half century, the post-collapse cone of Anak Krakatau (Child of Krakatau) was constructed within the 1883 caldera at a point between the former Danan and Perbuwatan cones. Anak Krakatau has been the site of frequent eruptions since 1927.
Information Contacts: Pusat Vulkanologi dan Mitigasi Bencana Geologi (PVMBG, also known as Indonesian Center for Volcanology and Geological Hazard Mitigation, CVGHM), Jalan Diponegoro 57, Bandung 40122, Indonesia (URL: http://www.vsi.esdm.go.id/); MAGMA Indonesia, Kementerian Energi dan Sumber Daya Mineral (URL: https://magma.esdm.go.id/v1); MIROVA (Middle InfraRed Observation of Volcanic Activity), a collaborative project between the Universities of Turin and Florence (Italy) supported by the Centre for Volcanic Risk of the Italian Civil Protection Department (URL: http://www.mirovaweb.it/); Copernicus Browser, Copernicus Data Space Ecosystem, European Space Agency (URL: https://dataspace.copernicus.eu/browser/).
Villarrica (Chile) — October 2023 Cite this Report
Villarrica
Chile
39.42°S, 71.93°W; summit elev. 2847 m
All times are local (unless otherwise noted)
Strombolian activity, gas-and-ash emissions, and crater incandescence during April-September 2023
Villarrica, in central Chile, consists of a 2-km-wide caldera that formed about 3,500 years ago and is located at the base of the presently active cone at the NW margin of a 6-km-wide caldera. Historical eruptions eruptions date back to 1558 and have been characterized by mild-to-moderate explosive activity with occasional lava effusions. The current eruption period began in December 2014 and has recently consisted of nighttime crater incandescence, ash emissions, and seismicity (BGVN 48:04). This report covers activity during April through September 2023 and describes occasional Strombolian activity, gas-and-ash emissions, and nighttime crater incandescence. Information for this report primarily comes from the Southern Andes Volcano Observatory (Observatorio Volcanológico de Los Andes del Sur, OVDAS), part of Chile's National Service of Geology and Mining (Servicio Nacional de Geología y Minería, SERNAGEOMIN) and satellite data.
Seismicity during April consisted of long period (LP) events and tremor (TRE); a total of 9,413 LP-type events and 759 TR-type events were detected throughout the month. Nighttime crater incandescence persisted and was visible in the degassing column. Sulfur dioxide data was obtained using Differential Absorption Optical Spectroscopy Equipment (DOAS) that showed an average value of 1,450 ± 198 tons per day (t/d) during 1-15 April and 1,129 ± 201 t/d during 16-30 April, with a maximum daily value of 2,784 t/d on 9 April. Gas-and-steam emissions of variable intensities rose above the active crater as high as 1.3 km above the crater on 13 April. Strombolian explosions were not observed and there was a slight decrease in the lava lake level.
There were 14,123 LP-type events and 727 TR-type events detected during May. According to sulfur dioxide measurements taken with DOAS equipment, the active crater emitted an average value of 1,826 ± 482 t/d during 1-15 May and 912 ± 41 t/d during 16-30 May, with a daily maximum value of 5,155 t/d on 13 May. Surveillance cameras showed continuous white gas-and-steam emissions that rose as high as 430 m above the crater on 27 May. Nighttime incandescence illuminated the gas column less than 300 m above the crater rim was and no pyroclastic emissions were reported. A landslide was identified on 13 May on the E flank of the volcano 50 m from the crater rim and extending 300 m away; SERNAGEOMIN noted that this event may have occurred on 12 May. During the morning of 27 and 28 May minor Strombolian explosions characterized by incandescent ejecta were recorded at the crater rim; the last reported Strombolian explosions had occurred at the end of March.
Seismic activity during June consisted of five volcano-tectonic (VT)-type events, 21,606 LP-type events, and 2,085 TR-type events. The average value of sulfur dioxide flux obtained by DOAS equipment was 1,420 ± 217 t/d during 1-15 June and 2,562 ± 804 t/d, with a maximum daily value of 4,810 t/d on 17 June. White gas-and-steam emissions rose less than 480 m above the crater; frequent nighttime crater incandescence was reflected in the degassing plume. On 12 June an emission rose 100 m above the crater and drifted NNW. On 15 June one or several emissions resulted in ashfall to the NE as far as 5.5 km from the crater, based on a Skysat satellite image. Several Strombolian explosions occurred within the crater; activity on 15 June was higher energy and ejected blocks 200-300 m on the NE slope. Surveillance cameras showed white gas-and-steam emissions rising 480 m above the crater on 16 June. On 19 and 24 June low-intensity Strombolian activity was observed, ejecting material as far as 200 m from the center of the crater to the E.
During July, seismicity included 29,319 LP-type events, 3,736 TR-type events, and two VT-type events. DOAS equipment recorded two days of sulfur dioxide emissions of 4,220 t/d and 1,009 t/d on 1 and 13 July, respectively. Constant nighttime incandescence was also recorded and was particularly noticeable when accompanied by eruptive columns on 12 and 16 July. Minor explosive events were detected in the crater. According to Skysat satellite images taken on 12, 13, and 16 July, ashfall deposits were identified 155 m S of the crater. According to POVI, incandescence was visible from two vents on the crater floor around 0336 on 12 July. Gas-and-ash emissions rose as high as 1.2 km above the crater on 13 July and drifted E and NW. A series of gas-and-steam pulses containing some ash deposited material on the upper E flank around 1551 on 13 July. During 16-31 July, average sulfur dioxide emissions of 1,679 ± 406 t/d were recorded, with a maximum daily value of 2,343 t/d on 28 July. Fine ash emissions were also reported on 16, 17, and 23 July.
Seismicity persisted during August, characterized by 27,011 LP-type events, 3,323 TR-type events, and three VT-type events. The average value of sulfur dioxide measurements taken during 1-15 August was 1,642 ± 270 t/d and 2,207 ± 4,549 t/d during 16-31 August, with a maximum daily value of 3,294 t/d on 27 August. Nighttime crater incandescence remained visible in degassing columns. White gas-and-steam emissions rose 480 m above the crater on 6 August. According to a Skysat satellite image from 6 August, ash accumulation was observed proximal to the crater and was mainly distributed toward the E slope. White gas-and-steam emissions rose 320 m above the crater on 26 August. Nighttime incandescence and Strombolian activity that generated ash emissions were reported on 27 August.
Seismicity during September was characterized by five VT-type events, 12,057 LP-type events, and 2,058 TR-type events. Nighttime incandescence persisted. On 2 September an ash emission rose 180 m above the crater and drifted SE at 1643 (figure 125) and a white gas-and-steam plume rose 320 m above the crater. According to the Buenos Aires VAAC, periods of continuous gas-and-ash emissions were visible in webcam images from 1830 on 2 September to 0110 on 3 September. Strombolian activity was observed on 2 September and during the early morning of 3 September, the latter event of which generated an ash emission that rose 60 m above the crater and drifted 100 m from the center of the crater to the NE and SW. Ashfall was reported to the SE and S as far as 750 m from the crater. The lava lake was active during 3-4 September and lava fountaining was visible for the first time since 26 March 2023, according to POVI. Fountains captured in webcam images at 2133 on 3 September and at 0054 on 4 September rose as high as 60 m above the crater rim and ejected material onto the upper W flank. Sulfur dioxide flux of 1,730 t/d and 1,281 t/d was measured on 3 and 4 September, respectively, according to data obtained by DOAS equipment.
Strong Strombolian activity and larger gas-and-ash plumes were reported during 18-20 September. On 18 September activity was also associated with energetic LP-type events and notable sulfur dioxide fluxes (as high as 4,277 t/d). On 19 September Strombolian activity and incandescence were observed. On 20 September at 0914 ash emissions rose 50 m above the crater and drifted SSE, accompanied by Strombolian activity that ejected material less than 100 m SSE, causing fall deposits on that respective flank. SERNAGEOMIN reported that a Planet Scope satellite image taken on 20 September showed the lava lake in the crater, measuring 32 m x 35 m and an area of 0.001 km2. Several ash emissions were recorded at 0841, 0910, 1251, 1306, 1312, 1315, and 1324 on 23 September and rose less than 150 m above the crater. The sulfur dioxide flux value was 698 t/d on 23 September and 1,097 t/d on 24 September. On 24 September the Volcanic Alert Level (VAL) was raised to Orange (the third level on a four-color scale). SENAPRED maintained the Alert Level at Yellow (the middle level on a three-color scale) for the communities of Villarrica, Pucón (16 km N), Curarrehue, and Panguipulli.
During 24-25 September there was an increase in seismic energy (observed at TR-events) and acoustic signals, characterized by 1 VT-type event, 213 LP-type events, and 124 TR-type events. Mainly white gas-and-steam emissions, in addition to occasional fine ash emissions were recorded. During the early morning of 25 September Strombolian explosions were reported and ejected material 250 m in all directions, though dominantly toward the NW. On 25 September the average value of sulfur dioxide flux was 760 t/d. Seismicity during 25-30 September consisted of five VT-type events, 1,937 LP-type events, and 456 TR-type events.
During 25-29 September moderate Strombolian activity was observed and ejected material as far as the crater rim. In addition, ash pulses lasting roughly 50 minutes were observed around 0700 and dispersed ENE. During 26-27 September a TR episode lasted 6.5 hours and was accompanied by discrete acoustic signals. Satellite images from 26 September showed a spatter cone on the crater floor with one vent that measured 10 x 14 m and a smaller vent about 35 m NE of the cone. SERNAGEOMIN reported an abundant number of bomb-sized blocks up to 150 m from the crater, as well as impact marks on the snow, which indicated explosive activity. A low-altitude ash emission was observed drifting NW around 1140 on 28 September, based on webcam images. Between 0620 and 0850 on 29 September an ash emission rose 60 m above the crater and drifted NW. During an overflight taken around 1000 on 29 September scientists observed molten material in the vent, a large accumulation of pyroclasts inside the crater, and energetic degassing, some of which contained a small amount of ash. Block-sized pyroclasts were deposited on the internal walls and near the crater, and a distal ash deposit was also visible. The average sulfur dioxide flux measured on 28 September was 344 t/d. Satellite images taken on 29 September ashfall was deposited roughly 3 km WNW from the crater and nighttime crater incandescence remained visible. The average sulfur dioxide flux value from 29 September was 199 t/d. On 30 September at 0740 a pulsating ash emission rose 1.1 km above the crater and drifted NNW (figure 126). Deposits on the S flank extended as far as 4.5 km from the crater rim, based on satellite images from 30 September.
Infrared MODIS satellite data processed by MIROVA (Middle InfraRed Observation of Volcanic Activity) showed intermittent thermal activity during April through September, with slightly stronger activity detected during late September (figure 127). Small clusters of thermal activity were detected during mid-June, early July, early August, and late September. According to the MODVOLC thermal alert system, a total of four thermal hotspots were detected on 7 July and 3 and 23 September. This activity was also intermittently captured in infrared satellite imagery on clear weather days (figure 128).
Geologic Background. The glacier-covered Villarrica stratovolcano, in the northern Lakes District of central Chile, is ~15 km south of the city of Pucon. A 2-km-wide caldera that formed about 3,500 years ago is located at the base of the presently active, dominantly basaltic to basaltic andesite cone at the NW margin of a 6-km-wide Pleistocene caldera. More than 30 scoria cones and fissure vents are present on the flanks. Plinian eruptions and pyroclastic flows that have extended up to 20 km from the volcano were produced during the Holocene. Lava flows up to 18 km long have issued from summit and flank vents. Eruptions documented since 1558 CE have consisted largely of mild-to-moderate explosive activity with occasional lava effusion. Glaciers cover 40 km2 of the volcano, and lahars have damaged towns on its flanks.
Information Contacts: Servicio Nacional de Geología y Minería (SERNAGEOMIN), Observatorio Volcanológico de Los Andes del Sur (OVDAS), Avda Sta María No. 0104, Santiago, Chile (URL: http://www.sernageomin.cl/); Proyecto Observación Villarrica Internet (POVI) (URL: http://www.povi.cl/); Sistema y Servicio Nacional de Prevención y Repuesta Ante Desastres (SENAPRED), Av. Beauchef 1671, Santiago, Chile (URL: https://web.senapred.cl/); Buenos Aires Volcanic Ash Advisory Center (VAAC), Servicio Meteorológico Nacional-Fuerza Aérea Argentina, 25 de mayo 658, Buenos Aires, Argentina (URL: http://www.smn.gov.ar/vaac/buenosaires/inicio.php); MIROVA (Middle InfraRed Observation of Volcanic Activity), a collaborative project between the Universities of Turin and Florence (Italy) supported by the Centre for Volcanic Risk of the Italian Civil Protection Department (URL: http://www.mirovaweb.it/); Hawai'i Institute of Geophysics and Planetology (HIGP) - MODVOLC Thermal Alerts System, School of Ocean and Earth Science and Technology (SOEST), Univ. of Hawai'i, 2525 Correa Road, Honolulu, HI 96822, USA (URL: http://modis.higp.hawaii.edu/); Copernicus Browser, Copernicus Data Space Ecosystem, European Space Agency (URL: https://dataspace.copernicus.eu/browser/).
Merapi (Indonesia) — October 2023 Cite this Report
Merapi
Indonesia
7.54°S, 110.446°E; summit elev. 2910 m
All times are local (unless otherwise noted)
Frequent incandescent avalanches during April-September 2023
Merapi, located just north of the major city of Yogyakarta in central Java, Indonesia, has had activity within the last 20 years characterized by pyroclastic flows and lahars accompanying growth and collapse of the steep-sided active summit lava dome. The current eruption period began in late December 2020 and has more recently consisted of ash plumes, intermittent incandescent avalanches of material, and pyroclastic flows (BGVN 48:04). This report covers activity during April through September 2023, based on information from Balai Penyelidikan dan Pengembangan Teknologi Kebencanaan Geologi (BPPTKG), the Center for Research and Development of Geological Disaster Technology, a branch of PVMBG which specifically monitors Merapi. Additional information comes from the Pusat Vulkanologi dan Mitigasi Bencana Geologi (PVMBG, also known as Indonesian Center for Volcanology and Geological Hazard Mitigation, CVGHM), MAGMA Indonesia, the Darwin Volcanic Ash Advisory Centre (VAAC), and various satellite data.
Activity during April through September 2023 primarily consisted of incandescent avalanches of material that mainly affected the SW and W flanks and traveled as far as 2.3 km from the summit (table 25) and white gas-and-steam emissions that rose 10-1,000 m above the crater.
Table 25. Monthly summary of avalanches and avalanche distances recorded at Merapi during April through September 2023. The number of reported avalanches does not include instances where possible avalanches were heard but could not be visually confirmed as a result of inclement weather. Data courtesy of BPPTKG (April-September 2023 daily reports).
| Month |
Average number of avalanches per day |
Distance avalanches traveled (m) |
| Apr 2023 |
19 |
1,200-2,000 |
| May 2023 |
22 |
500-2,000 |
| Jun 2023 |
18 |
1,200-2,000 |
| Jul 2023 |
30 |
300-2,000 |
| Aug 2023 |
25 |
400-2,300 |
| Sep 2023 |
23 |
600-2,000 |
BPPTKG reported that during April and May white gas-and-steam emissions rose 10-750 m above the crater, incandescent avalanches descended 500-2,000 m on the SW and W flanks (figure 135). Cloudy weather often prevented clear views of the summit, and sometimes avalanches could not be confirmed. According to a webcam image, a pyroclastic flow was visible on 17 April at 0531. During the week of 28 April and 4 May a pyroclastic flow was reported on the SW flank, traveling up to 2.5 km. According to a drone overflight taken on 17 May the SW lava dome volume was an estimated 2,372,800 cubic meters and the dome in the main crater was an estimated 2,337,300 cubic meters.
During June and July similar activity persisted with white gas-and-steam emissions rising 10-350 m above the crater and frequent incandescent avalanches that traveled 300-2,000 m down the SW, W, and S flanks (figure 136). Based on an analysis of aerial photos taken on 24 June the volume of the SW lava dome was approximately 2.5 million cubic meters. A pyroclastic flow was observed on 5 July that traveled 2.7 km on the SW flank. According to the Darwin VAAC multiple minor ash plumes were identified in satellite images on 19 July that rose to 3.7 km altitude and drifted S and SW. During 22, 25, and 26 July a total of 17 avalanches descended as far as 1.8 km on the S flank.
Frequent white gas-and-steam emissions continued during August and September, rising 10-450 m above the crater. Incandescent avalanches mainly affected the SW and W flanks and traveled 400-2,300 m from the vent (figure 137). An aerial survey conducted on 10 August was analyzed and reported that estimates of the SW dome volume was 2,764,300 cubic meters and the dome in the main crater was 2,369,800 cubic meters.
Frequent and moderate-power thermal activity continued throughout the reporting period, according to a MIROVA (Middle InfraRed Observation of Volcanic Activity) analysis of MODIS satellite data (figure 138). There was an increase in the number of detected anomalies during mid-May. The MODVOLC thermal algorithm recorded a total of 47 thermal hotspots: six during April, nine during May, eight during June, 15 during July, four during August, and five during September. Some of this activity was captured in infrared satellite imagery on clear weather days, sometimes accompanied by incandescent material on the SW flank (figure 139).
Geologic Background. Merapi, one of Indonesia's most active volcanoes, lies in one of the world's most densely populated areas and dominates the landscape immediately north of the major city of Yogyakarta. It is the youngest and southernmost of a volcanic chain extending NNW to Ungaran volcano. Growth of Old Merapi during the Pleistocene ended with major edifice collapse perhaps about 2,000 years ago, leaving a large arcuate scarp cutting the eroded older Batulawang volcano. Subsequent growth of the steep-sided Young Merapi edifice, its upper part unvegetated due to frequent activity, began SW of the earlier collapse scarp. Pyroclastic flows and lahars accompanying growth and collapse of the steep-sided active summit lava dome have devastated cultivated lands on the western-to-southern flanks and caused many fatalities.
Information Contacts: Balai Penyelidikan dan Pengembangan Teknologi Kebencanaan Geologi (BPPTKG), Center for Research and Development of Geological Disaster Technology (URL: http://merapi.bgl.esdm.go.id/, Twitter: @BPPTKG); MAGMA Indonesia, Kementerian Energi dan Sumber Daya Mineral (URL: https://magma.esdm.go.id/v1); Pusat Vulkanologi dan Mitigasi Bencana Geologi (PVMBG, also known as Indonesian Center for Volcanology and Geological Hazard Mitigation, CVGHM), Jalan Diponegoro 57, Bandung 40122, Indonesia (URL: http://www.vsi.esdm.go.id/); Darwin Volcanic Ash Advisory Centre (VAAC), Bureau of Meteorology, Northern Territory Regional Office, PO Box 40050, Casuarina, NT 0811, Australia (URL: http://www.bom.gov.au/info/vaac/); MIROVA (Middle InfraRed Observation of Volcanic Activity), a collaborative project between the Universities of Turin and Florence (Italy) supported by the Centre for Volcanic Risk of the Italian Civil Protection Department (URL: http://www.mirovaweb.it/); Hawai'i Institute of Geophysics and Planetology (HIGP) - MODVOLC Thermal Alerts System, School of Ocean and Earth Science and Technology (SOEST), Univ. of Hawai'i, 2525 Correa Road, Honolulu, HI 96822, USA (URL: http://modis.higp.hawaii.edu/); Copernicus Browser, Copernicus Data Space Ecosystem, European Space Agency (URL: https://dataspace.copernicus.eu/browser/); Øystein Lund Andersen (URL: https://www.oysteinlundandersen.com/, https://twitter.com/oysteinvolcano).
Ebeko
Russia
50.686°N, 156.014°E; summit elev. 1103 m
All times are local (unless otherwise noted)
Moderate explosive activity with ash plumes continued during June-November 2023
Ebeko, located on the N end of Paramushir Island in Russia’s Kuril Islands just S of the Kamchatka Peninsula, consists of three summit craters along a SSW-NNE line at the northern end of a complex of five volcanic cones. Observed eruptions date back to the late 18th century and have been characterized as small-to-moderate explosions from the summit crater, accompanied by intense fumarolic activity. The current eruptive period began in June 2022, consisting of frequent explosions, ash plumes, and thermal activity (BGVN 47:10, 48:06). This report covers similar activity during June-November 2023, based on information from the Kamchatka Volcanic Eruptions Response Team (KVERT) and satellite data.
Moderate explosive activity continued during June-November 2023 (figures 50 and 51). According to visual data from Severo-Kurilsk, explosions sent ash 2-3.5 km above the summit (3-4.5 km altitude) during most days during June through mid-September. Activity after mid-September was slightly weaker, with ash usually reaching less than 2 km above the summit. According to KVERT the volcano in October and November was, with a few exceptions, either quiet or obscured by clouds that prevented satellite observations. KVERT issued Volcano Observatory Notices for Aviation (VONA) on 8 and 12 June, 13 and 22 July, 3 and 21 August, and 31 October warning of potential aviation hazards from ash plumes drifting 3-15 km from the volcano. Based on satellite data, KVERT reported a persistent thermal anomaly whenever weather clouds permitted viewing.
Geologic Background. The flat-topped summit of the central cone of Ebeko volcano, one of the most active in the Kuril Islands, occupies the northern end of Paramushir Island. Three summit craters located along a SSW-NNE line form Ebeko volcano proper, at the northern end of a complex of five volcanic cones. Blocky lava flows extend west from Ebeko and SE from the neighboring Nezametnyi cone. The eastern part of the southern crater contains strong solfataras and a large boiling spring. The central crater is filled by a lake about 20 m deep whose shores are lined with steaming solfataras; the northern crater lies across a narrow, low barrier from the central crater and contains a small, cold crescentic lake. Historical activity, recorded since the late-18th century, has been restricted to small-to-moderate explosive eruptions from the summit craters. Intense fumarolic activity occurs in the summit craters, on the outer flanks of the cone, and in lateral explosion craters.
Information Contacts: Kamchatka Volcanic Eruptions Response Team (KVERT), Far Eastern Branch, Russian Academy of Sciences, 9 Piip Blvd., Petropavlovsk-Kamchatsky, 683006, Russia (URL: http://www.kscnet.ru/ivs/kvert/).
Search Bulletin Archive by Publication Date
Select a month and year from the drop-downs and click "Show Issue" to have that issue displayed in this tab.
The default month and year is the latest issue available.
Bulletin of the Global Volcanism Network - Volume 45, Number 02 (February 2020)
Managing Editor: Edward Venzke
Barren Island (India)
Thermal anomalies and small ash plumes during February-April 2019 and September 2019-January 2020
Kikai (Japan)
Single explosion with steam and minor ash, 2 November 2019
Krakatau (Indonesia)
Tephra and steam explosions in the crater lake; explosions in December 2019 build a tephra cone
Lateiki (Tonga)
Eruption 13-22 October 2019 creates new island, which disappears by mid-January 2020
Masaya (Nicaragua)
Lava lake persists with lower temperatures during August 2019-January 2020
Pacaya (Guatemala)
Continuous explosions, small cone, and lava flows during August 2019-January 2020
Reventador (Ecuador)
Nearly daily ash emissions and frequent incandescent block avalanches August 2019-January 2020
Sangeang Api (Indonesia)
Ash emissions and lava flow extrusion continue during May 2019 through January 2020
Shishaldin (United States)
Multiple lava flows, pyroclastic flows, lahars, and ashfall events during October 2019 through January 2020
Whakaari/White Island (New Zealand)
Explosion producing an ash plume and pyroclastic surge resulted in fatalities and injuries on 9 December 2019
Barren Island (India) — February 2020 Cite this Report
Barren Island
India
12.278°N, 93.858°E; summit elev. 354 m
All times are local (unless otherwise noted)
Thermal anomalies and small ash plumes during February-April 2019 and September 2019-January 2020
Barren Island is a remote stratovolcano located east of India in the Andaman Islands. Its most recent eruptive episode began in September 2018 and has included lava flows, explosions, ash plumes, and lava fountaining (BGVN 44:02). This report updates information from February 2019 through January 2020 using various satellite data as a primary source of information.
MIROVA (Middle InfraRed Observation of Volcanic Activity) analysis of MODIS satellite data showed intermittent thermal anomalies within 5 km of the summit from mid-February 2019 through January 2020 (figure 41). There was a period of relatively low to no discernible activity between May to September 2019. The MODVOLC algorithm for MODIS thermal anomalies in comparison with Sentinel-2 thermal satellite imagery and Suomi NPP/VIIRS sensor data, registered elevated temperatures during late February 2019, early March, sparsely in April, late October, sparsely in November, early December, and intermittently in January 2020 (figure 42). Sentinel-2 thermal satellite imagery shows these thermal hotspots differing in strength from late February to late January 2020 (figure 43). The thermal anomalies in these satellite images are occasionally accompanied by ash plumes (25 February 2019, 23 October 2019, and 21 January 2020) and gas-and-steam emissions (26 April 2019).
The Darwin Volcanic Ash Advisory Center (VAAC) reported ash plumes rising from the summit on 7, 14, and 16 March 2019. The maximum altitude of the ash plume occurred on 7 March, rising 1.8 km altitude, drifting W and NW and 1.2 km altitude, drifting E and ESE, based on observations from Himawari-8. The VAAC reports for 14 and 16 March reported the ash plumes rising 0.9 km and 1.2 km altitude, respectively drifting W and W.
Geologic Background. Barren Island, a possession of India in the Andaman Sea about 135 km NE of Port Blair in the Andaman Islands, is the only historically active volcano along the N-S volcanic arc extending between Sumatra and Burma (Myanmar). It is the emergent summit of a volcano that rises from a depth of about 2250 m. The small, uninhabited 3-km-wide island contains a roughly 2-km-wide caldera with walls 250-350 m high. The caldera, which is open to the sea on the west, was created during a major explosive eruption in the late Pleistocene that produced pyroclastic-flow and -surge deposits. Historical eruptions have changed the morphology of the pyroclastic cone in the center of the caldera, and lava flows that fill much of the caldera floor have reached the sea along the western coast.
Information Contacts: MIROVA (Middle InfraRed Observation of Volcanic Activity), a collaborative project between the Universities of Turin and Florence (Italy) supported by the Centre for Volcanic Risk of the Italian Civil Protection Department (URL: http://www.mirovaweb.it/); Hawai'i Institute of Geophysics and Planetology (HIGP) - MODVOLC Thermal Alerts System, School of Ocean and Earth Science and Technology (SOEST), Univ. of Hawai'i, 2525 Correa Road, Honolulu, HI 96822, USA (URL: http://modis.higp.hawaii.edu/); Darwin Volcanic Ash Advisory Centre (VAAC), Bureau of Meteorology, Northern Territory Regional Office, PO Box 40050, Casuarina, NT 0811, Australia (URL: http://www.bom.gov.au/info/vaac/); Sentinel Hub Playground (URL: https://www.sentinel-hub.com/explore/sentinel-playground); NASA Worldview (URL: https://worldview.earthdata.nasa.gov/).
Kikai
Japan
30.793°N, 130.305°E; summit elev. 704 m
All times are local (unless otherwise noted)
Single explosion with steam and minor ash, 2 November 2019
The 19-km-wide submerged Kikai caldera at the N end of Japan’s Ryukyu Islands was the source of one of the world's largest Holocene eruptions about 6,300 years ago, producing large pyroclastic flows and abundant ashfall. During the last century, however, only intermittent minor ash emissions have characterized activity at Satsuma Iwo Jima island, the larger subaerial fragment of the Kikai caldera; several events have included limited ashfall in communities on nearby islands. The most recent event was a single day of explosions on 4 June 2013 that produced ash plumes and minor ashfall on the flank. A minor episode of increased seismicity and fumarolic activity was reported in late March 2018, but no ash emissions were reported. A new single-day event on 2 November 2019 is described here with information provided by the Japan Meteorological Agency (JMA).
JMA reduced the Alert Level to 1 on 27 April 2018 after a brief increase in seismicity during March 2018 (BGVN 45:05); no significant changes in volcanic activity were observed for the rest of the year. Steam plumes rose from the summit crater to heights around 1,000 m; the highest plume rose 1,800 m. Occasional nighttime incandescence was recorded by high-sensitivity surveillance cameras. SO2 measurements made during site visits in March, April, and May indicated amounts ranging from 300-1,500 tons per day, similar to values from 2017 (400-1,000 tons per day). Infrared imaging devices indicated thermal anomalies from fumarolic activity persisted on the N and W flanks during the three site visits. A field survey of the SW flank on 25 May 2018 confirmed that the crater edge had dropped several meters into the crater since a similar survey in April 2007. Scientists on a 19 December 2018 overflight had observed fumarolic activity.
There were no changes in activity through October 2019. Weak incandescence at night continued to be periodically recorded with the surveillance cameras (figure 11). A brief eruption on 2 November 2019 at 1735 local time produced a gray-white plume that rose slightly over 1,000 m above the Iodake crater rim (figure 12). As a result, JMA raised the Alert Level from 1 to 2. During an overflight the following day, a steam plume rose a few hundred meters above the summit, but no further activity was observed. No clear traces of volcanic ash or other ejecta were found around the summit (figure 13). Infrared imaging also showed no particular changes from previous measurements. Discolored seawater continued to be observed around the base of the island in several locations.
For the remainder of November 2019, steam plumes rose up to 1,300 m above the summit, and nighttime incandescence was occasionally observed in the webcam. Seismic activity remained low and there were no additional changes noted through January 2020.
Geologic Background. Multiple eruption centers have exhibited recent activity at Kikai, a mostly submerged, 19-km-wide caldera near the northern end of the Ryukyu Islands south of Kyushu. It was the source of one of the world's largest Holocene eruptions about 6,300 years ago when rhyolitic pyroclastic flows traveled across the sea for a total distance of 100 km to southern Kyushu, and ashfall reached the northern Japanese island of Hokkaido. The eruption devastated southern and central Kyushu, which remained uninhabited for several centuries. Post-caldera eruptions formed Iodake (or Iwo-dake) lava dome and Inamuradake scoria cone, as well as submarine lava domes. Recorded eruptions have occurred at or near Satsuma-Iojima (also known as Tokara-Iojima), a small 3 x 6 km island forming part of the NW caldera rim. Showa-Iojima lava dome (also known as Iojima-Shinto), a small island 2 km E of Satsuma-Iojima, was formed during submarine eruptions in 1934 and 1935. Mild-to-moderate explosive eruptions have occurred during the past few decades from Iodake, a rhyolitic lava dome at the eastern end of Satsuma-Iojima.
Information Contacts: Japan Meteorological Agency (JMA), Otemachi, 1-3-4, Chiyoda-ku Tokyo 100-8122, Japan (URL: http://www.jma.go.jp/jma/indexe.html).
Krakatau (Indonesia) — February 2020 Cite this Report
Krakatau
Indonesia
6.1009°S, 105.4233°E; summit elev. 285 m
All times are local (unless otherwise noted)
Tephra and steam explosions in the crater lake; explosions in December 2019 build a tephra cone
Krakatau volcano in the Sunda Strait between Indonesia’s Java and Sumatra Islands experienced a major caldera collapse around 535 CE; it formed a 7-km-wide caldera ringed by three islands. Remnants of this volcano joined to create the pre-1883 Krakatau Island which collapsed during the major 1883 eruption. Anak Krakatau (Child of Krakatau), constructed beginning in late 1927 within the 1883 caldera (BGVN 44:03, figure 56), was the site of over 40 eruptive episodes until 22 December 2018 when a large explosion and flank collapse destroyed most of the 338-m-high edifice and generated a deadly tsunami (BGVN 44:03). The near-sea level crater lake inside the remnant of Anak Krakatau was the site of numerous small steam and tephra explosions from February (BGVN 44:08) through November 2019. A larger explosion in December 2019 produced the beginnings of a new cone above the surface of crater lake. Activity from August 2019 through January 2020 is covered in this report with information provided by the Indonesian Center for Volcanology and Geological Hazard Mitigation, referred to as Pusat Vulkanologi dan Mitigasi Bencana Geologi (PVMBG). Aviation reports are provided by the Darwin Volcanic Ash Advisory Center (VAAC), and photographs are from the PVMBG webcam and visitors to the island.
Explosions were reported on more than ten days each month from August to October 2019. They were recorded based on seismicity, but webcam images also showed black tephra and steam being ejected from the crater lake to heights up to 450 m. Activity decreased significantly after the middle of November, although smaller explosions were witnessed by visitors to the island. After a period of relative quiet, a larger series of explosions at the end of December produced ash plumes that rose up to 3 km above the crater; the crater lake was largely filled with tephra after these explosions. Thermal activity persisted throughout the period of August 2019-January 2020. The wattage of Radiative Power increased from August through mid-October, and then decreased through January 2020 (figure 96).
Activity during August-November 2019. The new profile of Anak Krakatau rose to about 155 m elevation as of August 2019, almost 100 m less than prior to the December 2018 explosions and flank collapse (figure 97). Smaller explosions continued during August 2019 and were reported by PVMBG in 12 different VONAs (Volcano Observatory Notice to Aviation) on days 1, 3, 6, 17, 19, 22, 23, 25, and 28. Most of the explosions lasted for less than two minutes, according to the seismic data. PVMBG reported steam plumes of 25-50 m height above the sea-level crater on 20 and 21 August. They reported a visible ash cloud on 22 August; it rose to an altitude of 457 m and drifted NNE according to the VONA. In their daily update, they noted that the eruption plume of 250-400 m on 22 August was white, gray, and black. The Darwin VAAC reported that the ash plume was discernable on HIMAWARI-8 satellite imagery for a short period of time. PVMBG noted ten eruptions on 24 August with white, gray, and black ejecta rising 100-300 m. A webcam installed at month’s end provided evidence of diffuse steam plumes rising 25-150 m above the crater during 28-31 August.
VONAs were issued for explosions on 1-3, 11, 13, 17, 18, 21, 24-27 and 29 September 2019. The explosion on 2 September produced a steam plume that rose 350 m, and dense black ash and ejecta which rose 200 m from the crater and drifted N. Gray and white tephra and steam rose 450 m on 13 and 17 September; ejecta was black and gray and rose 200 m on 21 September (figure 98). During 24-27 and 29 September tephra rose at least 200 m each day; some days it was mostly white with gray, other days it was primarily gray and black. All of the ejecta plumes drifted N. On days without explosions, the webcam recorded steam plumes rising 50-150 m above the crater.
Explosions were reported daily during 12-14, 16-20, 25-27, and 29 October (figure 99). PVMBG reported eight explosions on 19 October and seven explosions the next day. Most explosions produced gray and black tephra that rose 200 m from the crater and drifted N. On many of the days an ash plume also rose 350 m from the crater and drifted N. The seismic events that accompanied the explosions varied in duration from 45 to 1,232 seconds (about 20 minutes). The Darwin VAAC reported the 12 October eruption as visible briefly in satellite imagery before dissipating near the volcano. The first of four explosions on 26 October also appeared in visible satellite imagery moving NNW for a short time. The webcam recorded diffuse steam plumes rising 25-150 m above the crater on most days during the month.
Five VONAs were issued for explosions during 5-7 November, and one on 13 November 2019. The three explosions on 5 November produced 200-m-high plumes of steam and gray and black ejecta and ash plumes that rose 200, 450, and 550 m respectively; they all drifted N (figure 100). The Darwin VAAC reported ash drifting N in visible imagery for a brief period also. A 350-m-high ash plume accompanied 200-m-high ejecta on 6 November. Tephra rose 150-300 m from the crater during a 43 second explosion on 7 November. The explosion reported by PVMBG on 13 November produced black tephra and white steam 200 m high that drifted N. For the remainder of the month, when not obscured by fog, steam plumes rose daily 25-150 m from the crater.
A joint expedition with PVMBG and the Earth Observatory of Singapore (EOS) installed geophysical equipment on Anak Krakatau and Rakata during 12 and 13 November 2019 (figure 101). Visitors to the island during 19-23 and 22-24 November recorded the short-lived landscape and continuing small explosions of steam and black tephra from the crater lake (figures 102 and 103).
Activity during December 2019-January 2020. Very little activity was recorded for most of December 2019. The webcam captured daily images of diffuse steam plumes rising 25-50 m above the crater which occasionally rose to 150 m. A new explosion on 28 December produced black and gray ejecta 200 m high that drifted N; the explosion was similar to those reported during August-November. A new series of explosions from 30 December 2019 to 1 January 2020 produced ash plumes which rose significantly higher than the previous explosions, reaching 2.4-3.0 km altitude and drifting S, E, and SE according to PVMBG (figure 104). They were initially visible in satellite imagery and reported drifting SW by the Darwin VAAC. By 31 December meteorological clouds prevented observation of the ash plume but a hotspot remained visible for part of that day.
The explosions on 30 and 31 December 2019 were captured in satellite imagery (figure 105) and appeared to indicate that the crater lake was largely destroyed and filled with tephra from a new growing cone, according to Simon Carn. This was confirmed in both satellite imagery and ground-based photography in early January (figures 106 and 107).
Steam plumes rose 50-200 m above the crater during the first week of January 2020. An explosion on 7 January produced dense gray ash that rose 200 m from the crater and drifted E. Steam plume heights varied during the second week, with some plumes reaching 300 m above the crater. Multiple explosions on 15 January produced dense, gray and black ejecta that rose 150 m. Fog obscured the crater for most of the second half of the month; for a brief period, diffuse steam plumes were observed 25-1,000 m above the crater.
General Reference: Perttu A, Caudron C, Assink J D, Metz D, Tailpied D, Perttu B, Hibert C, Nurfiani D, Pilger C, Muzli M, Fee D, Andersen O L, Taisne B, 2020, Reconstruction of the 2018 tsunamigenic flank collapse and eruptive activity at Anak Krakatau based on eyewitness reports, seismo-acoustic and satellite observations, Earth and Planetary Science Letters, 541:116268. https://doi.org/10.1016/j.epsl.2020.116268.
Geologic Background. The renowned Krakatau (frequently mis-named as Krakatoa) volcano lies in the Sunda Strait between Java and Sumatra. Collapse of an older edifice, perhaps in 416 or 535 CE, formed a 7-km-wide caldera. Remnants of that volcano are preserved in Verlaten and Lang Islands; subsequently the Rakata, Danan, and Perbuwatan cones were formed, coalescing to create the pre-1883 Krakatau Island. Caldera collapse during the catastrophic 1883 eruption destroyed Danan and Perbuwatan, and left only a remnant of Rakata. This eruption caused more than 36,000 fatalities, most as a result of tsunamis that swept the adjacent coastlines of Sumatra and Java. Pyroclastic surges traveled 40 km across the Sunda Strait and reached the Sumatra coast. After a quiescence of less than a half century, the post-collapse cone of Anak Krakatau (Child of Krakatau) was constructed within the 1883 caldera at a point between the former Danan and Perbuwatan cones. Anak Krakatau has been the site of frequent eruptions since 1927.
Information Contacts: Pusat Vulkanologi dan Mitigasi Bencana Geologi (PVMBG, also known as Indonesian Center for Volcanology and Geological Hazard Mitigation, CVGHM), Jalan Diponegoro 57, Bandung 40122, Indonesia (URL: http://www.vsi.esdm.go.id/); MAGMA Indonesia, Kementerian Energi dan Sumber Daya Mineral (URL: https://magma.esdm.go.id/); MIROVA (Middle InfraRed Observation of Volcanic Activity), a collaborative project between the Universities of Turin and Florence (Italy) supported by the Centre for Volcanic Risk of the Italian Civil Protection Department (URL: http://www.mirovaweb.it/); Sentinel Hub Playground (URL: https://www.sentinel-hub.com/explore/sentinel-playground); Planet Labs, Inc. (URL: https://www.planet.com/); Amber Madden-Nadeau, Oxford University (URL: https://www.earth.ox.ac.uk/people/amber-madden-nadeau/, https://twitter.com/AMaddenNadeau/status/1159458288406151169); Anna Perttu, Earth Observatory of Singapore (URL: https://earthobservatory.sg/people/anna-perttu); Simon Carn, Michigan Tech University (URL: https://www.mtu.edu/geo/department/faculty/carn/; https://twitter.com/simoncarn/status/1211793124089044994); VolcanoYT, Indonesia (URL: https://volcanoyt.com/, https://twitter.com/VolcanoYTz/status/1182882409445904386/photo/1; Christoph Sator (URL: https://twitter.com/ChristophSator/status/1184713192670281728/photo/1); Tom Pfeiffer, Volcano Discovery (URL: http://www.volcanodiscovery.com/); Pascal Blondé, France (URL: https://pascal-blonde.info/portefolio-krakatau/, https://twitter.com/rajo_ameh/status/1199219837265960960); Alex Bogár, Budapest (URL: https://twitter.com/AlexEtna/status/1211396913699991557); Piotr (Piter) Smieszek, Yogyakarta, Java, Indonesia (URL: http://www.lombok.pl/, https://twitter.com/piotr_smieszek/status/1204545970962231296); Peter Rendezvous (URL: https://www.facebook.com/peter.rendezvous ); Wulkany swiata, Poland (URL: http://wulkanyswiata.blogspot.com/, https://twitter.com/Wulkany1/status/1214841708862693376).
Lateiki
Tonga
19.18°S, 174.87°W; summit elev. 43 m
All times are local (unless otherwise noted)
Eruption 13-22 October 2019 creates new island, which disappears by mid-January 2020
Lateiki (Metis Shoal) is one of several submarine and island volcanoes on the W side of the Tonga trench in the South Pacific. It has produced ephemeral islands multiple times since the first confirmed activity in the mid-19th century. Two eruptions, in 1967 and 1979, produced islands that survived for a few months before eroding beneath the surface. An eruption in 1995 produced a larger island that persisted, possibly until a new eruption in mid-October 2019 destroyed it and built a new short-lived island. Information was provided by the Ministry of Lands, Survey and Natural Resources of the Government of the Kingdom of Tonga, and from satellite information and news sources.
Review of eruptions during 1967-1995. The first reported 20th century eruption at this location was observed by sailors beginning on 12 December 1967 (CSLP 02-67); incandescent ejecta rose several hundred meters into the air and "steam and smoke" rose at least 1,000 m from the ocean surface. The eruption created a small island that was reported to be a few tens of meters high, and a few thousand meters in length and width. Eruptive activity appeared to end in early January 1968, and the island quickly eroded beneath the surface by the end of February (figure 6). When observed in April 1968 the island was gone, with only plumes of yellowish water in the area of the former island.
A large steam plume and ejecta were observed on 19 June 1979, along with a "growing area of tephra" around the site with a diameter of 16 km by the end of June (SEAN 04:06). Geologists visited the site in mid-July and at that time the island was about 300 m long, 120 m wide, and 15 m high, composed of tephra ranging in size from ash to large bombs (SEAN 04:07); ash emissions were still occurring from the E side of the island. It was determined that the new island was located about 1 km E of the 1967-68 island. By early October 1979 the island had nearly disappeared beneath the ocean surface.
A new eruption was first observed on 6 June 1995. A new island appeared above the waves as a growing lava dome on 12 June (BGVN 20:06). Numerous ash plumes rose hundreds of meters and dissipated downwind. By late June an elliptical dome, about 300 x 250 m in size and 50 m high, had stopped growing. The new island it formed was composed of hardened lava and not the tuff cones of earlier islands (figure 7) according to visitors to the island; pumice was not observed. An overflight of the area in December 2006 showed that an island was still present (figure 8), possibly from the June 1995 eruption. Sentinel-2 satellite imagery confirming the presence of Lateiki Island and discolored water was clearly recorded multiple times between 2015 and 2019. This suggests that the island created in 1995 could have lasted for more than 20 years (figure 9).
New eruption in October 2019. The Kingdom of Tonga reported a new eruption at Lateiki on 13 October 2019, first noted by a ship at 0800 on 14 October. NASA satellite imagery confirmed the eruption taking place that day (figure 10). The following morning a pilot from Real Tonga Airlines photographed the steam plume and reported a plume height of 4.6-5.2 km altitude (figure 11). The Wellington VAAC issued an aviation advisory report noting the pilot's observation of steam, but no ash plume was visible in satellite imagery. They issued a second report on 22 October of a similar steam plume reported by a pilot at 3.7 km altitude. The MODVOLC thermal alert system recorded three thermal alerts from Lateiki, one each on 18, 20, and 22 October 2019.
The first satellite image of the eruption on 15 October 2019 showed activity over a large area, much bigger than the preexisting island that was visible on 10 October (figure 12). Although the eruption produced a steam plume that drifted several tens of kilometers SW and strong incandescent activity, no ash plume was visible, similar to reports of dense steam with little ash during the 1968 and 1979 eruptions (figure 13). Strong incandescence and a dense steam plume were still present on 20 October (figure 14).
A clear satellite image on 30 October 2019 revealed an island estimated to be about 100 m wide and 400 m long, according to geologist Taaniela Kula of the Tonga Geological Service of the Ministry of Lands, Survey and Natural Resources as reported by a local news source (Matangitonga). There was no obvious fumarolic steam activity from the surface, but a plume of greenish brown seawater swirled away from the island towards the NE (figure 15). In a comparison of the location of the old Lateiki island with the new one in satellite images, it was clear that the new island was located as far as 250 m to the NW (figure 16) on 30 October. Over the course of the next few weeks, the island's size decreased significantly; by 19 November, it was perhaps one-quarter the size it had been at the end of October. Lateiki Island continued to diminish during December 2019 and January 2020, and by mid-month only traces of discolored sea water were visible beneath the waves over the eruption site (figure 17).
Geologic Background. Lateiki, previously known as Metis Shoal, is a submarine volcano midway between the islands of Kao and Late that has produced a series of ephemeral islands since the first confirmed activity in the mid-19th century. An island, perhaps not in eruption, was reported in 1781 and subsequently eroded away. During periods of inactivity following 20th-century eruptions, waves have been observed to break on rocky reefs or sandy banks with depths of 10 m or less. Dacitic tuff cones formed during the eruptions in 1967 and 1979 were soon eroded beneath the ocean surface. An eruption in 1995 produced an island with a diameter of 280 m and a height of 43 m following growth of a lava dome above the surface.
Information Contacts: Government of the Kingdom of Tonga, PO Box 5, Nuku'alofa, Tonga (URL: http://www.gov.to/ ); Royal New Zealand Air Force (URL: http://www.airforce.mil.nz/); NASA Worldview (URL: https://worldview.earthdata.nasa.gov/); Hawai'i Institute of Geophysics and Planetology (HIGP) - MODVOLC Thermal Alerts System, School of Ocean and Earth Science and Technology (SOEST), Univ. of Hawai'i, 2525 Correa Road, Honolulu, HI 96822, USA (URL: http://modis.higp.hawaii.edu/); Sentinel Hub Playground (URL: https://www.sentinel-hub.com/explore/sentinel-playground); Annamaria Luongo, Brussels, Belgium (Twitter: @annamaria_84, URL: https://twitter.com/annamaria_84 ); Taaniela Kula, Tonga Geological Service, Ministry of Lands, Survey and Natural Resources; Matangi Tonga Online (URL: https://matangitonga.to/2019/11/06/eruption-lateiki).
Masaya (Nicaragua) — February 2020 Cite this Report
Masaya
Nicaragua
11.9844°N, 86.1688°W; summit elev. 594 m
All times are local (unless otherwise noted)
Lava lake persists with lower temperatures during August 2019-January 2020
Masaya is a basaltic caldera located in Nicaragua and contains the Nindirí, San Pedro, San Juan, and Santiago craters. The currently active Santiago crater hosts a lava lake, which has remained active since December 2015 (BGVN 41:08). The primary source of information for this August 2019-January 2020 report comes from the Instituto Nicareguense de Estudios Territoriales (INETER) and satellite -based imagery and thermal data.
On 16 August, 13 September, and 11 November 2019, INETER took SO2 measurements by making a transect using a mobile DOAS spectrometer that sampled for gases downwind of the volcano. Average values during these months were 2,095 tons/day, 1,416 tons/day, and 1,037 tons/day, respectively. August had the highest SO2 measurements while those during September and November were more typical values.
Satellite imagery showed a constant thermal anomaly in the Santiago crater at the lava lake during August 2019 through January 2020 (figure 82). According to a news report, ash was expelled from Masaya on 15 October 2019, resulting in minor ashfall in Colonia 4 de Mayo (6 km NW). On 21 November thermal measurements were taken at the fumaroles and near the lava lake using a FLIR SC620 thermal camera (figure 83). The temperature measured 287°C, which was 53° cooler than the last time thermal temperatures were taken in May 2019.
MIROVA (Middle InfraRed Observation of Volcanic Activity) analysis of MODIS satellite data showed intermittent low-power thermal anomalies compared to the higher-power ones before May 2019 (figure 84). The thermal anomalies were detected during August 2019 through January 2020 after a brief hiatus from early may to mid-June.
Geologic Background. Masaya volcano in Nicaragua has erupted frequently since the time of the Spanish Conquistadors, when an active lava lake prompted attempts to extract the volcano's molten "gold" until it was found to be basalt rock upon cooling. It lies within the massive Pleistocene Las Sierras caldera and is itself a broad, 6 x 11 km basaltic caldera with steep-sided walls up to 300 m high. The caldera is filled on its NW end by more than a dozen vents that erupted along a circular, 4-km-diameter fracture system. The Nindirí and Masaya cones, the source of observed eruptions, were constructed at the southern end of the fracture system and contain multiple summit craters, including the currently active Santiago crater. A major basaltic Plinian tephra erupted from Masaya about 6,500 years ago. Recent lava flows cover much of the caldera floor and there is a lake at the far eastern end. A lava flow from the 1670 eruption overtopped the north caldera rim. Periods of long-term vigorous gas emission at roughly quarter-century intervals have caused health hazards and crop damage.
Information Contacts: Instituto Nicaragüense de Estudios Territoriales (INETER), Apartado Postal 2110, Managua, Nicaragua (URL: http://www.ineter.gob.ni/); MIROVA (Middle InfraRed Observation of Volcanic Activity), a collaborative project between the Universities of Turin and Florence (Italy) supported by the Centre for Volcanic Risk of the Italian Civil Protection Department (URL: http://www.mirovaweb.it/); Sentinel Hub Playground (URL: https://www.sentinel-hub.com/explore/sentinel-playground); La Jornada (URL: https://www.lajornadanet.com/, article at https://www.lajornadanet.com/index.php/2019/10/16/volcan-masaya-expulsa-cenizas/#.Xl6f8ahKjct).
Pacaya (Guatemala) — February 2020 Cite this Report
Pacaya
Guatemala
14.382°N, 90.601°W; summit elev. 2569 m
All times are local (unless otherwise noted)
Continuous explosions, small cone, and lava flows during August 2019-January 2020
Pacaya is a highly active basaltic volcano located in Guatemala with volcanism consisting of frequent lava flows and Strombolian explosions originating in the Mackenney crater. The previous report summarizes volcanism that included multiple lava flows, Strombolian activity, avalanches, and gas-and-steam emissions (BGVN 44:08), all of which continue through this reporting period of August 2019 to January 2020. The primary source of information comes from reports by the Instituto Nacional de Sismologia, Vulcanologia, Meteorologia e Hydrologia (INSIVUMEH) in Guatemala and various satellite data.
Strombolian explosions occurred consistently throughout this reporting period. During the month of August 2019, explosions ejected material up to 30 m above the Mackenney crater. These explosions deposited material that contributed to the formation of a small cone on the NW flank of the Mackenney crater. White and occasionally blue gas-and-steam plumes rose up to 600 m above the crater drifting S and W. Multiple incandescent lava flows were observed traveling down the N and NW flanks, measuring up to 400 m long. Small to moderate avalanches were generated at the front of the lava flows, including incandescent blocks that measured up to 1 m in diameter. Occasionally incandescence was observed at night from the Mackenney crater.
In September 2019 seismicity was elevated compared to the previous month, registering a maximum of 8,000 RSAM (Realtime Seismic Amplitude Measurement) units. White and occasionally blue gas-and-steam plumes that rose up to 1 km above the crater drifted generally S as far as 3 km from the crater. Strombolian explosions continued, ejecting material up to 100 m above the crater rim. At night and during the early morning, crater incandescence was observed. Incandescent lava flows traveled as much as 600 m down the N and NW flanks toward the Cerro Chino crater (figure 116). On 21 September two lava flows descended the SW flank. Constant avalanches with incandescent blocks measuring 1 m in diameter occurred from the front of many of these lava flows.
Weak explosions continued through October 2019, ejecting material up to 75 m above the crater and building a small cone within the crater. White and occasionally blue gas-and-steam plumes rose 400-800 m above the crater, drifting W and NW and extending up to 4 km from the crater during the week of 26 October-1 November. Lava flows measuring up to 250 m long, originating from the Mackenney crater were descending the N and NW flanks (figure 117). Avalanches carrying large blocks 1 m in diameter commonly occurred at the front of these lava flows.
Continuing Strombolian explosions in November 2019 ejected material 15-75 m above the crater, which then contributed to the formation of the new cone. White and occasionally blue gas-and-steam plumes rose 100-600 m above the crater drifting in different directions and extending up to 2 km. Multiple lava flows from the Mackenney crater moving down all sides of the volcano continued, measuring 50-700 m long. Avalanches were generated at the front of the lava flows, often moving blocks as large as 1 m in diameter. The number of lava flows decreased during 2-8 November and the following week of 9-15 November no lava flows were observed, according to INSIVUMEH. During the week of 16-22 November, a small collapse occurred in the Mackenney crater and explosive activity increased during 16, 18, and 20 November, reaching RSAM units of 4,500. At night and early morning in late November crater incandescence was visible. On 24 November two lava flows descended the NW flank toward the Cerro Chino crater, measuring 100 m long.
During December 2019, much of the activity remained the same, with Strombolian explosions originating from two emission points in the Mackenney crater ejecting material 75-100 m above the crater; white and occasionally blue gas-and-steam plumes to 100-300 m above the crater drifted up to 1.5 km downwind to the S and SW. Lava flows descended the S and SW flanks reaching 250-600 m long (figure 118). On 29 December seismicity increased, reaching 5,000 RSAM units.
Consistent Strombolian activity continued into January 2020 ejecting material 25-100 m above the crater. These explosions deposited material inside the Mackenney crater, contributing to the formation of a small cone. White and occasionally blue fumaroles consisting of mostly water vapor were observed drifting in different directions. At night, summit incandescence and lava flows were visible descending the N, NW, and S flanks with the flow on the NW flank traveling toward the Cerro Chino crater.
During August 2019 through January 2020, multiple lava flows and bright thermal anomalies (yellow-orange) within the crater were seen in Sentinel-2 thermal satellite imagery (figures 119 and 120). In addition, constant strong thermal anomalies were detected by the MIROVA (Middle InfraRed Observation of Volcanic Activity) system during 21 February 2019 through January 2020 within 5 km of the summit (figure 121). A slight decrease in energy was seen from May to June and August to September. Energy increased again between November and December. According to the MODVOLC algorithm, 37 thermal alerts were recorded during August 2019 through January 2020.
Geologic Background. Eruptions from Pacaya are frequently visible from Guatemala City, the nation's capital. This complex basaltic volcano was constructed just outside the southern topographic rim of the 14 x 16 km Pleistocene Amatitlán caldera. A cluster of dacitic lava domes occupies the southern caldera floor. The post-caldera Pacaya massif includes the older Pacaya Viejo and Cerro Grande stratovolcanoes and the currently active Mackenney stratovolcano. Collapse of Pacaya Viejo between 600 and 1,500 years ago produced a debris-avalanche deposit that extends 25 km onto the Pacific coastal plain and left an arcuate scarp inside which the modern Pacaya volcano (Mackenney cone) grew. The NW-flank Cerro Chino crater was last active in the 19th century. During the past several decades, activity has consisted of frequent Strombolian eruptions with intermittent lava flow extrusion that has partially filled in the caldera moat and covered the flanks of Mackenney cone, punctuated by occasional larger explosive eruptions that partially destroy the summit.
Information Contacts: Instituto Nacional de Sismologia, Vulcanologia, Meteorologia e Hydrologia (INSIVUMEH), Unit of Volcanology, Geologic Department of Investigation and Services, 7a Av. 14-57, Zona 13, Guatemala City, Guatemala (URL: http://www.insivumeh.gob.gt/); MIROVA (Middle InfraRed Observation of Volcanic Activity), a collaborative project between the Universities of Turin and Florence (Italy) supported by the Centre for Volcanic Risk of the Italian Civil Protection Department (URL: http://www.mirovaweb.it/); Hawai'i Institute of Geophysics and Planetology (HIGP) - MODVOLC Thermal Alerts System, School of Ocean and Earth Science and Technology (SOEST), Univ. of Hawai'i, 2525 Correa Road, Honolulu, HI 96822, USA (URL: http://modis.higp.hawaii.edu/); Sentinel Hub Playground (URL: https://www.sentinel-hub.com/explore/sentinel-playground).
Reventador (Ecuador) — February 2020 Cite this Report
Reventador
Ecuador
0.077°S, 77.656°W; summit elev. 3562 m
All times are local (unless otherwise noted)
Nearly daily ash emissions and frequent incandescent block avalanches August 2019-January 2020
Reventador is an andesitic stratovolcano located in the Cordillera Real, Ecuador. Historical eruptions date back to the 16th century, consisting of lava flows and explosive events. The current eruptive activity has been ongoing since 2008 with previous activity including daily explosions with ash emissions, and incandescent block avalanches (BGVN 44:08). This report covers volcanism from August 2019 through January 2020 using information primarily from the Instituto Geofísico (IG-EPN), the Washington Volcano Ash Advisory Center (VAAC), and various infrared satellite data.
During August 2019 to January 2020, IG-EPN reported almost daily explosive eruptions and ash plumes. September had the highest average of explosive eruptions while January 2020 had the lowest (table 11). Ash plumes rose between a maximum of 1.2 to 2.5 km above the crater during this reporting period with the highest plume height recorded in December. The largest amount of SO2 gases produced was during the month of October with 502 tons/day. Frequently at night during this reporting period, crater incandescence was observed and was occasionally accompanied by incandescent block avalanches traveling as far as 900 m downslope from the summit of the volcano.
Table 11. Monthly summary of eruptive events recorded at Reventador from August 2019 through January 2020. Data courtesy of IG-EPN (August to January 2020 daily reports).
| Month |
Average Number of Explosions |
Max plume height above the crater |
Max SO2 |
| Aug 2019 |
26 |
1.6 km |
-- |
| Sep 2019 |
32 |
1.7 km |
428 tons/day |
| Oct 2019 |
29 |
1.3 km |
502 tons/day |
| Nov 2019 |
25 |
1.2 km |
432 tons/day |
| Dec 2019 |
25 |
2.5 km |
331 tons/day |
| Jan 2020 |
12 |
1.7 km |
-- |
During the month of August 2019, between 11 and 45 explosions were recorded every day, frequently accompanied by gas-and-steam and ash emissions (figure 119); plumes rose more than 1 km above the crater on nine days. On 20 August the ash plume rose to a maximum 1.6 km above the crater. Summit incandescence was seen at night beginning on 10 August, continuing frequently throughout the rest of the reporting period. Incandescent block avalanches were reported intermittently beginning that same night through 26 January 2020, ejecting material between 300 to 900 m below the summit and moving on all sides of the volcano.
Throughout most of September 2019 gas-and-steam and ash emissions were observed almost daily, with plumes rising more than 1 km above the crater on 15 days, according to IG-EPN. On 30 September, the ash plume rose to a high of 1.7 km above the crater. Each day, between 18 and 72 explosions were reported, with the latter occurring on 19 September. At night, crater incandescence was commonly observed, sometimes accompanied by incandescent material rolling down every flank.
Elevated seismicity was reported during 8-15 October 2019 and almost daily gas-and-steam and ash emissions were present, ranging up to 1.3 km above the summit. Every day during this month, between 13 and 54 explosions were documented and crater incandescence was commonly observed at night. During November 2019, gas-and-steam and ash emissions rose greater than 1 km above the crater except for 10 days; no emissions were reported on 29 November. Daily explosions ranged up to 42, occasionally accompanied by crater incandescence and incandescent ejecta.
Washington VAAC notices were issued almost daily during December 2019, reporting ash plumes between 4.6 and 6 km altitude throughout the month and drifting in multiple directions. Each day produced 5-52 explosions, many of which were accompanied by incandescent blocks rolling down all sides of the volcano up to 900 m below the summit. IG-EPN reported on 11 December that a gas-and-steam and ash emission column rose to a maximum height of 2.5 km above the crater, drifting SW as was observed by satellite images and reported by the Washington VAAC.
Volcanism in January 2020 was relatively low compared to the other months of this reporting period. Explosions continued on a nearly daily basis early in the month, ranging from 20 to 51. During 5-7 January incandescent material ejected from the summit vent moved as block avalanches downslope and multiple gas-and-steam and ash plumes were produced (figures 120, 121, and 122). After 9 January the number of explosions decreased to 0-16 per day. Ash plumes rose between 4.6 and 5.8 km altitude, according to the Washington VAAC.
MIROVA (Middle InfraRed Observation of Volcanic Activity) analysis of MODIS satellite data showed frequent and strong thermal anomalies within 5 km of the summit during 21 February 2019 through January 2020 (figure 123). In comparison, the MODVOLC algorithm reported 24 thermal alerts between August 2019 and January 2020 near the summit. Some thermal anomalies can be seen in Sentinel-2 thermal satellite imagery throughout this reporting period, even with the presence of meteorological clouds (figure 124). These thermal anomalies were accompanied by persistent gas-and-steam and ash plumes.
Geologic Background. Volcán El Reventador is the most frequently active of a chain of Ecuadorian volcanoes in the Cordillera Real, well east of the principal volcanic axis. The forested, dominantly andesitic stratovolcano has 4-km-wide avalanche scarp open to the E formed by edifice collapse. A young, unvegetated, cone rises from the amphitheater floor to a height comparable to the rim. It has been the source of numerous lava flows as well as explosive eruptions visible from Quito, about 90 km ESE. Frequent lahars in this region of heavy rainfall have left extensive deposits on the scarp slope. The largest recorded eruption took place in 2002, producing a 17-km-high eruption column, pyroclastic flows that traveled up to 8 km, and lava flows from summit and flank vents.
Information Contacts: Instituto Geofísico, Escuela Politécnica Nacional (IG-EPN), Casilla 17-01-2759, Quito, Ecuador (URL: http://www.igepn.edu.ec/); Washington Volcanic Ash Advisory Center (VAAC), Satellite Analysis Branch (SAB), NOAA/NESDIS OSPO, NOAA Science Center Room 401, 5200 Auth Rd, Camp Springs, MD 20746, USA (URL: www.ospo.noaa.gov/Products/atmosphere/vaac, archive at: http://www.ssd.noaa.gov/VAAC/archive.html); MIROVA (Middle InfraRed Observation of Volcanic Activity), a collaborative project between the Universities of Turin and Florence (Italy) supported by the Centre for Volcanic Risk of the Italian Civil Protection Department (URL: http://www.mirovaweb.it/); Hawai'i Institute of Geophysics and Planetology (HIGP) - MODVOLC Thermal Alerts System, School of Ocean and Earth Science and Technology (SOEST), Univ. of Hawai'i, 2525 Correa Road, Honolulu, HI 96822, USA (URL: http://modis.higp.hawaii.edu/); Sentinel Hub Playground (URL: https://www.sentinel-hub.com/explore/sentinel-playground); Radio La Voz del Santuario (URL: https://www.facebook.com/Radio-La-Voz-del-Santuario-126394484061111/, posted at: https://www.facebook.com/permalink.php?story_fbid=2630739100293291&id=126394484061111); Martin Rietze, Taubenstr. 1, D-82223 Eichenau, Germany (URL: https://mrietze.com/, https://www.youtube.com/channel/UC5LzAA_nyNWEUfpcUFOCpJw/videos).
Sangeang Api (Indonesia) — February 2020 Cite this Report
Sangeang Api
Indonesia
8.2°S, 119.07°E; summit elev. 1912 m
All times are local (unless otherwise noted)
Ash emissions and lava flow extrusion continue during May 2019 through January 2020
Sangeang Api is located in the eastern Sunda-Banda Arc in Indonesia, forming a small island in the Flores Strait, north of the eastern side of West Nusa Tenggara. It has been frequently active in recent times with documented eruptions spanning back to 1512. The edifice has two peaks – the active Doro Api cone and the inactive Doro Mantori within an older caldera (figure 37). The current activity is focused at the summit of the cone within a horseshoe-shaped crater at the summit of Doro Api. This bulletin summarizes activity during May 2019 through January 2020 and is based on Darwin Volcanic Ash Advisory Center (VAAC) reports, Pusat Vulkanologi dan Mitigasi Bencana Geologi (PVMBG, or CVGHM) MAGMA Indonesia Volcano Observatory Notice for Aviation (VONA) reports, and various satellite data.
Thermal anomalies were visible in Sentinel-2 satellite thermal images on 4 and 5 May with some ash and gas emission visible; bright pixels from the summit of the active cone extended to the SE towards the end of the month, indicating an active lava flow (figure 38). Multiple small emissions with increasing ash content reached 1.2-2.1 km altitude on 17 June. The emissions drifted W and WNW, and a thermal anomaly was also visible. On the 27th ash plumes rose to 2.1 km and drifted NW and the thermal anomaly persisted. One ash plume reached 2.4 km and drifted NW on the 29th, and steam emissions were ongoing. Satellite images showed two active lava flows in June, an upper and a lower flow, with several lobes descending the same channel and with lateral levees visible in satellite imagery (figure 39). The lava extrusion appeared to have ceased by late June with lower temperatures detected in Sentinel-2 thermal data.
During 4-5 July the Darwin VAAC reported ash plumes reaching 2.1-2.3 km altitude and drifting SW and W. Activity continued during 6-9 July with plumes up to 4.6 km drifting N, NW, and SW. Thermal anomalies were noted on the 4th and 8th. Plumes rose to 2.1-3 km during 10-16th, and to a maximum altitude of 4.6 km during 17-18 and 20-22. Similar activity was reported during 24-30 July with plumes reaching 2.4-3 km and dispersing NW, W, and SW. The upper lava flow had increased in length since 15 June (see figure 39).
During 31 July through 3 September ash plumes continued to reach 2.4-3 km altitude and disperse in multiple directions. Similar activity was reported throughout September. Thermal anomalies also persisted through July-September, with evidence of hot avalanches in Sentinel-2 thermal satellite imagery on 23 August, and 9, 12, 22, and 27 September. Thermal anomalies suggested hot avalanches or lava flows during October (figure 40). During 26-28 October short-lived ash plumes were reported to 2.1-2.7 km above sea level and dissipated to the NW, WNW, and W. Short-lived explosions produced ash plumes up to 2.7-3.5 km altitude were noted during 30-31 October and 3-4 November 2019.
Discrete explosions produced ash plumes up to 2.7-3.5 km altitude during 3-4 November, and during the 6-12th the Darwin VAAC reported short-lived ash emissions reaching 3 km altitude. Thermal anomalies were visible in satellite images during 6-8 November. A VONA was released on 14 November for an ash plume that reached about 2 km altitude and dispersed to the west. During 14-19 November the Darwin VAAC reported short-lived ash plumes reaching 2.4 km that drifted NW and W. Additional ash plumes were observed reaching a maximum altitude of 2.4 km during 20-26 November. Thermal anomalies were detected during the 18-19th, and on the 27th.
Ash plumes were recorded reaching 2.4 km during 4-5, 7-9, 11-13, and 17-19 December, and up to 3 km during 25-28 December. There were no reports of activity in early to mid-January 2020 until the Darwin VAAC reported ash reaching 3 km on 23 January. A webcam image on 15 January showed a gas plume originating from the summit. Several fires were visible on the flanks during May 2019 through January 2020, and this is seen in the MIROVA log thermal plot with the thermal anomalies greater than 5 km away from the crater (figure 41).
Geologic Background. Sangeang Api volcano, one of the most active in the Lesser Sunda Islands, forms a small 13-km-wide island off the NE coast of Sumbawa Island. Two large trachybasaltic-to-tranchyandesitic volcanic cones, Doro Api and Doro Mantoi, were constructed in the center and on the eastern rim, respectively, of an older, largely obscured caldera. Flank vents occur on the south side of Doro Mantoi and near the northern coast. Intermittent eruptions have been recorded since 1512, most of them during in the 20th century.
Information Contacts: Pusat Vulkanologi dan Mitigasi Bencana Geologi (PVMBG, also known as Indonesian Center for Volcanology and Geological Hazard Mitigation, CVGHM), Jalan Diponegoro 57, Bandung 40122, Indonesia (URL: http://www.vsi.esdm.go.id/); MIROVA (Middle InfraRed Observation of Volcanic Activity), a collaborative project between the Universities of Turin and Florence (Italy) supported by the Centre for Volcanic Risk of the Italian Civil Protection Department (URL: http://www.mirovaweb.it/); Sentinel Hub Playground (URL: https://www.sentinel-hub.com/explore/sentinel-playground); Planet Labs, Inc. (URL: https://www.planet.com/).
Shishaldin (United States) — February 2020 Cite this Report
Shishaldin
United States
54.756°N, 163.97°W; summit elev. 2857 m
All times are local (unless otherwise noted)
Multiple lava flows, pyroclastic flows, lahars, and ashfall events during October 2019 through January 2020
Shishaldin is located near the center of Unimak Island in Alaska and has been frequently active in recent times. Activity includes steam plumes, ash plumes, lava flows, lava fountaining, pyroclastic flows, and lahars. The current eruption phase began on 23 July 2019 and through September included lava fountaining, explosions, and a lava lake in the summit crater. Continuing activity during October 2019 through January 2020 is described in this report based largely on Alaska Volcano Observatory (AVO) reports, photographs, and satellite data.
Minor steam emissions were observed on 30 September 2019, but no activity was observed through the following week. Activity at that time was slightly above background levels with the Volcano Alert Level at Advisory and the Aviation Color Code at Yellow (figure 17). In the first few days of October weak tremor continued but no eruptive activity was observed. Weakly elevated temperatures were noted in clear satellite images during 4-9 October and weak tremor continued. Elevated temperatures were recorded again on the 14th with low-level tremor.
New lava extrusion was observed on 13 October, prompting AVO to raise the Aviation Color Code to Orange and the Volcano Alert Level to Watch. Elevated surface temperatures were detected by satellite during the 13th and 17-20th, and a steam plume was observed on the 19th. A change from small explosions to continuous tremor that morning suggested a change in eruptive behavior. Low-level Strombolian activity was observed during 21-22 October, accompanied by a persistent steam plume. Lava had filled the crater by the 23rd and began to overflow at two places. One lava flow to the north reached a distance of 200 m on the 24th and melted snow to form a 2.9-km-long lahar down the N flank. The second smaller lava flow resulted in a 1-km-long lahar down the NE flank. Additional snowmelt was produced by spatter accumulating around the crater rim. By 25 October the northern flow reached 800 m, there was minor explosive activity with periodic lava fountaining, and lahar deposits reached 3 km to the NW with shorter lahars to the N and E (figure 18). Trace amounts of ashfall extended at least 8.5 km SE. There was a pause in activity on the 29th, but beginning at 1839 on the 31st seismic and infrasound monitoring detected multiple small explosions.
Elevated activity continued through November with multiple lava flows on the northern flanks (figure 19). By 1 November the two lava flows had stalled after extending 1.8 km down the NW flank. Lahars had reached at least 4 km NW and trace amounts of ash were deposited on the north flank. Elevated seismicity on 2 November indicated that lava was likely flowing beyond the summit crater, supported by a local pilot observation. The next day an active lava flow moved 400 m down the NW flank while a smaller flow was active SE of the summit. Minor explosive activity and/or lava fountaining at the summit was indicated by incandescence during the night. Small explosions were recorded in seismic and infrasound data. On 5 November the longer lava flow had developed two lobes, reaching 1 km in length. The lahars had also increased in length, reaching 2 km on the N and S flanks. Incandescence continued and hot spatter was accumulating around the summit vent. Activity continued, other than a 10-hour pause on 4-5 November, and another pause on the 7th. The lava flow length had reached 1.3 km on the 8th and lahar deposits reached 5 km.
After variable levels of activity for a few days, there was a significant increase on 10-11 November with lava fountaining through the evening and night. This was accompanied by minor to moderate ash emissions up to around 3.7 km altitude and drifting northwards, and a significant increase in seismicity. Activity decreased again during the 11-12th while minor steam and ash emissions continued. On 14 November minor ash plumes were visible on the flanks, likely caused by the collapse of accumulated spatter. By 15 November a large network of debris flows consisting of snowmelt and fresh deposits extended 5.5 km NE and the collapse of spatter mounds continued. Ashfall from ash plumes reaching as high as 3.7 km altitude produced thin deposits to the NE, S, and SE. Activity paused during the 17-18th and resumed again on the 19th; intermittent clear views showed either a lava flow or lahar descending the SE flank. Activity sharply declined at 0340 on the 20th.
Seismicity began increasing again on 24 November and small explosions were detected on the 23rd. A small collapse of spatter that had accumulated at the summit occurred at 2330 on the 24th, producing a pyroclastic flow that reached 3 km in length down the NW flank. A new lava flow had also reached several hundred meters down the same flank. Variable but elevated activity continued over 27 November into early December, with a 1.5-km-long lava flow observed in satellite imagery acquired on the 1st. On 5 December minor steam or ash emissions were observed at the summit and on the north flank, and Strombolian explosions were detected. Activity from that day produced fresh ash deposits on the northern side of the volcano and a new lava flow extended 1.4 km down the NW flank. Three small explosions were detected on the 11th.
At 0710 on 12 December a 3-minute-long explosion produced an ash plume up to 6-7.6 km altitude that dispersed predominantly towards the W to NW and three lightning strokes were detected. Ash samples were collected on the SE flank by AVO field crews on 20 December and analysis showed variable crystal contents in a glassy matrix (figure 20). A new ash deposit was emplaced out to 10 km SE, and a 3.5-km-long pyroclastic flow had been emplaced to the north, containing blocks as large as 3 m in diameter. The pyroclastic flow was likely a result from collapse of the summit spatter cone and lava flows. A new narrow lava flow had reached 3 km to the NW and lahars continued out to the northern coast of Unimak island (figure 21). The incandescent lava flow was visible from Cold Bay on the evening of the 12th and a thick steam plume continued through the next day.
A new lava flow was reported by a pilot on the night of 16 December. Thermal satellite data showed that this flow reached 2 km to the NW. High-resolution radar satellite images over the 15-17th showed that the lava flow had advanced out to 2.5 km and had developed levees along the margins (figure 22). The lava channel was 5-15 m wide and was originating from a crater at the base of the summit scoria cone, which had been rebuilt since the collapse the previous week. Minor ash emissions drifted to the south on the 19tt and 20th (figure 23).
On 21 December a new lava flow commenced, traveling down the northern slope and accompanied by minor ash emissions. Continued lava extrusion was indicated by thermal data on the 25th and two lava flows reaching 1.5 km and 100 m were observed in satellite data on the 26th, as well as ash deposits on the upper flanks (figure 24). Weak explosions were detected by the regional infrasound network the following day. A satellite image acquired on the 30th showed a thick steam plume obscuring the summit and snow cover on the flanks indicating a pause in ash emissions.
In early January satellite data indicated slow lava extrusion or cooling lava flows (or both) near the summit. On the morning of the 3rd an ash plume rose to 6-7 km altitude and drifted 120 km E to SE, producing minor amounts of volcanic lightning. Elevated surface temperatures the previous week indicated continued lava extrusion. A satellite image acquired on 3 January showed lava flows extending to 1.6 km NW, pyroclastic flows moving 2.6 km down the western and southern flanks, and ashfall on the flanks (figure 25).
On 7 January the most sustained explosive episode for this eruption period occurred. An ash plume rose to 7 km altitude at 0500 and drifted east to northeast then intensified reaching 7.6 km altitude with increased ash content, prompting an increase of the Aviation Color Code to Red and Volcano Alert Level to Warning. The plume traveled over 200 km to the E to NE (figure 26). Lava flows were produced on the northern flanks and trace amounts of ashfall was reported in communities to the NE, resulting in several flight cancellations. Thermal satellite images showed active lava flows extruding from the summit vent (figure 27). Seismicity significantly decreased around 1200 and the alert levels were lowered to Orange and Watch that evening. Through the following week no notable eruptive activity occurred. An intermittent steam plume was observed in webcam views.
Eruptive activity resumed on 18 January with lava flows traveling 2 km down the NE flank accompanied by a weak plume with possible ash content dispersing to the SW (figure 28). A steam plume was produced at the front of the lava flow and lahar deposits continued to the north (figures 29 to 32). Activity intensified from 0030 on the 19th, generating a more ash-rich plume that extended over 150 km E and SE and reached up to 6 km altitude; activity increased again at around 1500 with ash emissions reaching 9 km altitude. AVO increased the alert levels to Red/Warning. Lava flows traveled down the NE and N flanks producing meltwater lahars, accompanied by elevated seismicity (figures 33). Activity continued through the day and trace amounts of ashfall were reported in False Pass (figure 34). Activity declined to small explosions over the next few days and the alert levels were lowered to Orange/watch shortly after midnight. The next morning weak steam emissions were observed at the summit and there was a thin ash deposit across the entire area. Satellite data acquired on 23 January showed pyroclastic flow deposits and cooling lava flows on the northern flank, and meltwater reaching the northern coast (figure 35).
Activity remained low in late January with some ash resuspension (due to winds) near the summit and continued elevated temperatures. Seismicity remained above background levels. Infrasound data indicated minor explosive activity during 22-23 January and small steam plumes were visible on 22, 23, and 26 January. MIROVA thermal data showed the rapid reduction in activity following activity in late-January (figure 36).
Geologic Background. The symmetrical glacier-covered Shishaldin in the Aleutian Islands is the westernmost of three large stratovolcanoes in the eastern half of Unimak Island. The Aleuts named the volcano Sisquk, meaning "mountain which points the way when I am lost." Constructed atop an older glacially dissected edifice, it is largely basaltic in composition. Remnants of an older edifice are exposed on the W and NE sides at 1,500-1,800 m elevation. There are over two dozen pyroclastic cones on its NW flank, which is covered by massive aa lava flows. Frequent explosive activity, primarily consisting of Strombolian ash eruptions from the small summit crater, but sometimes producing lava flows, has been recorded since the 18th century. A steam plume often rises from the summit crater.
Information Contacts: Alaska Volcano Observatory (AVO), a cooperative program of a) U.S. Geological Survey, 4200 University Drive, Anchorage, AK 99508-4667 USA (URL: https://avo.alaska.edu/), b) Geophysical Institute, University of Alaska, PO Box 757320, Fairbanks, AK 99775-7320, USA, and c) Alaska Division of Geological & Geophysical Surveys, 794 University Ave., Suite 200, Fairbanks, AK 99709, USA (URL: http://dggs.alaska.gov/); Simon Plank, German Aerospace Center (DLR) German Remote Sensing Data Center, Geo-Risks and Civil Security, Oberpfaffenhofen, 82234 Weßling (URL: https://www.dlr.de/eoc/en/desktopdefault.aspx/tabid-5242/8788_read-28554/sortby-lastname/); MIROVA (Middle InfraRed Observation of Volcanic Activity), a collaborative project between the Universities of Turin and Florence (Italy) supported by the Centre for Volcanic Risk of the Italian Civil Protection Department (URL: http://www.mirovaweb.it/); Planet Labs, Inc. (URL: https://www.planet.com/); Sentinel Hub Playground (URL: https://www.sentinel-hub.com/explore/sentinel-playground).
Whakaari/White Island (New Zealand) — February 2020 Cite this Report
Whakaari/White Island
New Zealand
37.52°S, 177.18°E; summit elev. 294 m
All times are local (unless otherwise noted)
Explosion producing an ash plume and pyroclastic surge resulted in fatalities and injuries on 9 December 2019
Whakaari/White Island has been New Zealand's most active volcano since 1976. Located 48 km offshore, the volcano is a popular tourism destination with tours leaving the town of Whakatane with approximately 17,500 people visiting the island in 2018. Ten lives were lost in 1914 when part of the crater wall collapsed, impacting sulfur miners. More recently, a brief explosion at 1411 on 9 December 2019 produced an ash plume and pyroclastic surge that impacted the entire crater area. With 47 people on the island at the time, the death toll stood at 21 on 3 February 2020. At that time more patients were still in hospitals within New Zealand or their home countries.
The island is the summit of a large underwater volcano, with around 70% of the edifice below the ocean and rising around 300 m above sea level (figure 70). A broad crater opens to the ocean to the SE, with steep crater walls and an active Main Crater area to the NW rear of the crater floor (figure 71). Although the island is privately owned, GeoNet continuously monitors activity both remotely and with visits to the volcano. This Bulletin covers activity from May 2017 through December 2019 and is based on reports by GeoNet, the New Zealand Civil Defence Bay of Plenty Emergency Management Group, satellite data, and footage taken by visitors to the island.
Nearly continuous activity occurred from December 1975 to September 2000, including the formation of collapse and explosion craters producing ash emissions and explosions that impacted all of the Main Crater area. More recently, it has been in a state of elevated unrest since 2011. Renewed activity commenced with an explosive eruption on 5 August 2012 that was followed by the extrusion of a lava dome and ongoing phreatic explosions and minor ash emissions through March 2013. An ash cone was seen on 4 March 2013, and over the next few months the crater lake reformed. Further significant explosions took place on 20 August and 4, 8, and 11 October 2013. A landslide occurred in November 2015 with material descending into the lake. More recent activity on 27 April 2016 produced a short-lived eruption that deposited material across the crater floor and walls. A short period of ash emission later that year, on 13 September 2016, originated from a vent on the recent lava dome. Explosive eruptions occur with little to no warning.
Since 19 September 2016 the Volcanic Alert Level (VAL) was set to 1 (minor volcanic unrest) (figure 72). During early 2017 background activity in the crater continued, including active fumaroles emitting volcanic gases and steam from the active geothermal system, boiling springs, volcanic tremor, and deformation. By April 2017 a new crater lake had begun to form, the first since the April 2016 explosion when the lake floor was excavated an additional 13 m. Before this, there were areas where water ponded in depressions within the Main Crater but no stable lake.
Activity from mid-2017 through 2018. In July-August 2017 GeoNet scientists carried out the first fieldwork at the crater area since late 2015 to sample the new crater lake and gas emissions. The crater lake was significantly cooler than the past lakes at 20°C, compared to 30-70°C that was typical previously. Chemical analysis of water samples collected in July showed the lowest concentrations of most "volcanic elements" in the lake for the past 10-15 years due to the reduced volcanic gases entering the lake. The acidity remained similar to that of battery acid. Gas emissions from the 2012 dome were 114°C, which were over 450°C in 2012 and 330°C in 2016. Fumarole 0 also had a reduced temperature of 152°C, reduced from over 190°C in late 2016 (figure 73). The observations and measurements indicated a decline in unrest. Further visits in December 2017 noted relatively low-level unrest including 149°C gas emissions from fumarole 0, a small crater lake, and loud gas vents nearby (figures 74 and 75). By 27 November the lake had risen to 10 m below overflow. Analysis of water samples led to an estimate of 75% of the lake water resulting from condensing steam vents below the lake and the rest from rainfall.
Routine fieldwork by GeoNet monitoring teams in early March 2018 showed continued low-level unrest and no apparent changes after a recent nearby earthquake swarm. The most notable change was the increase in the crater lake size, likely a response from recent high rainfall (figure 76). The water remained a relatively cool 27°C. Temperatures continued to decline at the 2012 dome vent (128°C) and Fumarole 0 (138°C). Spring and stream flow had also declined. Deformation was observed towards the Active Crater of 2-5 mm per month and seismicity remained low. The increase in lake level drowned gas vents along the lake shore resulting in geyser-like activity (figure 77). GeoNet warned that a new eruption could occur at any time, often without any useful warning.
In mid-April 2018 visitors reported loud sounds from the crater area as a result of the rising lake level drowning vents on the 2012 dome (in the western side of the crater) and resulting in steam-driven activity. There was no notable change in volcanic activity. The sounds stopped by July 2018 as the geothermal system adjusted to the rising water, up to 17 m below overfill and filling at a rate of about 2,000 m3 per day, rising towards more active vents (figure 78). A gas monitoring flight taken on 12 September showed a steaming lake surrounded by active fumaroles along the crater wall (figure 79).
Activity during April to early December 2019. A GeoNet volcanic alert bulletin in April 2019 reported that steady low-level unrest continued. The level of the lake had been declining since late January and was back down to 13 m below overflow (figure 80). The water temperature had increased to over 60°C due to the fumarole activity below the lake. Fumarole 0 remained steady at around 120-130°C. During May-June a seismic swarm was reported offshore, unrelated to volcanic activity but increasing the risk of landslides within the crater due to the shallow locations.
On 26 June the VAL was raised to level 2 (moderate to heightened volcanic unrest) due to increased SO2 flux rising to historically high levels. An overflight that day detected 1,886 tons/day, nearly three times the previous values of May 2019, the highest recorded value since 2013, and the second highest since measurements began in 2003. The VAL was subsequently lowered on 1 July due to a reduction in detected SO2 emissions of 880 tons/day on 28 June and 693 tons/day on 29 June.
GeoNet reported on 26 September that there was an increase in steam-driven activity within the active crater over the past three weeks. This included small geyser-like explosions of mud and steam with material reaching about 10 m above the lake. This was not attributed to an increase in volcanic activity, but to the crater lake level rising since early August.
On 30 October an increase in background activity was reported. An increasing trend in SO2 gas emissions and volcanic tremor had been ongoing for several months and had reached the highest levels since 2016. This indicated to GeoNet that Whakaari/White Island might be entering a period where eruptive activity was more likely. There were no significant changes in other monitoring parameters at this time and fumarole activity continued (figure 81).
On 18 November the VAL was raised to level 2 and the Aviation Colour Code was raised to Yellow due to further increase in SO2 emissions and volcanic tremor. Other monitoring parameters showed no significant changes. On 25 November GeoNet reported that moderate volcanic unrest continued but with no new changes. Gas emissions remained high and gas-driven ejecta regularly jetting material a few meters into the air above fumaroles in the crater lake (figure 82).
GeoNet reported on 3 December that moderate volcanic unrest continued, with increased but variable explosive gas and steam-driven jetting, with stronger events ejecting mud 20-30 m into the air and depositing mud around the vent area. Gas emissions and volcanic tremor remained elevated and occasional gas smells were reported on the North Island mainland depending on wind direction. The crater lake water level remained unchanged. Monitoring parameters were similar to those observed in 2011-2016 and remained within the expected range for moderate volcanic unrest.
Eruption on 9 December 2019. A short-lived eruption occurred at 1411 on 9 December 2019, generating a steam-and-ash plume to 3.6 km and covering the entire crater floor area with ash. Video taken by tourists on a nearby boat showed an eruption plume composed of a white steam-rich portion, and a black ash-rich ejecta (figure 83). A pyroclastic surge moved laterally across the crater floor and up the inner crater walls. Photos taken soon after the eruption showed sulfur-rich deposits across the crater floor and crater walls, and a helicopter that had been damaged and blown off the landing pad (figure 84). This activity caused the VAL to be raised to 4 (moderate volcanic eruption) and the Aviation Colour Code being raised to Orange.
A steam plume was visible in a webcam image taken at 1430 from Whakatane, 21 minutes after the explosion (figure 85). Subsequent explosions occurred at 1630 and 1749. Search-and-Rescue teams reached the island after the eruption and noted a very strong sulfur smell that was experienced through respirators. They experienced severe stinging of any exposed skin that came in contact with the gas, and were left with sensitive skin and eyes, and sore throats. Later in the afternoon the gas-and-steam plume continued and a sediment plume was dispersing from the island (figure 86). The VAL was lowered to level 3 (minor volcanic eruption) at 1625 that day; the Aviation Colour Code remained at Orange.
During or immediately after the eruption an unstable portion of the SW inner crater wall, composed of 1914 landslide material, collapsed and was identified in satellite radar imagery acquired after the eruption. The material slid into the crater lake area and left a 12-m-high scarp. Movement in this area continued into early January.
Activity from late 2019 into early 2020. A significant increase in volcanic tremor began at around 0400 on 11 December (figure 87). The increase was accompanied by vigorous steaming and ejections of mud in several of the new vents. By the afternoon the tremor was at the highest level seen since the 2016 eruption, and monitoring data indicated that shallow magma was driving the increased unrest.
The VAL was lowered to 2 on the morning of 12 December to reflect moderate to heightened unrest as no further explosive activity had occurred since the event on the 9th. Volcanic tremor was occurring at very high levels by the time a bulletin was released at 1025 that day. Gas emissions increased since 10 January, steam and mud jetting continued, and the situation was interpreted to be highly volatile. The Aviation Colour Code remained at Orange. Risk assessment maps released that day show the high-risk areas as monitoring parameters continued to show an increased likelihood of another eruption (figure 88).
The volcanic activity bulletin for 13 December reported that volcanic tremor remained high, but had declined overnight. Vigorous steam and mud jetting continuing at the vent area. Brief ash emission was observed in the evening with ashfall restricted to the vent area. The 14 January bulletin reported that volcanic tremor had declined significantly over night, and nighttime webcam images showed a glow in the vent area due to high heat flow.
Aerial observations on 14 and 15 December revealed steam and gas emissions continuing from at least three open vents within a 100 m2 area (figure 89). One vent near the back of the crater area was emitting transparent, high-temperature gas that indicated that magma was near the surface, and produced a glow registered by low-light cameras (figure 90). The gas emissions had a blue tinge that indicated high SO2 content. The area that once contained the crater lake, 16 m below overflow before the eruption, was filled with debris and small isolated ponds mostly from rainfall, with different colors due to the water reacting with the eruption deposits. The gas-and-steam plume was white near the volcano but changed to a gray-brown color as it cooled and moved downwind due to the gas content (figure 91). On 15 December the tremor remained at low levels (figure 92).
On 19 December tremor remained low (figure 93) and gas and steam emission continued. Overflight observations confirmed open vents with one producing temperatures over 650°C (figure 94). SO2 emissions remained high at around 15 kg/s, slightly lower than the 20 kg/s detected on 12 December. Small amounts of ash were produced on 23 and 26 December due to material entering the vents during erosion.
The Aviation Colour Code was reduced to Yellow on 6 January 2020 and the VAL remained at 2. Strong gas and steam emissions continued from the vent area through early January and the glow persisted in nighttime webcam images. Short-lived episodes of volcanic tremor were recorded between 8-10 January and were accompanied by minor explosions. A 15 January bulletin reported that the temperature at the vent area remained very hot, up to 440°C, and SO2 emissions were within normal post-eruption levels.
High temperatures were detected within the vent area in Sentinel-2 thermal data on 6 and 16 January (figure 95). Lava extrusion was confirmed within the 9 December vents on 20 January. Airborne SO2 measurements on that day recorded continued high levels and the vent temperature was over 400°C. Observations on 4 February showed that no new lava extrusion had occurred, and gas fluxes were lower than two weeks ago, but still elevated. The temperatures measured in the crater were 550-570°C and no further changes to the area were observed.
Geologic Background. The uninhabited Whakaari/White Island is the 2 x 2.4 km emergent summit of a 16 x 18 km submarine volcano in the Bay of Plenty about 50 km offshore of North Island. The island consists of two overlapping andesitic-to-dacitic stratovolcanoes. The SE side of the crater is open at sea level, with the recent activity centered about 1 km from the shore close to the rear crater wall. Volckner Rocks, sea stacks that are remnants of a lava dome, lie 5 km NW. Descriptions of volcanism since 1826 have included intermittent moderate phreatic, phreatomagmatic, and Strombolian eruptions; activity there also forms a prominent part of Maori legends. The formation of many new vents during the 19th and 20th centuries caused rapid changes in crater floor topography. Collapse of the crater wall in 1914 produced a debris avalanche that buried buildings and workers at a sulfur-mining project. Explosive activity in December 2019 took place while tourists were present, resulting in many fatalities. The official government name Whakaari/White Island is a combination of the full Maori name of Te Puia o Whakaari ("The Dramatic Volcano") and White Island (referencing the constant steam plume) given by Captain James Cook in 1769.
Information Contacts: New Zealand GeoNet Project, a collaboration between the Earthquake Commission and GNS Science, Wairakei Research Centre, Private Bag 2000, Taupo 3352, New Zealand (URL: http://www.geonet.org.nz/); GNS Science, Wairakei Research Centre, Private Bag 2000, Taupo 3352, New Zealand (URL: http://www.gns.cri.nz/); Bay of Plenty Emergency Management Group Civil Defense, New Zealand (URL: http://www.bopcivildefence.govt.nz/); Auckland Rescue Helicopter Trust, Auckland, New Zealand (URL: https://www.rescuehelicopter.org.nz/); Sentinel Hub Playground (URL: https://www.sentinel-hub.com/explore/sentinel-playground); Planet Labs, Inc. (URL: https://www.planet.com/); Ben Clarke, The University of Leicester, University Road, Leicester, LE1 7RH, United Kingdom (URL: https://le.ac.uk/geology, Twitter: https://twitter.com/PyroclasticBen); Michael Schade, San Francisco, USA (URL: https://twitter.com/sch).