The Japan Meteorological Agency (JMA) reported that the number of shallow volcanic earthquakes increased beneath an area near Kuchinoerabujima’s Furudake Crater in April and continued to increase. Sulfur dioxide emissions were low, averaging 20-80 tons per day since April, and there were days in April where the emissions were below detectable limits. Deformation data indicated ongoing inflation. Volcanic earthquakes with somewhat large amplitudes were occasionally recorded in May by the seismic network. There were many (135) volcanic earthquakes recorded during 2-11 June. No changes to geothermal areas located in and around both Shindake and Furudake craters were observed during a field survey conducted on 11 June. The Alert Level was raised to 3 (on a scale of 1-5) at 2100 on 11 June; the public was warned that ejected blocks may land within 2 km of both craters, and pyroclastic flows may affect areas between Shindake Crater and the coast.
Source: Japan Meteorological Agency (JMA)
Intermittent thermal anomalies and small eruptions in May and August 2020
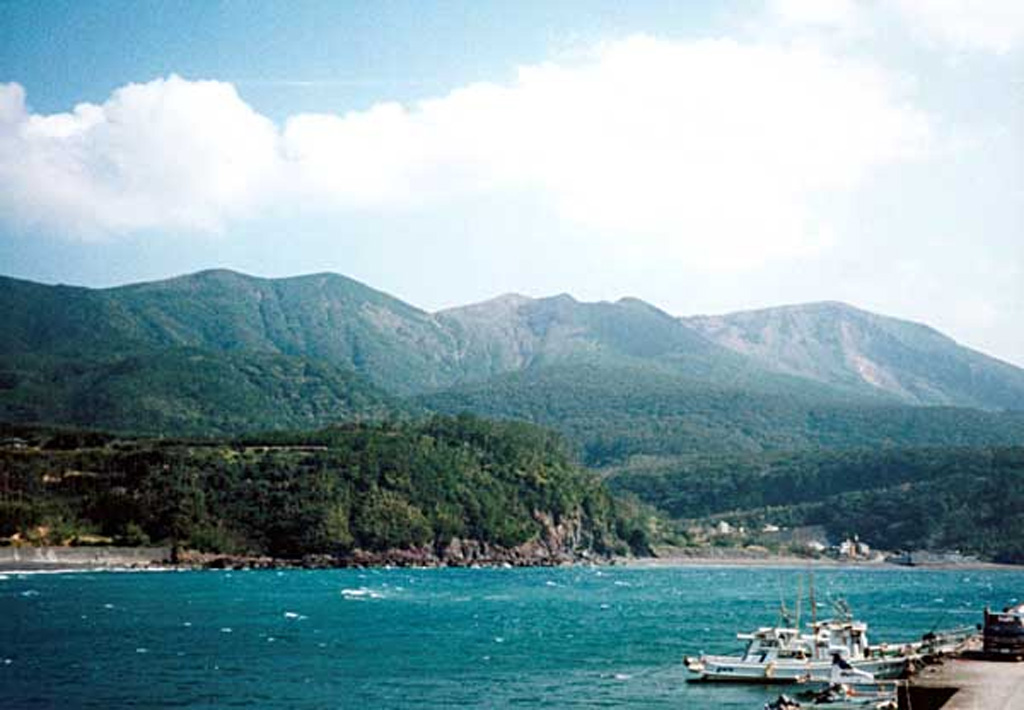
Kuchinoerabujima encompasses a group of young stratovolcanoes located in the northern Ryukyu Islands. All historical eruptions have originated from the Shindake cone, with the exception of a lava flow that originated from the S flank of the Furudake cone. The current eruptive period began in January 2020 and has been characterized by small explosions, ash plumes, ashfall, a pyroclastic flow, and gas-and-steam emissions. This report covers activity from May to October 2020, which includes small explosions, ash plumes, crater incandescence, and gas-and-steam emissions. The primary source of information for this report comes from monthly and annual reports from the Japan Meteorological Agency (JMA) and advisories from the Tokyo Volcanic Ash Advisory Center (VAAC).
Volcanism at Kuchinoerabujima remained relatively low during May through October 2020, according to JMA. During this time, SO2 emissions ranged from 40 to 3,400 tons/day; occasional gas-and-steam emissions were reported, rising to a maximum of 900 m above the crater. Sentinel-2 satellite images showed a particularly strong thermal anomaly in the Shindake crater on 1 May (figure 10). The thermal anomaly decreased in power after 1 May and was only visible on clear weather days, which included 19 August and 3 and 13 October. Global Navigation Satellite System (GNSS) observations identified continued slight inflation at the base of the volcano during the entire reporting period.
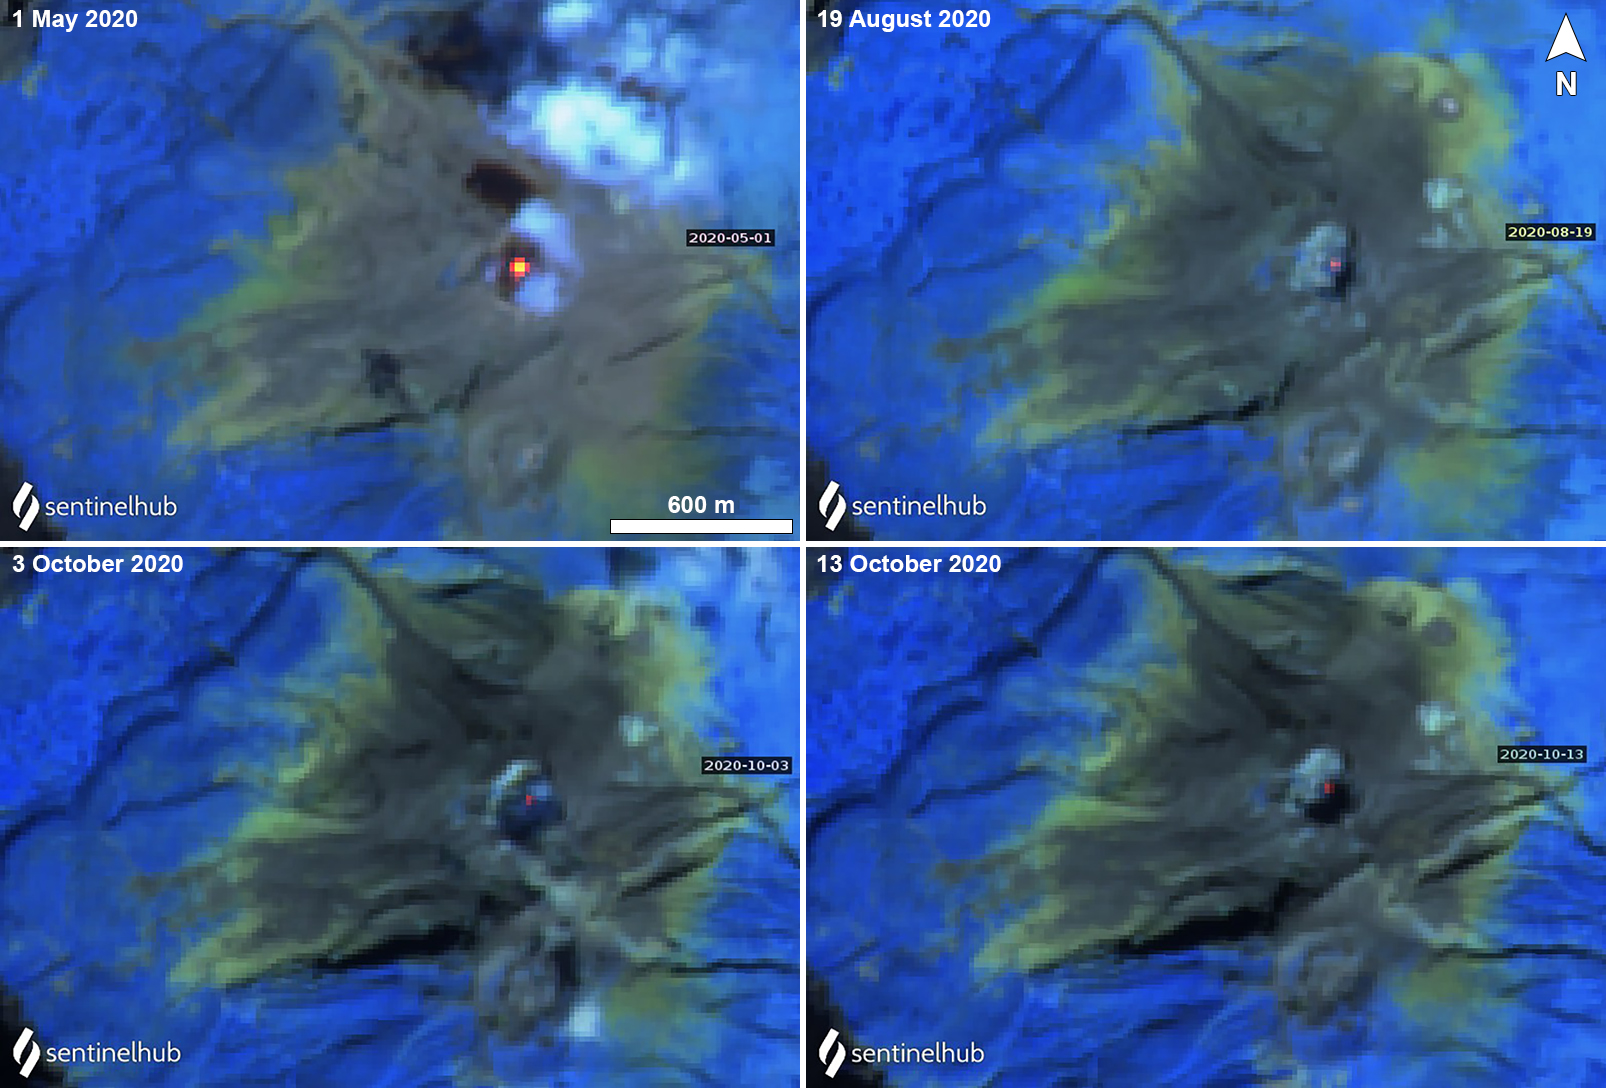 |
Figure 10. Sentinel-2 thermal satellite images showed a strong thermal anomaly (bright yellow-orange) in the Shindake crater at Kuchinoerabujima on 1 May 2020 (top left). Weaker thermal anomalies were also seen in the Shindake crater during 19 August (top right) and 3 (bottom left) and 13 (bottom right) October 2020. Sentinel-2 atmospheric penetration (bands 12, 11, 8A) images; courtesy of Sentinel Hub Playground. |
Three small eruptions were detected by JMA on 5, 6, and 13 May, which produced an ash plume rising 500 m above the crater on each day, resulting in ashfall on the downwind flanks. Incandescence was observed at night using a high-sensitivity surveillance camera (figure 11). On 5 and 13 May the Tokyo VAAC released a notice that reported ash plumes rising 0.9-1.2 km altitude, drifting NE and S, respectively. On 20 May weak fumaroles were observed on the W side of the Shindake crater. The SO2 emissions ranged from 700-3,400 tons/day.
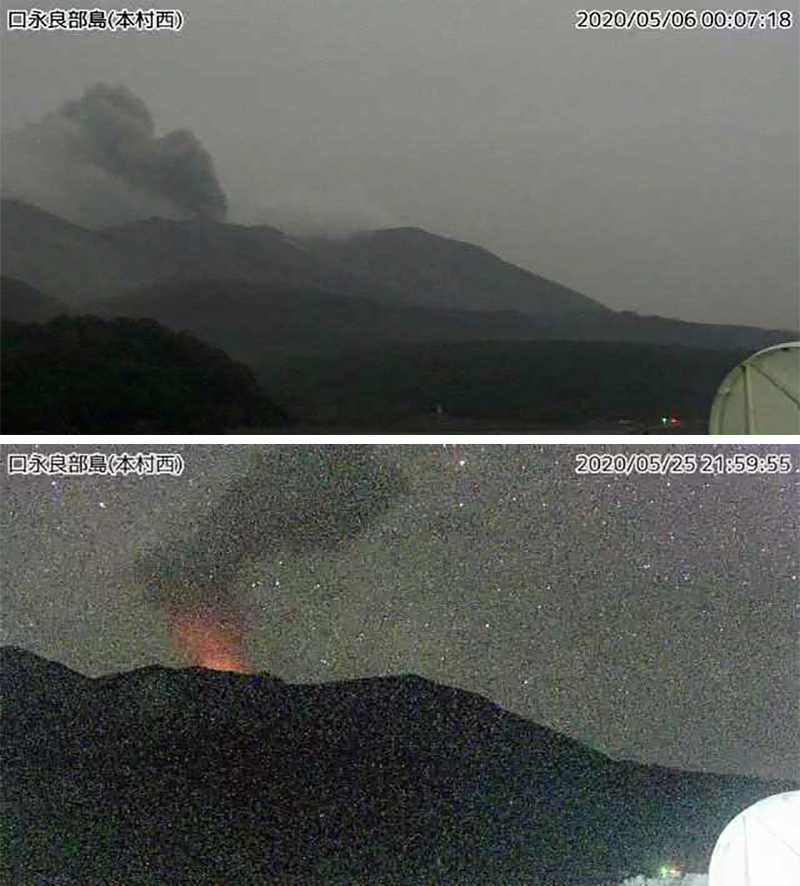 |
Figure 11. Webcam images of an eruption at Kuchinoerabujima on 6 May 2020 (top), producing a gray ash plume that rose 500 m above the crater. Crater incandescence was observed from the summit crater at night on 25 May 2020 (bottom). Courtesy of JMA (Monthly bulletin report 509, May 2020). |
Activity during June and July decreased compared to May, with gas-and-steam emissions occurring more prominently. On 22 June weak incandescence was observed, accompanied by white gas-and-steam emissions rising 700 m above the crater. Weak crater incandescence was also seen on 25 June. The SO2 emissions measured 400-1,400 tons/day. White gas-and-steam emissions were again observed on 31 July rising to 800 m above the crater. The SO2 emissions had decreased during this time to 300-700 tons/day.
According to JMA, the most recent eruptive event occurred on 29 August at 1746, which ejected bombs and was accompanied by some crater incandescence, though the eruptive column was not visible due to the cloud cover. However, white gas-and-steam emissions could be seen rising 1.3 km above the Shindake crater drifting SW. The SO2 emissions measured 200-500 tons/day. During August, the number of volcanic earthquakes increased significantly to 1,032, compared to the number in July (36).
The monthly bulletin for September reported white gas-and-steam emissions rising 900 m above the crater on 9 September and on 11 October the gas-and-steam emissions rose 600 m above the crater. Seismicity decreased between September and October from 1,920 to 866. The SO2 emissions continued to decrease compared to previous months, totaling 80-400 tons/day in September and 40-300 tons/day in October.
Information Contacts: Japan Meteorological Agency (JMA), 1-3-4 Otemachi, Chiyoda-ku, Tokyo 100-8122, Japan (URL: http://www.jma.go.jp/jma/indexe.html); Tokyo Volcanic Ash Advisory Center (VAAC), 1-3-4 Otemachi, Chiyoda-ku, Tokyo 100-8122, Japan (URL: http://ds.data.jma.go.jp/svd/vaac/data/); Sentinel Hub Playground (URL: https://www.sentinel-hub.com/explore/sentinel-playground).
2025: April
| June
2024: March
| April
| October
| November
| December
2023: June
| July
2022: May
| July
| August
2021: January
| February
| June
2020: January
| February
| April
2019: January
| June
| October
2018: April
| August
| October
| November
| December
2016: June
2015: January
| February
| March
| April
| May
| June
2014: July
| August
| September
| October
| November
| December
2009: March
2008: October
The Japan Meteorological Agency (JMA) reported that the number of shallow volcanic earthquakes increased beneath an area near Kuchinoerabujima’s Furudake Crater in April and continued to increase. Sulfur dioxide emissions were low, averaging 20-80 tons per day since April, and there were days in April where the emissions were below detectable limits. Deformation data indicated ongoing inflation. Volcanic earthquakes with somewhat large amplitudes were occasionally recorded in May by the seismic network. There were many (135) volcanic earthquakes recorded during 2-11 June. No changes to geothermal areas located in and around both Shindake and Furudake craters were observed during a field survey conducted on 11 June. The Alert Level was raised to 3 (on a scale of 1-5) at 2100 on 11 June; the public was warned that ejected blocks may land within 2 km of both craters, and pyroclastic flows may affect areas between Shindake Crater and the coast.
Source: Japan Meteorological Agency (JMA)
The Japan Meteorological Agency (JMA) reported that the number of shallow volcanic earthquakes increased beneath an area near Kuchinoerabujima’s Furudake Crater with 100 earthquakes recorded during 7-16 April. No changes to geothermal areas located in and around both Shindake and Furudake craters were observed during a field survey conducted on 11 April. Sulfur dioxide emissions were low, averaging 20 tons per day on 11 April, and no ground deformation had been detected since November 2023. The Alert Level was raised to 2 (on a scale of 1-5) at 2325 on 16 April; the public was warned that ejected blocks may land within 1 km of both craters, and pyroclastic flows may affect areas within 2 km of the W flank of Shindake Crater.
Source: Japan Meteorological Agency (JMA)
The Japan Meteorological Agency (JMA) reported that the number of shallow volcanic earthquakes increased beneath Kuchinoerabujima’s Furudake Crater with 30 earthquakes recorded during 5-6 December. No changes to geothermal areas located in and around both Shindake and Furudake craters were observed during field surveys conducted on 20 and 23 November as well as 3 and 5 December. Sulfur dioxide emissions were low, fluctuating between 30 and 60 tons per day in December, and no ground deformation had been detected since November 2023. The Alert Level was raised to 2 (on a scale of 1-5) at 0800 on 6 December and the public was warned to be cautious within a 1 km radius of both craters and within 2 km on the W flank of Shindake Crater.
Source: Japan Meteorological Agency (JMA)
The Japan Meteorological Agency (JMA) reported that volcanic activity at Kuchinoerabujima had been declining since mid-August. The number of shallow volcanic earthquakes that had been frequent since the beginning of April, with most epicenters located near Furudake Crater, and few near Shindake Crater (just N of Furudake), had declined; no large-amplitude earthquakes had been recorded. There were no notable changes to hydrothermal fields from late October to mid-November. Sulfur dioxide gas emissions were at low levels, fluctuating between 20 and 60 tons per day, and occasionally below detectable limits. The Alert Level was lowered to 1 (on a scale of 1-5) at 1100 on 20 November and the public was warned to exercise caution around the craters and not to enter restricted areas.
Source: Japan Meteorological Agency (JMA)
The Japan Meteorological Agency (JMA) reported that volcanic activity at Kuchinoerabujima had been declining since mid-August. The number of shallow volcanic earthquakes that had been frequent since the beginning of April, with most epicenters located near Furudake Crater, and few near Shindake Crater (just N of Furudake), have declined. The Alert Level was lowered to 2 (on a scale of 1-5) at 1100 on 18 October due to the decreased seismicity. Sulfur dioxide gas emissions were at low levels. The public was warned that ejected blocks and pyroclastic flows may impact areas within 1 km of both craters and within 2 km of Shindake.
Source: Japan Meteorological Agency (JMA)
JMA reported that shallow volcanic earthquakes at Kuchinoerabujima had been frequent since the beginning of April, with most epicenters located near Furudake Crater, and some near Shindake Crater (just N of Furudake). Both the number and magnitude of the volcanic earthquakes increased and remained elevated. The Alert Level was raised to 3 (on a scale of 1-5) at 1200 on 13 April due to the increased seismicity. Visual observations during 10-12 April field visits indicated no changes to the craters nor to the geothermal area near the fissure on the W side of the Shindake. Sulfur dioxide gas emissions were at low levels. The public was warned that ejected blocks and pyroclastic flows may impact areas within 1 km of both craters and within 2 km of Shindake.
Source: Japan Meteorological Agency (JMA)
JMA reported that the number of shallow volcanic earthquakes at Kuchinoerabujima increased during June and July 2023, fluctuated at elevated levels, began to decrease in mid-January 2024, and continued to decrease through March. The epicenters were mainly located near Furudake Crater, with some located near Shindake Crater (just N of Furudake). Sulfur dioxide emissions shared a similar pattern with increases starting in July 2023, peaks of 200-400 tons per day (t/d) during August-September, and a gradual decrease to less than 100 t/d by 18 March 2024. A geothermal area near Furudake Crater expanded and temperatures increased during October-December 2023 but beginning in January 2024 both the temperatures and the size decreased. No changes to the geothermal area near the fissure on the W side of Shindake Crater were observed during March. At 1400 on 27 March the Alert Level was lowered to 2 (on a scale of 1-5) with restrictions to access encompassing only the crater area. JMA noted that seismic activity continued to be recorded near the crater, and that the sulfur dioxide emissions and the level of activity at the geothermal areas remained at higher levels than before activity increased in June 2023.
Source: Japan Meteorological Agency (JMA)
JMA reported that shallow volcanic earthquakes at Kuchinoerabujima had been frequent since starting in late June, with most epicenters located near Furudake Crater, and some near Shindake Crater (just N of Furudake). Both the number and magnitude of the volcanic earthquakes increased on 9 June and remained elevated through 19 July; there were 285 events on 13 July, 241 on 14 July, 200 on 15 July, 104 on 16 July, 85 on 17 July, and 72 by 1500 on 18 July. The public was warned to stay 2 km away from Furudake. The Alert Level remained at 3 (on a scale of 1-5).
Source: Japan Meteorological Agency (JMA)
JMA reported that shallow volcanic earthquakes at Kuchinoerabujima had been occurring frequently starting in late June with most epicenters located near Furudake Crater, and some near Shindake Crater (just N of Furudake). Both the number and magnitude of the volcanic earthquakes increased on 9 June and remained elevated through 12 July; there were 151 events on 9 July, 319 on 10 July, 276 on 11 July, and 172 by 1500 on 12 July. The public was previously warned that ejected blocks and pyroclastic flows may affect areas within 2 km of Shindake, and at 1600 on 10 June the public was also warned to stay 2 km away from Furudake. The Alert Level remained at 3 (on a scale of 1-5).
Source: Japan Meteorological Agency (JMA)
The number of shallow volcanic earthquakes gradually increased at Kuchinoerabujima, with a total of 100 events recorded during 17-26 June, prompting JMA to raise the Alert Level to 2 (on a scale of 1-5). During late on 26 June until 1834 on 27 June a total of 50 shallow volcanic earthquakes were recorded, an increased rate of events. At 1930 JMA raised the Alert Level to 3. Earthquakes continued to be recorded during the rest of the week; there were 41, 18, 9, and 9 events respectively recorded each day during 27-30 June, with most epicenters located near Furudake Crater, and some near Shindake Crater (just N of Furudake). Sulfur dioxide emissions remained at low levels and no changes were visible to the gas-and-steam emissions which rose as high as 100 m above the crater rim. No obvious changes at the geothermal area near the fissure on the W side of the Shindake were visible during daily field surveys during 28 June-1 July; weather clouds obscured views during 29-30 June. SAR radar data from 30 June revealed inflation within an area extending several hundred meters around the Furudake crater. The public was warned that ejected blocks and pyroclastic flows may impact areas within 2 km of Shindake.
Source: Japan Meteorological Agency (JMA)
JMA reported that the number of volcanic earthquakes increased at Kuchinoerabujima. A total of 100 shallow volcanic earthquakes were recorded during 17-26 June with most epicenters located near Furudake Crater and some located near Shindake Crater (just N of Furudake). Sulfur dioxide emissions were low, and typical white emissions rose 100-500 m above Shindake on 13 and 25 June. No changes at the geothermal area on the W flank of Shindake were observed during a field inspection during 19-20 June. The Alert Level was raised to 2 (on a scale of 1-5) on 26 June due to the increased seismicity. The public was warned that ejected blocks and pyroclastic flows may impact areas within 2 km of Shindake.
Source: Japan Meteorological Agency (JMA)
The number of volcanic earthquakes with hypocenters near Kuchinoerabujima’s crater increased during 30-31 July prompting JMA to raise the Alert Level to 2 (on a scale of 1-5). The number of earthquakes then decreased to low levels by 1 August and remained low. Sulfur dioxide emissions were also at low levels and on some days were below the detection limit. On 1 September the Alert Level was lowered to 1.
Source: Japan Meteorological Agency (JMA)
JMA reported that the number of volcanic earthquakes with hypocenters near Kuchinoerabujima’s crater began increasing around 1000 on 30 July and remained elevated. The Alert level was raised to 2 (on a scale of 1-5) on 31 July. Around 40 volcanic earthquakes were recorded by 1500 on 1 August. JMA noted that daily emissions of sulfur dioxide gas remained low, with a rate less than 50 tons per day. No deformation was detected.
Source: Japan Meteorological Agency (JMA)
JMA lowered the Alert Level for Kuchinoerabujima to 1 (on a scale of 1-5) on 25 May, noting that the number of volcanic earthquakes had decreased to low levels. The report noted that sulfur dioxide emissions had continued to remain low, and that no changes in temperature or the extent of the geothermal areas around the crater were observed.
Source: Japan Meteorological Agency (JMA)
JMA reported that deformation data at Kuchinoerabujima had shown a deflationary trend since February and the number of volcanic earthquakes had been decreasing since May. The Alert Level was lowered to 2 (on a scale of 1-5) on 5 July, and JMA reminded the public to stay 1 km away from Shindake Crater in general and 2 km away from the W flank.
Source: Japan Meteorological Agency (JMA)
JMA reported that the number of volcanic earthquakes located at shallow depths beneath Kuchinoerabujima’s Shindake Crater increased on 21 February and remained elevated. The Alert Level was raised to 3 (the middle level on a scale of 1-5) on 28 February. No other monitoring data showed upward trends and no surficial changes were visible; sulfur dioxide emissions remained low at 60 tons per day on 24 February.
Source: Japan Meteorological Agency (JMA)
JMA lowered the Alert Level for Kuchinoerabujima to 2 (the second lowest level on a scale of 1-5) on 19 January, noting downward trends in activity data since mid-2020. Specifically, after May 2020 no volcanic earthquakes were detected, inflation slowed to baseline levels, and sulfur dioxide emissions began decreasing though remained slightly high. Additionally, crater incandescence had not been visible after July and no eruptions were recorded after August 2020.
Source: Japan Meteorological Agency (JMA)
JMA reported that during 13-20 April very small eruptive events at Kuchinoerabujima’s Shindake Crater produced grayish-white plumes that rose 600 m above the crater rim. An event at 0147 on 20 April generated a grayish-white plume that rose 800 m and drifted SE. The Alert Level remained at 3 (the middle level on a scale of 1-5).
Source: Japan Meteorological Agency (JMA)
JMA reported that during 30 March-3 April white plumes rose 500 m above the rim of Kuchinoerabujima’s Shindake Crater. Sulfur dioxide emissions were at high levels. Very small eruptive events during 5-6 April generated plumes that rose 900 m and merged into weather clouds. The Alert Level remained at 3 (the middle level on a scale of 1-5).
Source: Japan Meteorological Agency (JMA)
JMA reported that very small eruptive events recorded at Kuchinoerabujima’s Shindake Crater during 20-21 February generated whitish plumes that rose 200 m above the crater rim. No changes were observed during field visits on those two days. Sulfur dioxide emissions were 400-600 tons per day during 20-23 February. The Alert Level remained at 3 (the middle level on a scale of 1-5).
Source: Japan Meteorological Agency (JMA)
JMA reported that at 1211 on 13 February a very small eruption at Kuchinoerabujima’s Shindake Crater produced a grayish white plume that rose 300 m above the crater rim and drifted NE. The Alert Level remained at 3 (the middle level on a scale of 1-5).
Source: Japan Meteorological Agency (JMA)
JMA reported that after the 3 February eruption at Kuchinoerabujima’s Shindake Crater the number of volcanic earthquakes decreased, and very small eruptive events occurred intermittently though 5 February and on 9 February. A large amount of ashfall (including lapilli up to 2 cm in diameter) was confirmed on the SE flank during field observations on 3 and 6 February. Thermal image observations revealed 5-km-long pyroclastic flow deposits on the SW flank. The number of volcanic earthquakes began increasing on 9 February and continued to be elevated the next day. A large-amplitude volcanic tremor event was accompanied by fluctuating tilt at 1318 on 11 February. The Alert Level remained at 3 (the middle level on a scale of 1-5).
Source: Japan Meteorological Agency (JMA)
JMA reported that at 0521 on 3 February an eruption at Kuchinoerabujima’s Shindake Crater produced an ash plume that rose 7 km above the crater rim, based on satellite images, and ejected material 600 m away from the crater. A pyroclastic flow traveled about 900 m SW, the first one recorded since 29 January 2019. Ashfall was confirmed in the northern part of neighboring Yakushima Island (a large amount in Miyanoura, 32 km ESE) and southern Tanegashima. According to a news article the eruption caused one flight to be diverted and one to be cancelled. The Alert Level remained at 3 (the middle level on a scale of 1-5).
Sources: Japan Meteorological Agency (JMA); Stuff
Very small eruptive events recorded at Kuchinoerabujima on 20, 23, and 24 January produced grayish-white plumes that rose 500 m above the crater rim. Ashfall 2 km NE of the crater was confirmed during aerial observations on 23 January. The number of volcanic earthquakes increased during 25-26 January. An eruptive event was recorded at 0148 on 27 January, though weather clouds prevented visual confirmation; volcanic tremor, changes in tilt data, and infrasound signals accompanied the event. Sulfur dioxide gas emissions were 200-1,000 tons per day during 20-27 January; JMA characterized emissions of 600-1,000 tons per day as high.
Source: Japan Meteorological Agency (JMA)
White plumes from Kuchinoerabujima rose 600 m above the crater rim during 14-17 January. Minor eruptive activity from 1659 on 17 January through 1030 on 20 January generated grayish-white plumes that rose 300 m. Sulfur dioxide emissions were high at 800 and 1,600 tons per day on 15 and 16 January, respectively. The Alert Level remained at 3 (the middle level on a scale of 1-5).
Source: Japan Meteorological Agency (JMA)
An eruption at Kuchinoerabujima began at 1505 on 11 January and produced ash plumes that rose 2 km above the crater rim, drifted E, and then faded into a weather cloud. Tephra was ejected 300 m from the crater, and ashfall was reported on neighboring Yakushima Island. The eruption continued until 0730 on 12 January, producing ash plumes that rose 400 m above the crater rim and drifted SW; afterwards only white plumes were visible rising 600 m. The Alert Level remained at 3 (the middle level on a scale of 1-5).
Source: Japan Meteorological Agency (JMA)
A large shallow earthquake at Kuchinoerabujima was recorded at 2133 on 27 October, prompting JMA to raise the Alert Level to 3 (the middle level on a scale of 1-5) within a few hours. The report also stated that the number of volcanic earthquakes had increased on 18 October. A large earthquake was also detected on 18 October but had occurred at a slightly deeper location (below the W part of Shindake Crater) than the 27 October event.
Source: Japan Meteorological Agency (JMA)
JMA reported that Kuchinoerabujima’s Shindake Crater has not erupted since 3 February, and the number of shallow earthquakes located near the crater had been decreasing since then. Deeper volcanic earthquakes had not been recorded since 16 May. Sulfur dioxide emissions remained elevated. JMA lowered the Alert Level to 2 (the second lowest level on a scale of 1-5) on 12 June.
Source: Japan Meteorological Agency (JMA)
JMA reported that during 1713-1915 on 29 January an eruption at Kuchinoerabujima’s Shindake Crater produced an ash plume that rose 4 km above the crater rim and drifted E, and a pyroclastic flow. Ash fell in parts of Yakushima. During 30 January-1 February and 3-5 February white plumes rose as high as 600 m. An event that lasted during 1141-1300 on 2 February generated a plume that rose 600 m. The Alert Level remained at 3 (on a scale of 1-5).
Source: Japan Meteorological Agency (JMA)
JMA reported that at 1637 on 18 December an eruption at Kuchinoerabujima’s Shindake Crater produced an ash plume that rose 2 km and then disappeared into a weather cloud. The event ejected material that fell in the crater area, and generated a pyroclastic flow that traveled 1 km W. The Alert Level remained at 3 (on a scale of 1-5).
Source: Japan Meteorological Agency (JMA)
JMA reported that during 28 November-3 December intermittent events at Kuchinoerabujima’s Shindake Crater generated plumes that rose as high as 1.5 km above the crater rim. The Alert Level remained at 3 (on a scale of 1-5).
Source: Japan Meteorological Agency (JMA)
JMA reported that during 22-26 November intermittent events at Kuchinoerabujima’s Shindake Crater generated plumes that rose as high as 2.1 km above the crater rim. The Alert Level remained at 3 (on a scale of 1-5).
Source: Japan Meteorological Agency (JMA)
JMA reported that intermittent events at Kuchinoerabujima’s Shindake Crater had been recorded since 21 October, and crater incandescence began to be periodically visible on 6 November. Ash plumes rose as high as 1.2 km above the crater rim during 12-19 November and, according to the Tokyo VAAC, drifted in multiple directions. During fieldwork on 14 and 15 November observers noted no changes to the thermal areas in the crater. The Alert Level remained at 3 (on a scale of 1-5).
Sources: Japan Meteorological Agency (JMA); Tokyo Volcanic Ash Advisory Center (VAAC)
JMA reported that during 31 October-5 November there were very small events recorded at Kuchinoerabujima’s Shindake Crater. Plumes rose 500-1,200 m above the crater rim. The Alert Level remained at 3 (on a scale of 1-5).
Source: Japan Meteorological Agency (JMA)
Based on satellite images and information from JMA, the Tokyo VAAC reported that during 24-28 October ash plumes from Kuchinoerabujima’s Shindake Crater rose to altitudes of 0.9-1.5 km (3,000-5,000 ft) a.s.l. and drifted in multiple directions. JMA scientists noted no changes in the thermal anomalies at the crater during a field observation on 28 October. The Alert Level remained at 3 (on a scale of 1-5).
Sources: Japan Meteorological Agency (JMA); Tokyo Volcanic Ash Advisory Center (VAAC)
JMA reported that a very small eruption at Kuchinoerabujima’s Shindake Crater was recorded at 1831 on 21 October, with additional activity between 2110 on 21 October and 1350 on 22 October. Plumes rose 200 m above the crater rim. During an overflight on 22 October observers noted ash in the emissions, though no morphological changes to the crater nor ash deposits were seen. The Alert Level remained at 3 (on a scale of 1-5).
Source: Japan Meteorological Agency (JMA)
JMA reported that earthquakes at Kuchinoerabujima’s Shindake Crater typically occur at shallow levels, though on 15 August a swarm of deep volcanic earthquakes was recorded, prompting JMA to raise the Alert Level to 4 (on a scale of 1-5). The earthquake hypocenters were about 5 km deep, below the SW flanks of Shindake, and the maximum magnitude was 1.9. They occurred at about the same place as the swarm that occurred just before the May 2015 eruption. Sulfur dioxide emissions had been increasing since the beginning of August; they were 1,600, 1,000, and 1,200 tons/day on 11, 13, and 17 August, respectively. No surficial changes in gas emissions or thermal areas were observed during 16-20 August.
Source: Japan Meteorological Agency (JMA)
JMA reported that a low-temperature thermal anomaly persisted near the W fracture in Kuchinoerabujima Shindake crater. In addition, both the number of volcanic earthquakes (generally occurring in a large quantity) and sulfur dioxide flux remained above baselines levels in August 2014. No eruptions have occurred since 19 June 2015, and deflation had been recorded since January 2016; the Alert Level was lowered to 2 (on a scale of 1-5).
Source: Japan Meteorological Agency (JMA)
On 14 June JMA reported that no activity at Kuchinoerabujima had been detected after a small eruption on 19 June 2015. The report noted that volcanic tremor had not been detected, the temperature of thermal areas had declined, sulfur dioxide gas flux was lower than values detected prior to the May-June 2015 eruption, and volcanic earthquake levels were lower than levels detected in August 2014. The Alert Level was lowered to 3 (the highest level on a 1-5 scale) on 14 June, and the public was reminded to stay at least 2 km away from Shindake Crater.
Source: Japan Meteorological Agency (JMA)
JMA reported that during 3-8 June white plumes rose 100-400 m above Shindake Crater's rim at Kuchinoerabujima. Volcanic earthquakes had declined on 30 May but continued to periodically occur. The Alert Level remained at 5 (the highest level on a 1-5 scale).
Source: Japan Meteorological Agency (JMA)
JMA reported that at 0959 on 29 May an explosive and phreatomagmatic eruption at Kuchinoerabujima generated an ash plume that rose 9 km above Shindake Crater's rim and drifted ESE. Pyroclastic flows descended the SW flank and reached the coast on the NW flank. Volcanic earthquakes increased after that event, but then decreased around 1300. The Alert Level was raised to 5 (the highest level on a 1-5 scale). According to a news article all residents and visitors (137-141) were safely evacuated by a ferry to neighboring Yakushima Island. Later that day ash plumes rose 200 m and drifted SW. Scientists conducted an overflight and confirmed pyroclastic flow deposits on the NW and NE flanks.
Ash plumes continued to be emitted the next day, rising as high as 1.2 km. A field team observed discolored trees on the SE and SW flanks, and fallen trees near the coast on the NW flank. Cloud cover prevented views of the eruption area, but the team was able to confirm continued fumarolic activity from a crack in the W part of the crater as well as incandescence.
Source: Japan Meteorological Agency (JMA)
JMA reported that no eruptions occurred from Kuchinoerabujima during 18-22 May, although the level of activity remained elevated. White plumes rose 600 m above Shindake Crater, and incandescence from the W part of the crater was observed at night. Volcanic earthquakes were detected; tremor was absent. Fumarolic activity in a crack in W part of the crater was observed during a field survey. The Alert Level remained at 3 (on a scale of 1-5).
Source: Japan Meteorological Agency (JMA)
JMA reported that no eruptions occurred from Kuchinoerabujima during 30 March-3 April, although the level of activity remained elevated. White plumes rose 1 km above Shindake Crater, and incandescence from the crater was observed at night. Volcanic earthquakes were detected; tremor was absent. Fumarolic activity in a crack in W part of the crater was observed during a field survey on 30 March. In addition the temperature of a thermal anomaly in the W part continued to rise. The Alert Level remained at 3 (on a scale of 1-5).
Source: Japan Meteorological Agency (JMA)
JMA reported that no eruptions occurred from Kuchinoerabujima during 27-30 March, although the level of activity remained elevated. White plumes rose 1 km above Shindake Crater. Continuing fumarolic actiivty in a crack in W part of the crater was confirmed during a field survey. In addition the temperature of a thermal anomaly in the W part continued to rise. Low-level seismicity continued. The Alert Level remained at 3 (on a scale of 1-5).
Source: Japan Meteorological Agency (JMA)
JMA reported that no eruptions occurred from Kuchinoerabujima during 16-20 February, although the level of activity remained elevated. White plumes rose 600 m above the crater. Low-level seismicity continued and tremor was absent. The Alert Level remained at 3 (on a scale of 1-5).
Source: Japan Meteorological Agency (JMA)
JMA reported that no eruptions occurred from Kuchinoerabujima during 9-16 February although the level of activity remained elevated. White plumes rose 400-700 m above the crater. Low-level seismicity continued and tremor was absent. Scientists aboard an overflight on 10 February observed a new crater with high-temperature areas on the NE part, new fissures, and white steam emissions. The Alert Level remained at 3 (on a scale of 1-5).
Source: Japan Meteorological Agency (JMA)
JMA reported that no eruptions occurred from Kuchinoerabujima during 5-9 January, although the level of activity remained elevated. White plumes rose 500 m above the crater. Low-level seismicity continued and tremor was absent. The Alert Level remained at 3 (on a scale of 1-5).
Source: Japan Meteorological Agency (JMA)
JMA reported that no eruptions occurred from Kuchinoerabujima during 8-12 December, although the level of activity remained elevated. White plumes rose 400 m above the crater. Low-level seismicity continued and tremor was absent. Sulfur dioxide emissions increased on 9 December; measurements indicated a rate of 1,700 tons per day. The Alert Level remained at 3 (on a scale of 1-5).
Source: Japan Meteorological Agency (JMA)
JMA reported that no eruptions occurred from Kuchinoerabujima during 1-5 December, although the level of activity remained elevated. White plumes rose 300 m above the crater. Low-level seismicity continued and tremor was absent. The Alert Level remained at 3 (on a scale of 1-5).
Source: Japan Meteorological Agency (JMA)
JMA reported that no eruptions occurred from Kuchinoerabujima during 25-28 November although the level of activity remained elevated. White plumes rose 200 m above the crater. Low-level seismicity continued and tremor was absent. The Alert Level remained at 3 (on a scale of 1-5).
Source: Japan Meteorological Agency (JMA)
JMA reported that no eruptions occurred from Kuchinoerabujima during 29 September-3 October. White plumes rose 600 m above the crater. Low-level seismicity continued and tremor was absent. The Alert Level remained at 3 (on a scale of 1-5).
Source: Japan Meteorological Agency (JMA)
JMA reported that no eruptions occurred from Kuchinoerabujima during 26-29 September. White plumes rose 300 m above the crater. Low-level seismicity continued and tremor was absent. The Alert Level remained at 3 (on a scale of 1-5).
Source: Japan Meteorological Agency (JMA)
JMA reported that no eruptions occurred from Kuchinoerabujima during 16-19 September. White plumes rose 600 m above the crater. Low-level seismicity continued and tremor was absent. The Alert Level remained at 3 (on a scale of 1-5).
Source: Japan Meteorological Agency (JMA)
During 8-16 September JMA reported that Alert Level 3 conditions persisted at Kuchinoerabujima, but no eruptive activity was observed. Low-level seismicity continued and tremor was absent. White plumes were visible on webcamera images rising 800 m from the crater during 8-12 September and to 600 m during 13-16 September. A field survey on 12 September measured SO2 emissions that were similar to pre-eruptive levels (300 tons/day).
Source: Japan Meteorological Agency (JMA)
During 1-8 September, JMA reported that Alert Level 3 conditions persisted at Kuchinoerabujima, but no eruptive activity was observed. Seismicity increased during 3-5 September; tremor was occasionally detected. Based on webcamera images, white plumes were visible rising 400 m from the crater during 1-5 September and to 200 m during 5-8 September. Tremor was not detected during 5-8 September and JMA noted that poor weather conditions due to a typhoon were affecting the seismic network.
Source: Japan Meteorological Agency (JMA)
JMA reported that during 27 August-2 September few volcanic earthquakes were accompanied by no explosion at Kuchinoerabujima. On most days a white plume rose 50-300m above the crater rim . The Alert Level for Kuchinoerabujima remained at 3 (on a scale of 1-5).
Source: Japan Meteorological Agency (JMA)
JMA reported that during 20-26 August there were few episodes of volcanic tremor and volcanic earthquakes, with no explosions at Kuchinoerabujima. On most days a white plume rose 20-400m above the crater rim. The Alert Level for Kuchinoerabujima remained at 3 (on a scale of 1-5).
Source: Japan Meteorological Agency (JMA)
JMA reported that during 13-19 August tremor and quakes were accompanied by no explosions at Kuchinoerabujima. On 13 August a white plume rose 600 m and on 18 August rose 50 m above the crater rim. The Alert Level remained at 3 (on a scale of 1-5).
Source: Japan Meteorological Agency (JMA)
JMA reported on 6, 12 August a white plume rose 800m and 300 m respectively above the crater rim at Kuchinoerabujima. Views of the volcano remained obscured by clouds other days, but instruments recorded volcanic seismicity and volcanic tremor. The Alert Level for Kuchinoerabujima remained at 3 (on a scale of 1-5).
Source: Japan Meteorological Agency (JMA)
On 3 August, JMA reported that Kuchinoerabujima erupted in the vicinity of Shin-dake crater and an overflight confirmed traces of ash on the west side of the volcano. Tokyo VAAC reported an ash plume rose to 1.5 km (5,000 ft) a.s.l. and drifted N. JMA raised the Alert Level for Kuchinoerabujima from 2 to 3 (on a scale of 1-5). On 5 August, volcanic seismicity and volcanic tremor decreased and views from a remote web camera showed a white plume 50 m above the crater rim.
Sources: Japan Meteorological Agency (JMA); Tokyo Volcanic Ash Advisory Center (VAAC)
On 18 March, JMA lowered the Alert Level for Kuchinoerabu-jima from 3 to 2 (on a scale of 1-5). Sulfur dioxide emissions decreased in January and the rate of deformation decreased in February. Seismicity was also low. The volcano had been in a state of unrest since September 2008.
Source: Japan Meteorological Agency (JMA)
On 27 October, JMA raised the Alert Level for Kuchinoerabu-jima from 2 to 3 (on a scale of 1-5). GPS measurements indicated that inflation just below the summit crater, which had started in September, was continuing. Fumarolic activity near summit had also increased. On 4 September, JMA had raised the Alert Level for from 1 to 2 because of the increased seismicity.
Source: Japan Meteorological Agency (JMA)
Reports are organized chronologically and indexed below by Month/Year (Publication Volume:Number), and include a one-line summary. Click on the index link or scroll down to read the reports.
Explosion sends column 3 km high
An explosion at Shin-dake cone yielded columns of smoke 3,000 m high at about [1540] on 2 April. After 30 minutes the height of the smoke column decreased to about 200 m (twice that of usual emissions). Egg-sized volcanic ejecta fell, and ash 2 cm deep was measured in a village 3 km from the crater. The last explosion took place on 3 June 1974. [JMA reported that there was no damage.]
Information Contacts: T. Tiba, National Science Museum, Tokyo.
Weak ash emission
After four years of quiet, a brief, weak explosion produced a [2-3-km-high] ash cloud on 28 September at 0510. Ash fell on the sea [SW] of the volcano, missing the homes of the 12 x 5 km island's 300 residents. Activity after the explosion was limited to emission of white vapor through the end of September. Minor ash explosions have occurred in seven different years since 1966.
Information Contacts: JMA, Tokyo.
Seismicity and steaming decline; 28 September eruption fissure and tephra described
"After the 28 September eruption, which lasted for 1/2 hour, no additional eruptions had occurred as of the end of December. Eight scientists from Kyoto University, Kagoshima University, and the JMA observatory arrived at the island on 1 October, installing portable seismometers at five sites. The next day, they climbed to the new fissure, which was 0.6-6.0 m wide and 750 m long, trending N-S near Shin-dake crater (figure 1), active in historic time. A considerable amount of white vapor was emitted from the fissure.
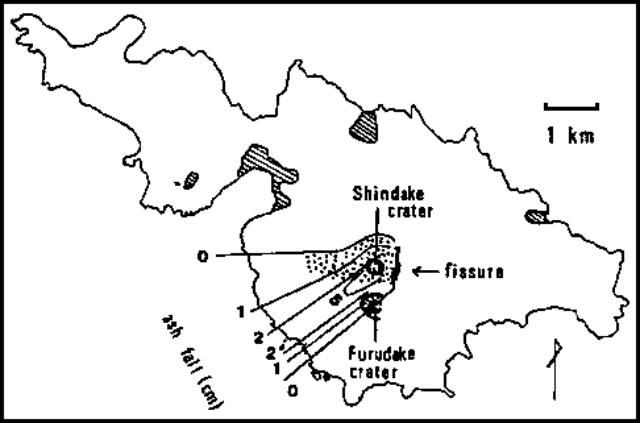 |
Figure 1. Sketch map of Kuchinoerabu-jima Island, 28 September 1980. Ashfall isopachs are in centimeters. Blocks fell in the stippled area. Shaded zones are inhabited. Courtesy of JMA. |
"The SW sector of the volcano was covered with gray ash, l m thick near the fissure and 2 cm thick at the base of the volcano, on the coast. Blocks were scattered N and W of the fissure, the largest block measuring about 2 m in diameter. No essential ejecta were observed. The volume of ejecta was estimated at about 105 m3. Steaming decreased gradually during October, and was restricted to 10 small craters on the fissure by mid-October.
"Seismicity was relatively weak in October and November except on 4 and 9 October when swarms of small B-type earthquakes were recorded (figure 2). The JMA's seismometer was removed on 15 November because the volcano was quiet. People on the island reported no felt earthquakes, and decreasing steam activity through December. Life returned to normal for the island's 300 inhabitants soon after the 28 September eruption."
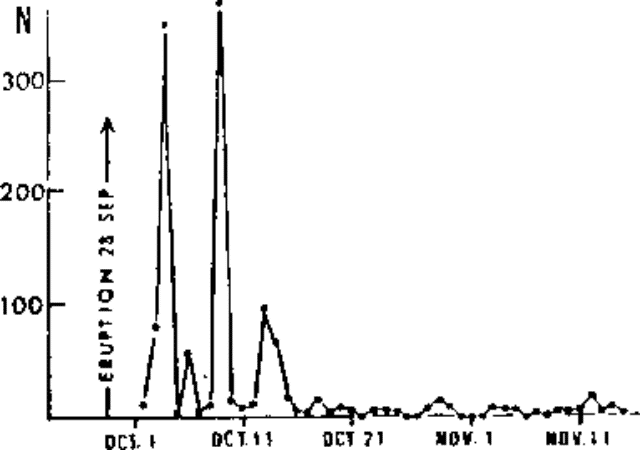 |
Figure 2. Number of seismic events/day at Kuchinoerabu-jima, 1 October-15 November 1980. Courtesy of JMA. |
Information Contacts: JMA, Tokyo.
Increasing number of earthquakes since January
According to the Sakura-jima Volcanological Observatory of Kyoto University, the number of earthquakes has increased around Shin-dake since January. The total number of earthquakes recorded was 32 in January, 40 in February, and 77 in March.
A group of young stratovolcanoes forms the E end of Kuchinoerabu-jima Island, midway between Suwanose-jima and Kyushu. Several villages on the 4 x 12 km island are located within a few kilometers of the active crater of Shin-dake and have suffered damage from historical eruptions. Shin-dake is the summit cone, and has been the site of all 13 eruptions known since 1840. The last eruption was a weak 30-minute explosion on 28 September 1980 that sent an ash plume 2-3 km high.
Information Contacts: Japan Meteorological Agency (JMA), Volcanological Division, Seismological and Volcanological Department, 1-3-4 Ote-machi, Chiyoda-ku, Tokyo 100, Japan.
Number of volcanic earthquakes continues to increase
According to reports from Sakura-jima Volcanological Observatory, Kyoto University, 91 earthquakes occurred around Shin-dake in April. Earthquakes have progressively increased here since January 1996. Specifically, there were 32 earthquakes in January, 40 in February, and 77 in March.
Information Contacts: Japan Meteorological Agency (JMA), Volcanological Division, Seismological and Volcanological Department, 1-3-4 Ote-machi, Chiyoda-ku, Tokyo 100, Japan.
Number of volcanic earthquakes increases
According to reports of Sakura-jima Volcanological Observatory, Kyoto University, 86 earthquakes occurred around Shin-dake in May. Seismicity has been increasing since January 1996.
Information Contacts: Japan Meteorological Agency (JMA), Volcanological Division, Seismological and Volcanological Department, 1-3-4 Ote-machi, Chiyoda-ku, Tokyo 100, Japan.
Seismic activity increasing since January 1996
Seismicity has been increasing since January 1996. According to the Sakura-jima Volcanological Observatory, Kyoto University, 75 and 25 earthquakes were detected around Shin-dake cone in June and July, respectively.
Information Contacts: Volcanological Division, Japan Meteorological Agency, 1-3-4 Ote-machi, Chiyoda-ku, Tokyo 100, Japan
Elevated seismicity continues since January
Seismicity has been increasing since January 1996 (BGVN 21:04, 21:05, and 21:07). According to the Sakura-jima Volcanological Observatory, Kyoto University, 62 earthquakes were detected around Shin-dake cone during August.
Information Contacts: Volcanological Division, Japan Meteorological Agency (JMA), 1-3-4 Ote-machi, Chiyoda-ku, Tokyo 100, Japan.
Increased seismicity, but no change at the fumaroles
The Japan Meteorological Agency (JMA) reported an increase in seismic activity on Kuchinoerabu-jima since July 1999 based on data from Sakura-jima Volcano Observatory (SVO), Kyoto University. The number of earthquakes/month increased, rising from 26 in June, to 87 in July, and to 195 in August. By mid-September, JMA and SVO had not observed any anomalous change in fumaroles in the craters of Shin-dake (the youngest volcanic cone).
Kuchinoerabu-jima is a volcanic island 12 km long and 5 km wide located ~100 km SSW of southern Kyushu Island and Sakura-jima volcano. An andesite stratovolcano, Kuchinoerabu-jima includes both an older edifice to the NW and young edifices (Furudake and Shindake cones) to the SE. Historical eruptions at Shindake were phreatic. An eruption in December 1933 killed 8 persons and injured 26.
Information Contacts: Volcanological Division, Seismological and Volcanological Department, Japan Meteorological Agency (JMA), 1-3-4 Ote-machi, Chiyoda-ku, Tokyo 100 Japan; Setsuya Nakada, Volcano Research Center, ERI, University of Tokyo, Yayoi 1-1-1, Bunkyo-ku, Tokyo 113, Japan (URL: http://www.eri.u-tokyo.ac.jp/VRC/index_E.html).
A rise in hazard status owing to 2008 seismicity and GPS-measured inflation
Anomalous seismicity and inflation was noted at Kuchinoerabu-jima in late 2008. Seismic unrest was also reported during mid-1999 (BGVN 24:08). The island of the same name is home to ~ 140 residents and lies ~ 130 km S of the city of Kagoshima (Kyushu Island, Japan). The 19-km-diameter Kikai caldera, which is mainly submarine, sits a few tens of kilometers to the N, and is renowned for its massive eruption ~ 6,300 years ago. Kuchinoerabu Island contains a composite elongate cone made up of three closely spaced Holocene volcanoes supporting the island's S-central zone (figure 3; Geshi and Nakano, 2007; Geshi and Kobayashi, 2007).
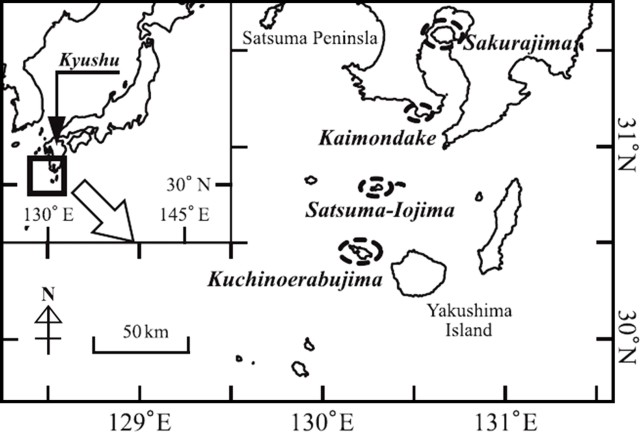 |
Figure 3. Map showing the location and geography of Kuchinoerabu-jima Island (Ryukyu Islands) south of Kyushu, Japan. The island is located ~ 15 km W of the larger circular Yaku-shima Island. The map also indicates recently active volcanoes of the region. Modified from Matsumoto and others (2007). |
Increased seismicity prompted the Japan Meteorological Agency (JMA) to raise the Alert Level from 1 to 2 (on a scale of 1-5) on 4 September 2008, and to level 3 on 27 October 2008. According to JMA, GPS measurements indicated inflation just below the summit crater that had started in September was continuing in October. Fumarolic activity near the summit had also increased.
Reference. Matsumoto, T., Ueno, H., and Kobayashi, T., 2007, A new secular variation curve for South Kyushu, Japan, and its application to the dating of some lava flows: Rep. Fac. Sci., Kagoshima Univ., no. 40, p. 35-49.
Information Contacts: Volcanological Division, Seismological and Volcanological Department, Japan Meteorological Agency (JMA), 1-3-4 Ote-machi, Chiyoda-ku, Tokyo 100 Japan; Volcano Research Center (VRC-ERI), Earthquake Research Institute, University of Tokyo , Yayoi 1-1-1, Bunkyo-ku, Tokyo 113, Japan (URL: http://www.eri.u-tokyo.ac.jp/VRC/index_E.html).
Some periods of increased seismicity through 2009; white plumes
No eruptive activity has been reported at Kuchinoerabu-jima since a small eruption in September 1980 (SEAN 05:12). However, there have been many periods of elevated seismicity.
One such episode, beginning in early September 2008, prompted two increases in the hazard status by late October when the seismicity was accompanied by inflation and increased fumarolic activity near the summit (BGVN 33:09). The Alert Level remained at 3 (on a scale of 1-5) until 18 March 2009, when it was decreased to level 2. Sulfur dioxide emissions had decreased in January 2009, followed by a decrease in the rate of deformation.
Seismicity data during 2003-2009. Seismic data recorded by JMA between January 2003 and December 2006 indicted that the number of monthly volcanic earthquakes was typically below 200, with less than 30 tremor events. Seismicity was higher in March 2004, January-February, May, July-September, and November 2005, March-April, August, and October-December 2006, and February and April 2007 (table 1).
Table 1. Months with anomalous seismicity at Kuchinoerabu-jima between January 2003 and December 2009, showing numbers of earthquakes, tremors, and plume observations. Months with either more than 200 volcanic earthquakes or more than 30 tremors are shown, and months with earthquake swarms on specific days. All observed plumes throughout this period were white. Data courtesy of JMA.
| Month | Earthquakes | Tremors | Days with plumes | Plume height (m) | Notes |
| Mar 2004 | 315 | 48 | -- | -- | -- |
| Jan 2005 | 346 | 59 | -- | -- | -- |
| Feb 2005 | 234 | 36 | 4 | 40 | -- |
| May 2005 | 100 | 35 | -- | -- | -- |
| Jul 2005 | 136 | 58 | -- | -- | -- |
| Aug 2005 | 228 | 40 | -- | -- | -- |
| Sep 2005 | 201 | 10 | -- | -- | -- |
| Nov 2005 | 205 | 7 | -- | -- | -- |
| Mar 2006 | 292 | 7 | -- | -- | -- |
| Apr 2006 | 289 | 11 | -- | -- | -- |
| Aug 2006 | 221 | 2 | -- | -- | -- |
| Oct 2006 | 291 | 31 | 1 | 10 | -- |
| Nov 2006 | 479 | 100 | 5 | 30 | -- |
| Dec 2006 | 201 | 32 | 5 | 10 | -- |
| Feb 2007 | 174 | 65 | 2 | 10 | -- |
| Apr 2007 | 127 | 57 | 2 | 10 | -- |
| Sep 2008 | 186 | 49 | 1 | 30 | 70 earthquakes on 4 Sep |
| Oct 2008 | 133 | 94 | 20 | 200 | -- |
| Nov 2008 | 106 | 54 | 25 | 200 | -- |
| Dec 2008 | 138 | 39 | 27 | 200 | -- |
| Apr 2009 | 124 | 67 | 12 | 400 | -- |
| May 2009 | 153 | 96 | 22 | 300 | -- |
| Sep 2009 | 177 | 6 | 10 | 200 | Earthquakes: 75 on 27 Sep, ~750 on 28-29 Sep. Tremors on 28 and 30 Sep. |
| Oct 2009 | 131 | 32 | 10 | 200 | All tremors during 1-6 Oct. |
A seismic swarm consisting of 70 events on 4 September 2008 resulted in the Alert Level increase already reported. The months of September-December 2008 included high numbers of tremor episodes (table 1). Large numbers of tremors were recorded again in April-May 2009. Seismicity decreased after that time, until an earthquake swarm was recorded during 27-29 September 2009 (about 150 earthquakes). Tremor events also increased briefly, with 38 between 28 September and 6 October 2009. White fumarolic plumes rising from the summit area increased in height (up to 400 m) and frequency (every 1-2 days) after September 2008 through 2009.
Information Contacts: Japan Meteorological Agency (JMA), Otemachi, 1-3-4, Chiyoda-ku Tokyo 100-8122, Japan (URL: http://www.jma.go.jp/)
Increased seismicity, 11 December 2011-5 January 2012
Since a small eruption in 1980, Kuchinoerabu-jima experienced numerous periods of elevated seismicity, with volcanic earthquakes and tremor detected at least through December 2009 (BGVN 35:11). The volcano is located in the Ryukyu Island arc, off Japan's SW coast (figure 4).
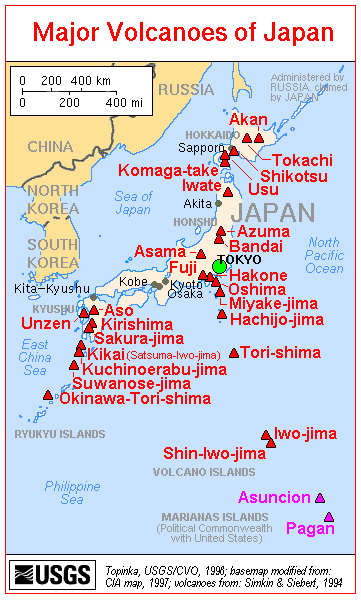 |
Figure 4. A map of the major volcanoes of Japan. Kuchinoerabu-jima is at the lower left. Courtesy of USGS/CVO. |
Recent monthly reports of volcanic activity from the Japan Meteorological Agency (JMA) translated into English resumed in October 2010. The only recent English-translated JMA report on Kuchinoerabu-jima available online through December 2012 was in January 2012. We know of no other recent report on this volcano's seismic activity; therefore, this report summarizes seismicity between December 2011 and January 2012.
According to JMA, seismicity increased to a relatively high level immediately after 11 December 2011, but then decreased on 5 January 2012. On 20 January 2012, the Alert Level was lowered from 2 to 1; JMA noted that the possibility of an eruption was minimal.
During the December 2011-January 2012 period, no significant change in plume activity was observed, and plume heights remained below 100 m above the crater. According to a field survey on 11 January, infrared images (compared to images obtained in December 2011) showed no significant change in temperature distribution either at the summit or on the W slope of Shin-dake (also refered to as Shin-take), the youngest and most active cone.
Field surveys found that sulfur dioxide levels were 50 and 100 metric tons/day on 12 and 13 January 2012, respectively, which were lower than those recorded in December 2011 (200 metric tons/day on 9 December 2011).
According to JMA, continuous GPS measurements have established a baseline across Shin-dake, collecting data since September 2010. Shin-dake's rate of change in surface deformation at the stations has been slowing since September 2011.
Information Contacts: Japan Meteorological Agency (JMA), Otemachi, 1-3-4, Chiyoda-ku Tokyo 100-8122, Japan (URL: http://www.jma.go.jp/).
Explosions on 3 August 2014, 29-30 May 2015 (with pyroclastic flow), and 18-19 June 2015
Intermittent ash explosions during the last century have characterized activity at Japan's Kuchinoerabujima volcano, located at the northern end of the Ryukyu Islands approximately 260 km S of Nagasaki, Japan. Brief periods of higher seismicity had been detected in the last approximately 30 years, although no explosions had been recorded since 1980 (BGVN 35:11 and 38:01). A new explosion occurred on 3 August 2014, and activity remained elevated through June 2015. Information on the latest activity is provided by the Japan Meteorological Agency (JMA) monthly reports and aviation alerts are from the Tokyo Volcanic Ash Advisory Center (VAAC).
A modest explosion from Shindake crater on 3 August 2014 caused JMA to increase the Alert Level at the volcano. Activity decreased shortly after the explosion, and only steam plumes, fumarolic activity, and occasional incandescence were observed for the next nine months. A large explosion on 29 May 2015 generated a gray-black ash plume that rose to over 9 km altitude and sent pyroclastic flows down the flanks; JMA increased the Alert Level and ordered evacuation of local residents. Activity declined after a few days, and Shindake remained quiet until a smaller explosion on 18 June 2015. The ash plume did not exceed 1 km, but ashfall was reported in towns on neighboring islands and in areas up to 80 km E. Two additional smaller explosions were reported on 18 and 19 June. Seismicity decreased significantly after the 19 June explosion, but SO2 emissions remained elevated until October 2015. The JMA did not lower the Alert Level until June 2016.
Activity during August 2014-February 2015. JMA reported an eruption from the vicinity of Shindake crater around noon local time on 3 August 2014, with a gray plume rising more than 800 m above the crater rim. This led to an increase in the Alert Level from 1 (Normal) to 3 (Do not approach the volcano) on a 5-level scale. An overflight confirmed traces of ash on the W flank. The Tokyo VAAC reported that the plume rose to an altitude greater than 1.5 km and drifted N. On 5 August, seismicity decreased, and views from a remote web camera showed a white plume rising 50 m above the crater rim. For the rest of August, seismicity remained low and steam plumes rose 50 to 800 m above the crater.
During September 2014, white plumes were generally observed 200-800 m above the crater when visibility was not obscured by weather; seismicity remained low. Scientists conducting a field survey on 12 September found SO2 emissions at 300 metric tons per day (t/d), higher than the background value of 60 t/d measured on 21 May 2014. Occasional earthquakes were recorded in October 2014, and the volume of gas emissions remained relatively high compared with before the August eruption; steam-and-gas plumes rose to 600 m above the crater rim. During field surveys on 7 and 8 October scientists measured SO2 emissions of 500 t/d. Gas emissions rose from within the Shindake crater, around a thermally anomalous fissure at the W edge of the crater, as well as from a new fumarole on the SW flank of the crater. In November, plumes continued to rise as high as 1,000 m above the crater. In another survey on 9 December 2014, scientists found that SO2 levels had increased to 1,700 t/d.
Emissions of SO2 remained high during the second half of January 2015, ranging from 1,100 to 3,100 t/d. A M 2.2 seismic event located 5 km beneath the island was recorded on 24 January. Observations made during field surveys in February confirmed continued steam emissions, and thermal anomalies from the W crater rim fissure and the new fissure on the SW flank. SO2 emissions decreased slightly from January levels to a range of 400 to 2,700 t/d in February, and steam plumes continued to rise 400-700 m above the crater.
Activity during March-June 2015. Incandescence at night was first recorded at the Shindake Crater from 24 to 31 March 2015 with a high-sensitivity camera. Aerial observation on 25 March by JMA and JCG (Japan Coast Guard) indicated a temperature rise and continued fumarolic activity around the thermal anomaly W of the crater rim. SO2 emissions remained high in March (1,000 to 3,700 t/d) and April (900 to 2,600 t/d), and steam plumes rose to 1 km above the crater. Incandescence was occasionally observed at night during April and again during 18-22 May; fumarolic activity continued along with a rise in temperature at the W and SW fissures. Steam plumes were observed rising to 600 m above the crater in May.
According to JMA, at 0959 local time on 29 May 2015, a large explosive phreatomagmatic eruption generated a gray-black ash plume that rose to over 9 km altitude and drifted ESE (figure 5). The plume was reported by the Tokyo VAAC to be at 10.9 km altitude about an hour after the eruption. The largest of several pyroclastic flows descended NW from the SW side of the crater in the Mukaehama district and reached the coast. Based on these events, JMA raised the Volcanic Alert Level to 5 (Evacuate). Aerial observation conducted on the same day (in collaboration with the Kyushu Regional Bureau of the Ministry of Land, Infrastructure, Transport and Tourism) revealed additional pyroclastic flows moving in nearly all directions from the Shindake crater (figure 6) including flows reaching halfway down the mountain to the SW and SE of the crater. Seismicity increased immediately after the eruption, but had decreased by midday.
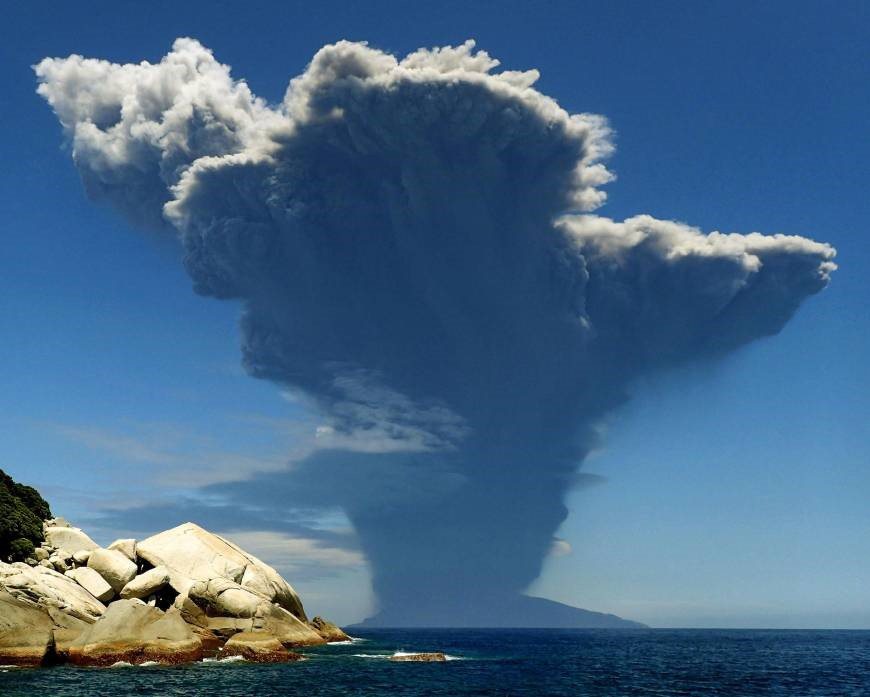 |
Figure 5. Ash plume from Kuchinoerabujima's Shindake Crater during an explosion on 29 May 2015. The plume height was reported by the Tokyo VAAC as 10.9 km altitude. Photo taken from the neighboring island of Yakushima by Itaru Takaku. Courtesy of Kyodo News and The Japan Times. |
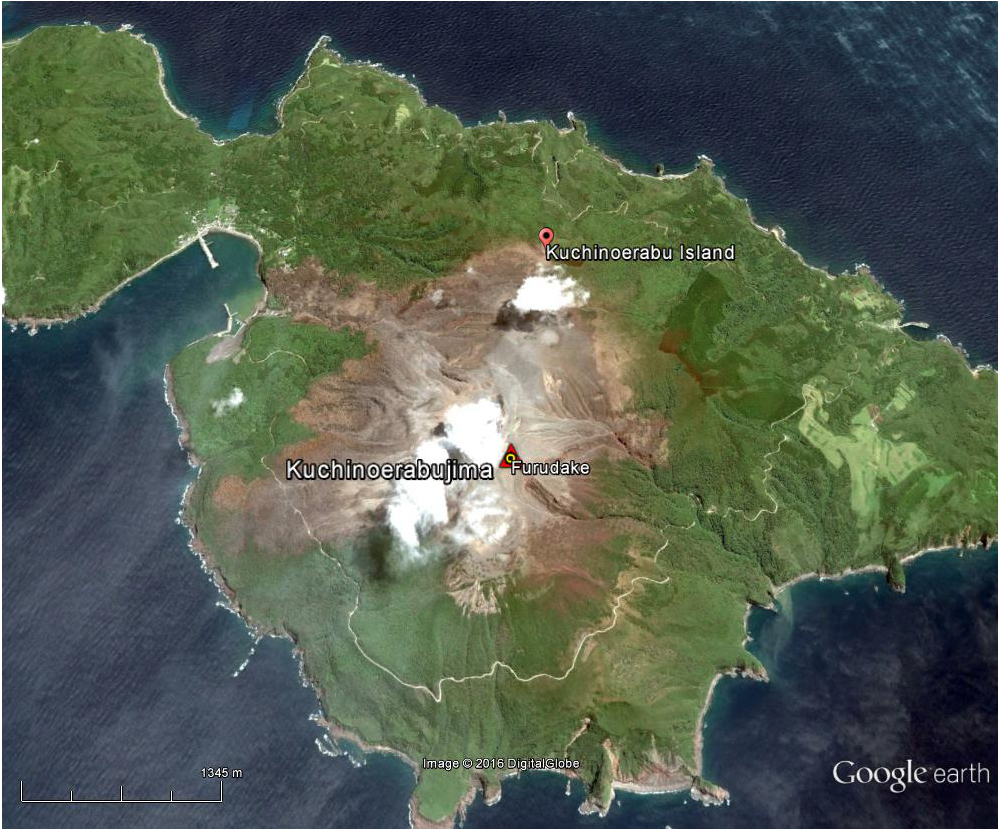 |
Figure 6. Google Earth imagery dated 5 June 2015, one week after a large explosion which generated several pyroclastic flows around the summit crater at Kuchinoerabujima. Note the brown areas extending in most directions away from the summit crater (beneath the white clouds), all the way to the coast on the NW and W flanks that are the result of the pyroclastic flows that occurred on 29 May 2015. Courtesy of Google Earth. |
According to a news article (The Japan Times), all residents and visitors (141 people) were safely evacuated by a ferry, coast guard ship, and helicopter to neighboring Yakushima Island (25 km SE). A resident of Yakushima reported that ash reached the island. Later that day, ash plumes rose 200 m and drifted SW.
Ash plumes continued the next day, 30 May, rising only 1.2 km. A field team observed discolored trees on the SE and SW flanks, and fallen trees near the coast on the NW flank. Cloud cover prevented views of the eruption area, but the team was able to confirm continued fumarolic activity and incandescence in the W part of the crater. Seismicity continued at low levels, and during the first week of June white plumes rose 100-400 m above the crater rim.
Another smaller eruption on 18 June 2015 caused lapilli and ash to fall on the E side of the island. Ash was reported in Yakushima Town (44 km ESE on Yakushima Island), Nishinoomote City (80 km NE on Tanegashima Island), and Nakatane Town (72 km E on Tanegashima). Small eruptions also occurred at 1631 on 18 June and at 0943 on 19 June. Tokyo VAAC reported the larger 18 June eruption, but plume heights were below 1 km, and not observed on satellite. Aerial observations on 20 June by JMA revealed no traces of new pyroclastic-flow deposits around the crater or on the flanks.
Post-eruption observations through June 2016. Emissions of SO2 remained elevated during June 2015 (800-1,700 t/d), and decreased somewhat in July to 500-700 t/d. They decreased further to 200-300 t/d in August. Increased seismicity was recorded briefly from 1-3 and 6-11 August. SO2 emissions continued to decline in September, except for a spike of 700 t/d on 10 September. Thermal infrared observations taken during a field survey in October 2015 indicated a decrease in temperature around the fissure W of the crater rim since the 29 May eruption. Emissions of SO2 remained below 300 t/d for the remainder of 2015 and no further activity was reported, although the Alert Level remained at 5. On 14 June 2016, JMA lowered the Alert Level to 3; seismic activity and SO2 flux values were below levels detected prior to the May-June 2015 eruption.
Information Contacts: Japan Meteorological Agency (JMA), Otemachi, 1-3-4, Chiyoda-ku Tokyo 100-8122, Japan (URL: http://www.jma.go.jp/); Tokyo Volcanic Ash Advisory Center (VAAC), 1-3-4 Otemachi, Chiyoda-ku, Tokyo, Japan (URL: http://ds.data.jma.go.jp/svd/vaac/data/); Google Earth (URL: https://www.google.com/earth/); The Japan Times (URL: http://www.japantimes.co.jp/news/2015/05/29/national/volcano-erupts-isle-kagoshima-prompting-evacuation-order/).
Weak explosions and ash plumes beginning 21 October 2018
Activity at Kuchinoerabujima is exemplified by interim explosions and periods of high seismicity. A weak explosion occurred on 3 August 2014, the first since 1980, and was followed by several others during 29 May-19 June 2015 (BGVN 42:03). This report describes events through February 2019. Information is based on monthly and annual reports from the Japan Meteorological Agency (JMA) and advisories from the Tokyo Volcanic Ash Advisory Center (VAAC). Activity has been limited to Kuchinoerabujima's Shindake Crater.
Activity during 2016-2018. According to JMA, between July 2016 and August 2018, the volcano was relatively quiet. Deflation had occurred since January 2016. On 18 April 2018 the Alert Level was lowered from 3 to 2 (on a scale of 1-5). A low-temperature thermal anomaly persisted near the W fracture in Shindake crater. During January-March 2018, both the number of volcanic earthquakes (generally numerous and typically shallow) and sulfur dioxide flux remained slightly above baselines levels in August 2014 (60-500 tons/day compared tp generally less than 100 tons/day in August 2014).
JMA reported that on 15 August 2018 a swarm of deep volcanic earthquakes was recorded, prompting an increase in the Alert Level to 4. The earthquake hypocenters were about 5 km deep, below the SW flanks of Shindake, and the maximum magnitude was 1.9. They occurred at about the same place as the swarm that occurred just before the May 2015 eruption. Sulfur dioxide emissions had increased since the beginning of August; they were 1,600, 1,000, and 1,200 tons/day on 11, 13, and 17 August, respectively. No surficial changes in gas emissions or thermal areas were observed during 16-20 August. On 29 August, JMA downgraded the Alert Level to 3, after no further SO2 flux increase had occurred in recent days and GNSS measurements had not changed.
A very weak explosion was recorded at 1831 on 21 October, with additional activity between 2110 on 21 October and 1350 on 22 October; plumes rose 200 m above the crater rim. During an overflight on 22 October, observers noted ash in the emissions, though no morphological changes to the crater nor ash deposits were seen. Based on satellite images and information from JMA, the Tokyo VAAC reported that during 24-28 October ash plumes rose to altitudes of 0.9-1.5 km and drifted in multiple directions. During a field observation on 28 October, JMA scientists did not observe any changes in the thermal anomalies at the crater.
JMA reported that during 31 October-5 November 2018, very small events released plumes that rose 500-1,200 m above the crater rim. On 6 November, crater incandescence began to be periodically visible. During 12-19 November, ash plumes rose as high as 1.2 km above the crater rim and, according to the Tokyo VAAC, drifted in multiple directions. Observers doing fieldwork on 14 and 15 November noted that thermal measurements in the crater had not changed. Intermittent explosions during 22-26 November generated plumes that rose as high as 2.1 km above the crater rim. During 28 November-3 December the plumes rose as high as 1.5 km above the rim.
JMA reported that at 1637 on 18 December an explosion produced an ash plume that rose 2 km and then disappeared into a weather cloud. The event ejected material that fell in the crater area, and generated a pyroclastic flow that traveled 1 km W and 500 m E of the crater. Another weak explosion occurred on 28 December, scattering large cinders up to 500 m from the crater.
The Tokyo VAAC did not issue any ash advisories for aviation until 21 October 2018, when it issued at least one report every day through 13 December. It also issued advisories on 18-20 and 28 December.
Activity during January-early February 2019. JMA reported that at 0919 local time on 17 January 2019 an explosion generated a pyroclastic flow that reached about 1.9 km NW and 1 km E of the crater. It was the strongest explosion since October 2018. In addition, "large cinders" fell about 1-1.8 km from the crater.
Tokyo VAAC ash advisories were issued on 1, 17, 20, and 29 January 2018. An explosion at 1713-1915 on 29 January produced an ash plume that rose 4 km above the crater rim and drifted E, along with a pyroclastic flow. Ash fell in parts of Yakushima. During 30 January-1 February and 3-5 February, white plumes rose as high as 600 m. On 2 February, an explosion at 1141-1300 generated a plume that rose 600 m. No additional activity during February was reported by JMA. The Alert Level remained at 3.
Information Contacts: Japan Meteorological Agency (JMA), Otemachi, 1-3-4, Chiyoda-ku Tokyo 100-8122, Japan (URL: http://www.jma.go.jp/); Tokyo Volcanic Ash Advisory Center (VAAC), 1-3-4 Otemachi, Chiyoda-ku, Tokyo, Japan (URL: http://ds.data.jma.go.jp/svd/vaac/data/).
Eruption and ash plumes begin on 11 January 2020 and continue through April 2020
Kuchinoerabujima encompasses a group of young stratovolcanoes located in the northern Ryukyu Islands. All historical eruptions have originated from the Shindake cone, with the exception of a lava flow that originated from the S flank of the Furudake cone. The most recent previous eruptive period took place during October 2018-February 2019 and primarily consisted of weak explosions, ash plumes, and ashfall. The current eruption began on 11 January 2020 after nearly a year of dominantly gas-and-steam emissions. Volcanism for this reporting period from March 2019 to April 2020 included explosions, ash plumes, SO2 emissions, and ashfall. The primary source of information for this report comes from monthly and annual reports from the Japan Meteorological Agency (JMA) and advisories from the Tokyo Volcanic Ash Advisory Center (VAAC). Activity has been limited to Kuchinoerabujima's Shindake Crater.
Volcanism at Kuchinoerabujima was relatively low during March through December 2019, according to JMA. During this time, SO2 emissions ranged from 100 to 1,000 tons/day. Gas-and-steam emissions were frequently observed throughout the entire reporting period, rising to a maximum height of 1.1 km above the crater on 13 December 2019. Satellite imagery from Sentinel-2 showed gas-and-steam and occasional ash emissions rising from the Shindake crater throughout the reporting period (figure 7). Though JMA reported thermal anomalies occurring on 29 January and continuing through late April 2020, Sentinel-2 imagery shows the first thermal signature appearing on 26 April.
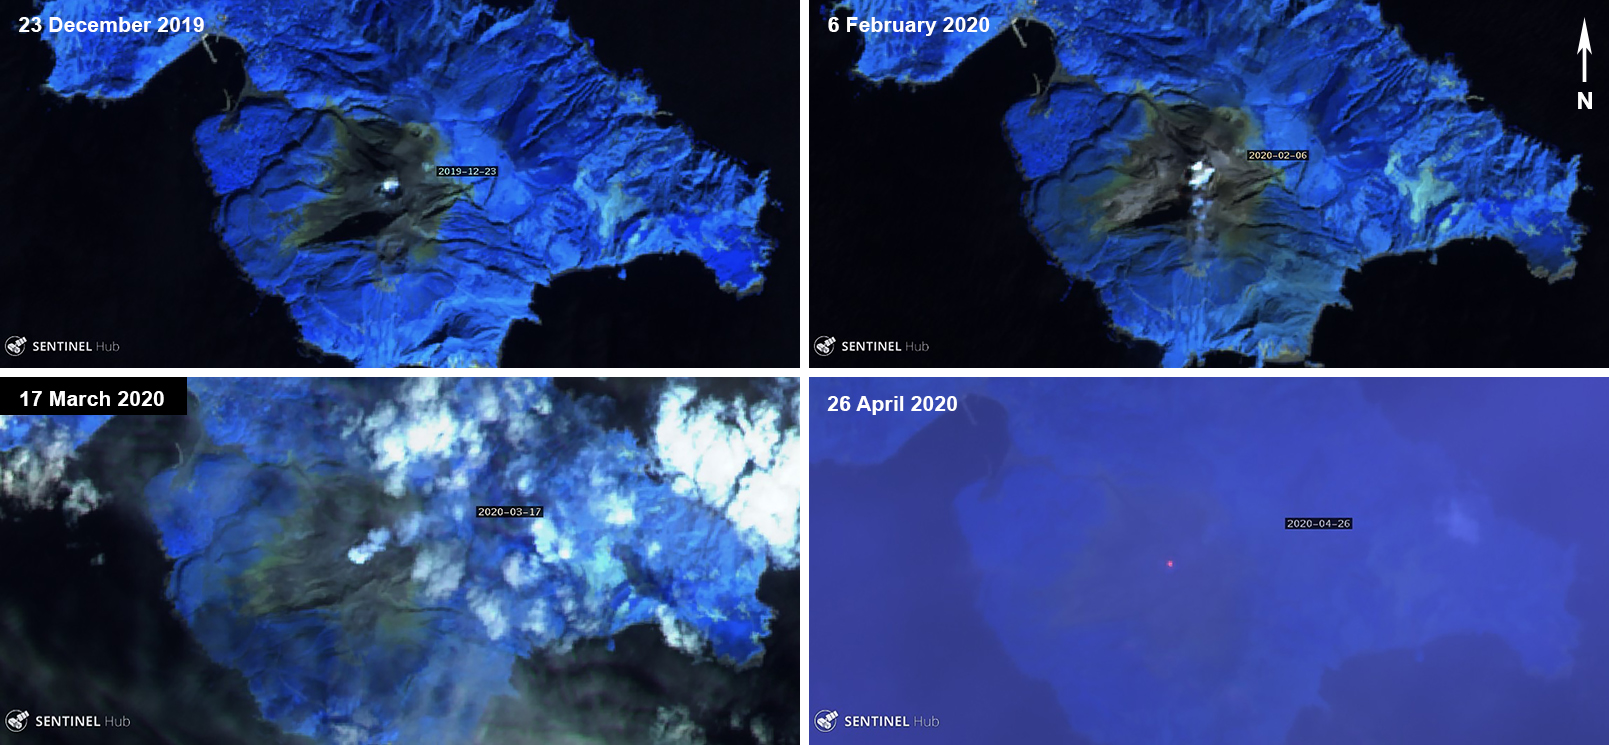 |
Figure 7. Sentinel-2 thermal satellite images showed gas-and-steam and ash emissions rising from Kuchinoerabujima. Some ash deposits can be seen on 6 February 2020 (top right). A thermal anomaly appeared on 26 April 2020 (bottom right). Sentinel-2 atmospheric penetration (bands 12, 11, 8A) images courtesy of Sentinel Hub Playground. |
An eruption on 11 January 2020 at 1505 ejected material 300 m from the crater and produced ash plumes that rose 2 km above the crater rim, extending E, according to JMA. The eruption continued through 12 January until 0730. The resulting ash plumes rose 400 m above the crater, drifting SW while the SO2 emissions measured 1,300 tons/day. Ashfall was reported on Yakushima Island (15 km E). Minor eruptive activity was reported during 17-20 January which produced gray-white plumes that rose 300-500 m above the crater. On 23 January, seismicity increased, and an eruption produced an ash plume that rose 1.2 km altitude, according to a Tokyo VAAC report, resulting in ashfall 2 km NE of the crater. A small explosion was detected on 24 January, followed by an increase in the number of earthquakes during 25-26 January (65-71 earthquakes per day were registered). Another small eruptive event detected on 27 January at 0148 was accompanied by a volcanic tremor and a change in tilt data. During the month of January, some inflation was detected at the base on the volcano and a total of 347 earthquakes were recorded. The SO2 emissions ranged from 200-1,600 tons/day.
An eruption on 1 February 2020 produced an eruption column that rose less than 1 km altitude and extended SE and SW (figure 8), according to the Tokyo VAAC report. On 3 February, an eruption from the Shindake crater at 0521 produced an ash plume that rose 7 km above the crater and ejected material as far as 600 m away. As a result, a pyroclastic flow formed, traveling 900-1,500 m SW. The previous pyroclastic flow that was recorded occurred on 29 January 2019. Ashfall was confirmed in the N part of Yakushima Island with a large amount in Miyanoura (32 km ESE) and southern Tanegashima. The SO2 emissions measured 1,700 tons/day during this event.
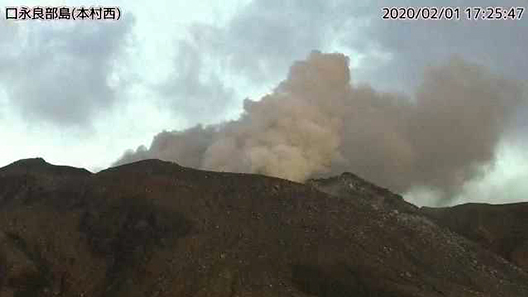 |
Figure 8. Webcam images from the Honmura west surveillance camera of an ash plume rising from Kuchinoerabujima on 1 February 2020. Courtesy of JMA (Weekly bulletin report 509, February 2020). |
Intermittent small eruptive events occurred during 5-9 February; field observations showed a large amount of ashfall on the SE flank which included lapilli that measured up to 2 cm in diameter. Additionally, thermal images showed 5-km-long pyroclastic flow deposits on the SW flank. An eruption on 9 February produced an ash plume that rose 1.2 km altitude, drifting SE. On 13 February a small eruption was detected in the Shindake crater at 1211, producing gray-white plumes that rose 300 m above the crater, drifting NE. Small eruptive events also occurred during 20-21 February, resulting in gas-and-steam emissions that rose 200 m above the crater. During the month of February, some horizontal extension was observed since January 2020 using GNSS data. The total number of earthquakes during this month drastically increased to 1225 compared to January. The SO2 emissions ranged from 300-1,700 tons/day.
By 2 March 2020, seismicity decreased, and activity declined. Gas-and-steam emissions continued infrequently for the duration of the reporting period. The SO2 emissions during March ranged from 700-2,100 tons/day, the latter of which occurred on 15 March. Seismicity increased again on 27 March. During 5-8 April 2020, small eruptive events were detected, generating ash plumes that rose 900 m above the crater (figure 9). The SO2 emissions on 6 April reached 3,200 tons/day, the maximum measurement for this reporting period. These small eruptive events continued from 13-20 and 23-25 April within the Shindake crater, producing gray-white plumes that rose 300-800 m above the crater.
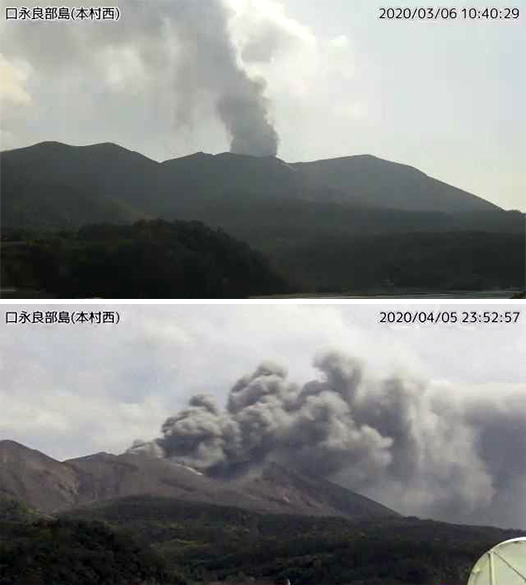 |
Figure 9. Webcam images from the Honmura Nishi (top) and Honmura west (bottom) surveillance cameras of ash plumes rising from Kuchinoerabujima on 6 March and 5 April 2020. Courtesy of JMA (Weekly bulletin report 509, March and April 2020). |
Information Contacts: Japan Meteorological Agency (JMA), 1-3-4 Otemachi, Chiyoda-ku, Tokyo 100-8122, Japan (URL: http://www.jma.go.jp/jma/indexe.html); Tokyo Volcanic Ash Advisory Center (VAAC), 1-3-4 Otemachi, Chiyoda-ku, Tokyo 100-8122, Japan (URL: http://ds.data.jma.go.jp/svd/vaac/data/); Sentinel Hub Playground (URL: https://www.sentinel-hub.com/explore/sentinel-playground).
Intermittent thermal anomalies and small eruptions in May and August 2020
Kuchinoerabujima encompasses a group of young stratovolcanoes located in the northern Ryukyu Islands. All historical eruptions have originated from the Shindake cone, with the exception of a lava flow that originated from the S flank of the Furudake cone. The current eruptive period began in January 2020 and has been characterized by small explosions, ash plumes, ashfall, a pyroclastic flow, and gas-and-steam emissions. This report covers activity from May to October 2020, which includes small explosions, ash plumes, crater incandescence, and gas-and-steam emissions. The primary source of information for this report comes from monthly and annual reports from the Japan Meteorological Agency (JMA) and advisories from the Tokyo Volcanic Ash Advisory Center (VAAC).
Volcanism at Kuchinoerabujima remained relatively low during May through October 2020, according to JMA. During this time, SO2 emissions ranged from 40 to 3,400 tons/day; occasional gas-and-steam emissions were reported, rising to a maximum of 900 m above the crater. Sentinel-2 satellite images showed a particularly strong thermal anomaly in the Shindake crater on 1 May (figure 10). The thermal anomaly decreased in power after 1 May and was only visible on clear weather days, which included 19 August and 3 and 13 October. Global Navigation Satellite System (GNSS) observations identified continued slight inflation at the base of the volcano during the entire reporting period.
|
Figure 10. Sentinel-2 thermal satellite images showed a strong thermal anomaly (bright yellow-orange) in the Shindake crater at Kuchinoerabujima on 1 May 2020 (top left). Weaker thermal anomalies were also seen in the Shindake crater during 19 August (top right) and 3 (bottom left) and 13 (bottom right) October 2020. Sentinel-2 atmospheric penetration (bands 12, 11, 8A) images; courtesy of Sentinel Hub Playground. |
Three small eruptions were detected by JMA on 5, 6, and 13 May, which produced an ash plume rising 500 m above the crater on each day, resulting in ashfall on the downwind flanks. Incandescence was observed at night using a high-sensitivity surveillance camera (figure 11). On 5 and 13 May the Tokyo VAAC released a notice that reported ash plumes rising 0.9-1.2 km altitude, drifting NE and S, respectively. On 20 May weak fumaroles were observed on the W side of the Shindake crater. The SO2 emissions ranged from 700-3,400 tons/day.
|
Figure 11. Webcam images of an eruption at Kuchinoerabujima on 6 May 2020 (top), producing a gray ash plume that rose 500 m above the crater. Crater incandescence was observed from the summit crater at night on 25 May 2020 (bottom). Courtesy of JMA (Monthly bulletin report 509, May 2020). |
Activity during June and July decreased compared to May, with gas-and-steam emissions occurring more prominently. On 22 June weak incandescence was observed, accompanied by white gas-and-steam emissions rising 700 m above the crater. Weak crater incandescence was also seen on 25 June. The SO2 emissions measured 400-1,400 tons/day. White gas-and-steam emissions were again observed on 31 July rising to 800 m above the crater. The SO2 emissions had decreased during this time to 300-700 tons/day.
According to JMA, the most recent eruptive event occurred on 29 August at 1746, which ejected bombs and was accompanied by some crater incandescence, though the eruptive column was not visible due to the cloud cover. However, white gas-and-steam emissions could be seen rising 1.3 km above the Shindake crater drifting SW. The SO2 emissions measured 200-500 tons/day. During August, the number of volcanic earthquakes increased significantly to 1,032, compared to the number in July (36).
The monthly bulletin for September reported white gas-and-steam emissions rising 900 m above the crater on 9 September and on 11 October the gas-and-steam emissions rose 600 m above the crater. Seismicity decreased between September and October from 1,920 to 866. The SO2 emissions continued to decrease compared to previous months, totaling 80-400 tons/day in September and 40-300 tons/day in October.
Information Contacts: Japan Meteorological Agency (JMA), 1-3-4 Otemachi, Chiyoda-ku, Tokyo 100-8122, Japan (URL: http://www.jma.go.jp/jma/indexe.html); Tokyo Volcanic Ash Advisory Center (VAAC), 1-3-4 Otemachi, Chiyoda-ku, Tokyo 100-8122, Japan (URL: http://ds.data.jma.go.jp/svd/vaac/data/); Sentinel Hub Playground (URL: https://www.sentinel-hub.com/explore/sentinel-playground).
|
|
||||||||||||||||||||||||||||
There is data available for 29 confirmed Holocene eruptive periods.
2020 Aug 29 - 2020 Aug 29 Confirmed Eruption (Explosive / Effusive) VEI: 1
| Episode 1 | Eruption (Explosive / Effusive) | |||||||||||||||||||||||||
|---|---|---|---|---|---|---|---|---|---|---|---|---|---|---|---|---|---|---|---|---|---|---|---|---|---|
| 2020 Aug 29 - 2020 Aug 29 | Evidence from Observations: Reported | ||||||||||||||||||||||||
|
List of 3 Events for Episode 1
|
|||||||||||||||||||||||||
2020 Jan 11 - 2020 May 13 Confirmed Eruption (Explosive / Effusive) VEI: 3
| Episode 1 | Eruption (Explosive / Effusive) | |||||||||||||||
|---|---|---|---|---|---|---|---|---|---|---|---|---|---|---|---|
| 2020 Jan 11 - 2020 May 13 | Evidence from Observations: Reported | ||||||||||||||
|
List of 1 Events for Episode 1
|
|||||||||||||||
2018 Oct 21 - 2019 Feb 3 Confirmed Eruption (Explosive / Effusive) VEI: 3
| Episode 1 | Eruption (Explosive / Effusive) | Shindake Crater | |||||||||||||||||||||||||||||||||||||||||||||||||||||||||||||||||||||||||||||||||||||||||||||||||||||||||||||||||||||||||||||||||||||||||||
|---|---|---|---|---|---|---|---|---|---|---|---|---|---|---|---|---|---|---|---|---|---|---|---|---|---|---|---|---|---|---|---|---|---|---|---|---|---|---|---|---|---|---|---|---|---|---|---|---|---|---|---|---|---|---|---|---|---|---|---|---|---|---|---|---|---|---|---|---|---|---|---|---|---|---|---|---|---|---|---|---|---|---|---|---|---|---|---|---|---|---|---|---|---|---|---|---|---|---|---|---|---|---|---|---|---|---|---|---|---|---|---|---|---|---|---|---|---|---|---|---|---|---|---|---|---|---|---|---|---|---|---|---|---|---|---|---|---|---|---|---|
| 2018 Oct 21 - 2019 Feb 3 | Evidence from Observations: Reported | |||||||||||||||||||||||||||||||||||||||||||||||||||||||||||||||||||||||||||||||||||||||||||||||||||||||||||||||||||||||||||||||||||||||||||
|
List of 26 Events for Episode 1 at Shindake Crater
|
||||||||||||||||||||||||||||||||||||||||||||||||||||||||||||||||||||||||||||||||||||||||||||||||||||||||||||||||||||||||||||||||||||||||||||
2015 May 29 - 2015 Jun 19 Confirmed Eruption (Explosive / Effusive) VEI: 3
| Episode 1 | Non-eruptive (Precursory) | Shindake Crater | ||||||||||||||||||||||||||||||||||||||||||||||||||||||
|---|---|---|---|---|---|---|---|---|---|---|---|---|---|---|---|---|---|---|---|---|---|---|---|---|---|---|---|---|---|---|---|---|---|---|---|---|---|---|---|---|---|---|---|---|---|---|---|---|---|---|---|---|---|---|---|
| 2015 Feb 10 - 2015 May 22 (on or after) | Evidence from Observations: Reported | ||||||||||||||||||||||||||||||||||||||||||||||||||||||
|
List of 9 Events for Episode 1 at Shindake Crater
|
|||||||||||||||||||||||||||||||||||||||||||||||||||||||
| Episode 2 | Eruption (Explosive / Effusive) | Shindake crater | |||||||||||||||||||||||||||||||||||||||||||||||||||||||||||||||||||||||||||||||
|---|---|---|---|---|---|---|---|---|---|---|---|---|---|---|---|---|---|---|---|---|---|---|---|---|---|---|---|---|---|---|---|---|---|---|---|---|---|---|---|---|---|---|---|---|---|---|---|---|---|---|---|---|---|---|---|---|---|---|---|---|---|---|---|---|---|---|---|---|---|---|---|---|---|---|---|---|---|---|---|---|
| 2015 May 29 - 2015 Jun 19 | Evidence from Observations: Reported | |||||||||||||||||||||||||||||||||||||||||||||||||||||||||||||||||||||||||||||||
|
List of 14 Events for Episode 2 at Shindake crater
|
||||||||||||||||||||||||||||||||||||||||||||||||||||||||||||||||||||||||||||||||
2014 Aug 3 - 2014 Aug 3 Confirmed Eruption (Explosive / Effusive) VEI: 1
| Episode 1 | Eruption (Explosive / Effusive) | Shindake | ||||||||||||||||||||||||||||||||||
|---|---|---|---|---|---|---|---|---|---|---|---|---|---|---|---|---|---|---|---|---|---|---|---|---|---|---|---|---|---|---|---|---|---|---|---|
| 2014 Aug 3 - 2014 Aug 3 | Evidence from Observations: Reported | ||||||||||||||||||||||||||||||||||
|
List of 5 Events for Episode 1 at Shindake
|
|||||||||||||||||||||||||||||||||||
1980 Sep 28 - 1980 Sep 28 Confirmed Eruption (Explosive / Effusive) VEI: 2
| Episode 1 | Eruption (Explosive / Effusive) | NNE-SSW fissure on E side of Shindake | ||||||||||||||||||||||||||||||||||
|---|---|---|---|---|---|---|---|---|---|---|---|---|---|---|---|---|---|---|---|---|---|---|---|---|---|---|---|---|---|---|---|---|---|---|---|
| 1980 Sep 28 - 1980 Sep 28 | Evidence from Observations: Reported | ||||||||||||||||||||||||||||||||||
|
List of 5 Events for Episode 1 at NNE-SSW fissure on E side of Shindake
|
|||||||||||||||||||||||||||||||||||
1976 Apr 2 - 1976 Apr 2 Confirmed Eruption (Explosive / Effusive) VEI: 2
| Episode 1 | Eruption (Explosive / Effusive) | Shindake | |||||||||||||||||||||||||||||||||||||||
|---|---|---|---|---|---|---|---|---|---|---|---|---|---|---|---|---|---|---|---|---|---|---|---|---|---|---|---|---|---|---|---|---|---|---|---|---|---|---|---|---|
| 1976 Apr 2 - 1976 Apr 2 | Evidence from Observations: Reported | |||||||||||||||||||||||||||||||||||||||
|
List of 6 Events for Episode 1 at Shindake
|
||||||||||||||||||||||||||||||||||||||||
1974 Jun 3 - 1974 Jun 3 Confirmed Eruption (Explosive / Effusive) VEI: 1
| Episode 1 | Eruption (Explosive / Effusive) | Shindake | ||||||||||||||||||||||||
|---|---|---|---|---|---|---|---|---|---|---|---|---|---|---|---|---|---|---|---|---|---|---|---|---|---|
| 1974 Jun 3 - 1974 Jun 3 | Evidence from Observations: Reported | ||||||||||||||||||||||||
|
List of 3 Events for Episode 1 at Shindake
|
|||||||||||||||||||||||||
1973 Nov 5 - 1973 Nov 19 Confirmed Eruption (Explosive / Effusive) VEI: 2
| Episode 1 | Eruption (Explosive / Effusive) | Shindake | ||||||||||||||||||||||||
|---|---|---|---|---|---|---|---|---|---|---|---|---|---|---|---|---|---|---|---|---|---|---|---|---|---|
| 1973 Nov 5 - 1973 Nov 19 | Evidence from Observations: Reported | ||||||||||||||||||||||||
|
List of 3 Events for Episode 1 at Shindake
|
|||||||||||||||||||||||||
1972 Sep 2 - 1972 Sep 2 Confirmed Eruption (Explosive / Effusive) VEI: 2
| Episode 1 | Eruption (Explosive / Effusive) | Shindake | |||||||||||||||||||
|---|---|---|---|---|---|---|---|---|---|---|---|---|---|---|---|---|---|---|---|---|
| 1972 Sep 2 - 1972 Sep 2 | Evidence from Observations: Reported | |||||||||||||||||||
|
List of 2 Events for Episode 1 at Shindake
|
||||||||||||||||||||
1968 Dec 21 - 1969 Mar 10 Confirmed Eruption (Explosive / Effusive) VEI: 3
| Episode 1 | Eruption (Explosive / Effusive) | Shindake | |||||||||||||||||||||||||||||||||||||||
|---|---|---|---|---|---|---|---|---|---|---|---|---|---|---|---|---|---|---|---|---|---|---|---|---|---|---|---|---|---|---|---|---|---|---|---|---|---|---|---|---|
| 1968 Dec 21 - 1969 Mar 10 | Evidence from Observations: Reported | |||||||||||||||||||||||||||||||||||||||
|
List of 6 Events for Episode 1 at Shindake
|
||||||||||||||||||||||||||||||||||||||||
1966 Nov 22 - 1966 Nov 22 Confirmed Eruption (Explosive / Effusive) VEI: 2
| Episode 1 | Eruption (Explosive / Effusive) | Shindake | ||||||||||||||||||||||||
|---|---|---|---|---|---|---|---|---|---|---|---|---|---|---|---|---|---|---|---|---|---|---|---|---|---|
| 1966 Nov 22 - 1966 Nov 22 | Evidence from Observations: Reported | ||||||||||||||||||||||||
|
List of 3 Events for Episode 1 at Shindake
|
|||||||||||||||||||||||||
1945 Nov 3 - 1945 Nov 3 Confirmed Eruption (Explosive / Effusive) VEI: 2
| Episode 1 | Eruption (Explosive / Effusive) | NNE-SSW fissure on E side of Shindake | |||||||||||||||||||||||||||||
|---|---|---|---|---|---|---|---|---|---|---|---|---|---|---|---|---|---|---|---|---|---|---|---|---|---|---|---|---|---|---|
| 1945 Nov 3 - 1945 Nov 3 | Evidence from Observations: Reported | |||||||||||||||||||||||||||||
|
List of 4 Events for Episode 1 at NNE-SSW fissure on E side of Shindake
|
||||||||||||||||||||||||||||||
1933 Dec 23 - 1934 Jan 12 Confirmed Eruption (Explosive / Effusive) VEI: 4 (?)
| Episode 1 | Eruption (Explosive / Effusive) | Shindake | ||||||||||||||||||||||||||||||||||||||||||||||||||||||
|---|---|---|---|---|---|---|---|---|---|---|---|---|---|---|---|---|---|---|---|---|---|---|---|---|---|---|---|---|---|---|---|---|---|---|---|---|---|---|---|---|---|---|---|---|---|---|---|---|---|---|---|---|---|---|---|
| 1933 Dec 23 - 1934 Jan 12 | Evidence from Observations: Reported | ||||||||||||||||||||||||||||||||||||||||||||||||||||||
|
List of 9 Events for Episode 1 at Shindake
|
|||||||||||||||||||||||||||||||||||||||||||||||||||||||
[ 1932 Jul 23 - 1932 Jul 23 ] Uncertain Eruption
| Episode 1 | Eruption (Explosive / Effusive) | Shindake | |||||||||||||||||||||||||||||
|---|---|---|---|---|---|---|---|---|---|---|---|---|---|---|---|---|---|---|---|---|---|---|---|---|---|---|---|---|---|---|
| 1932 Jul 23 - 1932 Jul 23 | Evidence from Unknown | |||||||||||||||||||||||||||||
|
List of 4 Events for Episode 1 at Shindake
|
||||||||||||||||||||||||||||||
1931 Apr 2 - 1931 Jun 22 Confirmed Eruption (Explosive / Effusive) VEI: 3 (?)
| Episode 1 | Eruption (Explosive / Effusive) | SW flank of Shindake | |||||||||||||||||||||||||||||||||||||||||||||||||||||||||||||||||||||
|---|---|---|---|---|---|---|---|---|---|---|---|---|---|---|---|---|---|---|---|---|---|---|---|---|---|---|---|---|---|---|---|---|---|---|---|---|---|---|---|---|---|---|---|---|---|---|---|---|---|---|---|---|---|---|---|---|---|---|---|---|---|---|---|---|---|---|---|---|---|---|
| 1931 Apr 2 - 1931 Jun 22 | Evidence from Observations: Reported | |||||||||||||||||||||||||||||||||||||||||||||||||||||||||||||||||||||
|
List of 12 Events for Episode 1 at SW flank of Shindake
|
||||||||||||||||||||||||||||||||||||||||||||||||||||||||||||||||||||||
1914 Jan 5 Confirmed Eruption (Explosive / Effusive) VEI: 2 (?)
| Episode 1 | Eruption (Explosive / Effusive) | Shindake | ||||||||||||||||||||||||||||||||||
|---|---|---|---|---|---|---|---|---|---|---|---|---|---|---|---|---|---|---|---|---|---|---|---|---|---|---|---|---|---|---|---|---|---|---|---|
| 1914 Jan 5 - Unknown | Evidence from Observations: Reported | ||||||||||||||||||||||||||||||||||
|
List of 5 Events for Episode 1 at Shindake
|
|||||||||||||||||||||||||||||||||||
[ 1906 - 1907 ] Uncertain Eruption
| Episode 1 | Eruption (Explosive / Effusive) | Shindake | ||||||||||||||
|---|---|---|---|---|---|---|---|---|---|---|---|---|---|---|---|
| 1906 - 1907 | Evidence from Unknown | ||||||||||||||
|
List of 1 Events for Episode 1 at Shindake
|
|||||||||||||||
1841 May 23 - 1841 Aug 1 Confirmed Eruption (Explosive / Effusive) VEI: 2
| Episode 1 | Eruption (Explosive / Effusive) | Shindake | ||||||||||||||||||||||||||||||||||
|---|---|---|---|---|---|---|---|---|---|---|---|---|---|---|---|---|---|---|---|---|---|---|---|---|---|---|---|---|---|---|---|---|---|---|---|
| 1841 May 23 - 1841 Aug 1 | Evidence from Observations: Reported | ||||||||||||||||||||||||||||||||||
|
List of 5 Events for Episode 1 at Shindake
|
|||||||||||||||||||||||||||||||||||
1840 (in or before) Confirmed Eruption (Explosive / Effusive) VEI: 2 (?)
| Episode 1 | Eruption (Explosive / Effusive) | Shindake | ||||||||||||||
|---|---|---|---|---|---|---|---|---|---|---|---|---|---|---|---|
| 1840 (in or before) - Unknown | Evidence from Observations: Reported | ||||||||||||||
|
List of 1 Events for Episode 1 at Shindake
|
|||||||||||||||
1560 ± 100 years Confirmed Eruption (Explosive / Effusive)
| Episode 1 | Eruption (Explosive / Effusive) | Furudake | |||||||||||||||||||
|---|---|---|---|---|---|---|---|---|---|---|---|---|---|---|---|---|---|---|---|---|
| 1560 ± 100 years - Unknown | Evidence from Isotopic: 14C (calibrated) | |||||||||||||||||||
|
List of 2 Events for Episode 1 at Furudake
|
||||||||||||||||||||
1470 ± 50 years Confirmed Eruption (Explosive / Effusive)
| Episode 1 | Eruption (Explosive / Effusive) | Furudake | |||||||||||||||||||
|---|---|---|---|---|---|---|---|---|---|---|---|---|---|---|---|---|---|---|---|---|
| 1470 ± 50 years - Unknown | Evidence from Isotopic: 14C (calibrated) | |||||||||||||||||||
|
List of 2 Events for Episode 1 at Furudake
|
||||||||||||||||||||
1440 ± 50 years Confirmed Eruption (Explosive / Effusive)
| Episode 1 | Eruption (Explosive / Effusive) | Shindake, N-1? tephra | |||||||||||||||||||
|---|---|---|---|---|---|---|---|---|---|---|---|---|---|---|---|---|---|---|---|---|
| 1440 ± 50 years - Unknown | Evidence from Isotopic: 14C (calibrated) | |||||||||||||||||||
|
List of 2 Events for Episode 1 at Shindake, N-1? tephra
|
||||||||||||||||||||
1110 ± 75 years Confirmed Eruption (Explosive / Effusive)
| Episode 1 | Eruption (Explosive / Effusive) | Furudake | |||||||||||||||||||
|---|---|---|---|---|---|---|---|---|---|---|---|---|---|---|---|---|---|---|---|---|
| 1110 ± 75 years - Unknown | Evidence from Isotopic: 14C (calibrated) | |||||||||||||||||||
|
List of 2 Events for Episode 1 at Furudake
|
||||||||||||||||||||
1100 ± 100 years Confirmed Eruption (Explosive / Effusive)
| Episode 1 | Eruption (Explosive / Effusive) | Shindake, N-5 tephra | |||||||||||||||||||
|---|---|---|---|---|---|---|---|---|---|---|---|---|---|---|---|---|---|---|---|---|
| 1100 ± 100 years - Unknown | Evidence from Isotopic: 14C (calibrated) | |||||||||||||||||||
|
List of 2 Events for Episode 1 at Shindake, N-5 tephra
|
||||||||||||||||||||
0970 ± 75 years Confirmed Eruption (Explosive / Effusive)
| Episode 1 | Eruption (Explosive / Effusive) | Furudake | |||||||||||||||||||
|---|---|---|---|---|---|---|---|---|---|---|---|---|---|---|---|---|---|---|---|---|
| 0970 ± 75 years - Unknown | Evidence from Isotopic: 14C (calibrated) | |||||||||||||||||||
|
List of 2 Events for Episode 1 at Furudake
|
||||||||||||||||||||
0600 ± 75 years Confirmed Eruption (Explosive / Effusive)
| Episode 1 | Eruption (Explosive / Effusive) | Shindake, N-6 tephra | |||||||||||||||||||
|---|---|---|---|---|---|---|---|---|---|---|---|---|---|---|---|---|---|---|---|---|
| 0600 ± 75 years - Unknown | Evidence from Isotopic: 14C (calibrated) | |||||||||||||||||||
|
List of 2 Events for Episode 1 at Shindake, N-6 tephra
|
||||||||||||||||||||
1140 BCE ± 150 years Confirmed Eruption (Explosive / Effusive)
| Episode 1 | Eruption (Explosive / Effusive) | Furudake | ||||||||||||||||||||||||
|---|---|---|---|---|---|---|---|---|---|---|---|---|---|---|---|---|---|---|---|---|---|---|---|---|---|
| 1140 BCE ± 150 years - Unknown | Evidence from Isotopic: 14C (calibrated) | ||||||||||||||||||||||||
|
List of 3 Events for Episode 1 at Furudake
|
|||||||||||||||||||||||||
1450 BCE ± 75 years Confirmed Eruption (Explosive / Effusive)
| Episode 1 | Eruption (Explosive / Effusive) | Shindake, N-m tephra | |||||||||||||||||||
|---|---|---|---|---|---|---|---|---|---|---|---|---|---|---|---|---|---|---|---|---|
| 1450 BCE ± 75 years - Unknown | Evidence from Isotopic: 14C (calibrated) | |||||||||||||||||||
|
List of 2 Events for Episode 1 at Shindake, N-m tephra
|
||||||||||||||||||||
3480 BCE ± 150 years Confirmed Eruption (Explosive / Effusive)
| Episode 1 | Eruption (Explosive / Effusive) | Furudake | |||||||||||||||||||
|---|---|---|---|---|---|---|---|---|---|---|---|---|---|---|---|---|---|---|---|---|
| 3480 BCE ± 150 years - Unknown | Evidence from Isotopic: 14C (calibrated) | |||||||||||||||||||
|
List of 2 Events for Episode 1 at Furudake
|
||||||||||||||||||||
9520 BCE ± 300 years Confirmed Eruption (Explosive / Effusive)
| Episode 1 | Eruption (Explosive / Effusive) | Furudake | |||||||||||||||||||
|---|---|---|---|---|---|---|---|---|---|---|---|---|---|---|---|---|---|---|---|---|
| 9520 BCE ± 300 years - Unknown | Evidence from Isotopic: 14C (calibrated) | |||||||||||||||||||
|
List of 2 Events for Episode 1 at Furudake
|
||||||||||||||||||||
This compilation of synonyms and subsidiary features may not be comprehensive. Features are organized into four major categories: Cones, Craters, Domes, and Thermal Features. Synonyms of features appear indented below the primary name. In some cases additional feature type, elevation, or location details are provided.
Synonyms |
||||
| Kutierabu-zima | Kutinoerabu-zima | Kuchierabu-jima | ||||
Cones |
||||
| Feature Name | Feature Type | Elevation | Latitude | Longitude |
| Banyagamine | Stratovolcano | 291 m | ||
| Furudake
Huru-dake Furu-take |
Stratovolcano | 615 m | 30° 26' 21.00" N | 130° 12' 58.00" E |
| Gyoko | Stratovolcano | |||
| Hachikubo | Stratovolcano | |||
| Jyogahana | Stratovolcano | |||
| Kashimine | Stratovolcano | |||
| Noikeyama
Sankakuten-yama |
Stratovolcano | 599 m | 30° 27' 5.00" N | 130° 13' 2.00" E |
| Shindake
Sin-dake Shin-take |
Stratovolcano | 595 m | 30° 26' 45.00" N | 130° 12' 55.00" E |
| Takadomori | Stratovolcano | |||
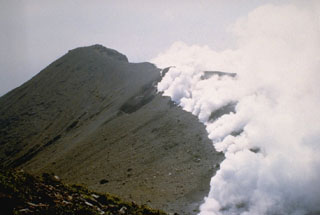 Gas-and-steam plumes emanate from a newly opened, 800-m-long arcuate fissure on Shindake, the summit crater of Japan's Kuchinoerabujima volcano, on 29 September 1980. A brief eruption at the fissure the previous day ejected blocks and ash up to 2 km above the crater. All historical eruptions have occurred from the Shindake crater; ejecta from frequent explosive eruptions since 1840 have sometimes damaged villages near the crater.
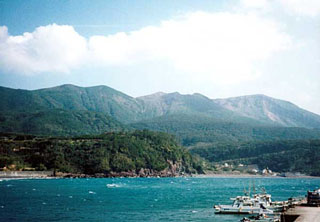 Kuchinoerabu rises to the SE above the fishing village of Motomura. The active cone of Shindake is in the center, Sankakutenyama is to the left, and Furudake (Hurudake) to the right. Shindake has been the site of frequent explosive eruptions in historical time. Several villages on the 4 x 12 km island are located within a few kilometers of the active crater and have suffered damage from eruptions.
There are no samples for Kuchinoerabujima in the Smithsonian's NMNH Department of Mineral Sciences Rock and Ore collection.
| Copernicus Browser | The Copernicus Browser replaced the Sentinel Hub Playground browser in 2023, to provide access to Earth observation archives from the Copernicus Data Space Ecosystem, the main distribution platform for data from the EU Copernicus missions. |
| MIROVA | Middle InfraRed Observation of Volcanic Activity (MIROVA) is a near real time volcanic hot-spot detection system based on the analysis of MODIS (Moderate Resolution Imaging Spectroradiometer) data. In particular, MIROVA uses the Middle InfraRed Radiation (MIR), measured over target volcanoes, in order to detect, locate and measure the heat radiation sourced from volcanic activity. |
| MODVOLC Thermal Alerts | Using infrared satellite Moderate Resolution Imaging Spectroradiometer (MODIS) data, scientists at the Hawai'i Institute of Geophysics and Planetology, University of Hawai'i, developed an automated system called MODVOLC to map thermal hot-spots in near real time. For each MODIS image, the algorithm automatically scans each 1 km pixel within it to check for high-temperature hot-spots. When one is found the date, time, location, and intensity are recorded. MODIS looks at every square km of the Earth every 48 hours, once during the day and once during the night, and the presence of two MODIS sensors in space allows at least four hot-spot observations every two days. Each day updated global maps are compiled to display the locations of all hot spots detected in the previous 24 hours. There is a drop-down list with volcano names which allow users to 'zoom-in' and examine the distribution of hot-spots at a variety of spatial scales. |
|
WOVOdat
Single Volcano View Temporal Evolution of Unrest Side by Side Volcanoes |
WOVOdat is a database of volcanic unrest; instrumentally and visually recorded changes in seismicity, ground deformation, gas emission, and other parameters from their normal baselines. It is sponsored by the World Organization of Volcano Observatories (WOVO) and presently hosted at the Earth Observatory of Singapore.
GVMID Data on Volcano Monitoring Infrastructure The Global Volcano Monitoring Infrastructure Database GVMID, is aimed at documenting and improving capabilities of volcano monitoring from the ground and space. GVMID should provide a snapshot and baseline view of the techniques and instrumentation that are in place at various volcanoes, which can be use by volcano observatories as reference to setup new monitoring system or improving networks at a specific volcano. These data will allow identification of what monitoring gaps exist, which can be then targeted by remote sensing infrastructure and future instrument deployments. |
| Volcanic Hazard Maps | The IAVCEI Commission on Volcanic Hazards and Risk has a Volcanic Hazard Maps database designed to serve as a resource for hazard mappers (or other interested parties) to explore how common issues in hazard map development have been addressed at different volcanoes, in different countries, for different hazards, and for different intended audiences. In addition to the comprehensive, searchable Volcanic Hazard Maps Database, this website contains information about diversity of volcanic hazard maps, illustrated using examples from the database. This site is for educational purposes related to volcanic hazard maps. Hazard maps found on this website should not be used for emergency purposes. For the most recent, official hazard map for a particular volcano, please seek out the proper institutional authorities on the matter. |
| IRIS seismic stations/networks | Incorporated Research Institutions for Seismology (IRIS) Data Services map showing the location of seismic stations from all available networks (permanent or temporary) within a radius of 0.18° (about 20 km at mid-latitudes) from the given location of Kuchinoerabujima. Users can customize a variety of filters and options in the left panel. Note that if there are no stations are known the map will default to show the entire world with a "No data matched request" error notice. |
| UNAVCO GPS/GNSS stations | Geodetic Data Services map from UNAVCO showing the location of GPS/GNSS stations from all available networks (permanent or temporary) within a radius of 20 km from the given location of Kuchinoerabujima. Users can customize the data search based on station or network names, location, and time window. Requires Adobe Flash Player. |
| DECADE Data | The DECADE portal, still in the developmental stage, serves as an example of the proposed interoperability between The Smithsonian Institution's Global Volcanism Program, the Mapping Gas Emissions (MaGa) Database, and the EarthChem Geochemical Portal. The Deep Earth Carbon Degassing (DECADE) initiative seeks to use new and established technologies to determine accurate global fluxes of volcanic CO2 to the atmosphere, but installing CO2 monitoring networks on 20 of the world's 150 most actively degassing volcanoes. The group uses related laboratory-based studies (direct gas sampling and analysis, melt inclusions) to provide new data for direct degassing of deep earth carbon to the atmosphere. |
| Large Eruptions of Kuchinoerabujima | Information about large Quaternary eruptions (VEI >= 4) is cataloged in the Large Magnitude Explosive Volcanic Eruptions (LaMEVE) database of the Volcano Global Risk Identification and Analysis Project (VOGRIPA). |
| EarthChem | EarthChem develops and maintains databases, software, and services that support the preservation, discovery, access and analysis of geochemical data, and facilitate their integration with the broad array of other available earth science parameters. EarthChem is operated by a joint team of disciplinary scientists, data scientists, data managers and information technology developers who are part of the NSF-funded data facility Integrated Earth Data Applications (IEDA). IEDA is a collaborative effort of EarthChem and the Marine Geoscience Data System (MGDS). |

