At 1047 on 24 July both the Aviation Color Code and the Volcano Alert Level for Ahyi Seamount were lowered to Unassigned because signs of unrest had declined, and discolored seawater over the seamount was last observed on 28 May. The latest phase of activity began in August 2024 and was characterized by visible plumes of discolored seawater observed sporadically in satellite images.
Source: US Geological Survey
Intermittent hydroacoustic signals and discolored plumes during November 2022-June 2023
Ahyi seamount is a large, conical submarine volcano that rises to within 75 m of the ocean surface about 18 km SE of the island of Farallon de Pajaros in the Northern Marianas. The remote location of the seamount has made eruptions difficult to document, but seismic stations installed in the region confirmed an eruption in the vicinity in 2001. No new activity was detected until April-May 2014 when an eruption was detected by NOAA (National Oceanic and Atmospheric Administration) divers, hydroacoustic sensors, and seismic stations (BGVN 42:04). New activity was first detected on 15 November by hydroacoustic sensors that were consistent with submarine volcanic activity. This report covers activity during November 2022 through June 2023 based on daily and weekly reports from the US Geological Survey.
Starting in mid-October, hydroacoustic sensors at Wake Island (2.2 km E) recorded signals consistent with submarine volcanic activity, according to a report from the USGS issued on 15 November 2022. A combined analysis of the hydroacoustic signals and seismic stations located at Guam and Chichijima Island, Japan, suggested that the source of this activity was at or near the Ahyi seamount. After a re-analysis of a satellite image of the area that was captured on 6 November, USGS confirmed that there was no evidence of discoloration at the ocean surface. Few hydroacoustic and seismic signals continued through November, including on 18 November, which USGS suggested signified a decline or pause in unrest. A VONA (Volcano Observatory Notice for Aviation) reported that a discolored water plume was persistently visible in satellite data starting on 18 November (figure 6). Though clouds often obscured clear views of the volcano, another discolored water plume was captured in a satellite image on 26 November. The Aviation Color Code (ACC) was raised to Yellow (the second lowest level on a four-color scale) and the Volcano Alert Level (VAL) was raised to Advisory (the second lowest level on a four-level scale) on 29 November.
 |
Figure 6. A clear, true color satellite image showed a yellow-green discolored water plume extending NW from the Ahyi seamount (white arrow) on 21 November 2022. Courtesy of Copernicus Browser. |
During December, occasional detections were recorded on the Wake Island hydrophone sensors and discolored water over the seamount remained visible. During 2-7, 10-12, and 16-31 December possible explosion signals were detected. A small area of discolored water was observed in high-resolution Sentinel-2 satellite images during 1-6 December (figure 7). High-resolution satellite images recorded discolored water plumes on 13 December that originated from the summit region; no observations indicated that activity breached the ocean surface. A possible underwater plume was visible in satellite images on 18 December, and during 19-20 December a definite but diffuse underwater plume located SSE from the main vent was reported. An underwater plume was visible in a satellite image taken on 26 December (figure 7).
 |
Figure 7. Clear, true color satellite images showed yellow-green discolored water plumes extending NE and W from Ahyi (white arrows) on 1 (left) and 26 (right) December 2022, respectively. Courtesy of Copernicus Browser. |
Hydrophone sensors continued to detect signals consistent with possible explosions during 1-8 January 2023. USGS reported that the number of detections decreased during 4-5 January. The hydrophone sensors experienced a data outage that started at 0118 on 8 January and continued through 10 January, though according to USGS, possible explosions were recorded prior to the data outage and likely continued during the outage. A discolored water plume originating from the summit region was detected in a partly cloudy satellite image on 8 January. On 11-12 and 15-17 January possible explosion signals were recorded again. One small signal was detected during 22-23 January and several signals were recorded on 25 and 31 January. During 27-31 January a plume of discolored water was observed above the seamount in satellite imagery (figure 8).
 |
Figure 8. True color satellite images showed intermittent yellow-green discolored water plumes of various sizes extending N on 5 January 2023 (top left), SE on 30 January 2023 (top right), W on 4 February 2023 (bottom left), and SW on 1 March 2023 (bottom right) from Ahyi (white arrows). Courtesy of Copernicus Browser. |
Low levels of activity continued during February and March, based on data from pressure sensors on Wake Island. During 1 and 4-6 February activity was reported, and a submarine plume was observed on 4 February (figure 8). Possible explosion signals were detected during 7-8, 10, 13-14, and 24 February. During 1-2 and 3-5 March a plume of discolored water was observed in satellite imagery (figure 8). Almost continuous hydroacoustic signals were detected in remote pressure sensor data on Wake Island 2,270 km E from the volcano during 7-13 March. During 12-13 March water discoloration around the seamount was observed in satellite imagery, despite cloudy weather. By 14 March discolored water extended about 35 km, but no direction was noted. USGS reported that the continuous hydroacoustic signals detected during 13-14 March stopped abruptly on 14 March and no new detections were observed. Three 30 second hydroacoustic detections were reported during 17-19 March, but no activity was visible due to cloudy weather. A data outage was reported during 21-22 March, making pressure sensor data unavailable; a discolored water plume was, however, visible in satellite data. A possible underwater explosion signal was detected by pressure sensors at Wake Island on 26, 29, and 31 March, though the cause and origin of these events were unclear.
Similar low activity continued during April, May, and June. Several signals were detected during 1-3 April in pressure sensors at Wake Island. USGS suggested that these may be related to underwater explosions or earthquakes at the volcano, but no underwater plumes were visible in clear satellite images. The pressure sensors had data outages during 12-13 April and no data were recorded; no underwater plumes were visible in satellite images, although cloudy weather obscured most clear views. Eruptive activity was reported starting at 2210 on 21 May. On 22 May a discolored water plume that extended 4 km was visible in satellite images, though no direction was recorded. During 23-24 May some signals were detected by the underwater pressure sensors. Possible hydroacoustic signals were detected during 2-3 and 6-8 June. Multiple hydroacoustic signals were detected during 9-11 and 16-17 June, although no activity was visible in satellite images. One hydroacoustic signal was detected during 23-24 June, but there was some uncertainty about its association with volcanic activity. A single possible hydroacoustic signal was detected during 30 June to 1 July.
Information Contacts: US Geological Survey, Volcano Hazards Program (USGS-VHP), 12201 Sunrise Valley Drive, Reston, VA, USA, https://volcanoes.usgs.gov/index.html; Copernicus Browser, Copernicus Data Space Ecosystem, European Space Agency (URL: https://dataspace.copernicus.eu/browser/).
2025: January
| February
| March
| April
| May
| July
2024: January
| February
| March
| April
| November
| December
2023: January
| February
| March
| April
| May
| June
| July
| December
2022: November
| December
2014: April
| May
At 1047 on 24 July both the Aviation Color Code and the Volcano Alert Level for Ahyi Seamount were lowered to Unassigned because signs of unrest had declined, and discolored seawater over the seamount was last observed on 28 May. The latest phase of activity began in August 2024 and was characterized by visible plumes of discolored seawater observed sporadically in satellite images.
Source: US Geological Survey
Unrest at Ahyi Seamount continued during 24-30 May. A small plume of discolored water in the vicinity of the seamount was identified in a satellite image on 28 May, indicating possible submarine activity. Possible infrasound signals coming from the direction of Ahyi were identified in data from underwater pressure sensors near Wake Island (about 2,270 km E) on 29 May. The Aviation Color Code remained at Yellow (the second lowest level on a four-color scale) and the Volcano Alert Level remained at Advisory (the second lowest level on a four-level scale).
Source: US Geological Survey
No activity at the Ahyi Seamount was detected in either satellite or acoustic data from underwater pressure sensors near Wake Island (about 2,270 km E) during 17-23 May, though unrest continued. The Exploration Vessel Nautilus visited the area and deployed a remotely operated vehicle (ROV) on 19 May. The observations confirmed that lava had erupted over the past few years, building the summit to within 50-60 m of the ocean surface. Ahyi remained active with vigorous degassing of bubbles observed across a broad area of the summit. The Aviation Color Code remained at Yellow (the second lowest level on a four-color scale) and the Volcano Alert Level remained at Advisory (the second lowest level on a four-level scale).
Source: US Geological Survey
Unrest at Ahyi Seamount continued during 25 April-1 May. Discolored water in the vicinity of the seamount was last identified in a satellite image on 25 April, indicating possible submarine activity. Signals coming from the direction of Ahyi were identified in data from underwater pressure sensors near Wake Island (about 2,270 km E) during 28 April-1 May. The Aviation Color Code remained at Yellow (the second lowest level on a four-color scale) and the Volcano Alert Level remained at Advisory (the second lowest level on a four-level scale).
Source: US Geological Survey
Unrest at Ahyi Seamount may have continued during 18-25 April. Signals coming from the direction of Ahyi were identified in data from underwater pressure sensors near Wake Island (about 2,270 km E of Ahyi) on 18 and 20 April. No signs of activity at the ocean’s surface were identified in satellite images. The Aviation Color Code remained at Yellow (the second lowest level on a four-color scale) and the Volcano Alert Level remained at Advisory (the second lowest level on a four-level scale).
Source: US Geological Survey
Unrest at Ahyi Seamount may have continued during 4-11 April. A diffuse plume of discolored water in the vicinity of the seamount was last identified in a satellite image on 30 March, indicating possible submarine activity. No signals coming from the direction of Ahyi were identified in data from underwater pressure sensors near Wake Island (about 2,270 km E of Ahyi), though sporadic data outages occurred during the week. The Aviation Color Code remained at Yellow (the second lowest level on a four-color scale) and the Volcano Alert Level remained at Advisory (the second lowest level on a four-level scale).
Source: US Geological Survey
Unrest at Ahyi Seamount may have continued during 28 March-5 April. A diffuse plume of discolored water in the vicinity of the seamount was last identified in a satellite image on 30 March, indicating possible submarine activity. No signals coming from the direction of Ahyi were identified in data from underwater pressure sensors near Wake Island (about 2,270 km E of Ahyi). The Aviation Color Code remained at Yellow (the second lowest level on a four-color scale) and the Volcano Alert Level remained at Advisory (the second lowest level on a four-level scale).
Source: US Geological Survey
Unrest at Ahyi Seamount may have continued during 21-28 March. A diffuse plume of discolored water in the vicinity of the seamount was last identified in a satellite image on 15 March, indicating possible submarine activity. The Aviation Color Code remained at Yellow (the second lowest level on a four-color scale) and the Volcano Alert Level remained at Advisory (the second lowest level on a four-level scale).
Source: US Geological Survey
Unrest at Ahyi Seamount continued during 14-21 March. A diffuse plume of discolored water in the vicinity of the seamount was identified in a satellite image on 15 March, indicating possible submarine activity. The Aviation Color Code remained at Yellow (the second lowest level on a four-color scale) and the Volcano Alert Level remained at Advisory (the second lowest level on a four-level scale).
Source: US Geological Survey
Unrest at Ahyi Seamount continued during 7-14 March. A few hydroacoustic detections coming from the direction of Ahyi were identified in data from underwater pressure sensors near Wake Island (about 2,270 km E of Ahyi). Weather clouds obscured satellite views of the seamount. The Aviation Color Code remained at Yellow (the second lowest level on a four-color scale) and the Volcano Alert Level remained at Advisory (the second lowest level on a four-level scale).
Source: US Geological Survey
Unrest at Ahyi Seamount continued during 28 February-7 March. A plume of discolored water in the vicinity of the seamount was identified in a satellite image on 3 March, indicating possible submarine activity. Weather clouds obscured views during the rest of the week. No signals coming from the direction of Ahyi were identified in data from underwater pressure sensors near Wake Island (about 2,270 km E of Ahyi). The Aviation Color Code remained at Yellow (the second lowest level on a four-color scale) and the Volcano Alert Level remained at Advisory (the second lowest level on a four-level scale).
Source: US Geological Survey
Unrest at Ahyi Seamount continued during 21-28 February. Occasional weak signals coming from the direction of Ahyi were identified in data from underwater pressure sensors near Wake Island (about 2,270 km E of Ahyi). The Aviation Color Code remained at Yellow (the second lowest level on a four-color scale) and the Volcano Alert Level remained at Advisory (the second lowest level on a four-level scale).
Source: US Geological Survey
Unrest at Ahyi Seamount continued during 13-21 February. A plume of discolored water in the vicinity of the seamount was identified in satellite images during 14-16 February, indicating possible submarine activity. No signals coming from the direction of Ahyi were identified in data from underwater pressure sensors near Wake Island (about 2,270 km E of Ahyi). The Aviation Color Code remained at Yellow (the second lowest level on a four-color scale) and the Volcano Alert Level remained at Advisory (the second lowest level on a four-level scale).
Source: US Geological Survey
Unrest at Ahyi Seamount continued during 7-13 February. A satellite image on 8 February showed a plume of discolored water in the vicinity of the seamount, indicating possible submarine activity. The Aviation Color Code remained at Yellow (the second lowest level on a four-color scale) and the Volcano Alert Level remained at Advisory (the second lowest level on a four-level scale).
Source: US Geological Survey
Unrest at Ahyi Seamount continued during 31 January-7 February. A satellite image on 1 February showed a plume of discolored water in the vicinity of the seamount, indicating possible submarine activity. Signals indicting minor activity coming from the direction of Ahyi were identified in data from underwater pressure sensors near Wake Island (about 2,270 km E of Ahyi) on 3 and 5 February. The Aviation Color Code remained at Yellow (the second lowest level on a four-color scale) and the Volcano Alert Level remained at Advisory (the second lowest level on a four-level scale).
Source: US Geological Survey
Unrest at Ahyi Seamount continued through 31 January. Satellite images showed a plume of discolored water in the vicinity of the seamount on 27 and 29 January, indicating possible submarine activity. No signals coming from the direction of Ahyi were identified in data from underwater pressure sensors near Wake Island (about 2,270 km E of Ahyi). The Aviation Color Code remained at Yellow (the second lowest level on a four-color scale) and the Volcano Alert Level remained at Advisory (the second lowest level on a four-level scale).
Source: US Geological Survey
Unrest at Ahyi Seamount continued through 24 January. Satellite images showed a plume of discolored water in the vicinity of the seamount on 18 January, indicating possible submarine activity. No signals coming from the direction of Ahyi were identified in data from underwater pressure sensors near Wake Island (about 2,270 km E of Ahyi). The Aviation Color Code remained at Yellow (the second lowest level on a four-color scale) and the Volcano Alert Level remained at Advisory (the second lowest level on a four-level scale).
Source: US Geological Survey
Unrest at Ahyi Seamount continued through 17 January. Signals indicating activity, coming from the direction of Ahyi, were identified in data from underwater pressure sensors near Wake Island (about 2,270 km E of Ahyi) on 9 January. Satellite images showed a distinct plume of discolored water originating from the seamount on 10 January. The Aviation Color Code remained at Yellow (the second lowest level on a four-color scale) and the Volcano Alert Level remained at Advisory (the second lowest level on a four-level scale).
Source: US Geological Survey
Unrest at Ahyi Seamount continued through 3 January. Signals indicating activity, coming from the direction of Ahyi, were identified in data from underwater pressure sensors near Wake Island (about 2,270 km E of Ahyi) on 28 and 30 December (UTC). Satellite images showed possible signs of underwater activity on 27 and 28 December, and clearer signs on 2 January consisting of a plume of discolored water extending 2.3 km NNW. The Aviation Color Code remained at Yellow (the second lowest level on a four-color scale) and the Volcano Alert Level remained at Advisory (the second lowest level on a four-level scale).
Source: US Geological Survey
A plume of discolored water surrounding Ahyi Seamount was identified in satellite data on 15 December, indicating continued low-level unrest. Signals from underwater activity coming from the direction of Ahyi were identified in data from underwater pressure sensors near Wake Island (about 2,270 km E of Ahyi) on 24 and 26 December (UTC). Satellite data from those days were obscured by clouds; no evidence of discolored water was identified in a partly cloudy satellite image from 25 December. The Aviation Color Code remained at Yellow (the second lowest level on a four-color scale) and the Volcano Alert Level remained at Advisory (the second lowest level on a four-level scale).
Source: US Geological Survey
No plumes of discolored water surrounding Ahyi Seamount were identified in satellite images during 7-13 December and no significant signals were identified in data from underwater pressure sensors near Wake Island (about 2,270 km E of Ahyi). The Aviation Color Code remained at Yellow (the second lowest level on a four-color scale) and the Volcano Alert Level remained at Advisory (the second lowest level on a four-level scale).
Source: US Geological Survey
Several plumes of discolored water surrounding Ahyi Seamount were identified in satellite images during 30 November-6 December, indicating continued low-level unrest. No significant signals were identified in data from underwater pressure sensors near Wake Island (about 2,270 km E of Ahyi), though submarine plumes are sometimes observed without clear hydroacoustic evidence of eruptive activity. The Aviation Color Code remained at Yellow (the second lowest level on a four-color scale) and the Volcano Alert Level remained at Advisory (the second lowest level on a four-level scale).
Source: US Geological Survey
No plumes of discolored water surrounding Ahyi Seamount have been identified in satellite images since 20 November and no significant signals were identified in data from underwater pressure sensors near Wake Island (about 2,270 km E of Ahyi) during 20-29 November. The Aviation Color Code remained at Yellow (the second lowest level on a four-color scale) and the Volcano Alert Level remained at Advisory (the second lowest level on a four-level scale).
Source: US Geological Survey
On 20 November the Aviation Color Code for Ahyi Seamount was raised to Yellow (the second lowest level on a four-color scale) and the Volcano Alert Level was raised to Advisory (the second lowest level on a four-level scale) due to an ongoing submarine eruption. Plumes of discolored water were observed extending as far as several hundred meters away from the volcano in satellite images on 1, 10, and 19 November. Retrospective analysis of older satellite data revealed minor activity extending back to 5 August. Possible pumice floating on the ocean surface was identified in the most recent image. No volcanic activity was identified in data from underwater pressure sensors near Wake Island (about 2,270 km E of Ahyi), though submarine plumes had been observed in the past without clear hydroacoustic signals.
Source: US Geological Survey
Signs of unrest at Ahyi Seamount had not been observed in satellite images since 27 March when an area of discolored water was present near the seamount. Both the Aviation Color Code and the Volcano Alert Level were lowered to Unassigned at 0346 on 10 April due to the absence of activity and the lack of local monitoring stations.
Source: US Geological Survey
Signs of unrest at Ahyi Seamount continued. Small (less than 2 km long) plumes of discolored seawater in the vicinity of the seamount were observed in satellite images during 22 and 24-26 March. The Aviation Color Code remained at Yellow (the second lowest level on a four-color scale) and the Volcano Alert Level remained at Advisory (the second lowest level on a four-level scale).
Source: US Geological Survey
Signs of unrest at Ahyi Seamount continued. A small plume of discolored seawater in the vicinity of the seamount was observed in a 5 March satellite image. The Aviation Color Code remained at Yellow (the second lowest level on a four-color scale) and the Volcano Alert Level remained at Advisory (the second lowest level on a four-level scale).
Source: US Geological Survey
Signs of unrest at Ahyi Seamount continued. Plumes of discolored seawater in the vicinity of the seamount were occasionally observed in satellite images during 2-9 February. No additional signs of unrest were identified in data collected by regional seismic stations or remote underwater pressure sensors located near Wake Island (2,270 km E of Ahyi). The Aviation Color Code remained at Yellow (the second lowest level on a four-color scale) and the Volcano Alert Level remained at Advisory (the second lowest level on a four-level scale).
Source: US Geological Survey
Signs of unrest at Ahyi Seamount continued. Plumes of discolored water extending as far as 19 km from the summit area were identified in satellite images during 23-26 January. Weather clouds obscured or mostly obscured views during the rest of the week. No volcanic activity was identified in data from underwater pressure sensors near Wake Island (about 2,270 km E of Ahyi). The Aviation Color Code remained at Yellow (the second lowest level on a four-color scale) and the Volcano Alert Level remained at Advisory (the second lowest level on a four-level scale).
Source: US Geological Survey
Signs of unrest at Ahyi Seamount continued. Plumes of discolored water extending 4-4.5 km from the summit area were identified in satellite images during 21-23 January. No volcanic activity was identified in data from underwater pressure sensors near Wake Island (about 2,270 km E of Ahyi). The Aviation Color Code remained at Yellow (the second lowest level on a four-color scale) and the Volcano Alert Level remained at Advisory (the second lowest level on a four-level scale).
Source: US Geological Survey
Signs of unrest at Ahyi Seamount were observed during the previous few weeks. Plumes of discolored water drifting as far as 10 km from the vent were identified in satellite data on 24 December 2023 and again on 4 and 10 January 2024. Hydroacoustic arrays located on Wake Island did not record any significant signals, though submarine plumes have been observed in the past without clear hydroacoustic evidence. The Aviation Color Code was raised to Yellow (the second level on a four-color scale) and the Volcano Alert Level was raised to Advisory (the second level on a four-level scale) on 14 January because the likelihood of an eruption had increased. No unusual activity observed in satellite data during 15-17 January.
Source: US Geological Survey
A plume of discolored water in the vicinity of Ahyi Seamount was observed in satellite images on 1 January. The plume possibly signified underwater volcanic activity but that interpretation could not be confirmed because pressure sensors at Wake Island were not operational; more distant sensors did not record any activity. Both the Aviation Color Code and the Volcano Alert Level remained at Unassigned.
Source: US Geological Survey
Signs of unrest at Ahyi Seamount had not been recorded by underwater pressure sensors on Wake Island (2,270 km E) for the previous four weeks (since early June) and satellite observations of discolored water near the seamount was last visible on 22 May. Both the Aviation Color Code and the Volcano Alert Level were lowered to Unassigned on 18 July.
Source: US Geological Survey
Unrest at Ahyi Seamount possibly continued during 21-27 June. One small hydroacoustic signal coming from the direction of the seamount was detected by pressure sensors on Wake Island (2,270 km E) during 23-24 June. Data from the sensors on Wake Island stopped transmitting at 0414 on 24 June though no signals were detected by sensors on Saipan during the rest of the week. No surface activity was visible in satellite images. The Aviation Color Code remained at Yellow (the second lowest level on a four-color scale) and the Volcano Alert Level remained at Advisory (the second lowest level on a four-level scale).
Source: US Geological Survey
Unrest at Ahyi Seamount possibly continued during 13-20 June. A few small hydroacoustic signals coming from the direction of the seamount were detected by pressure sensors on Wake Island (2,270 km E) during 16-17 June. No surface activity was visible in satellite images. The Aviation Color Code remained at Yellow (the second lowest level on a four-color scale) and the Volcano Alert Level remained at Advisory (the second lowest level on a four-level scale).
Source: US Geological Survey
Unrest at Ahyi Seamount continued during 6-12 June. Possible hydroacoustic signal was detected by pressure sensors on Wake Island (2,270 km E) during 6-8 June, and multiple hydroacoustic signals were detected during 9-11 June. No surface activity was visible in partly cloudy and partly clear satellite images. The Aviation Color Code remained at Yellow (the second lowest level on a four-color scale) and the Volcano Alert Level remained at Advisory (the second lowest level on a four-level scale).
Source: US Geological Survey
Unrest at Ahyi Seamount continued during 30 May-7 June. A possible hydroacoustic signal was detected by pressure sensors on Wake Island (2,270 km E) during 2-3 June. No activity was visible in cloudy satellite images. The Aviation Color Code remained at Yellow (the second lowest level on a four-color scale) and the Volcano Alert Level remained at Advisory (the second lowest level on a four-level scale).
Source: US Geological Survey
Unrest at Ahyi Seamount continued during 21-30 May. Underwater events were detected by pressure sensors on Wake Island (2,270 km E) at least during 24-25 and 28-30 May. The events were possibly related to underwater explosions or earthquakes at the volcano. No activity was visible in cloudy or partly cloudy satellite images. The Aviation Color Code remained at Yellow (the second lowest level on a four-color scale) and the Volcano Alert Level remained at Advisory (the second lowest level on a four-level scale).
Source: US Geological Survey
The U.S. Geological Survey reported that unrest at Ahyi Seamount was again detected, after activity paused in early April. Signals consistent with eruptive activity were recorded by underwater pressure sensors on Wake Island, 2,270 km E, beginning at about 2210 on 21 May and were continuing. A plume of discolored sea water was observed above the area of the vent in a satellite image on 22 May. On 23 May the Aviation Color Code was changed to Yellow (the second lowest level on a four-color scale) and the Volcano Alert Level was changed to Advisory (the second lowest level on a four-level scale).
Source: US Geological Survey
On 26 April both the Aviation Color Code and the Volcano Alert Level for Ahyi Seamount were lowered to Unassigned because signs of unrest had decreased, and no indication of submarine volcanic activity had occurred for at least four weeks. Observations of discolored water near the seamount were last identified in satellite images in late March 2023, and underwater activity based on acoustic signals had been negligible since early April 2023.
Source: US Geological Survey
Unrest at Ahyi Seamount continued during 28 March-4 April. Underwater events were detected by pressure sensors on Wake Island, 2,270 km E, on 29 and 31 March and during 1-2 April. The events were possibly related to underwater explosions or earthquakes at the volcano. The Aviation Color Code remained at Yellow (the second lowest level on a four-color scale) and the Volcano Alert Level remained at Advisory (the second lowest level on a four-level scale).
Source: US Geological Survey
Unrest at Ahyi Seamount continued during 21-28 March. A plume of discolored water was observed in high-resolution satellite images acquired on 21 and 22 March. No observations indicated that activity has breached the ocean surface. One possible underwater explosion was detected by pressure sensors on Wake Island, 2,270 km E, during 26-27 March. The Aviation Color Code remained at Yellow (the second lowest level on a four-color scale) and the Volcano Alert Level remained at Advisory (the second lowest level on a four-level scale).
Source: US Geological Survey
Unrest at Ahyi Seamount continued during 15-21 March. A total of three short (~30 seconds) hydroacoustic detections from the direction of Ahyi were detected by pressure sensors on Wake Island, 2,270 km E, during 17-19 March. Weather clouds often prevented satellite views. Data was not available during 20-21 March due to an outage, though a plume of discolored water was visible in satellite images. The Aviation Color Code remained at Yellow (the second lowest level on a four-color scale) and the Volcano Alert Level remained at Advisory (the second lowest level on a four-level scale).
Source: US Geological Survey
Unrest at Ahyi Seamount continued during 8-14 March. A few events per day were detected by pressure sensors on Wake Island, 2,270 km E, during 7-11 March. Almost continuous hydroacoustic signals from roughly the direction of Ahyi were recorded by the sensors during 11-13 March, and then signals stopped abruptly on 14 March. Discolored water was visible in satellite images during 12-14 March; the discoloration extended about 35 km at the end of the week. The Aviation Color Code remained at Yellow (the second lowest level on a four-color scale) and the Volcano Alert Level remained at Advisory (the second lowest level on a four-level scale).
Source: US Geological Survey
Unrest at Ahyi Seamount continued during 1-7 March. Plumes of discolored water above the seamount were visible in satellite images during 1-2 and 4 March. Pressure sensors on Wake Island, 2,270 km E of Ahyi Seamount, did not detect activity. The Aviation Color Code remained at Yellow (the second lowest level on a four-color scale) and the Volcano Alert Level remained at Advisory (the second lowest level on a four-level scale).
Source: US Geological Survey
Unrest at Ahyi Seamount continued during 7-14 February. Pressure sensors on Wake Island, 2,270 km E of Ahyi Seamount, occasionally detected possible activity including possible explosions during 13-14 February. No activity was identified in satellite images, though the image resolutions were too low to detect water discoloration. The Aviation Color Code remained at Yellow (the second lowest level on a four-color scale) and the Volcano Alert Level remained at Advisory (the second lowest level on a four-level scale).
Source: US Geological Survey
Unrest at Ahyi Seamount continued during 31 January-7 February. Pressure sensors on Wake Island, 2,270 km E of Ahyi Seamount, detected activity during 31 January-1 February and possible activity during 4-6 February. Plumes of discolored water were not identified satellite images, though the image resolutions were too low to detect it. The Aviation Color Code remained at Yellow (the second lowest level on a four-color scale) and the Volcano Alert Level remained at Advisory (the second lowest level on a four-level scale).
Source: US Geological Survey
Unrest at Ahyi Seamount continued during 24-31 January. Pressure sensors on Wake Island, 2,270 km E of Ahyi Seamount, detected a possible explosion signal on 25 January. Plumes of discolored water were identified in satellite images during 27-31 January. The Aviation Color Code remained at Yellow (the second lowest level on a four-color scale) and the Volcano Alert Level remained at Advisory (the second lowest level on a four-level scale).
Source: US Geological Survey
Unrest at Ahyi Seamount was occasionally detected during 17-24 January. Pressure sensors on Wake Island, 2,270 km E of Ahyi Seamount, detected one small signal during 22-23 January. No activity was observed in mostly cloudy satellite images. The Aviation Color Code remained at Yellow (the second lowest level on a four-color scale) and the Volcano Alert Level remained at Advisory (the second lowest level on a four-level scale).
Source: US Geological Survey
Unrest at Ahyi Seamount was occasionally detected during 11-17 January. Pressure sensors on Wake Island (2,270 km E of Ahyi) were back online and recorded possible explosions during 11-12 and 15-16 January. One weak signal, possibly from the seamount, was recorded during 16-17 January. No activity was visible in clear or partly cloudy satellite images. The Aviation Color Code remained at Yellow (the second lowest level on a four-color scale) and the Volcano Alert Level remained at Advisory (the second lowest level on a four-level scale).
Source: US Geological Survey
Unrest continued to be detected at Ahyi Seamount during 4-10 January. Daily signals possibly indicating explosions were detected by hydrophone sensors on Wake Island (2,270 km E of Ahyi), though a data outage began at 0118 on 8 January. No activity was visible in mostly cloudy satellite images, though a plume of discolored water originating from the summit region of the seamount was seen in partly cloudy satellite images on 8 January. The Aviation Color Code remained at Yellow (the second lowest level on a four-color scale) and the Volcano Alert Level remained at Advisory (the second lowest level on a four-level scale).
Source: US Geological Survey
Unrest continued to be detected at Ahyi Seamount during 28 December 2022-3 January 2023. Daily signals possibly indicating explosions were detected by hydrophone sensors on Wake Island (2,270 km E of Ahyi). No activity was visible in mostly cloudy satellite images. The Aviation Color Code remained at Yellow (the second lowest level on a four-color scale) and the Volcano Alert Level remained at Advisory (the second lowest level on a four-level scale).
Source: US Geological Survey
Unrest continued to be detected at Ahyi Seamount during 21-27 December. Wake Island hydrophone sensors detected daily signals that possibly indicated explosions. An underwater plume was visible in satellite images during 26-27 December. The Aviation Color Code remained at Yellow (the second lowest level on a four-color scale) and the Volcano Alert Level remained at Advisory (the second lowest level on a four-level scale).
Source: US Geological Survey
Unrest continued to be detected at Ahyi Seamount during 14-20 December. Wake Island hydrophone sensors detected daily signals consistent with explosions. A possible underwater plume was observed in satellite images on 18 December, and definite but diffuse plumes were visible to the SSE of the vent during 19-20 December. The Aviation Color Code remained at Yellow (the second lowest level on a four-color scale) and the Volcano Alert Level remained at Advisory (the second lowest level on a four-level scale).
Source: US Geological Survey
Unrest continued to be detected at Ahyi Seamount during 7-13 December. Wake Island hydrophone sensors detected daily signals consistent with explosions during 10-12 December. No signs of underwater plumes were visible in satellite images during 10-11 December; weather clouds obscured the area on 12 December. The Aviation Color Code remained at Yellow (the second lowest level on a four-color scale) and the Volcano Alert Level remained at Advisory (the second lowest level on a four-level scale).
Source: US Geological Survey
Unrest continued to be detected at Ahyi Seamount during 30 November-6 December. Wake Island hydrophone sensors detected signals on most days and discolored water over the seamount was identified daily in satellite images. The Aviation Color Code remained at Yellow (the second lowest level on a four-color scale) and the Volcano Alert Level remained at Advisory (the second lowest level on a four-level scale).
Source: US Geological Survey
Signs of unrest at Ahyi Seamount have been observed in satellite and remote geophysical data, starting in mid-October. Hydroacoustic signals continued to be observed but had declined in the previous few weeks. Discolored water over the seamount was first visible on 18 November and persisted, possibly from either degassing or an eruption. On 29 November the Aviation Color Code was raised to Yellow (the second lowest level on a four-color scale) and the Volcano Alert Level was raised to Advisory (the second lowest level on a four-level scale).
Source: US Geological Survey
On 18 November the USGS reported that hydroacoustic and seismic signals suggestive of underwater eruptive activity at Ahyi Seamount had declined over the past week. No other signs of volcanic unrest were detected at the seamount.
Source: US Geological Survey
On 15 November the USGS reported that hydroacoustic sensors at Wake Island began to record signals in mid-October that are consistent with submarine volcanic activity. A combined analysis of the hydroacoustic signals and seismic data from stations on Guam and Chichijima Island, Japan, suggest the source of this activity is at or near Ahyi seamount. Contrary to initial observations of there being discoloration on the water’s surface, a reanalysis of satellite imagery from 6 November showed no evidence of water discoloration at the ocean surface.
On 23 May the USGS reported that during the previous week one explosion signal from the source at or near Ahyi seamount was detected. Seismic activity had been low since 8 May continuing to indicate that the eruption had possibly paused or ended.
On 16 May the USGS reported that during the previous week seismic signals from the source at or near Ahyi seamount had greatly diminished, indicating that the eruption had possibly paused or ended. Scientists aboard the research ship Hi'ialakai conducted water column tests in the vicinity of Ahyi on 15 May and reported no sign of activity, suggesting that the eruption occurred from a nearby volcanic vent and not the summit. The Aviation Color Code remained at Yellow and the Volcano Alert Level remained at Advisory.
A helicorder plot from a station on Pagan showed that seismic signals from a source at or near the Ahyi seamount stopped at 1610 on 8 May. An additional isolated event was reported at 1810.
Source: Matthew Haney, Alaska Volcano Observatory via Bill Chadwick, Oregon State University's Marine Science Center and NOAA/PMEL EOI Program, personal communication
Seismic stations on Pagan, Sarigan, Anatahan, and Saipan started recording signals on 24 April that continued at least through 2 May. The source had not been confirmed, but is thought to be at or near the Ahyi seamount. During 4-5 May a helicorder plot from a station on Pagan showed explosive signals at a rate of 20 per hour.
Sources: Emergency Management Office of the Commonwealth of the Mariana Islands and United States Geological Survey Volcano Hazards Program; Matthew Haney, Alaska Volcano Observatory via Bill Chadwick, Oregon State University's Marine Science Center and NOAA/PMEL EOI Program, personal communication
Seismic stations on Pagan, Sarigan, Anatahan, and Saipan began recording signals starting at 0635 on 24 April believed to be from an undersea volcanic source. Hydroacoustic sensors on Wake Island suggested that the source is at or near Ahyi seamount, although it was possible that the vent is located at one of the other volcanic seamounts in the area. While conducting coral reef research at Farallon de Pajaros, NOAA divers reported hearing loud explosions and feeling the shock waves. One of the more powerful explosions was felt by the crew as it reverberated through the hull of the ship. On 27 April the Color Code was raised from Unassigned to Yellow. A report issued at 0536 on 30 April noted that seismic activity remained high.
Sources: Emergency Management Office of the Commonwealth of the Mariana Islands and United States Geological Survey Volcano Hazards Program; Bill Chadwick, Oregon State University's Marine Science Center and NOAA/PMEL EOI Program, personal communication
Reports are organized chronologically and indexed below by Month/Year (Publication Volume:Number), and include a one-line summary. Click on the index link or scroll down to read the reports.
Submarine eruption during 11-12 March 1969
Card 0528 (06 May 1969) Acoustic activity during 11-12 March
The following was received in a telephone report from Tom Simkin (Smithsonian Institution). "Examination of government recordings made at Eniwetok, Wake, and Midway hydrophone stations turned up acoustic activity which appears to be at the location of the March 1967 event (Norris and Johnson, 1969) near Farallon de Parajos in the Northern Mariana Islands [but see next report for better location]. The recent activity occurred at a fairly uniform rate for two days beginning 11 March 0100 GMT and ending 12 March 2300 GMT, 1969."
Reference. Norris, R.A., and Johnson, R.H., 1969, Submarine volcanic eruptions recently located in the Pacific by Sofar hydrophones: Journal of Geophysical Research, v. 74, no. 2, p. 650-664.
Card 0534 (08 May 1969) Explosions sounds and water discoloration
The following cable was received from the Japanese Meteorological Agency. "Fishing boat sailing near Uracas Island in Marianas informed of submarine eruption as follows: From about 0930 GMT on 12 March explosion sounds - three times - were heard in latitude 20.24°N, longitude 145.02°E, neighboring sea surface was colored in brown."
[Reports reviewed and attributed to Ahyi in 2023.]
Information Contacts:
Card 0528 (06 May 1969) Roger A. Norris, The T-Phase Project, University of Hawaii, Honolulu, Hawaii.
Card 0534 (08 May 1969) Seismological Section, Japanese Meteorological Agency.
Shocks and sulfur upwelling
The crew of the fishing boat Koyo-maru 5 felt a series of shocks beginning at about 1530 on 15 November, followed by the upwelling of water containing sulfur about 15 km SE of Farallon de Pajaros Island at 20.445°N, 145.03°E. Depths in the area of the activity range from 70 to 200 m. The JMSA reports that sea surface discoloration has been observed there in the past.
Since the day before, a larger than normal cloud plume had been observed over Farallon de Pajaros.
Information Contacts: JMSA, Tokyo; JMA, Tokyo; T. Tiba, National Science Museum, Tokyo.
Discolored water but no eruption plume
On 2 September, a Continental Air Micronesia pilot observed a zone of brown and light green discolored water about 3 km in diameter, centered about 30 km S of Farallon de Pajaros. No eruption plume was seen by the pilot and inspection of satellite images for several days after 2 September revealed no visible plumes. Cloudy weather obscured the area in the days immediately preceding 2 September. No other reports of activity have been received.
The location of the 1985 activity is approximate, but is not inconsistent with the position of the 1969 eruption and the seamount.
[Report reviewed and attributed to Ahyi in 2023.]
Information Contacts: N. Banks, CVO, Vancouver, WA; W. Gould, NOAA/NESDIS.
T-Phases recorded in Tahiti may be from this site
Between 2 August and 5 September, 109 T-phase events originating in the NW Pacific were received by a high-gain station at Rangiroa, Tahiti. J.M. Talandier notes that their characteristics are typical of submarine volcanic eruptions, being of shallow (ocean) depth; the timing of the events coincides with the presence of a zone of discolored water.... However, a precise origin cannot be determined because the events were of weak amplitude and recorded by only one station.
[Report reviewed and attributed to Ahyi in 2023.]
Information Contacts: J. Talandier, Lab. de Geophysique, Tahiti.
Twenty-one hours of volcanic seismicity
An intense episode of apparent submarine volcanism was recorded 21-22 September by an 11-channel hydrophone array on Wake Island, an ocean bottom seismometer off Japan's Boso Peninsula, and the Polynesian Seismic Network's Pomariorio station, on Rangiroa atoll. Strong activity began at about 1100 and peaked between 1230 and 1520, with several hundred distinct events detected before the episode ended abruptly at about 0755 the next morning. During the activity, continuous noise levels in the SOFAR channel remained at least 20 dB above normal ambient values, at frequencies of 5-30 Hz. T-Phase arrivals at the three sites were used to determine a rough location for the activity at 21.9°N, 145.9°E, with a typical potential error of about ± 100 km [but see 14:12]. However, the calculated position is displaced >200 km E of the northern Marianas volcanic arc, falling on the W edge of the trench.
Activity was last reported from the area on 2 September 1985, when a 3-km zone of discolored water near the 1969 eruption site... was observed from an aircraft. Between 2 August and 5 September 1985, the Polynesian Seismic Network's Rangiroa station recorded 109 T-Phase events, with characteristics typical of submarine eruptions, originating from the NW Pacific. However, no other seismic stations were known to have recorded the activity and a precise location was impossible.
Reference. McCreery, C., Oliveria, F., and Walker, D., 1989, Submarine volcano: EOS, v. 70, p. 1466.
[Report reviewed and attributed to Ahyi in 2023.]
Information Contacts: D. Walker, Univ of Hawaii; J. Talandier, LDG, Tahiti; Y. Sawada, JMA.
Renewed activity at September 1989 site
An ocean bottom seismometer off the Boso Peninsula, Japan, and hydrophones on Wake Island detected renewed episodes of apparent submarine volcanism on 22-24 and 26-27 December. Arrival directions and times were very similar to those from the 21-22 September activity, and probably originated from the same area.
Seismicity began to be recorded by the Boso Peninsula instrument on 22 December at about 0630, and events soon became frequent, although intervals between events were slightly longer than in September. Seismicity had nearly ended shortly before 0200 on 24 December, although one additional shock was recorded at 0245. T-phase signals resumed on 26 December at about 1600 and continued until about 2300 the next day, but occurred at significantly longer intervals than the two earlier episodes.
Using more precise sound velocities, Univ of Hawaii geophysicists refined the locations of the 21-22 September events to about 20.3°N, 144.9°E, roughly 30 km S of... Farallon de Pajaros (Uracas). The potential location error remains large, but is oriented along a NE-SW line oblique to the volcanic chain. The 21-22 September locations are very close to the site of... a 3-km zone of discolored water that was observed in September 1985 near the 1969 eruption site.
[Report reviewed and attributed to Ahyi in 2023.]
Information Contacts: Y. Sawada, JMA; C. McCreery and D. Walker, Univ of Hawaii.
Brief explosive activity on 24 April 2001 detected seismically
A short episode of explosive submarine volcanism was recorded 24 April 2001 by the Laboratoire de Géophysique's (LDG) Pomariorio (PMO) seismic station on Rangiroa Atoll, Tuamotu Archipelago. This episode began at 1110 UTC, and ended at 1900 UTC, with more than 40 explosive T-waves at a fairly uniform rate. The wave forms were similar to those of December 1989 (from a source NW of Supply Reef, SEAN 14:12), and suggested a source in the Mariana Islands. LDG scientists identified these explosive events on records from some other IRIS and Freesia stations, and computed a well-constrained location at 20.34°N, 145.02°E with an error of 15 km (figure 1).
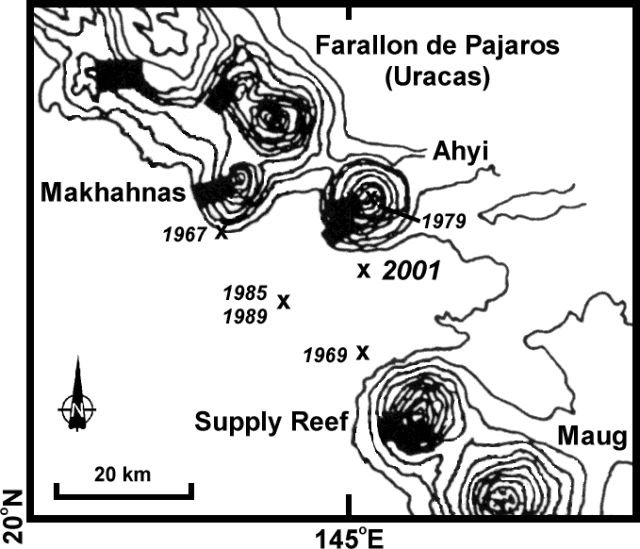 |
Figure 1. Map showing Ahyi and other volcanic edifices along part of the Mariana Arc just north of 20°N, 145°E. The location of the April 2001 activity is indicated, as well as activity reported between Farallon de Pajaros and Supply Reef in 1967, 1969, 1979, 1985, and 1989. Contour interval is 200 m; bathymetry is based on US Navy narrow-beam SASS data. Thick black bars show 1985 dredge locations. Scale and volcanic activity locations are approximate. Base map modified from Bloomer and others (1989). |
The summit of Ahyi lies within this location uncertainty, approximately 10 km N. Ahyi seamount is a large conical submarine volcano that rises to within about 140 m of the sea surface about 18 km SE of Farallon de Pajaros. Water discoloration has been observed over the volcano, and in 1979 the crew of a fishing boat felt shocks over the summit area followed by upwelling of sulfur-bearing water (SEAN 04:11).
Regional volcanic activity. Most of the recent historical activity in this area is based on acoustic detection methods from great distances, making exact location determinations difficult. The following presents background information about other volcanoes close to the April 2001 event, with a description of recent volcanism.
The small 2-km-wide island of Farallon de Pajaros (also known as Uracas) is the northernmost and most active volcano of the Mariana Islands. Its relatively frequent historical eruptions dating back to the mid-19th century have caused it to be referred to as the "lighthouse of the western Pacific." Flank fissures have fed historical lava flows that form platforms along the coast. Summit vents have also been active during historical time, and eruptions have been observed from nearby submarine vents. Aerial observations of fuming were reported in July 1981 (with discolored water), August 1990, and May 1992. Makhahnas seamount, which rises to within 640 m of the sea surface, lies about 10 km SW. A possible eruption during March-April 1967 on the SW flank of this seamount was identified on the basis of T-phase recordings by Norris and Johnson (1969).
Supply Reef is a conical submarine volcano that rises to within 8 m of the sea surface. The seamount lies about 10 km NW of the Maug Islands, the emergent summit of a submarine volcano that is joined to Supply Reef by a low saddle at a depth of about 1,800 m. Several submarine eruptions have been detected by sonar signals originating from points very approximately located at distances of 15-25 km NW of Supply Reef. An event in March 1969 was detected using T-phase recordings and located by the crew of a fishing boat who heard explosion sounds and saw water discoloration (CSLP Cards 528 and 534). Activity in August-September 1985 (SEAN 10:09 and 10:11) and September and December 1989 (SEAN 14:10 and 14:12) were in the same approximate location, 30 km S of Farallon de Pajaros, about midway between Makhahnas and Supply Reef. Both of these events were identified and located using T-phase data, but discolored water was also observed during the 1985 event by an airline pilot.
References. Bloomer, S.H., Stern, R.J., and Smoot, N.C., 1989, Physical volcanology of the submarine Mariana and Volcano arcs: Bulletin of Volcanology, v. 51, p. 210-224.
Norris, R.A., and Johnson, R.H., 1969, Submarine volcanic eruptions recently located in the Pacific by Sofar hydrophones: Journal of Geophysical Research, v. 74, no. 2, p. 650-664.
Information Contacts: Olivier Hyvernaud, Laboratoire de Géophysique, PO Box 640, Pamatai, Tahiti, French Polynesia.
Seismic/acoustic signals and bathymetric data validate April-May 2014 eruption
Ahyi seamount is located ~20 km SE of Farallon de Pajaros and was discussed in the Bulletin associated with volcanic unrest in 1979 (SEAN 04:01) and in 2001 (BGVN 26:05). The evidence for a 2014 eruption at Ahyi seamount includes seismicity, noises heard by divers and felt aboard a vessel in the area, and a follow-up research cruise to Ahyi that measured a hydrothermal plume and significant bathymetric changes since the last survey in 2003. This report is revised from an earlier version.
The U.S. Geological Survey (USGS) reported that, beginning about 0635 local time on 24 April 2014 (2035 on 23 April 2014, UTC), seismometers in various locations in the Mariana Islands began recording T-phase signals interpreted as stemming from an undersea eruption in an area to the N of Pagan island near the island of Uracas (also known as Farallon de Pajaros). Note that throughout this report, at the suggestion of William Chadwick of NOAA, 'T-phase signals' have been used in lieu of 'earthquakes' since all the eruption-related signals were hydroacoustic (from underwater explosions) rather than seismic body-waves. See the final section of this report for a brief definition of T-phase waves. The eruption was ultimately tracked to Ahyi seamount (figures 2 and 3).
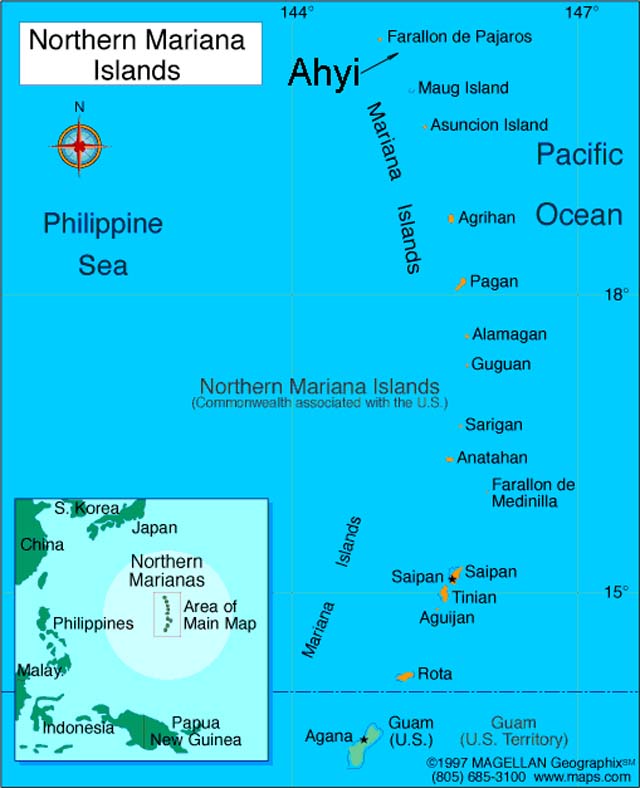 |
Figure 2. Map of the western Pacific margin showing the Northern Mariana Islands with the location of Ahyi volcano added. Original map from Magellan Graphix (1957). |
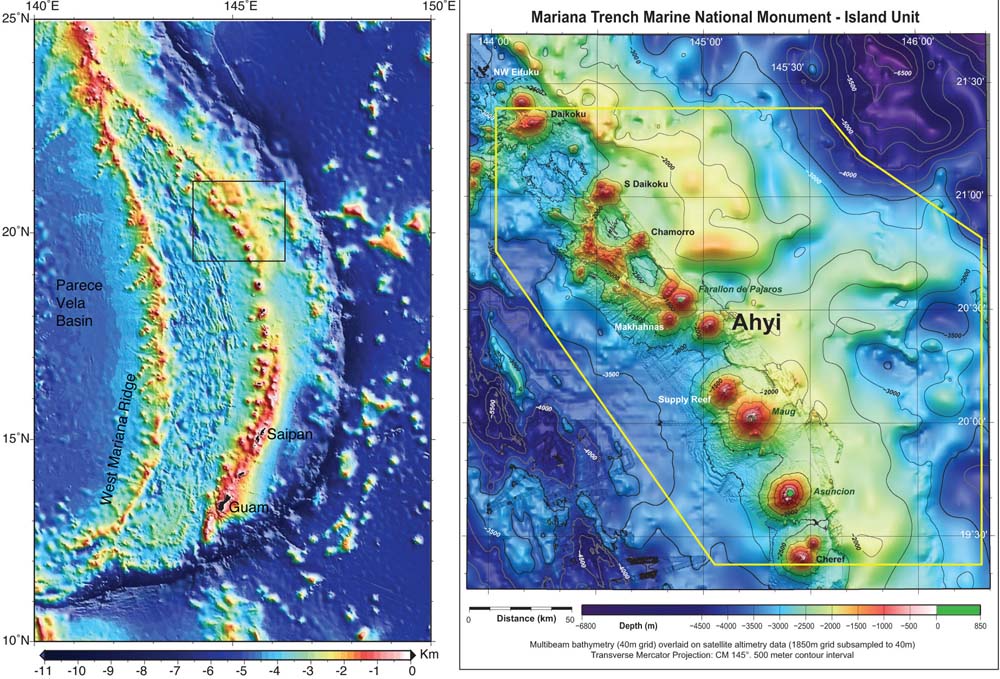 |
Figure 3. (left) A bathymetric map showing the islands and seamounts making up the Mariana island arc. The rectangular box on that map delineates the N part of the arc that is shown on the map at right. (right) A larger scale bathymetric map that highlights features in the vicinity of Ahyi seamount; within the yellow-lined box is the islands unit of the Mariana Trench Marine National Monument. Maps courtesy of Susan Merle, Oregon State University and NOAA-PMEL. |
Seismometers that recorded the 2014 T-phase signals included those on Saipan, Pagan, Sarigan, and Anatahan islands (figure 2). The USGS reported recording T-phases during 24 April through 8 May 2014. During this same period, hydroacoustic sensors on Wake Island (~2,300 km ENE from Ahyi) also received signals. The recorded events all indicated that the source of the hydroacoustic signals was at or near Ahyi seamount, but the accuracy of the initially determined locations remained uncertain because there are other active volcanic seamounts in the area.
On 25 April 2014 the Aviation Color Code was raised by the USGS from Unassigned (Volcanic Alert Level: Unassigned) to Yellow (Volcanic Alert Level: Advisory). As of 29 May, USGS had received no reports of an eruption plume or any evidence that eruptive products had reached the surface. Satellite images showed nothing indicative of a volcanic eruption. On 29 May the Aviation Color Code was lowered by the USGS to Unassigned (Volcanic Alert Level: Unassigned).
At the time of the T-phase signals in April 2014, submarine explosions were heard and felt by scuba divers conducting coral reef research in the area. Chip Young, leader of the Hi'ialakai expedition working in the area as part of a coral reef survey by the NOAA Pacific Islands Fisheries Science Center (PIFSC), provided the following information on 28-29 April 2014. At this stage, the source of the signals was still a mystery.
"While we were diving [on 26 April at Farallon de Pajaros (FDP)] we could hear eruptions underwater. It wasn't casual, in fact, it sounded like bombs exploding with the concussion felt through your body. I don't know how close we were to the event, none of the…divers saw volcanic activity, but at least one explosion was so powerful, that it reverberated through the hull of the ship and the crew onboard thought that something had happened to the ship (at the time they didn't realized we too were hearing these explosions under water)."
"The first divers' comments about hearing something underwater started at Asuncion (4/24-4/25). We were at FDP on [26 April] and to my best guess, the massive explosion that I previously wrote about occurred 0100-0230 26 APR 14 UTC on the SE side of FDP. There were plenty of other explosions throughout the day, but that was the largest one I experienced. There were conglomerates/mats of orange+yellow bubbles on the surface of the water on the SE coastline of FDP as well. We had a very calm day at FDP, so the mats/sludge stretched on for 20-30 ft [~7-9 m] or more. These could have been from Ahyi, but visual disturbances near Ahyi weren't specifically made because we passed there in the early [morning] on the way to FDP and then in the evening on the way to Maug. We did hear explosions underwater at Maug too. I heard distant explosions, which I assumed were from FDP, but there were closer ones too. Not as violent as the sounds we heard at FDP, but 'cracks' for sure."
During the height of the T-phase swarm, explosive signals from the underwater eruption source in the vicinity of Ahyi were occurring at a rate of ~20 per hour. On 16 May 2014, the USGS reported that over the preceding week, T-phase signals had greatly diminished.
Verification of 2014 Ahyi eruption. A subsequent expedition took place during 12-18 May, after the eruption T-phases had stopped. This expedition, led by Chip Young and Dave Butterfield aboard the R/V Hi'ialakai, was working at Maug island (~50 km SSE of Ahyi) and conducted several water-column CTD (conductivity-temperature-depth) casts in the area. They found a hydrothermal plume coming from Ahyi. In addition, they collected new bathymetric data over the summit of Ahyi, which showed the depth changes that confirmed that Ahyi was indeed the source of the 2014 eruption.
According to William Chadwick, NOAA surveyed Ahyi in 2003, measuring a summit depth of 60 m. After the T-phase signals declined in mid-May 2014, the NOAA ship Hi'ialakai went over the summit and the new minimum depth was found to be 75 m. In addition, a new summit crater is evident in the 2014 bathymetry that is ~95 m deep. Bloomer and others (1989) noted a value of 137 m as Ahyi's summit depth, based on U.S. Navy Sonar Array Sounding System (SASS), an early form of multibeam sonar. This pre-2003 summit depth value is probably less accurate and therefore does not necessarily represent a true depth change between the SASS survey and 2003.
Figure 4B shows the results of multibeam sonar bathymetry over Ahyi's summit collected by the Hi'ialakai in 2014. This map was compared to their previous survey in 2003 (figure 4A) and used to compose a third map (figure 4C) showing depth differences between the two surveys. In essence, the summit elevation dropped by 25 m; a crater had developed with a floor at a depth of 195 m; and a conspicuous landslide chute descended to at least 2,300 m depth along the SE slope. Up to 125 m of material was removed from the head of the landslide chute, and constructional deposits downslope were up to 40 m thick. The map analysts noted that even though the 2014 re-survey was limited and produced an incomplete look at the entire Ahyi edifice, the changes were very clear and indicated recent eruptive activity at Ahyi.
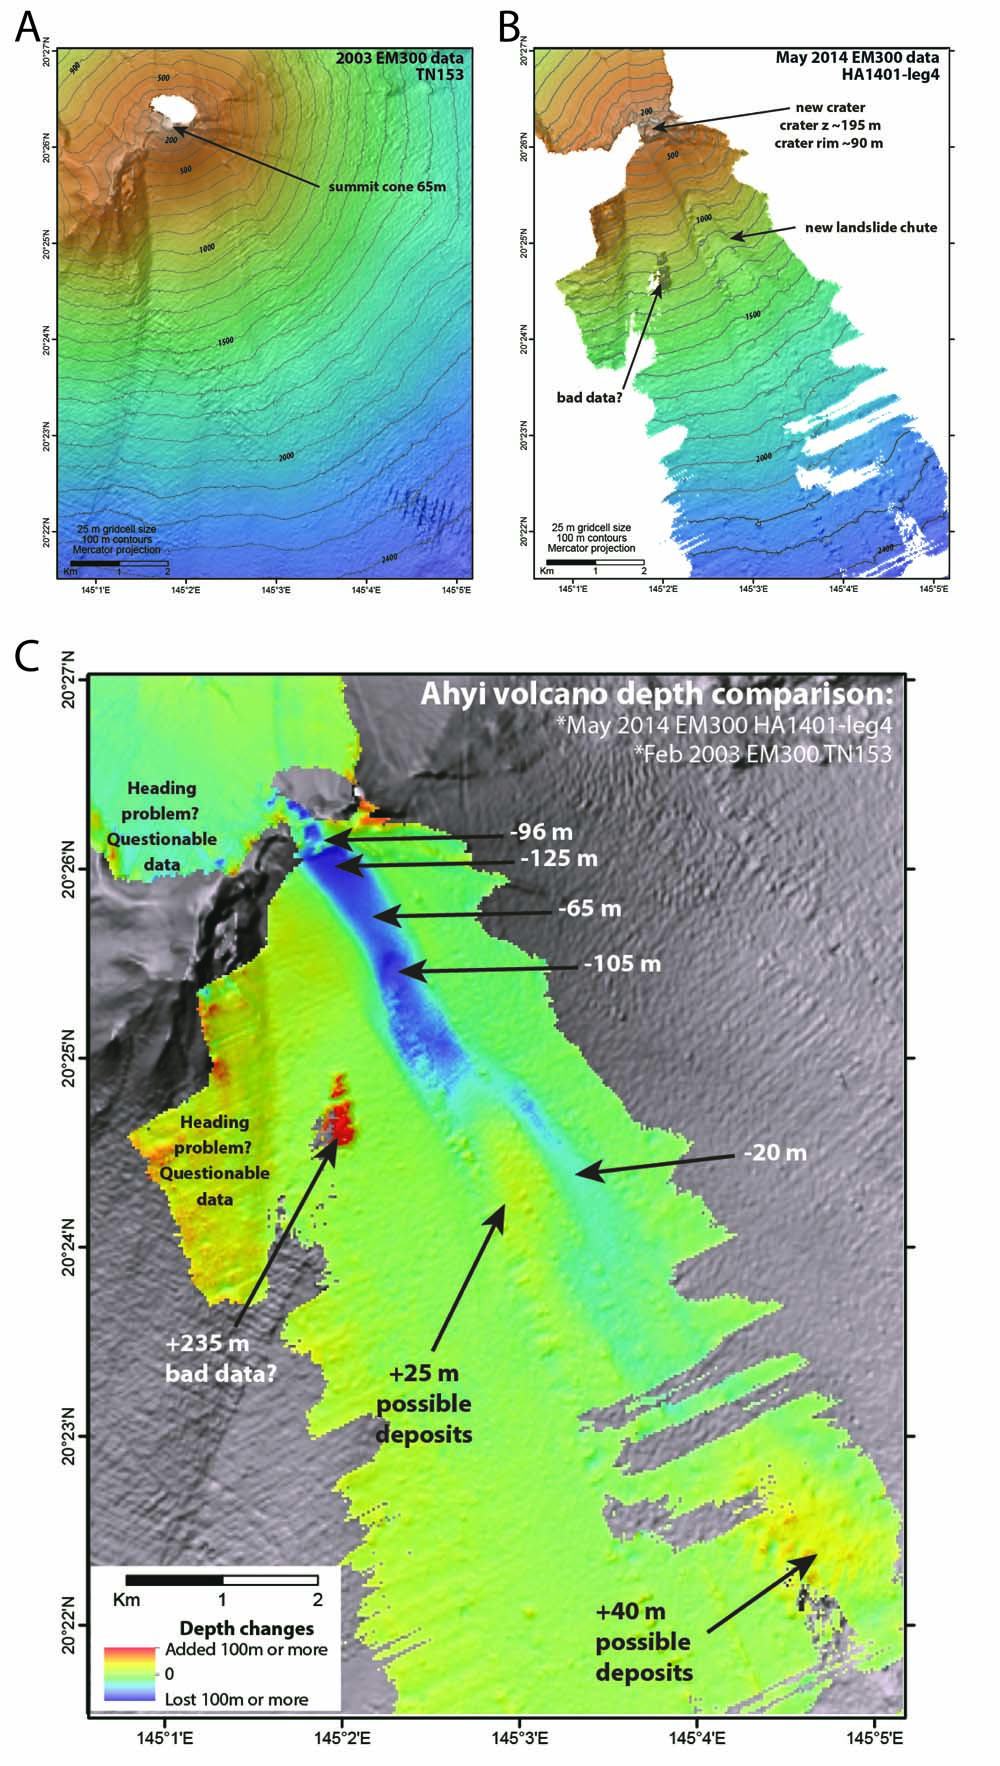 |
Figure 4. Three maps (frames A, B, C) showing multibeam bathymetry and analyses of bathymetric changes between surveys of 2003 and May 2014 of Ahyi volcano (white areas signify lack of data). (A) Bathymetry of Ahyi volcano conducted 2003 showing a cone with summit at a depth of 65 m (Merle and others, 2003). (B) Ahyi map from survey conducted May 2014. The cone was gone and was replaced by a new crater with a rim at 90 m depth and a floor at 195 m depth. The current minimum summit depth for the volcano at 75 m resides near the location on figure 4B labeled "crater rim ~90 m." Extending SSE from the new crater, the research disclosed a new landslide chute descending to at least 2,300 m depth. (C) Depth changes comparing 2003 and 2014 maps. As defined on key at lower left, the cool colors signify material removed; green, no change; and warm colors, material added. Labels indicate elevation changes disclosed in the comparison (e.g. -20 m means this area is 20 m lower on the 2014 map than on the 2003 map). Map courtesy of Susan Merle, Oregon State University and NOAA/PMEL. |
T-phase waves: According to Okal (2011) "T phases are defined as seismic recordings of signals having traveled an extended path as acoustic waves in the water body of the oceans. This is made possible by the 'Sound Fixing and Ranging' (SOFAR) channel, a layer of minimum sound velocity acting as a wave guide at average depths of 1,000 m. It allows the efficient propagation of extremely small signals over extremely long distances, in practice limited only by the finite size of the ocean basins."
The use of T-waves has led to much improved diagnosis of submarine vent locations. For example, Fox and Dziak (1998) described the detection of intense seismicity the NE Pacific Ocean using the T-phase Monitoring System developed by NOAA/PMEL to access the U.S. Navy's SOund SUrveillance System (SOSUS) in the North Pacific. Dziak and Fox (2002) discussed monitoring of hydroacoustic signals from the Volcano Islands arc, S of Japan (just N of the N Mariana Islands shown in figure 2), a region with frequent submarine eruptions. The signals are characterized by a narrowband, long-duration, high-amplitude fundamental centered at 10 Hz with three harmonics at 20, 30, and 40 Hz. The hydroacoustic (T-wave) signals are consistent with harmonic tremor signals observed using traditional seismic methods at active subaerial volcanoes throughout the world.
References. Bloomer, S.H., Stern, R.J., and Smoot, N.C., 1989, Physical volcanology of the submarine Mariana and Volcano Arcs, Bulletin of Volcanology, v. 51, pp. 210-224.
Bloomer, S.H., Stern, R.J., Fisk, E., and Geschwind, C.H., 1989, Shoshonitic Volcanism in the Northern Mariana Arc 1. Mineralogic and Major and Trace Element Characteristics, Journal of Geophysical Research, v. 94, no. B4, pp. 4469-4496.
Dziak, R.P., and Fox, C.G., 2002, Evidence of harmonic tremor from a submarine volcano detected across the Pacific Ocean basin, Journal of Geophysical Research, v. 107, no. B5, p. 2085.
Fox, C.G., and Dziak, R.P., 1998 (December), Hydroacoustic detection of volcanic activity on the Gorda Ridge, February-March 1996, Deep Sea Research Part II: Topical Studies in Oceanography, v. 45, no. 12, pp. 2513-2530 (DOI: 10.1016/S0967-0645(98)00081-2).
Magellan Graphix, 1997, Map: Northern Mariana Islands (territory of US) (URL: http://www.infoplease.com/atlas/state/northernmarianaislands.html).
Merle, S., Embley, R., Baker, E., and Chadwick, B., 2003, Submarine Ring of Fire 2003 - Mariana Arc R/V T.G. Thompson Cruise TN-153, February 9-March 5, 2003, Guam to Guam, Cruise Report, NOAA-PMEL (URL: http://www.pmel.noaa.gov/eoi/marianas/marianas-crrpt-03.pdf).
Okal, E.A., 2011, T Waves, in Gupta, H.K. (ed), Encyclopedia of Solid Earth Geophysics, pp. 1421-1423, Springer Netherlands (DOI: 10.1007/978-90-481-8702-7_165).
USGS, 2014 (30 April), Northern Mariana Islands Information Statement, Wednesday, April 30, 2014 5:36 AM ChST (Tuesday, April 29, 2014 19:36 UTC) (URL: http://volcanoes.usgs.gov/activity/archiveupdate.php?noticeid=10031).
USGS, 2014 (1 May), A new submarine eruption in the Northern Mariana Islands: could it happen here?, Hawaii Volcano Observatory (URL: http://hvo.wr.usgs.gov/volcanowatch/view.php?id=226).
USGS, 2014 (16 May), Current Alerts for U.S. Volcanoes, Northern Mariana Islands Weekly Update, 16 May (URL: http://volcanoes.usgs.gov/nmi/activity//status.php).
USGS, 2014 (23 May), Northern Mariana islands Weekly Update, 23 May 2014 (URL: http://volcanoes.usgs.gov/nmi/activity/index.php).
Information Contacts: NOAA Pacific Marine Environmental Laboratory (NOAA-PMEL), 7600 Sand Point Way NE, Bldg #3, Seattle, WA 98115 (URL: http://www.pmel.noaa.gov/); William W. Chadwick and Susan Merle, NOAA-PMEL Earth-Ocean Interactions Program and Oregon State University; David A. Butterfield, University of Washington and NOAA-PMEL; Charles (Chip) Young, NOAA Fisheries, Pacific Islands Fisheries Science Center (PIFSC); Matt Haney, U.S. Geological Survey (USGS), Alaska Volcano Observatory (AVO), Anchorage, AK 99508; USGS Volcano Hazards Program (URL: http://volcanoes.usgs.gov/nmi/activity/); and CNMI Emergency Management Office (URL: http://www.cnmihomelandsecurity.gov.mp/).
Hydrothermal activity continues in December 2014
Ahyi seamount is one of a long string of submarine seamounts at the northern edge of the Northern Mariana Islands, part of the Mariana Back-arc segment of the Izu-Bonin trench in the western Pacific Ocean. The remote location of the seamount has made eruptions difficult to document, but seismic stations installed in the region confirmed an eruption in the vicinity in 2001. No further activity was reported until a new eruption was detected by seismic stations and felt by divers in the immediate area in April 2014. Volcanic activity in the Commonwealth of the Northern Mariana Islands is monitored by the US Geological Survey's Volcano Hazards Program, and observations are sometimes gathered by NOAA (National Oceanic and Atmospheric Administration) expeditions. The 2014 eruption and follow-up observations from December 2014 are summarized here.
The eruption at Ahyi seamount between 24 April and 17 May 2014 (BGVN 39:02; Haney et al., 2014) was first recorded as T-phase signals that were detected by various seismometers in the Mariana Islands. Submarine explosions were also heard and felt by NOAA scuba divers conducting coral reef research on the SE coastline of Farallon de Pajaros (Uracas) Island, about 20 km NW of Ahyi. In the same area, the NOAA crew reported sighting mats of orange-yellow bubbles on the water surface that extended up to 1 km from the shoreline. T-phase seismic signals registered across the Northern Mariana Islands (NMI) seismic network at a rate of approximately 10 per hour until 8 May, and then sporadically until 17 May (Haney et al., 2014).
During mid-May, the NOAA ship Hi'ialakai gathered multibeam sonar bathymetry and took three water-column CTD casts (Conductivity, Temperature, and Depth sensor; it gives scientists a precise and comprehensive charting of the distribution and variation of water temperature, salinity, and density). The May 2014 bathymetry revealed that the minimum depth to the summit was about 90 m, notably deeper than the 60 m measured during a 2003 survey. In addition a new crater about 100 m deep had formed at the summit, replacing the summit cone. Also, a distinct landslide chute descended the SE slope 2,300 m, removing material from the head and depositing debris at the base (see figure 4, BGVN 39:02). Significant particle plumes were detected with all three CTD casts, indicating ongoing hydrothermal activity. Plumes with optical anomalies up to 0.4 NTU (nephelometric turbidity units) were found S and W of Ahyi at 100-175 m water depth, corresponding to the depth of the new summit crater. NTU's are light backscattering measurements done by optical sensors in sea water to determine the presence of hydrothermal plumes in the water column.
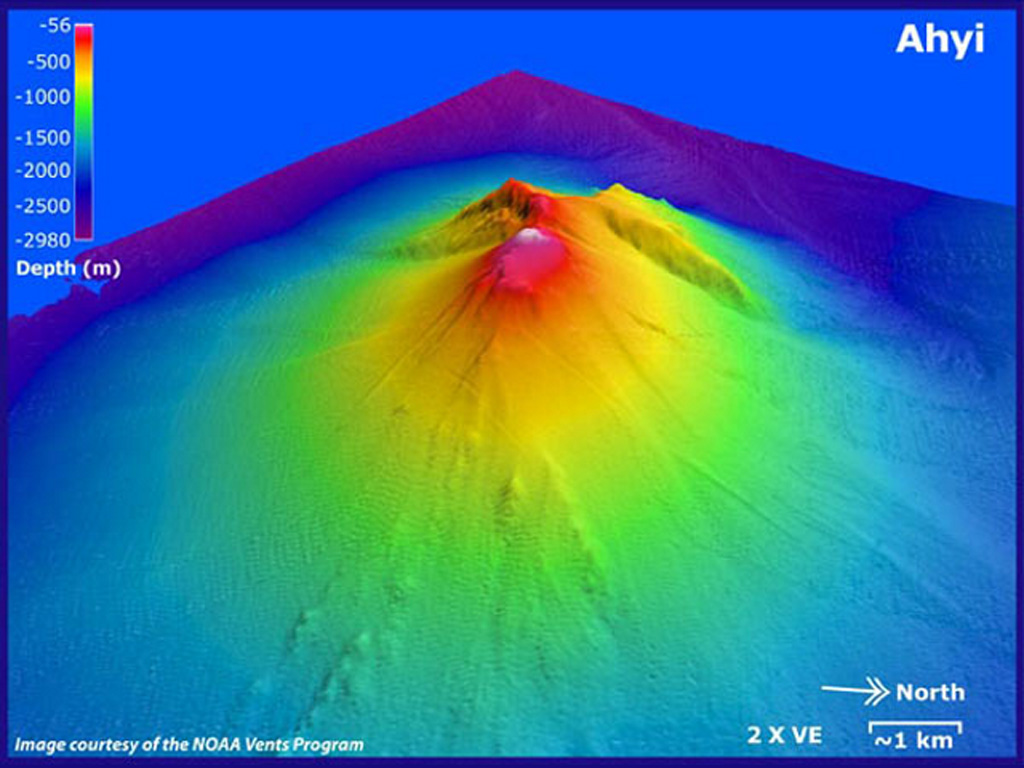
On 4 December 2014, the NOAA Expedition "Submarine Ring of Fire 2014 – Ironman" visited Ahyi, and again used a CTD sensor to assess the hydrothermal status of the volcano. EM122 multibeam bathymetry data imaged CO2 gas bubbles rising from the summit (figure 5), and clearly revealed the new summit crater. When the CTD sensor and sampling package was lowered into the water, it measured a thick plume of particles indicating ongoing hydrothermal activity near 150 m depth, close to the base of the new crater that formed during the eruption in April-May 2014.
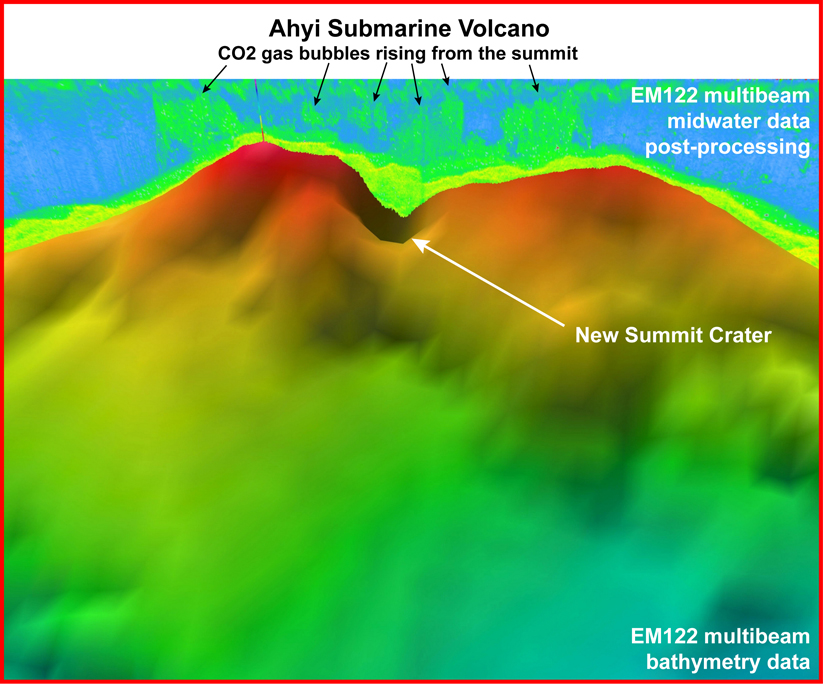 |
Figure 5. Three-dimensional image of the summit of Ahyi submarine volcano gathered on 4 December 2014 with the mid-water data shown above the new crater created by the April 2014 eruption. The summit crater is ~100 m deep. CO2 bubbles (in green) can be seen rising from most of the summit, suggesting that there is more than one source of venting. This image shows an area 850 m across with depths ranging from 78 (red) to 400 m (blue). No vertical exaggeration. Image courtesy of Submarine Ring of Fire 2014 - Ironman, NSF/NOAA (http://oceanexplorer.noaa.gov/explorations/ 14fire/logs/december04/media/ahyi.html). |
References: Haney, M. M., Chadwick, W., Merle, S. G., Buck, N. J., Butterfield, D. A., Coombs, M. L., Evers, L. G., Heaney, K. D., Lyons, J. J., Searcy, C. K., Walker, S. L., Young, C., and Embley, R. W., The 2014 Submarine Eruption of Ahyi Volcano, Northern Mariana Islands, American Geophysical Union, Fall Meeting 2014, abstract V11B-4727.
Information Contacts: National Oceanic and Atmospheric Administration (NOAA), Office of Ocean Exploration and Research, 1315 East-West Highway, Silver Spring, Maryland, USA (URL: http://oceanexplorer.noaa.gov/welcome.html); US Geological Survey, Volcano Hazards Program (USGS-VHP), 12201 Sunrise Valley Drive, Reston, VA, USA (URL: https://volcanoes.usgs.gov/index.html).
Intermittent hydroacoustic signals and discolored plumes during November 2022-June 2023
Ahyi seamount is a large, conical submarine volcano that rises to within 75 m of the ocean surface about 18 km SE of the island of Farallon de Pajaros in the Northern Marianas. The remote location of the seamount has made eruptions difficult to document, but seismic stations installed in the region confirmed an eruption in the vicinity in 2001. No new activity was detected until April-May 2014 when an eruption was detected by NOAA (National Oceanic and Atmospheric Administration) divers, hydroacoustic sensors, and seismic stations (BGVN 42:04). New activity was first detected on 15 November by hydroacoustic sensors that were consistent with submarine volcanic activity. This report covers activity during November 2022 through June 2023 based on daily and weekly reports from the US Geological Survey.
Starting in mid-October, hydroacoustic sensors at Wake Island (2.2 km E) recorded signals consistent with submarine volcanic activity, according to a report from the USGS issued on 15 November 2022. A combined analysis of the hydroacoustic signals and seismic stations located at Guam and Chichijima Island, Japan, suggested that the source of this activity was at or near the Ahyi seamount. After a re-analysis of a satellite image of the area that was captured on 6 November, USGS confirmed that there was no evidence of discoloration at the ocean surface. Few hydroacoustic and seismic signals continued through November, including on 18 November, which USGS suggested signified a decline or pause in unrest. A VONA (Volcano Observatory Notice for Aviation) reported that a discolored water plume was persistently visible in satellite data starting on 18 November (figure 6). Though clouds often obscured clear views of the volcano, another discolored water plume was captured in a satellite image on 26 November. The Aviation Color Code (ACC) was raised to Yellow (the second lowest level on a four-color scale) and the Volcano Alert Level (VAL) was raised to Advisory (the second lowest level on a four-level scale) on 29 November.
|
Figure 6. A clear, true color satellite image showed a yellow-green discolored water plume extending NW from the Ahyi seamount (white arrow) on 21 November 2022. Courtesy of Copernicus Browser. |
During December, occasional detections were recorded on the Wake Island hydrophone sensors and discolored water over the seamount remained visible. During 2-7, 10-12, and 16-31 December possible explosion signals were detected. A small area of discolored water was observed in high-resolution Sentinel-2 satellite images during 1-6 December (figure 7). High-resolution satellite images recorded discolored water plumes on 13 December that originated from the summit region; no observations indicated that activity breached the ocean surface. A possible underwater plume was visible in satellite images on 18 December, and during 19-20 December a definite but diffuse underwater plume located SSE from the main vent was reported. An underwater plume was visible in a satellite image taken on 26 December (figure 7).
|
Figure 7. Clear, true color satellite images showed yellow-green discolored water plumes extending NE and W from Ahyi (white arrows) on 1 (left) and 26 (right) December 2022, respectively. Courtesy of Copernicus Browser. |
Hydrophone sensors continued to detect signals consistent with possible explosions during 1-8 January 2023. USGS reported that the number of detections decreased during 4-5 January. The hydrophone sensors experienced a data outage that started at 0118 on 8 January and continued through 10 January, though according to USGS, possible explosions were recorded prior to the data outage and likely continued during the outage. A discolored water plume originating from the summit region was detected in a partly cloudy satellite image on 8 January. On 11-12 and 15-17 January possible explosion signals were recorded again. One small signal was detected during 22-23 January and several signals were recorded on 25 and 31 January. During 27-31 January a plume of discolored water was observed above the seamount in satellite imagery (figure 8).
|
Figure 8. True color satellite images showed intermittent yellow-green discolored water plumes of various sizes extending N on 5 January 2023 (top left), SE on 30 January 2023 (top right), W on 4 February 2023 (bottom left), and SW on 1 March 2023 (bottom right) from Ahyi (white arrows). Courtesy of Copernicus Browser. |
Low levels of activity continued during February and March, based on data from pressure sensors on Wake Island. During 1 and 4-6 February activity was reported, and a submarine plume was observed on 4 February (figure 8). Possible explosion signals were detected during 7-8, 10, 13-14, and 24 February. During 1-2 and 3-5 March a plume of discolored water was observed in satellite imagery (figure 8). Almost continuous hydroacoustic signals were detected in remote pressure sensor data on Wake Island 2,270 km E from the volcano during 7-13 March. During 12-13 March water discoloration around the seamount was observed in satellite imagery, despite cloudy weather. By 14 March discolored water extended about 35 km, but no direction was noted. USGS reported that the continuous hydroacoustic signals detected during 13-14 March stopped abruptly on 14 March and no new detections were observed. Three 30 second hydroacoustic detections were reported during 17-19 March, but no activity was visible due to cloudy weather. A data outage was reported during 21-22 March, making pressure sensor data unavailable; a discolored water plume was, however, visible in satellite data. A possible underwater explosion signal was detected by pressure sensors at Wake Island on 26, 29, and 31 March, though the cause and origin of these events were unclear.
Similar low activity continued during April, May, and June. Several signals were detected during 1-3 April in pressure sensors at Wake Island. USGS suggested that these may be related to underwater explosions or earthquakes at the volcano, but no underwater plumes were visible in clear satellite images. The pressure sensors had data outages during 12-13 April and no data were recorded; no underwater plumes were visible in satellite images, although cloudy weather obscured most clear views. Eruptive activity was reported starting at 2210 on 21 May. On 22 May a discolored water plume that extended 4 km was visible in satellite images, though no direction was recorded. During 23-24 May some signals were detected by the underwater pressure sensors. Possible hydroacoustic signals were detected during 2-3 and 6-8 June. Multiple hydroacoustic signals were detected during 9-11 and 16-17 June, although no activity was visible in satellite images. One hydroacoustic signal was detected during 23-24 June, but there was some uncertainty about its association with volcanic activity. A single possible hydroacoustic signal was detected during 30 June to 1 July.
Information Contacts: US Geological Survey, Volcano Hazards Program (USGS-VHP), 12201 Sunrise Valley Drive, Reston, VA, USA, https://volcanoes.usgs.gov/index.html; Copernicus Browser, Copernicus Data Space Ecosystem, European Space Agency (URL: https://dataspace.copernicus.eu/browser/).
|
|
||||||||||||||||||||||||||
There is data available for 11 confirmed eruptive periods.
2024 Aug 5 - 2025 May 28 Confirmed Eruption (Submarine) VEI: 0
| Episode 1 | Eruption (Submarine) | ||||||||||||||
|---|---|---|---|---|---|---|---|---|---|---|---|---|---|---|
| 2024 Aug 5 - 2025 May 28 | Evidence from Observations: Reported | |||||||||||||
|
List of 1 Events for Episode 1
|
||||||||||||||
2024 Jan 1 - 2024 Mar 27 Confirmed Eruption (Submarine) VEI: 0
| Episode 1 | Eruption (Submarine) | ||||||||||||||
|---|---|---|---|---|---|---|---|---|---|---|---|---|---|---|
| 2024 Jan 1 - 2024 Mar 27 | Evidence from Observations: Satellite (visual) | |||||||||||||
|
List of 1 Events for Episode 1
|
||||||||||||||
2022 Nov 18 ± 1 days - 2023 Jun 11 Confirmed Eruption (Submarine) VEI: 1
| Episode 1 | Eruption (Submarine) | |||||||||||||||||||
|---|---|---|---|---|---|---|---|---|---|---|---|---|---|---|---|---|---|---|---|
| 2022 Nov 18 ± 1 days - 2023 Jun 11 | Evidence from Observations: Reported | ||||||||||||||||||
|
List of 2 Events for Episode 1
|
|||||||||||||||||||
2014 Apr 24 - 2014 May 17 Confirmed Eruption (Submarine) VEI: 2
| Episode 1 | Eruption (Submarine) | Summit crater and SE slope | ||||||||||||||||||||||||||||||||||||||||||||||||||||||||||||||||||||
|---|---|---|---|---|---|---|---|---|---|---|---|---|---|---|---|---|---|---|---|---|---|---|---|---|---|---|---|---|---|---|---|---|---|---|---|---|---|---|---|---|---|---|---|---|---|---|---|---|---|---|---|---|---|---|---|---|---|---|---|---|---|---|---|---|---|---|---|---|---|
| 2014 Apr 24 - 2014 May 17 | Evidence from Observations: Hydrophonic | ||||||||||||||||||||||||||||||||||||||||||||||||||||||||||||||||||||
| Seismic stations on Pagan, Sarigan, Anatahan, and Saipan began recording signals starting at 0635 on 24 April 2014, believed to be from an undersea volcanic source at or near Ahyi seamount. On 26 April, while conducting coral reef research at Farallon de Pajaros, NOAA divers reported hearing loud explosions and feeling shock waves. Explosion signals of 20 per hour were recorded during 4-5 May. Seismicity decreased significantly beginning 8 May and the last seismic signals were recorded by 23 May. A bathymetry survey during 12-18 May revealed a new summit crater and a landslide chute that descended to at least 2,300 m depth along the SE slope of the seamount. Ongoing hydrothermal activity near 150 m depth, close to the base of the new crater was measured in December 2014. | |||||||||||||||||||||||||||||||||||||||||||||||||||||||||||||||||||||
|
List of 12 Events for Episode 1 at Summit crater and SE slope
|
|||||||||||||||||||||||||||||||||||||||||||||||||||||||||||||||||||||
2001 Apr 24 - 2001 Apr 25 Confirmed Eruption (Submarine) VEI: 0
| Episode 1 | Eruption (Submarine) | S of Ahyi (20.34 N, 145.02 E) | ||||||||||||||||||
|---|---|---|---|---|---|---|---|---|---|---|---|---|---|---|---|---|---|---|---|
| 2001 Apr 24 - 2001 Apr 25 | Evidence from Observations: Hydrophonic | ||||||||||||||||||
| A short episode of explosive submarine volcanism was recorded 24-25 April 2001 by the Laboratoire de Géophysique's (LDG) Pomariorio (PMO) seismic station on Rangiroa Atoll, Tuamotu Archipelago. This episode began at 1110 UTC, and ended at 1900 UTC, with more than 40 explosive T-waves at a fairly uniform rate. The wave forms were similar to those of a December 1989 events. LDG scientists identified these explosive events on records from additional IRIS and Freesia stations, and computed a well-constrained location at 20.34°N, 145.02°E with an error of 15 km. This site lies at the southern base of Ahyi, ~9 km from the summit. | |||||||||||||||||||
|
List of 2 Events for Episode 1 at S of Ahyi (20.34 N, 145.02 E)
|
|||||||||||||||||||
1994 Apr 23 Confirmed Eruption (Submarine) VEI: 0
| Episode 1 | Eruption (Submarine) | |||||||||||||||||||
|---|---|---|---|---|---|---|---|---|---|---|---|---|---|---|---|---|---|---|---|
| 1994 Apr 23 - Unknown | Evidence from Observations: Reported | ||||||||||||||||||
| An anomalous discoloration on the ocean surface ~17-18 km S of Farallon de Pajaros was seen by USGS volcanologists on 23 April 1994 (Sako et al., 1995). From about 30 m above the surface they observed large bubbles rising to the surface, with the area of most intense upwelling across an area of perhaps 10-30 m in diameter. A narrow (20-40 m) trail of discolored water (light green to yellow, in contrast to the deep blue of the unaffected ocean) drifted several hundred meters to the north. | |||||||||||||||||||
|
List of 2 Events for Episode 1
|
|||||||||||||||||||
1989 Sep 21 - 1989 Dec 27 Confirmed Eruption (Submarine) VEI: 0
| Episode 1 | Eruption (Submarine) | SW of Ahyi (~20.3 N, 144.9 E) | ||||||||||||||||||||||||||||
|---|---|---|---|---|---|---|---|---|---|---|---|---|---|---|---|---|---|---|---|---|---|---|---|---|---|---|---|---|---|
| 1989 Sep 21 - 1989 Dec 27 | Evidence from Observations: Hydrophonic | ||||||||||||||||||||||||||||
| Apparent submarine volcanism was detected by hydrophone arrays 21-22 September, 22-24 December, and 26-27 December 1989. The location, with a very large potential error, appears to be ~20 km SW of Ahyi seamount, near the location of similar events in 1985 and 1969. University of Hawaii geophysicists refined the locations of the 21-22 September events to about 20.3°N, 144.9°E, noting that he potential location error remained large, but was oriented along a NE-SW line oblique to the volcanic chain. | |||||||||||||||||||||||||||||
|
List of 4 Events for Episode 1 at SW of Ahyi (~20.3 N, 144.9 E)
|
|||||||||||||||||||||||||||||
1985 Aug 2 - 1985 Sep 5 Confirmed Eruption (Submarine) VEI: 0
| Episode 1 | Eruption (Submarine) | SW of Ahyi | |||||||||||||||||||||||
|---|---|---|---|---|---|---|---|---|---|---|---|---|---|---|---|---|---|---|---|---|---|---|---|---|
| 1985 Aug 2 - 1985 Sep 5 | Evidence from Observations: Hydrophonic | |||||||||||||||||||||||
| Between 2 August and 5 September 1985 T-phase events typical of those associated with submarine eruptions were detected at the Tahiti station, but a precise origin could not be determined because the events were of weak amplitude and recorded by only one station. Discolored water about 3 km in diameter was observed by an airline pilot on 2 September about 30 km S of Farallon de Pájaros, or about 20 km SW of Ahyi seamount. | ||||||||||||||||||||||||
|
List of 3 Events for Episode 1 at SW of Ahyi
|
||||||||||||||||||||||||
[ 1979 Nov 15 - 1979 Nov 15 ] Uncertain Eruption
| Episode 1 | Eruption (Submarine) | Near the Ahyi summit | |||||||||||||||||||||||
|---|---|---|---|---|---|---|---|---|---|---|---|---|---|---|---|---|---|---|---|---|---|---|---|---|
| 1979 Nov 15 - 1979 Nov 15 | Evidence from Observations: Reported | |||||||||||||||||||||||
| A fishing boat crew felt a series of shocks, followed by the upwelling of sulfur-containing water (20.445°N, 145.03°E). The location was near the summit of Ahyi seamount; JMSA reports that water discoloration has been observed there in the past. | ||||||||||||||||||||||||
|
List of 3 Events for Episode 1 at Near the Ahyi summit
|
||||||||||||||||||||||||
1969 Mar 11 - 1969 Mar 13 Confirmed Eruption (Submarine) VEI: 0
| Episode 1 | Eruption (Submarine) | S of Ahyi (20.24 N, 145.02 E) | ||||||||||||||||||||||||||||
|---|---|---|---|---|---|---|---|---|---|---|---|---|---|---|---|---|---|---|---|---|---|---|---|---|---|---|---|---|---|
| 1969 Mar 11 - 1969 Mar 13 | Evidence from Observations: Hydrophonic | ||||||||||||||||||||||||||||
| Hydrophone stations at Eniwetok, Wake, and Midway detected acoustic activity which appeared to be at the location of the March 1967 event (Norris and Johnson, 1969), which would be ~25 km ESE of Ahyi. However, Japanese fishermen described three instances of explosion sounds on 12 March from ~20 km S of Ahyi (20.24°N, 145.02°E), including brown water discoloration. Norris and Hart (1970) computed SOFAR source positions for several explosions, tracing a line E from the fishing boat location past and just S of the Ahyi summit, noting that the E-W spread was due to all of the recording stations being E of the source. | |||||||||||||||||||||||||||||
|
List of 4 Events for Episode 1 at S of Ahyi (20.24 N, 145.02 E)
|
|||||||||||||||||||||||||||||
1967 Mar 27 - 1967 Apr 10 Confirmed Eruption (Submarine) VEI: 0
| Episode 1 | Eruption (Submarine) | SW of Farallon de Pájaros | ||||||||||||||||||
|---|---|---|---|---|---|---|---|---|---|---|---|---|---|---|---|---|---|---|---|
| 1967 Mar 27 - 1967 Apr 10 | Evidence from Observations: Hydrophonic | ||||||||||||||||||
| SOFAR signals interpreted as being cause by a submarine eruption were detected 27 March to 10 April 1967 from a location SW of Farallon de Pajaros island. The precision of the location of the signal source was not stated, but the given location corresponds to a point on the southwest flank of Makhahnas seamount, whose summit lies 10 km SW of the island. It is also about 25 km ESE of Ahyi seamount; University of Hawaii scientists noted during a similar 1989 events that potential location errors were along a NE-SW line. | |||||||||||||||||||
|
List of 2 Events for Episode 1 at SW of Farallon de Pájaros
|
|||||||||||||||||||
1934 Jul 15 ± 45 days Confirmed Eruption (Submarine) VEI: 1
| Episode 1 | Eruption (Submarine) | Vicinity of Farallon de Pájaros | ||||||||||||||||||
|---|---|---|---|---|---|---|---|---|---|---|---|---|---|---|---|---|---|---|---|
| 1934 Jul 15 ± 45 days - Unknown | Evidence from Observations: Reported | ||||||||||||||||||
| Following a visit to the area in the summer of 1936, Tanakadate (1940) reported that "According to the inhabitants of Saipan Island, in the summer of 1934, a submarine eruption occurred in the vicinity of Uracas (20°31'N, 144°53'E) when large quantities of steam were seen rising from the sea. In the neighborhood of which there floated enormous quantities of pumice of a dark color." The CAVW interpreted those coordinates, about 2 km S of the island, to be an eruption location. However, the original quote appears to be using general coordinates to identify Uracas/Farallon de Pájaros, where all other recent activity was on the island. This eruption seems likely to have been from the Ahyi seamount, a submarine volcano 20 km SE and unknown to Tanakadate at the time of the event, which has been frequently active since the 1960s. | |||||||||||||||||||
|
List of 2 Events for Episode 1 at Vicinity of Farallon de Pájaros
|
|||||||||||||||||||
This compilation of synonyms and subsidiary features may not be comprehensive. Features are organized into four major categories: Cones, Craters, Domes, and Thermal Features. Synonyms of features appear indented below the primary name. In some cases additional feature type, elevation, or location details are provided.
Cones |
||||
| Feature Name | Feature Type | Elevation | Latitude | Longitude |
| Ahyi | Cone | |||
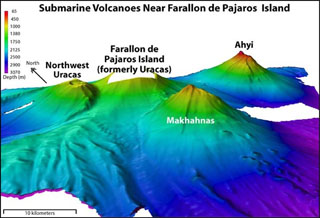 Ahyi seamount (upper right) is a large submarine volcano that rises to within about 150 m of the sea surface about 18 km SE of the island of Farallon de Pajaros (left-center). At various times since 1979, water discoloration, felt seismicity followed by upwelling of sulfur-bearing water, and a seismically detected submarine eruption have been reported at or near the seamount. Two submarine volcanoes on the flanks of Farallon de Pajaros, Northwest Uracas and Makhahnas, are seen in this NOAA bathymetric image.
 Ahyi submarine volcano is seen in a bathymetric view looking from the NE with 2x vertical exaggeration. It rises to within about 150 m of the sea surface about 18 km SE of the island of Farallon de Pajaros (Uracas) in the northern Marianas. Water discoloration has been observed over the volcano and an explosive eruption was seismically detected in April 2001.
There are no samples for Ahyi in the Smithsonian's NMNH Department of Mineral Sciences Rock and Ore collection.
| Copernicus Browser | The Copernicus Browser replaced the Sentinel Hub Playground browser in 2023, to provide access to Earth observation archives from the Copernicus Data Space Ecosystem, the main distribution platform for data from the EU Copernicus missions. |
| MIROVA | Middle InfraRed Observation of Volcanic Activity (MIROVA) is a near real time volcanic hot-spot detection system based on the analysis of MODIS (Moderate Resolution Imaging Spectroradiometer) data. In particular, MIROVA uses the Middle InfraRed Radiation (MIR), measured over target volcanoes, in order to detect, locate and measure the heat radiation sourced from volcanic activity. |
| MODVOLC Thermal Alerts | Using infrared satellite Moderate Resolution Imaging Spectroradiometer (MODIS) data, scientists at the Hawai'i Institute of Geophysics and Planetology, University of Hawai'i, developed an automated system called MODVOLC to map thermal hot-spots in near real time. For each MODIS image, the algorithm automatically scans each 1 km pixel within it to check for high-temperature hot-spots. When one is found the date, time, location, and intensity are recorded. MODIS looks at every square km of the Earth every 48 hours, once during the day and once during the night, and the presence of two MODIS sensors in space allows at least four hot-spot observations every two days. Each day updated global maps are compiled to display the locations of all hot spots detected in the previous 24 hours. There is a drop-down list with volcano names which allow users to 'zoom-in' and examine the distribution of hot-spots at a variety of spatial scales. |
|
WOVOdat
Single Volcano View Temporal Evolution of Unrest Side by Side Volcanoes |
WOVOdat is a database of volcanic unrest; instrumentally and visually recorded changes in seismicity, ground deformation, gas emission, and other parameters from their normal baselines. It is sponsored by the World Organization of Volcano Observatories (WOVO) and presently hosted at the Earth Observatory of Singapore.
GVMID Data on Volcano Monitoring Infrastructure The Global Volcano Monitoring Infrastructure Database GVMID, is aimed at documenting and improving capabilities of volcano monitoring from the ground and space. GVMID should provide a snapshot and baseline view of the techniques and instrumentation that are in place at various volcanoes, which can be use by volcano observatories as reference to setup new monitoring system or improving networks at a specific volcano. These data will allow identification of what monitoring gaps exist, which can be then targeted by remote sensing infrastructure and future instrument deployments. |
| Volcanic Hazard Maps | The IAVCEI Commission on Volcanic Hazards and Risk has a Volcanic Hazard Maps database designed to serve as a resource for hazard mappers (or other interested parties) to explore how common issues in hazard map development have been addressed at different volcanoes, in different countries, for different hazards, and for different intended audiences. In addition to the comprehensive, searchable Volcanic Hazard Maps Database, this website contains information about diversity of volcanic hazard maps, illustrated using examples from the database. This site is for educational purposes related to volcanic hazard maps. Hazard maps found on this website should not be used for emergency purposes. For the most recent, official hazard map for a particular volcano, please seek out the proper institutional authorities on the matter. |
| IRIS seismic stations/networks | Incorporated Research Institutions for Seismology (IRIS) Data Services map showing the location of seismic stations from all available networks (permanent or temporary) within a radius of 0.18° (about 20 km at mid-latitudes) from the given location of Ahyi. Users can customize a variety of filters and options in the left panel. Note that if there are no stations are known the map will default to show the entire world with a "No data matched request" error notice. |
| UNAVCO GPS/GNSS stations | Geodetic Data Services map from UNAVCO showing the location of GPS/GNSS stations from all available networks (permanent or temporary) within a radius of 20 km from the given location of Ahyi. Users can customize the data search based on station or network names, location, and time window. Requires Adobe Flash Player. |
| DECADE Data | The DECADE portal, still in the developmental stage, serves as an example of the proposed interoperability between The Smithsonian Institution's Global Volcanism Program, the Mapping Gas Emissions (MaGa) Database, and the EarthChem Geochemical Portal. The Deep Earth Carbon Degassing (DECADE) initiative seeks to use new and established technologies to determine accurate global fluxes of volcanic CO2 to the atmosphere, but installing CO2 monitoring networks on 20 of the world's 150 most actively degassing volcanoes. The group uses related laboratory-based studies (direct gas sampling and analysis, melt inclusions) to provide new data for direct degassing of deep earth carbon to the atmosphere. |
| Large Eruptions of Ahyi | Information about large Quaternary eruptions (VEI >= 4) is cataloged in the Large Magnitude Explosive Volcanic Eruptions (LaMEVE) database of the Volcano Global Risk Identification and Analysis Project (VOGRIPA). |
| EarthChem | EarthChem develops and maintains databases, software, and services that support the preservation, discovery, access and analysis of geochemical data, and facilitate their integration with the broad array of other available earth science parameters. EarthChem is operated by a joint team of disciplinary scientists, data scientists, data managers and information technology developers who are part of the NSF-funded data facility Integrated Earth Data Applications (IEDA). IEDA is a collaborative effort of EarthChem and the Marine Geoscience Data System (MGDS). |

