

On 20 March, AVO lowered the Volcano Alert Level for Okmok to Normal and the Aviation Color Code to Green. Seismic activity had been at low to near background levels and satellite views showed no activity during the previous two weeks. The last confirmed ash emission at Okmok occurred on 19 August 2008.
Source: US Geological Survey Alaska Volcano Observatory (AVO)
Mid-July to mid-August 2008: abundant tremor and ash plumes to ~11 km altitude
This report discusses the important explosive eruption of Okmok (figure 3) that began on 12 July 2008 (BGVN 33:06) and summarizes the period from mid-July to mid-August 2008. Vigorous eruptions continued with many plumes over 4 km altitude and some as tall as ~ 11 km. The information in this report is mostly compiled from daily and weekly AVO postings. Remote sensing data showed vigorous eruption plumes that spread over North America; these plumes were unusually complex and well-documented in photographs by pilots, including some over Montana (USA), thousands of kilometers from the volcano. Other powerful eruptions in the region included those at Cleveland and an SO2-rich eruption from Kasatoshi. Near Okmok, cloud cover often restricted views.
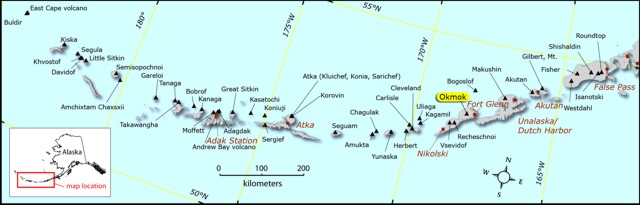 |
Figure 3. Map showing Okmok and vicinity. Courtesy of Janet Schaefer, Alaska Volcano Observatory / Alaska Division of Geological & Geophysical Surveys (AVO/ADGGS). |
On 19 July seismicity increased markedly and reached a level commonly associated with vigorous ash emissions. The seismic data was consistent with explosive ash plumes and an image (AAVHRR thermal IR (Channel 4)) indicated cloud temperatures of -50°C, suggesting an altitude of at least 9.1 km.
Satellite imagery from 20 July revealed an ash plume ~ 20 km from Okmok drifting SE at 3.7 km altitude. Nearly continuous volcanic tremor changed to tremor of a more episodic character, and the overall seismic intensity declined. Additional ash plumes observed on satellite imagery and spotted by pilots rose to altitudes of 4.6-6.1 km. On this day a photograph taken from an Alaska Airlines jet captured an impressive plume from Okmok from 11.3 km (37,000 ft) altitude (figure 4).
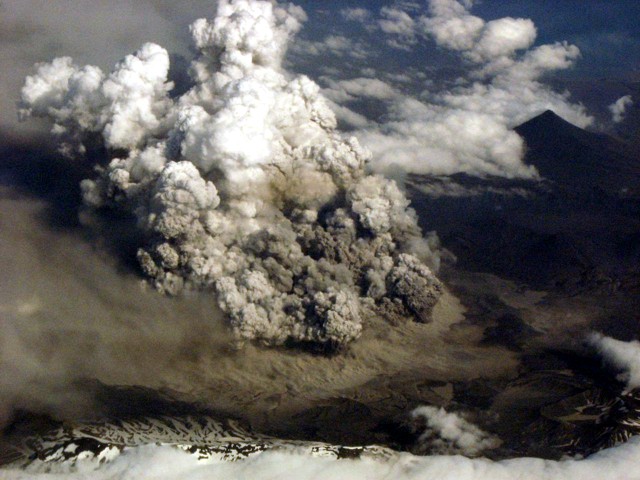 |
Figure 4. A 20 July aerial photo of the Okmok eruption made looking S from a spot ~ 24 km away (taken at approximately 1950 ADT). Estimated tops of ash and vapor were at 6.2 km (20,000 ft.) altitude. Photo taken by Phil Walgren. |
Aerial photographs and video footage was collected by AVO staff and others on 20 and 21 July. It confirmed the presence of multiple vigorous vents on the caldera floor.
The flights on 21 July revealed Okmok ash on the snow at Makushin volcano. During 21-22 July, ash plumes continued to be present and rose to altitudes of 6.1-9.1 km and drifted SE. Okmok's seismicity remained episodic, but well above background. On 23 July, tremor that was episodic in duration shifted to nearly continuous and grew to mid-level amplitudes. Although cloud cover obscured views of Okmok that day, previously emitted ash plumes were visible to the ESE. On 24 July, a thermal anomaly was possibly present on satellite imagery. Lahar damage to bridges and roads in Fort Glenn was evident. Around this time, the sailing vessel "Minnow" endured ashfall during a 30-minute interval. The thickness of ash deposited was not disclosed, but ash removal required five hours of cleaning.
Seismic amplitude increased on 25 July. Based on pilot reports and observations of satellite imagery, AVO reported that ash plumes rose to altitudes of 10.7-12.2 km.
On 26 July, seismicity decreased and satellite imagery indicated that ash plumes rose to altitudes of 6.1-6.7 km. Seismicity increased again on 27 July. Satellite imagery possibly indicated another thermal anomaly; a possible plume at an altitude of less than 3 km was also noted.
Two photos (figures 5 and 6) illustrate the new delta resulting from fresh ash deposits eroded and carried to the mouth of Crater Creek. The first photo was taken 27 July, the second, 2 August.
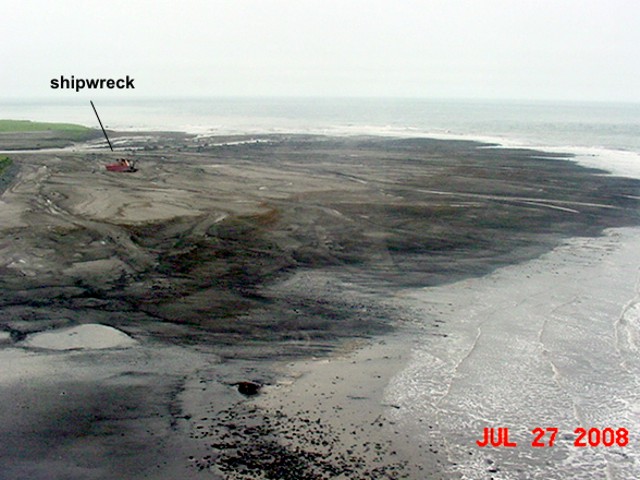 |
Figure 5. A 27 July 2008 photo illustrating the broad delta formed by lahars along Okmok's Crater Creek. The "Equinox," the shipwreck on the left side of the photo, used to be awash before the July 2008 eruption. Photo courtesy of Lonnie Kennedy. |
 |
Figure 6. Another view of the new Okmok lahar delta formed at Cape Tanak, where Crater Creek enters the sea. The shipwreck lies in the center of this photo. Photo taken 2 August 2008 by Jessica Larsen, Alaska Volcano Observatory / University of Alaska Fairbanks, Geophysical Institute (AVO/UAF-GI). |
On 28 July, tremor decreased. Ash plumes at altitudes of 8.2-10.7 km drifted E and SE. Tremor shifted from nearly continuous to episodic. Later that day and on 29 July, discrete plumes containing some ash rose to altitudes of 6.1-10.7 km and drifted E to SE.
According to pilot reports and analysis of satellite imagery for 30 July, ash plumes then rose to altitudes of 4.6-6.1 km and drifted W. Seismicity alternated between periods of continuous and pulsating tremor. On 31 July, ash plume at altitudes of 9.1-9.8 km were seen on satellite images. On 31 July, reports from a fishing boat 11.3 km N indicated visibility had ceased due to ashfall. The National Weather Service issued an ashfall advisory for Umnak Island and Unalaska/Dutch Harbor that remained in effect until 2400 on 1 August.
Strong volcanic tremor on 2 August prompted AVO to raise the Volcano Alert Level and the Aviation Color Code to the highest level. Cloudy conditions prevented satellite observations. Later that day, AVO geologists in the area reported that ash-and-steam plumes rose to minimum altitude of 6.1 km. The seismicity then decreased. Next, observers in Fort Glenn on Umnak Island reported smelling sulfur and seeing a larger ash plume than earlier that day. The plume drifted ESE.
AVO scientists observed the eruption during a visit on 2 and 3 August. They saw significant ashfall accumulated in the caldera and on the upper flanks. Lahars and lahar deltas had formed in drainages from the SE to the NE flank (figure 7). Continuous ash jets escaped from three or more vents in the NE sector of the caldera.
 |
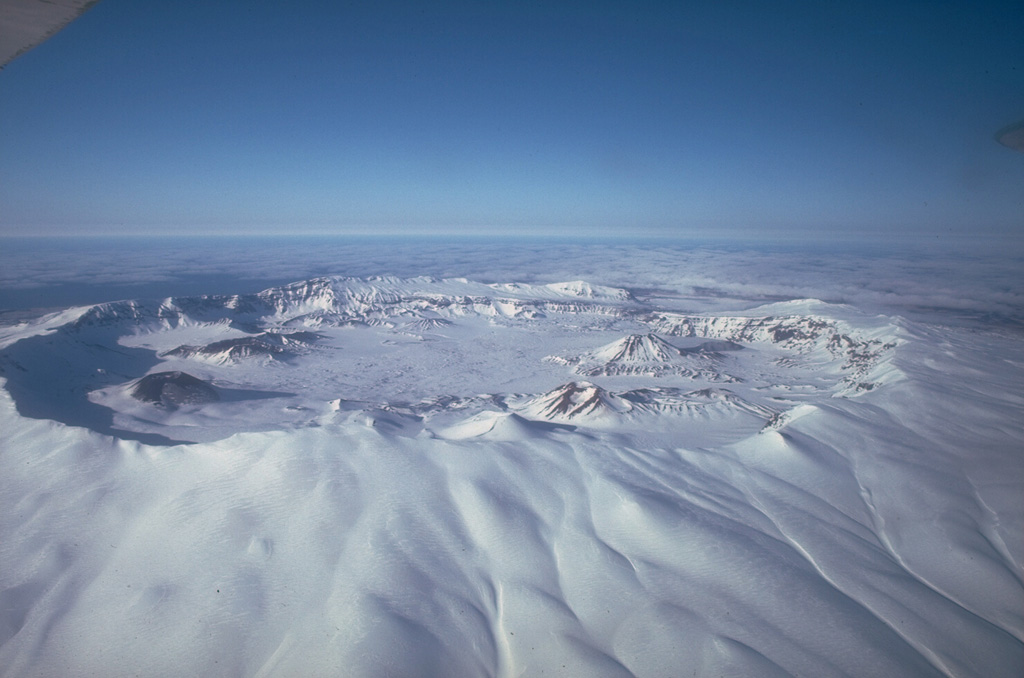
Figure 7. Before-and-after photographs of the falls on Crater Creek, the outflow stream draining Okmok caldera on its NE side. The right photo was taken on 2 August, three weeks after the onset of the 2008 eruption. The left photo is approximately the same view taken in September 2004. Okmok is treeless, but at lower elevations is covered with a verdant blanket of wildflowers and grasses. The index image (lower-left corner) is from a digital elevation map (DEM). Both photographs and the DEM are by Janet Schaefer, AVO/ADGGS. |
Figure 8 shows a view of a 3 August eruption, as seen from a commercial airliner. The plume was also seen midday on 3 August (figure 9). On that day, both helicopter and ground-based observers indicated an ash plume at lower altitude along with a steam plume at higher altitude. Satellite imagery revealed ash plumes at altitudes of 9.1-10.7 km drifting SSW.
 |
Figure 8. View of Okmok eruption, taken from a NE-bound Alaska Airlines flight at ~ 10.7 km (35,000 ft) altitude on 3 August 2008 (between the hours of 2000 and 2008). Plume tops estimated to ~ 2.1 km (~ 7,000 ft) altitude using nearby Mount Vsevidof (summit elevation, 2,149 m 7,051 ft) for reference. Courtesy of Burke Mees. |
 |
Figure 9. View of Okmok's ash plume emitting from multiple vents near intracaldera Cone D. Photo taken on 3 August 2008 by Jessica Larsen, Alaska Volcano Observatory / University of Alaska Fairbanks, Geophysical Institute (AVO/UAF-GI). |
On 4 August, ashfall reported in the settlement of Nikolski (80 km SW) had accumulated to a depth of 3 mm. During 4-5 August, satellite imagery and pilot observations indicated that ash plumes rose to altitudes of 3-7.6 km and drifted SW and W.
Elevated seismicity occurred during 6-8 August, and declined on 9 August. According to satellite imagery for 9-10 August, there were steam plumes possibly containing ash rising up to 4.6 km altitude. On 11 August, steam plumes rose to less than 6.1 km altitude and drifted SE. Ash plumes that rose to around a hundred meters above the crater were reported by an observer in Nikolski. These plumes were not detected on satellite imagery due to cloud cover. On 12 August, a pilot reported an ash plume at an altitude of 4.6 km.
AVO reported that a new vent was active on 13 August. Emissions that day, possibly from multiple vents, were rich in both ash and steam. Low-level steam-and-ash plumes were visible on satellite imagery drifting SE at altitudes of 3-4.6 km. During 14-17 August satellite observations were hindered due to cloud cover; seismic levels fluctuated, possibly indicating that steam-and-ash emissions continued. During 18-19 August, ash plumes were seen on satellite imagery at altitudes of 3-4.6 km.
No thermal anomalies related to Okmok were measured by MODIS satellites during January-August 2008.
Information Contacts: Alaska Volcano Observatory (AVO), a cooperative program of the U.S. Geological Survey, 4200 University Drive, Anchorage, AK 99508-4667, USA (URL: http://www.avo.alaska.edu/), the Geophysical Institute, University of Alaska, PO Box 757320, Fairbanks, AK 99775-7320, USA, and the Alaska Division of Geological and Geophysical Surveys, 794 University Ave., Suite 200, Fairbanks, AK 99709, USA.
2009: February
| March
2008: July
| August
2001: May
On 20 March, AVO lowered the Volcano Alert Level for Okmok to Normal and the Aviation Color Code to Green. Seismic activity had been at low to near background levels and satellite views showed no activity during the previous two weeks. The last confirmed ash emission at Okmok occurred on 19 August 2008.
Source: US Geological Survey Alaska Volcano Observatory (AVO)
On 2 March, AVO raised the Volcano Alert Level for Okmok to Advisory and the Aviation Color Code to Yellow because of increased seismicity. Short bursts of volcanic tremor at an average rate of one per hour had been detected during the previous 24 hours, an increase above the typical background level. The events were the first sign of significant seismic activity at the volcano since the cessation of the last eruption in August 2008.
Source: US Geological Survey Alaska Volcano Observatory (AVO)
On 27 August, AVO lowered the Volcano Alert Level for Okmok to Advisory and the Aviation Color Code to Yellow because seismicity had declined steadily during 20-27 August and ash plumes had not been observed since 19 August. On 28 August, a thermal anomaly and a steam plume were detected on satellite imagery. Cloud cover prevented observations on the other days.
Source: US Geological Survey Alaska Volcano Observatory (AVO)
AVO reported that seismic activity at Okmok decreased on 19 August to near pre-eruption levels and remained low during 20-24 August. Occasional bursts of volcanic tremor were detected. Although satellite views were hindered due to cloud cover, a possible thermal anomaly in the crater was present on 21, 24, and 25 August. The Volcano Alert Level remained at Watch and the Aviation Color Code at Orange.
Source: US Geological Survey Alaska Volcano Observatory (AVO)
AVO reported that on 13 August low-level steam-and-ash plumes from Okmok were visible on satellite imagery drifting SE at altitudes of 3-4.6 km (10,000-15,000 ft) a.s.l. During 14-17 August satellite observations were hindered due to cloud cover; seismic levels fluctuated possibly indicating that steam-and-ash emissions continued. During 18-19 August, ash plumes were seen on satellite imagery at altitudes of 3-4.6 km (5,000-15,000 ft) a.s.l. The Volcano Alert Level remained at Watch and the Aviation Color Code at Orange.
Source: US Geological Survey Alaska Volcano Observatory (AVO)
AVO scientists observed the eruption of Okmok during a visit to Umnak Island on 2 and 3 August. They saw significant ashfall that had accumulated in the caldera and on the upper flanks, lahars and lahar deltas that formed in drainages from the SE to the NE flank, and continuous ash jets being emitted from three or more vents in the vicinity of Cone D in the NE sector of the caldera. Elevated seismicity was detected during 6-8 August, and declined on 9 August. According to observations of satellite imagery, steam plumes possibly containing ash rose to altitudes below 4.6 km (15,000 ft) a.s.l. during 9-10 August. On 11 August, steam plumes rose to altitudes of less than 6.1 km (20,000 ft) a.s.l. and drifted SE. Ash plumes that rose to around a hundred meters above the crater were reported by an observer in Nikolski (80 km SW). These plumes were not detected on satellite imagery due to cloud cover. On 12 August, a pilot reported an ash plume at an altitude of 4.6 km (15,000 ft) a.s.l. The Volcano Alert Level remained at Watch and the Aviation Color Code remained at Orange.
Source: US Geological Survey Alaska Volcano Observatory (AVO)
Based on observations of satellite imagery and pilot reports, AVO reported that ash plumes from Okmok rose to altitudes of 4.6-10.7 km (15,000-35,000 ft) a.s.l. and drifted SW, W, N, NNE, and SE. On 30 July, seismicity alternated between continuous and pulsating volcanic tremor. The Volcano Alert Level was lowered to Watch and the Aviation Color Code was lowered to Orange. On 31 July, reports from a fishing boat 11.3 km N indicated no visibility due to ashfall.
Strong volcanic tremor on 2 August prompted AVO to raise the Volcano Alert Level to Warning and the Aviation Color Code to Red. Cloudy conditions prevented satellite observations. Later that day, AVO geologists in the area reported that ash-and-steam plumes rose to minimum altitude of 6.1 km (20,000 ft) a.s.l. The seismicity decreased and the Volcano Alert Level was lowered to Watch and the Aviation Color Code was lowered to Orange. Observers in Ft. Glenn on Umnak Island reported smelling sulfur and seeing a larger ash plume than earlier that day. The plume drifted ESE. On 3 August, helicopter and ground-based observers indicated a lower-altitude ash plume along with a higher steam plume. Satellite imagery revealed that ash plumes at altitudes of 9.1-10.7 km (30,000-35,000 ft) a.s.l. drifted SSW. On 4 August, ashfall reported in Nikolski had accumulated to a depth of 3 mm. During 4-5 August satellite imagery and pilot observations indicated that ash plumes rose to altitudes of 3-7.6 km (10,000-25,000 ft) a.s.l. and drifted SW and W.
Source: US Geological Survey Alaska Volcano Observatory (AVO)
AVO reported that on 23 July, seismicity from Okmok changed from episodic volcanic tremor to nearly continuous mid-level volcanic tremor. Although cloud cover obscured views of Okmok, previously emitted ash plumes were observed to the ESE. On 24 July, a thermal anomaly was possibly present on satellite imagery. On 25 July, seismic amplitude increased. Based on pilot reports and observations of satellite imagery, AVO reported that ash plumes rose to altitudes of 10.7-12.2 km (35,000-40,000 ft) a.s.l. The Volcano Alert Level was raised to Warning and the Aviation Color Code was raised to Red.
On 26 July, seismic activity decreased and satellite imagery indicated that ash plumes rose to altitudes of 6.1-6.7 km (20,000-22,000 ft) a.s.l. The Volcano Alert Level was lowered to Watch and the Aviation Color Code was lowered to Orange. Seismicity increased again on 27 July. Satellite imagery possibly indicated another thermal anomaly; a possible plume at an altitude of less than 3 km (10,000 ft) a.s.l. was also noted. On 28 July, seismic tremor decreased. An ash plume at a possible altitude of 8.2 km (27,000 ft) a.s.l. drifted 90 km SE. Seismicity changed from nearly continuous volcanic tremor to episodic. Later that day and on 29 July, ash plumes possibly rose to an altitude of 10.7 km (35,000 ft) a.s.l. and drifted E to SE. The Volcano Alert Level was raised to Warning and the Aviation Color Code was raised to Red.
Source: US Geological Survey Alaska Volcano Observatory (AVO)
AVO reported that during 15-16 July seismicity from Okmok changed from nearly continuous to episodic volcanic tremor, and the overall seismic intensity declined. Satellite imagery indicated elevated surface temperatures in the NE sector of the caldera; meteorological clouds obscured views. On 16 July, the Volcano Alert Level was lowered to Watch and the Aviation Color Code was lowered to Orange. On 17 July, a pilot reported that an ash plume rose to altitudes of 4.6-6.1 km (15,000-20,000) a.s.l. and drifted E and NE. On 18 July, AVO indicated that the eruption was episodic, with occasional ash-producing explosions occurring every 15 to 30 minutes. The plumes from these explosions were limited to about 6.1 km (20,000 ft) a.s.l.
On 19 July seismicity increased markedly, interpreted as possibly indicating that ash plumes rose to altitudes of 7.6-9.1 km (25,000-30,000 ft) a.s.l. The Volcano Alert Level was raised to Warning and the Aviation Color Code was raised to Red. The next day, seismicity declined again and the Volcano Alert Level was lowered to Watch and the Aviation Color Code was lowered to Orange. Satellite imagery revealed that an ash plume about 20 km from Okmok drifted SE at an altitude of 3.7 km (12,000 ft) a.s.l. Additional ash plumes observed on satellite imagery and spotted by pilots rose to altitudes of 4.6-6.1 km (15,000-20,000 ft) a.s.l. During 21-22 July, ash plumes rose to altitudes of 6.1-9.1 km (20,000-30,000 ft) a.s.l. and drifted SE.
Source: US Geological Survey Alaska Volcano Observatory (AVO)
A strong explosive eruption at Okmok began abruptly at 1143 on 12 July after about an hour of rapidly escalating earthquake activity. Ash and gas from the initial explosions reached at least 15 km (50,000 ft) a.s.l on 12 July and drifted as a large cloud S and E above the North Pacific. Satellite tracking of the ash cloud by traditional techniques has been hampered by the high water content due to interaction of rising magma with very shallow groundwater and surficial water inside the caldera. Heavy ashfall occurred on the eastern portion of Umnak Island; a dusting of ash also occurred for several hours in Unalaska/Dutch Harbor.
As of 15 July, based on AVO analysis of satellite data, ash is continuing to erupt from a composite cinder and spatter cone called Cone D in the eastern portion of the 6-mile wide caldera. Seismicity reached a peak at about 1400 on 12 July and has been gradually declining since. The volcano is currently at aviation color code RED and alert level WARNING. All areas immediately around the volcano are considered hazardous.
News media reported that residents of Umnak Island heard thundering noises the morning of 12 July and quickly realized an eruption had begun. After calling the US Coast Guard for assistance, they began to evacuate to Unalaska using a small helicopter. A fishing boat evacuated the remaining residents after heavy ashfall made further flights impossible.
Sources: US Geological Survey Alaska Volcano Observatory (AVO); Associated Press
AVO reported that the earthquake swarm centered near Okmok that was first detected on 11 May greatly diminished by 15 May.
Source: US Geological Survey Alaska Volcano Observatory (AVO)
During ~0800 to at least 1700 on 11 May AVO detected a small earthquake swarm that was centered near Okmok. Earthquakes in the swarm had magnitudes of approximately 2-3.6, but their locations could not be pinpointed because Okmok is not monitored by a local seismic network. AVO noted that the earthquakes may have been of volcanic origin, but earthquake swarms with similar sizes and character are not uncommon at Aleutian arc volcanoes and do not necessarily lead to eruptive activity.
Source: US Geological Survey Alaska Volcano Observatory (AVO)
Reports are organized chronologically and indexed below by Month/Year (Publication Volume:Number), and include a one-line summary. Click on the index link or scroll down to read the reports.
Possible eruption plume on satellite imagery
Images from the NOAA 7 polar orbiting satellite at 1816 on 8 July showed an elongate plume extending approximately 100 km S from Okmok. Analysis of infrared data yielded a plume temperature of -25°C, corresponding to an altitude of 6.3 km. The plume was not visible on imagery returned 12 hours earlier and later. There were no other reports of activity at Okmok during this period. Umnak Island is not densely populated, but aircraft frequently fly near the volcano.
Information Contacts: M. Matson, NOAA/NESDIS; T. Miller and M. E. Yount, USGS, Anchorage.
Tephra eruption and debris flow
A steam and ash plume was rising to ~200 m above a cinder cone in the SW part of the caldera when Aleutian Air pilot T. Madsen flew past the volcano on 18 November at 1320. Winds blew ash to the SE. Because of his low flight altitude, Madsen was unable to determine the extent of recent ash deposits. The active cone, probably Cone A of Byers (1959) is one of eight that ring the inside of the 9-km Okmok caldera.
No additional reports of activity were received until 5 January [but see 12:1], when a small ash eruption was observed by Peninsula Airways pilot H. Wilson, ~13 hours after a large earthquake with an epicenter 130 km to the SW. The shallow, Ms 6.6 event occurred at 0312, centered at 52.47°N, 169.28°W. Objects were knocked off shelves in Nikolski, 65 km to the SW, but there was no structural damage. When Wilson flew over Okmok at 1630, a 300-m-high steam and ash plume was being emitted, again from Cone A in the SW part of the caldera. A small debris flow had descended to the cone's SE foot. Fresh black ash extended NE from the cone across the caldera floor and over the caldera rim, 9 km away, where Wilson estimated that the ash deposit was ~5 km wide. The deposit thinned noticeably with distance from the cone, and was difficult to recognize beyond the caldera rim because the volcano's flanks were snow-free. Although there were snow squalls in the area, the ash lacked any obvious snow cover.
Reference. Byers, F. M., Jr., 1959, Geology of Umnak and Bogoslof Islands, Aleutian Islands, Alaska: USGS Bulletin 1028-L, p. 267-369.
Information Contacts: J. Reeder, Alaska Division of Geological and Geophysical Surveys (ADGGS).
Ash emission declines
At 1600 on 18 December, pilot T. Madsen observed steam and ash emission from the cinder cone in the SW part of the caldera. During the next 2 hours about six large pulses of ash rose 900 m above the cone. Madsen observed a trace of fresh ash when he landed on the SE flank. At 1800, ash was drifting NE for ~55 km, and the S and SW part of the caldera floor were completely covered with black ash.
When H. Wilson flew by the caldera on the afternoon of 19 January, no ash was penetrating the 1,200-m cloud cover, although he noted increased stream flow from the NNE part of the crater. On 2 February a 60-m steam plume containing small amounts of grey ash rose from the cone but on 11 February pilot Dwight Blackburn reported only minor white steam emission.
Information Contacts: J. Reeder, Alaska Division of Geological and Geophysical Surveys (ADGGS).
Vigorous ash eruption seen 31 January
At 1600 on 31 January, Chuck Harvey and Marlaine Lovess observed several ash explosions from 42 km E of the active cone. Consecutive black ash plumes rose vertically to several kilometers above the summit and formed mushroom-like clouds.
Information Contacts: J. Reeder, Alaska Division of Geological and Geophysical Surveys (ADGGS).
Minor ash emission
Peninsula Airways pilot H. Wilson noted a bluish-gray haze just ESE of Okmok Caldera on 10 June at 1600, although clouds obscured the volcano. On 18 June at about 1500, Jay Brian Carribaburu (Peninsula Airways) observed minor ash emission from a cinder cone in the SW part of the caldera. Steam and ash were being continuously emitted from the cinder cone when T. Madsen (Aleutian Airways) flew by on 19 June at 1140. Steam and ash rose to 2,100 m (~1 km above the summit) and drifted ~11 km SW. Several large blasts of ash occurred during Madsen's observations. On 23 June, Wilson saw steam with minor ash rising to 500 m above the active cone.
Information Contacts: J. Reeder, Alaska Division of Geological and Geophysical Surveys (ADGGS).
Minor ash emission
At 1700 on 22 July, H. Wilson observed continuous but minor ash emissions from a cone in the SW part of the caldera. The ash and steam plume rose ~150 m above the cone with a burst of dark gray and light yellow ash. As the plume drifted ESE, most of the ash dropped from the plume and the steam dissipated within 5 km of the cone, although a gray haze could be recognized to 25 km ESE. When Wilson returned at 2030 that day he saw only minor steam emission rising no more than 60 m above the cone. The floor of the cone was visible and no incandescent material was observed.
Information Contacts: J. Reeder, Alaska Division of Geological and Geophysical Surveys (ADGGS).
Minor ash emission; possible cone growth
Minor eruptive activity from a cone in the SW part of the caldera was observed at 1410 on 16 November by airplane pilots Dave Holman and Jay Brown (Coast Guard). Steam with some ash rose to ~2,100 m altitude and a thin plume drifted 20 km ENE at 1,500-2,100 m altitude. [On 1 December] at 1300 and 1510, pilot T. Madsen (Aleutian Air) observed a light gray plume drifting 25 km ESE at 1,200 m altitude. He also noted that the cone appeared to be higher than the caldera rim (900-950 m elevation), indicating that it had grown since he last saw it over a month ago.
Information Contacts: J. Reeder, Alaska Division of Geological and Geophysical Surveys (ADGGS).
Ash emission continues
Minor eruptive activity continued . . . through December. Above-average, fairly continuous steaming was noted (by Milton Holmes and others) from 41 km E between 12 and 17 December. On 30 December at 1320 pilot T. Madsen observed constant brown-black ash emission drifting 80 km horizontally at 900 m altitude. Snow on the flanks was mostly covered with ash. He noted similar activity on 5 January, when an opaque plume was drifting NW at 1.2 km altitude for 30 km. A trapper, who has been on Umnak Island at the SE base of Okmok for the past several months, has reported several strong earthquakes followed by ash eruptions, but gave no dates.
Information Contacts: J. Reeder, Alaska Division of Geological and Geophysical Surveys (ADGGS).
Ash from new vent
On 26 February, ash emerged from a new vent at the SW base of the cone, while the cone's previously active vent was limited to steaming (table 1).
Table 1. Reports of activity at Okmok, January-February 1987, compiled by John Reeder from James Dickson and Tom Madsen, Aleutian Air Ltd.
| Date | Time | Observer | Activity |
| 08 Jan 1987 | 0900 | Dickson | 600-m billowing white steam plume seen from boat just N of Unmak Island. |
| 14 Feb 1987 | 1600 | Madsen | Continuous steam and ash emission; cloud to 1,400 m altitude (about 500 m above the caldera rim), drifting 70 km NW in a 55 km/hour wind. |
| 26 Feb 1987 | 1730 | Madsen | Onset of black plume emission, from a new vent at the SW base of the cone; plume dirfted about 35 km SSW at 1,350 m altitude; only white steam emerged from the cone's previously active vent. |
Information Contacts: J. Reeder, Alaska Division of Geological and Geophysical Surveys (ADGGS).
Eruption begins on 13 February from crater along S caldera rim
On the morning of 13 February, a small eruption began from a cone at 760 m elevation along the S rim of the Okmok caldera. Around 1000 a dark ash plume rose to ~1,525 m and was carried SW by prevailing winds. On 18 February, Coast Guard pilots reported an ash plume that rose to an altitude of 3,050-4,600 m. Observers at the former Fort Glenn military base reported seeing a bright red glare reflected from the 1,830-m-high weather clouds between 0100 and sunrise. At 1335 pilots reported a second plume that rose to 4,875 m. Satellite imagery continued to reveal a hot spot in the vicinity of the cone through the week of 21 February.
Information Contacts: Alaska Volcano Observatory (AVO); NOAA/NESDIS Satellite Analysis Branch (SAB).
Cone on S side of caldera floor continues to emit lava, steam, and ash
The eruption that began 13 February continued between 28 February and 21 March. The cone on the south side of the caldera floor continued to emit lava and intermittent steam and ash plumes. Fort Glenn residents who climbed to the rim of the caldera saw a lava flow that was <500 m in length. On 19 February, ash fell on the flanks of the volcano associated with one of the larger steam-and-ash plumes. The largest plume during this period occurred on 11 March; a pilot noted a short-lived steam and ash plume that reached ~10.5 km and drifted NW.
Satellite imagery during this period revealed significant hot spots in the caldera and showed occasional plumes drifting as far as 85 km downwind.
Information Contacts: Tom Miller, Alaska Volcano Observatory (AVO); NOAA/NESDIS Satellite Analysis Branch (SAB).
Emission of steam, ash, and lava continues
Reports on 27 March, and 4, 11, 18, and 25 April, confirmed that the eruption which began on 13 February was continuing at relatively low levels. Satellite images examined by AVO indicated the presence of hot lava flows in the caldera, and occasional thin, low-level plumes drifting downwind from the volcano. NOAA/NESDIS also reported that on 4 April an aircraft pilot saw lava flows and [observed] an ash column at ~3,500 m, drifting slowly SE. On 12 April another ash plume was reported by a pilot at 2.4 km; this same plume was detected in visible and infrared satellite imagery.
Okmok volcano is not monitored seismically and is not assigned a color code. Based on past eruptive history, lava flows and low--level ash emission could continue for weeks to months. Eruptive activity could intensify at any time.
Information Contacts: Alaska Volcano Observatory (AVO); NOAA/NESDIS Satellite Analysis Branch (SAB).
Activity waning by month's end
The activity that began on 13 February continued through the first half of May, but appeared to be waning by month's end. Prior to 9 May, hot lava flows were observed within the caldera. Also, satellite imagery revealed thin low-level ash plumes. Activity was continuing at a relatively low level on 16 May. By 23 May, satellite images contained no signs of activity or hotspots. Okmok is not monitored seismically.
Information Contacts: Alaska Volcano Observatory (AVO).
Small earthquake swarm during 11-15 May 2001
Since the February 1997 eruption (BGVN 22:04) until at least September 2001, Okmok has remained relatively quiet, with one period of increased seismic activity. On 11 May 2001, from about 0800 to at least 1700, the Alaska Volcano Observatory (AVO) detected a small earthquake swarm centered near the volcano. Earthquakes in the swarm had magnitudes ranging from ~2 to 3.6. The locations of the earthquakes could not be pinpointed because Okmok is not monitored by a local seismic network. AVO noted that the earthquakes may have been of volcanic origin, but swarms with similar characteristics are not uncommon at Aleutian arc volcanoes and do not necessarily lead to eruptive activity. The earthquake swarm ended by 15 May, and AVO has not reported any further activity at Okmok since then.
Information Contacts: Alaska Volcano Observatory (AVO), a cooperative program of a) U.S. Geological Survey, 4200 University Drive, Anchorage, AK 99508-4667, USA (URL: http://www.avo.alaska.edu/), b) Geophysical Institute, University of Alaska, PO Box 757320, Fairbanks, AK 99775-7320, USA, and c) Alaska Division of Geological & Geophysical Surveys, 794 University Ave., Suite 200, Fairbanks, AK 99709, USA.
Large explosive eruption started on 12 July, ash plumes initially rose to 15.2 km altitude
The Alaska Volcano Observatory (AVO) reported that on 12 July 2008 at 1143 a strong explosive eruption at Okmok began abruptly after about an hour of rapidly escalating earthquake activity. The Volcano Alert Level was raised to Warning and the Aviation Color Code was raised to Red from the previous Alert Level of Normal/Green. The last explosive eruption began on 13 February, 1997 (BGVN 22:01) from a cone on the south side of the caldera floor. Lava flowed across the caldera floor until 9 May. Ash plumes generally rose to altitudes of 1.5-4.9 km from 13 February to about 23 May, when thermal anomalies and plumes were no longer seen on satellite imagery. One ash plume rose to an altitude of 10.5 km on 11 March. In May 2001 a small seismic swarm (BGVN 26:08) was detected in the vicinity of the volcano. The earthquake locations could not be pinpointed because Okmok is not monitored by a local seismic network.
The initial phase of the 2008 eruption was very explosive, with high levels of seismicity that peaked at 2200 then began to decline. A wet gas-and-ash-rich plume was estimated to have risen to altitudes of 10.7-15.2 km or greater. Wet, sand-sized ash fell within minutes of the onset of the eruption in Fort Glenn, about 10 km WSW. Heavy ashfall occurred on the eastern portion of Umnak Island; a dusting of ash that started at 0345 also occurred for several hours about 105 km NE in Unalaska/Dutch Harbor. News media reported that residents of Umnak Island heard thundering noises the morning of 12 July and quickly realized an eruption had begun. After calling the US Coast Guard for assistance, they began to evacuate to Unalaska using a small helicopter. A fishing boat evacuated the remaining residents after heavy ashfall made further flights impossible.
On 13 July, reports from Unalaska indicated no ashfall had occurred in Unalaska/Dutch Harbor since the previous night. The National Weather Service reported that the ash plume rose to an altitude of 13.7 km (figure 1). Plumes drifted SE and E. Based on observations of satellite imagery, the ash plume altitude was 9.1 km and drifted SE. However, satellite tracking of the ash cloud by traditional techniques was hampered by the high water content due to interaction of rising magma with very shallow groundwater and surficial water inside the caldera.
 |
Figure 1. Photograph of Okmok by flight attendant Kelly Reeves during Alaska airlines flight on 13 July 2008. Image courtesy of Alaska Airlines. |
Ash erupted from a vent or vents near composite cinder cone called Cone D in the eastern portion of the 9.7-km wide caldera. Activity during the past three significant eruptions (1945, 1958, and 1997) occurred from Cone A, a cinder cone on the far western portion of the caldera floor. Each of the three previous eruptions was generally mildly to moderately explosive with most ash clouds produced rising to less than 9.1 km altitude. Each eruption also produced a lava flow that traveled about 5 km across the caldera floor.
AVO reported that during 15-16 July seismicity changed from nearly continuous to episodic volcanic tremor, and the overall seismic intensity declined. Little to no ash was detected by satellite, but meteorological clouds obscured views. Satellite imagery from 0533 on 16 July indicated elevated surface temperatures in the NE sector of the caldera. On 16 July, a light dusting of ash was reported in Unalaska/Dutch Harbor. A plume at an altitude of 9.1 km was visible on satellite imagery at 0800. On 17 July, a pilot reported that an ash plume rose to altitudes of 4.6-6.1 km and drifted E and NE. The sulfur dioxide plume had drifted at least as far as eastern Montana (figure 2). On 18 July, the eruption was episodic, with occasional ash-producing explosions occurring every 15 to 30 minutes. The plumes from these explosions were limited to about 6.1 km.
 |
Figure 2. OMI composite image from NOAA showing the extent of the sulfur dioxide gas cloud from the eruption of Okmok imaged at about 1200 AKDT on 17 July, 2008. The large mass shows the location of the high altitude sulfur dioxide cloud from the main explosive phase on 12 July 2008. Image created by Rick Wessels (AVO); courtesy of the OMI near-real-time decision support project funded by NASA. |
Information Contacts: Alaska Volcano Observatory (AVO), a cooperative program of the U.S. Geological Survey, 4200 University Drive, Anchorage, AK 99508-4667, USA; Geophysical Institute, University of Alaska, PO Box 757320, Fairbanks, AK 99775-7320, USA; and Alaska Division of Geological & Geophysical Surveys, 794 University Ave., Suite 200, Fairbanks, AK 99709, USA (URL: http://www.avo.alaska.edu/); Associated Press (URL: http://www.ap.org/).
Mid-July to mid-August 2008: abundant tremor and ash plumes to ~11 km altitude
This report discusses the important explosive eruption of Okmok (figure 3) that began on 12 July 2008 (BGVN 33:06) and summarizes the period from mid-July to mid-August 2008. Vigorous eruptions continued with many plumes over 4 km altitude and some as tall as ~ 11 km. The information in this report is mostly compiled from daily and weekly AVO postings. Remote sensing data showed vigorous eruption plumes that spread over North America; these plumes were unusually complex and well-documented in photographs by pilots, including some over Montana (USA), thousands of kilometers from the volcano. Other powerful eruptions in the region included those at Cleveland and an SO2-rich eruption from Kasatoshi. Near Okmok, cloud cover often restricted views.
|
Figure 3. Map showing Okmok and vicinity. Courtesy of Janet Schaefer, Alaska Volcano Observatory / Alaska Division of Geological & Geophysical Surveys (AVO/ADGGS). |
On 19 July seismicity increased markedly and reached a level commonly associated with vigorous ash emissions. The seismic data was consistent with explosive ash plumes and an image (AAVHRR thermal IR (Channel 4)) indicated cloud temperatures of -50°C, suggesting an altitude of at least 9.1 km.
Satellite imagery from 20 July revealed an ash plume ~ 20 km from Okmok drifting SE at 3.7 km altitude. Nearly continuous volcanic tremor changed to tremor of a more episodic character, and the overall seismic intensity declined. Additional ash plumes observed on satellite imagery and spotted by pilots rose to altitudes of 4.6-6.1 km. On this day a photograph taken from an Alaska Airlines jet captured an impressive plume from Okmok from 11.3 km (37,000 ft) altitude (figure 4).
|
Figure 4. A 20 July aerial photo of the Okmok eruption made looking S from a spot ~ 24 km away (taken at approximately 1950 ADT). Estimated tops of ash and vapor were at 6.2 km (20,000 ft.) altitude. Photo taken by Phil Walgren. |
Aerial photographs and video footage was collected by AVO staff and others on 20 and 21 July. It confirmed the presence of multiple vigorous vents on the caldera floor.
The flights on 21 July revealed Okmok ash on the snow at Makushin volcano. During 21-22 July, ash plumes continued to be present and rose to altitudes of 6.1-9.1 km and drifted SE. Okmok's seismicity remained episodic, but well above background. On 23 July, tremor that was episodic in duration shifted to nearly continuous and grew to mid-level amplitudes. Although cloud cover obscured views of Okmok that day, previously emitted ash plumes were visible to the ESE. On 24 July, a thermal anomaly was possibly present on satellite imagery. Lahar damage to bridges and roads in Fort Glenn was evident. Around this time, the sailing vessel "Minnow" endured ashfall during a 30-minute interval. The thickness of ash deposited was not disclosed, but ash removal required five hours of cleaning.
Seismic amplitude increased on 25 July. Based on pilot reports and observations of satellite imagery, AVO reported that ash plumes rose to altitudes of 10.7-12.2 km.
On 26 July, seismicity decreased and satellite imagery indicated that ash plumes rose to altitudes of 6.1-6.7 km. Seismicity increased again on 27 July. Satellite imagery possibly indicated another thermal anomaly; a possible plume at an altitude of less than 3 km was also noted.
Two photos (figures 5 and 6) illustrate the new delta resulting from fresh ash deposits eroded and carried to the mouth of Crater Creek. The first photo was taken 27 July, the second, 2 August.
|
Figure 5. A 27 July 2008 photo illustrating the broad delta formed by lahars along Okmok's Crater Creek. The "Equinox," the shipwreck on the left side of the photo, used to be awash before the July 2008 eruption. Photo courtesy of Lonnie Kennedy. |
|
Figure 6. Another view of the new Okmok lahar delta formed at Cape Tanak, where Crater Creek enters the sea. The shipwreck lies in the center of this photo. Photo taken 2 August 2008 by Jessica Larsen, Alaska Volcano Observatory / University of Alaska Fairbanks, Geophysical Institute (AVO/UAF-GI). |
On 28 July, tremor decreased. Ash plumes at altitudes of 8.2-10.7 km drifted E and SE. Tremor shifted from nearly continuous to episodic. Later that day and on 29 July, discrete plumes containing some ash rose to altitudes of 6.1-10.7 km and drifted E to SE.
According to pilot reports and analysis of satellite imagery for 30 July, ash plumes then rose to altitudes of 4.6-6.1 km and drifted W. Seismicity alternated between periods of continuous and pulsating tremor. On 31 July, ash plume at altitudes of 9.1-9.8 km were seen on satellite images. On 31 July, reports from a fishing boat 11.3 km N indicated visibility had ceased due to ashfall. The National Weather Service issued an ashfall advisory for Umnak Island and Unalaska/Dutch Harbor that remained in effect until 2400 on 1 August.
Strong volcanic tremor on 2 August prompted AVO to raise the Volcano Alert Level and the Aviation Color Code to the highest level. Cloudy conditions prevented satellite observations. Later that day, AVO geologists in the area reported that ash-and-steam plumes rose to minimum altitude of 6.1 km. The seismicity then decreased. Next, observers in Fort Glenn on Umnak Island reported smelling sulfur and seeing a larger ash plume than earlier that day. The plume drifted ESE.
AVO scientists observed the eruption during a visit on 2 and 3 August. They saw significant ashfall accumulated in the caldera and on the upper flanks. Lahars and lahar deltas had formed in drainages from the SE to the NE flank (figure 7). Continuous ash jets escaped from three or more vents in the NE sector of the caldera.
|
Figure 7. Before-and-after photographs of the falls on Crater Creek, the outflow stream draining Okmok caldera on its NE side. The right photo was taken on 2 August, three weeks after the onset of the 2008 eruption. The left photo is approximately the same view taken in September 2004. Okmok is treeless, but at lower elevations is covered with a verdant blanket of wildflowers and grasses. The index image (lower-left corner) is from a digital elevation map (DEM). Both photographs and the DEM are by Janet Schaefer, AVO/ADGGS. |
Figure 8 shows a view of a 3 August eruption, as seen from a commercial airliner. The plume was also seen midday on 3 August (figure 9). On that day, both helicopter and ground-based observers indicated an ash plume at lower altitude along with a steam plume at higher altitude. Satellite imagery revealed ash plumes at altitudes of 9.1-10.7 km drifting SSW.
|
Figure 8. View of Okmok eruption, taken from a NE-bound Alaska Airlines flight at ~ 10.7 km (35,000 ft) altitude on 3 August 2008 (between the hours of 2000 and 2008). Plume tops estimated to ~ 2.1 km (~ 7,000 ft) altitude using nearby Mount Vsevidof (summit elevation, 2,149 m 7,051 ft) for reference. Courtesy of Burke Mees. |
|
Figure 9. View of Okmok's ash plume emitting from multiple vents near intracaldera Cone D. Photo taken on 3 August 2008 by Jessica Larsen, Alaska Volcano Observatory / University of Alaska Fairbanks, Geophysical Institute (AVO/UAF-GI). |
On 4 August, ashfall reported in the settlement of Nikolski (80 km SW) had accumulated to a depth of 3 mm. During 4-5 August, satellite imagery and pilot observations indicated that ash plumes rose to altitudes of 3-7.6 km and drifted SW and W.
Elevated seismicity occurred during 6-8 August, and declined on 9 August. According to satellite imagery for 9-10 August, there were steam plumes possibly containing ash rising up to 4.6 km altitude. On 11 August, steam plumes rose to less than 6.1 km altitude and drifted SE. Ash plumes that rose to around a hundred meters above the crater were reported by an observer in Nikolski. These plumes were not detected on satellite imagery due to cloud cover. On 12 August, a pilot reported an ash plume at an altitude of 4.6 km.
AVO reported that a new vent was active on 13 August. Emissions that day, possibly from multiple vents, were rich in both ash and steam. Low-level steam-and-ash plumes were visible on satellite imagery drifting SE at altitudes of 3-4.6 km. During 14-17 August satellite observations were hindered due to cloud cover; seismic levels fluctuated, possibly indicating that steam-and-ash emissions continued. During 18-19 August, ash plumes were seen on satellite imagery at altitudes of 3-4.6 km.
No thermal anomalies related to Okmok were measured by MODIS satellites during January-August 2008.
Information Contacts: Alaska Volcano Observatory (AVO), a cooperative program of the U.S. Geological Survey, 4200 University Drive, Anchorage, AK 99508-4667, USA (URL: http://www.avo.alaska.edu/), the Geophysical Institute, University of Alaska, PO Box 757320, Fairbanks, AK 99775-7320, USA, and the Alaska Division of Geological and Geophysical Surveys, 794 University Ave., Suite 200, Fairbanks, AK 99709, USA.
This compilation of synonyms and subsidiary features may not be comprehensive. Features are organized into four major categories: Cones, Craters, Domes, and Thermal Features. Synonyms of features appear indented below the primary name. In some cases additional feature type, elevation, or location details are provided.
Synonyms |
||||
| Zoomie | ||||
Cones |
||||
| Feature Name | Feature Type | Elevation | Latitude | Longitude |
| Idak, Mount | Cone | 585 m | ||
| Jag Peak | Cone | |||
| Tulik | Stratovolcano | 1253 m | 53° 23' 0" N | 168° 2' 0" W |
Thermal |
||||
| Feature Name | Feature Type | Elevation | Latitude | Longitude |
| Hot Springs Cone | Hot Spring | |||
|
|
||||||||||||||||||||||||||||
There is data available for 18 confirmed Holocene eruptive periods.
2008 Jul 12 - 2008 Aug 19 Confirmed Eruption VEI: 4 (?)
| Episode 1 | Eruption | NE caldera floor | |||||||||||||||||||||||||||||||||||||||||||||||||||||||||||
|---|---|---|---|---|---|---|---|---|---|---|---|---|---|---|---|---|---|---|---|---|---|---|---|---|---|---|---|---|---|---|---|---|---|---|---|---|---|---|---|---|---|---|---|---|---|---|---|---|---|---|---|---|---|---|---|---|---|---|---|---|
| 2008 Jul 12 - 2008 Aug 19 | Evidence from Observations: Reported | |||||||||||||||||||||||||||||||||||||||||||||||||||||||||||
|
List of 10 Events for Episode 1 at NE caldera floor
| ||||||||||||||||||||||||||||||||||||||||||||||||||||||||||||
1997 Feb 11 - 1997 May 19 ± 4 days Confirmed Eruption VEI: 3
| Episode 1 | Eruption | SW part of caldera (Cone A) | |||||||||||||||||||||||||||||||||||||||
|---|---|---|---|---|---|---|---|---|---|---|---|---|---|---|---|---|---|---|---|---|---|---|---|---|---|---|---|---|---|---|---|---|---|---|---|---|---|---|---|---|
| 1997 Feb 11 - 1997 May 19 ± 4 days | Evidence from Observations: Reported | |||||||||||||||||||||||||||||||||||||||
|
List of 6 Events for Episode 1 at SW part of caldera (Cone A)
| ||||||||||||||||||||||||||||||||||||||||
1986 Nov 18 - 1988 Feb 26 Confirmed Eruption VEI: 2
| Episode 1 | Eruption | SW part of caldera (Cone A) | |||||||||||||||||||||||||||||||||||||||
|---|---|---|---|---|---|---|---|---|---|---|---|---|---|---|---|---|---|---|---|---|---|---|---|---|---|---|---|---|---|---|---|---|---|---|---|---|---|---|---|---|
| 1986 Nov 18 - 1988 Feb 26 | Evidence from Observations: Reported | |||||||||||||||||||||||||||||||||||||||
|
List of 6 Events for Episode 1 at SW part of caldera (Cone A)
| ||||||||||||||||||||||||||||||||||||||||
1983 Jul 8 - 1983 Jul 8 Confirmed Eruption VEI: 2
| Episode 1 | Eruption | SW part of caldera (Cone A) | |||||||||||||||||||||||||||||
|---|---|---|---|---|---|---|---|---|---|---|---|---|---|---|---|---|---|---|---|---|---|---|---|---|---|---|---|---|---|---|
| 1983 Jul 8 - 1983 Jul 8 | Evidence from Observations: Reported | |||||||||||||||||||||||||||||
|
List of 4 Events for Episode 1 at SW part of caldera (Cone A)
| ||||||||||||||||||||||||||||||
1981 Mar 24 - 1981 Mar 24 Confirmed Eruption VEI: 3 (?)
| Episode 1 | Eruption | SW part of caldera (Cone A) | |||||||||||||||||||||||||||||
|---|---|---|---|---|---|---|---|---|---|---|---|---|---|---|---|---|---|---|---|---|---|---|---|---|---|---|---|---|---|---|
| 1981 Mar 24 - 1981 Mar 24 | Evidence from Observations: Reported | |||||||||||||||||||||||||||||
|
List of 4 Events for Episode 1 at SW part of caldera (Cone A)
| ||||||||||||||||||||||||||||||
1960 Oct 15 ± 45 days - 1961 Apr 15 ± 45 days Confirmed Eruption VEI: 3
| Episode 1 | Eruption | SW part of caldera (Cone A) | ||||||||||||||||||||||||||||||||||
|---|---|---|---|---|---|---|---|---|---|---|---|---|---|---|---|---|---|---|---|---|---|---|---|---|---|---|---|---|---|---|---|---|---|---|---|
| 1960 Oct 15 ± 45 days - 1961 Apr 15 ± 45 days | Evidence from Observations: Reported | ||||||||||||||||||||||||||||||||||
|
List of 5 Events for Episode 1 at SW part of caldera (Cone A)
| |||||||||||||||||||||||||||||||||||
1958 Aug 14 - 1958 Aug 25 ± 10 days Confirmed Eruption VEI: 3
| Episode 1 | Eruption | SW part of caldera (Cone A) | |||||||||||||||||||||||||||||||||||||||
|---|---|---|---|---|---|---|---|---|---|---|---|---|---|---|---|---|---|---|---|---|---|---|---|---|---|---|---|---|---|---|---|---|---|---|---|---|---|---|---|---|
| 1958 Aug 14 - 1958 Aug 25 ± 10 days | Evidence from Observations: Reported | |||||||||||||||||||||||||||||||||||||||
|
List of 6 Events for Episode 1 at SW part of caldera (Cone A)
| ||||||||||||||||||||||||||||||||||||||||
1945 Jun 4 - 1945 Dec Confirmed Eruption VEI: 2
| Episode 1 | Eruption | SW part of caldera (Cone A) | |||||||||||||||||||||||||||||||||||||||
|---|---|---|---|---|---|---|---|---|---|---|---|---|---|---|---|---|---|---|---|---|---|---|---|---|---|---|---|---|---|---|---|---|---|---|---|---|---|---|---|---|
| 1945 Jun 4 - 1945 Dec | Evidence from Observations: Reported | |||||||||||||||||||||||||||||||||||||||
|
List of 6 Events for Episode 1 at SW part of caldera (Cone A)
| ||||||||||||||||||||||||||||||||||||||||
1943 Jun Confirmed Eruption VEI: 1
| Episode 1 | Eruption | SW part of caldera (Cone A) | ||||||||||||||||||||||||
|---|---|---|---|---|---|---|---|---|---|---|---|---|---|---|---|---|---|---|---|---|---|---|---|---|---|
| 1943 Jun - Unknown | Evidence from Observations: Reported | ||||||||||||||||||||||||
|
List of 3 Events for Episode 1 at SW part of caldera (Cone A)
| |||||||||||||||||||||||||
1938 Confirmed Eruption
| Episode 1 | Eruption | SW part of caldera (Cone A) | ||||||||||||||
|---|---|---|---|---|---|---|---|---|---|---|---|---|---|---|---|
| 1938 - Unknown | Evidence from Observations: Reported | ||||||||||||||
|
List of 1 Events for Episode 1 at SW part of caldera (Cone A)
| |||||||||||||||
[ 1936 ] Uncertain Eruption
| Episode 1 | Eruption | SW part of caldera (Cone A) | |||
|---|---|---|---|---|
| 1936 - Unknown | Evidence from Unknown | |||
1931 Mar 21 - 1931 May 13 (in or after) Confirmed Eruption VEI: 2
| Episode 1 | Eruption | Cone A? | ||||||||||||||||||||||||
|---|---|---|---|---|---|---|---|---|---|---|---|---|---|---|---|---|---|---|---|---|---|---|---|---|---|
| 1931 Mar 21 - 1931 May 13 (in or after) | Evidence from Observations: Reported | ||||||||||||||||||||||||
|
List of 3 Events for Episode 1 at Cone A?
| |||||||||||||||||||||||||
1899 Confirmed Eruption VEI: 3
| Episode 1 | Eruption | SW part of caldera (Cone A) | ||||||||||||||||||||||||
|---|---|---|---|---|---|---|---|---|---|---|---|---|---|---|---|---|---|---|---|---|---|---|---|---|---|
| 1899 - Unknown | Evidence from Observations: Reported | ||||||||||||||||||||||||
|
List of 3 Events for Episode 1 at SW part of caldera (Cone A)
| |||||||||||||||||||||||||
1878 Confirmed Eruption VEI: 2 (?)
| Episode 1 | Eruption | Cone A? | |||||||||||||||||||||||||||||
|---|---|---|---|---|---|---|---|---|---|---|---|---|---|---|---|---|---|---|---|---|---|---|---|---|---|---|---|---|---|---|
| 1878 - Unknown | Evidence from Observations: Reported | |||||||||||||||||||||||||||||
|
List of 4 Events for Episode 1 at Cone A?
| ||||||||||||||||||||||||||||||
1824 - 1830 Confirmed Eruption
| Episode 1 | Eruption | Cone B? | ||||||||||||||||||||||||
|---|---|---|---|---|---|---|---|---|---|---|---|---|---|---|---|---|---|---|---|---|---|---|---|---|---|
| 1824 - 1830 | Evidence from Observations: Reported | ||||||||||||||||||||||||
|
List of 3 Events for Episode 1 at Cone B?
| |||||||||||||||||||||||||
1817 Mar 1 - 1820 Confirmed Eruption VEI: 3
| Episode 1 | Eruption | Cone E? or B? | |||||||||||||||||||||||||||||||||||||||
|---|---|---|---|---|---|---|---|---|---|---|---|---|---|---|---|---|---|---|---|---|---|---|---|---|---|---|---|---|---|---|---|---|---|---|---|---|---|---|---|---|
| 1817 Mar 1 - 1820 | Evidence from Observations: Reported | |||||||||||||||||||||||||||||||||||||||
|
List of 6 Events for Episode 1 at Cone E? or B?
| ||||||||||||||||||||||||||||||||||||||||
1805 Confirmed Eruption
| Episode 1 | Eruption | |||||||||||||||
|---|---|---|---|---|---|---|---|---|---|---|---|---|---|---|---|
| 1805 - Unknown | Evidence from Observations: Reported | ||||||||||||||
|
List of 1 Events for Episode 1
| |||||||||||||||
0100 BCE ± 50 years Confirmed Eruption VEI: 6
| Episode 1 | Eruption | Okmok II caldera | |||||||||||||||||||||||||||||||||||||||||||||||||
|---|---|---|---|---|---|---|---|---|---|---|---|---|---|---|---|---|---|---|---|---|---|---|---|---|---|---|---|---|---|---|---|---|---|---|---|---|---|---|---|---|---|---|---|---|---|---|---|---|---|---|
| 0100 BCE ± 50 years - Unknown | Evidence from Isotopic: 14C (uncalibrated) | |||||||||||||||||||||||||||||||||||||||||||||||||
|
List of 8 Events for Episode 1 at Okmok II caldera
| ||||||||||||||||||||||||||||||||||||||||||||||||||
6310 BCE ± 500 years Confirmed Eruption VEI: 4
| Episode 1 | Eruption | ||||||||||||||||||||||||||||||
|---|---|---|---|---|---|---|---|---|---|---|---|---|---|---|---|---|---|---|---|---|---|---|---|---|---|---|---|---|---|---|
| 6310 BCE ± 500 years - Unknown | Evidence from Isotopic: 14C (uncalibrated) | |||||||||||||||||||||||||||||
|
List of 4 Events for Episode 1
| ||||||||||||||||||||||||||||||
There is data available for 9 deformation periods. Expand each entry for additional details.
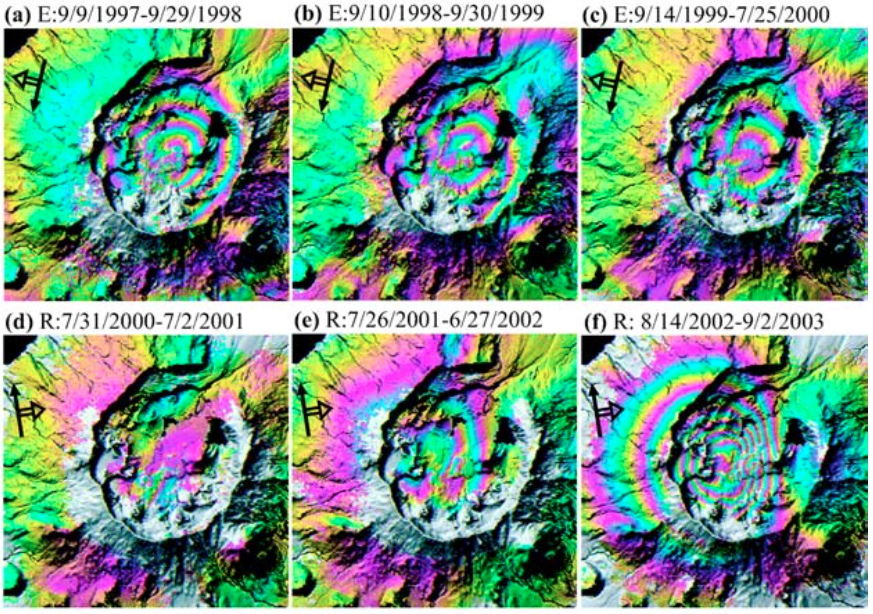
| Start Date: 2007 Oct | Stop Date: 2008 Jul | Direction: Subsidence | Method: InSAR |
| Magnitude: 115.000 cm | Spatial Extent: Unknown | Latitude: Unknown | Longitude: Unknown |
Remarks: Interferograms spanning the 2008 eruption show rapid subsidence of the caldera floor. There was 75 cm subsidence from 7 October to 13 July, and 115 cm subsidence from 10 October to 16 July. Multiple aperature interferometry (MAI) shows no horizontal along-track (approximately north-south) displacement during the first 13 hours of the eruption. | |||
 |
Multi-temporal deformation interferograms that span the 2008 eruption of Mount Okmok. InSAR image dates are: a October 7, 2007?July 13, 2008 (Envisat track 179) b October 10, 2007?July 16, 2008 (Envisat track 222) c June 19, 2008?July 24, 2008 (ERS-2 track 344) d June 27, 2008?August 1, 2008 (Envisat track 451) e July 10, 2008?August 3, 2008 (Radarsat-1 ascending track) f September 5, 2007?August 20, 2008 (Envisat track 222) g September 21, 2007? September 5, 2008 (Envisat track 451), and h August 22, 2007? October 7, 2008 (PALSAR track 300). To better illustrate the large amount of co-eruptive deformation and to facilitate inter-comparison of the images, one fringe (color cycle) represents 10 cm of line-of- sight (LOS) ground displacement in all cases. Deformation inside the caldera (a?c) is enlarged in the insets to improve visibility. Areas that lack interferometric coherence are uncolored. Satellite ID: E ERS-2, R Radarsat-1, V Envisat, and P PALSAR. Image acquisition dates, satellite flight direction, and radar look directions are labeled From: Lu and Dzurisin 2014. |
||
Reference List: Lu and Dzurisin 2014; Lu et al. 2010b.
Full References:
Lu Z, Dzurisin D, 2014. InSAR imaging of Aleutian volcanoes: monitoring a volcanic arc from space. Springer-Verlag Berlin Heidelberg. https://doi.org/10.1007/978-3-642-00348-6
Lu, Z., and D. Dzurisin, 2010. Ground surface deformation patterns, magma supply, and magma storage at Okmok volcano, Alaska, from InSAR analysis: 2. Coeruptive deflation, July-August 2008. J. Geophys. Res., 115, B00B03. https://doi.org/10.1029/2009JB006970
| Start Date: 2007 Jun | Stop Date: 2008 Jul 10 | Direction: Uplift | Method: InSAR |
| Magnitude: 15.000 cm | Spatial Extent: Unknown | Latitude: Unknown | Longitude: Unknown |
Remarks: About 15 cm uplift occurred from summer 2007 to 10 July 2008, shortly before the 12 July 2008 eruption. | |||
 |
Multi-temporal 1-year InSAR images showing deformation of Mount Okmok for various time periods during 1992?2008, before the 2008 eruption (years at top left in each panel). InSAR deformation phase values are draped over the shaded relief map from the TOPSAR DEM. Each fringe (full color cycle) represents 2.83 cm of range change between the ground and the satellite, unless noted otherwise. Areas that lack interferometric coherence are uncolored From: Lu and Dzurisin 2014. |
||
Reference List: Lu and Dzurisin 2014; Lu et al 2010a; Biggs et al. 2010b.
Full References:
Biggs C J, Mothes P, Ruiz M, Amelung F, Dixon T H, Baker S, Hong S-H, 2010. Stratovolcano growth by co-eruptive intrusion: The 2008 eruption of Tungurahua Ecuador. Geophysical Research Letters, 37, (L21302). https://doi.org/10.1029/2010GL044942
Lu Z, Dzurisin D, 2014. InSAR imaging of Aleutian volcanoes: monitoring a volcanic arc from space. Springer-Verlag Berlin Heidelberg. https://doi.org/10.1007/978-3-642-00348-6
Lu, Z., and D. Dzurisin, 2010. Ground surface deformation patterns, magma supply, and magma storage at Okmok volcano, Alaska, from InSAR analysis: 2. Coeruptive deflation, July-August 2008. J. Geophys. Res., 115, B00B03. https://doi.org/10.1029/2009JB006970
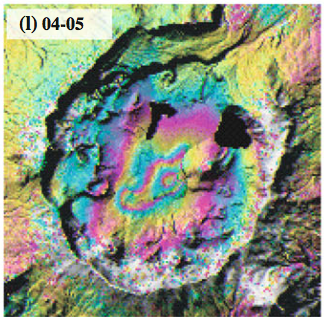
| Start Date: 2005 | Stop Date: 2006 | Direction: Uplift | Method: InSAR |
| Magnitude: 5.000 cm | Spatial Extent: Unknown | Latitude: Unknown | Longitude: Unknown |
Remarks: The caldera floor rose 3-5 cm during 2005-2006. | |||
 |
Multi-temporal 1-year InSAR images showing deformation of Mount Okmok for various time periods during 1992?2008, before the 2008 eruption (years at top left in each panel). InSAR deformation phase values are draped over the shaded relief map from the TOPSAR DEM. Each fringe (full color cycle) represents 2.83 cm of range change between the ground and the satellite, unless noted otherwise. Areas that lack interferometric coherence are uncolored From: Lu and Dzurisin 2014. |
||
Reference List: Lu and Dzurisin 2014; Lu et al 2010a; Biggs et al. 2010b.
Full References:
Biggs C J, Mothes P, Ruiz M, Amelung F, Dixon T H, Baker S, Hong S-H, 2010. Stratovolcano growth by co-eruptive intrusion: The 2008 eruption of Tungurahua Ecuador. Geophysical Research Letters, 37, (L21302). https://doi.org/10.1029/2010GL044942
Lu Z, Dzurisin D, 2014. InSAR imaging of Aleutian volcanoes: monitoring a volcanic arc from space. Springer-Verlag Berlin Heidelberg. https://doi.org/10.1007/978-3-642-00348-6
Lu, Z., and D. Dzurisin, 2010. Ground surface deformation patterns, magma supply, and magma storage at Okmok volcano, Alaska, from InSAR analysis: 2. Coeruptive deflation, July-August 2008. J. Geophys. Res., 115, B00B03. https://doi.org/10.1029/2009JB006970
| Start Date: 2004 | Stop Date: 2005 | Direction: Subsidence | Method: InSAR |
| Magnitude: 5.000 cm | Spatial Extent: Unknown | Latitude: Unknown | Longitude: Unknown |
Remarks: The caldera floor subsided 3-5 cm during 2004-2005. | |||
 |
Multi-temporal 1-year InSAR images showing deformation of Mount Okmok for various time periods during 1992?2008, before the 2008 eruption (years at top left in each panel). InSAR deformation phase values are draped over the shaded relief map from the TOPSAR DEM. Each fringe (full color cycle) represents 2.83 cm of range change between the ground and the satellite, unless noted otherwise. Areas that lack interferometric coherence are uncolored From: Lu and Dzurisin 2014. |
||
Reference List: Lu and Dzurisin 2014; Lu et al 2010a; Biggs et al. 2010b.
Full References:
Biggs C J, Mothes P, Ruiz M, Amelung F, Dixon T H, Baker S, Hong S-H, 2010. Stratovolcano growth by co-eruptive intrusion: The 2008 eruption of Tungurahua Ecuador. Geophysical Research Letters, 37, (L21302). https://doi.org/10.1029/2010GL044942
Lu Z, Dzurisin D, 2014. InSAR imaging of Aleutian volcanoes: monitoring a volcanic arc from space. Springer-Verlag Berlin Heidelberg. https://doi.org/10.1007/978-3-642-00348-6
Lu, Z., and D. Dzurisin, 2010. Ground surface deformation patterns, magma supply, and magma storage at Okmok volcano, Alaska, from InSAR analysis: 2. Coeruptive deflation, July-August 2008. J. Geophys. Res., 115, B00B03. https://doi.org/10.1029/2009JB006970
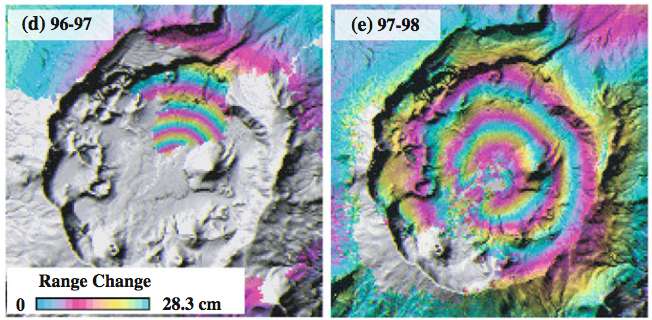
| Start Date: 1997 | Stop Date: 1997 | Direction: Subsidence | Method: InSAR |
| Magnitude: 140.000 cm | Spatial Extent: Unknown | Latitude: Unknown | Longitude: Unknown |
Remarks: The caldera floor subsided more than 1.2 meters during the 1997 eruption. | |||
 |
Multi-temporal 1-year InSAR images showing deformation of Mount Okmok for various time periods during 1992?2008, before the 2008 eruption (years at top left in each panel). InSAR deformation phase values are draped over the shaded relief map from the TOPSAR DEM. Each fringe (full color cycle) represents 2.83 cm of range change between the ground and the satellite, unless noted otherwise. Areas that lack interferometric coherence are uncolored From: Lu and Dzurisin 2014. |
||
Reference List: Lu and Dzurisin 2014; Biggs et al. 2010b; Lu et al. 2005b; Mann et al. 2002.
Full References:
Biggs C J, Mothes P, Ruiz M, Amelung F, Dixon T H, Baker S, Hong S-H, 2010. Stratovolcano growth by co-eruptive intrusion: The 2008 eruption of Tungurahua Ecuador. Geophysical Research Letters, 37, (L21302). https://doi.org/10.1029/2010GL044942
Lu Z, Dzurisin D, 2014. InSAR imaging of Aleutian volcanoes: monitoring a volcanic arc from space. Springer-Verlag Berlin Heidelberg. https://doi.org/10.1007/978-3-642-00348-6
Lu, Z., T. Masterlark, and D. Dzurisin, 2005. Interferometric synthetic aperture radar study of Okmok volcano, Alaska, 1992-2003: Magma supply dynamics and postemplacement lava flow deformation. J. Geophys. Res., 110, B02403. https://doi.org/10.1029/2004JB003148
Mann, D., J. Freymueller, and Z. Lu,, 2002. Deformation associated with the 1997 eruption of Okmok volcano, Alaska. J. Geophys. Res., 107: ETG 7-1 - ETG 7-12. https://doi.org/10.1029/2001JB000163
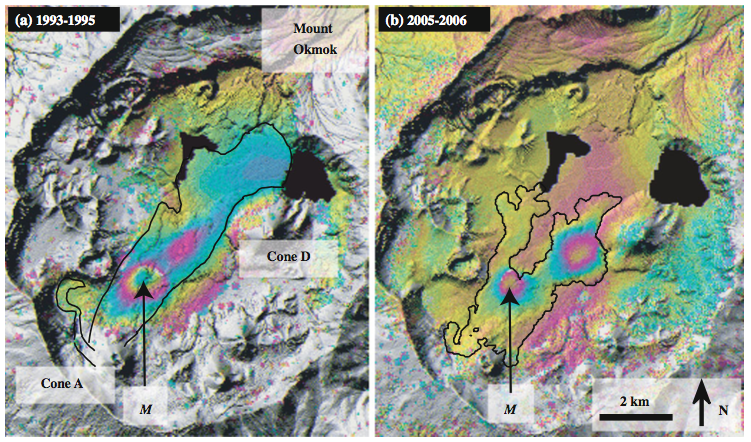
| Start Date: 1997 | Stop Date: 2004 | Direction: Uplift | Method: GPS, InSAR |
| Magnitude: Unknown | Spatial Extent: Unknown | Latitude: Unknown | Longitude: Unknown |
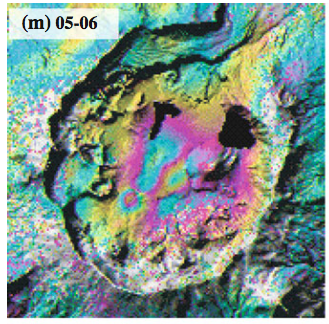
Remarks: Okmok began to re-inflate after the 1997 eruption, with the inflarion rate decreasing with time from 10 cm/year during 1997-1998, to 8 cm/yr during 1998-2000, to 4 cm/yr during 2000-2001. Inflation rates then increased to 20 cm/yr during 2002-2003 and 10 cm/yr during 2003-2004. | |||
 |
Annual interferograms showing ground surface deformation of Okmok volcano from 1997 to 2008, specifically during the following time periods (date format here is yyyymmdd): (a) 19970909? 19980929, (b) 19980910?19990930, (c) 19990914?20000725, (d) 20000731?20010702, (e) 20010726? 20020627, (f) 20020814?20030902, (g) 20030912?20040723, (h) 20040710?20050822, (i) 20050719? 20060808, (j) 20060615?20070705, and (k) 20071026?20080627. Satellite ID (E is ERS?2, R is Radarsat?1, and V is Envisat), satellite flight direction, and radar look direction are labeled. Each fringe (full color cycle) represents 28 mm of range change between the ground and the satellite. Additional information on SAR images used to produce the interferograms is given in Table 1. Areas that lack interferometric coherence are uncolored. From: Lu et al. 2010a. |
||
Reference List: Lu and Dzurisin 2014; Lu et al 2010a; Biggs et al. 2010b; Lu et al. 2005b; Mann et al. 2002; Miyagi et al. 2004.
Full References:
Biggs C J, Mothes P, Ruiz M, Amelung F, Dixon T H, Baker S, Hong S-H, 2010. Stratovolcano growth by co-eruptive intrusion: The 2008 eruption of Tungurahua Ecuador. Geophysical Research Letters, 37, (L21302). https://doi.org/10.1029/2010GL044942
Lu Z, Dzurisin D, 2014. InSAR imaging of Aleutian volcanoes: monitoring a volcanic arc from space. Springer-Verlag Berlin Heidelberg. https://doi.org/10.1007/978-3-642-00348-6
Lu, Z., and D. Dzurisin, 2010. Ground surface deformation patterns, magma supply, and magma storage at Okmok volcano, Alaska, from InSAR analysis: 2. Coeruptive deflation, July-August 2008. J. Geophys. Res., 115, B00B03. https://doi.org/10.1029/2009JB006970
Lu, Z., T. Masterlark, and D. Dzurisin, 2005. Interferometric synthetic aperture radar study of Okmok volcano, Alaska, 1992-2003: Magma supply dynamics and postemplacement lava flow deformation. J. Geophys. Res., 110, B02403. https://doi.org/10.1029/2004JB003148
Mann, D., J. Freymueller, and Z. Lu,, 2002. Deformation associated with the 1997 eruption of Okmok volcano, Alaska. J. Geophys. Res., 107: ETG 7-1 - ETG 7-12. https://doi.org/10.1029/2001JB000163
Miyagi, Y., Freymueller, J. T., Kimata, F., Sato, T., & Mann, D., 2004. Surface deformation caused by shallow magmatic activity at Okmok volcano, Alaska, detected by GPS campaigns 2000-2002. Earth, planets and space, 56(10), 29-32.
| Start Date: 1995 | Stop Date: 1996 | Direction: Subsidence | Method: InSAR |
| Magnitude: 2.000 cm | Spatial Extent: Unknown | Latitude: Unknown | Longitude: Unknown |
Remarks: The caldera floor subsided 1-2 cm before the 1997 eruption. | |||
 |
Multi-temporal 1-year InSAR images showing deformation of Mount Okmok for various time periods during 1992?2008, before the 2008 eruption (years at top left in each panel). InSAR deformation phase values are draped over the shaded relief map from the TOPSAR DEM. Each fringe (full color cycle) represents 2.83 cm of range change between the ground and the satellite, unless noted otherwise. Areas that lack interferometric coherence are uncolored From: Lu and Dzurisin 2014. |
||
Reference List: Lu and Dzurisin 2014; Biggs et al. 2010b; Lu et al. 2005b; Mann et al. 2002.
Full References:
Biggs C J, Mothes P, Ruiz M, Amelung F, Dixon T H, Baker S, Hong S-H, 2010. Stratovolcano growth by co-eruptive intrusion: The 2008 eruption of Tungurahua Ecuador. Geophysical Research Letters, 37, (L21302). https://doi.org/10.1029/2010GL044942
Lu Z, Dzurisin D, 2014. InSAR imaging of Aleutian volcanoes: monitoring a volcanic arc from space. Springer-Verlag Berlin Heidelberg. https://doi.org/10.1007/978-3-642-00348-6
Lu, Z., T. Masterlark, and D. Dzurisin, 2005. Interferometric synthetic aperture radar study of Okmok volcano, Alaska, 1992-2003: Magma supply dynamics and postemplacement lava flow deformation. J. Geophys. Res., 110, B02403. https://doi.org/10.1029/2004JB003148
Mann, D., J. Freymueller, and Z. Lu,, 2002. Deformation associated with the 1997 eruption of Okmok volcano, Alaska. J. Geophys. Res., 107: ETG 7-1 - ETG 7-12. https://doi.org/10.1029/2001JB000163
| Start Date: 1992 | Stop Date: 1995 | Direction: Uplift | Method: InSAR |
| Magnitude: 20.000 cm | Spatial Extent: Unknown | Latitude: Unknown | Longitude: Unknown |
Remarks: The center of the 10-km wide caldera rose more than 14 cm during 1992-1993 and about 6 cm during 1993-1995. | |||
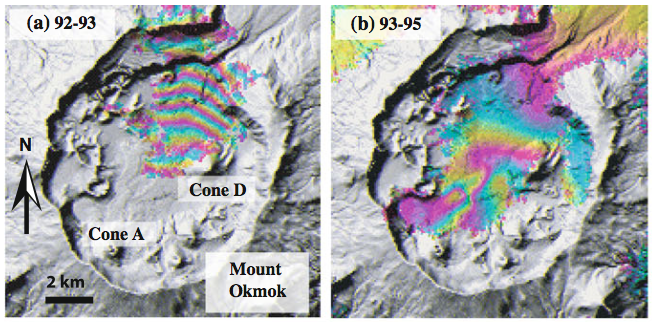 |
Multi-temporal 1-year InSAR images showing deformation of Mount Okmok for various time periods during 1992?2008, before the 2008 eruption (years at top left in each panel). InSAR deformation phase values are draped over the shaded relief map from the TOPSAR DEM. Each fringe (full color cycle) represents 2.83 cm of range change between the ground and the satellite, unless noted otherwise. Areas that lack interferometric coherence are uncolored From: Lu and Dzurisin 2014. |
||
Reference List: Lu and Dzurisin 2014; Biggs et al. 2010b; Lu et al. 2005b; Mann et al. 2002.
Full References:
Biggs C J, Mothes P, Ruiz M, Amelung F, Dixon T H, Baker S, Hong S-H, 2010. Stratovolcano growth by co-eruptive intrusion: The 2008 eruption of Tungurahua Ecuador. Geophysical Research Letters, 37, (L21302). https://doi.org/10.1029/2010GL044942
Lu Z, Dzurisin D, 2014. InSAR imaging of Aleutian volcanoes: monitoring a volcanic arc from space. Springer-Verlag Berlin Heidelberg. https://doi.org/10.1007/978-3-642-00348-6
Lu, Z., T. Masterlark, and D. Dzurisin, 2005. Interferometric synthetic aperture radar study of Okmok volcano, Alaska, 1992-2003: Magma supply dynamics and postemplacement lava flow deformation. J. Geophys. Res., 110, B02403. https://doi.org/10.1029/2004JB003148
Mann, D., J. Freymueller, and Z. Lu,, 2002. Deformation associated with the 1997 eruption of Okmok volcano, Alaska. J. Geophys. Res., 107: ETG 7-1 - ETG 7-12. https://doi.org/10.1029/2001JB000163
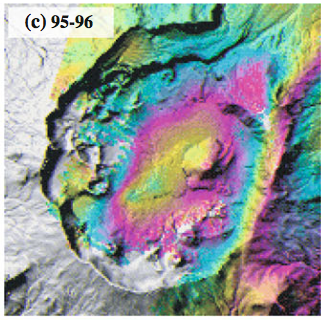
| Start Date: 1992 | Stop Date: 2008 | Direction: Subsidence | Method: InSAR |
| Magnitude: Unknown | Spatial Extent: Unknown | Latitude: Unknown | Longitude: Unknown |
Remarks: The 1958 and 1997 lava flows are subsiding. | |||
 |
Comparison of post-emplacement subsidence of: (a) 1958 lava flows during 1993?1995, and (b) 1997 lava flows (as well as 1958 flows) during 2005?2006. M marks the location of maximum subsidence of the 1958 lava flows From: Lu and Dzurisin 2014. |
||
Reference List: Lu and Dzurisin 2014; Lu et al. 2005b.
Full References:
Lu Z, Dzurisin D, 2014. InSAR imaging of Aleutian volcanoes: monitoring a volcanic arc from space. Springer-Verlag Berlin Heidelberg. https://doi.org/10.1007/978-3-642-00348-6
Lu, Z., T. Masterlark, and D. Dzurisin, 2005. Interferometric synthetic aperture radar study of Okmok volcano, Alaska, 1992-2003: Magma supply dynamics and postemplacement lava flow deformation. J. Geophys. Res., 110, B02403. https://doi.org/10.1029/2004JB003148
There is data available for 1 emission periods. Expand each entry for additional details.
| Start Date: 2008 Jul 12 | Stop Date: 2008 Jul 12 | Method: Satellite (Aura OMI) |
| SO2 Altitude Min: 15 km | SO2 Altitude Max: 15 km | Total SO2 Mass: 150 kt |
Data Details
| Date Start | Date End | Assumed SO2 Altitude | SO2 Algorithm | SO2 Mass |
| 20080712 | 15.0 | 150.000 |
 This 2 March 1987 view from the west shows the ash deposition on the flanks of a cone in the SW corner of Okmok caldera. Intermittent explosive eruptions took place from November 1986 to February 1988 from Cone A. Cone C and Cone F are visible in the background.
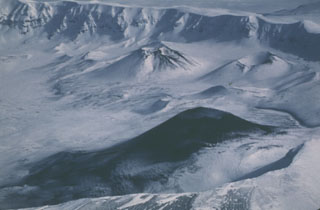
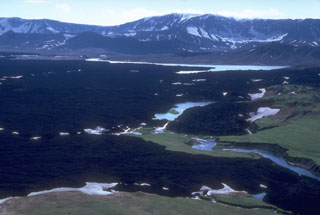 Lava flows cover large parts of the Okmok caldera floor on NE Umnak Island, some of which erupted during historical time. The small lakes within the caldera are remnants of a larger lake that filled the caldera to depths of more than 200 m before overtopping the rim and eroding a 180-m-deep notch through the northern caldera wall.
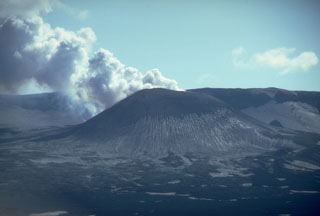 A steam-and-gas plume rises in December 1980 from a scoria cone in Alaska's Okmok caldera. Known only as Cone A, it is one of numerous unnamed cones within the 10-km-wide caldera. Erosional furrows produce linear stripes on the flank of the cone. Eruptions in 1945 and 1958 produced lava flows onto the caldera floor. The wall of Okmok caldera forms the skyline ridge.
 The summit of 35-km-wide Okmok has two largely overlapping 10-km-wide calderas. Both calderas formed by voluminous eruptions of tephra and pyroclastic flows during the Holocene, one about 8,250 years ago and the other about 2,400 years ago. Numerous cones and lava domes formed on the caldera floor and flanks. Historical explosive eruptions and lava flows have originated from cones within the caldera.
Maps are not currently available due to technical issues.
The maps shown below have been scanned from the GVP map archives and include the volcano on this page. Clicking on the small images will load the full 300 dpi map. Very small-scale maps (such as world maps) are not included.
The following 2 samples associated with this volcano can be found in the Smithsonian's NMNH Department of Mineral Sciences collections, and may be availble for research (contact the Rock and Ore Collections Manager). Catalog number links will open a window with more information.
| Catalog Number | Sample Description | Lava Source | Collection Date |
|---|---|---|---|
| NMNH 117457-10 | Rhyolite | -- | -- |
| NMNH 117457-13 | Obsidian | Somma I | -- |
| Alaska Volcano Observatory (Link to Okmok) | The Alaska Volcano Observatory (AVO) is a joint program of the U.S. Geological Survey (USGS), the Geophysical Institute of the University of Alaska Fairbanks (UAFGI), and the State of Alaska Division of Geological and Geophysical Surveys (ADGGS). AVO was formed in 1988, and uses federal, state, and university resources to monitor and study Alaska's hazardous volcanoes, to predict and record eruptive activity, and to mitigate volcanic hazards to life and property. |
| Copernicus Browser | The Copernicus Browser replaced the Sentinel Hub Playground browser in 2023, to provide access to Earth observation archives from the Copernicus Data Space Ecosystem, the main distribution platform for data from the EU Copernicus missions. |
| MIROVA | Middle InfraRed Observation of Volcanic Activity (MIROVA) is a near real time volcanic hot-spot detection system based on the analysis of MODIS (Moderate Resolution Imaging Spectroradiometer) data. In particular, MIROVA uses the Middle InfraRed Radiation (MIR), measured over target volcanoes, in order to detect, locate and measure the heat radiation sourced from volcanic activity. |
| MODVOLC Thermal Alerts | Using infrared satellite Moderate Resolution Imaging Spectroradiometer (MODIS) data, scientists at the Hawai'i Institute of Geophysics and Planetology, University of Hawai'i, developed an automated system called MODVOLC to map thermal hot-spots in near real time. For each MODIS image, the algorithm automatically scans each 1 km pixel within it to check for high-temperature hot-spots. When one is found the date, time, location, and intensity are recorded. MODIS looks at every square km of the Earth every 48 hours, once during the day and once during the night, and the presence of two MODIS sensors in space allows at least four hot-spot observations every two days. Each day updated global maps are compiled to display the locations of all hot spots detected in the previous 24 hours. There is a drop-down list with volcano names which allow users to 'zoom-in' and examine the distribution of hot-spots at a variety of spatial scales. |
|
WOVOdat
Single Volcano View Temporal Evolution of Unrest Side by Side Volcanoes |
WOVOdat is a database of volcanic unrest; instrumentally and visually recorded changes in seismicity, ground deformation, gas emission, and other parameters from their normal baselines. It is sponsored by the World Organization of Volcano Observatories (WOVO) and presently hosted at the Earth Observatory of Singapore.
GVMID Data on Volcano Monitoring Infrastructure The Global Volcano Monitoring Infrastructure Database GVMID, is aimed at documenting and improving capabilities of volcano monitoring from the ground and space. GVMID should provide a snapshot and baseline view of the techniques and instrumentation that are in place at various volcanoes, which can be use by volcano observatories as reference to setup new monitoring system or improving networks at a specific volcano. These data will allow identification of what monitoring gaps exist, which can be then targeted by remote sensing infrastructure and future instrument deployments. |
| Volcanic Hazard Maps | The IAVCEI Commission on Volcanic Hazards and Risk has a Volcanic Hazard Maps database designed to serve as a resource for hazard mappers (or other interested parties) to explore how common issues in hazard map development have been addressed at different volcanoes, in different countries, for different hazards, and for different intended audiences. In addition to the comprehensive, searchable Volcanic Hazard Maps Database, this website contains information about diversity of volcanic hazard maps, illustrated using examples from the database. This site is for educational purposes related to volcanic hazard maps. Hazard maps found on this website should not be used for emergency purposes. For the most recent, official hazard map for a particular volcano, please seek out the proper institutional authorities on the matter. |
| IRIS seismic stations/networks | Incorporated Research Institutions for Seismology (IRIS) Data Services map showing the location of seismic stations from all available networks (permanent or temporary) within a radius of 0.18° (about 20 km at mid-latitudes) from the given location of Okmok. Users can customize a variety of filters and options in the left panel. Note that if there are no stations are known the map will default to show the entire world with a "No data matched request" error notice. |
| UNAVCO GPS/GNSS stations | Geodetic Data Services map from UNAVCO showing the location of GPS/GNSS stations from all available networks (permanent or temporary) within a radius of 20 km from the given location of Okmok. Users can customize the data search based on station or network names, location, and time window. Requires Adobe Flash Player. |
| DECADE Data | The DECADE portal, still in the developmental stage, serves as an example of the proposed interoperability between The Smithsonian Institution's Global Volcanism Program, the Mapping Gas Emissions (MaGa) Database, and the EarthChem Geochemical Portal. The Deep Earth Carbon Degassing (DECADE) initiative seeks to use new and established technologies to determine accurate global fluxes of volcanic CO2 to the atmosphere, but installing CO2 monitoring networks on 20 of the world's 150 most actively degassing volcanoes. The group uses related laboratory-based studies (direct gas sampling and analysis, melt inclusions) to provide new data for direct degassing of deep earth carbon to the atmosphere. |
| Large Eruptions of Okmok | Information about large Quaternary eruptions (VEI >= 4) is cataloged in the Large Magnitude Explosive Volcanic Eruptions (LaMEVE) database of the Volcano Global Risk Identification and Analysis Project (VOGRIPA). |
| EarthChem | EarthChem develops and maintains databases, software, and services that support the preservation, discovery, access and analysis of geochemical data, and facilitate their integration with the broad array of other available earth science parameters. EarthChem is operated by a joint team of disciplinary scientists, data scientists, data managers and information technology developers who are part of the NSF-funded data facility Integrated Earth Data Applications (IEDA). IEDA is a collaborative effort of EarthChem and the Marine Geoscience Data System (MGDS). |