

AVO reported that the seismic network at Westdahl has been re-established, again allowing seismic unrest at the volcano to be monitored. The Volcano Alert Level and Aviation Color Code were changed from Unassigned to Normal and Green, respectively, on 15 October.
Source: US Geological Survey Alaska Volcano Observatory (AVO)
Eruption apparently ends; seismic data from eruption onset
Westdahl's eruption appears to have stopped. Poor weather limited observations and the stop date is uncertain, but a significant decrease in eruption intensity was noted on 15 January. Geologists noted that comparison with the 1978 eruption suggested that this cessation in activity may be only a pause.
No plume penetrated the cloud deck that obscured the summit-area fissure during a 23 January overflight. The lava flow appears to have widened to cover 2-3 times its 3 December area (figure 5), while its front had not advanced significantly. As of late January, infrared images from the NOAA-11 polar orbiting weather satellite indicated a "warm" spot in the vicinity of the volcano. Exact registration of the warm area has been difficult, but it is believed to be associated with the position of the cooling lava flow. The FAA removed all flight restrictions around the volcano on 7 February. During aerial observations by FWS personnel on 13 February, only scattered steaming was noted from the flow. Minor steaming occurred from a small cinder cone near a steep, ice-walled canyon, where the fissure vent cuts the E part of the summit glacier.
Information Contacts: AVO.
2020: October
AVO reported that the seismic network at Westdahl has been re-established, again allowing seismic unrest at the volcano to be monitored. The Volcano Alert Level and Aviation Color Code were changed from Unassigned to Normal and Green, respectively, on 15 October.
Source: US Geological Survey Alaska Volcano Observatory (AVO)
Reports are organized chronologically and indexed below by Month/Year (Publication Volume:Number), and include a one-line summary. Click on the index link or scroll down to read the reports.
Large new explosive eruption
The USCG reported on 6 February that ash, accompanied by a sulfur odor, was falling on a station located at the foot of Westdahl. Lightning was observed above the summit, accompanied by thunder and rumbling. The summit is not visible from the Coast Guard station and cloud cover has prevented direct aerial observation of the group of volcanoes which includes stratovolcanoes Westdahl and Pogromni, active in historical time. However, Reeve Aleutian Airways personnel report an ash cloud rising to 8-10 km altitude, including some large blocks visible above the 3-km cloud layer. Satellite images returned 5 February show a well-developed ash cloud, but it has not yet been possible to pinpoint the eruption start time [see 3:9].
Information Contacts: T. Miller, USGS, Anchorage.
Major ash eruption (about six days)
Data from satellite imagery and aircraft observations established that the eruption originated from the summit of Westdahl, one of five volcanoes on Unimak Island active in historical times. The eruption column was first visible in 5 February satellite imagery (figure 1), but Coast Guard personnel from Scotch Cap (15 km SW of Westdahl's summit) noted a sulfur odor during the evening of the 3rd and reported that ash had begun to fall by the next morning. Eruption column height was estimated at 8-10 km from aircraft observations on 6 February (figure 2) and up to 8 km from interpretation of satellite imagery (figure 3). Nearly 1 m of ash fell at Scotch Cap, forcing evacuation of its personnel and damaging Scotch Cap Light. Meltwater caused stream flooding and washed out the coast road. A Reeve Aleutian Airways pilot observed a new cinder cone, about 100 m in diameter, located near the site of Westdahl's last eruption (March-April, 1964). No lava flow has been observed. Activity declined to steaming after 9 February.
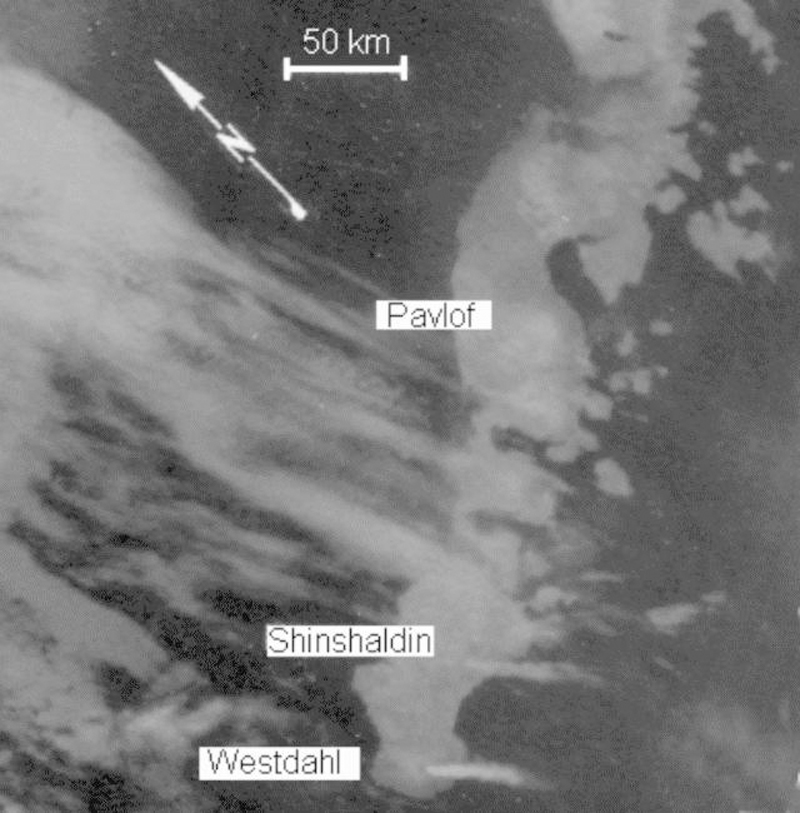 |
Figure 1. Enlargement of a portion of a NOAA 5 infrared image at 1835 on 8 February 1978 (0.9-km ground resolution), showing plumes, each about 60 km long, extending SE from both Westdahl and Shishaldin. Most of the Alaska Peninsula is visible, as is the coast of Alaska NW to the entrance to Kuskokwim Bay. The gray area off the coast is pack ice. Courtesy of Jürgen Kienle and NOAA. |
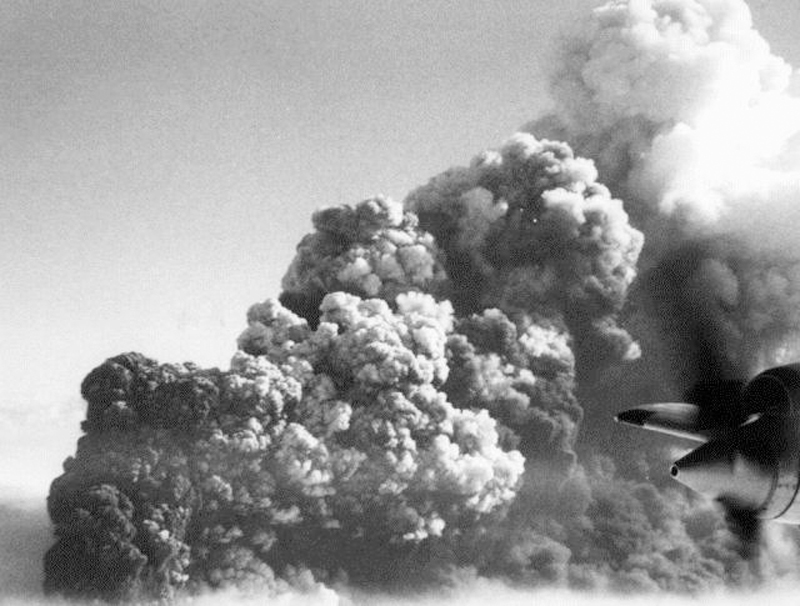 |
Figure 2. Oblique airphoto taken 6 February 1978 by George Wooliver (Reeve Aleutian Airways), showing Westdahl's eruption column emerging from the cloud layer at about 3000 m altitude. Wind is from the N at about 130 km/hr. Wooliver estimated that the top of the eruption column was at 8-10 km altitude. Courtesy of Thomas Miller. |
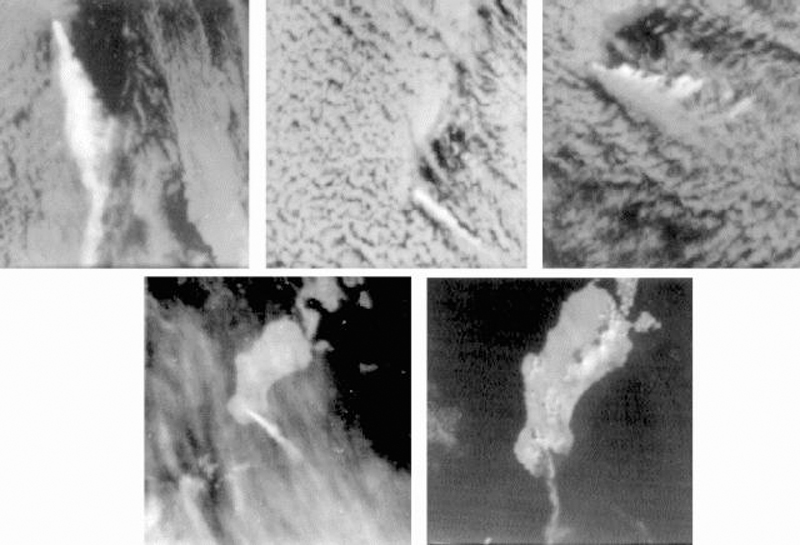 |
Figure 3. NOAA 5 satellite imagery, 5-9 February 1978, showing Unimak Island and vicinity. North orientations (arrow) are the same for each. A: (5 February 1978, 1036, infrared) Plume extends about 230 km S, rising to an estimated 8 km; black summit hot spot. B: (6 February 1978, 1141, infrared) Plume extends about 110 km SE; black summit hot spot. C: (7 February 1978, 1101, infrared) Plume at least 6 km high and about 160 km long, blown primarily SSE but some eastward shearing evident, probably by lower altitude winds. D: (8 February 1978, 1018, infrared) Plume extends 80 km SSE, at lower altitude than in C. E: (8 February 1978, 1018, visible, enlarged about 50% more than A-D) Weak plume curves SW to W about 100 km. Shishaldin is no longer active, 16 hours after its plume was visible in figure 11-2. The dark triangular area S of Westdahl is fresh ashfall, subtending an angle of about 95° and covering an area of about 300 km2. No ashfall is visible on Shishaldin. Courtesy of Jürgen Kienle and NOAA. |
Information Contacts: J. Kienle, Univ. of Alaska; T. Miller, USGS, Anchorage.
February ashfall on vessel 1,000 km SE of Westdahl
Snow contaminated by dark ash fell on the freight vessel United Spirit between 1200 and about midnight on 7 February, as it steamed from 48.8°N, 152.5°W to 49.2°N, 156.3°W, about 1,000 km SE of Westdahl. Satellite imagery (figure 3) shows that winds were driving the eruption cloud towards the vessel, about 24 hours before the ashfall began. Winds observed from the United Spirit during the snowfall were steadily from the NW.
Information Contacts: JMA, Tokyo.
February eruption site visited; new crater 1.5 km in diameter and 0.5 km deep
On 6-7 August a team of six, including volcanologists Maurice and Katia Krafft and Alain Gerente, climbed Westdahl. The new crater formed by the February eruption is about 1.5 km in diameter and 0.5 km deep, at about 1450 m elevation (figure 4). Its upper portion cut through glacial ice, which reached 200 m thickness on the N rim. The bottom of the vertical-walled crater is filled with blocks, ash, ice, and talus.
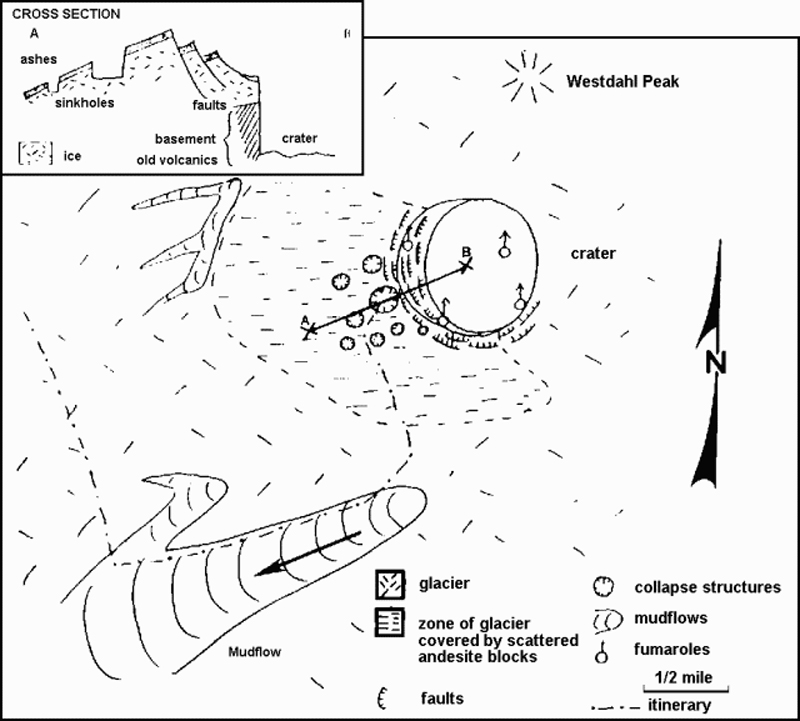 |
Figure 4. Sketch map with cross section of Westdahl's February eruption crater and vicinity, prepared by Maurice Krafft from observations made during a visit 6-7 August 1978. |
A lahar deposit, originating on the WSW flank of the new crater, extended down the glacier on Westdahl's flank to the sea, cutting the road from Cape Sarichef to Scotch Cap. The thickness of the upper portion of the deposit averaged about 50 cm, increasing to 1-3 m near the lower end.
A diary from Richard Clark (who was at Scotch Cap during the eruption) has established that the eruption began about 1330 on 4 February with the ejection of a steam cloud. Ash emission began soon afterward and ashfall started at Scotch Cap (15 km SW of the crater) at about 1600. A thunderstorm associated with the activity dropped hailstones formed around particles of ash and small lapilli. Tephra fall and the associated thunderstorm continued at Scotch Cap until mid-afternoon on 5 February. Clark reported that ash emission was continuing when he left the area during the morning of 8 February. A plume was visible in a satellite image at 1129 on 9 February (3:2). After the 9th, activity declined to steaming.
Information Contacts: M. Krafft, Cernay; R. Clark, Blaine WA.
8-km cloud seen on satellite imagery
A cloud apparently erupted from Westdahl was present on NOAA weather satellite imagery for more than 30 hours on 8 and 9 February. The cloud was first observed on an infrared image at 0352 on 8 February, about 17 hours after the previous image, on which no eruption cloud could be seen. A cloud was present on successive images on the 8th at 0926 (visible and infrared) and on the 9th at 0842 and 1037 (infrared) but not at 1958 on the 9th or 0952 on the l0th. The cloud was no more than 50 km in longest dimension on any of the images, nor was it elongated into a typical volcanic plume.
The height of the cloud was calcuated separately from infrared and visual images taken at 0926 on 8 February. Analysis of the infrared image gives a temperature of -53°C at the top of the cloud, corresponding to an altitude of slightly more than 8 km. On the visual image, measurements of the shadow cast on the weather cloud deck by the volcanic cloud result in an estimated altitude of 7.7 ± 1 km.
No activity was reported from the USCG LORAN Station at Cape Sarichef, less than 25 km from Westdahl, nor was there any aircraft confirmation of the activity.
Information Contacts: F. Parmenter, NOAA/NESS, Anchorage; J. Kienle, Univ. of Alaska; USCG LORAN Station, Unimak Island.
Lava flows and tephra from 8-km NE-flank fissure
Westdahl erupted at approximately 1700 on 29 November, sending a plume of steam and ash to more than 6 km altitude. The FAA immediately rerouted air traffic to the Pacific side of the eastern Aleutians to avoid encounters with the plume, which drifted NNE over the Bering Sea.
Video and still photographs from 30 November (courtesy of the U.S. Coast Guard, Peninsula Airways, and several civilians) show that the eruption occurred from a fissure, ~8 km long, extending down the NE flank from Westdahl Peak to an elevation of ~760 m. Several large craters and gaping sinuous cracks, parallel to the fissure, formed in snow and ice fields, probably by collapse due to melting. Ash venting occurred discontinuously along most of the fissure's length, but lava fountaining was concentrated along the lower few kilometers. Several streams of fluid lava traveled E down at least two steep-walled drainages. By the second day of the eruption, the principal lava flow had moved a distance of about 4 km. Based on observations by AVO staff from a Coast Guard C-130 aircraft on 3 December, the very active flow front was 1.5 km wide, 5-10 m high, and ~7 km from the vent [figure 5]. The lava flow consisted of blocky gray aa, and widened as it reached the broad valley draining to the Pacific Ocean. As of 3 December, the front was about 10 km from the ocean. Also observed on the overflight was a dark-colored debris-flow deposit that extended to the Pacific. Streams draining the NE flank were muddy and steaming slightly when observed on 30 November and 3 December. Lava fountaining was visible, during clear weather, through 10 December, and lava flows remained active on the NE flank.
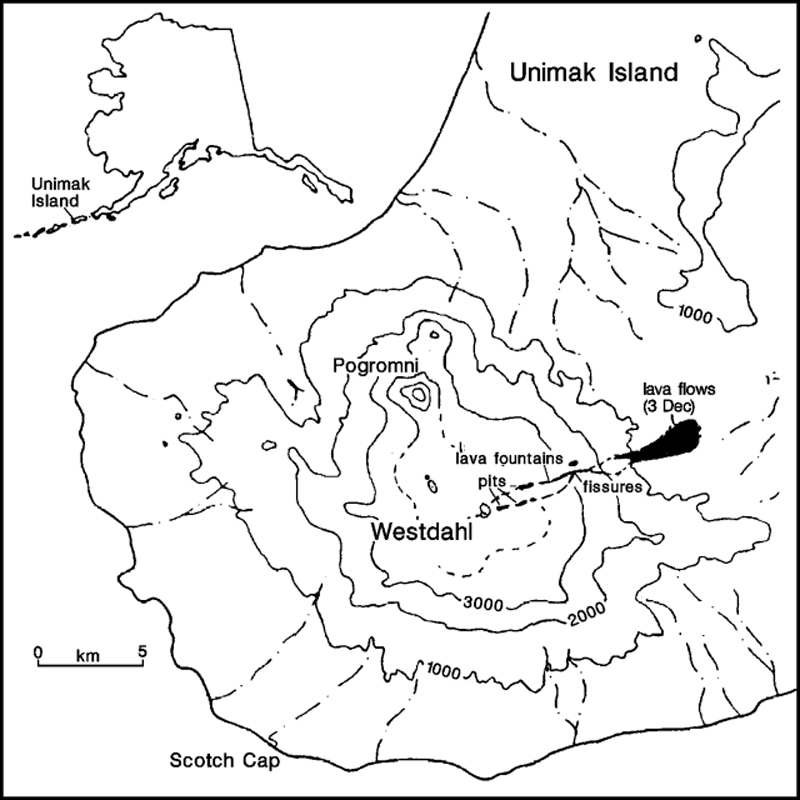 |
Figure 5. Sketch map of the SW part of Unimak Island, showing the eruption vents and lava flow from the Westdahl eruption as of 3 December 1991. Contour interval, 1,000 feet (about 300 m). Printed by permission of the Alaska Volcano Observatory. [Originally in 17:01] |
Satellite imagery and pilot observations through mid-December indicated that the steam plume, periodically containing small quantities of ash, rose to as much as 7 km altitude and was preferentially carried NE. On 30 November, residents of False Pass, 90 km NE, reported ash-laden skies, fine ash deposition, and a strong sulfur smell that lasted into the night. Similar strong sulfur odors were reported by pilots up to several hundred kilometers inland. Light ashfall occurred again at False Pass on 9 and 12 December, and distant roaring and rumbling were occasionally heard at night through mid-December. No ash was reported in Cold Bay (145 km NE).
[No seismometers are installed on Westdahl, so information about seismicity associated with the eruption is limited. Data from the nearest seismic station, 170 km ENE of Westdahl (at Dutton), included six earthquakes of M 2.8-3.1 between 1100 and 1940 on 29 November. S-P values were consistent with epicenters in the Westdahl area, as were those recorded at Sand Point, 275 km ENE. The Dutton station also detected a tremor-like signal, different from typical noise at the site, between 1500 and 1949 on 29 November. (Originally in 17:01).]
Further Reference. Swanson, S., 1990, Westdahl, in Wood, C. and Kienle, J., Volcanoes of North America: Cambridge University Press, p. 45-46.
Information Contacts: AVO; SAB; AP.
Tephra emission declines
The eruption ... continued until 15 January when a significant decrease in activity was noted. Bad weather prevented further observations of the lava flow. Aircraft pilots reported steam and ash plumes to 3.7-7.0 km altitude on 16-20 December, and 4.9 km altitude on 21-23 December. Light ashfall was noted on 16, 25, and 26 December at False Pass, 90 km NE. Residents of False Pass reported hearing rumbling for several nights prior to 30 December. Analyses of ash samples (collected 9 and 25 December) indicated a basaltic andesite composition, with [54.7]% SiO2.
Steam clouds rose to 4.6-4.9 km altitude on 2 and 3 January. Ash clouds were again observed on 8 and 9 January, rising to 2.1-2.4 km altitude. Satellite images during the late afternoon on the 9th showed the plume extending about 150 km SE. A dark spot appeared in satellite images of the volcano for several days prior to 13 January, indicating high temperatures. A black ash cloud was reported to 4 km on 13 January.
The eruption was greatly diminished in intensity on 15 January. Observers noted a small amount of steam at ground level in the vicinity of the eruption site, but there was no sign of a vertical plume. That day, an elongate area of slightly elevated temperature on the volcano's NE flank was visible in a satellite image.
[A 23 January overflight provided the first clear view of the lava flow since 3 December. The flow appeared to have widened to cover 2-3 times its 3 December area, but its front had not advanced significantly.]
Information Contacts: AVO.
Eruption apparently ends; seismic data from eruption onset
Westdahl's eruption appears to have stopped. Poor weather limited observations and the stop date is uncertain, but a significant decrease in eruption intensity was noted on 15 January. Geologists noted that comparison with the 1978 eruption suggested that this cessation in activity may be only a pause.
No plume penetrated the cloud deck that obscured the summit-area fissure during a 23 January overflight. The lava flow appears to have widened to cover 2-3 times its 3 December area (figure 5), while its front had not advanced significantly. As of late January, infrared images from the NOAA-11 polar orbiting weather satellite indicated a "warm" spot in the vicinity of the volcano. Exact registration of the warm area has been difficult, but it is believed to be associated with the position of the cooling lava flow. The FAA removed all flight restrictions around the volcano on 7 February. During aerial observations by FWS personnel on 13 February, only scattered steaming was noted from the flow. Minor steaming occurred from a small cinder cone near a steep, ice-walled canyon, where the fissure vent cuts the E part of the summit glacier.
Information Contacts: AVO.
|
|
||||||||||||||||||||||||||||
There is data available for 7 confirmed Holocene eruptive periods.
1991 Nov 29 - 1992 Jan 14 Confirmed Eruption (Explosive / Effusive) VEI: 3
| Episode 1 | Eruption (Explosive / Effusive) | ENE flank (1560-760 m) | |||||||||||||||||||||||||||||||||||||||
|---|---|---|---|---|---|---|---|---|---|---|---|---|---|---|---|---|---|---|---|---|---|---|---|---|---|---|---|---|---|---|---|---|---|---|---|---|---|---|---|---|
| 1991 Nov 29 - 1992 Jan 14 | Evidence from Observations: Reported | |||||||||||||||||||||||||||||||||||||||
|
List of 6 Events for Episode 1 at ENE flank (1560-760 m)
|
||||||||||||||||||||||||||||||||||||||||
[ 1979 Feb 8 - 1979 Feb 9 ] Uncertain Eruption
| Episode 1 | Eruption (Explosive / Effusive) | |||||||||||||||||||||||||
|---|---|---|---|---|---|---|---|---|---|---|---|---|---|---|---|---|---|---|---|---|---|---|---|---|---|
| 1979 Feb 8 - 1979 Feb 9 | Evidence from Unknown | ||||||||||||||||||||||||
|
List of 3 Events for Episode 1
|
|||||||||||||||||||||||||
1978 Feb 4 - 1978 Feb 9 Confirmed Eruption (Explosive / Effusive) VEI: 3
| Episode 1 | Eruption (Explosive / Effusive) | South of Westdahl Peak (1450 m) | |||||||||||||||||||||||||||||||||||||||||||||||||||||||||||
|---|---|---|---|---|---|---|---|---|---|---|---|---|---|---|---|---|---|---|---|---|---|---|---|---|---|---|---|---|---|---|---|---|---|---|---|---|---|---|---|---|---|---|---|---|---|---|---|---|---|---|---|---|---|---|---|---|---|---|---|---|
| 1978 Feb 4 - 1978 Feb 9 | Evidence from Observations: Reported | |||||||||||||||||||||||||||||||||||||||||||||||||||||||||||
|
List of 10 Events for Episode 1 at South of Westdahl Peak (1450 m)
|
||||||||||||||||||||||||||||||||||||||||||||||||||||||||||||
1964 Mar 10 - 1964 Apr 16 Confirmed Eruption (Explosive / Effusive) VEI: 2
| Episode 1 | Eruption (Explosive / Effusive) | |||||||||||||||||||||||||||||||||||
|---|---|---|---|---|---|---|---|---|---|---|---|---|---|---|---|---|---|---|---|---|---|---|---|---|---|---|---|---|---|---|---|---|---|---|---|
| 1964 Mar 10 - 1964 Apr 16 | Evidence from Observations: Reported | ||||||||||||||||||||||||||||||||||
|
List of 5 Events for Episode 1
|
|||||||||||||||||||||||||||||||||||
1827 - 1830 Confirmed Eruption (Explosive / Effusive) VEI: 2
| Episode 1 | Eruption (Explosive / Effusive) | Pogromni or (more likely) Westdahl | |||||||||||||||||||||||||||||
|---|---|---|---|---|---|---|---|---|---|---|---|---|---|---|---|---|---|---|---|---|---|---|---|---|---|---|---|---|---|---|
| 1827 - 1830 | Evidence from Observations: Reported | |||||||||||||||||||||||||||||
|
List of 4 Events for Episode 1 at Pogromni or (more likely) Westdahl
|
||||||||||||||||||||||||||||||
1820 Confirmed Eruption (Explosive / Effusive) VEI: 2
| Episode 1 | Eruption (Explosive / Effusive) | Pogromni or (more likely) Westdahl | |||||||||||||||||||
|---|---|---|---|---|---|---|---|---|---|---|---|---|---|---|---|---|---|---|---|---|
| 1820 - Unknown | Evidence from Observations: Reported | |||||||||||||||||||
|
List of 2 Events for Episode 1 at Pogromni or (more likely) Westdahl
|
||||||||||||||||||||
1796 Confirmed Eruption (Explosive / Effusive) VEI: 0
| Episode 1 | Eruption (Explosive / Effusive) | Pogromni or (more likely) Westdahl | ||||||||||||||||||||||||
|---|---|---|---|---|---|---|---|---|---|---|---|---|---|---|---|---|---|---|---|---|---|---|---|---|---|
| 1796 - Unknown | Evidence from Observations: Reported | ||||||||||||||||||||||||
|
List of 3 Events for Episode 1 at Pogromni or (more likely) Westdahl
|
|||||||||||||||||||||||||
1795 Confirmed Eruption (Explosive / Effusive) VEI: 4
| Episode 1 | Eruption (Explosive / Effusive) | Pogromni or (more likely) Westdahl | |||||||||||||||||||||||||||||
|---|---|---|---|---|---|---|---|---|---|---|---|---|---|---|---|---|---|---|---|---|---|---|---|---|---|---|---|---|---|---|
| 1795 - Unknown | Evidence from Observations: Reported | |||||||||||||||||||||||||||||
|
List of 4 Events for Episode 1 at Pogromni or (more likely) Westdahl
|
||||||||||||||||||||||||||||||
This compilation of synonyms and subsidiary features may not be comprehensive. Features are organized into four major categories: Cones, Craters, Domes, and Thermal Features. Synonyms of features appear indented below the primary name. In some cases additional feature type, elevation, or location details are provided.
Cones |
||||
| Feature Name | Feature Type | Elevation | Latitude | Longitude |
| Faris Peak | Cone | 1648 m | 54° 31' 40.00" N | 164° 41' 11.00" W |
| Pogromni
Nosowskoj Kugidach-Jagutscha Pogrumni Pogrumnoy Devastation Volcano |
Stratovolcano | 1960 m | 54° 34' 14.00" N | 164° 41' 33.00" W |
| Pogromni's Sister | Stratovolcano | 1215 m | 54° 35' 54.00" N | 164° 41' 1.00" W |
| Westdahl | Stratovolcano | 1563 m | 54° 30' 57.00" N | 164° 38' 59.00" W |
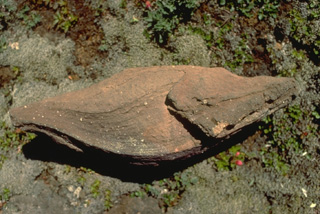 This roughly 50-cm-long volcanic bomb, erupted from Westdahl volcano in the Aleutians, is known as a spindle bomb. Molten masses of magma that are blown out of the crater commonly become aerodynamically rounded into a spindle shape as they are hurled through the air. Some bombs are still partially molten and become deformed when they impact onto the ground.
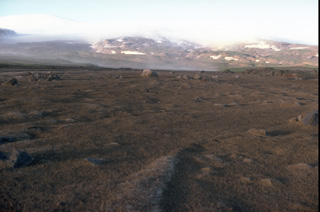 A lahar produced by the melting of snow and ice during a February 4-9, 1978 eruption of Westdahl volcano in the Aleutians is seen in the foreground of this summer 1978 photo taken near Scotch Cap on the SW coast. The lahar traveled 12 km from the summit, visible at the upper left. The 1978 eruption blasted a 1.5-km wide, 500-m deep crater through the summit icecap.
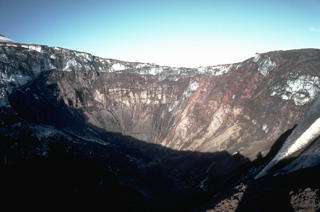 An explosive eruption February 4-9, 1978, produced an 8-10 km-high eruption column and blasted a new 1.5-km-wide, 0.5-km-deep crater through the summit icecap 1 km south of Westdahl Peak. This view from the west rim shows the summit icefield at the top of the new crater; the icefield was truncated by the explosions.
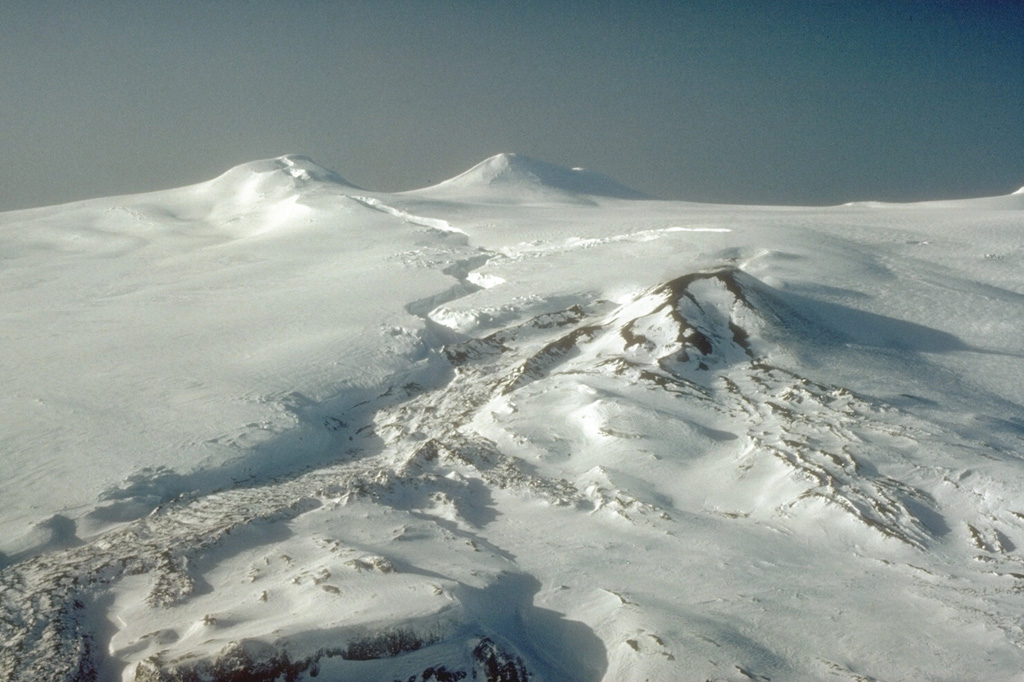
 The summit area of Westdahl, located on the southwestern part of Unimak Island in the eastern Aleutians, is seen here from the east. Westdahl Peak (left) and Faris Peak (right) formed on the broad main edifice. The scoria cone in the center was the principal eruption site for the 1991-92 activity, producing the snow-covered lava flow in the foreground. . The sinuous fissure cutting across the glacial icecap from the summit formed in the opening phases of the eruption and produced lava fountaining.
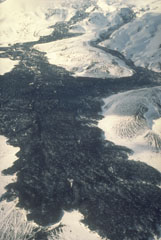 This 1992 view up the eastern flank of Westdahl was taken two months after the end of a major eruption that produced these lava flows. The eruption took place from an 8-km-long fissure that extended from the summit down the east flank and began on 29 November 1991 with a 6-km-high ash plume. The lava flow traveled as far as 7 km from the vent, widening as it reached the lower flanks.
There are no samples for Westdahl in the Smithsonian's NMNH Department of Mineral Sciences Rock and Ore collection.
| Alaska Volcano Observatory (Link to Westdahl) | The Alaska Volcano Observatory (AVO) is a joint program of the U.S. Geological Survey (USGS), the Geophysical Institute of the University of Alaska Fairbanks (UAFGI), and the State of Alaska Division of Geological and Geophysical Surveys (ADGGS). AVO was formed in 1988, and uses federal, state, and university resources to monitor and study Alaska's hazardous volcanoes, to predict and record eruptive activity, and to mitigate volcanic hazards to life and property. |
| Copernicus Browser | The Copernicus Browser replaced the Sentinel Hub Playground browser in 2023, to provide access to Earth observation archives from the Copernicus Data Space Ecosystem, the main distribution platform for data from the EU Copernicus missions. |
| MIROVA | Middle InfraRed Observation of Volcanic Activity (MIROVA) is a near real time volcanic hot-spot detection system based on the analysis of MODIS (Moderate Resolution Imaging Spectroradiometer) data. In particular, MIROVA uses the Middle InfraRed Radiation (MIR), measured over target volcanoes, in order to detect, locate and measure the heat radiation sourced from volcanic activity. |
| MODVOLC Thermal Alerts | Using infrared satellite Moderate Resolution Imaging Spectroradiometer (MODIS) data, scientists at the Hawai'i Institute of Geophysics and Planetology, University of Hawai'i, developed an automated system called MODVOLC to map thermal hot-spots in near real time. For each MODIS image, the algorithm automatically scans each 1 km pixel within it to check for high-temperature hot-spots. When one is found the date, time, location, and intensity are recorded. MODIS looks at every square km of the Earth every 48 hours, once during the day and once during the night, and the presence of two MODIS sensors in space allows at least four hot-spot observations every two days. Each day updated global maps are compiled to display the locations of all hot spots detected in the previous 24 hours. There is a drop-down list with volcano names which allow users to 'zoom-in' and examine the distribution of hot-spots at a variety of spatial scales. |
|
WOVOdat
Single Volcano View Temporal Evolution of Unrest Side by Side Volcanoes |
WOVOdat is a database of volcanic unrest; instrumentally and visually recorded changes in seismicity, ground deformation, gas emission, and other parameters from their normal baselines. It is sponsored by the World Organization of Volcano Observatories (WOVO) and presently hosted at the Earth Observatory of Singapore.
GVMID Data on Volcano Monitoring Infrastructure The Global Volcano Monitoring Infrastructure Database GVMID, is aimed at documenting and improving capabilities of volcano monitoring from the ground and space. GVMID should provide a snapshot and baseline view of the techniques and instrumentation that are in place at various volcanoes, which can be use by volcano observatories as reference to setup new monitoring system or improving networks at a specific volcano. These data will allow identification of what monitoring gaps exist, which can be then targeted by remote sensing infrastructure and future instrument deployments. |
| Volcanic Hazard Maps | The IAVCEI Commission on Volcanic Hazards and Risk has a Volcanic Hazard Maps database designed to serve as a resource for hazard mappers (or other interested parties) to explore how common issues in hazard map development have been addressed at different volcanoes, in different countries, for different hazards, and for different intended audiences. In addition to the comprehensive, searchable Volcanic Hazard Maps Database, this website contains information about diversity of volcanic hazard maps, illustrated using examples from the database. This site is for educational purposes related to volcanic hazard maps. Hazard maps found on this website should not be used for emergency purposes. For the most recent, official hazard map for a particular volcano, please seek out the proper institutional authorities on the matter. |
| IRIS seismic stations/networks | Incorporated Research Institutions for Seismology (IRIS) Data Services map showing the location of seismic stations from all available networks (permanent or temporary) within a radius of 0.18° (about 20 km at mid-latitudes) from the given location of Westdahl. Users can customize a variety of filters and options in the left panel. Note that if there are no stations are known the map will default to show the entire world with a "No data matched request" error notice. |
| UNAVCO GPS/GNSS stations | Geodetic Data Services map from UNAVCO showing the location of GPS/GNSS stations from all available networks (permanent or temporary) within a radius of 20 km from the given location of Westdahl. Users can customize the data search based on station or network names, location, and time window. Requires Adobe Flash Player. |
| DECADE Data | The DECADE portal, still in the developmental stage, serves as an example of the proposed interoperability between The Smithsonian Institution's Global Volcanism Program, the Mapping Gas Emissions (MaGa) Database, and the EarthChem Geochemical Portal. The Deep Earth Carbon Degassing (DECADE) initiative seeks to use new and established technologies to determine accurate global fluxes of volcanic CO2 to the atmosphere, but installing CO2 monitoring networks on 20 of the world's 150 most actively degassing volcanoes. The group uses related laboratory-based studies (direct gas sampling and analysis, melt inclusions) to provide new data for direct degassing of deep earth carbon to the atmosphere. |
| Large Eruptions of Westdahl | Information about large Quaternary eruptions (VEI >= 4) is cataloged in the Large Magnitude Explosive Volcanic Eruptions (LaMEVE) database of the Volcano Global Risk Identification and Analysis Project (VOGRIPA). |
| EarthChem | EarthChem develops and maintains databases, software, and services that support the preservation, discovery, access and analysis of geochemical data, and facilitate their integration with the broad array of other available earth science parameters. EarthChem is operated by a joint team of disciplinary scientists, data scientists, data managers and information technology developers who are part of the NSF-funded data facility Integrated Earth Data Applications (IEDA). IEDA is a collaborative effort of EarthChem and the Marine Geoscience Data System (MGDS). |