Recently Published Bulletin Reports
Agung (Indonesia) Three eruptive events reported in April, May, and December 2022
Tengger Caldera (Indonesia) Minor ash emission in December 2023; persistent weak thermal anomaly in the Bromo crater
Saunders (United Kingdom) Persistent thermal anomalies from the summit crater lava lake during February 2023-January 2024
Shishaldin (United States) New eruption with significant Strombolian explosions, ash plumes, and ashfall
Ioto (Japan) New eruption with discolored water, ejecta, and floating pumice during October-December 2023
Purace (Colombia) Gas-and-ash emission on 16 November 2023
Etna (Italy) Strombolian explosions, lava fountains, and lava flows during July-August 2023
Suwanosejima (Japan) Eruption plumes, crater incandescence, and occasional explosions during July-October 2023
Aira (Japan) Explosions, ash plumes, ash fall, and crater incandescence during July-October 2023
Nishinoshima (Japan) Gray emissions during October 2023
Kilauea (United States) Strong lava fountains, lava flows, and spatter at Halema’uma’u during January-September 2023
Tinakula (Solomon Islands) Continued lava flows and thermal activity during June through November 2023
Agung (Indonesia) — January 2024  Cite this Report
Agung
Indonesia
8.343°S, 115.508°E; summit elev. 2997 m
All times are local (unless otherwise noted)
Three eruptive events reported in April, May, and December 2022
Mount Agung, located on the E end of the island of Bali, Indonesia, rises above the SE rim of the Batur caldera. The summit area extends 1.5 km E-W, with the highest point on the W and a steep-walled 800-m-wide crater on the E. Recorded eruptions date back to the early 19th century. A large and deadly explosive and effusive eruption occurred during 1963-64, which was characterized by voluminous ashfall, pyroclastic flows, and lahars that caused extensive damage and many fatalities. More recent activity was documented during November 2017-June 2019 that consisted of multiple explosions, significant ash plumes, lava flows at the summit crater, and incandescent ejecta. This report covers activity reported during April-May 2022 and December 2022 based on data from the Darwin Volcanic Ash Advisory Center (VAAC).
Activity during 2022 was relatively low and mainly consisted of a few ash plumes during April-May and December. An ash plume on 3 April rising to 3.7 km altitude (700 m above the summit) and drifting N was reported in a Darwin VAAC notice based on a ground report, with ash seen in HIMAWARI-8 visible imagery. Another ash plume was reported at 1120 on 27 May that rose to 5.5 km altitude (2.5 m above the summit); the plume was not visible in satellite or webcam images due to weather clouds. An eruption was reported based on seismic data at 0840 on 13 December, with an estimated plume altitude of 3.7 km; however, no ash was seen using satellite imagery in clear conditions before weather clouds obscured the summit.
Geologic Background. Symmetrical Agung stratovolcano, Bali's highest and most sacred mountain, towers over the eastern end of the island. The volcano, whose name means "Paramount," rises above the SE rim of the Batur caldera, and the northern and southern flanks extend to the coast. The summit area extends 1.5 km E-W, with the high point on the W and a steep-walled 800-m-wide crater on the E. The Pawon cone is located low on the SE flank. Only a few eruptions dating back to the early 19th century have been recorded in historical time. The 1963-64 eruption, one of the largest in the 20th century, produced voluminous ashfall along with devastating pyroclastic flows and lahars that caused extensive damage and many fatalities.
Information Contacts: Darwin Volcanic Ash Advisory Centre (VAAC), Bureau of Meteorology, Northern Territory Regional Office, PO Box 40050, Casuarina, NT 0811, Australia (URL: http://www.bom.gov.au/info/vaac/).
Tengger Caldera (Indonesia) — February 2024 Cite this Report
Tengger Caldera
Indonesia
7.942°S, 112.95°E; summit elev. 2329 m
All times are local (unless otherwise noted)
Minor ash emission in December 2023; persistent weak thermal anomaly in the Bromo crater
Tengger Caldera, located at the N end of a volcanic massif in Indonesia’s East Java, consists of five overlapping stratovolcanoes. The youngest and only active cone in the 16-km-wide caldera is Bromo, which typically produces gas-and-steam plumes, occasional ash plumes and explosions, and weak thermal signals (BGVN 44:05, 47:01). This report covers activity during January 2022-December 2023, consisting of mostly white gas-and-steam emissions and persistent weak thermal anomalies. Information was provided by the Pusat Vulkanologi dan Mitigasi Bencana Geologi (PVMBG, also known as Indonesian Center for Volcanology and Geological Hazard Mitigation, CVGHM) and satellite imagery. The Alert Level remained at 2 (on a scale of 1-4), and visitors were warned to stay at least 1 km from the crater.
Activity was generally low during the reporting period, similar to that in 2021. According to almost daily images from MAGMA Indonesia (a platform developed by PVMBG), white emissions and plumes rose from 50 to 900 m above the main crater during this period (figure 24). During several days in March and June 2022, white plumes reached heights of 1-1.2 km above the crater.
After an increase in activity at 2114 on 3 February 2023, a PVMBG team that was sent to observe white emissions rising as high as 300 m during 9-12 February and heard rumbling noises. A sulfur dioxide odor was also strong near the crater and measurements indicated that levels were above the healthy (non-hazardous) threshold of 5 parts per million; differential optical absorption spectroscopy (DOAS) measurements indicated an average flux of 190 metric tons per day on 11 February. Incandescence originating from a large fumarole in the NNW part of the crater was visible at night. The team observed that vegetation on the E caldera wall was yellow and withered. The seismic network recorded continuous tremor and deep and shallow volcanic earthquakes.
According to a PVMBG press release, activity increased on 13 December 2023 with white, gray, and brown emissions rising as high as 900 m above Bromo’s crater rim and drifting in multiple directions (figure 25). The report noted that tremor was continuous and was accompanied in December by three volcanic earthquakes. Deformation data indicated inflation in December. There was no observable difference in the persistent thermal anomaly in the crater between 11 and 16 December 2023.
All clear views of the Bromo crater throughout this time, using Sentinel-2 infrared satellite images, showed a weak persistent thermal anomaly; none of the anomalies were strong enough to cause MODVOLC Thermal Alerts. A fire in the SE part of the caldera in early September 2023 resulted in a brief period of strong thermal anomalies.
Geologic Background. The 16-km-wide Tengger caldera is located at the northern end of a volcanic massif extending from Semeru volcano. The massive volcanic complex dates back to about 820,000 years ago and consists of five overlapping stratovolcanoes, each truncated by a caldera. Lava domes, pyroclastic cones, and a maar occupy the flanks of the massif. The Ngadisari caldera at the NE end of the complex formed about 150,000 years ago and is now drained through the Sapikerep valley. The most recent of the calderas is the 9 x 10 km wide Sandsea caldera at the SW end of the complex, which formed incrementally during the late Pleistocene and early Holocene. An overlapping cluster of post-caldera cones was constructed on the floor of the Sandsea caldera within the past several thousand years. The youngest of these is Bromo, one of Java's most active and most frequently visited volcanoes.
Information Contacts: Pusat Vulkanologi dan Mitigasi Bencana Geologi (PVMBG, also known as Indonesian Center for Volcanology and Geological Hazard Mitigation, CVGHM), Jalan Diponegoro 57, Bandung 40122, Indonesia (URL: http://www.vsi.esdm.go.id/); MAGMA Indonesia, Kementerian Energi dan Sumber Daya Mineral (URL: https://magma.esdm.go.id/v1); Copernicus Browser, Copernicus Data Space Ecosystem, European Space Agency (URL: https://dataspace.copernicus.eu/browser/); Hawai'i Institute of Geophysics and Planetology (HIGP) - MODVOLC Thermal Alerts System, School of Ocean and Earth Science and Technology (SOEST), Univ. of Hawai'i, 2525 Correa Road, Honolulu, HI 96822, USA (URL: http://modis.higp.hawaii.edu/).
Saunders (United Kingdom) — February 2024 Cite this Report
Saunders
United Kingdom
57.8°S, 26.483°W; summit elev. 843 m
All times are local (unless otherwise noted)
Persistent thermal anomalies from the summit crater lava lake during February 2023-January 2024
Saunders is one of eleven islands that comprise the South Sandwich Islands in the South Atlantic. The active Mount Michael volcano has been in almost continuous eruption since November 2014 (BGVN 48:02). Recent activity has resulted in intermittent thermal anomalies and gas-and-steam emissions (BGVN 47:03, 48:02). Visits are infrequent due to its remote location, and cloud cover often prevents satellite observations. Satellite thermal imagery and visual observation of incandescence during a research expedition in 2019 (BGVN 28:02 and 44:08) and a finding confirmed by a National Geographic Society research team that summited Michael in November 2022 reported the presence of a lava lake.
Although nearly constant cloud cover during February 2023 through January 2024 greatly limited satellite observations, thermal anomalies from the lava lake in the summit crater were detected on clear days, especially around 20-23 August 2023. Anomalies similar to previous years (eg. BGVN 48:02) were seen in both MIROVA (Middle InfraRed Observation of Volcanic Activity) data from MODIS instruments and in Sentinel 2 infrared imagery. The only notable sulfur dioxide plume detected near Saunders was on 25 September 2023, with the TROPOMI instrument aboard the Sentinel-5P satellite.
Geologic Background. Saunders Island consists of a large central volcanic edifice intersected by two seamount chains, as shown by bathymetric mapping (Leat et al., 2013). The young Mount Michael stratovolcano dominates the glacier-covered island, while two submarine plateaus, Harpers Bank and Saunders Bank, extend north. The symmetrical Michael has a 500-m-wide summit crater and a remnant of a somma rim to the SE. Tephra layers visible in ice cliffs surrounding the island are evidence of recent eruptions. Ash clouds were reported from the summit crater in 1819, and an effusive eruption was inferred to have occurred from a N-flank fissure around the end of the 19th century and beginning of the 20th century. A low ice-free lava platform, Blackstone Plain, is located on the north coast, surrounding a group of former sea stacks. A cluster of cones on the SE flank, the Ashen Hills, appear to have been modified since 1820 (LeMasurier and Thomson, 1990). Analysis of satellite imagery available since 1989 (Gray et al., 2019; MODVOLC) suggests frequent eruptive activity (when weather conditions allow), volcanic clouds, steam plumes, and thermal anomalies indicative of a persistent, or at least frequently active, lava lake in the summit crater. Due to this observational bias, there has been a presumption when defining eruptive periods that activity has been ongoing unless there is no evidence for at least 10 months.
Information Contacts: MIROVA (Middle InfraRed Observation of Volcanic Activity), a collaborative project between the Universities of Turin and Florence (Italy) supported by the Centre for Volcanic Risk of the Italian Civil Protection Department (URL: http://www.mirovaweb.it/); NASA Global Sulfur Dioxide Monitoring Page, Atmospheric Chemistry and Dynamics Laboratory, NASA Goddard Space Flight Center (NASA/GSFC), 8800 Greenbelt Road, Goddard MD 20771, USA (URL: https://so2.gsfc.nasa.gov/); Copernicus Browser (URL: https://dataspace.copernicus.eu/browser).
Shishaldin (United States) — December 2023 Cite this Report
Shishaldin
United States
54.756°N, 163.97°W; summit elev. 2857 m
All times are local (unless otherwise noted)
New eruption with significant Strombolian explosions, ash plumes, and ashfall
Shishaldin is located on the eastern half of Unimak Island, one of the Aleutian Islands. Frequent explosive activity, primarily consisting of Strombolian ash eruptions from the small summit crater, but sometimes producing lava flows, has been recorded since the 18th century. The previous eruption ended in May 2020 and was characterized by intermittent thermal activity, increased seismicity and surface temperatures, ash plumes, and ash deposits (BGVN 45:06). This report covers a new eruption during July through November 2023, which consisted of significant explosions, ash plumes, ashfall, and lava fountaining. Information comes from daily, weekly, and special reports from the Alaska Volcano Observatory (AVO) and various satellite data. AVO monitors the volcano using local seismic and infrasound sensors, satellite data, web cameras, and remote infrasound and lightning networks.
AVO reported that intermittent tremor and low-frequency earthquakes had gradually become more regular and consistent during 10-13 July. Strongly elevated surface temperatures at the summit were identified in satellite images during 10-13 July. On 11 July AVO raised the Aviation Color Code (ACC) to Yellow (the second color on a four-color scale) and Volcano Alert Level (VAL) to Advisory (the second level on a four-level scale) at 1439. Later in the day on 11 July summit crater incandescence was observed in webcam images. Observations of the summit suggested that lava was likely present at the crater, which prompted AVO to raise the ACC to Orange (the second highest color on a four-color scale) and the VAL to Watch (the second highest level on a four-level scale). The US Coast Guard conducted an overflight on 12 July and confirmed that lava was erupting from the summit. That same day, sulfur dioxide emissions were detected in satellite images.
A significant explosion began at 0109 on 14 July that produced an ash plume that rose to 9-12 km altitude and drifted S over the Pacific Ocean (figure 43). Webcam images and photos taken around 0700 from a ship SW off Unimak Island showed small lahar deposits, which were the result of the interaction of hot pyroclastic material and snow and ice on the flanks. There was also ashfall on the SW and N flanks. A smaller explosion at 0710 generated an ash plume that rose to 4.5 km altitude. Webcam images and pilot reports showed continued low-level ash emissions during the morning, rising to less than 4.6 km altitude; those emissions included a small ash plume near the summit around 1030 resulting from a small explosion.
Seismic tremor amplitude began increasing at around 1700 on 15 July; strongly elevated surface temperatures were also reported. An ash plume rose to 4.6 km altitude and drifted SSE at 2100, based on a satellite image. A continuous ash plume during 2150 through 2330 rose to 5 km altitude and extended 125 km S. At 2357 AVO raised the ACC to Red (the highest color on a four-color scale) and the VAL to Warning (the highest level on a four-level scale), noting that seismicity remained elevated for more than six hours and explosion signals were frequently detected by regional infrasound (pressure sensor) networks. Explosions generated an ash plume that rose to 4.9 km altitude and drifted as far as 500 km SE. Activity throughout the night declined and by 0735 the ACC was lowered to Orange and the VAL to Watch. High-resolution satellite images taken on 16 July showed pyroclastic deposits extending as far as 3 km from the vent; these deposits generated lahars that extended further down the drainages on the flanks. Ash deposits were mainly observed on the SSE flank and extended to the shore of Unimak Island. During 16-17 July lava continued to erupt at the summit, which caused strongly elevated surface temperatures that were visible in satellite imagery.
Lava effusion increased at 0100 on 18 July, as noted in elevated surface temperatures identified in satellite data, increasing seismic tremor, and activity detected on regional infrasound arrays. A significant ash plume at 0700 rose to 7 km altitude and continued until 0830, eventually reaching 9.1 km altitude and drifting SSE (figure 44). As a result, the ACC was raised to Red and the VAL to Warning. By 0930 the main plume detached, but residual low-level ash emissions continued for several hours, remaining below 3 km altitude and drifting S. The eruption gradually declined and by 1208 the ACC was lowered to Orange and the VAL was lowered to Watch. High-resolution satellite images showed ash deposits on the SW flank and pyroclastic deposits on the N, E, and S flanks, extending as far as 3 km from the vent; lahars triggered by the eruption extended farther down the flanks (figure 45). Lava continued to erupt from the summit crater on 19 July.
Elevated surface temperatures were detected in satellite images during 19-25 July, despite occasional weather cloud cover, which was consistent with increased lava effusion. During 22-23 July satellite observations acquired after the eruption from 18 July showed pyroclastic flow and lahar deposits extending as far as 3 km down the N, NW, and NE flanks and as far as 1.5 km down the S and SE flanks. Ash deposits covered the SW and NE flanks. No lava flows were observed outside the crater. On 22 July a sulfur dioxide plume was detected in satellite data midday that had an estimated mass of 10 kt. In a special notice issued at 1653 on 22 July AVO noted that eruptive activity had intensified over the previous six hours, which was characterized by an hours-long steady increase in seismic tremor, intermittent infrasound signals consistent with small explosions, and an increase in surface temperatures that were visible in satellite data. Pilots first reported low-level ash plumes at around 1900. At 2320 an ash plume had risen to 9 km altitude based on additional pilot reports and satellite images. The ACC was increased to Red and the VAL to Warning at 2343. Satellite images indicated growth of a significantly higher ash plume that rose to 11 km altitude continued until 0030 and drifted NE. During the early morning hours of 23 July ash plumes had declined to 4.6 k altitude. Seismic tremor peaked at 0030 on 23 July and began to rapidly decline at 0109; active ash emissions were no longer visible in satellite data by 0130. The ACC was lowered to Orange and the VAL to Watch at 0418; bursts of increased seismicity were recorded throughout the morning, but seismicity generally remained at low levels. Elevated surface temperatures were visible in satellite data until about 0600. On 24 July pilots reported seeing vigorous gas-and-steam plumes rising to about 3 km altitude; the plumes may have contained minor amounts of ash.
During 24-25 July low level seismicity and volcanic tremor were detected at low levels following the previous explosion on 23 July. Strongly elevated surface temperatures were observed at the summit crater in satellite data. Around 2200 on 25 July seismicity began to increase, followed by infrasound signals of explosions after 0200 on 26 July. An ash plume rose to 3 km altitude at 0500 and drifted ENE, along with an associated sulfur dioxide plume that drifted NE and had an estimated mass of 22 kt. Diffuse ash emissions were visible in satellite data and rose to 6.1-7.6 km altitude and extended 125 km from the volcano starting around 1130. These ash events were preceded by about seven hours of seismic tremor, infrasound detections of explosions, and five hours of increased surface temperatures visible in satellite data. Activity began to decline around 1327, which included low-frequency earthquakes and decreased volcanic tremor, and infrasound data no longer detected significant explosions. Surface temperatures remained elevated through the end of the month.
Seismicity, volcanic tremor, and ash emissions remained at low levels during early August. Satellite images on 1 August showed that some slumping had occurred on the E crater wall due to the recent explosive activity. Elevated surface temperatures continued, which was consistent with cooling lava. On 2 August small explosive events were detected, consistent with low-level Strombolian activity. Some episodes of volcanic tremor were reported, which reflected low-level ash emissions. Those ash emissions rose to less than 3 km altitude and drifted as far as 92.6 km N. Pilots that were located N of the volcano observed an ash plume that rose to 2.7 km altitude. Seismicity began to increase in intensity around 0900 on 3 August. Seismicity continued to increase throughout the day and through the night with strongly elevated surface temperatures, which suggested that lava was active at the surface.
An ash cloud that rose to 7.6-7.9 km altitude and drifted 60-75 km NE was visible in a satellite image at 0520 on 4 August. Pilots saw and reported the plume at 0836 (figure 46). By 0900 the plume had risen to 9.1 km altitude and extended over 100 km NE. AVO raised the ACC to Red and the VAL to Warning as a result. Seismic tremor levels peaked at 1400 and then sharply declined at 1500 to slightly elevated levels; the plume was sustained during the period of high tremor and drifted N and NE. The ACC was lowered to Orange and the VAL to Watch at 2055. During 5-14 August seismicity remained low and surface temperatures were elevated based on satellite data due to cooling lava. On 9 August a small lava flow was observed that extended from the crater rim to the upper NE flank. It had advanced to 55 m in length and appeared in satellite imagery on 11 August. Occasional gas-and-steam plumes were noted in webcam images. At 1827 AVO noted that seismic tremor had steadily increased during the afternoon and erupting lava was visible at the summit in satellite images.
Strong explosion signals were detected at 0200 on 15 August. An ash cloud that was visible in satellite data extended 100 km NE and may have risen as high as 11 km altitude around 0240. By 0335 satellite images showed the ash cloud rising to 7.6 km altitude and drifting NE. Significant seismicity and explosions were detected by the local AVO seismic and infrasound networks, and volcanic lightning was detected by the World Wide Lightning Location Network (WWLLN). A sulfur dioxide plume associated with the eruption drifted over the S Bering Sea and parts of Alaska and western Canada. Seismicity was significantly elevated during the eruption but had declined by 1322. A pilot reported that ash emissions continued, rising as high as 4.9 km altitude. Elevated surface temperatures detected in satellite data were caused by hot, eruptive material (pyroclastic debris and lava) that accumulated around the summit. Eruptive activity declined by 16 August and the associated sulfur dioxide plume had mostly dissipated; remnants continued to be identified in satellite images at least through 18 August. Surface temperatures remained elevated based on satellite images, indicating hot material on the upper parts of the volcano. Small explosions were detected in infrasound data on the morning of 19 August and were consistent with pilot reports of small, short-lived ash plumes that rose to about 4.3 km altitude. Low-level explosive activity was reported during 20-24 August, according to seismic and infrasound data, and weather clouds sometimes prevented views. Elevated surface temperatures were observed in satellite images, which indicated continued hot material on the upper parts of the volcano.
Seismic tremor began to increase at around 0300 on 25 August and was followed by elevated surface temperatures identified in satellite images, consistent with erupting lava. Small explosions were recorded in infrasound data. The ACC was raised to Red and the VAL to Warning at 1204 after a pilot reported an ash plume that rose to 9.1 km altitude. Seismicity peaked at 1630 and began to rapidly decline at around 1730. Ash plumes rose as high as 10 km altitude and drifted as far as 400 km NE. By 2020 the ash plumes had declined to 6.4 km altitude and continued to drift NE. Ash emissions were visible in satellite data until 0000 on 26 August and seismicity was at low levels. AVO lowered the ACC to Orange and the VAL to Watch at 0030. Minor explosive activity within the summit crater was detected during 26-28 August and strongly elevated surface temperatures were still visible in satellite imagery through the rest of the month. An AVO field crew working on Unimak Island observed a mass flow that descended the upper flanks beginning around 1720 on 27 August. The flow produced a short-lived ash cloud that rose to 4.5 km altitude and rapidly dissipated. The mass flow was likely caused by the collapse of spatter that accumulated on the summit crater rim.
Similar variable explosive activity was reported in September, although weather observations sometimes prevented observations. A moderate resolution satellite image from the afternoon of 1 September showed gas-and-steam emissions filling the summit crater and obscuring views of the vent. In addition, hot deposits from the previous 25-26 August explosive event were visible on the NE flank near the summit, based on a 1 September satellite image. On 2 and 4 September seismic and infrasound data showed signals of small, repetitive explosions. Variable gas-and-steam emissions from the summit were visible but there was no evidence of ash. Possible summit crater incandescence was visible in nighttime webcam images during 3-4 September.
Seismicity began to gradually increase at around 0300 on 5 September and activity escalated at around 0830. A pilot reported an ash plume that rose to 7.6 km altitude at 0842 and continued to rise as high as possibly 9.7 km altitude and drifted SSE based on satellite images (figure 47). The ACC was raised to Red and the VAL to Warning at 0900. In addition to strong tremor and sustained explosions, the eruption produced volcanic lightning that was detected by the WWLLN. Around 1100 seismicity decreased and satellite data confirmed that the altitude of the ash emissions had declined to 7.6 km altitude. By 1200 the lower-altitude portion of the ash plume had drifted 125 km E. Significant ash emissions ended by 1330 based on webcam images. The ACC was lowered to Orange and the VAL to Watch at 1440. Satellite images showed extensive pyroclastic debris flows on most of the flanks that extended 1.2-3.3 km from the crater rim.
During 6-13 September elevated surface temperatures continued to be observed in satellite data, seismicity remained elevated with weak but steady tremor, and small, low-frequency earthquakes and small explosions were reported, except on 12 September. On 6 September a low-level ash plume rose to 1.5-1.8 km altitude and drifted SSE. Occasional small and diffuse gas-and-steam emissions at the summit were visible in webcam images. Around 1800 on 13 September seismic tremor amplitudes began to increase, and small explosions were detected in seismic and infrasound data. Incandescent lava at the summit was seen in a webcam image taken at 0134 on 14 September during a period of elevated tremor. No ash emissions were reported during the period of elevated seismicity. Lava fountaining began around 0200, based on webcam images. Satellite-based radar observations showed that the lava fountaining activity led to the growth of a cone in the summit crater, which refilled most of the crater. By 0730 seismicity significantly declined and remained at low levels.
Seismic tremor began to increase around 0900 on 15 September and rapidly intensified. An explosive eruption began at around 1710, which prompted AVO to raise the ACC to Red and the VAL to Warning. Within about 30 minutes ash plumes drifted E below a weather cloud at 8.2 km altitude. The National Weather Service estimated that an ash-rich plume rose as high as 12.8 km altitude and produced volcanic lightning. The upper part of the ash plume detached from the vent around 1830 and drifted E, and was observed over the Gulf of Alaska. Around the same time, seismicity dramatically decreased. Trace ashfall was reported in the community of False Pass (38 km ENE) between 1800-2030 and also in King Cove and nearby marine waters. Activity declined at around 1830 although seismicity remained elevated, ash emissions, and ashfall continued until 2100. Lightning was again detected beginning around 1930, which suggested that ash emissions continued. Ongoing explosions were detected in infrasound data, at a lower level than during the most energetic phase of this event. Lightning was last detected at 2048. By 2124 the intensity of the eruption had decreased, and ash emissions were likely rising to less than 6.7 km altitude. Seismicity returned to pre-eruption levels. On 16 September the ACC was lowered to Orange and the VAL to Watch at 1244; the sulfur dioxide plume that was emitted from the previous eruption event was still visible over the northern Pacific Ocean. Elevated surface temperatures, gas-and-steam emissions from the vent, and new, small lahars were reported on the upper flanks based on satellite and webcam images. Minor deposits were reported on the flanks which were likely the result of collapse of previously accumulated lava near the summit crater.
Elevated seismicity with tremor, small earthquakes, and elevated surface temperatures were detected during 17-23 September. Minor gas-and-steam emissions were visible in webcam images. On 20 September small volcanic debris flows were reported on the upper flanks. On 21 September a small ash deposit was observed on the upper flanks extending to the NE based on webcam images. Seismic tremor increased significantly during 22-23 September. Regional infrasound sensors suggested that low-level eruptive activity was occurring within the summit crater by around 1800 on 23 September. Even though seismicity was at high levels, strongly elevated surface temperatures indicating lava at the surface were absent and no ash emissions were detected; weather clouds at 0.6-4.6 km altitude obscured views. At 0025 on 24 September AVO noted that seismicity continued at high levels and nearly continuous small infrasound signals began, likely from low-level eruptive activity. Strongly elevated surface temperatures were identified in satellite images by 0900 and persisted throughout the day; the higher temperatures along with infrasound and seismic data were consistent with lava erupting at the summit. Around 1700 similarly elevated surface temperatures were detected from the summit in satellite data, which suggested that more vigorous lava fountaining had started. Starting around 1800 low-level ash emissions rose to altitudes less than 4.6 km altitude and quickly dissipated.
Beginning at midnight on 25 September, a series of seismic signals consistent with volcanic flows were recorded on the N side of the volcano. A change in seismicity and infrasound signals occurred around 0535 and at 0540 a significant ash cloud formed and quickly reached 14 km altitude and drifted E along the Alaska Peninsula. The cloud generated at least 150 lightning strokes with thunder that could be heard by people in False Pass. Seismicity rapidly declined to near background levels around 0600. AVO increased the ACC to Red and the VAL to Warning at 0602. The ash cloud detached from the volcano at around 0700, rose to 11.6 km altitude, and drifted ESE. Trace to minor amounts of ashfall were reported by the communities of False Pass, King Cove, Cold Bay, and Sand Point around 0700. Ash emissions continued at lower altitudes of 6-7.6 km altitude at 0820. Small explosions at the vent area continued to be detected in infrasound data and likely represented low-level eruptive activity near the vent. Due to the significant decrease in seismicity and ash emissions the ACC was lowered to Orange and the VAL to Watch at 1234. Radar data showed significant collapses of the crater that occurred on 25 September. Satellite data also showed significant hot, degassing pyroclastic and lahar deposits on all flanks, including more extensive flows on the ENE and WSW sections below two new collapse scarps. Following the significant activity during 24-25 September, only low-level activity was observed. Seismicity decreased notably near the end of the strong activity on 25 September and continued to decrease through the end of the month, though tremor and small earthquakes were still reported. No explosive activity was detected in infrasound data through 2 October. Gas-and-steam emissions rose to 3.7 km altitude, as reported by pilots and seen in satellite images. Satellite data from 26 September showed that significant collapses had occurred at the summit crater and hot, steaming deposits from pyroclastic flows and lahars were present on all the flanks, particularly to the ENE and WSW. A small ash cloud was visible in webcam images on 27 September, likely from a collapse at the summit cone. High elevated surface temperatures were observed in satellite imagery during 27-28 September, which were likely the result of hot deposits on the flanks erupted on 25 September. Minor steaming at the summit crater and from an area on the upper flanks was visible in webcam images on 28 September.
During October, explosion events continued between periods of low activity. Seismicity significantly increased starting at around 2100 on 2 October; around the same time satellite images showed an increase in surface temperatures consistent with lava fountaining. Small, hot avalanches of rock and lava descended an unspecified flank. In addition, a distinct increase in infrasound, seismicity, and lightning detections was followed by an ash plume that rose to 12.2 km altitude and drifted S and E at 0520 on 3 October, based on satellite images. Nighttime webcam images showed incandescence due to lava fountaining at the summit and pyroclastic flows descending the NE flank. AVO reported that a notable explosive eruption started at 0547 and lasted until 0900 on 3 October, which prompted a rise in the ACC to Red and the VAL to Warning. Subsequent ash plumes rose to 6-7.6 km altitude by 0931. At 1036 the ACC was lowered back to Orange and the VAL to Watch since both seismic and infrasound data quieted substantially and were slightly above background levels. Gas-and-steam emissions were observed at the summit, based on webcam images. Trace amounts of ashfall were observed in Cold Bay. Resuspended ash was present at several kilometers altitude near the volcano. During the afternoon, low-level ash plumes were visible at the flanks, which appeared to be largely generated by rock avalanches off the summit crater following the explosive activity. These ash plumes rose to 3 km altitude and drifted W. Trace amounts of ashfall were reported by observers in Cold Bay and Unalaska and flights to these communities were disrupted by the ash cloud. Satellite images taken after the eruption showed evidence of pyroclastic flows and lahar deposits in drainages 2 km down the SW flank and about 3.2 km down the NE flank, and continued erosion of the crater rim. Small explosion craters at the end of the pyroclastic flows on the NE flank were noted for the first time, which may have resulted from gas-and-steam explosions when hot deposits interact with underlying ice.
During 4 October seismicity, including frequent small earthquakes, remained elevated, but was gradually declining. Ash plumes were produced for over eight hours until around 1400 that rose to below 3.7 km altitude. These ash plumes were primarily generated off the sides of the volcano where hot rock avalanches from the crater rim had entered drainages to the SW and NE. Two explosion craters were observed at the base of the NE deposits about 3.2 km from the crater rim. Webcam images showed the explosion craters were a source of persistent ash emissions; occasional collapse events also generated ash. Seismicity remained elevated with sulfur dioxide emissions that had a daily average of more than 1,000 tons per day, and frequent small earthquakes through the end of the month. Frequent elevated surface temperatures were identified in satellite images and gas-and-steam plumes were observed in webcam images, although weather conditions occasionally prevented clear views of the summit. Emissions were robust during 14-16 October and were likely generated by the interaction of hot material and snow and ice. During the afternoon of 21 October a strong gas-and-steam plume rose to 3-4.6 km altitude and extended 40 km WSW, based on satellite images and reports from pilots. On 31 October the ACC was lowered to Yellow and the VAL was lowered to Advisory.
Activity in November was characterized by elevated seismicity with ongoing seismic tremor and small, low-frequency earthquakes, elevated surface temperatures, and gas-and-steam emissions. There was an increase in seismic and infrasound tremor amplitudes starting at 1940 on 2 November. As a result, the ACC was again raised to Orange and the VAL was increased to Watch, although ash was not identified in satellite data. An ash cloud rose to 6.1 km altitude and drifted W according to satellite data at 2000. By 0831 on 3 November ash emissions were no longer visible in satellite images. On 6 and 9 November air pressure sensors detected signals consistent with small explosions. Small explosions were detected in infrasound data consistent with weak Strombolian activity on 19 and 21 November. Seismicity started to decrease on 21 November. On 25 November gas-and-steam emissions were emitted from the vent as well as from a scarp on the NE side of the volcano near the summit. A gas-and-steam plume extended about 50 km SSE and was observed in satellite and webcam images on 26 November. On 28 November small explosions were observed in seismic and local infrasound data and gas-and-steam emissions were visible from the summit and from the upper NE collapse scarp based on webcam images. Possible small explosions were observed in infrasound data on 30 November. Weakly elevated surface temperatures and a persistent gas-and-steam plume from the summit and collapse scarps on the upper flanks. A passing aircraft reported the gas-and-steam plume rose to 3-3.4 km altitude on 30 November, but no significant ash emissions were detected.
Satellite data. MODIS thermal anomaly data provided through MIROVA (Middle InfraRed Observation of Volcanic Activity) showed a strong pulse of thermal activity beginning in July 2023 that continued through November 2023 (figure 48). This strong activity was due to Strombolian explosions and lava fountaining events at the summit crater. According to data from MODVOLC thermal alerts, a total of 101 hotspots were detected near the summit crater in July (11-14, 16-19, 23-24 and 26), August (4, 25-26, and 29), September (5, 12, and 17), and October (3, 4, and 8). Infrared satellite data showed large lava flows descending primarily the northern and SE flanks during the reporting period (figure 49). Sulfur dioxide plumes often exceeded two Dobson Units (DUs) and drifted in different directions throughout the reporting period, based on satellite data from the TROPOMI instrument on the Sentinel-5P satellite (figure 50).
Geologic Background. The symmetrical glacier-covered Shishaldin in the Aleutian Islands is the westernmost of three large stratovolcanoes in the eastern half of Unimak Island. The Aleuts named the volcano Sisquk, meaning "mountain which points the way when I am lost." Constructed atop an older glacially dissected edifice, it is largely basaltic in composition. Remnants of an older edifice are exposed on the W and NE sides at 1,500-1,800 m elevation. There are over two dozen pyroclastic cones on its NW flank, which is covered by massive aa lava flows. Frequent explosive activity, primarily consisting of Strombolian ash eruptions from the small summit crater, but sometimes producing lava flows, has been recorded since the 18th century. A steam plume often rises from the summit crater.
Information Contacts: Alaska Volcano Observatory (AVO), a cooperative program of a) U.S. Geological Survey, 4200 University Drive, Anchorage, AK 99508-4667 USA (URL: https://avo.alaska.edu/), b) Geophysical Institute, University of Alaska, PO Box 757320, Fairbanks, AK 99775-7320, USA, and c) Alaska Division of Geological & Geophysical Surveys, 794 University Ave., Suite 200, Fairbanks, AK 99709, USA (URL: http://dggs.alaska.gov/); MIROVA (Middle InfraRed Observation of Volcanic Activity), a collaborative project between the Universities of Turin and Florence (Italy) supported by the Centre for Volcanic Risk of the Italian Civil Protection Department (URL: http://www.mirovaweb.it/); Hawai'i Institute of Geophysics and Planetology (HIGP) - MODVOLC Thermal Alerts System, School of Ocean and Earth Science and Technology (SOEST), Univ. of Hawai'i, 2525 Correa Road, Honolulu, HI 96822, USA (URL: http://modis.higp.hawaii.edu/); NASA Global Sulfur Dioxide Monitoring Page, Atmospheric Chemistry and Dynamics Laboratory, NASA Goddard Space Flight Center (NASA/GSFC), 8800 Greenbelt Road, Goddard, Maryland, USA (URL: https://so2.gsfc.nasa.gov/); Copernicus Browser, Copernicus Data Space Ecosystem, European Space Agency (URL: https://dataspace.copernicus.eu/browser/).
Ioto
Japan
24.751°N, 141.289°E; summit elev. 169 m
All times are local (unless otherwise noted)
New eruption with discolored water, ejecta, and floating pumice during October-December 2023
Ioto (Iwo-jima), located about 1,200 km S of Tokyo, lies within a 9-km-wide submarine caldera along the Izu-Bonin-Mariana volcanic arc. Previous eruptions date back to 1889 and have consisted of dominantly phreatic explosions, pumice deposits during 2001, and discolored water. A submarine eruption during July through December 2022 was characterized by discolored water, pumice deposits, and gas emissions (BGVN 48:01). This report covers a new eruption during October through December 2023, which consisted of explosions, black ejecta, discolored water, and floating pumice, based on information from the Japan Meteorological Association (JMA), the Japan Coast Guard (JCG), and satellite data.
JMA reported that an eruption had been occurring offshore of Okinahama on the SE side of the island since 21 October, which was characterized by volcanic tremor, according to the Japan Maritime Self-Defense Force (JMSDF) Iwo Jima Air Base (figure 22). According to an 18 October satellite image a plume of discolored water at the site of this new eruption extended NE (figure 23). During an overflight conducted on 30 October, a vent was identified about 1 km off the coast of Okinahama. Observers recorded explosions every few minutes that ejected dark material about 20 m above the ocean and as high as 150 m. Ejecta from the vent formed a black-colored island about 100 m in diameter, according to observations conducted from the air by the Earthquake Research Institute of the University of Tokyo in cooperation with the Mainichi newspaper (figure 24). Occasionally, large boulders measuring more than several meters in size were also ejected. Observations from the Advanced Land Observing Satellite Daichi-2 and Sentinel-2 satellite images also confirmed the formation of this island (figure 23). Brown discolored water and floating pumice were present surrounding the island.
The eruption continued during November. During an overflight on 3 November observers photographed the island and noted that material was ejected 169 m high, according to a news source. Explosions gradually became shorter, and, by the 3rd, they occurred every few seconds; dark and incandescent material were ejected about 800 m above the vent. On 4 November eruptions were accompanied by explosive sounds. Floating, brown-colored pumice was present in the water surrounding the island. There was a brief increase in the number of volcanic earthquakes during 8-14 November and 24-25 November. The eruption temporarily paused during 9-11 November and by 12 November eruptions resumed to the W of the island. On 10 November dark brown-to-dark yellow-green discolored water and a small amount of black floating material was observed (figure 25). A small eruption was reported on 18 November off the NE coast of the island, accompanied by white gas-and-steam plumes (figure 23). Another pause was recorded during 17-19 November, which then resumed on 20 November and continued erupting intermittently. According to a field survey conducted by the National Institute for Disaster Prevention Science and Technology on 19 November, a 30-m diameter crater was visible on the NE coast where landslides, hot water, and gray volcanic ash containing clay have occurred and been distributed previously. Erupted blocks about 10 cm in diameter were distributed about 90-120 m from the crater. JCG made observations during an overflight on 23 November and reported a phreatomagmatic eruption. Explosions at the main vent generated dark gas-and-ash plumes that rose to 200 m altitude and ejected large blocks that landed on the island and in the ocean (figure 26). Discolored water also surrounded the island. The size of the new island had grown to 450 m N-S x 200 m E-W by 23 November, according to JCG.
The eruption continued through 11 December, followed by a brief pause in activity, which then resumed on 31 December, according to JMA. Intermittent explosions produced 100-m-high black plumes at intervals of several minutes to 30 minutes during 1-10 December. Overflights were conducted on 4 and 15 December and reported that the water surrounding the new island was discolored to dark brown-to-dark yellow-green (figure 27). No floating material was reported during this time. In comparison to the observations made on 23 November, the new land had extended N and part of it had eroded away. In addition, analysis by the Geospatial Information Authority of Japan using SAR data from Daichi-2 also confirmed that the area of the new island continued to decrease between 4 and 15 December. Ejected material combined with wave erosion transformed the island into a “J” shape, 500-m-long and with the curved part about 200 m offshore of Ioto. The island was covered with brown ash and blocks, and the surrounding water was discolored to greenish-brown and contained an area of floating pumice. JCG reported from an overflight on 4 December that volcanic ash-like material found around the S vent on the NE part of the island was newly deposited since 10 November (figure 28). By 15 December the N part of the “J” shaped island had separated and migrated N, connecting to the Okinahama coast and the curved part of the “J” had eroded into two smaller islands (figure 27).
References. Ukawa, M., Fujita, E., Kobayashi, T., 2002, Recent volcanic activity of Iwo Jima and the 2001 eruption, Monthly Chikyu, Extra No. 39, 157-164.
Geologic Background. Ioto, in the Volcano Islands of Japan, lies within a 9-km-wide submarine caldera. The volcano is also known as Ogasawara-Iojima to distinguish it from several other "Sulfur Island" volcanoes in Japan. The triangular, low-elevation, 8-km-long island narrows toward its SW tip and has produced trachyandesitic and trachytic rocks that are more alkalic than those of other volcanoes in this arc. The island has undergone uplift for at least the past 700 years, accompanying resurgent doming of the caldera; a shoreline landed upon by Captain Cook's surveying crew in 1779 is now 40 m above sea level. The Motoyama plateau on the NE half of the island consists of submarine tuffs overlain by coral deposits and forms the island's high point. Many fumaroles are oriented along a NE-SW zone cutting through Motoyama. Numerous recorded phreatic eruptions, many from vents on the W and NW sides of the island, have accompanied the uplift.
Information Contacts: Japan Meteorological Agency (JMA), 1-3-4 Otemachi, Chiyoda-ku, Tokyo 100-8122, Japan (URL: http://www.jma.go.jp/jma/indexe.html); Japan Coast Guard (JCG) Volcano Database, Hydrographic and Oceanographic Department, 3-1-1, Kasumigaseki, Chiyoda-ku, Tokyo 100-8932, Japan (URL: https://www1.kaiho.mlit.go.jp/GIJUTSUKOKUSAI/kaiikiDB/kaiyo22-2.htm); Copernicus Browser, Copernicus Data Space Ecosystem, European Space Agency (URL: https://dataspace.copernicus.eu/browser/); Asahi, 5-3-2, Tsukiji, Chuo Ward, Tokyo, 104-8011, Japan (URL: https://www.asahi.com/ajw/articles/15048458).
Purace (Colombia) — December 2023 Cite this Report
Purace
Colombia
2.3095°N, 76.3948°W; summit elev. 4650 m
All times are local (unless otherwise noted)
Gas-and-ash emission on 16 November 2023
Puracé, located in Colombia, is a stratovolcano that contains a 500-m-wide summit crater. It is part of the Los Coconucos volcanic chain that is a NW-SE trending group of seven cones and craters. The most recent eruption occurred during March 2022 that was characterized by frequent seismicity and gas-and-steam emissions (BGVN 47:06). This report covers a brief eruption during November 2023 based on monthly reports from the Popayán Observatory, part of the Servicio Geologico Colombiano (SGC).
Activity during November 2022 through November 2023 primarily consisted of seismicity: VT-type events, LP-type events, HB-type events, and TR-type events (table 4). Maximum sulfur dioxide values were measured weekly and ranged from 259-5,854 tons per day (t/d) during November 2022 through April 2023. White gas-and-steam emissions were also occasionally reported.
SGC issued a report on 25 October that noted a significant increase in the number of earthquakes associated with rock fracturing. These earthquakes were located SE of the crater between Puracé and Piocollo at depths of 1-4 km. There were no reported variations in sulfur dioxide values, but SGC noted high carbon dioxide values, compared to those recorded in the first half of 2023.
SGC reported that at 1929 on 16 November the seismic network detected a signal that was possibly associated with a gas-and-ash emission, though it was not confirmed in webcam images due to limited visibility. On 17 November an observer confirmed ash deposits on the N flank. Webcam images showed an increase in degassing both inside the crater and from the NW flank, rising 700 m above the crater.
Table 4. Seismicity at Puracé during November 2022-November 2023. Volcano-tectonic (VT), long-period (LP), hybrid (HB), and tremor (TR) events are reported each month. Courtesy of SGC.
| Month |
Volcano-tectonic |
Long-period |
Hybrid |
Tremor |
| Nov 2022 |
429 |
2,023 |
5 |
831 |
| Dec 2022 |
423 |
1,390 |
9 |
834 |
| Jan 2023 |
719 |
1,622 |
0 |
957 |
| Feb 2023 |
598 |
1,701 |
2 |
1,124 |
| Mar 2023 |
331 |
2,408 |
147 |
607 |
| Apr 2023 |
614 |
4,427 |
33 |
148 |
| May 2023 |
620 |
3,717 |
170 |
109 |
| Jun 2023 |
467 |
3,293 |
86 |
148 |
| Jul 2023 |
1,116 |
5,809 |
183 |
542 |
| Aug 2023 |
692 |
2,927 |
94 |
321 |
| Sep 2023 |
887 |
1,505 |
82 |
848 |
| Oct 2023 |
2,373 |
2,949 |
135 |
692 |
| Nov 2023 |
1,212 |
2,302 |
69 |
293 |
Geologic Background. Puracé is an active andesitic volcano with a 600-m-diameter summit crater at the NW end of the Los Coconucos Volcanic Chain. This volcanic complex includes nine composite and five monogenetic volcanoes, extending from the Puracé crater more than 6 km SE to the summit of Pan de Azúcar stratovolcano. The dacitic massif which the complex is built on extends about 13 km NW-SE and 10 km NE-SW. Frequent small to moderate explosive eruptions reported since 1816 CE have modified the morphology of the summit crater, with the largest eruptions in 1849, 1869, and 1885.
Information Contacts: Servicio Geologico Colombiano (SGC), Diagonal 53 No. 34-53 - Bogotá D.C., Colombia (URL: https://www.sgc.gov.co/volcanes).
Etna
Italy
37.748°N, 14.999°E; summit elev. 3357 m
All times are local (unless otherwise noted)
Strombolian explosions, lava fountains, and lava flows during July-August 2023
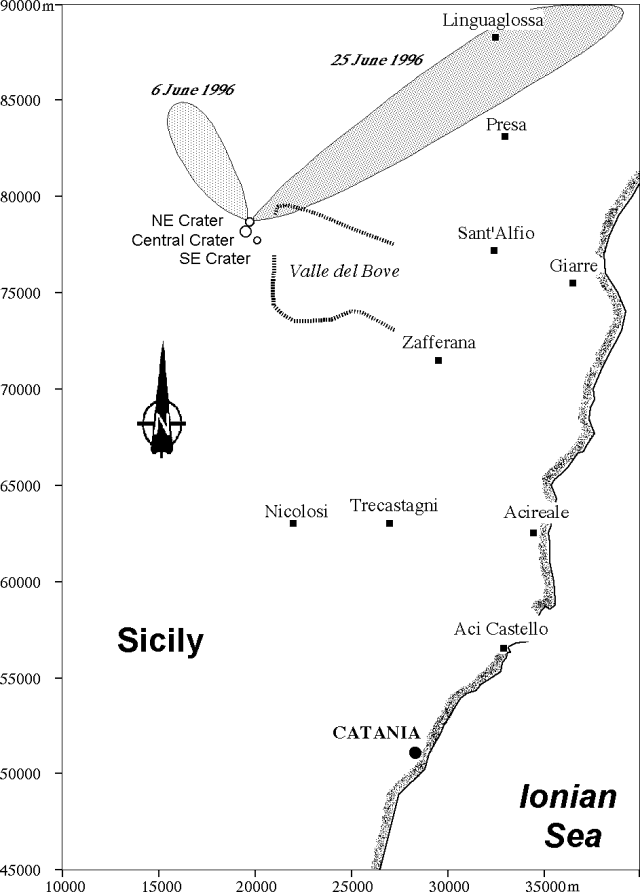
Etna, located on the Italian island of Sicily, has had documented eruptions dating back to 1500 BCE. Activity typically originates from multiple cones at the summit, where several craters have formed and evolved. The currently active craters are Northeast Crater (NEC), Voragine (VOR), and Bocca Nuova (BN), and the Southeast Crater (SEC); VOR and BN were previously referred to as the “Central Crater”. The original Southeast crater formed in 1978, and a second eruptive site that opened on its SE flank in 2011 was named the New Southeast Crater (NSEC). Another eruptive site between the SEC and NSEC developed during early 2017 and was referred to as the "cono della sella" (saddle cone). The current eruption period began in November 2022 and has been characterized by intermittent Strombolian activity, lava flows, and ash plumes (BGVN 48:08). This report updates activity during July through October 2023, which includes primarily gas-and-steam emissions; during July and August Strombolian explosions, lava fountains, and lava flows were reported, based on weekly and special reports by the Osservatorio Etneo (OE), part of the Catania Branch of Italy's Istituo Nazionale di Geofisica e Vulcanologica (INGV) and satellite data.
Variable fumarolic degassing was reported at all summit craters (BN, VOR, NEC, and SEC) throughout the entire reporting period (table 15). The MIROVA (Middle InfraRed Observation of Volcanic Activity) volcano hotspot detection system based on the analysis of MODIS data showed frequent low-to-moderate power thermal anomalies during the reporting period (figure 399). During mid-August there was a pulse in activity that showed an increase in the power of the anomalies due to Strombolian activity, lava fountains, and lava flows. Infrared satellite imagery captured strong thermal anomalies at the central and southeast summit crater areas (figure 400). Accompanying thermal activity were occasional sulfur dioxide plumes that exceeded 2 Dobson Units (DUs) recorded by the TROPOMI instrument on the Sentinel-5P satellite (figure 401).
Table 15. Summary of activity at the four primary crater areas at the summit of Etna during July-October 2023. Information is from INGV weekly reports.
| Month |
Bocca Nuova (BN) |
Voragine (VOR) |
Northeast Crater (NEC) |
Southeast Crater (SEC) |
| Jul 2023 |
Continuous degassing. |
No observations. |
Weak gas emissions. |
Continuous degassing. Sporadic and weak-to-moderate ash emissions. Strombolian explosions. |
| Aug 2023 |
Continuous degassing. |
No observations. |
No observations. |
Continuous degassing. Occasional ash emissions. Strombolian activity, lava fountaining, and lava flows. |
| Sep 2023 |
Variable degassing. Crater incandescence. |
Weak fumarolic activity. |
Weak fumarolic activity. |
Variable degassing. |
| Oct 2023 |
Continuous degassing. |
Weak fumarolic activity. |
Weak fumarolic activity. |
Continuous degassing. |
Activity during July and August was relatively low and mainly consisted of degassing at the summit craters, particularly at SEC and BN. Cloudy weather prevented clear views of the summit during early July. During the night of 2 July some crater incandescence was visible at SEC. Explosive activity resumed at SEC during 9-10 July, which was characterized by sporadic and weak ash emissions that rapidly dispersed in the summit area (figure 402). INGV reported moderate Strombolian activity began at 2034 on 14 July and was confined to the inside of the crater and fed by a vent located in the E part of SEC. An ash emission was detected at 2037. A new vent opened on 15 July in the SE part of BN and began to produce continuous gas-and-steam emissions. During an inspection carried out on 28 July pulsating degassing, along with audible booms, were reported at two active vents in BN. Vigorous gas-and-steam emissions intermittently generated rings. On rare occasions, fine, reddish ash was emitted from BN1 and resuspended by the gas-and-steam emissions.
Around 2000 on 13 August INGV reported a sudden increase in volcanic tremor amplitude. Significant infrasonic activity coincided with the tremor increase. Incandescent flashes were visible through the cloud cover in webcam images of SEC (figure 403). Strombolian activity at SEC began to gradually intensify starting at 2040 as seismicity continued to increase. The Aviation Color Code (ACC) was raised to Yellow (the second lowest-level on a four-color scale) at 2126 and then to Orange (the second highest-level on a four-color scale) at 2129 due to above-background activity. The activity rapidly transitioned from Strombolian activity to lava fountains around 2333 that rose 300-400 m above the crater (figure 403). Activity was initially focused on the E vent of the crater, but then the vent located above the S flank of the cone also became active. A lava flow from this vent traveled SW into the drainage created on 10 February 2022, overlapping with previous flows from 10 and 21 February 2022 and 21 May 2023, moving between Monte Barbagallo and Monte Frumento Supino (figure 404). The lava flow was 350 m long, oriented NNE-SSW, and descended to an elevation of 2.8 km. Flows covered an area of 300,000 m2 and had an estimated volume of 900,000 m3. The ACC was raised to Red at 2241 based on strong explosive activity and ashfall in Rifugio Sapienza-Piano Vetore at 1.7 km elevation on the S flank. INGV reported that pyroclastic flows accompanied this activity.
Activity peaked between 0240 and 0330 on 14 August, when roughly 5-6 vents erupted lava fountains from the E to SW flank of SEC. The easternmost vents produced lava fountains that ejected material strongly to the E, which caused heavy fallout of incandescent pyroclastic material on the underlying flank, triggering small pyroclastic flows. This event was also accompanied by lightning both in the ash column and in the ash clouds that were generated by the pyroclastic flows. A fracture characterized by a series of collapse craters (pit craters) opened on the upper SW flank of SEC. An ash cloud rose a few kilometers above the crater and drifted S, causing ash and lapilli falls in Rifugio Sapienza and expanding toward Nicolosi, Mascalucia, Catania, and up to Syracuse. Ashfall resulted in operational problems at the Catania airport (50 km S), which lasted from 0238 until 2000. By 0420 the volcanic tremor amplitude values declined to background levels. After 0500 activity sharply decreased, although the ash cloud remained for several hours and drifted S. By late morning, activity had completely stopped. The ACC was lowered to Orange as volcanic ash was confined to the summit area. Sporadic, minor ash emissions continued throughout the day. At 1415 the ACC was lowered to Yellow and then to Green at 1417.
During the night of 14-15 August only occasional flashes were observed, which were more intense during avalanches of material inside the eruptive vents. Small explosions were detected at SEC at 2346 on 14 August and at 0900 on 26 August that each produced ash clouds which rapidly dispersed into the atmosphere (figure 405). According to a webcam image, an explosive event detected at 2344 at SEC generated a modest ash cloud that was rapidly dispersed by winds. The ACC was raised to Yellow at 2355 on 14 August due to increasing unrest and was lowered to Green at 0954 on 15 August.
Activity during September and October was relatively low and mainly characterized by variable degassing from BN and SEC. Intense, continuous, and pulsating degassing was accompanied by roaring sounds and flashes of incandescence at BN both from BN1 and the new pit crater that formed during late July (figure 406). The degassing from the new pit crater sometimes emitted vapor rings. Cloudy weather during 6-8 September prevented observations of the summit craters .
Geologic Background. Mount Etna, towering above Catania on the island of Sicily, has one of the world's longest documented records of volcanism, dating back to 1500 BCE. Historical lava flows of basaltic composition cover much of the surface of this massive volcano, whose edifice is the highest and most voluminous in Italy. The Mongibello stratovolcano, truncated by several small calderas, was constructed during the late Pleistocene and Holocene over an older shield volcano. The most prominent morphological feature of Etna is the Valle del Bove, a 5 x 10 km caldera open to the east. Two styles of eruptive activity typically occur, sometimes simultaneously. Persistent explosive eruptions, sometimes with minor lava emissions, take place from one or more summit craters. Flank vents, typically with higher effusion rates, are less frequently active and originate from fissures that open progressively downward from near the summit (usually accompanied by Strombolian eruptions at the upper end). Cinder cones are commonly constructed over the vents of lower-flank lava flows. Lava flows extend to the foot of the volcano on all sides and have reached the sea over a broad area on the SE flank.
Information Contacts: Sezione di Catania - Osservatorio Etneo, Istituto Nazionale di Geofisica e Vulcanologia (INGV), Sezione di Catania, Piazza Roma 2, 95123 Catania, Italy (URL: http://www.ct.ingv.it/it/); MIROVA (Middle InfraRed Observation of Volcanic Activity), a collaborative project between the Universities of Turin and Florence (Italy) supported by the Centre for Volcanic Risk of the Italian Civil Protection Department (URL: http://www.mirovaweb.it/); NASA Global Sulfur Dioxide Monitoring Page, Atmospheric Chemistry and Dynamics Laboratory, NASA Goddard Space Flight Center (NASA/GSFC), 8800 Greenbelt Road, Goddard MD 20771, USA (URL: https://so2.gsfc.nasa.gov/); Copernicus Browser, Copernicus Data Space Ecosystem, European Space Agency (URL: https://dataspace.copernicus.eu/browser/).
Suwanosejima (Japan) — December 2023 Cite this Report
Suwanosejima
Japan
29.638°N, 129.714°E; summit elev. 796 m
All times are local (unless otherwise noted)
Eruption plumes, crater incandescence, and occasional explosions during July-October 2023
Suwanosejima is an 8-km-long island that consists of a stratovolcano and two active summit craters, located in the northern Ryukyu Islands, Japan. Volcanism over the past century has been characterized by Strombolian explosions, ash plumes, and ashfall. The current eruption began in October 2004 and has more recently consisted of frequent eruption plumes, explosions, and incandescent ejecta (BGVN 48:07). This report covers similar activity of ash plumes, explosions, and crater incandescence during July through October 2023 using monthly reports from the Japan Meteorological Agency (JMA) and satellite data.
Thermal activity during the reporting period was relatively low; only one low-power thermal anomaly was detected during mid-July and one during early August, based on a MIROVA (Middle InfraRed Observation of Volcanic Activity) Log Radiative Power graph of the MODIS thermal anomaly data. On two clear weather days, a thermal anomaly was visible in infrared satellite images (figure 81).
Low-level activity was reported at the Otake crater during July and no explosions were detected. Eruption plumes rose as high as 1.8 km above the crater. On 13 July an ash plume rose 1.7 km above the crater rim, based on a webcam image. During the night of the 28th crater incandescence was visible in a webcam image. An eruptive event reported on 31 July produced an eruption plume that rose 2.1 km above the crater. Seismicity consisted of 11 volcanic earthquakes on the W flank, the number of which had decreased compared to June (28) and 68 volcanic earthquakes near the Otake crater, which had decreased from 722 in the previous month. According to observations conducted by the University of Tokyo Graduate School of Science, Kyoto University Disaster Prevention Research Institute, Toshima Village, and JMA, the amount of sulfur dioxide emissions released during the month was 400-800 tons per day (t/d).
Eruptive activity in the Otake crater continued during August and no explosions were reported. An eruptive event produced a plume that rose 1 km above the crater at 1447 on 12 August. Subsequent eruptive events were recorded at 0911 on 16 August, at 1303 on 20 August, and at 0317 on 21 August, which produced ash plumes that rose 1-1.1 km above the crater and drifted SE, SW, and W. On 22 August an ash plume was captured in a webcam image rising 1.4 km above the crater (figure 82). Multiple eruptive events were detected on 25 August at 0544, 0742, 0824, 1424, and 1704, which generated ash plumes that rose 1.1-1.2 km above the crater and drifted NE, W, and SW. On 28 August a small amount of ashfall was observed as far as 1.5 km from the crater. There were 17 volcanic earthquakes recorded on the W flank of the volcano and 79 recorded at the Otake crater during the month. The amount of sulfur dioxide emissions released during the month was 400-800 t/d.
Activity continued at the Otake crater during September. Occasionally, nighttime crater incandescence was observed in webcam images and ashfall was reported. An eruptive event at 1949 on 4 September produced an ash plume that rose 1 km above the crater and drifted SW. On 9 September several eruption events were detected at 0221, 0301, and 0333, which produced ash plumes that rose 1.1-1.4 km above the crater rim and drifted W; continuous ash emissions during 0404-0740 rose to a maximum height of 2 km above the crater rim (figure 83). More eruptive events were reported at 1437 on 10 September, at 0319 on 11 September, and at 0511 and 1228 on 15 September, which generated ash plumes that rose 1-1.8 km above the crater. During 25, 27, and 30 September, ash plumes rose as high as 1.3 km above the crater rim. JMA reported that large blocks were ejected as far as 300 m from the center of the crater. There were 18 volcanic earthquakes detected beneath the W flank and 82 volcanic earthquakes detected near the Otake crater. The amount of sulfur dioxide released during the month ranged from 600 to 1,600 t/d.
Activity during early-to-mid-October consisted of occasional explosions, a total number of 13, and ash plumes that rose as high as 1.9 km above the Otake crater rim on 29 October (figure 84). These explosions are the first to have occurred since June 2023. Continuous ash emissions were reported during 0510-0555 on 1 October. Explosions were recorded at 0304, 2141, and 2359 on 2 October, at 0112 on 3 October, and at 1326 on 6 October, which produced ash plumes that rose as high as 1 km above the crater rim and drifted SW and W. An explosion was noted at 0428 on 3 October, but emission details were unknown. A total of eight explosions were recorded by the seismic network at 1522 on 14 October, at 0337, 0433, 0555, 1008, and 1539 on 15 October, and at 0454 and 0517 on 16 October. Ash plumes from these explosions rose as high as 900 m above the crater and drifted SE. Eruptive events during 25-27 and 29-30 October generated plumes that rose as high as 1.9 km above the crater and drifted SE, S, and SW. Ash was deposited in Toshima village (3.5 km SSW). Eruptive activity occasionally ejected large volcanic blocks as far as 600 m from the crater. Nighttime crater incandescence was visible in webcams. Intermittent ashfall was reported as far as 1.5 km from the crater. There were 43 volcanic earthquakes detected on the W flank during the month, and 184 volcanic earthquakes detected near the Otake crater. The amount of sulfur dioxide emitted ranged between 400 and 900 t/d.
Geologic Background. The 8-km-long island of Suwanosejima in the northern Ryukyu Islands consists of an andesitic stratovolcano with two active summit craters. The summit is truncated by a large breached crater extending to the sea on the E flank that was formed by edifice collapse. One of Japan's most frequently active volcanoes, it was in a state of intermittent Strombolian activity from Otake, the NE summit crater, between 1949 and 1996, after which periods of inactivity lengthened. The largest recorded eruption took place in 1813-14, when thick scoria deposits covered residential areas, and the SW crater produced two lava flows that reached the western coast. At the end of the eruption the summit of Otake collapsed, forming a large debris avalanche and creating an open collapse scarp extending to the eastern coast. The island remained uninhabited for about 70 years after the 1813-1814 eruption. Lava flows reached the eastern coast of the island in 1884. Only about 50 people live on the island.
Information Contacts: Japan Meteorological Agency (JMA), 1-3-4 Otemachi, Chiyoda-ku, Tokyo 100-8122, Japan (URL: http://www.jma.go.jp/jma/indexe.html); MIROVA (Middle InfraRed Observation of Volcanic Activity), a collaborative project between the Universities of Turin and Florence (Italy) supported by the Centre for Volcanic Risk of the Italian Civil Protection Department (URL: http://www.mirovaweb.it/); Hawai'i Institute of Geophysics and Planetology (HIGP) - MODVOLC Thermal Alerts System, School of Ocean and Earth Science and Technology (SOEST), Univ. of Hawai'i, 2525 Correa Road, Honolulu, HI 96822, USA (URL: http://modis.higp.hawaii.edu/); Copernicus Browser, Copernicus Data Space Ecosystem, European Space Agency (URL: https://dataspace.copernicus.eu/browser/).
Aira
Japan
31.5772°N, 130.6589°E; summit elev. 1117 m
All times are local (unless otherwise noted)
Explosions, ash plumes, ash fall, and crater incandescence during July-October 2023
Aira caldera, located in the northern half of Kagoshima Bay, Japan, contains the post-caldera Sakurajima volcano. Eruptions typically originate from the Minamidake crater, and since the 8th century, ash deposits have been recorded in the city of Kagoshima (10 km W), one of Kyushu’s largest cities. The Minamidake summit cone and crater has had persistent activity since 1955; the Showa crater on the E flank has also been intermittently active since 2006. The current eruption period began during March 2017 and has recently been characterized by intermittent explosions, eruption plumes, and ashfall (BGVN 48:07). This report updates activity during July through October 2023 and describes explosive events, ash plumes, nighttime crater incandescence, and ashfall, according to monthly activity reports from the Japan Meteorological Agency (JMA) and satellite data.
Thermal activity remained at low levels during this reporting period, according to the MIROVA (Middle InfraRed Observation of Volcanic Activity) system (figure 149). There was a slight increase in the number of anomalies during September through October. Occasional thermal anomalies were visible in infrared satellite images mainly at the Minamidake crater (Vent A is located to the left and Vent B is located to the right) (figure 150).
Table 30. Number of monthly explosive events, days of ashfall, area of ash covered, and sulfur dioxide emissions from Sakurajima’s Minamidake crater at Aira during July-October 2023. Note that smaller ash events are not listed. Ashfall days were measured at Kagoshima Local Meteorological Observatory and ashfall amounts represent material covering all the Kagoshima Prefecture. Data courtesy of JMA monthly reports.
| Month |
Explosive events |
Days of ashfall |
Ashfall amount (g/m2) |
SO2 emissions (tons/day) |
| Jul 2023 |
3 |
0 |
0 |
1,600-3,200 |
| Aug 2023 |
3 |
10 |
7 |
1,800-3,300 |
| Sep 2023 |
3 |
7 |
3 |
1,600-2,300 |
| Oct 2023 |
33 |
8 |
61 |
2,200-4,200 |
JMA reported that during July, there were eight eruptions, three of which were explosion events in the Showa crater. Large blocks were ejected as far as 600 m from the Showa crater. Very small eruptions were occasionally reported at the Minamidake crater. Nighttime incandescence was observed in both the Showa and Minamidake crater. Explosions were reported on 16 July at 2314 and on 17 July at 1224 and at 1232 (figure 151). Resulting eruption plumes rose 700-2,500 m above the crater and drifted N. On 23 July the number of volcanic earthquakes on the SW flank of the volcano increased. A strong Mw 3.1 volcanic earthquake was detected at 1054 on 26 July. The number of earthquakes recorded throughout the month was 545, which markedly increased from 73 in June. No ashfall was observed at the Kagoshima Regional Meteorological Observatory during July. According to a field survey conducted during the month, the daily amount of sulfur dioxide emissions was 1,600-3,200 tons per day (t/d).
There were three eruptions reported at the Minamidake crater during August, each of which were explosive. The explosions occurred on 9 August at 0345, on 13 August at 2205, and on 31 August at 0640, which generated ash plumes that rose 800-2,000 m above the crater and drifted W. There were two eruptions detected at Showa crater; on 4 August at 2150 ejecta traveled 800 m from the Showa crater and associated eruption plumes rose 2.3 km above the crater. The explosion at 2205 on 13 August generated an ash plume that rose 2 km above the crater and was accompanied by large blocks that were ejected 600 m from the Minamidake crater (figure 152). Nighttime crater incandescence was visible in a high-sensitivity surveillance camera at both craters. Seismicity consisted of 163 volcanic earthquakes, 84 of which were detected on the SW flank. According to the Kagoshima Regional Meteorological Observatory there was a total of 7 g/m2 of ashfall over the course of 10 days during the month. According to a field survey, the daily amount of sulfur dioxide emitted was 1,800-3,300 t/d.
During September, four eruptions were reported, three of which were explosion events. These events occurred at 1512 on 9 September, at 0018 on 11 September, and at 2211 on 13 September. Resulting ash plumes generally rose 800-1,100 m above the crater. An explosion produced an ash plume at 2211 on 13 September that rose as high as 1.7 km above the crater. Large volcanic blocks were ejected 600 m from the Minamidake crater. Smaller eruptions were occasionally observed at the Showa crater. Nighttime crater incandescence was visible at the Minamidake crater. Seismicity was characterized by 68 volcanic earthquakes, 28 of which were detected beneath the SW flank. According to the Kagoshima Regional Meteorological Observatory there was a total of 3 g/m2 of ashfall over the course of seven days during the month. A field survey reported that the daily amount of sulfur dioxide emitted was 1,600-2,300 t/d.
Eruptive activity during October consisted of 69 eruptions, 33 of which were described as explosive. These explosions occurred during 4 and 11-21 October and generated ash plumes that rose 500-3,600 m above the crater and drifted S, E, SE, and N. On 19 October at 1648 an explosion generated an ash plume that rose 3.6 km above the crater (figure 153). No eruptions were reported in the Showa crater; white gas-and-steam emissions rose 100 m above the crater from a vent on the N flank. Nighttime incandescence was observed at the Minamidake crater. On 24 October an eruption was reported from 0346 through 0430, which included an ash plume that rose 3.4 km above the crater. Ejected blocks traveled 1.2 km from the Minamidake crater. Following this eruption, small amounts of ashfall were observed from Arimura (4.5 km SE) and a varying amount in Kurokami (4 km E) (figure 154). The number of recorded volcanic earthquakes during the month was 190, of which 14 were located beneath the SW flank. Approximately 61 g/m2 of ashfall was reported over eight days of the month. According to a field survey, the daily amount of sulfur dioxide emitted was 2,200-4,200 t/d.
Geologic Background. The Aira caldera in the northern half of Kagoshima Bay contains the post-caldera Sakurajima volcano, one of Japan's most active. Eruption of the voluminous Ito pyroclastic flow accompanied formation of the 17 x 23 km caldera about 22,000 years ago. The smaller Wakamiko caldera was formed during the early Holocene in the NE corner of the caldera, along with several post-caldera cones. The construction of Sakurajima began about 13,000 years ago on the southern rim and built an island that was joined to the Osumi Peninsula during the major explosive and effusive eruption of 1914. Activity at the Kitadake summit cone ended about 4,850 years ago, after which eruptions took place at Minamidake. Frequent eruptions since the 8th century have deposited ash on the city of Kagoshima, located across Kagoshima Bay only 8 km from the summit. The largest recorded eruption took place during 1471-76.
Information Contacts: Japan Meteorological Agency (JMA), 1-3-4 Otemachi, Chiyoda-ku, Tokyo 100-8122, Japan (URL: http://www.jma.go.jp/jma/indexe.html); MIROVA (Middle InfraRed Observation of Volcanic Activity), a collaborative project between the Universities of Turin and Florence (Italy) supported by the Centre for Volcanic Risk of the Italian Civil Protection Department (URL: http://www.mirovaweb.it/); Copernicus Browser, Copernicus Data Space Ecosystem, European Space Agency (URL: https://dataspace.copernicus.eu/browser/).
Nishinoshima (Japan) — November 2023 Cite this Report
Nishinoshima
Japan
27.247°N, 140.874°E; summit elev. 100 m
All times are local (unless otherwise noted)
Gray emissions during October 2023
Nishinoshima is a small island in the Ogasawara Arc, about 1,000 km S of Tokyo, Japan. It contains prominent submarine peaks to the S, W, and NE. Recorded eruptions date back to 1973, with the current eruption period beginning in October 2022. Eruption plumes and fumarolic activity characterize recent activity (BGVN 48:10). This report covers the end of the eruption for September through October 2023, based on information from monthly reports of the Japan Meteorological Agency (JMA) monthly reports, and satellite data.
No eruptive activity was reported during September 2023, although JMA noted that the surface temperature was slightly elevated compared to the surrounding area since early March 2023. The Japan Coast Guard (JCG) conducted an overflight on 20 September and reported white gas-and-steam plumes rising 3 km above the central crater of the pyroclastic cone, as well as multiple white gas-and-steam emissions emanating from the N, E, and S flanks of the crater to the coastline. In addition, dark reddish brown-to-green discolored water was distributed around almost the entire circumference of the island.
Similar low-level activity was reported during October. Multiple white gas-and-steam emissions rose from the N, E, and S flanks of the central crater of the pyroclastic cone and along the coastline; these emissions were more intense compared to the previous overflight observations. Dark reddish brown-to-green discolored water remained visible around the circumference of the island. On 4 October aerial observations by JCG showed a small eruption consisting of continuous gas-and-steam emissions emanating from the central crater, with gray emissions rising to 1.5 km altitude (figure 129). According to observations from the marine weather observation vessel Keifu Maru on 26 October, white gas-and-steam emissions persisted from the center of the pyroclastic cone, as well as from the NW, SW, and SE coasts of the island for about five minutes. Slightly discolored water was visible up to about 1 km.
Frequent low-to-moderate power thermal anomalies were recorded in the MIROVA graph (Middle InfraRed Observation of Volcanic Activity) during September (figure 130). Occasional anomalies were detected during October, and fewer during November through December. A thermal anomaly was visible in the crater using infrared satellite imagery on 6, 8, 11, 16, 18, 21, and 23 September and 8, 13, 21, 26, and 28 October (figure 131).
Geologic Background. The small island of Nishinoshima was enlarged when several new islands coalesced during an eruption in 1973-74. Multiple eruptions that began in 2013 completely covered the previous exposed surface and continued to enlarge the island. The island is the summit of a massive submarine volcano that has prominent peaks to the S, W, and NE. The summit of the southern cone rises to within 214 m of the ocean surface 9 km SSE.
Information Contacts: Japan Meteorological Agency (JMA), 1-3-4 Otemachi, Chiyoda-ku, Tokyo 100-8122, Japan (URL: http://www.jma.go.jp/jma/indexe.html); MIROVA (Middle InfraRed Observation of Volcanic Activity), a collaborative project between the Universities of Turin and Florence (Italy) supported by the Centre for Volcanic Risk of the Italian Civil Protection Department (URL: http://www.mirovaweb.it/); Copernicus Browser, Copernicus Data Space Ecosystem, European Space Agency (URL: https://dataspace.copernicus.eu/browser/).
Kilauea (United States) — October 2023 Cite this Report
Kilauea
United States
19.421°N, 155.287°W; summit elev. 1222 m
All times are local (unless otherwise noted)
Strong lava fountains, lava flows, and spatter at Halema’uma’u during January-September 2023
Kīlauea is on the island of Hawai’i and overlaps the E flank of the Mauna Loa volcano. Its East Rift Zone (ERZ) has been intermittently active for at least 2,000 years. An extended eruption period began in January 1983 and was characterized by open lava lakes and lava flows from the summit caldera and the East Rift Zone. During May 2018 magma migrated into the Lower East Rift Zone (LERZ) and opened 24 fissures along a 6-km-long NE-trending fracture zone that produced lava flows traveling in multiple directions. As lava emerged from the fissures, the lava lake at Halema'uma'u drained and explosions sent ash plumes to several kilometers altitude (BGVN 43:10).
The current eruption period started during September 2021 and has been characterized by low-level lava effusions in the active Halema’uma’u lava lake (BGVN 48:01). This report covers three notable eruption periods during February, June, and September 2023 consisting of lava fountaining, lava flows, and spatter during January through September 2023 using information from daily reports, volcanic activity notices, and abundant photo, map, and video data from the US Geological Survey's (USGS) Hawaiian Volcano Observatory (HVO).
Activity during January 2023. Small earthquake swarms were recorded on 2 January 2023; increased seismicity and changes in the pattern of deformation were noted on the morning of 5 January. At around 1500 both the rate of deformation and seismicity drastically increased, which suggested magma movement toward the surface. HVO raised the Volcano Alert Level (VAL) to Watch (the second highest level on a four-level scale) and the Aviation Color Code (ACC) to Orange (the second highest color on a four-color scale) at 1520.
Multiple lava fountains and lava effusions from vents in the central eastern portion of the Halema’uma’u crater began on 5 January around 0434; activity was confined to the eastern half of the crater and within the basin of the western half of the crater, which was the focus of the eruption in 2021-2022 (figure 525). Incandescence was visible in webcam images at 1634 on 5 January, prompting HVO to raise the VAL to Warning (the highest level on a four-level scale) and the ACC to Red (the highest color on a four-color scale). Lava fountains initially rose as high as 50 m above the vent at the onset of the eruption (figure 526) but then declined to a more consistent 5-6 m height in the proceeding days. By 1930 that same day, lava had covered most of the crater floor (an area of about 1,200,000 m2) and the lava lake had a depth of 10 m. A higher-elevation island that formed during the initial phase of the December 2020 eruption remained exposed, appearing darker in images, along with a ring of older lava around the lava lake that was active prior to December 2022. Overnight during 5-6 January the lava fountains continued to rise 5 m high, and the lava effusion rate had slowed.
On 6 January at 0815 HVO lowered the VAL to Watch and the ACC to Orange due to the declining effusion rates. Sulfur dioxide emission rates ranged from 3,000-12,500 tonnes per day (t/d), the highest value of which was recorded on 6 January. Lava continued to erupt from the vents during 6-8 January, although the footprint of the active area had shrunk; a similar progression has been commonly observed during the early stages of recent eruptions at Halema’uma’u. On 9 January HVO reported one dominant lava fountain rising 6-7 m high in the E half of the crater. Lava flows built up the margins of the lake, causing the lake to be perched. On 10 January the eastern lava lake had an area of approximately 120,000 m2 that increased to 250,000 m2 by 17 January. During 13-31 January several small overflows occurred along the margins of the E lake. A smaller area of lava was active within the basin in the W half of the crater that had been the focus of activity during 2021-2022. On 19 January just after 0200 a small ooze-out was observed on the crater’s W edge.
Activity during February 2023. Activity continued in the E part of Halema’uma’u crater, as well as in a smaller basin in the W part of the 2021-2022 lava lake (figure 527). The E lava lake contained a single lava fountain and frequent overflows. HVO reported that during the morning of 1 February the large E lava lake began to cool and crust over in the center of the lake; two smaller areas of lava were observed on the N and S sides by the afternoon. The dominant lava fountain located in the S part of the lava lake paused for roughly 45 minutes at 2315 and resumed by midnight, rising 1-2 m. At 0100 on 2 February lava from the S part was effusing across the entire E lava lake area, covering the crusted over portion in the center of the lake and continuing across the majority of the previously measured 250,000 m2 by 0400. A small lava pond near the E lake produced an overflow around 0716 on 2 February. On 3 February some lava crust began to form against the N and E levees, which defined the 250,000 m2 eastern lava lake. The small S lava fountain remained active, rising 1-6 m high during 3-9 February; around 0400 on 5 February occasional bursts doubled the height of the lava fountain.
A large breakout occurred overnight during 2100 on 4 February to 0900 on 5 February on the N part of the crater floor, equal to or slightly larger in size than the E lava lake. A second, smaller lava fountain appeared in the same area of the E lava lake between 0300 and 0700 on 5 February and was temporarily active. This large breakout continued until 7 February. A small, brief breakout was reported in the S of the E lava lake around midnight on 7 February. In the W lake, as well as the smaller lava pond in the central portion of the crater floor, contained several overflows during 7-10 February and intermittent fountaining. Activity at the S small lava pond and the small S lava fountain within the E lake declined during 9-10 February. The lava pond in the central portion of the crater floor had nearly continuous, expansive flows during 10-13 February; channels from the small central lava pond seemed to flow into the larger E lake. During 13-18 February a small lava fountain was observed in the small lava pond in the central portion of the crater floor. Continuous overflows persisted during this time.
Activity in the eastern and central lakes began to decline in the late afternoon of 17 February. By 18 February HVO reported that the lava effusions had significantly declined, and that the eastern and central lakes were no longer erupting. The W lake in the basin remained active but at a greatly reduced level that continued to decline. HVO reported that this decrease in activity is attributed to notable deflationary tilt that began early on the morning of 17 February and lasted until early 19 February. By 19 February the W lake was mostly crusted over although some weak lava flows remained, which continued through 28 February. The sulfur dioxide emission rates ranged 250-2,800 t/d, the highest value of which was recorded on 6 February.
Activity during March 2023. The summit eruption at Halema’uma’u crater continued at greatly reduced levels compared to the previous two months. The E and central vents stopped effusing lava, and the W lava lake remained active with weak lava flows; the lake was mostly crusted over, although slowly circulating lava intermittently overturned the crust. By 6 March the lava lake in the W basin had stopped because the entire surface was crusted over. The only apparent surface eruptive activity during 5-6 March was minor ooze-outs of lava onto the crater floor, which had stopped by 7 March. Several hornitos on the crater floor still glowed through 12 March according to overnight webcam images, but they did not erupt any lava. A small ooze-out of lava was observed just after 1830 in the W lava lake on 8 March, which diminished overnight. The sulfur dioxide emission rate ranged from 155-321 t/d on 21 March. The VAL was lowered to Advisory, and the ACC was lowered to Yellow (the second lowest on a four-color scale) on 23 March due to a pause in the eruption since 7 March.
Activity during April-May 2023. The eruption at Halema’uma’u crater was paused; no lava effusions were visible on the crater floor. Sulfur dioxide emission rates ranged from 75-185 t/d, the highest of which was measured on 22 April. During May and June summit seismicity was elevated compared to seismicity that preceded the activity during January.
Activity during June 2023. Earthquake activity and changes in the patterns of ground deformation beneath the summit began during the evening of 6 June. The data indicated magma movement toward the surface, prompting HVO to raise the VAL to Watch and the ACC to Orange. At about 0444 on 7 June incandescence in Halema’uma’u crater was visible in webcam images, indicating that a new eruption had begun. HVO raised the VAL to Warning and the ACC to Red (the highest color on a four-color scale). Lava flowed from fissures that had opened on the crater floor. Multiple minor lava fountains were active in the central E portion of the Halema’uma’u crater, and one vent opened on the W wall of the caldera (figure 528). The eruptive vent on the SW wall of the crater continued to effuse into the lava lake in the far SW part of the crater (figure 529). The largest lava fountain consistently rose 15 m high; during the early phase of the eruption, fountain bursts rose as high as 60 m. Lava flows inundated much of the crater floor and added about 6 m depth of new lava within a few hours, covering approximately 10,000 m2. By 0800 on 7 June lava filled the crater floor to a depth of about 10 m. During 0800-0900 the sulfur dioxide emission rate was about 65,000 t/d. Residents of Pahala (30 km downwind of the summit) reported minor deposits of fine, gritty ash and Pele’s hair. A small spatter cone had formed at the vent on the SW wall by midday, and lava from the cone was flowing into the active lava lake. Fountain heights had decreased from the onset of the eruption and were 4-9 m high by 1600, with occasional higher bursts. Inflation switched to deflation and summit earthquake activity greatly diminished shortly after the eruption onset.
At 0837 on 8 June HVO lowered the VAL to Watch and the ACC to Orange because the initial high effusion rates had declined, and no infrastructure was threatened. The surface of the lava lake had dropped by about 2 m, likely due to gas loss by the morning of 8 June. The drop left a wall of cooled lava around the margins of the crater floor. Lava fountain heights decreased during 8-9 June but continued to rise to 10 m high. Active lava and vents covered much of the W half of Halema’uma’u crater in a broad, horseshoe-shape around a central, uplifted area (figure 530). The preliminary average effusion rate for the first 24 hours of the eruption was about 150 cubic meters per second, though the estimate did not account for vesiculated lava and variations in crater floor topography. The effusion rate during the very earliest phases of the eruption appeared significantly higher than the previous three summit eruptions based on the rapid coverage of the entire crater floor. An active lava lake, also referred to as the “western lava lake” was centered within the uplifted area and was fed by a vent in the NE corner. Two small active lava lakes were located just SE from the W lava lake and in the E portion of the crater floor.
During 8-9 June the lava in the central lava lake had a thickness of approximately 1.5 m, based on measurements from a laser rangefinder. During 9-12 June the height of the lava fountains decreased to 9 m high. HVO reported that the previously active lava lake in the E part of the crater appeared stagnant during 10-11 June. The surface of the W lake rose approximately 1 m overnight during 11-12 June, likely due to the construction of a levee around it. Only a few small fountains were active during 12-13 June; the extent of the active lava had retreated so that all activity was concentrated in the SW and central parts of Halema’uma’u crater. Intermittent spattering from the vent on the SW wall was visible in overnight webcam images during 13-18 June. On the morning of 14 June a weak lava effusion originated from near the western eruptive vent, but by 15 June there were no signs of continued activity. HVO reported that other eruptive vents in the SW lava lake had stopped during this time, following several days of waning activity; lava filled the lake by about 0.5 m. Lava circulation continued in the central lake and no active lava was reported in the northern or eastern parts of the crater. Around 0800 on 15 June the top of the SW wall spatter cone collapsed, which was followed by renewed and constant spattering from the top vent and a change in activity from the base vent; several new lava flows effused from the top of the cone, as well as from the pre-existing tube-fed flow from its base. Accumulation of lava on the floor resulted in a drop of the central basin relative to the crater floor, allowing several overflows from the SW lava lake to cascade into the basin during the night of 15 June into the morning of 16 June.
Renewed lava fountaining was reported at the eruptive vent on the SW side of the crater during 16-19 June, which effused lava into the far SW part of the crater. This activity was described as vigorous during midday on 16 June; a group of observatory geologists estimated that the lava was consistently ejected at least 10 m high, with some spatter ejected even higher and farther. Deposits from the fountain further heightened and widened the spatter cone built around the original eruptive vent in the lower section of the crater wall. Multiple lava flows from the base of the cone were fed into the SW lava lake and onto the southwestern-most block from the 2018 collapse within Halema’uma’u on 17 June (figure 531); by 18 June they focused into a single flow feeding into the SW lava lake. On the morning of 19 June a second lava flow from the base of the eruptive cone advanced into the SW lava lake.
Around 1600 on 19 June there was a rapid decline in lava fountaining and effusion at the eruptive vent on the SW side of the crater; vent activity had been vigorous up to that point (figure 532). Circulation in the lava lake also slowed, and the lava lake surface dropped by several meters. Overnight webcam images showed some previously eruptive lava still flowing onto the crater floor, which continued until those flows began to cool. By 21 June no lava was erupting in Halema’uma’u crater. Overnight webcam images during 29-30 June showed some incandescence from previously erupted lava flows as they continued to cool. Seismicity in the crater declined to low levels. Sulfur dioxide emission rates ranged 160-21,000 t/d throughout the month, the highest measurement of which was recorded on 8 June. On 30 June the VAL was lowered to Advisory (the second level on a four-level scale) and the ACC was lowered to Yellow. Gradual inflation was detected at summit tiltmeters during 19-30 June.
Activity during July-August 2023. During July, the eruption paused; no lava was erupting in Halema’uma’u crater. Nighttime webcam images showed some incandescence from previously erupted lava as it continued to cool on the crater floor. During the week of 14 August HVO reported that the rate in seismicity increased, with 467 earthquakes of Mw 3.2 and smaller occurring. Sulfur dioxide emission rates remained low, ranging from 75-86 t/d, the highest of which was recorded on 10 and 15 August. On 15 August beginning at 0730 and lasting for several hours, a swarm of approximately 50 earthquakes were detected at a depth of 2-3 km below the surface and about 2 km long directly S of Halema’uma’u crater. HVO reported that this was likely due to magma movement in the S caldera region. During 0130-0500 and 1700-2100 on 21 August two small earthquake swarms of approximately 20 and 25 earthquakes, respectively, occurred at the same location and at similar depths. Another swarm of 50 earthquakes were recorded during 0430-0830 on 23 August. Elevated seismicity continued in the S area through the end of the month.
Activity during September 2023. Elevated seismicity persisted in the S summit with occasional small, brief seismic swarms. Sulfur dioxide measurements were relatively low and were 70 t/d on 8 September. About 150 earthquakes occurred during 9-10 September, and tiltmeter and Global Positioning System (GPS) data showed inflation in the S portion of the crater.
At 0252 on 10 September HVO raised the VAL to Watch and the ACC to Orange due to increased earthquake activity and changes in ground deformation that indicated magma moving toward the surface. At 1515 the summit eruption resumed in the E part of the caldera based on field reports and webcam images. Fissures opened on the crater floor and produced multiple minor lava fountains and flows (figure 533). The VAL and ACC were raised to Warning and Red, respectively. Gas-and-steam plumes rose from the fissures and drifted downwind. A line of eruptive vents stretched approximately 1.4 km from the E part of the crater into the E wall of the down dropped block by 1900. The lava fountains at the onset of the eruption had an estimated 50 m height, which later rose 20-25 m high. Lava erupted from fissures on the down dropped block and expanded W toward Halema’uma’u crater. Data from a laser rangefinder recorded about 2.5 m thick of new lava added to the W part of the crater. Sulfur dioxide emissions were elevated in the eruptive area during 1600-1500 on 10 September, measuring at least 100,000 t/d.
At 0810 on 11 September HVO lowered the VAL and ACC back to Watch and Orange due to the style of eruption and the fissure location had stabilized. The initial extremely high effusion rates had declined (but remained at high levels) and no infrastructure was threatened. An eruption plume, mainly comprised of sulfur dioxide and particulates, rose as high as 3 km altitude. Several lava fountains were active on the W side of the down dropped block during 11-15 September, while the easternmost vents on the down dropped block and the westernmost vents in the crater became inactive on 11 September (figure 534). The remaining vents spanned approximately 750 m and trended roughly E-W. The fed channelized lava effusions flowed N and W into Halema’uma’u. The E rim of the crater was buried by new lava flows; pahoehoe lava flows covered most of the crater floor except areas of higher elevation in the SW part of the crater. The W part of the crater filled about 5 m since the start of the eruption, according to data from a laser rangefinder during 11-12 September. Lava fountaining continued, rising as high as 15 m by the morning of 12 September. During the morning of 13 September active lava flows were moving on the N and E parts of the crater. The area N of the eruptive vents that had active lava on its surface became perched and was about 3 m higher than the surrounding ground surface. By the morning of 14 September active lava was flowing on the W part of the down dropped block and the NE parts of the crater. The distances of the active flows progressively decreased. Spatter had accumulated on the S (downwind) side of the vents, forming ramparts about 20 m high.
Vigorous spattering was restricted to the westernmost large spatter cone with fountains rising 10-15 m high. Minor spattering occurred within the cone to the E of the main cone, but HVO noted that the fountains remained mostly below the rim of the cone. Lava continued to effuse from these cones and likely from several others as well, traveled N and W, confined to the W part of the down-dropped block and the NE parts of Halema’uma’u. Numerous ooze-outs of lava were visible over other parts of the crater floor at night. Laser range-finder measurements taken of the W part of the crater during 14-15 September showed that lava filled the crater by 10 m since the start of the eruption. Sulfur dioxide emissions remained elevated after the onset of the eruption, ranging 20,000-190,000 t/d during the eruption activity, the highest of which occurred on 10 September.
Field crews observed the eruptive activity on 15 September; they reported a notable decrease or stop in activity at several vents. Webcam images showed little to no fountaining since 0700 on 16 September, though intermittent spattering continued from the westernmost large cone throughout the night of 15-16 September. Thermal images showed that lava continued to flow onto the crater floor. On 16 September HVO reported that the eruption stopped around 1200 and that there was no observable activity anywhere overnight or on the morning of 17 September. HVO field crews reported that active lava was no longer flowing onto Halema’uma’u crater floor and was restricted to a ponded area N of the vents on the down dropped block. They reported that spattering stopped around 1115 on 16 September. Nighttime webcam images showed some incandescence on the crater floor as lava continued to cool. Field observations supported by geophysical data showed that eruptive tremor in the summit region decreased over 15-16 September and returned to pre-eruption levels by 1700 on 16 September. Sulfur dioxide emissions were measured at a rate of 800 t/d on 16 September while the eruption was waning, and 200 t/d on 17 September, which were markedly lower compared to measurements taken the previous week of 20,000-190,000 t/d.
Geologic Background. Kilauea overlaps the E flank of the massive Mauna Loa shield volcano in the island of Hawaii. Eruptions are prominent in Polynesian legends; written documentation since 1820 records frequent summit and flank lava flow eruptions interspersed with periods of long-term lava lake activity at Halemaumau crater in the summit caldera until 1924. The 3 x 5 km caldera was formed in several stages about 1,500 years ago and during the 18th century; eruptions have also originated from the lengthy East and Southwest rift zones, which extend to the ocean in both directions. About 90% of the surface of the basaltic shield volcano is formed of lava flows less than about 1,100 years old; 70% of the surface is younger than 600 years. The long-term eruption from the East rift zone between 1983 and 2018 produced lava flows covering more than 100 km2, destroyed hundreds of houses, and added new coastline.
Information Contacts: Hawaiian Volcano Observatory (HVO), U.S. Geological Survey, PO Box 51, Hawai'i National Park, HI 96718, USA (URL: http://hvo.wr.usgs.gov/).
Tinakula (Solomon Islands) — December 2023 Cite this Report
Tinakula
Solomon Islands
10.386°S, 165.804°E; summit elev. 796 m
All times are local (unless otherwise noted)
Continued lava flows and thermal activity during June through November 2023
Tinakula is a remote 3.5 km-wide island in the Solomon Islands, located 640 km ESE of the capital, Honiara. The current eruption period began in December 2018 and has more recently been characterized by intermittent lava flows and thermal activity (BGVN 48:06). This report covers similar activity during June through November 2023 using satellite data.
During clear weather days (20 July, 23 September, 23 October, and 12 November), infrared satellite imagery showed lava flows that mainly affected the W side of the island and were sometimes accompanied by gas-and-steam emissions (figure 54). The flow appeared more intense during July and September compared to October and November. According to the MODVOLC thermal alerts, there were a total of eight anomalies detected on 19 and 21 July, 28 and 30 October, and 16 November. Infrared MODIS satellite data processed by MIROVA (Middle InfraRed Observation of Volcanic Activity) detected a small cluster of thermal activity occurring during late July, followed by two anomalies during August, two during September, five during October, and five during November (figure 55).
Geologic Background. The small 3.5-km-wide island of Tinakula is the exposed summit of a massive stratovolcano at the NW end of the Santa Cruz islands. It has a breached summit crater that extends from the summit to below sea level. Landslides enlarged this scarp in 1965, creating an embayment on the NW coast. The Mendana cone is located on the SE side. The dominantly andesitic volcano has frequently been observed in eruption since the era of Spanish exploration began in 1595. In about 1840, an explosive eruption apparently produced pyroclastic flows that swept all sides of the island, killing its inhabitants. Recorded eruptions have frequently originated from a cone constructed within the large breached crater. These have left the upper flanks and the steep apron of lava flows and volcaniclastic debris within the breach unvegetated.
Information Contacts: MIROVA (Middle InfraRed Observation of Volcanic Activity), a collaborative project between the Universities of Turin and Florence (Italy) supported by the Centre for Volcanic Risk of the Italian Civil Protection Department (URL: http://www.mirovaweb.it/); Hawai'i Institute of Geophysics and Planetology (HIGP) - MODVOLC Thermal Alerts System, School of Ocean and Earth Science and Technology (SOEST), Univ. of Hawai'i, 2525 Correa Road, Honolulu, HI 96822, USA (URL: http://modis.higp.hawaii.edu/); Copernicus Browser, Copernicus Data Space Ecosystem, European Space Agency (URL: https://dataspace.copernicus.eu/browser/).
Search Bulletin Archive by Publication Date
Select a month and year from the drop-downs and click "Show Issue" to have that issue displayed in this tab.
The default month and year is the latest issue available.
Bulletin of the Global Volcanism Network - Volume 21, Number 07 (July 1996)
Aira (Japan)
Minor activity continues
Asamayama (Japan)
Seismic activity increases
Asosan (Japan)
Crater glows; water and mud ejected
Azumayama (Japan)
Small-amplitude volcanic tremor
Etna (Italy)
Crater glows, Strombolian eruptions, and two fire fountaining episodes
Guallatiri (Chile)
Quiet emission of vapor from summit crater and S flank fumaroles
Iwatesan (Japan)
Volcanic tremor
Izu-Tobu (Japan)
Seismic activity increases
Kama'ehuakanaloa (United States)
Earthquake swarm and a new submarine pit crater
Kanlaon (Philippines)
Sudden phreatic explosion kills three people
Kilauea (United States)
Surface flows, ocean entries, and bench collapses; continued eruption tremor
Kuchinoerabujima (Japan)
Seismic activity increasing since January 1996
Kujusan (Japan)
No ashfall despite seismic increases
Kusatsu-Shiranesan (Japan)
Seismic activity increases
Langila (Papua New Guinea)
Low-level activity persists
Lascar (Chile)
Quiet emission of vapor
Manam (Papua New Guinea)
Gentle release of white vapor; moderate to low seismicity
Nasudake (Japan)
Seismic activity increases
Niijima (Japan)
Seismic activity increases
Ontakesan (Japan)
Seismic activity increases
Rabaul (Papua New Guinea)
Tavurvur eruption continues; seismic activity increases
Shikotsu (Japan)
Seismic activity increases
Soufriere Hills (United Kingdom)
Dome growth continues, rockfalls and pyroclastic flows increase
Suwanosejima (Japan)
Explosive activity continues
Ubinas (Peru)
Increased fumarolic activity prompts seismic and other monitoring
Aira
Japan
31.5772°N, 130.6589°E; summit elev. 1117 m
All times are local (unless otherwise noted)
Minor activity continues
Minami-dake crater had one non-explosive eruption in July. The seismic station 2.3 km NW of the crater (Station B) recorded 136 earthquakes and 29 tremors during July. No ashfall was found at the Kagoshima Local Meteorological Observatory, 10 km W of the crater.
Geologic Background. The Aira caldera in the northern half of Kagoshima Bay contains the post-caldera Sakurajima volcano, one of Japan's most active. Eruption of the voluminous Ito pyroclastic flow accompanied formation of the 17 x 23 km caldera about 22,000 years ago. The smaller Wakamiko caldera was formed during the early Holocene in the NE corner of the caldera, along with several post-caldera cones. The construction of Sakurajima began about 13,000 years ago on the southern rim and built an island that was joined to the Osumi Peninsula during the major explosive and effusive eruption of 1914. Activity at the Kitadake summit cone ended about 4,850 years ago, after which eruptions took place at Minamidake. Frequent eruptions since the 8th century have deposited ash on the city of Kagoshima, located across Kagoshima Bay only 8 km from the summit. The largest recorded eruption took place during 1471-76.
Information Contacts: Volcanological Division, Japan Meteorological Agency, 1-3-4 Ote-machi, Chiyoda-ku, Tokyo 100, Japan
Asamayama
Japan
36.406°N, 138.523°E; summit elev. 2568 m
All times are local (unless otherwise noted)
Seismic activity increases
Seismicity was above normal levels during June, with 1,002 earthquakes recorded at Station B, 2 km S the summit. A peak of 70 events occurred on 5 June.
Geologic Background. Asamayama, Honshu's most active volcano, overlooks the resort town of Karuizawa, 140 km NW of Tokyo. The volcano is located at the junction of the Izu-Marianas and NE Japan volcanic arcs. The modern Maekake cone forms the summit and is situated east of the remnant of an older andesitic volcano, Kurofuyama, which was destroyed by a late-Pleistocene landslide about 20,000 years before present (BP). Growth of a dacitic shield volcano was accompanied by pumiceous pyroclastic flows, the largest of which occurred about 14,000-11,000 BP, and by growth of the Ko-Asamayama lava dome on the east flank. Maekake, capped by the Kamayama pyroclastic cone that forms the present summit, is probably only a few thousand years old and has observed activity dating back at least to the 11th century CE. Maekake has had several major Plinian eruptions, the last two of which occurred in 1108 (Asamayama's largest Holocene eruption) and 1783 CE.
Information Contacts: Volcanological Division, Japan Meteorological Agency, 1-3-4 Ote-machi, Chiyoda-ku, Tokyo 100, Japan
Asosan
Japan
32.8849°N, 131.085°E; summit elev. 1592 m
All times are local (unless otherwise noted)
Crater glows; water and mud ejected
Red glows were observed over the S wall of Naka-dake Crater 1 in May and June. The crater floor was covered with water in June, and weak water ejections were observed on 5-6 June. On 30 July, Crater 1 ejected mud on its SE side. Such ejections were also observed on 26 October 1995 (BGVN 20:10).
The 24-km-wide Aso Caldera contains 15 central cones. One of these cones, Naka-dake, has erupted more than 165 times since 553 A.D.
Geologic Background. The 24-km-wide Asosan caldera was formed during four major explosive eruptions from 300,000 to 90,000 years ago. These produced voluminous pyroclastic flows that covered much of Kyushu. The last of these, the Aso-4 eruption, produced more than 600 km3 of airfall tephra and pyroclastic-flow deposits. A group of 17 central cones was constructed in the middle of the caldera, one of which, Nakadake, is one of Japan's most active volcanoes. It was the location of Japan's first documented historical eruption in 553 CE. The Nakadake complex has remained active throughout the Holocene. Several other cones have been active during the Holocene, including the Kometsuka scoria cone as recently as about 210 CE. Historical eruptions have largely consisted of basaltic to basaltic andesite ash emission with periodic strombolian and phreatomagmatic activity. The summit crater of Nakadake is accessible by toll road and cable car, and is one of Kyushu's most popular tourist destinations.
Information Contacts: Volcanological Division, Japan Meteorological Agency, 1-3-4 Ote-machi, Chiyoda-ku, Tokyo 100, Japan
Azumayama
Japan
37.735°N, 140.244°E; summit elev. 1949 m
All times are local (unless otherwise noted)
Small-amplitude volcanic tremor
Small-amplitude volcanic tremors were detected on 10, 17, and 30 June, and on 27 July.
Geologic Background. The Azumayama volcanic group consists of a cluster of stratovolcanoes, shield volcanoes, lava domes, and pyroclastic cones. The andesitic and basaltic complex was constructed in two E-W rows above a relatively high basement of Tertiary sedimentary rocks and granodiorites west of Fukushima city. Volcanic activity has migrated to the east, with the Higashi-Azuma volcano group being the youngest. The symmetrical Azuma-Kofuji crater and a nearby fumarolic area on the flank of Issaikyo volcano are popular tourist destinations. The Azumayama complex contains several crater lakes, including Goshikinuma and Okenuma. Historical eruptions, mostly small phreatic explosions, have been restricted to Issaikyo volcano at the northern end of the Higashiyama group.
Information Contacts: Volcanological Division, Japan Meteorological Agency, 1-3-4 Ote-machi, Chiyoda-ku, Tokyo 100, Japan
Etna
Italy
37.748°N, 14.999°E; summit elev. 3357 m
All times are local (unless otherwise noted)
Crater glows, Strombolian eruptions, and two fire fountaining episodes
During June eruptive activity was very strong. Two episodes of fire fountaining occurred at Northeast Crater (NEC), the first on 6 June and the second on 25 June.
On 2-3 June there were many Strombolian explosions at NEC. After two days of quiescence, the 9th episode of fire fountaining since November 1995 was recorded at 2015-2110 on 6 June by the seismic network and surveillance video camera. Poor weather conditions prohibited clear observations. Volcanic tremors increased after 0550 on 6 June, with tremor amplitude reaching a maximum at 1944 and returning to normal around 2300. Lapilli and ash dispersed NW up to a few kilometers from the vent (figure 64).
Red glow appeared above NEC around midnight on 7 June. From 0200 to 0400 on 8 June, there were almost continuous strong Strombolian eruptions. Between 2240 on 8 June and 0355 on 9 June, and on the evening of 9 June (2020-2200), the "La Montagnola" surveillance video camera recorded red glow above NEC and weak Strombolian activity inside the crater. On the nights of 10 and 11 June, red glows lasted a few minutes. During 0400-1200 on 12 June, ash explosions took place at NEC at intervals of 10-20 minutes. On the early morning of 13 June Strombolian activity at NEC resumed for ~20 minutes, and during 1755-1900 on 13 June there was almost continuous ash emission. The video camera system was not operational during 14-17 June. Explosions took place at NEC during 2317-2350 on 17 June, and during 0004-0300 on 18 June strong and continuous Strombolian activity was recorded. From 18 to 24 June Strombolian activity was low and sporadic.
At 2347 on 25 June, the 10th episode of fire fountaining began. The paroxysmal phase lasted for 35 minutes (0015 to 0050), and at 0055 on 26 June the episode ended. The fire fountains rose ~300 m, and a column of lapilli and ash reached several kilometers above the summit. The lapilli fell on the NE flank of the volcano (figure 64) and extended as far as Taormina, 28 km from the vent. Ashfall was also observed in Messina, 70 km away. An increase of volcanic tremors with oscillation of amplitude was recorded after 2200 on 24 June. The maximum amplitude of volcanic tremors was reached at 2230 on 25 June and lasted for more than one hour.
After the 10th eruptive episode, NEC remained quiescent until the morning of 28 June. At around 1700 that day, strong ash explosions opened a new vent on the W side of the crater floor that had been sealed by fire-fountain spatter. In the last week of June, Strombolian activity also resumed at Bocca Nuova crater (BN). Several red bombs were thrown up to the crater rim.
Beginning on 2 July, the surveillance camera recorded continuous red glow during all the nights in July, indicating persistent Strombolian activity inside NEC. During the first ten days of July, explosive activity at NEC was relatively low, then gradually increased and became vigorous on the early morning of the 14th. On 16 July Strombolian activity abruptly decreased. The next day several black ash puffs were observed, eruption intensity increased again, and a second vent inside the crater began to erupt. During 18-20 July, Strombolian activity was very strong and the magma level inside the vents was high. Jets of magma rising up to 200 m resulted in the fast growth of two cinder cones.
Two eruptive fissures formed on the W and S flanks of the cone at NEC on the morning of 21 July. The fissure on the W flank (N70°W, 40 m long, ~3,220 m elevation) issued a lava flow that was active until that afternoon and produced a small lava tongue, which was 100 m long, 10 m wide, and 2 m thick. The W lava flow continued until 22 July. A lava flow from the S fissure moved on the flank of NEC that borders the Voragine crater at ~3,230 m elevation.
On the morning of 23 July, lava spilled from an ephemeral vent on the lowest portion of the E rim at NEC (at an elevation of ~3,250 m). The vent drained a crusted lava flow field that had formed in the previous days and covered the E side of the crater floor. The lava overflow traveled E for more than 1 km inside the Valle del Bove, and its front reached an elevation of ~2,650 m, above the hornitos chain from the 1986 eruption. Close to the vent, the lava flow was ~2 m deep and ~1 m wide, but at a few tens of meters away from the vent, it was up to 10 m in width. On the morning of 25 July, a preliminary estimate of the lava output rate was 0.3 m3/s. Direct thermocouple measurements of the lava flow temperature gave a maximum value of 1,080°C. On 28 July the lava issuing from the E side of NEC crater rim stopped, resumed a few hours later, then stopped on the morning of 29 July.
The lava erupting inside the Voragine crater stopped on the morning of 30 July, and resumed a few hours later. On 31 July the lava flow and gas emission continued, and lava filled the degassing vent of the Voragine crater at a rate of ~0.5 m3/s.
On 1 August eruptive activity increased very quickly, and on the night of 3 August three lava flows poured from the NEC crater rim and moved down the E slope of the summit cone into the Valle del Bove. Explosive activity continued at NEC and threw large bombs up to 300 m above the crater rim.
Geologic Background. Mount Etna, towering above Catania on the island of Sicily, has one of the world's longest documented records of volcanism, dating back to 1500 BCE. Historical lava flows of basaltic composition cover much of the surface of this massive volcano, whose edifice is the highest and most voluminous in Italy. The Mongibello stratovolcano, truncated by several small calderas, was constructed during the late Pleistocene and Holocene over an older shield volcano. The most prominent morphological feature of Etna is the Valle del Bove, a 5 x 10 km caldera open to the east. Two styles of eruptive activity typically occur, sometimes simultaneously. Persistent explosive eruptions, sometimes with minor lava emissions, take place from one or more summit craters. Flank vents, typically with higher effusion rates, are less frequently active and originate from fissures that open progressively downward from near the summit (usually accompanied by Strombolian eruptions at the upper end). Cinder cones are commonly constructed over the vents of lower-flank lava flows. Lava flows extend to the foot of the volcano on all sides and have reached the sea over a broad area on the SE flank.
Information Contacts: Mauro Coltelli and Paola Del Carlo, CNR Istituto Internazionale di Vulcanologia (IIV), Piazza Roma 2, Catania, Italy (URL: http://www.ingv.it/en/).
Guallatiri
Chile
18.42°S, 69.092°W; summit elev. 6071 m
All times are local (unless otherwise noted)
Quiet emission of vapor from summit crater and S flank fumaroles
On 19 and 20 July, quiet emissions and occasional denser puffs of white vapor from the summit crater were observed. A zone of fumaroles on the S flank of the volcano, free of snow and ~400 m below the summit, also released a similar amount of vapor as that from the summit crater.
Guallatiri, one of N Chile's most active volcanoes, is a symmetrical ice-clad volcano at the S end of the Nevados de Quimsachata volcano group.
Geologic Background. One of northern Chile's most active volcanoes, Volcán Guallatiri is a symmetrical ice-clad stratovolcano at the SW end of the Nevados de Quimsachata volcano group. It lies just W of the border with Bolivia and is capped by a central dacitic dome or lava complex, with the active vent situated on its S side. Thick lava flows are prominent on the lower N and W flanks of the andesitic-to-rhyolitic volcano. Minor explosive eruptions have been reported since the beginning of the 19th century. Intense fumarolic activity with "jet-like" noises continues, and numerous solfataras extend more than 300 m down the W flank.
Information Contacts: J. Sesiano, Département de Minéralogie, Université de Genève, 13 rue des Maraîchers, 1121 Genève 4, Switzerland.
Iwatesan
Japan
39.853°N, 141.001°E; summit elev. 2038 m
All times are local (unless otherwise noted)
Volcanic tremor
On 10, 11, 12, and 17 June, small-amplitude volcanic tremors were detected. According to reports from the Observation Center for Prediction of Earthquakes and Volcanic Eruptions, Tohoku University, there were also shallow volcanic microearthquakes beneath Iwate on 7 and 27 June, and on 2 and 6 July. Tremor was previously reported on 4 March and 12 May 1996 (BGVN 21:03 and 21:05), and in September and October 1995 (BGVN 20:09 and 20:10).
Geologic Background. Viewed from the east, Iwatesan volcano has a symmetrical profile that invites comparison with Fuji, but on the west an older cone is visible containing an oval-shaped, 1.8 x 3 km caldera. After the growth of Nishi-Iwate volcano beginning about 700,000 years ago, activity migrated eastward to form Higashi-Iwate volcano. Iwate has collapsed seven times during the past 230,000 years, most recently between 739 and 1615 CE. The dominantly basaltic summit cone of Higashi-Iwate volcano, Yakushidake, is truncated by a 500-m-wide crater. It rises well above and buries the eastern rim of the caldera, which is breached by a narrow gorge on the NW. A central cone containing a 500-m-wide crater partially filled by a lake is located in the center of the oval-shaped caldera. A young lava flow from Yakushidake descended into the caldera, and a fresh-looking lava flow from the 1732 eruption traveled down the NE flank.
Information Contacts: Volcanological Division, Japan Meteorological Agency, 1-3-4 Ote-machi, Chiyoda-ku, Tokyo 100, Japan
Izu-Tobu
Japan
34.9°N, 139.098°E; summit elev. 1406 m
All times are local (unless otherwise noted)
Seismic activity increases
Seismicity at the Izu-Tobu volcano group increased in July. There were 318 earthquakes recorded in July; and the largest one was M 2.4 detected on 12 July. The Kamata seismic station in Ito City recorded 61 events on 15 July, and 45 events on 20 July. Seismicity declined after 24 July.
Geologic Background. The Izu-Tobu volcano group (Higashi-Izu volcano group) is scattered over a broad, plateau-like area of more than 400 km2 on the E side of the Izu Peninsula. Construction of several stratovolcanoes continued throughout much of the Pleistocene and overlapped with growth of smaller monogenetic volcanoes beginning about 300,000 years ago. About 70 subaerial monogenetic volcanoes formed during the last 140,000 years, and chemically similar submarine cones are located offshore. These volcanoes are located on a basement of late-Tertiary volcanic rocks and related sediments and on the flanks of three Quaternary stratovolcanoes: Amagi, Tenshi, and Usami. Some eruptive vents are controlled by fissure systems trending NW-SE or NE-SW. Thirteen eruptive episodes have been documented during the past 32,000 years. Kawagodaira maar produced pyroclastic flows during the largest Holocene eruption about 3,000 years ago. The latest eruption occurred in 1989, when a small submarine crater was formed NE of Ito City.
Information Contacts: Volcanological Division, Japan Meteorological Agency, 1-3-4 Ote-machi, Chiyoda-ku, Tokyo 100, Japan
Kama'ehuakanaloa (United States) — July 1996 Cite this Report
Kama'ehuakanaloa
United States
18.92°N, 155.27°W; summit elev. -975 m
All times are local (unless otherwise noted)
Earthquake swarm and a new submarine pit crater
The largest swarm of earthquakes ever recorded on the Hawaiian volcanoes occurred below Lōʻihi seamount in July-August (figures 7 and 8). The seismic network maintained by the Hawaiian Volcano Observatory (HVO) began detecting events from this swarm at 2154 on 16 July; events continued at low rates until 20 July, when counts rapidly increased. More than 4,000 earthquakes were recorded through 29 July. Several hundred of M >= 3.0 were detected, and more than 80 were M >= 4. The largest event, M 5.0, occurred at 2330 on 27 July. The number of events decreased in early August.
In an effort sponsored by the U.S. National Science Foundation, an interdisciplinary team of researchers from the University of Hawaii, in collaboration with scientists from the U.S. Geological Survey, the Bishop Museum, and the University of Washington, investigated this unique event. The team left Honolulu at 0700 on 5 August and returned on the evening of 10 August after a six-day observation by the research ship and manned submersible. The following summary is from the daily reports of the Hawaii Center for Volcanology.
6 August. Amidst ongoing intense seismic and inferred volcanic activity, scientists were rocked by several earthquakes felt through the hull of the research vessel Kaimikai O Kanaloa (RV KOK) as they steamed over Lōʻihi. On their first pass over the volcano, they noted that Pele's Vents, an area 980 m below the surface where active hydrothermal venting had been recorded by previous cruises, was no longer there. The area was now the site of a pit crater 260 m in diameter and 300 m deep (named "Pele's Puka"), roughly the same size as similar craters at Kīlauea. Water samples recovered from the area near Pele's Puka were 2.5°C warmer than the surrounding water and highly acidic, indicating that they were nearly saturated in carbon dioxide. The water samples were milky brown in color because of suspended fine particles of what is probably volcanic glass. These characteristics, along with other chemical indicators, imply that the samples were taken very close to an underwater volcanic eruption.
7 August. Scientists raised and lowered instruments in the water, mainly looking for anomalies in water temperature and chemistry and also listening for sounds that might indicate an eruption. Except for the area around the peak of Lōʻihi, the sounds and water appeared normal, but toward the S end of the summit region the water was considerably warmer than usual, charged with carbon dioxide, and loaded with suspended particles. This "plume" of warm water was among the most intense ever recorded in the ocean. Sonobuoys, which broadcast sounds back to the ship by radio from underwater microphones, picked up crackling and grinding noises in the summit area, which could have been sounds of an eruption in progress.
8 August. Scientists in the PISCES V manned submersible landed near the highest point of the seamount (PISCES Peak) and worked their way slowly toward the new pit crater through murky waters, with visibility
Geologic Background. The Kama’ehuakanaloa seamount, previously known as Loihi, lies about 35 km off the SE coast of the island of Hawaii. This youngest volcano of the Hawaiian chain has an elongated morphology dominated by two curving rift zones extending north and south of the summit. The summit region contains a caldera about 3 x 4 km and exhibits numerous lava cones, the highest of which is about 975 m below the ocean surface. The summit platform also includes two well-defined pit craters, sediment-free glassy lava, and low-temperature hydrothermal venting. An arcuate chain of small cones on the western edge of the summit extends north and south of the pit craters and merges into the crests prominent rift zones. Seismicity indicates a magmatic system distinct from that of Kilauea. During 1996 a new pit crater formed at the summit, and lava flows were erupted. Continued volcanism is expected to eventually build a new island; time estimates for the summit to reach the ocean surface range from roughly 10,000 to 100,000 years.
Information Contacts: Hawaii Center for Volcanology, Department of Geology & Geophysics, University of Hawaii at Manoa, 2525 Correa Road, Honolulu, HI 96822 USA (URL: http://www.soest.hawaii.edu/GG/hcv.html); Hawaiian Volcano Observatory (HVO), U.S. Geological Survey, PO Box 51, Hawaii National Park, HI 96718, USA (URL: http://www.soest.hawaii.edu/hvo/).
Kanlaon (Philippines) — July 1996 Cite this Report
Kanlaon
Philippines
10.4096°N, 123.13°E; summit elev. 2422 m
All times are local (unless otherwise noted)
Sudden phreatic explosion kills three people
On 10 August at 1431 an ash ejection killed three hikers and emitted a dirty-white steam-and-ash plume to 1,500 m above the central summit crater. The ash ejection lasted ~24 minutes, based on seismic records. A small associated explosion-type earthquake (22.8 mm of amplitude) was detected at the PHIVOLCS Cabagnaan seismic station, 5.5 km SW of the volcano. The ash drifted NE and was observed at altitudes of 7.6 and 11.3 km by Qantas aviators. The Bureau of Meteorology in Darwin issued a volcanic ash advisory describing the plume as extending 110 km SW. PHIVOLCS established a Level 1 alert (low level of hydrothermal disturbance, without any indication of magmatic activity), but no evacuation was advised. PHIVOLCS promptly warned the public to stay outside the 4-km-radius permanent-danger buffer zone. Based on previous Canlaon ash ejections, which were clustered in time, it was judged that there could be more explosions without any additional precursors. After the ash ejection, moderate emissions of white to dirty-white steam rose 100-150 m before drifting NE. On 11 August more white steam emissions were noted between 0353 and 0500. Another aviation notice reported the plume drifting SW.
The Cabagnaan seismograph recorded a total of 23 low-frequency volcanic earthquakes and four tectonic earthquakes from 0600 on 11 August through 0600 on 12 August. During 12 August, a quick response team from PHIVOLCS had installed four seismographs and was monitoring ground deformation. The team was also planning to determine the extent of the ash deposit.
According to 11 August news reports, two mountaineering groups were present on the summit at the moment of the explosion: a group of ten students from a Belgian University and their seven Filipino guides, and two British visitors accompanied by two local guides. Three people, one British and two Filipino, were killed. Seven Belgians and four Filipinos were evacuated or managed to make it off the mountain before darkness halted rescue efforts, but the other survivors were not rescued until the next morning.
Some of the 18 survivors were hospitalized because of injuries caused mainly by falling ejecta. Belgian Caroline Verlinde told reporters that she was descending from the crater rim when the eruption began without warning. She said she had seen a plume of smoke but her guide reassured her that it was normal. "Suddenly it spewed ash and stones. I hid behind a tree but my friends had nothing to protect them. I saw stones falling on them," she told the reporters.
Geologic Background. Kanlaon volcano (also spelled Canlaon) forms the highest point on the Philippine island of Negros. The massive andesitic stratovolcano is covered with fissure-controlled pyroclastic cones and craters, many of which are filled by lakes. The largest debris avalanche known in the Philippines traveled 33 km SW from Kanlaon. The summit contains a 2-km-wide, elongated northern caldera with a crater lake and a smaller but higher active vent, Lugud crater, to the south. Eruptions recorded since 1866 have typically consisted of phreatic explosions of small-to-moderate size that produce minor local ashfall.
Information Contacts: Philippine Institute of Volcanology and Seismology (PHIVOLCS), Department of Science and Technology, 5th & 6th Floors, Hizon building, 29 Quezon Avenue, Quezon City, Philippines; Bureau of Meteorology, Northern Territory Regional Office, P.O. Box 735, Darwin, NT 0801, Australia; Agence France Presse (AFP); Reuters Limited.
Kilauea (United States) — July 1996 Cite this Report
Kilauea
United States
19.421°N, 155.287°W; summit elev. 1222 m
All times are local (unless otherwise noted)
Surface flows, ocean entries, and bench collapses; continued eruption tremor
The eruption along the East Rift Zone continued in June and July after a pause from 30 May to 4 June (BGVN 21:05). On the morning of 4 June, lava began to fill a large collapse-pit over the tube near the base of Pu`u `O`o. Soon thereafter, a breakout at 690 m elevation fed a broad, slow-moving pahoehoe sheet flow. By the late afternoon of 4 June, channelized aa flows were streaming down the face of Pulama Pali (a fault scarp) from breakouts and large pahoehoe sheet flows were emanating from the tube near the base of the pali. Surface flows continued to spread W across the coastal plain below Paliuli. On the morning of 6 June, the flow front reached the ocean near Lae`apuki. By 13 June, three additional ocean entries were established spanning 1.6 km of coastline. All four entries remained active through 14 June, and surface flows diminished to a few breakouts on the coastal plain. After rising to 58 m below the rim on 4 June, the pond in Pu`u `O`o receded to a depth of 80 m.
During 18 June-1 July, tubes delivered lava to the ocean at three points (West Lae`apuki, Lae`apuki, and Kamoamoa) along a 1.8-km stretch of coastline within Hawaii Volcanoes National Park. Just before midnight on 22 June, a large collapse at the Lae`apuki entry removed roughly 12,000 m2 of the bench and the area immediately inland. Surface flow activity was concentrated on the coastal plain inland of the entry points. A few breakouts were intermittently active on the slope of Pulama Pali. The lava pond at the bottom of Pu`u `O`o Crater remained active at ~85 m below the rim.
Throughout July lava flowed to the ocean through an 11-km-long tube system. Approximately 95% of lava that reached the ocean entered at Lae`apuki; the remaining 5% entered from a 200-m-wide zone of surface flows at West Lae`apuki. At the main Lae`apuki bench, two skylights appeared over the tube within 150 m of the shoreline.
A small collapse of the West Lae`apuki bench was witnessed at 1920 on 10 July. A major collapse at the main Lae`apuki bench claimed several acres at 2000 on 12 July. Both bench collapses were accompanied by explosions and spattering at the shoreline. The Lae`apuki bench was completely rebuilt by 25 July. Explosive activity at this ocean entry was common during the week of 21-28 July, and by 27 July a littoral cone had been constructed. However, the entire Lae`apuki bench collapsed into the ocean again on the evening of 28 July.
Surface flows during the first half of the month were confined to the coastal plain in the center of the Kamoamoa flow field. Later in the month surface flows on the coastal plain occurred within 150 m of the ocean at West Lae`apuki. These flows came within several meters of the kipuka and remnant of the old coastal road at Highcastle and covered 25% of the black sand beach below the Highcastle overlook. Two surface flows occurred at higher elevations. On 23-25 July, a pahoehoe flow from a skylight traveled 300 m down the face of Pulama Pali. In addition, a 300-m-wide lava flow issued from the skylight at 690 m elevation between 26 and 29 July.
Inside Pu`u `O`o, gas pistoning in two distinct lava ponds was observed over several hours on 9 July. The pond levels rose and fell by 15 m during 10-minute cycles. However, the level of the lava pond generally remained at 80-85 m below the rim during most of June and July.
Seismicity. Eruption tremors continued along the East Rift Zone of Kīlauea with amplitudes fluctuating between background and 2-3x background levels in June and July. Microearthquake counts were low to moderate beneath the summit and rift zones. There were several episodes of weak to strong deep tremor from the usual SW source, the strongest of which occurred between 0637 and 0716 on 12 June. Explosive events were detected along the coast of Kalapana between 2330 on 22 June and 0017 on 23 June, at 1900-2300 on 12 July, and at 1700-1900 on 28 July. Several of these events were equivalent to, or greater than, an M 2.8 earthquake. Between 1700 and 1800 on 12 July, a small burst of long-period intermediate-depth events was located beneath the summit.
Geologic Background. Kilauea overlaps the E flank of the massive Mauna Loa shield volcano in the island of Hawaii. Eruptions are prominent in Polynesian legends; written documentation since 1820 records frequent summit and flank lava flow eruptions interspersed with periods of long-term lava lake activity at Halemaumau crater in the summit caldera until 1924. The 3 x 5 km caldera was formed in several stages about 1,500 years ago and during the 18th century; eruptions have also originated from the lengthy East and Southwest rift zones, which extend to the ocean in both directions. About 90% of the surface of the basaltic shield volcano is formed of lava flows less than about 1,100 years old; 70% of the surface is younger than 600 years. The long-term eruption from the East rift zone between 1983 and 2018 produced lava flows covering more than 100 km2, destroyed hundreds of houses, and added new coastline.
Information Contacts: Hawaiian Volcano Observatory (HVO), U.S. Geological Survey, PO Box 51, Hawaii National Park, HI 96718, USA.
Kuchinoerabujima (Japan) — July 1996 Cite this Report
Kuchinoerabujima
Japan
30.443°N, 130.217°E; summit elev. 657 m
All times are local (unless otherwise noted)
Seismic activity increasing since January 1996
Seismicity has been increasing since January 1996. According to the Sakura-jima Volcanological Observatory, Kyoto University, 75 and 25 earthquakes were detected around Shin-dake cone in June and July, respectively.
Geologic Background. A group of young stratovolcanoes forms the eastern end of the irregularly shaped island of Kuchinoerabujima in the northern Ryukyu Islands, 15 km W of Yakushima. The Furudake, Shindake, and Noikeyama cones were erupted from south to north, respectively, forming a composite cone with multiple craters. All historical eruptions have occurred from Shindake, although a lava flow from the S flank of Furudake that reached the coast has a very fresh morphology. Frequent explosive eruptions have taken place from Shindake since 1840; the largest of these was in December 1933. Several villages on the 4 x 12 km island are located within a few kilometers of the active crater and have suffered damage from eruptions.
Information Contacts: Volcanological Division, Japan Meteorological Agency, 1-3-4 Ote-machi, Chiyoda-ku, Tokyo 100, Japan
Kujusan
Japan
33.086°N, 131.249°E; summit elev. 1791 m
All times are local (unless otherwise noted)
No ashfall despite seismic increases
During June and July, high seismicity around Kuju was recorded. Some of the daily earthquake totals were as follows: 20-30 (18, 26, and 27 June); 39 (3 July); and 31 (15 July). Overall there were 212 events in June and 279 in July. During June and July no ashfall was seen and plume height typically remained lower than 400 m.
Geologic Background. Kujusan is a complex of stratovolcanoes and lava domes lying NE of Aso caldera in north-central Kyushu. The group consists of 16 andesitic lava domes, five andesitic stratovolcanoes, and one basaltic cone. Activity dates back about 150,000 years. Six major andesitic-to-dacitic tephra deposits, many associated with the growth of lava domes, have been recorded during the Holocene. Eruptive activity has migrated systematically eastward during the past 5000 years. The latest magmatic activity occurred about 1600 years ago, when Kurodake lava dome at the E end of the complex was formed. The first reports of historical eruptions were in the 17th and 18th centuries, when phreatic or hydrothermal activity occurred. There are also many hot springs and hydrothermal fields. A fumarole on Hosho lava dome was the site of a sulfur mine for at least 500 years. Two geothermal power plants are in operation at Kuju.
Information Contacts: Volcanological Division, Japan Meteorological Agency, 1-3-4 Ote-machi, Chiyoda-ku, Tokyo 100, Japan
Kusatsu-Shiranesan (Japan) — July 1996 Cite this Report
Kusatsu-Shiranesan
Japan
36.618°N, 138.528°E; summit elev. 2165 m
All times are local (unless otherwise noted)
Seismic activity increases
According to the Kusatsu-Shirane Volcano Observatory, Tokyo Institute of Technology, many small earthquakes were detected near the vent on 8 July.
Geologic Background. The Kusatsu-Shiranesan complex, located immediately north of Asama volcano, consists of a series of overlapping pyroclastic cones and three crater lakes. The andesitic-to-dacitic volcano was formed in three eruptive stages beginning in the early to mid-Pleistocene. The Pleistocene Oshi pyroclastic flow produced extensive welded tuffs and non-welded pumice that covers much of the E, S, and SW flanks. The latest eruptive stage began about 14,000 years ago. Historical eruptions have consisted of phreatic explosions from the acidic crater lakes or their margins. Fumaroles and hot springs that dot the flanks have strongly acidified many rivers draining from the volcano. The crater was the site of active sulfur mining for many years during the 19th and 20th centuries.
Information Contacts: Volcanological Division, Japan Meteorological Agency, 1-3-4 Ote-machi, Chiyoda-ku, Tokyo 100, Japan
Langila (Papua New Guinea) — July 1996 Cite this Report
Langila
Papua New Guinea
5.525°S, 148.42°E; summit elev. 1330 m
All times are local (unless otherwise noted)
Low-level activity persists
During July, Crater 2 continued its low-level eruptive activity and Crater 3 remained quiet. Crater 2 emitted gray to brown ash clouds, which rose several hundred meters above the crater. The ash clouds were blown to the NW and produced light ashfall. The emissions were accompanied by rumbling and explosion sounds. On most nights in July, variable glows were observed around the crater. Small incandescent lava fragments were ejected on 12 July.
Geologic Background. Langila, one of the most active volcanoes of New Britain, consists of a group of four small overlapping composite basaltic-andesitic cones on the lower E flank of the extinct Talawe volcano in the Cape Gloucester area of NW New Britain. A rectangular, 2.5-km-long crater is breached widely to the SE; Langila was constructed NE of the breached crater of Talawe. An extensive lava field reaches the coast on the N and NE sides of Langila. Frequent mild-to-moderate explosive eruptions, sometimes accompanied by lava flows, have been recorded since the 19th century from three active craters at the summit. The youngest and smallest crater (no. 3 crater) was formed in 1960 and has a diameter of 150 m.
Information Contacts: B. Talai, D. Lolok, and C. McKee, RVO.
Lascar
Chile
23.37°S, 67.73°W; summit elev. 5592 m
All times are local (unless otherwise noted)
Quiet emission of vapor
In July 1996, activity was observed during a two-week period. Vapor quietly puffed several times per minute. The white to bluish color and smell of the vapor suggested that it consisted mainly of H2O and SO2. No rumbling was perceptible 300 m below the S rim of the crater.
Geologic Background. Láscar is the most active volcano of the northern Chilean Andes. The andesitic-to-dacitic stratovolcano contains six overlapping summit craters. Prominent lava flows descend its NW flanks. An older, higher stratovolcano 5 km E, Volcán Aguas Calientes, displays a well-developed summit crater and a probable Holocene lava flow near its summit (de Silva and Francis, 1991). Láscar consists of two major edifices; activity began at the eastern volcano and then shifted to the western cone. The largest eruption took place about 26,500 years ago, and following the eruption of the Tumbres scoria flow about 9000 years ago, activity shifted back to the eastern edifice, where three overlapping craters were formed. Frequent small-to-moderate explosive eruptions have been recorded since the mid-19th century, along with periodic larger eruptions that produced ashfall hundreds of kilometers away. The largest historical eruption took place in 1993, producing pyroclastic flows to 8.5 km NW of the summit and ashfall in Buenos Aires.
Information Contacts: J. Sesiano, Département de Minéralogie, Université de Genève, 13 rue des Maraîchers, 1121 Genève 4, Switzerland.
Manam (Papua New Guinea) — July 1996 Cite this Report
Manam
Papua New Guinea
4.08°S, 145.037°E; summit elev. 1807 m
All times are local (unless otherwise noted)
Gentle release of white vapor; moderate to low seismicity
Low-level activity continued in July. Both summit craters (Main Crater and South Crater) gently released white vapor in low to moderate volumes. Seismicity was at moderate to low levels in July with ~700-1,700 low-frequency earthquakes recorded each day. No significant ground deformation was detected in July.
Geologic Background. The 10-km-wide island of Manam, lying 13 km off the northern coast of mainland Papua New Guinea, is one of the country's most active volcanoes. Four large radial valleys extend from the unvegetated summit of the conical basaltic-andesitic stratovolcano to its lower flanks. These valleys channel lava flows and pyroclastic avalanches that have sometimes reached the coast. Five small satellitic centers are located near the island's shoreline on the northern, southern, and western sides. Two summit craters are present; both are active, although most observed eruptions have originated from the southern crater, concentrating eruptive products during much of the past century into the SE valley. Frequent eruptions, typically of mild-to-moderate scale, have been recorded since 1616. Occasional larger eruptions have produced pyroclastic flows and lava flows that reached flat-lying coastal areas and entered the sea, sometimes impacting populated areas.
Information Contacts: B. Talai, D. Lolok, and C. McKee, RVO.
Nasudake
Japan
37.125°N, 139.963°E; summit elev. 1915 m
All times are local (unless otherwise noted)
Seismic activity increases
High seismicity was recorded on 14 July with a total of 14 earthquakes. The Nasu volcano group consists of a N-S cluster of stratovolcanoes and lava domes at the N end of the Kanto plain. Nasu volcanics date back at least 350,000 years. The youngest dome, Chausu-dake, is late Holocene in age and has had several severe explosive eruptions since its first historical eruption in the late 14th century.
Geologic Background. The Nasudake volcanic group consists of a N-S-trending cluster of stratovolcanoes and lava domes at the north end of the Kanto Plain. Volcanic activity dates back about 500,000 years. Growth of three large basaltic-to-dacitic stratovolcanoes, each lasting about 200,000 years, was followed by construction of three smaller andesitic stratovolcanoes, Asahidake, Futamatayama, and Chausudake. Activity during the last 55,000 years included the collapse of Asahidake volcano about 30-40,000 years ago, producing the massive Ofujisan debris-avalanche deposit, which covers a broad area SE of the volcano. The youngest volcano, Chausudake, began forming about 16,000 years ago. Six magmatic eruptions took place since then, the latest in 1408-1410 CE, when the Chausudake summit lava dome formed. These eruptions produced block-and-ash flows and concluded with the extrusion of lava flows. Smaller phreatic eruptions have occurred every few hundred years during the past 5,000 years.
Information Contacts: Volcanological Division, Japan Meteorological Agency, 1-3-4 Ote-machi, Chiyoda-ku, Tokyo 100, Japan
Niijima
Japan
34.397°N, 139.27°E; summit elev. 432 m
All times are local (unless otherwise noted)
Seismic activity increases
High seismicity around the island was recorded on 17 and 24-26 July. The largest earthquakes (M 4.0) were detected at 1250 and 1321 on 17 July.
Geologic Background. The elongated island of Niijima, SSW of Oshima, is 11 km long and only 2.5 km wide. Eight low rhyolitic lava domes are clustered in two groups at the northern and southern ends of the island, separated by an area of flat-topped domes and a low isthmus of pyroclastic deposits. The Mukaiyama complex on the south and the Atchiyama lava dome on the north were formed during eruptions in the 9th century CE, the last known activity. Shikineyama and Zinaito domes form small islands immediately to the SW and W, respectively, during earlier stages of volcanism. Earthquake swarms occurred during the 20th century.
Information Contacts: Volcanological Division, Japan Meteorological Agency, 1-3-4 Ote-machi, Chiyoda-ku, Tokyo 100, Japan
Ontakesan
Japan
35.893°N, 137.48°E; summit elev. 3067 m
All times are local (unless otherwise noted)
Seismic activity increases
High seismicity was recorded on 6 July with a total of 29 earthquakes.
Geologic Background. The massive Ontakesan stratovolcano, the second highest volcano in Japan, lies at the southern end of the Northern Japan Alps. Ascending this volcano is one of the major objects of religious pilgrimage in central Japan. It is constructed within a largely buried 4 x 5 km caldera and occupies the southern end of the Norikura volcanic zone, which extends northward to Yakedake volcano. The older volcanic complex consisted of at least four major stratovolcanoes constructed from about 680,000 to about 420,000 years ago, after which Ontakesan was inactive for more than 300,000 years. The broad, elongated summit of the younger edifice is cut by a series of small explosion craters along a NNE-trending line. Several phreatic eruptions post-date the roughly 7300-year-old Akahoya tephra from Kikai caldera. The first historical eruption took place in 1979 from fissures near the summit. A non-eruptive landslide in 1984 produced a debris avalanche and lahar that swept down valleys south and east of the volcano. Very minor phreatic activity caused a dusting of ash near the summit in 1991 and 2007. A significant phreatic explosion in September 2014, when a large number of hikers were at or near the summit, resulted in many fatalities.
Information Contacts: Volcanological Division, Seismological and Volcanological Department, Japan Meteorological Agency (JMA), 1-3-4 Ote-machi, Chiyoda-ku, Tokyo 100 Japan.
Rabaul (Papua New Guinea) — July 1996 Cite this Report
Rabaul
Papua New Guinea
4.2459°S, 152.1937°E; summit elev. 688 m
All times are local (unless otherwise noted)
Tavurvur eruption continues; seismic activity increases
During the first two weeks of July, Tavurvur emitted pale to medium gray clouds with low to moderate ash contents every 2-8 minutes. Some emissions were accompanied by roaring and weak explosion sounds. Projections of glowing lava fragments were observed at night. Eruptive activity changed on 13 June, when the rate of ash emissions decreased, and discrete, moderate to large explosions took place at longer intervals (about every 1-5 hours). The explosions emitted medium gray clouds with moderate ash contents, which rose to a height of 2-3 km before being blown to the N. Large lava blocks fell on the flanks of Tavurvur as far as the shoreline. After 13 June the rate of emissions increased slightly and ash clouds were released at variable intervals (minutes to hours). Few audible sounds accompanied the emissions. Between ash emissions, Tavurvur was generally quiet and continuously released bluish white vapor in low to moderate volumes. During July light ashfall was observed in Rabaul Town and the areas to its N.
Seismicity was at a moderate level for the first half of July. This was a continuation of the increased activity that began 29 June. Seismicity declined after 16 July, and remained low until the end of July. In total, 2,384 explosion earthquakes and three tremors were recorded in July, higher than those in June (1,565 explosion earthquakes and 10 tremors). On 29 July a sequence of high-frequency earthquakes began NE of the caldera. During a period of two and a half days (29-31 July), about 300 earthquakes took place. In a NE-trending zone crossing the caldera, 69 high-frequency earthquakes were recorded and the strongest one had a magnitude of about 3.0. In addition, five other high-frequency earthquakes took place elsewhere in the caldera.
An electronic tiltmeter on Matupit Island (2.5 km W of Tavurvur) recorded a deflationary tilt of 27 µrad towards Tavurvur during 23 June-31 July. A low inflationary tilt towards Tavurvur occurred after 3 July, but deflation took place on 27 July and continued until the end of July. Between 3 and 27 July about 20 µrad of inflationary tilt accumulated. On the other side of the caldera, Vulcan remained quiet throughout July and the Vulcan headland continued its slow deflation (<5 µrad/month tilt and 1 cm/month subsidence).
Geologic Background. The low-lying Rabaul caldera on the tip of the Gazelle Peninsula at the NE end of New Britain forms a broad sheltered harbor utilized by what was the island's largest city prior to a major eruption in 1994. The outer flanks of the asymmetrical shield volcano are formed by thick pyroclastic-flow deposits. The 8 x 14 km caldera is widely breached on the east, where its floor is flooded by Blanche Bay and was formed about 1,400 years ago. An earlier caldera-forming eruption about 7,100 years ago is thought to have originated from Tavui caldera, offshore to the north. Three small stratovolcanoes lie outside the N and NE caldera rims. Post-caldera eruptions built basaltic-to-dacitic pyroclastic cones on the caldera floor near the NE and W caldera walls. Several of these, including Vulcan cone, which was formed during a large eruption in 1878, have produced major explosive activity during historical time. A powerful explosive eruption in 1994 occurred simultaneously from Vulcan and Tavurvur volcanoes and forced the temporary abandonment of Rabaul city.
Information Contacts: B. Talai, D. Lolok, and C. McKee, Rabaul Volcano Observatory (RVO), P.O. Box 386, Rabaul, Papua New Guinea.
Shikotsu
Japan
42.688°N, 141.38°E; summit elev. 1320 m
All times are local (unless otherwise noted)
Seismic activity increases
The number of volcanic earthquakes beneath Tarumai stratovolcano (on the rim on Shikotsu caldera) increased in June and July. There were 13 events on both 8 and 10 June. A total of 64 earthquakes was recorded in July.
Geologic Background. The 13 x 15 km Shikotsu caldera, largely filled by the waters of Lake Shikotsu, was formed during one of Hokkaido's largest Quaternary eruptions about 31-34,000 years ago. The small andesitic Tarumaesan stratovolcano was then constructed on its SE rim and has been frequently active in historical time. Pyroclastic-flow deposits from Tarumaesan extend nearly to the Pacific coast. Two other Holocene post-caldera volcanoes, Fuppushidake (adjacent to Tarumaesan) and Eniwadake (on the opposite side of the caldera), occur on a line trending NW from Tarumaesan, and were constructed just inside the caldera rim. Minor eruptions took place from the summit of Eniwadake as late as the 17th century. The summit of Tarumaesan contains a small 1.5-km-wide caldera formed during two of Hokkaido's largest historical eruptions, in 1667 and 1739. Tarumaesan is now capped by a flat-topped summit lava dome that formed in 1909.
Information Contacts: Volcanological Division, Japan Meteorological Agency, 1-3-4 Ote-machi, Chiyoda-ku, Tokyo 100, Japan
Soufriere Hills (United Kingdom) — July 1996 Cite this Report
Soufriere Hills
United Kingdom
16.72°N, 62.18°W; summit elev. 915 m
All times are local (unless otherwise noted)
Dome growth continues, rockfalls and pyroclastic flows increase
The following condenses daily Scientific Reports of the Montserrat Volcano Observatory (MVO) for the period 1 July-1 August. Seismic and other significant events of this month are also summarized in table 9.
Table 9. Chronology of seismicity and other major events at Soufriere Hills, Montserrat, 1 July through 1 August. The observation period is a 24-hour interval beginning at 1600 the previous day. Courtesy of MVO.
| Date |
Volcano-tectonic |
Long-period |
Hybrid |
Rockfall |
Tremor Intensity |
Visual Observations |
| 01 Jul 1996 |
2 |
11 |
12 |
57 |
Low |
-- |
| 02 Jul 1996 |
1 |
1 |
18 |
64 |
Low |
-- |
| 03 Jul 1996 |
-- |
5 |
-- |
59 |
Low |
-- |
| 04 Jul 1996 |
-- |
5 |
25 |
52 |
Low |
One small ash cloud. |
| 05 Jul 1996 |
-- |
6 |
22 |
27 |
Low |
-- |
| 06 Jul 1996 |
-- |
9 |
6 |
11 |
High |
-- |
| 07 Jul 1996 |
2 |
12 |
6 |
22 |
High |
-- |
| 08 Jul 1996 |
1 |
3? |
3? |
3? |
High |
Hurricane Bertha. |
| 09 Jul 1996 |
1 |
1 |
5 |
9 |
Low |
-- |
| 10 Jul 1996 |
1 |
4 |
2 |
22 |
Low |
Two light ash clouds drifted W. |
| 11 Jul 1996 |
2 |
4 |
2 |
32 |
Low and High |
Flash flooding in Upper Fort Ghaut and Tar River Valley. Few very small pyroclastic flows. Light ash fall N of Plymouth. |
| 12 Jul 1996 |
4 |
10 |
11 |
9 |
Low |
-- |
| 13 Jul 1996 |
-- |
9 |
22 |
14 |
Low-to-Moderate |
-- |
| 14 Jul 1996 |
4 |
22 |
5 |
18 |
Low-to-Moderate |
-- |
| 15 Jul 1996 |
2 |
13 |
11 |
14 |
Low-to-Moderate |
One small ash cloud. |
| 16 Jul 1996 |
2 |
14 |
13 |
15 |
Low-to-Moderate |
One small ashfall in Brodericks. |
| 17 Jul 1996 |
-- |
8 |
14 |
24 |
Low |
Two small ash clouds drifted W. |
| 18 Jul 1996 |
-- |
12 |
17 |
16 |
Low |
One small ash cloud. |
| 19 Jul 1996 |
4 |
12 |
11 |
20 |
Low |
Four small ash clouds drifted W. |
| 20 Jul 1996 |
-- |
4 |
4 |
21 |
Low-to-Moderate |
One small ash cloud drifted W. |
| 21 Jul 1996 |
560 |
19 |
44 |
58 |
Low-to-Moderate |
Some small ash clouds. Few small pyroclastic flows. |
| 22 Jul 1996 |
82 |
105 |
114 |
94 |
Low-to-Moderate |
Some small ash clouds. Seven small pyroclastic flows. |
| 23 Jul 1996 |
15 |
24 |
101 |
150+ |
Low-to-Moderate |
Continuous ash clouds production. |
| 24 Jul 1996 |
15 |
1 |
9 |
~160 |
Low-to-Moderate |
One ash cloud. |
| 25 Jul 1996 |
106 |
9 |
35 |
~100 |
Low-to-Moderate |
One ash cloud drifted NW. |
| 26 Jul 1996 |
98 |
5 |
15 |
102 |
Low-to-Moderate |
Some very small ash clouds. |
| 27 Jul 1996 |
15 |
5 |
36 |
~100 |
Low-to-Moderate |
Some small ash clouds produced light ashfall toward W. |
| 28 Jul 1996 |
5 |
-- |
-- |
-- |
Low-to-Moderate |
Continuous ash cloud production resulted in heavy ashfall toward W. Several small pyroclastic flows. |
| 29 Jul 1996 |
-- |
-- |
-- |
-- |
Low-to-Moderate |
Moderate-sized ash cloud caused ashfall toward WNW. |
| 30 Jul 1996 |
20 |
6 |
clusters |
89 |
Low-to-Moderate |
One small ash cloud. Few small pyroclastic flows. |
| 31 Jul 1996 |
88 |
-- |
178 |
93 |
High |
Large number of pyroclastic flows produced continuous ash clouds and heavy ashfall. |
| 01 Aug 1996 |
20 |
36 |
215 |
117 |
Low |
Ashfall continued from the day before. |
Activity during 1-20 July. During the first 10 days of July activity remained at a low level, similar to the last week of June (BGVN 21:06). The most significant events were small-to-moderate size rockfalls from the growing S flank of the lava dome. The largest rockfalls produced small ash clouds that drifted with the prevailing winds, principally to the W of the volcano, toward Upper Gages, Amersham, and Plymouth.
Most of the time visibility was poor because of bad weather conditions. On 4 July a brief period of excellent viewing conditions confirmed that the dome was growing mainly in the S section of the crater. A huge slab extruded at the top SE part of the lava dome had a vertical crack down the middle; activity was concentrated around its base. Several large loose boulders were seen on the slopes of the dome. A small quantity of fresh dome material, mainly blocks, was observed in the upper reaches of Fort Ghaut. Moderate steaming and gas production were occurring from several areas.
Seismicity remained low, with volcano-tectonic events concentrated under English's Crater at depths of <2 km. Daily episodes of intermittent low-amplitude broadband tremor lasted from a few minutes to several hours. On 6 and 7 July periods of high-amplitude tremor were associated with heavy rainfall and an increase in steam venting at the summit.
On 7 July a brief period of good visibility revealed a second peak on the dome, and the accumulation of material behind Galways Wall. Intense fumarolic activity was occurring in the saddle between the two peaks. That day the elevation at the top of the dome was measured as 939 m. MVO estimated that the rate of dome growth had not changed significantly since early May.
On 10 July the seismic signals became longer and stronger. That same day a brief view of the dome showed that rockfall activity was spreading to other areas within the active SE section. More fresh material had accumulated down the S side of Castle Peak, while vigorous steaming was observed behind it. Fumaroles were active on the summit of the SE peak and in the saddle area between the two peaks inside English's Crater.
On 11 July, heavy rainfall caused flash floods in Fort Ghaut and possibly Tar River. A fine ashfall was reported in areas N of Plymouth and out to sea. Some small pyroclastic flows went into the Upper Tar River area. Helicopter inspections found that a significant amount of material had come down the N and S sides of Castle Peak and the fresh deposits were still steaming. Several erosion scars were observed on the NE flank of the dome, which was probably the source of the flows.
On 12 July the activity level decreased and it remained low throughout 20 July. However, the broadband tremor increased in amplitude, which was interpreted as a sign of increased steam emission; brief glimpses of the dome eventually revealed vigorous steaming, at times tainted with bluish vapor. That same day rockfall deposits were reported on the S and NE sides of the dome. The wet material on the NE side, around the whaleback feature, had dried out in places and two well-formed erosion chutes were present. Dome elevation was measured at 941 m.
On 17 July more new material was seen over Gages Wall and against Galways Wall. Observers on Perche's Mountain noted that most of the rockfall activity was on the SW flank of the dome.They also reported a small block-and-ash flow down the E flank of the dome around noon. On 19 July a field party working at Farrell's heard frequent rockfall activity and observed one rockfall descending the NE flank of the dome.
Activity during 21 July-1 August.On 21 July, the occurrence of 560 volcano-tectonic earthquakes marked a sharp increase in activity that lasted until August. These events originated from a shallow source beneath the crater, or just slightly NNE at <3 km. Long-period earthquakes were of moderate size whereas hybrid events were always small and occurred in a near-repetitive pattern at times so frequently to resemble continuous tremor. This type of activity had previously been associated with increased dome growth.
When weather conditions allowed, views of the dome revealed very vigorous steam emission from behind the old Castle Peak spine. On 25 July a large spine at the summit of the N peak of the dome was seen from Hermitage.
The rockfall activity, mainly on the NE flank of the dome, increased daily. Periods of near-continuous rockfalls were reported after 27 July. Most of the rockfalls were channeled down the NE-flank gully; none reached as far as the Tar River Soufriere. Small pyroclastic flows from the E and NE parts of the dome occurred daily into the Tar River Valley until they filled the entire valley area. Most of the local vegetation was set on fire by these flows. Associated ash clouds caused light to moderate ashfalls on 27, 28, and 29 July. One eyewitness reported on an electronic forum that during the ashfall of 28 July visibility in Plymouth was reduced to the less than one-half of a city block.
The dominating event on 31 July was a sequence of pyroclastic flows in the Tar River valley. It started at 1150 hours with a series of small- to moderate-sized rockfalls, which gradually led to the pyroclastic flow. Four flows occurred within a period of four minutes, with the last three eventually reaching the sea. A helicopter inspection confirmed that the pyroclastic flows were confined to the Tar River Valley. Light steam emission was observed from the area where the pyroclastic flows entered the sea and from the Tar River Valley.
The ash cloud generated by the pyroclastic flows attained a height of 6.4 km above sea level, according to Bramble Airport Control Tower. The ash cloud produced significant ashfalls in most areas of central Montserrat (Lees, Gages, St. George's Hill, Cork hill, Garibaldi Hill and Fox's Bay) and a far N as Woodlands. Lighter ashfalls were reported in Amersham and Plymouth. An eyewitness posted to an electronic forum that during the 31 July ashfall there was ". . . total darkness, the electricity had gone off . . . then it started to rain. The windows . . . facing the mountain became almost solid black. All the rest were covered with some mud . . . . When I got up to [my pickup the] windows, top, and hood were covered with ~1.5 inches [~3.8 cm] of mud."
That same day five episodes of high-amplitude, low-frequency, harmonic tremor were recorded at intervals of ~4 hours. After each period the signal decayed first into smaller hybrids and then to background noise. These signals could be related to movement of magma at shallow depth as the process of dome growth continued.
GPS, EDM, and COSPEC measurements. The poor weather conditions in July prevented most of these measurements. COSPEC data collected during an all-day experiment on 30 June showed no systematic variation in the SO2 production; on 10 July ~88 tons/day were measured.
A GPS survey carried out on the E side of the volcano on 7 July showed that no significant movement had taken place there since 18 June. Data collected on 10 July from Tar River, Harry's, O'Hara's, and Dagenham showed changes <5 mm in all lines since the survey started on 11 April.
EDM measurements showed an increase in the shortening rate from a few millimeters/day at the beginning of the month up to 1.5 cm/day toward the end of the month for the lines of the E triangle (Whites-Castle Peak-Long Ground) (table 10). Lengthening (1 and 2.3 cm) was measured on 30 July, when the dome elevation was found to be 923 m.
Table 10. EDM data from Soufriere Hills, Montserrat, 1 July through 1 August 1996. Courtesy of MVO.
| Date |
Shortening (-) or lengthening (+)/day(s) |
Line or triangle |
| 01 Jul 1996 |
-0 |
Amersham-Dagenham-Chances |
| 12 Jul 1996 |
-few mm |
Whites-Chances Peak-Long Ground |
| 18 Jul 1996 |
-1.5 cm/2 days |
Whites-Chances Peak |
| 18 Jul 1996 |
-1.5 cm/2 days |
Long Ground-Chances Peak |
| 24 Jul 1996 |
-8 cm/4 days |
Whites-Chances Peak |
| 24 Jul 1996 |
-8 cm/4 days |
Long Ground-Chances Peak |
| 26 Jul 1996 |
-3 cm/2 days |
Whites-Chances Peak |
| 26 Jul 1996 |
-3 cm/2 days |
Long Ground-Chances Peak |
| 29 Jul 1996 |
-3 cm/3 days |
Whites-Chances Peak |
| 29 Jul 1996 |
-1.3 cm/3 days |
Long Ground-Chances Peak |
| 29 Jul 1996 |
-17.5 cm/14 days |
Tar River-Chances Peak |
| 30 Jul 1996 |
+1 cm/day |
Whites-Chances Peak |
| 30 Jul 1996 |
+2.3 cm/day |
Long Ground-Chances Peak |
| 01 Aug 1996 |
-4 cm/day |
Whites-Chances Peak |
Geologic Background. The complex, dominantly andesitic Soufrière Hills volcano occupies the southern half of the island of Montserrat. The summit area consists primarily of a series of lava domes emplaced along an ESE-trending zone. The volcano is flanked by Pleistocene complexes to the north and south. English's Crater, a 1-km-wide crater breached widely to the east by edifice collapse, was formed about 2000 years ago as a result of the youngest of several collapse events producing submarine debris-avalanche deposits. Block-and-ash flow and surge deposits associated with dome growth predominate in flank deposits, including those from an eruption that likely preceded the 1632 CE settlement of the island, allowing cultivation on recently devegetated land to near the summit. Non-eruptive seismic swarms occurred at 30-year intervals in the 20th century, but no historical eruptions were recorded until 1995. Long-term small-to-moderate ash eruptions beginning in that year were later accompanied by lava-dome growth and pyroclastic flows that forced evacuation of the southern half of the island and ultimately destroyed the capital city of Plymouth, causing major social and economic disruption.
Information Contacts: Montserrat Volcano Observatory (MVO), c/o Chief Minister's Office, PO Box 292, Plymouth, Montserrat (URL: http://www.mvo.ms/).
Suwanosejima (Japan) — July 1996 Cite this Report
Suwanosejima
Japan
29.638°N, 129.714°E; summit elev. 796 m
All times are local (unless otherwise noted)
Explosive activity continues
According to Kagoshima Prefectural Government, a weak ash eruption was observed on 14 July. On 22 July a civil aviator reported an ash cloud at ~1.5 km altitude.
Geologic Background. The 8-km-long island of Suwanosejima in the northern Ryukyu Islands consists of an andesitic stratovolcano with two active summit craters. The summit is truncated by a large breached crater extending to the sea on the E flank that was formed by edifice collapse. One of Japan's most frequently active volcanoes, it was in a state of intermittent Strombolian activity from Otake, the NE summit crater, between 1949 and 1996, after which periods of inactivity lengthened. The largest recorded eruption took place in 1813-14, when thick scoria deposits covered residential areas, and the SW crater produced two lava flows that reached the western coast. At the end of the eruption the summit of Otake collapsed, forming a large debris avalanche and creating an open collapse scarp extending to the eastern coast. The island remained uninhabited for about 70 years after the 1813-1814 eruption. Lava flows reached the eastern coast of the island in 1884. Only about 50 people live on the island.
Information Contacts: Volcanological Division, Japan Meteorological Agency, 1-3-4 Ote-machi, Chiyoda-ku, Tokyo 100, Japan
Ubinas
Peru
16.345°S, 70.8972°W; summit elev. 5608 m
All times are local (unless otherwise noted)
Increased fumarolic activity prompts seismic and other monitoring
Ubinas stratovolcano (figure 1) is known for persistent weak fumarolic activity; this appeared to increase after December 1995 and was vigorous during April 1996. During April five steam vents were located along a ~N40°W-trending fault cutting across the crater's floor and walls. White steam from the fumaroles commonly rose 100-500 m above the crater and occasionally rose 1-1.5 km above the caldera rim. Seismic monitoring during April detected ~50-70 events/day, a suggestion of increased seismicity.
These observations led to designation of the hazard level as "Yellow," and this information was sent to local civil authorities. Scientists installed seismic instruments (three digital PDR-1 Kinemetrics and one visual MEQ-600) on the volcano's W, N, and SE flanks at ~4,800 m elevation.
Continued field work was aimed at assessing hazards and outlining preliminary hazard-zone maps. Potential hazards include debris avalanches, Plinian tephra, phreatic outbursts, and pyroclastic flows and lahars. Debris-avalanche deposits crop out in the Rio Ubinas as far as 10 km downstream. Future debris avalanches could occur if the caldera headwall, which is only 120-400 m thick, failed due to dome extrusion or seismic loading.
Widespread Plinian pumice-fall deposits include some of Holocene age. The eruption that formed the summit caldera left a conspicuous 3-m-thick Plinian tephra chiefly distributed towards the SSE, in the direction of the village of Ubinas (6 km from the vent). At least three Ubinas tephra-fall layers postdate the 1600 AD eruption of Huaynaputina (a center located 25 km S, figure 1). In contrast to the Plinian fall deposits, the intra-caldera deposits are nearly all ash and lapilli fallout of phreatomagmatic and phreatic origin.
Snowfields on the S-facing summit area above 5,000 m elevation remain during December through July and thus could be melted to generate S- and SE-flank debris flows. Pyroclastic flows could follow the same routes. Recent scoria-flow deposits remaining on the steep NW and N flanks suggest that pyroclastic flows may spill over the lower breaches of the caldera rim and down these slopes.
A 27 June news report in the Lima paper El Comercio briefly mentioned ongoing deformation and seismic studies; it included a panoramic view of the summit's nested craters with the inner pit crater emitting steam. The article also pointed out that the district of Ubinas has ~5,000 inhabitants.
Ubinas (also known as Uvinas and Uvillas) is Perú's most active volcano. Holocene lava flows cover its flanks, but the historical record, which extends back to the mid-1500's, contains evidence of minor explosive eruptions. Ubinas rises about 1,300 m above the altiplano of the Cordillera Occidental. Its summit crater is 200-400 m deep, ~1.5 km in diameter, and hosts a smaller inner crater.
Geologic Background. The truncated appearance of Ubinas, Perú's most active volcano, is a result of a 1.4-km-wide crater at the summit. It is the northernmost of three young volcanoes located along a regional structural lineament about 50 km behind the main volcanic front. The growth and destruction of Ubinas I was followed by construction of Ubinas II beginning in the mid-Pleistocene. The upper slopes of the andesitic-to-rhyolitic Ubinas II stratovolcano are composed primarily of andesitic and trachyandesitic lava flows and steepen to nearly 45°. The steep-walled, 150-m-deep summit crater contains an ash cone with a 500-m-wide funnel-shaped vent that is 200 m deep. Debris-avalanche deposits from the collapse of the SE flank about 3,700 years ago extend 10 km from the volcano. Widespread Plinian pumice-fall deposits include one from about 1,000 years ago. Holocene lava flows are visible on the flanks, but activity documented since the 16th century has consisted of intermittent minor-to-moderate explosive eruptions.
Information Contacts: J-C. Thouret and J-L. Le Pennec, ORSTOM (UR14)-Instituto Geofísico del Perú (IGP), Calle Calatrava 216, Urbinizacion Camino Real, La Molina, Lima 100, Perú; R. Woodman, IGP Lima, and O. Macedo, IGP Volcano and Geophysics Observatory, Cayma-Arequipa, Perú.