Recently Published Bulletin Reports
Erebus (Antarctica) Lava lake remains active; most thermal alerts recorded since 2019
Rincon de la Vieja (Costa Rica) Frequent phreatic explosions during July-December 2023
Bezymianny (Russia) Explosion on 18 October 2023 sends ash plume 8 km high; lava flows and incandescent avalanches
Kilauea (United States) Low-level lava effusions in the lava lake at Halema’uma’u during July-December 2022
Nyamulagira (DR Congo) Lava flows and thermal activity during May-October 2023
Bagana (Papua New Guinea) Explosions, ash plumes, ashfall, and lava flows during April-September 2023
Mayon (Philippines) Lava flows, pyroclastic flows, ash emissions, and seismicity during April-September 2023
Nishinoshima (Japan) Eruption plumes and gas-and-steam plumes during May-August 2023
Krakatau (Indonesia) White gas-and-steam plumes and occasional ash plumes during May-August 2023
Villarrica (Chile) Strombolian activity, gas-and-ash emissions, and crater incandescence during April-September 2023
Merapi (Indonesia) Frequent incandescent avalanches during April-September 2023
Ebeko (Russia) Moderate explosive activity with ash plumes continued during June-November 2023
Erebus (Antarctica) — January 2024  Cite this Report
Erebus
Antarctica
77.53°S, 167.17°E; summit elev. 3794 m
All times are local (unless otherwise noted)
Lava lake remains active; most thermal alerts recorded since 2019
The lava lake in the summit crater of Erebus has been active since at least 1972. Located in Antarctica overlooking the McMurdo Station on Ross Island, it is the southernmost active volcano on the planet. Because of the remote location, activity is primarily monitored by satellites. This report covers activity during 2023.
The number of thermal alerts recorded by the Hawai'i Institute of Geophysics and Planetology’s MODVOLC Thermal Alerts System increased considerably in 2023 compared to the years 2020-2022 (table 9). In contrast to previous years, the MODIS instruments aboard the Aqua and Terra satellites captured data from Erebus every month during 2023. Consistent with previous years, the lowest number of anomalous pixels were recorded in January, November, and December.
Table 9. Number of monthly MODIS-MODVOLC thermal alert pixels recorded at Erebus during 2017-2023. See BGVN 42:06 for data from 2000 through 2016. The table was compiled using data provided by the HIGP – MODVOLC Thermal Alerts System.
| Year |
Jan |
Feb |
Mar |
Apr |
May |
Jun |
Jul |
Aug |
Sep |
Oct |
Nov |
Dec |
SUM |
| 2017 |
0 |
21 |
9 |
0 |
0 |
1 |
11 |
61 |
76 |
52 |
0 |
3 |
234 |
| 2018 |
0 |
21 |
58 |
182 |
55 |
17 |
137 |
172 |
103 |
29 |
0 |
0 |
774 |
| 2019 |
2 |
21 |
162 |
151 |
55 |
56 |
75 |
53 |
29 |
19 |
1 |
0 |
624 |
| 2020 |
0 |
2 |
16 |
18 |
4 |
4 |
1 |
3 |
18 |
3 |
1 |
6 |
76 |
| 2021 |
0 |
9 |
1 |
0 |
2 |
56 |
46 |
47 |
35 |
52 |
5 |
3 |
256 |
| 2022 |
1 |
13 |
55 |
22 |
15 |
32 |
39 |
19 |
31 |
11 |
0 |
0 |
238 |
| 2023 |
2 |
33 |
49 |
82 |
41 |
32 |
70 |
64 |
42 |
17 |
5 |
11 |
448 |
Sentinel-2 infrared images showed one or two prominent heat sources within the summit crater, accompanied by adjacent smaller sources, similar to recent years (see BGVN 46:01, 47:02, and 48:01). A unique image was obtained on 25 November 2023 by the OLI-2 (Operational Land Imager-2) on Landsat 9, showing the upper part of the volcano surrounded by clouds (figure 32).
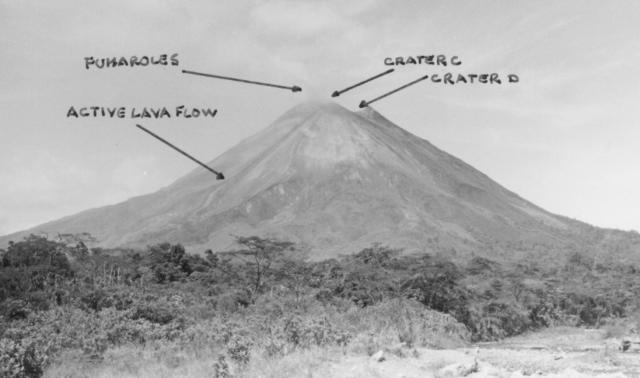
Geologic Background. Mount Erebus, the world's southernmost historically active volcano, overlooks the McMurdo research station on Ross Island. It is the largest of three major volcanoes forming the crudely triangular Ross Island. The summit of the dominantly phonolitic volcano has been modified by one or two generations of caldera formation. A summit plateau at about 3,200 m elevation marks the rim of the youngest caldera, which formed during the late-Pleistocene and within which the modern cone was constructed. An elliptical 500 x 600 m wide, 110-m-deep crater truncates the summit and contains an active lava lake within a 250-m-wide, 100-m-deep inner crater; other lava lakes are sometimes present. The glacier-covered volcano was erupting when first sighted by Captain James Ross in 1841. Continuous lava-lake activity with minor explosions, punctuated by occasional larger Strombolian explosions that eject bombs onto the crater rim, has been documented since 1972, but has probably been occurring for much of the volcano's recent history.
Information Contacts: Hawai'i Institute of Geophysics and Planetology (HIGP) - MODVOLC Thermal Alerts System, School of Ocean and Earth Science and Technology (SOEST), Univ. of Hawai'i, 2525 Correa Road, Honolulu, HI 96822, USA (URL: http://modis.higp.hawaii.edu/); Copernicus Browser, Copernicus Data Space Ecosystem, European Space Agency (URL: https://dataspace.copernicus.eu/browser/); NASA Earth Observatory, EOS Project Science Office, NASA Goddard Space Flight Center, Goddard, Maryland, USA (URL: https://earthobservatory.nasa.gov/images/152134/erebus-breaks-through).
Rincon de la Vieja (Costa Rica) — January 2024 Cite this Report
Rincon de la Vieja
Costa Rica
10.83°N, 85.324°W; summit elev. 1916 m
All times are local (unless otherwise noted)
Frequent phreatic explosions during July-December 2023
Rincón de la Vieja is a volcanic complex in Costa Rica with a hot convecting acid lake that exhibits frequent weak phreatic explosions, gas-and-steam emissions, and occasional elevated sulfur dioxide levels (BGVN 45:10, 46:03, 46:11). The current eruption period began June 2021. This report covers activity during July-December 2023 and is based on weekly bulletins and occasional daily reports from the Observatorio Vulcanologico Sismologica de Costa Rica-Universidad Nacional (OVSICORI-UNA).
Numerous weak phreatic explosions continued during July-December 2023, along with gas-and-steam emissions and plumes that rose as high as 3 km above the crater rim. Many weekly OVSICORI-UNA bulletins included the previous week's number of explosions and emissions (table 9). For many explosions, the time of explosion was given (table 10). Frequent seismic activity (long-period earthquakes, volcano-tectonic earthquakes, and tremor) accompanied the phreatic activity.
Table 9. Number of reported weekly phreatic explosions and gas-and-steam emissions at Rincón de la Vieja, July-December 2023. Counts are reported for the week before the Weekly Bulletin date; not all reports included these data. Courtesy of OVSICORI-UNA.
| OVSICORI Weekly Bulletin |
Number of explosions |
Number of emissions |
| 28 Jul 2023 |
6 |
14 |
| 4 Aug 2023 |
10 |
12 |
| 1 Sep 2023 |
13 |
11 |
| 22 Sep 2023 |
12 |
13 |
| 29 Sep 2023 |
6 |
11 |
| 6 Oct 2023 |
12 |
5 |
| 13 Oct 2023 |
7 |
9 |
| 20 Oct 2023 |
1 |
15 |
| 27 Oct 2023 |
3 |
23 |
| 3 Nov 2023 |
3 |
10 |
| 17 Nov 2023 |
0 |
Some |
| 24 Nov 2023 |
0 |
14 |
| 8 Dec 2023 |
4 |
16 |
| 22 Dec 2023 |
8 |
18 |
Table 10. Summary of activity at Rincón de la Vieja during July-December 2023. Weak phreatic explosions and gas emissions are noted where the time of explosion was indicated in the weekly or daily bulletins. Height of plumes or emissions are distance above the crater rim. Courtesy of OVSICORI-UNA.
| Date |
Time |
Description of Activity |
| 1 Jul 2023 |
0156 |
Explosion. |
| 2 Jul 2023 |
0305 |
Explosion. |
| 4 Jul 2023 |
0229, 0635 |
Event at 0635 produced a gas-and-steam plume that rose 700 m and drifted W; seen by residents in Liberia (21 km SW). |
| 9 Jul 2023 |
1843 |
Explosion. |
| 21 Jul 2023 |
0705 |
Explosion. |
| 26 Jul 2023 |
1807 |
Explosion. |
| 28 Jul 2023 |
0802 |
Explosion generated a gas-and-steam plume that rose 500 m. |
| 30 Jul 2023 |
1250 |
Explosion. |
| 31 Jul 2023 |
2136 |
Explosion. |
| 11 Aug 2023 |
0828 |
Explosion. |
| 18 Aug 2023 |
1304 |
Explosion. |
| 21 Aug 2023 |
1224 |
Explosion generated gas-and-steam plumes rose 500-600 m. |
| 22 Aug 2023 |
0749 |
Explosion generated gas-and-steam plumes rose 500-600 m. |
| 24 Aug 2023 |
1900 |
Explosion. |
| 25 Aug 2023 |
0828 |
Event produced a steam-and-gas plume that rose 3 km and drifted NW. |
| 27-28 Aug 2023 |
0813 |
Four small events; the event at 0813 on 28 August lasted two minutes and generated a steam-and-gas plume that rose 2.5 km. |
| 1 Sep 2023 |
1526 |
Explosion generated plume that rose 2 km and ejected material onto the flanks. |
| 2-3 Sep 2023 |
- |
Small explosions detected in infrasound data. |
| 4 Sep 2023 |
1251 |
Gas-and-steam plume rose 1 km and drifted W. |
| 7 Nov 2023 |
1113 |
Explosion. |
| 8 Nov 2023 |
0722 |
Explosion. |
| 12 Nov 2023 |
0136 |
Small gas emissions. |
| 14 Nov 2023 |
0415 |
Small gas emissions. |
According to OVSICORI-UNA, during July-October the average weekly sulfur dioxide (SO2) flux ranged from 68 to 240 tonnes/day. However, in mid-November the flux increased to as high as 334 tonnes/day, the highest value measured in recent years. The high SO2 flux in mid-November was also detected by the TROPOMI instrument on the Sentinel-5P satellite (figure 43).
Geologic Background. Rincón de la Vieja, the largest volcano in NW Costa Rica, is a remote volcanic complex in the Guanacaste Range. The volcano consists of an elongated, arcuate NW-SE-trending ridge constructed within the 15-km-wide early Pleistocene Guachipelín caldera, whose rim is exposed on the south side. Sometimes known as the "Colossus of Guanacaste," it has an estimated volume of 130 km3 and contains at least nine major eruptive centers. Activity has migrated to the SE, where the youngest-looking craters are located. The twin cone of Santa María volcano, the highest peak of the complex, is located at the eastern end of a smaller, 5-km-wide caldera and has a 500-m-wide crater. A Plinian eruption producing the 0.25 km3 Río Blanca tephra about 3,500 years ago was the last major magmatic eruption. All subsequent eruptions, including numerous historical eruptions possibly dating back to the 16th century, have been from the prominent active crater containing a 500-m-wide acid lake located ENE of Von Seebach crater.
Information Contacts: Observatorio Vulcanológico Sismológica de Costa Rica-Universidad Nacional (OVSICORI-UNA), Apartado 86-3000, Heredia, Costa Rica (URL: http://www.ovsicori.una.ac.cr/); NASA Global Sulfur Dioxide Monitoring Page, Atmospheric Chemistry and Dynamics Laboratory, NASA Goddard Space Flight Center (NASA/GSFC), 8800 Greenbelt Road, Goddard MD 20771, USA (URL: https://so2.gsfc.nasa.gov/).
Bezymianny (Russia) — November 2023 Cite this Report
Bezymianny
Russia
55.972°N, 160.595°E; summit elev. 2882 m
All times are local (unless otherwise noted)
Explosion on 18 October 2023 sends ash plume 8 km high; lava flows and incandescent avalanches
Bezymianny, located on Russia’s Kamchatka Peninsula, has had eruptions since 1955 characterized by dome growth, explosions, pyroclastic flows, ash plumes, and ashfall. Activity during November 2022-April 2023 included gas-and-steam emissions, lava dome collapses generating avalanches, and persistent thermal activity. Similar eruptive activity continued from May through October 2023, described here based on information from weekly and daily reports of the Kamchatka Volcano Eruptions Response Team (KVERT), notices from Tokyo VAAC (Volcanic Ash Advisory Center), and from satellite data.
Overall activity decreased after the strong period of activity in late March through April 2023, which included ash explosions during 29 March and 7-8 April 2023 that sent plumes as high as 10-12 km altitude, along with dome growth and lava flows (BGVN 48:05). This reduced activity can be seen in the MIROVA thermal detection system graph (figure 56), which was consistent with data from the MODVOLC thermal detection system and with Sentinel-2 satellite images that showed persistent hotspots in the summit crater when conditions allowed observations. A renewed period of strong activity began in mid-October 2023.
Activity increased significantly on 17 October 2023 when large collapses began during 0700-0830 on the E flanks of the lava dome and continued to after 0930 the next day (figure 57). Ash plumes rose to an altitude of 4.5-5 km, extending 220 km NNE by 18 October. A large explosion at 1630 on 18 October produced an ash plume that rose to an altitude of 11 km (8 km above the summit) and drifted NNE and then NW, extending 900 km NW within two days at an altitude of 8 km. Minor ashfall was noted in Kozyrevsk (45 km WNW). At 0820 on 20 October an ash plume was identified in satellite images drifting 100 km ENE at altitudes of 4-4.5 km.
Lava flows and hot avalanches from the dome down the SE flank continued over the next few days, including 23 October when clear conditions allowed good observations (figures 58 and 59). A large thermal anomaly was observed over the volcano through 24 October, and in the summit crater on 30 October (figure 60). Strong fumarolic activity continued, with numerous avalanches and occasional incandescence. By the last week of October, volcanic activity had decreased to a level consistent with that earlier in the reporting period.
Aviation warnings were frequently updated during 17-20 October. KVERT issued a Volcano Observatory Notice for Aviation (VONA) on 17 October at 1419 and 1727 (0219 and 0527 UTC) raising the Aviation Color Code (ACC) from Yellow to Orange (second highest level). The next day, KVERT issued a VONA at 1705 (0505 UTC) raising the ACC to Red (highest level) but lowered it back to Orange at 2117 (0917 UTC). After another decrease to Yellow and back to Orange, the ACC was reduced to Yellow on 20 October at 1204 (0004 UTC). In addition, the Tokyo VAAC issued a series of Volcanic Ash Advisories beginning on 16 October and continuing through 30 October.
Geologic Background. The modern Bezymianny, much smaller than its massive neighbors Kamen and Kliuchevskoi on the Kamchatka Peninsula, was formed about 4,700 years ago over a late-Pleistocene lava-dome complex and an edifice built about 11,000-7,000 years ago. Three periods of intensified activity have occurred during the past 3,000 years. The latest period, which was preceded by a 1,000-year quiescence, began with the dramatic 1955-56 eruption. This eruption, similar to that of St. Helens in 1980, produced a large open crater that was formed by collapse of the summit and an associated lateral blast. Subsequent episodic but ongoing lava-dome growth, accompanied by intermittent explosive activity and pyroclastic flows, has largely filled the 1956 crater.
Information Contacts: Kamchatka Volcanic Eruptions Response Team (KVERT), Far Eastern Branch, Russian Academy of Sciences, 9 Piip Blvd., Petropavlovsk-Kamchatsky, 683006, Russia (URL: http://www.kscnet.ru/ivs/kvert/); Kamchatka Volcanological Station, Kamchatka Branch of Geophysical Survey, (KB GS RAS), Klyuchi, Kamchatka Krai, Russia (URL: http://volkstat.ru/); Tokyo Volcanic Ash Advisory Center (VAAC), 1-3-4 Otemachi, Chiyoda-ku, Tokyo 100-8122, Japan (URL: http://ds.data.jma.go.jp/svd/vaac/data/); Hawai'i Institute of Geophysics and Planetology (HIGP) - MODVOLC Thermal Alerts System, School of Ocean and Earth Science and Technology (SOEST), Univ. of Hawai'i, 2525 Correa Road, Honolulu, HI 96822, USA (URL: http://modis.higp.hawaii.edu/); MIROVA (Middle InfraRed Observation of Volcanic Activity), a collaborative project between the Universities of Turin and Florence (Italy) supported by the Centre for Volcanic Risk of the Italian Civil Protection Department (URL: http://www.mirovaweb.it/); Copernicus Browser, Copernicus Data Space Ecosystem, European Space Agency (URL: https://dataspace.copernicus.eu/browser/).chr
Kilauea (United States) — January 2023 Cite this Report
Kilauea
United States
19.421°N, 155.287°W; summit elev. 1222 m
All times are local (unless otherwise noted)
Low-level lava effusions in the lava lake at Halema’uma’u during July-December 2022
Kīlauea is the southeastern-most volcano in Hawaii and overlaps the E flank of the Mauna Loa volcano. Its East Rift Zone (ERZ) has been intermittently active for at least 2,000 years. An extended eruption period began in January 1983 and was characterized by open lava lakes and lava flows from the summit caldera and the East Rift Zone. During May 2018 magma migrated into the Lower East Rift Zone (LERZ) and opened 24 fissures along a 6-km-long NE-trending fracture zone that produced lava flows traveling in multiple directions. As lava emerged from the fissures, the lava lake at Halema'uma'u drained and explosions sent ash plumes to several kilometers altitude (BGVN 43:10).
The current eruption period started during September 2021 and has recently been characterized by lava effusions, spatter, and sulfur dioxide emissions in the active Halema’uma’u lava lake (BGVN 47:08). Lava effusions, some spatter, and sulfur dioxide emissions have continued during this reporting period of July through December 2022 using daily reports, volcanic activity notices, and abundant photo, map, and video data from the US Geological Survey's (USGS) Hawaiian Volcano Observatory (HVO).
Summary of activity during July-December 2022. Low-level effusions have continued at the western vent of the Halema’uma’u crater during July through early December 2022. Occasional weak ooze-outs (also called lava break outs) would occur along the margins of the crater floor. The overall level of the active lava lake throughout the reporting period gradually increased due to infilling, however it stagnated in mid-September (table 13). During September through November, activity began to decline, though lava effusions persisted at the western vent. By 9 December, the active part of the lava lake had completely crusted over, and incandescence was no longer visible.
Table 13. Summary of measurements taken during overflights at Kīlauea that show a gradual increase in the active lava lake level and the volume of lava effused since 29 September 2021. Lower activity was reported during September-October. Data collected during July-December 2022. Courtesy of HVO.
| Date: |
Level of the active lava lake (m): |
Cumulative volume of lava effused (million cubic meters): |
| 7 Jul 2022 |
130 |
95 |
| 19 Jul 2022 |
133 |
98 |
| 4 Aug 2022 |
136 |
102 |
| 16 Aug 2022 |
137 |
104 |
| 12 Sep 2022 |
143 |
111 |
| 5 Oct 2022 |
143 |
111 |
| 28 Oct 2022 |
143 |
111 |
Activity during July 2022. Lava effusions were reported from the western vent in the Halema’uma’u crater, along with occasional weak ooze-outs along the margins of the crater floor. The height of the lava lake was variable due to deflation-inflation tilt events; for example, the lake level dropped approximately 3-4 m during a summit deflation-inflation event reported on 1 July. Webcam images taken during the night of 6-12 July showed intermittent low-level spattering at the western vent that rose less than 10 m above the vent (figure 519). Measurements made during an overflight on 7 July indicated that the crater floor was infilled about 130 m and that 95 million cubic meters of lava had been effused since 29 September 2021. A single, relatively small lava ooze-out was active to the S of the lava lake. Around midnight on 8 July there were two brief periods of lava overflow onto the lake margins. On 9 July lava ooze-outs were reported near the SE and NE edges of the crater floor and during 10-11 July they occurred near the E, NE, and NW edges. On 16 July crater incandescence was reported, though the ooze-outs and spattering were not visible. On 18 July overnight webcam images showed incandescence in the western vent complex and two ooze-outs were reported around 0000 and 0200 on 19 July. By 0900 there were active ooze-outs along the SW edge of the crater floor. Measurements made from an overflight on 19 July indicated that the crater floor was infilled about 133 m and 98 million cubic meters of lava had erupted since 29 September 2021 (figure 520). On 20 July around 1600 active ooze-outs were visible along the N edge of the crater, which continued through the next day. Extensive ooze-outs occurred along the W margin during 24 July until 1900; on 26 July minor ooze-outs were noted along the N margin. Minor spattering was visible on 29 July along the E margin of the lake. The sulfur dioxide emission rates ranged 650-2,800 tons per day (t/d), the higher of which was measured on 8 July (figure 519).
Activity during August 2022. The eruption continued in the Halema’uma’u crater at the western vent. According to HVO the lava in the active lake remained at the level of the bounding levees. Occasional minor ooze-outs were observed along the margins of the crater floor. Strong nighttime crater incandescence was visible after midnight on 6 August over the western vent cone. During 6-7 August scattered small lava lobes were active along the crater floor and incandescence persisted above the western vent through 9 August. During 7-9 August HVO reported a single lava effusion source was active along the NW margin of the crater floor. Measurements from an overflight on 4 August indicated that the crater floor was infilled about 136 m total and that 102 million cubic meters of lava had been erupted since the start of the eruption. Lava breakouts were reported along the N, NE, E, S, and W margins of the crater during 10-16 August. Another overflight survey conducted on 16 August indicated that the crater floor infilled about 137 m and 104 million cubic meters of lava had been erupted since September 2021. Measured sulfur dioxide emissions rates ranged 1,150-2,450 t/d, the higher of which occurred on 8 August.
Activity during September 2022. During September, lava effusion continued from the western vent into the active lava lake and onto the crater floor. Intermittent minor ooze-outs were reported through the month. A small ooze-out was visible on the W crater floor margin at 0220 on 2 September, which showed decreasing surface activity throughout the day, but remained active through 3 September. On 3 September around 1900 a lava outbreak occurred along the NW margin of the crater floor but had stopped by the evening of 4 September. Field crews monitoring the summit lava lake on 9 September observed spattering on the NE margin of the lake that rose no higher than 10 m, before falling back onto the lava lake crust (figure 521). Overflight measurements on 12 September indicated that the crater floor was infilled a total of 143 m and 111 million cubic meters of lava had been erupted since September 2021. Extensive breakouts in the W and N part of the crater floor were reported at 1600 on 20 September and continued into 26 September. The active part of the lava lake dropped by 10 m while other parts of the crater floor dropped by several meters. Summit tiltmeters recorded a summit seismic swarm of more than 80 earthquakes during 1500-1800 on 21 September, which occurred about 1.5 km below Halema’uma’u; a majority of these were less than Mw 2. By 22 September the active part of the lava lake was infilled about 2 m. On 23 September the western vent areas exhibited several small spatter cones with incandescent openings, along with weak, sporadic spattering (figure 522). The sulfur dioxide emission rate ranged from 930 t/d to 2,000 t/d, the higher of which was measured on 6 September.
Activity during October 2022. Activity during October declined slightly compared to previous months, though lava effusions persisted from the western vent into the active lava lake and onto the crater floor during October (figure 523). Slight variations in the lava lake were noted throughout the month. HVO reported that around 0600 on 3 October the level of the lava lake has lowered slightly. Overflight measurements taken on 5 October indicated that the crater floor was infilled a total of about 143 m and that 111 million cubic meters of lava had been effused since September 2021. During 6-7 October the lake gradually rose 0.5 m. Sulfur dioxide measurements made on 22 October had an emission rate of 700 t/d. Another overflight taken on 28 October showed that there was little to no change in the elevation of the crater floor: the crater floor was infilled a total of 143 m and 111 million cubic meters of lava had erupted since the start of the eruption.
Activity during November 2022. Activity remained low during November, though HVO reported that lava from the western vent continued to effuse into the active lava lake and onto the crater floor throughout the month. The rate of sulfur dioxide emissions during November ranged from 300-600 t/d, the higher amount of which occurred on 9 November.
Activity during December 2022. Similar low activity was reported during December, with lava effusing from the western vent into the active lava lake and onto the crater floor. During 4-5 December the active part of the lava lake was slightly variable in elevation and fluctuated within 1 m. On 9 December HVO reported that lava was no longer erupting from the western vent in the Halema’uma’u crater and that sulfur dioxide emissions had returned to near pre-eruption background levels; during 10-11 December, the lava lake had completely crusted over, and no incandescence was visible (figure 524). Time lapse camera images covering the 4-10 December showed that the crater floor showed weak deflation and no inflation. Some passive events of crustal overturning were reported during 14-15 December, which brought fresh incandescent lava to the lake surface. The sulfur dioxide emission rate was approximately 200 t/d on 14 December. A smaller overturn event on 17 December and another that occurred around 0000 and into the morning of 20 December were also detected. A small seismic swarm was later detected on 30 December.
Geologic Background. Kilauea overlaps the E flank of the massive Mauna Loa shield volcano in the island of Hawaii. Eruptions are prominent in Polynesian legends; written documentation since 1820 records frequent summit and flank lava flow eruptions interspersed with periods of long-term lava lake activity at Halemaumau crater in the summit caldera until 1924. The 3 x 5 km caldera was formed in several stages about 1,500 years ago and during the 18th century; eruptions have also originated from the lengthy East and Southwest rift zones, which extend to the ocean in both directions. About 90% of the surface of the basaltic shield volcano is formed of lava flows less than about 1,100 years old; 70% of the surface is younger than 600 years. The long-term eruption from the East rift zone between 1983 and 2018 produced lava flows covering more than 100 km2, destroyed hundreds of houses, and added new coastline.
Information Contacts: Hawaiian Volcano Observatory (HVO), U.S. Geological Survey, PO Box 51, Hawai'i National Park, HI 96718, USA (URL: http://hvo.wr.usgs.gov/).
Nyamulagira (DR Congo) — November 2023 Cite this Report
Nyamulagira
DR Congo
1.408°S, 29.2°E; summit elev. 3058 m
All times are local (unless otherwise noted)
Lava flows and thermal activity during May-October 2023
Nyamulagira (also known as Nyamuragira) is a shield volcano in the Democratic Republic of Congo with the summit truncated by a small 2 x 2.3 km caldera with walls up to about 100 m high. Documented eruptions have occurred within the summit caldera, as well as from numerous flank fissures and cinder cones. The current eruption period began in April 2018 and has more recently been characterized by summit crater lava flows and thermal activity (BGVN 48:05). This report describes lava flows and variable thermal activity during May through October 2023, based on information from the Observatoire Volcanologique de Goma (OVG) and various satellite data.
Lava lake activity continued during May. The MIROVA (Middle InfraRed Observation of Volcanic Activity) system recorded moderate-to-strong thermal activity throughout the reporting period; activity was more intense during May and October and relatively weaker from June through September (figure 95). The MODVOLC thermal algorithm, detected a total of 209 thermal alerts. There were 143 hotspots detected during May, eight during June, nine during September, and 49 during October. This activity was also reflected in infrared satellite images, where a lava flow was visible in the NW part of the crater on 7 May and strong activity was seen in the center of the crater on 4 October (figure 96). Another infrared satellite image taken on 12 May showed still active lava flows along the NW margin of the crater. According to OVG lava effusions were active during 7-29 May and moved to the N and NW parts of the crater beginning on 9 May. Strong summit crater incandescence was visible from Goma (27 km S) during the nights of 17, 19, and 20 May (figure 97). On 17 May there was an increase in eruptive activity, which peaked at 0100 on 20 May. Notable sulfur dioxide plumes drifted NW and W during 19-20 May (figure 98). Drone footage acquired in partnership with the USGS (United States Geological Survey) on 20 May captured images of narrow lava flows that traveled about 100 m down the W flank (figure 99). Data from the Rumangabo seismic station indicated a decreasing trend in activity during 17-21 May. Although weather clouds prevented clear views of the summit, a strong thermal signature on the NW flank was visible in an infrared satellite image on 22 May, based on an infrared satellite image. On 28 May the lava flows on the upper W flank began to cool and solidify. By 29 May seismicity returned to levels similar to those recorded before the 17 May increase. Lava effusion continued but was confined to the summit crater; periodic crater incandescence was observed.
Low-level activity was noted during June through October. On 1 June OVG reported that seismicity remained at lower levels and that crater incandescence had been absent for three days, though infrared satellite imagery showed continued lava effusion in the summit crater. The lava flows on the flanks covered an estimated 0.6 km2. Satellite imagery continued to show thermal activity confined to the lava lake through October (figure 96), although no lava flows or significant sulfur dioxide emissions were reported.
Geologic Background. Africa's most active volcano, Nyamulagira (also known as Nyamuragira), is a massive high-potassium basaltic shield about 25 km N of Lake Kivu and 13 km NNW of the steep-sided Nyiragongo volcano. The summit is truncated by a small 2 x 2.3 km caldera that has walls up to about 100 m high. Documented eruptions have occurred within the summit caldera, as well as from the numerous flank fissures and cinder cones. A lava lake in the summit crater, active since at least 1921, drained in 1938, at the time of a major flank eruption. Recent lava flows extend down the flanks more than 30 km from the summit as far as Lake Kivu; extensive lava flows from this volcano have covered 1,500 km2 of the western branch of the East African Rift.
Information Contacts: Observatoire Volcanologique de Goma (OVG), Departement de Geophysique, Centre de Recherche en Sciences Naturelles, Lwiro, D.S. Bukavu, DR Congo; Hawai'i Institute of Geophysics and Planetology (HIGP) - MODVOLC Thermal Alerts System, School of Ocean and Earth Science and Technology (SOEST), Univ. of Hawai'i, 2525 Correa Road, Honolulu, HI 96822, USA (URL: http://modis.higp.hawaii.edu/); MIROVA (Middle InfraRed Observation of Volcanic Activity), a collaborative project between the Universities of Turin and Florence (Italy) supported by the Centre for Volcanic Risk of the Italian Civil Protection Department (URL: http://www.mirovaweb.it/); NASA Global Sulfur Dioxide Monitoring Page, Atmospheric Chemistry and Dynamics Laboratory, NASA Goddard Space Flight Center (NASA/GSFC), 8800 Greenbelt Road, Goddard, Maryland, USA (URL: https://so2.gsfc.nasa.gov/); Copernicus Browser, Copernicus Data Space Ecosystem, European Space Agency (URL: https://dataspace.copernicus.eu/browser/); Charles Balagizi, Goma Volcano Observatory, Departement de Geophysique, Centre de Recherche en Sciences Naturelles, Lwiro, D.S. Bukavu, DR Congo.
Bagana (Papua New Guinea) — October 2023 Cite this Report
Bagana
Papua New Guinea
6.137°S, 155.196°E; summit elev. 1855 m
All times are local (unless otherwise noted)
Explosions, ash plumes, ashfall, and lava flows during April-September 2023
The remote volcano of Bagana is located in central Bougainville Island, Papua New Guinea. Recorded eruptions date back to 1842 and activity has consisted of effusive activity that has built a small lava dome in the summit crater and occasional explosions that produced pyroclastic flows. The most recent eruption has been ongoing since February 2000 and has produced occasional explosions, ash plumes, and lava flows. More recently, activity has been characterized by ongoing effusive activity and ash emissions (BGVN 48:04). This report updates activity from April through September 2023 that has consisted of explosions, ash plumes, ashfall, and lava flows, using information from the Darwin Volcanic Ash Advisory Center (VAAC) and satellite data.
An explosive eruption was reported on 7 July that generated a large gas-and-ash plume to high altitudes and caused significant ashfall in local communities; the eruption plume had reached upper tropospheric (16-18 km altitude) altitudes by 2200, according to satellite images. Sulfur dioxide plumes were detected in satellite images on 8 July and indicated that the plume was likely a mixture of gas, ice, and ash. A report issued by the Autonomous Bougainville Government (ABG) (Torokina District, Education Section) on 10 July noted that significant ash began falling during 2000-2100 on 7 July and covered most areas in the Vuakovi, Gotana (9 km SW), Koromaketo, Laruma (25 km W) and Atsilima (27 km NW) villages. Pyroclastic flows also occurred, according to ground-based reports; small deposits confined to one drainage were inspected by RVO during an overflight on 17 July and were confirmed to be from the 7 July event. Ashfall continued until 10 July and covered vegetation, which destroyed bushes and gardens and contaminated rivers and streams.
RVO reported another eruption on 14 July. The Darwin VAAC stated that an explosive event started around 0830 on 15 July and produced an ash plume that rose to 16.5 km altitude by 1000 and drifted N, according to satellite images. The plume continued to drift N and remained visible through 1900, and by 2150 it had dissipated.
Ashfall likely from both the 7 and 15 July events impacted about 8,111 people in Torokina (20 km SW), including Tsito/Vuakovi, Gotana, Koromaketo, Kenaia, Longkogari, Kenbaki, Piva (13 km SW), and Atsinima, and in the Tsitovi district, according to ABG. Significant ashfall was also reported in Ruruvu (22 km N) in the Wakunai District of Central Bougainville, though the thickness of these deposits could not be confirmed. An evacuation was called for the villages in Wakunai, where heavy ashfall had contaminated water sources; the communities of Ruruvu, Togarau, Kakarapaia, Karauturi, Atao, and Kuritaturi were asked to evacuate to a disaster center at the Wakunai District Station, and communities in Torokina were asked to evacuate to the Piva District station. According to a news article, more than 7,000 people needed temporary accommodations, with about 1,000 people in evacuation shelters. Ashfall had deposited over a broad area, contaminating water supplies, affecting crops, and collapsing some roofs and houses in rural areas. Schools were temporarily shut down. Intermittent ash emissions continued through the end of July and drifted NNW, NW, and SW. Fine ashfall was reported on the coast of Torokina, and ash plumes also drifted toward Laruma and Atsilima.
A small explosive eruption occurred at 2130 on 28 July that ejected material from the crater vents, according to reports from Torokina, in addition to a lava flow that contained two lobes. A second explosion was detected at 2157. Incandescence from the lava flow was visible from Piva as it descended the W flank around 2000 on 29 July (figure 47). The Darwin VAAC reported that a strong thermal anomaly was visible in satellite images during 30-31 July and that ash emissions rose to 2.4 km altitude and drifted WSW on 30 July. A ground report from RVO described localized emissions at 0900 on 31 July.
The Darwin VAAC reported that ash plumes were identified in satellite imagery at 0800 and 1220 on 12 August and rose to 2.1 km and 3 km altitude and drifted NW and W, respectively. A news report stated that aid was sent to more than 6,300 people that were adversely affected by the eruption. Photos taken during 17-19 August showed ash emissions rising no higher than 1 km above the summit and drifting SE. A small explosion generated an ash plume during the morning of 19 August. Deposits from small pyroclastic flows were also captured in the photos. Satellite images captured lava flows and pyroclastic flow deposits. Two temporary seismic stations were installed near Bagana on 17 August at distances of 7 km WSW (Vakovi station) and 11 km SW (Kepox station). The Kepox station immediately started to record continuous, low-frequency background seismicity.
Satellite data. Little to no thermal activity was detected during April through mid-July 2023; only one anomaly was recorded during early April and one during early June, according to MIROVA (Middle InfraRed Observation of Volcanic Activity) data (figure 48). Thermal activity increased in both power and frequency during mid-July through September, although there were still some short gaps in detected activity. MODVOLC also detected increased thermal activity during August; thermal hotspots were detected a total of five times on 19, 20, and 27 August. Weak thermal anomalies were also captured in infrared satellite images on clear weather days throughout the reporting period on 7, 12, and 17 April, 27 May, 1, 6, 16, and 31 July, and 19 September (figure 48); a strong thermal anomaly was visible on 31 July. Distinct sulfur dioxide plumes that drifted generally NW were intermittently captured by the TROPOMI instrument on the Sentinel-5P satellite and sometimes exceeded two Dobson Units (DUs) (figure 49).
Geologic Background. Bagana volcano, in a remote portion of central Bougainville Island, is frequently active. This massive symmetrical cone was largely constructed by an accumulation of viscous andesitic lava flows. The entire edifice could have been constructed in about 300 years at its present rate of lava production. Eruptive activity is characterized by non-explosive effusion of viscous lava that maintains a small lava dome in the summit crater, although occasional explosive activity produces pyroclastic flows. Lava flows with tongue-shaped lobes up to 50 m thick and prominent levees descend the flanks on all sides.
Information Contacts: Rabaul Volcano Observatory (RVO), Geohazards Management Division, Department of Mineral Policy and Geohazards Management (DMPGM), PO Box 3386, Kokopo, East New Britain Province, Papua New Guinea; Darwin Volcanic Ash Advisory Centre (VAAC), Bureau of Meteorology, Northern Territory Regional Office, PO Box 40050, Casuarina, NT 0811, Australia (URL: http://www.bom.gov.au/info/vaac/); MIROVA (Middle InfraRed Observation of Volcanic Activity), a collaborative project between the Universities of Turin and Florence (Italy) supported by the Centre for Volcanic Risk of the Italian Civil Protection Department (URL: http://www.mirovaweb.it/); Hawai'i Institute of Geophysics and Planetology (HIGP) - MODVOLC Thermal Alerts System, School of Ocean and Earth Science and Technology (SOEST), Univ. of Hawai'i, 2525 Correa Road, Honolulu, HI 96822, USA (URL: http://modis.higp.hawaii.edu/); NASA Global Sulfur Dioxide Monitoring Page, Atmospheric Chemistry and Dynamics Laboratory, NASA Goddard Space Flight Center (NASA/GSFC), 8800 Greenbelt Road, Goddard, Maryland, USA (URL: https://so2.gsfc.nasa.gov/); Copernicus Browser, Copernicus Data Space Ecosystem, European Space Agency (URL: https://dataspace.copernicus.eu/browser/); Autonomous Bougainville Government, P.O Box 322, Buka, AROB, PNG (URL: https://abg.gov.pg/); Andrew Tupper (Twitter: @andrewcraigtupp); Simon Carn, Geological and Mining Engineering and Sciences, Michigan Technological University, 1400 Townsend Drive, Houghton, MI 49931, USA (URL: http://www.volcarno.com/, Twitter: @simoncarn); Radio NZ (URL: https://www.rnz.co.nz/news/pacific/494464/more-than-7-000-people-in-bougainville-need-temporary-accommodation-after-eruption); USAID, 1300 Pennsylvania Ave, NW, Washington DC 20004, USA (URL: https://www.usaid.gov/pacific-islands/press-releases/aug-08-2023-united-states-provides-immediate-emergency-assistance-support-communities-affected-mount-bagana-volcanic-eruptions).
Mayon (Philippines) — October 2023 Cite this Report
Mayon
Philippines
13.257°N, 123.685°E; summit elev. 2462 m
All times are local (unless otherwise noted)
Lava flows, pyroclastic flows, ash emissions, and seismicity during April-September 2023
Mayon is located in the Philippines and has steep upper slopes capped by a small summit crater. Historical eruptions date back to 1616 CE that have been characterized by Strombolian eruptions, lava flows, pyroclastic flows, and mudflows. Eruptions mostly originated from a central conduit. Pyroclastic flows and mudflows have commonly descended many of the approximately 40 drainages that surround the volcano. The most recent eruption occurred during June through October 2022 and consisted of lava dome growth and gas-and-steam emissions (BGVN 47:12). A new eruption was reported during late April 2023 and has included lava flows, pyroclastic density currents, ash emissions, and seismicity. This report covers activity during April through September 2023 based on daily bulletins from the Philippine Institute of Volcanology and Seismology (PHIVOLCS).
During April through September 2023, PHIVOLCS reported near-daily rockfall events, frequent volcanic earthquakes, and sulfur dioxide measurements. Gas-and-steam emissions rose 100-900 m above the crater and drifted in different directions. Nighttime crater incandescence was often visible during clear weather and was accompanied by incandescent avalanches of material. Activity notably increased during June when lava flows were reported on the S, SE, and E flanks (figure 52). The MIROVA graph (Middle InfraRed Observation of Volcanic Activity) showed strong thermal activity coincident with these lava flows, which remained active through September (figure 53). According to the MODVOLC thermal algorithm, a total of 110 thermal alerts were detected during the reporting period: 17 during June, 40 during July, 27 during August, and 26 during September. During early June, pyroclastic density currents (PDCs) started to occur more frequently.
Low activity was reported during much of April and May; gas-and-steam emissions rose 100-900 m above the crater and generally drifted in different directions. A total of 52 rockfall events and 18 volcanic earthquakes were detected during April and 147 rockfall events and 13 volcanic events during May. Sulfur dioxide flux measurements ranged between 400-576 tons per day (t/d) during April, the latter of which was measured on 29 April and between 162-343 t/d during May, the latter of which was measured on 13 May.
Activity during June increased, characterized by lava flows, pyroclastic density currents (PDCs), crater incandescence and incandescent rockfall events, gas-and-steam emissions, and continued seismicity. Weather clouds often prevented clear views of the summit, but during clear days, moderate gas-and-steam emissions rose 100-2,500 m above the crater and drifted in multiple directions. A total of 6,237 rockfall events and 288 volcanic earthquakes were detected. The rockfall events often deposited material on the S and SE flanks within 700-1,500 m of the summit crater and ash from the events drifted SW, S, SE, NE, and E. Sulfur dioxide emissions ranged between 149-1,205 t/d, the latter of which was measured on 10 June. Short-term observations from EDM and electronic tiltmeter monitoring indicated that the upper slopes were inflating since February 2023. Longer-term ground deformation parameters based on EDM, precise leveling, continuous GPS, and electronic tilt monitoring indicated that the volcano remained inflated, especially on the NW and SE flanks. At 1000 on 5 June the Volcano Alert Level (VAL) was raised to 2 (on a 0-5 scale). PHIVOLCS noted that although low-level volcanic earthquakes, ground deformation, and volcanic gas emissions indicated unrest, the steep increase in rockfall frequency may indicate increased dome activity.
A total of 151 dome-collapse PDCs occurred during 8-9 and 11-30 June, traveled 500-2,000 m, and deposited material on the S flank within 2 km of the summit crater. During 8-9 June the VAL was raised to 3. At approximately 1947 on 11 June lava flow activity was reported; two lobes traveled within 500 m from the crater and deposited material on the S (Mi-isi), SE (Bonga), and E (Basud) flanks. Weak seismicity accompanied the lava flow and slight inflation on the upper flanks. This lava flow remained active through 30 June, moving down the S and SE flank as far as 2.5 km and 1.8 km, respectively and depositing material up to 3.3 km from the crater. During 15-16 June traces of ashfall from the PDCs were reported in Sitio Buga, Nabonton, City of Ligao and Purok, and San Francisco, Municipality of Guinobatan. During 28-29 June there were two PDCs generated by the collapse of the lava flow front, which generated a light-brown ash plume 1 km high. Satellite monitors detected significant concentrations of sulfur dioxide beginning on 29 June. On 30 June PDCs primarily affected the Basud Gully on the E flank, the largest of which occurred at 1301 and lasted eight minutes, based on the seismic record. Four PDCs generated between 1800 and 2000 that lasted approximately four minutes each traveled 3-4 km on the E flank and generated an ash plume that rose 1 km above the crater and drifted N and NW. Ashfall was recorded in Tabaco City.
Similar strong activity continued during July; slow lava effusion remained active on the S and SE flanks and traveled as far as 2.8 km and 2.8 km, respectively and material was deposited as far as 4 km from the crater. There was a total of 6,983 rockfall events and 189 PDCs that affected the S, SE, and E flanks. The volcano network detected a total of 2,124 volcanic earthquakes. Continuous gas-and-steam emissions rose 200-2,000 m above the crater and drifted in multiple directions. Sulfur dioxide emissions averaged 792-4,113 t/d, the latter of which was measured on 28 July. During 2-4 July three PDCs were generated from the collapse of the lava flow and resulting light brown plumes rose 200-300 m above the crater. Continuous tremor pulses were reported beginning at 1547 on 3 July through 7 July at 1200, at 2300 on 8 July and going through 0300 on 10 July, and at 2300 on 16 July, as recorded by the seismic network. During 6-9 July there were 10 lava flow-collapse-related PDCs that generated light brown plumes 300-500 m above the crater. During 10-11 July light ashfall was reported in some areas of Mabinit, Legazpi City, Budiao and Salvacion, Daraga, and Camalig, Albay. By 18 July the lava flow advanced 600 m on the E flank as well.
During 1733 on 18 July and 0434 on 19 July PHIVOLCS reported 30 “ashing” events, which are degassing events accompanied by audible thunder-like sounds and entrained ash at the crater, which produced short, dark plumes that drifted SW. These events each lasted 20-40 seconds, and plume heights ranged from 150-300 m above the crater, as recorded by seismic, infrasound, visual, and thermal monitors. Three more ashing events occurred during 19-20 July. Short-term observations from electronic tilt and GPS monitoring indicate deflation on the E lower flanks in early July and inflation on the NW middle flanks during the third week of July. Longer-term ground deformation parameters from EDM, precise leveling, continuous GPS, and electronic tilt monitoring indicated that the volcano was still generally inflated relative to baseline levels. A short-lived lava pulse lasted 28 seconds at 1956 on 21 July, which was accompanied by seismic and infrasound signals. By 22 July, the only lava flow that remained active was on the SE flank, and continued to extend 3.4 km, while those on the S and E flanks weakened markedly. One ashing event was detected during 30-31 July, whereas there were 57 detected during 31 July-1 August; according to PHIVOLCS beginning at approximately 1800 on 31 July eruptive activity was dominated by phases of intermittent ashing, as well as increased in the apparent rates of lava effusion from the summit crater. The ashing phases consisted of discrete events recorded as low-frequency volcanic earthquakes (LFVQ) typically 30 seconds in duration, based on seismic and infrasound signals. Gray ash plume rose 100 m above the crater and generally drifted NE. Shortly after these ashing events began, new lava began to effuse rapidly from the crater, feeding the established flowed on the SE, E, and E flanks and generating frequent rockfall events.
Intensified unrest persisted during August. There was a total of 4,141 rockfall events, 2,881 volcanic earthquakes, which included volcanic tremor events, 32 ashing events, and 101 PDCs detected throughout the month. On clear weather days, gas-and-steam emissions rose 300-1,500 m above the crater and drifted in different directions (figure 54). Sulfur dioxide emissions averaged 735-4,756 t/d, the higher value of which was measured on 16 August. During 1-2 August the rate of lava effusion decreased, but continued to feed the flows on the SE, S, and E flanks, maintaining their advances to 3.4 km, 2.8 km, and 1.1 km from the crater, respectively (figure 55). Rockfall and PDCs generated by collapses at the lava flow margins and from the summit dome deposited material within 4 km of the crater. During 3-4 August there were 10 tremor events detected that lasted 1-4 minutes. Short-lived lava pulse lasted 35 seconds and was accompanied by seismic and infrasound signals at 0442 on 6 August. Seven collapses were recorded at the front of the lava flow during 12-14 August.
During September, similar activity of slow lava effusion, PDCs, gas-and-steam emissions, and seismicity continued. There was a total of 4,452 rockfall events, 329 volcanic earthquakes, which included volcanic tremor events, two ashing events, and 85 PDCs recorded throughout the month. On clear weather days, gas-and-steam emissions rose 100-1,500 m above the crater and drifted in multiple directions. Sulfur dioxide emissions averaged 609-2,252 t/d, the higher average of which was measured on 6 September. Slow lava effusion continued advancing on the SE, S, and E flanks, maintaining lengths of 3.4 km, 2.8 km, and 1.1 km, respectively. Rockfall and PDC events generated by collapses along the lava flow margins and at the summit dome deposited material within 4 km of the crater.
Geologic Background. Symmetrical Mayon, which rises above the Albay Gulf NW of Legazpi City, is the most active volcano of the Philippines. The steep upper slopes are capped by a small summit crater. Recorded eruptions since 1616 CE range from Strombolian to basaltic Plinian, with cyclical activity beginning with basaltic eruptions, followed by longer periods of andesitic lava flows. Eruptions occur predominately from the central conduit and have also produced lava flows that travel far down the flanks. Pyroclastic density currents and mudflows have commonly swept down many of the approximately 40 ravines that radiate from the summit and have often damaged populated lowland areas. A violent eruption in 1814 killed more than 1,200 people and devastated several towns.
Information Contacts: Philippine Institute of Volcanology and Seismology (PHIVOLCS), Department of Science and Technology, University of the Philippines Campus, Diliman, Quezon City, Philippines (URL: http://www.phivolcs.dost.gov.ph/); MIROVA (Middle InfraRed Observation of Volcanic Activity), a collaborative project between the Universities of Turin and Florence (Italy) supported by the Centre for Volcanic Risk of the Italian Civil Protection Department (URL: http://www.mirovaweb.it/); Hawai'i Institute of Geophysics and Planetology (HIGP) - MODVOLC Thermal Alerts System, School of Ocean and Earth Science and Technology (SOEST), Univ. of Hawai'i, 2525 Correa Road, Honolulu, HI 96822, USA (URL: http://modis.higp.hawaii.edu/); Copernicus Browser, Copernicus Data Space Ecosystem, European Space Agency (URL: https://dataspace.copernicus.eu/browser/); William Rogers, Legazpi City, Albay Province, Philippines.
Nishinoshima (Japan) — October 2023 Cite this Report
Nishinoshima
Japan
27.247°N, 140.874°E; summit elev. 100 m
All times are local (unless otherwise noted)
Eruption plumes and gas-and-steam plumes during May-August 2023
Nishinoshima, located about 1,000 km S of Tokyo, is a small island in the Ogasawara Arc in Japan. The island is the summit of a massive submarine volcano that has prominent submarine peaks to the S, W, and NE. Eruptions date back to 1973 and the current eruption period began in October 2022. Recent activity has consisted of small ash plumes and fumarolic activity (BGVN 48:07). This report covers activity during May through August 2023, using information from monthly reports of the Japan Meteorological Agency (JMA) monthly reports and satellite data.
Activity during May through June was relatively low. The Japan Coast Guard (JCG) did overflights on 14 and 22 June and reported white gas-and-steam emissions rising 600 m and 1,200 m from the central crater of the pyroclastic cone, respectively (figure 125). In addition, multiple white gas-and-steam emissions rose from the inner rim of the W side of the crater and from the SE flank of the pyroclastic cone. Discolored brown-to-green water was observed around almost the entire perimeter of the island; on 22 June light green discolored water was observed off the S coast of the island.
Observations from the Himawari meteorological satellite confirmed an eruption on 9 and 10 July. An eruption plume rose 1.6 km above the crater and drifted N around 1300 on 9 July. Satellite images acquired at 1420 and 2020 on 9 July and at 0220 on 10 July showed continuing emissions that rose 1.3-1.6 km above the crater and drifted NE and N. The Tokyo VAAC reported that an ash plume seen by a pilot and identified in a satellite image at 0630 on 21 July rose to 3 km altitude and drifted S.
Aerial observations conducted by JCG on 8 August showed a white-and-gray plume rising from the central crater of the pyroclastic cone, and multiple white gas-and-steam emissions were rising from the inner edge of the western crater and along the NW-SE flanks of the island (figure 126). Brown-to-green discolored water was also noted around the perimeter of the island.
Intermittent low-to-moderate power thermal anomalies were recorded in the MIROVA graph (Middle InfraRed Observation of Volcanic Activity), showing an increase in both frequency and power beginning in July (figure 127). This increase in activity coincides with eruptive activity on 9 and 10 July, characterized by eruption plumes. According to the MODVOLC thermal alert algorithm, one thermal hotspot was recorded on 20 July. Weak thermal anomalies were also detected in infrared satellite imagery, accompanied by strong gas-and-steam plumes (figure 128).
Geologic Background. The small island of Nishinoshima was enlarged when several new islands coalesced during an eruption in 1973-74. Multiple eruptions that began in 2013 completely covered the previous exposed surface and continued to enlarge the island. The island is the summit of a massive submarine volcano that has prominent peaks to the S, W, and NE. The summit of the southern cone rises to within 214 m of the ocean surface 9 km SSE.
Information Contacts: Japan Meteorological Agency (JMA), 1-3-4 Otemachi, Chiyoda-ku, Tokyo 100-8122, Japan (URL: http://www.jma.go.jp/jma/indexe.html); Tokyo Volcanic Ash Advisory Center (VAAC), 1-3-4 Otemachi, Chiyoda-ku, Tokyo 100-8122, Japan (URL: http://ds.data.jma.go.jp/svd/vaac/data/); MIROVA (Middle InfraRed Observation of Volcanic Activity), a collaborative project between the Universities of Turin and Florence (Italy) supported by the Centre for Volcanic Risk of the Italian Civil Protection Department (URL: http://www.mirovaweb.it/); Copernicus Browser, Copernicus Data Space Ecosystem, European Space Agency (URL: https://dataspace.copernicus.eu/browser/).
Krakatau (Indonesia) — October 2023 Cite this Report
Krakatau
Indonesia
6.1009°S, 105.4233°E; summit elev. 285 m
All times are local (unless otherwise noted)
White gas-and-steam plumes and occasional ash plumes during May-August 2023
Krakatau is located in the Sunda Strait between Java and Sumatra, Indonesia. Caldera collapse during the catastrophic 1883 eruption destroyed Danan and Perbuwatan cones and left only a remnant of Rakata. The post-collapse cone of Anak Krakatau (Child of Krakatau) was constructed within the 1883 caldera at a point between the former Danan and Perbuwatan cones; it has been the site of frequent eruptions since 1927. The current eruption period began in May 2021 and has recently consisted of Strombolian eruptions and ash plumes (BGVN 48:07). This report describes lower levels of activity consisting of ash and white gas-and-steam plumes during May through August 2023, based on information provided by the Indonesian Center for Volcanology and Geological Hazard Mitigation, referred to as Pusat Vulkanologi dan Mitigasi Bencana Geologi (PVMBG), MAGMA Indonesia, and satellite data.
Activity was relatively low during May and June. Daily white gas-and-steam emissions rose 25-200 m above the crater and drifted in different directions. Five ash plumes were detected at 0519 on 10 May, 1241 on 11 May, 0920 on 12 May, 2320 on 12 May, and at 0710 on 13 May, and rose 1-2.5 km above the crater and drifted SW. A webcam image taken on 12 May showed ejection of incandescent material above the vent. A total of nine ash plumes were detected during 6-11 June: at 1434 and 00220 on 6 and 7 June the ash plumes rose 500 m above the crater and drifted NW, at 1537 on 8 June the ash plume rose 1 km above the crater and drifted SW, at 0746 and at 0846 on 9 June the ash plumes rose 800 m and 3 km above the crater and drifted SW, respectively, at 0423, 1431, and 1750 on 10 June the ash plumes rose 2 km, 1.5 km, and 3.5 km above the crater and drifted NW, respectively, and at 0030 on 11 June an ash plume rose 2 km above the crater and drifted NW. Webcam images taken on 10 and 11 June at 0455 and 0102, respectively, showed incandescent material ejected above the vent. On 19 June an ash plume at 0822 rose 1.5 km above the crater and drifted SE.
Similar low activity of white gas-and-steam emissions and few ash plumes were reported during July and August. Daily white gas-and-steam emissions rose 25-300 m above the crater and drifted in multiple directions. Three ash plumes were reported at 0843, 0851, and 0852 on 20 July that rose 500-2,000 m above the crater and drifted NW.
The MIROVA (Middle InfraRed Observation of Volcanic Activity) graph of MODIS thermal anomaly data showed intermittent low-to-moderate power thermal anomalies during May through August 2023 (figure 140). Although activity was often obscured by weather clouds, a thermal anomaly was visible in an infrared satellite image of the crater on 12 May, accompanied by an eruption plume that drifted SW (figure 141).
Geologic Background. The renowned Krakatau (frequently mis-named as Krakatoa) volcano lies in the Sunda Strait between Java and Sumatra. Collapse of an older edifice, perhaps in 416 or 535 CE, formed a 7-km-wide caldera. Remnants of that volcano are preserved in Verlaten and Lang Islands; subsequently the Rakata, Danan, and Perbuwatan cones were formed, coalescing to create the pre-1883 Krakatau Island. Caldera collapse during the catastrophic 1883 eruption destroyed Danan and Perbuwatan, and left only a remnant of Rakata. This eruption caused more than 36,000 fatalities, most as a result of tsunamis that swept the adjacent coastlines of Sumatra and Java. Pyroclastic surges traveled 40 km across the Sunda Strait and reached the Sumatra coast. After a quiescence of less than a half century, the post-collapse cone of Anak Krakatau (Child of Krakatau) was constructed within the 1883 caldera at a point between the former Danan and Perbuwatan cones. Anak Krakatau has been the site of frequent eruptions since 1927.
Information Contacts: Pusat Vulkanologi dan Mitigasi Bencana Geologi (PVMBG, also known as Indonesian Center for Volcanology and Geological Hazard Mitigation, CVGHM), Jalan Diponegoro 57, Bandung 40122, Indonesia (URL: http://www.vsi.esdm.go.id/); MAGMA Indonesia, Kementerian Energi dan Sumber Daya Mineral (URL: https://magma.esdm.go.id/v1); MIROVA (Middle InfraRed Observation of Volcanic Activity), a collaborative project between the Universities of Turin and Florence (Italy) supported by the Centre for Volcanic Risk of the Italian Civil Protection Department (URL: http://www.mirovaweb.it/); Copernicus Browser, Copernicus Data Space Ecosystem, European Space Agency (URL: https://dataspace.copernicus.eu/browser/).
Villarrica (Chile) — October 2023 Cite this Report
Villarrica
Chile
39.42°S, 71.93°W; summit elev. 2847 m
All times are local (unless otherwise noted)
Strombolian activity, gas-and-ash emissions, and crater incandescence during April-September 2023
Villarrica, in central Chile, consists of a 2-km-wide caldera that formed about 3,500 years ago and is located at the base of the presently active cone at the NW margin of a 6-km-wide caldera. Historical eruptions eruptions date back to 1558 and have been characterized by mild-to-moderate explosive activity with occasional lava effusions. The current eruption period began in December 2014 and has recently consisted of nighttime crater incandescence, ash emissions, and seismicity (BGVN 48:04). This report covers activity during April through September 2023 and describes occasional Strombolian activity, gas-and-ash emissions, and nighttime crater incandescence. Information for this report primarily comes from the Southern Andes Volcano Observatory (Observatorio Volcanológico de Los Andes del Sur, OVDAS), part of Chile's National Service of Geology and Mining (Servicio Nacional de Geología y Minería, SERNAGEOMIN) and satellite data.
Seismicity during April consisted of long period (LP) events and tremor (TRE); a total of 9,413 LP-type events and 759 TR-type events were detected throughout the month. Nighttime crater incandescence persisted and was visible in the degassing column. Sulfur dioxide data was obtained using Differential Absorption Optical Spectroscopy Equipment (DOAS) that showed an average value of 1,450 ± 198 tons per day (t/d) during 1-15 April and 1,129 ± 201 t/d during 16-30 April, with a maximum daily value of 2,784 t/d on 9 April. Gas-and-steam emissions of variable intensities rose above the active crater as high as 1.3 km above the crater on 13 April. Strombolian explosions were not observed and there was a slight decrease in the lava lake level.
There were 14,123 LP-type events and 727 TR-type events detected during May. According to sulfur dioxide measurements taken with DOAS equipment, the active crater emitted an average value of 1,826 ± 482 t/d during 1-15 May and 912 ± 41 t/d during 16-30 May, with a daily maximum value of 5,155 t/d on 13 May. Surveillance cameras showed continuous white gas-and-steam emissions that rose as high as 430 m above the crater on 27 May. Nighttime incandescence illuminated the gas column less than 300 m above the crater rim was and no pyroclastic emissions were reported. A landslide was identified on 13 May on the E flank of the volcano 50 m from the crater rim and extending 300 m away; SERNAGEOMIN noted that this event may have occurred on 12 May. During the morning of 27 and 28 May minor Strombolian explosions characterized by incandescent ejecta were recorded at the crater rim; the last reported Strombolian explosions had occurred at the end of March.
Seismic activity during June consisted of five volcano-tectonic (VT)-type events, 21,606 LP-type events, and 2,085 TR-type events. The average value of sulfur dioxide flux obtained by DOAS equipment was 1,420 ± 217 t/d during 1-15 June and 2,562 ± 804 t/d, with a maximum daily value of 4,810 t/d on 17 June. White gas-and-steam emissions rose less than 480 m above the crater; frequent nighttime crater incandescence was reflected in the degassing plume. On 12 June an emission rose 100 m above the crater and drifted NNW. On 15 June one or several emissions resulted in ashfall to the NE as far as 5.5 km from the crater, based on a Skysat satellite image. Several Strombolian explosions occurred within the crater; activity on 15 June was higher energy and ejected blocks 200-300 m on the NE slope. Surveillance cameras showed white gas-and-steam emissions rising 480 m above the crater on 16 June. On 19 and 24 June low-intensity Strombolian activity was observed, ejecting material as far as 200 m from the center of the crater to the E.
During July, seismicity included 29,319 LP-type events, 3,736 TR-type events, and two VT-type events. DOAS equipment recorded two days of sulfur dioxide emissions of 4,220 t/d and 1,009 t/d on 1 and 13 July, respectively. Constant nighttime incandescence was also recorded and was particularly noticeable when accompanied by eruptive columns on 12 and 16 July. Minor explosive events were detected in the crater. According to Skysat satellite images taken on 12, 13, and 16 July, ashfall deposits were identified 155 m S of the crater. According to POVI, incandescence was visible from two vents on the crater floor around 0336 on 12 July. Gas-and-ash emissions rose as high as 1.2 km above the crater on 13 July and drifted E and NW. A series of gas-and-steam pulses containing some ash deposited material on the upper E flank around 1551 on 13 July. During 16-31 July, average sulfur dioxide emissions of 1,679 ± 406 t/d were recorded, with a maximum daily value of 2,343 t/d on 28 July. Fine ash emissions were also reported on 16, 17, and 23 July.
Seismicity persisted during August, characterized by 27,011 LP-type events, 3,323 TR-type events, and three VT-type events. The average value of sulfur dioxide measurements taken during 1-15 August was 1,642 ± 270 t/d and 2,207 ± 4,549 t/d during 16-31 August, with a maximum daily value of 3,294 t/d on 27 August. Nighttime crater incandescence remained visible in degassing columns. White gas-and-steam emissions rose 480 m above the crater on 6 August. According to a Skysat satellite image from 6 August, ash accumulation was observed proximal to the crater and was mainly distributed toward the E slope. White gas-and-steam emissions rose 320 m above the crater on 26 August. Nighttime incandescence and Strombolian activity that generated ash emissions were reported on 27 August.
Seismicity during September was characterized by five VT-type events, 12,057 LP-type events, and 2,058 TR-type events. Nighttime incandescence persisted. On 2 September an ash emission rose 180 m above the crater and drifted SE at 1643 (figure 125) and a white gas-and-steam plume rose 320 m above the crater. According to the Buenos Aires VAAC, periods of continuous gas-and-ash emissions were visible in webcam images from 1830 on 2 September to 0110 on 3 September. Strombolian activity was observed on 2 September and during the early morning of 3 September, the latter event of which generated an ash emission that rose 60 m above the crater and drifted 100 m from the center of the crater to the NE and SW. Ashfall was reported to the SE and S as far as 750 m from the crater. The lava lake was active during 3-4 September and lava fountaining was visible for the first time since 26 March 2023, according to POVI. Fountains captured in webcam images at 2133 on 3 September and at 0054 on 4 September rose as high as 60 m above the crater rim and ejected material onto the upper W flank. Sulfur dioxide flux of 1,730 t/d and 1,281 t/d was measured on 3 and 4 September, respectively, according to data obtained by DOAS equipment.
Strong Strombolian activity and larger gas-and-ash plumes were reported during 18-20 September. On 18 September activity was also associated with energetic LP-type events and notable sulfur dioxide fluxes (as high as 4,277 t/d). On 19 September Strombolian activity and incandescence were observed. On 20 September at 0914 ash emissions rose 50 m above the crater and drifted SSE, accompanied by Strombolian activity that ejected material less than 100 m SSE, causing fall deposits on that respective flank. SERNAGEOMIN reported that a Planet Scope satellite image taken on 20 September showed the lava lake in the crater, measuring 32 m x 35 m and an area of 0.001 km2. Several ash emissions were recorded at 0841, 0910, 1251, 1306, 1312, 1315, and 1324 on 23 September and rose less than 150 m above the crater. The sulfur dioxide flux value was 698 t/d on 23 September and 1,097 t/d on 24 September. On 24 September the Volcanic Alert Level (VAL) was raised to Orange (the third level on a four-color scale). SENAPRED maintained the Alert Level at Yellow (the middle level on a three-color scale) for the communities of Villarrica, Pucón (16 km N), Curarrehue, and Panguipulli.
During 24-25 September there was an increase in seismic energy (observed at TR-events) and acoustic signals, characterized by 1 VT-type event, 213 LP-type events, and 124 TR-type events. Mainly white gas-and-steam emissions, in addition to occasional fine ash emissions were recorded. During the early morning of 25 September Strombolian explosions were reported and ejected material 250 m in all directions, though dominantly toward the NW. On 25 September the average value of sulfur dioxide flux was 760 t/d. Seismicity during 25-30 September consisted of five VT-type events, 1,937 LP-type events, and 456 TR-type events.
During 25-29 September moderate Strombolian activity was observed and ejected material as far as the crater rim. In addition, ash pulses lasting roughly 50 minutes were observed around 0700 and dispersed ENE. During 26-27 September a TR episode lasted 6.5 hours and was accompanied by discrete acoustic signals. Satellite images from 26 September showed a spatter cone on the crater floor with one vent that measured 10 x 14 m and a smaller vent about 35 m NE of the cone. SERNAGEOMIN reported an abundant number of bomb-sized blocks up to 150 m from the crater, as well as impact marks on the snow, which indicated explosive activity. A low-altitude ash emission was observed drifting NW around 1140 on 28 September, based on webcam images. Between 0620 and 0850 on 29 September an ash emission rose 60 m above the crater and drifted NW. During an overflight taken around 1000 on 29 September scientists observed molten material in the vent, a large accumulation of pyroclasts inside the crater, and energetic degassing, some of which contained a small amount of ash. Block-sized pyroclasts were deposited on the internal walls and near the crater, and a distal ash deposit was also visible. The average sulfur dioxide flux measured on 28 September was 344 t/d. Satellite images taken on 29 September ashfall was deposited roughly 3 km WNW from the crater and nighttime crater incandescence remained visible. The average sulfur dioxide flux value from 29 September was 199 t/d. On 30 September at 0740 a pulsating ash emission rose 1.1 km above the crater and drifted NNW (figure 126). Deposits on the S flank extended as far as 4.5 km from the crater rim, based on satellite images from 30 September.
Infrared MODIS satellite data processed by MIROVA (Middle InfraRed Observation of Volcanic Activity) showed intermittent thermal activity during April through September, with slightly stronger activity detected during late September (figure 127). Small clusters of thermal activity were detected during mid-June, early July, early August, and late September. According to the MODVOLC thermal alert system, a total of four thermal hotspots were detected on 7 July and 3 and 23 September. This activity was also intermittently captured in infrared satellite imagery on clear weather days (figure 128).
Geologic Background. The glacier-covered Villarrica stratovolcano, in the northern Lakes District of central Chile, is ~15 km south of the city of Pucon. A 2-km-wide caldera that formed about 3,500 years ago is located at the base of the presently active, dominantly basaltic to basaltic andesite cone at the NW margin of a 6-km-wide Pleistocene caldera. More than 30 scoria cones and fissure vents are present on the flanks. Plinian eruptions and pyroclastic flows that have extended up to 20 km from the volcano were produced during the Holocene. Lava flows up to 18 km long have issued from summit and flank vents. Eruptions documented since 1558 CE have consisted largely of mild-to-moderate explosive activity with occasional lava effusion. Glaciers cover 40 km2 of the volcano, and lahars have damaged towns on its flanks.
Information Contacts: Servicio Nacional de Geología y Minería (SERNAGEOMIN), Observatorio Volcanológico de Los Andes del Sur (OVDAS), Avda Sta María No. 0104, Santiago, Chile (URL: http://www.sernageomin.cl/); Proyecto Observación Villarrica Internet (POVI) (URL: http://www.povi.cl/); Sistema y Servicio Nacional de Prevención y Repuesta Ante Desastres (SENAPRED), Av. Beauchef 1671, Santiago, Chile (URL: https://web.senapred.cl/); Buenos Aires Volcanic Ash Advisory Center (VAAC), Servicio Meteorológico Nacional-Fuerza Aérea Argentina, 25 de mayo 658, Buenos Aires, Argentina (URL: http://www.smn.gov.ar/vaac/buenosaires/inicio.php); MIROVA (Middle InfraRed Observation of Volcanic Activity), a collaborative project between the Universities of Turin and Florence (Italy) supported by the Centre for Volcanic Risk of the Italian Civil Protection Department (URL: http://www.mirovaweb.it/); Hawai'i Institute of Geophysics and Planetology (HIGP) - MODVOLC Thermal Alerts System, School of Ocean and Earth Science and Technology (SOEST), Univ. of Hawai'i, 2525 Correa Road, Honolulu, HI 96822, USA (URL: http://modis.higp.hawaii.edu/); Copernicus Browser, Copernicus Data Space Ecosystem, European Space Agency (URL: https://dataspace.copernicus.eu/browser/).
Merapi (Indonesia) — October 2023 Cite this Report
Merapi
Indonesia
7.54°S, 110.446°E; summit elev. 2910 m
All times are local (unless otherwise noted)
Frequent incandescent avalanches during April-September 2023
Merapi, located just north of the major city of Yogyakarta in central Java, Indonesia, has had activity within the last 20 years characterized by pyroclastic flows and lahars accompanying growth and collapse of the steep-sided active summit lava dome. The current eruption period began in late December 2020 and has more recently consisted of ash plumes, intermittent incandescent avalanches of material, and pyroclastic flows (BGVN 48:04). This report covers activity during April through September 2023, based on information from Balai Penyelidikan dan Pengembangan Teknologi Kebencanaan Geologi (BPPTKG), the Center for Research and Development of Geological Disaster Technology, a branch of PVMBG which specifically monitors Merapi. Additional information comes from the Pusat Vulkanologi dan Mitigasi Bencana Geologi (PVMBG, also known as Indonesian Center for Volcanology and Geological Hazard Mitigation, CVGHM), MAGMA Indonesia, the Darwin Volcanic Ash Advisory Centre (VAAC), and various satellite data.
Activity during April through September 2023 primarily consisted of incandescent avalanches of material that mainly affected the SW and W flanks and traveled as far as 2.3 km from the summit (table 25) and white gas-and-steam emissions that rose 10-1,000 m above the crater.
Table 25. Monthly summary of avalanches and avalanche distances recorded at Merapi during April through September 2023. The number of reported avalanches does not include instances where possible avalanches were heard but could not be visually confirmed as a result of inclement weather. Data courtesy of BPPTKG (April-September 2023 daily reports).
| Month |
Average number of avalanches per day |
Distance avalanches traveled (m) |
| Apr 2023 |
19 |
1,200-2,000 |
| May 2023 |
22 |
500-2,000 |
| Jun 2023 |
18 |
1,200-2,000 |
| Jul 2023 |
30 |
300-2,000 |
| Aug 2023 |
25 |
400-2,300 |
| Sep 2023 |
23 |
600-2,000 |
BPPTKG reported that during April and May white gas-and-steam emissions rose 10-750 m above the crater, incandescent avalanches descended 500-2,000 m on the SW and W flanks (figure 135). Cloudy weather often prevented clear views of the summit, and sometimes avalanches could not be confirmed. According to a webcam image, a pyroclastic flow was visible on 17 April at 0531. During the week of 28 April and 4 May a pyroclastic flow was reported on the SW flank, traveling up to 2.5 km. According to a drone overflight taken on 17 May the SW lava dome volume was an estimated 2,372,800 cubic meters and the dome in the main crater was an estimated 2,337,300 cubic meters.
During June and July similar activity persisted with white gas-and-steam emissions rising 10-350 m above the crater and frequent incandescent avalanches that traveled 300-2,000 m down the SW, W, and S flanks (figure 136). Based on an analysis of aerial photos taken on 24 June the volume of the SW lava dome was approximately 2.5 million cubic meters. A pyroclastic flow was observed on 5 July that traveled 2.7 km on the SW flank. According to the Darwin VAAC multiple minor ash plumes were identified in satellite images on 19 July that rose to 3.7 km altitude and drifted S and SW. During 22, 25, and 26 July a total of 17 avalanches descended as far as 1.8 km on the S flank.
Frequent white gas-and-steam emissions continued during August and September, rising 10-450 m above the crater. Incandescent avalanches mainly affected the SW and W flanks and traveled 400-2,300 m from the vent (figure 137). An aerial survey conducted on 10 August was analyzed and reported that estimates of the SW dome volume was 2,764,300 cubic meters and the dome in the main crater was 2,369,800 cubic meters.
Frequent and moderate-power thermal activity continued throughout the reporting period, according to a MIROVA (Middle InfraRed Observation of Volcanic Activity) analysis of MODIS satellite data (figure 138). There was an increase in the number of detected anomalies during mid-May. The MODVOLC thermal algorithm recorded a total of 47 thermal hotspots: six during April, nine during May, eight during June, 15 during July, four during August, and five during September. Some of this activity was captured in infrared satellite imagery on clear weather days, sometimes accompanied by incandescent material on the SW flank (figure 139).
Geologic Background. Merapi, one of Indonesia's most active volcanoes, lies in one of the world's most densely populated areas and dominates the landscape immediately north of the major city of Yogyakarta. It is the youngest and southernmost of a volcanic chain extending NNW to Ungaran volcano. Growth of Old Merapi during the Pleistocene ended with major edifice collapse perhaps about 2,000 years ago, leaving a large arcuate scarp cutting the eroded older Batulawang volcano. Subsequent growth of the steep-sided Young Merapi edifice, its upper part unvegetated due to frequent activity, began SW of the earlier collapse scarp. Pyroclastic flows and lahars accompanying growth and collapse of the steep-sided active summit lava dome have devastated cultivated lands on the western-to-southern flanks and caused many fatalities.
Information Contacts: Balai Penyelidikan dan Pengembangan Teknologi Kebencanaan Geologi (BPPTKG), Center for Research and Development of Geological Disaster Technology (URL: http://merapi.bgl.esdm.go.id/, Twitter: @BPPTKG); MAGMA Indonesia, Kementerian Energi dan Sumber Daya Mineral (URL: https://magma.esdm.go.id/v1); Pusat Vulkanologi dan Mitigasi Bencana Geologi (PVMBG, also known as Indonesian Center for Volcanology and Geological Hazard Mitigation, CVGHM), Jalan Diponegoro 57, Bandung 40122, Indonesia (URL: http://www.vsi.esdm.go.id/); Darwin Volcanic Ash Advisory Centre (VAAC), Bureau of Meteorology, Northern Territory Regional Office, PO Box 40050, Casuarina, NT 0811, Australia (URL: http://www.bom.gov.au/info/vaac/); MIROVA (Middle InfraRed Observation of Volcanic Activity), a collaborative project between the Universities of Turin and Florence (Italy) supported by the Centre for Volcanic Risk of the Italian Civil Protection Department (URL: http://www.mirovaweb.it/); Hawai'i Institute of Geophysics and Planetology (HIGP) - MODVOLC Thermal Alerts System, School of Ocean and Earth Science and Technology (SOEST), Univ. of Hawai'i, 2525 Correa Road, Honolulu, HI 96822, USA (URL: http://modis.higp.hawaii.edu/); Copernicus Browser, Copernicus Data Space Ecosystem, European Space Agency (URL: https://dataspace.copernicus.eu/browser/); Øystein Lund Andersen (URL: https://www.oysteinlundandersen.com/, https://twitter.com/oysteinvolcano).
Ebeko
Russia
50.686°N, 156.014°E; summit elev. 1103 m
All times are local (unless otherwise noted)
Moderate explosive activity with ash plumes continued during June-November 2023
Ebeko, located on the N end of Paramushir Island in Russia’s Kuril Islands just S of the Kamchatka Peninsula, consists of three summit craters along a SSW-NNE line at the northern end of a complex of five volcanic cones. Observed eruptions date back to the late 18th century and have been characterized as small-to-moderate explosions from the summit crater, accompanied by intense fumarolic activity. The current eruptive period began in June 2022, consisting of frequent explosions, ash plumes, and thermal activity (BGVN 47:10, 48:06). This report covers similar activity during June-November 2023, based on information from the Kamchatka Volcanic Eruptions Response Team (KVERT) and satellite data.
Moderate explosive activity continued during June-November 2023 (figures 50 and 51). According to visual data from Severo-Kurilsk, explosions sent ash 2-3.5 km above the summit (3-4.5 km altitude) during most days during June through mid-September. Activity after mid-September was slightly weaker, with ash usually reaching less than 2 km above the summit. According to KVERT the volcano in October and November was, with a few exceptions, either quiet or obscured by clouds that prevented satellite observations. KVERT issued Volcano Observatory Notices for Aviation (VONA) on 8 and 12 June, 13 and 22 July, 3 and 21 August, and 31 October warning of potential aviation hazards from ash plumes drifting 3-15 km from the volcano. Based on satellite data, KVERT reported a persistent thermal anomaly whenever weather clouds permitted viewing.
Geologic Background. The flat-topped summit of the central cone of Ebeko volcano, one of the most active in the Kuril Islands, occupies the northern end of Paramushir Island. Three summit craters located along a SSW-NNE line form Ebeko volcano proper, at the northern end of a complex of five volcanic cones. Blocky lava flows extend west from Ebeko and SE from the neighboring Nezametnyi cone. The eastern part of the southern crater contains strong solfataras and a large boiling spring. The central crater is filled by a lake about 20 m deep whose shores are lined with steaming solfataras; the northern crater lies across a narrow, low barrier from the central crater and contains a small, cold crescentic lake. Historical activity, recorded since the late-18th century, has been restricted to small-to-moderate explosive eruptions from the summit craters. Intense fumarolic activity occurs in the summit craters, on the outer flanks of the cone, and in lateral explosion craters.
Information Contacts: Kamchatka Volcanic Eruptions Response Team (KVERT), Far Eastern Branch, Russian Academy of Sciences, 9 Piip Blvd., Petropavlovsk-Kamchatsky, 683006, Russia (URL: http://www.kscnet.ru/ivs/kvert/).
Search Bulletin Archive by Publication Date
Select a month and year from the drop-downs and click "Show Issue" to have that issue displayed in this tab.
The default month and year is the latest issue available.
Bulletin of the Global Volcanism Network - Volume 17, Number 03 (March 1992)
Managing Editor: Lindsay McClelland
Aira (Japan)
Fewer explosions but stronger seismicity
Akutan (United States)
Small steam-and-ash emissions
Arenal (Costa Rica)
Lava flows continue to advance; Strombolian activity weakens
Etna (Italy)
Lava production continues from SE-flank vent; town threatened by lava flow
Galeras (Colombia)
Seismicity and SO2 release fluctuate; minor deformation
Hudson, Cerro (Chile)
Sulfur odors; increased river flow and turbidity; fine August 1991 ash remobilized
Irazu (Costa Rica)
Earthquakes in three epicentral zones; fumarolic activity
Kilauea (United States)
Continued lava production from East rift fissure vent
Kirishimayama (Japan)
Steam emission and weak seismicity
Langila (Papua New Guinea)
Incandescent tephra ejection; new lava flow
Lascar (Chile)
New lava dome in central crater; fumarolic activity
Lengai, Ol Doinyo (Tanzania)
Continued production of small lava flows
Manam (Papua New Guinea)
Vigorous Strombolian activity, strongest since 1987; small debris flows
Merapi (Indonesia)
Continued lava extrusion; small rockfalls and avalanche-generated pyroclastic flows
Negro, Cerro (Nicaragua)
Strong Strombolian eruption with heavy ashfall and 28,000 evacuated
Niijima (Japan)
Earthquake swarm but no surface changes evident
Pinatubo (Philippines)
Lahar triggers secondary explosion on NE flank
Poas (Costa Rica)
Small phreatic eruptions; acid rain and mist cause damage on flanks; continued seismicity
Rabaul (Papua New Guinea)
Slight increase in seismicity
Rincon de la Vieja (Costa Rica)
Small explosions and rumbling; earthquakes
Ruapehu (New Zealand)
Small phreatic eruptions accompany rise in Crater Lake temperature
Spurr (United States)
Earthquake swarms but no indication of imminent eruption
Stromboli (Italy)
Less-frequent eruptive episodes
Turrialba (Costa Rica)
Continued low-frequency seismicity
Unzendake (Japan)
Lava extrusion persists; new dome follows increased seismicity; strong pyroclastic-flow activity
Vulcano (Italy)
Vigorous fumarolic activity
Whakaari/White Island (New Zealand)
Continued vigorous explosive activity
Yellowstone (United States)
Strong new thermal activity
Aira
Japan
31.5772°N, 130.6589°E; summit elev. 1117 m
All times are local (unless otherwise noted)
Fewer explosions but stronger seismicity
Ten explosions were recorded . . . in March . . . . The month's highest ash cloud rose 1,900 m on 13 March. Seismicity was more vigorous than usual, with volcanic earthquake swarms recorded almost daily from 14 to 29 March, each lasting 4-5 hours.
Geologic Background. The Aira caldera in the northern half of Kagoshima Bay contains the post-caldera Sakurajima volcano, one of Japan's most active. Eruption of the voluminous Ito pyroclastic flow accompanied formation of the 17 x 23 km caldera about 22,000 years ago. The smaller Wakamiko caldera was formed during the early Holocene in the NE corner of the caldera, along with several post-caldera cones. The construction of Sakurajima began about 13,000 years ago on the southern rim and built an island that was joined to the Osumi Peninsula during the major explosive and effusive eruption of 1914. Activity at the Kitadake summit cone ended about 4,850 years ago, after which eruptions took place at Minamidake. Frequent eruptions since the 8th century have deposited ash on the city of Kagoshima, located across Kagoshima Bay only 8 km from the summit. The largest recorded eruption took place during 1471-76.
Information Contacts: JMA.
Akutan (United States) — March 1992 Cite this Report
Akutan
United States
54.134°N, 165.986°W; summit elev. 1303 m
All times are local (unless otherwise noted)
Small steam-and-ash emissions
Small steam-and-ash emissions were observed periodically through mid-April, beginning at 1645 on 8 March, when a pilot flying near the volcano reported a small steam plume, possibly containing ash, that rose about 2 km above the summit. One hour later, only minor steaming was observed during a flight directly over the crater. A second flight at 1806 reported ash covering snow on the SW side of the crater. Minor steaming continued to be visible during flights at 1915 and 2006, rising to ~150 m. No activity was observed the following morning. Small steam and ash plumes, mostly <100 m high, were noted on 11-12 March.
Fishing vessels reported ashfall off Akutan Island on 22 March, following a pilot's report of a 4.3-km-high ash plume at 1637. No ashfall was reported 16 km NE, in Akutan village. A NOTAM was issued at 1224 on 24 March, prohibiting air traffic within 18 km of the volcano, up to 18 km altitude.
Activity was reported again on 7 April, when an Akutan village resident noted ash plumes rising 450-550 m above the volcano. Two days later, at 1000, a pilot reported an ash cloud at about 3-3.5 km altitude, drifting NW. A single lightning strike was recorded at the time of the eruption, by AVO's detection system.
Geologic Background. Akutan contains a 2-km-wide caldera with a large cinder cone in the NE part of the caldera that has been the source of frequent explosive eruptions and occasional lava effusion that covers the caldera floor. An older, largely buried caldera was formed during the late Pleistocene or early Holocene. Two volcanic centers are located on the NW flank. Lava Peak is of Pleistocene age, and a cinder cone lower on the flank produced a lava flow in 1852 that extended the shoreline of the island and forms Lava Point. The 60-365 m deep younger caldera was formed during a major explosive eruption about 1,600 years ago and contains at least three lakes. A lava flow in 1978 traveled through a narrow breach in the north caldera rim almost to the coast. Fumaroles occur at the base of the caldera cinder cone, and hot springs are located NE of the caldera at the head of Hot Springs Bay valley and along the shores of Hot Springs Bay.
Information Contacts: AVO; FAA.
Arenal (Costa Rica) — March 1992 Cite this Report
Arenal
Costa Rica
10.463°N, 84.703°W; summit elev. 1670 m
All times are local (unless otherwise noted)
Lava flows continue to advance; Strombolian activity weakens
The two lava flows active in February continued to descend the W and WSW flanks in March (figures 45 and 46). The WSW-flank flow bifurcated, with one tongue advancing 50 m in early March to 730 m elevation, before stopping in mid-month. Near 1,100 m elevation, the W-flank flow also divided; one lobe advanced W down a valley, while the other diverged to the WSW, overflowing the September 1991-March 1992 flows (figure 46). The lava flow advanced an estimated 10-20 m daily on the upper slope, and 2-5 m daily on the gentler, lower slope. The most active, northern- and southern-most, lobes extended to 870 m and 830 m elevation, respectively, the first time in several years that lava had reached that elevation on the WSW flank.
Strombolian activity continued at a significantly decreased rate and intensity, consisting primarily of sudden or rhythmic degassing events, with little or no pyroclastic ejection. In addition to intense fumarolic activity in Crater C (the active crater), intense steaming was observed between craters C and D (300 m E of Crater C).
Seismic activity was at moderate levels, with an average of 15 earthquakes recorded daily (at station FOR, 4 km E), and peaks on 4, 25, and 30 March. Increases in tremor were recorded on 11, 13, and 18 March.
Geologic Background. Conical Volcán Arenal is the youngest stratovolcano in Costa Rica and one of its most active. The 1670-m-high andesitic volcano towers above the eastern shores of Lake Arenal, which has been enlarged by a hydroelectric project. Arenal lies along a volcanic chain that has migrated to the NW from the late-Pleistocene Los Perdidos lava domes through the Pleistocene-to-Holocene Chato volcano, which contains a 500-m-wide, lake-filled summit crater. The earliest known eruptions of Arenal took place about 7000 years ago, and it was active concurrently with Cerro Chato until the activity of Chato ended about 3500 years ago. Growth of Arenal has been characterized by periodic major explosive eruptions at several-hundred-year intervals and periods of lava effusion that armor the cone. An eruptive period that began with a major explosive eruption in 1968 ended in December 2010; continuous explosive activity accompanied by slow lava effusion and the occasional emission of pyroclastic flows characterized the eruption from vents at the summit and on the upper western flank.
Information Contacts: G. Soto and R. Barquero, ICE; G. Alvarado, GEOMAR, Germany; M. Fernández, Univ de Costa Rica.
Etna
Italy
37.748°N, 14.999°E; summit elev. 3357 m
All times are local (unless otherwise noted)
Lava production continues from SE-flank vent; town threatened by lava flow
Most of the following is from R. Romano.
The fissure eruption ... was continuing in mid-April. Lava production from the main vent at 2,100 m altitude (in the W wall of the Valle del Bove) has remained almost constant, accompanied by degassing of varying intensity. By mid-April, 85 x 106 m3 of lava that had emerged at an average rate of 8 m3/s was estimated to cover an area of >7 km2.
From March through mid-April, lava from the main vent immediately entered a complex tube system, reappearing through ephemeral vents ~ 5 km downslope, below the Valle del Bove. The vents formed on the edge of the Salto della Giumenta, at the head of the Val Calanna a few kilometers from Zafferana Etnea, population ~ 7,000 (see figure 43). No ephemeral vents or lava overflows have been observed since the end of February in the wide lava field that had developed in the S part of the Valle del Bove.
On 14 March, lava reached the base of the barrier constructed in early January at the bottom of the Val Calanna. During the second half of March and the first few days of April, lava from the ephemeral vents gradually filled the area from the base of the Salto della Giumenta to the barrier. On 3 April, vents began to form within the Salto della Giumenta, feeding flows inside the Val Calanna. By the morning of 7 April, lava was only a few meters from the top of the barrier, with an active front along the barrier's entire length. That afternoon, lava flowed around the S side of the barrier and began to advance along the access road in the Val Calanna. The next afternoon, lava spilled over the central part of the barrier, and began to move down the gorge of the neighboring Portella Calanna valley. Lava advanced rapidly, aided by the steep slope, covering 1 km in 5 days. At least six earth barriers were built to contain the lava, but none were successful. By 14 April, lava was overflowing the last barrier, at ~ 780 m elevation, 1.5 km from the inhabited center of Zafferana Etnea and 7.5 km from the main vent.
Efforts were also made to slow or halt the advancing lava by disrupting the feeder tube system. Experiments with directed explosives, designed to blast holes in the lava field and encourage lava breakouts, began on 13 April in the upper Valle del Bove and Val Calanna. Lava destroyed two isolated houses above Zafferana on 14 April and covered nearby orchards, but the lobe threatening the town had virtually stopped by the next day and evacuation plans were postponed. New lava approached Zafferana over earlier flows in the succeeding days, and was again within a kilometer of the town by 20 April.
Degassing from the summit craters has gradually decreased following the collapse episode in Northeast Crater at the end of February (17:02). Additional Northeast Crater collapses 21-29 March triggered ash ejections accompanied by distinctive seismicity. Moderate gas emission from the summit vents observed by B. Behncke on 21 March was punctuated around 0900 by several low-energy ash emissions from Northeast Crater. At 1230 on 24 March, a dark-gray, convoluted ash plume rose to ~ 1 km above the summit within ~ 5 minutes, and also appeared to spread laterally at its base. The plume gradually dissipated during the following 30 minutes, depositing tephra to the E.
Geologic Background. Mount Etna, towering above Catania on the island of Sicily, has one of the world's longest documented records of volcanism, dating back to 1500 BCE. Historical lava flows of basaltic composition cover much of the surface of this massive volcano, whose edifice is the highest and most voluminous in Italy. The Mongibello stratovolcano, truncated by several small calderas, was constructed during the late Pleistocene and Holocene over an older shield volcano. The most prominent morphological feature of Etna is the Valle del Bove, a 5 x 10 km caldera open to the east. Two styles of eruptive activity typically occur, sometimes simultaneously. Persistent explosive eruptions, sometimes with minor lava emissions, take place from one or more summit craters. Flank vents, typically with higher effusion rates, are less frequently active and originate from fissures that open progressively downward from near the summit (usually accompanied by Strombolian eruptions at the upper end). Cinder cones are commonly constructed over the vents of lower-flank lava flows. Lava flows extend to the foot of the volcano on all sides and have reached the sea over a broad area on the SE flank.
Information Contacts: R. Romano, T. Caltabiano, and M. Porto, IIV; P. Carveni and M. Grasso, Univ di Catania; B. Behncke, GEOMAR, Kiel; Il Mattino, Napoli; AP; UPI; Reuters.
Galeras
Colombia
1.22°N, 77.37°W; summit elev. 4276 m
All times are local (unless otherwise noted)
Seismicity and SO2 release fluctuate; minor deformation
Seismic energy release and the number of long-period events fluctuated widely in March, similar to behavior in January-February. Tremor remained at low levels throughout the month. Eleven high-frequency earthquakes were recorded (M 1.2-2.2), centered primarily N and NE of the crater. Electronic tiltmeter measurements [at Crater Station] showed 21.8 µrad deflation in the N component, while measurements [at Peladitos Station] were essentially stable, with a slight tendency toward inflation (11 and 6 µrad for the two components). SO2 flux from the volcano was variable in March, ranging from 120 to ~2,500 t/d, but showed a general increase late in the month.
Geologic Background. Galeras, a stratovolcano with a large breached caldera located immediately west of the city of Pasto, is one of Colombia's most frequently active volcanoes. The dominantly andesitic complex has been active for more than 1 million years, and two major caldera collapse eruptions took place during the late Pleistocene. Long-term extensive hydrothermal alteration has contributed to large-scale edifice collapse on at least three occasions, producing debris avalanches that swept to the west and left a large open caldera inside which the modern cone has been constructed. Major explosive eruptions since the mid-Holocene have produced widespread tephra deposits and pyroclastic flows that swept all but the southern flanks. A central cone slightly lower than the caldera rim has been the site of numerous small-to-moderate eruptions since the time of the Spanish conquistadors.
Information Contacts: J. Romero, INGEOMINAS-Observatorio Vulcanológico del Sur.
Cerro Hudson (Chile) — March 1992 Cite this Report
Cerro Hudson
Chile
45.9°S, 72.97°W; summit elev. 1905 m
All times are local (unless otherwise noted)
Sulfur odors; increased river flow and turbidity; fine August 1991 ash remobilized
Sulfurous odors were occasionally detected up to 90 km S and SE of the volcano, beginning 10 April and increasing to a peak at 1100 on 13 April. Residents of Murta (60 km SSE) and Puerto Tranquilo (80 km SSE) reported headaches and nausea at 1500. The Civil Aviation Administration confirmed the intense sulfur odor SE of the volcano, but direct observation of the summit on 13 April revealed no visible eruptive activity. At 1700 on 14 April, an abnormal increase in river flow volume and turbidity was reported from Puerto Ibáñez, 90 km SE. Geologists suggested that the observed phenomena were a result of increased thermal and fumarolic activity beneath the caldera glacier (10 km diameter), combined with the abnormally dry weather conditions.
In late March, aeolian re-suspension of ash from Hudson's August 1991 eruption continued in Argentinian Patagonia. The following is from a report by the Patagonian Volcanism Project.
At about 1030 on 30 March, the crew of flight TAN 404 (Malargue to Neuquen), noted a brown "dust veil" ~50 km S of Malargue, at ~ 6,000 m altitude. Finely dispersed, light-brown volcanic ash formed a well-defined layer ~100 m thick and 300 km wide that spanned the horizon. The layer was rather homogeneous and perfectly visible against the cloud-free blue sky, but once within it the layer was no longer evident. The pilot reported that the layer had not originated from nearby surface dust, but was the result of Hudson ash again being transported to high altitudes from Argentinian Patagonia following calm weather that had prevailed in late March.
The ash was not from a recent eruption, but was entirely due to reworking of volcanic ash in dry, windy Santa Cruz Province, Argentina. On 21 March, re-suspended ash was deposited in Comodoro Rivadavia, accompanying local precipitation and a drop in temperature. At that time, strong southerly winds in Southern Patagonia suspended the ash, which preferentially traveled N along Argentina's Atlantic coastline and the Andean foothills. Other atmospheric effects included lowering of the dust layer during cold morning conditions, followed by ascent during the day due to surface heating, and fiery-red to pink high-level clouds seen in Comodoro Rivadavia at dawn on 31 March.
Volcanic bombs from the Hudson area contain black streaks in highly vesicular lighter-colored pumice. However, microprobe data indicate that the clear and dark glasses have essentially identical high-K dacite compositions.
Geologic Background. The ice-filled, 10-km-wide caldera of Cerro Hudson volcano was not recognized until its first 20th-century eruption in 1971. It is the southernmost volcano in the Chilean Andes, related to subduction of the Nazca plate beneath the South American plate. The massive volcano covers an area of 300 km2. The compound caldera is drained through a breach on its NW rim, which has been the source of mudflows down the Río de Los Huemeles. Two cinder cones occur N of the volcano and others occupy the SW and SE flanks. This volcano has been the source of several major Holocene explosive eruptions. An eruption about 6,700 years ago was one of the largest known in the southern Andes during the Holocene; another eruption about 3,600 years ago also produced more than 10 km3 of tephra. An eruption in 1991 formed a new 800-m-wide crater in the SW portion of the caldera.
Information Contacts: J. Naranjo, SERNAGEOMIN; P. Bitschene, A. Arizmendi, M. Fernández, N. Arias, and A. Nillni, Patagonian Volcanism Proyect, Argentina.
Irazu
Costa Rica
9.979°N, 83.852°W; summit elev. 3436 m
All times are local (unless otherwise noted)
Earthquakes in three epicentral zones; fumarolic activity
Fumarolic activity continued in March. The crater lake's water level was several centimeters lower than in February, with an average temperature of 28°C and a pH of 3.7 on 2 April. The 141 earthquakes recorded in March (at station IRZ2, 5 km W of the crater), included M 2.0-2.5 events on 2, 15, and 21-22 March. The larger earthquakes were centered 6-7 km NW, 1.5 km SE, and 3 km NE of the crater, at 0-17 km depth. Low-frequency seismicity continued beneath the crater.
Geologic Background. The massive Irazú volcano in Costa Rica, immediately E of the capital city of San José, covers an area of 500 km2 and is vegetated to within a few hundred meters of its broad summit crater complex. At least 10 satellitic cones are located on its S flank. No lava effusion is known since the eruption of the Cervantes lava flows from S-flank vents about 14,000 years ago, and all known Holocene eruptions have been explosive. The focus of eruptions at the summit crater complex has migrated to the W towards the main crater, which contains a small lake. The first well-documented eruption occurred in 1723, and frequent explosive eruptions have occurred since. Ashfall from the last major eruption during 1963-65 caused significant disruption to San José and surrounding areas. Phreatic activity reported in 1994 may have been a landslide event from the fumarolic area on the NW summit (Fallas et al., 2018).
Information Contacts: E. Fernández, J. Barquero, and V. Barboza, OVSICORI; G. Soto and R. Barquero, ICE; Guillermo Alvarado, GEOMAR, Christian-Albrechts-Universität, Germany; Mario Fernández, Sección de Sismología y Vulcanología, Escuela Centroamericana de Geología, Univ de Costa Rica.
Kilauea (United States) — March 1992 Cite this Report
Kilauea
United States
19.421°N, 155.287°W; summit elev. 1222 m
All times are local (unless otherwise noted)
Continued lava production from East rift fissure vent
Episode 51 . . . began on the afternoon of 7 March, four days after an intrusion in the upper East rift marked the end of the previous episode. A new fissure vent developed on the W flank of Pu`u `O`o, directly upslope from the E-50 vent, and lava within Pu`u `O`o rose to within 55 m of the rim. Lava production apparently stopped at about 2100, but resumed by midnight. Fieldwork the next day revealed an active fissure 34 m long with a spatter rampart 6 m high. Lava ponded W of the vent, while channelized flows moved south and new lava briefly filled the E-50 aa channel.
Lava production stopped at least four times during the following weeks. Active periods that sometimes lasted little more than a day were separated by repose intervals of 16-67 hours. Summit tilt consistently showed slight inflation during repose periods. The E-51 vent built a small shield on the W flank of Pu`u `O`o. Most of the small braided lava streams that covered the shield were fed by a summit lava pond, on the uprift (W) side of the active fissure. Large flows advanced in all directions from the new vent, expanding the W and S margins of the E-50-51 lava field (figure 85). Some flows emerged from the vent without passing through the pond. These wrapped around the base of Pu`u `O`o. On 13 April, a large pahoehoe flow was moving south and was nearing a forested area.
The level of lava inside Pu`u `O`o fluctuated between 35 and 60 m below the spillway on the crater rim, sustaining frequent gas-piston events and vigorous spattering. The lava level apparently dropped during two of the repose periods, then rose with renewed activity at the E-51 vent. On 12 April, several lava overflows briefly covered the crater floor before lava again retreated deeper into the vent.
Geologic Background. Kilauea overlaps the E flank of the massive Mauna Loa shield volcano in the island of Hawaii. Eruptions are prominent in Polynesian legends; written documentation since 1820 records frequent summit and flank lava flow eruptions interspersed with periods of long-term lava lake activity at Halemaumau crater in the summit caldera until 1924. The 3 x 5 km caldera was formed in several stages about 1,500 years ago and during the 18th century; eruptions have also originated from the lengthy East and Southwest rift zones, which extend to the ocean in both directions. About 90% of the surface of the basaltic shield volcano is formed of lava flows less than about 1,100 years old; 70% of the surface is younger than 600 years. The long-term eruption from the East rift zone between 1983 and 2018 produced lava flows covering more than 100 km2, destroyed hundreds of houses, and added new coastline.
Information Contacts: T. Mattox, HVO.
Kirishimayama (Japan) — March 1992 Cite this Report
Kirishimayama
Japan
31.934°N, 130.862°E; summit elev. 1700 m
All times are local (unless otherwise noted)
Steam emission and weak seismicity
Steam emission from Shinmoe-dake cone's summit crater . . . produced a continuous 100-200-m-high plume in March. Seismicity was at low levels, with a monthly total of 27 small earthquakes, similar to February . . . . Two weak tremor episodes were recorded on 6 and 17 March. Fine ash emissions . . . were not observed in March.
Geologic Background. Kirishimayama is a large group of more than 20 Quaternary volcanoes located north of Kagoshima Bay. The late-Pleistocene to Holocene dominantly andesitic group consists of stratovolcanoes, pyroclastic cones, maars, and underlying shield volcanoes located over an area of 20 x 30 km. The larger stratovolcanoes are scattered throughout the field, with the centrally located Karakunidake being the highest. Onamiike and Miike, the two largest maars, are located SW of Karakunidake and at its far eastern end, respectively. Holocene eruptions have been concentrated along an E-W line of vents from Miike to Ohachi, and at Shinmoedake to the NE. Frequent small-to-moderate explosive eruptions have been recorded since the 8th century.
Information Contacts: JMA.
Langila (Papua New Guinea) — March 1992 Cite this Report
Langila
Papua New Guinea
5.525°S, 148.42°E; summit elev. 1330 m
All times are local (unless otherwise noted)
Incandescent tephra ejection; new lava flow
"Activity increased in March with Crater 3 becoming more active. Emissions from Crater 3 consisted of weak to moderate white-grey vapour and ash with occasional blue vapour. Weak to moderate explosion noises were frequently heard throughout the month. At night, weak to moderate red glow over the crater and occasional incandescent lava ejections were seen. A new lava flow on the cone's N flank began on 6 March and was still advancing at the end of the month. Emissions from Crater 2 consisted of low to moderate volumes of white-grey vapour and ash clouds. Thick black ash clouds were emitted towards the end of the month, resulting in ashfall on the SE side of the volcano. Rumbling and explosion noises associated with some of the emissions were heard throughout the month. Steady weak red crater glow was observed on clear nights, with incandescent lava ejections occurring on 21 and 22 March. Seismic activity was at a higher level than in January and February."
Geologic Background. Langila, one of the most active volcanoes of New Britain, consists of a group of four small overlapping composite basaltic-andesitic cones on the lower E flank of the extinct Talawe volcano in the Cape Gloucester area of NW New Britain. A rectangular, 2.5-km-long crater is breached widely to the SE; Langila was constructed NE of the breached crater of Talawe. An extensive lava field reaches the coast on the N and NE sides of Langila. Frequent mild-to-moderate explosive eruptions, sometimes accompanied by lava flows, have been recorded since the 19th century from three active craters at the summit. The youngest and smallest crater (no. 3 crater) was formed in 1960 and has a diameter of 150 m.
Information Contacts: I. Itikarai, P. de Saint-Ours, and C. McKee, RVO; ICAO.
Lascar
Chile
23.37°S, 67.73°W; summit elev. 5592 m
All times are local (unless otherwise noted)
New lava dome in central crater; fumarolic activity
Growth of a new dome and fumarolic activity were observed in the active central crater (800 m wide, 350 m deep) during 26 Feb-8 March observations. The new dome, at the base of the crater's S wall, had a fresh surface of black spines and an apparent diameter of <1/3 the size of the dome erupted in 1989 (~200 m). Estimation of its size and shape was difficult because of its position directly below the observation point. The dome was apparently in an early stage of extrusion, and local authorities were warned of the possibility of large explosions within the next few months, similar to those in September 1986 and February 1990.
Fumarolic activity and sulfur deposition occurred along ring fractures elsewhere in the crater, and a strong sulfur odor was noted on the volcano's N and S flanks. White steam emissions to 300-500 m above the rim were punctuated by sporadic vigorous pulses of alternating white and dark gray columns, which rose to 2,500 m. Gentle summer winds primarily carried the plumes SE, although plumes extending northward were commonly observed in the morning. Although activity was vigorous, the jet fumaroles seen in the crater during a previous dome-building episode in 1989 (14:11) were not evident in 1992. No night glow was observed nor was seismicity recorded during the February-March observation period. Although there is no current seismic monitoring in the area, visual observations continue from nearby villages.
Geologic Background. Láscar is the most active volcano of the northern Chilean Andes. The andesitic-to-dacitic stratovolcano contains six overlapping summit craters. Prominent lava flows descend its NW flanks. An older, higher stratovolcano 5 km E, Volcán Aguas Calientes, displays a well-developed summit crater and a probable Holocene lava flow near its summit (de Silva and Francis, 1991). Láscar consists of two major edifices; activity began at the eastern volcano and then shifted to the western cone. The largest eruption took place about 26,500 years ago, and following the eruption of the Tumbres scoria flow about 9000 years ago, activity shifted back to the eastern edifice, where three overlapping craters were formed. Frequent small-to-moderate explosive eruptions have been recorded since the mid-19th century, along with periodic larger eruptions that produced ashfall hundreds of kilometers away. The largest historical eruption took place in 1993, producing pyroclastic flows to 8.5 km NW of the summit and ashfall in Buenos Aires.
Information Contacts: M. Gardeweg, SERNAGEOMIN, Santiago; S. Sparks and R. Thomas, Univ of Bristol; M. Murphy, Univ College, Dublin.
Ol Doinyo Lengai (Tanzania) — March 1992 Cite this Report
Ol Doinyo Lengai
Tanzania
2.764°S, 35.914°E; summit elev. 2962 m
All times are local (unless otherwise noted)
Continued production of small lava flows
Lava bubbled from a new vent (T20) [but see 17:6] in the center of the crater floor (figure 24) . . . on 12 March. A very recent lava flow (F33) extended from the new vent across the S depression, and was still cracking, suggesting that it had formed the previous day. The new vent was in roughly the same position as former vent T18 (observed in June-October 1991, but not in December 1991, perhaps after being covered by flow F32; 16:8 and 17:02), and may represent a renewal of activity from that vent. The largest of the remaining cones (T5/T9), estimated at 20 m high, had heat waves emanating from its vents. None of the other cones showed visible signs of activity
Geologic Background. The symmetrical Ol Doinyo Lengai is the only volcano known to have erupted carbonatite tephras and lavas in historical time. The prominent stratovolcano, known to the Maasai as "The Mountain of God," rises abruptly above the broad plain south of Lake Natron in the Gregory Rift Valley. The cone-building stage ended about 15,000 years ago and was followed by periodic ejection of natrocarbonatitic and nephelinite tephra during the Holocene. Historical eruptions have consisted of smaller tephra ejections and emission of numerous natrocarbonatitic lava flows on the floor of the summit crater and occasionally down the upper flanks. The depth and morphology of the northern crater have changed dramatically during the course of historical eruptions, ranging from steep crater walls about 200 m deep in the mid-20th century to shallow platforms mostly filling the crater. Long-term lava effusion in the summit crater beginning in 1983 had by the turn of the century mostly filled the northern crater; by late 1998 lava had begun overflowing the crater rim.
Information Contacts: C. Nyamweru, St. Lawrence Univ; M. Peterson, Arusha.
Manam (Papua New Guinea) — March 1992 Cite this Report
Manam
Papua New Guinea
4.08°S, 145.037°E; summit elev. 1807 m
All times are local (unless otherwise noted)
Vigorous Strombolian activity, strongest since 1987; small debris flows
"A build-up of activity at Southern Crater led to a series of brief phases of moderate-strong Strombolian activity starting on 23 March. Weak Strombolian eruptive activity started at Southern Crater on the evening of 29 February. Incandescent lava ejections were weak to moderate (up to 200 m above the crater), and intermittent (every few minutes or up to 6/minute) throughout the first 20 days of March. During the day, incandescence was not seen, but each burst produced a "puff" of brown ash-laden vapour that rose to between 500 and 1,000 m above the crater and produced fine ashfalls in coastal areas downwind. The ash consisted of ~45% black lithic material, 35% oxidized fragments, apparently from older rocks, and ~20% fresh-looking glass shards and crystals.
"The seismicity was at a moderate level, with 400-1,100 small, low-frequency events per day. Starting on 21 March, a definite build-up in seismicity (1,200-1,400 events/day of larger amplitude) was recorded in association with more forceful ash-laden ejections. Incandescent lava fragments rose to 500 m above the crater. The seismicity became sub-continuous in the afternoon of 23 March, moderately strong explosion sounds started to rattle the walls of Tabele Observatory . . . , and dark grey-brown ash clouds rose forcefully to 900-1,000 m above the crater. From 1615 to 2000 this crater produced sub-continuous emissions of incandescent scoriae to ~1,100 m above the crater rim, with flashing arcs a few seconds apart accompanying each explosion. Scoria avalanches descended into the upper SE and SW valleys, and ash and lapilli fell into coastal areas. The lapilli were as large as 3 cm in size and consisted of light, highly vesiculated, grey glassy pumices with ~5% crystals. The maximum thickness of the lapilli-ash deposit was ~0.5 cm. At the end of this eruptive phase, the seismicity dropped dramatically, but resumed six hours later when another similar phase of activity (of lesser intensity) started and continued for ~30 minutes.
"During the following week, a new pattern of activity was observed. Periods of sub-continuous Strombolian eruptions, with low frequency events in such close succession as to look like monochromatic tremor of fluctuating amplitude (lasting about an hour each) were separated by periods of irregular duration (0.5-22.75 hours) during which no emissions or night glow were seen over the crater and virtually no seismicity was recorded. Altogether there were 24 periods of sub-continuous Strombolian activity (counted from the periods of seismicity that characteristically accompanied them) between 23 and 30 March. Some of these active phases were followed by periods of intermittent, mild Strombolian activity lasting a few hours. After 30 March, the more usual pattern of regular Strombolian activity and seismicity (1,300-1,400 small events/day) resumed."
The crew of Qantas flight 59 reported a moderately dense black plume rising . . . to ~2.5 km altitude on 1 April at 1417. A NOTAM was issued several hours later. The observer at Manam reported sub-continuous ejection of thick gray-brown ash clouds to 400-500 m above the summit on 1 April, consistent with the aircraft report. Seismograms that day showed an even distribution of small volcanic earthquakes, not indicative of strong Strombolian activity.
"Aerial and ground inspections were conducted between 28 and 30 March. Southern Crater, which since at least 1975 has had an open funnel shape with a diameter of ~50 m, was bowl-shaped, clogged with agglutinated scoriae, and the active vent was only ~15 m wide and 8 m deep. There was no emission from the crater area between eruptions. The summit area was mantled with scoriae, but these deposits did not extend in any significant thickness lower than about the 1,000-m level, and no lava flows were produced. Only one small debris flow deposit was recognized in the SE valley; the flow descended a gully along its southern margin. Although the nose of the flow stopped at 950 m elev, a lighter hot cloud overriding it apparently continued to ~900 m elev, scorching vegetation. Other small debris flows may have contributed to the apron of pyroclastic debris on the upper part of the SE valley. A few small debris flows would have, similarly, cascaded down the steep rock face at the head of the SW valley and come to a stop in its amphitheatre, at ~900 m elev.
"Throughout March (and since April 1991), Main Crater was totally inactive, and its floor covered with debris eroded from the crater walls. Tilt recordings showed no significant change throughout the month, although 3 µrad of radial inflation were recorded at Tabele in the 3.5 months preceding the onset of the eruption. In late March, two short leveling lines (~500 m long) were laid out radially to the volcano on the lower E and NW flanks for further ground deformation monitoring in the upcoming months.
"The previous most significant activity from Manam occurred in June 1987. On 30 June, after a period of ~1.5 months of mild Strombolian activity, an intense Strombolian eruptive phase (of similar character to the latest activity) produced numerous scoria flows into the SE and SW valleys down to ~300 m elev. This phase also produced a short viscous basaltic lava flow, lapilli, and ashfalls that caused some damage to subsistence gardening areas near the coast (between 4 and 5 km radial distance from the crater). In comparison, the latest eruption was of lesser magnitude. It produced less than half the amount of material (<2-5 x 10⁶ m3) and no significant damage to gardens or inhabited areas."
Geologic Background. The 10-km-wide island of Manam, lying 13 km off the northern coast of mainland Papua New Guinea, is one of the country's most active volcanoes. Four large radial valleys extend from the unvegetated summit of the conical basaltic-andesitic stratovolcano to its lower flanks. These valleys channel lava flows and pyroclastic avalanches that have sometimes reached the coast. Five small satellitic centers are located near the island's shoreline on the northern, southern, and western sides. Two summit craters are present; both are active, although most observed eruptions have originated from the southern crater, concentrating eruptive products during much of the past century into the SE valley. Frequent eruptions, typically of mild-to-moderate scale, have been recorded since 1616. Occasional larger eruptions have produced pyroclastic flows and lava flows that reached flat-lying coastal areas and entered the sea, sometimes impacting populated areas.
Information Contacts: I. Itikarai, P. de Saint-Ours, and C. McKee, RVO; ICAO.
Merapi
Indonesia
7.54°S, 110.446°E; summit elev. 2910 m
All times are local (unless otherwise noted)
Continued lava extrusion; small rockfalls and avalanche-generated pyroclastic flows
Glowing rockfalls continued from Merapi's 1992 dome. They were channeled into the headwaters of rivers on the NW (Senowo), W (Putih), and SW (Bebeng) flanks, extending 300-2,000 m from the dome. The number of rockfalls and multiphase earthquakes generally decreased after late February, although they still dominated seismic records (figure 5). Occasional avalanche-generated pyroclastic flows remained relatively small and traveled a maximum of 2,000 m downslope. The plume was low (to 550 m height), relatively thin, and white. The average SO2 flux measured by COSPEC (figure 6) was 324 t/d through mid-April, with individual measurements ranging from 32 to 419 t/d, the highest on 2 April. As of mid-April, Merapi remained at a Level-1 Alert (see 17:2 for details of the alert system), with summit climbs by the public prohibited.
[1988 and 1990-91 seismicity and deformation data were moved to follow 15:7]
Geologic Background. Merapi, one of Indonesia's most active volcanoes, lies in one of the world's most densely populated areas and dominates the landscape immediately north of the major city of Yogyakarta. It is the youngest and southernmost of a volcanic chain extending NNW to Ungaran volcano. Growth of Old Merapi during the Pleistocene ended with major edifice collapse perhaps about 2,000 years ago, leaving a large arcuate scarp cutting the eroded older Batulawang volcano. Subsequent growth of the steep-sided Young Merapi edifice, its upper part unvegetated due to frequent activity, began SW of the earlier collapse scarp. Pyroclastic flows and lahars accompanying growth and collapse of the steep-sided active summit lava dome have devastated cultivated lands on the western-to-southern flanks and caused many fatalities.
Information Contacts: B. Voight, Pennsylvania State Univ.
Cerro Negro (Nicaragua) — March 1992 Cite this Report
Cerro Negro
Nicaragua
12.506°N, 86.702°W; summit elev. 728 m
All times are local (unless otherwise noted)
Strong Strombolian eruption with heavy ashfall and 28,000 evacuated
Violent Strombolian activity occurred at the volcano on 9-12 April, and resumed at lower intensity on 13-14 April. Heavy ashfall forced the evacuation of 28,000 people [but see BGVN 17:04] from nearby towns and from parts of León (18 km WSW; figure 3), the second-largest city in Nicaragua, between 10 and 12 April. No fatalities directly related to the eruption were reported, although there were two accidental deaths during the evacuation. The volcano was quiet as of 20 April.
9-12 April 1992. No instrumental seismic data were available before the eruption, but 5 earthquakes were felt in villages within 5 km of the volcano at about 2300 on 9 April, signalling the onset of activity. The first explosion occurred at 2320, and was quickly followed by the eruption of incandescent material with the development of a large ash cloud. The initial eruption plume rose an estimated 4000 m above the cone, and contained material up to bomb-size.
The ash cloud was visible on weather-satellite images beginning at 0000 on 10 April, and by 0530, the cloud extended 300 km to the WSW (264° azimuth), with a maximum width of about 200 km, at an estimated initial altitude of 6 km. Both ground and satellite observations indicated that the eruption was vigorous and nearly continuous. The eruption column, clearly visible from Managua (60 km SE) much of the time, was estimated from the ground to be approximately 7 km high. Satellite images showed that the plume extended 400 km W on 11-12 April. Material ejected to about 7.5 km during more energetic pulses of the eruption was carried roughly 50 km NE by higher-altitude winds. SO2 plumes that are significantly below the tropopause (roughly 16 km at this latitude) are difficult to detect with NASA's Total Ozone Mapping Spectrometer, and none were evident during the Cerro Negro eruption.
Ash began falling in León within 1 hour of the onset of activity, and formed deposits up to 4 cm thick by 1700 the next day. Very fine ashfall was reported as far away as the Pacific Coast (50 km W, in Corinto). Late on 10 April, the wind direction changed from WSW to W and ash accumulations were recognized in Telica (16 km W). That evening, 15 houses and several other structures, including a few large storage buildings, collapsed in León and surrounding areas. Collapses of numerous farm buildings, rural homes, and school buildings were reported over the next several days.
Ashfall continued W of the volcano, with accumulations of 2.5 cm of ash in Telica, 1.5 cm in Quezalguaque (20 km W), and 0.1 cm in Chinandega (50 km WNW) by 12 April. A change in wind direction to the SW during the night of 11 April caused the first ashfall S of León. That evening, incandescent material was observed consistently rising 300 m above the crater. Activity continued the following day, but was intermittent and less vigorous, finally ceasing at about 1800 on 12 April. During the 9-12 April activity, the crater diameter increased from approximately 100 m to 300-400 m.
13-14 April 1992. Only very light fumarolic activity was observed in the crater, and the volcano was otherwise quiet until explosions reportedly resumed around 2200-2300 on 13 April. An infrared satellite image at 2300 showed an already developed eruption cloud, which extended to about 350 km SSW by 0700 on 14 April. Remnants of the ash cloud produced by the more violent 9-12 April eruption were still evident 500 km W of the volcano on satellite images at 0800. Strombolian activity on 13-14 April ejected bombs to about 300 m height and produced a light ash cloud about 3.5 km high, but the interval between explosions (5 seconds early on 14 April), and their intensity, decreased throughout the day. The maximum recorded rate of ashfall in León, 2.4 gm/m2/minute, was measured at 1000. Although the plume appeared to be disconnected from the volcano on a satellite image at 1200, ground observations indicated that the eruption continued at lesser intensity until about 1730. Only light fumarolic activity was observed the following day.
Deposit thicknesses were 1 m, 1.2 km W; 15 cm, 13 km WSW; 5 cm, 20 km WSW; and 1 cm, 39 km WSW of the volcano. Rough calculations based on preliminary isopach mapping by INETER suggest a total erupted volume of approximately 0.03 km3 DRE.
Seismicity. Seismic stations were installed around the volcano on 10-11 April. During 10-12 April, low-frequency, low-amplitude seismic tremor was nearly continuous. Some B-type earthquakes were also recorded. The tremor rate declined on 12 April and tremor ceased on 13 April.
Several A-type events were recorded in the hours before the renewed eruption on 13 April. Tremor accompanied the eruption, and ceased at the end of explosive activity. Seismic data collected on 13-15 April (figure 4) show a very rapid rate of increase in seismic energy release immediately prior to the resumption of the eruption on the 13th, nearly steady-state energy release for the duration of the eruption, and a very rapid decrease to background levels following cessation of activity on the evening of the 14th. Geologists suggest that these data support the existence of a relatively open conduit that rapidly delivers magma from depth, and the current lack of any voluminous magma body close to the surface. On 17 April, 40 earthquakes were recorded near the volcano, a significant increase from seismicity on 15-16 April.
Geologic Background. Nicaragua's youngest volcano, Cerro Negro, was created following an eruption that began in April 1850 about 2 km NW of the summit of Las Pilas volcano. It is the largest, southernmost, and most recent of a group of four youthful cinder cones constructed along a NNW-SSE-trending line in the central Marrabios Range. Strombolian-to-subplinian eruptions at intervals of a few years to several decades have constructed a roughly 250-m-high basaltic cone and an associated lava field constrained by topography to extend primarily NE and SW. Cone and crater morphology have varied significantly during its short eruptive history. Although it lies in a relatively unpopulated area, occasional heavy ashfalls have damaged crops and buildings.
Information Contacts: Claudio Gutiérrez (Director); Helman Taleno L., Fabio Segura M., Martha Navarro C., Oscar Urbina L., and Wilfried Strauch, INETER, Aptdo. 2110, Managua, Nicaragua; Patricio Jerez, IRENA, Kilómetro 12, Carretera Norte, Managua, Nicaragua; C.B. Connor, FIU, Miami; J. Lynch, Thomas Baldwin, and Charles Kadin, SAB; S. Doiron, NASA GSFC; Deborah Jerez, 9808 Natick Rd., Burke, VA 22015 USA.
Niijima
Japan
34.397°N, 139.27°E; summit elev. 432 m
All times are local (unless otherwise noted)
Earthquake swarm but no surface changes evident
A seismic swarm recorded between 0200 and 0400 on 19 March consisted of 10 earthquakes beneath and around the island (figure 3). Several of the events were felt by island residents, the largest, M 2.5, at 0349. No surface anomalies were observed.
Geologic Background. The elongated island of Niijima, SSW of Oshima, is 11 km long and only 2.5 km wide. Eight low rhyolitic lava domes are clustered in two groups at the northern and southern ends of the island, separated by an area of flat-topped domes and a low isthmus of pyroclastic deposits. The Mukaiyama complex on the south and the Atchiyama lava dome on the north were formed during eruptions in the 9th century CE, the last known activity. Shikineyama and Zinaito domes form small islands immediately to the SW and W, respectively, during earlier stages of volcanism. Earthquake swarms occurred during the 20th century.
Information Contacts: JMA.
Pinatubo (Philippines) — March 1992 Cite this Report
Pinatubo
Philippines
15.13°N, 120.35°E; summit elev. 1486 m
All times are local (unless otherwise noted)
Lahar triggers secondary explosion on NE flank
On 4 April, rainfall triggered a lahar in a NE-flank drainage (Sacobia). The lahar disrupted a portion of the extensive June 1991 pyroclastic-flow deposits, producing a secondary explosion and reportedly a secondary pyroclastic flow. The press described an ash cloud that rose about 1,200 m, and darkened the Angeles area (25 km E of the summit). The lahar also destroyed two sabo dams that were being constructed to reduce future mudflow damage downslope, but no casualties or additional property damage were reported.
Geologic Background. Prior to 1991 Pinatubo volcano was a relatively unknown, heavily forested lava dome complex located 100 km NW of Manila with no records of historical eruptions. The 1991 eruption, one of the world's largest of the 20th century, ejected massive amounts of tephra and produced voluminous pyroclastic flows, forming a small, 2.5-km-wide summit caldera whose floor is now covered by a lake. Caldera formation lowered the height of the summit by more than 300 m. Although the eruption caused hundreds of fatalities and major damage with severe social and economic impact, successful monitoring efforts greatly reduced the number of fatalities. Widespread lahars that redistributed products of the 1991 eruption have continued to cause severe disruption. Previous major eruptive periods, interrupted by lengthy quiescent periods, have produced pyroclastic flows and lahars that were even more extensive than in 1991.
Information Contacts: R. Punongbayan, PHIVOLCS; Reuters.
Poas
Costa Rica
10.2°N, 84.233°W; summit elev. 2697 m
All times are local (unless otherwise noted)
Small phreatic eruptions; acid rain and mist cause damage on flanks; continued seismicity
Small phreatic explosions, observed in the crater lake in February, were concentrated in March at mud pots exposed by the continued decline in lake water level. Lake temperature measurements oscillated between 65 and 75°C. Gas emission continued, producing plumes that rose to >1 km and extended W and SW. Residents on the W and SW flanks reported that acid rain and mist affected vision, caused skin rashes, and damaged agricultural areas. On average, 237 earthquakes were recorded daily in March (at station POA2, 2.7 km SW of the crater), with a maximum of 398 on 4 March. A M 2.5 earthquake was recorded at 0652 on 3 March, centered 3.5 W of the crater at 7 km depth.
Geologic Background. The broad vegetated edifice of Poás, one of the most active volcanoes of Costa Rica, contains three craters along a N-S line. The frequently visited multi-hued summit crater lakes of the basaltic-to-dacitic volcano are easily accessible by vehicle from the nearby capital city of San José. A N-S-trending fissure cutting the complex stratovolcano extends to the lower N flank, where it has produced the Congo stratovolcano and several lake-filled maars. The southernmost of the two summit crater lakes, Botos, last erupted about 7,500 years ago. The more prominent geothermally heated northern lake, Laguna Caliente, is one of the world's most acidic natural lakes, with a pH of near zero. It has been the site of frequent phreatic and phreatomagmatic eruptions since an eruption was reported in 1828. Eruptions often include geyser-like ejections of crater-lake water.
Information Contacts: E. Fernández, J. Barquero, and V. Barboza, OVSICORI.
Rabaul (Papua New Guinea) — March 1992 Cite this Report
Rabaul
Papua New Guinea
4.2459°S, 152.1937°E; summit elev. 688 m
All times are local (unless otherwise noted)
Slight increase in seismicity
"Seismic activity increased slightly in March. The month's total number of caldera earthquakes was 267 . . .. The maximum daily count was 72, recorded on 7 March. None of the events was large enough to be felt. The strongest earthquake for the month was a ML 2.7 event recorded on 12 March."
Geologic Background. The low-lying Rabaul caldera on the tip of the Gazelle Peninsula at the NE end of New Britain forms a broad sheltered harbor utilized by what was the island's largest city prior to a major eruption in 1994. The outer flanks of the asymmetrical shield volcano are formed by thick pyroclastic-flow deposits. The 8 x 14 km caldera is widely breached on the east, where its floor is flooded by Blanche Bay and was formed about 1,400 years ago. An earlier caldera-forming eruption about 7,100 years ago is thought to have originated from Tavui caldera, offshore to the north. Three small stratovolcanoes lie outside the N and NE caldera rims. Post-caldera eruptions built basaltic-to-dacitic pyroclastic cones on the caldera floor near the NE and W caldera walls. Several of these, including Vulcan cone, which was formed during a large eruption in 1878, have produced major explosive activity during historical time. A powerful explosive eruption in 1994 occurred simultaneously from Vulcan and Tavurvur volcanoes and forced the temporary abandonment of Rabaul city.
Information Contacts: I. Itakarai, P. de Saint-Ours, and C. McKee, RVO; ICAO.
Rincon de la Vieja (Costa Rica) — March 1992 Cite this Report
Rincon de la Vieja
Costa Rica
10.83°N, 85.324°W; summit elev. 1916 m
All times are local (unless otherwise noted)
Small explosions and rumbling; earthquakes
Rumbling and small explosions were reported on several occasions in March. Portable seismometers at Proyecto Geotérmico Miravalles (35 km SE of the active crater) recorded small earthquakes, possibly associated with explosions, on 13-16, 20, and 26 March. A maximum of five events was recorded, on 16 March.
Geologic Background. Rincón de la Vieja, the largest volcano in NW Costa Rica, is a remote volcanic complex in the Guanacaste Range. The volcano consists of an elongated, arcuate NW-SE-trending ridge constructed within the 15-km-wide early Pleistocene Guachipelín caldera, whose rim is exposed on the south side. Sometimes known as the "Colossus of Guanacaste," it has an estimated volume of 130 km3 and contains at least nine major eruptive centers. Activity has migrated to the SE, where the youngest-looking craters are located. The twin cone of Santa María volcano, the highest peak of the complex, is located at the eastern end of a smaller, 5-km-wide caldera and has a 500-m-wide crater. A Plinian eruption producing the 0.25 km3 Río Blanca tephra about 3,500 years ago was the last major magmatic eruption. All subsequent eruptions, including numerous historical eruptions possibly dating back to the 16th century, have been from the prominent active crater containing a 500-m-wide acid lake located ENE of Von Seebach crater.
Information Contacts: G. Soto and R. Barquero, ICE; Guillermo Alvarado, GEOMAR, Christian-Albrechts-Universität, Germany; Mario Fernández, Univ. de Costa Rica.
Ruapehu (New Zealand) — March 1992 Cite this Report
Ruapehu
New Zealand
39.28°S, 175.57°E; summit elev. 2797 m
All times are local (unless otherwise noted)
Small phreatic eruptions accompany rise in Crater Lake temperature
Increased thermal activity began in early January, peaked around 23-26 February, and concluded about 8 March. Several minor phreatic eruptions were observed beginning on 8 February, including several since 11 February fieldwork. Steam clouds were observed over Crater Lake at 1500-1600 on 12 February by Dept of Conservation staff. On 18 February, airplane pilots (Darren Kirkland and Ross Bateup) reported a phreatic eruption generating a steam column and waves 0.6-0.9 m high at around 1100, and two large "bubbles" and a pulse of steam at 1822. During a visit on 20 February, Dr. Ockens (Univ of Sydney) heard an airplane engine-like noise, followed by steam emission from the lake and a sulfur odor. Kirkland observed an eruption that produced large waves at 1200 on 23 February, and after a week of relative quiet, reported the lake to be vigorously active at 1600-1800 on 6 March, producing dense steam clouds and large waves. Steam clouds were noted rising from the lake that day at about 1330, by Roger Smith (from near the lake shore) and Keith McKenzie (from a helicopter, at a distance). Smith also reported the appearance of sulfurous, yellow-green patches in the lake.
During fieldwork on 24 March, Crater Lake appeared pale gray, with upwelling (three or four cells) and yellow slicks over the N vent area. New snow was visible at the water's edge and there was no evidence of recent activity. The temperature data logger recorded a peak of 47°C on 23 and 26 February, then temperature fell, plateauing briefly at ~44°C on 2-8 March, and reaching 31.5°C (direct measurement) on 24 March (figure 12). Water analyses indicated no significant changes in Mg or Cl concentrations during the February-March activity.
EDM measurements showed moderate inflation associated with the February/March activity. Seismicity has remained at background levels since 11 February, with low-level volcanic tremor or small volcanic earthquakes recorded on most days. No signals related to reported activity were seen. Geologists noted that the February/March activity was similar to the minor events that occurred every 5-10 months between 1985 and January 1990.
Geologic Background. Ruapehu, one of New Zealand's most active volcanoes, is a complex stratovolcano constructed during at least four cone-building episodes dating back to about 200,000 years ago. The dominantly andesitic 110 km3 volcanic massif is elongated in a NNE-SSW direction and surrounded by another 100 km3 ring plain of volcaniclastic debris, including the NW-flank Murimoto debris-avalanche deposit. A series of subplinian eruptions took place between about 22,600 and 10,000 years ago, but pyroclastic flows have been infrequent. The broad summait area and flank contain at least six vents active during the Holocene. Frequent mild-to-moderate explosive eruptions have been recorded from the Te Wai a-Moe (Crater Lake) vent, and tephra characteristics suggest that the crater lake may have formed as recently as 3,000 years ago. Lahars resulting from phreatic eruptions at the summit crater lake are a hazard to a ski area on the upper flanks and lower river valleys.
Information Contacts: P. Otway, DSIR Wairakei.
Spurr (United States) — March 1992 Cite this Report
Spurr
United States
61.299°N, 152.251°W; summit elev. 3374 m
All times are local (unless otherwise noted)
Earthquake swarms but no indication of imminent eruption
In January-February 1992, seismic activity was at the highest levels since the start of monitoring in 1980, although there is no indication that an eruption is imminent. This activity followed a significant increase in August 1991, when earthquakes began to occur beneath Crater Peak, a region that had been almost quiescent since monitoring began (figures 1 and 2). During January-July 1991, within a 10-km radius of the volcano, an average of 2 earthquakes (M>0) were recorded every 10 days. This average increased to 7 earthquakes/10 days in August-November 1991, and again to 20 earthquakes/10 days in December 1991-February 1992. Most of the earthquakes had magnitudes <1 and depths <5 km. Since November 1991, the majority of the earthquakes have been centered beneath the main summit and Crater Peak, with a zone of lesser activity 5 km N of the main summit.
Seismicity at Spurr has been characterized by large fluctuations in the number of events. Large earthquake swarms were recorded in early 1982 (>140 events recorded) and in early 1989 (not shown in figure 2), both centered 3 km N of the main summit. Normal seismicity has tended to concentrate beneath the main summit.
On 9 July 1953, a brief explosive eruption from Crater Peak produced a 21-km-high plume that dropped ash in Anchorage (120 km E). A mudflow blocked the Chakachatna River (S flank), forming a lake 8 km long.
Reference. Nye, C.J., and Turner, D.L., 1990, Petrology, geochemistry, and age of the Spurr Volcanic Complex, eastern Aleutian Arc: BV, v. 52, p. 205-226.
Geologic Background. Mount Spurr is the closest volcano to Anchorage, Alaska (130 km W) and just NE of Chakachamna Lake. The summit is a large lava dome at the center of a roughly 5-km-wide amphitheater open to the south formed by a late-Pleistocene or early Holocene debris avalanche and associated pyroclastic flows that destroyed an older edifice. The debris avalanche traveled more than 25 km SE, and the resulting deposit contains blocks as large as 100 m in diameter. Several ice-carved post-collapse cones or lava domes are present. The youngest vent, Crater Peak, formed at the southern end of the amphitheater and has been the source of about 40 identified Holocene tephra layers. Eruptions from Crater Peak in 1953 and 1992 deposited ash in Anchorage.
Information Contacts: AVO.
Stromboli
Italy
38.789°N, 15.213°E; summit elev. 924 m
All times are local (unless otherwise noted)
Less-frequent eruptive episodes
Visitors ... in mid-March reported that activity was at a low level, with only a few eruptive episodes an hour. Despite frequent heavy rains, no dark, ash-laden phreatomagmatic eruption plumes were observed. When viewed from a ferryboat for about an hour during the morning of 18 March, the volcano erupted only once, shortly after 0730, otherwise emitting only a gas plume.
Geologic Background. Spectacular incandescent nighttime explosions at Stromboli have long attracted visitors to the "Lighthouse of the Mediterranean" in the NE Aeolian Islands. This volcano has lent its name to the frequent mild explosive activity that has characterized its eruptions throughout much of historical time. The small island is the emergent summit of a volcano that grew in two main eruptive cycles, the last of which formed the western portion of the island. The Neostromboli eruptive period took place between about 13,000 and 5,000 years ago. The active summit vents are located at the head of the Sciara del Fuoco, a prominent scarp that formed about 5,000 years ago due to a series of slope failures which extends to below sea level. The modern volcano has been constructed within this scarp, which funnels pyroclastic ejecta and lava flows to the NW. Essentially continuous mild Strombolian explosions, sometimes accompanied by lava flows, have been recorded for more than a millennium.
Information Contacts: B. Behncke, GEOMAR, Kiel.
Turrialba (Costa Rica) — March 1992 Cite this Report
Turrialba
Costa Rica
10.025°N, 83.767°W; summit elev. 3340 m
All times are local (unless otherwise noted)
Continued low-frequency seismicity
Low-frequency seismicity continued at levels similar to February. An average of 1-2 events were recorded daily (at station VTU, 0.5 km E of the crater), with a maximum of four events on 6 March.
Geologic Background. Turrialba, the easternmost of Costa Rica's Holocene volcanoes, is a large vegetated basaltic-to-dacitic stratovolcano located across a broad saddle NE of Irazú volcano overlooking the city of Cartago. The massive edifice covers an area of 500 km2. Three well-defined craters occur at the upper SW end of a broad 800 x 2200 m summit depression that is breached to the NE. Most activity originated from the summit vent complex, but two pyroclastic cones are located on the SW flank. Five major explosive eruptions have occurred during the past 3500 years. A series of explosive eruptions during the 19th century were sometimes accompanied by pyroclastic flows. Fumarolic activity continues at the central and SW summit craters.
Information Contacts: E. Fernández, J. Barquero, and V. Barboza, OVSICORI.
Unzendake
Japan
32.761°N, 130.299°E; summit elev. 1483 m
All times are local (unless otherwise noted)
Lava extrusion persists; new dome follows increased seismicity; strong pyroclastic-flow activity
Lava extrusion . . . was continuing in mid-April 1992. Dome 5 . . . swelled by intrusion, pushing the N half of dome 4 eastward, while dome 6 (formed 3 December 1991) thickened by new surface flows (figure 41). The length of dome 6 did not increase significantly, and the complex "petal" surface structures remained close to the vent, now the highest point in the dome complex. Increased seismicity in early April preceded the extrusion of a new dome (7), which was growing rapidly at mid-month.
Frequent partial collapse of the front and sides of dome 6, and rarely the E and NE side of dome 5, generated pyroclastic flows that descended SE (toward the Akamatsu River) and sometimes ESE (along the Mizunashi River). During March, 504 pyroclastic flows were seismically recorded, up from 344 in February. The SE slope of the Akamatsu Valley was almost filled by block-and-ash-flow deposits by early April. A large pyroclastic flow, generated by collapse of large blocks between domes 5 and 6 on 1 April, traveled 3 km down the Mizunashi River, reaching the evacuated town of Kita-Kamikoba (where 43 people were killed by the 3 June 1991 flows). The 1 April block-and-ash-flow deposit was thinner, and its ash-cloud surge deposit was thinner and distributed over a much smaller area than those from the 3 June 1991 flows. The 1 April pyroclastic flow was the largest since the 15 September 1991 flows, whose deposit surface and lava blocks continued to steam as of early April. Small pit craters (to 30 cm diameter) were visible on the surface of the September 1991 deposit.
Heavy rainfall triggered three large debris flows in March. The 1 March debris flow reached a point 100 m from the coast (8 km E of the summit) crossing Routes 57 and 251, and burying a 200-m section of the Shimabara Railway. At 1000 on 15 March, 30 mm/hour of rainfall triggered a debris flow of similar size and route. Both highways were crossed, and a 140-m section of the railway was buried by 0.3 m of mud, remaining closed until 14 April. A smaller debris flow occurred along the same route on the morning of 23 March, burying a 30-m section of Route 251. Roughly 7,600 people remained evacuated as of mid-April.
During March, 5,663 earthquakes were recorded on the dome complex, down slightly from 6423 in February. Seismicity declined through mid-March, increased to the highest level of the eruption, and then declined again at the end of the month. The number of earthquakes increased during the first few days of April, before declining once more on 6 April, as a new dome (7) began to emerge. The new dome had grown to 100 x 150 m by 12 April (figure 41).
Geologic Background. The massive Unzendake volcanic complex comprises much of the Shimabara Peninsula east of the city of Nagasaki. An E-W graben, 30-40 km long, extends across the peninsula. Three large stratovolcanoes with complex structures, Kinugasa on the north, Fugen-dake at the east-center, and Kusenbu on the south, form topographic highs on the broad peninsula. Fugendake and Mayuyama volcanoes in the east-central portion of the andesitic-to-dacitic volcanic complex have been active during the Holocene. The Mayuyama lava dome complex, located along the eastern coast west of Shimabara City, formed about 4000 years ago and was the source of a devastating 1792 CE debris avalanche and tsunami. Historical eruptive activity has been restricted to the summit and flanks of Fugendake. The latest activity during 1990-95 formed a lava dome at the summit, accompanied by pyroclastic flows that caused fatalities and damaged populated areas near Shimabara City.
Information Contacts: S. Nakada, Kyushu Univ; JMA.
Vulcano
Italy
38.404°N, 14.962°E; summit elev. 500 m
All times are local (unless otherwise noted)
Vigorous fumarolic activity
Vigorous fumarolic activity was continuing from the N rim of the historically active crater (Fossa Grande) and from thermal areas on the upper N flank during a visit on the afternoon of 18 March. Most of the fumaroles were concentrated along the N crater rim, inside the N part of the crater, and on the N flank of the wall of tephra built during Vulcano's last eruption, in 1888-90. The main fumarole field appears to have extended a short distance to the E along the N crater rim, where new vents had formed since Behncke's last visit in November 1990. A new linear zone of high-pressure gas emission has developed roughly parallel to the large fissure that formed after 1988 on the N crater wall. Fumarolic activity from scattered vents on the upper N flank seemed to have increased since November 1990, and a less-prominent thermal area on the outer SE flank included at least 7 weak fumarolic vents.
Intense hydrothermal alteration and erosional undercutting have occurred on the upper N flank, around the S rim of the 18th-century Forgia Vecchia craters. Extension cracks have appeared within a few meters of the steep N slope, and deep gullies extend toward the coastal town of Porto di Levante.
Geologic Background. The word volcano is derived from Vulcano stratovolcano in Italy's Aeolian Islands. Vulcano was constructed during six stages over the past 136,000 years. Two overlapping calderas, the 2.5-km-wide Caldera del Piano on the SE and the 4-km-wide Caldera della Fossa on the NW, were formed at about 100,000 and 24,000-15,000 years ago, respectively, and volcanism has migrated north over time. La Fossa cone, active throughout the Holocene and the location of most historical eruptions, occupies the 3-km-wide Caldera della Fossa at the NW end of the elongated 3 x 7 km island. The Vulcanello lava platform is a low, roughly circular peninsula on the northern tip of Vulcano that was formed as an island beginning more than 2,000 years ago and was connected to the main island in about 1550 CE. Vulcanello is capped by three pyroclastic cones and was active intermittently until the 16th century. Explosive activity took place at the Fossa cone from 1898 to 1900.
Information Contacts: B. Behncke, GEOMAR, Kiel.
Whakaari/White Island (New Zealand) — March 1992 Cite this Report
Whakaari/White Island
New Zealand
37.52°S, 177.18°E; summit elev. 294 m
All times are local (unless otherwise noted)
Continued vigorous explosive activity
Explosive activity continued through early March from Wade and TV1 Craters.... Distinct emissions of gray and reddish ash were observed during regular visits to the island and from nearby fishing vessels. A larger event on 20 February produced a tall plume (estimates ranged up to 5,000 m) and ejected blocks and juvenile bombs. Numerous E-type seismic signals were recorded through mid-Mar.
Observations. On 3 February, R. Fleming (Waimana Helicopters) noted gray ash, not present during a 1 February visit, covering the W and SW walls of the main crater. Two eruption columns were reported the next day, the first at 0740 by R. Pollack (MV Pursuit), and a stronger one at 1318 by V. Froude (Dept of Conservation; MV Takapu). Froude observed another eruption column at 0737 on 5 February. TV1 Crater was the source of a light gray ash cloud, 50-100 m high, during an island visit at 1040-1730 on 7 February. Ash again emerged from TV1 during a 12 February visit. Light pink-brown ash emission began at about 1229, and increased slightly during the afternoon. The next day, Fleming reported the emission of red ash from TV1 (at 1530). Strong red ash emissions were reported at 1900-2000 by John Baker (MV Ma Cherie). Wade Crater, inactive earlier in the month, erupted light pink-red ash during a 17 February visit (1030-1546), while TV1 emitted only white steam.
The eruption on 20 February began abruptly at about 1004 without any visible precursors. The initial dark eruptive pulse rose rapidly from TV1 Crater, accompanied by an uprushing noise. Ballistics, white lithic blocks, and dark (not visibly incandescent) juvenile bombs, were ejected to 400-500 m height. Another 3-5 more-dilute, block-free pulses of activity occurred over the next 5 minutes, feeding a high convective plume that traveled SSE. By 1010, several observers along the Bay of Plenty coast had seen the eruption cloud, estimating heights of 1,600-5,000 m. R. Martin and M. Stringfellow (Bay of Plenty Regional Council staff) measured elevation angles of 4.8-5°, yielding column heights of 4,200-4,300 m. Fleming estimated that the initial eruptive pulse rose 1,700-1,800 m before expanding. By 1020, activity had decreased to an ash-free, very weakly convoluting, low eruptive plume. High levels of steam and gas emission continued for 1.5 hours after the explosion, before a dramatic decrease in mid-afternoon.
Voluminous light-brown ash emissions completely obscured the main crater during an afternoon visit on 27 February. On 1 March, thick dark ash emissions were reported by Pollack at 0847. Wade Crater erupted a cloud of pink/brown ash 500-700 m high while TV1 emitted white steam, during a visit at 1125-1515 on 3 March. Nearly continuous ashfall occurred E of the crater. Maximum particle sizes were ~1 mm. Occasional roaring and thumping noises were heard. Fumarole temperatures ranged to >300°C, and analyses of gas samples showed high gas/water ratios, with one sample yielding a strong magmatic signature. The floor of May 91 Crater was nearly flat, reaching 30-35 m below its SE rim. During a 5 March visit at 1020-1605, Wade emitted a weak ash-tinged plume and conspicuously blue fume, accompanied by loud, pulsating degassing noises. Dense ash-free steam from TV1 often obscured half of the 1978/90 Crater Complex. No ash was observed during a 10 March visit, although a steam plume rose to 300-400 m.
Seismicity. B-type seismicity increased from 5-6 events recorded daily 18-24 January to >15/day 1-5 February, while the daily number of recorded A-type earthquakes remained at 2-4. Medium-frequency volcanic tremor began on 6 February. B-type earthquakes declined sharply in number, and were absent from records on 12-17 February. Volcanic tremor amplitude increased after 11 February to a peak on 16 February, coinciding with an 11-hour period (15-16 February) when 4-6 microearthquakes were recorded per minute. Tremor, predominantly medium-frequency (4-7 Hz) with occasional lower frequency signals lasting 1-5 hours, declined to background levels by 21 February. The level of seismic activity remained similar (0-6 A-type and 0-5 B-type events daily) through 3 March, when a swarm of >40 B-type events was recorded.
E-type (eruption) events were recorded every several days during late January-early February [six from 30 January-4 February], were rare in mid-February [one on 14 February], then occurred almost daily from late February through mid-March [20 from 20 February-15 March, with seven on 29 February]. The event that accompanied the production of the large ash-laden column on 20 February was similar to, but larger than, the 17 January seismic event. Of the two predominant varieties of E-type signals during this period, the more common had a low-frequency onset followed by a high-frequency coda; the other was dominantly high-frequency and had a more impulsive onset.
Geologic Background. The uninhabited Whakaari/White Island is the 2 x 2.4 km emergent summit of a 16 x 18 km submarine volcano in the Bay of Plenty about 50 km offshore of North Island. The island consists of two overlapping andesitic-to-dacitic stratovolcanoes. The SE side of the crater is open at sea level, with the recent activity centered about 1 km from the shore close to the rear crater wall. Volckner Rocks, sea stacks that are remnants of a lava dome, lie 5 km NW. Descriptions of volcanism since 1826 have included intermittent moderate phreatic, phreatomagmatic, and Strombolian eruptions; activity there also forms a prominent part of Maori legends. The formation of many new vents during the 19th and 20th centuries caused rapid changes in crater floor topography. Collapse of the crater wall in 1914 produced a debris avalanche that buried buildings and workers at a sulfur-mining project. Explosive activity in December 2019 took place while tourists were present, resulting in many fatalities. The official government name Whakaari/White Island is a combination of the full Maori name of Te Puia o Whakaari ("The Dramatic Volcano") and White Island (referencing the constant steam plume) given by Captain James Cook in 1769.
Information Contacts: I. Nairn and B. Scott, DSIR Rotorua.
Yellowstone (United States) — March 1992 Cite this Report
Yellowstone
United States
44.43°N, 110.67°W; summit elev. 2805 m
All times are local (unless otherwise noted)
Strong new thermal activity
In 1985, a new superheated fumarole formed on the upper E margin of the Mushpots thermal area, which lies on the E side of the caldera associated with the youngest of Yellowstone's three cycles of voluminous rhyolitic volcanism, 0.6 million years ago. The presence of vegetation and the limited extent of bare thermal ground indicated that heat flow near the site of the new fumarole had been moderate to low for at least the previous 15 years. Interviews with park personnel strongly suggested that activity began about 3 July 1985. The steam cloud from the vent may have inspired a false report of smoke from the area, but the vent was not discovered until 5 October 1986, during fieldwork by C. Craig-Hunter and Roderick Hutchinson. At that time, the fumarole's transparent dry-steam jet was directed upslope N35°W at an approximate angle of 21°. A small, reddish-brown, iron-stained cone of hydrothermally altered sand-sized material had grown ~ 0.5 m above the uphill side of the rectangular 1.35 x 1.9-m vent, which dipped at an angle under the lower S rim. Just below the fumarole, on the floor of an old thermal zone, were numerous new or recently enlarged, small, steaming, thermal and mud pot vents, covering an area ~ 10 m in diameter. Sulfate and/or yellow elemental sulfur deposits covered most of the area and nearby slopes to the W, SW, and NW. A second area of new or rejuvenated thermal vents was also discovered in the drainage to the south.
Many trees had been killed in line with the fumarole's directed plume and around the margins of the old thermal zone. Mature trees as much as 87 cm in diameter were snapped off at ground level or uprooted, and tops were broken on other trees 40 m from the rim of the old thermal zone (54 m from the fumarole). A narrow zone of hydrothermally altered white chips of glacial till was found among the toppled trees up to 40 m from the thermal zone rim. These ejecta were 6 cm deep on the rim in 1986.
Geologists returned on 12 February 1987, after a nearby Univ of Utah seismograph . . . detected an isolated episode resembling volcanic tremor. The fumarole's temperature had increased (figure 1) and more elemental sulfur and iron sulfates had been deposited in the old thermal zone, but no other changes were evident. Since then, a biannual survey has been conducted in the area.
During fieldwork on 28 March 1992, a quiet cloud of wet, 93°C vapor filled the 1985 fumarole's vent. However, less than 30 m downslope (S), on the E margin of the old thermal zone's floor, the ground was shaking violently with the formation and growth of a new mud pot. Bursts of thick, viscous mud were typically doming to 2 m and occasionally to 5 m in diameter before exploding to 3-6 m height. Each explosion shook the ground in all directions. Branches of thermally killed trees shook 50 m away, the ground was visibly moving 8-10 m from the rim, and within 4 m of the rim was behaving like pudding, with violent shaking causing surface oscillations of 1-2 cm. During 90 minutes of observations, the surface area of the mud pot increased by ~ 50%, to an estimated 11 x 7 m. It had a depth of at least 2 m. The minimal amount of ejected mud surrounding the crater and the intense shaking suggested that development of the mud pot had begun within the last 24 hours.
Geologic Background. The Yellowstone Plateau volcanic field developed through three volcanic cycles spanning two million years that included some of the world's largest known eruptions. Eruption of the over 2,450 km3 Huckleberry Ridge Tuff about 2.1 million years ago created the more than 75-km-long Island Park caldera. The second cycle concluded with the eruption of the Mesa Falls Tuff around 1.3 million years ago, forming the 16-km-wide Henrys Fork caldera at the western end of the first caldera. Activity subsequently shifted to the present Yellowstone Plateau and culminated 640,000 years ago with the eruption of the over 1,000 km3 Lava Creek Tuff and the formation of the present 45 x 85 km caldera. Resurgent doming subsequently occurred at both the NE and SW sides of the caldera and voluminous (1000 km3) intracaldera rhyolitic lava flows were erupted between 150,000 and 70,000 years ago. No magmatic eruptions have occurred since the late Pleistocene, but large hydrothermal events took place near Yellowstone Lake during the Holocene. Yellowstone is presently the site of one of the world's largest hydrothermal systems, including Earth's largest concentration of geysers.
Information Contacts: Roderick A. Hutchinson, Yellowstone National Park.