Recently Published Bulletin Reports
Erebus (Antarctica) Lava lake remains active; most thermal alerts recorded since 2019
Rincon de la Vieja (Costa Rica) Frequent phreatic explosions during July-December 2023
Bezymianny (Russia) Explosion on 18 October 2023 sends ash plume 8 km high; lava flows and incandescent avalanches
Kilauea (United States) Low-level lava effusions in the lava lake at Halema’uma’u during July-December 2022
Nyamulagira (DR Congo) Lava flows and thermal activity during May-October 2023
Bagana (Papua New Guinea) Explosions, ash plumes, ashfall, and lava flows during April-September 2023
Mayon (Philippines) Lava flows, pyroclastic flows, ash emissions, and seismicity during April-September 2023
Nishinoshima (Japan) Eruption plumes and gas-and-steam plumes during May-August 2023
Krakatau (Indonesia) White gas-and-steam plumes and occasional ash plumes during May-August 2023
Villarrica (Chile) Strombolian activity, gas-and-ash emissions, and crater incandescence during April-September 2023
Merapi (Indonesia) Frequent incandescent avalanches during April-September 2023
Ebeko (Russia) Moderate explosive activity with ash plumes continued during June-November 2023
Erebus (Antarctica) — January 2024  Cite this Report
Erebus
Antarctica
77.53°S, 167.17°E; summit elev. 3794 m
All times are local (unless otherwise noted)
Lava lake remains active; most thermal alerts recorded since 2019
The lava lake in the summit crater of Erebus has been active since at least 1972. Located in Antarctica overlooking the McMurdo Station on Ross Island, it is the southernmost active volcano on the planet. Because of the remote location, activity is primarily monitored by satellites. This report covers activity during 2023.
The number of thermal alerts recorded by the Hawai'i Institute of Geophysics and Planetology’s MODVOLC Thermal Alerts System increased considerably in 2023 compared to the years 2020-2022 (table 9). In contrast to previous years, the MODIS instruments aboard the Aqua and Terra satellites captured data from Erebus every month during 2023. Consistent with previous years, the lowest number of anomalous pixels were recorded in January, November, and December.
Table 9. Number of monthly MODIS-MODVOLC thermal alert pixels recorded at Erebus during 2017-2023. See BGVN 42:06 for data from 2000 through 2016. The table was compiled using data provided by the HIGP – MODVOLC Thermal Alerts System.
| Year |
Jan |
Feb |
Mar |
Apr |
May |
Jun |
Jul |
Aug |
Sep |
Oct |
Nov |
Dec |
SUM |
| 2017 |
0 |
21 |
9 |
0 |
0 |
1 |
11 |
61 |
76 |
52 |
0 |
3 |
234 |
| 2018 |
0 |
21 |
58 |
182 |
55 |
17 |
137 |
172 |
103 |
29 |
0 |
0 |
774 |
| 2019 |
2 |
21 |
162 |
151 |
55 |
56 |
75 |
53 |
29 |
19 |
1 |
0 |
624 |
| 2020 |
0 |
2 |
16 |
18 |
4 |
4 |
1 |
3 |
18 |
3 |
1 |
6 |
76 |
| 2021 |
0 |
9 |
1 |
0 |
2 |
56 |
46 |
47 |
35 |
52 |
5 |
3 |
256 |
| 2022 |
1 |
13 |
55 |
22 |
15 |
32 |
39 |
19 |
31 |
11 |
0 |
0 |
238 |
| 2023 |
2 |
33 |
49 |
82 |
41 |
32 |
70 |
64 |
42 |
17 |
5 |
11 |
448 |
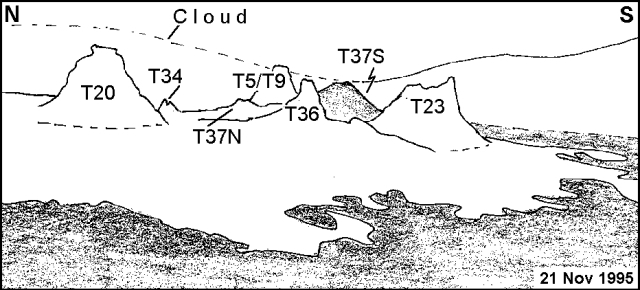
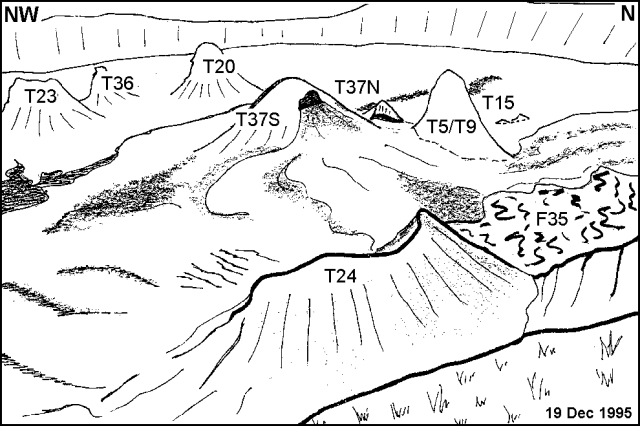
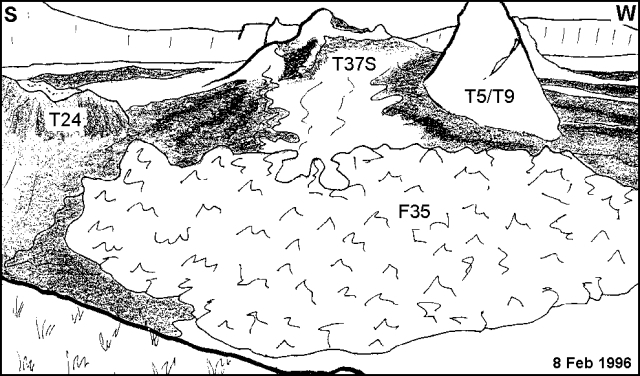
Sentinel-2 infrared images showed one or two prominent heat sources within the summit crater, accompanied by adjacent smaller sources, similar to recent years (see BGVN 46:01, 47:02, and 48:01). A unique image was obtained on 25 November 2023 by the OLI-2 (Operational Land Imager-2) on Landsat 9, showing the upper part of the volcano surrounded by clouds (figure 32).
Geologic Background. Mount Erebus, the world's southernmost historically active volcano, overlooks the McMurdo research station on Ross Island. It is the largest of three major volcanoes forming the crudely triangular Ross Island. The summit of the dominantly phonolitic volcano has been modified by one or two generations of caldera formation. A summit plateau at about 3,200 m elevation marks the rim of the youngest caldera, which formed during the late-Pleistocene and within which the modern cone was constructed. An elliptical 500 x 600 m wide, 110-m-deep crater truncates the summit and contains an active lava lake within a 250-m-wide, 100-m-deep inner crater; other lava lakes are sometimes present. The glacier-covered volcano was erupting when first sighted by Captain James Ross in 1841. Continuous lava-lake activity with minor explosions, punctuated by occasional larger Strombolian explosions that eject bombs onto the crater rim, has been documented since 1972, but has probably been occurring for much of the volcano's recent history.
Information Contacts: Hawai'i Institute of Geophysics and Planetology (HIGP) - MODVOLC Thermal Alerts System, School of Ocean and Earth Science and Technology (SOEST), Univ. of Hawai'i, 2525 Correa Road, Honolulu, HI 96822, USA (URL: http://modis.higp.hawaii.edu/); Copernicus Browser, Copernicus Data Space Ecosystem, European Space Agency (URL: https://dataspace.copernicus.eu/browser/); NASA Earth Observatory, EOS Project Science Office, NASA Goddard Space Flight Center, Goddard, Maryland, USA (URL: https://earthobservatory.nasa.gov/images/152134/erebus-breaks-through).
Rincon de la Vieja (Costa Rica) — January 2024 Cite this Report
Rincon de la Vieja
Costa Rica
10.83°N, 85.324°W; summit elev. 1916 m
All times are local (unless otherwise noted)
Frequent phreatic explosions during July-December 2023
Rincón de la Vieja is a volcanic complex in Costa Rica with a hot convecting acid lake that exhibits frequent weak phreatic explosions, gas-and-steam emissions, and occasional elevated sulfur dioxide levels (BGVN 45:10, 46:03, 46:11). The current eruption period began June 2021. This report covers activity during July-December 2023 and is based on weekly bulletins and occasional daily reports from the Observatorio Vulcanologico Sismologica de Costa Rica-Universidad Nacional (OVSICORI-UNA).
Numerous weak phreatic explosions continued during July-December 2023, along with gas-and-steam emissions and plumes that rose as high as 3 km above the crater rim. Many weekly OVSICORI-UNA bulletins included the previous week's number of explosions and emissions (table 9). For many explosions, the time of explosion was given (table 10). Frequent seismic activity (long-period earthquakes, volcano-tectonic earthquakes, and tremor) accompanied the phreatic activity.
Table 9. Number of reported weekly phreatic explosions and gas-and-steam emissions at Rincón de la Vieja, July-December 2023. Counts are reported for the week before the Weekly Bulletin date; not all reports included these data. Courtesy of OVSICORI-UNA.
| OVSICORI Weekly Bulletin |
Number of explosions |
Number of emissions |
| 28 Jul 2023 |
6 |
14 |
| 4 Aug 2023 |
10 |
12 |
| 1 Sep 2023 |
13 |
11 |
| 22 Sep 2023 |
12 |
13 |
| 29 Sep 2023 |
6 |
11 |
| 6 Oct 2023 |
12 |
5 |
| 13 Oct 2023 |
7 |
9 |
| 20 Oct 2023 |
1 |
15 |
| 27 Oct 2023 |
3 |
23 |
| 3 Nov 2023 |
3 |
10 |
| 17 Nov 2023 |
0 |
Some |
| 24 Nov 2023 |
0 |
14 |
| 8 Dec 2023 |
4 |
16 |
| 22 Dec 2023 |
8 |
18 |
Table 10. Summary of activity at Rincón de la Vieja during July-December 2023. Weak phreatic explosions and gas emissions are noted where the time of explosion was indicated in the weekly or daily bulletins. Height of plumes or emissions are distance above the crater rim. Courtesy of OVSICORI-UNA.
| Date |
Time |
Description of Activity |
| 1 Jul 2023 |
0156 |
Explosion. |
| 2 Jul 2023 |
0305 |
Explosion. |
| 4 Jul 2023 |
0229, 0635 |
Event at 0635 produced a gas-and-steam plume that rose 700 m and drifted W; seen by residents in Liberia (21 km SW). |
| 9 Jul 2023 |
1843 |
Explosion. |
| 21 Jul 2023 |
0705 |
Explosion. |
| 26 Jul 2023 |
1807 |
Explosion. |
| 28 Jul 2023 |
0802 |
Explosion generated a gas-and-steam plume that rose 500 m. |
| 30 Jul 2023 |
1250 |
Explosion. |
| 31 Jul 2023 |
2136 |
Explosion. |
| 11 Aug 2023 |
0828 |
Explosion. |
| 18 Aug 2023 |
1304 |
Explosion. |
| 21 Aug 2023 |
1224 |
Explosion generated gas-and-steam plumes rose 500-600 m. |
| 22 Aug 2023 |
0749 |
Explosion generated gas-and-steam plumes rose 500-600 m. |
| 24 Aug 2023 |
1900 |
Explosion. |
| 25 Aug 2023 |
0828 |
Event produced a steam-and-gas plume that rose 3 km and drifted NW. |
| 27-28 Aug 2023 |
0813 |
Four small events; the event at 0813 on 28 August lasted two minutes and generated a steam-and-gas plume that rose 2.5 km. |
| 1 Sep 2023 |
1526 |
Explosion generated plume that rose 2 km and ejected material onto the flanks. |
| 2-3 Sep 2023 |
- |
Small explosions detected in infrasound data. |
| 4 Sep 2023 |
1251 |
Gas-and-steam plume rose 1 km and drifted W. |
| 7 Nov 2023 |
1113 |
Explosion. |
| 8 Nov 2023 |
0722 |
Explosion. |
| 12 Nov 2023 |
0136 |
Small gas emissions. |
| 14 Nov 2023 |
0415 |
Small gas emissions. |
According to OVSICORI-UNA, during July-October the average weekly sulfur dioxide (SO2) flux ranged from 68 to 240 tonnes/day. However, in mid-November the flux increased to as high as 334 tonnes/day, the highest value measured in recent years. The high SO2 flux in mid-November was also detected by the TROPOMI instrument on the Sentinel-5P satellite (figure 43).
Geologic Background. Rincón de la Vieja, the largest volcano in NW Costa Rica, is a remote volcanic complex in the Guanacaste Range. The volcano consists of an elongated, arcuate NW-SE-trending ridge constructed within the 15-km-wide early Pleistocene Guachipelín caldera, whose rim is exposed on the south side. Sometimes known as the "Colossus of Guanacaste," it has an estimated volume of 130 km3 and contains at least nine major eruptive centers. Activity has migrated to the SE, where the youngest-looking craters are located. The twin cone of Santa María volcano, the highest peak of the complex, is located at the eastern end of a smaller, 5-km-wide caldera and has a 500-m-wide crater. A Plinian eruption producing the 0.25 km3 Río Blanca tephra about 3,500 years ago was the last major magmatic eruption. All subsequent eruptions, including numerous historical eruptions possibly dating back to the 16th century, have been from the prominent active crater containing a 500-m-wide acid lake located ENE of Von Seebach crater.
Information Contacts: Observatorio Vulcanológico Sismológica de Costa Rica-Universidad Nacional (OVSICORI-UNA), Apartado 86-3000, Heredia, Costa Rica (URL: http://www.ovsicori.una.ac.cr/); NASA Global Sulfur Dioxide Monitoring Page, Atmospheric Chemistry and Dynamics Laboratory, NASA Goddard Space Flight Center (NASA/GSFC), 8800 Greenbelt Road, Goddard MD 20771, USA (URL: https://so2.gsfc.nasa.gov/).
Bezymianny (Russia) — November 2023 Cite this Report
Bezymianny
Russia
55.972°N, 160.595°E; summit elev. 2882 m
All times are local (unless otherwise noted)
Explosion on 18 October 2023 sends ash plume 8 km high; lava flows and incandescent avalanches
Bezymianny, located on Russia’s Kamchatka Peninsula, has had eruptions since 1955 characterized by dome growth, explosions, pyroclastic flows, ash plumes, and ashfall. Activity during November 2022-April 2023 included gas-and-steam emissions, lava dome collapses generating avalanches, and persistent thermal activity. Similar eruptive activity continued from May through October 2023, described here based on information from weekly and daily reports of the Kamchatka Volcano Eruptions Response Team (KVERT), notices from Tokyo VAAC (Volcanic Ash Advisory Center), and from satellite data.
Overall activity decreased after the strong period of activity in late March through April 2023, which included ash explosions during 29 March and 7-8 April 2023 that sent plumes as high as 10-12 km altitude, along with dome growth and lava flows (BGVN 48:05). This reduced activity can be seen in the MIROVA thermal detection system graph (figure 56), which was consistent with data from the MODVOLC thermal detection system and with Sentinel-2 satellite images that showed persistent hotspots in the summit crater when conditions allowed observations. A renewed period of strong activity began in mid-October 2023.
Activity increased significantly on 17 October 2023 when large collapses began during 0700-0830 on the E flanks of the lava dome and continued to after 0930 the next day (figure 57). Ash plumes rose to an altitude of 4.5-5 km, extending 220 km NNE by 18 October. A large explosion at 1630 on 18 October produced an ash plume that rose to an altitude of 11 km (8 km above the summit) and drifted NNE and then NW, extending 900 km NW within two days at an altitude of 8 km. Minor ashfall was noted in Kozyrevsk (45 km WNW). At 0820 on 20 October an ash plume was identified in satellite images drifting 100 km ENE at altitudes of 4-4.5 km.
Lava flows and hot avalanches from the dome down the SE flank continued over the next few days, including 23 October when clear conditions allowed good observations (figures 58 and 59). A large thermal anomaly was observed over the volcano through 24 October, and in the summit crater on 30 October (figure 60). Strong fumarolic activity continued, with numerous avalanches and occasional incandescence. By the last week of October, volcanic activity had decreased to a level consistent with that earlier in the reporting period.
Aviation warnings were frequently updated during 17-20 October. KVERT issued a Volcano Observatory Notice for Aviation (VONA) on 17 October at 1419 and 1727 (0219 and 0527 UTC) raising the Aviation Color Code (ACC) from Yellow to Orange (second highest level). The next day, KVERT issued a VONA at 1705 (0505 UTC) raising the ACC to Red (highest level) but lowered it back to Orange at 2117 (0917 UTC). After another decrease to Yellow and back to Orange, the ACC was reduced to Yellow on 20 October at 1204 (0004 UTC). In addition, the Tokyo VAAC issued a series of Volcanic Ash Advisories beginning on 16 October and continuing through 30 October.
Geologic Background. The modern Bezymianny, much smaller than its massive neighbors Kamen and Kliuchevskoi on the Kamchatka Peninsula, was formed about 4,700 years ago over a late-Pleistocene lava-dome complex and an edifice built about 11,000-7,000 years ago. Three periods of intensified activity have occurred during the past 3,000 years. The latest period, which was preceded by a 1,000-year quiescence, began with the dramatic 1955-56 eruption. This eruption, similar to that of St. Helens in 1980, produced a large open crater that was formed by collapse of the summit and an associated lateral blast. Subsequent episodic but ongoing lava-dome growth, accompanied by intermittent explosive activity and pyroclastic flows, has largely filled the 1956 crater.
Information Contacts: Kamchatka Volcanic Eruptions Response Team (KVERT), Far Eastern Branch, Russian Academy of Sciences, 9 Piip Blvd., Petropavlovsk-Kamchatsky, 683006, Russia (URL: http://www.kscnet.ru/ivs/kvert/); Kamchatka Volcanological Station, Kamchatka Branch of Geophysical Survey, (KB GS RAS), Klyuchi, Kamchatka Krai, Russia (URL: http://volkstat.ru/); Tokyo Volcanic Ash Advisory Center (VAAC), 1-3-4 Otemachi, Chiyoda-ku, Tokyo 100-8122, Japan (URL: http://ds.data.jma.go.jp/svd/vaac/data/); Hawai'i Institute of Geophysics and Planetology (HIGP) - MODVOLC Thermal Alerts System, School of Ocean and Earth Science and Technology (SOEST), Univ. of Hawai'i, 2525 Correa Road, Honolulu, HI 96822, USA (URL: http://modis.higp.hawaii.edu/); MIROVA (Middle InfraRed Observation of Volcanic Activity), a collaborative project between the Universities of Turin and Florence (Italy) supported by the Centre for Volcanic Risk of the Italian Civil Protection Department (URL: http://www.mirovaweb.it/); Copernicus Browser, Copernicus Data Space Ecosystem, European Space Agency (URL: https://dataspace.copernicus.eu/browser/).chr
Kilauea (United States) — January 2023 Cite this Report
Kilauea
United States
19.421°N, 155.287°W; summit elev. 1222 m
All times are local (unless otherwise noted)
Low-level lava effusions in the lava lake at Halema’uma’u during July-December 2022
Kīlauea is the southeastern-most volcano in Hawaii and overlaps the E flank of the Mauna Loa volcano. Its East Rift Zone (ERZ) has been intermittently active for at least 2,000 years. An extended eruption period began in January 1983 and was characterized by open lava lakes and lava flows from the summit caldera and the East Rift Zone. During May 2018 magma migrated into the Lower East Rift Zone (LERZ) and opened 24 fissures along a 6-km-long NE-trending fracture zone that produced lava flows traveling in multiple directions. As lava emerged from the fissures, the lava lake at Halema'uma'u drained and explosions sent ash plumes to several kilometers altitude (BGVN 43:10).
The current eruption period started during September 2021 and has recently been characterized by lava effusions, spatter, and sulfur dioxide emissions in the active Halema’uma’u lava lake (BGVN 47:08). Lava effusions, some spatter, and sulfur dioxide emissions have continued during this reporting period of July through December 2022 using daily reports, volcanic activity notices, and abundant photo, map, and video data from the US Geological Survey's (USGS) Hawaiian Volcano Observatory (HVO).
Summary of activity during July-December 2022. Low-level effusions have continued at the western vent of the Halema’uma’u crater during July through early December 2022. Occasional weak ooze-outs (also called lava break outs) would occur along the margins of the crater floor. The overall level of the active lava lake throughout the reporting period gradually increased due to infilling, however it stagnated in mid-September (table 13). During September through November, activity began to decline, though lava effusions persisted at the western vent. By 9 December, the active part of the lava lake had completely crusted over, and incandescence was no longer visible.
Table 13. Summary of measurements taken during overflights at Kīlauea that show a gradual increase in the active lava lake level and the volume of lava effused since 29 September 2021. Lower activity was reported during September-October. Data collected during July-December 2022. Courtesy of HVO.
| Date: |
Level of the active lava lake (m): |
Cumulative volume of lava effused (million cubic meters): |
| 7 Jul 2022 |
130 |
95 |
| 19 Jul 2022 |
133 |
98 |
| 4 Aug 2022 |
136 |
102 |
| 16 Aug 2022 |
137 |
104 |
| 12 Sep 2022 |
143 |
111 |
| 5 Oct 2022 |
143 |
111 |
| 28 Oct 2022 |
143 |
111 |
Activity during July 2022. Lava effusions were reported from the western vent in the Halema’uma’u crater, along with occasional weak ooze-outs along the margins of the crater floor. The height of the lava lake was variable due to deflation-inflation tilt events; for example, the lake level dropped approximately 3-4 m during a summit deflation-inflation event reported on 1 July. Webcam images taken during the night of 6-12 July showed intermittent low-level spattering at the western vent that rose less than 10 m above the vent (figure 519). Measurements made during an overflight on 7 July indicated that the crater floor was infilled about 130 m and that 95 million cubic meters of lava had been effused since 29 September 2021. A single, relatively small lava ooze-out was active to the S of the lava lake. Around midnight on 8 July there were two brief periods of lava overflow onto the lake margins. On 9 July lava ooze-outs were reported near the SE and NE edges of the crater floor and during 10-11 July they occurred near the E, NE, and NW edges. On 16 July crater incandescence was reported, though the ooze-outs and spattering were not visible. On 18 July overnight webcam images showed incandescence in the western vent complex and two ooze-outs were reported around 0000 and 0200 on 19 July. By 0900 there were active ooze-outs along the SW edge of the crater floor. Measurements made from an overflight on 19 July indicated that the crater floor was infilled about 133 m and 98 million cubic meters of lava had erupted since 29 September 2021 (figure 520). On 20 July around 1600 active ooze-outs were visible along the N edge of the crater, which continued through the next day. Extensive ooze-outs occurred along the W margin during 24 July until 1900; on 26 July minor ooze-outs were noted along the N margin. Minor spattering was visible on 29 July along the E margin of the lake. The sulfur dioxide emission rates ranged 650-2,800 tons per day (t/d), the higher of which was measured on 8 July (figure 519).
Activity during August 2022. The eruption continued in the Halema’uma’u crater at the western vent. According to HVO the lava in the active lake remained at the level of the bounding levees. Occasional minor ooze-outs were observed along the margins of the crater floor. Strong nighttime crater incandescence was visible after midnight on 6 August over the western vent cone. During 6-7 August scattered small lava lobes were active along the crater floor and incandescence persisted above the western vent through 9 August. During 7-9 August HVO reported a single lava effusion source was active along the NW margin of the crater floor. Measurements from an overflight on 4 August indicated that the crater floor was infilled about 136 m total and that 102 million cubic meters of lava had been erupted since the start of the eruption. Lava breakouts were reported along the N, NE, E, S, and W margins of the crater during 10-16 August. Another overflight survey conducted on 16 August indicated that the crater floor infilled about 137 m and 104 million cubic meters of lava had been erupted since September 2021. Measured sulfur dioxide emissions rates ranged 1,150-2,450 t/d, the higher of which occurred on 8 August.
Activity during September 2022. During September, lava effusion continued from the western vent into the active lava lake and onto the crater floor. Intermittent minor ooze-outs were reported through the month. A small ooze-out was visible on the W crater floor margin at 0220 on 2 September, which showed decreasing surface activity throughout the day, but remained active through 3 September. On 3 September around 1900 a lava outbreak occurred along the NW margin of the crater floor but had stopped by the evening of 4 September. Field crews monitoring the summit lava lake on 9 September observed spattering on the NE margin of the lake that rose no higher than 10 m, before falling back onto the lava lake crust (figure 521). Overflight measurements on 12 September indicated that the crater floor was infilled a total of 143 m and 111 million cubic meters of lava had been erupted since September 2021. Extensive breakouts in the W and N part of the crater floor were reported at 1600 on 20 September and continued into 26 September. The active part of the lava lake dropped by 10 m while other parts of the crater floor dropped by several meters. Summit tiltmeters recorded a summit seismic swarm of more than 80 earthquakes during 1500-1800 on 21 September, which occurred about 1.5 km below Halema’uma’u; a majority of these were less than Mw 2. By 22 September the active part of the lava lake was infilled about 2 m. On 23 September the western vent areas exhibited several small spatter cones with incandescent openings, along with weak, sporadic spattering (figure 522). The sulfur dioxide emission rate ranged from 930 t/d to 2,000 t/d, the higher of which was measured on 6 September.
Activity during October 2022. Activity during October declined slightly compared to previous months, though lava effusions persisted from the western vent into the active lava lake and onto the crater floor during October (figure 523). Slight variations in the lava lake were noted throughout the month. HVO reported that around 0600 on 3 October the level of the lava lake has lowered slightly. Overflight measurements taken on 5 October indicated that the crater floor was infilled a total of about 143 m and that 111 million cubic meters of lava had been effused since September 2021. During 6-7 October the lake gradually rose 0.5 m. Sulfur dioxide measurements made on 22 October had an emission rate of 700 t/d. Another overflight taken on 28 October showed that there was little to no change in the elevation of the crater floor: the crater floor was infilled a total of 143 m and 111 million cubic meters of lava had erupted since the start of the eruption.
Activity during November 2022. Activity remained low during November, though HVO reported that lava from the western vent continued to effuse into the active lava lake and onto the crater floor throughout the month. The rate of sulfur dioxide emissions during November ranged from 300-600 t/d, the higher amount of which occurred on 9 November.
Activity during December 2022. Similar low activity was reported during December, with lava effusing from the western vent into the active lava lake and onto the crater floor. During 4-5 December the active part of the lava lake was slightly variable in elevation and fluctuated within 1 m. On 9 December HVO reported that lava was no longer erupting from the western vent in the Halema’uma’u crater and that sulfur dioxide emissions had returned to near pre-eruption background levels; during 10-11 December, the lava lake had completely crusted over, and no incandescence was visible (figure 524). Time lapse camera images covering the 4-10 December showed that the crater floor showed weak deflation and no inflation. Some passive events of crustal overturning were reported during 14-15 December, which brought fresh incandescent lava to the lake surface. The sulfur dioxide emission rate was approximately 200 t/d on 14 December. A smaller overturn event on 17 December and another that occurred around 0000 and into the morning of 20 December were also detected. A small seismic swarm was later detected on 30 December.
Geologic Background. Kilauea overlaps the E flank of the massive Mauna Loa shield volcano in the island of Hawaii. Eruptions are prominent in Polynesian legends; written documentation since 1820 records frequent summit and flank lava flow eruptions interspersed with periods of long-term lava lake activity at Halemaumau crater in the summit caldera until 1924. The 3 x 5 km caldera was formed in several stages about 1,500 years ago and during the 18th century; eruptions have also originated from the lengthy East and Southwest rift zones, which extend to the ocean in both directions. About 90% of the surface of the basaltic shield volcano is formed of lava flows less than about 1,100 years old; 70% of the surface is younger than 600 years. The long-term eruption from the East rift zone between 1983 and 2018 produced lava flows covering more than 100 km2, destroyed hundreds of houses, and added new coastline.
Information Contacts: Hawaiian Volcano Observatory (HVO), U.S. Geological Survey, PO Box 51, Hawai'i National Park, HI 96718, USA (URL: http://hvo.wr.usgs.gov/).
Nyamulagira (DR Congo) — November 2023 Cite this Report
Nyamulagira
DR Congo
1.408°S, 29.2°E; summit elev. 3058 m
All times are local (unless otherwise noted)
Lava flows and thermal activity during May-October 2023
Nyamulagira (also known as Nyamuragira) is a shield volcano in the Democratic Republic of Congo with the summit truncated by a small 2 x 2.3 km caldera with walls up to about 100 m high. Documented eruptions have occurred within the summit caldera, as well as from numerous flank fissures and cinder cones. The current eruption period began in April 2018 and has more recently been characterized by summit crater lava flows and thermal activity (BGVN 48:05). This report describes lava flows and variable thermal activity during May through October 2023, based on information from the Observatoire Volcanologique de Goma (OVG) and various satellite data.
Lava lake activity continued during May. The MIROVA (Middle InfraRed Observation of Volcanic Activity) system recorded moderate-to-strong thermal activity throughout the reporting period; activity was more intense during May and October and relatively weaker from June through September (figure 95). The MODVOLC thermal algorithm, detected a total of 209 thermal alerts. There were 143 hotspots detected during May, eight during June, nine during September, and 49 during October. This activity was also reflected in infrared satellite images, where a lava flow was visible in the NW part of the crater on 7 May and strong activity was seen in the center of the crater on 4 October (figure 96). Another infrared satellite image taken on 12 May showed still active lava flows along the NW margin of the crater. According to OVG lava effusions were active during 7-29 May and moved to the N and NW parts of the crater beginning on 9 May. Strong summit crater incandescence was visible from Goma (27 km S) during the nights of 17, 19, and 20 May (figure 97). On 17 May there was an increase in eruptive activity, which peaked at 0100 on 20 May. Notable sulfur dioxide plumes drifted NW and W during 19-20 May (figure 98). Drone footage acquired in partnership with the USGS (United States Geological Survey) on 20 May captured images of narrow lava flows that traveled about 100 m down the W flank (figure 99). Data from the Rumangabo seismic station indicated a decreasing trend in activity during 17-21 May. Although weather clouds prevented clear views of the summit, a strong thermal signature on the NW flank was visible in an infrared satellite image on 22 May, based on an infrared satellite image. On 28 May the lava flows on the upper W flank began to cool and solidify. By 29 May seismicity returned to levels similar to those recorded before the 17 May increase. Lava effusion continued but was confined to the summit crater; periodic crater incandescence was observed.
Low-level activity was noted during June through October. On 1 June OVG reported that seismicity remained at lower levels and that crater incandescence had been absent for three days, though infrared satellite imagery showed continued lava effusion in the summit crater. The lava flows on the flanks covered an estimated 0.6 km2. Satellite imagery continued to show thermal activity confined to the lava lake through October (figure 96), although no lava flows or significant sulfur dioxide emissions were reported.
Geologic Background. Africa's most active volcano, Nyamulagira (also known as Nyamuragira), is a massive high-potassium basaltic shield about 25 km N of Lake Kivu and 13 km NNW of the steep-sided Nyiragongo volcano. The summit is truncated by a small 2 x 2.3 km caldera that has walls up to about 100 m high. Documented eruptions have occurred within the summit caldera, as well as from the numerous flank fissures and cinder cones. A lava lake in the summit crater, active since at least 1921, drained in 1938, at the time of a major flank eruption. Recent lava flows extend down the flanks more than 30 km from the summit as far as Lake Kivu; extensive lava flows from this volcano have covered 1,500 km2 of the western branch of the East African Rift.
Information Contacts: Observatoire Volcanologique de Goma (OVG), Departement de Geophysique, Centre de Recherche en Sciences Naturelles, Lwiro, D.S. Bukavu, DR Congo; Hawai'i Institute of Geophysics and Planetology (HIGP) - MODVOLC Thermal Alerts System, School of Ocean and Earth Science and Technology (SOEST), Univ. of Hawai'i, 2525 Correa Road, Honolulu, HI 96822, USA (URL: http://modis.higp.hawaii.edu/); MIROVA (Middle InfraRed Observation of Volcanic Activity), a collaborative project between the Universities of Turin and Florence (Italy) supported by the Centre for Volcanic Risk of the Italian Civil Protection Department (URL: http://www.mirovaweb.it/); NASA Global Sulfur Dioxide Monitoring Page, Atmospheric Chemistry and Dynamics Laboratory, NASA Goddard Space Flight Center (NASA/GSFC), 8800 Greenbelt Road, Goddard, Maryland, USA (URL: https://so2.gsfc.nasa.gov/); Copernicus Browser, Copernicus Data Space Ecosystem, European Space Agency (URL: https://dataspace.copernicus.eu/browser/); Charles Balagizi, Goma Volcano Observatory, Departement de Geophysique, Centre de Recherche en Sciences Naturelles, Lwiro, D.S. Bukavu, DR Congo.
Bagana (Papua New Guinea) — October 2023 Cite this Report
Bagana
Papua New Guinea
6.137°S, 155.196°E; summit elev. 1855 m
All times are local (unless otherwise noted)
Explosions, ash plumes, ashfall, and lava flows during April-September 2023
The remote volcano of Bagana is located in central Bougainville Island, Papua New Guinea. Recorded eruptions date back to 1842 and activity has consisted of effusive activity that has built a small lava dome in the summit crater and occasional explosions that produced pyroclastic flows. The most recent eruption has been ongoing since February 2000 and has produced occasional explosions, ash plumes, and lava flows. More recently, activity has been characterized by ongoing effusive activity and ash emissions (BGVN 48:04). This report updates activity from April through September 2023 that has consisted of explosions, ash plumes, ashfall, and lava flows, using information from the Darwin Volcanic Ash Advisory Center (VAAC) and satellite data.
An explosive eruption was reported on 7 July that generated a large gas-and-ash plume to high altitudes and caused significant ashfall in local communities; the eruption plume had reached upper tropospheric (16-18 km altitude) altitudes by 2200, according to satellite images. Sulfur dioxide plumes were detected in satellite images on 8 July and indicated that the plume was likely a mixture of gas, ice, and ash. A report issued by the Autonomous Bougainville Government (ABG) (Torokina District, Education Section) on 10 July noted that significant ash began falling during 2000-2100 on 7 July and covered most areas in the Vuakovi, Gotana (9 km SW), Koromaketo, Laruma (25 km W) and Atsilima (27 km NW) villages. Pyroclastic flows also occurred, according to ground-based reports; small deposits confined to one drainage were inspected by RVO during an overflight on 17 July and were confirmed to be from the 7 July event. Ashfall continued until 10 July and covered vegetation, which destroyed bushes and gardens and contaminated rivers and streams.
RVO reported another eruption on 14 July. The Darwin VAAC stated that an explosive event started around 0830 on 15 July and produced an ash plume that rose to 16.5 km altitude by 1000 and drifted N, according to satellite images. The plume continued to drift N and remained visible through 1900, and by 2150 it had dissipated.
Ashfall likely from both the 7 and 15 July events impacted about 8,111 people in Torokina (20 km SW), including Tsito/Vuakovi, Gotana, Koromaketo, Kenaia, Longkogari, Kenbaki, Piva (13 km SW), and Atsinima, and in the Tsitovi district, according to ABG. Significant ashfall was also reported in Ruruvu (22 km N) in the Wakunai District of Central Bougainville, though the thickness of these deposits could not be confirmed. An evacuation was called for the villages in Wakunai, where heavy ashfall had contaminated water sources; the communities of Ruruvu, Togarau, Kakarapaia, Karauturi, Atao, and Kuritaturi were asked to evacuate to a disaster center at the Wakunai District Station, and communities in Torokina were asked to evacuate to the Piva District station. According to a news article, more than 7,000 people needed temporary accommodations, with about 1,000 people in evacuation shelters. Ashfall had deposited over a broad area, contaminating water supplies, affecting crops, and collapsing some roofs and houses in rural areas. Schools were temporarily shut down. Intermittent ash emissions continued through the end of July and drifted NNW, NW, and SW. Fine ashfall was reported on the coast of Torokina, and ash plumes also drifted toward Laruma and Atsilima.
A small explosive eruption occurred at 2130 on 28 July that ejected material from the crater vents, according to reports from Torokina, in addition to a lava flow that contained two lobes. A second explosion was detected at 2157. Incandescence from the lava flow was visible from Piva as it descended the W flank around 2000 on 29 July (figure 47). The Darwin VAAC reported that a strong thermal anomaly was visible in satellite images during 30-31 July and that ash emissions rose to 2.4 km altitude and drifted WSW on 30 July. A ground report from RVO described localized emissions at 0900 on 31 July.
The Darwin VAAC reported that ash plumes were identified in satellite imagery at 0800 and 1220 on 12 August and rose to 2.1 km and 3 km altitude and drifted NW and W, respectively. A news report stated that aid was sent to more than 6,300 people that were adversely affected by the eruption. Photos taken during 17-19 August showed ash emissions rising no higher than 1 km above the summit and drifting SE. A small explosion generated an ash plume during the morning of 19 August. Deposits from small pyroclastic flows were also captured in the photos. Satellite images captured lava flows and pyroclastic flow deposits. Two temporary seismic stations were installed near Bagana on 17 August at distances of 7 km WSW (Vakovi station) and 11 km SW (Kepox station). The Kepox station immediately started to record continuous, low-frequency background seismicity.
Satellite data. Little to no thermal activity was detected during April through mid-July 2023; only one anomaly was recorded during early April and one during early June, according to MIROVA (Middle InfraRed Observation of Volcanic Activity) data (figure 48). Thermal activity increased in both power and frequency during mid-July through September, although there were still some short gaps in detected activity. MODVOLC also detected increased thermal activity during August; thermal hotspots were detected a total of five times on 19, 20, and 27 August. Weak thermal anomalies were also captured in infrared satellite images on clear weather days throughout the reporting period on 7, 12, and 17 April, 27 May, 1, 6, 16, and 31 July, and 19 September (figure 48); a strong thermal anomaly was visible on 31 July. Distinct sulfur dioxide plumes that drifted generally NW were intermittently captured by the TROPOMI instrument on the Sentinel-5P satellite and sometimes exceeded two Dobson Units (DUs) (figure 49).
Geologic Background. Bagana volcano, in a remote portion of central Bougainville Island, is frequently active. This massive symmetrical cone was largely constructed by an accumulation of viscous andesitic lava flows. The entire edifice could have been constructed in about 300 years at its present rate of lava production. Eruptive activity is characterized by non-explosive effusion of viscous lava that maintains a small lava dome in the summit crater, although occasional explosive activity produces pyroclastic flows. Lava flows with tongue-shaped lobes up to 50 m thick and prominent levees descend the flanks on all sides.
Information Contacts: Rabaul Volcano Observatory (RVO), Geohazards Management Division, Department of Mineral Policy and Geohazards Management (DMPGM), PO Box 3386, Kokopo, East New Britain Province, Papua New Guinea; Darwin Volcanic Ash Advisory Centre (VAAC), Bureau of Meteorology, Northern Territory Regional Office, PO Box 40050, Casuarina, NT 0811, Australia (URL: http://www.bom.gov.au/info/vaac/); MIROVA (Middle InfraRed Observation of Volcanic Activity), a collaborative project between the Universities of Turin and Florence (Italy) supported by the Centre for Volcanic Risk of the Italian Civil Protection Department (URL: http://www.mirovaweb.it/); Hawai'i Institute of Geophysics and Planetology (HIGP) - MODVOLC Thermal Alerts System, School of Ocean and Earth Science and Technology (SOEST), Univ. of Hawai'i, 2525 Correa Road, Honolulu, HI 96822, USA (URL: http://modis.higp.hawaii.edu/); NASA Global Sulfur Dioxide Monitoring Page, Atmospheric Chemistry and Dynamics Laboratory, NASA Goddard Space Flight Center (NASA/GSFC), 8800 Greenbelt Road, Goddard, Maryland, USA (URL: https://so2.gsfc.nasa.gov/); Copernicus Browser, Copernicus Data Space Ecosystem, European Space Agency (URL: https://dataspace.copernicus.eu/browser/); Autonomous Bougainville Government, P.O Box 322, Buka, AROB, PNG (URL: https://abg.gov.pg/); Andrew Tupper (Twitter: @andrewcraigtupp); Simon Carn, Geological and Mining Engineering and Sciences, Michigan Technological University, 1400 Townsend Drive, Houghton, MI 49931, USA (URL: http://www.volcarno.com/, Twitter: @simoncarn); Radio NZ (URL: https://www.rnz.co.nz/news/pacific/494464/more-than-7-000-people-in-bougainville-need-temporary-accommodation-after-eruption); USAID, 1300 Pennsylvania Ave, NW, Washington DC 20004, USA (URL: https://www.usaid.gov/pacific-islands/press-releases/aug-08-2023-united-states-provides-immediate-emergency-assistance-support-communities-affected-mount-bagana-volcanic-eruptions).
Mayon (Philippines) — October 2023 Cite this Report
Mayon
Philippines
13.257°N, 123.685°E; summit elev. 2462 m
All times are local (unless otherwise noted)
Lava flows, pyroclastic flows, ash emissions, and seismicity during April-September 2023
Mayon is located in the Philippines and has steep upper slopes capped by a small summit crater. Historical eruptions date back to 1616 CE that have been characterized by Strombolian eruptions, lava flows, pyroclastic flows, and mudflows. Eruptions mostly originated from a central conduit. Pyroclastic flows and mudflows have commonly descended many of the approximately 40 drainages that surround the volcano. The most recent eruption occurred during June through October 2022 and consisted of lava dome growth and gas-and-steam emissions (BGVN 47:12). A new eruption was reported during late April 2023 and has included lava flows, pyroclastic density currents, ash emissions, and seismicity. This report covers activity during April through September 2023 based on daily bulletins from the Philippine Institute of Volcanology and Seismology (PHIVOLCS).
During April through September 2023, PHIVOLCS reported near-daily rockfall events, frequent volcanic earthquakes, and sulfur dioxide measurements. Gas-and-steam emissions rose 100-900 m above the crater and drifted in different directions. Nighttime crater incandescence was often visible during clear weather and was accompanied by incandescent avalanches of material. Activity notably increased during June when lava flows were reported on the S, SE, and E flanks (figure 52). The MIROVA graph (Middle InfraRed Observation of Volcanic Activity) showed strong thermal activity coincident with these lava flows, which remained active through September (figure 53). According to the MODVOLC thermal algorithm, a total of 110 thermal alerts were detected during the reporting period: 17 during June, 40 during July, 27 during August, and 26 during September. During early June, pyroclastic density currents (PDCs) started to occur more frequently.
Low activity was reported during much of April and May; gas-and-steam emissions rose 100-900 m above the crater and generally drifted in different directions. A total of 52 rockfall events and 18 volcanic earthquakes were detected during April and 147 rockfall events and 13 volcanic events during May. Sulfur dioxide flux measurements ranged between 400-576 tons per day (t/d) during April, the latter of which was measured on 29 April and between 162-343 t/d during May, the latter of which was measured on 13 May.
Activity during June increased, characterized by lava flows, pyroclastic density currents (PDCs), crater incandescence and incandescent rockfall events, gas-and-steam emissions, and continued seismicity. Weather clouds often prevented clear views of the summit, but during clear days, moderate gas-and-steam emissions rose 100-2,500 m above the crater and drifted in multiple directions. A total of 6,237 rockfall events and 288 volcanic earthquakes were detected. The rockfall events often deposited material on the S and SE flanks within 700-1,500 m of the summit crater and ash from the events drifted SW, S, SE, NE, and E. Sulfur dioxide emissions ranged between 149-1,205 t/d, the latter of which was measured on 10 June. Short-term observations from EDM and electronic tiltmeter monitoring indicated that the upper slopes were inflating since February 2023. Longer-term ground deformation parameters based on EDM, precise leveling, continuous GPS, and electronic tilt monitoring indicated that the volcano remained inflated, especially on the NW and SE flanks. At 1000 on 5 June the Volcano Alert Level (VAL) was raised to 2 (on a 0-5 scale). PHIVOLCS noted that although low-level volcanic earthquakes, ground deformation, and volcanic gas emissions indicated unrest, the steep increase in rockfall frequency may indicate increased dome activity.
A total of 151 dome-collapse PDCs occurred during 8-9 and 11-30 June, traveled 500-2,000 m, and deposited material on the S flank within 2 km of the summit crater. During 8-9 June the VAL was raised to 3. At approximately 1947 on 11 June lava flow activity was reported; two lobes traveled within 500 m from the crater and deposited material on the S (Mi-isi), SE (Bonga), and E (Basud) flanks. Weak seismicity accompanied the lava flow and slight inflation on the upper flanks. This lava flow remained active through 30 June, moving down the S and SE flank as far as 2.5 km and 1.8 km, respectively and depositing material up to 3.3 km from the crater. During 15-16 June traces of ashfall from the PDCs were reported in Sitio Buga, Nabonton, City of Ligao and Purok, and San Francisco, Municipality of Guinobatan. During 28-29 June there were two PDCs generated by the collapse of the lava flow front, which generated a light-brown ash plume 1 km high. Satellite monitors detected significant concentrations of sulfur dioxide beginning on 29 June. On 30 June PDCs primarily affected the Basud Gully on the E flank, the largest of which occurred at 1301 and lasted eight minutes, based on the seismic record. Four PDCs generated between 1800 and 2000 that lasted approximately four minutes each traveled 3-4 km on the E flank and generated an ash plume that rose 1 km above the crater and drifted N and NW. Ashfall was recorded in Tabaco City.
Similar strong activity continued during July; slow lava effusion remained active on the S and SE flanks and traveled as far as 2.8 km and 2.8 km, respectively and material was deposited as far as 4 km from the crater. There was a total of 6,983 rockfall events and 189 PDCs that affected the S, SE, and E flanks. The volcano network detected a total of 2,124 volcanic earthquakes. Continuous gas-and-steam emissions rose 200-2,000 m above the crater and drifted in multiple directions. Sulfur dioxide emissions averaged 792-4,113 t/d, the latter of which was measured on 28 July. During 2-4 July three PDCs were generated from the collapse of the lava flow and resulting light brown plumes rose 200-300 m above the crater. Continuous tremor pulses were reported beginning at 1547 on 3 July through 7 July at 1200, at 2300 on 8 July and going through 0300 on 10 July, and at 2300 on 16 July, as recorded by the seismic network. During 6-9 July there were 10 lava flow-collapse-related PDCs that generated light brown plumes 300-500 m above the crater. During 10-11 July light ashfall was reported in some areas of Mabinit, Legazpi City, Budiao and Salvacion, Daraga, and Camalig, Albay. By 18 July the lava flow advanced 600 m on the E flank as well.
During 1733 on 18 July and 0434 on 19 July PHIVOLCS reported 30 “ashing” events, which are degassing events accompanied by audible thunder-like sounds and entrained ash at the crater, which produced short, dark plumes that drifted SW. These events each lasted 20-40 seconds, and plume heights ranged from 150-300 m above the crater, as recorded by seismic, infrasound, visual, and thermal monitors. Three more ashing events occurred during 19-20 July. Short-term observations from electronic tilt and GPS monitoring indicate deflation on the E lower flanks in early July and inflation on the NW middle flanks during the third week of July. Longer-term ground deformation parameters from EDM, precise leveling, continuous GPS, and electronic tilt monitoring indicated that the volcano was still generally inflated relative to baseline levels. A short-lived lava pulse lasted 28 seconds at 1956 on 21 July, which was accompanied by seismic and infrasound signals. By 22 July, the only lava flow that remained active was on the SE flank, and continued to extend 3.4 km, while those on the S and E flanks weakened markedly. One ashing event was detected during 30-31 July, whereas there were 57 detected during 31 July-1 August; according to PHIVOLCS beginning at approximately 1800 on 31 July eruptive activity was dominated by phases of intermittent ashing, as well as increased in the apparent rates of lava effusion from the summit crater. The ashing phases consisted of discrete events recorded as low-frequency volcanic earthquakes (LFVQ) typically 30 seconds in duration, based on seismic and infrasound signals. Gray ash plume rose 100 m above the crater and generally drifted NE. Shortly after these ashing events began, new lava began to effuse rapidly from the crater, feeding the established flowed on the SE, E, and E flanks and generating frequent rockfall events.
Intensified unrest persisted during August. There was a total of 4,141 rockfall events, 2,881 volcanic earthquakes, which included volcanic tremor events, 32 ashing events, and 101 PDCs detected throughout the month. On clear weather days, gas-and-steam emissions rose 300-1,500 m above the crater and drifted in different directions (figure 54). Sulfur dioxide emissions averaged 735-4,756 t/d, the higher value of which was measured on 16 August. During 1-2 August the rate of lava effusion decreased, but continued to feed the flows on the SE, S, and E flanks, maintaining their advances to 3.4 km, 2.8 km, and 1.1 km from the crater, respectively (figure 55). Rockfall and PDCs generated by collapses at the lava flow margins and from the summit dome deposited material within 4 km of the crater. During 3-4 August there were 10 tremor events detected that lasted 1-4 minutes. Short-lived lava pulse lasted 35 seconds and was accompanied by seismic and infrasound signals at 0442 on 6 August. Seven collapses were recorded at the front of the lava flow during 12-14 August.
During September, similar activity of slow lava effusion, PDCs, gas-and-steam emissions, and seismicity continued. There was a total of 4,452 rockfall events, 329 volcanic earthquakes, which included volcanic tremor events, two ashing events, and 85 PDCs recorded throughout the month. On clear weather days, gas-and-steam emissions rose 100-1,500 m above the crater and drifted in multiple directions. Sulfur dioxide emissions averaged 609-2,252 t/d, the higher average of which was measured on 6 September. Slow lava effusion continued advancing on the SE, S, and E flanks, maintaining lengths of 3.4 km, 2.8 km, and 1.1 km, respectively. Rockfall and PDC events generated by collapses along the lava flow margins and at the summit dome deposited material within 4 km of the crater.
Geologic Background. Symmetrical Mayon, which rises above the Albay Gulf NW of Legazpi City, is the most active volcano of the Philippines. The steep upper slopes are capped by a small summit crater. Recorded eruptions since 1616 CE range from Strombolian to basaltic Plinian, with cyclical activity beginning with basaltic eruptions, followed by longer periods of andesitic lava flows. Eruptions occur predominately from the central conduit and have also produced lava flows that travel far down the flanks. Pyroclastic density currents and mudflows have commonly swept down many of the approximately 40 ravines that radiate from the summit and have often damaged populated lowland areas. A violent eruption in 1814 killed more than 1,200 people and devastated several towns.
Information Contacts: Philippine Institute of Volcanology and Seismology (PHIVOLCS), Department of Science and Technology, University of the Philippines Campus, Diliman, Quezon City, Philippines (URL: http://www.phivolcs.dost.gov.ph/); MIROVA (Middle InfraRed Observation of Volcanic Activity), a collaborative project between the Universities of Turin and Florence (Italy) supported by the Centre for Volcanic Risk of the Italian Civil Protection Department (URL: http://www.mirovaweb.it/); Hawai'i Institute of Geophysics and Planetology (HIGP) - MODVOLC Thermal Alerts System, School of Ocean and Earth Science and Technology (SOEST), Univ. of Hawai'i, 2525 Correa Road, Honolulu, HI 96822, USA (URL: http://modis.higp.hawaii.edu/); Copernicus Browser, Copernicus Data Space Ecosystem, European Space Agency (URL: https://dataspace.copernicus.eu/browser/); William Rogers, Legazpi City, Albay Province, Philippines.
Nishinoshima (Japan) — October 2023 Cite this Report
Nishinoshima
Japan
27.247°N, 140.874°E; summit elev. 100 m
All times are local (unless otherwise noted)
Eruption plumes and gas-and-steam plumes during May-August 2023
Nishinoshima, located about 1,000 km S of Tokyo, is a small island in the Ogasawara Arc in Japan. The island is the summit of a massive submarine volcano that has prominent submarine peaks to the S, W, and NE. Eruptions date back to 1973 and the current eruption period began in October 2022. Recent activity has consisted of small ash plumes and fumarolic activity (BGVN 48:07). This report covers activity during May through August 2023, using information from monthly reports of the Japan Meteorological Agency (JMA) monthly reports and satellite data.
Activity during May through June was relatively low. The Japan Coast Guard (JCG) did overflights on 14 and 22 June and reported white gas-and-steam emissions rising 600 m and 1,200 m from the central crater of the pyroclastic cone, respectively (figure 125). In addition, multiple white gas-and-steam emissions rose from the inner rim of the W side of the crater and from the SE flank of the pyroclastic cone. Discolored brown-to-green water was observed around almost the entire perimeter of the island; on 22 June light green discolored water was observed off the S coast of the island.
Observations from the Himawari meteorological satellite confirmed an eruption on 9 and 10 July. An eruption plume rose 1.6 km above the crater and drifted N around 1300 on 9 July. Satellite images acquired at 1420 and 2020 on 9 July and at 0220 on 10 July showed continuing emissions that rose 1.3-1.6 km above the crater and drifted NE and N. The Tokyo VAAC reported that an ash plume seen by a pilot and identified in a satellite image at 0630 on 21 July rose to 3 km altitude and drifted S.
Aerial observations conducted by JCG on 8 August showed a white-and-gray plume rising from the central crater of the pyroclastic cone, and multiple white gas-and-steam emissions were rising from the inner edge of the western crater and along the NW-SE flanks of the island (figure 126). Brown-to-green discolored water was also noted around the perimeter of the island.
Intermittent low-to-moderate power thermal anomalies were recorded in the MIROVA graph (Middle InfraRed Observation of Volcanic Activity), showing an increase in both frequency and power beginning in July (figure 127). This increase in activity coincides with eruptive activity on 9 and 10 July, characterized by eruption plumes. According to the MODVOLC thermal alert algorithm, one thermal hotspot was recorded on 20 July. Weak thermal anomalies were also detected in infrared satellite imagery, accompanied by strong gas-and-steam plumes (figure 128).
Geologic Background. The small island of Nishinoshima was enlarged when several new islands coalesced during an eruption in 1973-74. Multiple eruptions that began in 2013 completely covered the previous exposed surface and continued to enlarge the island. The island is the summit of a massive submarine volcano that has prominent peaks to the S, W, and NE. The summit of the southern cone rises to within 214 m of the ocean surface 9 km SSE.
Information Contacts: Japan Meteorological Agency (JMA), 1-3-4 Otemachi, Chiyoda-ku, Tokyo 100-8122, Japan (URL: http://www.jma.go.jp/jma/indexe.html); Tokyo Volcanic Ash Advisory Center (VAAC), 1-3-4 Otemachi, Chiyoda-ku, Tokyo 100-8122, Japan (URL: http://ds.data.jma.go.jp/svd/vaac/data/); MIROVA (Middle InfraRed Observation of Volcanic Activity), a collaborative project between the Universities of Turin and Florence (Italy) supported by the Centre for Volcanic Risk of the Italian Civil Protection Department (URL: http://www.mirovaweb.it/); Copernicus Browser, Copernicus Data Space Ecosystem, European Space Agency (URL: https://dataspace.copernicus.eu/browser/).
Krakatau (Indonesia) — October 2023 Cite this Report
Krakatau
Indonesia
6.1009°S, 105.4233°E; summit elev. 285 m
All times are local (unless otherwise noted)
White gas-and-steam plumes and occasional ash plumes during May-August 2023
Krakatau is located in the Sunda Strait between Java and Sumatra, Indonesia. Caldera collapse during the catastrophic 1883 eruption destroyed Danan and Perbuwatan cones and left only a remnant of Rakata. The post-collapse cone of Anak Krakatau (Child of Krakatau) was constructed within the 1883 caldera at a point between the former Danan and Perbuwatan cones; it has been the site of frequent eruptions since 1927. The current eruption period began in May 2021 and has recently consisted of Strombolian eruptions and ash plumes (BGVN 48:07). This report describes lower levels of activity consisting of ash and white gas-and-steam plumes during May through August 2023, based on information provided by the Indonesian Center for Volcanology and Geological Hazard Mitigation, referred to as Pusat Vulkanologi dan Mitigasi Bencana Geologi (PVMBG), MAGMA Indonesia, and satellite data.
Activity was relatively low during May and June. Daily white gas-and-steam emissions rose 25-200 m above the crater and drifted in different directions. Five ash plumes were detected at 0519 on 10 May, 1241 on 11 May, 0920 on 12 May, 2320 on 12 May, and at 0710 on 13 May, and rose 1-2.5 km above the crater and drifted SW. A webcam image taken on 12 May showed ejection of incandescent material above the vent. A total of nine ash plumes were detected during 6-11 June: at 1434 and 00220 on 6 and 7 June the ash plumes rose 500 m above the crater and drifted NW, at 1537 on 8 June the ash plume rose 1 km above the crater and drifted SW, at 0746 and at 0846 on 9 June the ash plumes rose 800 m and 3 km above the crater and drifted SW, respectively, at 0423, 1431, and 1750 on 10 June the ash plumes rose 2 km, 1.5 km, and 3.5 km above the crater and drifted NW, respectively, and at 0030 on 11 June an ash plume rose 2 km above the crater and drifted NW. Webcam images taken on 10 and 11 June at 0455 and 0102, respectively, showed incandescent material ejected above the vent. On 19 June an ash plume at 0822 rose 1.5 km above the crater and drifted SE.
Similar low activity of white gas-and-steam emissions and few ash plumes were reported during July and August. Daily white gas-and-steam emissions rose 25-300 m above the crater and drifted in multiple directions. Three ash plumes were reported at 0843, 0851, and 0852 on 20 July that rose 500-2,000 m above the crater and drifted NW.
The MIROVA (Middle InfraRed Observation of Volcanic Activity) graph of MODIS thermal anomaly data showed intermittent low-to-moderate power thermal anomalies during May through August 2023 (figure 140). Although activity was often obscured by weather clouds, a thermal anomaly was visible in an infrared satellite image of the crater on 12 May, accompanied by an eruption plume that drifted SW (figure 141).
Geologic Background. The renowned Krakatau (frequently mis-named as Krakatoa) volcano lies in the Sunda Strait between Java and Sumatra. Collapse of an older edifice, perhaps in 416 or 535 CE, formed a 7-km-wide caldera. Remnants of that volcano are preserved in Verlaten and Lang Islands; subsequently the Rakata, Danan, and Perbuwatan cones were formed, coalescing to create the pre-1883 Krakatau Island. Caldera collapse during the catastrophic 1883 eruption destroyed Danan and Perbuwatan, and left only a remnant of Rakata. This eruption caused more than 36,000 fatalities, most as a result of tsunamis that swept the adjacent coastlines of Sumatra and Java. Pyroclastic surges traveled 40 km across the Sunda Strait and reached the Sumatra coast. After a quiescence of less than a half century, the post-collapse cone of Anak Krakatau (Child of Krakatau) was constructed within the 1883 caldera at a point between the former Danan and Perbuwatan cones. Anak Krakatau has been the site of frequent eruptions since 1927.
Information Contacts: Pusat Vulkanologi dan Mitigasi Bencana Geologi (PVMBG, also known as Indonesian Center for Volcanology and Geological Hazard Mitigation, CVGHM), Jalan Diponegoro 57, Bandung 40122, Indonesia (URL: http://www.vsi.esdm.go.id/); MAGMA Indonesia, Kementerian Energi dan Sumber Daya Mineral (URL: https://magma.esdm.go.id/v1); MIROVA (Middle InfraRed Observation of Volcanic Activity), a collaborative project between the Universities of Turin and Florence (Italy) supported by the Centre for Volcanic Risk of the Italian Civil Protection Department (URL: http://www.mirovaweb.it/); Copernicus Browser, Copernicus Data Space Ecosystem, European Space Agency (URL: https://dataspace.copernicus.eu/browser/).
Villarrica (Chile) — October 2023 Cite this Report
Villarrica
Chile
39.42°S, 71.93°W; summit elev. 2847 m
All times are local (unless otherwise noted)
Strombolian activity, gas-and-ash emissions, and crater incandescence during April-September 2023
Villarrica, in central Chile, consists of a 2-km-wide caldera that formed about 3,500 years ago and is located at the base of the presently active cone at the NW margin of a 6-km-wide caldera. Historical eruptions eruptions date back to 1558 and have been characterized by mild-to-moderate explosive activity with occasional lava effusions. The current eruption period began in December 2014 and has recently consisted of nighttime crater incandescence, ash emissions, and seismicity (BGVN 48:04). This report covers activity during April through September 2023 and describes occasional Strombolian activity, gas-and-ash emissions, and nighttime crater incandescence. Information for this report primarily comes from the Southern Andes Volcano Observatory (Observatorio Volcanológico de Los Andes del Sur, OVDAS), part of Chile's National Service of Geology and Mining (Servicio Nacional de Geología y Minería, SERNAGEOMIN) and satellite data.
Seismicity during April consisted of long period (LP) events and tremor (TRE); a total of 9,413 LP-type events and 759 TR-type events were detected throughout the month. Nighttime crater incandescence persisted and was visible in the degassing column. Sulfur dioxide data was obtained using Differential Absorption Optical Spectroscopy Equipment (DOAS) that showed an average value of 1,450 ± 198 tons per day (t/d) during 1-15 April and 1,129 ± 201 t/d during 16-30 April, with a maximum daily value of 2,784 t/d on 9 April. Gas-and-steam emissions of variable intensities rose above the active crater as high as 1.3 km above the crater on 13 April. Strombolian explosions were not observed and there was a slight decrease in the lava lake level.
There were 14,123 LP-type events and 727 TR-type events detected during May. According to sulfur dioxide measurements taken with DOAS equipment, the active crater emitted an average value of 1,826 ± 482 t/d during 1-15 May and 912 ± 41 t/d during 16-30 May, with a daily maximum value of 5,155 t/d on 13 May. Surveillance cameras showed continuous white gas-and-steam emissions that rose as high as 430 m above the crater on 27 May. Nighttime incandescence illuminated the gas column less than 300 m above the crater rim was and no pyroclastic emissions were reported. A landslide was identified on 13 May on the E flank of the volcano 50 m from the crater rim and extending 300 m away; SERNAGEOMIN noted that this event may have occurred on 12 May. During the morning of 27 and 28 May minor Strombolian explosions characterized by incandescent ejecta were recorded at the crater rim; the last reported Strombolian explosions had occurred at the end of March.
Seismic activity during June consisted of five volcano-tectonic (VT)-type events, 21,606 LP-type events, and 2,085 TR-type events. The average value of sulfur dioxide flux obtained by DOAS equipment was 1,420 ± 217 t/d during 1-15 June and 2,562 ± 804 t/d, with a maximum daily value of 4,810 t/d on 17 June. White gas-and-steam emissions rose less than 480 m above the crater; frequent nighttime crater incandescence was reflected in the degassing plume. On 12 June an emission rose 100 m above the crater and drifted NNW. On 15 June one or several emissions resulted in ashfall to the NE as far as 5.5 km from the crater, based on a Skysat satellite image. Several Strombolian explosions occurred within the crater; activity on 15 June was higher energy and ejected blocks 200-300 m on the NE slope. Surveillance cameras showed white gas-and-steam emissions rising 480 m above the crater on 16 June. On 19 and 24 June low-intensity Strombolian activity was observed, ejecting material as far as 200 m from the center of the crater to the E.
During July, seismicity included 29,319 LP-type events, 3,736 TR-type events, and two VT-type events. DOAS equipment recorded two days of sulfur dioxide emissions of 4,220 t/d and 1,009 t/d on 1 and 13 July, respectively. Constant nighttime incandescence was also recorded and was particularly noticeable when accompanied by eruptive columns on 12 and 16 July. Minor explosive events were detected in the crater. According to Skysat satellite images taken on 12, 13, and 16 July, ashfall deposits were identified 155 m S of the crater. According to POVI, incandescence was visible from two vents on the crater floor around 0336 on 12 July. Gas-and-ash emissions rose as high as 1.2 km above the crater on 13 July and drifted E and NW. A series of gas-and-steam pulses containing some ash deposited material on the upper E flank around 1551 on 13 July. During 16-31 July, average sulfur dioxide emissions of 1,679 ± 406 t/d were recorded, with a maximum daily value of 2,343 t/d on 28 July. Fine ash emissions were also reported on 16, 17, and 23 July.
Seismicity persisted during August, characterized by 27,011 LP-type events, 3,323 TR-type events, and three VT-type events. The average value of sulfur dioxide measurements taken during 1-15 August was 1,642 ± 270 t/d and 2,207 ± 4,549 t/d during 16-31 August, with a maximum daily value of 3,294 t/d on 27 August. Nighttime crater incandescence remained visible in degassing columns. White gas-and-steam emissions rose 480 m above the crater on 6 August. According to a Skysat satellite image from 6 August, ash accumulation was observed proximal to the crater and was mainly distributed toward the E slope. White gas-and-steam emissions rose 320 m above the crater on 26 August. Nighttime incandescence and Strombolian activity that generated ash emissions were reported on 27 August.
Seismicity during September was characterized by five VT-type events, 12,057 LP-type events, and 2,058 TR-type events. Nighttime incandescence persisted. On 2 September an ash emission rose 180 m above the crater and drifted SE at 1643 (figure 125) and a white gas-and-steam plume rose 320 m above the crater. According to the Buenos Aires VAAC, periods of continuous gas-and-ash emissions were visible in webcam images from 1830 on 2 September to 0110 on 3 September. Strombolian activity was observed on 2 September and during the early morning of 3 September, the latter event of which generated an ash emission that rose 60 m above the crater and drifted 100 m from the center of the crater to the NE and SW. Ashfall was reported to the SE and S as far as 750 m from the crater. The lava lake was active during 3-4 September and lava fountaining was visible for the first time since 26 March 2023, according to POVI. Fountains captured in webcam images at 2133 on 3 September and at 0054 on 4 September rose as high as 60 m above the crater rim and ejected material onto the upper W flank. Sulfur dioxide flux of 1,730 t/d and 1,281 t/d was measured on 3 and 4 September, respectively, according to data obtained by DOAS equipment.
Strong Strombolian activity and larger gas-and-ash plumes were reported during 18-20 September. On 18 September activity was also associated with energetic LP-type events and notable sulfur dioxide fluxes (as high as 4,277 t/d). On 19 September Strombolian activity and incandescence were observed. On 20 September at 0914 ash emissions rose 50 m above the crater and drifted SSE, accompanied by Strombolian activity that ejected material less than 100 m SSE, causing fall deposits on that respective flank. SERNAGEOMIN reported that a Planet Scope satellite image taken on 20 September showed the lava lake in the crater, measuring 32 m x 35 m and an area of 0.001 km2. Several ash emissions were recorded at 0841, 0910, 1251, 1306, 1312, 1315, and 1324 on 23 September and rose less than 150 m above the crater. The sulfur dioxide flux value was 698 t/d on 23 September and 1,097 t/d on 24 September. On 24 September the Volcanic Alert Level (VAL) was raised to Orange (the third level on a four-color scale). SENAPRED maintained the Alert Level at Yellow (the middle level on a three-color scale) for the communities of Villarrica, Pucón (16 km N), Curarrehue, and Panguipulli.
During 24-25 September there was an increase in seismic energy (observed at TR-events) and acoustic signals, characterized by 1 VT-type event, 213 LP-type events, and 124 TR-type events. Mainly white gas-and-steam emissions, in addition to occasional fine ash emissions were recorded. During the early morning of 25 September Strombolian explosions were reported and ejected material 250 m in all directions, though dominantly toward the NW. On 25 September the average value of sulfur dioxide flux was 760 t/d. Seismicity during 25-30 September consisted of five VT-type events, 1,937 LP-type events, and 456 TR-type events.
During 25-29 September moderate Strombolian activity was observed and ejected material as far as the crater rim. In addition, ash pulses lasting roughly 50 minutes were observed around 0700 and dispersed ENE. During 26-27 September a TR episode lasted 6.5 hours and was accompanied by discrete acoustic signals. Satellite images from 26 September showed a spatter cone on the crater floor with one vent that measured 10 x 14 m and a smaller vent about 35 m NE of the cone. SERNAGEOMIN reported an abundant number of bomb-sized blocks up to 150 m from the crater, as well as impact marks on the snow, which indicated explosive activity. A low-altitude ash emission was observed drifting NW around 1140 on 28 September, based on webcam images. Between 0620 and 0850 on 29 September an ash emission rose 60 m above the crater and drifted NW. During an overflight taken around 1000 on 29 September scientists observed molten material in the vent, a large accumulation of pyroclasts inside the crater, and energetic degassing, some of which contained a small amount of ash. Block-sized pyroclasts were deposited on the internal walls and near the crater, and a distal ash deposit was also visible. The average sulfur dioxide flux measured on 28 September was 344 t/d. Satellite images taken on 29 September ashfall was deposited roughly 3 km WNW from the crater and nighttime crater incandescence remained visible. The average sulfur dioxide flux value from 29 September was 199 t/d. On 30 September at 0740 a pulsating ash emission rose 1.1 km above the crater and drifted NNW (figure 126). Deposits on the S flank extended as far as 4.5 km from the crater rim, based on satellite images from 30 September.
Infrared MODIS satellite data processed by MIROVA (Middle InfraRed Observation of Volcanic Activity) showed intermittent thermal activity during April through September, with slightly stronger activity detected during late September (figure 127). Small clusters of thermal activity were detected during mid-June, early July, early August, and late September. According to the MODVOLC thermal alert system, a total of four thermal hotspots were detected on 7 July and 3 and 23 September. This activity was also intermittently captured in infrared satellite imagery on clear weather days (figure 128).
Geologic Background. The glacier-covered Villarrica stratovolcano, in the northern Lakes District of central Chile, is ~15 km south of the city of Pucon. A 2-km-wide caldera that formed about 3,500 years ago is located at the base of the presently active, dominantly basaltic to basaltic andesite cone at the NW margin of a 6-km-wide Pleistocene caldera. More than 30 scoria cones and fissure vents are present on the flanks. Plinian eruptions and pyroclastic flows that have extended up to 20 km from the volcano were produced during the Holocene. Lava flows up to 18 km long have issued from summit and flank vents. Eruptions documented since 1558 CE have consisted largely of mild-to-moderate explosive activity with occasional lava effusion. Glaciers cover 40 km2 of the volcano, and lahars have damaged towns on its flanks.
Information Contacts: Servicio Nacional de Geología y Minería (SERNAGEOMIN), Observatorio Volcanológico de Los Andes del Sur (OVDAS), Avda Sta María No. 0104, Santiago, Chile (URL: http://www.sernageomin.cl/); Proyecto Observación Villarrica Internet (POVI) (URL: http://www.povi.cl/); Sistema y Servicio Nacional de Prevención y Repuesta Ante Desastres (SENAPRED), Av. Beauchef 1671, Santiago, Chile (URL: https://web.senapred.cl/); Buenos Aires Volcanic Ash Advisory Center (VAAC), Servicio Meteorológico Nacional-Fuerza Aérea Argentina, 25 de mayo 658, Buenos Aires, Argentina (URL: http://www.smn.gov.ar/vaac/buenosaires/inicio.php); MIROVA (Middle InfraRed Observation of Volcanic Activity), a collaborative project between the Universities of Turin and Florence (Italy) supported by the Centre for Volcanic Risk of the Italian Civil Protection Department (URL: http://www.mirovaweb.it/); Hawai'i Institute of Geophysics and Planetology (HIGP) - MODVOLC Thermal Alerts System, School of Ocean and Earth Science and Technology (SOEST), Univ. of Hawai'i, 2525 Correa Road, Honolulu, HI 96822, USA (URL: http://modis.higp.hawaii.edu/); Copernicus Browser, Copernicus Data Space Ecosystem, European Space Agency (URL: https://dataspace.copernicus.eu/browser/).
Merapi (Indonesia) — October 2023 Cite this Report
Merapi
Indonesia
7.54°S, 110.446°E; summit elev. 2910 m
All times are local (unless otherwise noted)
Frequent incandescent avalanches during April-September 2023
Merapi, located just north of the major city of Yogyakarta in central Java, Indonesia, has had activity within the last 20 years characterized by pyroclastic flows and lahars accompanying growth and collapse of the steep-sided active summit lava dome. The current eruption period began in late December 2020 and has more recently consisted of ash plumes, intermittent incandescent avalanches of material, and pyroclastic flows (BGVN 48:04). This report covers activity during April through September 2023, based on information from Balai Penyelidikan dan Pengembangan Teknologi Kebencanaan Geologi (BPPTKG), the Center for Research and Development of Geological Disaster Technology, a branch of PVMBG which specifically monitors Merapi. Additional information comes from the Pusat Vulkanologi dan Mitigasi Bencana Geologi (PVMBG, also known as Indonesian Center for Volcanology and Geological Hazard Mitigation, CVGHM), MAGMA Indonesia, the Darwin Volcanic Ash Advisory Centre (VAAC), and various satellite data.
Activity during April through September 2023 primarily consisted of incandescent avalanches of material that mainly affected the SW and W flanks and traveled as far as 2.3 km from the summit (table 25) and white gas-and-steam emissions that rose 10-1,000 m above the crater.
Table 25. Monthly summary of avalanches and avalanche distances recorded at Merapi during April through September 2023. The number of reported avalanches does not include instances where possible avalanches were heard but could not be visually confirmed as a result of inclement weather. Data courtesy of BPPTKG (April-September 2023 daily reports).
| Month |
Average number of avalanches per day |
Distance avalanches traveled (m) |
| Apr 2023 |
19 |
1,200-2,000 |
| May 2023 |
22 |
500-2,000 |
| Jun 2023 |
18 |
1,200-2,000 |
| Jul 2023 |
30 |
300-2,000 |
| Aug 2023 |
25 |
400-2,300 |
| Sep 2023 |
23 |
600-2,000 |
BPPTKG reported that during April and May white gas-and-steam emissions rose 10-750 m above the crater, incandescent avalanches descended 500-2,000 m on the SW and W flanks (figure 135). Cloudy weather often prevented clear views of the summit, and sometimes avalanches could not be confirmed. According to a webcam image, a pyroclastic flow was visible on 17 April at 0531. During the week of 28 April and 4 May a pyroclastic flow was reported on the SW flank, traveling up to 2.5 km. According to a drone overflight taken on 17 May the SW lava dome volume was an estimated 2,372,800 cubic meters and the dome in the main crater was an estimated 2,337,300 cubic meters.
During June and July similar activity persisted with white gas-and-steam emissions rising 10-350 m above the crater and frequent incandescent avalanches that traveled 300-2,000 m down the SW, W, and S flanks (figure 136). Based on an analysis of aerial photos taken on 24 June the volume of the SW lava dome was approximately 2.5 million cubic meters. A pyroclastic flow was observed on 5 July that traveled 2.7 km on the SW flank. According to the Darwin VAAC multiple minor ash plumes were identified in satellite images on 19 July that rose to 3.7 km altitude and drifted S and SW. During 22, 25, and 26 July a total of 17 avalanches descended as far as 1.8 km on the S flank.
Frequent white gas-and-steam emissions continued during August and September, rising 10-450 m above the crater. Incandescent avalanches mainly affected the SW and W flanks and traveled 400-2,300 m from the vent (figure 137). An aerial survey conducted on 10 August was analyzed and reported that estimates of the SW dome volume was 2,764,300 cubic meters and the dome in the main crater was 2,369,800 cubic meters.
Frequent and moderate-power thermal activity continued throughout the reporting period, according to a MIROVA (Middle InfraRed Observation of Volcanic Activity) analysis of MODIS satellite data (figure 138). There was an increase in the number of detected anomalies during mid-May. The MODVOLC thermal algorithm recorded a total of 47 thermal hotspots: six during April, nine during May, eight during June, 15 during July, four during August, and five during September. Some of this activity was captured in infrared satellite imagery on clear weather days, sometimes accompanied by incandescent material on the SW flank (figure 139).
Geologic Background. Merapi, one of Indonesia's most active volcanoes, lies in one of the world's most densely populated areas and dominates the landscape immediately north of the major city of Yogyakarta. It is the youngest and southernmost of a volcanic chain extending NNW to Ungaran volcano. Growth of Old Merapi during the Pleistocene ended with major edifice collapse perhaps about 2,000 years ago, leaving a large arcuate scarp cutting the eroded older Batulawang volcano. Subsequent growth of the steep-sided Young Merapi edifice, its upper part unvegetated due to frequent activity, began SW of the earlier collapse scarp. Pyroclastic flows and lahars accompanying growth and collapse of the steep-sided active summit lava dome have devastated cultivated lands on the western-to-southern flanks and caused many fatalities.
Information Contacts: Balai Penyelidikan dan Pengembangan Teknologi Kebencanaan Geologi (BPPTKG), Center for Research and Development of Geological Disaster Technology (URL: http://merapi.bgl.esdm.go.id/, Twitter: @BPPTKG); MAGMA Indonesia, Kementerian Energi dan Sumber Daya Mineral (URL: https://magma.esdm.go.id/v1); Pusat Vulkanologi dan Mitigasi Bencana Geologi (PVMBG, also known as Indonesian Center for Volcanology and Geological Hazard Mitigation, CVGHM), Jalan Diponegoro 57, Bandung 40122, Indonesia (URL: http://www.vsi.esdm.go.id/); Darwin Volcanic Ash Advisory Centre (VAAC), Bureau of Meteorology, Northern Territory Regional Office, PO Box 40050, Casuarina, NT 0811, Australia (URL: http://www.bom.gov.au/info/vaac/); MIROVA (Middle InfraRed Observation of Volcanic Activity), a collaborative project between the Universities of Turin and Florence (Italy) supported by the Centre for Volcanic Risk of the Italian Civil Protection Department (URL: http://www.mirovaweb.it/); Hawai'i Institute of Geophysics and Planetology (HIGP) - MODVOLC Thermal Alerts System, School of Ocean and Earth Science and Technology (SOEST), Univ. of Hawai'i, 2525 Correa Road, Honolulu, HI 96822, USA (URL: http://modis.higp.hawaii.edu/); Copernicus Browser, Copernicus Data Space Ecosystem, European Space Agency (URL: https://dataspace.copernicus.eu/browser/); Øystein Lund Andersen (URL: https://www.oysteinlundandersen.com/, https://twitter.com/oysteinvolcano).
Ebeko
Russia
50.686°N, 156.014°E; summit elev. 1103 m
All times are local (unless otherwise noted)
Moderate explosive activity with ash plumes continued during June-November 2023
Ebeko, located on the N end of Paramushir Island in Russia’s Kuril Islands just S of the Kamchatka Peninsula, consists of three summit craters along a SSW-NNE line at the northern end of a complex of five volcanic cones. Observed eruptions date back to the late 18th century and have been characterized as small-to-moderate explosions from the summit crater, accompanied by intense fumarolic activity. The current eruptive period began in June 2022, consisting of frequent explosions, ash plumes, and thermal activity (BGVN 47:10, 48:06). This report covers similar activity during June-November 2023, based on information from the Kamchatka Volcanic Eruptions Response Team (KVERT) and satellite data.
Moderate explosive activity continued during June-November 2023 (figures 50 and 51). According to visual data from Severo-Kurilsk, explosions sent ash 2-3.5 km above the summit (3-4.5 km altitude) during most days during June through mid-September. Activity after mid-September was slightly weaker, with ash usually reaching less than 2 km above the summit. According to KVERT the volcano in October and November was, with a few exceptions, either quiet or obscured by clouds that prevented satellite observations. KVERT issued Volcano Observatory Notices for Aviation (VONA) on 8 and 12 June, 13 and 22 July, 3 and 21 August, and 31 October warning of potential aviation hazards from ash plumes drifting 3-15 km from the volcano. Based on satellite data, KVERT reported a persistent thermal anomaly whenever weather clouds permitted viewing.
Geologic Background. The flat-topped summit of the central cone of Ebeko volcano, one of the most active in the Kuril Islands, occupies the northern end of Paramushir Island. Three summit craters located along a SSW-NNE line form Ebeko volcano proper, at the northern end of a complex of five volcanic cones. Blocky lava flows extend west from Ebeko and SE from the neighboring Nezametnyi cone. The eastern part of the southern crater contains strong solfataras and a large boiling spring. The central crater is filled by a lake about 20 m deep whose shores are lined with steaming solfataras; the northern crater lies across a narrow, low barrier from the central crater and contains a small, cold crescentic lake. Historical activity, recorded since the late-18th century, has been restricted to small-to-moderate explosive eruptions from the summit craters. Intense fumarolic activity occurs in the summit craters, on the outer flanks of the cone, and in lateral explosion craters.
Information Contacts: Kamchatka Volcanic Eruptions Response Team (KVERT), Far Eastern Branch, Russian Academy of Sciences, 9 Piip Blvd., Petropavlovsk-Kamchatsky, 683006, Russia (URL: http://www.kscnet.ru/ivs/kvert/).
Search Bulletin Archive by Publication Date
Select a month and year from the drop-downs and click "Show Issue" to have that issue displayed in this tab.
The default month and year is the latest issue available.
Bulletin of the Global Volcanism Network - Volume 21, Number 06 (June 1996)
Managing Editor: Richard Wunderman
Aira (Japan)
Explosive activity continues, but at decreased levels in June
Akutan (United States)
Low seismicity
Arenal (Costa Rica)
Sub-continuous Strombolian fountaining and lava flow details
Atka Volcanic Complex (United States)
Eruption of volcanic ash
Avachinsky (Russia)
Normal seismic activity and degassing
Bezymianny (Russia)
Degassing continues
Etna (Italy)
Crater glow, gas emissions, and mild Strombolian eruptions
Galeras (Colombia)
Degassing and low seismic activity continue
Karymsky (Russia)
Above background seismicity correlating to weak Strombolian eruptions
Klyuchevskoy (Russia)
Normal seismic activity, but degassing persists
La Palma (Spain)
No surface deformation detected
Langila (Papua New Guinea)
Continued weak eruptions with increased seismicity in June
Lengai, Ol Doinyo (Tanzania)
Summary of activity July 1995-April 1996
Long Valley (United States)
Two S-moat earthquake swarms during June
Manam (Papua New Guinea)
Emissions of ash clouds and increase of seismic activity
North Gorda Ridge Segment (United States)
Submarine plumes and a brief fissure eruption
Poas (Costa Rica)
Moderate seismicity during June
Rabaul (Papua New Guinea)
Eruptions wane, stop, then resume
Rincon de la Vieja (Costa Rica)
Six-fold seismic increase over previous months in 1996
Ruapehu (New Zealand)
Variable intensity eruptions continue
Semeru (Indonesia)
Eruptions form ash plumes
Sheveluch (Russia)
Normal seismic activity, but degassing continues
Soufriere Hills (United Kingdom)
Dome growth continues
St. Helens (United States)
Dwindling seismicity
Suwanosejima (Japan)
Strong eruptions produce volcanic ash clouds
Turrialba (Costa Rica)
Microseismicity escalates from 0 (background) to 246 events/month
Ulawun (Papua New Guinea)
Steam emissions continue
Vesuvius (Italy)
Seismicity during 1995-96 is the highest in the past 50 years
Aira
Japan
31.5772°N, 130.6589°E; summit elev. 1117 m
All times are local (unless otherwise noted)
Explosive activity continues, but at decreased levels in June
An eruption on 16 May sent an ash plume 3,500 m above the summit, to ~4,600 m altitude (BGVN 21:05). This higher than usual ash plume was estimated at 4,880 m altitude in aviation notices from Tokyo. However, the eruption was not detected on GMS satellite imagery. Ths Volcano Research Center also noted that this explosion threw large cinders to 2 km NW of the crater.
According to the Sakura-jima Volcanological Observatory (SVO), Kyoto University, since March there has been a decrease in the amount of air-fall tephra, the frequency of explosions, and earthquakes (including BL, surface, and shallow types).
The Japanese Meterological Agency reported that Minami-dake crater produced four explosive eruptions during June. The highest ash plume of the month rose 900 m above the crater on 22 June. Ashfall measured at the Kagoshima Local Meteorological Station, 10 km from the crater, was 1 g/m2. The seismic station 2.3 km NW of the crater recorded 118 earthquakes and 63 tremors through 29 June. High seismicity began around 0800 on 30 June; 349 earthquakes were recorded that day, bringing the monthly total to 467.
Geologic Background. The Aira caldera in the northern half of Kagoshima Bay contains the post-caldera Sakurajima volcano, one of Japan's most active. Eruption of the voluminous Ito pyroclastic flow accompanied formation of the 17 x 23 km caldera about 22,000 years ago. The smaller Wakamiko caldera was formed during the early Holocene in the NE corner of the caldera, along with several post-caldera cones. The construction of Sakurajima began about 13,000 years ago on the southern rim and built an island that was joined to the Osumi Peninsula during the major explosive and effusive eruption of 1914. Activity at the Kitadake summit cone ended about 4,850 years ago, after which eruptions took place at Minamidake. Frequent eruptions since the 8th century have deposited ash on the city of Kagoshima, located across Kagoshima Bay only 8 km from the summit. The largest recorded eruption took place during 1471-76.
Information Contacts: Volcano Research Center, Earthquake Research Institute, University of Tokyo, Yayoi 1-1-1, Bunkyo-ku, Tokyo 113, Japan (URL: http://www.eri.u-tokyo.ac.jp/VRC/index_E.html); NOAA/NESDIS Synoptic Analysis Branch (SAB), Room 401, 5200 Auth Road, Camp Springs, MD 20746, USA; Volcanological Division, Japan Meteorological Agency, 1-3-4 Ote-machi, Chiyoda-ku, Tokyo 100, Japan.
Akutan (United States) — June 1996 Cite this Report
Akutan
United States
54.134°N, 165.986°W; summit elev. 1303 m
All times are local (unless otherwise noted)
Low seismicity
The daily number of recorded earthquakes continued to be low (at an average rate of a few events/day) in May and June, with some fluctuations. This rate was significantly lower than the rate measured during the seismic crisis of mid-March (BGVN 21:02-21:04).
Geologic Background. Akutan contains a 2-km-wide caldera with a large cinder cone in the NE part of the caldera that has been the source of frequent explosive eruptions and occasional lava effusion that covers the caldera floor. An older, largely buried caldera was formed during the late Pleistocene or early Holocene. Two volcanic centers are located on the NW flank. Lava Peak is of Pleistocene age, and a cinder cone lower on the flank produced a lava flow in 1852 that extended the shoreline of the island and forms Lava Point. The 60-365 m deep younger caldera was formed during a major explosive eruption about 1,600 years ago and contains at least three lakes. A lava flow in 1978 traveled through a narrow breach in the north caldera rim almost to the coast. Fumaroles occur at the base of the caldera cinder cone, and hot springs are located NE of the caldera at the head of Hot Springs Bay valley and along the shores of Hot Springs Bay.
Information Contacts: Alaska Volcano Observatory (AVO), a cooperative program of a) U.S. Geological Survey, 4200 University Drive, Anchorage, AK 99508-4667, USA, b) Geophysical Institute, University of Alaska, PO Box 757320, Fairbanks, AK 99775-7320, USA, and c) Alaska Division of Geological & Geophysical Surveys.
Arenal
Costa Rica
10.463°N, 84.703°W; summit elev. 1670 m
All times are local (unless otherwise noted)
Sub-continuous Strombolian fountaining and lava flow details
During June, Arenal continued its unbroken eruptive sequence lasting nearly 28 years. In the second half of the month, the active crater, Crater C, increased the volume of pyroclastic emissions above that seen in recent months. Some plumes ascended over 1 km above Crater C. Bombs and blocks landed as far down on the flanks as 1,100 m elevation.
Gerardo Soto (ICE) sketched how lava flows had advanced ~2 km into the N sector and then paused at this point on 17 June (figures 77 and 78). A new, parallel flow that developed on the W side of the older one reached 1,100 m elevation on 20 June. The estimated volume of these flows was 2.5 x 10⁶ m3. They spawned occasional avalanches off their margins. The lava's source vent was the scene of sub-continuous fountaining that formed a 30-m tall, horse-shoe shaped spatter cone open towards the escaping flows. W-flank ashfalls have increased in mass during the course of 1996 (table 16).
Table 16. The mass of Arenal's ash accumulating per day (collected 1.8 km W of the active vent). Courtesy of ICE.
| Collection Interval |
Avg daily ashfall (grams/m2) |
Ash % 300+µ |
Ash % less than 300µ |
| 22 Dec-06 Mar 1996 |
33 |
50 |
50 |
| 06 Mar-15 Apr 1996 |
43 |
50 |
50 |
| 15 Apr-16 May 1996 |
48 |
56 |
44 |
| 16 May-20 Jun 1996 |
58 |
20 |
70 |
OVSCICORI-UNA reported that during June low-frequency (<3.5 HZ) seismicity totalled 781 events; the majority of these events were associated with eruptions; some events were also recorded at a station 30 km SW of the active crater. Tremor durations of over 23 hours took place on 4, 6, 7, and 11 June; the total for the month was 375 hours. This tremor's dominant frequency was 2.1-3.4 hz.
Geologic Background. Conical Volcán Arenal is the youngest stratovolcano in Costa Rica and one of its most active. The 1670-m-high andesitic volcano towers above the eastern shores of Lake Arenal, which has been enlarged by a hydroelectric project. Arenal lies along a volcanic chain that has migrated to the NW from the late-Pleistocene Los Perdidos lava domes through the Pleistocene-to-Holocene Chato volcano, which contains a 500-m-wide, lake-filled summit crater. The earliest known eruptions of Arenal took place about 7000 years ago, and it was active concurrently with Cerro Chato until the activity of Chato ended about 3500 years ago. Growth of Arenal has been characterized by periodic major explosive eruptions at several-hundred-year intervals and periods of lava effusion that armor the cone. An eruptive period that began with a major explosive eruption in 1968 ended in December 2010; continuous explosive activity accompanied by slow lava effusion and the occasional emission of pyroclastic flows characterized the eruption from vents at the summit and on the upper western flank.
Information Contacts: Erick Fernández, Elicer Duarte, Vilma Barboza, Rodolfo Van der Laat, and Enrique Hernandez, Observatorio Vulcanológico y Sismológico de Costa Rica, Universidad Nacional (OVSICORI-UNA), Apartado 86-3000, Heredia, Costa Rica; Gerardo J. Soto, Guillermo E. Alvarado, and Francisco (Chico) Arias, Oficina de Sismología y Vulcanología, Departamento de Geología, Instituto Costarricense de Electricidad (ICE), Apartado 10032-1000, San José, Costa Rica.
Atka Volcanic Complex (United States) — June 1996 Cite this Report
Atka Volcanic Complex
United States
52.331°N, 174.139°W; summit elev. 1518 m
All times are local (unless otherwise noted)
Eruption of volcanic ash
On 29 June, Japan Airlines reported volcanic ash erupting from Atka. In addition, GEOS-9 satellite images showed a possible small ash cloud in the immediate vicinity of Atka. In early May 1995 residents of Atka village observed a small plume-like cloud over Kliuchef and reported a strong sulfur smell (BGVN 20:05).
[The 1996 eruption described here was later discredited.]
Geologic Background. The Atka Volcanic Complex consists of a central shield and Pleistocene caldera and four notable volcanic cones. A major explosive dacitic eruption accompanied formation of the caldera about 500,000 to 300,000 years ago; approximately half of the caldera rime remains, open towards the NW. The Sarichef cone, ~5 km ESE of the caldera rim, retains a symmetrical profile, unlike most other heavily eroded features outside the caldera to the S and W. The Kliuchef stratovolcano grew within the caldera and exhibits five eruptive vents striking NE, including two at the summit, that have been active in the Holocene. A 700-m-diameter crater 1 km NE of the summit may have been the source vent for a large 1812 CE eruption. Hot springs and fumaroles are located on the flanks of Kliuchef and in a glacial valley to the SW. The most frequently active volcano of the complex is Korovin, at the NE tip of Atka Island about 5 km N of Kliuchef. An 800-m-diameter crater on the SE side of the summit contains a deep circular pit that sometimes contains a crater lake thought to be the source of phreatic ash explosions. The smaller Konia cone, slightly offset to the E, lies between Kliuchef and Korovin. Most of the lava flows in the complex are basaltic, though some dacitic flows are also present.
Information Contacts: Alaska Volcano Observatory (AVO), a cooperative program of a) U.S. Geological Survey, 4200 University Drive, Anchorage, AK 99508-4667, USA, b) Geophysical Institute, University of Alaska, PO Box 757320, Fairbanks, AK 99775-7320, USA, and c) Alaska Division of Geological & Geophysical Surveys; NOAA/NESDIS Synoptic Analysis Branch (SAB), Room 401, 5200 Auth Road, Camp Springs, MD 20746, USA.
Avachinsky
Russia
53.256°N, 158.836°E; summit elev. 2717 m
All times are local (unless otherwise noted)
Normal seismic activity and degassing
Seismicity remained slightly above or at normal levels in June and the first half of July. Normal fumarolic activity was seen above the crater. Regular reports from KVERT (via AVO) resumed in June after funding problems in Russia halted communications in December 1994 (BGVN 19:11).
Geologic Background. Avachinsky, one of Kamchatka's most active volcanoes, rises above Petropavlovsk, Kamchatka's largest city. It began to form during the middle or late Pleistocene, and is flanked to the SE by Kozelsky volcano, which has a large crater breached to the NE. A large collapse scarp open to the SW was created when a major debris avalanche about 30,000-40,000 years ago buried an area of about 500 km2 to the south, underlying the city of Petropavlovsk. Reconstruction of the volcano took place in two stages, the first of which began about 18,000 years before present (BP), and the second 7,000 years BP. Most eruptions have been explosive, with pyroclastic flows and hot lahars being directed primarily to the SW by the collapse scarp, although there have also been relatively short lava flows. The frequent historical eruptions have been similar in style and magnitude to previous Holocene eruptions.
Information Contacts: Tom Miller, Alaska Volcano Observatory (AVO); Vladimir Kirianov, Kamchatka Volcanic Eruptions Response Team (KVERT), Institute of Volcanic Geology and Geochemistry, Russia.
Bezymianny
Russia
55.972°N, 160.595°E; summit elev. 2882 m
All times are local (unless otherwise noted)
Degassing continues
Seismicity remained at or a little above normal background levels from 26 May to 22 July. Gas-and-steam plumes rose 100-300 m above the crater and extended ~2-7 km downwind. On 30 June, seismicity increased slightly, possibly associated with processes inside the extrusive lava dome. Regular reports from KVERT (via AVO) resumed in June after funding problems in Russia halted communications in December 1994 (BGVN 19:11).
Geologic Background. The modern Bezymianny, much smaller than its massive neighbors Kamen and Kliuchevskoi on the Kamchatka Peninsula, was formed about 4,700 years ago over a late-Pleistocene lava-dome complex and an edifice built about 11,000-7,000 years ago. Three periods of intensified activity have occurred during the past 3,000 years. The latest period, which was preceded by a 1,000-year quiescence, began with the dramatic 1955-56 eruption. This eruption, similar to that of St. Helens in 1980, produced a large open crater that was formed by collapse of the summit and an associated lateral blast. Subsequent episodic but ongoing lava-dome growth, accompanied by intermittent explosive activity and pyroclastic flows, has largely filled the 1956 crater.
Information Contacts: Tom Miller, Alaska Volcano Observatory (AVO), a cooperative program of a) U.S. Geological Survey, 4200 University Drive, Anchorage, AK 99508-4667, USA, b) Geophysical Institute, University of Alaska, PO Box 757320, Fairbanks, AK 99775-7320, USA, and c) Alaska Division of Geological & Geophysical Surveys, 794 University Ave., Suite 200, Fairbanks, AK 99709, USA; Vladimir Kirianov, Kamchatka Volcanic Eruptions Response Team (KVERT), Institute of Volcanic Geology and Geochemistry, Piip Ave. 9, Petropavlovsk-Kamchatsky, 683006, Russia.
Etna
Italy
37.748°N, 14.999°E; summit elev. 3357 m
All times are local (unless otherwise noted)
Crater glow, gas emissions, and mild Strombolian eruptions
Visiting scientists made observations of eruptive activity during late May and June. The observations revealed continued activity similar to that previously described for this eruptive phase (BGVN 20:06-20:11/12 and 21:02-20:03).
Observations during 26 May-3 June. Activity at the summit craters was described by Marco Fulle following visits on 26 and 30-31 May and on 1 and 3 June.
Bocca Nuova was filled by thick steam on the afternoon of 26 May, but there were many strong explosions. A vent on the SE side of the crater was emitting steam jets. A vent with a lava pond on the crater floor was ejecting meter-sized lava clots 20 m high. When the pond level was close to the bottom, Strombolian explosions rose 50 m. Northeast Crater (NEC) erupted thin ash and black bombs, but later produced Strombolian explosions every 10-50 seconds that sent a few bombs 50 m above the rim directed towards the E. No bombs fell outside the crater.
Observations of NEC beginning in the late afternoon of 30 May were made for 18 hours from Pizzi Deneri and the W rim of NEC. Strombolian explosions ejected black bombs 100-200 m above the rim at 1-40 second intervals. On the morning of 31 May many meter-sized incandescent bombs were ejected well beyond the SW crater rim due to a strong wind. After 30 minutes, this activity changed to predominantly ash eruptions. Eruption intensity soon increased again, ejecting lava clots and dark bombs well above the rim.
For two hours on the evening o f 1 June observers watched from the W rim of Bocca Nuova and Voragine. Bocca Nuova contained two vents with active lava ponds aligned N-S. The N vent produced Strombolian explosions 50 m high every 10-30 minutes. The S vent produced Strombolian explosions 10-30 m high every 5-20 seconds. A third vent in the SE side of the crater produced steam eruptions every 2-10 minutes with red glow during the steam ejections. Voragine produced steam jets when NEC was inactive. During five hours of observations at NEC from the W rim on 3 June, Strombolian explosions every 2-50 seconds rose 100-200 m.
Observations during 1-20 June. While making GPS measurement of a deformation network on the volcano's upper S flanks on 1-20 June, J.L. Moss and co-workers observed summit activity.
During 1-5 June, no explosions or ash clouds were observed, but the summit vents were vigorously steaming. On 6 June, local guides reported explosive activity at NEC. On 9 June steam degassed strongly from the summit craters, and yellowish fumes escaped from Southeast Crater.
On the night of 10 June Bocca Nuova exhibited two strongly glowing vents on the crater floor, each producing mild Strombolian explosions every 5-10 seconds and ejecting material to heights of a few meters. Larger explosions took place about every minute, but no material was ejected above the crater rim. At La Voragine crater (the Chasm), a single glowing vent on the crater floor produced mild, audible, Strombolian explosions every 5-30 seconds that ejected material a few meters high.
At NEC Moss's group felt radiant heat and saw intense heat shimmering above radial fractures around the crater rim. Very strong gas emissions prompted them to wear gas masks. The crater was filled with dark (non-glowing) solidified lava; it formed a fractured dome from which a dense gas/water mixture escaped. No Strombolian activity was observed.
During 13-17 June, loud explosions were heard in the Valle del Bove, up to 3 km from the summit. Black ash clouds periodically rose 100 m above NEC.
Geologic Background. Mount Etna, towering above Catania on the island of Sicily, has one of the world's longest documented records of volcanism, dating back to 1500 BCE. Historical lava flows of basaltic composition cover much of the surface of this massive volcano, whose edifice is the highest and most voluminous in Italy. The Mongibello stratovolcano, truncated by several small calderas, was constructed during the late Pleistocene and Holocene over an older shield volcano. The most prominent morphological feature of Etna is the Valle del Bove, a 5 x 10 km caldera open to the east. Two styles of eruptive activity typically occur, sometimes simultaneously. Persistent explosive eruptions, sometimes with minor lava emissions, take place from one or more summit craters. Flank vents, typically with higher effusion rates, are less frequently active and originate from fissures that open progressively downward from near the summit (usually accompanied by Strombolian eruptions at the upper end). Cinder cones are commonly constructed over the vents of lower-flank lava flows. Lava flows extend to the foot of the volcano on all sides and have reached the sea over a broad area on the SE flank.
Information Contacts: Marco Fulle, Osservatorio Astronomico, Via Tiepolo 11, I-34131 Trieste, Italy; J.L. Moss, Centre for Volcanic Research, Cheltenham & Gloucester College, Francis Close Hall, Swindon Road, Cheltenham GL50 4AZ, United Kingdom; S.J. Saunders and V.A. Buck, Brunel University, Department of Geography & Earth Science, Borough Road, Isleworth, Middlesex TW7 5DU, United Kingdom.
Galeras
Colombia
1.22°N, 77.37°W; summit elev. 4276 m
All times are local (unless otherwise noted)
Degassing and low seismic activity continue
Seismicity during May and June remained low, similar to previous months, and was characterized by fracture events centered 2-8 km NNE of the main crater, generally at 5-10 km depths. Surface degassing was still concentrated in craters, and fumaroles were located in the W sector of the active cone, mainly at the Chavas and La Joya sites. Correlation spectrophotometer (COSPEC) data indicated that SO2 was emitted around the volcano at rates of <100 tons/day. The deformation network did not show significant changes.
On 1 May, a M 1.6 event was felt. Moreover, on 20 May, an M 3.7 event occurred 10 km SE of the volcano that was felt by inhabitants of Pasto and in the epicentral zone.
In June, the coda magnitudes for seismic events had M < 1.7. High-frequency events with M < 2.3 were located near Rio Bobo, ~15 km SW of Galeras, at depths <14 km. In addition, during June the seismicity interpreted as related to dynamic fluids remained low, and the seismic network recorded 35 long-period events.
Geologic Background. Galeras, a stratovolcano with a large breached caldera located immediately west of the city of Pasto, is one of Colombia's most frequently active volcanoes. The dominantly andesitic complex has been active for more than 1 million years, and two major caldera collapse eruptions took place during the late Pleistocene. Long-term extensive hydrothermal alteration has contributed to large-scale edifice collapse on at least three occasions, producing debris avalanches that swept to the west and left a large open caldera inside which the modern cone has been constructed. Major explosive eruptions since the mid-Holocene have produced widespread tephra deposits and pyroclastic flows that swept all but the southern flanks. A central cone slightly lower than the caldera rim has been the site of numerous small-to-moderate eruptions since the time of the Spanish conquistadors.
Information Contacts: Pablo Chamorro, INGEOMINAS Observatorio Vulcanologico y Sismologico de Pasto (OVP), A.A. 1795, San Juan de Pasto, Nariño, Colombia (URL: https://www2.sgc.gov.co/volcanes/index.html).
Karymsky
Russia
54.049°N, 159.443°E; summit elev. 1513 m
All times are local (unless otherwise noted)
Above background seismicity correlating to weak Strombolian eruptions
Seismicity remained above background in June and the first half of July, and was indicative of continued low-level Strombolian eruptive activity. Gas-and-ash explosions occurred about every 5-20 minutes, generating ash-and-steam plumes to an altitude of 500-3,000 m. Regular reports from KVERT (via AVO) resumed in June after funding problems in Russia halted communications in December 1994 (BGVN 19:11).
Geologic Background. Karymsky, the most active volcano of Kamchatka's eastern volcanic zone, is a symmetrical stratovolcano constructed within a 5-km-wide caldera that formed during the early Holocene. The caldera cuts the south side of the Pleistocene Dvor volcano and is located outside the north margin of the large mid-Pleistocene Polovinka caldera, which contains the smaller Akademia Nauk and Odnoboky calderas. Most seismicity preceding Karymsky eruptions originated beneath Akademia Nauk caldera, located immediately south. The caldera enclosing Karymsky formed about 7600-7700 radiocarbon years ago; construction of the stratovolcano began about 2000 years later. The latest eruptive period began about 500 years ago, following a 2300-year quiescence. Much of the cone is mantled by lava flows less than 200 years old. Historical eruptions have been vulcanian or vulcanian-strombolian with moderate explosive activity and occasional lava flows from the summit crater.
Information Contacts: Tom Miller, Alaska Volcano Observatory; Vladimir Kirianov, Kamchatka Volcanic Eruptions Response Team (KVERT), Institute of Volcanic Geology and Geochemistry.
Klyuchevskoy (Russia) — June 1996 Cite this Report
Klyuchevskoy
Russia
56.056°N, 160.642°E; summit elev. 4754 m
All times are local (unless otherwise noted)
Normal seismic activity, but degassing persists
During 26 May-22 July, seismicity remained at normal background levels. Gas and steam plumes rose 50-300 m above the crater and extended up to 15 km downwind. Regular reports from KVERT (via AVO) resumed in June after funding problems in Russia halted communications in December 1994 (BGVN 19:11).
Geologic Background. Klyuchevskoy is the highest and most active volcano on the Kamchatka Peninsula. Since its origin about 6,000 years ago, this symmetrical, basaltic stratovolcano has produced frequent moderate-volume explosive and effusive eruptions without major periods of inactivity. It rises above a saddle NE of Kamen volcano and lies SE of the broad Ushkovsky massif. More than 100 flank eruptions have occurred during approximately the past 3,000 years, with most lateral craters and cones occurring along radial fissures between the unconfined NE-to-SE flanks of the conical volcano between 500 and 3,600 m elevation. Eruptions recorded since the late 17th century have resulted in frequent changes to the morphology of the 700-m-wide summit crater. These eruptions over the past 400 years have originated primarily from the summit crater, but have also included numerous major explosive and effusive eruptions from flank craters.
Information Contacts: Tom Miller, Alaska Volcano Observatory (AVO), a cooperative program of a) U.S. Geological Survey, 4200 University Drive, Anchorage, AK 99508-4667, USA, b) Geophysical Institute, University of Alaska, PO Box 757320, Fairbanks, AK 99775-7320, USA, and c) Alaska Division of Geological & Geophysical Surveys, 794 University Ave., Suite 200, Fairbanks, AK 99709, USA; Vladimir Kirianov, Kamchatka Volcanic Eruptions Response Team (KVERT), Institute of Volcanic Geology and Geochemistry, Piip Ave. 9, Petropavlovsk-Kamchatsky, 683006, Russia.
La Palma
Spain
28.57°N, 17.83°W; summit elev. 2426 m
All times are local (unless otherwise noted)
No surface deformation detected
A March 1996 EDM survey of the active Cumbre Vieja rift volcano indicated no significant surface deformation since installation of the network in October 1994. The network contains 11 benchmarks (incorporating two Spanish survey triangulation pillars) and was measured using the infrared EDM method. Together with one 3-component seismic station NE of the main rift, the network provides the only current means of monitoring activity on the island.
The deformation network covers the area affected by faulting associated with the July 1949 eruption (figure 1), a zone where W-facing normal faults showed a maximum vertical displacement of ~4 m. The Cumbre Vieja ridge lies between the two 1949 eruptive centers (Duraznero and San Juan). Eyewitness accounts (Bonnelli, 1950) and detailed mapping of the eruptive products showed that during the 1949 eruption, fault displacements also had westward components with downslope movement on the volcano's flanks. La Palma is comparable in form and structure to other Canary Islands that have undergone large-scale slope failure. Steep topography, together with the prospect of a future magma intrusion, cause concern for the long-term stability of the Cumbre Vieja ridge.
The wedge-shaped island of La Palma contains two large volcanic centers. The northern one is cut by the massive Caldera Taburiente. The southern Cumbre Vieja rift volcano, oriented N-S, has been the site of historical eruptions recorded since the 15th century. An eruption from the S tip of La Palma in 1971 produced the Teneguia cinder cone. Fissure-fed eruptions from vents ~1 km S of the 1677 San Antonio cone produced lava flows that reached the SW coast.
Reference. Bonnelli, R., 1950, Contribucion al estudio de la erupcion del volcan del Nambroque o San Juan (Isla de la Palma), 24 de Junio - Agosto de 1949: Instituto Geografico y Catastral, Madrid, Spain.
Geologic Background. The 47-km-long wedge-shaped island of La Palma, the NW-most of the Canary Islands, is composed of two large volcanic centers. The older northern one is cut by the steep-walled Caldera Taburiente, one of several massive collapse scarps produced by edifice failure to the SW. On the south, the younger Cumbre Vieja volcano is one of the most active in the Canaries. The elongated volcano dates back to about 125,000 years ago and is oriented N-S. Eruptions during the past 7,000 years have formed abundant cinder cones and craters along the axis, producing fissure-fed lava flows that descend steeply to the sea. Eruptions recorded since the 15th century have produced mild explosive activity and lava flows that damaged populated areas. The southern tip of the island is mantled by a broad lava field emplaced during the 1677-1678 eruption. Lava flows also reached the sea in 1585, 1646, 1712, 1949, 1971, and 2021.
Information Contacts: J.L. Moss, W.J. McGuire, and S.J. Day, Center for Volcanic Research, Cheltenham & Gloucester College, Francis Close Hall, Swindon Road, Cheltenham GL50 4AZ, United Kingdom; S.J. Saunders, Brunel University, Department of Geography & Earth Science, Borough Road, Isleworth, Middlesex TW7 5DU, United Kingdom; J-C. Carracedo, Estacion Volcanologica de las Canarias, Tigua Carretera de la Esperanza 3, Apartado de Correos 195, 38206 La Laguna, Tenerife, Canary Islands, Spain.
Langila (Papua New Guinea) — June 1996 Cite this Report
Langila
Papua New Guinea
5.525°S, 148.42°E; summit elev. 1330 m
All times are local (unless otherwise noted)
Continued weak eruptions with increased seismicity in June
During June, white-gray or brown ash and vapor clouds emitted from Crater 2 rose to several hundred meters above the crater rim. Fine ash was mostly blown to the NW and occasionally to the SE and NE. Rumbling noises were heard throughout the month. During the first half of June, night glow was seen only on 5 June, but weak red glow was observed on most nights of the second half of the month. Weak to moderate projections of glowing lava fragments were observed on the nights of 17, 18, 19, and 21 June. Crater 3 remained quiet during June.
Geologic Background. Langila, one of the most active volcanoes of New Britain, consists of a group of four small overlapping composite basaltic-andesitic cones on the lower E flank of the extinct Talawe volcano in the Cape Gloucester area of NW New Britain. A rectangular, 2.5-km-long crater is breached widely to the SE; Langila was constructed NE of the breached crater of Talawe. An extensive lava field reaches the coast on the N and NE sides of Langila. Frequent mild-to-moderate explosive eruptions, sometimes accompanied by lava flows, have been recorded since the 19th century from three active craters at the summit. The youngest and smallest crater (no. 3 crater) was formed in 1960 and has a diameter of 150 m.
Information Contacts: D. Lolok, and C. McKee, RVO.
Ol Doinyo Lengai (Tanzania) — June 1996 Cite this Report
Ol Doinyo Lengai
Tanzania
2.764°S, 35.914°E; summit elev. 2962 m
All times are local (unless otherwise noted)
Summary of activity July 1995-April 1996
The following report summarizes morphological changes in the summit crater seen in a series of visits between July 1995 and April 1996 (figures 38-41).
On 19 July 1995 a group of cones observed W of T5/T9 included T23, T20, T36, T35 (a small cone joined to the SE side of T20), and T34 (BGVN 20:10). The upper parts of T8, T14, and T15 were engulfed by younger flows. T37, a low mound at the base of the NW slope of T5/T9, was not active. Lavas escaped from small vents at the base of T36. At the same time two hornitos in the T36 cluster were emitting low sprays of gassy lava. Lava, coming probably from T23 and T36, had almost filled the depression W of T5/T9 described by Dawson in late 1993 (BGVN 17:10).
On 27 September 1995, Andy Johnson observed a slight growth of T37, which remained a broad open feature, 1.5 m tall (figure 38). T36 showed a more pointed summit, but it hadn't changed significantly. There was no other sign of activity. A visit on 17 October 1995 by Jorg Keller revealed that T37 had grown into a broad cone to half the height of T5/T9. Small clots of lava were erupted S of T37 (at T37S). T37S soon became taller that the rest of the cone.
Burra Ami Gadiye visited on 21 November 1995 and noted no drastic change for T37, but reported that the N and S parts were distinguishable. T37S was clearly higher and darker than the N part, with fresh lava on its W slope. Activity was observed from a vent on T36 (figure 39). On 1 December 1995, Gadiye reported that continued growth of T37 had resulted in a large cone (T37S) and an open vent on a low dome (T37N). Lava flowing copiously and rapidly N traveled past T15. The source, located W of T5/T9, was probably at the base of T37S.
During a 15-19 December 1995 visit, C. Oppenheimer and P. Vetsch observed emission of small amounts of carbonatitic lava coming from the cone cluster T36 (BGVN 20:11/12). On 18 December the E-flank of T37S collapsed followed by a NE-directed lava flow that covered a large part of the F35 flow and surrounded the E slope of T5/T9. Continued activity at T37S built a large cone with a vent high on its SE slope (figure 40). T37N remained small and formed a partial cone on the W side of an open vent.
On 20 December Iris Saxer saw that the vent on the SE slope of T37S had been filled with lava and built a rim of spatter on its lip. This cone became almost as high as T5/T9 but much broader. A small summit vent was observed emitting puffs of steam and occasional clots of lava.
On 18 January 1996, H. Schabel observed small amounts of pahoehoe lava flowing N from vents near the base of T37S; the lavas surrounded T15. Few changes were noted in the shape of T37S but lava still spattered from its summit vent.
On 8 February, B. Saunders found that the top of T37S had collapsed (figure 41). Several flows originating from T37 had gone N and NE to reach the base of the crater wall. Some of these flows had crossed F35, around the E side of T5/T9. Other flows had reached farther E to separate F35 from the base of the E crater wall. Bubbling lava issued from a small vent at the SE base of T37S.
During 4-6 April, J.M. Bardintzeff observed a lava platform on the E side of T37S and a lava lake with asymmetrical overhang facing W. At that time lava was escaping the lake to the S and SW. Saunders also noted that a vent on the W side of the T36 cluster was a source of intermittent lava spattering.
Geologic Background. The symmetrical Ol Doinyo Lengai is the only volcano known to have erupted carbonatite tephras and lavas in historical time. The prominent stratovolcano, known to the Maasai as "The Mountain of God," rises abruptly above the broad plain south of Lake Natron in the Gregory Rift Valley. The cone-building stage ended about 15,000 years ago and was followed by periodic ejection of natrocarbonatitic and nephelinite tephra during the Holocene. Historical eruptions have consisted of smaller tephra ejections and emission of numerous natrocarbonatitic lava flows on the floor of the summit crater and occasionally down the upper flanks. The depth and morphology of the northern crater have changed dramatically during the course of historical eruptions, ranging from steep crater walls about 200 m deep in the mid-20th century to shallow platforms mostly filling the crater. Long-term lava effusion in the summit crater beginning in 1983 had by the turn of the century mostly filled the northern crater; by late 1998 lava had begun overflowing the crater rim.
Information Contacts: Celia Nyamweru, Department of Anthropology, St. Lawrence University, Canton, NY 13617, USA
Long Valley (United States) — June 1996 Cite this Report
Long Valley
United States
37.7°N, 118.87°W; summit elev. 3390 m
All times are local (unless otherwise noted)
Two S-moat earthquake swarms during June
Moderate earthquake swarms on 14 and 19-21 June triggered a "D" alert status (moderate unrest) for the caldera. The D-status for the second swarm expired at 0600 on 28 June. The activity associated with these swarms is common in the caldera and poses little or no threat. Focal depths of both swarms centered around 5-6 km, and there was no significant ground deformation.
The first swarm, which began on the morning of 14 June, was centered at the SW margin of the resurgent dome (near the Highway 203/395 junction 5 km E of Mammoth Lakes). It included 17 M > 2 earthquakes and more than 150 events large enough to be located (M >0.5). The two largest events in this swarm were M 3.0 and 3.3 earthquakes at 0943 and 2154, respectively. This swarm gradually died out early the next morning.
The second swarm, centered 5 km to the E along the SE margin of the resurgent dome, began late in the evening of 18 June and gradually tailed off through the early morning of 21 June. This swarm included a M 3.3 earthquake at 0513 on 19 June, and over 33 events of M >2. The number of M >0.5 events detected and located through the morning of 21 June exceeded 400. This swarm was centered 2-3 km N of the 29 March-10 April S-moat swarm, which included three M > 4 earthquakes (BGVN 21:04).
This 17 x 32 km caldera formed about 730,000 years ago as a result of the Bishop Tuff eruption. Resurgent doming was followed by eruptions until ~50,000 years ago. Since then the caldera has remained thermally active, and in recent years, has undergone significant deformation. Although distinct from Long Valley Caldera, both Inyo Craters and Mammoth Mountain sit adjacent to it.
Geologic Background. The large 17 x 32 km Long Valley caldera east of the central Sierra Nevada Range formed as a result of the voluminous Bishop Tuff eruption about 760,000 years ago. Resurgent doming in the central part of the caldera occurred shortly afterwards, followed by rhyolitic eruptions from the caldera moat and the eruption of rhyodacite from outer ring fracture vents, ending about 50,000 years ago. During early resurgent doming the caldera was filled with a large lake that left strandlines on the caldera walls and the resurgent dome island; the lake eventually drained through the Owens River Gorge. The caldera remains thermally active, with many hot springs and fumaroles, and has had significant deformation, seismicity, and other unrest in recent years. The late-Pleistocene to Holocene Inyo Craters cut the NW topographic rim of the caldera, and along with Mammoth Mountain on the SW topographic rim, are west of the structural caldera and are chemically and tectonically distinct from the Long Valley magmatic system.
Information Contacts: David Hill, U.S. Geological Survey, MS 977, 345 Middlefield Rd., Menlo Park, CA 94025 USA (URL: https://volcanoes.usgs.gov/observatories/calvo/).
Manam (Papua New Guinea) — June 1996 Cite this Report
Manam
Papua New Guinea
4.08°S, 145.037°E; summit elev. 1807 m
All times are local (unless otherwise noted)
Emissions of ash clouds and increase of seismic activity
Low-level activity persisted during June as in the previous months (BGVN 21:04 and 21:05). Both craters gently released white vapor with occasional whitish gray ash clouds from Southern Crater. There were no audible noises or night glow from either crater. Seismicity was low during the first half of June with daily totals of 350-850 small low-frequency earthquakes. Seismicity increased to 1,090-1,700 events per day after 17 June.
Geologic Background. The 10-km-wide island of Manam, lying 13 km off the northern coast of mainland Papua New Guinea, is one of the country's most active volcanoes. Four large radial valleys extend from the unvegetated summit of the conical basaltic-andesitic stratovolcano to its lower flanks. These valleys channel lava flows and pyroclastic avalanches that have sometimes reached the coast. Five small satellitic centers are located near the island's shoreline on the northern, southern, and western sides. Two summit craters are present; both are active, although most observed eruptions have originated from the southern crater, concentrating eruptive products during much of the past century into the SE valley. Frequent eruptions, typically of mild-to-moderate scale, have been recorded since 1616. Occasional larger eruptions have produced pyroclastic flows and lava flows that reached flat-lying coastal areas and entered the sea, sometimes impacting populated areas.
Information Contacts: D. Lolok, and C. McKee, RVO.
North Gorda Ridge Segment (United States) — June 1996 Cite this Report
North Gorda Ridge Segment
United States
42.67°N, 126.78°W; summit elev. -3000 m
All times are local (unless otherwise noted)
Submarine plumes and a brief fissure eruption
The following report describes preliminary results of investigations on the eruptive activity that began on 28 February along the Gorda Ridge (BGVN 21:02). On 10-11 March 1996 NOAA's RV MacArthur carried out a series of conductivity-temperature-depth (CTD) casts to study the plume(s) activity.
Figure 2 shows a N-S cross section of the temperature anomaly through the event plume(s) discovered above the ridge. The temperature anomaly was defined as the increase of the water temperature above that expected for a given density horizon. The contours are based on five vertical casts evenly spaced between 42°36' and 42°43'N. A similar pattern was observed on an E-W transect. Since previous event plumes were characterized by symmetry about a central core, the structure in this anomaly suggested an agglomeration of two or more separate plumes. The events that caused the plumes could have been separated in space and time or both.
Water samples taken from station 7 (42°37.9'N, 126°47.8'W) in mid-March showed a very high enrichment in Helium-3 (figure 3). The presence of this isotope, enriched in fresh oceanic volcanic rocks and in submarine hydrothermal fluids, suggested a hydrothermal input into the ocean. Station 7 was also characterized by an increase in temperature and in suspended particles (nephels).
The plot of Helium-3 concentration versus temperature anomaly at stations 7 and 13 (42°45.7'N, 126°44.8'W) suggested that each had sampled water columns with different plume characteristics (figure 4). The Helium-3/heat trend for station 7 (the event plume) had a flat slope of 0.34 x 10⁻¹² cm3/cal, similar to other event plumes detected in 1986 and 1993 over the Juan de Fuca Ridge. In contrast, the plume detected at station 13 had a much higher helium-3/heat trend of 2.27 x 10⁻¹² cm3/cal.
SEM analysis of the first sample from the megaplume site at GR-14 revealed the presence of Fe-oxides, Zn-sulfides, and bacterial aggregates. The Fe-oxides were found with and without phosphorus. It was suggested that Fe-oxides formed beneath the seafloor lacked phosphorus, whereas Fe-oxides formed within the megaplume were enriched in phosphorus. The Zn-sulfides were very pure (i.e., no Fe). This sample appeared similar to the plume samples collected over the flow site in 1993. Preliminary results from the dissolved concentrations of Mn and Fe suggested that the event plume had formed recently.
In April the RV Wecoma surveyed a new lava flow with five camera tows. Figure 5 is a digital camera image that shows the contact between the new lava flow at the ridge and the surrounding older lava. The eruption site was at least 3.5 km long and only ~100-200 m wide, based mainly on the distribution of near-bottom temperature anomalies above the cooling flow. With this shape, the flow was clearly the product of a brief fissure eruption, where a dike reached the surface. The lava flow was located directly under the event plume mapped by CTD casts during the RV MacArthur cruise. Figure 6 shows the new lava flow, the camera tows, the CTD casts, the event plume(s), and the epicenters detected in the area since 28 February (BGVN 21:02).
Geologic Background. The northernmost of five segments of the Gorda Ridge lies immediately south of the Blanco Transform Fault that offsets the Gorda and Juan de Fuca oceanic spreading ridges. The 65-km-long segment is located about 200 km W of the southern Oregon coast and has deep 5- 10-km-wide valleys at either ends with a shallower narrow axial valley at the center. This morphology, which in plan view resembles an hourglass, is typical of magmatically active spreading segments. A submarine lava flow was erupted in late February and early March 1996, near the center of the segment. The eruption was initially detected through acoustic T-waves from a seismic swarm and the emission of large thermal plumes. In April submarine cameras revealed new lava flows about 100-200 m wide along a fissure that was at least 3.5 km long. A seismic swarm of uncertain origin also occurred at this location in January 1998.
Information Contacts: Chris Fox, Bob Dziak, Bob Embley, Bill Chadwick, Ed Baker, John Lupton, Dick Feely, and Gary Massoth, NOAA Pacific Marine Environmental Laboratory, 2115 SE Osu Drive, Newport, OR 97365 USA (URL: https://www.pmel.noaa.gov/eoi/).
Poas
Costa Rica
10.2°N, 84.233°W; summit elev. 2697 m
All times are local (unless otherwise noted)
Moderate seismicity during June
During June the lake at Poás had a greenish-turquoise color, a temperature of 44°C, and bubbled constantly from points on its S, SW, and W sides. A gas plume rose to between 400 and 500 m. Small rockfalls continued along the crater's N and W walls and gas escape rates in the latter area appeared low. The main source of fumarolic discharge came from the pyroclastic cone; at an accessible point on this region the temperature measured 94°C. Fumaroles on the SE, S, and SW walls maintained temperatures of 90-95°C.
OVSCICORI-UNA reported that June seismicity totalled 2,043 events, chiefly of low frequency. During June, totals for medium- and high-frequency events were 115 and 11, respectively. The low-frequency events occurred 20-157 times/day, with the highest number of events at mid-month. The high- and medium-frequency events also both peaked mid-month (with daily highs of about 3 and 13 events, respectively). The peak in high-frequency daily events took place on the 15th and coincided with the appearance of new fumaroles in the active crater.
Mauricio Mora (UCR) described six months of seismicity at Poás (table 7). A seismic peak in January was characterized by harmonic tremor and low-frequency events (both below 2 Hz). Tremor decreased during the first half of the year but a small peak in seismicity appeared in June. Mora also discussed January-June activity in the three primary areas of fumaroles, including: 1) the S crater wall, which appeared to be growing SW (91°C); 2) the dome and crater's S border, which issued plumes to 30 m height (~90°C); and 3) the crater's W border, which in March was covered by a landslide of hydrothermally altered wall rock.
Table 7. Number of low-frequency and A-type seismic events at Poás (recorded at station VPS2, 1 km SW of the active crater), January-June 1996. Courtesy of Mauricio Mora.
| Month |
Low-frequency events |
A-type events |
| Jan 1996 |
4,475 |
-- |
| Feb 1996 |
1,651 |
2 |
| Mar 1996 |
1,800 |
-- |
| Apr 1996 |
1,214 |
-- |
| May 1996 |
1,721 |
4 |
| Jun 1996 |
2,994 |
6 |
Geologic Background. The broad vegetated edifice of Poás, one of the most active volcanoes of Costa Rica, contains three craters along a N-S line. The frequently visited multi-hued summit crater lakes of the basaltic-to-dacitic volcano are easily accessible by vehicle from the nearby capital city of San José. A N-S-trending fissure cutting the complex stratovolcano extends to the lower N flank, where it has produced the Congo stratovolcano and several lake-filled maars. The southernmost of the two summit crater lakes, Botos, last erupted about 7,500 years ago. The more prominent geothermally heated northern lake, Laguna Caliente, is one of the world's most acidic natural lakes, with a pH of near zero. It has been the site of frequent phreatic and phreatomagmatic eruptions since an eruption was reported in 1828. Eruptions often include geyser-like ejections of crater-lake water.
Information Contacts: Erick Fernández, Elicer Duarte, Vilma Barboza, Rodolfo Van der Laat, and Enrique Hernandez, Observatorio Vulcanológico y Sismológico de Costa Rica, Universidad Nacional (OVSICORI-UNA), Apartado 86-3000, Heredia, Costa Rica; Gerardo J. Soto, Guillermo E. Alvarado, and Francisco (Chico) Arias, Oficina de Sismología y Vulcanología, Departamento de Geología, Instituto Costarricense de Electricidad (ICE), Apartado 10032-1000, San José, Costa Rica; Mauricio Mora F., Sección de Sismologia, Volcanologia y Exploración Geofisica, Escuala Centroamericana de Geología, Universidad de Costa Rica, Apdo. 35-2060, San José, Costa Rica
Rabaul (Papua New Guinea) — June 1996 Cite this Report
Rabaul
Papua New Guinea
4.2459°S, 152.1937°E; summit elev. 688 m
All times are local (unless otherwise noted)
Eruptions wane, stop, then resume
From December to April, Tavurvur continued fairly steady eruptive activity. During May emissions became more variable. In June Tavurvur's summit emissions waned, stopped for several days, then resumed.
On 1-2 June Tavurvur produced weak-to-moderate explosions at irregular intervals, but these became more frequent on 4-5 June. The explosions generated pale- to dark-gray ash-and-vapor clouds that rose 400-2,000 m above the crater rim. The clouds blew N and NW and produced ashfalls. Between 3 and 5 June, explosions were accompanied by roaring noises.
On 5 June, the number of earthquakes dropped rapidly, reaching the lowest level in six months and remaining low until 29 June (figure 27). During 5-29 June observers saw white- to pale-gray vapor clouds rising ~1 km; these clouds blew N, NW, and W. Moderate explosions 1-2 times/day caused regular warnings to aircraft in the vicinity. For example, on 10 June a SIGMET from Port Moresby noted volcanic ash to below 5,600 m altitude. For a period of six days (11-16 June), no emissions took place from the summit, but explosions resumed on 17 June.
Ground deformation changes were low for the first half of June. After 13 June (figure 28), however, rapid radial inflation (to the N of Tavurvur) was recorded by the Matupit (MPT) electronic tiltmeter 2 km W of Tavurvur. Inflation was also recorded by a water-tube tiltmeter at Sulphur Creek (3.3 km NW). Sea-shore leveling measurements near Tavurvur have showed slow uplift since September 1995. The total inflation recorded at MPT was >52 µrad. Forty-two µrad were recorded in four days, the highest recorded rate since electronic tiltmeters were installed in October 1994.
Following the rapid inflation indicated by the electronic tiltmeter, it was expected that a higher level of eruptive activity would commence. It did so later in the month when activity similar to that in the past six months resumed. Frequent explosions sent ash clouds to 400-1,000 m above the crater rim, some accompanied by loud roaring noises. These explosions continued through the end of June.
Seismicity in June consisted of 1,575 explosion earthquakes, 10 volcanic tremors, and 11 high-frequency earthquakes. The number of explosion earthquakes was the lowest since December 1995. Four high-frequency earthquakes were located to the NE of the caldera, four struck in the W part of the area delineated by the pre-1994 caldera seismicity, and the rest were scattered elsewhere.
Geologic Background. The low-lying Rabaul caldera on the tip of the Gazelle Peninsula at the NE end of New Britain forms a broad sheltered harbor utilized by what was the island's largest city prior to a major eruption in 1994. The outer flanks of the asymmetrical shield volcano are formed by thick pyroclastic-flow deposits. The 8 x 14 km caldera is widely breached on the east, where its floor is flooded by Blanche Bay and was formed about 1,400 years ago. An earlier caldera-forming eruption about 7,100 years ago is thought to have originated from Tavui caldera, offshore to the north. Three small stratovolcanoes lie outside the N and NE caldera rims. Post-caldera eruptions built basaltic-to-dacitic pyroclastic cones on the caldera floor near the NE and W caldera walls. Several of these, including Vulcan cone, which was formed during a large eruption in 1878, have produced major explosive activity during historical time. A powerful explosive eruption in 1994 occurred simultaneously from Vulcan and Tavurvur volcanoes and forced the temporary abandonment of Rabaul city.
Information Contacts: D. Lolok, and C. McKee, Rabaul Volcano Observatory (RVO), P.O. Box 385, Rabaul, Papua New Guinea; Jim Lynch, NOAA/NESDIS Synoptic Analysis Branch (SAB), Room 401, 5200 Auth Road, Camp Springs, MD 20746, USA.
Rincon de la Vieja (Costa Rica) — June 1996 Cite this Report
Rincon de la Vieja
Costa Rica
10.83°N, 85.324°W; summit elev. 1916 m
All times are local (unless otherwise noted)
Six-fold seismic increase over previous months in 1996
The local seismic station (RIN3, located 5 km SW of the active crater) registered a total of 50 events, a 6-fold increase over any previous month in 1996. These events were only detected at this seismic station.
Geologic Background. Rincón de la Vieja, the largest volcano in NW Costa Rica, is a remote volcanic complex in the Guanacaste Range. The volcano consists of an elongated, arcuate NW-SE-trending ridge constructed within the 15-km-wide early Pleistocene Guachipelín caldera, whose rim is exposed on the south side. Sometimes known as the "Colossus of Guanacaste," it has an estimated volume of 130 km3 and contains at least nine major eruptive centers. Activity has migrated to the SE, where the youngest-looking craters are located. The twin cone of Santa María volcano, the highest peak of the complex, is located at the eastern end of a smaller, 5-km-wide caldera and has a 500-m-wide crater. A Plinian eruption producing the 0.25 km3 Río Blanca tephra about 3,500 years ago was the last major magmatic eruption. All subsequent eruptions, including numerous historical eruptions possibly dating back to the 16th century, have been from the prominent active crater containing a 500-m-wide acid lake located ENE of Von Seebach crater.
Information Contacts: Erick Fernández, Elicer Duarte, Vilma Barboza, Rodolfo Van der Laat, and Enrique Hernandez, Observatorio Vulcanológico y Sismológico de Costa Rica, Universidad Nacional (OVSICORI-UNA), Apartado 86-3000, Heredia, Costa Rica.
Ruapehu (New Zealand) — June 1996 Cite this Report
Ruapehu
New Zealand
39.28°S, 175.57°E; summit elev. 2797 m
All times are local (unless otherwise noted)
Variable intensity eruptions continue
Variable intensity eruptions continued at Ruapehu. Although during 15-16 June volcanic tremor reached the highest levels seen in the past six months (BGVN 21:05), tremor dropped to background levels early on 20 June. Tremor and local earthquakes both remained low until 26 June when they increased slightly. A more definite increase in the intensity of seismicity took place on 27 June. Ruapehu then began larger discrete eruptions (around 0400) followed by ash-bearing eruptions (around 1000).
Airborne observers saw the volcano at 1120-1140 on 27 June and reported weak emissions that rose ~100 m above the crater. There appeared to be two source vents in an area N of the former crater lake's outlet area (on the crater's E side). The westernmost vent produced vivid white fumes; the easternmost vent produced dark gray ash. Ashfall had accumulated on Mitre Peak. Variable eruptions continued and after 1310 they grew larger. A ~6-km-tall ash column developed and ash fell to the E and SE.
The eruption continued the next day (the 28th), but appeared in conjunction with less seismicity and as a relatively gas-rich plume carrying minor ash. Tremor then was described as 5-10% of that recorded during the mid- June peak. Later, at 1144 on 28 June, a dark gray plume rose to over 600 m. Associated seismicity at the Dome station was weak. Weak to moderate ash emissions were detected 100-150 km downwind. Concern was raised about the mobility of near-source ash deposits.
A substantial amount of SO2 escaped from the volcano. Correlation spectrometer (COSPEC) measurements of SO2 flux rose from 4,100 metric tons/day (t/d) on 19 June to 5,100 t/d on 28 June (revised from an original estimate of 3,800 t/d), and remained high on 10 July at 6,000 ± 1,500 t/d.
Predominantly gas-rich plumes were seen from the ground on 1 July. Low seismicity, similar to that of 28 June, prevailed until 0400 on 2 July. At that time there were increases in both low-amplitude, high-frequency emergent events (the sort previously correlated with small ash eruptions) and larger high-frequency impulsive (A-type) events (interpreted as located at shallow depths beneath the summit). Bad weather on 2 July prevented detailed ground observations, but commercial aircraft reported ash-bearing plumes rising up to 600 m above the summit and blowing E.
The next day (2 July) white plumes were seen to 300 m above the summit. The day after (4 July) pilots reported a dark ash plume at ~3 km altitude extending 40 km downwind. At 1520 on 4 July, clouds cleared from the summit and observers saw a dark ash column rising up to 300 m above the summit; it deposited ash on snow in the ski area. On the Dome seismograph a large number of impulsive seismic events (larger than seen in the past few days) appeared to coincide with the ash column.
A report on 5 July stated that only relatively minor emissions had taken place since the last moderate-sized ash eruption (the event of 27 June). Intermittent minor eruptions still continued on 5 and 6 July, but on the later day, calm weather conditions allowed relatively high ash-bearing columns to develop.
An interval of increased seismicity, reaching levels seen in mid-July, began at 2030 on 7 July and preceded discrete inferred eruptions at 0115-0730 on 8 July. These eruptions took place at 2 to 3 minute intervals. An hour-long, intense burst of shallow seismicity ending about 0830 was followed by another interval of discrete explosions that diminished after about 1300. A helicopter flight at 0950-1030 documented an ash-poor plume to about 4.6 km altitude; an afternoon flight at 1330 also took place. Together, these flights confirmed that Strombolian eruptions ejected lava bombs up to 500 m above the vent.
Although seismicity dropped and then fluctuated in the last hours of 8 July, it resumed for intervals on 9 July. Eruptions continued on 9 July but bad weather and decreased, typically low seismicity prevailed during most of the next week.
At 1435-1735 on 16 July the volcano discharged an ash column to over 6-km altitude. Other eruptions followed; from 1735 to 0516 the next day there were 15 large explosive events, most with well-recorded air-wave phases. Tremor of variable amplitude and several hours of elevated seismicity prevailed. Aviation reports noted plumes at 3.3-4.6 km.
On 17 [July] seismicity dropped beginning at about 0330 and remained low for the next several days. Despite the lull in seismicity, in the afternoon on 18 and 19 [July] plumes rose 100-300 m above the summit.
On 20 July Ruapehu produced the largest outbursts since those in mid-June. Early on 20 July the seismicity and tremor again increased significantly; by about 0700 that day the tremor was replaced by small eruption earthquakes with airwave signals. Although pilots noted ash rising to 6.1-7.5 km altitude, some sustained moderate eruptions rose as high as 10.7 km and included bombs thrown 1.4 km above the crater and fire fountaining. Continuing through the next day, the seismic signals included both episodes with 2 to 7 discrete events per hour and episodes with continuous tremor and fewer discrete events. On 21 July the eruption's E-blown plumes, which were brown in color and thought to contain ash but not be ash-rich, ascended as high as 4.3 km.
Geologic Background. Ruapehu, one of New Zealand's most active volcanoes, is a complex stratovolcano constructed during at least four cone-building episodes dating back to about 200,000 years ago. The dominantly andesitic 110 km3 volcanic massif is elongated in a NNE-SSW direction and surrounded by another 100 km3 ring plain of volcaniclastic debris, including the NW-flank Murimoto debris-avalanche deposit. A series of subplinian eruptions took place between about 22,600 and 10,000 years ago, but pyroclastic flows have been infrequent. The broad summait area and flank contain at least six vents active during the Holocene. Frequent mild-to-moderate explosive eruptions have been recorded from the Te Wai a-Moe (Crater Lake) vent, and tephra characteristics suggest that the crater lake may have formed as recently as 3,000 years ago. Lahars resulting from phreatic eruptions at the summit crater lake are a hazard to a ski area on the upper flanks and lower river valleys.
Information Contacts: Colin Wilson, B.J. Scott, B.F. Houghton, C.J. Bryan, S. Sherburn, T. Thordarson, and I. Nairn, Institute of Geological & Nuclear Sciences (IGNS), Private Bag 2000, Wairakei, New Zealand.
Semeru
Indonesia
8.108°S, 112.922°E; summit elev. 3657 m
All times are local (unless otherwise noted)
Eruptions form ash plumes
A pilot report from Qantas Airlines on 5 May noted activity around 1800 generating a plume to ~10.5 km altitude. Eruptive activity was again observed from the same flight at 1745 on 7 May, but the ash cloud was only ~1 km above the summit and drifting NE.
Based on a report from Japan Air Lines, another aviation notice of volcanic ash from Semeru was posted at 0335 on 11 May. The report indicated that ash extended ~300 m above the peak and was moving SE at 18.5 km/hour. Lauda Air reported a low-level ash cloud around 1,300 m altitude on the early morning of 12 May, and a Qantas Airlines flight observed periodic emissions later that evening that did not rise above 6 km altitude. Satellite imagery throughout 5-12 May showed no ash plumes.
Geologic Background. Semeru, the highest volcano on Java, and one of its most active, lies at the southern end of a volcanic massif extending north to the Tengger caldera. The steep-sided volcano, also referred to as Mahameru (Great Mountain), rises above coastal plains to the south. Gunung Semeru was constructed south of the overlapping Ajek-ajek and Jambangan calderas. A line of lake-filled maars was constructed along a N-S trend cutting through the summit, and cinder cones and lava domes occupy the eastern and NE flanks. Summit topography is complicated by the shifting of craters from NW to SE. Frequent 19th and 20th century eruptions were dominated by small-to-moderate explosions from the summit crater, with occasional lava flows and larger explosive eruptions accompanied by pyroclastic flows that have reached the lower flanks of the volcano.
Information Contacts: Bureau of Meteorology, Northern Territory Regional Office, P.O. Box 735, Darwin, NT 0801, Australia; Jim Lynch, NOAA/NESDIS Synoptic Analysis Branch (SAB), Room 401, 5200 Auth Road, Camp Springs, MD 20746, USA.
Sheveluch
Russia
56.653°N, 161.36°E; summit elev. 3283 m
All times are local (unless otherwise noted)
Normal seismic activity, but degassing continues
During the period of 26 May-22 July, seismicity remained at normal background levels. Gas and steam plumes were observed above the volcano, rising to heights of 50-300 m above the crater and extending 2-8 km downwind. Regular reports from KVERT (via AVO) resumed in June after funding problems in Russia halted communications in December 1994 (BGVN 19:11).
Geologic Background. The high, isolated massif of Sheveluch volcano (also spelled Shiveluch) rises above the lowlands NNE of the Kliuchevskaya volcano group. The 1,300 km3 andesitic volcano is one of Kamchatka's largest and most active volcanic structures, with at least 60 large eruptions during the Holocene. The summit of roughly 65,000-year-old Stary Shiveluch is truncated by a broad 9-km-wide late-Pleistocene caldera breached to the south. Many lava domes occur on its outer flanks. The Molodoy Shiveluch lava dome complex was constructed during the Holocene within the large open caldera; Holocene lava dome extrusion also took place on the flanks of Stary Shiveluch. Widespread tephra layers from these eruptions have provided valuable time markers for dating volcanic events in Kamchatka. Frequent collapses of dome complexes, most recently in 1964, have produced debris avalanches whose deposits cover much of the floor of the breached caldera.
Information Contacts: Tom Miller, Alaska Volcano Observatory (URL: https://www.avo.alaska.edu/); Vladimir Kirianov, Kamchatka Volcanic Eruptions Response Team (KVERT), Institute of Volcanic Geology and Geochemistry, Piip Ave. 9, Petropavlovsk-Kamchatsky, 683006, Russia.
Soufriere Hills (United Kingdom) — June 1996 Cite this Report
Soufriere Hills
United Kingdom
16.72°N, 62.18°W; summit elev. 915 m
All times are local (unless otherwise noted)
Dome growth continues
The current eruption, which began on 18 July 1995 (BGVN 20:06), started extruding a lava dome on about 16 November 1995 (BGVN 20:11/12). What follows condenses Montserrat Volcano Observatory (MVO) Scientific Reports for the weeks ending 5 and 12 June and Daily Reports for the rest of June.
On 31 May, and 1 and 15 June, pyroclastic flows progressed several kilometers E; one to within 300 m of the sea. Associated plumes reached up to 3 km altitude. Persistent dome growth continued in June. Its talus filled the W moat, allowing rockfalls to begin escaping the crater, but none reached farther than 100 m beyond the rim. Summaries are included for visual observations, seismic observations, daily seismic event counts, and SO2 flux (tables 5, 6, 7, and 8).
Table 5. Chronology of visual observations at Soufriere Hills, Montserrat, late May through early June 1996. Poor weather conditions often prevented observations. Dated events after 12 June refer to 24-hour intervals beginning at 1600 the previous day. Courtesy of MVO.
| Date |
Visual Observations |
| 30 May 1996 |
Rockfalls concentrated on N and NE; vigorous steaming from many parts of the dome. |
| 31 May 1996 |
Rockfalls mainly concentrated on N and E, but some traveled into the S moat. Two pyroclastic flows down the Tar River; the first progressed to within 300 m of the sea; the second, to well past the Tar River Soufriere. Associated ash clouds rose to 2-3 km and were blown NW. A large S-directed rockfall escaped the S crater but progressed less than another 100 m. |
| 01 Jun 1996 |
Rockfalls concentrated on the dome's NE, E, and S. Small pyroclastic flow to the E (into the upper Tar River Valley); the associated plume rose to ~2 km. |
| 02 Jun 1996 |
Small "whale back" extruded on the dome's E flank, just N of Castle Peak. |
| 04 Jun 1996 |
Although the E dome was quiet, growth was indicated on the S and W sides. No spines were observed; instead the dome's top appeared comparatively rounded. |
| 09 Jun 1996 |
Intense incandescent spots coincided with the source areas for rockfalls. New spines in the W summit area. Night incandescence and associated rockfalls; rockfalls on the dome's NE flank to its W flank. |
| 10 Jun 1996 |
One of the spines seen on 9 June had fallen over. The dome overtopped the W crater rim at Gages Wall and debris began to travel into the uppermost reaches of Fort Ghaut. Dome growth indicated on the NE. |
| 11 Jun 1996 |
Dome growth indicated on the NW side. |
| 12 Jun 1996 |
Estimated height of the new dome's summit was 943 m. |
| 13 Jun 1996 |
Having filled the moat to ~25-m depth, talus spilled out of the partly buried crater for ~100 m into the upper Gages Valley. |
| 14 Jun 1996 |
During heavy rainfall, ash erupted and fell NW of the volcano (in the St George's Hill, Cork Hill, and Old Towne areas). Rockfalls were abundant; one ash emission during the afternoon was semi-continuous and lasted about an hour. |
| 15 Jun 1996 |
A small (~300-m-long) pyroclastic flow S of Castle Peak; fresh deposits from two others in the upper Tar River valley (on the dome's E and NE flanks). |
| 16 Jun 1996 |
Rockfalls on the dome's NE, N, SE, and W sides. On the W it was unclear how much new material escaped the crater along the upper Fort Ghaut. |
| 17 Jun 1996 |
Very little new material had traveled down the upper W slopes into the upper Fort Ghaut. Talus on the dome's N side had built up to ~15 m below the rim of Farells wall. A projection along the new dome's summit measured 942 m elevation. |
| 26 Jun 1996 |
Dome appeared wet and issued heavy steam from the SE flank. A stubby spine was on the NE summit. |
| 30 Jun 1996 |
Dome rockfalls relatively rare but considerable new material had been deposited on the dome's E sector, in the Tar river's upper S fork. The dome's most rapid growth appeared to be on the S. Little new mass wasting on the W (down Fort Ghaut); however, steam production was concentrated in the W moat area. |
| 04 Jul 1996 |
Viewed a large slab of extruded lava at the top of the SE dome. A few blocks of fresh dome lava lay in the dome's new W drainage (the upper Fort Ghaut). |
Table 6. Chronology of seismically derived observations of volcanic activity at Soufriere Hills, Montserrat, 30 May through July 1996. Dated events after 12 June refer to 24-hour intervals beginning at 1600 the previous day. Courtesy of MVO.
| Date |
Seismic Observations |
| 30 May-03 Jun 1996 |
Swarm of small hybrid earthquakes of variable amplitude, occurring at the rate of 0.5-2 events/minute. |
| 30 May 1996 |
Volcano-tectonic earthquake 750 m beneath the crater. |
| 31 May-03 Jun 1996 |
Somewhat elevated tremor; volcano-tectonic earthquake 1.5 km beneath the crater. |
| 01 Jun 1996 |
Volcano-tectonic earthquake 2 km beneath the crater. |
| 03 Jun 1996 |
One ~2-hour continuous tremor episode and a second 5-hour episode running into 4 June. |
| 05 Jun 1996 |
Interpreted small, local mudflow in upper Fort Ghaut. |
| 06 Jun 1996 |
Sediment-laden flood towards the W (Plymouth) down Fort Ghaut. |
| 09 Jun 1996 |
Areas of incandescence seen associated with rockfalls. |
| 13 Jun 1996 |
Very early in the morning the Gages and Chances Peak seismic stations started to record a few small repetitive hybrid events; these slowly increased in number and were occurring at a rate of ~1 every two minutes by the end of the reporting period. |
| 15 Jun 1996 |
During sustained heavy rainfall, small hybrid events appeared prior to abundant rockfalls. These hybrid events grew from ~1/minute to 5/minute and their amplitudes doubled before they decreased in number and size. Larger rockfall signals looked similar to signals from small pyroclastic flows. |
Table 7. Daily counts of seismic events at Soufriere Hills, Montserrat, 30 May-1 July 1996. The amount of tremor is described qualitatively (high-low) or using analysis from the Daily Reports (particularly after 12 June). Dated events after 12 June refer to 24-hour intervals beginning at 1600 the previous day. Courtesy of MVO.
| Date |
Volcano-tectonic |
Long-period |
Hybrid |
Rockfall |
Amount of Tremor |
| 30 May 1996 |
1 |
5 |
0 |
17 |
Low to intermediate (3 hours of continuous tremor) |
| 31 May 1996 |
1 |
14 |
96 |
97 |
Intermediate to high |
| 01 Jun 1996 |
1 |
0 |
307 |
116 |
Intermediate to high |
| 02 Jun 1996 |
0 |
0 |
132 |
83 |
Intermediate to high |
| 03 Jun 1996 |
0 |
1 |
19 |
32 |
Intermediate to high |
| 04 Jun 1996 |
0 |
5 |
18 |
51 |
Low to intermediate |
| 05 Jun 1996 |
0 |
17 |
8 |
57 |
Low to intermediate |
| 06 Jun 1996 |
0 |
13 |
4 |
49 |
Low to intermediate |
| 07 Jun 1996 |
0 |
0 |
1 |
13 |
Low to intermediate |
| 08 Jun 1996 |
0 |
0 |
1 |
51 |
Low to intermediate |
| 09 Jun 1996 |
0 |
3 |
1 |
54 |
Low to intermediate |
| 10 Jun 1996 |
1 |
15 |
2 |
54 |
Low to intermediate |
| 11 Jun 1996 |
0 |
12 |
5 |
87 |
Low to intermediate |
| 12 Jun 1996 |
0 |
2 |
1 |
59 |
Intermediate |
| 13 Jun 1996 |
1 |
2 |
(tab 4) |
39 |
5.5 hours |
| 14 Jun 1996 |
-- |
12 |
25 |
34 |
-- |
| 15 Jun 1996 |
-- |
-- |
(tab 4) |
198 |
-- |
| 16 Jun 1996 |
-- |
15 |
21 |
149 |
1 hour |
| 17 Jun 1996 |
-- |
16 |
2 |
49 |
12 hours |
| 18 Jun 1996 |
1 |
13 |
0 |
81 |
-- |
| 19 Jun 1996 |
-- |
7 |
8 |
92 |
-- |
| 20 Jun 1996 |
-- |
1 |
7 |
63 |
-- |
| 21 Jun 1996 |
-- |
3 |
5 |
53 |
6.6 hours |
| 22 Jun 1996 |
-- |
5 |
0 |
28 |
Low |
| 23 Jun 1996 |
-- |
1 |
4 |
60 |
7 hours |
| 24 Jun 1996 |
-- |
29 |
3 |
62 |
Very low |
| 25 Jun 1996 |
-- |
7 |
2 |
37 |
Low |
| 26 Jun 1996 |
-- |
4 |
6 |
37 |
-- |
| 27 Jun 1996 |
-- |
6 |
7 |
59 |
-- |
| 28 Jun 1996 |
2 |
14 |
11 |
66 |
-- |
| 29 Jun 1996 |
1 |
4 |
4 |
55 |
-- |
| 30 Jun 1996 |
-- |
-- |
~55 |
-- |
-- |
| 01 Jul 1996 |
2 |
11 |
12 |
57 |
4 hours |
Table 8. COSPEC measurements of SO2 flux at Soufriere Hills. Courtesy of MVO.
| Date |
Number of measurements |
SO2 flux (metric tons/day) |
| 30 May 1996 |
2 |
224 |
| 31 May 1996 |
2 |
88 |
| 01 Jun 1996 |
3 |
52 |
| 02 Jun 1996 |
6 |
193 |
| 03 Jun 1996 |
3 |
192 |
| 04 Jun 1996 |
4 |
240 |
| 05 Jun 1996 |
7 |
194 |
| 07 Jun 1996 |
3 |
84 |
| 08 Jun 1996 |
5 |
269 |
| 09 Jun 1996 |
4 |
126 |
| 10 Jun 1996 |
5 |
59 |
| 12 Jun 1996 |
5 |
168 |
| 15 Jun 1996 |
-- |
135 |
| 17 Jun 1996 |
6 |
125 |
| 19 Jun 1996 |
-- |
170 |
| 24 Jun 1996 |
-- |
76 |
| 28 Jun 1996 |
-- |
160 |
During the week ending 5 June gas measurements using a Fourier Transform Infrared Spectrometer showed substantial errors (50-100%), but did establish that at ground level on the lower slopes of the volcano (excluding Upper Amersham), the ambient concentrations of HCl and SO2 in the air were well below 100 ppb. The SO2:HCl ratio was generally well below 1.0. The only exception to this, on 24 May, was when the measurement errors were large. The SO2:HCl ratios could be used to make an argument about status of the magma chamber. Assuming that this ground-level SO2:HCl ratio was the same as in the plume, then the low ratios measured would indicate a moderately degassed magma chamber.
During 6-12 June, ash generation was generally low and few ash clouds emerged from the crater area; seismically detected rockfalls decreased with respect to the previous week and although no swarm of hybrid earthquakes occurred as in the previous week, the abundance of long-period earthquakes did appear similar to the previous few weeks.
EDM deformation measurements often detected an overall shortening rate along survey lines of ~1 mm/day during the interval from the beginning of December through the end of April. During 1 May-4 June there was a shortening rate of 2.4 and 2.1 mm/day in the volcano's N region (White's and Long Ground respectively); however, the shortening rate subsequently returned to ~1 mm/day.
On 12 June it was noted that during the previous 7-day interval, a ~12 mm/day shortening rate occurred on the N line (Long Ground to Castle Peak). In contrast, during this interval the W and N triangles continued to show no changes in line length above the error of the method.
On 13 June the E triangle was remeasured; its previous measurement was on 11 June: the Long Ground to Castle Peak line shortened by 9 mm and the Whites to Castle Peak line shortened by 6 mm. On 15 June it was reported that the W triangle's line lengths had recently shortened by ~1 mm/day. On 19 June it was found that NE sector (White's and Long Ground to Castle Peak) line lengths shortened by 2.5 cm over 5 days; this result extended a 3-week trend of 3-5 mm/day shortening here. Despite these larger than typical deformations in the NE sector during June, during the same month it was reported that the tiltmeters at Long Ground had remained stable for the past 10 months.
Scientists also noted that by June considerable new dome lava and talus had piled against the crater's W wall. Still, the June EDM surveys failed to show corresponding movement in this portion of the older edifice.
Geologic Background. The complex, dominantly andesitic Soufrière Hills volcano occupies the southern half of the island of Montserrat. The summit area consists primarily of a series of lava domes emplaced along an ESE-trending zone. The volcano is flanked by Pleistocene complexes to the north and south. English's Crater, a 1-km-wide crater breached widely to the east by edifice collapse, was formed about 2000 years ago as a result of the youngest of several collapse events producing submarine debris-avalanche deposits. Block-and-ash flow and surge deposits associated with dome growth predominate in flank deposits, including those from an eruption that likely preceded the 1632 CE settlement of the island, allowing cultivation on recently devegetated land to near the summit. Non-eruptive seismic swarms occurred at 30-year intervals in the 20th century, but no historical eruptions were recorded until 1995. Long-term small-to-moderate ash eruptions beginning in that year were later accompanied by lava-dome growth and pyroclastic flows that forced evacuation of the southern half of the island and ultimately destroyed the capital city of Plymouth, causing major social and economic disruption.
Information Contacts: Montserrat Volcano Observatory (MVO), c/o Chief Minister's Office, PO Box 292, Plymouth, Montserrat (URL: http://www.mvo.ms/).
St. Helens (United States) — June 1996 Cite this Report
St. Helens
United States
46.2°N, 122.18°W; summit elev. 2549 m
All times are local (unless otherwise noted)
Dwindling seismicity
No eruptive activity occurred during the first half of 1996, and a trend of declining seismicity since October 1995 continued. Thus far in 1996 monthly earthquake totals have been: January, 14; February, 13; March, 17; April, 16; May, 11; and June, 10 (figure 11). At 1651 on 21 February, an M 2.4 earthquake occurred ~4 km beneath the crater floor; this was followed by four locatable aftershocks and then by ~20 very small seismic events that resembled signals typical of rock or snow avalanches. These later events were shallow, apparently triggered by the M 2.4 earthquake that preceded them. Activity returned to normal within a few hours. Except for that on 21 February, the rest of the earthquakes from January to June did not exceed M 2.0. During the night of 9 June, a large seismic event from the volcano triggered an automated, 24-hour alarm system. The character of the signal suggested that the source was a rockfall from the crater wall. This interpretation was confirmed when a USGS crew working in the crater on 11 June observed a large fresh rockfall deposit that originated from the S crater wall. Rockfalls are a common occurrence in the crater during the summer, and generally do not indicate any increase in volcanic activity.
Geologic Background. Prior to 1980, Mount St. Helens was a conical volcano sometimes known as the Fujisan of America. During the 1980 eruption the upper 400 m of the summit was removed by slope failure, leaving a 2 x 3.5 km breached crater now partially filled by a lava dome. There have been nine major eruptive periods beginning about 40-50,000 years ago, and it has been the most active volcano in the Cascade Range during the Holocene. Prior to 2,200 years ago, tephra, lava domes, and pyroclastic flows were erupted, forming the older edifice, but few lava flows extended beyond the base of the volcano. The modern edifice consists of basaltic as well as andesitic and dacitic products from summit and flank vents. Eruptions in the 19th century originated from the Goat Rocks area on the N flank, and were witnessed by early settlers.
Information Contacts: Dan Dzurisin, Cascades Volcano Observatory, U.S. Geological Survey, 5400 MacArthur Blvd., Vancouver, WA 98661 USA (URL: http://volcanoes.usgs.gov/); Steve Malone, Geophysics Program, University of Washington, Seattle, WA 98195 USA (URL: https://volcanoes.usgs.gov/observatories/cvo/).
Suwanosejima (Japan) — June 1996 Cite this Report
Suwanosejima
Japan
29.638°N, 129.714°E; summit elev. 796 m
All times are local (unless otherwise noted)
Strong eruptions produce volcanic ash clouds
On 2 June, an aviation notice to airmen (NOTAM) indicated a volcanic ash cloud to 4,600 m emanating from Suwanose-jima. A second NOTAM at 1515 on 2 June noted that the ash cloud top was at 2,100 m. No discernible ash plume was evident in GMS satellite data from the Japanese Meteorological Agency (JMA) through 1732 on 2 June.
The Kagoshima Prefectural Government confirmed to JMA that emissions on 1-2 June caused ashfall. Ashfall was also observed on the island on 4 June.
The Sakura-jima Volcanological Observatory of Kyushu University reported that activity has continued at the same level since 1994, with nearly constant A-type earthquakes. Ash emissions have occurred this year on 10-13 January, 23 February, 5-6 March, and 14 April. The eruption column in March rose 500 m above the volcano.
Geologic Background. The 8-km-long island of Suwanosejima in the northern Ryukyu Islands consists of an andesitic stratovolcano with two active summit craters. The summit is truncated by a large breached crater extending to the sea on the E flank that was formed by edifice collapse. One of Japan's most frequently active volcanoes, it was in a state of intermittent Strombolian activity from Otake, the NE summit crater, between 1949 and 1996, after which periods of inactivity lengthened. The largest recorded eruption took place in 1813-14, when thick scoria deposits covered residential areas, and the SW crater produced two lava flows that reached the western coast. At the end of the eruption the summit of Otake collapsed, forming a large debris avalanche and creating an open collapse scarp extending to the eastern coast. The island remained uninhabited for about 70 years after the 1813-1814 eruption. Lava flows reached the eastern coast of the island in 1884. Only about 50 people live on the island.
Information Contacts: Volcano Research Center, Earthquake Research Institute, University of Tokyo, Yayoi 1-1-1, Bunkyo-ku, Tokyo 113, Japan (URL: http://www.eri.u-tokyo.ac.jp/VRC/index_E.html); Jim Lynch, NOAA/NESDIS Synoptic Analysis Branch (SAB), Room 401, 5200 Auth Road, Camp Springs, MD 20746, USA; Volcanological Division, Japan Meteorological Agency, 1-3-4 Ote-machi, Chiyoda-ku, Tokyo 100, Japan.
Turrialba (Costa Rica) — June 1996 Cite this Report
Turrialba
Costa Rica
10.025°N, 83.767°W; summit elev. 3340 m
All times are local (unless otherwise noted)
Microseismicity escalates from 0 (background) to 246 events/month
After 23 May Turrialba's seismic station (VTU, located 0.5 km E of the active crater) registered a sudden increase in microseismicity. During the first four months of 1996 nearly no events were registered. In late May there were over 50 events; in June, 246 events. The dominant frequency of these events varied between 2.5 and 4.0 Hz.
Geologic Background. Turrialba, the easternmost of Costa Rica's Holocene volcanoes, is a large vegetated basaltic-to-dacitic stratovolcano located across a broad saddle NE of Irazú volcano overlooking the city of Cartago. The massive edifice covers an area of 500 km2. Three well-defined craters occur at the upper SW end of a broad 800 x 2200 m summit depression that is breached to the NE. Most activity originated from the summit vent complex, but two pyroclastic cones are located on the SW flank. Five major explosive eruptions have occurred during the past 3500 years. A series of explosive eruptions during the 19th century were sometimes accompanied by pyroclastic flows. Fumarolic activity continues at the central and SW summit craters.
Information Contacts: Erick Fernández, Elicer Duarte, Vilma Barboza, Rodolfo Van der Laat, and Enrique Hernandez, Observatorio Vulcanológico y Sismológico de Costa Rica, Universidad Nacional (OVSICORI-UNA), Apartado 86-3000, Heredia, Costa Rica.
Ulawun (Papua New Guinea) — June 1996 Cite this Report
Ulawun
Papua New Guinea
5.05°S, 151.33°E; summit elev. 2334 m
All times are local (unless otherwise noted)
Steam emissions continue
The low-level activity of recent months persisted through June. Emissions consisted mainly of small to moderate volumes of white vapor. Seismic recording resumed on 28 June and showed low-level seismicity.
Geologic Background. The symmetrical basaltic-to-andesitic Ulawun stratovolcano is the highest volcano of the Bismarck arc, and one of Papua New Guinea's most frequently active. The volcano, also known as the Father, rises above the N coast of the island of New Britain across a low saddle NE of Bamus volcano, the South Son. The upper 1,000 m is unvegetated. A prominent E-W escarpment on the south may be the result of large-scale slumping. Satellitic cones occupy the NW and E flanks. A steep-walled valley cuts the NW side, and a flank lava-flow complex lies to the south of this valley. Historical eruptions date back to the beginning of the 18th century. Twentieth-century eruptions were mildly explosive until 1967, but after 1970 several larger eruptions produced lava flows and basaltic pyroclastic flows, greatly modifying the summit crater.
Information Contacts: D. Lolok, and C. McKee, RVO.
Vesuvius
Italy
40.821°N, 14.426°E; summit elev. 1281 m
All times are local (unless otherwise noted)
Seismicity during 1995-96 is the highest in the past 50 years
The Somma-Vesuvius volcanic complex is a central composite volcano formed by an older stratovolcano (Monte Somma) with a summit caldera partially filled by the composite cone of Vesuvius. The most noted eruption, in 79 A.D., destroyed the ancient cities of Pompeii and Herculaneum. Since the explosive sub-Plinian eruption of 1631, Vesuvius has erupted with both Strombolian and mixed effusive-explosive styles. For the past three centuries the volcanic activity has mainly focused inside the Somma caldera but occasionally lava issued outside it (i.e., 1760 eruption). The last cycle of activity ended with the 1944 eruption. Since then, the volcano has been characterized by moderate seismicity and intra-crater fumarolic activity.
The Osservatorio Vesuviano maintains an array of short-period seismographs (eight three-component and nine vertical-component instruments). Seismicity was monitored during 1995 and March-April 1996. The 1995-96 period was the most active of the past fifty years. Several hundred microearthqukes (M < 3.2) were recorded during 1995, many from sources within the volcanic edifice above sea level. An increase in strain release and in frequency of earthquakes was observed from August to October 1995. During this period 217 events were recorded. Three of these earthquakes had M > 3.0 and were felt by the local population (~600,000 people): the first event (M 3.1, focal depth 3.1 km) occurred on 2 August; the second (M 3.2, focal depth 4.2 km) on 16 September, and the third (M 3.1, focal depth 3.3 km) on 24 September.
During November 1995-February 1996 the seismicity decreased to less than 10 events/month, and the strongest earthquake was M 2.5. During March-April 1996, however, 296 earthquakes were recorded. A M 3.4 event at 2 km depth was the strongest recorded during the past fifty years. Seismic activity at Vesuvius decreased again after this event.
Hypocenter locations for the past two years have clustered in a small volume below the crater area, no deeper than 6 km below sea level (figure 1). Focal mechanisms of relevant events suggested that the cause of seismicity was crustal rupture. Harmonic tremor and monochromatic low-frequency events were not observed. No changes in ground deformation or fumarolic gas compositions were reported.
A Reuters news story noted that a geophysical experiment is planned at the end of June to obtain a tomographic image of the volcano. The report said that the experiment, a joint-venture of Swiss, French, and Italian scientists, includes a series of controlled explosions at 14 boreholes on the volcano's slopes and as far away as the Sorrento peninsula. The explosions will be monitored by a network of 250 seismic stations. In addition, a marine seismic prospecting survey will be carried out in the Bay of Naples to investigate the volcano's submarine flanks.
Geologic Background. One of the world's most noted volcanoes, Vesuvius (Vesuvio) forms a dramatic backdrop to the Bay of Naples. The active cone was constructed within a large caldera of the older Monte Somma edifice, thought to have formed incrementally beginning about 17,000 years ago. The Monte Somma caldera wall has channeled lava flows and pyroclastic flows primarily to the south and west. Eight major explosive eruptions have taken place in the last 17,000 years, often accompanied by large pyroclastic flows and surges, such as during the 79 CE Pompeii eruption. Intermittent eruptions since 79 CE were followed by a period of frequent long-term explosive and effusive eruptions between 1631 and 1944. The large 1631 eruption produced pyroclastic flows that reached as far as the coast and caused great destruction. Many towns are located on the flanks, and several million people live within areas that could be affected by eruptions.
Information Contacts: Lucia Civetta, Francesca Bianco, Giuseppe Vilardo, and Mario Castellano, Osservatorio Vesuviano, Via Manzoni 249, 80123 Napoli, Italy; Paul Holmes, Reuters News Service.