Recently Published Bulletin Reports
Erebus (Antarctica) Lava lake remains active; most thermal alerts recorded since 2019
Rincon de la Vieja (Costa Rica) Frequent phreatic explosions during July-December 2023
Bezymianny (Russia) Explosion on 18 October 2023 sends ash plume 8 km high; lava flows and incandescent avalanches
Kilauea (United States) Low-level lava effusions in the lava lake at Halema’uma’u during July-December 2022
Nyamulagira (DR Congo) Lava flows and thermal activity during May-October 2023
Bagana (Papua New Guinea) Explosions, ash plumes, ashfall, and lava flows during April-September 2023
Mayon (Philippines) Lava flows, pyroclastic flows, ash emissions, and seismicity during April-September 2023
Nishinoshima (Japan) Eruption plumes and gas-and-steam plumes during May-August 2023
Krakatau (Indonesia) White gas-and-steam plumes and occasional ash plumes during May-August 2023
Villarrica (Chile) Strombolian activity, gas-and-ash emissions, and crater incandescence during April-September 2023
Merapi (Indonesia) Frequent incandescent avalanches during April-September 2023
Ebeko (Russia) Moderate explosive activity with ash plumes continued during June-November 2023
Erebus (Antarctica) — January 2024  Cite this Report
Erebus
Antarctica
77.53°S, 167.17°E; summit elev. 3794 m
All times are local (unless otherwise noted)
Lava lake remains active; most thermal alerts recorded since 2019
The lava lake in the summit crater of Erebus has been active since at least 1972. Located in Antarctica overlooking the McMurdo Station on Ross Island, it is the southernmost active volcano on the planet. Because of the remote location, activity is primarily monitored by satellites. This report covers activity during 2023.
The number of thermal alerts recorded by the Hawai'i Institute of Geophysics and Planetology’s MODVOLC Thermal Alerts System increased considerably in 2023 compared to the years 2020-2022 (table 9). In contrast to previous years, the MODIS instruments aboard the Aqua and Terra satellites captured data from Erebus every month during 2023. Consistent with previous years, the lowest number of anomalous pixels were recorded in January, November, and December.
Table 9. Number of monthly MODIS-MODVOLC thermal alert pixels recorded at Erebus during 2017-2023. See BGVN 42:06 for data from 2000 through 2016. The table was compiled using data provided by the HIGP – MODVOLC Thermal Alerts System.
| Year |
Jan |
Feb |
Mar |
Apr |
May |
Jun |
Jul |
Aug |
Sep |
Oct |
Nov |
Dec |
SUM |
| 2017 |
0 |
21 |
9 |
0 |
0 |
1 |
11 |
61 |
76 |
52 |
0 |
3 |
234 |
| 2018 |
0 |
21 |
58 |
182 |
55 |
17 |
137 |
172 |
103 |
29 |
0 |
0 |
774 |
| 2019 |
2 |
21 |
162 |
151 |
55 |
56 |
75 |
53 |
29 |
19 |
1 |
0 |
624 |
| 2020 |
0 |
2 |
16 |
18 |
4 |
4 |
1 |
3 |
18 |
3 |
1 |
6 |
76 |
| 2021 |
0 |
9 |
1 |
0 |
2 |
56 |
46 |
47 |
35 |
52 |
5 |
3 |
256 |
| 2022 |
1 |
13 |
55 |
22 |
15 |
32 |
39 |
19 |
31 |
11 |
0 |
0 |
238 |
| 2023 |
2 |
33 |
49 |
82 |
41 |
32 |
70 |
64 |
42 |
17 |
5 |
11 |
448 |
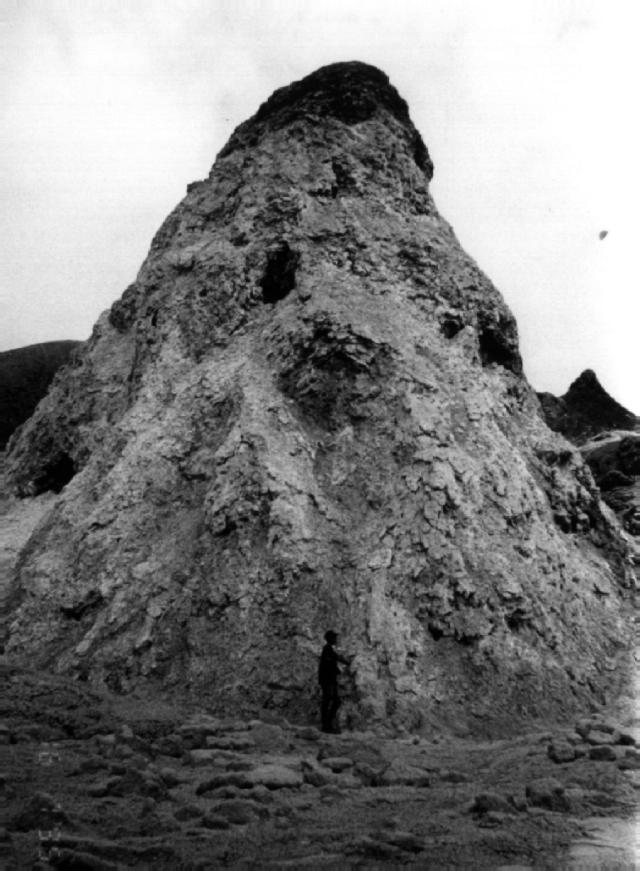
Sentinel-2 infrared images showed one or two prominent heat sources within the summit crater, accompanied by adjacent smaller sources, similar to recent years (see BGVN 46:01, 47:02, and 48:01). A unique image was obtained on 25 November 2023 by the OLI-2 (Operational Land Imager-2) on Landsat 9, showing the upper part of the volcano surrounded by clouds (figure 32).
Geologic Background. Mount Erebus, the world's southernmost historically active volcano, overlooks the McMurdo research station on Ross Island. It is the largest of three major volcanoes forming the crudely triangular Ross Island. The summit of the dominantly phonolitic volcano has been modified by one or two generations of caldera formation. A summit plateau at about 3,200 m elevation marks the rim of the youngest caldera, which formed during the late-Pleistocene and within which the modern cone was constructed. An elliptical 500 x 600 m wide, 110-m-deep crater truncates the summit and contains an active lava lake within a 250-m-wide, 100-m-deep inner crater; other lava lakes are sometimes present. The glacier-covered volcano was erupting when first sighted by Captain James Ross in 1841. Continuous lava-lake activity with minor explosions, punctuated by occasional larger Strombolian explosions that eject bombs onto the crater rim, has been documented since 1972, but has probably been occurring for much of the volcano's recent history.
Information Contacts: Hawai'i Institute of Geophysics and Planetology (HIGP) - MODVOLC Thermal Alerts System, School of Ocean and Earth Science and Technology (SOEST), Univ. of Hawai'i, 2525 Correa Road, Honolulu, HI 96822, USA (URL: http://modis.higp.hawaii.edu/); Copernicus Browser, Copernicus Data Space Ecosystem, European Space Agency (URL: https://dataspace.copernicus.eu/browser/); NASA Earth Observatory, EOS Project Science Office, NASA Goddard Space Flight Center, Goddard, Maryland, USA (URL: https://earthobservatory.nasa.gov/images/152134/erebus-breaks-through).
Rincon de la Vieja (Costa Rica) — January 2024 Cite this Report
Rincon de la Vieja
Costa Rica
10.83°N, 85.324°W; summit elev. 1916 m
All times are local (unless otherwise noted)
Frequent phreatic explosions during July-December 2023
Rincón de la Vieja is a volcanic complex in Costa Rica with a hot convecting acid lake that exhibits frequent weak phreatic explosions, gas-and-steam emissions, and occasional elevated sulfur dioxide levels (BGVN 45:10, 46:03, 46:11). The current eruption period began June 2021. This report covers activity during July-December 2023 and is based on weekly bulletins and occasional daily reports from the Observatorio Vulcanologico Sismologica de Costa Rica-Universidad Nacional (OVSICORI-UNA).
Numerous weak phreatic explosions continued during July-December 2023, along with gas-and-steam emissions and plumes that rose as high as 3 km above the crater rim. Many weekly OVSICORI-UNA bulletins included the previous week's number of explosions and emissions (table 9). For many explosions, the time of explosion was given (table 10). Frequent seismic activity (long-period earthquakes, volcano-tectonic earthquakes, and tremor) accompanied the phreatic activity.
Table 9. Number of reported weekly phreatic explosions and gas-and-steam emissions at Rincón de la Vieja, July-December 2023. Counts are reported for the week before the Weekly Bulletin date; not all reports included these data. Courtesy of OVSICORI-UNA.
| OVSICORI Weekly Bulletin |
Number of explosions |
Number of emissions |
| 28 Jul 2023 |
6 |
14 |
| 4 Aug 2023 |
10 |
12 |
| 1 Sep 2023 |
13 |
11 |
| 22 Sep 2023 |
12 |
13 |
| 29 Sep 2023 |
6 |
11 |
| 6 Oct 2023 |
12 |
5 |
| 13 Oct 2023 |
7 |
9 |
| 20 Oct 2023 |
1 |
15 |
| 27 Oct 2023 |
3 |
23 |
| 3 Nov 2023 |
3 |
10 |
| 17 Nov 2023 |
0 |
Some |
| 24 Nov 2023 |
0 |
14 |
| 8 Dec 2023 |
4 |
16 |
| 22 Dec 2023 |
8 |
18 |
Table 10. Summary of activity at Rincón de la Vieja during July-December 2023. Weak phreatic explosions and gas emissions are noted where the time of explosion was indicated in the weekly or daily bulletins. Height of plumes or emissions are distance above the crater rim. Courtesy of OVSICORI-UNA.
| Date |
Time |
Description of Activity |
| 1 Jul 2023 |
0156 |
Explosion. |
| 2 Jul 2023 |
0305 |
Explosion. |
| 4 Jul 2023 |
0229, 0635 |
Event at 0635 produced a gas-and-steam plume that rose 700 m and drifted W; seen by residents in Liberia (21 km SW). |
| 9 Jul 2023 |
1843 |
Explosion. |
| 21 Jul 2023 |
0705 |
Explosion. |
| 26 Jul 2023 |
1807 |
Explosion. |
| 28 Jul 2023 |
0802 |
Explosion generated a gas-and-steam plume that rose 500 m. |
| 30 Jul 2023 |
1250 |
Explosion. |
| 31 Jul 2023 |
2136 |
Explosion. |
| 11 Aug 2023 |
0828 |
Explosion. |
| 18 Aug 2023 |
1304 |
Explosion. |
| 21 Aug 2023 |
1224 |
Explosion generated gas-and-steam plumes rose 500-600 m. |
| 22 Aug 2023 |
0749 |
Explosion generated gas-and-steam plumes rose 500-600 m. |
| 24 Aug 2023 |
1900 |
Explosion. |
| 25 Aug 2023 |
0828 |
Event produced a steam-and-gas plume that rose 3 km and drifted NW. |
| 27-28 Aug 2023 |
0813 |
Four small events; the event at 0813 on 28 August lasted two minutes and generated a steam-and-gas plume that rose 2.5 km. |
| 1 Sep 2023 |
1526 |
Explosion generated plume that rose 2 km and ejected material onto the flanks. |
| 2-3 Sep 2023 |
- |
Small explosions detected in infrasound data. |
| 4 Sep 2023 |
1251 |
Gas-and-steam plume rose 1 km and drifted W. |
| 7 Nov 2023 |
1113 |
Explosion. |
| 8 Nov 2023 |
0722 |
Explosion. |
| 12 Nov 2023 |
0136 |
Small gas emissions. |
| 14 Nov 2023 |
0415 |
Small gas emissions. |
According to OVSICORI-UNA, during July-October the average weekly sulfur dioxide (SO2) flux ranged from 68 to 240 tonnes/day. However, in mid-November the flux increased to as high as 334 tonnes/day, the highest value measured in recent years. The high SO2 flux in mid-November was also detected by the TROPOMI instrument on the Sentinel-5P satellite (figure 43).
Geologic Background. Rincón de la Vieja, the largest volcano in NW Costa Rica, is a remote volcanic complex in the Guanacaste Range. The volcano consists of an elongated, arcuate NW-SE-trending ridge constructed within the 15-km-wide early Pleistocene Guachipelín caldera, whose rim is exposed on the south side. Sometimes known as the "Colossus of Guanacaste," it has an estimated volume of 130 km3 and contains at least nine major eruptive centers. Activity has migrated to the SE, where the youngest-looking craters are located. The twin cone of Santa María volcano, the highest peak of the complex, is located at the eastern end of a smaller, 5-km-wide caldera and has a 500-m-wide crater. A Plinian eruption producing the 0.25 km3 Río Blanca tephra about 3,500 years ago was the last major magmatic eruption. All subsequent eruptions, including numerous historical eruptions possibly dating back to the 16th century, have been from the prominent active crater containing a 500-m-wide acid lake located ENE of Von Seebach crater.
Information Contacts: Observatorio Vulcanológico Sismológica de Costa Rica-Universidad Nacional (OVSICORI-UNA), Apartado 86-3000, Heredia, Costa Rica (URL: http://www.ovsicori.una.ac.cr/); NASA Global Sulfur Dioxide Monitoring Page, Atmospheric Chemistry and Dynamics Laboratory, NASA Goddard Space Flight Center (NASA/GSFC), 8800 Greenbelt Road, Goddard MD 20771, USA (URL: https://so2.gsfc.nasa.gov/).
Bezymianny (Russia) — November 2023 Cite this Report
Bezymianny
Russia
55.972°N, 160.595°E; summit elev. 2882 m
All times are local (unless otherwise noted)
Explosion on 18 October 2023 sends ash plume 8 km high; lava flows and incandescent avalanches
Bezymianny, located on Russia’s Kamchatka Peninsula, has had eruptions since 1955 characterized by dome growth, explosions, pyroclastic flows, ash plumes, and ashfall. Activity during November 2022-April 2023 included gas-and-steam emissions, lava dome collapses generating avalanches, and persistent thermal activity. Similar eruptive activity continued from May through October 2023, described here based on information from weekly and daily reports of the Kamchatka Volcano Eruptions Response Team (KVERT), notices from Tokyo VAAC (Volcanic Ash Advisory Center), and from satellite data.
Overall activity decreased after the strong period of activity in late March through April 2023, which included ash explosions during 29 March and 7-8 April 2023 that sent plumes as high as 10-12 km altitude, along with dome growth and lava flows (BGVN 48:05). This reduced activity can be seen in the MIROVA thermal detection system graph (figure 56), which was consistent with data from the MODVOLC thermal detection system and with Sentinel-2 satellite images that showed persistent hotspots in the summit crater when conditions allowed observations. A renewed period of strong activity began in mid-October 2023.
Activity increased significantly on 17 October 2023 when large collapses began during 0700-0830 on the E flanks of the lava dome and continued to after 0930 the next day (figure 57). Ash plumes rose to an altitude of 4.5-5 km, extending 220 km NNE by 18 October. A large explosion at 1630 on 18 October produced an ash plume that rose to an altitude of 11 km (8 km above the summit) and drifted NNE and then NW, extending 900 km NW within two days at an altitude of 8 km. Minor ashfall was noted in Kozyrevsk (45 km WNW). At 0820 on 20 October an ash plume was identified in satellite images drifting 100 km ENE at altitudes of 4-4.5 km.
Lava flows and hot avalanches from the dome down the SE flank continued over the next few days, including 23 October when clear conditions allowed good observations (figures 58 and 59). A large thermal anomaly was observed over the volcano through 24 October, and in the summit crater on 30 October (figure 60). Strong fumarolic activity continued, with numerous avalanches and occasional incandescence. By the last week of October, volcanic activity had decreased to a level consistent with that earlier in the reporting period.
Aviation warnings were frequently updated during 17-20 October. KVERT issued a Volcano Observatory Notice for Aviation (VONA) on 17 October at 1419 and 1727 (0219 and 0527 UTC) raising the Aviation Color Code (ACC) from Yellow to Orange (second highest level). The next day, KVERT issued a VONA at 1705 (0505 UTC) raising the ACC to Red (highest level) but lowered it back to Orange at 2117 (0917 UTC). After another decrease to Yellow and back to Orange, the ACC was reduced to Yellow on 20 October at 1204 (0004 UTC). In addition, the Tokyo VAAC issued a series of Volcanic Ash Advisories beginning on 16 October and continuing through 30 October.
Geologic Background. The modern Bezymianny, much smaller than its massive neighbors Kamen and Kliuchevskoi on the Kamchatka Peninsula, was formed about 4,700 years ago over a late-Pleistocene lava-dome complex and an edifice built about 11,000-7,000 years ago. Three periods of intensified activity have occurred during the past 3,000 years. The latest period, which was preceded by a 1,000-year quiescence, began with the dramatic 1955-56 eruption. This eruption, similar to that of St. Helens in 1980, produced a large open crater that was formed by collapse of the summit and an associated lateral blast. Subsequent episodic but ongoing lava-dome growth, accompanied by intermittent explosive activity and pyroclastic flows, has largely filled the 1956 crater.
Information Contacts: Kamchatka Volcanic Eruptions Response Team (KVERT), Far Eastern Branch, Russian Academy of Sciences, 9 Piip Blvd., Petropavlovsk-Kamchatsky, 683006, Russia (URL: http://www.kscnet.ru/ivs/kvert/); Kamchatka Volcanological Station, Kamchatka Branch of Geophysical Survey, (KB GS RAS), Klyuchi, Kamchatka Krai, Russia (URL: http://volkstat.ru/); Tokyo Volcanic Ash Advisory Center (VAAC), 1-3-4 Otemachi, Chiyoda-ku, Tokyo 100-8122, Japan (URL: http://ds.data.jma.go.jp/svd/vaac/data/); Hawai'i Institute of Geophysics and Planetology (HIGP) - MODVOLC Thermal Alerts System, School of Ocean and Earth Science and Technology (SOEST), Univ. of Hawai'i, 2525 Correa Road, Honolulu, HI 96822, USA (URL: http://modis.higp.hawaii.edu/); MIROVA (Middle InfraRed Observation of Volcanic Activity), a collaborative project between the Universities of Turin and Florence (Italy) supported by the Centre for Volcanic Risk of the Italian Civil Protection Department (URL: http://www.mirovaweb.it/); Copernicus Browser, Copernicus Data Space Ecosystem, European Space Agency (URL: https://dataspace.copernicus.eu/browser/).chr
Kilauea (United States) — January 2023 Cite this Report
Kilauea
United States
19.421°N, 155.287°W; summit elev. 1222 m
All times are local (unless otherwise noted)
Low-level lava effusions in the lava lake at Halema’uma’u during July-December 2022
Kīlauea is the southeastern-most volcano in Hawaii and overlaps the E flank of the Mauna Loa volcano. Its East Rift Zone (ERZ) has been intermittently active for at least 2,000 years. An extended eruption period began in January 1983 and was characterized by open lava lakes and lava flows from the summit caldera and the East Rift Zone. During May 2018 magma migrated into the Lower East Rift Zone (LERZ) and opened 24 fissures along a 6-km-long NE-trending fracture zone that produced lava flows traveling in multiple directions. As lava emerged from the fissures, the lava lake at Halema'uma'u drained and explosions sent ash plumes to several kilometers altitude (BGVN 43:10).
The current eruption period started during September 2021 and has recently been characterized by lava effusions, spatter, and sulfur dioxide emissions in the active Halema’uma’u lava lake (BGVN 47:08). Lava effusions, some spatter, and sulfur dioxide emissions have continued during this reporting period of July through December 2022 using daily reports, volcanic activity notices, and abundant photo, map, and video data from the US Geological Survey's (USGS) Hawaiian Volcano Observatory (HVO).
Summary of activity during July-December 2022. Low-level effusions have continued at the western vent of the Halema’uma’u crater during July through early December 2022. Occasional weak ooze-outs (also called lava break outs) would occur along the margins of the crater floor. The overall level of the active lava lake throughout the reporting period gradually increased due to infilling, however it stagnated in mid-September (table 13). During September through November, activity began to decline, though lava effusions persisted at the western vent. By 9 December, the active part of the lava lake had completely crusted over, and incandescence was no longer visible.
Table 13. Summary of measurements taken during overflights at Kīlauea that show a gradual increase in the active lava lake level and the volume of lava effused since 29 September 2021. Lower activity was reported during September-October. Data collected during July-December 2022. Courtesy of HVO.
| Date: |
Level of the active lava lake (m): |
Cumulative volume of lava effused (million cubic meters): |
| 7 Jul 2022 |
130 |
95 |
| 19 Jul 2022 |
133 |
98 |
| 4 Aug 2022 |
136 |
102 |
| 16 Aug 2022 |
137 |
104 |
| 12 Sep 2022 |
143 |
111 |
| 5 Oct 2022 |
143 |
111 |
| 28 Oct 2022 |
143 |
111 |
Activity during July 2022. Lava effusions were reported from the western vent in the Halema’uma’u crater, along with occasional weak ooze-outs along the margins of the crater floor. The height of the lava lake was variable due to deflation-inflation tilt events; for example, the lake level dropped approximately 3-4 m during a summit deflation-inflation event reported on 1 July. Webcam images taken during the night of 6-12 July showed intermittent low-level spattering at the western vent that rose less than 10 m above the vent (figure 519). Measurements made during an overflight on 7 July indicated that the crater floor was infilled about 130 m and that 95 million cubic meters of lava had been effused since 29 September 2021. A single, relatively small lava ooze-out was active to the S of the lava lake. Around midnight on 8 July there were two brief periods of lava overflow onto the lake margins. On 9 July lava ooze-outs were reported near the SE and NE edges of the crater floor and during 10-11 July they occurred near the E, NE, and NW edges. On 16 July crater incandescence was reported, though the ooze-outs and spattering were not visible. On 18 July overnight webcam images showed incandescence in the western vent complex and two ooze-outs were reported around 0000 and 0200 on 19 July. By 0900 there were active ooze-outs along the SW edge of the crater floor. Measurements made from an overflight on 19 July indicated that the crater floor was infilled about 133 m and 98 million cubic meters of lava had erupted since 29 September 2021 (figure 520). On 20 July around 1600 active ooze-outs were visible along the N edge of the crater, which continued through the next day. Extensive ooze-outs occurred along the W margin during 24 July until 1900; on 26 July minor ooze-outs were noted along the N margin. Minor spattering was visible on 29 July along the E margin of the lake. The sulfur dioxide emission rates ranged 650-2,800 tons per day (t/d), the higher of which was measured on 8 July (figure 519).
Activity during August 2022. The eruption continued in the Halema’uma’u crater at the western vent. According to HVO the lava in the active lake remained at the level of the bounding levees. Occasional minor ooze-outs were observed along the margins of the crater floor. Strong nighttime crater incandescence was visible after midnight on 6 August over the western vent cone. During 6-7 August scattered small lava lobes were active along the crater floor and incandescence persisted above the western vent through 9 August. During 7-9 August HVO reported a single lava effusion source was active along the NW margin of the crater floor. Measurements from an overflight on 4 August indicated that the crater floor was infilled about 136 m total and that 102 million cubic meters of lava had been erupted since the start of the eruption. Lava breakouts were reported along the N, NE, E, S, and W margins of the crater during 10-16 August. Another overflight survey conducted on 16 August indicated that the crater floor infilled about 137 m and 104 million cubic meters of lava had been erupted since September 2021. Measured sulfur dioxide emissions rates ranged 1,150-2,450 t/d, the higher of which occurred on 8 August.
Activity during September 2022. During September, lava effusion continued from the western vent into the active lava lake and onto the crater floor. Intermittent minor ooze-outs were reported through the month. A small ooze-out was visible on the W crater floor margin at 0220 on 2 September, which showed decreasing surface activity throughout the day, but remained active through 3 September. On 3 September around 1900 a lava outbreak occurred along the NW margin of the crater floor but had stopped by the evening of 4 September. Field crews monitoring the summit lava lake on 9 September observed spattering on the NE margin of the lake that rose no higher than 10 m, before falling back onto the lava lake crust (figure 521). Overflight measurements on 12 September indicated that the crater floor was infilled a total of 143 m and 111 million cubic meters of lava had been erupted since September 2021. Extensive breakouts in the W and N part of the crater floor were reported at 1600 on 20 September and continued into 26 September. The active part of the lava lake dropped by 10 m while other parts of the crater floor dropped by several meters. Summit tiltmeters recorded a summit seismic swarm of more than 80 earthquakes during 1500-1800 on 21 September, which occurred about 1.5 km below Halema’uma’u; a majority of these were less than Mw 2. By 22 September the active part of the lava lake was infilled about 2 m. On 23 September the western vent areas exhibited several small spatter cones with incandescent openings, along with weak, sporadic spattering (figure 522). The sulfur dioxide emission rate ranged from 930 t/d to 2,000 t/d, the higher of which was measured on 6 September.
Activity during October 2022. Activity during October declined slightly compared to previous months, though lava effusions persisted from the western vent into the active lava lake and onto the crater floor during October (figure 523). Slight variations in the lava lake were noted throughout the month. HVO reported that around 0600 on 3 October the level of the lava lake has lowered slightly. Overflight measurements taken on 5 October indicated that the crater floor was infilled a total of about 143 m and that 111 million cubic meters of lava had been effused since September 2021. During 6-7 October the lake gradually rose 0.5 m. Sulfur dioxide measurements made on 22 October had an emission rate of 700 t/d. Another overflight taken on 28 October showed that there was little to no change in the elevation of the crater floor: the crater floor was infilled a total of 143 m and 111 million cubic meters of lava had erupted since the start of the eruption.
Activity during November 2022. Activity remained low during November, though HVO reported that lava from the western vent continued to effuse into the active lava lake and onto the crater floor throughout the month. The rate of sulfur dioxide emissions during November ranged from 300-600 t/d, the higher amount of which occurred on 9 November.
Activity during December 2022. Similar low activity was reported during December, with lava effusing from the western vent into the active lava lake and onto the crater floor. During 4-5 December the active part of the lava lake was slightly variable in elevation and fluctuated within 1 m. On 9 December HVO reported that lava was no longer erupting from the western vent in the Halema’uma’u crater and that sulfur dioxide emissions had returned to near pre-eruption background levels; during 10-11 December, the lava lake had completely crusted over, and no incandescence was visible (figure 524). Time lapse camera images covering the 4-10 December showed that the crater floor showed weak deflation and no inflation. Some passive events of crustal overturning were reported during 14-15 December, which brought fresh incandescent lava to the lake surface. The sulfur dioxide emission rate was approximately 200 t/d on 14 December. A smaller overturn event on 17 December and another that occurred around 0000 and into the morning of 20 December were also detected. A small seismic swarm was later detected on 30 December.
Geologic Background. Kilauea overlaps the E flank of the massive Mauna Loa shield volcano in the island of Hawaii. Eruptions are prominent in Polynesian legends; written documentation since 1820 records frequent summit and flank lava flow eruptions interspersed with periods of long-term lava lake activity at Halemaumau crater in the summit caldera until 1924. The 3 x 5 km caldera was formed in several stages about 1,500 years ago and during the 18th century; eruptions have also originated from the lengthy East and Southwest rift zones, which extend to the ocean in both directions. About 90% of the surface of the basaltic shield volcano is formed of lava flows less than about 1,100 years old; 70% of the surface is younger than 600 years. The long-term eruption from the East rift zone between 1983 and 2018 produced lava flows covering more than 100 km2, destroyed hundreds of houses, and added new coastline.
Information Contacts: Hawaiian Volcano Observatory (HVO), U.S. Geological Survey, PO Box 51, Hawai'i National Park, HI 96718, USA (URL: http://hvo.wr.usgs.gov/).
Nyamulagira (DR Congo) — November 2023 Cite this Report
Nyamulagira
DR Congo
1.408°S, 29.2°E; summit elev. 3058 m
All times are local (unless otherwise noted)
Lava flows and thermal activity during May-October 2023
Nyamulagira (also known as Nyamuragira) is a shield volcano in the Democratic Republic of Congo with the summit truncated by a small 2 x 2.3 km caldera with walls up to about 100 m high. Documented eruptions have occurred within the summit caldera, as well as from numerous flank fissures and cinder cones. The current eruption period began in April 2018 and has more recently been characterized by summit crater lava flows and thermal activity (BGVN 48:05). This report describes lava flows and variable thermal activity during May through October 2023, based on information from the Observatoire Volcanologique de Goma (OVG) and various satellite data.
Lava lake activity continued during May. The MIROVA (Middle InfraRed Observation of Volcanic Activity) system recorded moderate-to-strong thermal activity throughout the reporting period; activity was more intense during May and October and relatively weaker from June through September (figure 95). The MODVOLC thermal algorithm, detected a total of 209 thermal alerts. There were 143 hotspots detected during May, eight during June, nine during September, and 49 during October. This activity was also reflected in infrared satellite images, where a lava flow was visible in the NW part of the crater on 7 May and strong activity was seen in the center of the crater on 4 October (figure 96). Another infrared satellite image taken on 12 May showed still active lava flows along the NW margin of the crater. According to OVG lava effusions were active during 7-29 May and moved to the N and NW parts of the crater beginning on 9 May. Strong summit crater incandescence was visible from Goma (27 km S) during the nights of 17, 19, and 20 May (figure 97). On 17 May there was an increase in eruptive activity, which peaked at 0100 on 20 May. Notable sulfur dioxide plumes drifted NW and W during 19-20 May (figure 98). Drone footage acquired in partnership with the USGS (United States Geological Survey) on 20 May captured images of narrow lava flows that traveled about 100 m down the W flank (figure 99). Data from the Rumangabo seismic station indicated a decreasing trend in activity during 17-21 May. Although weather clouds prevented clear views of the summit, a strong thermal signature on the NW flank was visible in an infrared satellite image on 22 May, based on an infrared satellite image. On 28 May the lava flows on the upper W flank began to cool and solidify. By 29 May seismicity returned to levels similar to those recorded before the 17 May increase. Lava effusion continued but was confined to the summit crater; periodic crater incandescence was observed.
Low-level activity was noted during June through October. On 1 June OVG reported that seismicity remained at lower levels and that crater incandescence had been absent for three days, though infrared satellite imagery showed continued lava effusion in the summit crater. The lava flows on the flanks covered an estimated 0.6 km2. Satellite imagery continued to show thermal activity confined to the lava lake through October (figure 96), although no lava flows or significant sulfur dioxide emissions were reported.
Geologic Background. Africa's most active volcano, Nyamulagira (also known as Nyamuragira), is a massive high-potassium basaltic shield about 25 km N of Lake Kivu and 13 km NNW of the steep-sided Nyiragongo volcano. The summit is truncated by a small 2 x 2.3 km caldera that has walls up to about 100 m high. Documented eruptions have occurred within the summit caldera, as well as from the numerous flank fissures and cinder cones. A lava lake in the summit crater, active since at least 1921, drained in 1938, at the time of a major flank eruption. Recent lava flows extend down the flanks more than 30 km from the summit as far as Lake Kivu; extensive lava flows from this volcano have covered 1,500 km2 of the western branch of the East African Rift.
Information Contacts: Observatoire Volcanologique de Goma (OVG), Departement de Geophysique, Centre de Recherche en Sciences Naturelles, Lwiro, D.S. Bukavu, DR Congo; Hawai'i Institute of Geophysics and Planetology (HIGP) - MODVOLC Thermal Alerts System, School of Ocean and Earth Science and Technology (SOEST), Univ. of Hawai'i, 2525 Correa Road, Honolulu, HI 96822, USA (URL: http://modis.higp.hawaii.edu/); MIROVA (Middle InfraRed Observation of Volcanic Activity), a collaborative project between the Universities of Turin and Florence (Italy) supported by the Centre for Volcanic Risk of the Italian Civil Protection Department (URL: http://www.mirovaweb.it/); NASA Global Sulfur Dioxide Monitoring Page, Atmospheric Chemistry and Dynamics Laboratory, NASA Goddard Space Flight Center (NASA/GSFC), 8800 Greenbelt Road, Goddard, Maryland, USA (URL: https://so2.gsfc.nasa.gov/); Copernicus Browser, Copernicus Data Space Ecosystem, European Space Agency (URL: https://dataspace.copernicus.eu/browser/); Charles Balagizi, Goma Volcano Observatory, Departement de Geophysique, Centre de Recherche en Sciences Naturelles, Lwiro, D.S. Bukavu, DR Congo.
Bagana (Papua New Guinea) — October 2023 Cite this Report
Bagana
Papua New Guinea
6.137°S, 155.196°E; summit elev. 1855 m
All times are local (unless otherwise noted)
Explosions, ash plumes, ashfall, and lava flows during April-September 2023
The remote volcano of Bagana is located in central Bougainville Island, Papua New Guinea. Recorded eruptions date back to 1842 and activity has consisted of effusive activity that has built a small lava dome in the summit crater and occasional explosions that produced pyroclastic flows. The most recent eruption has been ongoing since February 2000 and has produced occasional explosions, ash plumes, and lava flows. More recently, activity has been characterized by ongoing effusive activity and ash emissions (BGVN 48:04). This report updates activity from April through September 2023 that has consisted of explosions, ash plumes, ashfall, and lava flows, using information from the Darwin Volcanic Ash Advisory Center (VAAC) and satellite data.
An explosive eruption was reported on 7 July that generated a large gas-and-ash plume to high altitudes and caused significant ashfall in local communities; the eruption plume had reached upper tropospheric (16-18 km altitude) altitudes by 2200, according to satellite images. Sulfur dioxide plumes were detected in satellite images on 8 July and indicated that the plume was likely a mixture of gas, ice, and ash. A report issued by the Autonomous Bougainville Government (ABG) (Torokina District, Education Section) on 10 July noted that significant ash began falling during 2000-2100 on 7 July and covered most areas in the Vuakovi, Gotana (9 km SW), Koromaketo, Laruma (25 km W) and Atsilima (27 km NW) villages. Pyroclastic flows also occurred, according to ground-based reports; small deposits confined to one drainage were inspected by RVO during an overflight on 17 July and were confirmed to be from the 7 July event. Ashfall continued until 10 July and covered vegetation, which destroyed bushes and gardens and contaminated rivers and streams.
RVO reported another eruption on 14 July. The Darwin VAAC stated that an explosive event started around 0830 on 15 July and produced an ash plume that rose to 16.5 km altitude by 1000 and drifted N, according to satellite images. The plume continued to drift N and remained visible through 1900, and by 2150 it had dissipated.
Ashfall likely from both the 7 and 15 July events impacted about 8,111 people in Torokina (20 km SW), including Tsito/Vuakovi, Gotana, Koromaketo, Kenaia, Longkogari, Kenbaki, Piva (13 km SW), and Atsinima, and in the Tsitovi district, according to ABG. Significant ashfall was also reported in Ruruvu (22 km N) in the Wakunai District of Central Bougainville, though the thickness of these deposits could not be confirmed. An evacuation was called for the villages in Wakunai, where heavy ashfall had contaminated water sources; the communities of Ruruvu, Togarau, Kakarapaia, Karauturi, Atao, and Kuritaturi were asked to evacuate to a disaster center at the Wakunai District Station, and communities in Torokina were asked to evacuate to the Piva District station. According to a news article, more than 7,000 people needed temporary accommodations, with about 1,000 people in evacuation shelters. Ashfall had deposited over a broad area, contaminating water supplies, affecting crops, and collapsing some roofs and houses in rural areas. Schools were temporarily shut down. Intermittent ash emissions continued through the end of July and drifted NNW, NW, and SW. Fine ashfall was reported on the coast of Torokina, and ash plumes also drifted toward Laruma and Atsilima.
A small explosive eruption occurred at 2130 on 28 July that ejected material from the crater vents, according to reports from Torokina, in addition to a lava flow that contained two lobes. A second explosion was detected at 2157. Incandescence from the lava flow was visible from Piva as it descended the W flank around 2000 on 29 July (figure 47). The Darwin VAAC reported that a strong thermal anomaly was visible in satellite images during 30-31 July and that ash emissions rose to 2.4 km altitude and drifted WSW on 30 July. A ground report from RVO described localized emissions at 0900 on 31 July.
The Darwin VAAC reported that ash plumes were identified in satellite imagery at 0800 and 1220 on 12 August and rose to 2.1 km and 3 km altitude and drifted NW and W, respectively. A news report stated that aid was sent to more than 6,300 people that were adversely affected by the eruption. Photos taken during 17-19 August showed ash emissions rising no higher than 1 km above the summit and drifting SE. A small explosion generated an ash plume during the morning of 19 August. Deposits from small pyroclastic flows were also captured in the photos. Satellite images captured lava flows and pyroclastic flow deposits. Two temporary seismic stations were installed near Bagana on 17 August at distances of 7 km WSW (Vakovi station) and 11 km SW (Kepox station). The Kepox station immediately started to record continuous, low-frequency background seismicity.
Satellite data. Little to no thermal activity was detected during April through mid-July 2023; only one anomaly was recorded during early April and one during early June, according to MIROVA (Middle InfraRed Observation of Volcanic Activity) data (figure 48). Thermal activity increased in both power and frequency during mid-July through September, although there were still some short gaps in detected activity. MODVOLC also detected increased thermal activity during August; thermal hotspots were detected a total of five times on 19, 20, and 27 August. Weak thermal anomalies were also captured in infrared satellite images on clear weather days throughout the reporting period on 7, 12, and 17 April, 27 May, 1, 6, 16, and 31 July, and 19 September (figure 48); a strong thermal anomaly was visible on 31 July. Distinct sulfur dioxide plumes that drifted generally NW were intermittently captured by the TROPOMI instrument on the Sentinel-5P satellite and sometimes exceeded two Dobson Units (DUs) (figure 49).
Geologic Background. Bagana volcano, in a remote portion of central Bougainville Island, is frequently active. This massive symmetrical cone was largely constructed by an accumulation of viscous andesitic lava flows. The entire edifice could have been constructed in about 300 years at its present rate of lava production. Eruptive activity is characterized by non-explosive effusion of viscous lava that maintains a small lava dome in the summit crater, although occasional explosive activity produces pyroclastic flows. Lava flows with tongue-shaped lobes up to 50 m thick and prominent levees descend the flanks on all sides.
Information Contacts: Rabaul Volcano Observatory (RVO), Geohazards Management Division, Department of Mineral Policy and Geohazards Management (DMPGM), PO Box 3386, Kokopo, East New Britain Province, Papua New Guinea; Darwin Volcanic Ash Advisory Centre (VAAC), Bureau of Meteorology, Northern Territory Regional Office, PO Box 40050, Casuarina, NT 0811, Australia (URL: http://www.bom.gov.au/info/vaac/); MIROVA (Middle InfraRed Observation of Volcanic Activity), a collaborative project between the Universities of Turin and Florence (Italy) supported by the Centre for Volcanic Risk of the Italian Civil Protection Department (URL: http://www.mirovaweb.it/); Hawai'i Institute of Geophysics and Planetology (HIGP) - MODVOLC Thermal Alerts System, School of Ocean and Earth Science and Technology (SOEST), Univ. of Hawai'i, 2525 Correa Road, Honolulu, HI 96822, USA (URL: http://modis.higp.hawaii.edu/); NASA Global Sulfur Dioxide Monitoring Page, Atmospheric Chemistry and Dynamics Laboratory, NASA Goddard Space Flight Center (NASA/GSFC), 8800 Greenbelt Road, Goddard, Maryland, USA (URL: https://so2.gsfc.nasa.gov/); Copernicus Browser, Copernicus Data Space Ecosystem, European Space Agency (URL: https://dataspace.copernicus.eu/browser/); Autonomous Bougainville Government, P.O Box 322, Buka, AROB, PNG (URL: https://abg.gov.pg/); Andrew Tupper (Twitter: @andrewcraigtupp); Simon Carn, Geological and Mining Engineering and Sciences, Michigan Technological University, 1400 Townsend Drive, Houghton, MI 49931, USA (URL: http://www.volcarno.com/, Twitter: @simoncarn); Radio NZ (URL: https://www.rnz.co.nz/news/pacific/494464/more-than-7-000-people-in-bougainville-need-temporary-accommodation-after-eruption); USAID, 1300 Pennsylvania Ave, NW, Washington DC 20004, USA (URL: https://www.usaid.gov/pacific-islands/press-releases/aug-08-2023-united-states-provides-immediate-emergency-assistance-support-communities-affected-mount-bagana-volcanic-eruptions).
Mayon (Philippines) — October 2023 Cite this Report
Mayon
Philippines
13.257°N, 123.685°E; summit elev. 2462 m
All times are local (unless otherwise noted)
Lava flows, pyroclastic flows, ash emissions, and seismicity during April-September 2023
Mayon is located in the Philippines and has steep upper slopes capped by a small summit crater. Historical eruptions date back to 1616 CE that have been characterized by Strombolian eruptions, lava flows, pyroclastic flows, and mudflows. Eruptions mostly originated from a central conduit. Pyroclastic flows and mudflows have commonly descended many of the approximately 40 drainages that surround the volcano. The most recent eruption occurred during June through October 2022 and consisted of lava dome growth and gas-and-steam emissions (BGVN 47:12). A new eruption was reported during late April 2023 and has included lava flows, pyroclastic density currents, ash emissions, and seismicity. This report covers activity during April through September 2023 based on daily bulletins from the Philippine Institute of Volcanology and Seismology (PHIVOLCS).
During April through September 2023, PHIVOLCS reported near-daily rockfall events, frequent volcanic earthquakes, and sulfur dioxide measurements. Gas-and-steam emissions rose 100-900 m above the crater and drifted in different directions. Nighttime crater incandescence was often visible during clear weather and was accompanied by incandescent avalanches of material. Activity notably increased during June when lava flows were reported on the S, SE, and E flanks (figure 52). The MIROVA graph (Middle InfraRed Observation of Volcanic Activity) showed strong thermal activity coincident with these lava flows, which remained active through September (figure 53). According to the MODVOLC thermal algorithm, a total of 110 thermal alerts were detected during the reporting period: 17 during June, 40 during July, 27 during August, and 26 during September. During early June, pyroclastic density currents (PDCs) started to occur more frequently.
Low activity was reported during much of April and May; gas-and-steam emissions rose 100-900 m above the crater and generally drifted in different directions. A total of 52 rockfall events and 18 volcanic earthquakes were detected during April and 147 rockfall events and 13 volcanic events during May. Sulfur dioxide flux measurements ranged between 400-576 tons per day (t/d) during April, the latter of which was measured on 29 April and between 162-343 t/d during May, the latter of which was measured on 13 May.
Activity during June increased, characterized by lava flows, pyroclastic density currents (PDCs), crater incandescence and incandescent rockfall events, gas-and-steam emissions, and continued seismicity. Weather clouds often prevented clear views of the summit, but during clear days, moderate gas-and-steam emissions rose 100-2,500 m above the crater and drifted in multiple directions. A total of 6,237 rockfall events and 288 volcanic earthquakes were detected. The rockfall events often deposited material on the S and SE flanks within 700-1,500 m of the summit crater and ash from the events drifted SW, S, SE, NE, and E. Sulfur dioxide emissions ranged between 149-1,205 t/d, the latter of which was measured on 10 June. Short-term observations from EDM and electronic tiltmeter monitoring indicated that the upper slopes were inflating since February 2023. Longer-term ground deformation parameters based on EDM, precise leveling, continuous GPS, and electronic tilt monitoring indicated that the volcano remained inflated, especially on the NW and SE flanks. At 1000 on 5 June the Volcano Alert Level (VAL) was raised to 2 (on a 0-5 scale). PHIVOLCS noted that although low-level volcanic earthquakes, ground deformation, and volcanic gas emissions indicated unrest, the steep increase in rockfall frequency may indicate increased dome activity.
A total of 151 dome-collapse PDCs occurred during 8-9 and 11-30 June, traveled 500-2,000 m, and deposited material on the S flank within 2 km of the summit crater. During 8-9 June the VAL was raised to 3. At approximately 1947 on 11 June lava flow activity was reported; two lobes traveled within 500 m from the crater and deposited material on the S (Mi-isi), SE (Bonga), and E (Basud) flanks. Weak seismicity accompanied the lava flow and slight inflation on the upper flanks. This lava flow remained active through 30 June, moving down the S and SE flank as far as 2.5 km and 1.8 km, respectively and depositing material up to 3.3 km from the crater. During 15-16 June traces of ashfall from the PDCs were reported in Sitio Buga, Nabonton, City of Ligao and Purok, and San Francisco, Municipality of Guinobatan. During 28-29 June there were two PDCs generated by the collapse of the lava flow front, which generated a light-brown ash plume 1 km high. Satellite monitors detected significant concentrations of sulfur dioxide beginning on 29 June. On 30 June PDCs primarily affected the Basud Gully on the E flank, the largest of which occurred at 1301 and lasted eight minutes, based on the seismic record. Four PDCs generated between 1800 and 2000 that lasted approximately four minutes each traveled 3-4 km on the E flank and generated an ash plume that rose 1 km above the crater and drifted N and NW. Ashfall was recorded in Tabaco City.
Similar strong activity continued during July; slow lava effusion remained active on the S and SE flanks and traveled as far as 2.8 km and 2.8 km, respectively and material was deposited as far as 4 km from the crater. There was a total of 6,983 rockfall events and 189 PDCs that affected the S, SE, and E flanks. The volcano network detected a total of 2,124 volcanic earthquakes. Continuous gas-and-steam emissions rose 200-2,000 m above the crater and drifted in multiple directions. Sulfur dioxide emissions averaged 792-4,113 t/d, the latter of which was measured on 28 July. During 2-4 July three PDCs were generated from the collapse of the lava flow and resulting light brown plumes rose 200-300 m above the crater. Continuous tremor pulses were reported beginning at 1547 on 3 July through 7 July at 1200, at 2300 on 8 July and going through 0300 on 10 July, and at 2300 on 16 July, as recorded by the seismic network. During 6-9 July there were 10 lava flow-collapse-related PDCs that generated light brown plumes 300-500 m above the crater. During 10-11 July light ashfall was reported in some areas of Mabinit, Legazpi City, Budiao and Salvacion, Daraga, and Camalig, Albay. By 18 July the lava flow advanced 600 m on the E flank as well.
During 1733 on 18 July and 0434 on 19 July PHIVOLCS reported 30 “ashing” events, which are degassing events accompanied by audible thunder-like sounds and entrained ash at the crater, which produced short, dark plumes that drifted SW. These events each lasted 20-40 seconds, and plume heights ranged from 150-300 m above the crater, as recorded by seismic, infrasound, visual, and thermal monitors. Three more ashing events occurred during 19-20 July. Short-term observations from electronic tilt and GPS monitoring indicate deflation on the E lower flanks in early July and inflation on the NW middle flanks during the third week of July. Longer-term ground deformation parameters from EDM, precise leveling, continuous GPS, and electronic tilt monitoring indicated that the volcano was still generally inflated relative to baseline levels. A short-lived lava pulse lasted 28 seconds at 1956 on 21 July, which was accompanied by seismic and infrasound signals. By 22 July, the only lava flow that remained active was on the SE flank, and continued to extend 3.4 km, while those on the S and E flanks weakened markedly. One ashing event was detected during 30-31 July, whereas there were 57 detected during 31 July-1 August; according to PHIVOLCS beginning at approximately 1800 on 31 July eruptive activity was dominated by phases of intermittent ashing, as well as increased in the apparent rates of lava effusion from the summit crater. The ashing phases consisted of discrete events recorded as low-frequency volcanic earthquakes (LFVQ) typically 30 seconds in duration, based on seismic and infrasound signals. Gray ash plume rose 100 m above the crater and generally drifted NE. Shortly after these ashing events began, new lava began to effuse rapidly from the crater, feeding the established flowed on the SE, E, and E flanks and generating frequent rockfall events.
Intensified unrest persisted during August. There was a total of 4,141 rockfall events, 2,881 volcanic earthquakes, which included volcanic tremor events, 32 ashing events, and 101 PDCs detected throughout the month. On clear weather days, gas-and-steam emissions rose 300-1,500 m above the crater and drifted in different directions (figure 54). Sulfur dioxide emissions averaged 735-4,756 t/d, the higher value of which was measured on 16 August. During 1-2 August the rate of lava effusion decreased, but continued to feed the flows on the SE, S, and E flanks, maintaining their advances to 3.4 km, 2.8 km, and 1.1 km from the crater, respectively (figure 55). Rockfall and PDCs generated by collapses at the lava flow margins and from the summit dome deposited material within 4 km of the crater. During 3-4 August there were 10 tremor events detected that lasted 1-4 minutes. Short-lived lava pulse lasted 35 seconds and was accompanied by seismic and infrasound signals at 0442 on 6 August. Seven collapses were recorded at the front of the lava flow during 12-14 August.
During September, similar activity of slow lava effusion, PDCs, gas-and-steam emissions, and seismicity continued. There was a total of 4,452 rockfall events, 329 volcanic earthquakes, which included volcanic tremor events, two ashing events, and 85 PDCs recorded throughout the month. On clear weather days, gas-and-steam emissions rose 100-1,500 m above the crater and drifted in multiple directions. Sulfur dioxide emissions averaged 609-2,252 t/d, the higher average of which was measured on 6 September. Slow lava effusion continued advancing on the SE, S, and E flanks, maintaining lengths of 3.4 km, 2.8 km, and 1.1 km, respectively. Rockfall and PDC events generated by collapses along the lava flow margins and at the summit dome deposited material within 4 km of the crater.
Geologic Background. Symmetrical Mayon, which rises above the Albay Gulf NW of Legazpi City, is the most active volcano of the Philippines. The steep upper slopes are capped by a small summit crater. Recorded eruptions since 1616 CE range from Strombolian to basaltic Plinian, with cyclical activity beginning with basaltic eruptions, followed by longer periods of andesitic lava flows. Eruptions occur predominately from the central conduit and have also produced lava flows that travel far down the flanks. Pyroclastic density currents and mudflows have commonly swept down many of the approximately 40 ravines that radiate from the summit and have often damaged populated lowland areas. A violent eruption in 1814 killed more than 1,200 people and devastated several towns.
Information Contacts: Philippine Institute of Volcanology and Seismology (PHIVOLCS), Department of Science and Technology, University of the Philippines Campus, Diliman, Quezon City, Philippines (URL: http://www.phivolcs.dost.gov.ph/); MIROVA (Middle InfraRed Observation of Volcanic Activity), a collaborative project between the Universities of Turin and Florence (Italy) supported by the Centre for Volcanic Risk of the Italian Civil Protection Department (URL: http://www.mirovaweb.it/); Hawai'i Institute of Geophysics and Planetology (HIGP) - MODVOLC Thermal Alerts System, School of Ocean and Earth Science and Technology (SOEST), Univ. of Hawai'i, 2525 Correa Road, Honolulu, HI 96822, USA (URL: http://modis.higp.hawaii.edu/); Copernicus Browser, Copernicus Data Space Ecosystem, European Space Agency (URL: https://dataspace.copernicus.eu/browser/); William Rogers, Legazpi City, Albay Province, Philippines.
Nishinoshima (Japan) — October 2023 Cite this Report
Nishinoshima
Japan
27.247°N, 140.874°E; summit elev. 100 m
All times are local (unless otherwise noted)
Eruption plumes and gas-and-steam plumes during May-August 2023
Nishinoshima, located about 1,000 km S of Tokyo, is a small island in the Ogasawara Arc in Japan. The island is the summit of a massive submarine volcano that has prominent submarine peaks to the S, W, and NE. Eruptions date back to 1973 and the current eruption period began in October 2022. Recent activity has consisted of small ash plumes and fumarolic activity (BGVN 48:07). This report covers activity during May through August 2023, using information from monthly reports of the Japan Meteorological Agency (JMA) monthly reports and satellite data.
Activity during May through June was relatively low. The Japan Coast Guard (JCG) did overflights on 14 and 22 June and reported white gas-and-steam emissions rising 600 m and 1,200 m from the central crater of the pyroclastic cone, respectively (figure 125). In addition, multiple white gas-and-steam emissions rose from the inner rim of the W side of the crater and from the SE flank of the pyroclastic cone. Discolored brown-to-green water was observed around almost the entire perimeter of the island; on 22 June light green discolored water was observed off the S coast of the island.
Observations from the Himawari meteorological satellite confirmed an eruption on 9 and 10 July. An eruption plume rose 1.6 km above the crater and drifted N around 1300 on 9 July. Satellite images acquired at 1420 and 2020 on 9 July and at 0220 on 10 July showed continuing emissions that rose 1.3-1.6 km above the crater and drifted NE and N. The Tokyo VAAC reported that an ash plume seen by a pilot and identified in a satellite image at 0630 on 21 July rose to 3 km altitude and drifted S.
Aerial observations conducted by JCG on 8 August showed a white-and-gray plume rising from the central crater of the pyroclastic cone, and multiple white gas-and-steam emissions were rising from the inner edge of the western crater and along the NW-SE flanks of the island (figure 126). Brown-to-green discolored water was also noted around the perimeter of the island.
Intermittent low-to-moderate power thermal anomalies were recorded in the MIROVA graph (Middle InfraRed Observation of Volcanic Activity), showing an increase in both frequency and power beginning in July (figure 127). This increase in activity coincides with eruptive activity on 9 and 10 July, characterized by eruption plumes. According to the MODVOLC thermal alert algorithm, one thermal hotspot was recorded on 20 July. Weak thermal anomalies were also detected in infrared satellite imagery, accompanied by strong gas-and-steam plumes (figure 128).
Geologic Background. The small island of Nishinoshima was enlarged when several new islands coalesced during an eruption in 1973-74. Multiple eruptions that began in 2013 completely covered the previous exposed surface and continued to enlarge the island. The island is the summit of a massive submarine volcano that has prominent peaks to the S, W, and NE. The summit of the southern cone rises to within 214 m of the ocean surface 9 km SSE.
Information Contacts: Japan Meteorological Agency (JMA), 1-3-4 Otemachi, Chiyoda-ku, Tokyo 100-8122, Japan (URL: http://www.jma.go.jp/jma/indexe.html); Tokyo Volcanic Ash Advisory Center (VAAC), 1-3-4 Otemachi, Chiyoda-ku, Tokyo 100-8122, Japan (URL: http://ds.data.jma.go.jp/svd/vaac/data/); MIROVA (Middle InfraRed Observation of Volcanic Activity), a collaborative project between the Universities of Turin and Florence (Italy) supported by the Centre for Volcanic Risk of the Italian Civil Protection Department (URL: http://www.mirovaweb.it/); Copernicus Browser, Copernicus Data Space Ecosystem, European Space Agency (URL: https://dataspace.copernicus.eu/browser/).
Krakatau (Indonesia) — October 2023 Cite this Report
Krakatau
Indonesia
6.1009°S, 105.4233°E; summit elev. 285 m
All times are local (unless otherwise noted)
White gas-and-steam plumes and occasional ash plumes during May-August 2023
Krakatau is located in the Sunda Strait between Java and Sumatra, Indonesia. Caldera collapse during the catastrophic 1883 eruption destroyed Danan and Perbuwatan cones and left only a remnant of Rakata. The post-collapse cone of Anak Krakatau (Child of Krakatau) was constructed within the 1883 caldera at a point between the former Danan and Perbuwatan cones; it has been the site of frequent eruptions since 1927. The current eruption period began in May 2021 and has recently consisted of Strombolian eruptions and ash plumes (BGVN 48:07). This report describes lower levels of activity consisting of ash and white gas-and-steam plumes during May through August 2023, based on information provided by the Indonesian Center for Volcanology and Geological Hazard Mitigation, referred to as Pusat Vulkanologi dan Mitigasi Bencana Geologi (PVMBG), MAGMA Indonesia, and satellite data.
Activity was relatively low during May and June. Daily white gas-and-steam emissions rose 25-200 m above the crater and drifted in different directions. Five ash plumes were detected at 0519 on 10 May, 1241 on 11 May, 0920 on 12 May, 2320 on 12 May, and at 0710 on 13 May, and rose 1-2.5 km above the crater and drifted SW. A webcam image taken on 12 May showed ejection of incandescent material above the vent. A total of nine ash plumes were detected during 6-11 June: at 1434 and 00220 on 6 and 7 June the ash plumes rose 500 m above the crater and drifted NW, at 1537 on 8 June the ash plume rose 1 km above the crater and drifted SW, at 0746 and at 0846 on 9 June the ash plumes rose 800 m and 3 km above the crater and drifted SW, respectively, at 0423, 1431, and 1750 on 10 June the ash plumes rose 2 km, 1.5 km, and 3.5 km above the crater and drifted NW, respectively, and at 0030 on 11 June an ash plume rose 2 km above the crater and drifted NW. Webcam images taken on 10 and 11 June at 0455 and 0102, respectively, showed incandescent material ejected above the vent. On 19 June an ash plume at 0822 rose 1.5 km above the crater and drifted SE.
Similar low activity of white gas-and-steam emissions and few ash plumes were reported during July and August. Daily white gas-and-steam emissions rose 25-300 m above the crater and drifted in multiple directions. Three ash plumes were reported at 0843, 0851, and 0852 on 20 July that rose 500-2,000 m above the crater and drifted NW.
The MIROVA (Middle InfraRed Observation of Volcanic Activity) graph of MODIS thermal anomaly data showed intermittent low-to-moderate power thermal anomalies during May through August 2023 (figure 140). Although activity was often obscured by weather clouds, a thermal anomaly was visible in an infrared satellite image of the crater on 12 May, accompanied by an eruption plume that drifted SW (figure 141).
Geologic Background. The renowned Krakatau (frequently mis-named as Krakatoa) volcano lies in the Sunda Strait between Java and Sumatra. Collapse of an older edifice, perhaps in 416 or 535 CE, formed a 7-km-wide caldera. Remnants of that volcano are preserved in Verlaten and Lang Islands; subsequently the Rakata, Danan, and Perbuwatan cones were formed, coalescing to create the pre-1883 Krakatau Island. Caldera collapse during the catastrophic 1883 eruption destroyed Danan and Perbuwatan, and left only a remnant of Rakata. This eruption caused more than 36,000 fatalities, most as a result of tsunamis that swept the adjacent coastlines of Sumatra and Java. Pyroclastic surges traveled 40 km across the Sunda Strait and reached the Sumatra coast. After a quiescence of less than a half century, the post-collapse cone of Anak Krakatau (Child of Krakatau) was constructed within the 1883 caldera at a point between the former Danan and Perbuwatan cones. Anak Krakatau has been the site of frequent eruptions since 1927.
Information Contacts: Pusat Vulkanologi dan Mitigasi Bencana Geologi (PVMBG, also known as Indonesian Center for Volcanology and Geological Hazard Mitigation, CVGHM), Jalan Diponegoro 57, Bandung 40122, Indonesia (URL: http://www.vsi.esdm.go.id/); MAGMA Indonesia, Kementerian Energi dan Sumber Daya Mineral (URL: https://magma.esdm.go.id/v1); MIROVA (Middle InfraRed Observation of Volcanic Activity), a collaborative project between the Universities of Turin and Florence (Italy) supported by the Centre for Volcanic Risk of the Italian Civil Protection Department (URL: http://www.mirovaweb.it/); Copernicus Browser, Copernicus Data Space Ecosystem, European Space Agency (URL: https://dataspace.copernicus.eu/browser/).
Villarrica (Chile) — October 2023 Cite this Report
Villarrica
Chile
39.42°S, 71.93°W; summit elev. 2847 m
All times are local (unless otherwise noted)
Strombolian activity, gas-and-ash emissions, and crater incandescence during April-September 2023
Villarrica, in central Chile, consists of a 2-km-wide caldera that formed about 3,500 years ago and is located at the base of the presently active cone at the NW margin of a 6-km-wide caldera. Historical eruptions eruptions date back to 1558 and have been characterized by mild-to-moderate explosive activity with occasional lava effusions. The current eruption period began in December 2014 and has recently consisted of nighttime crater incandescence, ash emissions, and seismicity (BGVN 48:04). This report covers activity during April through September 2023 and describes occasional Strombolian activity, gas-and-ash emissions, and nighttime crater incandescence. Information for this report primarily comes from the Southern Andes Volcano Observatory (Observatorio Volcanológico de Los Andes del Sur, OVDAS), part of Chile's National Service of Geology and Mining (Servicio Nacional de Geología y Minería, SERNAGEOMIN) and satellite data.
Seismicity during April consisted of long period (LP) events and tremor (TRE); a total of 9,413 LP-type events and 759 TR-type events were detected throughout the month. Nighttime crater incandescence persisted and was visible in the degassing column. Sulfur dioxide data was obtained using Differential Absorption Optical Spectroscopy Equipment (DOAS) that showed an average value of 1,450 ± 198 tons per day (t/d) during 1-15 April and 1,129 ± 201 t/d during 16-30 April, with a maximum daily value of 2,784 t/d on 9 April. Gas-and-steam emissions of variable intensities rose above the active crater as high as 1.3 km above the crater on 13 April. Strombolian explosions were not observed and there was a slight decrease in the lava lake level.
There were 14,123 LP-type events and 727 TR-type events detected during May. According to sulfur dioxide measurements taken with DOAS equipment, the active crater emitted an average value of 1,826 ± 482 t/d during 1-15 May and 912 ± 41 t/d during 16-30 May, with a daily maximum value of 5,155 t/d on 13 May. Surveillance cameras showed continuous white gas-and-steam emissions that rose as high as 430 m above the crater on 27 May. Nighttime incandescence illuminated the gas column less than 300 m above the crater rim was and no pyroclastic emissions were reported. A landslide was identified on 13 May on the E flank of the volcano 50 m from the crater rim and extending 300 m away; SERNAGEOMIN noted that this event may have occurred on 12 May. During the morning of 27 and 28 May minor Strombolian explosions characterized by incandescent ejecta were recorded at the crater rim; the last reported Strombolian explosions had occurred at the end of March.
Seismic activity during June consisted of five volcano-tectonic (VT)-type events, 21,606 LP-type events, and 2,085 TR-type events. The average value of sulfur dioxide flux obtained by DOAS equipment was 1,420 ± 217 t/d during 1-15 June and 2,562 ± 804 t/d, with a maximum daily value of 4,810 t/d on 17 June. White gas-and-steam emissions rose less than 480 m above the crater; frequent nighttime crater incandescence was reflected in the degassing plume. On 12 June an emission rose 100 m above the crater and drifted NNW. On 15 June one or several emissions resulted in ashfall to the NE as far as 5.5 km from the crater, based on a Skysat satellite image. Several Strombolian explosions occurred within the crater; activity on 15 June was higher energy and ejected blocks 200-300 m on the NE slope. Surveillance cameras showed white gas-and-steam emissions rising 480 m above the crater on 16 June. On 19 and 24 June low-intensity Strombolian activity was observed, ejecting material as far as 200 m from the center of the crater to the E.
During July, seismicity included 29,319 LP-type events, 3,736 TR-type events, and two VT-type events. DOAS equipment recorded two days of sulfur dioxide emissions of 4,220 t/d and 1,009 t/d on 1 and 13 July, respectively. Constant nighttime incandescence was also recorded and was particularly noticeable when accompanied by eruptive columns on 12 and 16 July. Minor explosive events were detected in the crater. According to Skysat satellite images taken on 12, 13, and 16 July, ashfall deposits were identified 155 m S of the crater. According to POVI, incandescence was visible from two vents on the crater floor around 0336 on 12 July. Gas-and-ash emissions rose as high as 1.2 km above the crater on 13 July and drifted E and NW. A series of gas-and-steam pulses containing some ash deposited material on the upper E flank around 1551 on 13 July. During 16-31 July, average sulfur dioxide emissions of 1,679 ± 406 t/d were recorded, with a maximum daily value of 2,343 t/d on 28 July. Fine ash emissions were also reported on 16, 17, and 23 July.
Seismicity persisted during August, characterized by 27,011 LP-type events, 3,323 TR-type events, and three VT-type events. The average value of sulfur dioxide measurements taken during 1-15 August was 1,642 ± 270 t/d and 2,207 ± 4,549 t/d during 16-31 August, with a maximum daily value of 3,294 t/d on 27 August. Nighttime crater incandescence remained visible in degassing columns. White gas-and-steam emissions rose 480 m above the crater on 6 August. According to a Skysat satellite image from 6 August, ash accumulation was observed proximal to the crater and was mainly distributed toward the E slope. White gas-and-steam emissions rose 320 m above the crater on 26 August. Nighttime incandescence and Strombolian activity that generated ash emissions were reported on 27 August.
Seismicity during September was characterized by five VT-type events, 12,057 LP-type events, and 2,058 TR-type events. Nighttime incandescence persisted. On 2 September an ash emission rose 180 m above the crater and drifted SE at 1643 (figure 125) and a white gas-and-steam plume rose 320 m above the crater. According to the Buenos Aires VAAC, periods of continuous gas-and-ash emissions were visible in webcam images from 1830 on 2 September to 0110 on 3 September. Strombolian activity was observed on 2 September and during the early morning of 3 September, the latter event of which generated an ash emission that rose 60 m above the crater and drifted 100 m from the center of the crater to the NE and SW. Ashfall was reported to the SE and S as far as 750 m from the crater. The lava lake was active during 3-4 September and lava fountaining was visible for the first time since 26 March 2023, according to POVI. Fountains captured in webcam images at 2133 on 3 September and at 0054 on 4 September rose as high as 60 m above the crater rim and ejected material onto the upper W flank. Sulfur dioxide flux of 1,730 t/d and 1,281 t/d was measured on 3 and 4 September, respectively, according to data obtained by DOAS equipment.
Strong Strombolian activity and larger gas-and-ash plumes were reported during 18-20 September. On 18 September activity was also associated with energetic LP-type events and notable sulfur dioxide fluxes (as high as 4,277 t/d). On 19 September Strombolian activity and incandescence were observed. On 20 September at 0914 ash emissions rose 50 m above the crater and drifted SSE, accompanied by Strombolian activity that ejected material less than 100 m SSE, causing fall deposits on that respective flank. SERNAGEOMIN reported that a Planet Scope satellite image taken on 20 September showed the lava lake in the crater, measuring 32 m x 35 m and an area of 0.001 km2. Several ash emissions were recorded at 0841, 0910, 1251, 1306, 1312, 1315, and 1324 on 23 September and rose less than 150 m above the crater. The sulfur dioxide flux value was 698 t/d on 23 September and 1,097 t/d on 24 September. On 24 September the Volcanic Alert Level (VAL) was raised to Orange (the third level on a four-color scale). SENAPRED maintained the Alert Level at Yellow (the middle level on a three-color scale) for the communities of Villarrica, Pucón (16 km N), Curarrehue, and Panguipulli.
During 24-25 September there was an increase in seismic energy (observed at TR-events) and acoustic signals, characterized by 1 VT-type event, 213 LP-type events, and 124 TR-type events. Mainly white gas-and-steam emissions, in addition to occasional fine ash emissions were recorded. During the early morning of 25 September Strombolian explosions were reported and ejected material 250 m in all directions, though dominantly toward the NW. On 25 September the average value of sulfur dioxide flux was 760 t/d. Seismicity during 25-30 September consisted of five VT-type events, 1,937 LP-type events, and 456 TR-type events.
During 25-29 September moderate Strombolian activity was observed and ejected material as far as the crater rim. In addition, ash pulses lasting roughly 50 minutes were observed around 0700 and dispersed ENE. During 26-27 September a TR episode lasted 6.5 hours and was accompanied by discrete acoustic signals. Satellite images from 26 September showed a spatter cone on the crater floor with one vent that measured 10 x 14 m and a smaller vent about 35 m NE of the cone. SERNAGEOMIN reported an abundant number of bomb-sized blocks up to 150 m from the crater, as well as impact marks on the snow, which indicated explosive activity. A low-altitude ash emission was observed drifting NW around 1140 on 28 September, based on webcam images. Between 0620 and 0850 on 29 September an ash emission rose 60 m above the crater and drifted NW. During an overflight taken around 1000 on 29 September scientists observed molten material in the vent, a large accumulation of pyroclasts inside the crater, and energetic degassing, some of which contained a small amount of ash. Block-sized pyroclasts were deposited on the internal walls and near the crater, and a distal ash deposit was also visible. The average sulfur dioxide flux measured on 28 September was 344 t/d. Satellite images taken on 29 September ashfall was deposited roughly 3 km WNW from the crater and nighttime crater incandescence remained visible. The average sulfur dioxide flux value from 29 September was 199 t/d. On 30 September at 0740 a pulsating ash emission rose 1.1 km above the crater and drifted NNW (figure 126). Deposits on the S flank extended as far as 4.5 km from the crater rim, based on satellite images from 30 September.
Infrared MODIS satellite data processed by MIROVA (Middle InfraRed Observation of Volcanic Activity) showed intermittent thermal activity during April through September, with slightly stronger activity detected during late September (figure 127). Small clusters of thermal activity were detected during mid-June, early July, early August, and late September. According to the MODVOLC thermal alert system, a total of four thermal hotspots were detected on 7 July and 3 and 23 September. This activity was also intermittently captured in infrared satellite imagery on clear weather days (figure 128).
Geologic Background. The glacier-covered Villarrica stratovolcano, in the northern Lakes District of central Chile, is ~15 km south of the city of Pucon. A 2-km-wide caldera that formed about 3,500 years ago is located at the base of the presently active, dominantly basaltic to basaltic andesite cone at the NW margin of a 6-km-wide Pleistocene caldera. More than 30 scoria cones and fissure vents are present on the flanks. Plinian eruptions and pyroclastic flows that have extended up to 20 km from the volcano were produced during the Holocene. Lava flows up to 18 km long have issued from summit and flank vents. Eruptions documented since 1558 CE have consisted largely of mild-to-moderate explosive activity with occasional lava effusion. Glaciers cover 40 km2 of the volcano, and lahars have damaged towns on its flanks.
Information Contacts: Servicio Nacional de Geología y Minería (SERNAGEOMIN), Observatorio Volcanológico de Los Andes del Sur (OVDAS), Avda Sta María No. 0104, Santiago, Chile (URL: http://www.sernageomin.cl/); Proyecto Observación Villarrica Internet (POVI) (URL: http://www.povi.cl/); Sistema y Servicio Nacional de Prevención y Repuesta Ante Desastres (SENAPRED), Av. Beauchef 1671, Santiago, Chile (URL: https://web.senapred.cl/); Buenos Aires Volcanic Ash Advisory Center (VAAC), Servicio Meteorológico Nacional-Fuerza Aérea Argentina, 25 de mayo 658, Buenos Aires, Argentina (URL: http://www.smn.gov.ar/vaac/buenosaires/inicio.php); MIROVA (Middle InfraRed Observation of Volcanic Activity), a collaborative project between the Universities of Turin and Florence (Italy) supported by the Centre for Volcanic Risk of the Italian Civil Protection Department (URL: http://www.mirovaweb.it/); Hawai'i Institute of Geophysics and Planetology (HIGP) - MODVOLC Thermal Alerts System, School of Ocean and Earth Science and Technology (SOEST), Univ. of Hawai'i, 2525 Correa Road, Honolulu, HI 96822, USA (URL: http://modis.higp.hawaii.edu/); Copernicus Browser, Copernicus Data Space Ecosystem, European Space Agency (URL: https://dataspace.copernicus.eu/browser/).
Merapi (Indonesia) — October 2023 Cite this Report
Merapi
Indonesia
7.54°S, 110.446°E; summit elev. 2910 m
All times are local (unless otherwise noted)
Frequent incandescent avalanches during April-September 2023
Merapi, located just north of the major city of Yogyakarta in central Java, Indonesia, has had activity within the last 20 years characterized by pyroclastic flows and lahars accompanying growth and collapse of the steep-sided active summit lava dome. The current eruption period began in late December 2020 and has more recently consisted of ash plumes, intermittent incandescent avalanches of material, and pyroclastic flows (BGVN 48:04). This report covers activity during April through September 2023, based on information from Balai Penyelidikan dan Pengembangan Teknologi Kebencanaan Geologi (BPPTKG), the Center for Research and Development of Geological Disaster Technology, a branch of PVMBG which specifically monitors Merapi. Additional information comes from the Pusat Vulkanologi dan Mitigasi Bencana Geologi (PVMBG, also known as Indonesian Center for Volcanology and Geological Hazard Mitigation, CVGHM), MAGMA Indonesia, the Darwin Volcanic Ash Advisory Centre (VAAC), and various satellite data.
Activity during April through September 2023 primarily consisted of incandescent avalanches of material that mainly affected the SW and W flanks and traveled as far as 2.3 km from the summit (table 25) and white gas-and-steam emissions that rose 10-1,000 m above the crater.
Table 25. Monthly summary of avalanches and avalanche distances recorded at Merapi during April through September 2023. The number of reported avalanches does not include instances where possible avalanches were heard but could not be visually confirmed as a result of inclement weather. Data courtesy of BPPTKG (April-September 2023 daily reports).
| Month |
Average number of avalanches per day |
Distance avalanches traveled (m) |
| Apr 2023 |
19 |
1,200-2,000 |
| May 2023 |
22 |
500-2,000 |
| Jun 2023 |
18 |
1,200-2,000 |
| Jul 2023 |
30 |
300-2,000 |
| Aug 2023 |
25 |
400-2,300 |
| Sep 2023 |
23 |
600-2,000 |
BPPTKG reported that during April and May white gas-and-steam emissions rose 10-750 m above the crater, incandescent avalanches descended 500-2,000 m on the SW and W flanks (figure 135). Cloudy weather often prevented clear views of the summit, and sometimes avalanches could not be confirmed. According to a webcam image, a pyroclastic flow was visible on 17 April at 0531. During the week of 28 April and 4 May a pyroclastic flow was reported on the SW flank, traveling up to 2.5 km. According to a drone overflight taken on 17 May the SW lava dome volume was an estimated 2,372,800 cubic meters and the dome in the main crater was an estimated 2,337,300 cubic meters.
During June and July similar activity persisted with white gas-and-steam emissions rising 10-350 m above the crater and frequent incandescent avalanches that traveled 300-2,000 m down the SW, W, and S flanks (figure 136). Based on an analysis of aerial photos taken on 24 June the volume of the SW lava dome was approximately 2.5 million cubic meters. A pyroclastic flow was observed on 5 July that traveled 2.7 km on the SW flank. According to the Darwin VAAC multiple minor ash plumes were identified in satellite images on 19 July that rose to 3.7 km altitude and drifted S and SW. During 22, 25, and 26 July a total of 17 avalanches descended as far as 1.8 km on the S flank.
Frequent white gas-and-steam emissions continued during August and September, rising 10-450 m above the crater. Incandescent avalanches mainly affected the SW and W flanks and traveled 400-2,300 m from the vent (figure 137). An aerial survey conducted on 10 August was analyzed and reported that estimates of the SW dome volume was 2,764,300 cubic meters and the dome in the main crater was 2,369,800 cubic meters.
Frequent and moderate-power thermal activity continued throughout the reporting period, according to a MIROVA (Middle InfraRed Observation of Volcanic Activity) analysis of MODIS satellite data (figure 138). There was an increase in the number of detected anomalies during mid-May. The MODVOLC thermal algorithm recorded a total of 47 thermal hotspots: six during April, nine during May, eight during June, 15 during July, four during August, and five during September. Some of this activity was captured in infrared satellite imagery on clear weather days, sometimes accompanied by incandescent material on the SW flank (figure 139).
Geologic Background. Merapi, one of Indonesia's most active volcanoes, lies in one of the world's most densely populated areas and dominates the landscape immediately north of the major city of Yogyakarta. It is the youngest and southernmost of a volcanic chain extending NNW to Ungaran volcano. Growth of Old Merapi during the Pleistocene ended with major edifice collapse perhaps about 2,000 years ago, leaving a large arcuate scarp cutting the eroded older Batulawang volcano. Subsequent growth of the steep-sided Young Merapi edifice, its upper part unvegetated due to frequent activity, began SW of the earlier collapse scarp. Pyroclastic flows and lahars accompanying growth and collapse of the steep-sided active summit lava dome have devastated cultivated lands on the western-to-southern flanks and caused many fatalities.
Information Contacts: Balai Penyelidikan dan Pengembangan Teknologi Kebencanaan Geologi (BPPTKG), Center for Research and Development of Geological Disaster Technology (URL: http://merapi.bgl.esdm.go.id/, Twitter: @BPPTKG); MAGMA Indonesia, Kementerian Energi dan Sumber Daya Mineral (URL: https://magma.esdm.go.id/v1); Pusat Vulkanologi dan Mitigasi Bencana Geologi (PVMBG, also known as Indonesian Center for Volcanology and Geological Hazard Mitigation, CVGHM), Jalan Diponegoro 57, Bandung 40122, Indonesia (URL: http://www.vsi.esdm.go.id/); Darwin Volcanic Ash Advisory Centre (VAAC), Bureau of Meteorology, Northern Territory Regional Office, PO Box 40050, Casuarina, NT 0811, Australia (URL: http://www.bom.gov.au/info/vaac/); MIROVA (Middle InfraRed Observation of Volcanic Activity), a collaborative project between the Universities of Turin and Florence (Italy) supported by the Centre for Volcanic Risk of the Italian Civil Protection Department (URL: http://www.mirovaweb.it/); Hawai'i Institute of Geophysics and Planetology (HIGP) - MODVOLC Thermal Alerts System, School of Ocean and Earth Science and Technology (SOEST), Univ. of Hawai'i, 2525 Correa Road, Honolulu, HI 96822, USA (URL: http://modis.higp.hawaii.edu/); Copernicus Browser, Copernicus Data Space Ecosystem, European Space Agency (URL: https://dataspace.copernicus.eu/browser/); Øystein Lund Andersen (URL: https://www.oysteinlundandersen.com/, https://twitter.com/oysteinvolcano).
Ebeko
Russia
50.686°N, 156.014°E; summit elev. 1103 m
All times are local (unless otherwise noted)
Moderate explosive activity with ash plumes continued during June-November 2023
Ebeko, located on the N end of Paramushir Island in Russia’s Kuril Islands just S of the Kamchatka Peninsula, consists of three summit craters along a SSW-NNE line at the northern end of a complex of five volcanic cones. Observed eruptions date back to the late 18th century and have been characterized as small-to-moderate explosions from the summit crater, accompanied by intense fumarolic activity. The current eruptive period began in June 2022, consisting of frequent explosions, ash plumes, and thermal activity (BGVN 47:10, 48:06). This report covers similar activity during June-November 2023, based on information from the Kamchatka Volcanic Eruptions Response Team (KVERT) and satellite data.
Moderate explosive activity continued during June-November 2023 (figures 50 and 51). According to visual data from Severo-Kurilsk, explosions sent ash 2-3.5 km above the summit (3-4.5 km altitude) during most days during June through mid-September. Activity after mid-September was slightly weaker, with ash usually reaching less than 2 km above the summit. According to KVERT the volcano in October and November was, with a few exceptions, either quiet or obscured by clouds that prevented satellite observations. KVERT issued Volcano Observatory Notices for Aviation (VONA) on 8 and 12 June, 13 and 22 July, 3 and 21 August, and 31 October warning of potential aviation hazards from ash plumes drifting 3-15 km from the volcano. Based on satellite data, KVERT reported a persistent thermal anomaly whenever weather clouds permitted viewing.
Geologic Background. The flat-topped summit of the central cone of Ebeko volcano, one of the most active in the Kuril Islands, occupies the northern end of Paramushir Island. Three summit craters located along a SSW-NNE line form Ebeko volcano proper, at the northern end of a complex of five volcanic cones. Blocky lava flows extend west from Ebeko and SE from the neighboring Nezametnyi cone. The eastern part of the southern crater contains strong solfataras and a large boiling spring. The central crater is filled by a lake about 20 m deep whose shores are lined with steaming solfataras; the northern crater lies across a narrow, low barrier from the central crater and contains a small, cold crescentic lake. Historical activity, recorded since the late-18th century, has been restricted to small-to-moderate explosive eruptions from the summit craters. Intense fumarolic activity occurs in the summit craters, on the outer flanks of the cone, and in lateral explosion craters.
Information Contacts: Kamchatka Volcanic Eruptions Response Team (KVERT), Far Eastern Branch, Russian Academy of Sciences, 9 Piip Blvd., Petropavlovsk-Kamchatsky, 683006, Russia (URL: http://www.kscnet.ru/ivs/kvert/).
Search Bulletin Archive by Publication Date
Select a month and year from the drop-downs and click "Show Issue" to have that issue displayed in this tab.
The default month and year is the latest issue available.
Bulletin of the Global Volcanism Network - Volume 21, Number 09 (September 1996)
Managing Editor: Richard Wunderman
Ambrym (Vanuatu)
Lava lakes in both Benbow and Marum craters still active in July
Amukta (United States)
Small ash plumes observed in mid-September
Arenal (Costa Rica)
Small pyroclastic flows
Calbuco (Chile)
Strong fumarolic emission from main crater
Gaua (Vanuatu)
Large steam-and-gas plume observed in mid-July
Gorely (Russia)
Seismic activity increases with over 20 earthquakes recorded on 19 September
Grimsvotn (Iceland)
Abrupt subglacial fissure eruption fills caldera lake with meltwater; glacier burst expected
Iliamna (United States)
Increased seismic activity persists in September and early October
Kama'ehuakanaloa (United States)
Active hydrothermal venting, turbid water, and debris slides
Karymsky (Russia)
Explosions send bombs to 500 m and plumes up to 5 km high
Kilauea (United States)
Eruptive activity continues; ocean entry and lava bench collapses
Koryaksky (Russia)
Background seismicity in late July and August
Krakatau (Indonesia)
Thick plume to an altitude of 3.7 km on 29 September
Langila (Papua New Guinea)
Moderate Vulcanian activity; vapor-and-ash clouds, ashfall, crater glows
Lengai, Ol Doinyo (Tanzania)
Crater observations during July-September
Lopevi (Vanuatu)
Fumarolic emissions and sulfur deposits seen during overflight
Maderas (Nicaragua)
Lahar kills six people
Manam (Papua New Guinea)
Increased eruptive activity at both Main and South Craters
Pacaya (Guatemala)
Moderate Strombolian eruption; fountaining up to 500 m; lava flow
Pavlof (United States)
Increasing seismicity corresponds to stronger eruptive activity
Rabaul (Papua New Guinea)
Strong explosions produce ash clouds and ashfall
Ruiz, Nevado del (Colombia)
Seismic swarms; gas plumes; newly found fumarolic field and hot spring
Santa Maria (Guatemala)
Small explosion from Santiaguito dome
Semeru (Indonesia)
Intermittent pilot reports of eruptions from August to October
Soufriere Hills (United Kingdom)
Large destructive explosion 17 September
Villarrica (Chile)
Increased seismicity again in late September
Whakaari/White Island (New Zealand)
Recent heating and deformation episode appears to have ended
Yasur (Vanuatu)
Strombolian activity during July from three summit craters within the main crater
Ambrym (Vanuatu) — September 1996 Cite this Report
Ambrym
Vanuatu
16.25°S, 168.12°E; summit elev. 1334 m
All times are local (unless otherwise noted)
Lava lakes in both Benbow and Marum craters still active in July
A visit to the summit caldera on 8-9 July did not permit an approach to the lava lakes in the Benbow and Marum craters due to poor weather. An overflight on the night of 20 July permitted observations of surface bubbling in Marum's lava lake. Two other overflights, on 21 and 22 July, allowed observation of activity in both lakes for several minutes. During these observations, the surface of the Benbow lake was fairly calm. However, Marum's lava lake, ~100 m in diameter, exhibited occasional explosions that threw glowing magma fragments some meters above the surface; bubbling was clearly visible from the airplane.
Geologic Background. Ambrym, a large basaltic volcano with a 12-km-wide caldera, is one of the most active volcanoes of the New Hebrides Arc. A thick, almost exclusively pyroclastic sequence, initially dacitic then basaltic, overlies lava flows of a pre-caldera shield volcano. The caldera was formed during a major Plinian eruption with dacitic pyroclastic flows about 1,900 years ago. Post-caldera eruptions, primarily from Marum and Benbow cones, have partially filled the caldera floor and produced lava flows that ponded on the floor or overflowed through gaps in the caldera rim. Post-caldera eruptions have also formed a series of scoria cones and maars along a fissure system oriented ENE-WSW. Eruptions have apparently occurred almost yearly during historical time from cones within the caldera or from flank vents. However, from 1850 to 1950, reporting was mostly limited to extra-caldera eruptions that would have affected local populations.
Information Contacts: Henry Gaudru, C. Pittet, C. Bopp, and G. Borel, Société Volcanologique Européenne, C.P. 1, 1211 Genève 17, Switzerland (URL: http://www.sveurop.org/); Michel Lardy, Centre ORSTOM, B.P. 76, Port Vila, Vanuatu.
Amukta (United States) — September 1996 Cite this Report
Amukta
United States
52.5°N, 171.252°W; summit elev. 1066 m
All times are local (unless otherwise noted)
Small ash plumes observed in mid-September
On 18 September AVO received a pilot report of a small ash plume above Amukta. An Alaska Airlines pilot noted black and gray ash clouds rising ~300 m above the summit crater during overflights on 17 and 18 September. The ash plumes extended ~16 km S over the Pacific Ocean before dissipating. No plume was visible on satellite imagery.
Geologic Background. The symmetrical Amukta stratovolcano lies in the central Aleutians SW of Chagulak Island and is the westernmost of the Islands of the Four Mountains group. The stratovolcano was constructed at the northern side of an arcuate caldera-like feature that is open to the sea along the southern coast of the 8-km-wide Amukta Island. It overlies a broad shield volcano and is topped by a 400-m-wide crater, and a cinder cone is located near the NE coast. There have been several reported eruptions from both summit and flank vents.
Information Contacts: Alaska Volcano Observatory (AVO); NOAA/NESDIS Satellite Analysis Branch, Room 401, 5200 Auth Road, Camp Springs, MD 20746, USA.
Arenal (Costa Rica) — September 1996 Cite this Report
Arenal
Costa Rica
10.463°N, 84.703°W; summit elev. 1670 m
All times are local (unless otherwise noted)
Small pyroclastic flows
Some small pyroclastic flows took place in September but eruptions were milder than the previous month. Eruptions were often separated by 10-60 minute intervals, and plumes seldom rose much over 1 km. During September, a new lava flow began moving toward the crater's SW side.
Noteworthy eruptions took place several times during September. An eruption at 0926 on the 11th generated a pyroclastic flow that traveled SW; the associated plume reached 1,230 m altitude. At 1700 on the 29th eyewitnesses saw a rockslide off a lava flow that led to a small avalanche (figure 80). Also, at 1720 that same day, an ash-column collapse produced a small pyroclastic flow (figure 80). At 1634 on the 30th a pyroclastic flow swept NW; the associated plume reached 1,000 m altitude.
During September, OVSICORI-UNA reported about average monthly seismic activity: 875 events and 300 hours of tremor (station VACR, 2.7 km NE of Crater C). ICE reported above-average seismic activity during September: 86 events and 4.78 hours of tremor (Fortuna Station, 3.5 km E of Crater C). OVSICORI-UNA noted that many of the seismic events were associated with Strombolian eruptions.
Although the volcano's distance network has generally shown a cumulative contraction since the initial measurements in 1991, a small pulse of inflation (reaching 5 ppm) took place in April 1996. Due to accumulating lava and pyroclastic materials, the summit of the active crater (C) grew 1.65 m between April and September 1996. This growth rate was consistent with the average rate of 4.13 m/year seen thus far in 1996 and close to the overall average of 5.33 m/year.
Arenal's post-1968 Strombolian-type eruptions have produced basaltic-andesite tephra and lavas. The volcano lies directly adjacent to Lake Arenal, a dammed reservoir for generating hydroelectric power.
Geologic Background. Conical Volcán Arenal is the youngest stratovolcano in Costa Rica and one of its most active. The 1670-m-high andesitic volcano towers above the eastern shores of Lake Arenal, which has been enlarged by a hydroelectric project. Arenal lies along a volcanic chain that has migrated to the NW from the late-Pleistocene Los Perdidos lava domes through the Pleistocene-to-Holocene Chato volcano, which contains a 500-m-wide, lake-filled summit crater. The earliest known eruptions of Arenal took place about 7000 years ago, and it was active concurrently with Cerro Chato until the activity of Chato ended about 3500 years ago. Growth of Arenal has been characterized by periodic major explosive eruptions at several-hundred-year intervals and periods of lava effusion that armor the cone. An eruptive period that began with a major explosive eruption in 1968 ended in December 2010; continuous explosive activity accompanied by slow lava effusion and the occasional emission of pyroclastic flows characterized the eruption from vents at the summit and on the upper western flank.
Information Contacts: E. Fernández, E. Duarte, V. Barboza, R. Van der Laat, E. Hernandez, M. Martinez, and R. Sáenz, Observatorio Vulcanológico y Sismológico de Costa Rica, Universidad Nacional (OVSICORI-UNA), Apartado 86-3000, Heredia, Costa Rica; G.J. Soto and J.F. Arias, Oficina de Sismología y Vulcanología del Arenal y Miravalles (OSIVAM), Instituto Costarricense de Electricidad (ICE), Apartado 10032-1000, San José, Costa Rica.
Calbuco (Chile) — September 1996 Cite this Report
Calbuco
Chile
41.33°S, 72.618°W; summit elev. 1974 m
All times are local (unless otherwise noted)
Strong fumarolic emission from main crater
On the morning of 12 August, the ~250,000 residents of Puerto Montt (35 km SW) and Puerto Varas (36 km SW) were alarmed by strong fumarolic emissions from the 1.5-km-diameter main crater of Calbuco. In May 1995 a weak fumarole was noticed and filmed from a helicopter. Prior to that, Calbuco had showed no signs of activity since a 1972 eruption that lasted for ~4 hours.
Calbuco is a very explosive late Pleistocene to Holocene andesitic volcano S of Lake Llanquihue that underwent edifice collapse in the late Pleistocene, producing a volcanic debris avalanche that reached the lake. One of the largest historical eruptions in southern Chile took place from Calbuco in 1893-1894. Violent eruptions ejected 30-cm bombs to distances of 8 km from the crater, accompanied by voluminous hot lahars. Several days of darkness occurred in San Carlos de Bariloche, Argentina (>100 km SE). Strong explosions occurred in April 1917, and a lava dome formed in the crater accompanied by hot lahars. Another short explosive eruption in January 1929 also included an apparent pyroclastic flow and a lava flow. The last major eruption of Calbuco, in 1961, sent ash columns 12-15 km high and produced plumes that dispersed mainly to the SE as far as Bariloche; two lava flows were also emitted.
Geologic Background. Calbuco is one of the most active volcanoes of the southern Chilean Andes, along with its neighbor, Osorno. The late-Pleistocene to Holocene andesitic volcano is immediately SE of Lake Llanquihué in the Chilean lake district. Guanahuca, Guenauca, Huanauca, and Huanaque, all listed as synonyms of Calbuco (Catalog of Active Volcanoes of the World), are actually synonyms of nearby Osorno volcano (Moreno 1985, pers. comm.). The edifice is elongated in a SW-NE direction and is capped by a 400-500 m wide summit crater. The complex evolution included collapse of an intermediate edifice during the late Pleistocene that produced a 3-km3 debris avalanche that reached the lake. It has erupted frequently during the Holocene, and one of the largest historical eruptions in southern Chile took place from Calbuco in 1893-1894 that concluded with lava dome emplacement. Subsequent eruptions have enlarged the lava-dome complex in the summit crater.
Information Contacts: Hugo Moreno, Observatorio Volcanologico de los Andes del Sur (OVDAS), Universidad de la Frontera, Casilla 54-D, Temuco, Chile.
Gaua
Vanuatu
14.281°S, 167.514°E; summit elev. 729 m
All times are local (unless otherwise noted)
Large steam-and-gas plume observed in mid-July
Activity observed during 14-15 July consisted of a large steam-and-gas plume with a strong SO2 odor. Numerous fumarolic zones covered with yellow sulfur deposits dotted the interior wall of the crater. Fairly strong degassing was taking place from the NW part of the depression. An active fumarole rose from the high interior N part of the crater (T = 119 ± 5°C). The dominant vent sent a plume W from the caldera. The highest temperature of the hot sub-lacustrine fumaroles in the NE part of the lake, in the vicinity of the seismic station, varied between 34 and 65°C. The northernmost attained a temperature of 62°C.
The cone that dominates the NW part of the caldera is composed of five principal craters. The bottom of the northernmost crater is occupied in part by a small shallow pool of greenish water. The active crater is situated on the SE flank of the cone (Mt. Garat).
Geologic Background. The roughly 20-km-diameter Gaua Island, also known as Santa Maria, consists of a basaltic-to-andesitic stratovolcano with an 6 x 9 km summit caldera. Small vents near the caldera rim fed Pleistocene lava flows that reached the coast on several sides of the island; littoral cones were formed where these lava flows reached the ocean. Quiet collapse that formed the roughly 700-m-deep caldera was followed by extensive ash eruptions. The active Mount Garet (or Garat) cone in the SW part of the caldera has three pit craters across the summit area. Construction of Garet and other small cinder cones has left a crescent-shaped lake. The onset of eruptive activity from a vent high on the SE flank in 1962 ended a long period of dormancy.
Information Contacts: Henry Gaudru, C. Pittet, C. Bopp, and G. Borel, Société Volcanologique Européenne, C.P. 1, 1211 Genève 17, Switzerland (URL: http://www.sveurop.org/); Michel Lardy, Centre ORSTOM, B.P. 76, Port Vila, Vanuatu.
Gorely (Russia) — September 1996 Cite this Report
Gorely
Russia
52.5549°N, 158.0358°E; summit elev. 1799 m
All times are local (unless otherwise noted)
Seismic activity increases with over 20 earthquakes recorded on 19 September
On 19 September seismic activity increased and more than 20 earthquakes (M <= 1.8) were recorded beneath Gorely. However, no sign of eruptive activity was observed around the crater on 20 September. During 23-30 September seismicity returned to background levels.
Geologic Background. Gorely volcano consists of five small overlapping stratovolcanoes constructed along a WNW-ESE line within a large 9 x 13 km caldera. The caldera formed about 38,000-40,000 years ago accompanied by the eruption of about 100 km3 of tephra. The massive complex includes about 40 cinder cones, some of which contain acid or freshwater crater lakes; three major rift zones cut the complex. Another Holocene stratovolcano is located on the SW flank. Activity during the Holocene was characterized by frequent mild-to-moderate explosive eruptions along with a half dozen episodes of major lava extrusion. Early Holocene explosive activity, along with lava flows filled in much of the caldera. Quiescent periods became longer between 6,000 and 2,000 years ago, after which the activity was mainly explosive. About 600-650 years ago intermittent strong explosions and lava flow effusion accompanied frequent eruptions. Historical eruptions have consisted of moderate Vulcanian and phreatic explosions.
Information Contacts: Tom Miller, Alaska Volcano Observatory (AVO), 4200 University Drive, Anchorage, AK 99508-4667, USA; Vladimir Kirianov, Kamchatka Volcanic Eruptions Response Team (KVERT), Institute of Volcanic Geology and Geochemistry, Piip Ave. 9, Petropavlovsk-Kamchatsky, 683006, Russia.
Grimsvotn (Iceland) — September 1996 Cite this Report
Grimsvotn
Iceland
64.416°N, 17.316°W; summit elev. 1719 m
All times are local (unless otherwise noted)
Abrupt subglacial fissure eruption fills caldera lake with meltwater; glacier burst expected
The Nordic Volcanical Institute reported that from late in the evening of 30 September until 13 October a subglacial eruption occurred along part of the East Rift Zone that traverses beneath the NW side of Vatnajökull, Europe's largest continental glacier (Björnsson and Einarsson, 1991; Björnsson and Gudmundsson, 1993). This part of the Rift Zone includes both Bardarbunga and Grímsvötn fissure systems and their respective central volcanoes, each containing a substantial caldera (figure 1).
The eruption was preceded by an unusual sequence of earthquakes. One, at 1048 on 29 September, was Ms 5.4 and centered near Bardarbunga caldera's N rim (figure 1). Similar earthquakes have occurred beneath Bardarbunga many times during the last 22 years. Unlike this event, however, none of the previous large earthquakes had either significant aftershocks or preceded magmatic activity.
In the two hours following the M 5.4 event there were numerous earthquakes, including five larger than M 3. These were recorded at the two analog seismic stations just NW of Bardarbunga and at the S rim of the Grímsvötn caldera. Shortly after 1300 on 30 September, Science Institute seismologists informed Civil Defense authorities and the scientific community about this unusual seismicity and the possibility of impending eruptive activity.
The seismic swarm continued throughout 30 September, with increasing intensity. Hundreds of earthquakes were recorded each day, including over 10 events larger than M 3. The earthquakes were located in the N part of Bardarbunga and migrated towards Grímsvötn. They were accompanied by high-frequency (>3 Hz) continuous tremor of the same type as was frequently observed during intrusive activity within the Krafla volcanic system during 1975-84.
The Civil Defense Council issued a warning of a possible eruption at 1900 on 30 September. Later that evening earthquake activity near Grímsvötn decreased markedly, while that near Bardarbunga continued. At about 2200 the seismograph at Grímsvötn began recording continuous small-amplitude eruption tremor. The sudden decrease in earthquake activity and the onset of tremor may be taken as evidence that an eruption began between 2200 and 2300 on September 30. Tremor amplitude increased very slowly during the next hours, reaching a maximum at about 0600 on 1 October.
The eruption site was spotted from aircraft in the early morning of 1 October. By that time two elongate, 1-2 km wide and N23E-trending subsidence bowls or cauldrons had developed in the ice surface. These bowls were located to Bardarbunga's SSE, along a fissure on Grímsvötn's N flank (figure 1). The bowls (one of which is shown in figures 2 and 3) appeared in the glacial ice above a 4-6-km-long NNE-trending fissure; ice in this location had been considered 400-600 m thick, though some later estimates put the ice thickness more precisely at 450 m. The eruption was most powerful under the northernmost bowl, causing it to subside 50 m over 4 hours.
The resulting meltwater drained into Grímsvötn caldera (figure 1) raising the ice shelf above the caldera lake. The lake was covered by 250 m of ice and held in place by an ice dam. Widening and deepening of the bowls during the day added an estimated 0.3 km3 of water to the Grímsvötn lake in less than 24 hours. On 1 October a shallow linear subsidence structure extended from the eruption site to the subglacial Grímsvötn caldera lake, the surface manifestation of the subglacial pathway for water draining into Grímsvötn.
By 1 October the lake's surface had risen 10-15 m (to 1,410 m). During the first week of the eruption meltwater production was thought to be ~5,000 m3/second, but it later slowed. Glacier bursts (jökulhlaups) were thought to be likely, if not imminent. Water from Grímsvötn crater lake was expected to emerge at an outlet at the edge of the glacier ~50 km S. N-directed floods were also expected if the eruptive fissure continued to propagate N.
Helgi Torfason noted that although a previous glacier burst took place last summer (with 3,000 m3/second flow rates), the affected bridges were designed to withstand surges with meltwater fluxes 3x that size. On the other hand, a 1938 eruption, in almost exactly the same place (Gudmundsson and Björnsson, 1991) caused glacier bursts with fluxes ~5 or 6 times as large.
At 0447 on the morning of 2 October a vent on the floor of one bowl broke through the ice and the eruption began a subaerial phase. At 0800 vigorous explosive activity was observed in the crater with the eruption column rising to 4-5 km altitude. One account noted that rhythmic explosions resulted in black ash clouds rising 500 m while the buoyant eruption column rose to 3 km. In the afternoon the opening in the ice was several hundred meters wide. The eruptive fissure apparently extended 3 km farther N, because on the ice surface observers saw a new, elongated, N-trending ice cauldron. Some 2 October reports noted a steam column that rose to ~10 km altitude.
On 3 October the ice bowl over the northernmost part of the fissure had grown ~2 km since the previous day. By this time the glacier had subsided over an area 8-9 km long and 2-3 km wide. Subaerial eruptions pulsated, alternating between quiet periods and explosive activity. Ash mainly dispersed N but also SSW. The opening at the eruption site grew larger. Eruptive intensity began to decline on this day but tremor continued. A TV photographer captured footage of two lightning strikes traveling along the ash cloud that was widely shown on news reports. The water level in the vent was ~50-200 m below the original ice surface. The surface of Grímsvötn lake was at 1,460 m. Ash samples collected on this day had water-soluble fluorine contents of ~130 ppm, ~10% the amount found in Hekla ash, reducing concerns about the immediate danger to grazing animals. Initial electron microprobe analysis of the ash indicated that it was basaltic andesite in composition.
The eruption continued on 4 October. It was noted that the caldera lake was higher than at any point in this century. Poor weather intervened for the next few days, but on 7 and 9 October the eruption continued from the 9-km-long fissure; thin ash covered about half of the 8,100 km2 Vatnajökull glacier. On 9 October J-M. Bardintzeff and a visiting French team saw a 4-km-high plume as well as violent phreatic ash emissions between 1230 and 1415.
On 10 October eruptive intensity appeared similar to the low levels seen since 3 October. Occasional eruptions carried black ash clouds to ~3 km and vapor with finer ash to 4 km. Minor ashfall was limited to the Vatnajökull glacier. An 11 October flight confirmed that emissions continued, but lacked rooster-tail-shaped explosions seen previously and may have declined in intensity. The eruptive crater was still water covered. Grímsvötn ice cover had bulged upward but signs of escaping water were absent. The caldera lake's total volume was estimated at >2 km3.
A Canadian Space Agency satellite radar image from 17 October was processed by Troms Satellite Station. In this image they found increased backscatter compared to earlier in the month; they suggested that this may have been due to cooler ice caused by a return to stability around the crater. In accord with this observation, on 18 October NVI announced that the eruption had apparently stopped on 13 October.
The eruption left material piled up to form a subglacial ridge; the highest part of this ridge supported an eruptive crater that reached a few to tens of meters out of meltwater at the eruptive site. Cooling eruptive materials continued to melt significant volumes of ice.
Increased CO2 and H2S in N-flowing river water suggested some flow of meltwater from the eruptive site. As of 18 October most of the meltwater was still directed towards the Grímsvötn caldera lake, with no signs of the awaited glacier burst. GPS measurements in October documented the lake's rise on the 12th (1,500 m), 15th (1,504 m), and 17th (1,505 m). Glacier bursts from the crater lake have typically occurred at the much lower lake level of ~1,450 m.
The recent eruption was a continuation of geophysical events in the Vatnajökull area that began in 1995 and possibly earlier. In July 1995 and August 1996 there were glacial floods from subglacial geothermal areas NW of Grímsvötn. In both cases, after the water reservoir drained, distinct tremor episodes occurred. Presumably, these pressure releases triggered small eruptions. In February 1996 there was an intense, week-long earthquake swarm centered on Hamarinn volcano (figure 1).
Besides the prospect of glacier bursts, the eruption was watched closely because the 1783-84 Laki (Skaftár Fires) and 1783-85 Grímsvötn eruptions vented on the Rift Zone within ~70 km of the current eruption. The 27-km-long Laki fissures active in 1783-84 start ~40 km SW of Grímsvötn's center. The Laki eruption produced 14.7 ± 0.1 km3 of basaltic lavas (Thordarson and Self, 1993) making it the largest known lava eruption in history. Sulfur and other gases released produced an acid haze (aerosol) that perturbed the weather in Western Eurasia, the North Atlantic, and the Arctic. An estimated 9,350 Icelanders died in the "haze famine" from 1783-86, an interval that included two severe winters, crop failures, livestock and fish deaths, and various illnesses, including fluorine poisoning (Stothers, 1996).
References. Björnsson, H., and Gudmundsson, M.T., 1993, Variations in the thermal output of the subglacial Grímsvötn caldera, Iceland: Geophysical Research Letters, v. 20, p. 2127-2130.
Björnsson, H., and Einarsson, P., 1991, Volcanoes beneath Vatnajökull, Iceland: evidence from radio-echo sounding, earthquakes and jökulhlaups: Jökull, v. 40, p. 147-168.
Gudmundsson, M.T., and Björnsson, H., 1991, Eruptions in Grímsvötn, Vatnajökull, Iceland, 1934-1991: Jökull, v. 41, p. 21-45.
Stothers, R.B., 1996, The great dry fog of 1783: Climatic Change, Kluwer Academic Publishers, v. 32, p.79-89.
Thordarson, T., and Self, S., 1993, The Laki (Skaftár Fires) and Grímsvötn eruptions in 1783-1785: Bulletin of Volcanology, Springer-Verlag, v. 55, p. 233-263.
Further Reference. Worsley, P., 1997, The 1996 volcanically induced glacial mega-flood in Iceland - cause and consequence: Geology Today, Blackwell Science, Ltd., v. 13., no. 6, p. 222-227.
Geologic Background. Grímsvötn, Iceland's most frequently active volcano in recent history, lies largely beneath the vast Vatnajökull icecap. The caldera lake is covered by a 200-m-thick ice shelf, and only the southern rim of the 6 x 8 km caldera is exposed. The geothermal area in the caldera causes frequent jökulhlaups (glacier outburst floods) when melting raises the water level high enough to lift its ice dam. Long NE-SW-trending fissure systems extend from the central volcano. The most prominent of these is the noted Laki (Skaftar) fissure, which extends to the SW and produced the world's largest known historical lava flow in 1783. The 15 km3 basaltic Laki lavas were erupted over 7 months from a 27-km-long fissure system. Extensive crop damage and livestock losses caused a severe famine that resulted in the loss of one-fifth of the population of Iceland.
Information Contacts: Nordic Volcanological Institute (NVI), Grensásvegur 50, 108 Reykjavík, Iceland (URL: http://nordvulk.hi.is/); Páll Einarsson, Bryndís Brandsdóttir, Magnús Tumi Gudmundsson, and Helgi Björnsson, Science Institute, Dunhagi 3, 107 Reykjavík, Iceland (URL: https://www.hi.is/); Icelandic Meteorological Office, Geophysics Department, Reykjavík, Iceland (URL: http://en.vedur.is/); J-M. Bardintzeff, Lab. Petrographi-Volcanologie, bat 504, Universite Paris-Sud, 91305 Orsay, France; Helgi Torfason, National Energy Authority, Grensasvegur 9, 108 Reykjavík, Iceland; Tromsø Satellite Station, N-9005, Tromsø, Norway; R. Axelsson, Morgunbladid News (photographer), Reykjavík, Iceland.
Iliamna (United States) — September 1996 Cite this Report
Iliamna
United States
60.032°N, 153.09°W; summit elev. 3053 m
All times are local (unless otherwise noted)
Increased seismic activity persists in September and early October
A small shallow earthquake swarm occurred beneath Iliamna during mid-May. After two months of ensuing quiescence, seismic activity increased on 1 August (BGVN 21:08). During September and the first half of October, 6 to 27 events were recorded each day at depths within the edifice to 9 km below sea level. Most of them were less than M 1.0 and the largest was M 3.2. All events seemed to be volcano-tectonic, and no long-period earthquakes or tremors that usually precede eruptions were detected. This seismicity was likely related to an intrusion of magma, but doest not mean that an eruption is imminent.
Geologic Background. Iliamna is a prominentglacier-covered stratovolcano in Lake Clark National Park on the western side of Cook Inlet, about 225 km SW of Anchorage. Its flat-topped summit is flanked on the south, along a 5-km-long ridge, by the prominent North and South Twin Peaks, satellitic lava dome complexes. The Johnson Glacier dome complex lies on the NE flank. Steep headwalls on the S and E flanks expose an inaccessible cross-section of the volcano. Major glaciers radiate from the summit, and valleys below the summit contain debris-avalanche and lahar deposits. Only a few major Holocene explosive eruptions have occurred from the deeply dissected volcano, which lacks a distinct crater. Most of the reports of historical eruptions may represent plumes from vigorous fumaroles E and SE of the summit, which are often mistaken for eruption columns (Miller et al., 1998). Eruptions producing pyroclastic flows have been dated at as recent as about 300 and 140 years ago, and elevated seismicity accompanying dike emplacement beneath the volcano was recorded in 1996.
Information Contacts: Alaska Volcano Observatory (AVO), a cooperative program of a) U.S. Geological Survey, 4200 University Drive, Anchorage, AK 99508-4667, USA (URL: http://www.avo.alaska.edu/), b) Geophysical Institute, University of Alaska, PO Box 757320, Fairbanks, AK 99775-7320, USA, and c) Alaska Division of Geological & Geophysical Surveys, 794 University Ave., Suite 200, Fairbanks, AK 99709, USA; NOAA/NESDIS Satellite Analysis Branch (SAB), Room 401, 5200 Auth Road, Camp Springs, MD 20746, USA.
Kama'ehuakanaloa (United States) — September 1996 Cite this Report
Kama'ehuakanaloa
United States
18.92°N, 155.27°W; summit elev. -975 m
All times are local (unless otherwise noted)
Active hydrothermal venting, turbid water, and debris slides
The onset of an intense earthquake swarm, which began in mid-July, prompted a rapid-response cruise and submersible dives during early August (BGVN 21:07). Scientists from the University of Hawaii once again used the research vessel Ka'imikai O Kanaloa (R/V KOK) and PISCES V manned submersible to carry out two follow-up research cruises over Lōʻihi during 26-28 September and 2-10 October, respectively. The following summarized observations are from reports of the Hawaii Center for Volcanology.
Observations on 26-28 September. During 26 September the divers found hydrothermal venting on the bottom of the newly formed Pele's Pit (figure 9). In the summit area N of East Pit, no volcanic activity was observed, but a number of broken-up pillows were discovered. There was no activity at West Pit, however, the divers saw columnar basalt that appeared to be teetering due to collisions from debris slides. Some noise was heard with sonobuoys the next day. In East Pit on 27 September, divers saw a mudslide but no venting. Visibility was poor due to particles coming from Pele's Pit via a channel between the two pits. In Pele's Pit, active venting was observed on the upper W wall below Pele's Lookout. The divers encountered vents early during the dive on 28 September. The dive was aborted after the submersible brushed an unseen wall and damaged a thruster.
Observations on 2-3 October. The dive on 2 October began in the "sand channel" between the pre-existing East Pit and the new Pele's Pit. The bottom of the channel was covered with a thick layer of fine-grained sediments. A miniature temperature recorder (MTR) was deployed, and a maximum vent-fluid temperature of >18°C was measured. At the W end of the vent field at Pele's Pit (1,175-m depth), numerous vents were seen; most were covered with white, streaming mats. This area, dubbed the rubble zone, extended perhaps 50-60 m in diameter, and was marked with several locations of recent slides and a few relatively stable benches. At night a tow-yo survey of nearly 18-km length was run up the W side of the main N-S axis of the seamount. A nephelometer detected a large number of plumes over the N half of the survey concentrated at ~1,350 and 1,050 m depth beside a large summit plume at a depth of ~1,150 m.
Vents were found the next day with a maximum vent-fluid temperature of 77°C, a much higher temperature than any previously measured at Lōʻihi. A hydrocast into Pele's Pit showed that water-temperature anomalies had greatly decreased after the rapid-response cruise in August (a few tenths of a degree vs. three degrees). However, a distinct turbidity maximum remained in the bottom waters.
Observations on 4-6 October. A submersible dive up the S rift was conducted to investigate the origin of a hydrothermal plume at 1,350-m depth detected on 2 October. A new hydrothermal vent field was found on the rift axis at 1,325-m depth, and was named "Naha Vents". This extensive vent field contained many fresh fractures, including a fissure (1-3 m wide) that vented large volumes of water. A smaller vent had a measured temperature of 11.2°C. The dive concluded farther up the rift at the site of the previously active Kapo's Vents (1,250-m depth); no hydrothermal activity was observed there. At night a ship-based water sampling program included a ~13 km long SW-NE tow-yo survey across the summit (the tow was run parallel to the predominantly NE current). A hydrothermal plume was first detected 6.5 km downcurrent from the summit.
Observations on 5 October showed that the Naha vent field was ~20 x 30 m, and was heavily covered with nontronite deposits and tan bacterial mats. The field contained many small vents, as well as diffuse flows through fractured pillows and large fissures. The highest vent-fluid temperature was 22.7°C. Night water sampling (vertical hydrocast) 1.4 km downcurrent (NE) from the summit revealed six major turbidity maxima at depths of 1,050-1,330 m. The strongest signal, at 1,080 m, was associated with a significant temperature anomaly. This suggested that there might be an undiscovered major source of venting at the summit (all of the vents discovered thus far are below 1,180 m).
Water sampling the night of 6 October better located the sources of the large shallow (1,000-1,105 m depth) turbidity and temperature-anomaly maxima observed on 5 October. Hydrocasts and tow-yos across the seamount suggested that a major venting site should be just S of Pele's Pit near the top of the S rift.
Observations on 7-10 October. An MTR showed a slow increase in temperature from 48 to 53°C over its deployment during 4-7 October, with some daily variations. The dive on 7 October explored a site covered with nontronite-coated gravels where diffuse venting was observed at a depth of 1,099 m. This field was likely an early stage of the "finger vent"-type hydrothermal fields seen previously on Lōʻihi, and was named "Ula Vents". The dive concluded on the steep W flank of the summit at a site of previously observed intermittent venting (Maximilian Vents) at 1,249-m depth. A night water sampling program ran two perpendicular 5-km-long tow-yo sections near the summit. In the both runs, plume maxima were in the vicinity of Kapo's Vents. A hydrocast at West Pit indicated a substantial particle plume above the pit with no associated temperature anomaly.
The 8 October dive began just W of the site of Kapo's Vents, a small field that was active in the late 1980s. As on the section of the S rift already explored, large volumes of clay- to gravel-sized sediments covered much of the area. Pele's hair and flat sheets of glass that formed as walls of large lava bubbles were common. One interesting feature was ~5-cm-diameter holes at several sites in the sand layer that appeared to be locations of recently terminated venting. An area of modest venting through a mound of small nontronite-covered boulders was found at a depth of 1,196 m. A maximum vent-fluid temperature of 17.2°C was measured. At night a S-to-N tow 3 km W of the seamount axis showed that the bulk of the hydrothermal plume above Lōʻihi had shifted from the WSW to the NE over the previous few days.
Dive operations the next day focused on completing work at Lohiau Vents. The dive finished at the E end of the vent field and collected rocks bearing several high-temperature sulfide minerals; these suggested that vent-fluid temperatures during the July-August seismic event might have been much higher. The hydrothermal site sampled on 8 October at a depth of 1,196 m on the S rift was confirmed to be a new field. It was named "Pohaku Vents".
On 10 October, a repeat of the tow-yo section made on 8 October revealed that the plume had shifted to nearly due N. This shift during only a few days indicated the speed at which the ocean currents carrying the Lōʻihi plumes could change their orientation. During the whole cruise, 71 km of tow-yos were conducted, making Lōʻihi one of the most intensively studied submarine hydrothermal systems.
Reference. Carlowicz, M., 1996, Earthquake swarm heats up Lōʻihi: EOS, v. 77, no. 42, p. 405-406.
Geologic Background. The Kama’ehuakanaloa seamount, previously known as Loihi, lies about 35 km off the SE coast of the island of Hawaii. This youngest volcano of the Hawaiian chain has an elongated morphology dominated by two curving rift zones extending north and south of the summit. The summit region contains a caldera about 3 x 4 km and exhibits numerous lava cones, the highest of which is about 975 m below the ocean surface. The summit platform also includes two well-defined pit craters, sediment-free glassy lava, and low-temperature hydrothermal venting. An arcuate chain of small cones on the western edge of the summit extends north and south of the pit craters and merges into the crests prominent rift zones. Seismicity indicates a magmatic system distinct from that of Kilauea. During 1996 a new pit crater formed at the summit, and lava flows were erupted. Continued volcanism is expected to eventually build a new island; time estimates for the summit to reach the ocean surface range from roughly 10,000 to 100,000 years.
Information Contacts: Hawaii Center for Volcanology, Department of Geology & Geophysics, University of Hawaii at Manoa, 2525 Correa Road, Honolulu, HI 96822 USA (URL: http://www.soest.hawaii.edu/GG/hcv.html); Hawaiian Volcano Observatory (HVO), U.S. Geological Survey, PO Box 51, Hawaii National Park, HI 96718, USA (URL: http://www.soest.hawaii.edu/hvo/).
Karymsky (Russia) — September 1996 Cite this Report
Karymsky
Russia
54.049°N, 159.443°E; summit elev. 1513 m
All times are local (unless otherwise noted)
Explosions send bombs to 500 m and plumes up to 5 km high
During September and the first half of October, seismicity remained above background and was indicative of continued low-level Strombolian eruptive activity. Gas-and-ash explosions occurred every 3-25 minutes, commonly generating ash-and-steam plumes 300-700 m high. However, the eruptive activity increased on 13 October. Volcanic bombs were ejected to 500 m above the crater; eruptive plumes from separate explosions rose to 3-5 km above Karymsky and extended >200 km NE and E. AVO analysis of satellite imagery confirmed a hot spot at the volcano.
Geologic Background. Karymsky, the most active volcano of Kamchatka's eastern volcanic zone, is a symmetrical stratovolcano constructed within a 5-km-wide caldera that formed during the early Holocene. The caldera cuts the south side of the Pleistocene Dvor volcano and is located outside the north margin of the large mid-Pleistocene Polovinka caldera, which contains the smaller Akademia Nauk and Odnoboky calderas. Most seismicity preceding Karymsky eruptions originated beneath Akademia Nauk caldera, located immediately south. The caldera enclosing Karymsky formed about 7600-7700 radiocarbon years ago; construction of the stratovolcano began about 2000 years later. The latest eruptive period began about 500 years ago, following a 2300-year quiescence. Much of the cone is mantled by lava flows less than 200 years old. Historical eruptions have been vulcanian or vulcanian-strombolian with moderate explosive activity and occasional lava flows from the summit crater.
Information Contacts: Tom Miller, Alaska Volcano Observatory; Vladimir Kirianov, Kamchatka Volcanic Eruptions Response Team (KVERT), Institute of Volcanic Geology and Geochemistry.
Kilauea (United States) — September 1996 Cite this Report
Kilauea
United States
19.421°N, 155.287°W; summit elev. 1222 m
All times are local (unless otherwise noted)
Eruptive activity continues; ocean entry and lava bench collapses
During August and September, the eruption along the east rift zone continued without significant change and flows entered the ocean only at Lae`apuki in Hawaii Volcanoes National Park (figure 101). During the first ten days of August, the lava pond within Pu`u `O`o was sluggish and ~100 m below the lowest part of the rim. Glows from the pond reflecting off the fume cloud over the cone were often seen at night. After a short eruptive pause on 21 August, most of the lava was confined to tubes all the way to the sea, with only a few small surface flows from breakouts. Shortly after midnight on 29 August, a large collapse removed two-thirds of the active lava bench at Lae`apuki. During the early morning of 19 September, a large block of the Lae`apuki bench slid into the ocean. Sufficient energy was transferred to the ground for the HVO seismic network to detect the event, which lasted for eight minutes.
The lava flow field from this eruption that began in 1983 covers 23,475 acres, and ~820 acres of the flow field have been resurfaced by new lava since the beginning of June, when the eruption restarted after a five-day pause (BGVN 21:05). A total of 540 acres of new land has been added to the island since lava began entering the ocean in late 1986. As has been the case with other long-lived ocean entries, bench collapses at Lae`apuki have increased in frequency and are occurring about every two weeks. After each collapse, a severed lava tube or incandescent fault scarp is exposed and violent explosions follow. Types of explosive events observed at Lae`apuki after mid-August included sudden rock blasts, sustained and powerful steam jets, lava fountains, and "bubble-bursts" from holes in the tube above the entry.
Geologic Background. Kilauea overlaps the E flank of the massive Mauna Loa shield volcano in the island of Hawaii. Eruptions are prominent in Polynesian legends; written documentation since 1820 records frequent summit and flank lava flow eruptions interspersed with periods of long-term lava lake activity at Halemaumau crater in the summit caldera until 1924. The 3 x 5 km caldera was formed in several stages about 1,500 years ago and during the 18th century; eruptions have also originated from the lengthy East and Southwest rift zones, which extend to the ocean in both directions. About 90% of the surface of the basaltic shield volcano is formed of lava flows less than about 1,100 years old; 70% of the surface is younger than 600 years. The long-term eruption from the East rift zone between 1983 and 2018 produced lava flows covering more than 100 km2, destroyed hundreds of houses, and added new coastline.
Information Contacts: Hawaiian Volcano Observatory (HVO), U.S. Geological Survey, PO Box 51, Hawaii National Park, HI 96718, USA (URL: http://www.soest.hawaii.edu/hvo/).
Koryaksky (Russia) — September 1996 Cite this Report
Koryaksky
Russia
53.321°N, 158.712°E; summit elev. 3430 m
All times are local (unless otherwise noted)
Background seismicity in late July and August
Seismicity was at or a little above normal background levels in late July and August. Historical activity at Koryaksky has been largely fumarolic, although a weak explosive eruption took place in 1956-57 from the summit crater and a radial fissure on the upper NW flank.
Geologic Background. The large symmetrical Koryaksky stratovolcano is the most prominent landmark of the NW-trending Avachinskaya volcano group, which towers above Kamchatka's largest city, Petropavlovsk. Erosion has produced a ribbed surface on the eastern flanks of the 3430-m-high volcano; the youngest lava flows are found on the upper W flank and below SE-flank cinder cones. Extensive Holocene lava fields on the western flank were primarily fed by summit vents; those on the SW flank originated from flank vents. Lahars associated with a period of lava effusion from south- and SW-flank fissure vents about 3900-3500 years ago reached Avacha Bay. Only a few moderate explosive eruptions have occurred during historical time, but no strong explosive eruptions have been documented during the Holocene. Koryaksky's first historical eruption, in 1895, also produced a lava flow.
Information Contacts: Tom Miller, Alaska Volcano Observatory (AVO), 4200 University Drive, Anchorage, AK 99508-4667, USA; Vladimir Kirianov, Kamchatka Volcanic Eruptions Response Team (KVERT), Institute of Volcanic Geology and Geochemistry, Piip Ave. 9, Petropavlovsk-Kamchatsky, 683006, Russia.
Krakatau (Indonesia) — September 1996 Cite this Report
Krakatau
Indonesia
6.1009°S, 105.4233°E; summit elev. 285 m
All times are local (unless otherwise noted)
Thick plume to an altitude of 3.7 km on 29 September
At about 1140 on 29 September, a Qantas Airlines pilot reported a thick plume near Krakatau that rose to an altitude of 3,700 m and drifted NW at low levels and E at high levels. There was no definite signature on GMS satellite images.
Geologic Background. The renowned Krakatau (frequently mis-named as Krakatoa) volcano lies in the Sunda Strait between Java and Sumatra. Collapse of an older edifice, perhaps in 416 or 535 CE, formed a 7-km-wide caldera. Remnants of that volcano are preserved in Verlaten and Lang Islands; subsequently the Rakata, Danan, and Perbuwatan cones were formed, coalescing to create the pre-1883 Krakatau Island. Caldera collapse during the catastrophic 1883 eruption destroyed Danan and Perbuwatan, and left only a remnant of Rakata. This eruption caused more than 36,000 fatalities, most as a result of tsunamis that swept the adjacent coastlines of Sumatra and Java. Pyroclastic surges traveled 40 km across the Sunda Strait and reached the Sumatra coast. After a quiescence of less than a half century, the post-collapse cone of Anak Krakatau (Child of Krakatau) was constructed within the 1883 caldera at a point between the former Danan and Perbuwatan cones. Anak Krakatau has been the site of frequent eruptions since 1927.
Information Contacts: Bureau of Meteorology, Northern Territory Regional Office, P.O. Box 735, Darwin NT 0801, Australia; NOAA/NESDIS Satellite Analysis Branch (SAB), Room 401, 5200 Auth Road, Camp Springs, MD 20746, USA.
Langila (Papua New Guinea) — September 1996 Cite this Report
Langila
Papua New Guinea
5.525°S, 148.42°E; summit elev. 1330 m
All times are local (unless otherwise noted)
Moderate Vulcanian activity; vapor-and-ash clouds, ashfall, crater glows
Crater 3 remained quiet during September. Moderate Vulcanian activity at Crater 2 continued until 14 September; after then the activity declined to weak emissions of thin, white vapor. Emissions from Crater 2 produced thin white to thick gray vapor-and-ash clouds, which rose to a few hundred meters above the crater rim. Ash-laden emissions were commonly accompanied by low rumbling sounds. On 4-6, 10, and 13-14 September, strong explosions resulted in light ashfall on populated areas to the NW. Weak, steady crater glows were observed on most nights before 14 September. The Langila seismographs were inoperative during September.
Geologic Background. Langila, one of the most active volcanoes of New Britain, consists of a group of four small overlapping composite basaltic-andesitic cones on the lower E flank of the extinct Talawe volcano in the Cape Gloucester area of NW New Britain. A rectangular, 2.5-km-long crater is breached widely to the SE; Langila was constructed NE of the breached crater of Talawe. An extensive lava field reaches the coast on the N and NE sides of Langila. Frequent mild-to-moderate explosive eruptions, sometimes accompanied by lava flows, have been recorded since the 19th century from three active craters at the summit. The youngest and smallest crater (no. 3 crater) was formed in 1960 and has a diameter of 150 m.
Information Contacts: Chris McKee and Ben Talai, RVO.
Ol Doinyo Lengai (Tanzania) — September 1996 Cite this Report
Ol Doinyo Lengai
Tanzania
2.764°S, 35.914°E; summit elev. 2962 m
All times are local (unless otherwise noted)
Crater observations during July-September
The following report summarizes morphological changes in the summit crater seen during visits on 16 July, 17 August, and 24 September (figures 42-46). The crater was estimated to be ~400 m in diameter. Emissions of carbonatitic lava have been observed on many visits since July 1995 (BGVN 20:10, 20:11/12, 21:04, and 21:06).
On 16 July Celia Nyamweru and Mark Alvin reported that cone T39 was bubbling and splashing clots of molten lava every 30-60 seconds. The largest splashes reached 1-2 m above the vent. There was a recently formed pahoehoe flow ~50 m long and 2-3 m wide coming from the E side of cone T37. The continuous noise of gas escaping at high pressure was heard from a new vent, T38, between T5T9 and T20. Another new vent, T40, had formed by the N wall of the crater; it had produced a pahoehoe flow that covered a large portion of N and NE crater floor. At the time of the visit the sound of bubbling lava was coming from within this vent. Considerable volumes of steam were escaping from a longitudinal crack trending NW-SE on the W part of the crater floor, and sulfur fumes were escaping from a deep open crack on the E rim.
T24 was partially filled with lava from T37S; there was some sulfur staining and steaming emissions on it. T5T9 was also emitting small amounts of steam (figure 44). T37S, now a broad cone with several peaks, was taller than T5T9. It had emitted several pahoehoe flows toward E and between T5T9 and the crater wall, totally covering F35. T37N showed an open pit below an overhanging wall, and T36 had a spine recently formed on its top. T20 appeared white-to-pale brown, with a rounded top and some steam emission. Near its base T35 had almost completely crumbled and collapsed. A small open circular vent (not numbered) at the base of the E wall had covered some of the vegetation on the crater wall with spatters of lava. It was surrounded by an overhang with small lava stalactites. Slight warmth was perceived from the vent but the lava stalactites were white. T15, T8, and T14, buried under recent flows from T40 and T37S, were no longer visible. The crater walls had several vertical cracks on the NW side, the lowest wall, facing E, was ~8 m high.
Christoph Weber reported that on 17 August the crater floor had been covered with new black aa and pahoehoe lava flows. Weber had met another traveler, however, who had observed no eruptice activity about 14 days earlier. When Weber visited, he estimated the thickness of the fresh flows as typically ~20-30 cm. Fresh flows were easy to distinguish because they change from black to grayish white as they cool. They were often stacked, particularly on flow field F37, the one most active at that time, forming a composite of new flow material perhaps a meter thick overall. The area covered by these new flows was ~30,000 m2. Thus, in the first half of August, the volume of erupted lava was on the order of 30,000 m3. Because of the rough irregular surfaces on some flows, their contacts with successive flows often contained considerable void space. Many of the flows were tube-fed, the tubes typically being 10- to 150-m long. When Weber left on 17 August lavas still poured out. He also observed a lava fountain ~3-m-high on T37. On 24 September some students from St. Lawrence University observed continuous bubbling and spattering of lavas from several vents.
Geologic Background. The symmetrical Ol Doinyo Lengai is the only volcano known to have erupted carbonatite tephras and lavas in historical time. The prominent stratovolcano, known to the Maasai as "The Mountain of God," rises abruptly above the broad plain south of Lake Natron in the Gregory Rift Valley. The cone-building stage ended about 15,000 years ago and was followed by periodic ejection of natrocarbonatitic and nephelinite tephra during the Holocene. Historical eruptions have consisted of smaller tephra ejections and emission of numerous natrocarbonatitic lava flows on the floor of the summit crater and occasionally down the upper flanks. The depth and morphology of the northern crater have changed dramatically during the course of historical eruptions, ranging from steep crater walls about 200 m deep in the mid-20th century to shallow platforms mostly filling the crater. Long-term lava effusion in the summit crater beginning in 1983 had by the turn of the century mostly filled the northern crater; by late 1998 lava had begun overflowing the crater rim.
Information Contacts: Celia Nyamweru, Department of Anthropology, St. Lawrence University, Canton, NY 13617 USA; Christoph Weber, Kruppstrasse 171, 42113 Wuppertal, Germany.
Lopevi (Vanuatu) — September 1996 Cite this Report
Lopevi
Vanuatu
16.507°S, 168.346°E; summit elev. 1413 m
All times are local (unless otherwise noted)
Fumarolic emissions and sulfur deposits seen during overflight
An overflight on 21 and 22 July allowed observation of the summit for a few minutes. Activity at the two summit craters consisted of fumarolic emissions from the S interior wall of the principal crater, which is also the highest. A few yellow sulfur deposits carpet the interior walls of the cone, principally on the S and SW.
Geologic Background. The small 7-km-wide conical island of Lopevi, known locally as Vanei Vollohulu, is one of Vanuatu's most active volcanoes. A small summit crater containing a cinder cone is breached to the NW and tops an older cone that is rimmed by the remnant of a larger crater. The basaltic-to-andesitic volcano has been active during historical time at both summit and flank vents, primarily along a NW-SE-trending fissure that cuts across the island, producing moderate explosive eruptions and lava flows that reached the coast. Historical eruptions at the 1413-m-high volcano date back to the mid-19th century. The island was evacuated following major eruptions in 1939 and 1960. The latter eruption, from a NW-flank fissure vent, produced a pyroclastic flow that swept to the sea and a lava flow that formed a new peninsula on the western coast.
Information Contacts: Henry Gaudru, C. Pittet, C. Bopp, and G. Borel, Société Volcanologique Européenne, C.P. 1, 1211 Genève 17, Switzerland (URL: http://www.sveurop.org/); Michel Lardy, Centre ORSTOM, B.P. 76, Port Vila, Vanuatu.
Maderas (Nicaragua) — September 1996 Cite this Report
Maderas
Nicaragua
11.446°N, 85.515°W; summit elev. 1394 m
All times are local (unless otherwise noted)
Lahar kills six people
During the night of 27 September, a lahar triggered by unusually heavy rainfalls occurred on the E flank of Maderas and destroyed the village of El Corozal (~3 km from the volcano) and other settlements.
Five children and an adult were killed, and several more people injured. The full extent of the damage became evident only after a few days: rocks, mud, and water had destroyed 36 houses and heavily damaged crops; some areas were covered with 2 m of mud and water. About 250 people were affected by the lahar and evacuated to a local school.
Two policemen, who climbed the volcano two days after the lahar, observed a small crater at the starting point of the lahar. They presumed that a minor volcanic explosion could have triggered the event, but this has not been confirmed by Nicaraguan volcanologists. A local farmer reported a strange thunder sound minutes before the lahar came down.
Geologic Background. Volcán Maderas is a roughly conical stratovolcano that forms the SE end of the dumbbell-shaped Ometepe island in Lake Nicaragua. The basaltic-to-trachydacitic edifice is cut by numerous faults and grabens, the largest of which is a NW-SE-oriented graben that cuts the summit and has at least 140 m of vertical displacement. The small Laguna de Maderas lake occupies the bottom of the 800-m-wide summit crater, which is located at the western side of the central graben. The SW side of the edifice has been affected by large-scale slumping. Several pyroclastic cones, some of which may have originated from littoral explosions produced by lava flow entry into Lake Nicaragua, are situated on the lower NE flank down to the level of Lake Nicaragua. The latest period of major growth was considered to have taken place more than 3000 years ago, but later detailed mapping has shown that the most recent dated eruptive activity took place about 70,000 years ago and that it has likely been inactive for tens of thousands of years (Kapelanczyk et al., 2012). A lahar in September 1996 killed six people in an E-flank village, but associated volcanic activity was not confirmed.
Information Contacts: Wilfried Strauch, Instituto Nicaraguense de Estudios Territoriales (INETER), Dept. of Geophysics, Managua, Nicaragua.
Manam (Papua New Guinea) — September 1996 Cite this Report
Manam
Papua New Guinea
4.08°S, 145.037°E; summit elev. 1807 m
All times are local (unless otherwise noted)
Increased eruptive activity at both Main and South Craters
During early September, both Main and South Craters emitted weak to moderate white vapor. Main Crater started to produce occasional puffs of gray vapor and ash on 13 September, and became more forceful and frequent (at a-few-minute intervals) the next day. This increased eruptive activity during mid-September resulted in very light ashfall over villages and garden areas on the NW side of the island. This is the first time that Main Crater has been active since mid-December 1992. The activity began to decline on 20 September. Occasional roaring or rumbling sounds were heard, but neither glow nor incandescent projection was seen at night. By 26 September emissions were weak and took place every 30 minutes.
During 16-29 September, activity at South Crater also slightly increased with occasional blue and gray emissions. Mild Vulcanian explosions took place every 5-10 minutes on 22-27 September. However, neither night glow nor incandescent projection was observed over the crater.
There was no seismic monitoring at Manam during September. Measurements from the water-tube tiltmeters at Tabele Observatory (4 km SW of the summit) have shown no tilt change since April 1996.
Geologic Background. The 10-km-wide island of Manam, lying 13 km off the northern coast of mainland Papua New Guinea, is one of the country's most active volcanoes. Four large radial valleys extend from the unvegetated summit of the conical basaltic-andesitic stratovolcano to its lower flanks. These valleys channel lava flows and pyroclastic avalanches that have sometimes reached the coast. Five small satellitic centers are located near the island's shoreline on the northern, southern, and western sides. Two summit craters are present; both are active, although most observed eruptions have originated from the southern crater, concentrating eruptive products during much of the past century into the SE valley. Frequent eruptions, typically of mild-to-moderate scale, have been recorded since 1616. Occasional larger eruptions have produced pyroclastic flows and lava flows that reached flat-lying coastal areas and entered the sea, sometimes impacting populated areas.
Information Contacts: Chris McKee and Ben Talai, RVO.
Pacaya (Guatemala) — September 1996 Cite this Report
Pacaya
Guatemala
14.382°N, 90.601°W; summit elev. 2569 m
All times are local (unless otherwise noted)
Moderate Strombolian eruption; fountaining up to 500 m; lava flow
Pacaya erupted more forcefully than usual beginning late on 10 October. Based on an INSIVUMEH report, between about 2300 on 10 October and 0200 on 11 October Pacaya produced a moderate Strombolian eruption with sustained fountaining of incandescent materials up to 500 m high.
The plume's maximum height reached ~3.7 km altitude; within that plume the ash column rose to ~700 m. During the eruption winds blew from the NNE at 35 km/hour with gusts to 45 km/hour; they carried fine ash toward the town of Esquintla. A report from Puerto San Jose, a city on the Pacific coast ~60 km SW, indicated that the earlier dark ash cloud had thinned during the day.
The explosive eruption was followed by significant lava effusion from the crater. The longest lava flow traveled SW for 1.5 km over the surface of an older flow field. At 0300 the flow front's velocity was 100 m/hour; it came within 300 m of the relatively flat area reached by the 1991 lava flow. Lava ceased venting at dawn; however, the SW flow remained incandescent and slowly moving. Although eruptive strength diminished, some tremor persisted on 11 October. On that day satellite images (Band 2 on GOES-8) showed a small hot spot. An INSIVUMEH report on 14 October noted that ongoing eruptions continued into the morning of the 12th. After that the eruptive vigor and amount of tremor both dropped and no new lava vented from the crater.
On 16 October INSIVUMEH reported that Pacaya continued to expel abundant white steam. At that time there were no audible explosions, underground booming noises, or newly vented lava flows. Tremor was present, presumably related to the degassing seen at the surface. Eddy Sanchez noted that 38 people were evacuated from neighboring villages during the height of the eruption.
Geologic Background. Eruptions from Pacaya are frequently visible from Guatemala City, the nation's capital. This complex basaltic volcano was constructed just outside the southern topographic rim of the 14 x 16 km Pleistocene Amatitlán caldera. A cluster of dacitic lava domes occupies the southern caldera floor. The post-caldera Pacaya massif includes the older Pacaya Viejo and Cerro Grande stratovolcanoes and the currently active Mackenney stratovolcano. Collapse of Pacaya Viejo between 600 and 1,500 years ago produced a debris-avalanche deposit that extends 25 km onto the Pacific coastal plain and left an arcuate scarp inside which the modern Pacaya volcano (Mackenney cone) grew. The NW-flank Cerro Chino crater was last active in the 19th century. During the past several decades, activity has consisted of frequent Strombolian eruptions with intermittent lava flow extrusion that has partially filled in the caldera moat and covered the flanks of Mackenney cone, punctuated by occasional larger explosive eruptions that partially destroy the summit.
Information Contacts: Eddy Sanchez and Otoniel Matías, Seccion Vulcanologia, INSIVUMEH (Instituto Nacional de Sismologia, Vulcanologia, Meteorologia e Hydrologia of the Ministerio de Communicaciones, Transporte y Obras Publicas), 7A Avenida 14-57, Zona 13, Guatemala City, Guatemala; NOAA/NESDIS Satellite Analysis Branch, Room 401, 5200 Auth Road, Camp Springs, MD 20746, USA.
Pavlof (United States) — September 1996 Cite this Report
Pavlof
United States
55.417°N, 161.894°W; summit elev. 2493 m
All times are local (unless otherwise noted)
Increasing seismicity corresponds to stronger eruptive activity
Residents of the Alaska Peninsula observed small glowing plumes from Pavlof on 15 September. During the next week, seismicity was vigorous and eruptions were intermittent (BGVN 21:08). At 1328 on 24 September seismicity began to increase, suggesting stronger eruptive activity. This increased level of seismicity persisted through the first half of October. Visual observations and satellite imagery verified that increased seismicity correlated with eruptions of ash and bombs up to 1,200 m above the summit.
On 26 September satellite imagery showed a small steam-and-ash plume extending ~45 km SE. A pilot subsequently reported a steam plume to an estimated altitude of 3,700 m. AVO staff doing airborne observations during 27-30 September reported low-level fountaining and occasional small explosions of incandescent material in the summit crater. The small explosions produced sporadic steam-and-ash plumes to 610 m above the vent. The largest plume drifted S for ~110 km and appeared faintly on satellite images. Incandescent spatter was deposited on the NW summit slope or moved down a deep gully on the NW side of the volcano.
During 4-11 October lava fountaining from two vents continued to heights of a few hundred meters above the summit. Incandescent spatter-fed lava flows moved down the steep, snow- and ice-covered slope, widening at the base and extending NW. Occasional water-rich slurries of ash and mud descended the N flank. Diffuse plumes of steam, gas, and ash rose to as high as 6 km above sea level and drifted 160 km downwind. On 15 October eruptive activity increased and seismicity reached the highest levels yet observed. Satellite imagery and pilot reports showed ongoing lava fountaining from two vents near the summit. Pilot reports indicated that diffuse ash layers reached 7,300-m altitude and extended perhaps as far as 50 km SE.
Geologic Background. The most active volcano of the Aleutian arc, Pavlof is a Holocene stratovolcano that was constructed along a line of vents extending NE from the Emmons Lake caldera. Pavlof and Pavlof Sister to the NE form a dramatic pair of symmetrical, glacier-covered stratovolcanoes that overlook Pavlof and Volcano bays. Little Pavlof is a smaller cone on the SW flank of Pavlof volcano, near the rim of Emmons Lake caldera. Unlike Pavlof Sister, eruptions have frequently been reported from Pavlof, typically Strombolian to Vulcanian explosive eruptions from the summit vents and occasional lava flows. The active vents lie near the summit on the north and east sides. The largest recorded eruption took place in 1911, at the end of a 5-year-long eruptive episode, when a fissure opened on the N flank, ejecting large blocks and issuing lava flows.
Information Contacts: Alaska Volcano Observatory (AVO), a cooperative program of a) U.S. Geological Survey, 4200 University Drive, Anchorage, AK 99508-4667, USA (URL: http://www.avo.alaska.edu/), b) Geophysical Institute, University of Alaska, PO Box 757320, Fairbanks, AK 99775-7320, USA, and c) Alaska Division of Geological & Geophysical Surveys, 794 University Ave., Suite 200, Fairbanks, AK 99709, USA.
Rabaul (Papua New Guinea) — September 1996 Cite this Report
Rabaul
Papua New Guinea
4.2459°S, 152.1937°E; summit elev. 688 m
All times are local (unless otherwise noted)
Strong explosions produce ash clouds and ashfall
Mild eruptions continued at Tavurvur during September. Weak, white to pale-gray vapor-and-ash emissions took place at short irregular intervals, and plumes rose ~1,000 m above the crater. These emissions were occasionally accompanied by roaring sounds. On 2, 7, and 9-12 September, strong explosions sent ash clouds up to 4 km above the crater, resulting in light ashfall on Matupit Island and Rabaul town.
After the explosions on 26 August (BGVN 21:08), the release of SO2 was at a low level of ~200 metric tons/day (t/d). However, the flux rate gradually increased and reached ~1,500 t/d on the night of the 11 September explosions. Seismicity showed variations similar to the SO2 flux. The background seismicity level was 5-20 low-frequency events/hour and 30-100 RSAM (Real-time Seismic Amplitude Measurement) units. From 8 to 10 September, seismicity increased to ~40 low-frequency events/hour and 100-200 RSAM units. After the eruption on 11 September, seismicity returned to a normal level (3-15 events/hour and 25-100 RSAM units). Ground deformation was not evident around the mid-September eruptions.
After 18 September, seismic activity increased to medium levels (30-40 events/hour and 50-150 RSAM units). Likewise, the flux rates of SO2 changed from 200-400 t/d to 1,000-1,500 t/d by the end of September. Beginning on 22 September, tiltmeters recorded deflation of the central caldera reservoir at a rate of up to 1 µrad/day. Following these anomalies, strong eruptions took place in early October, sending ash clouds to an altitude of 5.5 km.
Geologic Background. The low-lying Rabaul caldera on the tip of the Gazelle Peninsula at the NE end of New Britain forms a broad sheltered harbor utilized by what was the island's largest city prior to a major eruption in 1994. The outer flanks of the asymmetrical shield volcano are formed by thick pyroclastic-flow deposits. The 8 x 14 km caldera is widely breached on the east, where its floor is flooded by Blanche Bay and was formed about 1,400 years ago. An earlier caldera-forming eruption about 7,100 years ago is thought to have originated from Tavui caldera, offshore to the north. Three small stratovolcanoes lie outside the N and NE caldera rims. Post-caldera eruptions built basaltic-to-dacitic pyroclastic cones on the caldera floor near the NE and W caldera walls. Several of these, including Vulcan cone, which was formed during a large eruption in 1878, have produced major explosive activity during historical time. A powerful explosive eruption in 1994 occurred simultaneously from Vulcan and Tavurvur volcanoes and forced the temporary abandonment of Rabaul city.
Information Contacts: C. McKee and B. Talai, Rabaul Volcano Observatory (RVO), P.O. Box 386, Rabaul, Papua New Guinea; NOAA/NESDIS Satellite Analysis Branch (SAB), Room 401, 5200 Auth Road, Camp Springs, MD 20746, USA.
Nevado del Ruiz (Colombia) — September 1996 Cite this Report
Nevado del Ruiz
Colombia
4.892°N, 75.324°W; summit elev. 5279 m
All times are local (unless otherwise noted)
Seismic swarms; gas plumes; newly found fumarolic field and hot spring
During May-July, seismic activity at Ruiz remained quite low. Significant volcano-tectonic earthquake swarms occurred on 8, 10, 11, 16, and 23 May, and 7, 15, and 18 June (figure 48). Most were located at depths of <7 km and within 3 km of Arenas Crater. The strongest volcano-tectonic earthquake (M 2.2) was recorded at 1636 on 10 May. Swarms of long-period events were registered on 9, 20, 23, and 25 May. Scientists working in the field reported that an isolated long-period event at 1153 on 29 May was correlated with an explosion-like sound possibly caused by the fall of solid material. The analog recorders detected this event, but the digital systems did not.
Visual monitoring indicated that normal white gas plumes occurred over the Ruiz summit and reached an altitude of <2 km. The FARALLONES electronic tiltmeter did not record any significant deformations during May-July.
A new fumarolic field and a hot spring, both called "El Calvario," were found 1.7 km NE of Arenas Crater at an elevation of 4,628 m. The fumarole had a temperature of 84°C and pH of 3.8. Emissions consisted of: H2O vapor, 95.5%; CO2, 4.3%; total S, 0.18%; and HCl, 0.001%. The water from the hot spring had the following features: temperature, 66.4°C; pH, 2.7; Cl, 10 ppm; and SO4, 1,545 ppm.
Geologic Background. Nevado del Ruiz is a broad, glacier-covered volcano in central Colombia that covers more than 200 km2. Three major edifices, composed of andesitic and dacitic lavas and andesitic pyroclastics, have been constructed since the beginning of the Pleistocene. The modern cone consists of a broad cluster of lava domes built within the caldera of an older edifice. The 1-km-wide, 240-m-deep Arenas crater occupies the summit. The prominent La Olleta pyroclastic cone located on the SW flank may also have been active in historical time. Steep headwalls of massive landslides cut the flanks. Melting of its summit icecap during historical eruptions, which date back to the 16th century, has resulted in devastating lahars, including one in 1985 that was South America's deadliest eruption.
Information Contacts: John Jairo Sánchez, Alvaro Pablo Acevedo, Fernando Gil Cruz, John Makario Londoño, Jairo Patiño Cifuentes, Claudia Alfaro Valero, Hector Mora Páez, Cesar A. Carvajal, Luis Fernando Guarnizo, and Jair Ramirez, INGEOMINAS Observatorio Vulcanológico y Sismológico de Manizales (OVSM), A.A. 1296, Manizales, Caldas, Colombia.
Santa Maria (Guatemala) — September 1996 Cite this Report
Santa Maria
Guatemala
14.757°N, 91.552°W; summit elev. 3745 m
All times are local (unless otherwise noted)
Small explosion from Santiaguito dome
The main crater (Caliente) of Santa María's active dome, Santiaguito, issued a 300-m-high explosion at 0631 on 14 October. Ash from the explosion blew E and small avalanches traveled down the E and S flanks. Brief explosions from the Caliente vent at Santiaguito were last reported in November 1993. However, it is likely that there has been near-continuous low-level activity since that time.
Geologic Background. Symmetrical, forest-covered Santa María volcano is part of a chain of large stratovolcanoes that rise above the Pacific coastal plain of Guatemala. The sharp-topped, conical profile is cut on the SW flank by a 1.5-km-wide crater. The oval-shaped crater extends from just below the summit to the lower flank, and was formed during a catastrophic eruption in 1902. The renowned Plinian eruption of 1902 that devastated much of SW Guatemala followed a long repose period after construction of the large basaltic andesite stratovolcano. The massive dacitic Santiaguito lava-dome complex has been growing at the base of the 1902 crater since 1922. Compound dome growth at Santiaguito has occurred episodically from four vents, with activity progressing E towards the most recent, Caliente. Dome growth has been accompanied by almost continuous minor explosions, with periodic lava extrusion, larger explosions, pyroclastic flows, and lahars.
Information Contacts: Eddie Sánchez and Otoniel Matías, INSIVUMEH.
Semeru (Indonesia) — September 1996 Cite this Report
Semeru
Indonesia
8.108°S, 112.922°E; summit elev. 3657 m
All times are local (unless otherwise noted)
Intermittent pilot reports of eruptions from August to October
A pilot report from Qantas Airlines on 1 August noted an ash cloud at an altitude of 4,000 m. Animated visible and infrared GMS satellite data through 0832 on 2 August did not reveal any discernible ash plume.
Another Qantas pilot report indicated that Semeru erupted at 1625 and 1637 on 12 September with ash reaching 4,600-m altitude and drifting NW; no plume was seen on satellite imagery. At approximately 0640 the next day a localized plume was evident on satellite imagery drifting SSW to ~35 km away. Eruptive activity was again observed by Qantas pilots who reported at 1154 on 29 September thick black "smoke" at 6 km altitude. Another aircraft report at 2110 later that day indicated ash to 6 km moving N and NW. Satellite data showed local high cloud cover throughout the day, but no apparent ash plume.
On 6 October an eruption was reported by Qantas pilots at 1418. The dense plume was rising to ~4.6 km altitude with no significant drift.
Semeru is the highest and one of the most active volcanoes of Java. It lies at the S end of a volcanic massif extending N to the Tengger Caldera and has been in almost continuous eruption since 1967.
Geologic Background. Semeru, the highest volcano on Java, and one of its most active, lies at the southern end of a volcanic massif extending north to the Tengger caldera. The steep-sided volcano, also referred to as Mahameru (Great Mountain), rises above coastal plains to the south. Gunung Semeru was constructed south of the overlapping Ajek-ajek and Jambangan calderas. A line of lake-filled maars was constructed along a N-S trend cutting through the summit, and cinder cones and lava domes occupy the eastern and NE flanks. Summit topography is complicated by the shifting of craters from NW to SE. Frequent 19th and 20th century eruptions were dominated by small-to-moderate explosions from the summit crater, with occasional lava flows and larger explosive eruptions accompanied by pyroclastic flows that have reached the lower flanks of the volcano.
Information Contacts: Bureau of Meteorology, Northern Territory Regional Office, P.O. Box 735, Darwin, NT 0801, Australia; NOAA/NESDIS Satellite Analysis Branch (SAB), Room 401, 5200 Auth Road, Camp Springs, MD 20746, USA; Tom Fox, International Civil Aviation Organization (ICAO), 999 University Street, Montreal, Quebec H3C 5H7, Canada.
Soufriere Hills (United Kingdom) — September 1996 Cite this Report
Soufriere Hills
United Kingdom
16.72°N, 62.18°W; summit elev. 915 m
All times are local (unless otherwise noted)
Large destructive explosion 17 September
The following condenses the weekly Scientific Reports of the Montserrat Volcano Observatory (MVO) and stated sources for the period 1 September-1 October.
Observations during 1-14 September. The early days of the month were characterized by several periods of intense rockfalls and pyroclastic flows from the E flank of the lava dome. The steepening of the dome's active flank caused a partial gravitational collapse on 2 and 3 September. The resulting pyroclastic flows were generally confined to the S part of the Tar River valley although they came from N of Castle Peak (figure 10). The pyroclastic flows caused significant erosion in the middle part of the valley and deposition in the lower part and at the mouth of the Tar River, on the pyroclastic-flow delta built up since late July. Excavation of a deep (>10 m) channel from the base of the new dome through the upper part of the talus fan confined the flows giving them greater run-out potential. The scar left on the E flank was soon refilled by continuous rockfall activity and new dome growth. Samples of the pyroclastic-flow deposits on the delta contained less vesicular material than other deposits since late July, and were typically ash-rich, very poorly sorted, and contained juvenile lava blocks to at least 50 cm diameter.
The pyroclastic flows of 2 and 3 September produced ash clouds that rose 6 km, but there was no evidence of vertical columns from the summit of the dome. The ash clouds deposited 1-2 cm of ash in the Cork Hill area, and >5 mm farther N in the Old Towne area. MVO estimated the volume of ash deposited on 2 and 3 September to be equivalent to a rock volume of 7 x 10⁴ m3. In addition to this description from MVO, a local newspaper, The Montserrat Reporter, said these events caused ash to fall on nearly every part of the island from St. Patrick's in the SW, to St. John's in the N, and from Plymouth in the W to Long Ground in the NE, including Bramble Airport. For the remainder of the period, rockfall and associated pyroclastic-flow activity was confined almost exclusively to the E flank. After the major ash falls of 2 and 3 September more moderate amounts were deposited W of the volcano.
Signals from rockfalls and pyroclastic flows dominated the seismic records during this observation period. Long-period and hybrid events remained at background levels and tremor was generally low. Volcano-tectonic earthquakes occurred exclusively in short swarms lasting 1-6 hours. The volcano-tectonic earthquakes were all located <2 km below sea level beneath the crater.
The passage of a hurricane caused several days of strong winds and heavy rain making visual observation of the dome difficult, and causing flash floods that deposited ~60 cm of sediment in Fort Ghaut's lower reaches.
Observations during 15-21 September. Several small pyroclastic flows occurred on 15 September, the largest reaching beyond the Tar River Soufriere. Ash clouds from rockfalls and flows were generally blown NW. Intense ash and steam venting during 1250-1320 on 15 September came from the highest part of the dome W of the active area.
Near-continuous rockfalls started late on the morning of 16 September and by mid-afternoon, numerous pyroclastic flows were being produced by gravitational collapse from the lava dome. Many of these pyroclastic flows reached the sea, extending considerably the depositional fan at the mouth of the Tar River valley. Continuous ash production from the flows fed into a convective column that reached heights of 2-3 km and deposited ash on areas W of the volcano. Activity slowed somewhat in the middle of the evening as pyroclastic flow generation stopped.
Activity restarted at 2342 on 17 September with a small explosive eruption. A laterally directed explosion projected ballistic clasts toward the E (over the Hermitage area and into Long Ground village) and an eruption column was briefly sustained. More than half of the houses in Long Ground were damaged by blocks falling through roofs, doors, and windows. Eight buildings, including the Pentecostal Church, were burnt in Long Ground, all from extremely hot rocks falling on them. The Tar River Estate House was partially demolished by a pyroclastic surge. Gravel-sized material of both pumiceous and dense nature was deposited at Cork Hill, Richmond Hill, and Fox's Bay from the eruption column. The Montserrat Reporter noted that many vehicles had lost their windscreens from "falling pebble rocks". On the other hand, MVO data suggested that the number of windscreen breakages was actually quite low and that ash loading contributed substantially to breakages. All ash erupted during the night was blown W over Plymouth and Richmond Hill and both of these areas received heavy ashfall.
In an electronic forum, Douglas Darby, an eyewitness, reported: "From Iles Bay, you could hear something coming from the direction of the volcano, at about [2345 on 17 September]. It sounded like a low roar, the first time ever in Iles Bay that you could hear any noise from the volcano. Immediately after, thunder and lightning began and it was obvious that this was not anything experienced before . . . And then the rain of stones began . . . Visually you could not really see much at that time but we thought we could see a low level of glowing all across the area where we know is Tar River, from the direction of the pyroclastic flows."
Reports from the NOAA Satellite Analysis Branch indicated that the ash column attained a height of at least 12 km and caused the closure of the airport in Guadeloupe on the morning of 18 September. Pilot and NOAA reports and personal communication with Tom Casadevall indicated that an Air Canada flight inadvertently entered the ash plume on 17 September. Dave Schneider of MTU collected and processed two AVHRR scenes of the ash plume from 18 September: at 0544 the plume was 175 km long E-W and 75 km wide N-S, at 1018 the cloud became very diffuse as it extended 550 km E and 85 km N-S (figure 11).
A major collapse scar cut deeply into the new dome's E flank. Some material was eroded from Castle Peak and a large volume was deposited in the Tar River Valley. The delta at the mouth of the Tar River Valley was enlarged and the vegetation was completely destroyed. MVO estimates stated that perhaps 25-30% of the new dome was removed.
Several small rockfalls from the inner steep-sided walls of the scar, particularly on the N and NW, generated small ash clouds and deposited new debris at the base of the valley. On 19 September field workers found pumice clasts of up to 95 g at 3 km and clasts up to 3.5 g at 6 km. On 22 September a sampling expedition to the Tar River area obtained a temperature of 373°C at a depth of 45 cm in the pyroclastic-flow deposits close to the Tar River Estate House.
Seismicity during this period was characterized by brief swarms of volcano-tectonic earthquakes from a shallow source. These swarms occurred immediately before the most intense rockfalls and increased in frequency and duration preceding the 17-18 September explosion. After 18 September the frequency of volcano-tectonic earthquakes decreased from 2-3 swarms/day to single isolated events at the end of the observation period. Long-period and hybrid events remained low, averaging <11 events/day; low-amplitude tremor was recorded on the Gages seismometer.
Observations during 24-30 September. Activity kept decreasing in intensity during the last part of the month. On 24 September visual observations of the scar's interior showed no signs of new material apart from debris derived from rockfalls off the side walls. Abundant steaming and sulfur deposits were observed at the base of the scar. Rockfalls were very small, mainly concentrated within the scar and associated with continued stabilization of the inner walls of the scar. The lack of large rockfalls suggests that any new dome growth was limited to the interior of the dome, probably at the base of the scar feature caused by the 17 September explosion. On 26 September some red-hot rock and high-temperature gases were seen in the bottom of the scar, suggesting that fresh magma was getting close to the surface again; however material falling from the scar walls covered any new dome growth. Light ashfall, possibly associated with small rockfalls into the scar, was observed by a field team near Chances Peak on 28 September.
On 30 September some areas to the SW and along the base of the scar showed light swelling. This may be due to new dome growth beneath the blocky deposits that line the base of the scar. The N part of the scar had a vertical cliff face with a nearly horizontal, bowl-shaped base, grading downward and outward to the Tar River Valley. Several unstable blocks were observed on the top inner parts of the NE sides of the scar.
Small rockfalls were the most dominant type of seismic signal recorded during this period, but hybrid and volcano-tectonic activity became more prominent during the latter part of the week. Volcano-tectonic earthquakes reappeared from 26 September onwards. They were transitional to hybrid events with a short high-frequency onset and low-frequency coda. The levels of long-period and hybrid events remained comparatively low throughout this period, averaging <11 events/day. Hybrid activity increased somewhat during the latter part of the week in tandem with the increase in volcano-tectonic activity. Tremor levels were high during the earlier parts of the week due to heavy rains. In Fort Ghaut, mudflows resulted from remobilization of thick ash deposits from the 17-18 September explosion.
EDM measurements. Measurements taken on 11 September from White's Yard to Castle Peak showed a 1 cm/day shortening trend, slightly higher than the trend established since mid-July. The Galway's to Chances Peak line was measured on 13 September, but it continued to show inconsistent changes, although shortening was predominant.
On 16 September a shortening of 2.8 cm on the St. George Hill-Farrell's line (N triangle) was measured since 22 August, whereas the two other lines in this triangle -- Windy Hill-Farrell's and St. George's Hill-Windy Hill -- did not change. Between 16 and 21 September the lines St. George's Hill-Farrell's and Windy Hill-Farrell's lengthened by 4 and 9 mm, respectively. These changes, however, are not considered to be related to the 17-18 September explosion. On 25 September the N triangle showed shortening on the St. George Hill-Farrell's and Windy Hill-Farrell's lines of 4 and 11 mm, respectively. Although little consistency is found in the changes of this triangle, a slight overall trend of shortening is observed.
Line lengths between Lower-Upper Amersham and Lower Amersham-Chances Peak showed changes of +48 mm and -1 mm, respectively, during 20-26 September. On 30 September the Galloways-Chances Peak line was found to have lengthened 13 mm during the previous 16 days.
Geologic Background. The complex, dominantly andesitic Soufrière Hills volcano occupies the southern half of the island of Montserrat. The summit area consists primarily of a series of lava domes emplaced along an ESE-trending zone. The volcano is flanked by Pleistocene complexes to the north and south. English's Crater, a 1-km-wide crater breached widely to the east by edifice collapse, was formed about 2000 years ago as a result of the youngest of several collapse events producing submarine debris-avalanche deposits. Block-and-ash flow and surge deposits associated with dome growth predominate in flank deposits, including those from an eruption that likely preceded the 1632 CE settlement of the island, allowing cultivation on recently devegetated land to near the summit. Non-eruptive seismic swarms occurred at 30-year intervals in the 20th century, but no historical eruptions were recorded until 1995. Long-term small-to-moderate ash eruptions beginning in that year were later accompanied by lava-dome growth and pyroclastic flows that forced evacuation of the southern half of the island and ultimately destroyed the capital city of Plymouth, causing major social and economic disruption.
Information Contacts: Montserrat Volcano Observatory (MVO), c/o Chief Minister's Office, PO Box 292, Plymouth, Montserrat (URL: http://www.mvo.ms/); NOAA/NESDIS Satellite Analysis Branch (SAB), Room 401, 5200 Auth Road, Camp Springs, MD 20746, USA; Bennette Roach, The Montserrat Reporter, v. XII nos. 33 and 35, Tom Casadevall, U.S. Geological Survey, Menlo Park, CA 90210 USA; Dave Schneider, Michigan Technological University, Houghton MI 49931, USA; Doug Darby, 6 Satinwood Road, Rocky Point, NY 11778 USA.
Villarrica (Chile) — September 1996 Cite this Report
Villarrica
Chile
39.42°S, 71.93°W; summit elev. 2847 m
All times are local (unless otherwise noted)
Increased seismicity again in late September
Above-background seismicity started on 7 September (BGVN 21:08); a follow-up report indicated that Villarrica's microseismicity again increased starting on 26 September and was continuing as late as 3 October. The events seen were of short-duration with dominant frequencies of 1.75 Hz and they appeared in swarms (figure 6). Some isolated events occurred in the 0.7-1 Hz range. In this same time interval the crater was the scene of abundant to occasionally intense degassing.
Geologic Background. The glacier-covered Villarrica stratovolcano, in the northern Lakes District of central Chile, is ~15 km south of the city of Pucon. A 2-km-wide caldera that formed about 3,500 years ago is located at the base of the presently active, dominantly basaltic to basaltic andesite cone at the NW margin of a 6-km-wide Pleistocene caldera. More than 30 scoria cones and fissure vents are present on the flanks. Plinian eruptions and pyroclastic flows that have extended up to 20 km from the volcano were produced during the Holocene. Lava flows up to 18 km long have issued from summit and flank vents. Eruptions documented since 1558 CE have consisted largely of mild-to-moderate explosive activity with occasional lava effusion. Glaciers cover 40 km2 of the volcano, and lahars have damaged towns on its flanks.
Information Contacts: Gustavo Fuentealba C.1 and Paola Peña, Programa Riesgo Volcánico de Chile (PRV), OVDAS; 1-also at Depto. Ciencias Fisicas, Universidad de La Frontera, Temuco, Chile.
Whakaari/White Island (New Zealand) — September 1996 Cite this Report
Whakaari/White Island
New Zealand
37.52°S, 177.18°E; summit elev. 294 m
All times are local (unless otherwise noted)
Recent heating and deformation episode appears to have ended
Observations in April, May, and July indicated continued increases in heat flow and inflation of the Main Crater floor. Low-level volcanic tremor that began in late July continued through August. Since the tremor commenced it appears that heat-flow has decreased, as has the deformation. Measurements in late August indicated that the crater-wide deformation and heating of the last 2-3 years appears to have peaked without eruptive activity. Since the last report (BGVN 21:04), monitoring visits were made on 18 April, 16 May, 24 July, and 28 August 1996.
Crater observations. On 18 April, the lake occupied Royce, Wade, Princess, and TV1 craters, with the S part of the divide between Princess and Wade craters 2-3 m above the lake. The lake was light turquoise, with a few brown surface slicks. A fumarole in the N wall of Wade Crater was audible from the edge of the 1978/90 Crater Complex; it was the only significant steam source in the complex.
Donald Mound was steaming vigorously, with that part exposed in the wall of the 1978/90 Crater Complex and the SE slopes the dominant features. Sulfur deposits were obvious on Donald Mound and the 1978/90 wall. The area of mud pots at the base of Donald Mound was also steaming vigorously. The whole area was wet and some mud pots included areas of significant sulfur deposition. Collapse was actively occurring between the 1978/90 Crater Complex and Donald Duck, causing brown slicks on the lake surface.
An ejecta apron with material up to 12 m from the vent was observed by charter pilot J. Tait on 4 June. Calm and clear conditions on 9 June allowed a tall steam plume to develop above the island; it was mistaken as an eruption plume by several coastal observers and the media. However, pilots R. Fleming and J. Tait, on the island at the time, observed no unusual activity. On 11 June R. Fleming reported a dramatic rise in lake level (>5 m) in three weeks. Strong convection in the lake caused fountaining up to 3-4 m high in the embayment below the May '91 vent.
Fumarolic discharge continued to increase on the crater floor when measured on 28 August, although temperatures had moderated somewhat since May. Springs, consisting largely of steam condensate, continued to discharge, and two new such features had developed along the boundary between the E and central sub-craters. Maximum temperatures on Donald Mound were 311°C, down ~100°C from May. A large fumarole discharging a bright yellow, sulfur-laden plume had developed ~5 m below the inner crater rim that intersects Donald Mound. The crater lake was mostly obscured by steam, but it appeared gray in color; maximum temperature as recorded by pyrometer was 69°C.
Magnetic survey. A comprehensive survey of the magnetic network was conducted on 16 May with the exception of a few sites at Donald Mound that were inaccessible due to hydrothermal activity. Contouring the changes since the partial survey on 23 January 1996 showed that the decreases at Donald Mound with corresponding increases to the S were continuing. These results suggested continued shallow (50-100 m deep) heating. A weaker negative anomaly W of Noisy Nellie, presumably resulting from heating on the N side of the complex, continued the trend observed during 6 July-12 December 1995.
A positive anomaly E of Donald Mound (site D10b) showed a change of +518 nT, although the site is near a new mud hole, so the effect may be local. Positive changes at Site G (+126 nT) and nearby sites are unusual because decreases are usually recorded when there is heating at Donald Mound. This anomaly may suggest cooling, perhaps around 100-200 m deep, at the E edge of the area of hydrothermal activity, possibly related to the rising water table.
Deformation. Levelling surveys on 18 April and 16 May were conducted over the entire network except over Donald Mound due to intense steam and hot, soft ground. Both surveys revealed broadly similar patterns and rates of continuing uplift centered on Donald Mound and extending SE. Relative subsidence continued NW of Donald Duck Crater, although part of that may be due to slumping induced by encroachment from the 1978/90 Crater Complex. The inflation pattern during the previous five months remained similar to that since Donald Mound began rising in late 1993.
A partial levelling survey was done on 28 August; three pegs near Donald Mound could not be accessed, two were lost due to crater wall collapses, and one was buried under a landslide. Since about 1992-93, levelling surveys have shown a systematic crater-wide uplift. However, this survey showed a dramatic reversal of the uplift trend, with minor subsidence observed over much of the Main Crater floor. The larger subsidences were focused about the Donald Mound area and the margins of the 1978/90 Crater Complex. These changes are consistent with the thermal changes observed on 28 August and may indicate that the present inflationary-heating episode is over or declining.
Geologic Background. The uninhabited Whakaari/White Island is the 2 x 2.4 km emergent summit of a 16 x 18 km submarine volcano in the Bay of Plenty about 50 km offshore of North Island. The island consists of two overlapping andesitic-to-dacitic stratovolcanoes. The SE side of the crater is open at sea level, with the recent activity centered about 1 km from the shore close to the rear crater wall. Volckner Rocks, sea stacks that are remnants of a lava dome, lie 5 km NW. Descriptions of volcanism since 1826 have included intermittent moderate phreatic, phreatomagmatic, and Strombolian eruptions; activity there also forms a prominent part of Maori legends. The formation of many new vents during the 19th and 20th centuries caused rapid changes in crater floor topography. Collapse of the crater wall in 1914 produced a debris avalanche that buried buildings and workers at a sulfur-mining project. Explosive activity in December 2019 took place while tourists were present, resulting in many fatalities. The official government name Whakaari/White Island is a combination of the full Maori name of Te Puia o Whakaari ("The Dramatic Volcano") and White Island (referencing the constant steam plume) given by Captain James Cook in 1769.
Information Contacts: B.J. Scott, Institute of Geological and Nuclear Sciences (IGNS), Private Bag 2000, Wairakei, New Zealand.
Yasur (Vanuatu) — September 1996 Cite this Report
Yasur
Vanuatu
19.532°S, 169.447°E; summit elev. 361 m
All times are local (unless otherwise noted)
Strombolian activity during July from three summit craters within the main crater
Although very intense activity was recorded during 1994, volcanism decreased in 1995 and was at normal levels (explosions, lava fountaining, and ash emissions) in November 1995. After a period of significant increase in the number and intensity of explosions during June 1996, activity returned to a quieter, but sustained, level (figure 6).
Observations made during 3-5 July showed that explosive Strombolian activity was fairly significant. Heavy ash-and-steam plumes, visible from surrounding villages, frequently rose several hundreds of meters above the volcano, accompanied by loud rumbling/roaring noises. The summit crater is ~250 m deep, and is occupied by three smaller active craters (figure 7). During observation the explosive activity and intense degassing came from six vents (one in Crater A; three in Crater B; two in Crater C).
Crater A was a pit with a S vertical wall ~100 m high. On the morning of 3 July between 1130 and 1330 the activity was principally characterized by frequent and intermittent explosions that generated ejections of magma fragments to several dozens of meters above the vent, sometimes surpassing the upper rim of the crater. A steam-and-ash plume regularly followed the explosive activity.
Crater B, smaller than A and separated from it by a small wall, had more sustained explosive activity from several vents, of which two (B1-B2) were particularly active with strong degassing. Bombs were regularly ejected >300 m vertically, often surpassing the highest point on the crater rim. The most active vent (B1) showed activity phases of continuous, very violent jets that lasted between 1 and 5 minutes, notably between 1930 and 2230 on 3 July. Pressurized gas intermittently generated a blue-orange flame. Good-sized magma fragments projected several meters above this vent were accompanied by strong detonations and intense degassing. Based on calculations made following several hours of observations, the ejection speed was estimated at 230-250 m/second. A third vent (B3) near the E rim was also very active but in a less violent and frequent manner. Two other vents, more westward, visible for an instant, showed mainly intense degassing sometimes accompanied by magma ejections to some meters above the red glow.
Crater C is a large depression with a lava lake in its center, usually agitated by surface movements. Violent explosions sent heavy gray-black ash plumes several hundreds of meters above the crater. Weak magma ejections also occurred from a glowing zone SW of the main lava lake. On the night of 3-4 July an intermittent flame came from the interior of this pit. Several times during the night, Strombolian explosions occurred simultaneously in these two areas.
A count of magma-ejecting explosions made over three 1-hour periods showed that Crater B was consistently more active. On 3 July between 1800 and 1900 a total of 63 explosions were distributed as follows: Crater A, 10; Crater B, 33; Crater C, 20. On 3 July between 2030 and 2130 a total of 51 explosions were distributed as follows: Crater A, 8; Crater B, 26; Crater C, 17. On 4 July between 1000 and 1100 a total of 54 explosions were distributed as follows: Crater A, 10; Crater B, 28; Crater C, 16.
On 5 July between 1430 and 1600, activity was much less frequent than the previous days, with explosions followed by long minutes of silence. The lava lake was quite visible in Crater C. During this period craters A and C were more active than B. At 1545 a larger explosion from Crater B generated some bomb falls at the extreme edge of the crater.
Geologic Background. Yasur has exhibited essentially continuous Strombolian and Vulcanian activity at least since Captain Cook observed ash eruptions in 1774. This style of activity may have continued for the past 800 years. Located at the SE tip of Tanna Island in Vanuatu, this pyroclastic cone has a nearly circular, 400-m-wide summit crater. The active cone is largely contained within the small Yenkahe caldera, and is the youngest of a group of Holocene volcanic centers constructed over the down-dropped NE flank of the Pleistocene Tukosmeru volcano. The Yenkahe horst is located within the Siwi ring fracture, a 4-km-wide open feature associated with eruption of the andesitic Siwi pyroclastic sequence. Active tectonism along the Yenkahe horst accompanying eruptions has raised Port Resolution harbor more than 20 m during the past century.
Information Contacts: Henry Gaudru, C. Pittet, C. Bopp, and G. Borel, Société Volcanologique Européenne, C.P. 1, 1211 Genève 17, Switzerland (URL: http://www.sveurop.org/); Michel Lardy, Centre ORSTOM, B.P. 76, Port Vila, Vanuatu.