Recently Published Bulletin Reports
Erebus (Antarctica) Lava lake remains active; most thermal alerts recorded since 2019
Rincon de la Vieja (Costa Rica) Frequent phreatic explosions during July-December 2023
Bezymianny (Russia) Explosion on 18 October 2023 sends ash plume 8 km high; lava flows and incandescent avalanches
Kilauea (United States) Low-level lava effusions in the lava lake at Halema’uma’u during July-December 2022
Nyamulagira (DR Congo) Lava flows and thermal activity during May-October 2023
Bagana (Papua New Guinea) Explosions, ash plumes, ashfall, and lava flows during April-September 2023
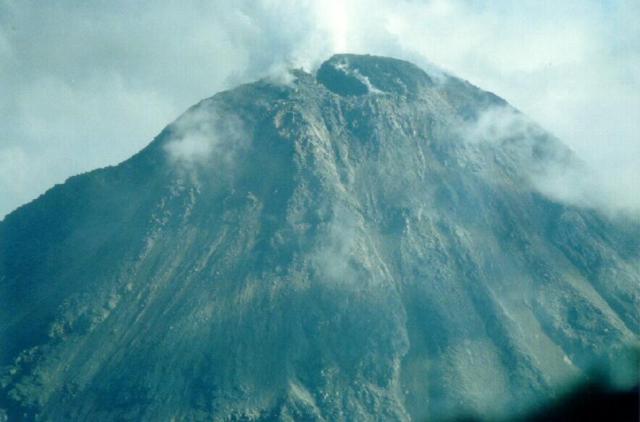
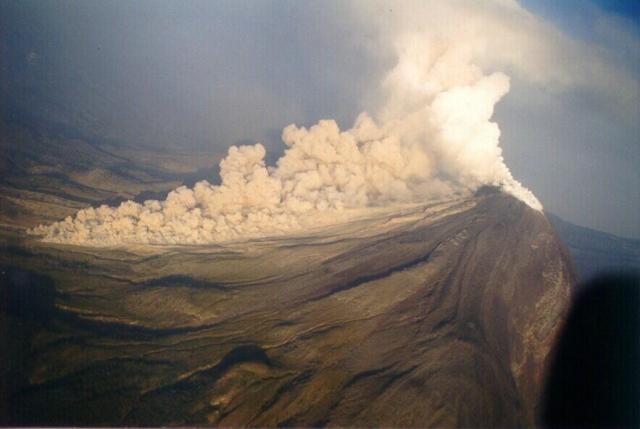
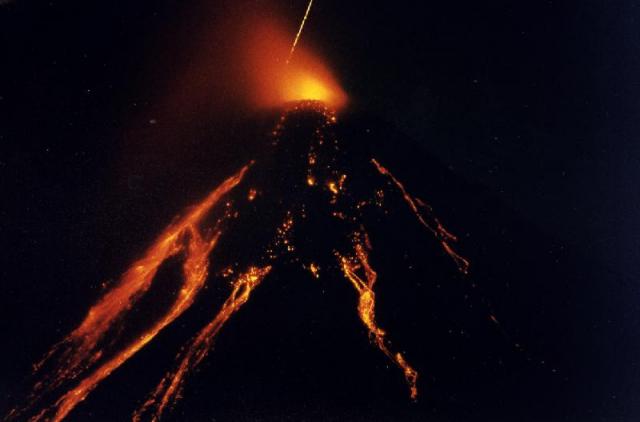
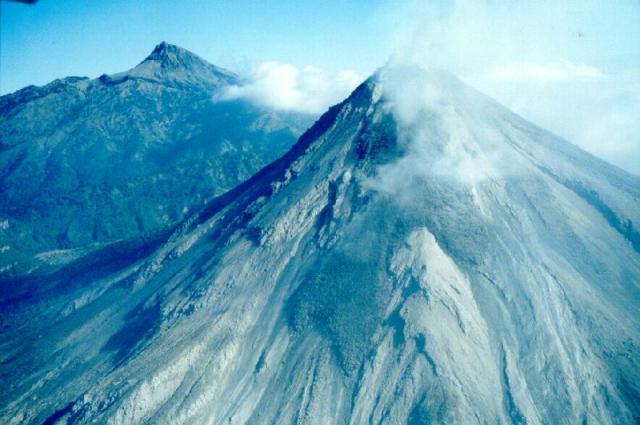
Mayon (Philippines) Lava flows, pyroclastic flows, ash emissions, and seismicity during April-September 2023
Nishinoshima (Japan) Eruption plumes and gas-and-steam plumes during May-August 2023
Krakatau (Indonesia) White gas-and-steam plumes and occasional ash plumes during May-August 2023
Villarrica (Chile) Strombolian activity, gas-and-ash emissions, and crater incandescence during April-September 2023
Merapi (Indonesia) Frequent incandescent avalanches during April-September 2023
Ebeko (Russia) Moderate explosive activity with ash plumes continued during June-November 2023
Erebus (Antarctica) — January 2024  Cite this Report
Erebus
Antarctica
77.53°S, 167.17°E; summit elev. 3794 m
All times are local (unless otherwise noted)
Lava lake remains active; most thermal alerts recorded since 2019
The lava lake in the summit crater of Erebus has been active since at least 1972. Located in Antarctica overlooking the McMurdo Station on Ross Island, it is the southernmost active volcano on the planet. Because of the remote location, activity is primarily monitored by satellites. This report covers activity during 2023.
The number of thermal alerts recorded by the Hawai'i Institute of Geophysics and Planetology’s MODVOLC Thermal Alerts System increased considerably in 2023 compared to the years 2020-2022 (table 9). In contrast to previous years, the MODIS instruments aboard the Aqua and Terra satellites captured data from Erebus every month during 2023. Consistent with previous years, the lowest number of anomalous pixels were recorded in January, November, and December.
Table 9. Number of monthly MODIS-MODVOLC thermal alert pixels recorded at Erebus during 2017-2023. See BGVN 42:06 for data from 2000 through 2016. The table was compiled using data provided by the HIGP – MODVOLC Thermal Alerts System.
| Year |
Jan |
Feb |
Mar |
Apr |
May |
Jun |
Jul |
Aug |
Sep |
Oct |
Nov |
Dec |
SUM |
| 2017 |
0 |
21 |
9 |
0 |
0 |
1 |
11 |
61 |
76 |
52 |
0 |
3 |
234 |
| 2018 |
0 |
21 |
58 |
182 |
55 |
17 |
137 |
172 |
103 |
29 |
0 |
0 |
774 |
| 2019 |
2 |
21 |
162 |
151 |
55 |
56 |
75 |
53 |
29 |
19 |
1 |
0 |
624 |
| 2020 |
0 |
2 |
16 |
18 |
4 |
4 |
1 |
3 |
18 |
3 |
1 |
6 |
76 |
| 2021 |
0 |
9 |
1 |
0 |
2 |
56 |
46 |
47 |
35 |
52 |
5 |
3 |
256 |
| 2022 |
1 |
13 |
55 |
22 |
15 |
32 |
39 |
19 |
31 |
11 |
0 |
0 |
238 |
| 2023 |
2 |
33 |
49 |
82 |
41 |
32 |
70 |
64 |
42 |
17 |
5 |
11 |
448 |
Sentinel-2 infrared images showed one or two prominent heat sources within the summit crater, accompanied by adjacent smaller sources, similar to recent years (see BGVN 46:01, 47:02, and 48:01). A unique image was obtained on 25 November 2023 by the OLI-2 (Operational Land Imager-2) on Landsat 9, showing the upper part of the volcano surrounded by clouds (figure 32).
Geologic Background. Mount Erebus, the world's southernmost historically active volcano, overlooks the McMurdo research station on Ross Island. It is the largest of three major volcanoes forming the crudely triangular Ross Island. The summit of the dominantly phonolitic volcano has been modified by one or two generations of caldera formation. A summit plateau at about 3,200 m elevation marks the rim of the youngest caldera, which formed during the late-Pleistocene and within which the modern cone was constructed. An elliptical 500 x 600 m wide, 110-m-deep crater truncates the summit and contains an active lava lake within a 250-m-wide, 100-m-deep inner crater; other lava lakes are sometimes present. The glacier-covered volcano was erupting when first sighted by Captain James Ross in 1841. Continuous lava-lake activity with minor explosions, punctuated by occasional larger Strombolian explosions that eject bombs onto the crater rim, has been documented since 1972, but has probably been occurring for much of the volcano's recent history.
Information Contacts: Hawai'i Institute of Geophysics and Planetology (HIGP) - MODVOLC Thermal Alerts System, School of Ocean and Earth Science and Technology (SOEST), Univ. of Hawai'i, 2525 Correa Road, Honolulu, HI 96822, USA (URL: http://modis.higp.hawaii.edu/); Copernicus Browser, Copernicus Data Space Ecosystem, European Space Agency (URL: https://dataspace.copernicus.eu/browser/); NASA Earth Observatory, EOS Project Science Office, NASA Goddard Space Flight Center, Goddard, Maryland, USA (URL: https://earthobservatory.nasa.gov/images/152134/erebus-breaks-through).
Rincon de la Vieja (Costa Rica) — January 2024 Cite this Report
Rincon de la Vieja
Costa Rica
10.83°N, 85.324°W; summit elev. 1916 m
All times are local (unless otherwise noted)
Frequent phreatic explosions during July-December 2023
Rincón de la Vieja is a volcanic complex in Costa Rica with a hot convecting acid lake that exhibits frequent weak phreatic explosions, gas-and-steam emissions, and occasional elevated sulfur dioxide levels (BGVN 45:10, 46:03, 46:11). The current eruption period began June 2021. This report covers activity during July-December 2023 and is based on weekly bulletins and occasional daily reports from the Observatorio Vulcanologico Sismologica de Costa Rica-Universidad Nacional (OVSICORI-UNA).
Numerous weak phreatic explosions continued during July-December 2023, along with gas-and-steam emissions and plumes that rose as high as 3 km above the crater rim. Many weekly OVSICORI-UNA bulletins included the previous week's number of explosions and emissions (table 9). For many explosions, the time of explosion was given (table 10). Frequent seismic activity (long-period earthquakes, volcano-tectonic earthquakes, and tremor) accompanied the phreatic activity.
Table 9. Number of reported weekly phreatic explosions and gas-and-steam emissions at Rincón de la Vieja, July-December 2023. Counts are reported for the week before the Weekly Bulletin date; not all reports included these data. Courtesy of OVSICORI-UNA.
| OVSICORI Weekly Bulletin |
Number of explosions |
Number of emissions |
| 28 Jul 2023 |
6 |
14 |
| 4 Aug 2023 |
10 |
12 |
| 1 Sep 2023 |
13 |
11 |
| 22 Sep 2023 |
12 |
13 |
| 29 Sep 2023 |
6 |
11 |
| 6 Oct 2023 |
12 |
5 |
| 13 Oct 2023 |
7 |
9 |
| 20 Oct 2023 |
1 |
15 |
| 27 Oct 2023 |
3 |
23 |
| 3 Nov 2023 |
3 |
10 |
| 17 Nov 2023 |
0 |
Some |
| 24 Nov 2023 |
0 |
14 |
| 8 Dec 2023 |
4 |
16 |
| 22 Dec 2023 |
8 |
18 |
Table 10. Summary of activity at Rincón de la Vieja during July-December 2023. Weak phreatic explosions and gas emissions are noted where the time of explosion was indicated in the weekly or daily bulletins. Height of plumes or emissions are distance above the crater rim. Courtesy of OVSICORI-UNA.
| Date |
Time |
Description of Activity |
| 1 Jul 2023 |
0156 |
Explosion. |
| 2 Jul 2023 |
0305 |
Explosion. |
| 4 Jul 2023 |
0229, 0635 |
Event at 0635 produced a gas-and-steam plume that rose 700 m and drifted W; seen by residents in Liberia (21 km SW). |
| 9 Jul 2023 |
1843 |
Explosion. |
| 21 Jul 2023 |
0705 |
Explosion. |
| 26 Jul 2023 |
1807 |
Explosion. |
| 28 Jul 2023 |
0802 |
Explosion generated a gas-and-steam plume that rose 500 m. |
| 30 Jul 2023 |
1250 |
Explosion. |
| 31 Jul 2023 |
2136 |
Explosion. |
| 11 Aug 2023 |
0828 |
Explosion. |
| 18 Aug 2023 |
1304 |
Explosion. |
| 21 Aug 2023 |
1224 |
Explosion generated gas-and-steam plumes rose 500-600 m. |
| 22 Aug 2023 |
0749 |
Explosion generated gas-and-steam plumes rose 500-600 m. |
| 24 Aug 2023 |
1900 |
Explosion. |
| 25 Aug 2023 |
0828 |
Event produced a steam-and-gas plume that rose 3 km and drifted NW. |
| 27-28 Aug 2023 |
0813 |
Four small events; the event at 0813 on 28 August lasted two minutes and generated a steam-and-gas plume that rose 2.5 km. |
| 1 Sep 2023 |
1526 |
Explosion generated plume that rose 2 km and ejected material onto the flanks. |
| 2-3 Sep 2023 |
- |
Small explosions detected in infrasound data. |
| 4 Sep 2023 |
1251 |
Gas-and-steam plume rose 1 km and drifted W. |
| 7 Nov 2023 |
1113 |
Explosion. |
| 8 Nov 2023 |
0722 |
Explosion. |
| 12 Nov 2023 |
0136 |
Small gas emissions. |
| 14 Nov 2023 |
0415 |
Small gas emissions. |
According to OVSICORI-UNA, during July-October the average weekly sulfur dioxide (SO2) flux ranged from 68 to 240 tonnes/day. However, in mid-November the flux increased to as high as 334 tonnes/day, the highest value measured in recent years. The high SO2 flux in mid-November was also detected by the TROPOMI instrument on the Sentinel-5P satellite (figure 43).
Geologic Background. Rincón de la Vieja, the largest volcano in NW Costa Rica, is a remote volcanic complex in the Guanacaste Range. The volcano consists of an elongated, arcuate NW-SE-trending ridge constructed within the 15-km-wide early Pleistocene Guachipelín caldera, whose rim is exposed on the south side. Sometimes known as the "Colossus of Guanacaste," it has an estimated volume of 130 km3 and contains at least nine major eruptive centers. Activity has migrated to the SE, where the youngest-looking craters are located. The twin cone of Santa María volcano, the highest peak of the complex, is located at the eastern end of a smaller, 5-km-wide caldera and has a 500-m-wide crater. A Plinian eruption producing the 0.25 km3 Río Blanca tephra about 3,500 years ago was the last major magmatic eruption. All subsequent eruptions, including numerous historical eruptions possibly dating back to the 16th century, have been from the prominent active crater containing a 500-m-wide acid lake located ENE of Von Seebach crater.
Information Contacts: Observatorio Vulcanológico Sismológica de Costa Rica-Universidad Nacional (OVSICORI-UNA), Apartado 86-3000, Heredia, Costa Rica (URL: http://www.ovsicori.una.ac.cr/); NASA Global Sulfur Dioxide Monitoring Page, Atmospheric Chemistry and Dynamics Laboratory, NASA Goddard Space Flight Center (NASA/GSFC), 8800 Greenbelt Road, Goddard MD 20771, USA (URL: https://so2.gsfc.nasa.gov/).
Bezymianny (Russia) — November 2023 Cite this Report
Bezymianny
Russia
55.972°N, 160.595°E; summit elev. 2882 m
All times are local (unless otherwise noted)
Explosion on 18 October 2023 sends ash plume 8 km high; lava flows and incandescent avalanches
Bezymianny, located on Russia’s Kamchatka Peninsula, has had eruptions since 1955 characterized by dome growth, explosions, pyroclastic flows, ash plumes, and ashfall. Activity during November 2022-April 2023 included gas-and-steam emissions, lava dome collapses generating avalanches, and persistent thermal activity. Similar eruptive activity continued from May through October 2023, described here based on information from weekly and daily reports of the Kamchatka Volcano Eruptions Response Team (KVERT), notices from Tokyo VAAC (Volcanic Ash Advisory Center), and from satellite data.
Overall activity decreased after the strong period of activity in late March through April 2023, which included ash explosions during 29 March and 7-8 April 2023 that sent plumes as high as 10-12 km altitude, along with dome growth and lava flows (BGVN 48:05). This reduced activity can be seen in the MIROVA thermal detection system graph (figure 56), which was consistent with data from the MODVOLC thermal detection system and with Sentinel-2 satellite images that showed persistent hotspots in the summit crater when conditions allowed observations. A renewed period of strong activity began in mid-October 2023.
Activity increased significantly on 17 October 2023 when large collapses began during 0700-0830 on the E flanks of the lava dome and continued to after 0930 the next day (figure 57). Ash plumes rose to an altitude of 4.5-5 km, extending 220 km NNE by 18 October. A large explosion at 1630 on 18 October produced an ash plume that rose to an altitude of 11 km (8 km above the summit) and drifted NNE and then NW, extending 900 km NW within two days at an altitude of 8 km. Minor ashfall was noted in Kozyrevsk (45 km WNW). At 0820 on 20 October an ash plume was identified in satellite images drifting 100 km ENE at altitudes of 4-4.5 km.
Lava flows and hot avalanches from the dome down the SE flank continued over the next few days, including 23 October when clear conditions allowed good observations (figures 58 and 59). A large thermal anomaly was observed over the volcano through 24 October, and in the summit crater on 30 October (figure 60). Strong fumarolic activity continued, with numerous avalanches and occasional incandescence. By the last week of October, volcanic activity had decreased to a level consistent with that earlier in the reporting period.
Aviation warnings were frequently updated during 17-20 October. KVERT issued a Volcano Observatory Notice for Aviation (VONA) on 17 October at 1419 and 1727 (0219 and 0527 UTC) raising the Aviation Color Code (ACC) from Yellow to Orange (second highest level). The next day, KVERT issued a VONA at 1705 (0505 UTC) raising the ACC to Red (highest level) but lowered it back to Orange at 2117 (0917 UTC). After another decrease to Yellow and back to Orange, the ACC was reduced to Yellow on 20 October at 1204 (0004 UTC). In addition, the Tokyo VAAC issued a series of Volcanic Ash Advisories beginning on 16 October and continuing through 30 October.
Geologic Background. The modern Bezymianny, much smaller than its massive neighbors Kamen and Kliuchevskoi on the Kamchatka Peninsula, was formed about 4,700 years ago over a late-Pleistocene lava-dome complex and an edifice built about 11,000-7,000 years ago. Three periods of intensified activity have occurred during the past 3,000 years. The latest period, which was preceded by a 1,000-year quiescence, began with the dramatic 1955-56 eruption. This eruption, similar to that of St. Helens in 1980, produced a large open crater that was formed by collapse of the summit and an associated lateral blast. Subsequent episodic but ongoing lava-dome growth, accompanied by intermittent explosive activity and pyroclastic flows, has largely filled the 1956 crater.
Information Contacts: Kamchatka Volcanic Eruptions Response Team (KVERT), Far Eastern Branch, Russian Academy of Sciences, 9 Piip Blvd., Petropavlovsk-Kamchatsky, 683006, Russia (URL: http://www.kscnet.ru/ivs/kvert/); Kamchatka Volcanological Station, Kamchatka Branch of Geophysical Survey, (KB GS RAS), Klyuchi, Kamchatka Krai, Russia (URL: http://volkstat.ru/); Tokyo Volcanic Ash Advisory Center (VAAC), 1-3-4 Otemachi, Chiyoda-ku, Tokyo 100-8122, Japan (URL: http://ds.data.jma.go.jp/svd/vaac/data/); Hawai'i Institute of Geophysics and Planetology (HIGP) - MODVOLC Thermal Alerts System, School of Ocean and Earth Science and Technology (SOEST), Univ. of Hawai'i, 2525 Correa Road, Honolulu, HI 96822, USA (URL: http://modis.higp.hawaii.edu/); MIROVA (Middle InfraRed Observation of Volcanic Activity), a collaborative project between the Universities of Turin and Florence (Italy) supported by the Centre for Volcanic Risk of the Italian Civil Protection Department (URL: http://www.mirovaweb.it/); Copernicus Browser, Copernicus Data Space Ecosystem, European Space Agency (URL: https://dataspace.copernicus.eu/browser/).chr
Kilauea (United States) — January 2023 Cite this Report
Kilauea
United States
19.421°N, 155.287°W; summit elev. 1222 m
All times are local (unless otherwise noted)
Low-level lava effusions in the lava lake at Halema’uma’u during July-December 2022
Kīlauea is the southeastern-most volcano in Hawaii and overlaps the E flank of the Mauna Loa volcano. Its East Rift Zone (ERZ) has been intermittently active for at least 2,000 years. An extended eruption period began in January 1983 and was characterized by open lava lakes and lava flows from the summit caldera and the East Rift Zone. During May 2018 magma migrated into the Lower East Rift Zone (LERZ) and opened 24 fissures along a 6-km-long NE-trending fracture zone that produced lava flows traveling in multiple directions. As lava emerged from the fissures, the lava lake at Halema'uma'u drained and explosions sent ash plumes to several kilometers altitude (BGVN 43:10).
The current eruption period started during September 2021 and has recently been characterized by lava effusions, spatter, and sulfur dioxide emissions in the active Halema’uma’u lava lake (BGVN 47:08). Lava effusions, some spatter, and sulfur dioxide emissions have continued during this reporting period of July through December 2022 using daily reports, volcanic activity notices, and abundant photo, map, and video data from the US Geological Survey's (USGS) Hawaiian Volcano Observatory (HVO).
Summary of activity during July-December 2022. Low-level effusions have continued at the western vent of the Halema’uma’u crater during July through early December 2022. Occasional weak ooze-outs (also called lava break outs) would occur along the margins of the crater floor. The overall level of the active lava lake throughout the reporting period gradually increased due to infilling, however it stagnated in mid-September (table 13). During September through November, activity began to decline, though lava effusions persisted at the western vent. By 9 December, the active part of the lava lake had completely crusted over, and incandescence was no longer visible.
Table 13. Summary of measurements taken during overflights at Kīlauea that show a gradual increase in the active lava lake level and the volume of lava effused since 29 September 2021. Lower activity was reported during September-October. Data collected during July-December 2022. Courtesy of HVO.
| Date: |
Level of the active lava lake (m): |
Cumulative volume of lava effused (million cubic meters): |
| 7 Jul 2022 |
130 |
95 |
| 19 Jul 2022 |
133 |
98 |
| 4 Aug 2022 |
136 |
102 |
| 16 Aug 2022 |
137 |
104 |
| 12 Sep 2022 |
143 |
111 |
| 5 Oct 2022 |
143 |
111 |
| 28 Oct 2022 |
143 |
111 |
Activity during July 2022. Lava effusions were reported from the western vent in the Halema’uma’u crater, along with occasional weak ooze-outs along the margins of the crater floor. The height of the lava lake was variable due to deflation-inflation tilt events; for example, the lake level dropped approximately 3-4 m during a summit deflation-inflation event reported on 1 July. Webcam images taken during the night of 6-12 July showed intermittent low-level spattering at the western vent that rose less than 10 m above the vent (figure 519). Measurements made during an overflight on 7 July indicated that the crater floor was infilled about 130 m and that 95 million cubic meters of lava had been effused since 29 September 2021. A single, relatively small lava ooze-out was active to the S of the lava lake. Around midnight on 8 July there were two brief periods of lava overflow onto the lake margins. On 9 July lava ooze-outs were reported near the SE and NE edges of the crater floor and during 10-11 July they occurred near the E, NE, and NW edges. On 16 July crater incandescence was reported, though the ooze-outs and spattering were not visible. On 18 July overnight webcam images showed incandescence in the western vent complex and two ooze-outs were reported around 0000 and 0200 on 19 July. By 0900 there were active ooze-outs along the SW edge of the crater floor. Measurements made from an overflight on 19 July indicated that the crater floor was infilled about 133 m and 98 million cubic meters of lava had erupted since 29 September 2021 (figure 520). On 20 July around 1600 active ooze-outs were visible along the N edge of the crater, which continued through the next day. Extensive ooze-outs occurred along the W margin during 24 July until 1900; on 26 July minor ooze-outs were noted along the N margin. Minor spattering was visible on 29 July along the E margin of the lake. The sulfur dioxide emission rates ranged 650-2,800 tons per day (t/d), the higher of which was measured on 8 July (figure 519).
Activity during August 2022. The eruption continued in the Halema’uma’u crater at the western vent. According to HVO the lava in the active lake remained at the level of the bounding levees. Occasional minor ooze-outs were observed along the margins of the crater floor. Strong nighttime crater incandescence was visible after midnight on 6 August over the western vent cone. During 6-7 August scattered small lava lobes were active along the crater floor and incandescence persisted above the western vent through 9 August. During 7-9 August HVO reported a single lava effusion source was active along the NW margin of the crater floor. Measurements from an overflight on 4 August indicated that the crater floor was infilled about 136 m total and that 102 million cubic meters of lava had been erupted since the start of the eruption. Lava breakouts were reported along the N, NE, E, S, and W margins of the crater during 10-16 August. Another overflight survey conducted on 16 August indicated that the crater floor infilled about 137 m and 104 million cubic meters of lava had been erupted since September 2021. Measured sulfur dioxide emissions rates ranged 1,150-2,450 t/d, the higher of which occurred on 8 August.
Activity during September 2022. During September, lava effusion continued from the western vent into the active lava lake and onto the crater floor. Intermittent minor ooze-outs were reported through the month. A small ooze-out was visible on the W crater floor margin at 0220 on 2 September, which showed decreasing surface activity throughout the day, but remained active through 3 September. On 3 September around 1900 a lava outbreak occurred along the NW margin of the crater floor but had stopped by the evening of 4 September. Field crews monitoring the summit lava lake on 9 September observed spattering on the NE margin of the lake that rose no higher than 10 m, before falling back onto the lava lake crust (figure 521). Overflight measurements on 12 September indicated that the crater floor was infilled a total of 143 m and 111 million cubic meters of lava had been erupted since September 2021. Extensive breakouts in the W and N part of the crater floor were reported at 1600 on 20 September and continued into 26 September. The active part of the lava lake dropped by 10 m while other parts of the crater floor dropped by several meters. Summit tiltmeters recorded a summit seismic swarm of more than 80 earthquakes during 1500-1800 on 21 September, which occurred about 1.5 km below Halema’uma’u; a majority of these were less than Mw 2. By 22 September the active part of the lava lake was infilled about 2 m. On 23 September the western vent areas exhibited several small spatter cones with incandescent openings, along with weak, sporadic spattering (figure 522). The sulfur dioxide emission rate ranged from 930 t/d to 2,000 t/d, the higher of which was measured on 6 September.
Activity during October 2022. Activity during October declined slightly compared to previous months, though lava effusions persisted from the western vent into the active lava lake and onto the crater floor during October (figure 523). Slight variations in the lava lake were noted throughout the month. HVO reported that around 0600 on 3 October the level of the lava lake has lowered slightly. Overflight measurements taken on 5 October indicated that the crater floor was infilled a total of about 143 m and that 111 million cubic meters of lava had been effused since September 2021. During 6-7 October the lake gradually rose 0.5 m. Sulfur dioxide measurements made on 22 October had an emission rate of 700 t/d. Another overflight taken on 28 October showed that there was little to no change in the elevation of the crater floor: the crater floor was infilled a total of 143 m and 111 million cubic meters of lava had erupted since the start of the eruption.
Activity during November 2022. Activity remained low during November, though HVO reported that lava from the western vent continued to effuse into the active lava lake and onto the crater floor throughout the month. The rate of sulfur dioxide emissions during November ranged from 300-600 t/d, the higher amount of which occurred on 9 November.
Activity during December 2022. Similar low activity was reported during December, with lava effusing from the western vent into the active lava lake and onto the crater floor. During 4-5 December the active part of the lava lake was slightly variable in elevation and fluctuated within 1 m. On 9 December HVO reported that lava was no longer erupting from the western vent in the Halema’uma’u crater and that sulfur dioxide emissions had returned to near pre-eruption background levels; during 10-11 December, the lava lake had completely crusted over, and no incandescence was visible (figure 524). Time lapse camera images covering the 4-10 December showed that the crater floor showed weak deflation and no inflation. Some passive events of crustal overturning were reported during 14-15 December, which brought fresh incandescent lava to the lake surface. The sulfur dioxide emission rate was approximately 200 t/d on 14 December. A smaller overturn event on 17 December and another that occurred around 0000 and into the morning of 20 December were also detected. A small seismic swarm was later detected on 30 December.
Geologic Background. Kilauea overlaps the E flank of the massive Mauna Loa shield volcano in the island of Hawaii. Eruptions are prominent in Polynesian legends; written documentation since 1820 records frequent summit and flank lava flow eruptions interspersed with periods of long-term lava lake activity at Halemaumau crater in the summit caldera until 1924. The 3 x 5 km caldera was formed in several stages about 1,500 years ago and during the 18th century; eruptions have also originated from the lengthy East and Southwest rift zones, which extend to the ocean in both directions. About 90% of the surface of the basaltic shield volcano is formed of lava flows less than about 1,100 years old; 70% of the surface is younger than 600 years. The long-term eruption from the East rift zone between 1983 and 2018 produced lava flows covering more than 100 km2, destroyed hundreds of houses, and added new coastline.
Information Contacts: Hawaiian Volcano Observatory (HVO), U.S. Geological Survey, PO Box 51, Hawai'i National Park, HI 96718, USA (URL: http://hvo.wr.usgs.gov/).
Nyamulagira (DR Congo) — November 2023 Cite this Report
Nyamulagira
DR Congo
1.408°S, 29.2°E; summit elev. 3058 m
All times are local (unless otherwise noted)
Lava flows and thermal activity during May-October 2023
Nyamulagira (also known as Nyamuragira) is a shield volcano in the Democratic Republic of Congo with the summit truncated by a small 2 x 2.3 km caldera with walls up to about 100 m high. Documented eruptions have occurred within the summit caldera, as well as from numerous flank fissures and cinder cones. The current eruption period began in April 2018 and has more recently been characterized by summit crater lava flows and thermal activity (BGVN 48:05). This report describes lava flows and variable thermal activity during May through October 2023, based on information from the Observatoire Volcanologique de Goma (OVG) and various satellite data.
Lava lake activity continued during May. The MIROVA (Middle InfraRed Observation of Volcanic Activity) system recorded moderate-to-strong thermal activity throughout the reporting period; activity was more intense during May and October and relatively weaker from June through September (figure 95). The MODVOLC thermal algorithm, detected a total of 209 thermal alerts. There were 143 hotspots detected during May, eight during June, nine during September, and 49 during October. This activity was also reflected in infrared satellite images, where a lava flow was visible in the NW part of the crater on 7 May and strong activity was seen in the center of the crater on 4 October (figure 96). Another infrared satellite image taken on 12 May showed still active lava flows along the NW margin of the crater. According to OVG lava effusions were active during 7-29 May and moved to the N and NW parts of the crater beginning on 9 May. Strong summit crater incandescence was visible from Goma (27 km S) during the nights of 17, 19, and 20 May (figure 97). On 17 May there was an increase in eruptive activity, which peaked at 0100 on 20 May. Notable sulfur dioxide plumes drifted NW and W during 19-20 May (figure 98). Drone footage acquired in partnership with the USGS (United States Geological Survey) on 20 May captured images of narrow lava flows that traveled about 100 m down the W flank (figure 99). Data from the Rumangabo seismic station indicated a decreasing trend in activity during 17-21 May. Although weather clouds prevented clear views of the summit, a strong thermal signature on the NW flank was visible in an infrared satellite image on 22 May, based on an infrared satellite image. On 28 May the lava flows on the upper W flank began to cool and solidify. By 29 May seismicity returned to levels similar to those recorded before the 17 May increase. Lava effusion continued but was confined to the summit crater; periodic crater incandescence was observed.
Low-level activity was noted during June through October. On 1 June OVG reported that seismicity remained at lower levels and that crater incandescence had been absent for three days, though infrared satellite imagery showed continued lava effusion in the summit crater. The lava flows on the flanks covered an estimated 0.6 km2. Satellite imagery continued to show thermal activity confined to the lava lake through October (figure 96), although no lava flows or significant sulfur dioxide emissions were reported.
Geologic Background. Africa's most active volcano, Nyamulagira (also known as Nyamuragira), is a massive high-potassium basaltic shield about 25 km N of Lake Kivu and 13 km NNW of the steep-sided Nyiragongo volcano. The summit is truncated by a small 2 x 2.3 km caldera that has walls up to about 100 m high. Documented eruptions have occurred within the summit caldera, as well as from the numerous flank fissures and cinder cones. A lava lake in the summit crater, active since at least 1921, drained in 1938, at the time of a major flank eruption. Recent lava flows extend down the flanks more than 30 km from the summit as far as Lake Kivu; extensive lava flows from this volcano have covered 1,500 km2 of the western branch of the East African Rift.
Information Contacts: Observatoire Volcanologique de Goma (OVG), Departement de Geophysique, Centre de Recherche en Sciences Naturelles, Lwiro, D.S. Bukavu, DR Congo; Hawai'i Institute of Geophysics and Planetology (HIGP) - MODVOLC Thermal Alerts System, School of Ocean and Earth Science and Technology (SOEST), Univ. of Hawai'i, 2525 Correa Road, Honolulu, HI 96822, USA (URL: http://modis.higp.hawaii.edu/); MIROVA (Middle InfraRed Observation of Volcanic Activity), a collaborative project between the Universities of Turin and Florence (Italy) supported by the Centre for Volcanic Risk of the Italian Civil Protection Department (URL: http://www.mirovaweb.it/); NASA Global Sulfur Dioxide Monitoring Page, Atmospheric Chemistry and Dynamics Laboratory, NASA Goddard Space Flight Center (NASA/GSFC), 8800 Greenbelt Road, Goddard, Maryland, USA (URL: https://so2.gsfc.nasa.gov/); Copernicus Browser, Copernicus Data Space Ecosystem, European Space Agency (URL: https://dataspace.copernicus.eu/browser/); Charles Balagizi, Goma Volcano Observatory, Departement de Geophysique, Centre de Recherche en Sciences Naturelles, Lwiro, D.S. Bukavu, DR Congo.
Bagana (Papua New Guinea) — October 2023 Cite this Report
Bagana
Papua New Guinea
6.137°S, 155.196°E; summit elev. 1855 m
All times are local (unless otherwise noted)
Explosions, ash plumes, ashfall, and lava flows during April-September 2023
The remote volcano of Bagana is located in central Bougainville Island, Papua New Guinea. Recorded eruptions date back to 1842 and activity has consisted of effusive activity that has built a small lava dome in the summit crater and occasional explosions that produced pyroclastic flows. The most recent eruption has been ongoing since February 2000 and has produced occasional explosions, ash plumes, and lava flows. More recently, activity has been characterized by ongoing effusive activity and ash emissions (BGVN 48:04). This report updates activity from April through September 2023 that has consisted of explosions, ash plumes, ashfall, and lava flows, using information from the Darwin Volcanic Ash Advisory Center (VAAC) and satellite data.
An explosive eruption was reported on 7 July that generated a large gas-and-ash plume to high altitudes and caused significant ashfall in local communities; the eruption plume had reached upper tropospheric (16-18 km altitude) altitudes by 2200, according to satellite images. Sulfur dioxide plumes were detected in satellite images on 8 July and indicated that the plume was likely a mixture of gas, ice, and ash. A report issued by the Autonomous Bougainville Government (ABG) (Torokina District, Education Section) on 10 July noted that significant ash began falling during 2000-2100 on 7 July and covered most areas in the Vuakovi, Gotana (9 km SW), Koromaketo, Laruma (25 km W) and Atsilima (27 km NW) villages. Pyroclastic flows also occurred, according to ground-based reports; small deposits confined to one drainage were inspected by RVO during an overflight on 17 July and were confirmed to be from the 7 July event. Ashfall continued until 10 July and covered vegetation, which destroyed bushes and gardens and contaminated rivers and streams.
RVO reported another eruption on 14 July. The Darwin VAAC stated that an explosive event started around 0830 on 15 July and produced an ash plume that rose to 16.5 km altitude by 1000 and drifted N, according to satellite images. The plume continued to drift N and remained visible through 1900, and by 2150 it had dissipated.
Ashfall likely from both the 7 and 15 July events impacted about 8,111 people in Torokina (20 km SW), including Tsito/Vuakovi, Gotana, Koromaketo, Kenaia, Longkogari, Kenbaki, Piva (13 km SW), and Atsinima, and in the Tsitovi district, according to ABG. Significant ashfall was also reported in Ruruvu (22 km N) in the Wakunai District of Central Bougainville, though the thickness of these deposits could not be confirmed. An evacuation was called for the villages in Wakunai, where heavy ashfall had contaminated water sources; the communities of Ruruvu, Togarau, Kakarapaia, Karauturi, Atao, and Kuritaturi were asked to evacuate to a disaster center at the Wakunai District Station, and communities in Torokina were asked to evacuate to the Piva District station. According to a news article, more than 7,000 people needed temporary accommodations, with about 1,000 people in evacuation shelters. Ashfall had deposited over a broad area, contaminating water supplies, affecting crops, and collapsing some roofs and houses in rural areas. Schools were temporarily shut down. Intermittent ash emissions continued through the end of July and drifted NNW, NW, and SW. Fine ashfall was reported on the coast of Torokina, and ash plumes also drifted toward Laruma and Atsilima.
A small explosive eruption occurred at 2130 on 28 July that ejected material from the crater vents, according to reports from Torokina, in addition to a lava flow that contained two lobes. A second explosion was detected at 2157. Incandescence from the lava flow was visible from Piva as it descended the W flank around 2000 on 29 July (figure 47). The Darwin VAAC reported that a strong thermal anomaly was visible in satellite images during 30-31 July and that ash emissions rose to 2.4 km altitude and drifted WSW on 30 July. A ground report from RVO described localized emissions at 0900 on 31 July.
The Darwin VAAC reported that ash plumes were identified in satellite imagery at 0800 and 1220 on 12 August and rose to 2.1 km and 3 km altitude and drifted NW and W, respectively. A news report stated that aid was sent to more than 6,300 people that were adversely affected by the eruption. Photos taken during 17-19 August showed ash emissions rising no higher than 1 km above the summit and drifting SE. A small explosion generated an ash plume during the morning of 19 August. Deposits from small pyroclastic flows were also captured in the photos. Satellite images captured lava flows and pyroclastic flow deposits. Two temporary seismic stations were installed near Bagana on 17 August at distances of 7 km WSW (Vakovi station) and 11 km SW (Kepox station). The Kepox station immediately started to record continuous, low-frequency background seismicity.
Satellite data. Little to no thermal activity was detected during April through mid-July 2023; only one anomaly was recorded during early April and one during early June, according to MIROVA (Middle InfraRed Observation of Volcanic Activity) data (figure 48). Thermal activity increased in both power and frequency during mid-July through September, although there were still some short gaps in detected activity. MODVOLC also detected increased thermal activity during August; thermal hotspots were detected a total of five times on 19, 20, and 27 August. Weak thermal anomalies were also captured in infrared satellite images on clear weather days throughout the reporting period on 7, 12, and 17 April, 27 May, 1, 6, 16, and 31 July, and 19 September (figure 48); a strong thermal anomaly was visible on 31 July. Distinct sulfur dioxide plumes that drifted generally NW were intermittently captured by the TROPOMI instrument on the Sentinel-5P satellite and sometimes exceeded two Dobson Units (DUs) (figure 49).
Geologic Background. Bagana volcano, in a remote portion of central Bougainville Island, is frequently active. This massive symmetrical cone was largely constructed by an accumulation of viscous andesitic lava flows. The entire edifice could have been constructed in about 300 years at its present rate of lava production. Eruptive activity is characterized by non-explosive effusion of viscous lava that maintains a small lava dome in the summit crater, although occasional explosive activity produces pyroclastic flows. Lava flows with tongue-shaped lobes up to 50 m thick and prominent levees descend the flanks on all sides.
Information Contacts: Rabaul Volcano Observatory (RVO), Geohazards Management Division, Department of Mineral Policy and Geohazards Management (DMPGM), PO Box 3386, Kokopo, East New Britain Province, Papua New Guinea; Darwin Volcanic Ash Advisory Centre (VAAC), Bureau of Meteorology, Northern Territory Regional Office, PO Box 40050, Casuarina, NT 0811, Australia (URL: http://www.bom.gov.au/info/vaac/); MIROVA (Middle InfraRed Observation of Volcanic Activity), a collaborative project between the Universities of Turin and Florence (Italy) supported by the Centre for Volcanic Risk of the Italian Civil Protection Department (URL: http://www.mirovaweb.it/); Hawai'i Institute of Geophysics and Planetology (HIGP) - MODVOLC Thermal Alerts System, School of Ocean and Earth Science and Technology (SOEST), Univ. of Hawai'i, 2525 Correa Road, Honolulu, HI 96822, USA (URL: http://modis.higp.hawaii.edu/); NASA Global Sulfur Dioxide Monitoring Page, Atmospheric Chemistry and Dynamics Laboratory, NASA Goddard Space Flight Center (NASA/GSFC), 8800 Greenbelt Road, Goddard, Maryland, USA (URL: https://so2.gsfc.nasa.gov/); Copernicus Browser, Copernicus Data Space Ecosystem, European Space Agency (URL: https://dataspace.copernicus.eu/browser/); Autonomous Bougainville Government, P.O Box 322, Buka, AROB, PNG (URL: https://abg.gov.pg/); Andrew Tupper (Twitter: @andrewcraigtupp); Simon Carn, Geological and Mining Engineering and Sciences, Michigan Technological University, 1400 Townsend Drive, Houghton, MI 49931, USA (URL: http://www.volcarno.com/, Twitter: @simoncarn); Radio NZ (URL: https://www.rnz.co.nz/news/pacific/494464/more-than-7-000-people-in-bougainville-need-temporary-accommodation-after-eruption); USAID, 1300 Pennsylvania Ave, NW, Washington DC 20004, USA (URL: https://www.usaid.gov/pacific-islands/press-releases/aug-08-2023-united-states-provides-immediate-emergency-assistance-support-communities-affected-mount-bagana-volcanic-eruptions).
Mayon (Philippines) — October 2023 Cite this Report
Mayon
Philippines
13.257°N, 123.685°E; summit elev. 2462 m
All times are local (unless otherwise noted)
Lava flows, pyroclastic flows, ash emissions, and seismicity during April-September 2023
Mayon is located in the Philippines and has steep upper slopes capped by a small summit crater. Historical eruptions date back to 1616 CE that have been characterized by Strombolian eruptions, lava flows, pyroclastic flows, and mudflows. Eruptions mostly originated from a central conduit. Pyroclastic flows and mudflows have commonly descended many of the approximately 40 drainages that surround the volcano. The most recent eruption occurred during June through October 2022 and consisted of lava dome growth and gas-and-steam emissions (BGVN 47:12). A new eruption was reported during late April 2023 and has included lava flows, pyroclastic density currents, ash emissions, and seismicity. This report covers activity during April through September 2023 based on daily bulletins from the Philippine Institute of Volcanology and Seismology (PHIVOLCS).
During April through September 2023, PHIVOLCS reported near-daily rockfall events, frequent volcanic earthquakes, and sulfur dioxide measurements. Gas-and-steam emissions rose 100-900 m above the crater and drifted in different directions. Nighttime crater incandescence was often visible during clear weather and was accompanied by incandescent avalanches of material. Activity notably increased during June when lava flows were reported on the S, SE, and E flanks (figure 52). The MIROVA graph (Middle InfraRed Observation of Volcanic Activity) showed strong thermal activity coincident with these lava flows, which remained active through September (figure 53). According to the MODVOLC thermal algorithm, a total of 110 thermal alerts were detected during the reporting period: 17 during June, 40 during July, 27 during August, and 26 during September. During early June, pyroclastic density currents (PDCs) started to occur more frequently.
Low activity was reported during much of April and May; gas-and-steam emissions rose 100-900 m above the crater and generally drifted in different directions. A total of 52 rockfall events and 18 volcanic earthquakes were detected during April and 147 rockfall events and 13 volcanic events during May. Sulfur dioxide flux measurements ranged between 400-576 tons per day (t/d) during April, the latter of which was measured on 29 April and between 162-343 t/d during May, the latter of which was measured on 13 May.
Activity during June increased, characterized by lava flows, pyroclastic density currents (PDCs), crater incandescence and incandescent rockfall events, gas-and-steam emissions, and continued seismicity. Weather clouds often prevented clear views of the summit, but during clear days, moderate gas-and-steam emissions rose 100-2,500 m above the crater and drifted in multiple directions. A total of 6,237 rockfall events and 288 volcanic earthquakes were detected. The rockfall events often deposited material on the S and SE flanks within 700-1,500 m of the summit crater and ash from the events drifted SW, S, SE, NE, and E. Sulfur dioxide emissions ranged between 149-1,205 t/d, the latter of which was measured on 10 June. Short-term observations from EDM and electronic tiltmeter monitoring indicated that the upper slopes were inflating since February 2023. Longer-term ground deformation parameters based on EDM, precise leveling, continuous GPS, and electronic tilt monitoring indicated that the volcano remained inflated, especially on the NW and SE flanks. At 1000 on 5 June the Volcano Alert Level (VAL) was raised to 2 (on a 0-5 scale). PHIVOLCS noted that although low-level volcanic earthquakes, ground deformation, and volcanic gas emissions indicated unrest, the steep increase in rockfall frequency may indicate increased dome activity.
A total of 151 dome-collapse PDCs occurred during 8-9 and 11-30 June, traveled 500-2,000 m, and deposited material on the S flank within 2 km of the summit crater. During 8-9 June the VAL was raised to 3. At approximately 1947 on 11 June lava flow activity was reported; two lobes traveled within 500 m from the crater and deposited material on the S (Mi-isi), SE (Bonga), and E (Basud) flanks. Weak seismicity accompanied the lava flow and slight inflation on the upper flanks. This lava flow remained active through 30 June, moving down the S and SE flank as far as 2.5 km and 1.8 km, respectively and depositing material up to 3.3 km from the crater. During 15-16 June traces of ashfall from the PDCs were reported in Sitio Buga, Nabonton, City of Ligao and Purok, and San Francisco, Municipality of Guinobatan. During 28-29 June there were two PDCs generated by the collapse of the lava flow front, which generated a light-brown ash plume 1 km high. Satellite monitors detected significant concentrations of sulfur dioxide beginning on 29 June. On 30 June PDCs primarily affected the Basud Gully on the E flank, the largest of which occurred at 1301 and lasted eight minutes, based on the seismic record. Four PDCs generated between 1800 and 2000 that lasted approximately four minutes each traveled 3-4 km on the E flank and generated an ash plume that rose 1 km above the crater and drifted N and NW. Ashfall was recorded in Tabaco City.
Similar strong activity continued during July; slow lava effusion remained active on the S and SE flanks and traveled as far as 2.8 km and 2.8 km, respectively and material was deposited as far as 4 km from the crater. There was a total of 6,983 rockfall events and 189 PDCs that affected the S, SE, and E flanks. The volcano network detected a total of 2,124 volcanic earthquakes. Continuous gas-and-steam emissions rose 200-2,000 m above the crater and drifted in multiple directions. Sulfur dioxide emissions averaged 792-4,113 t/d, the latter of which was measured on 28 July. During 2-4 July three PDCs were generated from the collapse of the lava flow and resulting light brown plumes rose 200-300 m above the crater. Continuous tremor pulses were reported beginning at 1547 on 3 July through 7 July at 1200, at 2300 on 8 July and going through 0300 on 10 July, and at 2300 on 16 July, as recorded by the seismic network. During 6-9 July there were 10 lava flow-collapse-related PDCs that generated light brown plumes 300-500 m above the crater. During 10-11 July light ashfall was reported in some areas of Mabinit, Legazpi City, Budiao and Salvacion, Daraga, and Camalig, Albay. By 18 July the lava flow advanced 600 m on the E flank as well.
During 1733 on 18 July and 0434 on 19 July PHIVOLCS reported 30 “ashing” events, which are degassing events accompanied by audible thunder-like sounds and entrained ash at the crater, which produced short, dark plumes that drifted SW. These events each lasted 20-40 seconds, and plume heights ranged from 150-300 m above the crater, as recorded by seismic, infrasound, visual, and thermal monitors. Three more ashing events occurred during 19-20 July. Short-term observations from electronic tilt and GPS monitoring indicate deflation on the E lower flanks in early July and inflation on the NW middle flanks during the third week of July. Longer-term ground deformation parameters from EDM, precise leveling, continuous GPS, and electronic tilt monitoring indicated that the volcano was still generally inflated relative to baseline levels. A short-lived lava pulse lasted 28 seconds at 1956 on 21 July, which was accompanied by seismic and infrasound signals. By 22 July, the only lava flow that remained active was on the SE flank, and continued to extend 3.4 km, while those on the S and E flanks weakened markedly. One ashing event was detected during 30-31 July, whereas there were 57 detected during 31 July-1 August; according to PHIVOLCS beginning at approximately 1800 on 31 July eruptive activity was dominated by phases of intermittent ashing, as well as increased in the apparent rates of lava effusion from the summit crater. The ashing phases consisted of discrete events recorded as low-frequency volcanic earthquakes (LFVQ) typically 30 seconds in duration, based on seismic and infrasound signals. Gray ash plume rose 100 m above the crater and generally drifted NE. Shortly after these ashing events began, new lava began to effuse rapidly from the crater, feeding the established flowed on the SE, E, and E flanks and generating frequent rockfall events.
Intensified unrest persisted during August. There was a total of 4,141 rockfall events, 2,881 volcanic earthquakes, which included volcanic tremor events, 32 ashing events, and 101 PDCs detected throughout the month. On clear weather days, gas-and-steam emissions rose 300-1,500 m above the crater and drifted in different directions (figure 54). Sulfur dioxide emissions averaged 735-4,756 t/d, the higher value of which was measured on 16 August. During 1-2 August the rate of lava effusion decreased, but continued to feed the flows on the SE, S, and E flanks, maintaining their advances to 3.4 km, 2.8 km, and 1.1 km from the crater, respectively (figure 55). Rockfall and PDCs generated by collapses at the lava flow margins and from the summit dome deposited material within 4 km of the crater. During 3-4 August there were 10 tremor events detected that lasted 1-4 minutes. Short-lived lava pulse lasted 35 seconds and was accompanied by seismic and infrasound signals at 0442 on 6 August. Seven collapses were recorded at the front of the lava flow during 12-14 August.
During September, similar activity of slow lava effusion, PDCs, gas-and-steam emissions, and seismicity continued. There was a total of 4,452 rockfall events, 329 volcanic earthquakes, which included volcanic tremor events, two ashing events, and 85 PDCs recorded throughout the month. On clear weather days, gas-and-steam emissions rose 100-1,500 m above the crater and drifted in multiple directions. Sulfur dioxide emissions averaged 609-2,252 t/d, the higher average of which was measured on 6 September. Slow lava effusion continued advancing on the SE, S, and E flanks, maintaining lengths of 3.4 km, 2.8 km, and 1.1 km, respectively. Rockfall and PDC events generated by collapses along the lava flow margins and at the summit dome deposited material within 4 km of the crater.
Geologic Background. Symmetrical Mayon, which rises above the Albay Gulf NW of Legazpi City, is the most active volcano of the Philippines. The steep upper slopes are capped by a small summit crater. Recorded eruptions since 1616 CE range from Strombolian to basaltic Plinian, with cyclical activity beginning with basaltic eruptions, followed by longer periods of andesitic lava flows. Eruptions occur predominately from the central conduit and have also produced lava flows that travel far down the flanks. Pyroclastic density currents and mudflows have commonly swept down many of the approximately 40 ravines that radiate from the summit and have often damaged populated lowland areas. A violent eruption in 1814 killed more than 1,200 people and devastated several towns.
Information Contacts: Philippine Institute of Volcanology and Seismology (PHIVOLCS), Department of Science and Technology, University of the Philippines Campus, Diliman, Quezon City, Philippines (URL: http://www.phivolcs.dost.gov.ph/); MIROVA (Middle InfraRed Observation of Volcanic Activity), a collaborative project between the Universities of Turin and Florence (Italy) supported by the Centre for Volcanic Risk of the Italian Civil Protection Department (URL: http://www.mirovaweb.it/); Hawai'i Institute of Geophysics and Planetology (HIGP) - MODVOLC Thermal Alerts System, School of Ocean and Earth Science and Technology (SOEST), Univ. of Hawai'i, 2525 Correa Road, Honolulu, HI 96822, USA (URL: http://modis.higp.hawaii.edu/); Copernicus Browser, Copernicus Data Space Ecosystem, European Space Agency (URL: https://dataspace.copernicus.eu/browser/); William Rogers, Legazpi City, Albay Province, Philippines.
Nishinoshima (Japan) — October 2023 Cite this Report
Nishinoshima
Japan
27.247°N, 140.874°E; summit elev. 100 m
All times are local (unless otherwise noted)
Eruption plumes and gas-and-steam plumes during May-August 2023
Nishinoshima, located about 1,000 km S of Tokyo, is a small island in the Ogasawara Arc in Japan. The island is the summit of a massive submarine volcano that has prominent submarine peaks to the S, W, and NE. Eruptions date back to 1973 and the current eruption period began in October 2022. Recent activity has consisted of small ash plumes and fumarolic activity (BGVN 48:07). This report covers activity during May through August 2023, using information from monthly reports of the Japan Meteorological Agency (JMA) monthly reports and satellite data.
Activity during May through June was relatively low. The Japan Coast Guard (JCG) did overflights on 14 and 22 June and reported white gas-and-steam emissions rising 600 m and 1,200 m from the central crater of the pyroclastic cone, respectively (figure 125). In addition, multiple white gas-and-steam emissions rose from the inner rim of the W side of the crater and from the SE flank of the pyroclastic cone. Discolored brown-to-green water was observed around almost the entire perimeter of the island; on 22 June light green discolored water was observed off the S coast of the island.
Observations from the Himawari meteorological satellite confirmed an eruption on 9 and 10 July. An eruption plume rose 1.6 km above the crater and drifted N around 1300 on 9 July. Satellite images acquired at 1420 and 2020 on 9 July and at 0220 on 10 July showed continuing emissions that rose 1.3-1.6 km above the crater and drifted NE and N. The Tokyo VAAC reported that an ash plume seen by a pilot and identified in a satellite image at 0630 on 21 July rose to 3 km altitude and drifted S.
Aerial observations conducted by JCG on 8 August showed a white-and-gray plume rising from the central crater of the pyroclastic cone, and multiple white gas-and-steam emissions were rising from the inner edge of the western crater and along the NW-SE flanks of the island (figure 126). Brown-to-green discolored water was also noted around the perimeter of the island.
Intermittent low-to-moderate power thermal anomalies were recorded in the MIROVA graph (Middle InfraRed Observation of Volcanic Activity), showing an increase in both frequency and power beginning in July (figure 127). This increase in activity coincides with eruptive activity on 9 and 10 July, characterized by eruption plumes. According to the MODVOLC thermal alert algorithm, one thermal hotspot was recorded on 20 July. Weak thermal anomalies were also detected in infrared satellite imagery, accompanied by strong gas-and-steam plumes (figure 128).
Geologic Background. The small island of Nishinoshima was enlarged when several new islands coalesced during an eruption in 1973-74. Multiple eruptions that began in 2013 completely covered the previous exposed surface and continued to enlarge the island. The island is the summit of a massive submarine volcano that has prominent peaks to the S, W, and NE. The summit of the southern cone rises to within 214 m of the ocean surface 9 km SSE.
Information Contacts: Japan Meteorological Agency (JMA), 1-3-4 Otemachi, Chiyoda-ku, Tokyo 100-8122, Japan (URL: http://www.jma.go.jp/jma/indexe.html); Tokyo Volcanic Ash Advisory Center (VAAC), 1-3-4 Otemachi, Chiyoda-ku, Tokyo 100-8122, Japan (URL: http://ds.data.jma.go.jp/svd/vaac/data/); MIROVA (Middle InfraRed Observation of Volcanic Activity), a collaborative project between the Universities of Turin and Florence (Italy) supported by the Centre for Volcanic Risk of the Italian Civil Protection Department (URL: http://www.mirovaweb.it/); Copernicus Browser, Copernicus Data Space Ecosystem, European Space Agency (URL: https://dataspace.copernicus.eu/browser/).
Krakatau (Indonesia) — October 2023 Cite this Report
Krakatau
Indonesia
6.1009°S, 105.4233°E; summit elev. 285 m
All times are local (unless otherwise noted)
White gas-and-steam plumes and occasional ash plumes during May-August 2023
Krakatau is located in the Sunda Strait between Java and Sumatra, Indonesia. Caldera collapse during the catastrophic 1883 eruption destroyed Danan and Perbuwatan cones and left only a remnant of Rakata. The post-collapse cone of Anak Krakatau (Child of Krakatau) was constructed within the 1883 caldera at a point between the former Danan and Perbuwatan cones; it has been the site of frequent eruptions since 1927. The current eruption period began in May 2021 and has recently consisted of Strombolian eruptions and ash plumes (BGVN 48:07). This report describes lower levels of activity consisting of ash and white gas-and-steam plumes during May through August 2023, based on information provided by the Indonesian Center for Volcanology and Geological Hazard Mitigation, referred to as Pusat Vulkanologi dan Mitigasi Bencana Geologi (PVMBG), MAGMA Indonesia, and satellite data.
Activity was relatively low during May and June. Daily white gas-and-steam emissions rose 25-200 m above the crater and drifted in different directions. Five ash plumes were detected at 0519 on 10 May, 1241 on 11 May, 0920 on 12 May, 2320 on 12 May, and at 0710 on 13 May, and rose 1-2.5 km above the crater and drifted SW. A webcam image taken on 12 May showed ejection of incandescent material above the vent. A total of nine ash plumes were detected during 6-11 June: at 1434 and 00220 on 6 and 7 June the ash plumes rose 500 m above the crater and drifted NW, at 1537 on 8 June the ash plume rose 1 km above the crater and drifted SW, at 0746 and at 0846 on 9 June the ash plumes rose 800 m and 3 km above the crater and drifted SW, respectively, at 0423, 1431, and 1750 on 10 June the ash plumes rose 2 km, 1.5 km, and 3.5 km above the crater and drifted NW, respectively, and at 0030 on 11 June an ash plume rose 2 km above the crater and drifted NW. Webcam images taken on 10 and 11 June at 0455 and 0102, respectively, showed incandescent material ejected above the vent. On 19 June an ash plume at 0822 rose 1.5 km above the crater and drifted SE.
Similar low activity of white gas-and-steam emissions and few ash plumes were reported during July and August. Daily white gas-and-steam emissions rose 25-300 m above the crater and drifted in multiple directions. Three ash plumes were reported at 0843, 0851, and 0852 on 20 July that rose 500-2,000 m above the crater and drifted NW.
The MIROVA (Middle InfraRed Observation of Volcanic Activity) graph of MODIS thermal anomaly data showed intermittent low-to-moderate power thermal anomalies during May through August 2023 (figure 140). Although activity was often obscured by weather clouds, a thermal anomaly was visible in an infrared satellite image of the crater on 12 May, accompanied by an eruption plume that drifted SW (figure 141).
Geologic Background. The renowned Krakatau (frequently mis-named as Krakatoa) volcano lies in the Sunda Strait between Java and Sumatra. Collapse of an older edifice, perhaps in 416 or 535 CE, formed a 7-km-wide caldera. Remnants of that volcano are preserved in Verlaten and Lang Islands; subsequently the Rakata, Danan, and Perbuwatan cones were formed, coalescing to create the pre-1883 Krakatau Island. Caldera collapse during the catastrophic 1883 eruption destroyed Danan and Perbuwatan, and left only a remnant of Rakata. This eruption caused more than 36,000 fatalities, most as a result of tsunamis that swept the adjacent coastlines of Sumatra and Java. Pyroclastic surges traveled 40 km across the Sunda Strait and reached the Sumatra coast. After a quiescence of less than a half century, the post-collapse cone of Anak Krakatau (Child of Krakatau) was constructed within the 1883 caldera at a point between the former Danan and Perbuwatan cones. Anak Krakatau has been the site of frequent eruptions since 1927.
Information Contacts: Pusat Vulkanologi dan Mitigasi Bencana Geologi (PVMBG, also known as Indonesian Center for Volcanology and Geological Hazard Mitigation, CVGHM), Jalan Diponegoro 57, Bandung 40122, Indonesia (URL: http://www.vsi.esdm.go.id/); MAGMA Indonesia, Kementerian Energi dan Sumber Daya Mineral (URL: https://magma.esdm.go.id/v1); MIROVA (Middle InfraRed Observation of Volcanic Activity), a collaborative project between the Universities of Turin and Florence (Italy) supported by the Centre for Volcanic Risk of the Italian Civil Protection Department (URL: http://www.mirovaweb.it/); Copernicus Browser, Copernicus Data Space Ecosystem, European Space Agency (URL: https://dataspace.copernicus.eu/browser/).
Villarrica (Chile) — October 2023 Cite this Report
Villarrica
Chile
39.42°S, 71.93°W; summit elev. 2847 m
All times are local (unless otherwise noted)
Strombolian activity, gas-and-ash emissions, and crater incandescence during April-September 2023
Villarrica, in central Chile, consists of a 2-km-wide caldera that formed about 3,500 years ago and is located at the base of the presently active cone at the NW margin of a 6-km-wide caldera. Historical eruptions eruptions date back to 1558 and have been characterized by mild-to-moderate explosive activity with occasional lava effusions. The current eruption period began in December 2014 and has recently consisted of nighttime crater incandescence, ash emissions, and seismicity (BGVN 48:04). This report covers activity during April through September 2023 and describes occasional Strombolian activity, gas-and-ash emissions, and nighttime crater incandescence. Information for this report primarily comes from the Southern Andes Volcano Observatory (Observatorio Volcanológico de Los Andes del Sur, OVDAS), part of Chile's National Service of Geology and Mining (Servicio Nacional de Geología y Minería, SERNAGEOMIN) and satellite data.
Seismicity during April consisted of long period (LP) events and tremor (TRE); a total of 9,413 LP-type events and 759 TR-type events were detected throughout the month. Nighttime crater incandescence persisted and was visible in the degassing column. Sulfur dioxide data was obtained using Differential Absorption Optical Spectroscopy Equipment (DOAS) that showed an average value of 1,450 ± 198 tons per day (t/d) during 1-15 April and 1,129 ± 201 t/d during 16-30 April, with a maximum daily value of 2,784 t/d on 9 April. Gas-and-steam emissions of variable intensities rose above the active crater as high as 1.3 km above the crater on 13 April. Strombolian explosions were not observed and there was a slight decrease in the lava lake level.
There were 14,123 LP-type events and 727 TR-type events detected during May. According to sulfur dioxide measurements taken with DOAS equipment, the active crater emitted an average value of 1,826 ± 482 t/d during 1-15 May and 912 ± 41 t/d during 16-30 May, with a daily maximum value of 5,155 t/d on 13 May. Surveillance cameras showed continuous white gas-and-steam emissions that rose as high as 430 m above the crater on 27 May. Nighttime incandescence illuminated the gas column less than 300 m above the crater rim was and no pyroclastic emissions were reported. A landslide was identified on 13 May on the E flank of the volcano 50 m from the crater rim and extending 300 m away; SERNAGEOMIN noted that this event may have occurred on 12 May. During the morning of 27 and 28 May minor Strombolian explosions characterized by incandescent ejecta were recorded at the crater rim; the last reported Strombolian explosions had occurred at the end of March.
Seismic activity during June consisted of five volcano-tectonic (VT)-type events, 21,606 LP-type events, and 2,085 TR-type events. The average value of sulfur dioxide flux obtained by DOAS equipment was 1,420 ± 217 t/d during 1-15 June and 2,562 ± 804 t/d, with a maximum daily value of 4,810 t/d on 17 June. White gas-and-steam emissions rose less than 480 m above the crater; frequent nighttime crater incandescence was reflected in the degassing plume. On 12 June an emission rose 100 m above the crater and drifted NNW. On 15 June one or several emissions resulted in ashfall to the NE as far as 5.5 km from the crater, based on a Skysat satellite image. Several Strombolian explosions occurred within the crater; activity on 15 June was higher energy and ejected blocks 200-300 m on the NE slope. Surveillance cameras showed white gas-and-steam emissions rising 480 m above the crater on 16 June. On 19 and 24 June low-intensity Strombolian activity was observed, ejecting material as far as 200 m from the center of the crater to the E.
During July, seismicity included 29,319 LP-type events, 3,736 TR-type events, and two VT-type events. DOAS equipment recorded two days of sulfur dioxide emissions of 4,220 t/d and 1,009 t/d on 1 and 13 July, respectively. Constant nighttime incandescence was also recorded and was particularly noticeable when accompanied by eruptive columns on 12 and 16 July. Minor explosive events were detected in the crater. According to Skysat satellite images taken on 12, 13, and 16 July, ashfall deposits were identified 155 m S of the crater. According to POVI, incandescence was visible from two vents on the crater floor around 0336 on 12 July. Gas-and-ash emissions rose as high as 1.2 km above the crater on 13 July and drifted E and NW. A series of gas-and-steam pulses containing some ash deposited material on the upper E flank around 1551 on 13 July. During 16-31 July, average sulfur dioxide emissions of 1,679 ± 406 t/d were recorded, with a maximum daily value of 2,343 t/d on 28 July. Fine ash emissions were also reported on 16, 17, and 23 July.
Seismicity persisted during August, characterized by 27,011 LP-type events, 3,323 TR-type events, and three VT-type events. The average value of sulfur dioxide measurements taken during 1-15 August was 1,642 ± 270 t/d and 2,207 ± 4,549 t/d during 16-31 August, with a maximum daily value of 3,294 t/d on 27 August. Nighttime crater incandescence remained visible in degassing columns. White gas-and-steam emissions rose 480 m above the crater on 6 August. According to a Skysat satellite image from 6 August, ash accumulation was observed proximal to the crater and was mainly distributed toward the E slope. White gas-and-steam emissions rose 320 m above the crater on 26 August. Nighttime incandescence and Strombolian activity that generated ash emissions were reported on 27 August.
Seismicity during September was characterized by five VT-type events, 12,057 LP-type events, and 2,058 TR-type events. Nighttime incandescence persisted. On 2 September an ash emission rose 180 m above the crater and drifted SE at 1643 (figure 125) and a white gas-and-steam plume rose 320 m above the crater. According to the Buenos Aires VAAC, periods of continuous gas-and-ash emissions were visible in webcam images from 1830 on 2 September to 0110 on 3 September. Strombolian activity was observed on 2 September and during the early morning of 3 September, the latter event of which generated an ash emission that rose 60 m above the crater and drifted 100 m from the center of the crater to the NE and SW. Ashfall was reported to the SE and S as far as 750 m from the crater. The lava lake was active during 3-4 September and lava fountaining was visible for the first time since 26 March 2023, according to POVI. Fountains captured in webcam images at 2133 on 3 September and at 0054 on 4 September rose as high as 60 m above the crater rim and ejected material onto the upper W flank. Sulfur dioxide flux of 1,730 t/d and 1,281 t/d was measured on 3 and 4 September, respectively, according to data obtained by DOAS equipment.
Strong Strombolian activity and larger gas-and-ash plumes were reported during 18-20 September. On 18 September activity was also associated with energetic LP-type events and notable sulfur dioxide fluxes (as high as 4,277 t/d). On 19 September Strombolian activity and incandescence were observed. On 20 September at 0914 ash emissions rose 50 m above the crater and drifted SSE, accompanied by Strombolian activity that ejected material less than 100 m SSE, causing fall deposits on that respective flank. SERNAGEOMIN reported that a Planet Scope satellite image taken on 20 September showed the lava lake in the crater, measuring 32 m x 35 m and an area of 0.001 km2. Several ash emissions were recorded at 0841, 0910, 1251, 1306, 1312, 1315, and 1324 on 23 September and rose less than 150 m above the crater. The sulfur dioxide flux value was 698 t/d on 23 September and 1,097 t/d on 24 September. On 24 September the Volcanic Alert Level (VAL) was raised to Orange (the third level on a four-color scale). SENAPRED maintained the Alert Level at Yellow (the middle level on a three-color scale) for the communities of Villarrica, Pucón (16 km N), Curarrehue, and Panguipulli.
During 24-25 September there was an increase in seismic energy (observed at TR-events) and acoustic signals, characterized by 1 VT-type event, 213 LP-type events, and 124 TR-type events. Mainly white gas-and-steam emissions, in addition to occasional fine ash emissions were recorded. During the early morning of 25 September Strombolian explosions were reported and ejected material 250 m in all directions, though dominantly toward the NW. On 25 September the average value of sulfur dioxide flux was 760 t/d. Seismicity during 25-30 September consisted of five VT-type events, 1,937 LP-type events, and 456 TR-type events.
During 25-29 September moderate Strombolian activity was observed and ejected material as far as the crater rim. In addition, ash pulses lasting roughly 50 minutes were observed around 0700 and dispersed ENE. During 26-27 September a TR episode lasted 6.5 hours and was accompanied by discrete acoustic signals. Satellite images from 26 September showed a spatter cone on the crater floor with one vent that measured 10 x 14 m and a smaller vent about 35 m NE of the cone. SERNAGEOMIN reported an abundant number of bomb-sized blocks up to 150 m from the crater, as well as impact marks on the snow, which indicated explosive activity. A low-altitude ash emission was observed drifting NW around 1140 on 28 September, based on webcam images. Between 0620 and 0850 on 29 September an ash emission rose 60 m above the crater and drifted NW. During an overflight taken around 1000 on 29 September scientists observed molten material in the vent, a large accumulation of pyroclasts inside the crater, and energetic degassing, some of which contained a small amount of ash. Block-sized pyroclasts were deposited on the internal walls and near the crater, and a distal ash deposit was also visible. The average sulfur dioxide flux measured on 28 September was 344 t/d. Satellite images taken on 29 September ashfall was deposited roughly 3 km WNW from the crater and nighttime crater incandescence remained visible. The average sulfur dioxide flux value from 29 September was 199 t/d. On 30 September at 0740 a pulsating ash emission rose 1.1 km above the crater and drifted NNW (figure 126). Deposits on the S flank extended as far as 4.5 km from the crater rim, based on satellite images from 30 September.
Infrared MODIS satellite data processed by MIROVA (Middle InfraRed Observation of Volcanic Activity) showed intermittent thermal activity during April through September, with slightly stronger activity detected during late September (figure 127). Small clusters of thermal activity were detected during mid-June, early July, early August, and late September. According to the MODVOLC thermal alert system, a total of four thermal hotspots were detected on 7 July and 3 and 23 September. This activity was also intermittently captured in infrared satellite imagery on clear weather days (figure 128).
Geologic Background. The glacier-covered Villarrica stratovolcano, in the northern Lakes District of central Chile, is ~15 km south of the city of Pucon. A 2-km-wide caldera that formed about 3,500 years ago is located at the base of the presently active, dominantly basaltic to basaltic andesite cone at the NW margin of a 6-km-wide Pleistocene caldera. More than 30 scoria cones and fissure vents are present on the flanks. Plinian eruptions and pyroclastic flows that have extended up to 20 km from the volcano were produced during the Holocene. Lava flows up to 18 km long have issued from summit and flank vents. Eruptions documented since 1558 CE have consisted largely of mild-to-moderate explosive activity with occasional lava effusion. Glaciers cover 40 km2 of the volcano, and lahars have damaged towns on its flanks.
Information Contacts: Servicio Nacional de Geología y Minería (SERNAGEOMIN), Observatorio Volcanológico de Los Andes del Sur (OVDAS), Avda Sta María No. 0104, Santiago, Chile (URL: http://www.sernageomin.cl/); Proyecto Observación Villarrica Internet (POVI) (URL: http://www.povi.cl/); Sistema y Servicio Nacional de Prevención y Repuesta Ante Desastres (SENAPRED), Av. Beauchef 1671, Santiago, Chile (URL: https://web.senapred.cl/); Buenos Aires Volcanic Ash Advisory Center (VAAC), Servicio Meteorológico Nacional-Fuerza Aérea Argentina, 25 de mayo 658, Buenos Aires, Argentina (URL: http://www.smn.gov.ar/vaac/buenosaires/inicio.php); MIROVA (Middle InfraRed Observation of Volcanic Activity), a collaborative project between the Universities of Turin and Florence (Italy) supported by the Centre for Volcanic Risk of the Italian Civil Protection Department (URL: http://www.mirovaweb.it/); Hawai'i Institute of Geophysics and Planetology (HIGP) - MODVOLC Thermal Alerts System, School of Ocean and Earth Science and Technology (SOEST), Univ. of Hawai'i, 2525 Correa Road, Honolulu, HI 96822, USA (URL: http://modis.higp.hawaii.edu/); Copernicus Browser, Copernicus Data Space Ecosystem, European Space Agency (URL: https://dataspace.copernicus.eu/browser/).
Merapi (Indonesia) — October 2023 Cite this Report
Merapi
Indonesia
7.54°S, 110.446°E; summit elev. 2910 m
All times are local (unless otherwise noted)
Frequent incandescent avalanches during April-September 2023
Merapi, located just north of the major city of Yogyakarta in central Java, Indonesia, has had activity within the last 20 years characterized by pyroclastic flows and lahars accompanying growth and collapse of the steep-sided active summit lava dome. The current eruption period began in late December 2020 and has more recently consisted of ash plumes, intermittent incandescent avalanches of material, and pyroclastic flows (BGVN 48:04). This report covers activity during April through September 2023, based on information from Balai Penyelidikan dan Pengembangan Teknologi Kebencanaan Geologi (BPPTKG), the Center for Research and Development of Geological Disaster Technology, a branch of PVMBG which specifically monitors Merapi. Additional information comes from the Pusat Vulkanologi dan Mitigasi Bencana Geologi (PVMBG, also known as Indonesian Center for Volcanology and Geological Hazard Mitigation, CVGHM), MAGMA Indonesia, the Darwin Volcanic Ash Advisory Centre (VAAC), and various satellite data.
Activity during April through September 2023 primarily consisted of incandescent avalanches of material that mainly affected the SW and W flanks and traveled as far as 2.3 km from the summit (table 25) and white gas-and-steam emissions that rose 10-1,000 m above the crater.
Table 25. Monthly summary of avalanches and avalanche distances recorded at Merapi during April through September 2023. The number of reported avalanches does not include instances where possible avalanches were heard but could not be visually confirmed as a result of inclement weather. Data courtesy of BPPTKG (April-September 2023 daily reports).
| Month |
Average number of avalanches per day |
Distance avalanches traveled (m) |
| Apr 2023 |
19 |
1,200-2,000 |
| May 2023 |
22 |
500-2,000 |
| Jun 2023 |
18 |
1,200-2,000 |
| Jul 2023 |
30 |
300-2,000 |
| Aug 2023 |
25 |
400-2,300 |
| Sep 2023 |
23 |
600-2,000 |
BPPTKG reported that during April and May white gas-and-steam emissions rose 10-750 m above the crater, incandescent avalanches descended 500-2,000 m on the SW and W flanks (figure 135). Cloudy weather often prevented clear views of the summit, and sometimes avalanches could not be confirmed. According to a webcam image, a pyroclastic flow was visible on 17 April at 0531. During the week of 28 April and 4 May a pyroclastic flow was reported on the SW flank, traveling up to 2.5 km. According to a drone overflight taken on 17 May the SW lava dome volume was an estimated 2,372,800 cubic meters and the dome in the main crater was an estimated 2,337,300 cubic meters.
During June and July similar activity persisted with white gas-and-steam emissions rising 10-350 m above the crater and frequent incandescent avalanches that traveled 300-2,000 m down the SW, W, and S flanks (figure 136). Based on an analysis of aerial photos taken on 24 June the volume of the SW lava dome was approximately 2.5 million cubic meters. A pyroclastic flow was observed on 5 July that traveled 2.7 km on the SW flank. According to the Darwin VAAC multiple minor ash plumes were identified in satellite images on 19 July that rose to 3.7 km altitude and drifted S and SW. During 22, 25, and 26 July a total of 17 avalanches descended as far as 1.8 km on the S flank.
Frequent white gas-and-steam emissions continued during August and September, rising 10-450 m above the crater. Incandescent avalanches mainly affected the SW and W flanks and traveled 400-2,300 m from the vent (figure 137). An aerial survey conducted on 10 August was analyzed and reported that estimates of the SW dome volume was 2,764,300 cubic meters and the dome in the main crater was 2,369,800 cubic meters.
Frequent and moderate-power thermal activity continued throughout the reporting period, according to a MIROVA (Middle InfraRed Observation of Volcanic Activity) analysis of MODIS satellite data (figure 138). There was an increase in the number of detected anomalies during mid-May. The MODVOLC thermal algorithm recorded a total of 47 thermal hotspots: six during April, nine during May, eight during June, 15 during July, four during August, and five during September. Some of this activity was captured in infrared satellite imagery on clear weather days, sometimes accompanied by incandescent material on the SW flank (figure 139).
Geologic Background. Merapi, one of Indonesia's most active volcanoes, lies in one of the world's most densely populated areas and dominates the landscape immediately north of the major city of Yogyakarta. It is the youngest and southernmost of a volcanic chain extending NNW to Ungaran volcano. Growth of Old Merapi during the Pleistocene ended with major edifice collapse perhaps about 2,000 years ago, leaving a large arcuate scarp cutting the eroded older Batulawang volcano. Subsequent growth of the steep-sided Young Merapi edifice, its upper part unvegetated due to frequent activity, began SW of the earlier collapse scarp. Pyroclastic flows and lahars accompanying growth and collapse of the steep-sided active summit lava dome have devastated cultivated lands on the western-to-southern flanks and caused many fatalities.
Information Contacts: Balai Penyelidikan dan Pengembangan Teknologi Kebencanaan Geologi (BPPTKG), Center for Research and Development of Geological Disaster Technology (URL: http://merapi.bgl.esdm.go.id/, Twitter: @BPPTKG); MAGMA Indonesia, Kementerian Energi dan Sumber Daya Mineral (URL: https://magma.esdm.go.id/v1); Pusat Vulkanologi dan Mitigasi Bencana Geologi (PVMBG, also known as Indonesian Center for Volcanology and Geological Hazard Mitigation, CVGHM), Jalan Diponegoro 57, Bandung 40122, Indonesia (URL: http://www.vsi.esdm.go.id/); Darwin Volcanic Ash Advisory Centre (VAAC), Bureau of Meteorology, Northern Territory Regional Office, PO Box 40050, Casuarina, NT 0811, Australia (URL: http://www.bom.gov.au/info/vaac/); MIROVA (Middle InfraRed Observation of Volcanic Activity), a collaborative project between the Universities of Turin and Florence (Italy) supported by the Centre for Volcanic Risk of the Italian Civil Protection Department (URL: http://www.mirovaweb.it/); Hawai'i Institute of Geophysics and Planetology (HIGP) - MODVOLC Thermal Alerts System, School of Ocean and Earth Science and Technology (SOEST), Univ. of Hawai'i, 2525 Correa Road, Honolulu, HI 96822, USA (URL: http://modis.higp.hawaii.edu/); Copernicus Browser, Copernicus Data Space Ecosystem, European Space Agency (URL: https://dataspace.copernicus.eu/browser/); Øystein Lund Andersen (URL: https://www.oysteinlundandersen.com/, https://twitter.com/oysteinvolcano).
Ebeko
Russia
50.686°N, 156.014°E; summit elev. 1103 m
All times are local (unless otherwise noted)
Moderate explosive activity with ash plumes continued during June-November 2023
Ebeko, located on the N end of Paramushir Island in Russia’s Kuril Islands just S of the Kamchatka Peninsula, consists of three summit craters along a SSW-NNE line at the northern end of a complex of five volcanic cones. Observed eruptions date back to the late 18th century and have been characterized as small-to-moderate explosions from the summit crater, accompanied by intense fumarolic activity. The current eruptive period began in June 2022, consisting of frequent explosions, ash plumes, and thermal activity (BGVN 47:10, 48:06). This report covers similar activity during June-November 2023, based on information from the Kamchatka Volcanic Eruptions Response Team (KVERT) and satellite data.
Moderate explosive activity continued during June-November 2023 (figures 50 and 51). According to visual data from Severo-Kurilsk, explosions sent ash 2-3.5 km above the summit (3-4.5 km altitude) during most days during June through mid-September. Activity after mid-September was slightly weaker, with ash usually reaching less than 2 km above the summit. According to KVERT the volcano in October and November was, with a few exceptions, either quiet or obscured by clouds that prevented satellite observations. KVERT issued Volcano Observatory Notices for Aviation (VONA) on 8 and 12 June, 13 and 22 July, 3 and 21 August, and 31 October warning of potential aviation hazards from ash plumes drifting 3-15 km from the volcano. Based on satellite data, KVERT reported a persistent thermal anomaly whenever weather clouds permitted viewing.
Geologic Background. The flat-topped summit of the central cone of Ebeko volcano, one of the most active in the Kuril Islands, occupies the northern end of Paramushir Island. Three summit craters located along a SSW-NNE line form Ebeko volcano proper, at the northern end of a complex of five volcanic cones. Blocky lava flows extend west from Ebeko and SE from the neighboring Nezametnyi cone. The eastern part of the southern crater contains strong solfataras and a large boiling spring. The central crater is filled by a lake about 20 m deep whose shores are lined with steaming solfataras; the northern crater lies across a narrow, low barrier from the central crater and contains a small, cold crescentic lake. Historical activity, recorded since the late-18th century, has been restricted to small-to-moderate explosive eruptions from the summit craters. Intense fumarolic activity occurs in the summit craters, on the outer flanks of the cone, and in lateral explosion craters.
Information Contacts: Kamchatka Volcanic Eruptions Response Team (KVERT), Far Eastern Branch, Russian Academy of Sciences, 9 Piip Blvd., Petropavlovsk-Kamchatsky, 683006, Russia (URL: http://www.kscnet.ru/ivs/kvert/).
Search Bulletin Archive by Publication Date
Select a month and year from the drop-downs and click "Show Issue" to have that issue displayed in this tab.
The default month and year is the latest issue available.
Bulletin of the Global Volcanism Network - Volume 23, Number 11 (November 1998)
Managing Editor: Richard Wunderman
Atmospheric Effects (1995-2001) (Unknown)
Lidar data from Hampton, Virginia, USA
Avachinsky (Russia)
Distinct change in seismic activity
Colima (Mexico)
Lava flows and block-and-ash flows down flanks from growing lava dome
Etna (Italy)
Summary of eruptive activity from summit craters during June-September 1998
Galeras (Colombia)
Fracture-related seismicity continues
Grimsvotn (Iceland)
Subglacial eruption near site of 1996 outburst flood
Ijen (Indonesia)
Recent measurements of acid crater lake
Karymsky (Russia)
Strombolian eruptions continue, ash column seen on 24 November
Kilauea (United States)
Continuing flow from Pu`u `O`o; major bench collapse
Manam (Papua New Guinea)
Energetic outbursts lead to pyroclastic flows, lava flows
Plat Pays, Morne (Dominica)
Strong earthquake swarms, tremor
Popocatepetl (Mexico)
Growing lava body in crater leads to larger explosions
Rabaul (Papua New Guinea)
Intermittent emissions continue during October
Sheveluch (Russia)
Steam-and-gas plumes, tremor episodes
Soufriere Hills (United Kingdom)
Small dome collapses, pyroclastic flows, and ash venting
Ushkovsky (Russia)
Earthquakes form distinctive group
Villarrica (Chile)
Summary of February-November activity; intermittent lava pond pulses, phreatic explosions
Whakaari/White Island (New Zealand)
Minor eruptive activity continues; alert level raised
Atmospheric Effects (1995-2001) (Unknown) — November 1998 Cite this Report
Atmospheric Effects (1995-2001)
Unknown
Unknown, Unknown; summit elev. m
All times are local (unless otherwise noted)
Lidar data from Hampton, Virginia, USA
Table 15 lists the ground-based 48-inch lidar measurements at 0.69 µm taken with a ruby laser in Hampton, Virginia (37.1°N, 76.3°W) during 1998. The lowest levels of aerosol loading ever reported in the 24-year lidar record at Hampton were measured during the summer of 1998.
Table 15. Lidar data from Virginia, USA, for April-December 1998 showing altitudes of aerosol layers. Backscattering ratios are for the ruby wavelength of 0.69 µm. The integrated values show total backscatter, expressed in steradians-1, integrated over 300-m intervals from the tropopause to 30 km. Courtesy of Mary Osborne.
| DATE |
LAYER ALTITUDE (km) (peak) |
BACKSCATTERING RATIO |
BACKSCATTERING INTEGRATED |
| Hampton, Virginia (37.1°N, 76.3°W) |
| 03 Apr 1998 |
13-26 (19.6) |
1.09 |
4.11 x 10⁻⁵ |
| 07 Apr 1998 |
12-27 (14.5) |
1.10 |
5.38 x 10⁻⁵ |
| 13 Apr 1998 |
15-25 (21.5) |
1.06 |
2.98 x 10⁻⁵ |
| 20 May 1998 |
13-28 (25.9) |
1.08 |
3.42 x 10⁻⁵ |
| 19 Jun 1998 |
13-23 (20.9) |
1.04 |
1.70 x 10⁻⁵ |
| 02 Jul 1998 |
14-29 (18.8) |
1.06 |
1.17 x 10⁻⁵ |
| 14 Jul 1998 |
15-29 (18.5) |
1.05 |
1.62 x 10⁻⁵ |
| 10 Sep 1998 |
17-30 (27.7) |
1.06 |
0.89 x 10⁻⁵ |
| 24 Sep 1998 |
13-29 (16.6) |
1.11 |
2.99 x 10⁻⁵ |
| 15 Oct 1998 |
13-33 (14.2) |
1.11 |
4.81 x 10⁻⁵ |
| 24 Nov 1998 |
14-29 (17.9) |
1.10 |
3.79 x 10⁻⁵ |
| 02 Dec 1998 |
12-27 (18.2) |
1.09 |
3.15 x 10⁻⁵ |
Geologic Background. The enormous aerosol cloud from the March-April 1982 eruption of Mexico''s El Chichón persisted for years in the stratosphere, and led to the Atmospheric Effects section becoming a regular feature of the Bulletin thorugh 1989. Lidar data and other atmospheric observations were again published intermittently between 1995 and 2001; those reports are included here.
Information Contacts: Mary Osborn, NASA Langley Research Center (LaRC), Hampton, VA 23681 USA.
Avachinsky (Russia) — November 1998 Cite this Report
Avachinsky
Russia
53.256°N, 158.836°E; summit elev. 2717 m
All times are local (unless otherwise noted)
Distinct change in seismic activity
A distinct change in seismic activity began on 3 December. About 120 shallow events of very low magnitude were recorded during 3-6 December. The only days during the episode when observation was not obscured by cloud were 1 and 3-6 December, but no plumes were seen those days.
Geologic Background. Avachinsky, one of Kamchatka's most active volcanoes, rises above Petropavlovsk, Kamchatka's largest city. It began to form during the middle or late Pleistocene, and is flanked to the SE by Kozelsky volcano, which has a large crater breached to the NE. A large collapse scarp open to the SW was created when a major debris avalanche about 30,000-40,000 years ago buried an area of about 500 km2 to the south, underlying the city of Petropavlovsk. Reconstruction of the volcano took place in two stages, the first of which began about 18,000 years before present (BP), and the second 7,000 years BP. Most eruptions have been explosive, with pyroclastic flows and hot lahars being directed primarily to the SW by the collapse scarp, although there have also been relatively short lava flows. The frequent historical eruptions have been similar in style and magnitude to previous Holocene eruptions.
Information Contacts: Olga Chubarova, Kamchatka Volcanic Eruptions Response Team (KVERT), Institute of Volcanic Geology and Geochemistry, Piip Ave. 9, Petropavlovsk-Kamchatsky, 683006, Russia; Tom Miller, Alaska Volcano Observatory (AVO), a cooperative program of a) U.S. Geological Survey, 4200 University Drive, Anchorage, AK 99508-4667, USA (URL: http://www.avo.alaska.edu/), b) Geophysical Institute, University of Alaska, PO Box 757320, Fairbanks, AK 99775-7320, USA, and c) Alaska Division of Geological & Geophysical Surveys, 794 University Ave., Suite 200, Fairbanks, AK 99709, USA.
Colima
Mexico
19.514°N, 103.62°W; summit elev. 3850 m
All times are local (unless otherwise noted)
Lava flows and block-and-ash flows down flanks from growing lava dome
The eruption at Colima began by 20 November 1998 following 17 days of continuous seismic unrest and deformation of the summit cone. Gabriel Reyes, Juan José Ramírez, and Yuri Taran noted that fumarolic gases monitored during previous years may have also shown precursory variations in chemical composition and temperature. New fractures in the summit region were observed on repeated occasions by Abel Cortes and J.C. Gavilanes during ascents on 27 November 1997, 18 March 1998, and 5 May 1998. Between 1614 and 1800 on 17 November, Carlos Navarro and Cortes visited La Yerbabuena, a town on the SW flank 9 km from the summit crater, where they heard more than 10 episodes of rumbling noise coming from the volcano. Cloudy weather did not allow direct observation of the volcano, but based on previous experience they interpreted the noises to be the result of small rockslides.
During the morning of 18 November the settlement of La Yerbabuena (~180 inhabitants) was evacuated voluntarily and in orderly fashion with the assistance of the Colima Observatory Information Group and the local civil protection and military authorities. During that day residents also evacuated the settlement of Juan Barragan (120 people) 10 km SE of the summit.
The first helicopter overflight took place between 0800 and 1000 on 19 November but cloudy weather obscured large parts of the summit area. Observers did note a vigorous fumarolic plume blowing W. That night the Red Sismológica Telemétrica del Estado de Colima (RESCO) reported strong seismic activity and harmonic tremor over periods lasting for 6 minutes. They also registered increased rockfall signals.
At 0700 on 21 November the new lava dome had almost entirely filled the 1994 crater (BGVN 23:10; figure 25). At 1130 that morning, lava started spilling out of the summit crater area producing block-and-ash flows to rush down the S slopes at 3- to 5-minute intervals. The block-and-ash flows were mostly emplaced within the eastern branch of Barranca El Cordobán. The most voluminous flows reached the 2,400 m contour, a distance of more than 4 km from the crater.
Another flight on 21 November revealed that the lava flow had advanced ~150 m downslope, and had a width of 100 m and a thickness of ~20 m. The lava flow continued advancing such that on 22 November it was 170 m long; on 23 November, 270 m; and on 24 November, 370 m. Block-and-ash flows emplaced during the morning of 25 November in the central branch of Barranca El Cordobán reached 1,900 m elevation. Observers and photographs revealed two additional lava flows as seen from both Rancho El Jabalí (10 km SW of the summit) during the night of 25 November and from Cofradia de Suchitlan (15 km SW) during the night of 26 November; these flows also descended the SW flank and headed towards two drainages (the W branch of Barranca El Cordobán and the S branch of Barranca La Lumbre).
On 28 November, S. Rodríguez, J.M. Espíndola, and C. Siebe observed the advance of the westernmost lava flow from a 3,100-m-elevation vantage point. Most of the time the flow's front and margins relinquished large blocks (up to 10 m across) producing strong rumbling noises. Small block-and-ash flows moved quietly compared with the rockfalls from the lava flow. Still, it was possible to collect samples of the lava flow.
Viewed in thin section the new lava contained, in decreasing abundance, phenocrysts of zoned plagioclase, hypersthene, pleochroic resorbed brown hornblende, and subordinate magnetite in a microcrystalline to glassy matrix. Chemical analysis indicated that the new lava is very similar in composition to previous eruptions (table 5).
Table 5. Chemistry of freshly erupted Colima lava sampled on 28 November 1998. Courtesy of S. Rodríguez, J.M. Espíndola, and C. Siebe; analysis made by Rufino Lozano, Laboratorio de Fluorescencia de Rayos X at Instituto de Geología, UNAM.
| Element |
Analysis |
| SiO2 |
59.14% |
| TiO2 |
0.66% |
| Al2O3 |
17.54% |
| Fe2O3 |
1.86% |
| FeO |
3.91% |
| MnO |
0.11% |
| MgO |
3.71% |
| CaO |
6.64% |
| Na2O |
3.99% |
| K2O |
1.31% |
| P2O5 |
0.16% |
| LOI |
-0.02% |
| Total |
99.01% |
| |
| Rb |
20 ppm |
| Sr |
549 ppm |
| Ba |
530 ppm |
| Y |
19 ppm |
| Zr |
148 ppm |
| Nb |
4 ppm |
| V |
110 ppm |
| Cr |
123 ppm |
| Co |
20 ppm |
| Ni |
32 ppm |
| Cu |
92 ppm |
| Zn |
68 ppm |
| Th |
less than 2 ppm |
| Pb |
7 ppm |
On 2 December the three lava flows on the SSW flanks had reached these estimated lengths: 1,000 m (more westerly flow), 1,200 m (central flow), and 900 m (SE flow). Good views of these flows were obtained during an overflight the next day (figure 28). Around this time, it seemed most probable that the ongoing eruption would remain mostly effusive and not exceed the magnitude of eruptions witnessed here during past decades. Accordingly, inhabitants of La Yerbabuena were allowed to return to their homes on 1 December.
Fine ash produced thus far during the eruption consisted mostly of non-juvenile material related to rockfalls and small block-and-ash flows. Two stations, one located at Rancho El Jabalí (10 km SW of the summit) and the other at La Becerrera (12 km SW of the summit), registered maximum ashfalls on 23 and 26 November, respectively; both with daily loads of around 50 g/m2. The wind mostly dispersed this ash towards the SW and W.
COSPEC measurements carried out by Gavilanes and Cortes since 30 October 1998 showed a marked increase in SO2 flux (table 6). The highest discharge, measured on 26 November, yielded an estimate of more than 16,000 metric tons/day.
Table 6. COSPEC measurements for SO2 fluxes at Colima volcano at stated dates in 1998. Fluxes are in metric tons/day and were rounded to three significant figures. Measurements on 11 February, 14 April, 2 May, and 25 May were below the detection limit. Extrusion began on 20 November. Courtesy of Juan Carlos Gavilanes and Abel Cortes, Universidad de Colima and Colima Volcano Observatory.
| Date |
Average |
Maximum |
Minimum |
Uncertainty (±) |
Avg. wind velocity (m/s) |
| 30 Oct 1998 |
408 |
437 |
365 |
36 |
6.01 |
| 14 Nov 1998 |
390 |
484 |
307 |
89 |
8.93 |
| 18 Nov 1998 |
1,610 |
2,270 |
905 |
685 |
7.20 |
| 21 Nov 1998 |
1,400 |
567 |
325 |
121 |
3.93 |
| 22 Nov 1998 |
850 |
1,110 |
647 |
229 |
1.30 |
| 24 Nov 1998 |
4,670 |
5,260 |
4,320 |
467 |
7.72 |
| 25 Nov 1998 |
8,210 |
9,250 |
7,260 |
994 |
7.29 |
| 26 Nov 1998 |
16,420 |
20,360 |
10,120 |
5,120 |
13.5 |
| 27 Nov 1998 |
10,670 |
13,150 |
7,930 |
2,610 |
15.2 |
| 28 Nov 1998 |
4,790 |
5,600 |
3,890 |
853 |
3.20 |
| 30 Nov 1998 |
2,330 |
2,500 |
2,070 |
216 |
5.81 |
| 03 Dec 1998 |
1,890 |
2,500 |
1,520 |
490 |
3.73 |
Geologic Background. The Colima complex is the most prominent volcanic center of the western Mexican Volcanic Belt. It consists of two southward-younging volcanoes, Nevado de Colima (the high point of the complex) on the north and the historically active Volcán de Colima at the south. A group of late-Pleistocene cinder cones is located on the floor of the Colima graben west and east of the complex. Volcán de Colima (also known as Volcán Fuego) is a youthful stratovolcano constructed within a 5-km-wide scarp, breached to the south, that has been the source of large debris avalanches. Major slope failures have occurred repeatedly from both the Nevado and Colima cones, producing thick debris-avalanche deposits on three sides of the complex. Frequent recorded eruptions date back to the 16th century. Occasional major explosive eruptions have destroyed the summit (most recently in 1913) and left a deep, steep-sided crater that was slowly refilled and then overtopped by lava dome growth.
Information Contacts: Juan Carlos Gavilanes, Carlos Navarro, Abel Cortés, Alicia Cuevas, and Esther Ceballos, Universidad de Colima; Claus Siebe, Juan Manuel Espíndola, Instituto de Geofísica, UNAM; Sergio Rodríguez-Elizarrarás, Instituto de Geología, UNAM.
Etna
Italy
37.748°N, 14.999°E; summit elev. 3357 m
All times are local (unless otherwise noted)
Summary of eruptive activity from summit craters during June-September 1998
The following report summarizes activity observed at each of the four summit craters of Etna (figure 70) from June through September 1998. In early June, Northeast Crater was quiet while Bocca Nuova, Southeast Crater and Voragine were displaying the highest level of activity seen in many months. Generally high levels of activity continued until a major explosive eruption from Voragine on 22 July. Strong Southeast Crater explosions on 15 September destroyed the intracrater cone, which was soon replaced.
During early July all four craters were erupting simultaneously, a fact never recorded since their birth; only the Central Voragine has degree of permanence; Northeast Crater (NEC) appeared in 1911, the Bocca Nuova (BN) in 1968 and the Southeast Crater (SEC) in 1971.
Most of the information for this report was compiled by Boris Behncke at the Istituto di Geologia e Geofisica, University of Catania (IGGUC), and published on his internet web site. The compilation was based on personal visits to the summit, telescopic observations from Catania, and other sources. Additional separate reports were provided by Tanguy and Patanè (10-14 July observations) and Murray, Stevens, and Craggs (15 September observations). Aviation notices were issued by the Toulouse (France) Volcanic Ash Advisory Center.
Activity at Southeast Crater (SEC). There were at least three explosive vents on the intracrater cone during 4-5 June. Activity usually alternated between the N and S vents. When both exploded simultaneously, a third NW vent produced weak incandescent projections. Vigorous growth around the vents elevated the summit to 20 m above the SEC rim. Lava flowed towards the NE flank where it spilled down to the base of the SEC cone. During a visit on 11 June, SEC had the usual two vents active, and fresh bombs scattered over the crater floor. Recent flows had built a high mound on the E side of the cone; an active flow issued from the vent area. By the morning of 15 June the lava flow at SEC had reached its southern base and was advancing slowly.
Explosive activity on 22 June occurred from three vents on the intracrater cone, and lava issued from a vent halfway up the S flank. Explosive Strombolian activity occurred in distinct cycles separated by quiet periods of up to one hour, although lava effusion persisted. The beginning of each cycle was marked by a flame of burning gas at the summit. More vigorous bursts would then follow at a larger vent. Explosions would become increasingly frequent and rise higher (up to 150 m above the vent), showering the southern part of SEC with bombs. Activity would then shift back to the SW vent where each Strombolian burst was accompanied by a gas flame. Intermittent explosive and effusive activity continued on 24 and 28 June.
During a summit visit by Behncke and members of L'Association Volcanologique Europeenne (LAVE) of Paris on 4 July, explosive activity at SEC was intense, with bombs falling outside the crater. Activity from the top of the intracrater cone sent jets of bombs and scoria up to 150 m. Lava issued from three vents, one feeding a flow over the SW crater rim. On the evening of 7 July LAVE members reported that the active lava flow on the SW flank of SEC was ~200 m long. The summit visit on 13 July was made by Giovanni Sturiale, Sandro Privitera, and Behncke (IGGUC), and Jürg Alean. At SEC, Strombolian activity was vigorous, bombs fell frequently outside the crater, and lava emission was continuing. Recent lava had filled the SW part of the crater to within 1-2 m of the rim. In all other areas the pre-1997 rim of SEC has been buried by overflowing lava. Jürg Alean visited on 14 July and reported that SEC continued to produce Strombolian activity. From the Torre del Filosofo hut a small lava flow could be seen descending the SE flank of SEC; incandescent blocks frequently detached from the flow front.
Vigorous activity occurred at SEC during the 22 July Voragine episode, and during the days after activity was limited to SEC where vigorous lava fountaining and effusion occurred. On 24 July, Sturiale and Privitera observed vigorous Strombolian activity, with many bombs falling outside the crater. However, SEC activity declined and virtually ceased by the end of July.
As of the night of 17-18 August, there had been no resumption of the SEC eruption. The crater was seen erupting later on 18 August by Privitera. When Monaco and Behncke visited on 20 August, virtually no activity was observed. As of 26 August SEC appeared quiet, although the activity in July had built the intracrater cone to 40-50 m higher than the crater rim. Bombs were scattered all over the crater area and beyond. Two post-22 July lava flows had spilled onto the S and NE flanks. No activity occurred during a visit by Behncke and Sturiale on 9 September.
Explosive activity from SEC was observed by scientists from Open University (Murray and Stevens) and the University of London (Craggs) on the morning of 15 September. Several ash clouds erupting from the summit between 0745 and 0800 were seen from 10 km S. At 0815 bomb-laden ash clouds were observed from near the Piccolo Rifugio (4.5 km S of the summit craters). At 0822 an exceptionally large explosion sent meter-sized bombs ~300-400 m above the crater rim. One more minor explosion was observed before the summit was obscured at 0826. Observation recommenced at the Pizzi Denieri volcano observatory. The summit was usually obscured by clouds, but five explosions during 0928-0936 were audible above gale-force winds and engine noise. Ash clouds were seen from Mt. Nero on the NE rift (6 km from the summit craters) at 1003, and at 1006 an explosion was heard.
Explosions continued all afternoon, causing ashfall in inhabited areas on the E flank. During the afternoon, while conducting fieldwork 50 km S of Etna, Behncke and Sturiale saw black ash fountains piercing weather clouds above the summit. These pyroclastic jets rose several hundred meters above the summit before drifting E. Observations by Behncke on 19 September revealed that the explosions ejected lithics and fresh bombs, which were abundant in the saddle between SEC and the main summit cone. Some of the bombs were up to 5 m across and had flattened upon impact. Bombs tens of centimeters in diameter formed a continuous deposit on the NW side of the crater. Most of the intracrater cone was destroyed, and a crater ~80 m across formed in its place (figure 71).
Vigorous activity on 17 and 18 September ejected bombs described as having been "several meters across" by a group of British geologists led by J.B. Murray working in the area. The beginning of a lava flow down the NE flank of SEC is not known, but it was reported by mountain guides to have been moving on 17-18 September. During a 19 September visit by Behncke, Strombolian bursts occurred from two vents in the explosion crater, around which a small cone had begun to grow. Lava emission from a vent high on the SEC cone was feeding a flow that advanced towards Valle del Leone.
Activity at SEC was continuing on 21 and 25 September with intense Strombolian activity; incandescent bombs jetted 150-200 m high. Continued vigorous activity during the last week of September caused rapid growth of the intracrater cone until ti was higher than ever before, having almost entirely covered the remains of its predecessor.
Activity at Bocca Nuova (BN). Eruptive activity during 4-5 June was occurring at both previously active areas. Night incandescence and bomb ejections were seen in a deep pit within the SE eruptive area. Noisy activity occurred at the NW eruptive area, at the bottom of the collapsed cone that had grown in 1997. At least five vents were producing explosions and lava fountains accompanied by bursts of burning gas. Several lava flows extended over the crater floor.
Observations were made for 30 minutes on 11 June from the crater rim. The SE vents had fountains of ash and bombs rising ~50 m. At the NW eruptive area, three vents were active, and the collapse pit was filled with pyroclastics and recent lava flows. Two large (30 and 50 m diameter) vents were in the central part of the filled pit while a smaller vent (~5 m in diameter) lay 50-70 m S; this latter one produced weak lava sputterings, building a low hornito. The two larger vents showed a repetitive eruptive behavior for the first 15 minutes of observation, then erupted simultaneously in a series of ash-free lava fountains. For about ten minutes there were bomb ejections from both major vents. Centimeter-sized scoria and Pele's hair were deposited all over the SE sector and on SEC.
Activity was less intense on 15 June; during a 1-hour stay in the summit area, strong explosions from the large cone ejected ash-rich jets of bombs up to 100 m above the crater rim. Visits to BN are dangerous due to frequent blasts of large quantities of meter-sized bombs. Most blasts observed on 22 June lasted up to 10 minutes. The source vent lay in the partially collapsed 1997 cone at the N eruptive area; it produced almost continuous minor explosions between the large detonations, ejecting large clots of fluid lava. A small vent to the south ejected minor sprays of meter-sized bombs. Continuous lava fountaining occurred from a SE vent. During the 22 June visit the central vent was the site of pulsating gas jets, and vigorous lava fountaining occurred at the larger SW vent. A large asymmetrical cone leaning against the thin wall between the Voragine and BN had grown around the vent. Vigorous activity was continuing on 24 and 28 June.
During a summit visit by Behncke and members of LAVE on 4 July, all four summit craters were active. The summit visit on 13 July by Sturiale, Privitera, Behncke, and Alean showed low levels of activity; a small cone had grown around the main vent. The N eruptive area was the site of Strombolian bursts every 5-10 minutes. A fairly large cone had grown at this vent, the first time that significant cone growth had occurred in BN since late 1997. Lava had covered the S crater floor.
A visit by J.C. Tanguy and G. Patanè during 10-14 July revealed that, with respect to the preceding year, the bottom of BN had raised considerably owing to the tephra deposition, so that the strongest explosions from the NW vent (figure 72) sometimes showered the external slope with bombs. By 12 July the explosions were reduced in strength and frequency. Jürg Alean visited on 14 July and reported that the N cone produced fountains heavily charged with bombs; many fell on the crater rims and in the Voragine.
Vigorous activity occurred at BN during the 22 July Voragine episode. On the afternoon of the 23rd, Carmelo Monaco (IGGUC) saw bright incandescence in BN even in bright daylight from an airplane approaching Catania. Activity was noted on 25 July and increased the following day according to Claude Grandpey (LAVE); activity at the NW area occurred from a small vent while the SE area had three vents emitting gas and bombs. In late July and early August, numerous vents erupted explosively at the NW area; subsidence of the central crater floor by a few meters occurred on 1 August. The SE vents displayed spectacular lava cascades from one vent into the other, the lower vent filling until an explosion cleared it. Kloster (LAVE) reported a lava lake in this area on 7 and 10 August, but during the following days there was only Strombolian activity.
On 20 August Monaco and Behncke observed moderate eruptions at the N vent area. Besides the summit vent, there were at least four smaller flank vents which had erupted recently. On 26 August frequent ash emissions were occurring. Growth of a small cone above the diaframma (septum between the craters) culminated in the fracturing of this cone and a cascade of lava into BN in late August.
A visit to the summit by Behncke and Sturiale on 9 September revealed that one vent at the summit of the NW cone was the site of Strombolian bursts alternating with bomb and ash emissions. Four smaller vents on the flanks on the cone were weakly degassing. Weak Strombolian activity occurred from two SE vents where a small cone was growing in a collapse depression. Behncke saw activity at similar levels on 19 September. As of 25 September there was low-level activity.
Activity at Voragine. On 3 June, near-continuous cannon-shot like detonations were heard kilometers away, and Marco Fulle (Osservatorio Astronomico, Trieste) observed magma bubbles within the vent burst at the onset of fire-fountaining episodes. When observed during 4-5 June, the vent in the SW crater floor had enlarged notably since 6 April and shifted away from the diaframma, and a low pyroclastic cone had grown around it. On the evening of 4 June, activity at the Voragine was observed for about 4 hours. A sustained fountain jetted from the vent, showering the SW part of the crater floor with bombs; many also fell into BN. This fountain lasted about 75 minutes, followed by pyroclastic material sliding from the inner walls of the vent into its throat. After a few minutes, a small vent opened below the inner SE rim of the vent and emitted jets of incandescent lava. Ejections soon resumed at the main vent, and a flame of burning gas persisted at the subsidiary vent accompanied by weak pyroclastic sprays. A new period of fountaining at the main vent resulted in the continuous fall of bombs into BN. The subsidiary vent was soon buried. At times, portions of the inner walls collapsed, causing ash-rich fountains.
The Voragine was not visited on 11 June, but very strong explosive activity was heard more than 10 km S, and high fountains contained meter-sized bombs. On 15 June the focus of activity had shifted to the central vent, previously active between July and December 1997. This vent ejected continuous lava fountains while a lava flow covered the E half of the crater floor. Fountains played up to 200 m above the vent, with all bombs falling back into the crater. At times, the magma level dropped, and the character of the activity changed to discrete explosions. The SW vent exhibited noisy gas emissions alternating with ash emission and lava fountaining. Vigorous activity was continuing on the evening of 24 June. During a summit visit on 28 June, Monaco observed fountaining from the central vent; the SW vent was less active and mostly ejected ash.
A scoria deposit extending SE, produced by a Voragine lava fountaining episode on 1 July, was examined by Behncke and members of LAVE on 4 July. Both vents in the Voragine were in vigorous, alternating activity. Eruptive cycles at the SW vent produced jets of fragmented pyroclastics. As activity waned at this vent, projections of large bombs would initiate at the central vent, increasing in frequency and height into a pulsating fountain at least 100 m above the crater floor.
Stefano Branca (IGGUC) reported that frequent explosions were audible throughout 6 July at Viagrande, a village at the SE flank of Etna; air concussions associated with the explosions shook windows and rattled doors. The explosions probably originated at the Voragine, the site of recent noisy activity. On 7 July explosions were still audible but less intense. Members of LAVE observed activity that evening from the SW vent that dropped bombs as far as the S rim of NEC.
A visit by J.C. Tanguy and G. Patanè during 10-14 July revealed activity at the large SW cone (figure 72) near the diaframma and from a central cone. By 12 July the two vents hurled large lava lumps and bombs in a fountain-like manner, some of which fell outside the crater. On 13 July this activity was stronger. That afternoon activity decreased, but two flows began from a fissure NE of the central cone. Lava rapidly invaded the northern, lowest part of the Voragine. During the peak effusive activity the two lava flows reached a speed estimated at 3-4 m/s. On the morning of 14 July, only the SW vent showed Strombolian explosions. Lava flows had entirely disappeared under a layer of tephra erupted during the night.
During a visit on 13 July by Sturiale, Privitera, Behncke, and Alean, the most vigorous activity occurred at the Voragine. On 12 July, lava fountains roared up to 200 m above the crater rim for three hours from the SW vent. Powerful jets of bombs mixed with ash were also ejected. The cone around the SW vent was higher in places than the diaframma; the vent was 30-50 m across. Activity varied from isolated powerful explosions to long-lasting lava fountains. At times dense ash plumes with large bombs rose from the vent. Explosions from the central cone blasted lava in all directions. Small lava fountains and ash emissions occurred from two fissures. On at least 20 occasions during 90 minutes of observation the magma surface in the vent domed up, forming a huge bubble that exploded. Explosions later ejected meter-sized bombs to 200 m or higher; many fell into BN, outside the Voragine, or on the E slope of the main summit cone not far from SEC. Jürg Alean visited on 14 July and reported that both vents showed intense activity. The SW vent was filled almost to the rim by lava which was fountaining vigorously. The central vent displayed a similar eruptive behavior as on the previous visit, but no lava bubbles were observed. On 20 July lava fountaining from the Voragine was common.
A major eruptive event began from the Voragine at about 1835 on 22 July. The following is based on preliminary information from scientists of the IGGUC (mainly Giovanni Sturiale and Sandro Privitera) and others who visited after the event as late as 20 August. According to eyewitnesses on the SW side of the main summit cone, huge lava fountains rose from the Voragine, and heavy tephra falls began in the summit area. A large mushroom-shaped tephra column rose up to 10 km above the summit. The plume was then driven S and SE, and widespread ashfalls occurred more than 30 km away. Sand-sized tephra fell in Catania, leaving a deposit about 1 mm thick. For the first time since 24 September 1986 (when NEC had a powerful explosive eruption) the Fontanarossa airport of Catania had to be closed (it was reopened after 15 hours). The Toulouse (France) Volcanic Ash Advisory Center issued 17 aviation notices warning pilots about the ash during 22-29 July. The tephra falls caused traffic problems on roads and highways. Close to the summit, a thick scoria deposit buried the dirt roads leading to the Rifugio Torre del Filosofo and around the western base of the main summit cone. Sturiale and Privitera reported that at Torre del Filosofo the thickness of the scoria deposit was about 50 cm.
It appears that both vent areas produced lava fountains and a tall tephra column. Rapid accumulation of ejecta in the saddle on the NW rim led to a lava flow between the NEC and the main summit cone (figure 73). The flow covered the road connecting the N and S flanks of Etna, and eroded a deep scar into the the S flank of the NEC cone. Continuing pyroclastic activity produced a thick scoria and bomb deposit, with bombs up to 5 m in length. A scoria fan extended 1-1.5 km NW. In the area of the diaframma a lava flow covered the crater floor to several meters depth. On the E flank of the main summit cone a thick pyroclastic deposit formed. In towns on the E and SE flank, the tephra deposit was a few millimeters to a few centimeters thick. Morphological changes within the Voragine consisted mainly of a large amount of filling of the crater followed by subsidence. Parts of the SW crater rim also collapsed.
Vigorous activity occurred simultaneously at BN and SEC on 22 July Voragine event, indicating that the episode affected much of the central conduit system at some depth, possibly due to the rise of a batch of fresh gas-rich magma. Lava fountaining from the Voragine continued intensely through the night of 22-23 July.
According to Grandpey (LAVE), the Voragine appeared "full of materials" on 25 July with no trace of the former intracrater cones. No further activity occurred until 3 August when Kloster (LAVE) saw explosions ejecting bombs. Two days later, three vents erupted in the center of the Voragine. On 7 August small flows on the crater floor were followed by explosive activity. Powerful Strombolian activity with bomb ejections and ash emission caused light ashfall on the SE flank on 18 August, reaching the outskirts of Catania.
On 19 August explosive ash emissions sent small plumes up to several hundred meters above the summit. When Monaco and Behncke visited on 20 August, vigorous activity occurred from two vents. Very light ashfalls on 21 and 24 August reached Catania; ash emissions were also produced on 26 August. A number of reports indicated continued activity through the end of August.
On 6 September bombs fell on the outer W slope of the Voragine and on 7 September ash emission occurred throughout the day. A visit to the summit by Behncke and Sturiale on 9 September revealed continuous moderately strong Strombolian activity from a SW vent; sporadic explosive activity from the vent next to the diaframma sent bombs over the crater rim. At least three other vents were quietly degassing. Similar activity was continuing as of 19 September. On 30 September strong ash and gas emissions rose hundreds of meters.
Activity at Northeast Crater (NEC). Deep-seated Strombolian activity within the central pit resumed in mid-May according to Vittorio Scribano (Istituto di Scienze della Terra, Catania University). Night glow was observed on the evening of 22 June from 3 km NE. During a summit visit by Behncke and members of LAVE on 4 July, all four craters were active; for the first time since 28 March eruptive activity was observed directly at NEC. The eruption site was a 30-m-diameter vent in the NW part of the central pit while a SW vent (~15-20 m in diameter) emitted dense vapor plumes. Small Strombolian bursts from the larger vent occurred every 2-5 minutes, with most ejecta falling back into the pit.
A visit on 13 July by Sturiale, Privitera, Behncke, and Alean revealed mild Strombolian activity from the central pit that ejected bombs. When Monaco and Behncke visited on 20 August, NEC was degassing quietly. Strong fumarolic activity was occurring on 26 August and 9 September.
Geologic Background. Mount Etna, towering above Catania on the island of Sicily, has one of the world's longest documented records of volcanism, dating back to 1500 BCE. Historical lava flows of basaltic composition cover much of the surface of this massive volcano, whose edifice is the highest and most voluminous in Italy. The Mongibello stratovolcano, truncated by several small calderas, was constructed during the late Pleistocene and Holocene over an older shield volcano. The most prominent morphological feature of Etna is the Valle del Bove, a 5 x 10 km caldera open to the east. Two styles of eruptive activity typically occur, sometimes simultaneously. Persistent explosive eruptions, sometimes with minor lava emissions, take place from one or more summit craters. Flank vents, typically with higher effusion rates, are less frequently active and originate from fissures that open progressively downward from near the summit (usually accompanied by Strombolian eruptions at the upper end). Cinder cones are commonly constructed over the vents of lower-flank lava flows. Lava flows extend to the foot of the volcano on all sides and have reached the sea over a broad area on the SE flank.
Information Contacts: Boris Behncke, Istituto di Geologia e Geofisica, Palazzo delle Scienze, Università di Catania, Corso Italia 55, 95129 Catania, Italy; J.C. Tanguy and G. Patanè, University of Catania, Istituto di Geologia e Geofisica, 55 Corso Italia, 95129 Catania, Italy; John Murray and Nicki Stevens, Department of Earth Sciences, Open University, Milton Keynes, United Kingdom; Emma Craggs, Geology Dept, Royal Holloway College, University of London, United Kingdom; Volcanic Ash Advisory Center (VAAC) Toulouse, Météo-France, 42 Avenue Gaspard Coriolis, F-31057 Toulouse cedex, France (URL: http://www.meteo.fr/vaac/)
Galeras (Colombia) — November 1998 Cite this Report
Galeras
Colombia
1.22°N, 77.37°W; summit elev. 4276 m
All times are local (unless otherwise noted)
Fracture-related seismicity continues
Since a volcanic crisis in February 1989 (SEAN 14:02-14:05), Observatorio Vulcanológico y Sismológico de Pasto (OVSP) has been constantly monitoring Galeras. The following is from their bi-monthly reports for late 1998.
During September and October 1998, low-level seismic activity continued at Galeras (figure 90). Most of the energy released (1.6 x 10¹⁶ ergs) was due to earthquakes associated with a fracture process. Volcano-tectonic earthquakes registered during these two months totaled 79, ranging from 0.5 to 16 km in depth. One remarkable earthquake occurred at 0209 on 21 September: it was located at 1°15.75'N, 77°19.16'W at a depth of 8 km, released 1.21 x 10¹⁶ ergs of energy, and had a coda magnitude of 3.4. This earthquake was felt in Pasto City and neighboring settlements. It was the most energetic event of 1998 to date.
Seismic processes related to fluid dynamics (i.e. long-period events and tremor episodes) released a total of 5.18 x 10¹⁴ ergs. Of these events, nine had small amplitudes with long coda and quasi-monochromatic frequencies—so-called "screw type" or "Tornillo" characteristics. Coda values spanned 19-65 s and dominant frequencies ranged 1.82-4.0 Hz. An unusual event occurred 23 October, when harmonic tremor lasted approximately one hour. This episode released 7.09 x 10⁹ ergs.
Galeras, a 4,276 m high andesitic stratovolcano, has a cone that rises 150 m above the floor of the summit caldera. The caldera is open to the west. The active crater is located ~9 km W of Pasto, a city of 350,000 persons. More than 400,000 people live within the volcano's zone of influence. At least six major eruptions have been identified during the past 4,500 years, last in 1886. These eruptions were Vulcanian with inferred low-altitude eruption columns (<10 km) that produced small-volume pyroclastic flows. During the last 500 years eruptions have been characterized by gas-and-ash emissions, small lava flows, and pyroclastic flows that have traveled up to 15 km from the crater.
Geologic Background. Galeras, a stratovolcano with a large breached caldera located immediately west of the city of Pasto, is one of Colombia's most frequently active volcanoes. The dominantly andesitic complex has been active for more than 1 million years, and two major caldera collapse eruptions took place during the late Pleistocene. Long-term extensive hydrothermal alteration has contributed to large-scale edifice collapse on at least three occasions, producing debris avalanches that swept to the west and left a large open caldera inside which the modern cone has been constructed. Major explosive eruptions since the mid-Holocene have produced widespread tephra deposits and pyroclastic flows that swept all but the southern flanks. A central cone slightly lower than the caldera rim has been the site of numerous small-to-moderate eruptions since the time of the Spanish conquistadors.
Information Contacts: Patricia Ponce V., and Pablo Chamorro C., Observatorio Vulcanológico y Sismológico de Pasto (OVSP), Carrera 31, 18-07 Parque Infantil, PO Box 1795, Pasto, Colombia (URL: https://www2.sgc.gov.co/volcanes/index.html).
Grimsvotn (Iceland) — November 1998 Cite this Report
Grimsvotn
Iceland
64.416°N, 17.316°W; summit elev. 1719 m
All times are local (unless otherwise noted)
Subglacial eruption near site of 1996 outburst flood
On 18 December an eruption occurred within the caldera of the subglacial Grímsvötn volcano, 10 km S of the 1996 eruption that resulted in a catastrophic flood. Scientists quickly investigated; the information that follows is from the Nordic Volcanological Institute (NVI).
Eruptive activity. The eruption began at 0920 on 18 December. Ten minutes later a plume (figure 4) was observed that eventually rose 10 km above the Vatnajökull glacier and persisted throughout the day. The plume could be seen from Reykjavik, 200 km W. Winds deflected the plume, causing tephra fallout onto the glacier up to 50 km SE. The London Volcanic Ash Advisory Center issued aviation notices later that day and throughout the eruption.
The eruption was preceded by a mild increase in seismicity for several weeks. A small earthquake swarm began at 2200 on 17 December and a sharp increase in earthquake activity began at 0330 on 18 December. This latter activity was replaced by continuous tremor at 0920, marking the beginning of the eruption. The Icelandic Meteorological Office and the Science Institute monitored seismicity during the eruption.
Vents were located along a 1,300-m-long E-W oriented fissure on the S caldera fault, similar to eruptions in 1934 and 1983, at the foot of Mt. Grímsfjall (which rises ~300 m above the flat ice shelf of the Grímsvötn subglacial lake). The eruption penetrated the caldera lake and its ice shelf, from ice/water depth of ~100 m. Activity was most vigorous at one crater, but several other craters on the short eruptive fissure were also active with less frequent explosions.
The eruption was slightly less vigorous on 19 December. The plume was continuous, but somewhat lower, rising to 7-8 km. Tephra continued to fall SE. A small part of the Grímsvötn ice shelf next to the eruption site had melted without raising the water level of the caldera lake significantly. Activity was mostly limited to one crater.
An overflight on 20 December from 1045 to 1215 revealed variable activity. The eruption plume extended to 7 km altitude. Initially the plume was light-colored, and narrow at its base. Later the ash content of the plume greatly increased, and the plume turned black. It collapsed down to 1-2 km, created a base surge, and Mt. Grímsfjall disappeared into an ash cloud.
Photographs from 27 December showed intermittent eruptive activity between 1124 and 1240. The plume was discontinuous, fed by intermittent crater activity. It rose to a maximum of 4.5 km and distributed ash near the crater; bombs up to 0.5 m in diameter were ejected onto Grímsfjall. The eruption has resulted in the formation of a tephra ring that lies partly on ice, but its inner part is likely to be made completely of ash overlying bedrock.
The eruption ended on 28 December. Continuous tremor recorded at the Grimsfjall seismograph, 3 km from the eruption site, stopped at 1050 on 28 December. Small tremor bursts were recorded for another 3 hours, but activity stopped completely at 1400.
This eruption was located 10 km S of the 1996 eruption in Vatnajökull (Gudmundsson and others, 1997), which caused a catastrophic outburst flood from the glacier. This time no major flood ensued because only a small amount of the Grímsvötn ice shelf near the eruption site melted, and water did not flow towards the Grímsvötn caldera lake.
Chemical analyses of ash. The ash analyzed fell during 1000-1200 on 20 December in Suðursveit, ~60 km SE of Grímsvötn. The ash was well sorted with an average grain size of 0.05 mm and density of ~2.7 g/cm3. The areal density of ash fall was estimated at 93 g/m2. The ash was aphyric; the glass composition (table 1) can be compared with Grímsvötn ash samples from earlier this century. The composition is similar to earlier samples; however, the recent sample is slightly less evolved, with higher MgO/FeO, Al2O3, and CaO, but lower TiO2. The composition was markedly different from more evolved samples from the 1996 eruption or most of the samples available from the neighboring Bárðarbunga volcanic system.
Table 1. Microprobe analyses of the glass phase from the 20 December 1998 Grímsvötn eruptions (standard deviation in parentheses) and two Grímsvötn hyaloclastites. The analyses from the 1983, 1934, 1922, and 1903 eruptions are from Grönvold and Johannesson (1984). The analyses of the hyaloclastites are from Heikki Makipaa (1978). All analyses are in weight percent. Courtesy NVI.
| Eruption / Sample Description |
SiO2 |
TiO2 |
Al2O3 |
FeO (total) |
MnO |
MgO |
CaO |
Na2O |
K2O |
P2O5 |
| Dec 1998 |
50.46 (0.55) |
2.55 (0.05) |
13.94 (0.29) |
12.90 (0.13) |
0.23 (0.01) |
5.72 (0.20) |
11.00 (0.28) |
2.71 (0.09) |
0.48 (0.03) |
0.35 (0.12) |
| 1983 G83-2 |
50.30 |
2.98 |
12.80 |
14.00 |
0.20 |
5.00 |
9.71 |
2.58 |
0.45 |
0.32 |
| 1983 G83-1 |
50.50 |
3.02 |
12.60 |
14.40 |
0.26 |
4.96 |
9.55 |
2.62 |
0.51 |
0.36 |
| 1934 G34 |
50.30 |
3.08 |
12.80 |
13.40 |
0.26 |
5.14 |
9.92 |
2.56 |
0.52 |
0.38 |
| 1922 G22 |
50.10 |
3.06 |
12.80 |
13.90 |
0.20 |
5.24 |
10.20 |
2.47 |
0.40 |
0.30 |
| 1903 G03 |
49.80 |
2.92 |
13.10 |
13.60 |
0.20 |
5.45 |
10.30 |
2.53 |
0.38 |
0.27 |
| HM22 Hyaloclastite glass |
49.92 |
2.59 |
14.46 |
12.95 |
0.23 |
5.42 |
10.09 |
2.98 |
0.31 |
0.32 |
| HM23 Hyaloclastite glass |
49.49 |
2.49 |
14.10 |
12.91 |
0.23 |
5.12 |
10.56 |
2.80 |
0.45 |
0.25 |
| HM22, HM23 Whole-rock |
52.00 |
2.57 |
12.85 |
12.99 |
0.22 |
9.90 |
5.56 |
2.93 |
0.51 |
0.32 |
| 1934 G34 Whole-rock |
49.34 |
3.10 |
14.23 |
13.96 |
0.23 |
9.95 |
4.84 |
3.32 |
0.48 |
0.39 |
| Svíahnúkur caldera rim hyaloclastite |
50.65 |
1.96 |
15.31 |
11.40 |
0.16 |
11.34 |
6.73 |
1.50 |
0.43 |
0.39 |
The potential chemical pollution of the fallout ash was tested by leaching a batch of ash with 6.7 times its mass of de-ionized water. The pH of the leachate was 5.12; the water-soluble components were as follows (mg leachate / kg ash): SiO2, 7.2; Na, 315.3; K, 32.7; SO4, 557.8; F, 346.5; Cl, 366.2.
References. Grönvold, K., and Jóhannesson, H., 1984, Eruption in Grímsvötn 1983, course of events and chemical studies of the tephra: Jökull, 34:1-11.
Gudmunsson, M., Sigmundsson, F., and Björnsson, H., 1997, Ice-volcano interaction of the 1996 Gjálp subglacial eruption, Vatnajökull, Iceland: Nature, v. 389, p. 954-957.
Geologic Background. Grímsvötn, Iceland's most frequently active volcano in recent history, lies largely beneath the vast Vatnajökull icecap. The caldera lake is covered by a 200-m-thick ice shelf, and only the southern rim of the 6 x 8 km caldera is exposed. The geothermal area in the caldera causes frequent jökulhlaups (glacier outburst floods) when melting raises the water level high enough to lift its ice dam. Long NE-SW-trending fissure systems extend from the central volcano. The most prominent of these is the noted Laki (Skaftar) fissure, which extends to the SW and produced the world's largest known historical lava flow in 1783. The 15 km3 basaltic Laki lavas were erupted over 7 months from a 27-km-long fissure system. Extensive crop damage and livestock losses caused a severe famine that resulted in the loss of one-fifth of the population of Iceland.
Information Contacts: Karl Grönvold and Freysteinn Sigmundsson, Nordic Volcanological Institute (NVI), Grensásvegur 50, 108 Reykjavík, Iceland (URL: http://nordvulk.hi.is/); Pall Einarsson, Science Institute, University of Iceland; Icelandic Meteorological Office, Reykjavík, Iceland (URL: http://en.vedur.is/).
Ijen (Indonesia) — November 1998 Cite this Report
Ijen
Indonesia
8.058°S, 114.242°E; summit elev. 2769 m
All times are local (unless otherwise noted)
Recent measurements of acid crater lake
Measurements and sampling were made in the acid lake of Kawah-Ijen during two transits with a rubber rowboat on 7 and 10 December 1998. The 7 December measurements occurred just after heavy rain and the lake's color was pale and nearly white. In the middle of the lake, the surface temperature was 23.5°C with a pH of 0.48 as a result of dilution by the rain. The temperature near the solfatara at the S side of the lake ranged between 24.6 and 24.9°C with a pH of 0.45. Near the hot sublacustrine spring the temperature was as high as 61.7°C and the pH was 0.60. In the Banyupahit River, 3 km from the dam that closes the lake, the water had a temperature of 21.1°C and a pH of 0.47.
Three days later, 10 December, the lake was pale green with localized brown coloration; the temperature of the surface was 24.8-25.2°C and the pH 0.36-0.38. The highest measured temperature of the solfatara was 224°C, while the CO2 content of the atmosphere near the lake surface was normal, ~300 ppm.
Geologic Background. The Ijen volcano complex at the eastern end of Java consists of a group of small stratovolcanoes constructed within the 20-km-wide Ijen (Kendeng) caldera. The north caldera wall forms a prominent arcuate ridge, but elsewhere the rim was buried by post-caldera volcanoes, including Gunung Merapi, which forms the high point of the complex. Immediately west of the Gunung Merapi stratovolcano is the historically active Kawah Ijen crater, which contains a nearly 1-km-wide, turquoise-colored, acid lake. Kawah Ijen is the site of a labor-intensive mining operation in which baskets of sulfur are hand-carried from the crater floor. Many other post-caldera cones and craters are located within the caldera or along its rim. The largest concentration of cones forms an E-W zone across the southern side of the caldera. Coffee plantations cover much of the caldera floor; nearby waterfalls and hot springs are tourist destinations.
Information Contacts: Jacques-Marie Bardintzeff, Laboratoire de Petrographie-Volcanologie, bat 504 Universite Paris-Sud, 91405 Orsay, France.
Karymsky (Russia) — November 1998 Cite this Report
Karymsky
Russia
54.049°N, 159.443°E; summit elev. 1513 m
All times are local (unless otherwise noted)
Strombolian eruptions continue, ash column seen on 24 November
Seismicity remained above background levels during 1 November-7 December. Low-level Strombolian activity, including 100-200 earthquakes and gas explosions each day, continued to characterize activity at the volcano. On 24 November a pilot in the vicinity reported an explosive event that sent an ash column 6 km above the summit. The color-coded hazard status remained at Yellow.
Geologic Background. Karymsky, the most active volcano of Kamchatka's eastern volcanic zone, is a symmetrical stratovolcano constructed within a 5-km-wide caldera that formed during the early Holocene. The caldera cuts the south side of the Pleistocene Dvor volcano and is located outside the north margin of the large mid-Pleistocene Polovinka caldera, which contains the smaller Akademia Nauk and Odnoboky calderas. Most seismicity preceding Karymsky eruptions originated beneath Akademia Nauk caldera, located immediately south. The caldera enclosing Karymsky formed about 7600-7700 radiocarbon years ago; construction of the stratovolcano began about 2000 years later. The latest eruptive period began about 500 years ago, following a 2300-year quiescence. Much of the cone is mantled by lava flows less than 200 years old. Historical eruptions have been vulcanian or vulcanian-strombolian with moderate explosive activity and occasional lava flows from the summit crater.
Information Contacts: Olga Chubarova, Kamchatka Volcanic Eruptions Response Team (KVERT), Institute of Volcanic Geology and Geochemistry; Tom Miller, Alaska Volcano Observatory.
Kilauea (United States) — November 1998 Cite this Report
Kilauea
United States
19.421°N, 155.287°W; summit elev. 1222 m
All times are local (unless otherwise noted)
Continuing flow from Pu`u `O`o; major bench collapse
A significant collapse of the lava bench on the coast SE of Kīlauea occurred in early December. Lava continued to flow into the sea via a tube from the Pu`u `O`o vent, and a pit at the vent continued to grow.
A large part of the active lava delta on the SE coast collapsed into the sea sometime between 1200 on 10 December and 0930 on 11 December. A comparison between the shoreline as mapped on 11 and 24 November (figure 125), and the shoreline on 11 December, showed that ~5.8 hectares (ha) was lost. The missing shoreline included ~3.4 ha of land built since August and ~2.4 ha built W of the current lava-entry area (indicated by the steam cloud at the top of figure 125) between 1992 and 1997. Judging from observations of earlier bench collapses, the collapsed area most likely slid into the sea in several segments over a period of tens of minutes to several hours.
The eruption of Pu`u `O`o continued in November as lava flowed to the sea through a lava tube that developed on the coastal plain after a major pause in magma supply to the vent on 12-14 August (BGVN 23:08). Another brief pause occurred on 7-8 November (pause #21 of the current eruptive episode) leading to several small `a`a and pahoehoe flows on the coastal plain, none of which reached the sea. Scientists measured a slight increase in the discharge of lava from the tube system—from 3/day in late October to just over 400,000 m3/day in early December. Dense volcanic fumes continued to obscure various pits within Pu`u `O`o most of the time, but sloshing sounds of lava degassing could be heard from the crater rim.
A new pit that developed high on the S flank of Pu`u `O`o about one year ago enlarged significantly in 1998, and recent measurements of cracks around the edge of the pit showed that its walls were slumping slowly into the pit.
Geologic Background. Kilauea overlaps the E flank of the massive Mauna Loa shield volcano in the island of Hawaii. Eruptions are prominent in Polynesian legends; written documentation since 1820 records frequent summit and flank lava flow eruptions interspersed with periods of long-term lava lake activity at Halemaumau crater in the summit caldera until 1924. The 3 x 5 km caldera was formed in several stages about 1,500 years ago and during the 18th century; eruptions have also originated from the lengthy East and Southwest rift zones, which extend to the ocean in both directions. About 90% of the surface of the basaltic shield volcano is formed of lava flows less than about 1,100 years old; 70% of the surface is younger than 600 years. The long-term eruption from the East rift zone between 1983 and 2018 produced lava flows covering more than 100 km2, destroyed hundreds of houses, and added new coastline.
Information Contacts: Hawaiian Volcano Observatory (HVO), U.S. Geological Survey, PO Box 51, Hawaii Volcanoes National Park, HI 96718, USA (URL: https://volcanoes.usgs.gov/observatories/hvo/); K. H. Rubin and Mike Garcia, Hawaii Center for Volcanology, University of Hawaii, Dept. of Geology & Geophysics, 2525 Correa Rd., Honolulu, HI 96822 USA (URL: http://www.soest.hawaii.edu/GG/hcv.html).
Manam (Papua New Guinea) — November 1998 Cite this Report
Manam
Papua New Guinea
4.08°S, 145.037°E; summit elev. 1807 m
All times are local (unless otherwise noted)
Energetic outbursts lead to pyroclastic flows, lava flows
Following one month of build-up in seismicity and radial tilt (figure 10), intensive eruptive activity resumed on 5 October 1998—the first since its fatal eruption of November-December 1996 (BGVN 21:12).
Visible increases in activity started on 23-25 September, with intermittent dark ash emissions and night-time incandescent projections to ~200 m above South Crater. In subsequent days of October, the activity decreased to continuous white vapor emissions, first profuse then very weak, and occasional roaring sounds and fluctuating glow. This corresponded to a slight decrease in seismic amplitude levels, but the radial tilt continued to show inflation.
On the morning of 5 October a rapid build-up of activity took place. At 0800 ash emissions became forceful, rising ~2 km above South Crater. By 0815 the first small pyroclastic flows started down SE Valley at 5-10 minute intervals. At 0850, the now-dark ash column rose ~3 km, surrounded by blue vapor. Pyroclastic flows started at 0913, penetrating down SW Valley, and the island's E side underwent heavy ash and scoria fall. After 1020 this crater produced several loud explosions every 10-15 minutes. Loud roaring and banging starting at 1205 heralded a decline in activity. By 1600, thick, dark clouds still rose intermittently, but by 1800 only weak, thin gray emissions were visible. Roaring and banging sounds were heard through the night. Although short-lived, this phase also fed a lava flow into SE Valley that branched into two lobes below 900 m elevation and stopped at ~450 m. A lava flow also started toward SW Valley but stopped at the headwall.
In the following days, the tiltmeter 4 km from the summit (at Tabele Observatory) recorded a drop of 2 µrad while the seismicity decreased to near background levels. Until 15 October, gray ash clouds and occasional deep roaring sounds were observed. Not even red glow remained. By the evening of the 16th, red glow reappeared and incandescent projections rose 100-200 m above South Crater. On 17 October, dark ash clouds rose forcefully with rumbling sounds, and minor ash fell on the island's N side.
On the 18th, Main Crater occasionally emitted gray-brown plumes to 600-700 m, and the seismic amplitude increased. Activity in South Crater became sub-continuous, with incandescent projections to 1,000-1,100 m. On the morning of the 19th, a lava flow issued by South Crater descended into SW Valley. The strength of the eruption declined after 1415 and again after 1600. Yet, by 2225 there was a fountain of incandescent projections 1,400-1,600 m above the crater accompanied by loud roaring all night.
Emissions on the morning of the 20th comprised a thick, dark, ash-laden column. In the afternoon, small pyroclastic flows at 1415 and 1750 reached only to the head of SW Valley. By that time, the lava flow extended to within ~2 km of the coast. A single large explosion at 1715 ejected ballistic blocks 1,500 m above the crater. That night, on-going Strombolian explosions rarely reached 1,100 m above the crater.
On the 21st, Main Crater produced dark columns, rising to ~1,000 m, while the roaring Strombolian eruption persisted in South Crater. That night, small tongues of lava flowed in the upper SE Valley.
Activity began to decrease on the 23rd, when the Strombolian projections gave way to intermittent dark ash clouds to ~800 m above the crater. After 1000 on the 23rd, rumbling diminished. The next day Main Crater forcefully ejected dark columns with ballistic fragments and South Crater continued to issue subdued white emissions, with occasional ones that were gray and forceful. This activity persisted until the end of the month, without sound except for occasional low roaring and a faint glow.
While the seismicity noticeably reflected the variations in eruptive strength, tilt was not affected by the second eruptive phase and it resumed rising steadily thereafter as late as early November (figure 10).
Geologic Background. The 10-km-wide island of Manam, lying 13 km off the northern coast of mainland Papua New Guinea, is one of the country's most active volcanoes. Four large radial valleys extend from the unvegetated summit of the conical basaltic-andesitic stratovolcano to its lower flanks. These valleys channel lava flows and pyroclastic avalanches that have sometimes reached the coast. Five small satellitic centers are located near the island's shoreline on the northern, southern, and western sides. Two summit craters are present; both are active, although most observed eruptions have originated from the southern crater, concentrating eruptive products during much of the past century into the SE valley. Frequent eruptions, typically of mild-to-moderate scale, have been recorded since 1616. Occasional larger eruptions have produced pyroclastic flows and lava flows that reached flat-lying coastal areas and entered the sea, sometimes impacting populated areas.
Information Contacts: Ben Talai and Patrice de Saint-Ours, RVO.
Morne Plat Pays (Dominica) — November 1998 Cite this Report
Morne Plat Pays
Dominica
15.255°N, 61.341°W; summit elev. 940 m
All times are local (unless otherwise noted)
Strong earthquake swarms, tremor
According to reports from local news sources and USAID's Office of Foreign Disaster Assistance (OFDA), earthquake swarms began on the island of Dominica on 11 September and continued intermittently into October. The Seismic Research Unit (SRU) of the University of the West Indies started monitoring the activity on 28 September and determined that [seismicity] was occurring in the S part of the island beneath Morne Patates volcano. By 23 October the [seismicity] had subsided to about two [earthquake] events per hour, with 10% large enough to be felt.
An earthquake recorded by SRU at 1018 on 24 September had its epicenter at 15.28°N, 61.37°W. It occurred at a depth of 15 km with a body-wave magnitude of 2.9 and a Richter magnitude of 1 to 3. A spasmodic (new events were starting before the previous were finished) sequence of activity started about 1500 on 22 October. These events were less than 6 km deep and had a maximum magnitude of 3.5 Richter and an intensity of MM V. On 23 October, an SRU aerial reconnaissance revealed no surface manifestations of the events (i.e., scarps, vents).
The strong [felt earthquakes] on 22-23 October were described as the longest and most intense in recent times. These [earthquakes] caused landslides and road closures, including the main road from the capital, Roseau, to the communities on the S end of the island. The SRU stated on 22 October that 27 was the maximum number of [events] recorded within a 24-hour period since 28 September, noting that the daily numbers were not as high as during the 1974 sequence.
Morne Patates, at the southern tip of Dominica, is an arcuate structure open to Soufriere Bay on the west. It was constructed within an irregular depression on the SW flank of a larger stratovolcano, Morne Plat Pays, whose summit is only 3 km NE. The latest eruptions occurred at about 450 ± 90 years BP (Roobol and others, 1983) from the Morne Patates lava dome just prior to European settlement. At least ten swarms of small-magnitude earthquakes have occurred since 1765. The most recent swarm, between March and October 1986, consisted of 10-30 recorded A-type volcanic shocks in about two hours. No eruptive activity followed any of these swarms and no systematic shallowing was documented to indicate upward migration of magma.
General References. Roobol, M.J., Wright, J.V., and Smith, A.L., 1983, Calderas or gravity-slide structures in the Lesser Antilles Island Arc?: JVGR, v. 19, p. 121-134.
Geologic Background. The Morne Plat Pays volcanic complex occupies the southern tip of the island of Dominica and has been active throughout the Holocene. An arcuate caldera that formed about 39,000 years ago as a result of a major explosive eruption and flank collapse is open to Soufrière Bay on the west. This depression cuts the SW side of Morne Plat Pays stratovolcano and extends to the southern tip of Dominica. At least a dozen small post-caldera lava domes were emplaced within and outside this depression, including one submarine dome south of Scotts Head. The latest dated eruptions occurred from the Morne Patates lava dome about 1270 CE, although younger deposits have not yet been dated. The complex is the site of extensive fumarolic activity, and at least ten swarms of small-magnitude earthquakes, none associated with eruptive activity, have occurred since 1765 at Morne Patates.
Information Contacts: Tina Neal, OFDA/USAID, 1300 Pennsylvania Ave. NW, Washington, DC 20523-8602 (URL: http://www.info.usaid.gov/ofda/ofda.htm); CaKaFete News, 25-12 Street, Canefield, Dominica (URL: http://www.cakafete.com/).
Popocatepetl (Mexico) — November 1998 Cite this Report
Popocatepetl
Mexico
19.023°N, 98.622°W; summit elev. 5393 m
All times are local (unless otherwise noted)
Growing lava body in crater leads to larger explosions
A change in the typical low-level steam-and-gas emission regime in late November and early December suggested that a new lava body was growing inside the crater. The following has been condensed from CENAPRED bulletins.
Low-level activity continued during the first three weeks of November, and included low-intensity, short-duration exhalations of steam and gas with occasional eruptions of ash. Bad weather obstructed observations on many days. Authorities recommended that no one approach within 5 km of the crater because of the danger of sudden explosions. The volcanic alert level remained at yellow, indicating a state of heightened caution. Several A-type earthquakes occurred (on 6, 14, 15, 16, and 17 November; M 2.1-2.9), generally 3-4 km E or SE from the crater, none of which seemed to affect eruptive activity. One exceptional emission occurred at 0109 on 9 November; its intense phase lasted one minute and was followed by 12 minutes of high-frequency tremor.
At 1753 on 19 November a moderately large eruption was followed by five smaller ones. The series lasted seven minutes and produced an ash column that rose 2-3 km above the summit and dissipated NNW. Light ash fall was reported in the neighboring town of Amecameca. At 2019 a slightly smaller exhalation lasted nine minutes.
At 1302 on 22 November the volcano began a substantial increase in activity, starting with a sequence of small ash emissions; light ashfall was reported at Paso de Cortés and Amecameca. This activity continued into the night with about 40 separate emission events by midnight. Exhalations increased, and at about 0430 on 23 November harmonic tremor episodes were recorded. At 0530 incandescence at the crater could be seen, at 0854 high-frequency tremor started, and at 0922 a moderate ash emission generated a column 3 km above the summit. By noon about 100 exhalations had been recorded. Dense fumarolic clouds of gas and steam were blown NW. Beginning at 1245 activity increased again: high-frequency tremor and emissions occurred at a rate of one per minute. Although the summit was obscured by cloud, it was assumed, based on reports from local towns, that ash emissions were continuous. After 1515 seismicity increased to saturation levels on most of the recording instruments. Later, an emission of steam, gas, and ash could be seen. At 1630 seismicity started to decrease.
Small, low-frequency tremor signals began around 0200 on 24 November, and intensified between 0300 and 0600. The tremor was accompanied by continuous emissions of gas, steam, and some ash, blown to the SW. At 1257 another increase of activity began. Low-frequency tremor of variable amplitude was recorded until 1600. Poor visibility prevented direct observation of the summit during most of the day.
A steam plume that rose 2-2.5 km over the summit persisted until 0803 on 25 November when a moderately large explosion lasting one minute produced an ash plume that rose 3-4 km over the summit (figure 28) and threw rock fragments to a distance of 2 km. The top of the plume moved N, while the lower part moved SW; ashfall warnings were issued to towns in those directions. A low-frequency tremor signal followed the explosion and persisted through the day. Other explosions occurred at 1205 and 1658 on 25 November. Although the explosions were heard in nearby towns, there were no reports of large ash emissions, and it is likely that the ejected rock fragments were dispersed around the crater.
An increase in tremor was followed by new explosions at 0654 and 0719 on 26 November. Moderate steam-and-ash plumes rose to a height of 1,500 m above the summit. A stronger exhalation at 0931 produced a moderate plume of steam and ash rising 3-3.5 km above the summit. Other explosions at 1013 (figure 28) and 1104 produced higher ash columns. In all cases warnings were issued to air-traffic controllers. A new warning to the general population recommended approaching no closer than 7 km from the crater. Tremor was followed by volcanic earthquakes at 2113 and 2220; both events produced moderately large explosions and ash plumes, and during the later event incandescent lava fragments were thrown to a distance of ~1.5 km.
Moderate explosions were detected in the crater at 1206, 1333, 1749, and 2345 on 27 November, and at 0242 and 1021 on 28 November. All of them, except the third, expelled incandescent fragments of lava around the crater to a distance of 0.5-2 km, and produced moderately large emissions of ash, rising in most cases up to 4 km over the summit. This activity was detected against a background of low-level exhalation and tremor signals of decreasing amplitude. Light ashfall had been reported in Tlacotitlán at 0130 on 28 November. During 28 November activity increased again following several short harmonic tremor signals at 2130. At 2228 a moderate volcano-tectonic event was followed by small tremor episodes.
At 0002 and 0305 on 29 November two explosions were preceded by low-frequency tremor. The second explosion produced a shock wave clearly heard at Paso de Cortes and San Nicolás de los Ranchos. Large quantities of glowing rocks ejected from the crater could be seen falling in a area of ~3 km radius. There was also a large ash emission. At 0654 a moderately large emission, lasting seven minutes, formed an ash plume 4 km above the summit. At 1118 there were several low-frequency harmonic tremors. A moderately large explosion at 1645 ejected incandescent lava blocks around the cone and produced an ash plume up to 7 km above the summit (according to personnel working close to Paso de Cortes).
Tremor episodes and moderate emissions of steam, ash, and gas with occasional explosions persisted over the next week. One explosion at 0929 on 30 November began with a strong shock wave and blast, ejected fragments over its flanks 2-3 km from the crater, and produced an ash column 4 km above the summit. At 1853 on 3 December an explosion ejected incandescent fragments over the SE flanks and produced a moderately large ash cloud, carried by the wind to the SE. The explosion signal lasted one minute, followed by 15 minutes of tremor. At 1255 on 4 December an explosion threw hot debris on the SE flanks and produced an ash plume that rose 4-5 km above the summit. Another explosive eruption at 1511 on 6 December ejected incandescent rocks over the E and N flanks and produced an ash column 5 km above the summit that dispersed to the NW. This event lasted 1.5 minutes and was followed by high-frequency tremor for four minutes. Three explosions were recorded on 7 December at 0241, 0449, and 0623; glowing fragments fell on the E and N flanks and an ash column rose 4 km. The last of these events lasted 1.5 minutes and was followed by high-frequency tremor for 10 more minutes. During 8 December frequent exhalations with durations of 3-10 minutes each produced steam-and-ash columns 2 km above the summit.
Activity became stable at lower levels during the second week of December, persisting until the time of this report (15 December).
Geologic Background. Volcán Popocatépetl, whose name is the Aztec word for smoking mountain, rises 70 km SE of Mexico City to form North America's 2nd-highest volcano. The glacier-clad stratovolcano contains a steep-walled, 400 x 600 m wide crater. The generally symmetrical volcano is modified by the sharp-peaked Ventorrillo on the NW, a remnant of an earlier volcano. At least three previous major cones were destroyed by gravitational failure during the Pleistocene, producing massive debris-avalanche deposits covering broad areas to the south. The modern volcano was constructed south of the late-Pleistocene to Holocene El Fraile cone. Three major Plinian eruptions, the most recent of which took place about 800 CE, have occurred since the mid-Holocene, accompanied by pyroclastic flows and voluminous lahars that swept basins below the volcano. Frequent historical eruptions, first recorded in Aztec codices, have occurred since Pre-Columbian time.
Information Contacts: Servando De la Cruz-Reyna1,2, Roberto Quaas1,2, Carlos Valdés G.2, and Alicia Martinez Bringas1. 1 Centro Nacional de Prevencion de Desastres (CENAPRED) Delfin Madrigal 665, Col. Pedregal de Santo Domingo,Coyoacan, 04360, México D.F. (URL: https://www.gob.mx/cenapred/); 2 Instituto de Geofisica, UNAM, Coyoacán 04510, México D.F., México.
Rabaul (Papua New Guinea) — November 1998 Cite this Report
Rabaul
Papua New Guinea
4.2459°S, 152.1937°E; summit elev. 688 m
All times are local (unless otherwise noted)
Intermittent emissions continue during October
Tilt, leveling, and sea-shore surveys continued to record the slow resurgence of the caldera floor observed since April 1996. During October, continued slow magma supply into Rabaul Caldera kept feeding mild Vulcanian activity at Tavurvur cone. Emissions occurred at irregular intervals, from a few minutes to several hours apart. Longer time intervals usually resulted in more powerful and voluminous explosions.
In the beginning of the month, explosions ejected a grayish ash plume 500-1,000 m above the crater. Following a particularly large explosion at 2138 on October 5 (which littered the cone with incandescent ballistic blocks, and displayed dramatic lightning within the dark rising cloud) emissions were larger for a few days, rising to 1,000-3,000 m, although without sounds. During 10-15 October emissions were again milder, hardly rising over 600 m above the crater. Emissions occurring 16-20 October rose to ~1,000 m and were often accompanied by roaring sounds. After 29 October, emissions were again noiseless, and from the 26th onward they became lower in ash content and energy.
October was the transitional period of wind shift. From the 19th, the NW wind began to dominate and bring welcome relief after seven months of very unpleasant, corrosive, and toxic ashfall to Rabaul and neighboring residents.
The recorded seismicity consisted almost exclusively of low-frequency events accompanying the Vulcanian activity from Tavurvur. However, two types of signals were observed: usual short-duration events, and low-amplitude, long-duration (1-3 minutes) events. Their combined number, with an increase in August and September, averaged 46 per day but increased to 81 and 143 on the last two days of October without any corresponding change in visible eruptive activity. The two types of signals usually occurred in subequal amounts, although on 5-7 October the number of long-lasting events started to dominate, while the shorter events prevailed for a few days after the 8th. The amplitude of both types fluctuated substantially for several multi-day intervals during October. Short-duration harmonic signals were also recorded during 16-18 and 24 October. On 20 October the system registered the month's only significant high-frequency event.
A visit to Rabaul by professional photographer George Casey resulted in several images of Tavurvur during August. Casey appreciated the aid kindly given him by RVO staff and was gracious enough to provide us with photos, including one of a small plume on 4 August (figure 32).
Geologic Background. The low-lying Rabaul caldera on the tip of the Gazelle Peninsula at the NE end of New Britain forms a broad sheltered harbor utilized by what was the island's largest city prior to a major eruption in 1994. The outer flanks of the asymmetrical shield volcano are formed by thick pyroclastic-flow deposits. The 8 x 14 km caldera is widely breached on the east, where its floor is flooded by Blanche Bay and was formed about 1,400 years ago. An earlier caldera-forming eruption about 7,100 years ago is thought to have originated from Tavui caldera, offshore to the north. Three small stratovolcanoes lie outside the N and NE caldera rims. Post-caldera eruptions built basaltic-to-dacitic pyroclastic cones on the caldera floor near the NE and W caldera walls. Several of these, including Vulcan cone, which was formed during a large eruption in 1878, have produced major explosive activity during historical time. A powerful explosive eruption in 1994 occurred simultaneously from Vulcan and Tavurvur volcanoes and forced the temporary abandonment of Rabaul city.
Information Contacts: Ben Talai and Patrice de Saint-Ours, Rabaul Volcano Observatory (RVO), P.O. Box 386, Rabaul, Papua New Guinea.
Sheveluch (Russia) — November 1998 Cite this Report
Sheveluch
Russia
56.653°N, 161.36°E; summit elev. 3283 m
All times are local (unless otherwise noted)
Steam-and-gas plumes, tremor episodes
Seismicity was generally at background levels during 1 November-7 December. Clouds obscured the volcano throughout much of the reporting period. On 1, 2, and 6 November steam-and-gas plumes were seen to rise 300 m above the summit before dispersing. High-frequency tremor increased over six hours on both 13 and 15 November. Periods of high-frequency tremor lasted 0.7 hours on 17 November and 3.5 hours on 22 November. Two hours of high-frequency tremor and 3 hours of low-frequency spasmodic tremor were recorded on 2 December. On 5-6 December a plume rose 150 m above the summit.
Geologic Background. The high, isolated massif of Sheveluch volcano (also spelled Shiveluch) rises above the lowlands NNE of the Kliuchevskaya volcano group. The 1,300 km3 andesitic volcano is one of Kamchatka's largest and most active volcanic structures, with at least 60 large eruptions during the Holocene. The summit of roughly 65,000-year-old Stary Shiveluch is truncated by a broad 9-km-wide late-Pleistocene caldera breached to the south. Many lava domes occur on its outer flanks. The Molodoy Shiveluch lava dome complex was constructed during the Holocene within the large open caldera; Holocene lava dome extrusion also took place on the flanks of Stary Shiveluch. Widespread tephra layers from these eruptions have provided valuable time markers for dating volcanic events in Kamchatka. Frequent collapses of dome complexes, most recently in 1964, have produced debris avalanches whose deposits cover much of the floor of the breached caldera.
Information Contacts: Olga Chubarova, Kamchatka Volcanic Eruptions Response Team (KVERT), Institute of Volcanic Geology and Geochemistry, Piip Ave. 9, Petropavlovsk-Kamchatsky, 683006, Russia; Tom Miller, Alaska Volcano Observatory (AVO), a cooperative program of a) U.S. Geological Survey, 4200 University Drive, Anchorage, AK 99508-4667, USA (URL: http://www.avo.alaska.edu/), b) Geophysical Institute, University of Alaska, PO Box 757320, Fairbanks, AK 99775-7320, USA, and c) Alaska Division of Geological & Geophysical Surveys, 794 University Ave., Suite 200, Fairbanks, AK 99709, USA.
Soufriere Hills (United Kingdom) — November 1998 Cite this Report
Soufriere Hills
United Kingdom
16.72°N, 62.18°W; summit elev. 915 m
All times are local (unless otherwise noted)
Small dome collapses, pyroclastic flows, and ash venting
There was a slight increase in activity in October according to reports from the Montserrat Volcano Observatory (MVO). Five small collapse events occurred on the dome, each producing significant deposits of ash up to 3 km away. Pyroclastic flows occurred along most of the volcano's main drainage. Ash fell predominantly W and NW of the volcano, light ash fell in the N of the island. Dome collapses were commonly followed by periods of volcanic tremor and ash venting, and sometimes swarms of volcano-tectonic earthquakes occurred shortly after the collapse events. The dome gradually eroded, leaving some large fractures in the carapace that could lead to larger collapses in the future.
Visual observations. Intermittent small pyroclastic flows originated from all flanks of the dome. The first significant event, at 0801 on 13 October, produced pyroclastic flows in Tuitt's Ghaut and Tyer's Ghaut. Volcanic tremor after the collapse correlated with ash venting from high on the dome's N flank, the ash cloud rapidly reached 7,500 m. The cloud drifted NW, depositing ash on parts of the island.
At 0916 on 18 October, there was another collapse, the ash cloud rose to around 2,000 m and moved W, although the exact direction was uncertain because a low cloud hampered observation. Subsequent volcanic tremor lasted for several hours.
Another small dome collapse occurred at 2241 on 20 October. The ash cloud from this event rose to an estimated 2,500 m, drifting slowly to the W and NW. Observations the following morning revealed that the pyroclastic flows from this event had traveled towards Plymouth as far as Upper Parsons (2.5 km W of the summit). Fallout included some coarse lithic fragments 4 to 5 mm in diameter.
At 0051 on 26 October, a fourth small collapse occurred. The seismic signal lasted for about 12 minutes followed by an extended period of tremor. Reports were received of thunder from the resultant ash cloud, and there was subsequent wet ashfall as far as 7 km N. Information received from NOAA satellite images indicated that the ash cloud reached to between 6,000 and 7,500 m. Observations during the early hours of the morning suggested that there were two ash cloud lobes, one S of Belham Valley and one over the Salem-Old Towne area. The deepest measured ashfall was 25 mm; 4 mm or more fell in other areas. The ash was fine grained, with common accretionary lapilli. During an observation flight on the 27th, steaming could be seen at the edge of the delta, indicating that the pyroclastic flows had traveled into the sea. The flows also reached NE as the Tar River Estate House (3 km from the summit). On the SW side, down the White River, a thin deposit of ash from the pyroclastic flows could be seen as far as about 700 m from the old coastline at O'Garras; when these deposits were emplaced is unknown.
A fifth small dome collapse occurred at 0418 on 31 October; an ash plume first drifted W, and thenN and NE depositing some ash in occupied areas at the island's N end. An observation flight later that day revealed new deposits: a pyroclastic-flow deposit in the White River reaching Galways Soufriere, and another in the Gages valley that did not extend beyond the top of the Gages fan. The White River deposit had numerous large angular blocks resting on its surface.
A large fissure within the dome extended from its base, where it rests against Chances Peak, to its top in the Galways area (S). At the foot of this crack a triangular-shaped opening had developed and appeared to have been the source of the White River pyroclastic-flow.
Unusual wind directions during the latter part of October directed the plume to the N. As a result, residents in N Montserrat smelled strong sulfurous odors.
On 27 October, probing into the pyroclastic deposits in the area of the Farm River in Trant's yielded these depth-temperature relations: 1.0 m and 86°C; 1.4 m and 146°C; and 2.25 m and 239°C. Unusually clear conditions in the early evening of 27 October enabled observers in Old Towne and Salem to see three small glowing areas on the dome; these areas were thought to reveal the dome's incandescent interior exposed during the recent collapse events.
Seismicity, deformation, and environmental monitoring. Over the reporting period seismicity was generally low; however, small dome collapses triggered volcanic tremor and swarms of volcano-tectonic earthquakes. As in the previous month, tremor correlated with intensified ash-and-steam venting from the N flanks of the dome.
Five small collapses occurred between 13 and 31 October. These were marked by pyroclastic-flow signals that lasted several minutes. The collapse on the 13th was preceded by a swarm of small volcano-tectonic earthquakes. Several much larger volcano-tectonic earthquakes occurred during the collapse, the first approximately 30 seconds after the start of the collapse; hypocenters for these events were tightly clustered directly under the lava dome.
The collapse on the 18th was accompanied by a more intense swarm of earthquakes (table 32). The first earthquake occurred about 40 seconds after the beginning of the collapse and was one of the largest earthquakes recorded since the installation of the broadband network; it was felt in the Woodlands area. This earthquake was much richer in low frequencies than typical volcano-tectonic earthquakes on Montserrat, possibly suggesting a larger source dimension. Hypocenters for the largest earthquakes were located S of the volcano. At the start of the swarm, hypocenters were directly under Roaches Mountain; as the swarm progressed, hypocenters migrated to S of Chances Peak. Preliminary calculations showed that the largest events were consistent with oblique-normal faulting in a NE-SW direction.
Table 32. October 1998 earthquake swarms at Soufriere Hills. Courtesy of MVO.
| Date |
Start Time |
Duration (hours) |
Hybrid |
Long-period |
Volcano-tectonic |
| 13 Oct 1998 |
0249 |
5.10 |
0 |
0 |
11 |
| 18 Oct 1998 |
0916 |
6.73 |
0 |
0 |
51 |
| 25 Oct 1998 |
0614 |
11.32 |
0 |
0 |
24 |
All GPS sites on the volcano and in the N of the island appear stable and there were no significant changes since last month. The EDM reflector on the northern flank was shot from Windy Hill. The line continues to shorten slowly. The site was later destroyed by a pyroclastic flow.
SO2 flux, measured using the miniCOSPEC instrument, was (in metric tons/day) 1,300 on 9 October, 340 on 21 October, and 280 on 30 October. These results are similar to those measured in recent months, although an apparent decrease occurred late in the month. Sulfur dioxide was also measured at ground level using diffusion tubes around the island. SO2 in Plymouth (at Police Headquarters) remained high; elsewhere the average levels were very low.
Geologic Background. The complex, dominantly andesitic Soufrière Hills volcano occupies the southern half of the island of Montserrat. The summit area consists primarily of a series of lava domes emplaced along an ESE-trending zone. The volcano is flanked by Pleistocene complexes to the north and south. English's Crater, a 1-km-wide crater breached widely to the east by edifice collapse, was formed about 2000 years ago as a result of the youngest of several collapse events producing submarine debris-avalanche deposits. Block-and-ash flow and surge deposits associated with dome growth predominate in flank deposits, including those from an eruption that likely preceded the 1632 CE settlement of the island, allowing cultivation on recently devegetated land to near the summit. Non-eruptive seismic swarms occurred at 30-year intervals in the 20th century, but no historical eruptions were recorded until 1995. Long-term small-to-moderate ash eruptions beginning in that year were later accompanied by lava-dome growth and pyroclastic flows that forced evacuation of the southern half of the island and ultimately destroyed the capital city of Plymouth, causing major social and economic disruption.
Information Contacts: Montserrat Volcano Observatory (MVO), c/o Chief Minister's Office, PO Box 292, Plymouth, Montserrat, West Indies (URL: http://www.mvo.ms/).
Ushkovsky (Russia) — November 1998 Cite this Report
Ushkovsky
Russia
56.113°N, 160.509°E; summit elev. 3943 m
All times are local (unless otherwise noted)
Earthquakes form distinctive group
On the basis of waveform features and locations, earthquakes in the vicinity of the volcano during November were identified as constituting a separate group. Since September 1998 more than 20 events with magnitudes ranging from 0.5 to 1.0 occurred at shallow depths (<5 km).
Geologic Background. The Ushkovsky (formerly known as Plosky) complex is a large compound volcanic massif located at the NW end of the Kliuchevskaya volcano group. The summit of Krestovsky (Blizhny Plosky) volcano, about 10 km NW of Kliuchevskoy, is the high point of the complex. Linear zones of cinder cones are found on the SW and NE flanks and on lowlands to the west. The Ushkovsky (Daljny Plosky) edifice SE of Krestkovsky is capped by an ice-filled 4.5 x 5.5 km caldera containing two glacier-clad cinder cones with large summit craters. A younger caldera at the summit of Daljny was formed in association with the eruption of large lava flows and pyroclastic material from the Lavovy Shish cinder cones at the foot of the volcano about 8,600 years ago. An explosive eruption took place from the summit cone in 1890.
Information Contacts: Olga Chubarova, Kamchatka Volcanic Eruptions Response Team (KVERT), Institute of Volcanic Geology and Geochemistry, Piip Ave. 9, Petropavlovsk-Kamchatsky, 683006, Russia; Tom Miller, Alaska Volcano Observatory (AVO), a cooperative program of a) U.S. Geological Survey, 4200 University Drive, Anchorage, AK 99508-4667, USA (URL: http://www.avo.alaska.edu/), b) Geophysical Institute, University of Alaska, PO Box 757320, Fairbanks, AK 99775-7320, USA, and c) Alaska Division of Geological & Geophysical Surveys, 794 University Ave., Suite 200, Fairbanks, AK 99709, USA.
Villarrica (Chile) — November 1998 Cite this Report
Villarrica
Chile
39.42°S, 71.93°W; summit elev. 2847 m
All times are local (unless otherwise noted)
Summary of February-November activity; intermittent lava pond pulses, phreatic explosions
This report summarizes daily visual observations by members of the Proyecto de Observación Villarrica (POVI), volcano guides, and other sources during February to November 1998. In late February, after two months of subsidence, the magmatic column reached the crater floor with a weak and irregular degassing. By mid-March the lava pond was clearly visible as an intermittent red glow from 12 km away. In April and May, three convective magmatic pushes, gas-poor, filled half of the funnel-shaped crater with pahoehoe lava. On 13, 25, and 30 June, small phreatic emissions rose up to 200 m above the summit. Since mid-October, the activity level in the lava pond has varied, with the low levels of degassing intensity occurring at irregular intervals. On 8 November, the red glow was seen for the only time that month.
It is inferred that the red glow indicates that a small volume of usually gas-enriched magma has reached the crater floor in phases and at irregular intervals. This causes a sudden occurrence of the glow, sometimes with increasing intensity and lasting from a few hours up to 3 days. Subsequently, a distinct reduction of the glow intensity is interpreted to mean that an insufficient supply of convecting magma and gas allows the lava pond to form a crust. During the report period, 16 such magmatic pulses were observed and 10 additional pulses were inferred for periods of non-observation due to weather conditions.
Geologic Background. The glacier-covered Villarrica stratovolcano, in the northern Lakes District of central Chile, is ~15 km south of the city of Pucon. A 2-km-wide caldera that formed about 3,500 years ago is located at the base of the presently active, dominantly basaltic to basaltic andesite cone at the NW margin of a 6-km-wide Pleistocene caldera. More than 30 scoria cones and fissure vents are present on the flanks. Plinian eruptions and pyroclastic flows that have extended up to 20 km from the volcano were produced during the Holocene. Lava flows up to 18 km long have issued from summit and flank vents. Eruptions documented since 1558 CE have consisted largely of mild-to-moderate explosive activity with occasional lava effusion. Glaciers cover 40 km2 of the volcano, and lahars have damaged towns on its flanks.
Information Contacts: Werner Keller U., Proyecto de Observacion Villarrica (P.O.V.I.), Wiesenstrasse 8, 86438 Kissing, Germany (URL: https://www.povi.cl/).
Whakaari/White Island (New Zealand) — November 1998 Cite this Report
Whakaari/White Island
New Zealand
37.52°S, 177.18°E; summit elev. 294 m
All times are local (unless otherwise noted)
Minor eruptive activity continues; alert level raised
Minor eruptive activity continued at White Island through November and early December. The level of activity varied, but observations during visits and instrumental indicators in early December were sufficient to raise the Alert Level from 1 to 2 on 3 December. The current style of activity was expected to continue for some time.
There was evidence that molten magma was the direct cause of eruptive activity, although only weak volcanic tremor accompanied the ash eruptions. A surveillance visit was made on 1 December to assess the ongoing activity, conduct deformation and magnetic surveys, and collect ash and gas samples.
Observations. The active vent at the base of the NW wall of 1978/90 Crater continued to erupt fine-grained volcanic ash during the 1 December visit. The vent size had not changed since the 2 November visit (BGVN 23:10). During the later visit, an ash-charged, tan-brown convecting plume rose to ~800 m before trailing downwind 10-15 km. The volume of ash in the plume was greater than that observed any time during November. The eruptive activity had deposited up to 45 mm of fine, dark gray and brown ash at the crater rim. Samples of ash that fell on 1 December showed a significant change from ash collected on 23 November and earlier. The 1 December ash samples contained fresh, vesiculated glass, suggesting that magma may have risen in the vent and was contributing directly to the eruption. Previously the ash was derived from solidified lava.
A ground-deformation survey showed a consistent trend of minor inflation across the main crater floor, with continued subsidence near the rim of 1978/90 Crater (figure 34). Large-scale post-1990 inflation was evident at the more distal sites (Pegs C and J), with only minor changes over the last 2-3 months. Collapse about the crater rim, which started in July, was continuing but at a lesser rate (Pegs M and W). Provisional results from the magnetic survey indicated heating at depth and shallow cooling about the crater rim area.
Fumarolic discharge pressures from sites 1, 6a (base of Donald Mound), and 13a were not significantly stronger than those observed on 2 and 16 November, and temperatures remained high at these features: site 1, 124°C; site 6a, 107°C; and site 13a, 120°C. Molten sulfur was found in vents at sites 1 and 13a, which is consistent with the temperatures in excess of 119°C. The sulfur mound at site 1 had grown over the vent during November, suggesting that sulfur was being remobilized from depth in response to elevated temperatures. The discharge at site 6a was mildly superheated, but of high pressure, indicating a relatively high gas content. These observations were consistent with general heating of the hydrothermal system.
The lake, which had reformed in the main crater, was the likely result of recent rains. The lake water was cool (~20°C) and had the brown color of the ash falling into it.
Geologic Background. The uninhabited Whakaari/White Island is the 2 x 2.4 km emergent summit of a 16 x 18 km submarine volcano in the Bay of Plenty about 50 km offshore of North Island. The island consists of two overlapping andesitic-to-dacitic stratovolcanoes. The SE side of the crater is open at sea level, with the recent activity centered about 1 km from the shore close to the rear crater wall. Volckner Rocks, sea stacks that are remnants of a lava dome, lie 5 km NW. Descriptions of volcanism since 1826 have included intermittent moderate phreatic, phreatomagmatic, and Strombolian eruptions; activity there also forms a prominent part of Maori legends. The formation of many new vents during the 19th and 20th centuries caused rapid changes in crater floor topography. Collapse of the crater wall in 1914 produced a debris avalanche that buried buildings and workers at a sulfur-mining project. Explosive activity in December 2019 took place while tourists were present, resulting in many fatalities. The official government name Whakaari/White Island is a combination of the full Maori name of Te Puia o Whakaari ("The Dramatic Volcano") and White Island (referencing the constant steam plume) given by Captain James Cook in 1769.
Information Contacts: B.J. Scott, Manager of Volcano Surveillance, Institute of Geological and Nuclear Sciences (IGNS), Private Bag 2000, Wairakei, New Zealand (URL: http://www.gns.cri.nz/).