Recently Published Bulletin Reports
Erebus (Antarctica) Lava lake remains active; most thermal alerts recorded since 2019
Rincon de la Vieja (Costa Rica) Frequent phreatic explosions during July-December 2023
Bezymianny (Russia) Explosion on 18 October 2023 sends ash plume 8 km high; lava flows and incandescent avalanches
Kilauea (United States) Low-level lava effusions in the lava lake at Halema’uma’u during July-December 2022
Nyamulagira (DR Congo) Lava flows and thermal activity during May-October 2023
Bagana (Papua New Guinea) Explosions, ash plumes, ashfall, and lava flows during April-September 2023
Mayon (Philippines) Lava flows, pyroclastic flows, ash emissions, and seismicity during April-September 2023
Nishinoshima (Japan) Eruption plumes and gas-and-steam plumes during May-August 2023
Krakatau (Indonesia) White gas-and-steam plumes and occasional ash plumes during May-August 2023
Villarrica (Chile) Strombolian activity, gas-and-ash emissions, and crater incandescence during April-September 2023
Merapi (Indonesia) Frequent incandescent avalanches during April-September 2023
Ebeko (Russia) Moderate explosive activity with ash plumes continued during June-November 2023
Erebus (Antarctica) — January 2024  Cite this Report
Erebus
Antarctica
77.53°S, 167.17°E; summit elev. 3794 m
All times are local (unless otherwise noted)
Lava lake remains active; most thermal alerts recorded since 2019
The lava lake in the summit crater of Erebus has been active since at least 1972. Located in Antarctica overlooking the McMurdo Station on Ross Island, it is the southernmost active volcano on the planet. Because of the remote location, activity is primarily monitored by satellites. This report covers activity during 2023.
The number of thermal alerts recorded by the Hawai'i Institute of Geophysics and Planetology’s MODVOLC Thermal Alerts System increased considerably in 2023 compared to the years 2020-2022 (table 9). In contrast to previous years, the MODIS instruments aboard the Aqua and Terra satellites captured data from Erebus every month during 2023. Consistent with previous years, the lowest number of anomalous pixels were recorded in January, November, and December.
Table 9. Number of monthly MODIS-MODVOLC thermal alert pixels recorded at Erebus during 2017-2023. See BGVN 42:06 for data from 2000 through 2016. The table was compiled using data provided by the HIGP – MODVOLC Thermal Alerts System.
| Year |
Jan |
Feb |
Mar |
Apr |
May |
Jun |
Jul |
Aug |
Sep |
Oct |
Nov |
Dec |
SUM |
| 2017 |
0 |
21 |
9 |
0 |
0 |
1 |
11 |
61 |
76 |
52 |
0 |
3 |
234 |
| 2018 |
0 |
21 |
58 |
182 |
55 |
17 |
137 |
172 |
103 |
29 |
0 |
0 |
774 |
| 2019 |
2 |
21 |
162 |
151 |
55 |
56 |
75 |
53 |
29 |
19 |
1 |
0 |
624 |
| 2020 |
0 |
2 |
16 |
18 |
4 |
4 |
1 |
3 |
18 |
3 |
1 |
6 |
76 |
| 2021 |
0 |
9 |
1 |
0 |
2 |
56 |
46 |
47 |
35 |
52 |
5 |
3 |
256 |
| 2022 |
1 |
13 |
55 |
22 |
15 |
32 |
39 |
19 |
31 |
11 |
0 |
0 |
238 |
| 2023 |
2 |
33 |
49 |
82 |
41 |
32 |
70 |
64 |
42 |
17 |
5 |
11 |
448 |
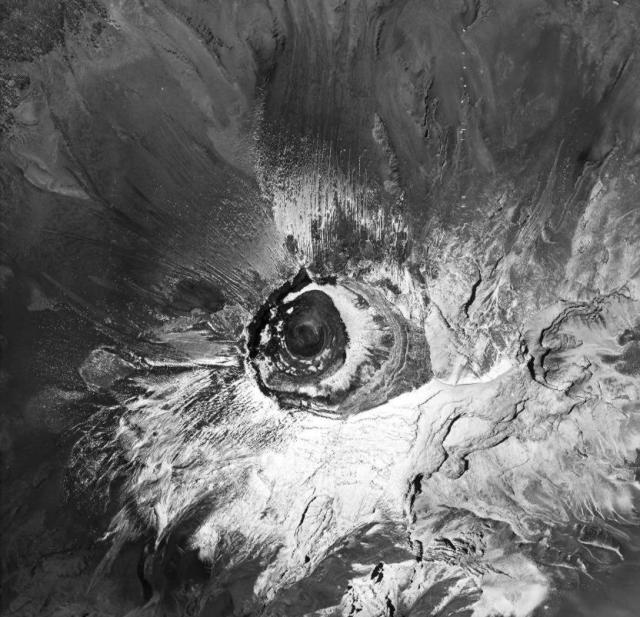
Sentinel-2 infrared images showed one or two prominent heat sources within the summit crater, accompanied by adjacent smaller sources, similar to recent years (see BGVN 46:01, 47:02, and 48:01). A unique image was obtained on 25 November 2023 by the OLI-2 (Operational Land Imager-2) on Landsat 9, showing the upper part of the volcano surrounded by clouds (figure 32).
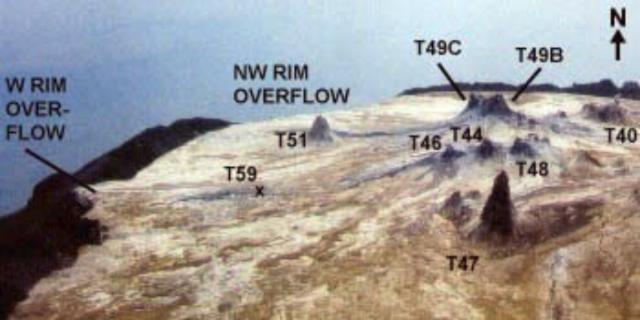
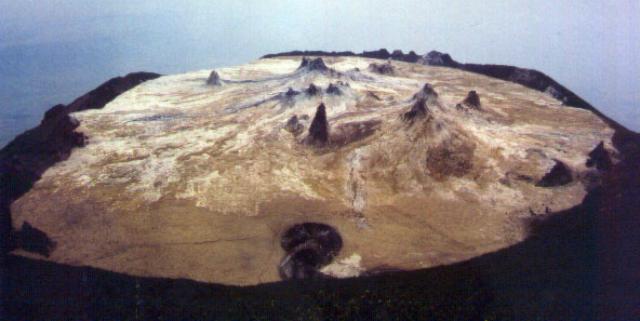
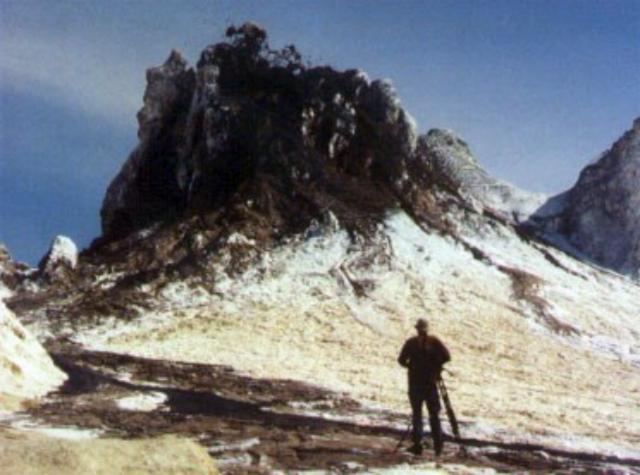
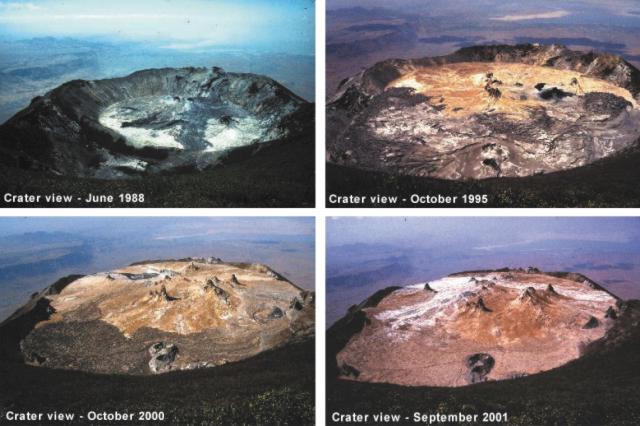
Geologic Background. Mount Erebus, the world's southernmost historically active volcano, overlooks the McMurdo research station on Ross Island. It is the largest of three major volcanoes forming the crudely triangular Ross Island. The summit of the dominantly phonolitic volcano has been modified by one or two generations of caldera formation. A summit plateau at about 3,200 m elevation marks the rim of the youngest caldera, which formed during the late-Pleistocene and within which the modern cone was constructed. An elliptical 500 x 600 m wide, 110-m-deep crater truncates the summit and contains an active lava lake within a 250-m-wide, 100-m-deep inner crater; other lava lakes are sometimes present. The glacier-covered volcano was erupting when first sighted by Captain James Ross in 1841. Continuous lava-lake activity with minor explosions, punctuated by occasional larger Strombolian explosions that eject bombs onto the crater rim, has been documented since 1972, but has probably been occurring for much of the volcano's recent history.
Information Contacts: Hawai'i Institute of Geophysics and Planetology (HIGP) - MODVOLC Thermal Alerts System, School of Ocean and Earth Science and Technology (SOEST), Univ. of Hawai'i, 2525 Correa Road, Honolulu, HI 96822, USA (URL: http://modis.higp.hawaii.edu/); Copernicus Browser, Copernicus Data Space Ecosystem, European Space Agency (URL: https://dataspace.copernicus.eu/browser/); NASA Earth Observatory, EOS Project Science Office, NASA Goddard Space Flight Center, Goddard, Maryland, USA (URL: https://earthobservatory.nasa.gov/images/152134/erebus-breaks-through).
Rincon de la Vieja (Costa Rica) — January 2024 Cite this Report
Rincon de la Vieja
Costa Rica
10.83°N, 85.324°W; summit elev. 1916 m
All times are local (unless otherwise noted)
Frequent phreatic explosions during July-December 2023
Rincón de la Vieja is a volcanic complex in Costa Rica with a hot convecting acid lake that exhibits frequent weak phreatic explosions, gas-and-steam emissions, and occasional elevated sulfur dioxide levels (BGVN 45:10, 46:03, 46:11). The current eruption period began June 2021. This report covers activity during July-December 2023 and is based on weekly bulletins and occasional daily reports from the Observatorio Vulcanologico Sismologica de Costa Rica-Universidad Nacional (OVSICORI-UNA).
Numerous weak phreatic explosions continued during July-December 2023, along with gas-and-steam emissions and plumes that rose as high as 3 km above the crater rim. Many weekly OVSICORI-UNA bulletins included the previous week's number of explosions and emissions (table 9). For many explosions, the time of explosion was given (table 10). Frequent seismic activity (long-period earthquakes, volcano-tectonic earthquakes, and tremor) accompanied the phreatic activity.
Table 9. Number of reported weekly phreatic explosions and gas-and-steam emissions at Rincón de la Vieja, July-December 2023. Counts are reported for the week before the Weekly Bulletin date; not all reports included these data. Courtesy of OVSICORI-UNA.
| OVSICORI Weekly Bulletin |
Number of explosions |
Number of emissions |
| 28 Jul 2023 |
6 |
14 |
| 4 Aug 2023 |
10 |
12 |
| 1 Sep 2023 |
13 |
11 |
| 22 Sep 2023 |
12 |
13 |
| 29 Sep 2023 |
6 |
11 |
| 6 Oct 2023 |
12 |
5 |
| 13 Oct 2023 |
7 |
9 |
| 20 Oct 2023 |
1 |
15 |
| 27 Oct 2023 |
3 |
23 |
| 3 Nov 2023 |
3 |
10 |
| 17 Nov 2023 |
0 |
Some |
| 24 Nov 2023 |
0 |
14 |
| 8 Dec 2023 |
4 |
16 |
| 22 Dec 2023 |
8 |
18 |
Table 10. Summary of activity at Rincón de la Vieja during July-December 2023. Weak phreatic explosions and gas emissions are noted where the time of explosion was indicated in the weekly or daily bulletins. Height of plumes or emissions are distance above the crater rim. Courtesy of OVSICORI-UNA.
| Date |
Time |
Description of Activity |
| 1 Jul 2023 |
0156 |
Explosion. |
| 2 Jul 2023 |
0305 |
Explosion. |
| 4 Jul 2023 |
0229, 0635 |
Event at 0635 produced a gas-and-steam plume that rose 700 m and drifted W; seen by residents in Liberia (21 km SW). |
| 9 Jul 2023 |
1843 |
Explosion. |
| 21 Jul 2023 |
0705 |
Explosion. |
| 26 Jul 2023 |
1807 |
Explosion. |
| 28 Jul 2023 |
0802 |
Explosion generated a gas-and-steam plume that rose 500 m. |
| 30 Jul 2023 |
1250 |
Explosion. |
| 31 Jul 2023 |
2136 |
Explosion. |
| 11 Aug 2023 |
0828 |
Explosion. |
| 18 Aug 2023 |
1304 |
Explosion. |
| 21 Aug 2023 |
1224 |
Explosion generated gas-and-steam plumes rose 500-600 m. |
| 22 Aug 2023 |
0749 |
Explosion generated gas-and-steam plumes rose 500-600 m. |
| 24 Aug 2023 |
1900 |
Explosion. |
| 25 Aug 2023 |
0828 |
Event produced a steam-and-gas plume that rose 3 km and drifted NW. |
| 27-28 Aug 2023 |
0813 |
Four small events; the event at 0813 on 28 August lasted two minutes and generated a steam-and-gas plume that rose 2.5 km. |
| 1 Sep 2023 |
1526 |
Explosion generated plume that rose 2 km and ejected material onto the flanks. |
| 2-3 Sep 2023 |
- |
Small explosions detected in infrasound data. |
| 4 Sep 2023 |
1251 |
Gas-and-steam plume rose 1 km and drifted W. |
| 7 Nov 2023 |
1113 |
Explosion. |
| 8 Nov 2023 |
0722 |
Explosion. |
| 12 Nov 2023 |
0136 |
Small gas emissions. |
| 14 Nov 2023 |
0415 |
Small gas emissions. |
According to OVSICORI-UNA, during July-October the average weekly sulfur dioxide (SO2) flux ranged from 68 to 240 tonnes/day. However, in mid-November the flux increased to as high as 334 tonnes/day, the highest value measured in recent years. The high SO2 flux in mid-November was also detected by the TROPOMI instrument on the Sentinel-5P satellite (figure 43).
Geologic Background. Rincón de la Vieja, the largest volcano in NW Costa Rica, is a remote volcanic complex in the Guanacaste Range. The volcano consists of an elongated, arcuate NW-SE-trending ridge constructed within the 15-km-wide early Pleistocene Guachipelín caldera, whose rim is exposed on the south side. Sometimes known as the "Colossus of Guanacaste," it has an estimated volume of 130 km3 and contains at least nine major eruptive centers. Activity has migrated to the SE, where the youngest-looking craters are located. The twin cone of Santa María volcano, the highest peak of the complex, is located at the eastern end of a smaller, 5-km-wide caldera and has a 500-m-wide crater. A Plinian eruption producing the 0.25 km3 Río Blanca tephra about 3,500 years ago was the last major magmatic eruption. All subsequent eruptions, including numerous historical eruptions possibly dating back to the 16th century, have been from the prominent active crater containing a 500-m-wide acid lake located ENE of Von Seebach crater.
Information Contacts: Observatorio Vulcanológico Sismológica de Costa Rica-Universidad Nacional (OVSICORI-UNA), Apartado 86-3000, Heredia, Costa Rica (URL: http://www.ovsicori.una.ac.cr/); NASA Global Sulfur Dioxide Monitoring Page, Atmospheric Chemistry and Dynamics Laboratory, NASA Goddard Space Flight Center (NASA/GSFC), 8800 Greenbelt Road, Goddard MD 20771, USA (URL: https://so2.gsfc.nasa.gov/).
Bezymianny (Russia) — November 2023 Cite this Report
Bezymianny
Russia
55.972°N, 160.595°E; summit elev. 2882 m
All times are local (unless otherwise noted)
Explosion on 18 October 2023 sends ash plume 8 km high; lava flows and incandescent avalanches
Bezymianny, located on Russia’s Kamchatka Peninsula, has had eruptions since 1955 characterized by dome growth, explosions, pyroclastic flows, ash plumes, and ashfall. Activity during November 2022-April 2023 included gas-and-steam emissions, lava dome collapses generating avalanches, and persistent thermal activity. Similar eruptive activity continued from May through October 2023, described here based on information from weekly and daily reports of the Kamchatka Volcano Eruptions Response Team (KVERT), notices from Tokyo VAAC (Volcanic Ash Advisory Center), and from satellite data.
Overall activity decreased after the strong period of activity in late March through April 2023, which included ash explosions during 29 March and 7-8 April 2023 that sent plumes as high as 10-12 km altitude, along with dome growth and lava flows (BGVN 48:05). This reduced activity can be seen in the MIROVA thermal detection system graph (figure 56), which was consistent with data from the MODVOLC thermal detection system and with Sentinel-2 satellite images that showed persistent hotspots in the summit crater when conditions allowed observations. A renewed period of strong activity began in mid-October 2023.
Activity increased significantly on 17 October 2023 when large collapses began during 0700-0830 on the E flanks of the lava dome and continued to after 0930 the next day (figure 57). Ash plumes rose to an altitude of 4.5-5 km, extending 220 km NNE by 18 October. A large explosion at 1630 on 18 October produced an ash plume that rose to an altitude of 11 km (8 km above the summit) and drifted NNE and then NW, extending 900 km NW within two days at an altitude of 8 km. Minor ashfall was noted in Kozyrevsk (45 km WNW). At 0820 on 20 October an ash plume was identified in satellite images drifting 100 km ENE at altitudes of 4-4.5 km.
Lava flows and hot avalanches from the dome down the SE flank continued over the next few days, including 23 October when clear conditions allowed good observations (figures 58 and 59). A large thermal anomaly was observed over the volcano through 24 October, and in the summit crater on 30 October (figure 60). Strong fumarolic activity continued, with numerous avalanches and occasional incandescence. By the last week of October, volcanic activity had decreased to a level consistent with that earlier in the reporting period.
Aviation warnings were frequently updated during 17-20 October. KVERT issued a Volcano Observatory Notice for Aviation (VONA) on 17 October at 1419 and 1727 (0219 and 0527 UTC) raising the Aviation Color Code (ACC) from Yellow to Orange (second highest level). The next day, KVERT issued a VONA at 1705 (0505 UTC) raising the ACC to Red (highest level) but lowered it back to Orange at 2117 (0917 UTC). After another decrease to Yellow and back to Orange, the ACC was reduced to Yellow on 20 October at 1204 (0004 UTC). In addition, the Tokyo VAAC issued a series of Volcanic Ash Advisories beginning on 16 October and continuing through 30 October.
Geologic Background. The modern Bezymianny, much smaller than its massive neighbors Kamen and Kliuchevskoi on the Kamchatka Peninsula, was formed about 4,700 years ago over a late-Pleistocene lava-dome complex and an edifice built about 11,000-7,000 years ago. Three periods of intensified activity have occurred during the past 3,000 years. The latest period, which was preceded by a 1,000-year quiescence, began with the dramatic 1955-56 eruption. This eruption, similar to that of St. Helens in 1980, produced a large open crater that was formed by collapse of the summit and an associated lateral blast. Subsequent episodic but ongoing lava-dome growth, accompanied by intermittent explosive activity and pyroclastic flows, has largely filled the 1956 crater.
Information Contacts: Kamchatka Volcanic Eruptions Response Team (KVERT), Far Eastern Branch, Russian Academy of Sciences, 9 Piip Blvd., Petropavlovsk-Kamchatsky, 683006, Russia (URL: http://www.kscnet.ru/ivs/kvert/); Kamchatka Volcanological Station, Kamchatka Branch of Geophysical Survey, (KB GS RAS), Klyuchi, Kamchatka Krai, Russia (URL: http://volkstat.ru/); Tokyo Volcanic Ash Advisory Center (VAAC), 1-3-4 Otemachi, Chiyoda-ku, Tokyo 100-8122, Japan (URL: http://ds.data.jma.go.jp/svd/vaac/data/); Hawai'i Institute of Geophysics and Planetology (HIGP) - MODVOLC Thermal Alerts System, School of Ocean and Earth Science and Technology (SOEST), Univ. of Hawai'i, 2525 Correa Road, Honolulu, HI 96822, USA (URL: http://modis.higp.hawaii.edu/); MIROVA (Middle InfraRed Observation of Volcanic Activity), a collaborative project between the Universities of Turin and Florence (Italy) supported by the Centre for Volcanic Risk of the Italian Civil Protection Department (URL: http://www.mirovaweb.it/); Copernicus Browser, Copernicus Data Space Ecosystem, European Space Agency (URL: https://dataspace.copernicus.eu/browser/).chr
Kilauea (United States) — January 2023 Cite this Report
Kilauea
United States
19.421°N, 155.287°W; summit elev. 1222 m
All times are local (unless otherwise noted)
Low-level lava effusions in the lava lake at Halema’uma’u during July-December 2022
Kīlauea is the southeastern-most volcano in Hawaii and overlaps the E flank of the Mauna Loa volcano. Its East Rift Zone (ERZ) has been intermittently active for at least 2,000 years. An extended eruption period began in January 1983 and was characterized by open lava lakes and lava flows from the summit caldera and the East Rift Zone. During May 2018 magma migrated into the Lower East Rift Zone (LERZ) and opened 24 fissures along a 6-km-long NE-trending fracture zone that produced lava flows traveling in multiple directions. As lava emerged from the fissures, the lava lake at Halema'uma'u drained and explosions sent ash plumes to several kilometers altitude (BGVN 43:10).
The current eruption period started during September 2021 and has recently been characterized by lava effusions, spatter, and sulfur dioxide emissions in the active Halema’uma’u lava lake (BGVN 47:08). Lava effusions, some spatter, and sulfur dioxide emissions have continued during this reporting period of July through December 2022 using daily reports, volcanic activity notices, and abundant photo, map, and video data from the US Geological Survey's (USGS) Hawaiian Volcano Observatory (HVO).
Summary of activity during July-December 2022. Low-level effusions have continued at the western vent of the Halema’uma’u crater during July through early December 2022. Occasional weak ooze-outs (also called lava break outs) would occur along the margins of the crater floor. The overall level of the active lava lake throughout the reporting period gradually increased due to infilling, however it stagnated in mid-September (table 13). During September through November, activity began to decline, though lava effusions persisted at the western vent. By 9 December, the active part of the lava lake had completely crusted over, and incandescence was no longer visible.
Table 13. Summary of measurements taken during overflights at Kīlauea that show a gradual increase in the active lava lake level and the volume of lava effused since 29 September 2021. Lower activity was reported during September-October. Data collected during July-December 2022. Courtesy of HVO.
| Date: |
Level of the active lava lake (m): |
Cumulative volume of lava effused (million cubic meters): |
| 7 Jul 2022 |
130 |
95 |
| 19 Jul 2022 |
133 |
98 |
| 4 Aug 2022 |
136 |
102 |
| 16 Aug 2022 |
137 |
104 |
| 12 Sep 2022 |
143 |
111 |
| 5 Oct 2022 |
143 |
111 |
| 28 Oct 2022 |
143 |
111 |
Activity during July 2022. Lava effusions were reported from the western vent in the Halema’uma’u crater, along with occasional weak ooze-outs along the margins of the crater floor. The height of the lava lake was variable due to deflation-inflation tilt events; for example, the lake level dropped approximately 3-4 m during a summit deflation-inflation event reported on 1 July. Webcam images taken during the night of 6-12 July showed intermittent low-level spattering at the western vent that rose less than 10 m above the vent (figure 519). Measurements made during an overflight on 7 July indicated that the crater floor was infilled about 130 m and that 95 million cubic meters of lava had been effused since 29 September 2021. A single, relatively small lava ooze-out was active to the S of the lava lake. Around midnight on 8 July there were two brief periods of lava overflow onto the lake margins. On 9 July lava ooze-outs were reported near the SE and NE edges of the crater floor and during 10-11 July they occurred near the E, NE, and NW edges. On 16 July crater incandescence was reported, though the ooze-outs and spattering were not visible. On 18 July overnight webcam images showed incandescence in the western vent complex and two ooze-outs were reported around 0000 and 0200 on 19 July. By 0900 there were active ooze-outs along the SW edge of the crater floor. Measurements made from an overflight on 19 July indicated that the crater floor was infilled about 133 m and 98 million cubic meters of lava had erupted since 29 September 2021 (figure 520). On 20 July around 1600 active ooze-outs were visible along the N edge of the crater, which continued through the next day. Extensive ooze-outs occurred along the W margin during 24 July until 1900; on 26 July minor ooze-outs were noted along the N margin. Minor spattering was visible on 29 July along the E margin of the lake. The sulfur dioxide emission rates ranged 650-2,800 tons per day (t/d), the higher of which was measured on 8 July (figure 519).
Activity during August 2022. The eruption continued in the Halema’uma’u crater at the western vent. According to HVO the lava in the active lake remained at the level of the bounding levees. Occasional minor ooze-outs were observed along the margins of the crater floor. Strong nighttime crater incandescence was visible after midnight on 6 August over the western vent cone. During 6-7 August scattered small lava lobes were active along the crater floor and incandescence persisted above the western vent through 9 August. During 7-9 August HVO reported a single lava effusion source was active along the NW margin of the crater floor. Measurements from an overflight on 4 August indicated that the crater floor was infilled about 136 m total and that 102 million cubic meters of lava had been erupted since the start of the eruption. Lava breakouts were reported along the N, NE, E, S, and W margins of the crater during 10-16 August. Another overflight survey conducted on 16 August indicated that the crater floor infilled about 137 m and 104 million cubic meters of lava had been erupted since September 2021. Measured sulfur dioxide emissions rates ranged 1,150-2,450 t/d, the higher of which occurred on 8 August.
Activity during September 2022. During September, lava effusion continued from the western vent into the active lava lake and onto the crater floor. Intermittent minor ooze-outs were reported through the month. A small ooze-out was visible on the W crater floor margin at 0220 on 2 September, which showed decreasing surface activity throughout the day, but remained active through 3 September. On 3 September around 1900 a lava outbreak occurred along the NW margin of the crater floor but had stopped by the evening of 4 September. Field crews monitoring the summit lava lake on 9 September observed spattering on the NE margin of the lake that rose no higher than 10 m, before falling back onto the lava lake crust (figure 521). Overflight measurements on 12 September indicated that the crater floor was infilled a total of 143 m and 111 million cubic meters of lava had been erupted since September 2021. Extensive breakouts in the W and N part of the crater floor were reported at 1600 on 20 September and continued into 26 September. The active part of the lava lake dropped by 10 m while other parts of the crater floor dropped by several meters. Summit tiltmeters recorded a summit seismic swarm of more than 80 earthquakes during 1500-1800 on 21 September, which occurred about 1.5 km below Halema’uma’u; a majority of these were less than Mw 2. By 22 September the active part of the lava lake was infilled about 2 m. On 23 September the western vent areas exhibited several small spatter cones with incandescent openings, along with weak, sporadic spattering (figure 522). The sulfur dioxide emission rate ranged from 930 t/d to 2,000 t/d, the higher of which was measured on 6 September.
Activity during October 2022. Activity during October declined slightly compared to previous months, though lava effusions persisted from the western vent into the active lava lake and onto the crater floor during October (figure 523). Slight variations in the lava lake were noted throughout the month. HVO reported that around 0600 on 3 October the level of the lava lake has lowered slightly. Overflight measurements taken on 5 October indicated that the crater floor was infilled a total of about 143 m and that 111 million cubic meters of lava had been effused since September 2021. During 6-7 October the lake gradually rose 0.5 m. Sulfur dioxide measurements made on 22 October had an emission rate of 700 t/d. Another overflight taken on 28 October showed that there was little to no change in the elevation of the crater floor: the crater floor was infilled a total of 143 m and 111 million cubic meters of lava had erupted since the start of the eruption.
Activity during November 2022. Activity remained low during November, though HVO reported that lava from the western vent continued to effuse into the active lava lake and onto the crater floor throughout the month. The rate of sulfur dioxide emissions during November ranged from 300-600 t/d, the higher amount of which occurred on 9 November.
Activity during December 2022. Similar low activity was reported during December, with lava effusing from the western vent into the active lava lake and onto the crater floor. During 4-5 December the active part of the lava lake was slightly variable in elevation and fluctuated within 1 m. On 9 December HVO reported that lava was no longer erupting from the western vent in the Halema’uma’u crater and that sulfur dioxide emissions had returned to near pre-eruption background levels; during 10-11 December, the lava lake had completely crusted over, and no incandescence was visible (figure 524). Time lapse camera images covering the 4-10 December showed that the crater floor showed weak deflation and no inflation. Some passive events of crustal overturning were reported during 14-15 December, which brought fresh incandescent lava to the lake surface. The sulfur dioxide emission rate was approximately 200 t/d on 14 December. A smaller overturn event on 17 December and another that occurred around 0000 and into the morning of 20 December were also detected. A small seismic swarm was later detected on 30 December.
Geologic Background. Kilauea overlaps the E flank of the massive Mauna Loa shield volcano in the island of Hawaii. Eruptions are prominent in Polynesian legends; written documentation since 1820 records frequent summit and flank lava flow eruptions interspersed with periods of long-term lava lake activity at Halemaumau crater in the summit caldera until 1924. The 3 x 5 km caldera was formed in several stages about 1,500 years ago and during the 18th century; eruptions have also originated from the lengthy East and Southwest rift zones, which extend to the ocean in both directions. About 90% of the surface of the basaltic shield volcano is formed of lava flows less than about 1,100 years old; 70% of the surface is younger than 600 years. The long-term eruption from the East rift zone between 1983 and 2018 produced lava flows covering more than 100 km2, destroyed hundreds of houses, and added new coastline.
Information Contacts: Hawaiian Volcano Observatory (HVO), U.S. Geological Survey, PO Box 51, Hawai'i National Park, HI 96718, USA (URL: http://hvo.wr.usgs.gov/).
Nyamulagira (DR Congo) — November 2023 Cite this Report
Nyamulagira
DR Congo
1.408°S, 29.2°E; summit elev. 3058 m
All times are local (unless otherwise noted)
Lava flows and thermal activity during May-October 2023
Nyamulagira (also known as Nyamuragira) is a shield volcano in the Democratic Republic of Congo with the summit truncated by a small 2 x 2.3 km caldera with walls up to about 100 m high. Documented eruptions have occurred within the summit caldera, as well as from numerous flank fissures and cinder cones. The current eruption period began in April 2018 and has more recently been characterized by summit crater lava flows and thermal activity (BGVN 48:05). This report describes lava flows and variable thermal activity during May through October 2023, based on information from the Observatoire Volcanologique de Goma (OVG) and various satellite data.
Lava lake activity continued during May. The MIROVA (Middle InfraRed Observation of Volcanic Activity) system recorded moderate-to-strong thermal activity throughout the reporting period; activity was more intense during May and October and relatively weaker from June through September (figure 95). The MODVOLC thermal algorithm, detected a total of 209 thermal alerts. There were 143 hotspots detected during May, eight during June, nine during September, and 49 during October. This activity was also reflected in infrared satellite images, where a lava flow was visible in the NW part of the crater on 7 May and strong activity was seen in the center of the crater on 4 October (figure 96). Another infrared satellite image taken on 12 May showed still active lava flows along the NW margin of the crater. According to OVG lava effusions were active during 7-29 May and moved to the N and NW parts of the crater beginning on 9 May. Strong summit crater incandescence was visible from Goma (27 km S) during the nights of 17, 19, and 20 May (figure 97). On 17 May there was an increase in eruptive activity, which peaked at 0100 on 20 May. Notable sulfur dioxide plumes drifted NW and W during 19-20 May (figure 98). Drone footage acquired in partnership with the USGS (United States Geological Survey) on 20 May captured images of narrow lava flows that traveled about 100 m down the W flank (figure 99). Data from the Rumangabo seismic station indicated a decreasing trend in activity during 17-21 May. Although weather clouds prevented clear views of the summit, a strong thermal signature on the NW flank was visible in an infrared satellite image on 22 May, based on an infrared satellite image. On 28 May the lava flows on the upper W flank began to cool and solidify. By 29 May seismicity returned to levels similar to those recorded before the 17 May increase. Lava effusion continued but was confined to the summit crater; periodic crater incandescence was observed.
Low-level activity was noted during June through October. On 1 June OVG reported that seismicity remained at lower levels and that crater incandescence had been absent for three days, though infrared satellite imagery showed continued lava effusion in the summit crater. The lava flows on the flanks covered an estimated 0.6 km2. Satellite imagery continued to show thermal activity confined to the lava lake through October (figure 96), although no lava flows or significant sulfur dioxide emissions were reported.
Geologic Background. Africa's most active volcano, Nyamulagira (also known as Nyamuragira), is a massive high-potassium basaltic shield about 25 km N of Lake Kivu and 13 km NNW of the steep-sided Nyiragongo volcano. The summit is truncated by a small 2 x 2.3 km caldera that has walls up to about 100 m high. Documented eruptions have occurred within the summit caldera, as well as from the numerous flank fissures and cinder cones. A lava lake in the summit crater, active since at least 1921, drained in 1938, at the time of a major flank eruption. Recent lava flows extend down the flanks more than 30 km from the summit as far as Lake Kivu; extensive lava flows from this volcano have covered 1,500 km2 of the western branch of the East African Rift.
Information Contacts: Observatoire Volcanologique de Goma (OVG), Departement de Geophysique, Centre de Recherche en Sciences Naturelles, Lwiro, D.S. Bukavu, DR Congo; Hawai'i Institute of Geophysics and Planetology (HIGP) - MODVOLC Thermal Alerts System, School of Ocean and Earth Science and Technology (SOEST), Univ. of Hawai'i, 2525 Correa Road, Honolulu, HI 96822, USA (URL: http://modis.higp.hawaii.edu/); MIROVA (Middle InfraRed Observation of Volcanic Activity), a collaborative project between the Universities of Turin and Florence (Italy) supported by the Centre for Volcanic Risk of the Italian Civil Protection Department (URL: http://www.mirovaweb.it/); NASA Global Sulfur Dioxide Monitoring Page, Atmospheric Chemistry and Dynamics Laboratory, NASA Goddard Space Flight Center (NASA/GSFC), 8800 Greenbelt Road, Goddard, Maryland, USA (URL: https://so2.gsfc.nasa.gov/); Copernicus Browser, Copernicus Data Space Ecosystem, European Space Agency (URL: https://dataspace.copernicus.eu/browser/); Charles Balagizi, Goma Volcano Observatory, Departement de Geophysique, Centre de Recherche en Sciences Naturelles, Lwiro, D.S. Bukavu, DR Congo.
Bagana (Papua New Guinea) — October 2023 Cite this Report
Bagana
Papua New Guinea
6.137°S, 155.196°E; summit elev. 1855 m
All times are local (unless otherwise noted)
Explosions, ash plumes, ashfall, and lava flows during April-September 2023
The remote volcano of Bagana is located in central Bougainville Island, Papua New Guinea. Recorded eruptions date back to 1842 and activity has consisted of effusive activity that has built a small lava dome in the summit crater and occasional explosions that produced pyroclastic flows. The most recent eruption has been ongoing since February 2000 and has produced occasional explosions, ash plumes, and lava flows. More recently, activity has been characterized by ongoing effusive activity and ash emissions (BGVN 48:04). This report updates activity from April through September 2023 that has consisted of explosions, ash plumes, ashfall, and lava flows, using information from the Darwin Volcanic Ash Advisory Center (VAAC) and satellite data.
An explosive eruption was reported on 7 July that generated a large gas-and-ash plume to high altitudes and caused significant ashfall in local communities; the eruption plume had reached upper tropospheric (16-18 km altitude) altitudes by 2200, according to satellite images. Sulfur dioxide plumes were detected in satellite images on 8 July and indicated that the plume was likely a mixture of gas, ice, and ash. A report issued by the Autonomous Bougainville Government (ABG) (Torokina District, Education Section) on 10 July noted that significant ash began falling during 2000-2100 on 7 July and covered most areas in the Vuakovi, Gotana (9 km SW), Koromaketo, Laruma (25 km W) and Atsilima (27 km NW) villages. Pyroclastic flows also occurred, according to ground-based reports; small deposits confined to one drainage were inspected by RVO during an overflight on 17 July and were confirmed to be from the 7 July event. Ashfall continued until 10 July and covered vegetation, which destroyed bushes and gardens and contaminated rivers and streams.
RVO reported another eruption on 14 July. The Darwin VAAC stated that an explosive event started around 0830 on 15 July and produced an ash plume that rose to 16.5 km altitude by 1000 and drifted N, according to satellite images. The plume continued to drift N and remained visible through 1900, and by 2150 it had dissipated.
Ashfall likely from both the 7 and 15 July events impacted about 8,111 people in Torokina (20 km SW), including Tsito/Vuakovi, Gotana, Koromaketo, Kenaia, Longkogari, Kenbaki, Piva (13 km SW), and Atsinima, and in the Tsitovi district, according to ABG. Significant ashfall was also reported in Ruruvu (22 km N) in the Wakunai District of Central Bougainville, though the thickness of these deposits could not be confirmed. An evacuation was called for the villages in Wakunai, where heavy ashfall had contaminated water sources; the communities of Ruruvu, Togarau, Kakarapaia, Karauturi, Atao, and Kuritaturi were asked to evacuate to a disaster center at the Wakunai District Station, and communities in Torokina were asked to evacuate to the Piva District station. According to a news article, more than 7,000 people needed temporary accommodations, with about 1,000 people in evacuation shelters. Ashfall had deposited over a broad area, contaminating water supplies, affecting crops, and collapsing some roofs and houses in rural areas. Schools were temporarily shut down. Intermittent ash emissions continued through the end of July and drifted NNW, NW, and SW. Fine ashfall was reported on the coast of Torokina, and ash plumes also drifted toward Laruma and Atsilima.
A small explosive eruption occurred at 2130 on 28 July that ejected material from the crater vents, according to reports from Torokina, in addition to a lava flow that contained two lobes. A second explosion was detected at 2157. Incandescence from the lava flow was visible from Piva as it descended the W flank around 2000 on 29 July (figure 47). The Darwin VAAC reported that a strong thermal anomaly was visible in satellite images during 30-31 July and that ash emissions rose to 2.4 km altitude and drifted WSW on 30 July. A ground report from RVO described localized emissions at 0900 on 31 July.
The Darwin VAAC reported that ash plumes were identified in satellite imagery at 0800 and 1220 on 12 August and rose to 2.1 km and 3 km altitude and drifted NW and W, respectively. A news report stated that aid was sent to more than 6,300 people that were adversely affected by the eruption. Photos taken during 17-19 August showed ash emissions rising no higher than 1 km above the summit and drifting SE. A small explosion generated an ash plume during the morning of 19 August. Deposits from small pyroclastic flows were also captured in the photos. Satellite images captured lava flows and pyroclastic flow deposits. Two temporary seismic stations were installed near Bagana on 17 August at distances of 7 km WSW (Vakovi station) and 11 km SW (Kepox station). The Kepox station immediately started to record continuous, low-frequency background seismicity.
Satellite data. Little to no thermal activity was detected during April through mid-July 2023; only one anomaly was recorded during early April and one during early June, according to MIROVA (Middle InfraRed Observation of Volcanic Activity) data (figure 48). Thermal activity increased in both power and frequency during mid-July through September, although there were still some short gaps in detected activity. MODVOLC also detected increased thermal activity during August; thermal hotspots were detected a total of five times on 19, 20, and 27 August. Weak thermal anomalies were also captured in infrared satellite images on clear weather days throughout the reporting period on 7, 12, and 17 April, 27 May, 1, 6, 16, and 31 July, and 19 September (figure 48); a strong thermal anomaly was visible on 31 July. Distinct sulfur dioxide plumes that drifted generally NW were intermittently captured by the TROPOMI instrument on the Sentinel-5P satellite and sometimes exceeded two Dobson Units (DUs) (figure 49).
Geologic Background. Bagana volcano, in a remote portion of central Bougainville Island, is frequently active. This massive symmetrical cone was largely constructed by an accumulation of viscous andesitic lava flows. The entire edifice could have been constructed in about 300 years at its present rate of lava production. Eruptive activity is characterized by non-explosive effusion of viscous lava that maintains a small lava dome in the summit crater, although occasional explosive activity produces pyroclastic flows. Lava flows with tongue-shaped lobes up to 50 m thick and prominent levees descend the flanks on all sides.
Information Contacts: Rabaul Volcano Observatory (RVO), Geohazards Management Division, Department of Mineral Policy and Geohazards Management (DMPGM), PO Box 3386, Kokopo, East New Britain Province, Papua New Guinea; Darwin Volcanic Ash Advisory Centre (VAAC), Bureau of Meteorology, Northern Territory Regional Office, PO Box 40050, Casuarina, NT 0811, Australia (URL: http://www.bom.gov.au/info/vaac/); MIROVA (Middle InfraRed Observation of Volcanic Activity), a collaborative project between the Universities of Turin and Florence (Italy) supported by the Centre for Volcanic Risk of the Italian Civil Protection Department (URL: http://www.mirovaweb.it/); Hawai'i Institute of Geophysics and Planetology (HIGP) - MODVOLC Thermal Alerts System, School of Ocean and Earth Science and Technology (SOEST), Univ. of Hawai'i, 2525 Correa Road, Honolulu, HI 96822, USA (URL: http://modis.higp.hawaii.edu/); NASA Global Sulfur Dioxide Monitoring Page, Atmospheric Chemistry and Dynamics Laboratory, NASA Goddard Space Flight Center (NASA/GSFC), 8800 Greenbelt Road, Goddard, Maryland, USA (URL: https://so2.gsfc.nasa.gov/); Copernicus Browser, Copernicus Data Space Ecosystem, European Space Agency (URL: https://dataspace.copernicus.eu/browser/); Autonomous Bougainville Government, P.O Box 322, Buka, AROB, PNG (URL: https://abg.gov.pg/); Andrew Tupper (Twitter: @andrewcraigtupp); Simon Carn, Geological and Mining Engineering and Sciences, Michigan Technological University, 1400 Townsend Drive, Houghton, MI 49931, USA (URL: http://www.volcarno.com/, Twitter: @simoncarn); Radio NZ (URL: https://www.rnz.co.nz/news/pacific/494464/more-than-7-000-people-in-bougainville-need-temporary-accommodation-after-eruption); USAID, 1300 Pennsylvania Ave, NW, Washington DC 20004, USA (URL: https://www.usaid.gov/pacific-islands/press-releases/aug-08-2023-united-states-provides-immediate-emergency-assistance-support-communities-affected-mount-bagana-volcanic-eruptions).
Mayon (Philippines) — October 2023 Cite this Report
Mayon
Philippines
13.257°N, 123.685°E; summit elev. 2462 m
All times are local (unless otherwise noted)
Lava flows, pyroclastic flows, ash emissions, and seismicity during April-September 2023
Mayon is located in the Philippines and has steep upper slopes capped by a small summit crater. Historical eruptions date back to 1616 CE that have been characterized by Strombolian eruptions, lava flows, pyroclastic flows, and mudflows. Eruptions mostly originated from a central conduit. Pyroclastic flows and mudflows have commonly descended many of the approximately 40 drainages that surround the volcano. The most recent eruption occurred during June through October 2022 and consisted of lava dome growth and gas-and-steam emissions (BGVN 47:12). A new eruption was reported during late April 2023 and has included lava flows, pyroclastic density currents, ash emissions, and seismicity. This report covers activity during April through September 2023 based on daily bulletins from the Philippine Institute of Volcanology and Seismology (PHIVOLCS).
During April through September 2023, PHIVOLCS reported near-daily rockfall events, frequent volcanic earthquakes, and sulfur dioxide measurements. Gas-and-steam emissions rose 100-900 m above the crater and drifted in different directions. Nighttime crater incandescence was often visible during clear weather and was accompanied by incandescent avalanches of material. Activity notably increased during June when lava flows were reported on the S, SE, and E flanks (figure 52). The MIROVA graph (Middle InfraRed Observation of Volcanic Activity) showed strong thermal activity coincident with these lava flows, which remained active through September (figure 53). According to the MODVOLC thermal algorithm, a total of 110 thermal alerts were detected during the reporting period: 17 during June, 40 during July, 27 during August, and 26 during September. During early June, pyroclastic density currents (PDCs) started to occur more frequently.
Low activity was reported during much of April and May; gas-and-steam emissions rose 100-900 m above the crater and generally drifted in different directions. A total of 52 rockfall events and 18 volcanic earthquakes were detected during April and 147 rockfall events and 13 volcanic events during May. Sulfur dioxide flux measurements ranged between 400-576 tons per day (t/d) during April, the latter of which was measured on 29 April and between 162-343 t/d during May, the latter of which was measured on 13 May.
Activity during June increased, characterized by lava flows, pyroclastic density currents (PDCs), crater incandescence and incandescent rockfall events, gas-and-steam emissions, and continued seismicity. Weather clouds often prevented clear views of the summit, but during clear days, moderate gas-and-steam emissions rose 100-2,500 m above the crater and drifted in multiple directions. A total of 6,237 rockfall events and 288 volcanic earthquakes were detected. The rockfall events often deposited material on the S and SE flanks within 700-1,500 m of the summit crater and ash from the events drifted SW, S, SE, NE, and E. Sulfur dioxide emissions ranged between 149-1,205 t/d, the latter of which was measured on 10 June. Short-term observations from EDM and electronic tiltmeter monitoring indicated that the upper slopes were inflating since February 2023. Longer-term ground deformation parameters based on EDM, precise leveling, continuous GPS, and electronic tilt monitoring indicated that the volcano remained inflated, especially on the NW and SE flanks. At 1000 on 5 June the Volcano Alert Level (VAL) was raised to 2 (on a 0-5 scale). PHIVOLCS noted that although low-level volcanic earthquakes, ground deformation, and volcanic gas emissions indicated unrest, the steep increase in rockfall frequency may indicate increased dome activity.
A total of 151 dome-collapse PDCs occurred during 8-9 and 11-30 June, traveled 500-2,000 m, and deposited material on the S flank within 2 km of the summit crater. During 8-9 June the VAL was raised to 3. At approximately 1947 on 11 June lava flow activity was reported; two lobes traveled within 500 m from the crater and deposited material on the S (Mi-isi), SE (Bonga), and E (Basud) flanks. Weak seismicity accompanied the lava flow and slight inflation on the upper flanks. This lava flow remained active through 30 June, moving down the S and SE flank as far as 2.5 km and 1.8 km, respectively and depositing material up to 3.3 km from the crater. During 15-16 June traces of ashfall from the PDCs were reported in Sitio Buga, Nabonton, City of Ligao and Purok, and San Francisco, Municipality of Guinobatan. During 28-29 June there were two PDCs generated by the collapse of the lava flow front, which generated a light-brown ash plume 1 km high. Satellite monitors detected significant concentrations of sulfur dioxide beginning on 29 June. On 30 June PDCs primarily affected the Basud Gully on the E flank, the largest of which occurred at 1301 and lasted eight minutes, based on the seismic record. Four PDCs generated between 1800 and 2000 that lasted approximately four minutes each traveled 3-4 km on the E flank and generated an ash plume that rose 1 km above the crater and drifted N and NW. Ashfall was recorded in Tabaco City.
Similar strong activity continued during July; slow lava effusion remained active on the S and SE flanks and traveled as far as 2.8 km and 2.8 km, respectively and material was deposited as far as 4 km from the crater. There was a total of 6,983 rockfall events and 189 PDCs that affected the S, SE, and E flanks. The volcano network detected a total of 2,124 volcanic earthquakes. Continuous gas-and-steam emissions rose 200-2,000 m above the crater and drifted in multiple directions. Sulfur dioxide emissions averaged 792-4,113 t/d, the latter of which was measured on 28 July. During 2-4 July three PDCs were generated from the collapse of the lava flow and resulting light brown plumes rose 200-300 m above the crater. Continuous tremor pulses were reported beginning at 1547 on 3 July through 7 July at 1200, at 2300 on 8 July and going through 0300 on 10 July, and at 2300 on 16 July, as recorded by the seismic network. During 6-9 July there were 10 lava flow-collapse-related PDCs that generated light brown plumes 300-500 m above the crater. During 10-11 July light ashfall was reported in some areas of Mabinit, Legazpi City, Budiao and Salvacion, Daraga, and Camalig, Albay. By 18 July the lava flow advanced 600 m on the E flank as well.
During 1733 on 18 July and 0434 on 19 July PHIVOLCS reported 30 “ashing” events, which are degassing events accompanied by audible thunder-like sounds and entrained ash at the crater, which produced short, dark plumes that drifted SW. These events each lasted 20-40 seconds, and plume heights ranged from 150-300 m above the crater, as recorded by seismic, infrasound, visual, and thermal monitors. Three more ashing events occurred during 19-20 July. Short-term observations from electronic tilt and GPS monitoring indicate deflation on the E lower flanks in early July and inflation on the NW middle flanks during the third week of July. Longer-term ground deformation parameters from EDM, precise leveling, continuous GPS, and electronic tilt monitoring indicated that the volcano was still generally inflated relative to baseline levels. A short-lived lava pulse lasted 28 seconds at 1956 on 21 July, which was accompanied by seismic and infrasound signals. By 22 July, the only lava flow that remained active was on the SE flank, and continued to extend 3.4 km, while those on the S and E flanks weakened markedly. One ashing event was detected during 30-31 July, whereas there were 57 detected during 31 July-1 August; according to PHIVOLCS beginning at approximately 1800 on 31 July eruptive activity was dominated by phases of intermittent ashing, as well as increased in the apparent rates of lava effusion from the summit crater. The ashing phases consisted of discrete events recorded as low-frequency volcanic earthquakes (LFVQ) typically 30 seconds in duration, based on seismic and infrasound signals. Gray ash plume rose 100 m above the crater and generally drifted NE. Shortly after these ashing events began, new lava began to effuse rapidly from the crater, feeding the established flowed on the SE, E, and E flanks and generating frequent rockfall events.
Intensified unrest persisted during August. There was a total of 4,141 rockfall events, 2,881 volcanic earthquakes, which included volcanic tremor events, 32 ashing events, and 101 PDCs detected throughout the month. On clear weather days, gas-and-steam emissions rose 300-1,500 m above the crater and drifted in different directions (figure 54). Sulfur dioxide emissions averaged 735-4,756 t/d, the higher value of which was measured on 16 August. During 1-2 August the rate of lava effusion decreased, but continued to feed the flows on the SE, S, and E flanks, maintaining their advances to 3.4 km, 2.8 km, and 1.1 km from the crater, respectively (figure 55). Rockfall and PDCs generated by collapses at the lava flow margins and from the summit dome deposited material within 4 km of the crater. During 3-4 August there were 10 tremor events detected that lasted 1-4 minutes. Short-lived lava pulse lasted 35 seconds and was accompanied by seismic and infrasound signals at 0442 on 6 August. Seven collapses were recorded at the front of the lava flow during 12-14 August.
During September, similar activity of slow lava effusion, PDCs, gas-and-steam emissions, and seismicity continued. There was a total of 4,452 rockfall events, 329 volcanic earthquakes, which included volcanic tremor events, two ashing events, and 85 PDCs recorded throughout the month. On clear weather days, gas-and-steam emissions rose 100-1,500 m above the crater and drifted in multiple directions. Sulfur dioxide emissions averaged 609-2,252 t/d, the higher average of which was measured on 6 September. Slow lava effusion continued advancing on the SE, S, and E flanks, maintaining lengths of 3.4 km, 2.8 km, and 1.1 km, respectively. Rockfall and PDC events generated by collapses along the lava flow margins and at the summit dome deposited material within 4 km of the crater.
Geologic Background. Symmetrical Mayon, which rises above the Albay Gulf NW of Legazpi City, is the most active volcano of the Philippines. The steep upper slopes are capped by a small summit crater. Recorded eruptions since 1616 CE range from Strombolian to basaltic Plinian, with cyclical activity beginning with basaltic eruptions, followed by longer periods of andesitic lava flows. Eruptions occur predominately from the central conduit and have also produced lava flows that travel far down the flanks. Pyroclastic density currents and mudflows have commonly swept down many of the approximately 40 ravines that radiate from the summit and have often damaged populated lowland areas. A violent eruption in 1814 killed more than 1,200 people and devastated several towns.
Information Contacts: Philippine Institute of Volcanology and Seismology (PHIVOLCS), Department of Science and Technology, University of the Philippines Campus, Diliman, Quezon City, Philippines (URL: http://www.phivolcs.dost.gov.ph/); MIROVA (Middle InfraRed Observation of Volcanic Activity), a collaborative project between the Universities of Turin and Florence (Italy) supported by the Centre for Volcanic Risk of the Italian Civil Protection Department (URL: http://www.mirovaweb.it/); Hawai'i Institute of Geophysics and Planetology (HIGP) - MODVOLC Thermal Alerts System, School of Ocean and Earth Science and Technology (SOEST), Univ. of Hawai'i, 2525 Correa Road, Honolulu, HI 96822, USA (URL: http://modis.higp.hawaii.edu/); Copernicus Browser, Copernicus Data Space Ecosystem, European Space Agency (URL: https://dataspace.copernicus.eu/browser/); William Rogers, Legazpi City, Albay Province, Philippines.
Nishinoshima (Japan) — October 2023 Cite this Report
Nishinoshima
Japan
27.247°N, 140.874°E; summit elev. 100 m
All times are local (unless otherwise noted)
Eruption plumes and gas-and-steam plumes during May-August 2023
Nishinoshima, located about 1,000 km S of Tokyo, is a small island in the Ogasawara Arc in Japan. The island is the summit of a massive submarine volcano that has prominent submarine peaks to the S, W, and NE. Eruptions date back to 1973 and the current eruption period began in October 2022. Recent activity has consisted of small ash plumes and fumarolic activity (BGVN 48:07). This report covers activity during May through August 2023, using information from monthly reports of the Japan Meteorological Agency (JMA) monthly reports and satellite data.
Activity during May through June was relatively low. The Japan Coast Guard (JCG) did overflights on 14 and 22 June and reported white gas-and-steam emissions rising 600 m and 1,200 m from the central crater of the pyroclastic cone, respectively (figure 125). In addition, multiple white gas-and-steam emissions rose from the inner rim of the W side of the crater and from the SE flank of the pyroclastic cone. Discolored brown-to-green water was observed around almost the entire perimeter of the island; on 22 June light green discolored water was observed off the S coast of the island.
Observations from the Himawari meteorological satellite confirmed an eruption on 9 and 10 July. An eruption plume rose 1.6 km above the crater and drifted N around 1300 on 9 July. Satellite images acquired at 1420 and 2020 on 9 July and at 0220 on 10 July showed continuing emissions that rose 1.3-1.6 km above the crater and drifted NE and N. The Tokyo VAAC reported that an ash plume seen by a pilot and identified in a satellite image at 0630 on 21 July rose to 3 km altitude and drifted S.
Aerial observations conducted by JCG on 8 August showed a white-and-gray plume rising from the central crater of the pyroclastic cone, and multiple white gas-and-steam emissions were rising from the inner edge of the western crater and along the NW-SE flanks of the island (figure 126). Brown-to-green discolored water was also noted around the perimeter of the island.
Intermittent low-to-moderate power thermal anomalies were recorded in the MIROVA graph (Middle InfraRed Observation of Volcanic Activity), showing an increase in both frequency and power beginning in July (figure 127). This increase in activity coincides with eruptive activity on 9 and 10 July, characterized by eruption plumes. According to the MODVOLC thermal alert algorithm, one thermal hotspot was recorded on 20 July. Weak thermal anomalies were also detected in infrared satellite imagery, accompanied by strong gas-and-steam plumes (figure 128).
Geologic Background. The small island of Nishinoshima was enlarged when several new islands coalesced during an eruption in 1973-74. Multiple eruptions that began in 2013 completely covered the previous exposed surface and continued to enlarge the island. The island is the summit of a massive submarine volcano that has prominent peaks to the S, W, and NE. The summit of the southern cone rises to within 214 m of the ocean surface 9 km SSE.
Information Contacts: Japan Meteorological Agency (JMA), 1-3-4 Otemachi, Chiyoda-ku, Tokyo 100-8122, Japan (URL: http://www.jma.go.jp/jma/indexe.html); Tokyo Volcanic Ash Advisory Center (VAAC), 1-3-4 Otemachi, Chiyoda-ku, Tokyo 100-8122, Japan (URL: http://ds.data.jma.go.jp/svd/vaac/data/); MIROVA (Middle InfraRed Observation of Volcanic Activity), a collaborative project between the Universities of Turin and Florence (Italy) supported by the Centre for Volcanic Risk of the Italian Civil Protection Department (URL: http://www.mirovaweb.it/); Copernicus Browser, Copernicus Data Space Ecosystem, European Space Agency (URL: https://dataspace.copernicus.eu/browser/).
Krakatau (Indonesia) — October 2023 Cite this Report
Krakatau
Indonesia
6.1009°S, 105.4233°E; summit elev. 285 m
All times are local (unless otherwise noted)
White gas-and-steam plumes and occasional ash plumes during May-August 2023
Krakatau is located in the Sunda Strait between Java and Sumatra, Indonesia. Caldera collapse during the catastrophic 1883 eruption destroyed Danan and Perbuwatan cones and left only a remnant of Rakata. The post-collapse cone of Anak Krakatau (Child of Krakatau) was constructed within the 1883 caldera at a point between the former Danan and Perbuwatan cones; it has been the site of frequent eruptions since 1927. The current eruption period began in May 2021 and has recently consisted of Strombolian eruptions and ash plumes (BGVN 48:07). This report describes lower levels of activity consisting of ash and white gas-and-steam plumes during May through August 2023, based on information provided by the Indonesian Center for Volcanology and Geological Hazard Mitigation, referred to as Pusat Vulkanologi dan Mitigasi Bencana Geologi (PVMBG), MAGMA Indonesia, and satellite data.
Activity was relatively low during May and June. Daily white gas-and-steam emissions rose 25-200 m above the crater and drifted in different directions. Five ash plumes were detected at 0519 on 10 May, 1241 on 11 May, 0920 on 12 May, 2320 on 12 May, and at 0710 on 13 May, and rose 1-2.5 km above the crater and drifted SW. A webcam image taken on 12 May showed ejection of incandescent material above the vent. A total of nine ash plumes were detected during 6-11 June: at 1434 and 00220 on 6 and 7 June the ash plumes rose 500 m above the crater and drifted NW, at 1537 on 8 June the ash plume rose 1 km above the crater and drifted SW, at 0746 and at 0846 on 9 June the ash plumes rose 800 m and 3 km above the crater and drifted SW, respectively, at 0423, 1431, and 1750 on 10 June the ash plumes rose 2 km, 1.5 km, and 3.5 km above the crater and drifted NW, respectively, and at 0030 on 11 June an ash plume rose 2 km above the crater and drifted NW. Webcam images taken on 10 and 11 June at 0455 and 0102, respectively, showed incandescent material ejected above the vent. On 19 June an ash plume at 0822 rose 1.5 km above the crater and drifted SE.
Similar low activity of white gas-and-steam emissions and few ash plumes were reported during July and August. Daily white gas-and-steam emissions rose 25-300 m above the crater and drifted in multiple directions. Three ash plumes were reported at 0843, 0851, and 0852 on 20 July that rose 500-2,000 m above the crater and drifted NW.
The MIROVA (Middle InfraRed Observation of Volcanic Activity) graph of MODIS thermal anomaly data showed intermittent low-to-moderate power thermal anomalies during May through August 2023 (figure 140). Although activity was often obscured by weather clouds, a thermal anomaly was visible in an infrared satellite image of the crater on 12 May, accompanied by an eruption plume that drifted SW (figure 141).
Geologic Background. The renowned Krakatau (frequently mis-named as Krakatoa) volcano lies in the Sunda Strait between Java and Sumatra. Collapse of an older edifice, perhaps in 416 or 535 CE, formed a 7-km-wide caldera. Remnants of that volcano are preserved in Verlaten and Lang Islands; subsequently the Rakata, Danan, and Perbuwatan cones were formed, coalescing to create the pre-1883 Krakatau Island. Caldera collapse during the catastrophic 1883 eruption destroyed Danan and Perbuwatan, and left only a remnant of Rakata. This eruption caused more than 36,000 fatalities, most as a result of tsunamis that swept the adjacent coastlines of Sumatra and Java. Pyroclastic surges traveled 40 km across the Sunda Strait and reached the Sumatra coast. After a quiescence of less than a half century, the post-collapse cone of Anak Krakatau (Child of Krakatau) was constructed within the 1883 caldera at a point between the former Danan and Perbuwatan cones. Anak Krakatau has been the site of frequent eruptions since 1927.
Information Contacts: Pusat Vulkanologi dan Mitigasi Bencana Geologi (PVMBG, also known as Indonesian Center for Volcanology and Geological Hazard Mitigation, CVGHM), Jalan Diponegoro 57, Bandung 40122, Indonesia (URL: http://www.vsi.esdm.go.id/); MAGMA Indonesia, Kementerian Energi dan Sumber Daya Mineral (URL: https://magma.esdm.go.id/v1); MIROVA (Middle InfraRed Observation of Volcanic Activity), a collaborative project between the Universities of Turin and Florence (Italy) supported by the Centre for Volcanic Risk of the Italian Civil Protection Department (URL: http://www.mirovaweb.it/); Copernicus Browser, Copernicus Data Space Ecosystem, European Space Agency (URL: https://dataspace.copernicus.eu/browser/).
Villarrica (Chile) — October 2023 Cite this Report
Villarrica
Chile
39.42°S, 71.93°W; summit elev. 2847 m
All times are local (unless otherwise noted)
Strombolian activity, gas-and-ash emissions, and crater incandescence during April-September 2023
Villarrica, in central Chile, consists of a 2-km-wide caldera that formed about 3,500 years ago and is located at the base of the presently active cone at the NW margin of a 6-km-wide caldera. Historical eruptions eruptions date back to 1558 and have been characterized by mild-to-moderate explosive activity with occasional lava effusions. The current eruption period began in December 2014 and has recently consisted of nighttime crater incandescence, ash emissions, and seismicity (BGVN 48:04). This report covers activity during April through September 2023 and describes occasional Strombolian activity, gas-and-ash emissions, and nighttime crater incandescence. Information for this report primarily comes from the Southern Andes Volcano Observatory (Observatorio Volcanológico de Los Andes del Sur, OVDAS), part of Chile's National Service of Geology and Mining (Servicio Nacional de Geología y Minería, SERNAGEOMIN) and satellite data.
Seismicity during April consisted of long period (LP) events and tremor (TRE); a total of 9,413 LP-type events and 759 TR-type events were detected throughout the month. Nighttime crater incandescence persisted and was visible in the degassing column. Sulfur dioxide data was obtained using Differential Absorption Optical Spectroscopy Equipment (DOAS) that showed an average value of 1,450 ± 198 tons per day (t/d) during 1-15 April and 1,129 ± 201 t/d during 16-30 April, with a maximum daily value of 2,784 t/d on 9 April. Gas-and-steam emissions of variable intensities rose above the active crater as high as 1.3 km above the crater on 13 April. Strombolian explosions were not observed and there was a slight decrease in the lava lake level.
There were 14,123 LP-type events and 727 TR-type events detected during May. According to sulfur dioxide measurements taken with DOAS equipment, the active crater emitted an average value of 1,826 ± 482 t/d during 1-15 May and 912 ± 41 t/d during 16-30 May, with a daily maximum value of 5,155 t/d on 13 May. Surveillance cameras showed continuous white gas-and-steam emissions that rose as high as 430 m above the crater on 27 May. Nighttime incandescence illuminated the gas column less than 300 m above the crater rim was and no pyroclastic emissions were reported. A landslide was identified on 13 May on the E flank of the volcano 50 m from the crater rim and extending 300 m away; SERNAGEOMIN noted that this event may have occurred on 12 May. During the morning of 27 and 28 May minor Strombolian explosions characterized by incandescent ejecta were recorded at the crater rim; the last reported Strombolian explosions had occurred at the end of March.
Seismic activity during June consisted of five volcano-tectonic (VT)-type events, 21,606 LP-type events, and 2,085 TR-type events. The average value of sulfur dioxide flux obtained by DOAS equipment was 1,420 ± 217 t/d during 1-15 June and 2,562 ± 804 t/d, with a maximum daily value of 4,810 t/d on 17 June. White gas-and-steam emissions rose less than 480 m above the crater; frequent nighttime crater incandescence was reflected in the degassing plume. On 12 June an emission rose 100 m above the crater and drifted NNW. On 15 June one or several emissions resulted in ashfall to the NE as far as 5.5 km from the crater, based on a Skysat satellite image. Several Strombolian explosions occurred within the crater; activity on 15 June was higher energy and ejected blocks 200-300 m on the NE slope. Surveillance cameras showed white gas-and-steam emissions rising 480 m above the crater on 16 June. On 19 and 24 June low-intensity Strombolian activity was observed, ejecting material as far as 200 m from the center of the crater to the E.
During July, seismicity included 29,319 LP-type events, 3,736 TR-type events, and two VT-type events. DOAS equipment recorded two days of sulfur dioxide emissions of 4,220 t/d and 1,009 t/d on 1 and 13 July, respectively. Constant nighttime incandescence was also recorded and was particularly noticeable when accompanied by eruptive columns on 12 and 16 July. Minor explosive events were detected in the crater. According to Skysat satellite images taken on 12, 13, and 16 July, ashfall deposits were identified 155 m S of the crater. According to POVI, incandescence was visible from two vents on the crater floor around 0336 on 12 July. Gas-and-ash emissions rose as high as 1.2 km above the crater on 13 July and drifted E and NW. A series of gas-and-steam pulses containing some ash deposited material on the upper E flank around 1551 on 13 July. During 16-31 July, average sulfur dioxide emissions of 1,679 ± 406 t/d were recorded, with a maximum daily value of 2,343 t/d on 28 July. Fine ash emissions were also reported on 16, 17, and 23 July.
Seismicity persisted during August, characterized by 27,011 LP-type events, 3,323 TR-type events, and three VT-type events. The average value of sulfur dioxide measurements taken during 1-15 August was 1,642 ± 270 t/d and 2,207 ± 4,549 t/d during 16-31 August, with a maximum daily value of 3,294 t/d on 27 August. Nighttime crater incandescence remained visible in degassing columns. White gas-and-steam emissions rose 480 m above the crater on 6 August. According to a Skysat satellite image from 6 August, ash accumulation was observed proximal to the crater and was mainly distributed toward the E slope. White gas-and-steam emissions rose 320 m above the crater on 26 August. Nighttime incandescence and Strombolian activity that generated ash emissions were reported on 27 August.
Seismicity during September was characterized by five VT-type events, 12,057 LP-type events, and 2,058 TR-type events. Nighttime incandescence persisted. On 2 September an ash emission rose 180 m above the crater and drifted SE at 1643 (figure 125) and a white gas-and-steam plume rose 320 m above the crater. According to the Buenos Aires VAAC, periods of continuous gas-and-ash emissions were visible in webcam images from 1830 on 2 September to 0110 on 3 September. Strombolian activity was observed on 2 September and during the early morning of 3 September, the latter event of which generated an ash emission that rose 60 m above the crater and drifted 100 m from the center of the crater to the NE and SW. Ashfall was reported to the SE and S as far as 750 m from the crater. The lava lake was active during 3-4 September and lava fountaining was visible for the first time since 26 March 2023, according to POVI. Fountains captured in webcam images at 2133 on 3 September and at 0054 on 4 September rose as high as 60 m above the crater rim and ejected material onto the upper W flank. Sulfur dioxide flux of 1,730 t/d and 1,281 t/d was measured on 3 and 4 September, respectively, according to data obtained by DOAS equipment.
Strong Strombolian activity and larger gas-and-ash plumes were reported during 18-20 September. On 18 September activity was also associated with energetic LP-type events and notable sulfur dioxide fluxes (as high as 4,277 t/d). On 19 September Strombolian activity and incandescence were observed. On 20 September at 0914 ash emissions rose 50 m above the crater and drifted SSE, accompanied by Strombolian activity that ejected material less than 100 m SSE, causing fall deposits on that respective flank. SERNAGEOMIN reported that a Planet Scope satellite image taken on 20 September showed the lava lake in the crater, measuring 32 m x 35 m and an area of 0.001 km2. Several ash emissions were recorded at 0841, 0910, 1251, 1306, 1312, 1315, and 1324 on 23 September and rose less than 150 m above the crater. The sulfur dioxide flux value was 698 t/d on 23 September and 1,097 t/d on 24 September. On 24 September the Volcanic Alert Level (VAL) was raised to Orange (the third level on a four-color scale). SENAPRED maintained the Alert Level at Yellow (the middle level on a three-color scale) for the communities of Villarrica, Pucón (16 km N), Curarrehue, and Panguipulli.
During 24-25 September there was an increase in seismic energy (observed at TR-events) and acoustic signals, characterized by 1 VT-type event, 213 LP-type events, and 124 TR-type events. Mainly white gas-and-steam emissions, in addition to occasional fine ash emissions were recorded. During the early morning of 25 September Strombolian explosions were reported and ejected material 250 m in all directions, though dominantly toward the NW. On 25 September the average value of sulfur dioxide flux was 760 t/d. Seismicity during 25-30 September consisted of five VT-type events, 1,937 LP-type events, and 456 TR-type events.
During 25-29 September moderate Strombolian activity was observed and ejected material as far as the crater rim. In addition, ash pulses lasting roughly 50 minutes were observed around 0700 and dispersed ENE. During 26-27 September a TR episode lasted 6.5 hours and was accompanied by discrete acoustic signals. Satellite images from 26 September showed a spatter cone on the crater floor with one vent that measured 10 x 14 m and a smaller vent about 35 m NE of the cone. SERNAGEOMIN reported an abundant number of bomb-sized blocks up to 150 m from the crater, as well as impact marks on the snow, which indicated explosive activity. A low-altitude ash emission was observed drifting NW around 1140 on 28 September, based on webcam images. Between 0620 and 0850 on 29 September an ash emission rose 60 m above the crater and drifted NW. During an overflight taken around 1000 on 29 September scientists observed molten material in the vent, a large accumulation of pyroclasts inside the crater, and energetic degassing, some of which contained a small amount of ash. Block-sized pyroclasts were deposited on the internal walls and near the crater, and a distal ash deposit was also visible. The average sulfur dioxide flux measured on 28 September was 344 t/d. Satellite images taken on 29 September ashfall was deposited roughly 3 km WNW from the crater and nighttime crater incandescence remained visible. The average sulfur dioxide flux value from 29 September was 199 t/d. On 30 September at 0740 a pulsating ash emission rose 1.1 km above the crater and drifted NNW (figure 126). Deposits on the S flank extended as far as 4.5 km from the crater rim, based on satellite images from 30 September.
Infrared MODIS satellite data processed by MIROVA (Middle InfraRed Observation of Volcanic Activity) showed intermittent thermal activity during April through September, with slightly stronger activity detected during late September (figure 127). Small clusters of thermal activity were detected during mid-June, early July, early August, and late September. According to the MODVOLC thermal alert system, a total of four thermal hotspots were detected on 7 July and 3 and 23 September. This activity was also intermittently captured in infrared satellite imagery on clear weather days (figure 128).
Geologic Background. The glacier-covered Villarrica stratovolcano, in the northern Lakes District of central Chile, is ~15 km south of the city of Pucon. A 2-km-wide caldera that formed about 3,500 years ago is located at the base of the presently active, dominantly basaltic to basaltic andesite cone at the NW margin of a 6-km-wide Pleistocene caldera. More than 30 scoria cones and fissure vents are present on the flanks. Plinian eruptions and pyroclastic flows that have extended up to 20 km from the volcano were produced during the Holocene. Lava flows up to 18 km long have issued from summit and flank vents. Eruptions documented since 1558 CE have consisted largely of mild-to-moderate explosive activity with occasional lava effusion. Glaciers cover 40 km2 of the volcano, and lahars have damaged towns on its flanks.
Information Contacts: Servicio Nacional de Geología y Minería (SERNAGEOMIN), Observatorio Volcanológico de Los Andes del Sur (OVDAS), Avda Sta María No. 0104, Santiago, Chile (URL: http://www.sernageomin.cl/); Proyecto Observación Villarrica Internet (POVI) (URL: http://www.povi.cl/); Sistema y Servicio Nacional de Prevención y Repuesta Ante Desastres (SENAPRED), Av. Beauchef 1671, Santiago, Chile (URL: https://web.senapred.cl/); Buenos Aires Volcanic Ash Advisory Center (VAAC), Servicio Meteorológico Nacional-Fuerza Aérea Argentina, 25 de mayo 658, Buenos Aires, Argentina (URL: http://www.smn.gov.ar/vaac/buenosaires/inicio.php); MIROVA (Middle InfraRed Observation of Volcanic Activity), a collaborative project between the Universities of Turin and Florence (Italy) supported by the Centre for Volcanic Risk of the Italian Civil Protection Department (URL: http://www.mirovaweb.it/); Hawai'i Institute of Geophysics and Planetology (HIGP) - MODVOLC Thermal Alerts System, School of Ocean and Earth Science and Technology (SOEST), Univ. of Hawai'i, 2525 Correa Road, Honolulu, HI 96822, USA (URL: http://modis.higp.hawaii.edu/); Copernicus Browser, Copernicus Data Space Ecosystem, European Space Agency (URL: https://dataspace.copernicus.eu/browser/).
Merapi (Indonesia) — October 2023 Cite this Report
Merapi
Indonesia
7.54°S, 110.446°E; summit elev. 2910 m
All times are local (unless otherwise noted)
Frequent incandescent avalanches during April-September 2023
Merapi, located just north of the major city of Yogyakarta in central Java, Indonesia, has had activity within the last 20 years characterized by pyroclastic flows and lahars accompanying growth and collapse of the steep-sided active summit lava dome. The current eruption period began in late December 2020 and has more recently consisted of ash plumes, intermittent incandescent avalanches of material, and pyroclastic flows (BGVN 48:04). This report covers activity during April through September 2023, based on information from Balai Penyelidikan dan Pengembangan Teknologi Kebencanaan Geologi (BPPTKG), the Center for Research and Development of Geological Disaster Technology, a branch of PVMBG which specifically monitors Merapi. Additional information comes from the Pusat Vulkanologi dan Mitigasi Bencana Geologi (PVMBG, also known as Indonesian Center for Volcanology and Geological Hazard Mitigation, CVGHM), MAGMA Indonesia, the Darwin Volcanic Ash Advisory Centre (VAAC), and various satellite data.
Activity during April through September 2023 primarily consisted of incandescent avalanches of material that mainly affected the SW and W flanks and traveled as far as 2.3 km from the summit (table 25) and white gas-and-steam emissions that rose 10-1,000 m above the crater.
Table 25. Monthly summary of avalanches and avalanche distances recorded at Merapi during April through September 2023. The number of reported avalanches does not include instances where possible avalanches were heard but could not be visually confirmed as a result of inclement weather. Data courtesy of BPPTKG (April-September 2023 daily reports).
| Month |
Average number of avalanches per day |
Distance avalanches traveled (m) |
| Apr 2023 |
19 |
1,200-2,000 |
| May 2023 |
22 |
500-2,000 |
| Jun 2023 |
18 |
1,200-2,000 |
| Jul 2023 |
30 |
300-2,000 |
| Aug 2023 |
25 |
400-2,300 |
| Sep 2023 |
23 |
600-2,000 |
BPPTKG reported that during April and May white gas-and-steam emissions rose 10-750 m above the crater, incandescent avalanches descended 500-2,000 m on the SW and W flanks (figure 135). Cloudy weather often prevented clear views of the summit, and sometimes avalanches could not be confirmed. According to a webcam image, a pyroclastic flow was visible on 17 April at 0531. During the week of 28 April and 4 May a pyroclastic flow was reported on the SW flank, traveling up to 2.5 km. According to a drone overflight taken on 17 May the SW lava dome volume was an estimated 2,372,800 cubic meters and the dome in the main crater was an estimated 2,337,300 cubic meters.
During June and July similar activity persisted with white gas-and-steam emissions rising 10-350 m above the crater and frequent incandescent avalanches that traveled 300-2,000 m down the SW, W, and S flanks (figure 136). Based on an analysis of aerial photos taken on 24 June the volume of the SW lava dome was approximately 2.5 million cubic meters. A pyroclastic flow was observed on 5 July that traveled 2.7 km on the SW flank. According to the Darwin VAAC multiple minor ash plumes were identified in satellite images on 19 July that rose to 3.7 km altitude and drifted S and SW. During 22, 25, and 26 July a total of 17 avalanches descended as far as 1.8 km on the S flank.
Frequent white gas-and-steam emissions continued during August and September, rising 10-450 m above the crater. Incandescent avalanches mainly affected the SW and W flanks and traveled 400-2,300 m from the vent (figure 137). An aerial survey conducted on 10 August was analyzed and reported that estimates of the SW dome volume was 2,764,300 cubic meters and the dome in the main crater was 2,369,800 cubic meters.
Frequent and moderate-power thermal activity continued throughout the reporting period, according to a MIROVA (Middle InfraRed Observation of Volcanic Activity) analysis of MODIS satellite data (figure 138). There was an increase in the number of detected anomalies during mid-May. The MODVOLC thermal algorithm recorded a total of 47 thermal hotspots: six during April, nine during May, eight during June, 15 during July, four during August, and five during September. Some of this activity was captured in infrared satellite imagery on clear weather days, sometimes accompanied by incandescent material on the SW flank (figure 139).
Geologic Background. Merapi, one of Indonesia's most active volcanoes, lies in one of the world's most densely populated areas and dominates the landscape immediately north of the major city of Yogyakarta. It is the youngest and southernmost of a volcanic chain extending NNW to Ungaran volcano. Growth of Old Merapi during the Pleistocene ended with major edifice collapse perhaps about 2,000 years ago, leaving a large arcuate scarp cutting the eroded older Batulawang volcano. Subsequent growth of the steep-sided Young Merapi edifice, its upper part unvegetated due to frequent activity, began SW of the earlier collapse scarp. Pyroclastic flows and lahars accompanying growth and collapse of the steep-sided active summit lava dome have devastated cultivated lands on the western-to-southern flanks and caused many fatalities.
Information Contacts: Balai Penyelidikan dan Pengembangan Teknologi Kebencanaan Geologi (BPPTKG), Center for Research and Development of Geological Disaster Technology (URL: http://merapi.bgl.esdm.go.id/, Twitter: @BPPTKG); MAGMA Indonesia, Kementerian Energi dan Sumber Daya Mineral (URL: https://magma.esdm.go.id/v1); Pusat Vulkanologi dan Mitigasi Bencana Geologi (PVMBG, also known as Indonesian Center for Volcanology and Geological Hazard Mitigation, CVGHM), Jalan Diponegoro 57, Bandung 40122, Indonesia (URL: http://www.vsi.esdm.go.id/); Darwin Volcanic Ash Advisory Centre (VAAC), Bureau of Meteorology, Northern Territory Regional Office, PO Box 40050, Casuarina, NT 0811, Australia (URL: http://www.bom.gov.au/info/vaac/); MIROVA (Middle InfraRed Observation of Volcanic Activity), a collaborative project between the Universities of Turin and Florence (Italy) supported by the Centre for Volcanic Risk of the Italian Civil Protection Department (URL: http://www.mirovaweb.it/); Hawai'i Institute of Geophysics and Planetology (HIGP) - MODVOLC Thermal Alerts System, School of Ocean and Earth Science and Technology (SOEST), Univ. of Hawai'i, 2525 Correa Road, Honolulu, HI 96822, USA (URL: http://modis.higp.hawaii.edu/); Copernicus Browser, Copernicus Data Space Ecosystem, European Space Agency (URL: https://dataspace.copernicus.eu/browser/); Øystein Lund Andersen (URL: https://www.oysteinlundandersen.com/, https://twitter.com/oysteinvolcano).
Ebeko
Russia
50.686°N, 156.014°E; summit elev. 1103 m
All times are local (unless otherwise noted)
Moderate explosive activity with ash plumes continued during June-November 2023
Ebeko, located on the N end of Paramushir Island in Russia’s Kuril Islands just S of the Kamchatka Peninsula, consists of three summit craters along a SSW-NNE line at the northern end of a complex of five volcanic cones. Observed eruptions date back to the late 18th century and have been characterized as small-to-moderate explosions from the summit crater, accompanied by intense fumarolic activity. The current eruptive period began in June 2022, consisting of frequent explosions, ash plumes, and thermal activity (BGVN 47:10, 48:06). This report covers similar activity during June-November 2023, based on information from the Kamchatka Volcanic Eruptions Response Team (KVERT) and satellite data.
Moderate explosive activity continued during June-November 2023 (figures 50 and 51). According to visual data from Severo-Kurilsk, explosions sent ash 2-3.5 km above the summit (3-4.5 km altitude) during most days during June through mid-September. Activity after mid-September was slightly weaker, with ash usually reaching less than 2 km above the summit. According to KVERT the volcano in October and November was, with a few exceptions, either quiet or obscured by clouds that prevented satellite observations. KVERT issued Volcano Observatory Notices for Aviation (VONA) on 8 and 12 June, 13 and 22 July, 3 and 21 August, and 31 October warning of potential aviation hazards from ash plumes drifting 3-15 km from the volcano. Based on satellite data, KVERT reported a persistent thermal anomaly whenever weather clouds permitted viewing.
Geologic Background. The flat-topped summit of the central cone of Ebeko volcano, one of the most active in the Kuril Islands, occupies the northern end of Paramushir Island. Three summit craters located along a SSW-NNE line form Ebeko volcano proper, at the northern end of a complex of five volcanic cones. Blocky lava flows extend west from Ebeko and SE from the neighboring Nezametnyi cone. The eastern part of the southern crater contains strong solfataras and a large boiling spring. The central crater is filled by a lake about 20 m deep whose shores are lined with steaming solfataras; the northern crater lies across a narrow, low barrier from the central crater and contains a small, cold crescentic lake. Historical activity, recorded since the late-18th century, has been restricted to small-to-moderate explosive eruptions from the summit craters. Intense fumarolic activity occurs in the summit craters, on the outer flanks of the cone, and in lateral explosion craters.
Information Contacts: Kamchatka Volcanic Eruptions Response Team (KVERT), Far Eastern Branch, Russian Academy of Sciences, 9 Piip Blvd., Petropavlovsk-Kamchatsky, 683006, Russia (URL: http://www.kscnet.ru/ivs/kvert/).
Search Bulletin Archive by Publication Date
Select a month and year from the drop-downs and click "Show Issue" to have that issue displayed in this tab.
The default month and year is the latest issue available.
Bulletin of the Global Volcanism Network - Volume 27, Number 10 (October 2002)
Managing Editor: Richard Wunderman
Bezymianny (Russia)
A one-pixel thermal anomaly on 16-17 November 2002
Etna (Italy)
A flank eruption started on 27 October; lava vented at N- and S-flank fissures
Izu-Torishima (Japan)
Mid-August 2002 plumes, larger crater, and discolored water
Lengai, Ol Doinyo (Tanzania)
Lava exits crater at 3 points during January 2001-September 2002
Nyamulagira (DR Congo)
Multi-vent eruption, 25 July-27 September 2002; regional earthquake
Nyiragongo (DR Congo)
New fissure vents and lava fountains; largest regional earthquake in 30 years
Panarea (Italy)
Increased submarine fumarolic activity near Panarea Island
Popocatepetl (Mexico)
Small explosions, earthquakes, and tremor during July-October 2002
Ruang (Indonesia)
Eruption on 25 September 2002 sends ash to at least 5 km
Veniaminof (United States)
Volcanic unrest, uncertain low-level eruptive activity in September 2002
Bezymianny (Russia) — October 2002 Cite this Report
Bezymianny
Russia
55.972°N, 160.595°E; summit elev. 2882 m
All times are local (unless otherwise noted)
A one-pixel thermal anomaly on 16-17 November 2002
The last reported activity at Bezymianny included a 4-km plume and thermal anomalies visible on satellite imagery during December 2001 and January 2002 (BGVN 26:12). No further reports were issued until mid-November 2002.
On 18 November KVERT raised the Concern Color Code at Bezymianny from Green to Yellow after a 1-pixel thermal anomaly was observed on various satellite images on 16 and 17 November. The closest telemetered seismic stations, situated on Kliuchevskoi, 13.5 km from Bezymianny's lava dome, only recorded several shallow seismic events at Bezymianny: 13 in August and September, and 3 in October. High seismic activity at Kliuchevskoi made it difficult to separate Bezymianny's seismic events from Kliuchevskoi's. According to AVHRR satellite images the thermal anomaly had a temperature of 18°C in a background of -30°C.
Geologic Background. The modern Bezymianny, much smaller than its massive neighbors Kamen and Kliuchevskoi on the Kamchatka Peninsula, was formed about 4,700 years ago over a late-Pleistocene lava-dome complex and an edifice built about 11,000-7,000 years ago. Three periods of intensified activity have occurred during the past 3,000 years. The latest period, which was preceded by a 1,000-year quiescence, began with the dramatic 1955-56 eruption. This eruption, similar to that of St. Helens in 1980, produced a large open crater that was formed by collapse of the summit and an associated lateral blast. Subsequent episodic but ongoing lava-dome growth, accompanied by intermittent explosive activity and pyroclastic flows, has largely filled the 1956 crater.
Information Contacts: Olga Girina, Kamchatka Volcanic Eruptions Response Team (KVERT), Institute of Volcanic Geology and Geochemistry, Piip Ave. 9, Petropavlovsk-Kamchatsky, 683006, Russia; Alaska Volcano Observatory (AVO), a cooperative program of a) U.S. Geological Survey, 4200 University Drive, Anchorage, AK 99508-4667, USA (URL: http://www.avo.alaska.edu/), b) Geophysical Institute, University of Alaska, PO Box 757320, Fairbanks, AK 99775-7320, USA, and c) Alaska Division of Geological & Geophysical Surveys, 794 University Ave., Suite 200, Fairbanks, AK 99709.
Etna
Italy
37.748°N, 14.999°E; summit elev. 3357 m
All times are local (unless otherwise noted)
A flank eruption started on 27 October; lava vented at N- and S-flank fissures
At 2225 on 26 October 2002 a swarm of earthquakes was recorded by the seismic network of the National Institute of Geophysics and Volcanology (INGV) in the Catania sector. Three hours after the swarm began, Etna started a new flank eruption. Until 1 November, ~500 shocks registered. The seismic swarm preceded and accompanied explosive activity in the summit area.
A survey at 0400 on 27 October found that two eruptive fissures had opened on Etna's N and S flanks; they were still propagating up- and down-slope when observed. Fire fountains escaped at both fissures.
At that time, lava flows started to pour from the lower part of the N-flank fissure, causing concern on Etna's N flank around Piano Provenzana. At the lower end of this fissure, two major flows spread NE and E. The NE flow stopped on 31 October after having traveled 2 km, behavior congruent with an observed decline in the effusion rate.
The E flow slowed down until 1 November, but it continued moving and crusting over in the middle portion of the flow field until 3 November. Scientists from INGV-CT conducted a helicopter-based aerial survey, using helicopters from the Civil Protection, and deploying a FLIR TM 695 thermal camera. Survey results showed a few sectors of solid crust and suggested the initial formation of a lava tube on this lava flow, which completely stopped on 5 November. The ski station and tourist shops on Piano Provenzana were first destroyed by the earthquakes, and then surrounded by lava flows. The flows also caused fire that engulfed parts of the pine forest. Flow mapping (shown on the INGV website) was limited by both the presence of fire around the flow fronts and ash clouds masking most of the flow field, and only the use of the FLIR TM 695 thermal camera allowed views of the active lava flows.
The N fissure opened between 2,500 and 2,350 m elevation, an area close to the fissure developed in the year 1809. The current N-flank fissure is a few kilometers long and expanded NE following the NE Rift Zone.
A lava flow from the S-flank fissure started ~12 hours after the N one. It spread SW and split in two branches around Monte Nero, following the same path as one of the 2001 lava branches. The S flows stopped on 31 October, having reached a total length of about 2 km. Fire fountains and phreatomagmatic activity decreased in intensity with time and disappeared at the N fissure, but were still continuing on the S fissure.
The S fissure, which opened at 2700 m elevation, traveled N20°W, and occurred a few hundred meters W of the 2001 S-fissure field, between Monte Frumento Supino and Cisternazza (a map appears at the INGV website, see below). Spatter falling around the S-fissure's vents formed two cinder cones at about 2,030 m elevation. Fire fountains from these vents were initially 100-300 m high, producing an ash plume and abundant ashfall on Etna's S flank. In 3 days the city of Catania received ~2.5 kg/m2 of ash due to strong winds from the N. This disrupted the local airport and caused problems with travel.
The high amount of gas released by the summit vents and at the 2,750-m cone (up to 25,000 tons/day), and the continuing explosive activity at the S vent, suggest a long duration for this eruptive event (figure 96).
Editor's note: Summaries of Etna activity from recent issues of the Bulletin have been prepared by our staff without the benefit of crafted summaries in English. As such, the contributors found them deficient in clarity of translation. For greater clarity and more technical details consult journal publications and the INGV website.
Geologic Background. Mount Etna, towering above Catania on the island of Sicily, has one of the world's longest documented records of volcanism, dating back to 1500 BCE. Historical lava flows of basaltic composition cover much of the surface of this massive volcano, whose edifice is the highest and most voluminous in Italy. The Mongibello stratovolcano, truncated by several small calderas, was constructed during the late Pleistocene and Holocene over an older shield volcano. The most prominent morphological feature of Etna is the Valle del Bove, a 5 x 10 km caldera open to the east. Two styles of eruptive activity typically occur, sometimes simultaneously. Persistent explosive eruptions, sometimes with minor lava emissions, take place from one or more summit craters. Flank vents, typically with higher effusion rates, are less frequently active and originate from fissures that open progressively downward from near the summit (usually accompanied by Strombolian eruptions at the upper end). Cinder cones are commonly constructed over the vents of lower-flank lava flows. Lava flows extend to the foot of the volcano on all sides and have reached the sea over a broad area on the SE flank.
Information Contacts: Sonia Calvari, Istituto Nazionale di Geofisica e Vulcanologia Sezione di Catania, Piazza Roma 2, 95123 Catania (URL: http://www.ct.ingv.it/).
Izu-Torishima (Japan) — October 2002 Cite this Report
Izu-Torishima
Japan
30.484°N, 140.303°E; summit elev. 394 m
All times are local (unless otherwise noted)
Mid-August 2002 plumes, larger crater, and discolored water
Following ship-based reports of activity at Tori-shima on 11 August 2002, scientists from the Japanese Meterological Agency overflew the area the next day when they observed and photographed ash plumes being erupted from the crater (BGVN 27:07). According to the Japan Coast Guard (via JMA), the activity continued as of 1200 on 14 August; the plume reached ~1.2-1.5 km above sea level on 13 August (figure 3), and ~900 m on 14 August. Emissions were observed from three active areas along the western inner-wall of the summit crater. The crater appeared to have widened. By 21 August, the Japan Coast Guard reported that Izu-Tori-shima no longer "smoked" and only weak steaming was seen in the southern portion of the crater. Faintly discolored sea surface was observed around the island.
Geologic Background. The circular, 2.7-km-wide island of Izu-Torishima in the southern Izu Islands is capped by an unvegetated summit cone formed during an eruption in 1939. Fresh lava flows from this eruption form part of the northern coastline of the basaltic-to-dacitic edifice. The volcano is referred to as Izu-Torishima to distinguish it from the several other Japanese island volcanoes called Torishima ("Bird Island"). The main cone is truncated by a 1.5-km-wide caldera that contains two central cones, of which Ioyama is the highest. Historical eruptions have also occurred from flank vents near the north coast and offshore submarine vents. A submarine caldera 6-8 km wide lies immediately to the north.
Information Contacts: Tomonori Kannno and Hitoshi Yamasato, Japanese Meteorological Agency (JMA), Volcanological Division, 1-3-4 Ote-machi, Chiyoda-ku, Tokyo 100, Japan (URL: http://www.jma.go.jp/); Volcano Research Center (VRC), Earthquake Research Institute (ERI), University of Tokyo (URL: http://www.eri.u-tokyo.ac.jp/VRC/index_E.html); U.S. Air Force Weather Agency, Offutt AFB, NE 68113-4039, USA.
Ol Doinyo Lengai (Tanzania) — October 2002 Cite this Report
Ol Doinyo Lengai
Tanzania
2.764°S, 35.914°E; summit elev. 2962 m
All times are local (unless otherwise noted)
Lava exits crater at 3 points during January 2001-September 2002
In 2001-2002 the crater at Ol Doinyo Lengai has become filled with lava. The thin lava flows (nearly devoid of silica and extremely low viscosity) have begun to regularly spill over three points on the crater rim, descending hundreds of meters downslope. The crater, whose high ground was once considered suitable for camping, is no longer free from sudden inundation by lava. Activity through December 2000 was reported in BGVN 25:12.
This report chronicles many visits to the volcano between January 2001 and September 2002. Fred Belton compiled reports of multiple field parties during July 2001 and May-September 2002. Other visitors are noted in the text. Jörg Keller and Aoife McGrath contributed some observations, photos, a reference, and lab data on whole-rock chemistry.
Observations during January 2001. Paul Hloben contributed the following report. "We visited Lengai 15-17 January 2001. The place was very wet, and most of the soda coating the crater floor and cones had washed away or was in solution within the crater floor and cones. The entire crater was sandy brown and muddy (except recent lava flows, which were brown or gray and rock-hard). Older cones were just soil-brown in color, like gigantic termite mounds. [In contrast, in dry conditions, older lavas generally look white in color.] At that time only two cones were active . . . one nearest the camp site located at the path leading down the volcano."
"The [T51] cone was too high for lava flows (to escape) or for viewing what was happening inside, but we heard continuous blows every 10-20 seconds. Further on (towards the crater's center) there resided twin partially collapsed cones [newly developed features between T49 and T48, figure 71]. They harbored two active ponds (the lava level was ~1.5 m below the collapsed crust at the adjacent point of access and overview). The ponds were interconnected, with lava and gas surges occurring approximately every 20-30 seconds independently in each pond. The smaller pond (on the N) was ~1-2 m in diameter. The larger pond was about 4-5 m in diameter, but not easy to see due to heat blows that forced us to retreat; we could observe it best during the night as it was glowing."
Comparison of field maps indicates that the larger of the two adjacent ponds stood in an area later identified as T55 (figure 71). Apparently fresh flows had recently cooled and stopped. They crossed the outflow on the NW crater rim and descended hundreds of meters down the flanks.
Observations during June 2001. Bob Carson and a group of 18 from Whitman College used the guide services of Burra Ami Gadiye to access the summit on 28 June. Carson's report follows. "We climbed on 28 June 2001 and spent from about 0800 to 1245 in the active southern crater. The crater floor was covered with about twenty steep-sided spatter cones and countless pahoehoe flows (some of the longer flows are aa-like near their toes). Radial cracks on the young surface of the crater floor penetrate the older rocks of the crater rim.
"Spatter cone T40B had been active on 27 June, sending ~10-cm-thick pahoehoe flows ~10 m from the vent; access to moisture was turning the edges of the still-warm black natrocarbonatite flows white. Later a slightly explosive eruption spewed tiny glassy spheres of tephra (1-2 mm in diameter) onto the surface of the 27 June pahoehoe flows. Spatter cone T40B sounded like a steam engine for the entire time we were near the volcano's summit. From about 1130 to 1200 on 28 June this cone erupted spatter, throwing blobs of tar-looking lava about 2 m into the air; the blobs landed on the side of the spatter cone making lava stalactites and short pahoehoe flows so that the cone looked like a giant sand castle."
Observations during July 2001. A visit by Fred Belton, Roberto Carniel, Marco Fulle, Andrew Locock, and four others during 23-30 July 2001 revealed that most of the previous year's morphologic changes occurred in the NW third of the crater. For example, T51 was 12 m tall, twice the previous year's height. T51B represented a new spatter cone just SE of T51, that contained a low rim overhanging a pit crater. Another new cone (T53) stood ~40 m NW of T40, but was inactive. Comprising a ~4 m tall rounded cone, T53 contained a hooded cave feeding a solidified open lava lake and lava channels that had flowed N. T40 had grown several meters toward the W. T40C, also new, was a white-to-gray 5-m-tall cone just SW of T40. T49B was white with a rounded summit, standing ~6 m tall. T49C was a broad cone of about the same height; it was first noted by C. Weber in October 2000. The new feature T49D was slightly lower than T49B and had vertical sides ringed with shallow grooves. T49E, probably the newest vent, formed an oval, 15 x 6 m low-rimmed crater just below the N flank of T49C.
On 23 July, T49E contained a frothy lava lake that drained N through a lava channel and frequently overflowed its E rim. By 0630 on 24 July the lava lake's surface had completely crusted over. During the day T49E inflated as lava entered and pushed up its solid surface. Early on 25 July the lake's solid surface had been lifted nearly 1 m above its position of the previous evening. It made continuous cracking and popping noises, and small rocks fell from its rim as it became increasingly engorged with lava. Cracks abruptly opened in its NW side and released copious flows of fluid lava. The filling/draining cycle was repeated twice more that day and several times on 26 July. The most interesting event occurred at 1710 on 25 July when a 3 m section of T49E's side collapsed, releasing a sudden flood of fluid lava that swept large blocks up to 9 m from their original positions (figure 72).
During 27-28 July 2001 an eruption occurred that far exceeded the volume and duration of typical lava eruptions. Estimates of lava output were 5 m3/s during the greatest outflow and no less than 1 m3/s at anytime during the first 30 hours of the eruption. At 0630 on 27 July, pencil-wide streams of light gray, comparitively transparent lava flowed from T49E. T49E's lava output increased at 1113, and T49C erupted from its summit vent. At 1430 lava from those vents reached the NW crater rim overflow. Then, T49C ceased erupting, while T49D began to emit spatter from a small hole in its N side and T49B began to overflow from its summit vent. T49B developed a large dome fountain and T49D began ejecting a narrow fan of spatter at a 30° angle.
At 1510 the previously solid surface of T49E abruptly released fountains 1-2 m high, and T49C began erupting clots of spatter every 10 seconds. Thus, four vents were erupting simultaneously. Highly fluid lava flowed in meter-wide channels toward the NW, E, and S. Lava crossed the NW crater rim overflow and cascaded hundreds of meters down the NW flank of Lengai. Lava did not cross the E rim of Lengai because it flowed into a fissure in the crater floor ~25 m NW of the E rim overflow, at a rate of ~1 m3/s. About 1 hour later a vent opened on the E flank of Lengai ~12 m below the rim overflow area and released torrents of lava that flowed far down the flank and started brush fires. Destruction of a seismic station (established 4 m E of the fissure by Joshua Jones, Univ. of Washington) was narrowly averted thanks to the fissure's absorption of the lava flow and Carniel and Locock moving the equipment to a more secure location on the crater rim.
After sunset, spectacular orange fountains played steadily from T49B and T49D. Jets of incandescent gas appeared as flames 1-2 m high above the vent of T49C. By 0600 on 28 July the lava fountain from T49B was diminished but T49D continued to feed a large lava channel toward the E. Width of the channel exceeded 1 m, and depth of the fluid lava within it varied in the range 0.5-1 m. During all of 28 July lava flowed hundreds of meters down a gully on Lengai's E flank after emerging from the channel and the crater-floor fissure, both of which had been enlarged by thermal erosion. During the afternoon, the vigor of T49D's activity gradually diminished and its lava became increasingly frothy. Early on 29 July the eruption ceased and there was no further activity before observers left at 0715 on 30 July. J. Jones revisited the crater on 31 July and 6 August 2001 but saw no activity or fresh lava flows.
Observations during February-September 2002. During 3-7 February 2002, several members of the Societe de Volcanologie Geneve observed lava flows and strong fountains from the T49 complex and reported a new overflow of lava on the W crater rim (Bessard, 2002).
Aoife McGrath climbed the volcano on 26 May 2002 and reported continual small-scale eruptions at T49B. A new spatter cone had formed ~30 m SW of T49B and, according to mountain guide Burra Ami Gadiye, was about 4 months old.
During 18-22 June 2002, Christoph Weber, Jurgis Klaudius, and a film team observed the crater (figures 73 and 74). Fresh lava had flowed 120 m W from T49B and several recent 20-80 m flows originated from T46. Fresh lava was also seen on T37B, and fresh lapilli covered T48, a feature that was audibly active at depth. A new vent, designated T54, was visible between T46 and the W-rim overflow. It was an open solidified lava pond with a 40 m overflow to the W, which covered flows that had passed over the W rim in February 2002. Since August 2001, the diameter of the T49 complex had greatly increased, and there were more and hotter (>125°C) fumaroles in the crater. During this visit, spatter cones T49D, T51B, and T52C were no longer visible.
During a five-hour period on 18 June lava spattered up to 3 m above the top of T49B (figure 75) and produced a 50-m lava flow to the NE. On 19 June spattering from T49B occurred several times until 1615, after which no further activity was seen through 22 June. On 22 June the team witnessed a ~10 m3 section of the crater wall in an area below the summit collapse into the crater. On each day there were 2-3 discrete tremors of about 1-cm amplitude, accompanied by gunshot sounds. They were distinctly different events from the continuous tremors caused by subsurface lava movement.
During the first half of July 2002 Jörg Keller was working near Lengai. He noted that until his departure on 14 July, a number of visitors returning from the summit reported either no activity or slight spattering from two cones.
During 4-9 August 2002, Fred Belton, Sven Dahlgren, Jeff Brown, and seven others observed four new spatter cones that had formed between 22 June and 4 August. One of these new cones was T55. Inactive when visited, T55 formed a white cone under 2 m tall containing a wide crater. T56, black and active, was ~7 m tall including a distinctive thin spire rising ~2 m above the summit. T57, ~4 m tall, was partly black but inactive. T57B stood ~7 m tall and was covered by fresh black lava. T54, documented by Weber on 21 June, had disappeared. Older cones such as T37B, T49B, and T49C had grown significantly since 2001 and towered above the N half of the crater rim.
Throughout the visit, T57B ejected clots of lava, expelled loud gas puffs, and produced thick clinkery aa flows. T56 spattered intermittently, T48 erupted pahoehoe lava from vents near its NW base, and T44 and T46 also produced spatter and a few short flows.
At around noon on 4 August a new vent, T49F, abruptly opened in rough, steaming ground near the W base of T49B. The eruption began with noisy ejection of spherical lapilli to a height of ~7 m and fluid lava to a height of 1 m. Throughout the day, the vent erupted at intervals of 1-2 hours, ejecting clouds of lapilli and forming aa lava flows that moved slowly W and NW to the crater rim area. Around 0200 on 5 August T49F eruptions dramatically increased in height and volume. Fountains played to at least 15 m and produced a flood of fluid pahoehoe that flowed W with great speed, destroying a supply camp. Similar eruptions continued for the next 28 hours, at first about two hours apart with gradually lengthening periods of repose between eruptions.
A typical T49F eruption consisted of lava first flowing or spattering from the low, open vent, then the abrupt onset of violent fountains that played for 2-4 minutes to a height of 10-15 m at a ~60° angle toward the W, and finally a decrease in fountain height and the draining of lava back into the vent. The final draining accompanied loud noises that to J. Brown sounded like "sheet metal being bent." By the afternoon of 5 August the site of the supply camp was under at least 1 m of thick pahoehoe slabs. The area just W of the vent was more than ankle deep in 2-8-mm-diameter spherical lapilli. Three vigorous fountaining episodes at T49F the night of 5 August started brush fires along the W crater rim. After dawn on 6 August, T49F's activity gradually waned, completely stopping by evening.
On 7 and 8 August T49F was completely inactive, thin pahoehoe lava flowed from T48, and T57B produced meter-thick clinkery aa flows. In the central crater there was an exceptionally strong smell of sulfur that at times made breathing uncomfortable, continuous low-pitched audible vibrations, and frequent hard bumps and tremors underfoot, especially near T57B and T56.
At about 2300 on 8 August a fissure ~12 m in length opened between T52B and T56 and began erupting a curtain of fire 6-8 m high with nearly continuous violent explosions. After midnight observers began to see an elongated spatter cone containing an extremely vigorous lava lake, whose surface rose ~0.3 m/hour. The new cone (T58) gradually merged with the flanks of T52B and T56. By 0830, T58 was over 2 m tall and its lava lake measured ~5 x 9 m. Lava bubbles over 2 m in diameter burst every 1-3 seconds and the activity showed no sign of abating when observers left at 0830 on 9 August. A photo from 17 August by Jean Bahr documented that T58 had grown to ~10 m in height and had a wide circular summit vent.
On 26 September 2002, Celia Nyamweru and twenty St. Lawrence University students visited the crater during 0630-0830. Lava spattered from T55 at 10-20 second intervals. Highly fluid pahoehoe lava emerged from the lower N slope of T49 and moved across other recent flows, probably from the previous night, which had passed between T40 and T40C and partially surrounded T53. Lava had accumulated against the N wall of the crater rim (then only 5 m high) and was heard flowing into a crack in the wall. The visitors could not see where the lava was going, but the next morning (27 September) as they were leaving the area by road a grass fire (started by lava?) was visible on the cone's upper NW slope. A local Maasai woman said that she had heard a loud noise from the volcano in the night. However, no activity was visible from the lowland N of Lengai.
Nyamweru's team observed one big crack, with steam, sulfur fumes, and black and yellow staining, running NW across the NW crater floor near T53. Other cracks on the NE floor were up to 30 or 40 cm wide and ran into cracks in the crater wall that were not steaming. The cones T26, T27, and T30 were still visible at the base of the S crater wall, surrounded by younger but deeply weathered lavas. The rim of T30 was less than 3 m above the lava surface, but its circular pit was still very well defined. In the NE segment of the crater floor a big blocky flow, brown and crumbly, bordered the NE wall for a considerable distance. It may have originated from T57 or T57B. Many cones from all parts of the crater were gently emitting steam, including T51, T45, T37, T30, and T47. The SE crater floor was very heavily weathered, with no sign of any fresh lava. There were a couple of patches of ground (each a shallow depression about 50 m2) that seemed to be the sites of former standing water. The depressions were floored with very fine pale brown clay/mud, which showed some fine layers and some areas with polygonal cracks. This seemed to be 'sediment' washed off the weathered lava by rain.
The most striking features of the topography were the extent to which the central crater floor has been built up. Except for the big wall to the S that rises to the summit, the topographic expression of the outer crater wall has diminished considerably (table 3). This impression was reinforced on 27 September when at a point about 10 km E of Lengai, they could look back and see the tops of several spatter cones showing above the eastern crater wall.
Table 3. Lava escaped Ol Doinyo Lengai's summit crater at three spots on the rim descending over the NW, E, and W sides. Visitors to the summit recorded these widths at each of the crater outlets. Courtesy of C. Nyamweru and F. Belton.
| Date |
Location |
Overflow width (m) |
| 30 Jul 2001 |
NW rim |
106 |
| 30 Jul 2001 |
E rim |
33 |
| 26 Sep 2002 |
NW rim |
135 |
| 26 Sep 2002 |
E rim |
39 |
| 26 Sep 2002 |
W rim |
12 |
Jörg Keller provided photographs showing the evolution of the crater from 1988 through the present, emphasizing the progressive upward growth of the crater floor (figure 76). The sequence shows how the volcano has reached a critical stage where extremely fluid lavas can pour down the flanks.
Whole-rock chemistry. Lengai's lavas have been analyzed by several techniques. High-precision XRF (x-ray fluorescence) analyses (table 4) were cross-checked and confirmed with ICP and ICP-MS (inductively coupled plasma and inductively coupled plasma mass spectrometer) instruments. The geochemistry of these lavas are of interest because of their unusual low-silica natrocarbonatite compositions.
Table 4. Natrocarbonatite compositions at Ol Doinyo Lengai for lavas erupted in 1988, 1995, and 2000. Analyses were by XRF. * From Keller and Krafft, 1990. Courtesy of Jürg Keller and Aoife McGrath.
| Sample |
OL 102* |
OL 122 |
OL 148 |
| Eruption Date |
1988 |
1995 |
2000 |
| SiO2 |
0.16 |
0.53 |
0.24 |
| TiO2 |
0.02 |
0.02 |
0.02 |
| Al2O3 |
b.d. |
0.13 |
0.01 |
| Fe2O3t |
0.28 |
0.91 |
0.37 |
| MnO |
0.38 |
0.39 |
0.46 |
| MgO |
0.38 |
0.39 |
0.46 |
| CaO |
14.02 |
16.25 |
14.61 |
| SrO |
1.42 |
1.4 |
1.42 |
| BaO |
1.6 |
1.25 |
1.71 |
| Na2O |
32.22 |
32.22 |
32.64 |
| K2O |
8.38 |
7.52 |
8.41 |
| P2O5 |
0.85 |
0.93 |
0.72 |
| CO2 |
31.55 |
32.7 |
30.9 |
| Cl |
3.4 |
3.16 |
4.53 |
| SO3 |
3.72 |
2.23 |
2.35 |
| F |
2.5 |
2.57 |
3.47 |
| H2O |
0.56 |
0.01 |
0.01 |
| - O = F, Cl |
-1.82 |
-1.91 |
-2.48 |
| Total |
99.62 |
100.7 |
99.85 |
Safety warnings. Deep radial cracks in the crater floor present a serious risk to visitors walking in the crater of Ol Doinyo Lengai, especially at night. Some of the cracks may be hidden by thin lava flows. Protective eyeglasses should be worn near any type of activity. In 2001 an observer without glasses was hit in one eye by spatter and escaped serious injury because his eye was closed at the moment of impact. He sustained second-degree burns on both eyelids.
Camping inside the active N crater has become much more dangerous due to increased crater floor steepness that allows lava from the central spatter cones to reach the crater rim very quickly. Around 0200 on 5 August 2002, fluid pahoehoe lava from the T49F vent destroyed a supply camp and injured Paul Mongi, a Tanzanian guide. One of Belton's websites gives credit to guides like Mongi, who have aided numerous visitors. (Mongi has recovered from second-degree burns on one foot, sustained when lava ignited his sleeping bag.) Lava invaded the camp in spite of a small ridge separating the camp from the crater floor. No location in the active crater is safe from lava flows. Sudden outbreaks of explosive lava fountains are also a serious risk. On 8 August 2002 two observers walked across the site of the T58 fissure eruption little more than an hour before the activity began. Contributors recommended that camps be set up in the inactive S crater, a 15 minute walk away.
References. Keller, J., and Krafft, M., 1990, Effusive natrocarbonatite activity of Oldoinyo Lengai, June 1988, Bulletin of Volcanology, v. 52, no. 8, p. 629-645.
Bessard, Yves, 2002, Ol Doinyo Lengai: Société de Volcanologie-Geneve (SVG), no. 22 (April 2002), p. 2-10 (URL: http://www.volcans.ch/).
Geologic Background. The symmetrical Ol Doinyo Lengai is the only volcano known to have erupted carbonatite tephras and lavas in historical time. The prominent stratovolcano, known to the Maasai as "The Mountain of God," rises abruptly above the broad plain south of Lake Natron in the Gregory Rift Valley. The cone-building stage ended about 15,000 years ago and was followed by periodic ejection of natrocarbonatitic and nephelinite tephra during the Holocene. Historical eruptions have consisted of smaller tephra ejections and emission of numerous natrocarbonatitic lava flows on the floor of the summit crater and occasionally down the upper flanks. The depth and morphology of the northern crater have changed dramatically during the course of historical eruptions, ranging from steep crater walls about 200 m deep in the mid-20th century to shallow platforms mostly filling the crater. Long-term lava effusion in the summit crater beginning in 1983 had by the turn of the century mostly filled the northern crater; by late 1998 lava had begun overflowing the crater rim.
Information Contacts: Fred Belton, Developmental Studies, Middle Tennessee State University, Murfreesboro, TN 37132, USA (URL: http://oldoinyolengai.pbworks.com/); Paul Hloben, P.O. Box 71860, Bryanston 2021, South Africa; Bob Carson, Department of Geology, Whitman College, Walla Walla, WA 99362, USA; Burra Ami Gadiye, c/o Sengo Safari Tours, P.O. Box 207, Arusha, Tanzania, Africa; Roberto Carniel, Dip. Georisorse e Territorio, Universita' di Udine Via Cotonificio, 114-33100 Udine, Italy (URL: http://www.swisseduc.ch/stromboli/); Sven Dahlgren, Fylkeshuset, Svend Foynsgt 9, 3126 Tonsberg, Norway; Marco Fulle, Osservatorio Astronomico, Via Tiepolo 11, I-34131 Trieste, Italy (URL: http://www.swisseduc.ch/stromboli/); Jörg Keller, Universitaet Freiburg, Albertstr. 23b, D-79104 Freiburg, Germany; Aoife McGrath, Senior Exploration Geologist, Geita Gold Mine, P.O. Box 532, Geita, Mwanza, Tanzania; Jurgis Klaudius, Institut für Mineralogie, Petrologie und Geochemie, Albertstr. 23 B, 79104 Freiburg, Germany; Andrew Locock, Dept. of Civil Engineering and Geological Sciences, University of Notre Dame, Notre Dame, IN 46556, USA; Celia Nyamweru, Dept. of Anthropology, St. Lawerence University, Canton, NY 13617, USA (URL: http://blogs.stlawu.edu/lengai/); Joshua Jones, Department of Earth & Space Sciences, Box 351310, Seattle, WA 98195-1310, USA; Jean M. Bahr, University of Wisconsin-Madison, Dept. of Geology & Geophysics, 411 Weeks Hall, 1215 W Dayton St. Madison, WI 53706, USA (URL: http://geoscience.wisc.edu/geoscience/people/faculty/jean-bahr/); Christoph Weber, Volcano Expeditions International, Muehlweg 11, 74199 Untergruppenbach, Germany (URL: http://www.Vulkanexpeditionen.de/).
Nyamulagira (DR Congo) — October 2002 Cite this Report
Nyamulagira
DR Congo
1.408°S, 29.2°E; summit elev. 3058 m
All times are local (unless otherwise noted)
Multi-vent eruption, 25 July-27 September 2002; regional earthquake
An eruption began at Nyamuragira on 25 July 2002 (BGVN 27:07). Flights on 1 and 3 August confirmed that the eruption was continuing at a high rate, but another look on 27 September showed that the eruption had ceased. An unusually large earthquake (Mw 6.1-6.2) and its aftershock (Mw 5.5) struck the region on 24 October 2002.
During 6-8 August a team composed of scientists from the Goma Volcano Observatory (GVO) (Kaseraka Mahinda and François Lukaya) and a UN-OCHA consultant volcanologist (Jacques Durieux) made a survey trip to the active eruption site of Nyamuragira. The team landed by helicopter in the summit caldera, reached the eruption site by foot, and spent 24 hours on the scene.
The team saw the eruption at 0330 on 25 July with lava venting at 3 different fractures, or fracture systems. One fracture was open in the central caldera, and lava flows had covered a major part of the floor and partially filled the pit crater (Crater B). Another fracture was active on the S flank, with lava fountains and one lava flow traveling towards the SW. This fracture was active during the first hours of the eruption only.
N-flank fractures had opened and extended for ~2 km, reaching from the crater rim (2,959 m) down to an elevation of ~2,540 m. At the beginning of the activity, lava fountains appeared along the fractures and spatter accumulated around them. Numerous lava flows (pahoehoe and aa) were emitted from several points of the fracture system. Both the fountaining and the presence of multiple fissure vents followed Nyamuragira's usual eruptive pattern.
On 6 August only the lower part of the fracture was active; a cone (several hundreds meters long, ~70 m high) contained three very active lava fountains ejecting scoria to an altitude of ~100 m. From a breach in the lowest part of the cone (on the S), very fast moving lava flowed NE. At that time the lava extrusion rate was ~3 x 10⁶ m3 per day, a typical value at this volcano. The activity of fountaining and lava emission regained some intensity at the beginning of the night but dropped dramatically during the early morning of 7 August. At that time, only one weak lava fountain remained active in the new crater. Decreasing tremor registered across GVO's seismic network, and low tremor prevailed on the morning of 8 August.
An overflight on 27 September confirmed the end of this eruptive episode when observers failed to see any still-active lava flow and the eruptive cones displayed only fumaroles. At that time, however, weak tremor still consistently registered, with slightly less at Nyamuragira (Katale station) than at Nyiragongo (Rusayo station). Nyamuragira also was the scene of a greater number of high frequency (HF) and long-period (LP) earthquakes.
A large tectonic earthquake (Mw 6.1-6.2; mb 5.8; Ms 6.3), one of the two largest in at least 30 years, occurred on 24 October. A second large-magnitude event (Mw 5.5) occurred about an hour later. For further details on these events, see the text and tables in the section "Regional seismicity" within the report on Nyiragongo in this Bulletin.
Geologic Background. Africa's most active volcano, Nyamulagira (also known as Nyamuragira), is a massive high-potassium basaltic shield about 25 km N of Lake Kivu and 13 km NNW of the steep-sided Nyiragongo volcano. The summit is truncated by a small 2 x 2.3 km caldera that has walls up to about 100 m high. Documented eruptions have occurred within the summit caldera, as well as from the numerous flank fissures and cinder cones. A lava lake in the summit crater, active since at least 1921, drained in 1938, at the time of a major flank eruption. Recent lava flows extend down the flanks more than 30 km from the summit as far as Lake Kivu; extensive lava flows from this volcano have covered 1,500 km2 of the western branch of the East African Rift.
Information Contacts: Kasereka Mahinda and François Lukaya, Goma Volcano Observatory, Departement de Geophysique, Centre de Recherche en Sciences Naturelles, Lwiro, D.S. Bukavu, DR Congo; Jacques Durieux, Resident Volcanologist, United Nations Office for the Coordination of Humanitarian Affairs (OCHA), United Nations, New York, NY 10017 USA (URL: https://reliefweb.int/).
Nyiragongo (DR Congo) — October 2002 Cite this Report
Nyiragongo
DR Congo
1.52°S, 29.25°E; summit elev. 3470 m
All times are local (unless otherwise noted)
New fissure vents and lava fountains; largest regional earthquake in 30 years
An expedition visited the summit of Nyiragongo during 17-18 May 2002 to look for possible extrusive activity (BGVN 27:05). During the visit, a small lava fountain was observed on the floor of the crater.
A team ascended to the summit by foot during 16-17 July 2002. As they climbed the team first observed a gray-black plume at 2,700 m elevation, and began to clearly smell SO2 at 3,100 m. From the crater rim (3,425 m) the inner crater was only partially visible because of dense fog and the dark plume. Sounds of molten lava (fountains and spatters) falling on rocks were heard. Despite the extremely poor visibility, it was possible, around 0600, to witness some lava fountaining. The height was estimated as 100 m above the crater floor. During the night, a continuous and strong ashfall affected the upper part of the volcano. On the morning of 17 July the ashfall had ended and only a white plume exited the crater. It was clear that the lower and central part of the crater was extremely active and the presence of a new lava lake was suspected.
On 20 July, the Goma Volcano Observatory (GVO) reported that during the previous weeks, episodes of tremor (some lasting for 23 hours per day) were recorded on several seismic stations around the volcano. Because of poor atmospheric conditions, no helicopter flights were organized. From very limited views through clouds, a white to gray plume was suspected to rise above the crater.
A series of Nyiragongo crater observations were made in September and October of 2002. During 29-30 September the level of the bottom of the crater was stable and occupied by accumulated debris. The crater also contained several vents, the largest of which continued to eject gases at very high pressure. The red coloration of the plume at night was attributed by the GVO to Strombolian explosions and combustion of gases. Burned plants were seen on the crater's E side. An 8 October flight found the crater to be entirely filled by visible vapor as a result of magma degassing. An 11 October flight revealed a new crack at the top of Nyiragongo (at 01°36.840' S and 029°14.505' E), trending in an E-W direction. Scientists conducted gas measurements on 12 October on the ground at Kibunga (Binza); the sampled gases lacked indications of deep origin.
Dario Tedesco indicated that during the two nights preceding a large earthquake on 24 October (see "Regional seismicity" below), incandescence was visible above Nyiragongo's crater from Goma. Witnesses also reported that around this time they saw projections of incandescent lava rising above the crater's confines (perhaps signifying a particularly intense episode of lava fountaining).
Regional seismicity. During 29 September-5 October, GVO noted a slight decrease in high-frequency (HF) and a strong increase in long-period (LP) seismicity compared to mid-August. Specifically, a total of 260 HF and 1,024 LP earthquakes occurred during the week (compared to 290 HF and 287 LP events during 18-24 August). Volcanic tremor was registered at all seismic stations (except in Lwiro), consistent with the eruption at Nyamuragira and a gas plume at Nyiragongo. The tremor was slightly less significant at Nyamuragira (Katale station) than at Nyiragongo (Rusayo station). The spatial distribution of the epicenters revealed that the LP earthquakes were mostly located in the vicinity of Nyamuragira. In contrast, HF epicenters were dispersed, occurring both in the N, at Virunga and Masisi, and in the S, at Lake Kivu. Located magmatic and HF earthquakes tended to be distributed to the E of Nyamuragira and Nyiragongo, at depths of 5-15 km. Tremor, practically constant in amplitude, duration (several hours per day), and temporal distribution, registered at Katale and Rusayo stations. The tremor was taken to indicate great activity at Nyamuragira and Nyiragongo. At each volcano, there was a negative correlation between the abundance of tremor and presence of LP swarms.
During 6-12 October, GVO noted a total of 342 HF and 996 LP earthquakes. Magmatic and HF earthquakes at Nyamuragira and Nyiragongo yielded hypocenters at 5-20 km depths. Other observations of seismicity were similar to the previous week.
A tectonic earthquake was felt in Goma and surrounding areas on 8 October 2002. The region had been the scene of an unusual number of recent earthquakes (table 4). The U.S. Geological Survey's National Earthquake Information Center (NEIC) catalog for 2002 included an anomalously large swarm of tectonic earthquakes in the area, including many events over M 4 during January 2002. Epicenters in the January swarm were commonly within 50 km, and in one case 6 km, of Nyiragongo. The 8 October earthquake mentioned above is absent from table 4, perhaps because of insufficient magnitude or depth.
Table 4. A list containing all earthquakes of M 2 or greater within 200 km of Nyiragongo during 1 January 2002-26 November 2002. Data courtesy of US Geological Survey, National Earthquake Information Center (NEIC) catalog of historical and preliminary data; Bruce Presgrave (NEIC) first noted the anomalously large number of earthquakes in January 2002. Magnitudes include mb, Ms, Mw, and Mn; all are computed magnitudes (where available). Moment magnitude (Mw) is a preferred magnitude scale for large earthquakes; it is in common use, computed from a long-period body- and mantle-wave moment tensor-inversion method. Surface-wave magnitude (Ms) is computed from the vertical component of surface waves of 20-second period; Ms does not increase beyond magnitude 8, and thus indicates smaller values than some other magnitude scales for large earthquakes (not a big factor here). Body-wave magnitude (mb) is computed using short-period P waves; for large natural earthquakes it is generally less uniform and reliable than the moment magnitude. The Mn magnitude, sometimes labeled MbLg, is computed from the vertical component of 1-second Lg seismic-waves (short-period surface waves).
| Date |
Coordinates (decimal degrees) |
mb |
Ms |
Other magnitude |
Radial distance (km) |
| 04 Jan 2002 |
0.136°S, 29.758°E |
4.8 |
4.5 |
-- |
162 |
| 17 Jan 2002 |
1.629°S, 29.152°E |
4.3 |
-- |
4.30 Mn |
16 |
| 17 Jan 2002 |
1.684°S, 29.077°E |
4.7 |
-- |
4.90 Mn |
26 |
| 18 Jan 2002 |
1.578°S, 29.031°E |
4.2 |
-- |
4.70 Mn |
25 |
| 18 Jan 2002 |
1.780°S, 29.076°E |
4.3 |
-- |
4.70 Mn |
34 |
| 18 Jan 2002 |
1.662°S, 28.866°E |
4.2 |
-- |
-- |
45 |
| 19 Jan 2002 |
1.761°S, 28.969°E |
3.9 |
-- |
4.40 Mn |
41 |
| 19 Jan 2002 |
1.931°S, 29.579°E |
4.6 |
-- |
4.70 Mn |
58 |
| 19 Jan 2002 |
1.879°S, 29.059°E |
4.2 |
-- |
4.40 Mn |
44 |
| 20 Jan 2002 |
1.681°S, 28.981°E |
4.9 |
4.6 |
5.20 Mn |
34 |
| 20 Jan 2002 |
1.641°S, 29.042°E |
3.9 |
-- |
4.40 Mn |
26 |
| 20 Jan 2002 |
1.599°S, 29.050°E |
4.2 |
-- |
4.60 Mn |
23 |
| 20 Jan 2002 |
1.726°S, 29.168°E |
3.8 |
-- |
4.20 Mn |
24 |
| 21 Jan 2002 |
1.726°S, 28.854°E |
4.6 |
-- |
4.90 Mn |
49 |
| 21 Jan 2002 |
1.505°S, 28.941°E |
4.2 |
-- |
4.50 Mn |
34 |
| 21 Jan 2002 |
1.776°S, 29.041°E |
4.9 |
4.5 |
5.10 Mn |
36 |
| 21 Jan 2002 |
1.903°S, 29.117°E |
4.7 |
-- |
5.10 Mn |
44 |
| 22 Jan 2002 |
1.787°S, 28.971°E |
4.0 |
-- |
4.30 Mn |
42 |
| 22 Jan 2002 |
1.746°S, 29.095°E |
3.9 |
-- |
4.50 Mn |
30 |
| 22 Jan 2002 |
1.515°S, 28.993°E |
4.9 |
4.7 |
5.20 Mn |
28 |
| 22 Jan 2002 |
1.551°S, 28.995°E |
4.4 |
-- |
4.70 Mn |
28 |
| 22 Jan 2002 |
1.461°S, 29.249°E |
4.2 |
-- |
4.60 Mn |
6 |
| 30 Jan 2002 |
1.633°S, 28.886°E |
-- |
-- |
4.60 Mn |
42 |
| 11 Feb 2002 |
1.386°S, 29.010°E |
4.4 |
-- |
-- |
30 |
| 09 Sep 2002 |
2.567°S, 28.867°E |
4.5 |
-- |
-- |
123 |
| 24 Oct 2002 |
1.899°S, 28.904°E |
5.8 |
6.3 |
6.10-6.20 Mw |
56 |
| 24 Oct 2002 |
1.988°S, 28.875°E |
5.3 |
5.5 |
5.50 Mw |
66 |
A violent earthquake (Mw 6.1-6.2), one of the two largest in at least 30 years in this area, occurred at 0808 on 24 October (table 4). GVO reported that it was felt in surrounding areas, including Rutshuru, Goma, Bukavu, Butare, Kigali, and Bujumbura. GVO's seven operating seismic stations (Lwiro, Goma, Kunene, Katale, Kubumba, Rusayo, and Bulengo) recorded the earthquake but the high amplitude of the signals caused saturations, thwarting attempts to use local data to obtain rapid, meaningful solutions for seismic parameters. A second large-magnitude event (Mw 5.5) occurred about an hour later. Both earthquakes struck SW of Nyiragongo, at distances of 56 and 66 km (tables 4 and 5).
Table 5. A list containing earthquakes of M 5 or greater located within 300 km of Nyiragongo during 1 January 1973-26 November 2002. Earthquake depths were typically ~10-33 km. Data courtesy of US Geological Survey, National Earthquake Information Center (NEIC) catalog of historical and preliminary data. See the previous table caption for a discussion of the magnitude types.
| Date |
Coordinates (decimal degrees) |
mb |
Ms |
Other magnitude |
Radial distance (km) |
| 21 Nov 1973 |
3.607°S, 28.186°E |
5.1 |
-- |
-- |
258 |
| 25 Apr 1974 |
0.995°N, 30.091°E |
5.0 |
-- |
-- |
292 |
| 06 Jan 1977 |
2.509°S, 28.702°E |
5.3 |
-- |
-- |
124 |
| 14 Apr 1977 |
2.456°S, 28.940°E |
5.2 |
-- |
-- |
108 |
| 29 Dec 1977 |
0.013°S, 29.683°E |
4.8 |
5.4 |
-- |
175 |
| 29 Jan 1978 |
3.929°S, 29.350°E |
5.3 |
-- |
-- |
266 |
| 25 Oct 1979 |
3.412°S, 29.070°E |
5.2 |
-- |
-- |
209 |
| 09 Jan 1980 |
3.445°S, 27.442°E |
5.0 |
4.6 |
-- |
292 |
| 21 May 1981 |
2.698°S, 28.661°E |
5.0 |
-- |
-- |
145 |
| 20 Jul 1981 |
2.709°S, 28.461°E |
5.0 |
4.0 |
-- |
157 |
| 09 Jan 1982 |
1.671°S, 28.338°E |
5.0 |
-- |
-- |
102 |
| 03 Jul 1982 |
3.737°S, 28.951°E |
5.2 |
-- |
-- |
246 |
| 04 Jul 1982 |
3.778°S, 28.917°E |
5.0 |
-- |
-- |
251 |
| 15 Jan 1983 |
0.513°N, 30.199°E |
5.2 |
4.1 |
-- |
247 |
| 24 Sep 1983 |
1.563°S, 28.381°E |
5.2 |
-- |
-- |
96 |
| 04 Sep 1990 |
0.479°S, 29.085°E |
5.0 |
5.0 |
-- |
116 |
| 18 Sep 1990 |
4.060°S, 29.483°E |
5.0 |
4.3 |
-- |
281 |
| 05 Feb 1994 |
0.593°S, 30.037°E |
5.8 |
6.0 |
6.20 Mw |
249 |
| 29 Apr 1995 |
1.315°S, 28.605°E |
5.1 |
4.9 |
-- |
75 |
| 24 Mar 1996 |
0.565°N, 30.169°E |
5.0 |
-- |
5.40 Mw |
251 |
| 02 Mar 2000 |
2.582°S, 27.826°E |
5.4 |
4.5 |
-- |
196 |
| 02 Mar 2000 |
2.371°S, 28.026°E |
5.0 |
4.1 |
-- |
165 |
| 29 Jun 2001 |
0.292°N, 29.972°E |
5.0 |
4.4 |
5.30 Mw |
215 |
| 20 Jan 2002 |
1.681°S, 28.981°E |
4.9 |
4.6 |
-- |
34 |
| 21 Jan 2002 |
1.776°S, 29.041°E |
4.9 |
4.5 |
5.10 Mn |
36 |
| 21 Jan 2002 |
1.903°S, 29.117°E |
4.7 |
-- |
5.10 Mn |
44 |
| 22 Jan 2002 |
1.515°S, 28.993°E |
4.9 |
4.7 |
5.20 Mn |
28 |
| 24 Oct 2002 |
1.899°S, 28.904°E |
5.8 |
6.3 |
6.10-6.20 Mw |
56 |
| 24 Oct 2002 |
1.988°S, 28.875°E |
5.3 |
5.5 |
5.50 Mw |
66 |
Soon after the earthquakes, a GVO team measured the temperature and composition of gas released from fractures on the S flank of Nyiragongo and along the N shore of Lake Kivu. No significant changes were found with respect to the measurements taken in the previous days.
Damage was reported at Bukavu (fissures in house walls), Lwiro (some houses destroyed, roof of the seismic station collapsed, and walls of laboratories fissured), Mugeri (a church destroyed), Goma (several house walls fissured, and a truck accident killed two people), and Kigali (walls of several houses fissured, and a school wall collapsed, causing panic).
Since earthquakes commonly occur and are expected to occur again in the future in the active rift, GVO recommended an education campaign discussing seismic hazards and response related to Africa's Great Lakes region.
Geologic Background. The Nyiragongo stratovolcano contained a lava lake in its deep summit crater that was active for half a century before draining catastrophically through its outer flanks in 1977. The steep slopes contrast to the low profile of its neighboring shield volcano, Nyamuragira. Benches in the steep-walled, 1.2-km-wide summit crater mark levels of former lava lakes, which have been observed since the late-19th century. Two older stratovolcanoes, Baruta and Shaheru, are partially overlapped by Nyiragongo on the north and south. About 100 cones are located primarily along radial fissures south of Shaheru, east of the summit, and along a NE-SW zone extending as far as Lake Kivu. Many cones are buried by voluminous lava flows that extend long distances down the flanks, which is characterized by the eruption of foiditic rocks. The extremely fluid 1977 lava flows caused many fatalities, as did lava flows that inundated portions of the major city of Goma in January 2002.
Information Contacts: Kavotha Kalendi Sadaka, Celestin Kasereka, Jean-Pierre Bajope, Mathieu Yalire, and Paolo Papale, Goma Volcano Observatory, Departement de Geophysique, Centre de Recherche en Sciences Naturelles, Lwiro, D.S. Bukavu, DR Congo; Jacques Durieux, Dario Tedesco, and Jack Lockwood, Groupe d'Etude des Volcans Actifs, 6, rue des Razes, 69320 Feyzin, France; Bruce Presgrave, National Earthquake Information Center, P.O. Box 25046, MS 966, Lakewood, CO 80225, USA (URL: https://earthquake.usgs.gov/); United Nations Office for the Coordination of Humanitarian Affairs (OCHA), United Nations, New York, NY 10017, USA (URL: https://reliefweb.int/).
Panarea
Italy
38.638°N, 15.064°E; summit elev. 399 m
All times are local (unless otherwise noted)
Increased submarine fumarolic activity near Panarea Island
On 3 November 2002, fishermen reported strong exhalative phenomena in the Lisca Bianca-Bottaro-Lisca Nera area, E of Panarea Island (figure 1). They described boiling seawater, dead fish, and an intense sulfur smell. On 4 November, scientists of the Istituto Nazionale di Geofisica e Vulcanologia (INGV) carried out aerial and sea surveys between Panarea and the Lisca Bianca-Dattilo-Bottaro islets from a Civil Protection helicopter and a Coast Guard boat.
In three distinct areas between Lisca Bianca and Lisca Nera (figure 2), discolored water was visible, accompanied by intense gas bubbling. The first area, located W of Lisca Bianca, had three distinct degassing points in which bubbles with diameters of some meters reached the sea surface. A second area stretched SSE from W of Bottaro; on the sea surface there was only one point where vigorous outbursts of meter-sized bubbles were noted (figure 3). The third and smallest area was just SW of the second one. Water depths in all three areas are shallower than 30 m.
During the preliminary survey, INGV scientists recorded thermal images of the sea surface. Direct pH and temperature measurements were carried out at different depths, and seawater samples were collected. Neither temperature measurements nor thermal images identified appreciable thermal anomalies, because water temperatures (22-23°C) near the degassing points were similar to those close to the island's pier. Conversely, pH values were about 5.6-5.7, significantly lower than typical seawater values.
A field survey was also carried out in the Calcara Beach area, where fumarolic activity has been known since the Roman Age. No anomalies were detected in either the fumarolic flux or in the measured temperature (100°C). Finally, field and aerial surveys were performed in order to exclude the occurrence of ground fissuring or other related anomalous phenomena on Panarea Island.
On 5 November the aerial survey highlighted a remarkable decrease in the intensity of exhalation activity and a sharp reduction of the area affected by water discoloration. In particular, gas bubbling was restricted to the area W of Bottaro. Repeated thermal investigations did not find any significant anomaly. Vigorous bubbling and water discoloration further decreased in the following days.
Seismicity. In the early morning on 3 November the INGV seismic station PAN recorded a swarm of microseisms close to Panarea. PAN, in the E part of the island, is equipped with a 1-Hz vertical seismometer. Although isolated micro-events were recorded beginning at 0253 GMT, the most intense phase of the swarm, in terms of number of events, occurred between 0337 and 0500 GMT. During the swarm, geophysicists noted some hundreds of micro-events with average durations of 8 seconds and magnitudes generally less than 1. After the climax, isolated events continued. Overall, there were a few events with magnitudes between 1 and 1.5; it was impossible to locate their hypocenters because they were not detected at stations more distant from the island. According to S-P arrival time differences, the source could lay within a radius of 2-3 km from the island. The spectrum of the events analyzed shows a broad frequency content, with dominant peaks from 5 to 16 Hz.
Background. Panarea, the smallest island of the Aeolian volcanic arc in the Southern Tyrrhenian Sea, is located ~30 km SW of Stromboli. Panarea is a cone-shaped edifice rising from 1,700 m below sea level to 421 m at Punta del Corvo peak. The subaerial portion of the island was built by prevailing effusive activity and emplacement of domes from 149 to 124 Ka (Calanchi et al., 1999). A second stage, during which pyroclastic activity prevailed, occurred between 59 and 13 Ka (Losito, 1989). As of November 2002 the only volcanic activity consists of a broad fumarolic field in a submarine crater, whose rim is inferred by the semicircular distribution of the islets of Dattilo, Lisca Bianca, Bottaro, and Lisca Nera (Gabbianelli et al., 1990, Italiano and Nuccio, 1991). Panarea and the Aeolian Islands are monitored by the Istiuto Nazioanle di Geofisica e Vulcanologias, Sezz. Catania and Palermo.
References. Calanchi, N., Tranne, C.A., Lucchini, F., Rossi, P.L., and Villa, I.M., 1999, Explanatory notes to the geological map (1:10000) of Panarea and Basiluzzo islands (Aeolian arc. Italy): Acta Vulcanologica, v. 11, no. 2, p. 223-243.
Gabbianelli, G., Gillot, P.Y., Lanzafame, G., Romagnoli, C., and Rossi, P.L., 1990, Tectonic and volcanic evolution of Panarea (Aeolian Islands, Italy): Marine Geology, v. 92, p. 313-326.
Gabbianelli, G., Cortecci, G., Capra, A., Giacomelli, L., Pompilio, M., and Rossi, P.L., 1996, Lineamenti geo-vulcanologici ed ambientali del'area craterica sottomarina di Dattilo-Lisca Bianca (Isola di Panarea, Arcipelago Eoliano) in Caratterizzazione ambientale marina del sistema Eolie e dei bacini limitrofi di Cefalù e Gioia (EOCUMM 95) (edited by Faranda, F.M., and Povero, P.): Data Report, p. 455-462.
Italiano, F., and Nuccio, P.M., 1991, Geochemical investigation of submarine volcanic exhalations to the east of Panarea, Aeolian Islands, Italy: Journal of Volcanology and Geothermal Research, v. 46, p. 125-141.
Losito, R., 1989, Stratigrafia, caratteri deposizionali e aree sorgenti dei Tufi Bruni delle Isole Eolie: Unpublished Ph.D. thesis, Bari University, 92 p.
Geologic Background. The mostly submerged Panarea volcanic complex lies about midway between Stromboli and Lipari in the eastern part of the Aeolian Islands. Panarea, the smallest island in the Aeolian Archipelago, lies on the western side of a shallow platform whose shelf margin is at about 130 m depth. A series of small islands breach the surface to form the Central Reefs, the rim of a crater 2 km E of Panarea, whose shallow submerged floor contains Roman ruins. The submerged Secca dei Pesci lava dome lies at the SE end of the platform, and the rhyolitic Basiluzzo lava dome rises 165 m above the surface at the NE end, along a ridge trending towards Stromboli volcano. The complex was constructed in two main stages: an initial effusive activity phase that produced lava domes, and an explosive stage. The youngest subaerial airfall-tephra deposits are dated to about 20,000 years ago; a date of less then 10,000 BP on a lava flow is uncertain. Vigorous hydrothermal activity has continued at fumarolic fields at several locations on the submerged platform; submarine hydrothermal explosions have occurred in historical time.
Information Contacts: Susanna Falsaperla, Luigi Lodato, and Massimo Pompilio, Istituto Nazionale di Geofisica e Vulcanologia - Sezione di Catania (INGV), Piazza Roma, 2, 95123 Catania, Italy (URL: http://www.ct.ingv.it/en/).
Popocatepetl (Mexico) — October 2002 Cite this Report
Popocatepetl
Mexico
19.023°N, 98.622°W; summit elev. 5393 m
All times are local (unless otherwise noted)
Small explosions, earthquakes, and tremor during July-October 2002
During July-October 2002, volcanic activity at Popocatépetl consisted of small-to-moderate, but at times explosive, eruptions of steam, gas, and generally minor amounts of ash. Explosions on 1 and 2 July produced ash plumes that reached 2 km and 700 m above the crater, respectively. Volcano-tectonic (VT) earthquakes (M 1.8-2.9) occurred almost daily. The earthquakes were located mostly to the S and E at depths up to 8 km beneath the crater. Isolated episodes of low-amplitude harmonic tremor were registered, typically for a few hours daily.
The Centro Nacional de Prevencion de Desastres (CENAPRED) reported that during most of July through mid-August, up to 25 small-to-moderate emissions per day were accompanied by steam, gas, and sometimes small amounts of ash. The number of exhalations per day increased during 22-24 July (43, 80, and 55) and 15-17 August (68, 58, and 70). Around 25-45 exhalations occurred per day through the end of August. During September and October, no more than 26 exhalations were registered per day.
Activity reported by CENAPRED in July was probably related to changes in morphology of the intracrater dome (BGVN 27:02 and 27:06). Compared to an aerial photo taken on 29 April (figure 46), an image on 22 May 2002 (figure 47) showed that the dome had diminished in size.
CENAPRED stated that future activity could consist of isolated minor explosions with emission of incandescent fragments out to short distances from the crater or emissions of variable quantities of ash. The Alert Level remained at 2, and CENAPRED recommended that people avoid the zone extending out to 12 km from the crater, although the road between Santiago Xalitzintla (Puebla) and San Pedro Nexapa (Mexico State), including Paso de Cortés, remained open for controlled traffic.
Geologic Background. Volcán Popocatépetl, whose name is the Aztec word for smoking mountain, rises 70 km SE of Mexico City to form North America's 2nd-highest volcano. The glacier-clad stratovolcano contains a steep-walled, 400 x 600 m wide crater. The generally symmetrical volcano is modified by the sharp-peaked Ventorrillo on the NW, a remnant of an earlier volcano. At least three previous major cones were destroyed by gravitational failure during the Pleistocene, producing massive debris-avalanche deposits covering broad areas to the south. The modern volcano was constructed south of the late-Pleistocene to Holocene El Fraile cone. Three major Plinian eruptions, the most recent of which took place about 800 CE, have occurred since the mid-Holocene, accompanied by pyroclastic flows and voluminous lahars that swept basins below the volcano. Frequent historical eruptions, first recorded in Aztec codices, have occurred since Pre-Columbian time.
Information Contacts: Centro Nacional de Prevencion de Desastres (CENAPRED), Delfin Madrigal 665, Col. Pedregal de Santo Domingo, Coyoacan, 04360, Mexico D.F. (URL: https://www.gob.mx/cenapred/).
Ruang (Indonesia) — October 2002 Cite this Report
Ruang
Indonesia
2.3058°N, 125.3671°E; summit elev. 703 m
All times are local (unless otherwise noted)
Eruption on 25 September 2002 sends ash to at least 5 km
The last reported activity at Ruang occurred when Qantas Airlines pilots observed an eruption around 1600 on 27 June 1996 (BGVN 21:08). A resulting plume moved W and reached an altitude of ~6 km. However, the eruption was not visible in GMS satellite imagery. The last known confirmed eruption at Ruang occurred in 1949.
A drastic increase of seismic events - from 3 to 24 events/day - was observed on 24 September by the Volcanological Survey of Indonesia (VSI). The next day, people near the volcano reported hearing a noise, and ash eruptions began by 0100. By 0300 ash emissions were continuous, and ash began falling around Ruang island and the nearby island of Tagulandang. Observers reported that the sounds accompanying the eruption were weak. By 0400 more than 1,000 people living near the volcano were evacuated to a nearby island. Around 0800, the Alert Level advanced to the highest status (level 4).
The first strong eruption commenced at 1140 on 25 September, producing thick black clouds that rose 3 km. Ten minutes later, a second eruption sent ash clouds rising 5 km. At 1210 the activity subsided enough to observe glowing material on E flank. The specific eruption site has not been firmly established. It has been presumed by VSI that it originated from "Crater II" or "where the 1949 lava originated (E side of summit)." The eruption column was reported from ground-based observations as rising to at least 5 km, and by Darwin VAAC advisories as rising to about 17 km. According to the Darwin VAAC, satellite imagery revealed that the ash cloud drifted westward to Borneo and Sumatra. Satellite images from NOAA showed the plume drifting SW with other components drifting W (figure 1). By 30 September the volcano was quiet with only a thin white plume rising about 100 m. The Alert Level was reduced from 4 to 3 on 30 September 2002.
Geologic Background. Ruang volcano is the southernmost volcano in the Sangihe Island arc, north of Sulawesi Island; it is not the better known Raung volcano on Java. The 4 x 5 km island volcano is across a narrow strait SW of the larger Tagulandang Island. The summit contains a crater partially filled by a lava dome initially emplaced in 1904. Explosive eruptions recorded since 1808 have often been accompanied by lava dome formation and pyroclastic flows that have damaged inhabited areas.
Information Contacts: Volcanological Survey of Indonesia (VSI), Jalan Diponegoro No. 57, Bandung 40122, Indonesia (URL: http://www.vsi.esdm.go.id/); Darwin Volcanic Ash Advisory Center (VAAC), Bureau of Meteorology, Northern Territory Regional Office, P.O. Box 735, Darwin, NT 0801 Australia; NOAA/NESDIS Satellite Analysis Branch, Room 401, 5200 Auth Road, Camp Springs, MD 20746, USA.
Veniaminof (United States) — October 2002 Cite this Report
Veniaminof
United States
56.17°N, 159.38°W; summit elev. 2507 m
All times are local (unless otherwise noted)
Volcanic unrest, uncertain low-level eruptive activity in September 2002
On 10 September 2002 the Alaska Volcano Observatory (AVO) detected 1-minute-long pulses of low-frequency tremor arriving every 2-5 minutes on several seismic stations at Veniaminof. This type of seismicity is indicative of volcanic unrest. Retrospective analysis of seismic data suggested that tremor began as early as 8 September. The overall level of seismicity decreased through late September, but remained above the background level established during the summer of 2002.
On 24 September, residents of Perryville, 35 km S of the volcano, reported and photographed small bursts of steam, possibly containing minor amounts of ash, rising just above the historically active intracaldera cinder cone. Without additional observations, AVO could not determine if this indicated very low-level eruptive activity or vigorous steaming from the cone. On several occasions of relatively clear weather conditions, AVO observed no signs of elevated temperature or ash emission on satellite imagery.
A satellite image recorded on 2 October suggested an apparent gray, diffuse deposit extending across the caldera from the historically active intracaldera cinder cone. This could reflect a small explosion, vigorous steam emission, or redistribution of material on the cone by strong winds. No thermal anomalies were observed on satellite imagery. AVO considered the activity at Veniaminof to be minor, but the exact nature of the unrest remained unknown. Due to the continuing seismicity and reports of unusual steaming, the Concern Color Code remained at Yellow.
Geologic Background. Veniaminof, on the Alaska Peninsula, is truncated by a steep-walled, 8 x 11 km, glacier-filled caldera that formed around 3,700 years ago. The caldera rim is up to 520 m high on the north, is deeply notched on the west by Cone Glacier, and is covered by an ice sheet on the south. Post-caldera vents are located along a NW-SE zone bisecting the caldera that extends 55 km from near the Bering Sea coast, across the caldera, and down the Pacific flank. Historical eruptions probably all originated from the westernmost and most prominent of two intra-caldera cones, which rises about 300 m above the surrounding icefield. The other cone is larger, and has a summit crater or caldera that may reach 2.5 km in diameter, but is more subdued and barely rises above the glacier surface.
Information Contacts: Alaska Volcano Observatory (AVO), a cooperative program of a) U.S. Geological Survey, 4200 University Drive, Anchorage, AK 99508-4667, USA, b) Geophysical Institute, University of Alaska, PO Box 757320, Fairbanks, AK 99775-7320, USA, and c) Alaska Division of Geological & Geophysical Surveys, 794 University Ave., Suite 200, Fairbanks, AK 99709, USA.