Recently Published Bulletin Reports
Erebus (Antarctica) Lava lake remains active; most thermal alerts recorded since 2019
Rincon de la Vieja (Costa Rica) Frequent phreatic explosions during July-December 2023
Bezymianny (Russia) Explosion on 18 October 2023 sends ash plume 8 km high; lava flows and incandescent avalanches
Kilauea (United States) Low-level lava effusions in the lava lake at Halema’uma’u during July-December 2022
Nyamulagira (DR Congo) Lava flows and thermal activity during May-October 2023
Bagana (Papua New Guinea) Explosions, ash plumes, ashfall, and lava flows during April-September 2023
Mayon (Philippines) Lava flows, pyroclastic flows, ash emissions, and seismicity during April-September 2023
Nishinoshima (Japan) Eruption plumes and gas-and-steam plumes during May-August 2023
Krakatau (Indonesia) White gas-and-steam plumes and occasional ash plumes during May-August 2023
Villarrica (Chile) Strombolian activity, gas-and-ash emissions, and crater incandescence during April-September 2023
Merapi (Indonesia) Frequent incandescent avalanches during April-September 2023
Ebeko (Russia) Moderate explosive activity with ash plumes continued during June-November 2023
Erebus (Antarctica) — January 2024  Cite this Report
Erebus
Antarctica
77.53°S, 167.17°E; summit elev. 3794 m
All times are local (unless otherwise noted)
Lava lake remains active; most thermal alerts recorded since 2019
The lava lake in the summit crater of Erebus has been active since at least 1972. Located in Antarctica overlooking the McMurdo Station on Ross Island, it is the southernmost active volcano on the planet. Because of the remote location, activity is primarily monitored by satellites. This report covers activity during 2023.
The number of thermal alerts recorded by the Hawai'i Institute of Geophysics and Planetology’s MODVOLC Thermal Alerts System increased considerably in 2023 compared to the years 2020-2022 (table 9). In contrast to previous years, the MODIS instruments aboard the Aqua and Terra satellites captured data from Erebus every month during 2023. Consistent with previous years, the lowest number of anomalous pixels were recorded in January, November, and December.
Table 9. Number of monthly MODIS-MODVOLC thermal alert pixels recorded at Erebus during 2017-2023. See BGVN 42:06 for data from 2000 through 2016. The table was compiled using data provided by the HIGP – MODVOLC Thermal Alerts System.
| Year |
Jan |
Feb |
Mar |
Apr |
May |
Jun |
Jul |
Aug |
Sep |
Oct |
Nov |
Dec |
SUM |
| 2017 |
0 |
21 |
9 |
0 |
0 |
1 |
11 |
61 |
76 |
52 |
0 |
3 |
234 |
| 2018 |
0 |
21 |
58 |
182 |
55 |
17 |
137 |
172 |
103 |
29 |
0 |
0 |
774 |
| 2019 |
2 |
21 |
162 |
151 |
55 |
56 |
75 |
53 |
29 |
19 |
1 |
0 |
624 |
| 2020 |
0 |
2 |
16 |
18 |
4 |
4 |
1 |
3 |
18 |
3 |
1 |
6 |
76 |
| 2021 |
0 |
9 |
1 |
0 |
2 |
56 |
46 |
47 |
35 |
52 |
5 |
3 |
256 |
| 2022 |
1 |
13 |
55 |
22 |
15 |
32 |
39 |
19 |
31 |
11 |
0 |
0 |
238 |
| 2023 |
2 |
33 |
49 |
82 |
41 |
32 |
70 |
64 |
42 |
17 |
5 |
11 |
448 |
Sentinel-2 infrared images showed one or two prominent heat sources within the summit crater, accompanied by adjacent smaller sources, similar to recent years (see BGVN 46:01, 47:02, and 48:01). A unique image was obtained on 25 November 2023 by the OLI-2 (Operational Land Imager-2) on Landsat 9, showing the upper part of the volcano surrounded by clouds (figure 32).
Geologic Background. Mount Erebus, the world's southernmost historically active volcano, overlooks the McMurdo research station on Ross Island. It is the largest of three major volcanoes forming the crudely triangular Ross Island. The summit of the dominantly phonolitic volcano has been modified by one or two generations of caldera formation. A summit plateau at about 3,200 m elevation marks the rim of the youngest caldera, which formed during the late-Pleistocene and within which the modern cone was constructed. An elliptical 500 x 600 m wide, 110-m-deep crater truncates the summit and contains an active lava lake within a 250-m-wide, 100-m-deep inner crater; other lava lakes are sometimes present. The glacier-covered volcano was erupting when first sighted by Captain James Ross in 1841. Continuous lava-lake activity with minor explosions, punctuated by occasional larger Strombolian explosions that eject bombs onto the crater rim, has been documented since 1972, but has probably been occurring for much of the volcano's recent history.
Information Contacts: Hawai'i Institute of Geophysics and Planetology (HIGP) - MODVOLC Thermal Alerts System, School of Ocean and Earth Science and Technology (SOEST), Univ. of Hawai'i, 2525 Correa Road, Honolulu, HI 96822, USA (URL: http://modis.higp.hawaii.edu/); Copernicus Browser, Copernicus Data Space Ecosystem, European Space Agency (URL: https://dataspace.copernicus.eu/browser/); NASA Earth Observatory, EOS Project Science Office, NASA Goddard Space Flight Center, Goddard, Maryland, USA (URL: https://earthobservatory.nasa.gov/images/152134/erebus-breaks-through).
Rincon de la Vieja (Costa Rica) — January 2024 Cite this Report
Rincon de la Vieja
Costa Rica
10.83°N, 85.324°W; summit elev. 1916 m
All times are local (unless otherwise noted)
Frequent phreatic explosions during July-December 2023
Rincón de la Vieja is a volcanic complex in Costa Rica with a hot convecting acid lake that exhibits frequent weak phreatic explosions, gas-and-steam emissions, and occasional elevated sulfur dioxide levels (BGVN 45:10, 46:03, 46:11). The current eruption period began June 2021. This report covers activity during July-December 2023 and is based on weekly bulletins and occasional daily reports from the Observatorio Vulcanologico Sismologica de Costa Rica-Universidad Nacional (OVSICORI-UNA).
Numerous weak phreatic explosions continued during July-December 2023, along with gas-and-steam emissions and plumes that rose as high as 3 km above the crater rim. Many weekly OVSICORI-UNA bulletins included the previous week's number of explosions and emissions (table 9). For many explosions, the time of explosion was given (table 10). Frequent seismic activity (long-period earthquakes, volcano-tectonic earthquakes, and tremor) accompanied the phreatic activity.
Table 9. Number of reported weekly phreatic explosions and gas-and-steam emissions at Rincón de la Vieja, July-December 2023. Counts are reported for the week before the Weekly Bulletin date; not all reports included these data. Courtesy of OVSICORI-UNA.
| OVSICORI Weekly Bulletin |
Number of explosions |
Number of emissions |
| 28 Jul 2023 |
6 |
14 |
| 4 Aug 2023 |
10 |
12 |
| 1 Sep 2023 |
13 |
11 |
| 22 Sep 2023 |
12 |
13 |
| 29 Sep 2023 |
6 |
11 |
| 6 Oct 2023 |
12 |
5 |
| 13 Oct 2023 |
7 |
9 |
| 20 Oct 2023 |
1 |
15 |
| 27 Oct 2023 |
3 |
23 |
| 3 Nov 2023 |
3 |
10 |
| 17 Nov 2023 |
0 |
Some |
| 24 Nov 2023 |
0 |
14 |
| 8 Dec 2023 |
4 |
16 |
| 22 Dec 2023 |
8 |
18 |
Table 10. Summary of activity at Rincón de la Vieja during July-December 2023. Weak phreatic explosions and gas emissions are noted where the time of explosion was indicated in the weekly or daily bulletins. Height of plumes or emissions are distance above the crater rim. Courtesy of OVSICORI-UNA.
| Date |
Time |
Description of Activity |
| 1 Jul 2023 |
0156 |
Explosion. |
| 2 Jul 2023 |
0305 |
Explosion. |
| 4 Jul 2023 |
0229, 0635 |
Event at 0635 produced a gas-and-steam plume that rose 700 m and drifted W; seen by residents in Liberia (21 km SW). |
| 9 Jul 2023 |
1843 |
Explosion. |
| 21 Jul 2023 |
0705 |
Explosion. |
| 26 Jul 2023 |
1807 |
Explosion. |
| 28 Jul 2023 |
0802 |
Explosion generated a gas-and-steam plume that rose 500 m. |
| 30 Jul 2023 |
1250 |
Explosion. |
| 31 Jul 2023 |
2136 |
Explosion. |
| 11 Aug 2023 |
0828 |
Explosion. |
| 18 Aug 2023 |
1304 |
Explosion. |
| 21 Aug 2023 |
1224 |
Explosion generated gas-and-steam plumes rose 500-600 m. |
| 22 Aug 2023 |
0749 |
Explosion generated gas-and-steam plumes rose 500-600 m. |
| 24 Aug 2023 |
1900 |
Explosion. |
| 25 Aug 2023 |
0828 |
Event produced a steam-and-gas plume that rose 3 km and drifted NW. |
| 27-28 Aug 2023 |
0813 |
Four small events; the event at 0813 on 28 August lasted two minutes and generated a steam-and-gas plume that rose 2.5 km. |
| 1 Sep 2023 |
1526 |
Explosion generated plume that rose 2 km and ejected material onto the flanks. |
| 2-3 Sep 2023 |
- |
Small explosions detected in infrasound data. |
| 4 Sep 2023 |
1251 |
Gas-and-steam plume rose 1 km and drifted W. |
| 7 Nov 2023 |
1113 |
Explosion. |
| 8 Nov 2023 |
0722 |
Explosion. |
| 12 Nov 2023 |
0136 |
Small gas emissions. |
| 14 Nov 2023 |
0415 |
Small gas emissions. |
According to OVSICORI-UNA, during July-October the average weekly sulfur dioxide (SO2) flux ranged from 68 to 240 tonnes/day. However, in mid-November the flux increased to as high as 334 tonnes/day, the highest value measured in recent years. The high SO2 flux in mid-November was also detected by the TROPOMI instrument on the Sentinel-5P satellite (figure 43).
Geologic Background. Rincón de la Vieja, the largest volcano in NW Costa Rica, is a remote volcanic complex in the Guanacaste Range. The volcano consists of an elongated, arcuate NW-SE-trending ridge constructed within the 15-km-wide early Pleistocene Guachipelín caldera, whose rim is exposed on the south side. Sometimes known as the "Colossus of Guanacaste," it has an estimated volume of 130 km3 and contains at least nine major eruptive centers. Activity has migrated to the SE, where the youngest-looking craters are located. The twin cone of Santa María volcano, the highest peak of the complex, is located at the eastern end of a smaller, 5-km-wide caldera and has a 500-m-wide crater. A Plinian eruption producing the 0.25 km3 Río Blanca tephra about 3,500 years ago was the last major magmatic eruption. All subsequent eruptions, including numerous historical eruptions possibly dating back to the 16th century, have been from the prominent active crater containing a 500-m-wide acid lake located ENE of Von Seebach crater.
Information Contacts: Observatorio Vulcanológico Sismológica de Costa Rica-Universidad Nacional (OVSICORI-UNA), Apartado 86-3000, Heredia, Costa Rica (URL: http://www.ovsicori.una.ac.cr/); NASA Global Sulfur Dioxide Monitoring Page, Atmospheric Chemistry and Dynamics Laboratory, NASA Goddard Space Flight Center (NASA/GSFC), 8800 Greenbelt Road, Goddard MD 20771, USA (URL: https://so2.gsfc.nasa.gov/).
Bezymianny (Russia) — November 2023 Cite this Report
Bezymianny
Russia
55.972°N, 160.595°E; summit elev. 2882 m
All times are local (unless otherwise noted)
Explosion on 18 October 2023 sends ash plume 8 km high; lava flows and incandescent avalanches
Bezymianny, located on Russia’s Kamchatka Peninsula, has had eruptions since 1955 characterized by dome growth, explosions, pyroclastic flows, ash plumes, and ashfall. Activity during November 2022-April 2023 included gas-and-steam emissions, lava dome collapses generating avalanches, and persistent thermal activity. Similar eruptive activity continued from May through October 2023, described here based on information from weekly and daily reports of the Kamchatka Volcano Eruptions Response Team (KVERT), notices from Tokyo VAAC (Volcanic Ash Advisory Center), and from satellite data.
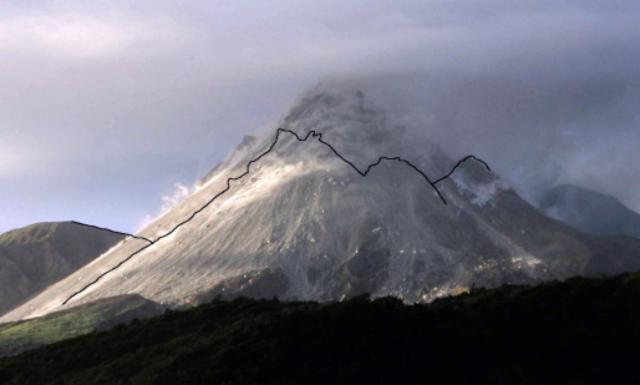
Overall activity decreased after the strong period of activity in late March through April 2023, which included ash explosions during 29 March and 7-8 April 2023 that sent plumes as high as 10-12 km altitude, along with dome growth and lava flows (BGVN 48:05). This reduced activity can be seen in the MIROVA thermal detection system graph (figure 56), which was consistent with data from the MODVOLC thermal detection system and with Sentinel-2 satellite images that showed persistent hotspots in the summit crater when conditions allowed observations. A renewed period of strong activity began in mid-October 2023.
Activity increased significantly on 17 October 2023 when large collapses began during 0700-0830 on the E flanks of the lava dome and continued to after 0930 the next day (figure 57). Ash plumes rose to an altitude of 4.5-5 km, extending 220 km NNE by 18 October. A large explosion at 1630 on 18 October produced an ash plume that rose to an altitude of 11 km (8 km above the summit) and drifted NNE and then NW, extending 900 km NW within two days at an altitude of 8 km. Minor ashfall was noted in Kozyrevsk (45 km WNW). At 0820 on 20 October an ash plume was identified in satellite images drifting 100 km ENE at altitudes of 4-4.5 km.
Lava flows and hot avalanches from the dome down the SE flank continued over the next few days, including 23 October when clear conditions allowed good observations (figures 58 and 59). A large thermal anomaly was observed over the volcano through 24 October, and in the summit crater on 30 October (figure 60). Strong fumarolic activity continued, with numerous avalanches and occasional incandescence. By the last week of October, volcanic activity had decreased to a level consistent with that earlier in the reporting period.
Aviation warnings were frequently updated during 17-20 October. KVERT issued a Volcano Observatory Notice for Aviation (VONA) on 17 October at 1419 and 1727 (0219 and 0527 UTC) raising the Aviation Color Code (ACC) from Yellow to Orange (second highest level). The next day, KVERT issued a VONA at 1705 (0505 UTC) raising the ACC to Red (highest level) but lowered it back to Orange at 2117 (0917 UTC). After another decrease to Yellow and back to Orange, the ACC was reduced to Yellow on 20 October at 1204 (0004 UTC). In addition, the Tokyo VAAC issued a series of Volcanic Ash Advisories beginning on 16 October and continuing through 30 October.
Geologic Background. The modern Bezymianny, much smaller than its massive neighbors Kamen and Kliuchevskoi on the Kamchatka Peninsula, was formed about 4,700 years ago over a late-Pleistocene lava-dome complex and an edifice built about 11,000-7,000 years ago. Three periods of intensified activity have occurred during the past 3,000 years. The latest period, which was preceded by a 1,000-year quiescence, began with the dramatic 1955-56 eruption. This eruption, similar to that of St. Helens in 1980, produced a large open crater that was formed by collapse of the summit and an associated lateral blast. Subsequent episodic but ongoing lava-dome growth, accompanied by intermittent explosive activity and pyroclastic flows, has largely filled the 1956 crater.
Information Contacts: Kamchatka Volcanic Eruptions Response Team (KVERT), Far Eastern Branch, Russian Academy of Sciences, 9 Piip Blvd., Petropavlovsk-Kamchatsky, 683006, Russia (URL: http://www.kscnet.ru/ivs/kvert/); Kamchatka Volcanological Station, Kamchatka Branch of Geophysical Survey, (KB GS RAS), Klyuchi, Kamchatka Krai, Russia (URL: http://volkstat.ru/); Tokyo Volcanic Ash Advisory Center (VAAC), 1-3-4 Otemachi, Chiyoda-ku, Tokyo 100-8122, Japan (URL: http://ds.data.jma.go.jp/svd/vaac/data/); Hawai'i Institute of Geophysics and Planetology (HIGP) - MODVOLC Thermal Alerts System, School of Ocean and Earth Science and Technology (SOEST), Univ. of Hawai'i, 2525 Correa Road, Honolulu, HI 96822, USA (URL: http://modis.higp.hawaii.edu/); MIROVA (Middle InfraRed Observation of Volcanic Activity), a collaborative project between the Universities of Turin and Florence (Italy) supported by the Centre for Volcanic Risk of the Italian Civil Protection Department (URL: http://www.mirovaweb.it/); Copernicus Browser, Copernicus Data Space Ecosystem, European Space Agency (URL: https://dataspace.copernicus.eu/browser/).chr
Kilauea (United States) — January 2023 Cite this Report
Kilauea
United States
19.421°N, 155.287°W; summit elev. 1222 m
All times are local (unless otherwise noted)
Low-level lava effusions in the lava lake at Halema’uma’u during July-December 2022
Kīlauea is the southeastern-most volcano in Hawaii and overlaps the E flank of the Mauna Loa volcano. Its East Rift Zone (ERZ) has been intermittently active for at least 2,000 years. An extended eruption period began in January 1983 and was characterized by open lava lakes and lava flows from the summit caldera and the East Rift Zone. During May 2018 magma migrated into the Lower East Rift Zone (LERZ) and opened 24 fissures along a 6-km-long NE-trending fracture zone that produced lava flows traveling in multiple directions. As lava emerged from the fissures, the lava lake at Halema'uma'u drained and explosions sent ash plumes to several kilometers altitude (BGVN 43:10).
The current eruption period started during September 2021 and has recently been characterized by lava effusions, spatter, and sulfur dioxide emissions in the active Halema’uma’u lava lake (BGVN 47:08). Lava effusions, some spatter, and sulfur dioxide emissions have continued during this reporting period of July through December 2022 using daily reports, volcanic activity notices, and abundant photo, map, and video data from the US Geological Survey's (USGS) Hawaiian Volcano Observatory (HVO).
Summary of activity during July-December 2022. Low-level effusions have continued at the western vent of the Halema’uma’u crater during July through early December 2022. Occasional weak ooze-outs (also called lava break outs) would occur along the margins of the crater floor. The overall level of the active lava lake throughout the reporting period gradually increased due to infilling, however it stagnated in mid-September (table 13). During September through November, activity began to decline, though lava effusions persisted at the western vent. By 9 December, the active part of the lava lake had completely crusted over, and incandescence was no longer visible.
Table 13. Summary of measurements taken during overflights at Kīlauea that show a gradual increase in the active lava lake level and the volume of lava effused since 29 September 2021. Lower activity was reported during September-October. Data collected during July-December 2022. Courtesy of HVO.
| Date: |
Level of the active lava lake (m): |
Cumulative volume of lava effused (million cubic meters): |
| 7 Jul 2022 |
130 |
95 |
| 19 Jul 2022 |
133 |
98 |
| 4 Aug 2022 |
136 |
102 |
| 16 Aug 2022 |
137 |
104 |
| 12 Sep 2022 |
143 |
111 |
| 5 Oct 2022 |
143 |
111 |
| 28 Oct 2022 |
143 |
111 |
Activity during July 2022. Lava effusions were reported from the western vent in the Halema’uma’u crater, along with occasional weak ooze-outs along the margins of the crater floor. The height of the lava lake was variable due to deflation-inflation tilt events; for example, the lake level dropped approximately 3-4 m during a summit deflation-inflation event reported on 1 July. Webcam images taken during the night of 6-12 July showed intermittent low-level spattering at the western vent that rose less than 10 m above the vent (figure 519). Measurements made during an overflight on 7 July indicated that the crater floor was infilled about 130 m and that 95 million cubic meters of lava had been effused since 29 September 2021. A single, relatively small lava ooze-out was active to the S of the lava lake. Around midnight on 8 July there were two brief periods of lava overflow onto the lake margins. On 9 July lava ooze-outs were reported near the SE and NE edges of the crater floor and during 10-11 July they occurred near the E, NE, and NW edges. On 16 July crater incandescence was reported, though the ooze-outs and spattering were not visible. On 18 July overnight webcam images showed incandescence in the western vent complex and two ooze-outs were reported around 0000 and 0200 on 19 July. By 0900 there were active ooze-outs along the SW edge of the crater floor. Measurements made from an overflight on 19 July indicated that the crater floor was infilled about 133 m and 98 million cubic meters of lava had erupted since 29 September 2021 (figure 520). On 20 July around 1600 active ooze-outs were visible along the N edge of the crater, which continued through the next day. Extensive ooze-outs occurred along the W margin during 24 July until 1900; on 26 July minor ooze-outs were noted along the N margin. Minor spattering was visible on 29 July along the E margin of the lake. The sulfur dioxide emission rates ranged 650-2,800 tons per day (t/d), the higher of which was measured on 8 July (figure 519).
Activity during August 2022. The eruption continued in the Halema’uma’u crater at the western vent. According to HVO the lava in the active lake remained at the level of the bounding levees. Occasional minor ooze-outs were observed along the margins of the crater floor. Strong nighttime crater incandescence was visible after midnight on 6 August over the western vent cone. During 6-7 August scattered small lava lobes were active along the crater floor and incandescence persisted above the western vent through 9 August. During 7-9 August HVO reported a single lava effusion source was active along the NW margin of the crater floor. Measurements from an overflight on 4 August indicated that the crater floor was infilled about 136 m total and that 102 million cubic meters of lava had been erupted since the start of the eruption. Lava breakouts were reported along the N, NE, E, S, and W margins of the crater during 10-16 August. Another overflight survey conducted on 16 August indicated that the crater floor infilled about 137 m and 104 million cubic meters of lava had been erupted since September 2021. Measured sulfur dioxide emissions rates ranged 1,150-2,450 t/d, the higher of which occurred on 8 August.
Activity during September 2022. During September, lava effusion continued from the western vent into the active lava lake and onto the crater floor. Intermittent minor ooze-outs were reported through the month. A small ooze-out was visible on the W crater floor margin at 0220 on 2 September, which showed decreasing surface activity throughout the day, but remained active through 3 September. On 3 September around 1900 a lava outbreak occurred along the NW margin of the crater floor but had stopped by the evening of 4 September. Field crews monitoring the summit lava lake on 9 September observed spattering on the NE margin of the lake that rose no higher than 10 m, before falling back onto the lava lake crust (figure 521). Overflight measurements on 12 September indicated that the crater floor was infilled a total of 143 m and 111 million cubic meters of lava had been erupted since September 2021. Extensive breakouts in the W and N part of the crater floor were reported at 1600 on 20 September and continued into 26 September. The active part of the lava lake dropped by 10 m while other parts of the crater floor dropped by several meters. Summit tiltmeters recorded a summit seismic swarm of more than 80 earthquakes during 1500-1800 on 21 September, which occurred about 1.5 km below Halema’uma’u; a majority of these were less than Mw 2. By 22 September the active part of the lava lake was infilled about 2 m. On 23 September the western vent areas exhibited several small spatter cones with incandescent openings, along with weak, sporadic spattering (figure 522). The sulfur dioxide emission rate ranged from 930 t/d to 2,000 t/d, the higher of which was measured on 6 September.
Activity during October 2022. Activity during October declined slightly compared to previous months, though lava effusions persisted from the western vent into the active lava lake and onto the crater floor during October (figure 523). Slight variations in the lava lake were noted throughout the month. HVO reported that around 0600 on 3 October the level of the lava lake has lowered slightly. Overflight measurements taken on 5 October indicated that the crater floor was infilled a total of about 143 m and that 111 million cubic meters of lava had been effused since September 2021. During 6-7 October the lake gradually rose 0.5 m. Sulfur dioxide measurements made on 22 October had an emission rate of 700 t/d. Another overflight taken on 28 October showed that there was little to no change in the elevation of the crater floor: the crater floor was infilled a total of 143 m and 111 million cubic meters of lava had erupted since the start of the eruption.
Activity during November 2022. Activity remained low during November, though HVO reported that lava from the western vent continued to effuse into the active lava lake and onto the crater floor throughout the month. The rate of sulfur dioxide emissions during November ranged from 300-600 t/d, the higher amount of which occurred on 9 November.
Activity during December 2022. Similar low activity was reported during December, with lava effusing from the western vent into the active lava lake and onto the crater floor. During 4-5 December the active part of the lava lake was slightly variable in elevation and fluctuated within 1 m. On 9 December HVO reported that lava was no longer erupting from the western vent in the Halema’uma’u crater and that sulfur dioxide emissions had returned to near pre-eruption background levels; during 10-11 December, the lava lake had completely crusted over, and no incandescence was visible (figure 524). Time lapse camera images covering the 4-10 December showed that the crater floor showed weak deflation and no inflation. Some passive events of crustal overturning were reported during 14-15 December, which brought fresh incandescent lava to the lake surface. The sulfur dioxide emission rate was approximately 200 t/d on 14 December. A smaller overturn event on 17 December and another that occurred around 0000 and into the morning of 20 December were also detected. A small seismic swarm was later detected on 30 December.
Geologic Background. Kilauea overlaps the E flank of the massive Mauna Loa shield volcano in the island of Hawaii. Eruptions are prominent in Polynesian legends; written documentation since 1820 records frequent summit and flank lava flow eruptions interspersed with periods of long-term lava lake activity at Halemaumau crater in the summit caldera until 1924. The 3 x 5 km caldera was formed in several stages about 1,500 years ago and during the 18th century; eruptions have also originated from the lengthy East and Southwest rift zones, which extend to the ocean in both directions. About 90% of the surface of the basaltic shield volcano is formed of lava flows less than about 1,100 years old; 70% of the surface is younger than 600 years. The long-term eruption from the East rift zone between 1983 and 2018 produced lava flows covering more than 100 km2, destroyed hundreds of houses, and added new coastline.
Information Contacts: Hawaiian Volcano Observatory (HVO), U.S. Geological Survey, PO Box 51, Hawai'i National Park, HI 96718, USA (URL: http://hvo.wr.usgs.gov/).
Nyamulagira (DR Congo) — November 2023 Cite this Report
Nyamulagira
DR Congo
1.408°S, 29.2°E; summit elev. 3058 m
All times are local (unless otherwise noted)
Lava flows and thermal activity during May-October 2023
Nyamulagira (also known as Nyamuragira) is a shield volcano in the Democratic Republic of Congo with the summit truncated by a small 2 x 2.3 km caldera with walls up to about 100 m high. Documented eruptions have occurred within the summit caldera, as well as from numerous flank fissures and cinder cones. The current eruption period began in April 2018 and has more recently been characterized by summit crater lava flows and thermal activity (BGVN 48:05). This report describes lava flows and variable thermal activity during May through October 2023, based on information from the Observatoire Volcanologique de Goma (OVG) and various satellite data.
Lava lake activity continued during May. The MIROVA (Middle InfraRed Observation of Volcanic Activity) system recorded moderate-to-strong thermal activity throughout the reporting period; activity was more intense during May and October and relatively weaker from June through September (figure 95). The MODVOLC thermal algorithm, detected a total of 209 thermal alerts. There were 143 hotspots detected during May, eight during June, nine during September, and 49 during October. This activity was also reflected in infrared satellite images, where a lava flow was visible in the NW part of the crater on 7 May and strong activity was seen in the center of the crater on 4 October (figure 96). Another infrared satellite image taken on 12 May showed still active lava flows along the NW margin of the crater. According to OVG lava effusions were active during 7-29 May and moved to the N and NW parts of the crater beginning on 9 May. Strong summit crater incandescence was visible from Goma (27 km S) during the nights of 17, 19, and 20 May (figure 97). On 17 May there was an increase in eruptive activity, which peaked at 0100 on 20 May. Notable sulfur dioxide plumes drifted NW and W during 19-20 May (figure 98). Drone footage acquired in partnership with the USGS (United States Geological Survey) on 20 May captured images of narrow lava flows that traveled about 100 m down the W flank (figure 99). Data from the Rumangabo seismic station indicated a decreasing trend in activity during 17-21 May. Although weather clouds prevented clear views of the summit, a strong thermal signature on the NW flank was visible in an infrared satellite image on 22 May, based on an infrared satellite image. On 28 May the lava flows on the upper W flank began to cool and solidify. By 29 May seismicity returned to levels similar to those recorded before the 17 May increase. Lava effusion continued but was confined to the summit crater; periodic crater incandescence was observed.
Low-level activity was noted during June through October. On 1 June OVG reported that seismicity remained at lower levels and that crater incandescence had been absent for three days, though infrared satellite imagery showed continued lava effusion in the summit crater. The lava flows on the flanks covered an estimated 0.6 km2. Satellite imagery continued to show thermal activity confined to the lava lake through October (figure 96), although no lava flows or significant sulfur dioxide emissions were reported.
Geologic Background. Africa's most active volcano, Nyamulagira (also known as Nyamuragira), is a massive high-potassium basaltic shield about 25 km N of Lake Kivu and 13 km NNW of the steep-sided Nyiragongo volcano. The summit is truncated by a small 2 x 2.3 km caldera that has walls up to about 100 m high. Documented eruptions have occurred within the summit caldera, as well as from the numerous flank fissures and cinder cones. A lava lake in the summit crater, active since at least 1921, drained in 1938, at the time of a major flank eruption. Recent lava flows extend down the flanks more than 30 km from the summit as far as Lake Kivu; extensive lava flows from this volcano have covered 1,500 km2 of the western branch of the East African Rift.
Information Contacts: Observatoire Volcanologique de Goma (OVG), Departement de Geophysique, Centre de Recherche en Sciences Naturelles, Lwiro, D.S. Bukavu, DR Congo; Hawai'i Institute of Geophysics and Planetology (HIGP) - MODVOLC Thermal Alerts System, School of Ocean and Earth Science and Technology (SOEST), Univ. of Hawai'i, 2525 Correa Road, Honolulu, HI 96822, USA (URL: http://modis.higp.hawaii.edu/); MIROVA (Middle InfraRed Observation of Volcanic Activity), a collaborative project between the Universities of Turin and Florence (Italy) supported by the Centre for Volcanic Risk of the Italian Civil Protection Department (URL: http://www.mirovaweb.it/); NASA Global Sulfur Dioxide Monitoring Page, Atmospheric Chemistry and Dynamics Laboratory, NASA Goddard Space Flight Center (NASA/GSFC), 8800 Greenbelt Road, Goddard, Maryland, USA (URL: https://so2.gsfc.nasa.gov/); Copernicus Browser, Copernicus Data Space Ecosystem, European Space Agency (URL: https://dataspace.copernicus.eu/browser/); Charles Balagizi, Goma Volcano Observatory, Departement de Geophysique, Centre de Recherche en Sciences Naturelles, Lwiro, D.S. Bukavu, DR Congo.
Bagana (Papua New Guinea) — October 2023 Cite this Report
Bagana
Papua New Guinea
6.137°S, 155.196°E; summit elev. 1855 m
All times are local (unless otherwise noted)
Explosions, ash plumes, ashfall, and lava flows during April-September 2023
The remote volcano of Bagana is located in central Bougainville Island, Papua New Guinea. Recorded eruptions date back to 1842 and activity has consisted of effusive activity that has built a small lava dome in the summit crater and occasional explosions that produced pyroclastic flows. The most recent eruption has been ongoing since February 2000 and has produced occasional explosions, ash plumes, and lava flows. More recently, activity has been characterized by ongoing effusive activity and ash emissions (BGVN 48:04). This report updates activity from April through September 2023 that has consisted of explosions, ash plumes, ashfall, and lava flows, using information from the Darwin Volcanic Ash Advisory Center (VAAC) and satellite data.
An explosive eruption was reported on 7 July that generated a large gas-and-ash plume to high altitudes and caused significant ashfall in local communities; the eruption plume had reached upper tropospheric (16-18 km altitude) altitudes by 2200, according to satellite images. Sulfur dioxide plumes were detected in satellite images on 8 July and indicated that the plume was likely a mixture of gas, ice, and ash. A report issued by the Autonomous Bougainville Government (ABG) (Torokina District, Education Section) on 10 July noted that significant ash began falling during 2000-2100 on 7 July and covered most areas in the Vuakovi, Gotana (9 km SW), Koromaketo, Laruma (25 km W) and Atsilima (27 km NW) villages. Pyroclastic flows also occurred, according to ground-based reports; small deposits confined to one drainage were inspected by RVO during an overflight on 17 July and were confirmed to be from the 7 July event. Ashfall continued until 10 July and covered vegetation, which destroyed bushes and gardens and contaminated rivers and streams.
RVO reported another eruption on 14 July. The Darwin VAAC stated that an explosive event started around 0830 on 15 July and produced an ash plume that rose to 16.5 km altitude by 1000 and drifted N, according to satellite images. The plume continued to drift N and remained visible through 1900, and by 2150 it had dissipated.
Ashfall likely from both the 7 and 15 July events impacted about 8,111 people in Torokina (20 km SW), including Tsito/Vuakovi, Gotana, Koromaketo, Kenaia, Longkogari, Kenbaki, Piva (13 km SW), and Atsinima, and in the Tsitovi district, according to ABG. Significant ashfall was also reported in Ruruvu (22 km N) in the Wakunai District of Central Bougainville, though the thickness of these deposits could not be confirmed. An evacuation was called for the villages in Wakunai, where heavy ashfall had contaminated water sources; the communities of Ruruvu, Togarau, Kakarapaia, Karauturi, Atao, and Kuritaturi were asked to evacuate to a disaster center at the Wakunai District Station, and communities in Torokina were asked to evacuate to the Piva District station. According to a news article, more than 7,000 people needed temporary accommodations, with about 1,000 people in evacuation shelters. Ashfall had deposited over a broad area, contaminating water supplies, affecting crops, and collapsing some roofs and houses in rural areas. Schools were temporarily shut down. Intermittent ash emissions continued through the end of July and drifted NNW, NW, and SW. Fine ashfall was reported on the coast of Torokina, and ash plumes also drifted toward Laruma and Atsilima.
A small explosive eruption occurred at 2130 on 28 July that ejected material from the crater vents, according to reports from Torokina, in addition to a lava flow that contained two lobes. A second explosion was detected at 2157. Incandescence from the lava flow was visible from Piva as it descended the W flank around 2000 on 29 July (figure 47). The Darwin VAAC reported that a strong thermal anomaly was visible in satellite images during 30-31 July and that ash emissions rose to 2.4 km altitude and drifted WSW on 30 July. A ground report from RVO described localized emissions at 0900 on 31 July.
The Darwin VAAC reported that ash plumes were identified in satellite imagery at 0800 and 1220 on 12 August and rose to 2.1 km and 3 km altitude and drifted NW and W, respectively. A news report stated that aid was sent to more than 6,300 people that were adversely affected by the eruption. Photos taken during 17-19 August showed ash emissions rising no higher than 1 km above the summit and drifting SE. A small explosion generated an ash plume during the morning of 19 August. Deposits from small pyroclastic flows were also captured in the photos. Satellite images captured lava flows and pyroclastic flow deposits. Two temporary seismic stations were installed near Bagana on 17 August at distances of 7 km WSW (Vakovi station) and 11 km SW (Kepox station). The Kepox station immediately started to record continuous, low-frequency background seismicity.
Satellite data. Little to no thermal activity was detected during April through mid-July 2023; only one anomaly was recorded during early April and one during early June, according to MIROVA (Middle InfraRed Observation of Volcanic Activity) data (figure 48). Thermal activity increased in both power and frequency during mid-July through September, although there were still some short gaps in detected activity. MODVOLC also detected increased thermal activity during August; thermal hotspots were detected a total of five times on 19, 20, and 27 August. Weak thermal anomalies were also captured in infrared satellite images on clear weather days throughout the reporting period on 7, 12, and 17 April, 27 May, 1, 6, 16, and 31 July, and 19 September (figure 48); a strong thermal anomaly was visible on 31 July. Distinct sulfur dioxide plumes that drifted generally NW were intermittently captured by the TROPOMI instrument on the Sentinel-5P satellite and sometimes exceeded two Dobson Units (DUs) (figure 49).
Geologic Background. Bagana volcano, in a remote portion of central Bougainville Island, is frequently active. This massive symmetrical cone was largely constructed by an accumulation of viscous andesitic lava flows. The entire edifice could have been constructed in about 300 years at its present rate of lava production. Eruptive activity is characterized by non-explosive effusion of viscous lava that maintains a small lava dome in the summit crater, although occasional explosive activity produces pyroclastic flows. Lava flows with tongue-shaped lobes up to 50 m thick and prominent levees descend the flanks on all sides.
Information Contacts: Rabaul Volcano Observatory (RVO), Geohazards Management Division, Department of Mineral Policy and Geohazards Management (DMPGM), PO Box 3386, Kokopo, East New Britain Province, Papua New Guinea; Darwin Volcanic Ash Advisory Centre (VAAC), Bureau of Meteorology, Northern Territory Regional Office, PO Box 40050, Casuarina, NT 0811, Australia (URL: http://www.bom.gov.au/info/vaac/); MIROVA (Middle InfraRed Observation of Volcanic Activity), a collaborative project between the Universities of Turin and Florence (Italy) supported by the Centre for Volcanic Risk of the Italian Civil Protection Department (URL: http://www.mirovaweb.it/); Hawai'i Institute of Geophysics and Planetology (HIGP) - MODVOLC Thermal Alerts System, School of Ocean and Earth Science and Technology (SOEST), Univ. of Hawai'i, 2525 Correa Road, Honolulu, HI 96822, USA (URL: http://modis.higp.hawaii.edu/); NASA Global Sulfur Dioxide Monitoring Page, Atmospheric Chemistry and Dynamics Laboratory, NASA Goddard Space Flight Center (NASA/GSFC), 8800 Greenbelt Road, Goddard, Maryland, USA (URL: https://so2.gsfc.nasa.gov/); Copernicus Browser, Copernicus Data Space Ecosystem, European Space Agency (URL: https://dataspace.copernicus.eu/browser/); Autonomous Bougainville Government, P.O Box 322, Buka, AROB, PNG (URL: https://abg.gov.pg/); Andrew Tupper (Twitter: @andrewcraigtupp); Simon Carn, Geological and Mining Engineering and Sciences, Michigan Technological University, 1400 Townsend Drive, Houghton, MI 49931, USA (URL: http://www.volcarno.com/, Twitter: @simoncarn); Radio NZ (URL: https://www.rnz.co.nz/news/pacific/494464/more-than-7-000-people-in-bougainville-need-temporary-accommodation-after-eruption); USAID, 1300 Pennsylvania Ave, NW, Washington DC 20004, USA (URL: https://www.usaid.gov/pacific-islands/press-releases/aug-08-2023-united-states-provides-immediate-emergency-assistance-support-communities-affected-mount-bagana-volcanic-eruptions).
Mayon (Philippines) — October 2023 Cite this Report
Mayon
Philippines
13.257°N, 123.685°E; summit elev. 2462 m
All times are local (unless otherwise noted)
Lava flows, pyroclastic flows, ash emissions, and seismicity during April-September 2023
Mayon is located in the Philippines and has steep upper slopes capped by a small summit crater. Historical eruptions date back to 1616 CE that have been characterized by Strombolian eruptions, lava flows, pyroclastic flows, and mudflows. Eruptions mostly originated from a central conduit. Pyroclastic flows and mudflows have commonly descended many of the approximately 40 drainages that surround the volcano. The most recent eruption occurred during June through October 2022 and consisted of lava dome growth and gas-and-steam emissions (BGVN 47:12). A new eruption was reported during late April 2023 and has included lava flows, pyroclastic density currents, ash emissions, and seismicity. This report covers activity during April through September 2023 based on daily bulletins from the Philippine Institute of Volcanology and Seismology (PHIVOLCS).
During April through September 2023, PHIVOLCS reported near-daily rockfall events, frequent volcanic earthquakes, and sulfur dioxide measurements. Gas-and-steam emissions rose 100-900 m above the crater and drifted in different directions. Nighttime crater incandescence was often visible during clear weather and was accompanied by incandescent avalanches of material. Activity notably increased during June when lava flows were reported on the S, SE, and E flanks (figure 52). The MIROVA graph (Middle InfraRed Observation of Volcanic Activity) showed strong thermal activity coincident with these lava flows, which remained active through September (figure 53). According to the MODVOLC thermal algorithm, a total of 110 thermal alerts were detected during the reporting period: 17 during June, 40 during July, 27 during August, and 26 during September. During early June, pyroclastic density currents (PDCs) started to occur more frequently.
Low activity was reported during much of April and May; gas-and-steam emissions rose 100-900 m above the crater and generally drifted in different directions. A total of 52 rockfall events and 18 volcanic earthquakes were detected during April and 147 rockfall events and 13 volcanic events during May. Sulfur dioxide flux measurements ranged between 400-576 tons per day (t/d) during April, the latter of which was measured on 29 April and between 162-343 t/d during May, the latter of which was measured on 13 May.
Activity during June increased, characterized by lava flows, pyroclastic density currents (PDCs), crater incandescence and incandescent rockfall events, gas-and-steam emissions, and continued seismicity. Weather clouds often prevented clear views of the summit, but during clear days, moderate gas-and-steam emissions rose 100-2,500 m above the crater and drifted in multiple directions. A total of 6,237 rockfall events and 288 volcanic earthquakes were detected. The rockfall events often deposited material on the S and SE flanks within 700-1,500 m of the summit crater and ash from the events drifted SW, S, SE, NE, and E. Sulfur dioxide emissions ranged between 149-1,205 t/d, the latter of which was measured on 10 June. Short-term observations from EDM and electronic tiltmeter monitoring indicated that the upper slopes were inflating since February 2023. Longer-term ground deformation parameters based on EDM, precise leveling, continuous GPS, and electronic tilt monitoring indicated that the volcano remained inflated, especially on the NW and SE flanks. At 1000 on 5 June the Volcano Alert Level (VAL) was raised to 2 (on a 0-5 scale). PHIVOLCS noted that although low-level volcanic earthquakes, ground deformation, and volcanic gas emissions indicated unrest, the steep increase in rockfall frequency may indicate increased dome activity.
A total of 151 dome-collapse PDCs occurred during 8-9 and 11-30 June, traveled 500-2,000 m, and deposited material on the S flank within 2 km of the summit crater. During 8-9 June the VAL was raised to 3. At approximately 1947 on 11 June lava flow activity was reported; two lobes traveled within 500 m from the crater and deposited material on the S (Mi-isi), SE (Bonga), and E (Basud) flanks. Weak seismicity accompanied the lava flow and slight inflation on the upper flanks. This lava flow remained active through 30 June, moving down the S and SE flank as far as 2.5 km and 1.8 km, respectively and depositing material up to 3.3 km from the crater. During 15-16 June traces of ashfall from the PDCs were reported in Sitio Buga, Nabonton, City of Ligao and Purok, and San Francisco, Municipality of Guinobatan. During 28-29 June there were two PDCs generated by the collapse of the lava flow front, which generated a light-brown ash plume 1 km high. Satellite monitors detected significant concentrations of sulfur dioxide beginning on 29 June. On 30 June PDCs primarily affected the Basud Gully on the E flank, the largest of which occurred at 1301 and lasted eight minutes, based on the seismic record. Four PDCs generated between 1800 and 2000 that lasted approximately four minutes each traveled 3-4 km on the E flank and generated an ash plume that rose 1 km above the crater and drifted N and NW. Ashfall was recorded in Tabaco City.
Similar strong activity continued during July; slow lava effusion remained active on the S and SE flanks and traveled as far as 2.8 km and 2.8 km, respectively and material was deposited as far as 4 km from the crater. There was a total of 6,983 rockfall events and 189 PDCs that affected the S, SE, and E flanks. The volcano network detected a total of 2,124 volcanic earthquakes. Continuous gas-and-steam emissions rose 200-2,000 m above the crater and drifted in multiple directions. Sulfur dioxide emissions averaged 792-4,113 t/d, the latter of which was measured on 28 July. During 2-4 July three PDCs were generated from the collapse of the lava flow and resulting light brown plumes rose 200-300 m above the crater. Continuous tremor pulses were reported beginning at 1547 on 3 July through 7 July at 1200, at 2300 on 8 July and going through 0300 on 10 July, and at 2300 on 16 July, as recorded by the seismic network. During 6-9 July there were 10 lava flow-collapse-related PDCs that generated light brown plumes 300-500 m above the crater. During 10-11 July light ashfall was reported in some areas of Mabinit, Legazpi City, Budiao and Salvacion, Daraga, and Camalig, Albay. By 18 July the lava flow advanced 600 m on the E flank as well.
During 1733 on 18 July and 0434 on 19 July PHIVOLCS reported 30 “ashing” events, which are degassing events accompanied by audible thunder-like sounds and entrained ash at the crater, which produced short, dark plumes that drifted SW. These events each lasted 20-40 seconds, and plume heights ranged from 150-300 m above the crater, as recorded by seismic, infrasound, visual, and thermal monitors. Three more ashing events occurred during 19-20 July. Short-term observations from electronic tilt and GPS monitoring indicate deflation on the E lower flanks in early July and inflation on the NW middle flanks during the third week of July. Longer-term ground deformation parameters from EDM, precise leveling, continuous GPS, and electronic tilt monitoring indicated that the volcano was still generally inflated relative to baseline levels. A short-lived lava pulse lasted 28 seconds at 1956 on 21 July, which was accompanied by seismic and infrasound signals. By 22 July, the only lava flow that remained active was on the SE flank, and continued to extend 3.4 km, while those on the S and E flanks weakened markedly. One ashing event was detected during 30-31 July, whereas there were 57 detected during 31 July-1 August; according to PHIVOLCS beginning at approximately 1800 on 31 July eruptive activity was dominated by phases of intermittent ashing, as well as increased in the apparent rates of lava effusion from the summit crater. The ashing phases consisted of discrete events recorded as low-frequency volcanic earthquakes (LFVQ) typically 30 seconds in duration, based on seismic and infrasound signals. Gray ash plume rose 100 m above the crater and generally drifted NE. Shortly after these ashing events began, new lava began to effuse rapidly from the crater, feeding the established flowed on the SE, E, and E flanks and generating frequent rockfall events.
Intensified unrest persisted during August. There was a total of 4,141 rockfall events, 2,881 volcanic earthquakes, which included volcanic tremor events, 32 ashing events, and 101 PDCs detected throughout the month. On clear weather days, gas-and-steam emissions rose 300-1,500 m above the crater and drifted in different directions (figure 54). Sulfur dioxide emissions averaged 735-4,756 t/d, the higher value of which was measured on 16 August. During 1-2 August the rate of lava effusion decreased, but continued to feed the flows on the SE, S, and E flanks, maintaining their advances to 3.4 km, 2.8 km, and 1.1 km from the crater, respectively (figure 55). Rockfall and PDCs generated by collapses at the lava flow margins and from the summit dome deposited material within 4 km of the crater. During 3-4 August there were 10 tremor events detected that lasted 1-4 minutes. Short-lived lava pulse lasted 35 seconds and was accompanied by seismic and infrasound signals at 0442 on 6 August. Seven collapses were recorded at the front of the lava flow during 12-14 August.
During September, similar activity of slow lava effusion, PDCs, gas-and-steam emissions, and seismicity continued. There was a total of 4,452 rockfall events, 329 volcanic earthquakes, which included volcanic tremor events, two ashing events, and 85 PDCs recorded throughout the month. On clear weather days, gas-and-steam emissions rose 100-1,500 m above the crater and drifted in multiple directions. Sulfur dioxide emissions averaged 609-2,252 t/d, the higher average of which was measured on 6 September. Slow lava effusion continued advancing on the SE, S, and E flanks, maintaining lengths of 3.4 km, 2.8 km, and 1.1 km, respectively. Rockfall and PDC events generated by collapses along the lava flow margins and at the summit dome deposited material within 4 km of the crater.
Geologic Background. Symmetrical Mayon, which rises above the Albay Gulf NW of Legazpi City, is the most active volcano of the Philippines. The steep upper slopes are capped by a small summit crater. Recorded eruptions since 1616 CE range from Strombolian to basaltic Plinian, with cyclical activity beginning with basaltic eruptions, followed by longer periods of andesitic lava flows. Eruptions occur predominately from the central conduit and have also produced lava flows that travel far down the flanks. Pyroclastic density currents and mudflows have commonly swept down many of the approximately 40 ravines that radiate from the summit and have often damaged populated lowland areas. A violent eruption in 1814 killed more than 1,200 people and devastated several towns.
Information Contacts: Philippine Institute of Volcanology and Seismology (PHIVOLCS), Department of Science and Technology, University of the Philippines Campus, Diliman, Quezon City, Philippines (URL: http://www.phivolcs.dost.gov.ph/); MIROVA (Middle InfraRed Observation of Volcanic Activity), a collaborative project between the Universities of Turin and Florence (Italy) supported by the Centre for Volcanic Risk of the Italian Civil Protection Department (URL: http://www.mirovaweb.it/); Hawai'i Institute of Geophysics and Planetology (HIGP) - MODVOLC Thermal Alerts System, School of Ocean and Earth Science and Technology (SOEST), Univ. of Hawai'i, 2525 Correa Road, Honolulu, HI 96822, USA (URL: http://modis.higp.hawaii.edu/); Copernicus Browser, Copernicus Data Space Ecosystem, European Space Agency (URL: https://dataspace.copernicus.eu/browser/); William Rogers, Legazpi City, Albay Province, Philippines.
Nishinoshima (Japan) — October 2023 Cite this Report
Nishinoshima
Japan
27.247°N, 140.874°E; summit elev. 100 m
All times are local (unless otherwise noted)
Eruption plumes and gas-and-steam plumes during May-August 2023
Nishinoshima, located about 1,000 km S of Tokyo, is a small island in the Ogasawara Arc in Japan. The island is the summit of a massive submarine volcano that has prominent submarine peaks to the S, W, and NE. Eruptions date back to 1973 and the current eruption period began in October 2022. Recent activity has consisted of small ash plumes and fumarolic activity (BGVN 48:07). This report covers activity during May through August 2023, using information from monthly reports of the Japan Meteorological Agency (JMA) monthly reports and satellite data.
Activity during May through June was relatively low. The Japan Coast Guard (JCG) did overflights on 14 and 22 June and reported white gas-and-steam emissions rising 600 m and 1,200 m from the central crater of the pyroclastic cone, respectively (figure 125). In addition, multiple white gas-and-steam emissions rose from the inner rim of the W side of the crater and from the SE flank of the pyroclastic cone. Discolored brown-to-green water was observed around almost the entire perimeter of the island; on 22 June light green discolored water was observed off the S coast of the island.
Observations from the Himawari meteorological satellite confirmed an eruption on 9 and 10 July. An eruption plume rose 1.6 km above the crater and drifted N around 1300 on 9 July. Satellite images acquired at 1420 and 2020 on 9 July and at 0220 on 10 July showed continuing emissions that rose 1.3-1.6 km above the crater and drifted NE and N. The Tokyo VAAC reported that an ash plume seen by a pilot and identified in a satellite image at 0630 on 21 July rose to 3 km altitude and drifted S.
Aerial observations conducted by JCG on 8 August showed a white-and-gray plume rising from the central crater of the pyroclastic cone, and multiple white gas-and-steam emissions were rising from the inner edge of the western crater and along the NW-SE flanks of the island (figure 126). Brown-to-green discolored water was also noted around the perimeter of the island.
Intermittent low-to-moderate power thermal anomalies were recorded in the MIROVA graph (Middle InfraRed Observation of Volcanic Activity), showing an increase in both frequency and power beginning in July (figure 127). This increase in activity coincides with eruptive activity on 9 and 10 July, characterized by eruption plumes. According to the MODVOLC thermal alert algorithm, one thermal hotspot was recorded on 20 July. Weak thermal anomalies were also detected in infrared satellite imagery, accompanied by strong gas-and-steam plumes (figure 128).
Geologic Background. The small island of Nishinoshima was enlarged when several new islands coalesced during an eruption in 1973-74. Multiple eruptions that began in 2013 completely covered the previous exposed surface and continued to enlarge the island. The island is the summit of a massive submarine volcano that has prominent peaks to the S, W, and NE. The summit of the southern cone rises to within 214 m of the ocean surface 9 km SSE.
Information Contacts: Japan Meteorological Agency (JMA), 1-3-4 Otemachi, Chiyoda-ku, Tokyo 100-8122, Japan (URL: http://www.jma.go.jp/jma/indexe.html); Tokyo Volcanic Ash Advisory Center (VAAC), 1-3-4 Otemachi, Chiyoda-ku, Tokyo 100-8122, Japan (URL: http://ds.data.jma.go.jp/svd/vaac/data/); MIROVA (Middle InfraRed Observation of Volcanic Activity), a collaborative project between the Universities of Turin and Florence (Italy) supported by the Centre for Volcanic Risk of the Italian Civil Protection Department (URL: http://www.mirovaweb.it/); Copernicus Browser, Copernicus Data Space Ecosystem, European Space Agency (URL: https://dataspace.copernicus.eu/browser/).
Krakatau (Indonesia) — October 2023 Cite this Report
Krakatau
Indonesia
6.1009°S, 105.4233°E; summit elev. 285 m
All times are local (unless otherwise noted)
White gas-and-steam plumes and occasional ash plumes during May-August 2023
Krakatau is located in the Sunda Strait between Java and Sumatra, Indonesia. Caldera collapse during the catastrophic 1883 eruption destroyed Danan and Perbuwatan cones and left only a remnant of Rakata. The post-collapse cone of Anak Krakatau (Child of Krakatau) was constructed within the 1883 caldera at a point between the former Danan and Perbuwatan cones; it has been the site of frequent eruptions since 1927. The current eruption period began in May 2021 and has recently consisted of Strombolian eruptions and ash plumes (BGVN 48:07). This report describes lower levels of activity consisting of ash and white gas-and-steam plumes during May through August 2023, based on information provided by the Indonesian Center for Volcanology and Geological Hazard Mitigation, referred to as Pusat Vulkanologi dan Mitigasi Bencana Geologi (PVMBG), MAGMA Indonesia, and satellite data.
Activity was relatively low during May and June. Daily white gas-and-steam emissions rose 25-200 m above the crater and drifted in different directions. Five ash plumes were detected at 0519 on 10 May, 1241 on 11 May, 0920 on 12 May, 2320 on 12 May, and at 0710 on 13 May, and rose 1-2.5 km above the crater and drifted SW. A webcam image taken on 12 May showed ejection of incandescent material above the vent. A total of nine ash plumes were detected during 6-11 June: at 1434 and 00220 on 6 and 7 June the ash plumes rose 500 m above the crater and drifted NW, at 1537 on 8 June the ash plume rose 1 km above the crater and drifted SW, at 0746 and at 0846 on 9 June the ash plumes rose 800 m and 3 km above the crater and drifted SW, respectively, at 0423, 1431, and 1750 on 10 June the ash plumes rose 2 km, 1.5 km, and 3.5 km above the crater and drifted NW, respectively, and at 0030 on 11 June an ash plume rose 2 km above the crater and drifted NW. Webcam images taken on 10 and 11 June at 0455 and 0102, respectively, showed incandescent material ejected above the vent. On 19 June an ash plume at 0822 rose 1.5 km above the crater and drifted SE.
Similar low activity of white gas-and-steam emissions and few ash plumes were reported during July and August. Daily white gas-and-steam emissions rose 25-300 m above the crater and drifted in multiple directions. Three ash plumes were reported at 0843, 0851, and 0852 on 20 July that rose 500-2,000 m above the crater and drifted NW.
The MIROVA (Middle InfraRed Observation of Volcanic Activity) graph of MODIS thermal anomaly data showed intermittent low-to-moderate power thermal anomalies during May through August 2023 (figure 140). Although activity was often obscured by weather clouds, a thermal anomaly was visible in an infrared satellite image of the crater on 12 May, accompanied by an eruption plume that drifted SW (figure 141).
Geologic Background. The renowned Krakatau (frequently mis-named as Krakatoa) volcano lies in the Sunda Strait between Java and Sumatra. Collapse of an older edifice, perhaps in 416 or 535 CE, formed a 7-km-wide caldera. Remnants of that volcano are preserved in Verlaten and Lang Islands; subsequently the Rakata, Danan, and Perbuwatan cones were formed, coalescing to create the pre-1883 Krakatau Island. Caldera collapse during the catastrophic 1883 eruption destroyed Danan and Perbuwatan, and left only a remnant of Rakata. This eruption caused more than 36,000 fatalities, most as a result of tsunamis that swept the adjacent coastlines of Sumatra and Java. Pyroclastic surges traveled 40 km across the Sunda Strait and reached the Sumatra coast. After a quiescence of less than a half century, the post-collapse cone of Anak Krakatau (Child of Krakatau) was constructed within the 1883 caldera at a point between the former Danan and Perbuwatan cones. Anak Krakatau has been the site of frequent eruptions since 1927.
Information Contacts: Pusat Vulkanologi dan Mitigasi Bencana Geologi (PVMBG, also known as Indonesian Center for Volcanology and Geological Hazard Mitigation, CVGHM), Jalan Diponegoro 57, Bandung 40122, Indonesia (URL: http://www.vsi.esdm.go.id/); MAGMA Indonesia, Kementerian Energi dan Sumber Daya Mineral (URL: https://magma.esdm.go.id/v1); MIROVA (Middle InfraRed Observation of Volcanic Activity), a collaborative project between the Universities of Turin and Florence (Italy) supported by the Centre for Volcanic Risk of the Italian Civil Protection Department (URL: http://www.mirovaweb.it/); Copernicus Browser, Copernicus Data Space Ecosystem, European Space Agency (URL: https://dataspace.copernicus.eu/browser/).
Villarrica (Chile) — October 2023 Cite this Report
Villarrica
Chile
39.42°S, 71.93°W; summit elev. 2847 m
All times are local (unless otherwise noted)
Strombolian activity, gas-and-ash emissions, and crater incandescence during April-September 2023
Villarrica, in central Chile, consists of a 2-km-wide caldera that formed about 3,500 years ago and is located at the base of the presently active cone at the NW margin of a 6-km-wide caldera. Historical eruptions eruptions date back to 1558 and have been characterized by mild-to-moderate explosive activity with occasional lava effusions. The current eruption period began in December 2014 and has recently consisted of nighttime crater incandescence, ash emissions, and seismicity (BGVN 48:04). This report covers activity during April through September 2023 and describes occasional Strombolian activity, gas-and-ash emissions, and nighttime crater incandescence. Information for this report primarily comes from the Southern Andes Volcano Observatory (Observatorio Volcanológico de Los Andes del Sur, OVDAS), part of Chile's National Service of Geology and Mining (Servicio Nacional de Geología y Minería, SERNAGEOMIN) and satellite data.
Seismicity during April consisted of long period (LP) events and tremor (TRE); a total of 9,413 LP-type events and 759 TR-type events were detected throughout the month. Nighttime crater incandescence persisted and was visible in the degassing column. Sulfur dioxide data was obtained using Differential Absorption Optical Spectroscopy Equipment (DOAS) that showed an average value of 1,450 ± 198 tons per day (t/d) during 1-15 April and 1,129 ± 201 t/d during 16-30 April, with a maximum daily value of 2,784 t/d on 9 April. Gas-and-steam emissions of variable intensities rose above the active crater as high as 1.3 km above the crater on 13 April. Strombolian explosions were not observed and there was a slight decrease in the lava lake level.
There were 14,123 LP-type events and 727 TR-type events detected during May. According to sulfur dioxide measurements taken with DOAS equipment, the active crater emitted an average value of 1,826 ± 482 t/d during 1-15 May and 912 ± 41 t/d during 16-30 May, with a daily maximum value of 5,155 t/d on 13 May. Surveillance cameras showed continuous white gas-and-steam emissions that rose as high as 430 m above the crater on 27 May. Nighttime incandescence illuminated the gas column less than 300 m above the crater rim was and no pyroclastic emissions were reported. A landslide was identified on 13 May on the E flank of the volcano 50 m from the crater rim and extending 300 m away; SERNAGEOMIN noted that this event may have occurred on 12 May. During the morning of 27 and 28 May minor Strombolian explosions characterized by incandescent ejecta were recorded at the crater rim; the last reported Strombolian explosions had occurred at the end of March.
Seismic activity during June consisted of five volcano-tectonic (VT)-type events, 21,606 LP-type events, and 2,085 TR-type events. The average value of sulfur dioxide flux obtained by DOAS equipment was 1,420 ± 217 t/d during 1-15 June and 2,562 ± 804 t/d, with a maximum daily value of 4,810 t/d on 17 June. White gas-and-steam emissions rose less than 480 m above the crater; frequent nighttime crater incandescence was reflected in the degassing plume. On 12 June an emission rose 100 m above the crater and drifted NNW. On 15 June one or several emissions resulted in ashfall to the NE as far as 5.5 km from the crater, based on a Skysat satellite image. Several Strombolian explosions occurred within the crater; activity on 15 June was higher energy and ejected blocks 200-300 m on the NE slope. Surveillance cameras showed white gas-and-steam emissions rising 480 m above the crater on 16 June. On 19 and 24 June low-intensity Strombolian activity was observed, ejecting material as far as 200 m from the center of the crater to the E.
During July, seismicity included 29,319 LP-type events, 3,736 TR-type events, and two VT-type events. DOAS equipment recorded two days of sulfur dioxide emissions of 4,220 t/d and 1,009 t/d on 1 and 13 July, respectively. Constant nighttime incandescence was also recorded and was particularly noticeable when accompanied by eruptive columns on 12 and 16 July. Minor explosive events were detected in the crater. According to Skysat satellite images taken on 12, 13, and 16 July, ashfall deposits were identified 155 m S of the crater. According to POVI, incandescence was visible from two vents on the crater floor around 0336 on 12 July. Gas-and-ash emissions rose as high as 1.2 km above the crater on 13 July and drifted E and NW. A series of gas-and-steam pulses containing some ash deposited material on the upper E flank around 1551 on 13 July. During 16-31 July, average sulfur dioxide emissions of 1,679 ± 406 t/d were recorded, with a maximum daily value of 2,343 t/d on 28 July. Fine ash emissions were also reported on 16, 17, and 23 July.
Seismicity persisted during August, characterized by 27,011 LP-type events, 3,323 TR-type events, and three VT-type events. The average value of sulfur dioxide measurements taken during 1-15 August was 1,642 ± 270 t/d and 2,207 ± 4,549 t/d during 16-31 August, with a maximum daily value of 3,294 t/d on 27 August. Nighttime crater incandescence remained visible in degassing columns. White gas-and-steam emissions rose 480 m above the crater on 6 August. According to a Skysat satellite image from 6 August, ash accumulation was observed proximal to the crater and was mainly distributed toward the E slope. White gas-and-steam emissions rose 320 m above the crater on 26 August. Nighttime incandescence and Strombolian activity that generated ash emissions were reported on 27 August.
Seismicity during September was characterized by five VT-type events, 12,057 LP-type events, and 2,058 TR-type events. Nighttime incandescence persisted. On 2 September an ash emission rose 180 m above the crater and drifted SE at 1643 (figure 125) and a white gas-and-steam plume rose 320 m above the crater. According to the Buenos Aires VAAC, periods of continuous gas-and-ash emissions were visible in webcam images from 1830 on 2 September to 0110 on 3 September. Strombolian activity was observed on 2 September and during the early morning of 3 September, the latter event of which generated an ash emission that rose 60 m above the crater and drifted 100 m from the center of the crater to the NE and SW. Ashfall was reported to the SE and S as far as 750 m from the crater. The lava lake was active during 3-4 September and lava fountaining was visible for the first time since 26 March 2023, according to POVI. Fountains captured in webcam images at 2133 on 3 September and at 0054 on 4 September rose as high as 60 m above the crater rim and ejected material onto the upper W flank. Sulfur dioxide flux of 1,730 t/d and 1,281 t/d was measured on 3 and 4 September, respectively, according to data obtained by DOAS equipment.
Strong Strombolian activity and larger gas-and-ash plumes were reported during 18-20 September. On 18 September activity was also associated with energetic LP-type events and notable sulfur dioxide fluxes (as high as 4,277 t/d). On 19 September Strombolian activity and incandescence were observed. On 20 September at 0914 ash emissions rose 50 m above the crater and drifted SSE, accompanied by Strombolian activity that ejected material less than 100 m SSE, causing fall deposits on that respective flank. SERNAGEOMIN reported that a Planet Scope satellite image taken on 20 September showed the lava lake in the crater, measuring 32 m x 35 m and an area of 0.001 km2. Several ash emissions were recorded at 0841, 0910, 1251, 1306, 1312, 1315, and 1324 on 23 September and rose less than 150 m above the crater. The sulfur dioxide flux value was 698 t/d on 23 September and 1,097 t/d on 24 September. On 24 September the Volcanic Alert Level (VAL) was raised to Orange (the third level on a four-color scale). SENAPRED maintained the Alert Level at Yellow (the middle level on a three-color scale) for the communities of Villarrica, Pucón (16 km N), Curarrehue, and Panguipulli.
During 24-25 September there was an increase in seismic energy (observed at TR-events) and acoustic signals, characterized by 1 VT-type event, 213 LP-type events, and 124 TR-type events. Mainly white gas-and-steam emissions, in addition to occasional fine ash emissions were recorded. During the early morning of 25 September Strombolian explosions were reported and ejected material 250 m in all directions, though dominantly toward the NW. On 25 September the average value of sulfur dioxide flux was 760 t/d. Seismicity during 25-30 September consisted of five VT-type events, 1,937 LP-type events, and 456 TR-type events.
During 25-29 September moderate Strombolian activity was observed and ejected material as far as the crater rim. In addition, ash pulses lasting roughly 50 minutes were observed around 0700 and dispersed ENE. During 26-27 September a TR episode lasted 6.5 hours and was accompanied by discrete acoustic signals. Satellite images from 26 September showed a spatter cone on the crater floor with one vent that measured 10 x 14 m and a smaller vent about 35 m NE of the cone. SERNAGEOMIN reported an abundant number of bomb-sized blocks up to 150 m from the crater, as well as impact marks on the snow, which indicated explosive activity. A low-altitude ash emission was observed drifting NW around 1140 on 28 September, based on webcam images. Between 0620 and 0850 on 29 September an ash emission rose 60 m above the crater and drifted NW. During an overflight taken around 1000 on 29 September scientists observed molten material in the vent, a large accumulation of pyroclasts inside the crater, and energetic degassing, some of which contained a small amount of ash. Block-sized pyroclasts were deposited on the internal walls and near the crater, and a distal ash deposit was also visible. The average sulfur dioxide flux measured on 28 September was 344 t/d. Satellite images taken on 29 September ashfall was deposited roughly 3 km WNW from the crater and nighttime crater incandescence remained visible. The average sulfur dioxide flux value from 29 September was 199 t/d. On 30 September at 0740 a pulsating ash emission rose 1.1 km above the crater and drifted NNW (figure 126). Deposits on the S flank extended as far as 4.5 km from the crater rim, based on satellite images from 30 September.
Infrared MODIS satellite data processed by MIROVA (Middle InfraRed Observation of Volcanic Activity) showed intermittent thermal activity during April through September, with slightly stronger activity detected during late September (figure 127). Small clusters of thermal activity were detected during mid-June, early July, early August, and late September. According to the MODVOLC thermal alert system, a total of four thermal hotspots were detected on 7 July and 3 and 23 September. This activity was also intermittently captured in infrared satellite imagery on clear weather days (figure 128).
Geologic Background. The glacier-covered Villarrica stratovolcano, in the northern Lakes District of central Chile, is ~15 km south of the city of Pucon. A 2-km-wide caldera that formed about 3,500 years ago is located at the base of the presently active, dominantly basaltic to basaltic andesite cone at the NW margin of a 6-km-wide Pleistocene caldera. More than 30 scoria cones and fissure vents are present on the flanks. Plinian eruptions and pyroclastic flows that have extended up to 20 km from the volcano were produced during the Holocene. Lava flows up to 18 km long have issued from summit and flank vents. Eruptions documented since 1558 CE have consisted largely of mild-to-moderate explosive activity with occasional lava effusion. Glaciers cover 40 km2 of the volcano, and lahars have damaged towns on its flanks.
Information Contacts: Servicio Nacional de Geología y Minería (SERNAGEOMIN), Observatorio Volcanológico de Los Andes del Sur (OVDAS), Avda Sta María No. 0104, Santiago, Chile (URL: http://www.sernageomin.cl/); Proyecto Observación Villarrica Internet (POVI) (URL: http://www.povi.cl/); Sistema y Servicio Nacional de Prevención y Repuesta Ante Desastres (SENAPRED), Av. Beauchef 1671, Santiago, Chile (URL: https://web.senapred.cl/); Buenos Aires Volcanic Ash Advisory Center (VAAC), Servicio Meteorológico Nacional-Fuerza Aérea Argentina, 25 de mayo 658, Buenos Aires, Argentina (URL: http://www.smn.gov.ar/vaac/buenosaires/inicio.php); MIROVA (Middle InfraRed Observation of Volcanic Activity), a collaborative project between the Universities of Turin and Florence (Italy) supported by the Centre for Volcanic Risk of the Italian Civil Protection Department (URL: http://www.mirovaweb.it/); Hawai'i Institute of Geophysics and Planetology (HIGP) - MODVOLC Thermal Alerts System, School of Ocean and Earth Science and Technology (SOEST), Univ. of Hawai'i, 2525 Correa Road, Honolulu, HI 96822, USA (URL: http://modis.higp.hawaii.edu/); Copernicus Browser, Copernicus Data Space Ecosystem, European Space Agency (URL: https://dataspace.copernicus.eu/browser/).
Merapi (Indonesia) — October 2023 Cite this Report
Merapi
Indonesia
7.54°S, 110.446°E; summit elev. 2910 m
All times are local (unless otherwise noted)
Frequent incandescent avalanches during April-September 2023
Merapi, located just north of the major city of Yogyakarta in central Java, Indonesia, has had activity within the last 20 years characterized by pyroclastic flows and lahars accompanying growth and collapse of the steep-sided active summit lava dome. The current eruption period began in late December 2020 and has more recently consisted of ash plumes, intermittent incandescent avalanches of material, and pyroclastic flows (BGVN 48:04). This report covers activity during April through September 2023, based on information from Balai Penyelidikan dan Pengembangan Teknologi Kebencanaan Geologi (BPPTKG), the Center for Research and Development of Geological Disaster Technology, a branch of PVMBG which specifically monitors Merapi. Additional information comes from the Pusat Vulkanologi dan Mitigasi Bencana Geologi (PVMBG, also known as Indonesian Center for Volcanology and Geological Hazard Mitigation, CVGHM), MAGMA Indonesia, the Darwin Volcanic Ash Advisory Centre (VAAC), and various satellite data.
Activity during April through September 2023 primarily consisted of incandescent avalanches of material that mainly affected the SW and W flanks and traveled as far as 2.3 km from the summit (table 25) and white gas-and-steam emissions that rose 10-1,000 m above the crater.
Table 25. Monthly summary of avalanches and avalanche distances recorded at Merapi during April through September 2023. The number of reported avalanches does not include instances where possible avalanches were heard but could not be visually confirmed as a result of inclement weather. Data courtesy of BPPTKG (April-September 2023 daily reports).
| Month |
Average number of avalanches per day |
Distance avalanches traveled (m) |
| Apr 2023 |
19 |
1,200-2,000 |
| May 2023 |
22 |
500-2,000 |
| Jun 2023 |
18 |
1,200-2,000 |
| Jul 2023 |
30 |
300-2,000 |
| Aug 2023 |
25 |
400-2,300 |
| Sep 2023 |
23 |
600-2,000 |
BPPTKG reported that during April and May white gas-and-steam emissions rose 10-750 m above the crater, incandescent avalanches descended 500-2,000 m on the SW and W flanks (figure 135). Cloudy weather often prevented clear views of the summit, and sometimes avalanches could not be confirmed. According to a webcam image, a pyroclastic flow was visible on 17 April at 0531. During the week of 28 April and 4 May a pyroclastic flow was reported on the SW flank, traveling up to 2.5 km. According to a drone overflight taken on 17 May the SW lava dome volume was an estimated 2,372,800 cubic meters and the dome in the main crater was an estimated 2,337,300 cubic meters.
During June and July similar activity persisted with white gas-and-steam emissions rising 10-350 m above the crater and frequent incandescent avalanches that traveled 300-2,000 m down the SW, W, and S flanks (figure 136). Based on an analysis of aerial photos taken on 24 June the volume of the SW lava dome was approximately 2.5 million cubic meters. A pyroclastic flow was observed on 5 July that traveled 2.7 km on the SW flank. According to the Darwin VAAC multiple minor ash plumes were identified in satellite images on 19 July that rose to 3.7 km altitude and drifted S and SW. During 22, 25, and 26 July a total of 17 avalanches descended as far as 1.8 km on the S flank.
Frequent white gas-and-steam emissions continued during August and September, rising 10-450 m above the crater. Incandescent avalanches mainly affected the SW and W flanks and traveled 400-2,300 m from the vent (figure 137). An aerial survey conducted on 10 August was analyzed and reported that estimates of the SW dome volume was 2,764,300 cubic meters and the dome in the main crater was 2,369,800 cubic meters.
Frequent and moderate-power thermal activity continued throughout the reporting period, according to a MIROVA (Middle InfraRed Observation of Volcanic Activity) analysis of MODIS satellite data (figure 138). There was an increase in the number of detected anomalies during mid-May. The MODVOLC thermal algorithm recorded a total of 47 thermal hotspots: six during April, nine during May, eight during June, 15 during July, four during August, and five during September. Some of this activity was captured in infrared satellite imagery on clear weather days, sometimes accompanied by incandescent material on the SW flank (figure 139).
Geologic Background. Merapi, one of Indonesia's most active volcanoes, lies in one of the world's most densely populated areas and dominates the landscape immediately north of the major city of Yogyakarta. It is the youngest and southernmost of a volcanic chain extending NNW to Ungaran volcano. Growth of Old Merapi during the Pleistocene ended with major edifice collapse perhaps about 2,000 years ago, leaving a large arcuate scarp cutting the eroded older Batulawang volcano. Subsequent growth of the steep-sided Young Merapi edifice, its upper part unvegetated due to frequent activity, began SW of the earlier collapse scarp. Pyroclastic flows and lahars accompanying growth and collapse of the steep-sided active summit lava dome have devastated cultivated lands on the western-to-southern flanks and caused many fatalities.
Information Contacts: Balai Penyelidikan dan Pengembangan Teknologi Kebencanaan Geologi (BPPTKG), Center for Research and Development of Geological Disaster Technology (URL: http://merapi.bgl.esdm.go.id/, Twitter: @BPPTKG); MAGMA Indonesia, Kementerian Energi dan Sumber Daya Mineral (URL: https://magma.esdm.go.id/v1); Pusat Vulkanologi dan Mitigasi Bencana Geologi (PVMBG, also known as Indonesian Center for Volcanology and Geological Hazard Mitigation, CVGHM), Jalan Diponegoro 57, Bandung 40122, Indonesia (URL: http://www.vsi.esdm.go.id/); Darwin Volcanic Ash Advisory Centre (VAAC), Bureau of Meteorology, Northern Territory Regional Office, PO Box 40050, Casuarina, NT 0811, Australia (URL: http://www.bom.gov.au/info/vaac/); MIROVA (Middle InfraRed Observation of Volcanic Activity), a collaborative project between the Universities of Turin and Florence (Italy) supported by the Centre for Volcanic Risk of the Italian Civil Protection Department (URL: http://www.mirovaweb.it/); Hawai'i Institute of Geophysics and Planetology (HIGP) - MODVOLC Thermal Alerts System, School of Ocean and Earth Science and Technology (SOEST), Univ. of Hawai'i, 2525 Correa Road, Honolulu, HI 96822, USA (URL: http://modis.higp.hawaii.edu/); Copernicus Browser, Copernicus Data Space Ecosystem, European Space Agency (URL: https://dataspace.copernicus.eu/browser/); Øystein Lund Andersen (URL: https://www.oysteinlundandersen.com/, https://twitter.com/oysteinvolcano).
Ebeko
Russia
50.686°N, 156.014°E; summit elev. 1103 m
All times are local (unless otherwise noted)
Moderate explosive activity with ash plumes continued during June-November 2023
Ebeko, located on the N end of Paramushir Island in Russia’s Kuril Islands just S of the Kamchatka Peninsula, consists of three summit craters along a SSW-NNE line at the northern end of a complex of five volcanic cones. Observed eruptions date back to the late 18th century and have been characterized as small-to-moderate explosions from the summit crater, accompanied by intense fumarolic activity. The current eruptive period began in June 2022, consisting of frequent explosions, ash plumes, and thermal activity (BGVN 47:10, 48:06). This report covers similar activity during June-November 2023, based on information from the Kamchatka Volcanic Eruptions Response Team (KVERT) and satellite data.
Moderate explosive activity continued during June-November 2023 (figures 50 and 51). According to visual data from Severo-Kurilsk, explosions sent ash 2-3.5 km above the summit (3-4.5 km altitude) during most days during June through mid-September. Activity after mid-September was slightly weaker, with ash usually reaching less than 2 km above the summit. According to KVERT the volcano in October and November was, with a few exceptions, either quiet or obscured by clouds that prevented satellite observations. KVERT issued Volcano Observatory Notices for Aviation (VONA) on 8 and 12 June, 13 and 22 July, 3 and 21 August, and 31 October warning of potential aviation hazards from ash plumes drifting 3-15 km from the volcano. Based on satellite data, KVERT reported a persistent thermal anomaly whenever weather clouds permitted viewing.
Geologic Background. The flat-topped summit of the central cone of Ebeko volcano, one of the most active in the Kuril Islands, occupies the northern end of Paramushir Island. Three summit craters located along a SSW-NNE line form Ebeko volcano proper, at the northern end of a complex of five volcanic cones. Blocky lava flows extend west from Ebeko and SE from the neighboring Nezametnyi cone. The eastern part of the southern crater contains strong solfataras and a large boiling spring. The central crater is filled by a lake about 20 m deep whose shores are lined with steaming solfataras; the northern crater lies across a narrow, low barrier from the central crater and contains a small, cold crescentic lake. Historical activity, recorded since the late-18th century, has been restricted to small-to-moderate explosive eruptions from the summit craters. Intense fumarolic activity occurs in the summit craters, on the outer flanks of the cone, and in lateral explosion craters.
Information Contacts: Kamchatka Volcanic Eruptions Response Team (KVERT), Far Eastern Branch, Russian Academy of Sciences, 9 Piip Blvd., Petropavlovsk-Kamchatsky, 683006, Russia (URL: http://www.kscnet.ru/ivs/kvert/).
Search Bulletin Archive by Publication Date
Select a month and year from the drop-downs and click "Show Issue" to have that issue displayed in this tab.
The default month and year is the latest issue available.
Bulletin of the Global Volcanism Network - Volume 28, Number 07 (July 2003)
Managing Editor: Edward Venzke
Anatahan (United States)
Observations of deposits from the eruptive sequence that began 10 May 2003
Arenal (Costa Rica)
September 2000-October 2001 eruptions include pyroclastic flows
Awu (Indonesia)
Elevated seismicity during last half of 2000
Bezymianny (Russia)
26 July 2003 ash plume to 8-11 km altitude
Chikurachki (Russia)
Infrequent observations suggest weaker eruptions continued in July 2003
Colima (Mexico)
Small explosions produced, including two on 17 July; absence of lava flows
Dieng Volcanic Complex (Indonesia)
Mud bubbling and outflows at Sileri crater that reached 50 m beyond crater rim
Gamalama (Indonesia)
Ashfall from 31 July eruption coats Ternate; pyroclastic flow
Kanlaon (Philippines)
1-km-high plume of ash-laden steam on 10-11 July 2003
Karangetang (Indonesia)
June 2003 ash plumes and two lava avalanches
Karymsky (Russia)
May-July ash plumes; affiliated seismicity and satellite thermal anomalies
Klyuchevskoy (Russia)
Gas-and-steam plumes June-August with occassional ash plumes
Krakatau (Indonesia)
Foggy weather and low seismicity
Lewotobi (Indonesia)
June-July ash plumes reported by pilots
Negro, Cerro (Nicaragua)
Slumbering volcano yields uneventful seismic and fumarolic temperature data
Papandayan (Indonesia)
After the explosions of November 2002, seismicity and eruptions waned
Semeru (Indonesia)
Ash plumes, pyroclastic flows, and high seismicity continue through June
Sheveluch (Russia)
Lava dome growth and ash-and-gas plumes to 5 km high
Soufriere Hills (United Kingdom)
Changes in activity style and dome growth since February 2002
Stromboli (Italy)
Flank eruption finished as of 22 July; activity resumed at summit craters on 17 April
Yellowstone (United States)
Geyser basin heats up, affecting thermal features
Anatahan (United States) — July 2003 Cite this Report
Anatahan
United States
16.35°N, 145.67°E; summit elev. 790 m
All times are local (unless otherwise noted)
Observations of deposits from the eruptive sequence that began 10 May 2003
Anatahan erupted on the evening of 10 May 2003 (BGVN 28:04). The volcano, which forms the uninhabited Anatahan Island in the Commonwealth of the Northern Mariana Islands (CNMI), had no recorded historical eruptions. This report provides observations from a 25 July 2003 report (updated 31 July 2003) by the University of Tokyo Earthquake Research Institute (ERI) documenting fieldwork by their team during 16-19 July 2003. During the inspection, the volcano was quiet, with only weak steaming at the active crater. Seismicity reported by the Commonwealth of the Northern Mariana Islands (CNMI) Emergency Management Office continued into early August.
Tephra deposits. The recent eruption left recognizable tephra deposits consisting mainly of pumice-bearing brown ash in a lower unit and fine gray ash in an upper unit (figure 10). Both the upper and lower units consist of many sub-layers. At the village (NW end of the island) the total thickness of brown ash was 20 cm and gray ash was 3 cm.
At the SE part of the island tephra deposits were less than 3 cm thick. Although grass and trees did not show heat damage, plastic bottles had melted. The outer S slope of the active crater in the E caldera was thickly covered by gray ash. Many rills and gullies developed on these deposits due to the impermeable nature of the gray ash, which typically consisted of very fine particles. Occasionally the observers noted partly broken, stripped trees on the slopes, with a thick cover of gray tephra accumulated on the side facing the active crater. Tephra was ~20 cm thick near the crater rim and pumice-bearing tephra below was ~25 cm thick. The latter included blocks and fragments of pumice.
Inside the W caldera, tephra deposits reached a thickness of up to 1 m. Gray ash was deposited most thickly NW of the crater. Pumice-bearing tephra was thickest in the WSW direction from the crater. The latter is consistent with the drift direction of eruption plumes in the earliest stage shown by satellite images (BGVN 28:06). Although most of the trees had survived falling pumice early during the eruption, they were toppled by the strong lateral movement of gray ash during the phreatic phase.
Crater observations. The mid-July fieldwork included two days of helicopter inspection; observers saw only steaming at the active crater. That crater occupied the S part of the E crater, which lies inside the E caldera. The S wall of the active crater extended directly into the wall of the E crater. The new crater was ~300 m across and ~100 m deep, with the deepest part in the S containing a dried-out mud pool.
A mound-like but rugged-ridged lava dome protruded along the active crater's inner N periphery (figure 11). The surface of this recently erupted dome lay beneath a thick cover of gray ash associated with the phreatic eruption. Infrared camera images indicate that it remained at higher temperature than deposits outside the crater.
The dome may have been broken by explosive eruptions in mid-June when high seismic and visual activities were reported. Products of a reamed-out dome may have been broken into small clasts, widely dispersed, and buried by later deposits. On the other hand, neither bombs nor blocks were clearly visible on the floors of either the E crater (outside the pyroclastic cone) or in the E caldera. Thus, the absence of large blocks of lava dome around the active crater could suggest that the original dimensions of the lava dome may have been small and that the dome had undergone comparatively little sculpting by later explosions.
A low pyroclastic cone developed on the crater's N side (figure 11). The maximum thickness of newly deposited tephra exposed in a gully through this cone reached ~20 m.
Chemistry and degassing of magma. Pumice from this eruption was crystal-poor and light to dark brown in color. A pumice block with a light-brown crust and dark-brown vesicular core collected from the pumice-fall layer just S of the active crater was analyzed by x-ray fluorescence spectroscopy at ERI. The crust and core parts were separately analyzed; each contained 61 weight percent SiO2.
Observers saw blue- to purple-colored gas escaping the active crater and smelled a strong rotten-egg near the S rim of the E caldera on 18 July. Instrumental concentration estimates measured 2-4 ppm SO2 and 0.5 ppm H2S. The SO2 emission rate remained moderate to low throughout the inspection; the total SO2 flux was probably less than several thousand tons a day, similar to that at Sakurajima, Japan.
Ongoing activity, July into early August. According to CNMI reports, volcanic tremor and other seismicity at Anatahan persisted through July and into August 2003 at a relatively low level. On 1 August the Anatahan seismic station registered a small swarm of a dozen or so long-period (LP) events of approximate magnitude 1; similar swarms occurred on 4 and 5 August. Several hundred small (LP) events occurred during 5-6 August. The number of small LP events was greater than that of previous days, but the overall energy release appears not to have increased significantly. No LP events were recorded on 7 August.
Geologic Background. The elongate, 9-km-long island of Anatahan in the central Mariana Islands consists of a large stratovolcano with a 2.3 x 5 km compound summit caldera. The larger western portion of the caldera is 2.3 x 3 km wide, and its western rim forms the island's high point. Ponded lava flows overlain by pyroclastic deposits fill the floor of the western caldera, whose SW side is cut by a fresh-looking smaller crater. The 2-km-wide eastern portion of the caldera contained a steep-walled inner crater whose floor prior to the 2003 eruption was only 68 m above sea level. A submarine cone, named NE Anatahan, rises to within 460 m of the sea surface on the NE flank, and numerous other submarine vents are found on the NE-to-SE flanks. Sparseness of vegetation on the most recent lava flows had indicated that they were of Holocene age, but the first historical eruption did not occur until May 2003, when a large explosive eruption took place forming a new crater inside the eastern caldera.
Information Contacts: Setsuya Nakada and Teruyuki Kato, Volcano Research Center, Earthquake Research Institute (ERI), University of Tokyo (URL: http://www.eri.u-tokyo.ac.jp/VRC/index_E.html); Takeshi Matsushima, Institute of Seismology and Volcanology (SEVO), Kyushu University, Japan; Juan Takai Camacho and Ramon Chong, Commonwealth of the Northern Mariana Islands (CNMI) Emergency Management Office, P.O. Box 10007, Saipan, MP 96950, USA (URL: http://www.cnmihsem.gov.mp/).
Arenal
Costa Rica
10.463°N, 84.703°W; summit elev. 1670 m
All times are local (unless otherwise noted)
September 2000-October 2001 eruptions include pyroclastic flows
During September 2000-October 2001 Arenal issued frequent Strombolian eruptions, occasional avalanches, and several episodes with sizable pyroclastic flows (PFs). Crater D remained fumarolic, with the eruptive activity centered at crater C. Crater C also emitted lava flows (as many as three simultaneously) down Arenal's NE-NW sides. In some cases the site of pyroclastic-flow (PF) generation came from outside crater C, emerging where lava flows perched on the slopes, broke open, and violently released blocks, ash, and gas (block-and-ash flows).
In September-November 2000, OVSICORI-UNA reports noted that the lava flows that began after the 23 August PFs descended the N flank, and during that month had fronts at ~900 m elevation. Sporadic avalanches broke off the lava flow fronts. One such episode at 0630 on 11 September 2000 produced a small ash column. September-November ash columns remained under 500 m above crater C. In September and later months cold loose debris came down parts of the edifice, entering the drainages Calle de Arenas, Manolo, Guillermina, and the larger Tabacón and Agua Caliente rivers.
Deformation, as measured by surveys of the distance network, lacked significant changes during August 2000-November 2000. However, between December and April 2001 there were sudden changes in line length, on the order of a centimeter on all lines, and most appreciable on NE-sector lines. The N-NE sectors are also where most of the lava flows and avalanche instability has occurred. Deformation and tilt changes through 2001 were otherwise described as minor.
Two noteworthy PFs, in August 2000 and March 2001, did not correlate with short-term increases in precursory seismicity. Crater C emitted Strombolian eruptions and N-directed lava flows in late February, and produced PFs during March 2001.
Eruptive episode of late March 2001. During 24 and 26 March 2001 PFs descended Arenal (figure 95) in a series of pulses traveling NNE towards Cedeño lake. Both reports from ICE and OVSICORI-UNA presented the eruptive time as about 1245 on the 24th and continuing until about 1600, with OVSICORI-UNA reporting under six pulses and ICE reporting under 10 pulses. ICE reported that the strongest pulses took place at 1258, 1331, and 1400. After that, the pulses became more frequent but of minor size.
ICE reports concluded that PFs reappeared on the 25th, with four pulses between 1348 and 1430. In contrast, OVSICORI-UNA's March report did not conclude that PFs occurred on the 25th and only described pulses on 24 and 26 March. ICE described PFs on the 26th as occurring in fewer than 8 pulses, between the hours of 0917 and 1400. OVSICORI-UNA stated that on the 26th there were fewer than three pulses in the early afternoon. It is clear that a series of PFs occurred over the 3-day (24-26 March) period, with few or none on the 25th.
Seismic signals interpreted by OVSICORI-UNA as PFs typically had durations lasting 100-200 seconds. This provided some measure of their time of origin and descent. These workers found that some very large (up to 36 x 17 x 5 m) incandescent blocks yielded temperatures of over 700°C two days after emplacement. They also reported that on Arenal's slopes the PFs excavated a gully 4 m wide by 500 m long. Field observations also disclosed that PFs or other processes removed part of the summit area, including segments of the cone's upper raised walls.
OVSICORI-UNA noted that the largest PFs accompanied dense clouds of lofted fine ash carried SW. The most distant ash fell over the main entrance to the park, in a pueblo known as El Castillo, and as far as 12 km from the source. OVSICORI-UNA scientists reported the lowest margins of the PFs reached ~660 m elevation.
Field work by ICE scientists Guillermo Alvarado and Francisco Arias revealed PF deposits forming three lobes. The main one was 10-50 m wide and reached 2 km in length. It reached down to 720 m elevation and covered 240,000 m3. When investigated (at an unstated date), its temperature measured over 200°C. The PFs had devastated 6-10 hectares (1 hectare is 104 m2) of primary forest, and the PFs, or related ash fall, heat, or singeing gases, had affected another 15 hectares. After the PFs diminished, lava flows began to escape following the same channel, their fronts later attaining ~1,400 m elevation.
This 24-26 March 2001 episode of PFs was judged to have been of smaller magnitude than the episode of 23 August 2000, a day when 27 pulses of PFs were observed, also directed towards lake Cedeño (BGVN 25:07 and 25:08). On that occasion two people died and another was seriously injured. The March 2001 PFs were without reported injuries or fatalities, although the affected zone was somewhat similar.
According to the ICE report, Alvarado and Arroyo (2000) listed five occasions when Arenal discharged a sequence of PFs for longer than one day (17-21 June 1975, 21-22 February 1989, 9-10 December 1991, 29-30 September 1996, and 19-20 August 1997). Only the sequence during 17-21 June 1975 and their interpretation of one during 24-26 March 2001 lasted more than 2 days. PFs in both of these multi-day sequences attained runout distances of over 1 km; by comparison, the flows during 1989 and 1996 did not surpass half kilometer runout distances. The longest PF occurred in 1975, reaching a 3.5 km runout distance, with the PF's distal portions following the Tabacón river.
April-December 2001. In their report for April 2001 OVSICORI-UNA reported that a lava flow had emerged from crater C decending along the path of the previous month's PFs, with lavas extending from the crater rim to the lava's front at ~1,400 m elevation. Blocks falling off the front reached 950 m elevation in N and NE directions. By the end of May 2001 OVSICORI-UNA noted the descending lavas took the form of three distinct flows that each crossed a different portion of crater C's rim. The three flows continued during June. At that time a sudden change was noted at a thermal spring along the Tabacón valley (NW of Arenal's summit). Its surface dropped by ~60 cm; the temperature of the spring remained stable, however, at 52°C. Deformation in the first half of 2001 showed only minor changes in both surveyed lines and tilt meters. The precise leveling lines on the W flank continued to show deflation on the order of 7 µrad/year.
OVSICORI-UNA stated that on 16 June at 0610 a small PF erupted. Although it failed to cause reported damage, it descended the NW flank in the direction of Balneario de Tabacón (a popular lodging and spa complex with thermal pools) situated farther downslope. During July two of the lava flows (the N- and NE-flank lavas) erupted during May and June stopped progressing. Meanwhile, the third lava flow, which exited crater C on the NW flank, remained active and mobile. During July and August, the eruptive vigor stood at modest levels; still, some eruption columns during July rose 500 m. The August and September reports stated that the one remaining actively progressing lava flow reached 950 and then 900 m elevation, respectively. It descended the same channel followed by the 16 July PF but had advanced little if any farther through October.
More PFs on 19 September 2001, during 1633-1640, and at 1646, were generated by lateral loosening of the lava flow at ~1,300 m elevation; it reached ~900 m elevation. The larger had an associated coffee-colored, mushroom-shaped cloud reaching more than 1 km in height. The associated ash cloud blew SE. PFs descended again on 18 October at 1035 from ~1,200 m elevation NE to 900 m elevation. Winds carried the associated ash cloud W.
Reference. Alvarado, G.E., and Arroyo, I., 2000, The pyroclastic flows of Arenal (Costa Rica) between 1975 and 2000: Origin, frequency, distribution and related hazards: Bulletin Osivam, v. 12, no. 23-24, p. 39-53.
Geologic Background. Conical Volcán Arenal is the youngest stratovolcano in Costa Rica and one of its most active. The 1670-m-high andesitic volcano towers above the eastern shores of Lake Arenal, which has been enlarged by a hydroelectric project. Arenal lies along a volcanic chain that has migrated to the NW from the late-Pleistocene Los Perdidos lava domes through the Pleistocene-to-Holocene Chato volcano, which contains a 500-m-wide, lake-filled summit crater. The earliest known eruptions of Arenal took place about 7000 years ago, and it was active concurrently with Cerro Chato until the activity of Chato ended about 3500 years ago. Growth of Arenal has been characterized by periodic major explosive eruptions at several-hundred-year intervals and periods of lava effusion that armor the cone. An eruptive period that began with a major explosive eruption in 1968 ended in December 2010; continuous explosive activity accompanied by slow lava effusion and the occasional emission of pyroclastic flows characterized the eruption from vents at the summit and on the upper western flank.
Information Contacts: E. Fernández, E. Duarte, E. Malavassi, R. Sáenz, V. Barboza, R. Van der Laat, T. Marino, E. Hernández, and F. Chavarría, Observatorio Vulcanológico y Sismológico de Costa Rica (OVSICORI-UNA); Jorge Barquero and Wendy Sáenz, Laboratorio de Química de la Atmósfera (LAQAT), Depto. de Química, Universidad Nacional, Heredia, Costa Rica; María Martínez (at both affiliations above); Orlando Vaselli and Franco Tassi, Department of Earth Sciences, University of Florence, Via La Pira 4, 50121 Florence, Italy; Ivonne Arroyo and Guillermo Alvarado, Observatorio Sismológico y Vulcanológico de Arenal y Miravalles (OSIVAM) Instituto Costarricense de Electricidad (ICE), Apdo 10032-San José, Costa Rica; Mauricio Mora, Sección de Sismología, Vulcanología y Exploración Geofísica, Universidad de Costa Rica (UCR), Apdo. 214-2060 San José, Costa Rica.
Awu
Indonesia
3.689°N, 125.447°E; summit elev. 1318 m
All times are local (unless otherwise noted)
Elevated seismicity during last half of 2000
The Volcanological Survey of Indonesia (VSI) issued reports of activity at Awu during June-July 2000, November-December 2002, and more recently during January-early March 2003, all of which are summarized here.
During June 2000, VSI reported an increase in seismicity, especially deep volcanic earthquakes (table 1). Satellite-relayed monitoring (by ARGOS) showed an increase in seismic energy beginning on 18 May 2000; deformation data showed inflation of ~800 µrad since 23 May.
Table 1. Seismicity reported at Awu during 13 June 2000-2 March 2003. Courtesy VSI.
| Date |
Deep Volcanic (A-type) |
Shallow Volcanic (B-type) |
Tectonic |
| 13 Jun-19 Jun 2000 |
21 |
-- |
161 |
| 25 Jul-30 Jul 2000 |
389 |
-- |
135 |
| 17 Oct 2002 |
3 |
-- |
-- |
| 20 Oct 2002 |
1 |
-- |
-- |
| 05 Nov 2002 |
1 |
-- |
-- |
| 07 Nov 2002 |
1 |
-- |
-- |
| 09 Nov-12 Nov 2002 |
~2/day |
-- |
-- |
| 11 Nov 2002 |
2 |
-- |
33 |
| 12 Nov 2002 |
2 |
-- |
28 |
| 13 Nov 2002 |
-- |
-- |
22 |
| 14 Nov 2002 |
-- |
-- |
23 |
| 15 Nov 2002 |
56 |
25 |
18 |
| 16 Nov 2002 |
2 |
12 |
26 |
| 17 Nov 2002 |
1 |
1 |
36 |
| 19 Nov-24 Nov 2002 |
12 |
5 |
129 |
| 23 Dec-29 Dec 2002 |
1 |
-- |
196 |
| 06 Jan-12 Jan 2003 |
4 |
-- |
161 |
| 13 Jan-19 Jan 2003 |
2 |
-- |
114 |
| 20 Jan-26 Jan 2003 |
3 |
-- |
151 |
| 27 Jan-02 Feb 2003 |
4 |
-- |
121 |
| 03 Feb-09 Feb 2003 |
5 |
-- |
125 |
| 10 Feb-16 Feb 2003 |
1 |
-- |
95 |
| 17 Feb-23 Feb 2003 |
2 |
-- |
155 |
During 14-16 October 2002, tremor was recorded and was followed by a felt tectonic earthquake with an amplitude of I-II MMI on 10 October. Soon after the tremor activity decreased, volcanic earthquakes began to be recorded (table 1). VSI reported a significant increase in seismicity during mid-November 2002; volcanic earthquakes that normally occurred less than five times per day occurred 81 times on 15 November. Activity decreased to normal levels by late 2002. Visual observations of the summit did not reveal significant changes. Volcanic earthquakes continued during January-early March 2003 (table 1). Awu remained at Alert Level 2 (on a scale of 1-4).
Geologic Background. The massive Gunung Awu stratovolcano occupies the northern end of Great Sangihe Island, the largest of the Sangihe arc. Deep valleys that form passageways for lahars dissect the flanks of the volcano, which was constructed within a 4.5-km-wide caldera. Powerful explosive eruptions in 1711, 1812, 1856, 1892, and 1966 produced devastating pyroclastic flows and lahars that caused more than 8000 cumulative fatalities. Awu contained a summit crater lake that was 1 km wide and 172 m deep in 1922, but was largely ejected during the 1966 eruption.
Information Contacts: Dali Ahmad, Volcanological Survey of Indonesia (VSI), Jalan Diponegoro No. 57, Bandung 40122, Indonesia (URL: http://www.vsi.esdm.go.id/).
Bezymianny
Russia
55.972°N, 160.595°E; summit elev. 2882 m
All times are local (unless otherwise noted)
26 July 2003 ash plume to 8-11 km altitude
According to visual observation from the city of Klyuchi by Yu. Demyanchuk, a large explosive eruption of Bezymianny began at 2120 on 26 July 2003; a later report from KVERT (Kamchatka Volcanic Eruptions Response Team) indicated that the eruption began at 2057. An ash plume rose up to 8-11 km and extended to the W, WNW, and SW. A large pyroclastic flow probably formed.
Prior to the eruption, a weak thermal anomaly was noted on satellite images from 6 July. Two shallow earthquakes of M 1.8 registered on 23 and 25 July.
Satellite data revealed plumes extending WNW at 2122 and 2300 on 26 July, to distances of 31 km and 86 km, respectively. Longer plumes were reported on 27 July to 192 km at 0305 and 217 km at 0445. At 1102 on 27 July, an 8-pixel thermal anomaly was observed with a temperature of 31°C on a background of 10°C. The ash cloud was ~250-300 km W of the vent. At 1258 that day a 5-pixel thermal anomaly was noted with a temperature of 50°C on a background of 35°C. The ash cloud was unchanged, and was also detected at 1325. At 1240 probable pyroclastic deposits were identified on the SE flank.
Satellite observations also noted that at 2058 on 27 July, a 10-pixel thermal anomaly yielded a temperature of 29°C on a background of 9°C. At 0246 on 28 July a 2-to 6-pixel thermal anomaly yielded a temperature of 33°C on a background of 5°C. At 2216 there was a 1-pixel thermal anomaly without accompanying ash. At 0246 and 0715 on 28 July, 2-to 6-pixel thermal anomalies were noted, with temperatures of 33° and 39°C on a background of 5° and 16°C, respectively. No ash was recorded for either event.
No seismicity was registered on 27-30 July, and no visual information was available because of meteorological clouds. Thermal anomalies of 1-to 3-pixels with a temperature of 16-25°C on backgrounds from -3° to 5° C, were observed on 28-29 July, 31 July, and 1 August. No seismicity was registered from 31 July-3 August, in part because of the seismicity due to a large volcanic tremor at nearby Klyuchevskoy. According to visual data, gas-steam plumes extended ~15 km to the NW on 2 August. Clouds obscured the volcano on other days.
Geologic Background. The modern Bezymianny, much smaller than its massive neighbors Kamen and Kliuchevskoi on the Kamchatka Peninsula, was formed about 4,700 years ago over a late-Pleistocene lava-dome complex and an edifice built about 11,000-7,000 years ago. Three periods of intensified activity have occurred during the past 3,000 years. The latest period, which was preceded by a 1,000-year quiescence, began with the dramatic 1955-56 eruption. This eruption, similar to that of St. Helens in 1980, produced a large open crater that was formed by collapse of the summit and an associated lateral blast. Subsequent episodic but ongoing lava-dome growth, accompanied by intermittent explosive activity and pyroclastic flows, has largely filled the 1956 crater.
Information Contacts: Olga Girina, Kamchatka Volcanic Eruptions Response Team (KVERT), a cooperative program of the Institute of Volcanic Geology and Geochemistry, Far East Division, Russian Academy of Sciences, Piip Ave. 9, Petropavlovsk-Kamchatsky, 683006, Russia, the Kamchatka Experimental and Methodical Seismological Department (KEMSD), GS RAS (Russia), and the Alaska Volcano Observatory (USA); Alaska Volcano Observatory (AVO), a cooperative program of the U.S. Geological Survey, 4200 University Drive, Anchorage, AK 99508-4667, USA (URL: http://www.avo.alaska.edu/), the Geophysical Institute, University of Alaska, PO Box 757320, Fairbanks, AK 99775-7320, USA, and the Alaska Division of Geological and Geophysical Surveys, 794 University Ave., Suite 200, Fairbanks, AK 99709, USA.
Chikurachki (Russia) — July 2003 Cite this Report
Chikurachki
Russia
50.324°N, 155.461°E; summit elev. 1781 m
All times are local (unless otherwise noted)
Infrequent observations suggest weaker eruptions continued in July 2003
The eruption of the Chikurachki volcano that began on 18 April 2003 continued into mid-July. Ash explosions, possibly up to 4 km above the crater, diminished, and by 3 July only rose up to 2 km above the crater. The volcano is remote, being ~60 km from Severo-Kurilsk on Paramushir Island. It also lacks seismic instruments, and the Kamchatka Volcanic Eruptions Response Team (KVERT) receives only occasional reports from Severo-Kurilsk.
According to a report from Leonid Kotenko of Severo-Kurilsk, ash explosions up to 500 m above the crater were observed from Shelekhov bay during 1930-2310 on 27 May. Ash plumes extended 70-80 km to the NE. At 0900 on 28 May, an ash plume rose 4 km above the crater and extended over 100 km to the NE. From 1030 on the same day, the plume heights decreased to 500 m above the crater. On 29 May, low-level ash plumes extended 15-20 km to the NE. In the afternoon of 29 May, an ash plume rose ~1.2 km above the crater, extended over Severo-Kurilsk, and ash fell on the town. Explosions occurred continually.
MODIS (moderate resolution imaging spectroradiometer) Terra and Aqua Goddard images from 1105 and 1235 on 30 May, depicted a faint, small ash cloud trending to the E. Clouds obscured the volcano on the other days in later May.
Kotenko reported on 6 June that the eruption continued. On 8 June, an ash plume extended 25-30 km to the SSE. On 9-10 June, the plume did not rise more than 500 m above the volcano and extended SSE. Ash fell on the Podgorny settlement, located at a distance of ~20 km SSE of the volcano. The observers from Shelekhov bay had noted more strong explosions during the night than in the day-time.
In the AVHRR (advanced very-high resolution radiometer) image at 1308 on 6 June, a narrow weak ash plume was observed extending to the SE for about 100 km from the volcano. In MODIS Goddard Terra images at 1100 on 8 June and at 1145 on 9 June, a narrow plume was seen extending to the SE for ~100 km. In the AVHRR image at 1245 on 9 June, this plume was also seen, but no ash was detected. Clouds obscured the volcano on the other days.
According to observers from Shelekhov settlement, on 15-16 June an ash plume was observed constantly at the volcano summit. The plume did not rise upwards, but was bent down the flanks of the volcano by a strong wind. On 17 June, observers saw a short gas-steam plume bent by a gale-force wind. On 18 June, Kotenko reported that the eruption continued. On other days, clouds obscured the volcano and prevented observation. According to the last report from Severo-Kurilsk, on 17-25 June, when the weather was good, fishermen from Shelekhovo bay observed only gas-steam activity from the volcano.
By 3 July, KVERT reported that the eruption of Chikurachki had possibly finished. According to satellite data from the USA and Russia, no activity of the volcano was noted from 25 June through 11 July.
Geologic Background. Chikurachki, the highest volcano on Paramushir Island in the northern Kuriles, is a relatively small cone constructed on a high Pleistocene edifice. Oxidized basaltic-to-andesitic scoria deposits covering the upper part of the young cone give it a distinctive red color. Frequent basaltic Plinian eruptions have occurred during the Holocene. Lava flows have reached the sea and formed capes on the NW coast; several young lava flows are also present on the E flank beneath a scoria deposit. The Tatarinov group of six volcanic centers is located immediately to the south, and the Lomonosov cinder cone group, the source of an early Holocene lava flow that reached the saddle between it and Fuss Peak to the west, lies at the southern end of the N-S-trending Chikurachki-Tatarinov complex. In contrast to the frequently active Chikurachki, the Tatarinov centers are extensively modified by erosion and have a more complex structure. Tephrochronology gives evidence of an eruption around 1690 CE from Tatarinov, although its southern cone contains a sulfur-encrusted crater with fumaroles that were active along the margin of a crater lake until 1959.
Information Contacts: Olga Girina, Kamchatka Volcanic Eruptions Response Team (KVERT), a cooperative program of the Institute of Volcanic Geology and Geochemistry, Far East Division, Russian Academy of Sciences, Piip Ave. 9, Petropavlovsk-Kamchatsky, 683006, Russia, the Kamchatka Experimental and Methodical Seismological Department (KEMSD), GS RAS (Russia), and the Alaska Volcano Observatory (USA); Alaska Volcano Observatory (AVO), a cooperative program of the U.S. Geological Survey, 4200 University Drive, Anchorage, AK 99508-4667, USA (URL: http://www.avo.alaska.edu/), the Geophysical Institute, University of Alaska, PO Box 757320, Fairbanks, AK 99775-7320, USA, and the Alaska Division of Geological and Geophysical Surveys, 794 University Ave., Suite 200, Fairbanks, AK 99709, USA.
Colima
Mexico
19.514°N, 103.62°W; summit elev. 3850 m
All times are local (unless otherwise noted)
Small explosions produced, including two on 17 July; absence of lava flows
Explosive activity at Colima continued in May and July 2003. A small explosive eruption reported at 1024 on 2 May 2003 produced an ash cloud visible on satellite imagery and monitoring cameras, but rising to no more than 500 m above the crater. The Mexico City Meteorological Watch Office stated that the plume moved SW of the summit at 5-10 knots (9-18 km/hour). The Washington VAAC described the plume as very small.
Nick Varley pointed out on 18 May that the GVP / USGS Weekly Volcanic Activity Report for 7-13 May 2003 incorrectly reported lava flows at Colima. He noted that "No lava has been produced since the beginning of March [2003]. The current activity comprises small explosions, on average some 25 per day, some containing ash. The dispersal of the ash is limited to approximately 7 km from the summit."
More significant explosions were reported on 17 July 2003. The first, at 0527, threw incandescent material 500 m high and an ash column to ~3 km height that blew SW . Small forest fires caused by the incandescent material 2.5-4 km SW of the crater suggested that the explosion was also directed to this sector. An explosion at 1400 on 17 July, produced an ash-laden cloud 1,000 m high, again dispersing SW. The seismic energy released by the 0527 explosion was reported to be less than half that released in the 1999 explosions.
Geologic Background. The Colima complex is the most prominent volcanic center of the western Mexican Volcanic Belt. It consists of two southward-younging volcanoes, Nevado de Colima (the high point of the complex) on the north and the historically active Volcán de Colima at the south. A group of late-Pleistocene cinder cones is located on the floor of the Colima graben west and east of the complex. Volcán de Colima (also known as Volcán Fuego) is a youthful stratovolcano constructed within a 5-km-wide scarp, breached to the south, that has been the source of large debris avalanches. Major slope failures have occurred repeatedly from both the Nevado and Colima cones, producing thick debris-avalanche deposits on three sides of the complex. Frequent recorded eruptions date back to the 16th century. Occasional major explosive eruptions have destroyed the summit (most recently in 1913) and left a deep, steep-sided crater that was slowly refilled and then overtopped by lava dome growth.
Information Contacts: Observatorio Vulcanologico de la Universidad de Colima, Colima, Col., 28045, México (URL: https://portal.ucol.mx/cueiv/); Nick Varley, Facultad de Ciencias, Universidad de Colima Av. 25 de Julio 965, Col. San Sebastian Apdo. postal 25, Colima, CP 28045, México.
Dieng Volcanic Complex (Indonesia) — July 2003 Cite this Report
Dieng Volcanic Complex
Indonesia
7.2°S, 109.879°E; summit elev. 2565 m
All times are local (unless otherwise noted)
Mud bubbling and outflows at Sileri crater that reached 50 m beyond crater rim
According to the Volcanological Survey of Indonesia (VSI), on 20 July 2003 mud poured from Sileri crater. The crater contains a lake and boiling mud pots, and has been the site of small-to-moderate historical eruptions. The incident of 20 July occurred at night and sent mud as far as 25 m S of the crater rim. On 21 July, a temperature measurement of the crater recorded 74°C, no striking increase from earlier measurements.
On the morning of 24 July, another mud outpouring from the crater covered an area up to 50 m N and E of the crater rim. Activity then continued with small areas of mud bubbling and ejecta thrown 1 m high at the middle of the crater. Neither of the mud-outpouring events were recorded on the seismometer 1.1 km S of the crater. The volcano's hazard status was raised to level 2 on 22 July.
Geologic Background. The Dieng plateau in the highlands of central Java is renowned both for the variety of its volcanic scenery and as a sacred area housing Java's oldest Hindu temples, dating back to the 9th century CE. The Dieng Volcanic Complex consists of multiple stratovolcanoes and more than 20 small Pleistocene-to-Holocene craters and cones over a 6 x 14 km area. Prahu stratovolcano was truncated by a large Pleistocene caldera, which was subsequently filled by a series of cones, lava domes, and craters, many containing lakes. Lava flows cover much of the plateau, but observed activity has been restricted to minor phreatic eruptions. Gas emissions are a hazard at several craters and have caused fatalities. There are abundant thermal features and high heat flow across the area.
Information Contacts: Dali Ahmad, Volcanological Survey of Indonesia (VSI), Jalan Diponegoro No. 57, Bandung 40122, Indonesia (URL: http://www.vsi.esdm.go.id/).
Gamalama (Indonesia) — July 2003 Cite this Report
Gamalama
Indonesia
0.81°N, 127.3322°E; summit elev. 1714 m
All times are local (unless otherwise noted)
Ashfall from 31 July eruption coats Ternate; pyroclastic flow
According to the Volcanological Survey of Indonesia (VSI), at 0300 on 31 July 2003, six type-A volcanic earthquakes were recorded. At 0600 the cloud issuing from the crater became thicker, but the gas pressure remained modest and similar to that normally seen. A series of explosive eruptions that began at 1434 sent a dark gray ash column 500-1,000 m high that drifted E toward Sultan Baabulah airport. A second explosion at 1625 produced a dark-gray ash column with strong gas pressure. The ash column rose 1-2 km above rim and drifted E carrying glowing material.
At 1627 a pyroclastic flow into Togorar valley on the NE flank traveled as much as 1 km but did not reach the village. A continuous blasting sound accompanied a series of ash emissions. Between 1704-1812, a dark gray ash column rose to 1,000-1,500 m, then during 1850-2200 a white-gray ash plume rose to 500 m. Several white gas plumes rose 10-150 m from 2209 through 0600 on 1 August. A steady glow was observed from 0200-0400.
After the initial outbursts, during 0000-1430 on 1 August, seismometers registered seven tectonic earthquakes, 16 shallow volcanic earthquakes, and two deep volcanic earthquakes. Continuous tremor also registered, with a maximum amplitude of 29-30 mm. Ashfall was 1-3 cm thick in the E part of the area, and some of the local population was evacuated.
According to local officials, Ternate (the regional capital, ~7 km E of Gamalama) was covered with thick ash. There were no reports of casualties or damage. The hazard status was set at level 3 starting at 1250 on 31 July and raised to the maximum, level 4, at 0000 the next day.
VSI reported that the last eruption occurred in 1996 from the main crater, followed by a pyroclastic flow to the E.
Geologic Background. Gamalama is a near-conical stratovolcano that comprises the entire island of Ternate off the western coast of Halmahera, and is one of Indonesia's most active volcanoes. The island was a major regional center in the Portuguese and Dutch spice trade for several centuries, which contributed to the extensive documentation of activity. Three cones, progressively younger to the north, form the summit. Several maars and vents define a rift zone, parallel to the Halmahera island arc, that cuts the volcano; the S-flank Ngade maar formed after about 14,500–13,000 cal. BP (Faral et al., 2022). Eruptions, recorded frequently since the 16th century, typically originated from the summit craters, although flank eruptions have occurred in 1763, 1770, 1775, and 1962-63.
Information Contacts: Dali Ahmad, Volcanological Survey of Indonesia (VSI), Jalan Diponegoro No. 57, Bandung 40122, Indonesia (URL: http://www.vsi.esdm.go.id/).
Kanlaon (Philippines) — July 2003 Cite this Report
Kanlaon
Philippines
10.4096°N, 123.13°E; summit elev. 2422 m
All times are local (unless otherwise noted)
1-km-high plume of ash-laden steam on 10-11 July 2003
Ash ejections were reported at Canlaon (also spelled Kanlaon) on 10 and 11 July 2003. At 1735 on 10 July a column of ash-laden steam, described as a moderate to strong dirty white color, was seen rising from the volcano to a height of 1 km by observers in Kanlaon City. The cloud drifted to the NW, SW, and NE, with an area within a 4-km radius from the crater affected by ashfall. The explosion registered as a low-frequency volcanic earthquake. Prior to this activity, two low-frequency volcanic earthquakes and two low-frequency short-duration harmonic tremors were recorded by the seismograph at Kanlaon Volcano Station. The phreatic activity continued as of 2000 that night.
Two ash ejections were reported on 11 July, from 0620 to 0624 and 0658 to 0705. Dirty white steam rose up to 1.3 km above the crater and drifted to the SW. The seismic network recorded six low-frequency volcanic earthquakes and three low-frequency short-duration harmonic tremors.
The alert status remained at Level 1 and PHIVOLCS reiterated its warning to the public not to venture within the 4 km radius Permanent Danger Zone.
Geologic Background. Kanlaon volcano (also spelled Canlaon) forms the highest point on the Philippine island of Negros. The massive andesitic stratovolcano is covered with fissure-controlled pyroclastic cones and craters, many of which are filled by lakes. The largest debris avalanche known in the Philippines traveled 33 km SW from Kanlaon. The summit contains a 2-km-wide, elongated northern caldera with a crater lake and a smaller but higher active vent, Lugud crater, to the south. Eruptions recorded since 1866 have typically consisted of phreatic explosions of small-to-moderate size that produce minor local ashfall.
Information Contacts: Philippine Institute of Volcanology and Seismology (PHIVOLCS), Department of Science and Technology, PHIVOLCS Building, C.P. Garcia Avenue, Univ. of the Philippines Campus, Diliman, Quezon City, Philippines (URL: http://www.phivolcs.dost.gov.ph/).
Karangetang (Indonesia) — July 2003 Cite this Report
Karangetang
Indonesia
2.781°N, 125.407°E; summit elev. 1797 m
All times are local (unless otherwise noted)
June 2003 ash plumes and two lava avalanches
Karangetang was the scene of volcanic and seismic unrest during early June 2003. The volcano produced ash plumes up to 400 m high and two lava avalanches.
In reports from the Volcanological Survey of Indonesia (VSI), activity for the week of 2-8 June 2003 was characterized by emissions of white-to-dark gray colored ash from the S crater, rising to 400 m. Observers at night noted a red glow up to 25 m over the crater. In the N crater, a white-colored gas emission rose to 150 m. During this week, a lava avalanche that occurred in the direction of the Batang river reached as far as 1000 m from the crater. There was a decrease in multiphase earthquakes compared to the previous week, but an increase in shallow volcanic earthquakes.
During the week of 9-15 June, white-colored gas emissions came from both the N and the S craters. Observers at night noted a continued red glow up to 25 m over the crater. Another lava avalanche occurred, this time traveling in the direction of the Beha river as far as 1000 m and toward the Batu Awang river as far as 250 m from the crater. There were increases in volcanic earthquakes and avalanche events.
The seismic record for 2-8 June suggested 11 deep volcanic earthquakes, 348 shallow volcanic earthquakes, 233 multiphase earthquakes, 46 emission earthquakes, 110 avalanches, and 26 tectonic earthquakes. The seismic record for 9-15 June noted 32 deep volcanic earthquakes, 438 shallow volcanic earthquakes, one explosion event, 228 multiphase earthquakes, 21 emission earthquakes, 447 avalanches, and 20 tectonic events. The volcano remained at alert level 2 (on a scale reaching a maximum of 4).
Geologic Background. Karangetang (Api Siau) volcano lies at the northern end of the island of Siau, about 125 km NNE of the NE-most point of Sulawesi. The stratovolcano contains five summit craters along a N-S line. It is one of Indonesia's most active volcanoes, with more than 40 eruptions recorded since 1675 and many additional small eruptions that were not documented (Neumann van Padang, 1951). Twentieth-century eruptions have included frequent explosive activity sometimes accompanied by pyroclastic flows and lahars. Lava dome growth has occurred in the summit craters; collapse of lava flow fronts have produced pyroclastic flows.
Information Contacts: Dali Ahmad and Nia Haerani, Volcanological Survey of Indonesia (VSI), Jalan Diponegoro No. 57, Bandung 40122, Indonesia (URL: http://www.vsi.esdm.go.id/).
Karymsky
Russia
54.049°N, 159.443°E; summit elev. 1513 m
All times are local (unless otherwise noted)
May-July ash plumes; affiliated seismicity and satellite thermal anomalies
Dark ash was observed on the NE, SE, and W flanks of the volcano on 30 May in a MODIS (moderate resolution imaging spectroradiometer) Terra image. Intermittent explosive eruptive activity at Karymsky occurred from early June into mid-August 2003, with seismic activity above background levels. Between 90 and 270 local shallow events occurred per day. The character of the seismicity indicated that ash-and-gas explosions to heights of 1,000-2,000 m above the volcano (2,500-3,500 m altitude) and gas blow-outs possibly occurred. On the morning of 17 July a strong, long duration (86 minutes), seismic event occurred that possibly resulted from a large pyroclastic flow or the onset of a new lava emission. Satellite data confirmed the continuing activity (table 3).
Table 3. Thermal anomalies at Karymsky from AVHHR (advanced very-high resolution radiometer) satellite images and visual observation during June and July 2003. Courtesy Kamchatka Volcanic Eruptions Response Team (KVERT).
| Date(s) |
Thermal Anomaly (pixels) |
Comments |
| 03 Jun 2003 |
2 (faint) |
No ash plume observed |
| 22-24 Jun 2003 |
1-4 |
-- |
| 27 Jun 2003 |
-- |
Short narrow plume to NE |
| 28-30 Jun 2003 |
1-4 |
-- |
| 04, 06-09 Jul 2003 |
1-4 |
-- |
| 14-15 Jul 2003 |
2-3 |
-- |
| 13, 16 Jul 2003 |
2-5 |
No ash plumes observed |
| 19 Jul 2003 |
-- |
Ash plume to SW |
| 25, 27-29 Jul 2003 |
1-3 |
-- |
Geologic Background. Karymsky, the most active volcano of Kamchatka's eastern volcanic zone, is a symmetrical stratovolcano constructed within a 5-km-wide caldera that formed during the early Holocene. The caldera cuts the south side of the Pleistocene Dvor volcano and is located outside the north margin of the large mid-Pleistocene Polovinka caldera, which contains the smaller Akademia Nauk and Odnoboky calderas. Most seismicity preceding Karymsky eruptions originated beneath Akademia Nauk caldera, located immediately south. The caldera enclosing Karymsky formed about 7600-7700 radiocarbon years ago; construction of the stratovolcano began about 2000 years later. The latest eruptive period began about 500 years ago, following a 2300-year quiescence. Much of the cone is mantled by lava flows less than 200 years old. Historical eruptions have been vulcanian or vulcanian-strombolian with moderate explosive activity and occasional lava flows from the summit crater.
Information Contacts: Olga Girina, Kamchatka Volcanic Eruptions Response Team (KVERT), a cooperative program of the Institute of Volcanic Geology and Geochemistry, Far East Division, Russian Academy of Sciences, Piip Ave. 9, Petropavlovsk-Kamchatsky, 683006, Russia, the Kamchatka Experimental and Methodical Seismological Department (KEMSD), GS RAS (Russia), and the Alaska Volcano Observatory (USA); Alaska Volcano Observatory (AVO), a cooperative program of the U.S. Geological Survey, 4200 University Drive, Anchorage, AK 99508-4667, USA (URL: http://www.avo.alaska.edu/), the Geophysical Institute, University of Alaska, PO Box 757320, Fairbanks, AK 99775-7320, USA, and the Alaska Division of Geological and Geophysical Surveys, 794 University Ave., Suite 200, Fairbanks, AK 99709, USA.
Klyuchevskoy (Russia) — July 2003 Cite this Report
Klyuchevskoy
Russia
56.056°N, 160.642°E; summit elev. 4754 m
All times are local (unless otherwise noted)
Gas-and-steam plumes June-August with occassional ash plumes
Eruptions continued at Kliuchevskoi during late 2002 through mid-2003, with typical plume heights estimated at several hundred meters and occasionally reaching ~2 km above the volcano (eg., early July and August 2003). Above-background seismicity prevailed during most or all the reporting interval.
The volcano (also spelled Klyuchevskoy) was last reported on in BGVN 28:02, and vol. 27, no. 11, issues discussing events through 4 March 2003. This report relies heavily on tabled data to convey observations from as far back as 3 December 2002, providing some further details during the 3 December-4 March 2003 interval of overlap with the earlier reports. The source reports came from the Kamchatkan Volcanic Eruption Response Team (KVERT) and were communicated via the Alaska Volcano Observatory (AVO). Table 9 summarizes recent plume observations, while table 10 summarizes recent earthquake and intermittent spasmodic volcanic tremor, basically above-background seismicity affiliated with ongoing eruptive unrest.
Table 9. Plumes visible at Kliuchevskoi during December 2002 through mid-April 2003. Courtesy KVERT.
| Date |
Plume details |
| 30 Nov-2 and 4 Dec 2002 |
Gas-and-steam plumes rose 100-400 m above crater and extended 10 km SE, E, W, and N. |
| 03 Dec 2002 |
Gas-and-steam plumes rose ~1,300 m above crater and extended N and NE (NNE ~15 km from Russian satellite data). |
| 05, 09, 12 Dec 2002 |
Gas-and-steam plumes rose ~100 m above crater and extended 3-10 km E and SE. |
| 10-11 Dec 2002 |
Gas-and-steam plumes rose ~1,500 m above crater and extended N and NE. |
| 13-16, 18 Dec 2002 |
Gas-and-steam plumes rose ~100-800 m above crater and extended 5-10 km E and SE. |
| 17, 19 Dec 2002 |
Gas-and-steam plumes rose ~1,000-1,500 m above crater and extended 10 km E. |
| 19, 21, 23 Dec 2002 |
Gas-and-steam plumes rose ~1,000-2,000 m above crater and extended to E, S, and N. |
| 24 Dec 2002 (0100 UTC) |
Gas-and-ash explosion rose ~4,000 m above crater and plume extended WSW. |
| 04 Jan 2003 (2125 UTC) |
Gas-and-steam plume rose ~1,000 m above crater and extended 20 km NE. |
| 05, 07, 09 Jan 2003 |
Gas-and-steam plumes rose 10 m above crater. |
| 08 Jan 2003 |
Gas-and-steam plumes rose 1,000 m above crater. |
| 11-13, 15 Jan 2003 |
Gas-and-steam plumes rose 50-300 m above crater (very narrow plume extended 30-50 km NNE from US satellite data). |
| 24, 27 Jan 2003 |
Gas-and-steam plumes rose 1,000 m above crater and extended 10 km NE (24 Jan) and SE (27 Jan). |
| 25-26, 28-29 Jan 2003 |
Gas-and-steam plumes rose 100-300 m above crater. |
| 01-03 Feb 2003 |
Gas-and-steam plumes rose 100-300 m above crater (extended 30 km NNE from Russian satellite data). |
| 04 Feb 2003 |
Gas-and-steam plumes rose 1,300 m above crater and extended 10 km NE. |
| 09 Feb 2003 |
Gas-and-steam plumes rose 1,500 m above crater and extended 10 km N. |
| 10 Feb 2003 |
Narrow gas-and-steam plume extending 25 km N. |
| 11, 13, 18-19 Feb 2003 |
Gas-and-steam plumes rose 50 m above crater. |
| 15-17 Feb 2003 |
Gas-and-steam plumes rose 1,000 m above crater. |
| 22-26 Feb 2003 |
Gas-and-steam plumes rose 200 m above crater. |
| 23 Feb 2003 |
Gray sector (perhaps ash deposits) showed up on MODIS satellite data from Russia on the SE part of summit. |
| 05 Mar 2003 |
Gas-and-steam plumes rose 300 m above crater. |
| 10-13 Mar 2003 |
Gas-and-steam plumes rose 50 m above crater. |
| 16 Mar 2003 |
Gas-and-steam plumes extended 25-40 km W (from US and Russian satellite data). |
| 18-19 Mar 2003 |
Gas-and-steam plumes rose 700-1,500 m above crater (extended less than 30 km W on 19 Mar, from US and Russian satellite data). |
| 21-22 and 24-25 Mar 2003 |
Gas-and-steam plumes rose up to 300-1,000 m above crater and and extended 5-30 km in all directions (extended 30 km NNW on 21 Mar and 100 km NNE on 24 Mar, from US and Russian satellite data). |
| 22 Mar 2003 |
Gas-and-steam explosions with ash-poor plumes that rose up to 200 m above the crater. |
| 28-30 Mar, 02 Apr 2003 |
Gas-and-steam plumes rose up to 50-300 m above crater and extended in all directions 5-20 km (10 km NW on 28 Mar, from US and Russian satellite data). |
| 05 Apr 2003 |
Gas-and-steam plumes rose up to 300 m above crater and extended 10 km E. |
| 07 Apr 2003 |
Weak fumarolic activity observed. |
| 15-16 Apr 2003 |
Series of ash plumes rose up to 300 m above crater and extended 10 km E. |
Table 10. Earthquakes and intermittent spasmodic volcanic tremor registered at Kliuchevskoi during December 2002 through mid-April 2003. Courtesy of KVERT.
| Date |
Earthquakes per day (~30 km depth) |
Intermittent tremor (in terms of geophone velocity) |
| 28 Nov-01 Dec 2002 |
8-13 |
~0.8 x 10⁻⁶ m/s. |
| 02-04 Dec 2002 |
24-33 |
~0.8 x 10⁻⁶ m/s. |
| 05-12 Dec 2002 |
12-24 |
~0.5-0.7 x 10⁻⁶ m/s. |
| 13-19 Dec 2002 |
6-12 |
0.5-0.7 x 10⁻⁶ m/s. |
| 19-25 Dec 2002 |
6-9 |
~0.6-0.7 x 10⁻⁶ m/s. |
| 24 Dec 2002 |
-- |
Gas-and-ash explosion at 0010 UTC. |
| 03-04 Jan 2003 |
9, 10 |
~0.5-0.7 x 10⁻⁶ m/s. |
| 05-09 Jan 2003 |
10-13; one M 1.75 earthquake |
Increased from 0.55 x 10⁻⁶ m/s on 5-7 Jan to 0.7 x 10⁻⁶ m/s on 8 Jan. |
| 10-12 Jan 2003 |
12-18 |
0.4-0.75 x 10⁻⁶ m/s. |
| 13-15 Jan 2003 |
33-35 |
0.4-0.75 x 10⁻⁶ m/s. |
| 16-23 Jan 2003 |
-- |
0.4-0.6 x 10⁻⁶ m/s. |
| 16-19 Jan 2003 |
Increased from 44 to 90 |
-- |
| 20-22 Jan 2003 |
Gradually decreased from 35 to 21 |
-- |
| 24-31 Jan 2003 |
10-22; 18 M 1.25 earthquakes |
0.3-0.5 x 10⁻⁶ m/s. |
| 01-06 Feb 2003 |
16-39; 15 M 2.0-2.2 earthquakes |
0.4-0.6 x 10⁻⁶ m/s. |
| 01 Feb 2003 |
-- |
1.26 x 10⁻⁶ m/s from 0311 to 2400 UTC. |
| 06-12 Feb 2003 |
17-30; 17 M 2.0-2.1 earthquakes |
0.5-0.7 x 10⁻⁶ m/s. |
| 13-20 Feb 2003 |
14-81; six M 2.0-2.2 earthquakes |
0.4-0.7 x 10⁻⁶ m/s (on 14 Feb, continuous tremor increased to 0.9 x 10⁻⁶ m/s). |
| 20-27 Feb 2003 |
10-14; 16 M 2.0-2.2 earthquakes |
0.4-0.6 x 10⁻⁶ m/s (from 1140 UTC 26 Feb, continuous tremor increased to 0.95 x 10⁻⁶ m/s). |
| 28 Feb-06 Mar 2003 |
5-11; three M 2.0-2.2 earthquakes |
0.5-0.8 x 10⁻⁶ m/s. |
| 06-13 Mar 2003 |
6-11; 12 M 2.0-2.2 earthquakes |
0.5-0.8 x 10⁻⁶ m/s (6-9 Mar) |
| 10-13 Mar 2003 |
-- |
1.1-1.3 x 10⁻⁶ m/s. |
| 13-20 Mar 2003 |
7-9; seven M 2.0-2.1 earthquakes |
0.5-1.5 x 10⁻⁶ m/s. |
| 14 Mar 2003 |
-- |
1.5 x 10⁻⁶ m/s. |
| 20-24 Mar 2003 |
6-9 |
-- |
| 20-26 Mar 2003 |
26 on 25 Mar, 41 on 26 Mar; 16 M 2.0-2.2 earthquakes |
1.0-2.8 x 10⁻⁶ m/s. |
| 28 Mar-03 Apr 2003 |
24-63 |
0.7-1.4 x 10⁻⁶ m/s. |
| 04-10 Apr 2003 |
10-15; 14 M 2.0-2.2 earthquakes |
1.5-3.7 x 10⁻⁶ m/s. |
| 15 Apr 2003 |
~70 |
Up to 4.0 x 10⁻⁶ m/s. |
Unrest continued during June 2003. Seismicity was above background and continuous spasmodic volcanic tremor tended to increase slowly and consistently. Earthquakes, both at 30 km and shallow depths, continued to register. The character of seismicity also indicated that weak gas-ash explosions possibly occurred. Table 11 summarizes thermal observations.
Table 11. Kliuchevskoi thermal anomalies and plumes observed via Russian and United States satellites, 2 June-11 August 2003. Courtesy of KVERT.
| Date |
Thermal Anomaly (pixels) |
Comments |
| 02 Jun 2003 |
-- |
Gas-and-steam plume rose 400 m above volcano. |
| 03 Jun 2003 |
3 |
-- |
| 06-07 Jun 2003 |
-- |
Ash-poor plume extending S 30-80 km; explosions sent ash-gas plumes to 50-500 m above volcano. |
| 07-08 Jun 2003 |
weak |
-- |
| 09 Jun 2003 |
-- |
Ash on NNE flank. |
| 13, 16, 19 Jun 2003 |
1-4 |
Four-pixel anomaly with max temp of 46°C in a background of -1°C; ash-poor plumes 50-500 m above volcano. |
| 23 Jun 2003 |
3 |
Possible ash deposits on SE flank; gas-and-steam plumes to 50-700 m above volcano. |
| 28 Jun, 02 Jul 2003 |
3 |
Ash-poor plumes to 100 m above volcano); separate and continuous ash plumes to 1,000 m above volcano; plumes extended to E. |
| 04-06 Jul 2003 |
1-2 |
Gas-and-steam with ash-poor plume extending 100 km to ESE; separate ash explosions to 2,000 m above volcano. |
| 15-16 Jul 2003 |
1-2 |
Separate or series ash explosions to 1,000 m above volcano; strong ash explosions to 2,000 m above volcano. |
| 20-24 Jul 2003 |
1-4 |
Gas-and-steam plumes rose from 100-1,000 m above volcano and extended 15 km to SW. |
| 27-29 Jul,01 Aug 2003 |
1-4 |
Temperature from 12 to 50°C in a background of -5 to 20°C; gas and steam plumes rose 500-700 m and extended 5 km SW. |
| 01, 04-07 Aug 2003 |
2-6 |
Gas-and-steam plumes rose 800-2,000 m above volcano and extended to NW and, later, S. |
| 09, 11 Aug 2003 |
2-3 |
-- |
Geologic Background. Klyuchevskoy is the highest and most active volcano on the Kamchatka Peninsula. Since its origin about 6,000 years ago, this symmetrical, basaltic stratovolcano has produced frequent moderate-volume explosive and effusive eruptions without major periods of inactivity. It rises above a saddle NE of Kamen volcano and lies SE of the broad Ushkovsky massif. More than 100 flank eruptions have occurred during approximately the past 3,000 years, with most lateral craters and cones occurring along radial fissures between the unconfined NE-to-SE flanks of the conical volcano between 500 and 3,600 m elevation. Eruptions recorded since the late 17th century have resulted in frequent changes to the morphology of the 700-m-wide summit crater. These eruptions over the past 400 years have originated primarily from the summit crater, but have also included numerous major explosive and effusive eruptions from flank craters.
Information Contacts: Olga Girina, Kamchatka Volcanic Eruptions Response Team (KVERT), a cooperative program of the Institute of Volcanic Geology and Geochemistry, Far East Division, Russian Academy of Sciences, Piip Ave. 9, Petropavlovsk-Kamchatsky, 683006, Russia, the Kamchatka Experimental and Methodical Seismological Department (KEMSD), GS RAS (Russia), and the Alaska Volcano Observatory (USA); Alaska Volcano Observatory (AVO), a cooperative program of the U.S. Geological Survey, 4200 University Drive, Anchorage, AK 99508-4667, USA (URL: http://www.avo.alaska.edu/), the Geophysical Institute, University of Alaska, PO Box 757320, Fairbanks, AK 99775-7320, USA, and the Alaska Division of Geological and Geophysical Surveys, 794 University Ave., Suite 200, Fairbanks, AK 99709, USA.
Krakatau (Indonesia) — July 2003 Cite this Report
Krakatau
Indonesia
6.1009°S, 105.4233°E; summit elev. 285 m
All times are local (unless otherwise noted)
Foggy weather and low seismicity
According to reports from the Volcanological Survey of Indonesia (VSI), no visual observations were made this month due to foggy weather. The volcano remained at alert level 2 for the month. They also noted that relatively few volcanic and tectonic earthquakes were recorded during the weeks of 2-8 and 9-15 June 2003. Specifically, the 2-8 June record consisted of 9 deep volcanic earthquakes, 19 shallow volcanic earthquakes, and 5 tectonic earthquakes; the record of 9-15 June consisted of 6 deep volcanic earthquakes, 17 shallow volcanic earthquakes, and 4 tectonic earthquakes.
In the week of 16-22 June, a significant increase in shallow volcanic earthquakes was observed, although no tectonic earthquakes were recorded. The sesimic record for that week showed 11 deep volcanic earthquakes and 63 shallow volcanic earthquakes. Both volcanic and tectonic earthquakes were recorded for the week of 23-29 June, with 7 deep volcanic earthquakes, 61 shallow volcanic earthquakes, and 2 tectonic earthquakes detected.
Geologic Background. The renowned Krakatau (frequently mis-named as Krakatoa) volcano lies in the Sunda Strait between Java and Sumatra. Collapse of an older edifice, perhaps in 416 or 535 CE, formed a 7-km-wide caldera. Remnants of that volcano are preserved in Verlaten and Lang Islands; subsequently the Rakata, Danan, and Perbuwatan cones were formed, coalescing to create the pre-1883 Krakatau Island. Caldera collapse during the catastrophic 1883 eruption destroyed Danan and Perbuwatan, and left only a remnant of Rakata. This eruption caused more than 36,000 fatalities, most as a result of tsunamis that swept the adjacent coastlines of Sumatra and Java. Pyroclastic surges traveled 40 km across the Sunda Strait and reached the Sumatra coast. After a quiescence of less than a half century, the post-collapse cone of Anak Krakatau (Child of Krakatau) was constructed within the 1883 caldera at a point between the former Danan and Perbuwatan cones. Anak Krakatau has been the site of frequent eruptions since 1927.
Information Contacts: Dali Ahmad and Nia Haerani, Volcanological Survey of Indonesia (VSI), Jalan Diponegoro No. 57, Bandung 40122, Indonesia (URL: http://www.vsi.esdm.go.id/).
Lewotobi (Indonesia) — July 2003 Cite this Report
Lewotobi
Indonesia
8.542°S, 122.775°E; summit elev. 1703 m
All times are local (unless otherwise noted)
June-July ash plumes reported by pilots
[No confirmation of these events was ever received (see Geological Summary for Lereboleng for more details). The high eruption plume of 29 July was also never confirmed. After a May 2025 review determined that these events were more likely from Lewotobi, this report was re-assigned.]
The Darwin Volcanic Ash Advisory Center (VAAC) provided a series of pilot reports on Leroboleng. Confirmation from observers on the ground are pending.
At 1038 on 26 June 2003 aviators reportedly saw an ash plume rise to ~1.8 km altitude. An aircraft crew advised that the activity appeared to be increasing. Ash was not visible on satellite imagery. Another report stated that an ash plume was visible above Leroboleng at 1606 on 14 July at ~2.5 km altitude. Ash was not visible on satellite imagery and at that time VSI personnel could not observe the volcano. An alleged eruption on 29 July at 0900 lasted 10 minutes and sent an ash cloud to ~7.3 km altitude.
Geologic Background. The Lewotobi edifice in eastern Flores Island is composed of the two adjacent Lewotobi Laki-laki and Lewotobi Perempuan stratovolcanoes (the "husband and wife"). Their summits are less than 2 km apart along a NW-SE line. The conical Laki-laki to the NW has been frequently active during the 19th and 20th centuries, while the taller and broader Perempuan has had observed eruptions in 1921 and 1935. Small lava domes have grown during the 20th century in both of the summit craters, which are open to the north. A prominent cone, Iliwokar, occurs on the E flank of Perampuan.
Information Contacts: Darwin Volcanic Ash Advisory Centre (VAAC), Bureau of Meteorology, Northern Territory Regional Office, PO Box 40050, Casuarina, NT 0811, Australia (URL: http://www.bom.gov.au/info/vaac/).
Cerro Negro (Nicaragua) — July 2003 Cite this Report
Cerro Negro
Nicaragua
12.506°N, 86.702°W; summit elev. 728 m
All times are local (unless otherwise noted)
Slumbering volcano yields uneventful seismic and fumarolic temperature data
Seismic activity has been monitored at Cerro Negro for the past 15 months. From April 2002 seismicity remained low with eight earthquakes registered in May and June. Earthquake activity was moderate in August (32), September (28), and October (28); no earthquakes were registered in November or December. Activity increased again in January 2003, when 91 tectonic events were registered. Activity dropped in February to 14 tectonic events but increased again in March (44 tectonic earthquakes, two of which were located underneath Cerro Negro), April (45), and May (41 volcano-tectonic earthquakes). Tremors remained low (5 RSAM units).
Gas emissions and fumarole temperatures measured by hand-held infrared instrument (table 3) were also monitored over this period. A visit on 12 April 2002 by Pedro Perez of INETER, Eliecer Duarte and Eric Fernandez of OVSICORI-UNA, Costa Rica, and Franco Tassi and Orlando Vaselli of the University of Florence, Italy, found that fumarole temperatures were down from February. Monthly visits to the volcano started in June 2002.
Table 3. Temperatures (°C) of fumaroles (identified by number) at Cerro Negro, June 2002-May 2003. Fumaroles 2-4 are in the crater formed in 1995. Courtesy of INETER.
| Date |
Fumarole 1 |
Fumarole 2 |
Fumarole 3 |
Fumarole 4 |
Fumarole 6 |
Fumarole 7 |
Fumarole 8 |
| 05 Jun 2002 |
252 |
-- |
-- |
-- |
-- |
-- |
-- |
| 28 Aug 2002 |
255 |
-- |
-- |
-- |
-- |
184 |
189 |
| 09 Sep 2002 |
257 |
-- |
-- |
-- |
175 |
184 |
189 |
| 18 Oct 2002 |
326 |
-- |
-- |
-- |
157 |
223 |
188 |
| 21 Nov 2002 |
475 |
564 |
245 |
475 |
-- |
-- |
-- |
| 22 Nov 2002 |
448 |
479 |
200 |
207 |
-- |
-- |
-- |
| 05 Dec 2002 |
403 |
508 |
385 |
208 |
-- |
-- |
316 / 278 |
| 09 Jan 2003 |
402 |
486 |
494 |
402 |
-- |
-- |
-- |
| 10 Feb 2003 |
402 |
486 |
494 |
402 |
-- |
-- |
-- |
| 21 Mar 2003 |
468 |
-- |
-- |
-- |
-- |
-- |
-- |
| 04 Apr 2003 |
388 |
-- |
-- |
-- |
-- |
-- |
-- |
| 03 May 2003 |
399 |
78.6 |
226 |
-- |
239 |
203 |
255 |
On 5 June, following heavy rain, steam was observed exiting the fissure SE of the volcano. Observations on 18 July noted abundant gas emissions at all fumaroles and a strong scent of sulfur around the entire crater. Emissions continued on the SE fissure and in Este del Cerro La Mula. On 28 August, Perez observed gas emissions at fumarole 4 and a continued sulfur odor. Falling rocks were observed in the inner crater. Few gas emissions were observed on 9 September and 18 October, but the strong scent of sulfur persisted. No landslides were observed. Gas emissions were observed at the fumaroles of Este del Cerro La Mula with greater abundance than in previous months.
Perez visited again on 21 November and during 25-27 November, accompanied by Matthias Frische, Kris Garofalo, Thor Hansten, and Boo Gall (GEOMAR Germany). The maximum measured temperature in the new crater was 564°C and for fumarole 1 of the old crater the temperature was 334°C.
The sampling that began in November continued in the following months. On 5 December temperatures continued to be high in the cone formed in 1995. The maximum fumarole temperature on the new cone was 494°C. The visit on 10 February included more sampling, but no physical change was observed at the volcano. Recorded temperatures did not vary from those made in January. Temperature measurements at fumarole 1 on 21 March 2003 revealed an increase of 66°C from February. On 30 and 31 March there was a slight increase of 20 RSAM units and officials observed the volcano for several hours, witnessing no anomolies. On 4 April more temperature measurements and gas sampling were performed and rock was noted to be loosening in fumarole 4. On 3 May the temperatures of the fumaroles located within the crater were constant with respect to the previous months, with the exception of fumarole 6, which had an increase of 100°C. Strong gas emissions were observed in parts of the inner crater.
Geologic Background. Nicaragua's youngest volcano, Cerro Negro, was created following an eruption that began in April 1850 about 2 km NW of the summit of Las Pilas volcano. It is the largest, southernmost, and most recent of a group of four youthful cinder cones constructed along a NNW-SSE-trending line in the central Marrabios Range. Strombolian-to-subplinian eruptions at intervals of a few years to several decades have constructed a roughly 250-m-high basaltic cone and an associated lava field constrained by topography to extend primarily NE and SW. Cone and crater morphology have varied significantly during its short eruptive history. Although it lies in a relatively unpopulated area, occasional heavy ashfalls have damaged crops and buildings.
Information Contacts: Pedro Perez, Armando Saballos, and Aduardo Mayorga, Instituto Nicaragüense de Estudios Territoriales (INETER), Apartado 1761, Managua, Nicaragua (URL: http://www.ineter.gob.ni/).
Papandayan (Indonesia) — July 2003 Cite this Report
Papandayan
Indonesia
7.32°S, 107.73°E; summit elev. 2665 m
All times are local (unless otherwise noted)
After the explosions of November 2002, seismicity and eruptions waned
On 11 November 2002, ash eruptions occurred at Papandayan (BGVN 27:11 and figure 8). Subsequently, seismic and eruptive activity waned, although gas emission continued (ending 4 May 2003). Lessening seismicity and volcanism in January 2003 resulted in a reduction of the hazard status from 3 to 2 (on a scale of 1 to 4, where 4 is the highest). Reduction in the activity continued through the beginning of May 2003 at which time the Volcanological Survey of Indonesia (VSI) terminated its weekly reporting on Papandayan.
During December 2002, white-gray ash plume was emitted continually from Baru crater and rose 150-400 m to the NE. [After the week of 16-22 December only gas plumes were emitted (described as "white ash emission").] As the activity level reduced (table 2) the typical height of the plume dropped from 150-400 m during December and early January 2003 to 75-250 m by late-January.
Table 2. Weekly seismic events at Papandayan from 2 December 2002 to 4 May 2003. Courtesy of VSI.
| Date |
Deep |
Shallow |
Tectonic |
Avalanches |
| 02 Dec-08 Dec 2002 |
9 |
10 |
17 |
-- |
| 09 Dec-15 Dec 2002 |
1 |
25 |
-- |
-- |
| 16 Dec-22 Dec 2002 |
1 |
20 |
21 |
-- |
| 23 Dec-29 Dec 2002 |
3 |
16 |
12 |
-- |
| 30 Dec-05 Jan 2003 |
28 |
42 |
29 |
-- |
| 06 Jan-12 Jan 2003 |
11 |
21 |
33 |
7 |
| 13 Jan-19 Jan 2003 |
7 |
11 |
16 |
12 |
| 20 Jan-26 Jan 2003 |
14 |
30 |
29 |
-- |
| 27 Jan-02 Feb 2003 |
8 |
25 |
30 |
-- |
| 03 Feb-09 Feb 2003 |
3 |
18 |
12 |
1 |
| 10 Feb-16 Feb 2003 |
-- |
14 |
18 |
2 |
| 17 Feb-23 Feb 2003 |
3 |
24 |
17 |
3 |
| 24 Feb-02 Mar 2003 |
2 |
1 |
3 |
-- |
| 03 Mar-09 Mar 2003 |
-- |
1 |
-- |
7 |
| 10 Mar-16 Mar 2003 |
1 |
10 |
16 |
-- |
| 17 Mar-23 Mar 2003 |
2 |
8 |
24 |
-- |
| 24 Mar-30 Mar 2003 |
2 |
10 |
14 |
-- |
| 31 Mar-06 Apr 2003 |
3 |
15 |
33 |
-- |
| 07 Apr-13 Apr 2003 |
1 |
8 |
9 |
-- |
| 14 Apr-20 Apr 2003 |
2 |
12 |
16 |
-- |
| 21 Apr-27 Apr 2003 |
8 |
5 |
23 |
-- |
| 28 Apr-04 May 2003 |
2 |
7 |
3 |
-- |
Two explosions occurred at 0700 on 4 December and at 1758 on 8 December 2002, and another occurred at 1758 on 12 December. During the week of 2-8 December, shallow volcanic earthquakes decreased, while deep volcanic and tectonic earthquakes increased. During the subsequent week, shallow earthquakes increased, while deep earthquakes decreased (table 2). Insignificant lahars occurred at Cibeureum Gede and Ciparugpug rivers at 1600 on 13 December and at 1700 on 14 December. The movement of stepped landslides on the wall of Nangklak crater were recorded on the seismograph throughout most of December; the last landslide occurred at 1154 on 21 December. The hazard level was reduced to 2 by the week of 13-19 January 2003.
Geologic Background. Papandayan is a complex stratovolcano with four large summit craters, the youngest of which was breached to the NE by collapse during a brief eruption in 1772 and contains active fumarole fields. The broad 1.1-km-wide, flat-floored Alun-Alun crater truncates the summit of Papandayan, and Gunung Puntang to the north gives a twin-peaked appearance. Several episodes of collapse have created an irregular profile and produced debris avalanches that have impacted lowland areas. A sulfur-encrusted fumarole field occupies historically active Kawah Mas ("Golden Crater"). After its first historical eruption in 1772, in which collapse of the NE flank produced a catastrophic debris avalanche that destroyed 40 villages and killed nearly 3000 people, only small phreatic eruptions had occurred prior to an explosive eruption that began in November 2002.
Information Contacts: Dali Ahmad, Volcanological Survey of Indonesia (VSI), Jalan Diponegoro No. 57, Bandung 40122, Indonesia (URL: http://www.vsi.esdm.go.id/).
Semeru
Indonesia
8.108°S, 112.922°E; summit elev. 3657 m
All times are local (unless otherwise noted)
Ash plumes, pyroclastic flows, and high seismicity continue through June
According to the Volcanological Survey of Indonesia (VSI), activity during 24 March-29 June 2003 was continually at a high level. Explosions produced white-gray ash plumes several times per week that rose 300-600 m over the summit. Pyroclastic flows on 27 March had a run-out distance of 3,750 m toward Besuk Bang. More pyroclastic-flow events on 14 and 18 April traveled toward Besuk Bang (3,500 m) and Besuk Kembar (2,500 m). On 11 May a pyroclastic flow entered Besuk Kembar and extended 1,500 m. Seismographs continually recorded earthquake activity (table 12). The hazard status remained at Level 2 (on a scale of 1-4) throughout the report period.
Table 12. Seismicity at Semeru, 24 March-29 June 2003. Courtesy of VSI.
| Date |
Explosion |
Avalanche |
Tremor |
Other |
Tectonic |
| 24 Mar-30 Mar 2003 |
794 |
48 |
17 |
1 flood; 12 PF |
6 |
| 31 Mar-06 Apr 2003 |
738 |
28 |
12 |
2 shallow; 2 PF |
6 |
| 07 Apr-13 Apr 2003 |
698 |
33 |
11 |
7 PF |
6 |
| 14 Apr-20 Apr 2003 |
697 |
70 |
20 |
12 PF |
7 |
| 21 Apr-27 Apr 2003 |
713 |
82 |
16 |
1 deep volc |
9 |
| 28 Apr-04 May 2003 |
651 |
36 |
31 |
1 deep volc |
2 |
| 05 May-11 May 2003 |
846 |
37 |
27 |
2 shallow volc; 1 PF |
5 |
| 12 May-18 May 2003 |
730 |
41 |
38 |
1 shallow volc |
3 |
| 19 May-25 May 2003 |
748 |
17 |
17 |
-- |
8 |
| 26 May-01 Jun 2003 |
585 |
27 |
26 |
-- |
8 |
| 02 Jun-08 Jun 2003 |
758 |
29 |
24 |
-- |
4 |
| 09 Jun-15 Jun 2003 |
600 |
27 |
63 |
2 deep volc |
13 |
| 16 Jun-22 Jun 2003 |
711 |
20 |
13 |
1 shallow volc |
8 |
| 23 Jun-29 Jun 2003 |
838 |
33 |
-- |
-- |
4 |
Geologic Background. Semeru, the highest volcano on Java, and one of its most active, lies at the southern end of a volcanic massif extending north to the Tengger caldera. The steep-sided volcano, also referred to as Mahameru (Great Mountain), rises above coastal plains to the south. Gunung Semeru was constructed south of the overlapping Ajek-ajek and Jambangan calderas. A line of lake-filled maars was constructed along a N-S trend cutting through the summit, and cinder cones and lava domes occupy the eastern and NE flanks. Summit topography is complicated by the shifting of craters from NW to SE. Frequent 19th and 20th century eruptions were dominated by small-to-moderate explosions from the summit crater, with occasional lava flows and larger explosive eruptions accompanied by pyroclastic flows that have reached the lower flanks of the volcano.
Information Contacts: Dali Ahmad and Nia Haerani, Volcanological Survey of Indonesia (VSI), Jalan Diponegoro No. 57, Bandung 40122, Indonesia (URL: http://www.vsi.esdm.go.id/).
Sheveluch
Russia
56.653°N, 161.36°E; summit elev. 3283 m
All times are local (unless otherwise noted)
Lava dome growth and ash-and-gas plumes to 5 km high
Eruptive activity continued during May-August 2003, including growth of a lava dome in the active crater. Seismic activity continued to remain above background levels, and shallow earthquakes at a depth of 5 km were recorded with magnitudes in the range of 1.8-2.8. Several short-lived explosive eruptions each week sent ash-gas plumes to heights of 2,500-5,000 m above the dome. Intermittent spasmodic volcanic tremor was registered. Satellite data on thermal anomalies are shown in table 7.
Table 7. US and Russian satellite data summarizing thermal anomalies associated with Sheveluch from late May to early August 2003. Courtesy of Kamchatka Volcanic Eruptions Response Team (KVERT).
| Date(s) |
Thermal Anomaly (pixels) |
Comments |
| 30 May 2003 |
1-4 |
No ash plumes observed. |
| 06-09 Jun 2003 |
1-6 |
Gas/steam plumes rose 100-700 m above dome and extended E. |
| 13-14, 16-17 Jun 2003 |
1-6 |
Gas/steam plume rose 100 m above dome and extended 5 km NE. |
| 21-22 Jun 2003 |
1-4 |
Gas/steam plumes rose 100 m above dome. |
| 28-30 Jun, 02 Jul 2003 |
1-5 |
Gas/steam plumes rose 100 m above dome. |
| 05-06, 10 Jul 2003 |
1-2 |
Gas/steam plumes rose 500 m above dome. |
| 11, 13-16 Jul 2003 |
1-2 |
Gas/steam plumes rose 200-800 m above dome. |
| 19-22, 24 Jul 2003 |
1-2 |
Gas/steam plumes rose 500-600 m above dome. |
| 27, 31 Jul, 01 Aug 2003 |
1-3 |
Temperatures of 10-19°C in background of 0-5°C; gas/steam plumes rose 100 m above dome. |
| 08-10 Aug 2003 |
2-3 |
-- |
Geologic Background. The high, isolated massif of Sheveluch volcano (also spelled Shiveluch) rises above the lowlands NNE of the Kliuchevskaya volcano group. The 1,300 km3 andesitic volcano is one of Kamchatka's largest and most active volcanic structures, with at least 60 large eruptions during the Holocene. The summit of roughly 65,000-year-old Stary Shiveluch is truncated by a broad 9-km-wide late-Pleistocene caldera breached to the south. Many lava domes occur on its outer flanks. The Molodoy Shiveluch lava dome complex was constructed during the Holocene within the large open caldera; Holocene lava dome extrusion also took place on the flanks of Stary Shiveluch. Widespread tephra layers from these eruptions have provided valuable time markers for dating volcanic events in Kamchatka. Frequent collapses of dome complexes, most recently in 1964, have produced debris avalanches whose deposits cover much of the floor of the breached caldera.
Information Contacts: Olga Girina, Kamchatka Volcanic Eruptions Response Team (KVERT), a cooperative program of the Institute of Volcanic Geology and Geochemistry, Far East Division, Russian Academy of Sciences, Piip Ave. 9, Petropavlovsk-Kamchatsky, 683006, Russia, the Kamchatka Experimental and Methodical Seismological Department (KEMSD), GS RAS (Russia), and the Alaska Volcano Observatory (USA); Alaska Volcano Observatory (AVO), a cooperative program of the U.S. Geological Survey, 4200 University Drive, Anchorage, AK 99508-4667, USA (URL: http://www.avo.alaska.edu/), the Geophysical Institute, University of Alaska, PO Box 757320, Fairbanks, AK 99775-7320, USA, and the Alaska Division of Geological and Geophysical Surveys, 794 University Ave., Suite 200, Fairbanks, AK 99709, USA.
Soufriere Hills (United Kingdom) — July 2003 Cite this Report
Soufriere Hills
United Kingdom
16.72°N, 62.18°W; summit elev. 915 m
All times are local (unless otherwise noted)
Changes in activity style and dome growth since February 2002
Although detailed reports about the activity and monitoring of Soufrière Hills are provided on a regular basis by the Montserrat Volcano Observatory, this report contains observations made by visitors Stephen O'Meara and Robert Benward. They monitored Soufrière Hills visually and, using some novel electronics, collected data and images for 12 days beginning on 7 February 2003. This visit was similar to one in February 2002 (BGVN 27:06).
The visual observations took place primarily on Jack Boy Hill, 6 km N of the volcano. At the new Montserrat Volcano Observatory, Benward set up a black and white CCD video camera that took a frame every eight (8) seconds and relayed it to a digital video recorder. The camera's low-light sensitivity provided round-the-clock surveillance of dome activity. However, orographic and rain clouds caused problems, and much of the volcanic activity was away from the camera view.
Since the visit in 2002, the dome had increased significantly in size (figure 56). The rockfalls and pyroclastic flows that dominated the activity in February 2002 were concentrated in the E portions of the dome and the Tar River Valley. In 2003, activity occurred in a broader arc that extended from Tar River in the E to Farrell's Plain in the N. Several pyroclastic flows traveled into Tuitt's Ghaut and the upper reaches of Tyre's Ghaut, and onto Farrell's Plain. These events were captured on the surveillance camera and in higher-definition color video taken from Jack Boy Hill.
The dome was impressive at night. The summit was often crowned with thick, blocky spines and sharp pinnacles. An array of spiny ridges (speckled with incandescence) that lined the upper portions of the dome helped channelize many of the rockfalls and pyroclastic flows, the flow channels remaining incandescent. The glow was strong throughout the observation period, but especially during 13-19 February, when episodes of prolonged activity made the dome appear to be melting like candle wax. The glowing dome could be seen from the northernmost reaches of the island at night. Its light was so intense that a homemade spectrograph (attached to a 3-inch telescope brought by Benward) revealed a continuous spectrum.
O'Meara visually observed the dome through a 60 power, 60 mm refractor scope and noticed two curious phenomena. At one point, a mass of viscous, but mobile, lava pushed out of the downslope edge of an incandescent ridge. It slumped onto the dome and formed a pad of molten material that quickly cooled and solidified into linear veins. The behavior was similar to that of a budding toe of pahoehoe lava where internal pressure forces fluid lava through its cooling skin. O'Meara also observed what appeared to be a tiny lateral explosion from the downslope edge of an incandescent ridge which shot out glowing gas and rock fragments like buckshot from a gun.
A significant difference in the style of eruption from that reported in 2002 was the periodic mass dumping of dome material. During these episodes, dome material calved off the highest portions of the dome, creating a wide avalanche of incandescent material which flowed down much of the dome's visible face in a matter of seconds. These episodes differed from the classical pyroclastic flows in that they produced comparatively little ash, being comprised principally of extremely massive and widespread rock and block fall.
A dramatic episode of rockfall and pyroclastic-flow activity occurred during 1745-2000 on 13 February. Massive movement of large, house-sized blocks, many of which self-destructed during their descent, preceded the pyroclastic flows. The subsequent pyroclastic flow activity was accompanied by roiling steel-gray ash clouds that drifted N. One particularly strong pyroclastic flow created an incandescent channel in Tuitt's Ghaut that glowed long into the night. Smaller pyroclastic flows followed this channel downslope, while larger ones overflowed the channel's levees or changed course. Often, when one flow slowed, another would push through it. At times pieces of incandescent rocks appeared to be sliding down the dome in the flow with no detectable rolling motion. At other times, linear threads of glowing gases appeared to advance like the treads of a tank. Another series of pyroclastic flows during 0614-0730 on 14 February were directed N, and spread out across Farrell's Plain. As in February 2002, the night activity was most spectacular when viewed and videotaped in the near-IR using Benward's homemade nightscope.
One purpose of the visit was to chronicle changes in visible behavior when the full Moon approached Earth and at perigee. With the approach of the full Moon, the team reported an apparent rise in the number of visible indicators, particularly an increase in the number of large and prolonged rockfalls and pyroclastic flows, and in the average number of events per hour. There was an impressive episode of spine growth in the 24 hours near the time of full Moon, similar to that in 2002. The limited duration of the observations, however, thwart conclusions about the relationships between lunar positions and volcanism. Convincing theories require baseline data over a considerably longer time period.
Geologic Background. The complex, dominantly andesitic Soufrière Hills volcano occupies the southern half of the island of Montserrat. The summit area consists primarily of a series of lava domes emplaced along an ESE-trending zone. The volcano is flanked by Pleistocene complexes to the north and south. English's Crater, a 1-km-wide crater breached widely to the east by edifice collapse, was formed about 2000 years ago as a result of the youngest of several collapse events producing submarine debris-avalanche deposits. Block-and-ash flow and surge deposits associated with dome growth predominate in flank deposits, including those from an eruption that likely preceded the 1632 CE settlement of the island, allowing cultivation on recently devegetated land to near the summit. Non-eruptive seismic swarms occurred at 30-year intervals in the 20th century, but no historical eruptions were recorded until 1995. Long-term small-to-moderate ash eruptions beginning in that year were later accompanied by lava-dome growth and pyroclastic flows that forced evacuation of the southern half of the island and ultimately destroyed the capital city of Plymouth, causing major social and economic disruption.
Information Contacts: Steve and Donna O'Meara, and Robert Benward, Volcano Watch International, PO Box 218, Volcano, HI 96785, USA.
Stromboli
Italy
38.789°N, 15.213°E; summit elev. 924 m
All times are local (unless otherwise noted)
Flank eruption finished as of 22 July; activity resumed at summit craters on 17 April
Effusion of lava from vents located at about 600 m elevation on the upper eastern corner of the Sciara del Fuoco decreased in early June and completely stopped between 21 and 22 July. The decreasing effusion rate caused shorter lava flows, which during July did not spread below 600 m elevation. The upper part of the lava flow field, formed since 15 February on the upper Sciara del Fuoco, reached an estimated thickness of more than 50 m as a result of the slower rate.
[After] the 5 April eruption (BGVN 28:04), the summit craters of the volcano [were] blocked by fallout debris obstructing the conduit. [By 17 April the blockage was apparently cleared because] small, occasional, and short-lived explosions of juvenile, hot material were observed at Crater 3 (the SW crater) [that day] during a helicopter survey with a hand-held thermal camera, and at Crater 1 (the NE crater) on 3 May from the SAR fixed camera located at 400 m on the eastern rim of the Sciara del Fuoco.
Strombolian activity from Crater 1 (NE crater) became more frequent and intense in June, and almost continuous in July, with spatter often falling outside the crater. In July, Crater 3 (SW crater) activity consisted mainly of degassing and sporadic ash emissions, with Strombolian explosions becoming more common in the second half of July.
Erosion of the N flank of Crater 1 by landslides in the upper Sciara del Fuoco increased in July, with the 30 December 2002 landslide scar extending backward and upslope, cutting the flank of the cone 50 m below the crater rim.
Geologic Background. Spectacular incandescent nighttime explosions at Stromboli have long attracted visitors to the "Lighthouse of the Mediterranean" in the NE Aeolian Islands. This volcano has lent its name to the frequent mild explosive activity that has characterized its eruptions throughout much of historical time. The small island is the emergent summit of a volcano that grew in two main eruptive cycles, the last of which formed the western portion of the island. The Neostromboli eruptive period took place between about 13,000 and 5,000 years ago. The active summit vents are located at the head of the Sciara del Fuoco, a prominent scarp that formed about 5,000 years ago due to a series of slope failures which extends to below sea level. The modern volcano has been constructed within this scarp, which funnels pyroclastic ejecta and lava flows to the NW. Essentially continuous mild Strombolian explosions, sometimes accompanied by lava flows, have been recorded for more than a millennium.
Information Contacts: Sonia Calvari, Istituto Nazionale di Geofisica e Vulcanologia, Piazza Roma 2, 95123 Catania, Italy (URL: http://www.ct.ingv.it/).
Yellowstone (United States) — July 2003 Cite this Report
Yellowstone
United States
44.43°N, 110.67°W; summit elev. 2805 m
All times are local (unless otherwise noted)
Geyser basin heats up, affecting thermal features
Yellowstone National Park press releases indicated unusual hydrothermal activity at the Norris geyser basin in the NW-central portion of the Park. A press release on 22 July 2003 announced that high ground temperatures and increased thermal activity had resulted in the temporary closure of a portion of the Back Basin.
The press release noted "Norris is the hottest and most seismically active geyser basin in Yellowstone. Recent activity in the Norris geyser basin has included formation of new mud pots, an eruption of Porkchop geyser (dormant since 1989), the draining of several geysers, creating steam vents and significantly increased measured ground temperatures (up to 200°F [93°C]). Additional observations include vegetation dying due to thermal activity and the changing of several geysers' eruption intervals. Vixen geyser has become more frequent and Echinus geyser has become more regular."
A press release on 7 August advised of a hydrothermal monitoring program by the Yellowstone Volcano Observatory to begin at Norris geyser basin. The Observatory is a collaborative partnership between the US Geological Survey, the University of Utah, and Yellowstone National Park. It was deploying a temporary network of seismographs, Global Positioning System receivers, and temperature loggers. Goals included identification of hydrothermal steam sources, the relationship of the behavior of Norris geyser basin to the general seismicity, and locating crustal deformation in the caldera.
Geologic Background. The Yellowstone Plateau volcanic field developed through three volcanic cycles spanning two million years that included some of the world's largest known eruptions. Eruption of the over 2,450 km3 Huckleberry Ridge Tuff about 2.1 million years ago created the more than 75-km-long Island Park caldera. The second cycle concluded with the eruption of the Mesa Falls Tuff around 1.3 million years ago, forming the 16-km-wide Henrys Fork caldera at the western end of the first caldera. Activity subsequently shifted to the present Yellowstone Plateau and culminated 640,000 years ago with the eruption of the over 1,000 km3 Lava Creek Tuff and the formation of the present 45 x 85 km caldera. Resurgent doming subsequently occurred at both the NE and SW sides of the caldera and voluminous (1000 km3) intracaldera rhyolitic lava flows were erupted between 150,000 and 70,000 years ago. No magmatic eruptions have occurred since the late Pleistocene, but large hydrothermal events took place near Yellowstone Lake during the Holocene. Yellowstone is presently the site of one of the world's largest hydrothermal systems, including Earth's largest concentration of geysers.
Information Contacts: Yellowstone Volcano Observatory, a cooperative arrangement that includesRobert L. Christiansen, U.S. Geological Survey, 345 Middlefield Road, Menlo Park, CA 94025; Robert B. Smith, Department of Geology and Geophysics, University of Utah, Salt Lake City, Utah 84112 USA; Henry Heasler, National Park Service, P.O. Box 168, Yellowstone National Park, WY 82190-0168 USA; and others (URL: https://volcanoes.usgs.gov/observatories/yvo/).