Recently Published Bulletin Reports
Erebus (Antarctica) Lava lake remains active; most thermal alerts recorded since 2019
Rincon de la Vieja (Costa Rica) Frequent phreatic explosions during July-December 2023
Bezymianny (Russia) Explosion on 18 October 2023 sends ash plume 8 km high; lava flows and incandescent avalanches
Kilauea (United States) Low-level lava effusions in the lava lake at Halema’uma’u during July-December 2022
Nyamulagira (DR Congo) Lava flows and thermal activity during May-October 2023
Bagana (Papua New Guinea) Explosions, ash plumes, ashfall, and lava flows during April-September 2023
Mayon (Philippines) Lava flows, pyroclastic flows, ash emissions, and seismicity during April-September 2023
Nishinoshima (Japan) Eruption plumes and gas-and-steam plumes during May-August 2023
Krakatau (Indonesia) White gas-and-steam plumes and occasional ash plumes during May-August 2023
Villarrica (Chile) Strombolian activity, gas-and-ash emissions, and crater incandescence during April-September 2023
Merapi (Indonesia) Frequent incandescent avalanches during April-September 2023
Ebeko (Russia) Moderate explosive activity with ash plumes continued during June-November 2023
Erebus (Antarctica) — January 2024  Cite this Report
Erebus
Antarctica
77.53°S, 167.17°E; summit elev. 3794 m
All times are local (unless otherwise noted)
Lava lake remains active; most thermal alerts recorded since 2019
The lava lake in the summit crater of Erebus has been active since at least 1972. Located in Antarctica overlooking the McMurdo Station on Ross Island, it is the southernmost active volcano on the planet. Because of the remote location, activity is primarily monitored by satellites. This report covers activity during 2023.
The number of thermal alerts recorded by the Hawai'i Institute of Geophysics and Planetology’s MODVOLC Thermal Alerts System increased considerably in 2023 compared to the years 2020-2022 (table 9). In contrast to previous years, the MODIS instruments aboard the Aqua and Terra satellites captured data from Erebus every month during 2023. Consistent with previous years, the lowest number of anomalous pixels were recorded in January, November, and December.
Table 9. Number of monthly MODIS-MODVOLC thermal alert pixels recorded at Erebus during 2017-2023. See BGVN 42:06 for data from 2000 through 2016. The table was compiled using data provided by the HIGP – MODVOLC Thermal Alerts System.
| Year |
Jan |
Feb |
Mar |
Apr |
May |
Jun |
Jul |
Aug |
Sep |
Oct |
Nov |
Dec |
SUM |
| 2017 |
0 |
21 |
9 |
0 |
0 |
1 |
11 |
61 |
76 |
52 |
0 |
3 |
234 |
| 2018 |
0 |
21 |
58 |
182 |
55 |
17 |
137 |
172 |
103 |
29 |
0 |
0 |
774 |
| 2019 |
2 |
21 |
162 |
151 |
55 |
56 |
75 |
53 |
29 |
19 |
1 |
0 |
624 |
| 2020 |
0 |
2 |
16 |
18 |
4 |
4 |
1 |
3 |
18 |
3 |
1 |
6 |
76 |
| 2021 |
0 |
9 |
1 |
0 |
2 |
56 |
46 |
47 |
35 |
52 |
5 |
3 |
256 |
| 2022 |
1 |
13 |
55 |
22 |
15 |
32 |
39 |
19 |
31 |
11 |
0 |
0 |
238 |
| 2023 |
2 |
33 |
49 |
82 |
41 |
32 |
70 |
64 |
42 |
17 |
5 |
11 |
448 |
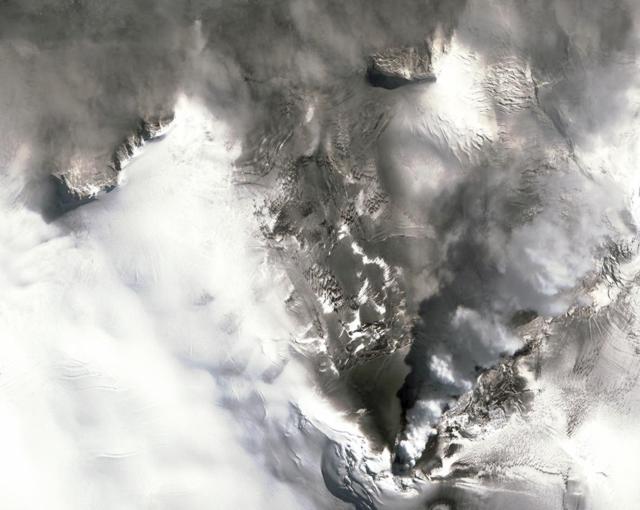
Sentinel-2 infrared images showed one or two prominent heat sources within the summit crater, accompanied by adjacent smaller sources, similar to recent years (see BGVN 46:01, 47:02, and 48:01). A unique image was obtained on 25 November 2023 by the OLI-2 (Operational Land Imager-2) on Landsat 9, showing the upper part of the volcano surrounded by clouds (figure 32).
Geologic Background. Mount Erebus, the world's southernmost historically active volcano, overlooks the McMurdo research station on Ross Island. It is the largest of three major volcanoes forming the crudely triangular Ross Island. The summit of the dominantly phonolitic volcano has been modified by one or two generations of caldera formation. A summit plateau at about 3,200 m elevation marks the rim of the youngest caldera, which formed during the late-Pleistocene and within which the modern cone was constructed. An elliptical 500 x 600 m wide, 110-m-deep crater truncates the summit and contains an active lava lake within a 250-m-wide, 100-m-deep inner crater; other lava lakes are sometimes present. The glacier-covered volcano was erupting when first sighted by Captain James Ross in 1841. Continuous lava-lake activity with minor explosions, punctuated by occasional larger Strombolian explosions that eject bombs onto the crater rim, has been documented since 1972, but has probably been occurring for much of the volcano's recent history.
Information Contacts: Hawai'i Institute of Geophysics and Planetology (HIGP) - MODVOLC Thermal Alerts System, School of Ocean and Earth Science and Technology (SOEST), Univ. of Hawai'i, 2525 Correa Road, Honolulu, HI 96822, USA (URL: http://modis.higp.hawaii.edu/); Copernicus Browser, Copernicus Data Space Ecosystem, European Space Agency (URL: https://dataspace.copernicus.eu/browser/); NASA Earth Observatory, EOS Project Science Office, NASA Goddard Space Flight Center, Goddard, Maryland, USA (URL: https://earthobservatory.nasa.gov/images/152134/erebus-breaks-through).
Rincon de la Vieja (Costa Rica) — January 2024 Cite this Report
Rincon de la Vieja
Costa Rica
10.83°N, 85.324°W; summit elev. 1916 m
All times are local (unless otherwise noted)
Frequent phreatic explosions during July-December 2023
Rincón de la Vieja is a volcanic complex in Costa Rica with a hot convecting acid lake that exhibits frequent weak phreatic explosions, gas-and-steam emissions, and occasional elevated sulfur dioxide levels (BGVN 45:10, 46:03, 46:11). The current eruption period began June 2021. This report covers activity during July-December 2023 and is based on weekly bulletins and occasional daily reports from the Observatorio Vulcanologico Sismologica de Costa Rica-Universidad Nacional (OVSICORI-UNA).
Numerous weak phreatic explosions continued during July-December 2023, along with gas-and-steam emissions and plumes that rose as high as 3 km above the crater rim. Many weekly OVSICORI-UNA bulletins included the previous week's number of explosions and emissions (table 9). For many explosions, the time of explosion was given (table 10). Frequent seismic activity (long-period earthquakes, volcano-tectonic earthquakes, and tremor) accompanied the phreatic activity.
Table 9. Number of reported weekly phreatic explosions and gas-and-steam emissions at Rincón de la Vieja, July-December 2023. Counts are reported for the week before the Weekly Bulletin date; not all reports included these data. Courtesy of OVSICORI-UNA.
| OVSICORI Weekly Bulletin |
Number of explosions |
Number of emissions |
| 28 Jul 2023 |
6 |
14 |
| 4 Aug 2023 |
10 |
12 |
| 1 Sep 2023 |
13 |
11 |
| 22 Sep 2023 |
12 |
13 |
| 29 Sep 2023 |
6 |
11 |
| 6 Oct 2023 |
12 |
5 |
| 13 Oct 2023 |
7 |
9 |
| 20 Oct 2023 |
1 |
15 |
| 27 Oct 2023 |
3 |
23 |
| 3 Nov 2023 |
3 |
10 |
| 17 Nov 2023 |
0 |
Some |
| 24 Nov 2023 |
0 |
14 |
| 8 Dec 2023 |
4 |
16 |
| 22 Dec 2023 |
8 |
18 |
Table 10. Summary of activity at Rincón de la Vieja during July-December 2023. Weak phreatic explosions and gas emissions are noted where the time of explosion was indicated in the weekly or daily bulletins. Height of plumes or emissions are distance above the crater rim. Courtesy of OVSICORI-UNA.
| Date |
Time |
Description of Activity |
| 1 Jul 2023 |
0156 |
Explosion. |
| 2 Jul 2023 |
0305 |
Explosion. |
| 4 Jul 2023 |
0229, 0635 |
Event at 0635 produced a gas-and-steam plume that rose 700 m and drifted W; seen by residents in Liberia (21 km SW). |
| 9 Jul 2023 |
1843 |
Explosion. |
| 21 Jul 2023 |
0705 |
Explosion. |
| 26 Jul 2023 |
1807 |
Explosion. |
| 28 Jul 2023 |
0802 |
Explosion generated a gas-and-steam plume that rose 500 m. |
| 30 Jul 2023 |
1250 |
Explosion. |
| 31 Jul 2023 |
2136 |
Explosion. |
| 11 Aug 2023 |
0828 |
Explosion. |
| 18 Aug 2023 |
1304 |
Explosion. |
| 21 Aug 2023 |
1224 |
Explosion generated gas-and-steam plumes rose 500-600 m. |
| 22 Aug 2023 |
0749 |
Explosion generated gas-and-steam plumes rose 500-600 m. |
| 24 Aug 2023 |
1900 |
Explosion. |
| 25 Aug 2023 |
0828 |
Event produced a steam-and-gas plume that rose 3 km and drifted NW. |
| 27-28 Aug 2023 |
0813 |
Four small events; the event at 0813 on 28 August lasted two minutes and generated a steam-and-gas plume that rose 2.5 km. |
| 1 Sep 2023 |
1526 |
Explosion generated plume that rose 2 km and ejected material onto the flanks. |
| 2-3 Sep 2023 |
- |
Small explosions detected in infrasound data. |
| 4 Sep 2023 |
1251 |
Gas-and-steam plume rose 1 km and drifted W. |
| 7 Nov 2023 |
1113 |
Explosion. |
| 8 Nov 2023 |
0722 |
Explosion. |
| 12 Nov 2023 |
0136 |
Small gas emissions. |
| 14 Nov 2023 |
0415 |
Small gas emissions. |
According to OVSICORI-UNA, during July-October the average weekly sulfur dioxide (SO2) flux ranged from 68 to 240 tonnes/day. However, in mid-November the flux increased to as high as 334 tonnes/day, the highest value measured in recent years. The high SO2 flux in mid-November was also detected by the TROPOMI instrument on the Sentinel-5P satellite (figure 43).
Geologic Background. Rincón de la Vieja, the largest volcano in NW Costa Rica, is a remote volcanic complex in the Guanacaste Range. The volcano consists of an elongated, arcuate NW-SE-trending ridge constructed within the 15-km-wide early Pleistocene Guachipelín caldera, whose rim is exposed on the south side. Sometimes known as the "Colossus of Guanacaste," it has an estimated volume of 130 km3 and contains at least nine major eruptive centers. Activity has migrated to the SE, where the youngest-looking craters are located. The twin cone of Santa María volcano, the highest peak of the complex, is located at the eastern end of a smaller, 5-km-wide caldera and has a 500-m-wide crater. A Plinian eruption producing the 0.25 km3 Río Blanca tephra about 3,500 years ago was the last major magmatic eruption. All subsequent eruptions, including numerous historical eruptions possibly dating back to the 16th century, have been from the prominent active crater containing a 500-m-wide acid lake located ENE of Von Seebach crater.
Information Contacts: Observatorio Vulcanológico Sismológica de Costa Rica-Universidad Nacional (OVSICORI-UNA), Apartado 86-3000, Heredia, Costa Rica (URL: http://www.ovsicori.una.ac.cr/); NASA Global Sulfur Dioxide Monitoring Page, Atmospheric Chemistry and Dynamics Laboratory, NASA Goddard Space Flight Center (NASA/GSFC), 8800 Greenbelt Road, Goddard MD 20771, USA (URL: https://so2.gsfc.nasa.gov/).
Bezymianny (Russia) — November 2023 Cite this Report
Bezymianny
Russia
55.972°N, 160.595°E; summit elev. 2882 m
All times are local (unless otherwise noted)
Explosion on 18 October 2023 sends ash plume 8 km high; lava flows and incandescent avalanches
Bezymianny, located on Russia’s Kamchatka Peninsula, has had eruptions since 1955 characterized by dome growth, explosions, pyroclastic flows, ash plumes, and ashfall. Activity during November 2022-April 2023 included gas-and-steam emissions, lava dome collapses generating avalanches, and persistent thermal activity. Similar eruptive activity continued from May through October 2023, described here based on information from weekly and daily reports of the Kamchatka Volcano Eruptions Response Team (KVERT), notices from Tokyo VAAC (Volcanic Ash Advisory Center), and from satellite data.
Overall activity decreased after the strong period of activity in late March through April 2023, which included ash explosions during 29 March and 7-8 April 2023 that sent plumes as high as 10-12 km altitude, along with dome growth and lava flows (BGVN 48:05). This reduced activity can be seen in the MIROVA thermal detection system graph (figure 56), which was consistent with data from the MODVOLC thermal detection system and with Sentinel-2 satellite images that showed persistent hotspots in the summit crater when conditions allowed observations. A renewed period of strong activity began in mid-October 2023.
Activity increased significantly on 17 October 2023 when large collapses began during 0700-0830 on the E flanks of the lava dome and continued to after 0930 the next day (figure 57). Ash plumes rose to an altitude of 4.5-5 km, extending 220 km NNE by 18 October. A large explosion at 1630 on 18 October produced an ash plume that rose to an altitude of 11 km (8 km above the summit) and drifted NNE and then NW, extending 900 km NW within two days at an altitude of 8 km. Minor ashfall was noted in Kozyrevsk (45 km WNW). At 0820 on 20 October an ash plume was identified in satellite images drifting 100 km ENE at altitudes of 4-4.5 km.
Lava flows and hot avalanches from the dome down the SE flank continued over the next few days, including 23 October when clear conditions allowed good observations (figures 58 and 59). A large thermal anomaly was observed over the volcano through 24 October, and in the summit crater on 30 October (figure 60). Strong fumarolic activity continued, with numerous avalanches and occasional incandescence. By the last week of October, volcanic activity had decreased to a level consistent with that earlier in the reporting period.
Aviation warnings were frequently updated during 17-20 October. KVERT issued a Volcano Observatory Notice for Aviation (VONA) on 17 October at 1419 and 1727 (0219 and 0527 UTC) raising the Aviation Color Code (ACC) from Yellow to Orange (second highest level). The next day, KVERT issued a VONA at 1705 (0505 UTC) raising the ACC to Red (highest level) but lowered it back to Orange at 2117 (0917 UTC). After another decrease to Yellow and back to Orange, the ACC was reduced to Yellow on 20 October at 1204 (0004 UTC). In addition, the Tokyo VAAC issued a series of Volcanic Ash Advisories beginning on 16 October and continuing through 30 October.
Geologic Background. The modern Bezymianny, much smaller than its massive neighbors Kamen and Kliuchevskoi on the Kamchatka Peninsula, was formed about 4,700 years ago over a late-Pleistocene lava-dome complex and an edifice built about 11,000-7,000 years ago. Three periods of intensified activity have occurred during the past 3,000 years. The latest period, which was preceded by a 1,000-year quiescence, began with the dramatic 1955-56 eruption. This eruption, similar to that of St. Helens in 1980, produced a large open crater that was formed by collapse of the summit and an associated lateral blast. Subsequent episodic but ongoing lava-dome growth, accompanied by intermittent explosive activity and pyroclastic flows, has largely filled the 1956 crater.
Information Contacts: Kamchatka Volcanic Eruptions Response Team (KVERT), Far Eastern Branch, Russian Academy of Sciences, 9 Piip Blvd., Petropavlovsk-Kamchatsky, 683006, Russia (URL: http://www.kscnet.ru/ivs/kvert/); Kamchatka Volcanological Station, Kamchatka Branch of Geophysical Survey, (KB GS RAS), Klyuchi, Kamchatka Krai, Russia (URL: http://volkstat.ru/); Tokyo Volcanic Ash Advisory Center (VAAC), 1-3-4 Otemachi, Chiyoda-ku, Tokyo 100-8122, Japan (URL: http://ds.data.jma.go.jp/svd/vaac/data/); Hawai'i Institute of Geophysics and Planetology (HIGP) - MODVOLC Thermal Alerts System, School of Ocean and Earth Science and Technology (SOEST), Univ. of Hawai'i, 2525 Correa Road, Honolulu, HI 96822, USA (URL: http://modis.higp.hawaii.edu/); MIROVA (Middle InfraRed Observation of Volcanic Activity), a collaborative project between the Universities of Turin and Florence (Italy) supported by the Centre for Volcanic Risk of the Italian Civil Protection Department (URL: http://www.mirovaweb.it/); Copernicus Browser, Copernicus Data Space Ecosystem, European Space Agency (URL: https://dataspace.copernicus.eu/browser/).chr
Kilauea (United States) — January 2023 Cite this Report
Kilauea
United States
19.421°N, 155.287°W; summit elev. 1222 m
All times are local (unless otherwise noted)
Low-level lava effusions in the lava lake at Halema’uma’u during July-December 2022
Kīlauea is the southeastern-most volcano in Hawaii and overlaps the E flank of the Mauna Loa volcano. Its East Rift Zone (ERZ) has been intermittently active for at least 2,000 years. An extended eruption period began in January 1983 and was characterized by open lava lakes and lava flows from the summit caldera and the East Rift Zone. During May 2018 magma migrated into the Lower East Rift Zone (LERZ) and opened 24 fissures along a 6-km-long NE-trending fracture zone that produced lava flows traveling in multiple directions. As lava emerged from the fissures, the lava lake at Halema'uma'u drained and explosions sent ash plumes to several kilometers altitude (BGVN 43:10).
The current eruption period started during September 2021 and has recently been characterized by lava effusions, spatter, and sulfur dioxide emissions in the active Halema’uma’u lava lake (BGVN 47:08). Lava effusions, some spatter, and sulfur dioxide emissions have continued during this reporting period of July through December 2022 using daily reports, volcanic activity notices, and abundant photo, map, and video data from the US Geological Survey's (USGS) Hawaiian Volcano Observatory (HVO).
Summary of activity during July-December 2022. Low-level effusions have continued at the western vent of the Halema’uma’u crater during July through early December 2022. Occasional weak ooze-outs (also called lava break outs) would occur along the margins of the crater floor. The overall level of the active lava lake throughout the reporting period gradually increased due to infilling, however it stagnated in mid-September (table 13). During September through November, activity began to decline, though lava effusions persisted at the western vent. By 9 December, the active part of the lava lake had completely crusted over, and incandescence was no longer visible.
Table 13. Summary of measurements taken during overflights at Kīlauea that show a gradual increase in the active lava lake level and the volume of lava effused since 29 September 2021. Lower activity was reported during September-October. Data collected during July-December 2022. Courtesy of HVO.
| Date: |
Level of the active lava lake (m): |
Cumulative volume of lava effused (million cubic meters): |
| 7 Jul 2022 |
130 |
95 |
| 19 Jul 2022 |
133 |
98 |
| 4 Aug 2022 |
136 |
102 |
| 16 Aug 2022 |
137 |
104 |
| 12 Sep 2022 |
143 |
111 |
| 5 Oct 2022 |
143 |
111 |
| 28 Oct 2022 |
143 |
111 |
Activity during July 2022. Lava effusions were reported from the western vent in the Halema’uma’u crater, along with occasional weak ooze-outs along the margins of the crater floor. The height of the lava lake was variable due to deflation-inflation tilt events; for example, the lake level dropped approximately 3-4 m during a summit deflation-inflation event reported on 1 July. Webcam images taken during the night of 6-12 July showed intermittent low-level spattering at the western vent that rose less than 10 m above the vent (figure 519). Measurements made during an overflight on 7 July indicated that the crater floor was infilled about 130 m and that 95 million cubic meters of lava had been effused since 29 September 2021. A single, relatively small lava ooze-out was active to the S of the lava lake. Around midnight on 8 July there were two brief periods of lava overflow onto the lake margins. On 9 July lava ooze-outs were reported near the SE and NE edges of the crater floor and during 10-11 July they occurred near the E, NE, and NW edges. On 16 July crater incandescence was reported, though the ooze-outs and spattering were not visible. On 18 July overnight webcam images showed incandescence in the western vent complex and two ooze-outs were reported around 0000 and 0200 on 19 July. By 0900 there were active ooze-outs along the SW edge of the crater floor. Measurements made from an overflight on 19 July indicated that the crater floor was infilled about 133 m and 98 million cubic meters of lava had erupted since 29 September 2021 (figure 520). On 20 July around 1600 active ooze-outs were visible along the N edge of the crater, which continued through the next day. Extensive ooze-outs occurred along the W margin during 24 July until 1900; on 26 July minor ooze-outs were noted along the N margin. Minor spattering was visible on 29 July along the E margin of the lake. The sulfur dioxide emission rates ranged 650-2,800 tons per day (t/d), the higher of which was measured on 8 July (figure 519).
Activity during August 2022. The eruption continued in the Halema’uma’u crater at the western vent. According to HVO the lava in the active lake remained at the level of the bounding levees. Occasional minor ooze-outs were observed along the margins of the crater floor. Strong nighttime crater incandescence was visible after midnight on 6 August over the western vent cone. During 6-7 August scattered small lava lobes were active along the crater floor and incandescence persisted above the western vent through 9 August. During 7-9 August HVO reported a single lava effusion source was active along the NW margin of the crater floor. Measurements from an overflight on 4 August indicated that the crater floor was infilled about 136 m total and that 102 million cubic meters of lava had been erupted since the start of the eruption. Lava breakouts were reported along the N, NE, E, S, and W margins of the crater during 10-16 August. Another overflight survey conducted on 16 August indicated that the crater floor infilled about 137 m and 104 million cubic meters of lava had been erupted since September 2021. Measured sulfur dioxide emissions rates ranged 1,150-2,450 t/d, the higher of which occurred on 8 August.
Activity during September 2022. During September, lava effusion continued from the western vent into the active lava lake and onto the crater floor. Intermittent minor ooze-outs were reported through the month. A small ooze-out was visible on the W crater floor margin at 0220 on 2 September, which showed decreasing surface activity throughout the day, but remained active through 3 September. On 3 September around 1900 a lava outbreak occurred along the NW margin of the crater floor but had stopped by the evening of 4 September. Field crews monitoring the summit lava lake on 9 September observed spattering on the NE margin of the lake that rose no higher than 10 m, before falling back onto the lava lake crust (figure 521). Overflight measurements on 12 September indicated that the crater floor was infilled a total of 143 m and 111 million cubic meters of lava had been erupted since September 2021. Extensive breakouts in the W and N part of the crater floor were reported at 1600 on 20 September and continued into 26 September. The active part of the lava lake dropped by 10 m while other parts of the crater floor dropped by several meters. Summit tiltmeters recorded a summit seismic swarm of more than 80 earthquakes during 1500-1800 on 21 September, which occurred about 1.5 km below Halema’uma’u; a majority of these were less than Mw 2. By 22 September the active part of the lava lake was infilled about 2 m. On 23 September the western vent areas exhibited several small spatter cones with incandescent openings, along with weak, sporadic spattering (figure 522). The sulfur dioxide emission rate ranged from 930 t/d to 2,000 t/d, the higher of which was measured on 6 September.
Activity during October 2022. Activity during October declined slightly compared to previous months, though lava effusions persisted from the western vent into the active lava lake and onto the crater floor during October (figure 523). Slight variations in the lava lake were noted throughout the month. HVO reported that around 0600 on 3 October the level of the lava lake has lowered slightly. Overflight measurements taken on 5 October indicated that the crater floor was infilled a total of about 143 m and that 111 million cubic meters of lava had been effused since September 2021. During 6-7 October the lake gradually rose 0.5 m. Sulfur dioxide measurements made on 22 October had an emission rate of 700 t/d. Another overflight taken on 28 October showed that there was little to no change in the elevation of the crater floor: the crater floor was infilled a total of 143 m and 111 million cubic meters of lava had erupted since the start of the eruption.
Activity during November 2022. Activity remained low during November, though HVO reported that lava from the western vent continued to effuse into the active lava lake and onto the crater floor throughout the month. The rate of sulfur dioxide emissions during November ranged from 300-600 t/d, the higher amount of which occurred on 9 November.
Activity during December 2022. Similar low activity was reported during December, with lava effusing from the western vent into the active lava lake and onto the crater floor. During 4-5 December the active part of the lava lake was slightly variable in elevation and fluctuated within 1 m. On 9 December HVO reported that lava was no longer erupting from the western vent in the Halema’uma’u crater and that sulfur dioxide emissions had returned to near pre-eruption background levels; during 10-11 December, the lava lake had completely crusted over, and no incandescence was visible (figure 524). Time lapse camera images covering the 4-10 December showed that the crater floor showed weak deflation and no inflation. Some passive events of crustal overturning were reported during 14-15 December, which brought fresh incandescent lava to the lake surface. The sulfur dioxide emission rate was approximately 200 t/d on 14 December. A smaller overturn event on 17 December and another that occurred around 0000 and into the morning of 20 December were also detected. A small seismic swarm was later detected on 30 December.
Geologic Background. Kilauea overlaps the E flank of the massive Mauna Loa shield volcano in the island of Hawaii. Eruptions are prominent in Polynesian legends; written documentation since 1820 records frequent summit and flank lava flow eruptions interspersed with periods of long-term lava lake activity at Halemaumau crater in the summit caldera until 1924. The 3 x 5 km caldera was formed in several stages about 1,500 years ago and during the 18th century; eruptions have also originated from the lengthy East and Southwest rift zones, which extend to the ocean in both directions. About 90% of the surface of the basaltic shield volcano is formed of lava flows less than about 1,100 years old; 70% of the surface is younger than 600 years. The long-term eruption from the East rift zone between 1983 and 2018 produced lava flows covering more than 100 km2, destroyed hundreds of houses, and added new coastline.
Information Contacts: Hawaiian Volcano Observatory (HVO), U.S. Geological Survey, PO Box 51, Hawai'i National Park, HI 96718, USA (URL: http://hvo.wr.usgs.gov/).
Nyamulagira (DR Congo) — November 2023 Cite this Report
Nyamulagira
DR Congo
1.408°S, 29.2°E; summit elev. 3058 m
All times are local (unless otherwise noted)
Lava flows and thermal activity during May-October 2023
Nyamulagira (also known as Nyamuragira) is a shield volcano in the Democratic Republic of Congo with the summit truncated by a small 2 x 2.3 km caldera with walls up to about 100 m high. Documented eruptions have occurred within the summit caldera, as well as from numerous flank fissures and cinder cones. The current eruption period began in April 2018 and has more recently been characterized by summit crater lava flows and thermal activity (BGVN 48:05). This report describes lava flows and variable thermal activity during May through October 2023, based on information from the Observatoire Volcanologique de Goma (OVG) and various satellite data.
Lava lake activity continued during May. The MIROVA (Middle InfraRed Observation of Volcanic Activity) system recorded moderate-to-strong thermal activity throughout the reporting period; activity was more intense during May and October and relatively weaker from June through September (figure 95). The MODVOLC thermal algorithm, detected a total of 209 thermal alerts. There were 143 hotspots detected during May, eight during June, nine during September, and 49 during October. This activity was also reflected in infrared satellite images, where a lava flow was visible in the NW part of the crater on 7 May and strong activity was seen in the center of the crater on 4 October (figure 96). Another infrared satellite image taken on 12 May showed still active lava flows along the NW margin of the crater. According to OVG lava effusions were active during 7-29 May and moved to the N and NW parts of the crater beginning on 9 May. Strong summit crater incandescence was visible from Goma (27 km S) during the nights of 17, 19, and 20 May (figure 97). On 17 May there was an increase in eruptive activity, which peaked at 0100 on 20 May. Notable sulfur dioxide plumes drifted NW and W during 19-20 May (figure 98). Drone footage acquired in partnership with the USGS (United States Geological Survey) on 20 May captured images of narrow lava flows that traveled about 100 m down the W flank (figure 99). Data from the Rumangabo seismic station indicated a decreasing trend in activity during 17-21 May. Although weather clouds prevented clear views of the summit, a strong thermal signature on the NW flank was visible in an infrared satellite image on 22 May, based on an infrared satellite image. On 28 May the lava flows on the upper W flank began to cool and solidify. By 29 May seismicity returned to levels similar to those recorded before the 17 May increase. Lava effusion continued but was confined to the summit crater; periodic crater incandescence was observed.
Low-level activity was noted during June through October. On 1 June OVG reported that seismicity remained at lower levels and that crater incandescence had been absent for three days, though infrared satellite imagery showed continued lava effusion in the summit crater. The lava flows on the flanks covered an estimated 0.6 km2. Satellite imagery continued to show thermal activity confined to the lava lake through October (figure 96), although no lava flows or significant sulfur dioxide emissions were reported.
Geologic Background. Africa's most active volcano, Nyamulagira (also known as Nyamuragira), is a massive high-potassium basaltic shield about 25 km N of Lake Kivu and 13 km NNW of the steep-sided Nyiragongo volcano. The summit is truncated by a small 2 x 2.3 km caldera that has walls up to about 100 m high. Documented eruptions have occurred within the summit caldera, as well as from the numerous flank fissures and cinder cones. A lava lake in the summit crater, active since at least 1921, drained in 1938, at the time of a major flank eruption. Recent lava flows extend down the flanks more than 30 km from the summit as far as Lake Kivu; extensive lava flows from this volcano have covered 1,500 km2 of the western branch of the East African Rift.
Information Contacts: Observatoire Volcanologique de Goma (OVG), Departement de Geophysique, Centre de Recherche en Sciences Naturelles, Lwiro, D.S. Bukavu, DR Congo; Hawai'i Institute of Geophysics and Planetology (HIGP) - MODVOLC Thermal Alerts System, School of Ocean and Earth Science and Technology (SOEST), Univ. of Hawai'i, 2525 Correa Road, Honolulu, HI 96822, USA (URL: http://modis.higp.hawaii.edu/); MIROVA (Middle InfraRed Observation of Volcanic Activity), a collaborative project between the Universities of Turin and Florence (Italy) supported by the Centre for Volcanic Risk of the Italian Civil Protection Department (URL: http://www.mirovaweb.it/); NASA Global Sulfur Dioxide Monitoring Page, Atmospheric Chemistry and Dynamics Laboratory, NASA Goddard Space Flight Center (NASA/GSFC), 8800 Greenbelt Road, Goddard, Maryland, USA (URL: https://so2.gsfc.nasa.gov/); Copernicus Browser, Copernicus Data Space Ecosystem, European Space Agency (URL: https://dataspace.copernicus.eu/browser/); Charles Balagizi, Goma Volcano Observatory, Departement de Geophysique, Centre de Recherche en Sciences Naturelles, Lwiro, D.S. Bukavu, DR Congo.
Bagana (Papua New Guinea) — October 2023 Cite this Report
Bagana
Papua New Guinea
6.137°S, 155.196°E; summit elev. 1855 m
All times are local (unless otherwise noted)
Explosions, ash plumes, ashfall, and lava flows during April-September 2023
The remote volcano of Bagana is located in central Bougainville Island, Papua New Guinea. Recorded eruptions date back to 1842 and activity has consisted of effusive activity that has built a small lava dome in the summit crater and occasional explosions that produced pyroclastic flows. The most recent eruption has been ongoing since February 2000 and has produced occasional explosions, ash plumes, and lava flows. More recently, activity has been characterized by ongoing effusive activity and ash emissions (BGVN 48:04). This report updates activity from April through September 2023 that has consisted of explosions, ash plumes, ashfall, and lava flows, using information from the Darwin Volcanic Ash Advisory Center (VAAC) and satellite data.
An explosive eruption was reported on 7 July that generated a large gas-and-ash plume to high altitudes and caused significant ashfall in local communities; the eruption plume had reached upper tropospheric (16-18 km altitude) altitudes by 2200, according to satellite images. Sulfur dioxide plumes were detected in satellite images on 8 July and indicated that the plume was likely a mixture of gas, ice, and ash. A report issued by the Autonomous Bougainville Government (ABG) (Torokina District, Education Section) on 10 July noted that significant ash began falling during 2000-2100 on 7 July and covered most areas in the Vuakovi, Gotana (9 km SW), Koromaketo, Laruma (25 km W) and Atsilima (27 km NW) villages. Pyroclastic flows also occurred, according to ground-based reports; small deposits confined to one drainage were inspected by RVO during an overflight on 17 July and were confirmed to be from the 7 July event. Ashfall continued until 10 July and covered vegetation, which destroyed bushes and gardens and contaminated rivers and streams.
RVO reported another eruption on 14 July. The Darwin VAAC stated that an explosive event started around 0830 on 15 July and produced an ash plume that rose to 16.5 km altitude by 1000 and drifted N, according to satellite images. The plume continued to drift N and remained visible through 1900, and by 2150 it had dissipated.
Ashfall likely from both the 7 and 15 July events impacted about 8,111 people in Torokina (20 km SW), including Tsito/Vuakovi, Gotana, Koromaketo, Kenaia, Longkogari, Kenbaki, Piva (13 km SW), and Atsinima, and in the Tsitovi district, according to ABG. Significant ashfall was also reported in Ruruvu (22 km N) in the Wakunai District of Central Bougainville, though the thickness of these deposits could not be confirmed. An evacuation was called for the villages in Wakunai, where heavy ashfall had contaminated water sources; the communities of Ruruvu, Togarau, Kakarapaia, Karauturi, Atao, and Kuritaturi were asked to evacuate to a disaster center at the Wakunai District Station, and communities in Torokina were asked to evacuate to the Piva District station. According to a news article, more than 7,000 people needed temporary accommodations, with about 1,000 people in evacuation shelters. Ashfall had deposited over a broad area, contaminating water supplies, affecting crops, and collapsing some roofs and houses in rural areas. Schools were temporarily shut down. Intermittent ash emissions continued through the end of July and drifted NNW, NW, and SW. Fine ashfall was reported on the coast of Torokina, and ash plumes also drifted toward Laruma and Atsilima.
A small explosive eruption occurred at 2130 on 28 July that ejected material from the crater vents, according to reports from Torokina, in addition to a lava flow that contained two lobes. A second explosion was detected at 2157. Incandescence from the lava flow was visible from Piva as it descended the W flank around 2000 on 29 July (figure 47). The Darwin VAAC reported that a strong thermal anomaly was visible in satellite images during 30-31 July and that ash emissions rose to 2.4 km altitude and drifted WSW on 30 July. A ground report from RVO described localized emissions at 0900 on 31 July.
The Darwin VAAC reported that ash plumes were identified in satellite imagery at 0800 and 1220 on 12 August and rose to 2.1 km and 3 km altitude and drifted NW and W, respectively. A news report stated that aid was sent to more than 6,300 people that were adversely affected by the eruption. Photos taken during 17-19 August showed ash emissions rising no higher than 1 km above the summit and drifting SE. A small explosion generated an ash plume during the morning of 19 August. Deposits from small pyroclastic flows were also captured in the photos. Satellite images captured lava flows and pyroclastic flow deposits. Two temporary seismic stations were installed near Bagana on 17 August at distances of 7 km WSW (Vakovi station) and 11 km SW (Kepox station). The Kepox station immediately started to record continuous, low-frequency background seismicity.
Satellite data. Little to no thermal activity was detected during April through mid-July 2023; only one anomaly was recorded during early April and one during early June, according to MIROVA (Middle InfraRed Observation of Volcanic Activity) data (figure 48). Thermal activity increased in both power and frequency during mid-July through September, although there were still some short gaps in detected activity. MODVOLC also detected increased thermal activity during August; thermal hotspots were detected a total of five times on 19, 20, and 27 August. Weak thermal anomalies were also captured in infrared satellite images on clear weather days throughout the reporting period on 7, 12, and 17 April, 27 May, 1, 6, 16, and 31 July, and 19 September (figure 48); a strong thermal anomaly was visible on 31 July. Distinct sulfur dioxide plumes that drifted generally NW were intermittently captured by the TROPOMI instrument on the Sentinel-5P satellite and sometimes exceeded two Dobson Units (DUs) (figure 49).
Geologic Background. Bagana volcano, in a remote portion of central Bougainville Island, is frequently active. This massive symmetrical cone was largely constructed by an accumulation of viscous andesitic lava flows. The entire edifice could have been constructed in about 300 years at its present rate of lava production. Eruptive activity is characterized by non-explosive effusion of viscous lava that maintains a small lava dome in the summit crater, although occasional explosive activity produces pyroclastic flows. Lava flows with tongue-shaped lobes up to 50 m thick and prominent levees descend the flanks on all sides.
Information Contacts: Rabaul Volcano Observatory (RVO), Geohazards Management Division, Department of Mineral Policy and Geohazards Management (DMPGM), PO Box 3386, Kokopo, East New Britain Province, Papua New Guinea; Darwin Volcanic Ash Advisory Centre (VAAC), Bureau of Meteorology, Northern Territory Regional Office, PO Box 40050, Casuarina, NT 0811, Australia (URL: http://www.bom.gov.au/info/vaac/); MIROVA (Middle InfraRed Observation of Volcanic Activity), a collaborative project between the Universities of Turin and Florence (Italy) supported by the Centre for Volcanic Risk of the Italian Civil Protection Department (URL: http://www.mirovaweb.it/); Hawai'i Institute of Geophysics and Planetology (HIGP) - MODVOLC Thermal Alerts System, School of Ocean and Earth Science and Technology (SOEST), Univ. of Hawai'i, 2525 Correa Road, Honolulu, HI 96822, USA (URL: http://modis.higp.hawaii.edu/); NASA Global Sulfur Dioxide Monitoring Page, Atmospheric Chemistry and Dynamics Laboratory, NASA Goddard Space Flight Center (NASA/GSFC), 8800 Greenbelt Road, Goddard, Maryland, USA (URL: https://so2.gsfc.nasa.gov/); Copernicus Browser, Copernicus Data Space Ecosystem, European Space Agency (URL: https://dataspace.copernicus.eu/browser/); Autonomous Bougainville Government, P.O Box 322, Buka, AROB, PNG (URL: https://abg.gov.pg/); Andrew Tupper (Twitter: @andrewcraigtupp); Simon Carn, Geological and Mining Engineering and Sciences, Michigan Technological University, 1400 Townsend Drive, Houghton, MI 49931, USA (URL: http://www.volcarno.com/, Twitter: @simoncarn); Radio NZ (URL: https://www.rnz.co.nz/news/pacific/494464/more-than-7-000-people-in-bougainville-need-temporary-accommodation-after-eruption); USAID, 1300 Pennsylvania Ave, NW, Washington DC 20004, USA (URL: https://www.usaid.gov/pacific-islands/press-releases/aug-08-2023-united-states-provides-immediate-emergency-assistance-support-communities-affected-mount-bagana-volcanic-eruptions).
Mayon (Philippines) — October 2023 Cite this Report
Mayon
Philippines
13.257°N, 123.685°E; summit elev. 2462 m
All times are local (unless otherwise noted)
Lava flows, pyroclastic flows, ash emissions, and seismicity during April-September 2023
Mayon is located in the Philippines and has steep upper slopes capped by a small summit crater. Historical eruptions date back to 1616 CE that have been characterized by Strombolian eruptions, lava flows, pyroclastic flows, and mudflows. Eruptions mostly originated from a central conduit. Pyroclastic flows and mudflows have commonly descended many of the approximately 40 drainages that surround the volcano. The most recent eruption occurred during June through October 2022 and consisted of lava dome growth and gas-and-steam emissions (BGVN 47:12). A new eruption was reported during late April 2023 and has included lava flows, pyroclastic density currents, ash emissions, and seismicity. This report covers activity during April through September 2023 based on daily bulletins from the Philippine Institute of Volcanology and Seismology (PHIVOLCS).
During April through September 2023, PHIVOLCS reported near-daily rockfall events, frequent volcanic earthquakes, and sulfur dioxide measurements. Gas-and-steam emissions rose 100-900 m above the crater and drifted in different directions. Nighttime crater incandescence was often visible during clear weather and was accompanied by incandescent avalanches of material. Activity notably increased during June when lava flows were reported on the S, SE, and E flanks (figure 52). The MIROVA graph (Middle InfraRed Observation of Volcanic Activity) showed strong thermal activity coincident with these lava flows, which remained active through September (figure 53). According to the MODVOLC thermal algorithm, a total of 110 thermal alerts were detected during the reporting period: 17 during June, 40 during July, 27 during August, and 26 during September. During early June, pyroclastic density currents (PDCs) started to occur more frequently.
Low activity was reported during much of April and May; gas-and-steam emissions rose 100-900 m above the crater and generally drifted in different directions. A total of 52 rockfall events and 18 volcanic earthquakes were detected during April and 147 rockfall events and 13 volcanic events during May. Sulfur dioxide flux measurements ranged between 400-576 tons per day (t/d) during April, the latter of which was measured on 29 April and between 162-343 t/d during May, the latter of which was measured on 13 May.
Activity during June increased, characterized by lava flows, pyroclastic density currents (PDCs), crater incandescence and incandescent rockfall events, gas-and-steam emissions, and continued seismicity. Weather clouds often prevented clear views of the summit, but during clear days, moderate gas-and-steam emissions rose 100-2,500 m above the crater and drifted in multiple directions. A total of 6,237 rockfall events and 288 volcanic earthquakes were detected. The rockfall events often deposited material on the S and SE flanks within 700-1,500 m of the summit crater and ash from the events drifted SW, S, SE, NE, and E. Sulfur dioxide emissions ranged between 149-1,205 t/d, the latter of which was measured on 10 June. Short-term observations from EDM and electronic tiltmeter monitoring indicated that the upper slopes were inflating since February 2023. Longer-term ground deformation parameters based on EDM, precise leveling, continuous GPS, and electronic tilt monitoring indicated that the volcano remained inflated, especially on the NW and SE flanks. At 1000 on 5 June the Volcano Alert Level (VAL) was raised to 2 (on a 0-5 scale). PHIVOLCS noted that although low-level volcanic earthquakes, ground deformation, and volcanic gas emissions indicated unrest, the steep increase in rockfall frequency may indicate increased dome activity.
A total of 151 dome-collapse PDCs occurred during 8-9 and 11-30 June, traveled 500-2,000 m, and deposited material on the S flank within 2 km of the summit crater. During 8-9 June the VAL was raised to 3. At approximately 1947 on 11 June lava flow activity was reported; two lobes traveled within 500 m from the crater and deposited material on the S (Mi-isi), SE (Bonga), and E (Basud) flanks. Weak seismicity accompanied the lava flow and slight inflation on the upper flanks. This lava flow remained active through 30 June, moving down the S and SE flank as far as 2.5 km and 1.8 km, respectively and depositing material up to 3.3 km from the crater. During 15-16 June traces of ashfall from the PDCs were reported in Sitio Buga, Nabonton, City of Ligao and Purok, and San Francisco, Municipality of Guinobatan. During 28-29 June there were two PDCs generated by the collapse of the lava flow front, which generated a light-brown ash plume 1 km high. Satellite monitors detected significant concentrations of sulfur dioxide beginning on 29 June. On 30 June PDCs primarily affected the Basud Gully on the E flank, the largest of which occurred at 1301 and lasted eight minutes, based on the seismic record. Four PDCs generated between 1800 and 2000 that lasted approximately four minutes each traveled 3-4 km on the E flank and generated an ash plume that rose 1 km above the crater and drifted N and NW. Ashfall was recorded in Tabaco City.
Similar strong activity continued during July; slow lava effusion remained active on the S and SE flanks and traveled as far as 2.8 km and 2.8 km, respectively and material was deposited as far as 4 km from the crater. There was a total of 6,983 rockfall events and 189 PDCs that affected the S, SE, and E flanks. The volcano network detected a total of 2,124 volcanic earthquakes. Continuous gas-and-steam emissions rose 200-2,000 m above the crater and drifted in multiple directions. Sulfur dioxide emissions averaged 792-4,113 t/d, the latter of which was measured on 28 July. During 2-4 July three PDCs were generated from the collapse of the lava flow and resulting light brown plumes rose 200-300 m above the crater. Continuous tremor pulses were reported beginning at 1547 on 3 July through 7 July at 1200, at 2300 on 8 July and going through 0300 on 10 July, and at 2300 on 16 July, as recorded by the seismic network. During 6-9 July there were 10 lava flow-collapse-related PDCs that generated light brown plumes 300-500 m above the crater. During 10-11 July light ashfall was reported in some areas of Mabinit, Legazpi City, Budiao and Salvacion, Daraga, and Camalig, Albay. By 18 July the lava flow advanced 600 m on the E flank as well.
During 1733 on 18 July and 0434 on 19 July PHIVOLCS reported 30 “ashing” events, which are degassing events accompanied by audible thunder-like sounds and entrained ash at the crater, which produced short, dark plumes that drifted SW. These events each lasted 20-40 seconds, and plume heights ranged from 150-300 m above the crater, as recorded by seismic, infrasound, visual, and thermal monitors. Three more ashing events occurred during 19-20 July. Short-term observations from electronic tilt and GPS monitoring indicate deflation on the E lower flanks in early July and inflation on the NW middle flanks during the third week of July. Longer-term ground deformation parameters from EDM, precise leveling, continuous GPS, and electronic tilt monitoring indicated that the volcano was still generally inflated relative to baseline levels. A short-lived lava pulse lasted 28 seconds at 1956 on 21 July, which was accompanied by seismic and infrasound signals. By 22 July, the only lava flow that remained active was on the SE flank, and continued to extend 3.4 km, while those on the S and E flanks weakened markedly. One ashing event was detected during 30-31 July, whereas there were 57 detected during 31 July-1 August; according to PHIVOLCS beginning at approximately 1800 on 31 July eruptive activity was dominated by phases of intermittent ashing, as well as increased in the apparent rates of lava effusion from the summit crater. The ashing phases consisted of discrete events recorded as low-frequency volcanic earthquakes (LFVQ) typically 30 seconds in duration, based on seismic and infrasound signals. Gray ash plume rose 100 m above the crater and generally drifted NE. Shortly after these ashing events began, new lava began to effuse rapidly from the crater, feeding the established flowed on the SE, E, and E flanks and generating frequent rockfall events.
Intensified unrest persisted during August. There was a total of 4,141 rockfall events, 2,881 volcanic earthquakes, which included volcanic tremor events, 32 ashing events, and 101 PDCs detected throughout the month. On clear weather days, gas-and-steam emissions rose 300-1,500 m above the crater and drifted in different directions (figure 54). Sulfur dioxide emissions averaged 735-4,756 t/d, the higher value of which was measured on 16 August. During 1-2 August the rate of lava effusion decreased, but continued to feed the flows on the SE, S, and E flanks, maintaining their advances to 3.4 km, 2.8 km, and 1.1 km from the crater, respectively (figure 55). Rockfall and PDCs generated by collapses at the lava flow margins and from the summit dome deposited material within 4 km of the crater. During 3-4 August there were 10 tremor events detected that lasted 1-4 minutes. Short-lived lava pulse lasted 35 seconds and was accompanied by seismic and infrasound signals at 0442 on 6 August. Seven collapses were recorded at the front of the lava flow during 12-14 August.
During September, similar activity of slow lava effusion, PDCs, gas-and-steam emissions, and seismicity continued. There was a total of 4,452 rockfall events, 329 volcanic earthquakes, which included volcanic tremor events, two ashing events, and 85 PDCs recorded throughout the month. On clear weather days, gas-and-steam emissions rose 100-1,500 m above the crater and drifted in multiple directions. Sulfur dioxide emissions averaged 609-2,252 t/d, the higher average of which was measured on 6 September. Slow lava effusion continued advancing on the SE, S, and E flanks, maintaining lengths of 3.4 km, 2.8 km, and 1.1 km, respectively. Rockfall and PDC events generated by collapses along the lava flow margins and at the summit dome deposited material within 4 km of the crater.
Geologic Background. Symmetrical Mayon, which rises above the Albay Gulf NW of Legazpi City, is the most active volcano of the Philippines. The steep upper slopes are capped by a small summit crater. Recorded eruptions since 1616 CE range from Strombolian to basaltic Plinian, with cyclical activity beginning with basaltic eruptions, followed by longer periods of andesitic lava flows. Eruptions occur predominately from the central conduit and have also produced lava flows that travel far down the flanks. Pyroclastic density currents and mudflows have commonly swept down many of the approximately 40 ravines that radiate from the summit and have often damaged populated lowland areas. A violent eruption in 1814 killed more than 1,200 people and devastated several towns.
Information Contacts: Philippine Institute of Volcanology and Seismology (PHIVOLCS), Department of Science and Technology, University of the Philippines Campus, Diliman, Quezon City, Philippines (URL: http://www.phivolcs.dost.gov.ph/); MIROVA (Middle InfraRed Observation of Volcanic Activity), a collaborative project between the Universities of Turin and Florence (Italy) supported by the Centre for Volcanic Risk of the Italian Civil Protection Department (URL: http://www.mirovaweb.it/); Hawai'i Institute of Geophysics and Planetology (HIGP) - MODVOLC Thermal Alerts System, School of Ocean and Earth Science and Technology (SOEST), Univ. of Hawai'i, 2525 Correa Road, Honolulu, HI 96822, USA (URL: http://modis.higp.hawaii.edu/); Copernicus Browser, Copernicus Data Space Ecosystem, European Space Agency (URL: https://dataspace.copernicus.eu/browser/); William Rogers, Legazpi City, Albay Province, Philippines.
Nishinoshima (Japan) — October 2023 Cite this Report
Nishinoshima
Japan
27.247°N, 140.874°E; summit elev. 100 m
All times are local (unless otherwise noted)
Eruption plumes and gas-and-steam plumes during May-August 2023
Nishinoshima, located about 1,000 km S of Tokyo, is a small island in the Ogasawara Arc in Japan. The island is the summit of a massive submarine volcano that has prominent submarine peaks to the S, W, and NE. Eruptions date back to 1973 and the current eruption period began in October 2022. Recent activity has consisted of small ash plumes and fumarolic activity (BGVN 48:07). This report covers activity during May through August 2023, using information from monthly reports of the Japan Meteorological Agency (JMA) monthly reports and satellite data.
Activity during May through June was relatively low. The Japan Coast Guard (JCG) did overflights on 14 and 22 June and reported white gas-and-steam emissions rising 600 m and 1,200 m from the central crater of the pyroclastic cone, respectively (figure 125). In addition, multiple white gas-and-steam emissions rose from the inner rim of the W side of the crater and from the SE flank of the pyroclastic cone. Discolored brown-to-green water was observed around almost the entire perimeter of the island; on 22 June light green discolored water was observed off the S coast of the island.
Observations from the Himawari meteorological satellite confirmed an eruption on 9 and 10 July. An eruption plume rose 1.6 km above the crater and drifted N around 1300 on 9 July. Satellite images acquired at 1420 and 2020 on 9 July and at 0220 on 10 July showed continuing emissions that rose 1.3-1.6 km above the crater and drifted NE and N. The Tokyo VAAC reported that an ash plume seen by a pilot and identified in a satellite image at 0630 on 21 July rose to 3 km altitude and drifted S.
Aerial observations conducted by JCG on 8 August showed a white-and-gray plume rising from the central crater of the pyroclastic cone, and multiple white gas-and-steam emissions were rising from the inner edge of the western crater and along the NW-SE flanks of the island (figure 126). Brown-to-green discolored water was also noted around the perimeter of the island.
Intermittent low-to-moderate power thermal anomalies were recorded in the MIROVA graph (Middle InfraRed Observation of Volcanic Activity), showing an increase in both frequency and power beginning in July (figure 127). This increase in activity coincides with eruptive activity on 9 and 10 July, characterized by eruption plumes. According to the MODVOLC thermal alert algorithm, one thermal hotspot was recorded on 20 July. Weak thermal anomalies were also detected in infrared satellite imagery, accompanied by strong gas-and-steam plumes (figure 128).
Geologic Background. The small island of Nishinoshima was enlarged when several new islands coalesced during an eruption in 1973-74. Multiple eruptions that began in 2013 completely covered the previous exposed surface and continued to enlarge the island. The island is the summit of a massive submarine volcano that has prominent peaks to the S, W, and NE. The summit of the southern cone rises to within 214 m of the ocean surface 9 km SSE.
Information Contacts: Japan Meteorological Agency (JMA), 1-3-4 Otemachi, Chiyoda-ku, Tokyo 100-8122, Japan (URL: http://www.jma.go.jp/jma/indexe.html); Tokyo Volcanic Ash Advisory Center (VAAC), 1-3-4 Otemachi, Chiyoda-ku, Tokyo 100-8122, Japan (URL: http://ds.data.jma.go.jp/svd/vaac/data/); MIROVA (Middle InfraRed Observation of Volcanic Activity), a collaborative project between the Universities of Turin and Florence (Italy) supported by the Centre for Volcanic Risk of the Italian Civil Protection Department (URL: http://www.mirovaweb.it/); Copernicus Browser, Copernicus Data Space Ecosystem, European Space Agency (URL: https://dataspace.copernicus.eu/browser/).
Krakatau (Indonesia) — October 2023 Cite this Report
Krakatau
Indonesia
6.1009°S, 105.4233°E; summit elev. 285 m
All times are local (unless otherwise noted)
White gas-and-steam plumes and occasional ash plumes during May-August 2023
Krakatau is located in the Sunda Strait between Java and Sumatra, Indonesia. Caldera collapse during the catastrophic 1883 eruption destroyed Danan and Perbuwatan cones and left only a remnant of Rakata. The post-collapse cone of Anak Krakatau (Child of Krakatau) was constructed within the 1883 caldera at a point between the former Danan and Perbuwatan cones; it has been the site of frequent eruptions since 1927. The current eruption period began in May 2021 and has recently consisted of Strombolian eruptions and ash plumes (BGVN 48:07). This report describes lower levels of activity consisting of ash and white gas-and-steam plumes during May through August 2023, based on information provided by the Indonesian Center for Volcanology and Geological Hazard Mitigation, referred to as Pusat Vulkanologi dan Mitigasi Bencana Geologi (PVMBG), MAGMA Indonesia, and satellite data.
Activity was relatively low during May and June. Daily white gas-and-steam emissions rose 25-200 m above the crater and drifted in different directions. Five ash plumes were detected at 0519 on 10 May, 1241 on 11 May, 0920 on 12 May, 2320 on 12 May, and at 0710 on 13 May, and rose 1-2.5 km above the crater and drifted SW. A webcam image taken on 12 May showed ejection of incandescent material above the vent. A total of nine ash plumes were detected during 6-11 June: at 1434 and 00220 on 6 and 7 June the ash plumes rose 500 m above the crater and drifted NW, at 1537 on 8 June the ash plume rose 1 km above the crater and drifted SW, at 0746 and at 0846 on 9 June the ash plumes rose 800 m and 3 km above the crater and drifted SW, respectively, at 0423, 1431, and 1750 on 10 June the ash plumes rose 2 km, 1.5 km, and 3.5 km above the crater and drifted NW, respectively, and at 0030 on 11 June an ash plume rose 2 km above the crater and drifted NW. Webcam images taken on 10 and 11 June at 0455 and 0102, respectively, showed incandescent material ejected above the vent. On 19 June an ash plume at 0822 rose 1.5 km above the crater and drifted SE.
Similar low activity of white gas-and-steam emissions and few ash plumes were reported during July and August. Daily white gas-and-steam emissions rose 25-300 m above the crater and drifted in multiple directions. Three ash plumes were reported at 0843, 0851, and 0852 on 20 July that rose 500-2,000 m above the crater and drifted NW.
The MIROVA (Middle InfraRed Observation of Volcanic Activity) graph of MODIS thermal anomaly data showed intermittent low-to-moderate power thermal anomalies during May through August 2023 (figure 140). Although activity was often obscured by weather clouds, a thermal anomaly was visible in an infrared satellite image of the crater on 12 May, accompanied by an eruption plume that drifted SW (figure 141).
Geologic Background. The renowned Krakatau (frequently mis-named as Krakatoa) volcano lies in the Sunda Strait between Java and Sumatra. Collapse of an older edifice, perhaps in 416 or 535 CE, formed a 7-km-wide caldera. Remnants of that volcano are preserved in Verlaten and Lang Islands; subsequently the Rakata, Danan, and Perbuwatan cones were formed, coalescing to create the pre-1883 Krakatau Island. Caldera collapse during the catastrophic 1883 eruption destroyed Danan and Perbuwatan, and left only a remnant of Rakata. This eruption caused more than 36,000 fatalities, most as a result of tsunamis that swept the adjacent coastlines of Sumatra and Java. Pyroclastic surges traveled 40 km across the Sunda Strait and reached the Sumatra coast. After a quiescence of less than a half century, the post-collapse cone of Anak Krakatau (Child of Krakatau) was constructed within the 1883 caldera at a point between the former Danan and Perbuwatan cones. Anak Krakatau has been the site of frequent eruptions since 1927.
Information Contacts: Pusat Vulkanologi dan Mitigasi Bencana Geologi (PVMBG, also known as Indonesian Center for Volcanology and Geological Hazard Mitigation, CVGHM), Jalan Diponegoro 57, Bandung 40122, Indonesia (URL: http://www.vsi.esdm.go.id/); MAGMA Indonesia, Kementerian Energi dan Sumber Daya Mineral (URL: https://magma.esdm.go.id/v1); MIROVA (Middle InfraRed Observation of Volcanic Activity), a collaborative project between the Universities of Turin and Florence (Italy) supported by the Centre for Volcanic Risk of the Italian Civil Protection Department (URL: http://www.mirovaweb.it/); Copernicus Browser, Copernicus Data Space Ecosystem, European Space Agency (URL: https://dataspace.copernicus.eu/browser/).
Villarrica (Chile) — October 2023 Cite this Report
Villarrica
Chile
39.42°S, 71.93°W; summit elev. 2847 m
All times are local (unless otherwise noted)
Strombolian activity, gas-and-ash emissions, and crater incandescence during April-September 2023
Villarrica, in central Chile, consists of a 2-km-wide caldera that formed about 3,500 years ago and is located at the base of the presently active cone at the NW margin of a 6-km-wide caldera. Historical eruptions eruptions date back to 1558 and have been characterized by mild-to-moderate explosive activity with occasional lava effusions. The current eruption period began in December 2014 and has recently consisted of nighttime crater incandescence, ash emissions, and seismicity (BGVN 48:04). This report covers activity during April through September 2023 and describes occasional Strombolian activity, gas-and-ash emissions, and nighttime crater incandescence. Information for this report primarily comes from the Southern Andes Volcano Observatory (Observatorio Volcanológico de Los Andes del Sur, OVDAS), part of Chile's National Service of Geology and Mining (Servicio Nacional de Geología y Minería, SERNAGEOMIN) and satellite data.
Seismicity during April consisted of long period (LP) events and tremor (TRE); a total of 9,413 LP-type events and 759 TR-type events were detected throughout the month. Nighttime crater incandescence persisted and was visible in the degassing column. Sulfur dioxide data was obtained using Differential Absorption Optical Spectroscopy Equipment (DOAS) that showed an average value of 1,450 ± 198 tons per day (t/d) during 1-15 April and 1,129 ± 201 t/d during 16-30 April, with a maximum daily value of 2,784 t/d on 9 April. Gas-and-steam emissions of variable intensities rose above the active crater as high as 1.3 km above the crater on 13 April. Strombolian explosions were not observed and there was a slight decrease in the lava lake level.
There were 14,123 LP-type events and 727 TR-type events detected during May. According to sulfur dioxide measurements taken with DOAS equipment, the active crater emitted an average value of 1,826 ± 482 t/d during 1-15 May and 912 ± 41 t/d during 16-30 May, with a daily maximum value of 5,155 t/d on 13 May. Surveillance cameras showed continuous white gas-and-steam emissions that rose as high as 430 m above the crater on 27 May. Nighttime incandescence illuminated the gas column less than 300 m above the crater rim was and no pyroclastic emissions were reported. A landslide was identified on 13 May on the E flank of the volcano 50 m from the crater rim and extending 300 m away; SERNAGEOMIN noted that this event may have occurred on 12 May. During the morning of 27 and 28 May minor Strombolian explosions characterized by incandescent ejecta were recorded at the crater rim; the last reported Strombolian explosions had occurred at the end of March.
Seismic activity during June consisted of five volcano-tectonic (VT)-type events, 21,606 LP-type events, and 2,085 TR-type events. The average value of sulfur dioxide flux obtained by DOAS equipment was 1,420 ± 217 t/d during 1-15 June and 2,562 ± 804 t/d, with a maximum daily value of 4,810 t/d on 17 June. White gas-and-steam emissions rose less than 480 m above the crater; frequent nighttime crater incandescence was reflected in the degassing plume. On 12 June an emission rose 100 m above the crater and drifted NNW. On 15 June one or several emissions resulted in ashfall to the NE as far as 5.5 km from the crater, based on a Skysat satellite image. Several Strombolian explosions occurred within the crater; activity on 15 June was higher energy and ejected blocks 200-300 m on the NE slope. Surveillance cameras showed white gas-and-steam emissions rising 480 m above the crater on 16 June. On 19 and 24 June low-intensity Strombolian activity was observed, ejecting material as far as 200 m from the center of the crater to the E.
During July, seismicity included 29,319 LP-type events, 3,736 TR-type events, and two VT-type events. DOAS equipment recorded two days of sulfur dioxide emissions of 4,220 t/d and 1,009 t/d on 1 and 13 July, respectively. Constant nighttime incandescence was also recorded and was particularly noticeable when accompanied by eruptive columns on 12 and 16 July. Minor explosive events were detected in the crater. According to Skysat satellite images taken on 12, 13, and 16 July, ashfall deposits were identified 155 m S of the crater. According to POVI, incandescence was visible from two vents on the crater floor around 0336 on 12 July. Gas-and-ash emissions rose as high as 1.2 km above the crater on 13 July and drifted E and NW. A series of gas-and-steam pulses containing some ash deposited material on the upper E flank around 1551 on 13 July. During 16-31 July, average sulfur dioxide emissions of 1,679 ± 406 t/d were recorded, with a maximum daily value of 2,343 t/d on 28 July. Fine ash emissions were also reported on 16, 17, and 23 July.
Seismicity persisted during August, characterized by 27,011 LP-type events, 3,323 TR-type events, and three VT-type events. The average value of sulfur dioxide measurements taken during 1-15 August was 1,642 ± 270 t/d and 2,207 ± 4,549 t/d during 16-31 August, with a maximum daily value of 3,294 t/d on 27 August. Nighttime crater incandescence remained visible in degassing columns. White gas-and-steam emissions rose 480 m above the crater on 6 August. According to a Skysat satellite image from 6 August, ash accumulation was observed proximal to the crater and was mainly distributed toward the E slope. White gas-and-steam emissions rose 320 m above the crater on 26 August. Nighttime incandescence and Strombolian activity that generated ash emissions were reported on 27 August.
Seismicity during September was characterized by five VT-type events, 12,057 LP-type events, and 2,058 TR-type events. Nighttime incandescence persisted. On 2 September an ash emission rose 180 m above the crater and drifted SE at 1643 (figure 125) and a white gas-and-steam plume rose 320 m above the crater. According to the Buenos Aires VAAC, periods of continuous gas-and-ash emissions were visible in webcam images from 1830 on 2 September to 0110 on 3 September. Strombolian activity was observed on 2 September and during the early morning of 3 September, the latter event of which generated an ash emission that rose 60 m above the crater and drifted 100 m from the center of the crater to the NE and SW. Ashfall was reported to the SE and S as far as 750 m from the crater. The lava lake was active during 3-4 September and lava fountaining was visible for the first time since 26 March 2023, according to POVI. Fountains captured in webcam images at 2133 on 3 September and at 0054 on 4 September rose as high as 60 m above the crater rim and ejected material onto the upper W flank. Sulfur dioxide flux of 1,730 t/d and 1,281 t/d was measured on 3 and 4 September, respectively, according to data obtained by DOAS equipment.
Strong Strombolian activity and larger gas-and-ash plumes were reported during 18-20 September. On 18 September activity was also associated with energetic LP-type events and notable sulfur dioxide fluxes (as high as 4,277 t/d). On 19 September Strombolian activity and incandescence were observed. On 20 September at 0914 ash emissions rose 50 m above the crater and drifted SSE, accompanied by Strombolian activity that ejected material less than 100 m SSE, causing fall deposits on that respective flank. SERNAGEOMIN reported that a Planet Scope satellite image taken on 20 September showed the lava lake in the crater, measuring 32 m x 35 m and an area of 0.001 km2. Several ash emissions were recorded at 0841, 0910, 1251, 1306, 1312, 1315, and 1324 on 23 September and rose less than 150 m above the crater. The sulfur dioxide flux value was 698 t/d on 23 September and 1,097 t/d on 24 September. On 24 September the Volcanic Alert Level (VAL) was raised to Orange (the third level on a four-color scale). SENAPRED maintained the Alert Level at Yellow (the middle level on a three-color scale) for the communities of Villarrica, Pucón (16 km N), Curarrehue, and Panguipulli.
During 24-25 September there was an increase in seismic energy (observed at TR-events) and acoustic signals, characterized by 1 VT-type event, 213 LP-type events, and 124 TR-type events. Mainly white gas-and-steam emissions, in addition to occasional fine ash emissions were recorded. During the early morning of 25 September Strombolian explosions were reported and ejected material 250 m in all directions, though dominantly toward the NW. On 25 September the average value of sulfur dioxide flux was 760 t/d. Seismicity during 25-30 September consisted of five VT-type events, 1,937 LP-type events, and 456 TR-type events.
During 25-29 September moderate Strombolian activity was observed and ejected material as far as the crater rim. In addition, ash pulses lasting roughly 50 minutes were observed around 0700 and dispersed ENE. During 26-27 September a TR episode lasted 6.5 hours and was accompanied by discrete acoustic signals. Satellite images from 26 September showed a spatter cone on the crater floor with one vent that measured 10 x 14 m and a smaller vent about 35 m NE of the cone. SERNAGEOMIN reported an abundant number of bomb-sized blocks up to 150 m from the crater, as well as impact marks on the snow, which indicated explosive activity. A low-altitude ash emission was observed drifting NW around 1140 on 28 September, based on webcam images. Between 0620 and 0850 on 29 September an ash emission rose 60 m above the crater and drifted NW. During an overflight taken around 1000 on 29 September scientists observed molten material in the vent, a large accumulation of pyroclasts inside the crater, and energetic degassing, some of which contained a small amount of ash. Block-sized pyroclasts were deposited on the internal walls and near the crater, and a distal ash deposit was also visible. The average sulfur dioxide flux measured on 28 September was 344 t/d. Satellite images taken on 29 September ashfall was deposited roughly 3 km WNW from the crater and nighttime crater incandescence remained visible. The average sulfur dioxide flux value from 29 September was 199 t/d. On 30 September at 0740 a pulsating ash emission rose 1.1 km above the crater and drifted NNW (figure 126). Deposits on the S flank extended as far as 4.5 km from the crater rim, based on satellite images from 30 September.
Infrared MODIS satellite data processed by MIROVA (Middle InfraRed Observation of Volcanic Activity) showed intermittent thermal activity during April through September, with slightly stronger activity detected during late September (figure 127). Small clusters of thermal activity were detected during mid-June, early July, early August, and late September. According to the MODVOLC thermal alert system, a total of four thermal hotspots were detected on 7 July and 3 and 23 September. This activity was also intermittently captured in infrared satellite imagery on clear weather days (figure 128).
Geologic Background. The glacier-covered Villarrica stratovolcano, in the northern Lakes District of central Chile, is ~15 km south of the city of Pucon. A 2-km-wide caldera that formed about 3,500 years ago is located at the base of the presently active, dominantly basaltic to basaltic andesite cone at the NW margin of a 6-km-wide Pleistocene caldera. More than 30 scoria cones and fissure vents are present on the flanks. Plinian eruptions and pyroclastic flows that have extended up to 20 km from the volcano were produced during the Holocene. Lava flows up to 18 km long have issued from summit and flank vents. Eruptions documented since 1558 CE have consisted largely of mild-to-moderate explosive activity with occasional lava effusion. Glaciers cover 40 km2 of the volcano, and lahars have damaged towns on its flanks.
Information Contacts: Servicio Nacional de Geología y Minería (SERNAGEOMIN), Observatorio Volcanológico de Los Andes del Sur (OVDAS), Avda Sta María No. 0104, Santiago, Chile (URL: http://www.sernageomin.cl/); Proyecto Observación Villarrica Internet (POVI) (URL: http://www.povi.cl/); Sistema y Servicio Nacional de Prevención y Repuesta Ante Desastres (SENAPRED), Av. Beauchef 1671, Santiago, Chile (URL: https://web.senapred.cl/); Buenos Aires Volcanic Ash Advisory Center (VAAC), Servicio Meteorológico Nacional-Fuerza Aérea Argentina, 25 de mayo 658, Buenos Aires, Argentina (URL: http://www.smn.gov.ar/vaac/buenosaires/inicio.php); MIROVA (Middle InfraRed Observation of Volcanic Activity), a collaborative project between the Universities of Turin and Florence (Italy) supported by the Centre for Volcanic Risk of the Italian Civil Protection Department (URL: http://www.mirovaweb.it/); Hawai'i Institute of Geophysics and Planetology (HIGP) - MODVOLC Thermal Alerts System, School of Ocean and Earth Science and Technology (SOEST), Univ. of Hawai'i, 2525 Correa Road, Honolulu, HI 96822, USA (URL: http://modis.higp.hawaii.edu/); Copernicus Browser, Copernicus Data Space Ecosystem, European Space Agency (URL: https://dataspace.copernicus.eu/browser/).
Merapi (Indonesia) — October 2023 Cite this Report
Merapi
Indonesia
7.54°S, 110.446°E; summit elev. 2910 m
All times are local (unless otherwise noted)
Frequent incandescent avalanches during April-September 2023
Merapi, located just north of the major city of Yogyakarta in central Java, Indonesia, has had activity within the last 20 years characterized by pyroclastic flows and lahars accompanying growth and collapse of the steep-sided active summit lava dome. The current eruption period began in late December 2020 and has more recently consisted of ash plumes, intermittent incandescent avalanches of material, and pyroclastic flows (BGVN 48:04). This report covers activity during April through September 2023, based on information from Balai Penyelidikan dan Pengembangan Teknologi Kebencanaan Geologi (BPPTKG), the Center for Research and Development of Geological Disaster Technology, a branch of PVMBG which specifically monitors Merapi. Additional information comes from the Pusat Vulkanologi dan Mitigasi Bencana Geologi (PVMBG, also known as Indonesian Center for Volcanology and Geological Hazard Mitigation, CVGHM), MAGMA Indonesia, the Darwin Volcanic Ash Advisory Centre (VAAC), and various satellite data.
Activity during April through September 2023 primarily consisted of incandescent avalanches of material that mainly affected the SW and W flanks and traveled as far as 2.3 km from the summit (table 25) and white gas-and-steam emissions that rose 10-1,000 m above the crater.
Table 25. Monthly summary of avalanches and avalanche distances recorded at Merapi during April through September 2023. The number of reported avalanches does not include instances where possible avalanches were heard but could not be visually confirmed as a result of inclement weather. Data courtesy of BPPTKG (April-September 2023 daily reports).
| Month |
Average number of avalanches per day |
Distance avalanches traveled (m) |
| Apr 2023 |
19 |
1,200-2,000 |
| May 2023 |
22 |
500-2,000 |
| Jun 2023 |
18 |
1,200-2,000 |
| Jul 2023 |
30 |
300-2,000 |
| Aug 2023 |
25 |
400-2,300 |
| Sep 2023 |
23 |
600-2,000 |
BPPTKG reported that during April and May white gas-and-steam emissions rose 10-750 m above the crater, incandescent avalanches descended 500-2,000 m on the SW and W flanks (figure 135). Cloudy weather often prevented clear views of the summit, and sometimes avalanches could not be confirmed. According to a webcam image, a pyroclastic flow was visible on 17 April at 0531. During the week of 28 April and 4 May a pyroclastic flow was reported on the SW flank, traveling up to 2.5 km. According to a drone overflight taken on 17 May the SW lava dome volume was an estimated 2,372,800 cubic meters and the dome in the main crater was an estimated 2,337,300 cubic meters.
During June and July similar activity persisted with white gas-and-steam emissions rising 10-350 m above the crater and frequent incandescent avalanches that traveled 300-2,000 m down the SW, W, and S flanks (figure 136). Based on an analysis of aerial photos taken on 24 June the volume of the SW lava dome was approximately 2.5 million cubic meters. A pyroclastic flow was observed on 5 July that traveled 2.7 km on the SW flank. According to the Darwin VAAC multiple minor ash plumes were identified in satellite images on 19 July that rose to 3.7 km altitude and drifted S and SW. During 22, 25, and 26 July a total of 17 avalanches descended as far as 1.8 km on the S flank.
Frequent white gas-and-steam emissions continued during August and September, rising 10-450 m above the crater. Incandescent avalanches mainly affected the SW and W flanks and traveled 400-2,300 m from the vent (figure 137). An aerial survey conducted on 10 August was analyzed and reported that estimates of the SW dome volume was 2,764,300 cubic meters and the dome in the main crater was 2,369,800 cubic meters.
Frequent and moderate-power thermal activity continued throughout the reporting period, according to a MIROVA (Middle InfraRed Observation of Volcanic Activity) analysis of MODIS satellite data (figure 138). There was an increase in the number of detected anomalies during mid-May. The MODVOLC thermal algorithm recorded a total of 47 thermal hotspots: six during April, nine during May, eight during June, 15 during July, four during August, and five during September. Some of this activity was captured in infrared satellite imagery on clear weather days, sometimes accompanied by incandescent material on the SW flank (figure 139).
Geologic Background. Merapi, one of Indonesia's most active volcanoes, lies in one of the world's most densely populated areas and dominates the landscape immediately north of the major city of Yogyakarta. It is the youngest and southernmost of a volcanic chain extending NNW to Ungaran volcano. Growth of Old Merapi during the Pleistocene ended with major edifice collapse perhaps about 2,000 years ago, leaving a large arcuate scarp cutting the eroded older Batulawang volcano. Subsequent growth of the steep-sided Young Merapi edifice, its upper part unvegetated due to frequent activity, began SW of the earlier collapse scarp. Pyroclastic flows and lahars accompanying growth and collapse of the steep-sided active summit lava dome have devastated cultivated lands on the western-to-southern flanks and caused many fatalities.
Information Contacts: Balai Penyelidikan dan Pengembangan Teknologi Kebencanaan Geologi (BPPTKG), Center for Research and Development of Geological Disaster Technology (URL: http://merapi.bgl.esdm.go.id/, Twitter: @BPPTKG); MAGMA Indonesia, Kementerian Energi dan Sumber Daya Mineral (URL: https://magma.esdm.go.id/v1); Pusat Vulkanologi dan Mitigasi Bencana Geologi (PVMBG, also known as Indonesian Center for Volcanology and Geological Hazard Mitigation, CVGHM), Jalan Diponegoro 57, Bandung 40122, Indonesia (URL: http://www.vsi.esdm.go.id/); Darwin Volcanic Ash Advisory Centre (VAAC), Bureau of Meteorology, Northern Territory Regional Office, PO Box 40050, Casuarina, NT 0811, Australia (URL: http://www.bom.gov.au/info/vaac/); MIROVA (Middle InfraRed Observation of Volcanic Activity), a collaborative project between the Universities of Turin and Florence (Italy) supported by the Centre for Volcanic Risk of the Italian Civil Protection Department (URL: http://www.mirovaweb.it/); Hawai'i Institute of Geophysics and Planetology (HIGP) - MODVOLC Thermal Alerts System, School of Ocean and Earth Science and Technology (SOEST), Univ. of Hawai'i, 2525 Correa Road, Honolulu, HI 96822, USA (URL: http://modis.higp.hawaii.edu/); Copernicus Browser, Copernicus Data Space Ecosystem, European Space Agency (URL: https://dataspace.copernicus.eu/browser/); Øystein Lund Andersen (URL: https://www.oysteinlundandersen.com/, https://twitter.com/oysteinvolcano).
Ebeko
Russia
50.686°N, 156.014°E; summit elev. 1103 m
All times are local (unless otherwise noted)
Moderate explosive activity with ash plumes continued during June-November 2023
Ebeko, located on the N end of Paramushir Island in Russia’s Kuril Islands just S of the Kamchatka Peninsula, consists of three summit craters along a SSW-NNE line at the northern end of a complex of five volcanic cones. Observed eruptions date back to the late 18th century and have been characterized as small-to-moderate explosions from the summit crater, accompanied by intense fumarolic activity. The current eruptive period began in June 2022, consisting of frequent explosions, ash plumes, and thermal activity (BGVN 47:10, 48:06). This report covers similar activity during June-November 2023, based on information from the Kamchatka Volcanic Eruptions Response Team (KVERT) and satellite data.
Moderate explosive activity continued during June-November 2023 (figures 50 and 51). According to visual data from Severo-Kurilsk, explosions sent ash 2-3.5 km above the summit (3-4.5 km altitude) during most days during June through mid-September. Activity after mid-September was slightly weaker, with ash usually reaching less than 2 km above the summit. According to KVERT the volcano in October and November was, with a few exceptions, either quiet or obscured by clouds that prevented satellite observations. KVERT issued Volcano Observatory Notices for Aviation (VONA) on 8 and 12 June, 13 and 22 July, 3 and 21 August, and 31 October warning of potential aviation hazards from ash plumes drifting 3-15 km from the volcano. Based on satellite data, KVERT reported a persistent thermal anomaly whenever weather clouds permitted viewing.
Geologic Background. The flat-topped summit of the central cone of Ebeko volcano, one of the most active in the Kuril Islands, occupies the northern end of Paramushir Island. Three summit craters located along a SSW-NNE line form Ebeko volcano proper, at the northern end of a complex of five volcanic cones. Blocky lava flows extend west from Ebeko and SE from the neighboring Nezametnyi cone. The eastern part of the southern crater contains strong solfataras and a large boiling spring. The central crater is filled by a lake about 20 m deep whose shores are lined with steaming solfataras; the northern crater lies across a narrow, low barrier from the central crater and contains a small, cold crescentic lake. Historical activity, recorded since the late-18th century, has been restricted to small-to-moderate explosive eruptions from the summit craters. Intense fumarolic activity occurs in the summit craters, on the outer flanks of the cone, and in lateral explosion craters.
Information Contacts: Kamchatka Volcanic Eruptions Response Team (KVERT), Far Eastern Branch, Russian Academy of Sciences, 9 Piip Blvd., Petropavlovsk-Kamchatsky, 683006, Russia (URL: http://www.kscnet.ru/ivs/kvert/).
Search Bulletin Archive by Publication Date
Select a month and year from the drop-downs and click "Show Issue" to have that issue displayed in this tab.
The default month and year is the latest issue available.
Bulletin of the Global Volcanism Network - Volume 29, Number 10 (October 2004)
Managing Editor: Richard Wunderman
Asamayama (Japan)
Pumice and lithic samples from September eruption chemically similar to older lavas
Awu (Indonesia)
Volcanic seismicity ends in early August; weak plumes
Grimsvotn (Iceland)
Subglacial eruption penetrates ice cover and sends ash far as Finland
Manam (Papua New Guinea)
Eruption from Southern Crater on 24 October; pyroclastic flows and ashfall
Montagu Island (United Kingdom)
Higher-resolution image shows abundant ash, not lava, on the N-flank
Soufriere Hills (United Kingdom)
Heavy rains cause frequent mudflows and increased seismicity
Spurr (United States)
Elevated seismicity, increased carbon dioxide emissions, and melting of the ice cap
St. Helens (United States)
Swelling dome rises ~250 m; minor plumes and few earthquakes
Taftan (Iran)
October 2003 visit found passive degassing; petrography of andesite lava sample
Asamayama (Japan) — October 2004 Cite this Report
Asamayama
Japan
36.406°N, 138.523°E; summit elev. 2568 m
All times are local (unless otherwise noted)
Pumice and lithic samples from September eruption chemically similar to older lavas
An explosive eruption occurred from the summit crater of Asama at 2002 on 1 September 2004 (BGVN 29:08). Most of the initial reporting was in Japanese, although many of those reports had segments in English. Setsuya Nakada and Yukio Hayakawa provided links to initially available reports. In initial assessments of the eruption, investigators identified several distinct suites of ejecta, including darker- and lighter-colored groups. The ERI report also discussed a breadcrust bomb sampled at Kromamegawara 3.5 km NE of Asama's crater, which contained a vitric outer film and vesicular interior. ERI compiled some initial major element compositions on the of products of the 1 September eruption, including those taken on both fresh pumices (bombs) and lithics. Both types of materials were chemically close to lavas erupted in the years 1783, 1973, and 1108.
Geologic Background. Asamayama, Honshu's most active volcano, overlooks the resort town of Karuizawa, 140 km NW of Tokyo. The volcano is located at the junction of the Izu-Marianas and NE Japan volcanic arcs. The modern Maekake cone forms the summit and is situated east of the remnant of an older andesitic volcano, Kurofuyama, which was destroyed by a late-Pleistocene landslide about 20,000 years before present (BP). Growth of a dacitic shield volcano was accompanied by pumiceous pyroclastic flows, the largest of which occurred about 14,000-11,000 BP, and by growth of the Ko-Asamayama lava dome on the east flank. Maekake, capped by the Kamayama pyroclastic cone that forms the present summit, is probably only a few thousand years old and has observed activity dating back at least to the 11th century CE. Maekake has had several major Plinian eruptions, the last two of which occurred in 1108 (Asamayama's largest Holocene eruption) and 1783 CE.
Information Contacts: Geological Survey of Japan, National Institute of Advanced Industrial Science and Technology (GSJ AIST) (URL: http://www.aist.go.jp/); Yukio Hayakawa, Faculty of Education, Gunma University, Aramaki 4-2, Maebashi Gunma 371-8510, Japan (URL: http://www.hayakawayukio.jp/English.html); Setsuya Nakada, Volcano Research Center, Earthquake Research Institute (ERI), University of Tokyo, Yayoi 1-1-1, Bunkyo-ku, Tokyo 113, Japan (URL: http://www.eri.u-tokyo.ac.jp/VRC/index_E.html).
Awu
Indonesia
3.689°N, 125.447°E; summit elev. 1318 m
All times are local (unless otherwise noted)
Volcanic seismicity ends in early August; weak plumes
Awu extruded a new dome in its crater by 2 June 2004 (BGVN 29:05). Several photos received from the Directorate of Volcanology and Geological Hazard Mitigation (DVGHM) taken from the crater's upper S side illustrate the crater prior to and just after the 2004 dome emplacement (figures 4-6). Elevated seismicity continued into the week ending on 8 August 2004 (table 2). During 12-25 July, observers saw white thin-medium plumes gently rising to 50 m above the summit. A report covering 9-15 August, noted that the Awu observation post documented a weak plume 200 m tall. They also reported nine type-B earthquakes. A brief message from DVGHM on 7 December noted that Awu was then quiet.
Table 2. Summary of volcanic type-A earthquakes and tectonic earthquakes at Awu during 22 June through 15 August 2004. Volcanic type-B volcanic earthquakes also occurred occasionally, perhaps once a week, except in the 9-15 August interval, when they occurred nine times. Data for several days and time intervals (eg., 6 and 11 July, and 26 July-1 August) was not available. Courtesy of DVGHM.
| Date |
Deep Volcanic (A-type) |
Tectonic |
| 22 Jun-28 Jun 2004 |
5 |
84 |
| 29 Jun-05 Jul 2004 |
6 |
74 |
| 07 Jul-12 Jul 2004 |
3 |
93 |
| 13 Jul-18 Jul 2004 |
2 |
74 |
| 19 Jul-25 Jul 2004 |
25 |
110 |
| 26 Jul-01 Aug 2004 |
-- |
-- |
| 02 Aug-08 Aug 2004 |
7 |
92 |
| 09 Aug-15 Aug 2004 |
0 |
75 |
Aviation reports. The Volcanic Ash Advisory Centre at Darwin, Australia, issued 15 reports (Volcanic Ash Advisories) regarding Awu during June 2004. These were the first and only Awu reports available in their archive of reports going back to 1998. The first message (on 8 June) was "Major eruption possible, but no eruption yet." Similar terminology accompanied Advisories until 12 June. The 9 June report noted "continuous small eruptions" and "four larger explosions in past two days." A plume also seen on satellite imagery was estimated by pilots to be at ~ 4.5-6 km. Later it became difficult to see the plume with satellite imagery. On 10 June two Advisories noted thin plumes directed NE extending ~ 37 km. The plumes were seen on imagery at 2325 and 0220 UTC (in aerospace shorthand, the imagery came from DVGHM, DMSP, GOES, and NOAA 17 satellites). The final Advisory, on 14 June, noted "Eruption details: Nil obs[erved] ash." That notice also commented that the alert status had dropped and no significant activity had been recorded, but a white plume rose ~ 100 m above the summit in the last 24 hours.
Geologic Background. The massive Gunung Awu stratovolcano occupies the northern end of Great Sangihe Island, the largest of the Sangihe arc. Deep valleys that form passageways for lahars dissect the flanks of the volcano, which was constructed within a 4.5-km-wide caldera. Powerful explosive eruptions in 1711, 1812, 1856, 1892, and 1966 produced devastating pyroclastic flows and lahars that caused more than 8000 cumulative fatalities. Awu contained a summit crater lake that was 1 km wide and 172 m deep in 1922, but was largely ejected during the 1966 eruption.
Information Contacts: Dali Ahmad, Volcanological Survey of Indonesia (VSI), Directorate of Volcanology and Geological Hazard Mitigation, Jalan Diponegoro 57, Bandung 40122, Indonesia (URL: http://www.vsi.esdm.go.id/); Office for the Coordination of Humanitarian Affairs (OCHA), United Nations, New York, NY 10017, USA; Darwin Volcanic Ash Advisory Centre (VAAC), Bureau of Meteorology, Northern Territory Regional Office, PO Box 40050, Casuarina, NT 0811, Australia (URL: http://www.bom.gov.au/info/vaac/).
Grimsvotn (Iceland) — October 2004 Cite this Report
Grimsvotn
Iceland
64.416°N, 17.316°W; summit elev. 1719 m
All times are local (unless otherwise noted)
Subglacial eruption penetrates ice cover and sends ash far as Finland
According to scientists from the Institute of Earth Sciences at the University of Iceland and the Icelandic Meteorological Office, an eruption began at the subglacial Grímsvötn volcano in the Vatnajökull ice cap, Iceland, on 1 November 2004 around 2100, and was declining by 5 November. The eruption, preceded by both long- and short-term precursors, was triggered by the release of overburden pressure associated with a glacial-outburst flood (jökulhlaup) originating from the subglacial caldera lake. The jökulhlaup reached a maximum on the afternoon of 2 November. At that time the peak discharge from affected rivers on the coastal plain at Skeidararsandur was 3,000-4,000 m3/s (based on information from the Icelandic Hydrological Service). Discharge declined quickly after the peak. No damage occurred to roads or bridges. The total volume of the jökulhlaup was ~ 0.5 km3.
Seismicity increased at the volcano in mid-2003, about the same time that uplift exceeded a maximum reached in 1998. Tthe last eruption at Grímsvötn occurred within the caldera beginning on 18 December 1998.... Additional uplift and expansion of the volcano since mid-2003 heralded the latest activity. Seismicity further increased in late October 2004, and on 26 October high-frequency tremor indicated increased water flow from the caldera lake and suggested that a glacial outburst flood was about to begin. On 29 October, the amount of discharge increased in the Skeidara River. About 3 hours before the eruption an intense swarm of volcanic earthquakes started, changing to continuous low-frequency tremor at the onset of the eruption.
The release in overburden pressure associated with the outburst flood triggered the eruption. The amount of drop in water level in the caldera at the onset of the eruption was uncertain, but was probably on the order of 10-20 m, corresponding to a pressure change of 0.1-0.2 MPa at the volcano's surface. This modest pressure change triggered the eruption because pressure in the shallow magma chamber was high after continuous inflow of magma since 1998.
Figure 5 shows the epicenters from 18 October to 1 November 2004, along with preliminary locations of the eruption site. In the early morning of 1 November, an earthquake swarm began beneath Grímsvötn. By 1400 there were 12 earthquakes; at 0651 the largest, an event of M 3 occurred. At 2010 on 1 November an eruption warning was sent to the Civil Defense, earthquake magnitudes had increased and around that time the swarm intensified. About 160 earthquakes with magnitudes up to 2.8 were recorded during the next 2 hours.
Initially under ice 150-200 m thick, the eruption melted its way through to the surface in about 1 hour. An eruption plume was detected by radar around midnight on 1 November. Radar estimates of plume altitude stood at 12-13 km numerous times during 2-3 November. A plot of altitude versus time showed two cases where plume heights were almost 13 km; each occurred about 0200 on 2 and 3 November. The weather radar used to make the plot was located at Keflavik-Airport, 260 km from Grímsvötn.
Lightning. Early on 2 November and through most of the morning on 3 November, numerous lightning strikes were detected by instruments, and their computed locations largely centered over Grímsvötn. The ash plume was driven to the N by southerly winds during the whole eruption. Accordingly, both the scatter and SE extension of the lightning were judged likely artifacts of imprecision in estimates of lighning locations (figure 6).
Regarding the lightning data, geophysicist Pordur Arason described the three systems used. First, the Icelandic lightning location system consists of three LLP direction finder stations, each measuring time, direction, polarity, intensity and multiplicity. The stations discriminate lightning and record only cloud-to-ground (CG) lightning. The location system is old (produced pre-1980) and unfortunately only one station (Sydri-Neslond) gave useful measurements. By assuming distance from the station to Grímsvötn, Arason calculated the current in the lightning. He noted that almost all of this CG lightning showed negative polarity (lightning polarity is determined by the charge of the cloud compared to Earth).
A second lightning system results from cooperation with the UK Met Office, and one of their ATD sferics stations in Iceland. Arason had access to their data. The locations on figure 2 are those of the ATD system, which gives times and locations but does not discriminate between cloud-to-ground (CG) lightning and cloud-to-cloud (CC) lightning, although it is biased towards CG, since its antennas only measure vertical electric-field variations.
The third system was a one-station recording system of vertical electric field variations (EFMS) in Reykjavik that records the vertical component of the electric field every 200 ns for a period of a 1 ms. During the eruption it recorded the waveforms of about 150 lightning events. About half of these show characteristics of a negative polarity CG and half CC.
Magma-water interactions lead to explosions, emission of ash and steam, and to charge separation. Erupted ash becomes negatively charged and the steam positively charged. Almost all of the CG lightning had negative polarity, indicating its origin in the ash, and not the steam.
Other observations. The initial inspection of the eruption from an airplane took place around 0800 UTC on 2 November. It confirmed that a phreatomagmatic eruption was in progress from a short (less than 1-km-long) eruptive fissure at 64.40°N, 17.23°W. At that time a continuous plume rose to ~ 9 km altitude. Observations throughout the day revealed periods of high explosive activity, with maximum plume heights of 12-14 km. The strength of the eruption correlated with the seismically recorded volcanic tremor. Some explosive activity had occurred in a second ice cauldron near the SE edge of Grímsvötn, 8 km to the E of the main crater. This ice cauldron issued steam when first detected after noon on 2 November.
The London VAAC reported that the ash plume produced from the eruption reached a height of ~ 12.2 km a.s.l. According to news articles, the eruption occurred in an unpopulated region so no evacuations were needed, but air traffic was diverted away from the region.
Observation flights later on 2 November photographed and videoed the vent that had opened through in the ice (figures 7-9). Plumes were sometimes nearly white and steam dominated, at other times black and ash dominated, and in some cases visible portions of the plumes simultaneously reflected both of these extremes (figure 7, 8, and 9). A 2 November view of the jökulhlaup appears as figure 10.
On 3 November, eruptive activity occurred in pulses, resulting in changing eruption column heights from 8-9 km to 13-14 km above the volcano. During the course of the eruption, ash plumes and tephra distributions imaged by satellites typically showed trends to the NE; in some cases plumes remained visible at least 150 km from the eruption site. A distal ash plume was observed in Norway, Finland, and Sweden.
On 9 November from 0630 to 1330 a tremor pulse was recorded, and on 11 November, from a little past 0900 and again around 1100, the seismic station at the volcano showed what the Iceland Meteorological Office called "increased jökulhlaup tremor." This tremor decreased after midnight on 12 November, increased from 0500 to 0830, then decreased again. The eruption followed a pattern similar to previous eruptions in 1983 and 1998, with probably less than 0.1 km3 of magma erupted.
According to scientists at the Iceland Meteorological Office and the Institute of Earth Sciences, University of Iceland, these eruptions, together with the 1996 Gjalp eruption N of Grímsvötn reflect much higher activity at Grímsvötn than during the middle part of last century, and may indicate that Grímsvötn is entering into a new period of high volcanism that may last for decades. Such a high activity period had been predicted on the basis of the observed cyclic volcanism in the area in the preceding millennium.
Geologic Background. Grímsvötn, Iceland's most frequently active volcano in recent history, lies largely beneath the vast Vatnajökull icecap. The caldera lake is covered by a 200-m-thick ice shelf, and only the southern rim of the 6 x 8 km caldera is exposed. The geothermal area in the caldera causes frequent jökulhlaups (glacier outburst floods) when melting raises the water level high enough to lift its ice dam. Long NE-SW-trending fissure systems extend from the central volcano. The most prominent of these is the noted Laki (Skaftar) fissure, which extends to the SW and produced the world's largest known historical lava flow in 1783. The 15 km3 basaltic Laki lavas were erupted over 7 months from a 27-km-long fissure system. Extensive crop damage and livestock losses caused a severe famine that resulted in the loss of one-fifth of the population of Iceland.
Information Contacts: Freysteinn Sigmundsson, Pall Einarsson, Magnus Tumi Gudmundsson, Thordis Hognadottir, Anette Mortensen, and Fredrik Holm, Institute of Earth Sciences, University of Iceland, Reykjavik, Iceland (URL: http://nordvulk.hi.is/, http://raunvisindastofnun.hi.is/); Steinunn Jakobsdottir, Matthew J. Roberts, Kristin Vogfjord, Ragnar Stefansson, and Pordur Arason, Icelandic Meteorological Office, Reykjavik, Iceland (URL: http://www.vedur.is/); London Volcanic Ash Advisory Center, Met Office, FitzRoy Road, Exeter, Devon EX1 3PB, United Kingdom (URL: http://www.metoffice.com/).
Manam (Papua New Guinea) — October 2004 Cite this Report
Manam
Papua New Guinea
4.08°S, 145.037°E; summit elev. 1807 m
All times are local (unless otherwise noted)
Eruption from Southern Crater on 24 October; pyroclastic flows and ashfall
The Rabaul Volcano Observatory (RVO) issued a series of information bulletins on Manam, describing conditions and hazard status recommendations associated with a strong eruption that started on 24 October 2004. That eruption was preceded by a clear buildup in seismicity, leading to a felt earthquake the day prior to the eruption. The eruption generated pyroclastic flows which traveled down the valley SE of the volcano and into the sea. The aviation color code rose to Red, the highest value.
The eruption's plume was imaged from space. Ash and condensed water vapor in the form of ice reached a maximum height of ~ 15 km altitude, intersecting the base of the tropopause but not entering the stratosphere. Low-level eruptive activity persisted after the 24 October eruption.
Lead-up to the 24 October eruption. RVO noticed increased low-frequency earthquakes at Manam beginning 15 October 2004. Its reports suggested the volcanic system had changed to a dynamic mode from its previously stable state. The escalation in low-frequency earthquakes during that interval was described as a "steady rise." But overall, the level was portrayed as low to moderate. In retrospect, RVO reports noted that seismicity increased steadily after 16 October; moreover, it rose further after a felt earthquake at about 1845 on the 23rd.
During 15-21 October RVO noted occasional weak roaring and rumbling noises from the Main Crater. The noises prevailed on 15, 16, and 17 October, becoming more frequent on the 18th, but reduced again on the 19th. The noises continued at a level similar to the 16th and 17th on the 20th and 21st. Noise from Southern Crater began on the 19th, consisting of the sound of a single low explosion. After the 20th, occasional low roaring and rumbling noises continued from both craters. Observers saw night glow from the Main Crater on the 18th and 19th. Occasionally the glow fluctuated at 3-5 minute intervals. Glow remained absent over Southern Crater. Both Craters released weak white-gray vapor.
Occasional ash-laden vapor was seen on the 21st from Southern Crater. In their report for 15-21 October, RVO recommended Alert Level 1. They said "Whilst no official public warning is required under this Alert Level, people living in and near the four main valleys of the Island should be informed to refrain from venturing into them unnecessarily." RVO later stressed the presence of NW winds at altitude, warning residents on that flank of possible ashfall.
Eruption on 24 October 2004. The eruption came from Southern Crater, beginning after 0800 on the 24th; it persisted throughout the morning and the early part of the afternoon, peaking between 1000 and 1100. At 1400 the eruption's intensity decreased slightly. Later that day it continued at a reduced level with moderate explosions and sub-continuous low rumbling and roaring noises.
The eruption produced a pyroclastic flow channeled into the SE valley, that eventually reached the sea. The NW part of the island, including villages between Tabele Mission and Baliau, were affected by ash and scoria falls. Some of the scoriae were fist-size and punched holes through the thatched-roofing of houses. The greatest impact occurred at Kuluguma and the surrounding villages. Casualties remained unreported. Between the hours of 0300 and 0500, residents of Wewak town called RVO, advising that fine ash had reached them.
Seismicity reflected the eruptive activity, with events peaking between the hours of 1000 and 1100, after which event counts reverted to low to moderate levels. Ongoing seismicity suggested that the volcano has not reached a completely quiet state. Still, the eruption level had declined as it continued. It was recommended that the Alert Level be upgraded from 1 to 2 (Stage 2 Alert Level does not call for evacuation from the Island). Authorities called for community information exchange ("toksave") on volcano status; for avoiding the four main valleys; for the population to stay prepared and organized, including village efforts.
The 24 October eruption caused the aviation color code to rise to Red, the highest value. According to RVO, low-level eruptive activity persisted after the 24 October eruption, decreasing further by 26 October. A RVO report issued at 0800 on 27 October noted that activity had subsided significantly since late on the 24th. An aerial inspection confirmed pyroclastic flows had gone down the SE- and upper part of the SW-trending valleys. A lava flow traveled 600 m down the SE valley. Tephra fall most affected the area from Kuluguma to Boda villages, including the Bieng Catholic mission on the island's NW side. Numerous food gardens were destroyed by the tephra deposit, which had an average thickness of 7 cm measured at the Bieng mission. RVO recommended that the Alert Level be downgraded to 1.
On 27-28 October occasional ash emissions still escaped from Southern Crater. Brown ash clouds rose several hundred meters above the summit before drifting to the NW and SW, resulting in fine ashfall. The ash emissions were accompanied by weak roaring and rumbling noises. Weak night-time glows were visible. Although earthquakes were few, tremor persisted. Low seismicity was coupled with a decline in eruptive vigor.
During 28-29 October, comparatively mild eruptions continued. Southern Crater continued to eject occasional emissions of dark, moderately thick, ash-laden clouds. The ash clouds were again blown NW, traversing the area between Yassa and Baliau villages. Low roaring and rumbling noises accompanied some of the activity. It was difficult to observe Main Crater due to cloud cover. Glow was difficult to observe due to cloud cover as well. Few earthquakes occurred, but volcanic tremor continued.
Media reports. News articles reported that authorities advised evacuation of ~ 3,000 people to safer parts of the island. Some of those articles revealed that the island's current population stood at 7,000, and that the government had helped provide food and shelter for those displaced.
According to the online version of the Papua New Guinea (PNG) Post-Courier, the Inter-Government Relations Minister, Sir Peter Barter, flew over the eruption. He allegedly saw large volumes of lava discharging into the sea, but judging from RVO observations, the term "lava" was mistakenly used for pyroclastic flows. In the news report Peter Barter had also stated that the entire SE side of the mountain, ~ 1 km wide, blew out, forcing lava (or other hot pyroclastic material) to flow down the SE valley to the sea. He was also reported as saying that at Bien (sometimes spelled Bieng, on the island's NW coast) his helicopter was hit by rocks (or other volcanic particles) that damaged its windscreen. Also, the Bien mission station lay beneath a heavy layer of ash. The damage to his helicopter kept him from flying completely around the island, missing the western segment between Bien, Yassa, Jorai, and the SW-flank settlement of Tabele, areas hit hardest by dust and rocks. He commented that much of the SE side of the island was relatively ash-free and safe, apart from the S-coast area between Dugulava (on the S coast) to Warisi.
A 27 October article by Dominic Krau in PNG's The National noted that the 24 October eruption had included a forceful outburst at 0800 on the 24th, and then climaxed during 1100-1400 that day, but had since been emitting only "smoke" and ash. It noted that prime minister Michael Somare had flown to Manam for a first-hand look at the damage. The same article mentioned that Peter Barter had assured that functioning radios were available at the settlements of Bien, Tabele, Warisis, Dugalava, Abereia, Bukure, and Kolang. It reported that volcanic ash fell in Wewak (on the main island's coast, 120 km NW), resulting in the civil aviation authority temporarily closing down the Boram airport for safety reasons.
Andrew Tupper of the Australian Bureau of Meteorology (BOM) posted satellite images of the 24 October eruption's ash cloud, which occurred just before the Terra and Aqua satellites passed over. They also captured AVHRR and GOES data of a very ice-rich volcanic cloud. The coldest temperature measured by BOM from the high-level cloud was about 204 K (a couple of hours after the eruption), which translates to an altitude of ~ 15 km. This altitude was in harmony with the cloud's subsequent dispersion pattern and wind-velocity models. Pilot reports have been generally lower, as is usual for large eruptions. There was no evidence of significant stratospheric penetration (the tropopause height was 15-16 km).
Geologic Background. The 10-km-wide island of Manam, lying 13 km off the northern coast of mainland Papua New Guinea, is one of the country's most active volcanoes. Four large radial valleys extend from the unvegetated summit of the conical basaltic-andesitic stratovolcano to its lower flanks. These valleys channel lava flows and pyroclastic avalanches that have sometimes reached the coast. Five small satellitic centers are located near the island's shoreline on the northern, southern, and western sides. Two summit craters are present; both are active, although most observed eruptions have originated from the southern crater, concentrating eruptive products during much of the past century into the SE valley. Frequent eruptions, typically of mild-to-moderate scale, have been recorded since 1616. Occasional larger eruptions have produced pyroclastic flows and lava flows that reached flat-lying coastal areas and entered the sea, sometimes impacting populated areas.
Information Contacts: Andrew Tupper, Australian Bureau of Meteorology; Darwin Volcanic Ash Advisory Centre, Australian Bureau of Meteorology (URL: http://www.bom.gov.au/info/vaac); Rabaul Volcanological Observatory (RVO), P.O. Box 386, Rabaul, Papua New Guinea; Papua New Guinea Post-Courier Online (URL: http://www.postcourier.com.pg).
Montagu Island (United Kingdom) — October 2004 Cite this Report
Montagu Island
United Kingdom
58.445°S, 26.374°W; summit elev. 1370 m
All times are local (unless otherwise noted)
Higher-resolution image shows abundant ash, not lava, on the N-flank
Matt Patrick of the Hawaii Institute of Geophysics and Planetology reviewed our previous report on Montagu Island (BGVN 29:09) and noted some erroneous interpretations. These had relied on imagery from 1 October 2004. Patrick generated a significantly improved, scaled, higher (4-m) resolution IKONOS image from the same time frame (figure 8), and offered some refinements and important corrections.
First, the previous report noted that "the area of apparently continuous flows seems to have reached the island's N margin (a distance of 3 km)." Over the entire new image there doesn't seem to be any new vents nor lava. The darkened area N of the Belinda summit cone contains clear crevasses indicating a region of ice entirely covered in ash.
A second erroneous statement was, "Another visible feature, the black area to the NNW . . . presumably reveals lava flows emerging from beneath the ice." Patrick points out that on the new image this area is seen to contain some of the island's rocky cliffs contrasting against the ice cover. He attributed the darkness around this area mainly to shadow. The presence of rocky cliffs negates another statement in the previous issue: "The black area to the NNW may thus be a new vent area."
The previous report commented that, "Another such [dark, presumably lava-covered] area may reside on the NNE flanks, midway from the summit area and the coast." Patrick noted that on the new image this area appears chaotic and can easily be misidentified as recent volcanics. He goes on to say, "We made a similar mistake earlier on, thinking there were concentric fractures related to subglacial melting. But it turned out from pre-eruption images that this area is just covered in topographic crevasses. Looking at the [improved] IKONOS image, one can see this more clearly."
Patrick offered interpretations of some features on the new image, the first high-resolution image since February 2004. It shows continued steaming from Mount Belinda as well as tephra cover on the surrounding ice field, activity very similar to that seen on all the previous imagery. Although the new IKONOS image lacks any evidence of new lava since the 2003 lava flow, that particular lava field lies hidden under the steam plume in the IKONOS image. Thus, there could be newer material in that small region. The IKONOS image appears devoid of new vents, and emissions come solely from the summit area.
Geologic Background. The largest of the South Sandwich Islands, Montagu consists of a massive shield volcano cut by a 6-km-wide ice-filled summit caldera. The summit of the 11 x 15 km island rises about 3,000 m from the sea floor between Bristol and Saunders Islands. Around 90% of the island is ice-covered; glaciers extending to the sea typically form vertical ice cliffs. The name Mount Belinda has been applied both to the high point at the southern end of the summit caldera and to the young central cone. Mount Oceanite, an isolated peak at the SE tip of the island, was the source of lava flows exposed at Mathias Point and Allen Point. There was no record of Holocene activity until MODIS satellite data, beginning in late 2001, revealed thermal anomalies consistent with lava lake activity. Apparent plumes and single anomalous pixels were observed intermittently on AVHRR images from March 1995 to February 1998, possibly indicating earlier volcanic activity.
Information Contacts: Matt Patrick, HIGP Thermal Alerts Team, Hawai'i Institute of Geophysics and Planetology (HIGP) / School of Ocean and Earth Science and Technology (SOEST), University of Hawai'i, 2525 Correa Road, Honolulu, HI 96822, USA (URL: http://modis.higp.hawaii.edu/).
Soufriere Hills (United Kingdom) — October 2004 Cite this Report
Soufriere Hills
United Kingdom
16.72°N, 62.18°W; summit elev. 915 m
All times are local (unless otherwise noted)
Heavy rains cause frequent mudflows and increased seismicity
Table 58, taken from reports of the Monserrat Volcano Observatory (MVO), summarizes activity at Soufrière Hills between 1 October and 26 November. The activity level remained elevated during much of this time period due to increases in seismicity, gas emission, rainfall, and mudflows.
Table 58. Activity recorded at Soufrière Hills, 1 October to 26 November 2004. One of the gas-monitoring sites only functioned on 18 November. Courtesy of Montserrat Volcano Observatory (MVO).
| Date |
Activity Level |
Hybrid EQ's |
Mixed EQ's |
Volcano-tectonic EQ's |
Long-period EQ's |
SO2 emissions (tons/day) |
Rockfalls |
| 01 Oct-08 Oct 2004 |
elevated |
8 |
-- |
-- |
2 |
187-1144 |
1 |
| 08 Oct-15 Oct 2004 |
elevated |
9 |
-- |
-- |
-- |
156- 553 |
1 |
| 15 Oct-22 Oct 2004 |
elevated |
49 |
-- |
1 |
-- |
250-1100 |
4 |
| 22 Oct-29 Oct 2004 |
elevated |
40 |
-- |
1 |
-- |
320-370 |
-- |
| 29 Oct-05 Nov 2004 |
elevated |
33 |
-- |
39 |
-- |
140- 440 |
1 |
| 05 Nov-12 Nov 2004 |
-- |
21 |
-- |
14 |
-- |
147- 225 |
3 |
| 12 Nov-19 Nov 2004 |
-- |
12 |
-- |
40 |
5 |
1111 |
3 |
| 19 Nov-26 Nov 2004 |
-- |
25 |
-- |
5 |
1 |
125-330 |
3 |
Heavy rains during the first six weeks of the reporting period led to steam venting, which triggered an increase in hybrid and volcanic-tectonic earthquakes. A large number of hybrid and volcano-tectonic (VT) earthquakes was recorded during most of October and early November. The most intense seismicity occurred during 2106-2216 on 12 November and 1335-1436 on 14 November.
Following the rains of 5-12 November, several fumaroles developed along the former Tuitt's Bottom and Pea Ghauts, but by 12 November, drier conditions prevailed and fumaroles diminished. Sulfur dioxide emissions remained low throughout most of the reporting period, however two surges in SO2 flux occurred during the weeks of 1 October and 15 October. Mudflows occurred since May. As heavy rainfall continued during October and November, more mudflows occurred. Nine separate mudflow events were recorded for this reporting period. The flows of 15, 19, 21, 22-29 October and 1, 3, 9, and 11 November were minor, though one of the flows, which traveled down the NW flank, reached the Belham River. A much heavier flow began around 0620 on 19 November, with a pulse occurring at 1138.
One MVO scientist deemed mudflows the "ongoing legacy of this [the 1995] eruption." Montserrat's rainy season typically continues until December, and more mudflows may occur in coming months. Mudflows have proven to be destructive, whether they have arisen from short, intense downpours or from a buildup over several rains. The example was given of mudflows after two hours of heavy rain on the afternoon of 21 May, which led to burial of the gateway to the Radio Antilles' offices.
MVO personnel made two observation flights during the reporting period (on 28 October and 4 November). Both flights confirmed the presence of the pond seen 30 August in the pit formed by the 3 March dome collapse. Looking into the crater, MVO scientists found no evidence of ongoing dome-building.
Geologic Background. The complex, dominantly andesitic Soufrière Hills volcano occupies the southern half of the island of Montserrat. The summit area consists primarily of a series of lava domes emplaced along an ESE-trending zone. The volcano is flanked by Pleistocene complexes to the north and south. English's Crater, a 1-km-wide crater breached widely to the east by edifice collapse, was formed about 2000 years ago as a result of the youngest of several collapse events producing submarine debris-avalanche deposits. Block-and-ash flow and surge deposits associated with dome growth predominate in flank deposits, including those from an eruption that likely preceded the 1632 CE settlement of the island, allowing cultivation on recently devegetated land to near the summit. Non-eruptive seismic swarms occurred at 30-year intervals in the 20th century, but no historical eruptions were recorded until 1995. Long-term small-to-moderate ash eruptions beginning in that year were later accompanied by lava-dome growth and pyroclastic flows that forced evacuation of the southern half of the island and ultimately destroyed the capital city of Plymouth, causing major social and economic disruption.
Information Contacts: Montserrat Volcano Observatory (MVO), Fleming, Montserrat, West Indies (URL: http://www.mvo.ms/).
Spurr (United States) — October 2004 Cite this Report
Spurr
United States
61.299°N, 152.251°W; summit elev. 3374 m
All times are local (unless otherwise noted)
Elevated seismicity, increased carbon dioxide emissions, and melting of the ice cap
Spurr, ~ 125 km W of Anchorage across Cook Inlet, became restless in recent months. This activity consisted of increased seismicity beginning in February 2004, melting of the summit ice cap, and substantial emission rates of carbon dioxide (CO2) and sulfur dioxide (SO2). Scientists at the Alaska Volcano Observatory (AVO) recorded hundreds of small earthquakes centered 4.8-6.4 km beneath the summit. Elevated levels of seismicity continued through early November 2004 (table 2). Although the rate of seismicity is greater than typical background levels, AVO has found no indication that an eruption is imminent.
Table 2. Weekly seismicity within 30 km of the summit at Spurr, with magnitudes over 1.5 and depths of 1-6 km. Courtesy of AVO.
| Dates |
Average earthquakes per day |
| 24 Jul-30 Jul 2004 |
10-20 |
| 31 Jul-06 Aug 2004 |
10-20 |
| 07 Aug-13 Aug 2004 |
10-20 |
| 14 Aug-20 Aug 2004 |
15 (70 events on 14 Aug) |
| 21 Aug-27 Aug 2004 |
12 |
| 28 Aug-03 Sep 2004 |
14 |
| 04 Sep-10 Sep 2004 |
13 |
| 11 Sep-17 Sep 2004 |
12 |
| 18 Sep-24 Sep 2004 |
10 |
| 25 Sep-01 Oct 2004 |
13 |
| 02 Oct-08 Oct 2004 |
8 |
| 09 Oct-15 Oct 2004 |
9 |
| 16 Oct-22 Oct 2004 |
2-14 |
| 23 Oct-29 Oct 2004 |
12-24 (3 per hour on 26 Oct) |
| 30 Oct-05 Nov 2004 |
0-24 (10 per hour on 4 Nov) |
Aerial reconnaissance in mid-July and early August documented recent small flows of mud and rock and a depression in the icecap (an "ice cauldron") just NE of the summit that was ~ 50 x 75 m in size and ~ 25 m deep. The floor of the depression contained an icy pond, with small areas of open water. No steam or volcanic emissions were observed. The ice cauldron is a collapse feature possibly caused by an increase in heat coming from deep beneath the summit. Using sensitive instruments, scientists flying around the volcano on 7 August detected small amounts of the volcanic gases in a plume from the summit.
Observations and photography during the week ending 10 September revealed that the ice cauldron had enlarged substantially (to ~ 150 x 170 m), presumably as the roof of the meltwater basin continued to subside and collapse. AVO scientists measured gases being emitted by the summit vent and Crater Peak, a flank vent, during a fixed-wing flight on 15 September 2004. The combined output of CO2 from the two vents was ~ 2,300 tons/day, an increase from the ~ 760 tons/day measured 7-8 August 2004. The gray color of the lake at the bottom of the ice cauldron is typical of crater lakes containing dissolved SO2.
AVO staff took an overflight of the volcano on 18 October and reported that the summit ice cauldron persisted without appreciable change of its geometry or of the surrounding crevasses. The ice cauldron continued to contain standing water, no steam or sulfur scent was observed from the summit, and steam issuing from Crater Peak had not changed from previous observations.
References. Power, J., 2004, Renewed unrest at Mount Spurr Volcano, Alaska: Eos (Transactions, American Geophysical Union), v. 85, no. 43, p. 2.
Waythomas, C.F., and Nye, C.J., 2002, Preliminary volcano-hazard assessment for Mount Spurr Volcano, Alaska: U.S. Geological Survey Open-File Report 01.482, Alaska Volcano Observatory, Anchorage, Alaska, 39 pp.
Geologic Background. Mount Spurr is the closest volcano to Anchorage, Alaska (130 km W) and just NE of Chakachamna Lake. The summit is a large lava dome at the center of a roughly 5-km-wide amphitheater open to the south formed by a late-Pleistocene or early Holocene debris avalanche and associated pyroclastic flows that destroyed an older edifice. The debris avalanche traveled more than 25 km SE, and the resulting deposit contains blocks as large as 100 m in diameter. Several ice-carved post-collapse cones or lava domes are present. The youngest vent, Crater Peak, formed at the southern end of the amphitheater and has been the source of about 40 identified Holocene tephra layers. Eruptions from Crater Peak in 1953 and 1992 deposited ash in Anchorage.
Information Contacts: U.S. Geological Survey Alaska Volcano Observatory (AVO), a cooperative program of the USGS, University of Alaska Fairbanks Geophysical Institute, and the Alaska Division of Geological and Geophysical Surveys (URL: http://www.avo.alaska.edu/).
St. Helens (United States) — October 2004 Cite this Report
St. Helens
United States
46.2°N, 122.18°W; summit elev. 2549 m
All times are local (unless otherwise noted)
Swelling dome rises ~250 m; minor plumes and few earthquakes
At St. Helens, rapid dome growth and pronounced uplift continued. Although this report covers 9 October-12 November 2004, there are several photos and comments on prior events. Figure 47, for example, contains a satellite image from 5 October. R. Scott Ireland photographically documented the 4 and 5 October eruptions, starting from the smallest plumes and including later wind-blown ash-bearing plumes. Digital copies of Ireland's set will be preserved in the Smithsonian's archives. Much of this report came from information posted by the Cascades Volcano Observatory (CVO).
Figure 48 presents four aerial views into the crater, taken on 8 August and 7, 10, and 14 October. They portray the southern part of the crater containing a broad area of uplift and deformation associated with a more restricted zone of dome emergence. On 7 October the broad area of uplift on the S side of the 1980-86 lava dome stood ~ 400 m (N-S) by ~500 m (E-W), with a maximum uplift of about 100-120 m. For perspective on this growth, CVO's 11 November estimate noted an expanded area of uplift and some parts of the dome rising ~250 m above the glacier.
Table 5 summarizes CVO's observations. The terminology of numbered days for this eruption began at Day 1 (23 September), when precursory earthquakes began (BGVN 29:09). In contrast to those initial several weeks, during the current reporting interval seismicity generally remained low, an observation consistent with the slow rise of gas-poor magma. The emerging magma drove uplift of the glacier within the crater but did not yield large explosive discharges and tall plumes.
Table 5. A simplified chronology of the events at St. Helens from 23 September to 12 November 2004. Regarding the Hazard Status column, the colors in parentheses represent an informal aviation hazard status (low to high; green, yellow, orange, and red). Taken from material posted by the USGS.
| Day |
Date |
Hazard Status |
Comment |
| DAY 17 |
09 Oct 2004 |
2 - Advisory (Orange) |
Moderate seismic activity-earthquakes up to M 2 at one event every two or three minutes. |
| DAY 18 |
10 Oct 2004 |
2 - Advisory (Orange) |
Earthquakes up to M 1 every minute. |
| DAY 19 |
11 Oct 2004 |
2 - Advisory (Orange) |
Low seismicity. Thermal imaging of the uplifted area (last seen on the 7th) found it had grown. The W portion of the uplift was steaming over a large diffuse area. Maximum measured surface temperatures were 200-300°C. Uplifting area discharged a brief emission at about 1600. Dusting of ash on new snow disclosed minor ash emissions the previous night. |
| DAY 20 |
12 Oct 2004 |
2 - Advisory (Orange) |
Low seismicity (earthquakes up to M 1 every 5-10 minutes). Thermal imaging of the W part of the uplifting area revealed temperatures of 500-600°C on a large pinkish-gray fin of rock and in nearby fumaroles and cracks. |
| DAY 21 |
13 Oct 2004 |
2 - Advisory (Orange) |
Hot (600°C) area both confirmed and appeared to have increased in size. Low seismicity; abundant steaming; SO2 and H2S detected; CO2 undetected; temperature and flow rate of water in streams similar to that measured in September. |
| DAY 22 |
14 Oct 2004 |
2 - Advisory (Orange) |
A zone approaching 700°C and in places reaching 761°C was measured on the new lobe, which emitted ash-rich jets rising ten's of meters. Abundant steam continued to rise from the area of lava extrusion to the crater rim. Low seismicity. |
| DAY 23-40 |
15-31 Oct 2004 |
2 - Advisory (Orange) |
Slight increase noted in area of uplift and new lobe of lava. On the 22nd a new protrusion of lava registered ~ 650°C. Slight increase in seismicity on 17th, but storm noise as well as rainfall triggering a small debris flow had also occurred; otherwise, seismicity was low. |
| DAY 41-53 |
01-12 Nov 2004 |
2 - Advisory (Orange) |
On the 5th there was an ash plume to ~ 3 km altitude; on the 9th, a steam plume rose to similar altitude. Also, a new extrusion was noted on the 5th (see text). By the 11th the dome's highest point stood ~ 250 m above the height of the glacier's surface prior to the eruption. On the 11th the hottest lava registered ~700°C. Low seismicity generally prevailed. |
Thermal images of the exposed dome revealed elevated temperatures there. This confirmed that new lava had reached the surface of the uplift.
Other details. The weather enabled clear views on 10 October. A photo of the scene at dawn showed an orange-colored plume. Field observers noted fresh snow over the crater floor contained a thin SE-directed ash deposit stretching to just beyond the crater rim. A steam plume rose to crater rim level or slightly above all day on 10 October and continued to blow SE. USGS field workers described the plume as "lazy," emphasing the absence of gas thrusts or notably vigorous convection. When the field crew visited the volcano, the plume appeared clean, with no noticeable ash nor blue nor orange haze. The odor of H2S was noted at the crater's breach, but not elsewhere.
On 14 October observers noted an increase in the deforming and uplifting area on the S side of the 1980-1986 lava dome and the new lobe of lava in the W part of that area. The maximum temperature of 761°C was measured in parts of the new lobe from which ash rich jets rose ten's of meters. Magma extruded onto the surface, forming a new lobe of the lava dome. Instruments detected low levels of H2S and SO2, but no CO2.
Crews collected samples and documented clear dome growth on 20-21 October. The new lava extrusion had horizontal dimensions of ~ 300 x 75 m and a thickness of ~ 70 m. The fin-shaped lava spine had collapsed. The 21 October volume estimate was almost 2 x 10⁶ m3. By 21 October the area of uplift and intense deformation had advanced S, nearing the crater wall. That day, ~ 30 cm of new snow with a light dusting of ash covered much of the uplift, except for the new lava extrusion, which steamed heavily. A vigorous steam plume rose to 3 km. Fluxes of gaseous H2S, SO2, and CO2 were low. Samples of the new dome were scooped up by a container slung on a line beneath a helicopter.
Atmospheric conditions on 27 October and 7 November again gave airborne observers clear views into the crater (figures 49, 50, and 51). The N-looking photo in figure 12 documents how the new dome and area of uplift had achieved substantial size, standing topographically above what was previously the moat to the S of the older dome. In plan view, the margin of the dome complex shifted from a circle to a figure-eight.
In addition to photos documenting crater changes, a CVO report on 29 October discussed rapid movement at a new GPS station on the southern part of the new dome (an area of uplifted glacial ice, rock debris, and new lava). The station showed continued southward motion of ~6 m in the previous 36 hours. A station near the summit of the old dome showed continued, slow northward motion.
Analysis of aerial photographs taken on 4 November led to an estimate of the volume of the uplifted area and new lava dome at ~ 20 x 106 m3. This followed other preliminary estimates made for 4 and 13 October of ~5 x 10⁶ m3 and ~12 x 106 m3, respectively. This most recent volume estimate (20 x 106 m3) amounted to more than 25% of the 1980-86 lava dome volume.
On 5 November the SO2 emission rates remained low. No H2S was detected and CO2 emission rates were not measurable. On that day viewers noted that a new mass of dacite had extruded, forming a spine rising ~100 m. Exposed rock faces had temperatures of 400-500°C. The steep new faces on the dome generated small hot rockfalls and avalanches. The finer particulate material rose to about 3 km altitude, a height ~900 m above the crater rim.
A sample of the new dome collected on 4 November established that the new dacite lava contained visible crystals of plagioclase, hornblende, and hypersthene. A comparison of the 1986 and 2004 dacites (table 6) shows that the new lava lacks augite, distinctive reaction rims on hornblende, and large plagioclase with sieve-textured cores.
Table 6. A comparison of the dome dacites extruded at St. Helens in 1986 and 2004. Courtesy of CVO.
| Year |
Rock type |
Mineralogy description |
| 1986 |
Augite-hornblende-hypersthene dacite |
63.5 weight percent SiO2. Hypersthene is the dominant mafic mineral. Hornblende contains distinctive reaction rims. Accessory augite. Large plagioclase phenocrysts, commonly with sieve-textured cores. |
| 2004 |
Hypersthene-hornblende dacite (collected 4 November) |
65.3 weight percent SiO2. Hornblende is the dominant mafic mineral, but it lacks significant reaction rims. Hypersthene is smaller and less abundant. Augite absent. Plagioclase phenocrysts, but absent large ones with sieve-textured cores. |
On 11 November the dome had reached ~ 250 m in height; it lay within a broad area of deformation that was ~ 600 m in diameter. Within this area, the new lava dome continued to occupy the E-central segment (broadly similar to the situation on figures 13 and 14). In plan view, the new dome stood 400 x 180 m. Regarding its height, the 11 November report noted that the highest point on the new lava dome was ~ 250 m "above the former surface of the glacier that occupied that point in mid-September."
Aviation Advisories. The first sentence of this section in BGVN 29:09 should be corrected to read, "The Washington VAAC issued advisories beginning on 29 September" (not 29 October).
The Washington Volcanic Ash Advisory Center issued one Ash Advisory each day during 9-18 October, noting elevated seismicity but a lack of explosive eruptions and substantial plumes. On 18 October the VAAC mentioned GOES-10 and -12 infrared and multispectral imagery of the volcano but concluded that "...after discussion with authorities at [CVO] we are discontinuing the Watch.... There continues to be low level [activity] ... not posing an [imminent] threat to aviation. A Notice to Aviation within ~9 km and below FL 130 should continue [Note: FL130, Flight Level 130, is the aviation community's shorthand for 13,000 feet; an altitude equivalent to 3,962 m, but typically rounded in the Bulletin to the nearest hundred meters]. If threat conditions rise[,] a Watch will again be issued. The Washington VAAC will continue to monitor the area and if ash is observed or reported a Volcanic Ash Advisory will be issued as soon as possible."
As of 12 November, the last Ash Advisory on St. Helens was issued on 6 November. It was in response to a minor ash emission that day. The emission was too small to detect with available satellite imagery. The local webcamera showed a weak, passively rising plume that barely rose above the crater rim.
Geologic Background. Prior to 1980, Mount St. Helens was a conical volcano sometimes known as the Fujisan of America. During the 1980 eruption the upper 400 m of the summit was removed by slope failure, leaving a 2 x 3.5 km breached crater now partially filled by a lava dome. There have been nine major eruptive periods beginning about 40-50,000 years ago, and it has been the most active volcano in the Cascade Range during the Holocene. Prior to 2,200 years ago, tephra, lava domes, and pyroclastic flows were erupted, forming the older edifice, but few lava flows extended beyond the base of the volcano. The modern edifice consists of basaltic as well as andesitic and dacitic products from summit and flank vents. Eruptions in the 19th century originated from the Goat Rocks area on the N flank, and were witnessed by early settlers.
Information Contacts: Cascades Volcano Observatory (USGS/CVO), U.S. Geological Survey, 1300 SE Cardinal Court, Building 10, Suite 100, Vancouver, WA 98683-9589, USA (URL: https://volcanoes.usgs.gov/observatories/cvo/); Pacific Northwest Seismograph Network (PNSN), Seismology Lab, University of Washington, Department of Earth and Space Sciences, Box 351310, Seattle, WA 98195-1310, USA (URL: http://www.pnsn.org/); Washington Volcanic Ash Advisory Center (VAAC), Satellite Analysis Branch (SAB), NOAA/NESDIS E/SP23, NOAA Science Center Room 401, 5200 Auth Road, Camp Springs, MD 20746, USA (URL: http://www.ospo.noaa.gov/Products/atmosphere/vaac/); R. Scott Ireland, 1660 NW 101 Way, Plantation, FL 33322, USA (URL: http://rsiphotos.com/); Stephen and Donna O'Meara, Volcano Watch International, PO Box 218, Volcano, HI 96785, USA.
Taftan
Iran
28.6°N, 61.13°E; summit elev. 3940 m
All times are local (unless otherwise noted)
October 2003 visit found passive degassing; petrography of andesite lava sample
When visited in October 2003, Taftan's behavior was similar to that reported in July 1999 (BGVN 24:10), consisting of a fumarolic zone on the SE cone's W side, ~ 10 m2 in area, emitting steam and SO2 gas, and depositing sulfur. Degassing was clearly visible from the refuge at 3,250 m elevation. A mixture of sulfur and clay derived from highly altered lavas gave a snowy appearance to the summit. This snowy appearance was also noted in July 1999 (BGVN 24:10). Close to the refuge, a warm acid spring generated deep yellow deposits along the ditch down the valley for more than 1 km. A chemical analysis showed that the deposits were predominantly iron salts.
A surface lava sample, taken on 30 October 2003 from just below the refuge on the volcano's W slopes, was judged to be relatively young. George Morris analyzed the sample by X-ray fluorescence spectroscopy (XRF) and described the sample as andesite. This was the first known chemical analysis for Taftan rocks. In addition to the sampled lava flow, thick deposits of ignimbrite appeared in the walls of a deep gorge followed by the trail ascending to the refuge (at ~ 2,500 m elevation). It looked fresh and was judged to be Holocene in age.
Petrography of the lava sample. The sample is phenocryst rich (by volume, ~ 40-50% phenocrysts) in a microcrystalline to cryptocrystalline groundmass. Plagioclase is the predominant phenocryst phase (30-40%) with hornblende (< 5%), pyroxene (< 1%), opaque Fe-Ti oxide phases (< 1%), and trace amounts of biotite. Microxenoliths (1-3 mm in size) were observed, contributing < 2% volume to the whole rock.
Plagioclase phenocrysts invariably show complex zoning, but can be roughly divided into four groups. Euhedral plagioclase (0.5-1 mm long) show fine oscillatory zoning as well as internal dissolution and overgrowth surfaces. They are invariably euhedral but show no sieve-textured zones or dissolution channeling. Sieve-texture mantled plagioclase (0.5-5 mm long) can either have an un-zoned anhedral or an oscillatory zoned core. This is mantled with a zone of fine sieve-textured plagioclase of variable width, then overgrown by an un-sieved rim that may be oscillatory zoned. Inclusion-rich zones were observed running parallel to the sieve-textured zones within the cores of larger phenocrysts. Sieve-cored plagioclase (0.3-1 mm long) contain a completely sieve-textured core overgrown (normally) with an oscillatory zoned rim. These are generally smaller than the sieve-texture mantled plagioclase; however, the thicker un-sieved rims suggest that they form a distinct group rather than being a smaller version of the above. Small euhedral lath shaped plagioclase (< 0.3 mm) are common in the groundmass.
Hornblende occurs as lozenge-shaped crystals 0.2-1.5 mm long. These are invariably rimmed by thick reaction zones dominated by opaque oxides. These reaction zones can sometimes completely replace the original phenocryst.
Rare euhedral crystals of clinopyroxene were observed as phenocrysts. Similar pyroxenes were observed both in clots (with plagioclase) and in microxenoliths. Opaque oxide phases were observed as euhedral to anhedral phenocrysts 0.2-0.3 mm in diameter but account for less than 1% of the whole rock. Trace amounts of biotite were also observed; similar biotite was seen in microxenoliths. Most microphenocrysts contained a microcrystalline mass dominated by opaque oxides. Where less altered examples survive, the mineralogy is dominated by subhedral plagioclase and euhedral clinopyroxene, the pyroxene often partially altered to biotite and oxide phases. Crystal faces on feldspar in contact with the groundmass show sieve-textured reaction mantles, which is absent on crystal faces internal to the microxenoliths.
Interpretation. The phenocryst assemblage of the lava sample suggests multiple phenocryst sources and disequilibrium between mineral phases and groundmass, typical of stratovolcanoes. The correspondence of some phenocryst phases with mineral phases in microxenoliths suggest that at least some of the phenocrysts were inherited during the assimilation of country rock, while the oscillatory zoning, sieve-textured cores and mantles, and multiple dissolution surfaces in feldspars indicates that other phenocrysts have undergone long and complex magmatic histories.
Setting and summit elevation. Taftan is in eastern Iran, 100 km SSE of the city of Zahedan and 50 km W of the Pakistan border. Several necks, representing erosional remnants of cinder cones, rise from the plain W from Taftan, as well as a second stratovolcano, Buzman (~ 3,500 m summit elevation), which remains largely unknown.
The summit elevation is listed in the Catalog of Active Volcanoes of the World (Gansser, 1964) as 4,050 m. Jean Sesiano found (presumably more current) Iranian maps with the volcanically active SE summit shown as 3,940 m, and the dissected NW summit, as 3,840 m.
Reference. Gansser, A., 1964, Catalog of the Active Volcanoes and Solfatara Fields of Iran; Rome, IAVCEI, part XVII-Appendix, p. 1-20.
Geologic Background. Taftan is a strongly eroded andesitic stratovolcano with two prominent summits. The volcano was constructed along the Makran-Chagai Arc in SE Iran. The higher SE summit cone has been the source of lava flows, as well as of highly active, sulfur-encrusted fumaroles. In January 1902 the volcano was reported to be smoking heavily for several days, with occasional strong night-time glow. A lava flow was reported in 1993, but may have been a mistaken observation of a molten sulfur flow. Despite these reports there is no clear evidence for Holocene activity. The youngest date obtained by Pang et al. (2014), using U-Pb on a zircon, was about 800 ka. Biabangard and Moradian (2008) obtained K-Ar dates around 700 ka.
Information Contacts: Jean Sesiano and George Morris, Earth Sciences Section, Mineralogy Dept, University of Geneva, 13 rue des Maraîchers, 1205 Genève, Switzerland