Recently Published Bulletin Reports
Erebus (Antarctica) Lava lake remains active; most thermal alerts recorded since 2019
Rincon de la Vieja (Costa Rica) Frequent phreatic explosions during July-December 2023
Bezymianny (Russia) Explosion on 18 October 2023 sends ash plume 8 km high; lava flows and incandescent avalanches
Kilauea (United States) Low-level lava effusions in the lava lake at Halema’uma’u during July-December 2022
Nyamulagira (DR Congo) Lava flows and thermal activity during May-October 2023
Bagana (Papua New Guinea) Explosions, ash plumes, ashfall, and lava flows during April-September 2023
Mayon (Philippines) Lava flows, pyroclastic flows, ash emissions, and seismicity during April-September 2023
Nishinoshima (Japan) Eruption plumes and gas-and-steam plumes during May-August 2023
Krakatau (Indonesia) White gas-and-steam plumes and occasional ash plumes during May-August 2023
Villarrica (Chile) Strombolian activity, gas-and-ash emissions, and crater incandescence during April-September 2023
Merapi (Indonesia) Frequent incandescent avalanches during April-September 2023
Ebeko (Russia) Moderate explosive activity with ash plumes continued during June-November 2023
Erebus (Antarctica) — January 2024  Cite this Report
Erebus
Antarctica
77.53°S, 167.17°E; summit elev. 3794 m
All times are local (unless otherwise noted)
Lava lake remains active; most thermal alerts recorded since 2019
The lava lake in the summit crater of Erebus has been active since at least 1972. Located in Antarctica overlooking the McMurdo Station on Ross Island, it is the southernmost active volcano on the planet. Because of the remote location, activity is primarily monitored by satellites. This report covers activity during 2023.
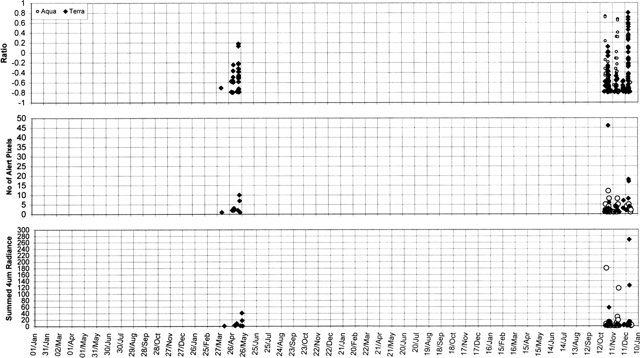
The number of thermal alerts recorded by the Hawai'i Institute of Geophysics and Planetology’s MODVOLC Thermal Alerts System increased considerably in 2023 compared to the years 2020-2022 (table 9). In contrast to previous years, the MODIS instruments aboard the Aqua and Terra satellites captured data from Erebus every month during 2023. Consistent with previous years, the lowest number of anomalous pixels were recorded in January, November, and December.
Table 9. Number of monthly MODIS-MODVOLC thermal alert pixels recorded at Erebus during 2017-2023. See BGVN 42:06 for data from 2000 through 2016. The table was compiled using data provided by the HIGP – MODVOLC Thermal Alerts System.
| Year |
Jan |
Feb |
Mar |
Apr |
May |
Jun |
Jul |
Aug |
Sep |
Oct |
Nov |
Dec |
SUM |
| 2017 |
0 |
21 |
9 |
0 |
0 |
1 |
11 |
61 |
76 |
52 |
0 |
3 |
234 |
| 2018 |
0 |
21 |
58 |
182 |
55 |
17 |
137 |
172 |
103 |
29 |
0 |
0 |
774 |
| 2019 |
2 |
21 |
162 |
151 |
55 |
56 |
75 |
53 |
29 |
19 |
1 |
0 |
624 |
| 2020 |
0 |
2 |
16 |
18 |
4 |
4 |
1 |
3 |
18 |
3 |
1 |
6 |
76 |
| 2021 |
0 |
9 |
1 |
0 |
2 |
56 |
46 |
47 |
35 |
52 |
5 |
3 |
256 |
| 2022 |
1 |
13 |
55 |
22 |
15 |
32 |
39 |
19 |
31 |
11 |
0 |
0 |
238 |
| 2023 |
2 |
33 |
49 |
82 |
41 |
32 |
70 |
64 |
42 |
17 |
5 |
11 |
448 |
Sentinel-2 infrared images showed one or two prominent heat sources within the summit crater, accompanied by adjacent smaller sources, similar to recent years (see BGVN 46:01, 47:02, and 48:01). A unique image was obtained on 25 November 2023 by the OLI-2 (Operational Land Imager-2) on Landsat 9, showing the upper part of the volcano surrounded by clouds (figure 32).
Geologic Background. Mount Erebus, the world's southernmost historically active volcano, overlooks the McMurdo research station on Ross Island. It is the largest of three major volcanoes forming the crudely triangular Ross Island. The summit of the dominantly phonolitic volcano has been modified by one or two generations of caldera formation. A summit plateau at about 3,200 m elevation marks the rim of the youngest caldera, which formed during the late-Pleistocene and within which the modern cone was constructed. An elliptical 500 x 600 m wide, 110-m-deep crater truncates the summit and contains an active lava lake within a 250-m-wide, 100-m-deep inner crater; other lava lakes are sometimes present. The glacier-covered volcano was erupting when first sighted by Captain James Ross in 1841. Continuous lava-lake activity with minor explosions, punctuated by occasional larger Strombolian explosions that eject bombs onto the crater rim, has been documented since 1972, but has probably been occurring for much of the volcano's recent history.
Information Contacts: Hawai'i Institute of Geophysics and Planetology (HIGP) - MODVOLC Thermal Alerts System, School of Ocean and Earth Science and Technology (SOEST), Univ. of Hawai'i, 2525 Correa Road, Honolulu, HI 96822, USA (URL: http://modis.higp.hawaii.edu/); Copernicus Browser, Copernicus Data Space Ecosystem, European Space Agency (URL: https://dataspace.copernicus.eu/browser/); NASA Earth Observatory, EOS Project Science Office, NASA Goddard Space Flight Center, Goddard, Maryland, USA (URL: https://earthobservatory.nasa.gov/images/152134/erebus-breaks-through).
Rincon de la Vieja (Costa Rica) — January 2024 Cite this Report
Rincon de la Vieja
Costa Rica
10.83°N, 85.324°W; summit elev. 1916 m
All times are local (unless otherwise noted)
Frequent phreatic explosions during July-December 2023
Rincón de la Vieja is a volcanic complex in Costa Rica with a hot convecting acid lake that exhibits frequent weak phreatic explosions, gas-and-steam emissions, and occasional elevated sulfur dioxide levels (BGVN 45:10, 46:03, 46:11). The current eruption period began June 2021. This report covers activity during July-December 2023 and is based on weekly bulletins and occasional daily reports from the Observatorio Vulcanologico Sismologica de Costa Rica-Universidad Nacional (OVSICORI-UNA).
Numerous weak phreatic explosions continued during July-December 2023, along with gas-and-steam emissions and plumes that rose as high as 3 km above the crater rim. Many weekly OVSICORI-UNA bulletins included the previous week's number of explosions and emissions (table 9). For many explosions, the time of explosion was given (table 10). Frequent seismic activity (long-period earthquakes, volcano-tectonic earthquakes, and tremor) accompanied the phreatic activity.
Table 9. Number of reported weekly phreatic explosions and gas-and-steam emissions at Rincón de la Vieja, July-December 2023. Counts are reported for the week before the Weekly Bulletin date; not all reports included these data. Courtesy of OVSICORI-UNA.
| OVSICORI Weekly Bulletin |
Number of explosions |
Number of emissions |
| 28 Jul 2023 |
6 |
14 |
| 4 Aug 2023 |
10 |
12 |
| 1 Sep 2023 |
13 |
11 |
| 22 Sep 2023 |
12 |
13 |
| 29 Sep 2023 |
6 |
11 |
| 6 Oct 2023 |
12 |
5 |
| 13 Oct 2023 |
7 |
9 |
| 20 Oct 2023 |
1 |
15 |
| 27 Oct 2023 |
3 |
23 |
| 3 Nov 2023 |
3 |
10 |
| 17 Nov 2023 |
0 |
Some |
| 24 Nov 2023 |
0 |
14 |
| 8 Dec 2023 |
4 |
16 |
| 22 Dec 2023 |
8 |
18 |
Table 10. Summary of activity at Rincón de la Vieja during July-December 2023. Weak phreatic explosions and gas emissions are noted where the time of explosion was indicated in the weekly or daily bulletins. Height of plumes or emissions are distance above the crater rim. Courtesy of OVSICORI-UNA.
| Date |
Time |
Description of Activity |
| 1 Jul 2023 |
0156 |
Explosion. |
| 2 Jul 2023 |
0305 |
Explosion. |
| 4 Jul 2023 |
0229, 0635 |
Event at 0635 produced a gas-and-steam plume that rose 700 m and drifted W; seen by residents in Liberia (21 km SW). |
| 9 Jul 2023 |
1843 |
Explosion. |
| 21 Jul 2023 |
0705 |
Explosion. |
| 26 Jul 2023 |
1807 |
Explosion. |
| 28 Jul 2023 |
0802 |
Explosion generated a gas-and-steam plume that rose 500 m. |
| 30 Jul 2023 |
1250 |
Explosion. |
| 31 Jul 2023 |
2136 |
Explosion. |
| 11 Aug 2023 |
0828 |
Explosion. |
| 18 Aug 2023 |
1304 |
Explosion. |
| 21 Aug 2023 |
1224 |
Explosion generated gas-and-steam plumes rose 500-600 m. |
| 22 Aug 2023 |
0749 |
Explosion generated gas-and-steam plumes rose 500-600 m. |
| 24 Aug 2023 |
1900 |
Explosion. |
| 25 Aug 2023 |
0828 |
Event produced a steam-and-gas plume that rose 3 km and drifted NW. |
| 27-28 Aug 2023 |
0813 |
Four small events; the event at 0813 on 28 August lasted two minutes and generated a steam-and-gas plume that rose 2.5 km. |
| 1 Sep 2023 |
1526 |
Explosion generated plume that rose 2 km and ejected material onto the flanks. |
| 2-3 Sep 2023 |
- |
Small explosions detected in infrasound data. |
| 4 Sep 2023 |
1251 |
Gas-and-steam plume rose 1 km and drifted W. |
| 7 Nov 2023 |
1113 |
Explosion. |
| 8 Nov 2023 |
0722 |
Explosion. |
| 12 Nov 2023 |
0136 |
Small gas emissions. |
| 14 Nov 2023 |
0415 |
Small gas emissions. |
According to OVSICORI-UNA, during July-October the average weekly sulfur dioxide (SO2) flux ranged from 68 to 240 tonnes/day. However, in mid-November the flux increased to as high as 334 tonnes/day, the highest value measured in recent years. The high SO2 flux in mid-November was also detected by the TROPOMI instrument on the Sentinel-5P satellite (figure 43).
Geologic Background. Rincón de la Vieja, the largest volcano in NW Costa Rica, is a remote volcanic complex in the Guanacaste Range. The volcano consists of an elongated, arcuate NW-SE-trending ridge constructed within the 15-km-wide early Pleistocene Guachipelín caldera, whose rim is exposed on the south side. Sometimes known as the "Colossus of Guanacaste," it has an estimated volume of 130 km3 and contains at least nine major eruptive centers. Activity has migrated to the SE, where the youngest-looking craters are located. The twin cone of Santa María volcano, the highest peak of the complex, is located at the eastern end of a smaller, 5-km-wide caldera and has a 500-m-wide crater. A Plinian eruption producing the 0.25 km3 Río Blanca tephra about 3,500 years ago was the last major magmatic eruption. All subsequent eruptions, including numerous historical eruptions possibly dating back to the 16th century, have been from the prominent active crater containing a 500-m-wide acid lake located ENE of Von Seebach crater.
Information Contacts: Observatorio Vulcanológico Sismológica de Costa Rica-Universidad Nacional (OVSICORI-UNA), Apartado 86-3000, Heredia, Costa Rica (URL: http://www.ovsicori.una.ac.cr/); NASA Global Sulfur Dioxide Monitoring Page, Atmospheric Chemistry and Dynamics Laboratory, NASA Goddard Space Flight Center (NASA/GSFC), 8800 Greenbelt Road, Goddard MD 20771, USA (URL: https://so2.gsfc.nasa.gov/).
Bezymianny (Russia) — November 2023 Cite this Report
Bezymianny
Russia
55.972°N, 160.595°E; summit elev. 2882 m
All times are local (unless otherwise noted)
Explosion on 18 October 2023 sends ash plume 8 km high; lava flows and incandescent avalanches
Bezymianny, located on Russia’s Kamchatka Peninsula, has had eruptions since 1955 characterized by dome growth, explosions, pyroclastic flows, ash plumes, and ashfall. Activity during November 2022-April 2023 included gas-and-steam emissions, lava dome collapses generating avalanches, and persistent thermal activity. Similar eruptive activity continued from May through October 2023, described here based on information from weekly and daily reports of the Kamchatka Volcano Eruptions Response Team (KVERT), notices from Tokyo VAAC (Volcanic Ash Advisory Center), and from satellite data.
Overall activity decreased after the strong period of activity in late March through April 2023, which included ash explosions during 29 March and 7-8 April 2023 that sent plumes as high as 10-12 km altitude, along with dome growth and lava flows (BGVN 48:05). This reduced activity can be seen in the MIROVA thermal detection system graph (figure 56), which was consistent with data from the MODVOLC thermal detection system and with Sentinel-2 satellite images that showed persistent hotspots in the summit crater when conditions allowed observations. A renewed period of strong activity began in mid-October 2023.
Activity increased significantly on 17 October 2023 when large collapses began during 0700-0830 on the E flanks of the lava dome and continued to after 0930 the next day (figure 57). Ash plumes rose to an altitude of 4.5-5 km, extending 220 km NNE by 18 October. A large explosion at 1630 on 18 October produced an ash plume that rose to an altitude of 11 km (8 km above the summit) and drifted NNE and then NW, extending 900 km NW within two days at an altitude of 8 km. Minor ashfall was noted in Kozyrevsk (45 km WNW). At 0820 on 20 October an ash plume was identified in satellite images drifting 100 km ENE at altitudes of 4-4.5 km.
Lava flows and hot avalanches from the dome down the SE flank continued over the next few days, including 23 October when clear conditions allowed good observations (figures 58 and 59). A large thermal anomaly was observed over the volcano through 24 October, and in the summit crater on 30 October (figure 60). Strong fumarolic activity continued, with numerous avalanches and occasional incandescence. By the last week of October, volcanic activity had decreased to a level consistent with that earlier in the reporting period.
Aviation warnings were frequently updated during 17-20 October. KVERT issued a Volcano Observatory Notice for Aviation (VONA) on 17 October at 1419 and 1727 (0219 and 0527 UTC) raising the Aviation Color Code (ACC) from Yellow to Orange (second highest level). The next day, KVERT issued a VONA at 1705 (0505 UTC) raising the ACC to Red (highest level) but lowered it back to Orange at 2117 (0917 UTC). After another decrease to Yellow and back to Orange, the ACC was reduced to Yellow on 20 October at 1204 (0004 UTC). In addition, the Tokyo VAAC issued a series of Volcanic Ash Advisories beginning on 16 October and continuing through 30 October.
Geologic Background. The modern Bezymianny, much smaller than its massive neighbors Kamen and Kliuchevskoi on the Kamchatka Peninsula, was formed about 4,700 years ago over a late-Pleistocene lava-dome complex and an edifice built about 11,000-7,000 years ago. Three periods of intensified activity have occurred during the past 3,000 years. The latest period, which was preceded by a 1,000-year quiescence, began with the dramatic 1955-56 eruption. This eruption, similar to that of St. Helens in 1980, produced a large open crater that was formed by collapse of the summit and an associated lateral blast. Subsequent episodic but ongoing lava-dome growth, accompanied by intermittent explosive activity and pyroclastic flows, has largely filled the 1956 crater.
Information Contacts: Kamchatka Volcanic Eruptions Response Team (KVERT), Far Eastern Branch, Russian Academy of Sciences, 9 Piip Blvd., Petropavlovsk-Kamchatsky, 683006, Russia (URL: http://www.kscnet.ru/ivs/kvert/); Kamchatka Volcanological Station, Kamchatka Branch of Geophysical Survey, (KB GS RAS), Klyuchi, Kamchatka Krai, Russia (URL: http://volkstat.ru/); Tokyo Volcanic Ash Advisory Center (VAAC), 1-3-4 Otemachi, Chiyoda-ku, Tokyo 100-8122, Japan (URL: http://ds.data.jma.go.jp/svd/vaac/data/); Hawai'i Institute of Geophysics and Planetology (HIGP) - MODVOLC Thermal Alerts System, School of Ocean and Earth Science and Technology (SOEST), Univ. of Hawai'i, 2525 Correa Road, Honolulu, HI 96822, USA (URL: http://modis.higp.hawaii.edu/); MIROVA (Middle InfraRed Observation of Volcanic Activity), a collaborative project between the Universities of Turin and Florence (Italy) supported by the Centre for Volcanic Risk of the Italian Civil Protection Department (URL: http://www.mirovaweb.it/); Copernicus Browser, Copernicus Data Space Ecosystem, European Space Agency (URL: https://dataspace.copernicus.eu/browser/).chr
Kilauea (United States) — January 2023 Cite this Report
Kilauea
United States
19.421°N, 155.287°W; summit elev. 1222 m
All times are local (unless otherwise noted)
Low-level lava effusions in the lava lake at Halema’uma’u during July-December 2022
Kīlauea is the southeastern-most volcano in Hawaii and overlaps the E flank of the Mauna Loa volcano. Its East Rift Zone (ERZ) has been intermittently active for at least 2,000 years. An extended eruption period began in January 1983 and was characterized by open lava lakes and lava flows from the summit caldera and the East Rift Zone. During May 2018 magma migrated into the Lower East Rift Zone (LERZ) and opened 24 fissures along a 6-km-long NE-trending fracture zone that produced lava flows traveling in multiple directions. As lava emerged from the fissures, the lava lake at Halema'uma'u drained and explosions sent ash plumes to several kilometers altitude (BGVN 43:10).
The current eruption period started during September 2021 and has recently been characterized by lava effusions, spatter, and sulfur dioxide emissions in the active Halema’uma’u lava lake (BGVN 47:08). Lava effusions, some spatter, and sulfur dioxide emissions have continued during this reporting period of July through December 2022 using daily reports, volcanic activity notices, and abundant photo, map, and video data from the US Geological Survey's (USGS) Hawaiian Volcano Observatory (HVO).
Summary of activity during July-December 2022. Low-level effusions have continued at the western vent of the Halema’uma’u crater during July through early December 2022. Occasional weak ooze-outs (also called lava break outs) would occur along the margins of the crater floor. The overall level of the active lava lake throughout the reporting period gradually increased due to infilling, however it stagnated in mid-September (table 13). During September through November, activity began to decline, though lava effusions persisted at the western vent. By 9 December, the active part of the lava lake had completely crusted over, and incandescence was no longer visible.
Table 13. Summary of measurements taken during overflights at Kīlauea that show a gradual increase in the active lava lake level and the volume of lava effused since 29 September 2021. Lower activity was reported during September-October. Data collected during July-December 2022. Courtesy of HVO.
| Date: |
Level of the active lava lake (m): |
Cumulative volume of lava effused (million cubic meters): |
| 7 Jul 2022 |
130 |
95 |
| 19 Jul 2022 |
133 |
98 |
| 4 Aug 2022 |
136 |
102 |
| 16 Aug 2022 |
137 |
104 |
| 12 Sep 2022 |
143 |
111 |
| 5 Oct 2022 |
143 |
111 |
| 28 Oct 2022 |
143 |
111 |
Activity during July 2022. Lava effusions were reported from the western vent in the Halema’uma’u crater, along with occasional weak ooze-outs along the margins of the crater floor. The height of the lava lake was variable due to deflation-inflation tilt events; for example, the lake level dropped approximately 3-4 m during a summit deflation-inflation event reported on 1 July. Webcam images taken during the night of 6-12 July showed intermittent low-level spattering at the western vent that rose less than 10 m above the vent (figure 519). Measurements made during an overflight on 7 July indicated that the crater floor was infilled about 130 m and that 95 million cubic meters of lava had been effused since 29 September 2021. A single, relatively small lava ooze-out was active to the S of the lava lake. Around midnight on 8 July there were two brief periods of lava overflow onto the lake margins. On 9 July lava ooze-outs were reported near the SE and NE edges of the crater floor and during 10-11 July they occurred near the E, NE, and NW edges. On 16 July crater incandescence was reported, though the ooze-outs and spattering were not visible. On 18 July overnight webcam images showed incandescence in the western vent complex and two ooze-outs were reported around 0000 and 0200 on 19 July. By 0900 there were active ooze-outs along the SW edge of the crater floor. Measurements made from an overflight on 19 July indicated that the crater floor was infilled about 133 m and 98 million cubic meters of lava had erupted since 29 September 2021 (figure 520). On 20 July around 1600 active ooze-outs were visible along the N edge of the crater, which continued through the next day. Extensive ooze-outs occurred along the W margin during 24 July until 1900; on 26 July minor ooze-outs were noted along the N margin. Minor spattering was visible on 29 July along the E margin of the lake. The sulfur dioxide emission rates ranged 650-2,800 tons per day (t/d), the higher of which was measured on 8 July (figure 519).
Activity during August 2022. The eruption continued in the Halema’uma’u crater at the western vent. According to HVO the lava in the active lake remained at the level of the bounding levees. Occasional minor ooze-outs were observed along the margins of the crater floor. Strong nighttime crater incandescence was visible after midnight on 6 August over the western vent cone. During 6-7 August scattered small lava lobes were active along the crater floor and incandescence persisted above the western vent through 9 August. During 7-9 August HVO reported a single lava effusion source was active along the NW margin of the crater floor. Measurements from an overflight on 4 August indicated that the crater floor was infilled about 136 m total and that 102 million cubic meters of lava had been erupted since the start of the eruption. Lava breakouts were reported along the N, NE, E, S, and W margins of the crater during 10-16 August. Another overflight survey conducted on 16 August indicated that the crater floor infilled about 137 m and 104 million cubic meters of lava had been erupted since September 2021. Measured sulfur dioxide emissions rates ranged 1,150-2,450 t/d, the higher of which occurred on 8 August.
Activity during September 2022. During September, lava effusion continued from the western vent into the active lava lake and onto the crater floor. Intermittent minor ooze-outs were reported through the month. A small ooze-out was visible on the W crater floor margin at 0220 on 2 September, which showed decreasing surface activity throughout the day, but remained active through 3 September. On 3 September around 1900 a lava outbreak occurred along the NW margin of the crater floor but had stopped by the evening of 4 September. Field crews monitoring the summit lava lake on 9 September observed spattering on the NE margin of the lake that rose no higher than 10 m, before falling back onto the lava lake crust (figure 521). Overflight measurements on 12 September indicated that the crater floor was infilled a total of 143 m and 111 million cubic meters of lava had been erupted since September 2021. Extensive breakouts in the W and N part of the crater floor were reported at 1600 on 20 September and continued into 26 September. The active part of the lava lake dropped by 10 m while other parts of the crater floor dropped by several meters. Summit tiltmeters recorded a summit seismic swarm of more than 80 earthquakes during 1500-1800 on 21 September, which occurred about 1.5 km below Halema’uma’u; a majority of these were less than Mw 2. By 22 September the active part of the lava lake was infilled about 2 m. On 23 September the western vent areas exhibited several small spatter cones with incandescent openings, along with weak, sporadic spattering (figure 522). The sulfur dioxide emission rate ranged from 930 t/d to 2,000 t/d, the higher of which was measured on 6 September.
Activity during October 2022. Activity during October declined slightly compared to previous months, though lava effusions persisted from the western vent into the active lava lake and onto the crater floor during October (figure 523). Slight variations in the lava lake were noted throughout the month. HVO reported that around 0600 on 3 October the level of the lava lake has lowered slightly. Overflight measurements taken on 5 October indicated that the crater floor was infilled a total of about 143 m and that 111 million cubic meters of lava had been effused since September 2021. During 6-7 October the lake gradually rose 0.5 m. Sulfur dioxide measurements made on 22 October had an emission rate of 700 t/d. Another overflight taken on 28 October showed that there was little to no change in the elevation of the crater floor: the crater floor was infilled a total of 143 m and 111 million cubic meters of lava had erupted since the start of the eruption.
Activity during November 2022. Activity remained low during November, though HVO reported that lava from the western vent continued to effuse into the active lava lake and onto the crater floor throughout the month. The rate of sulfur dioxide emissions during November ranged from 300-600 t/d, the higher amount of which occurred on 9 November.
Activity during December 2022. Similar low activity was reported during December, with lava effusing from the western vent into the active lava lake and onto the crater floor. During 4-5 December the active part of the lava lake was slightly variable in elevation and fluctuated within 1 m. On 9 December HVO reported that lava was no longer erupting from the western vent in the Halema’uma’u crater and that sulfur dioxide emissions had returned to near pre-eruption background levels; during 10-11 December, the lava lake had completely crusted over, and no incandescence was visible (figure 524). Time lapse camera images covering the 4-10 December showed that the crater floor showed weak deflation and no inflation. Some passive events of crustal overturning were reported during 14-15 December, which brought fresh incandescent lava to the lake surface. The sulfur dioxide emission rate was approximately 200 t/d on 14 December. A smaller overturn event on 17 December and another that occurred around 0000 and into the morning of 20 December were also detected. A small seismic swarm was later detected on 30 December.
Geologic Background. Kilauea overlaps the E flank of the massive Mauna Loa shield volcano in the island of Hawaii. Eruptions are prominent in Polynesian legends; written documentation since 1820 records frequent summit and flank lava flow eruptions interspersed with periods of long-term lava lake activity at Halemaumau crater in the summit caldera until 1924. The 3 x 5 km caldera was formed in several stages about 1,500 years ago and during the 18th century; eruptions have also originated from the lengthy East and Southwest rift zones, which extend to the ocean in both directions. About 90% of the surface of the basaltic shield volcano is formed of lava flows less than about 1,100 years old; 70% of the surface is younger than 600 years. The long-term eruption from the East rift zone between 1983 and 2018 produced lava flows covering more than 100 km2, destroyed hundreds of houses, and added new coastline.
Information Contacts: Hawaiian Volcano Observatory (HVO), U.S. Geological Survey, PO Box 51, Hawai'i National Park, HI 96718, USA (URL: http://hvo.wr.usgs.gov/).
Nyamulagira (DR Congo) — November 2023 Cite this Report
Nyamulagira
DR Congo
1.408°S, 29.2°E; summit elev. 3058 m
All times are local (unless otherwise noted)
Lava flows and thermal activity during May-October 2023
Nyamulagira (also known as Nyamuragira) is a shield volcano in the Democratic Republic of Congo with the summit truncated by a small 2 x 2.3 km caldera with walls up to about 100 m high. Documented eruptions have occurred within the summit caldera, as well as from numerous flank fissures and cinder cones. The current eruption period began in April 2018 and has more recently been characterized by summit crater lava flows and thermal activity (BGVN 48:05). This report describes lava flows and variable thermal activity during May through October 2023, based on information from the Observatoire Volcanologique de Goma (OVG) and various satellite data.
Lava lake activity continued during May. The MIROVA (Middle InfraRed Observation of Volcanic Activity) system recorded moderate-to-strong thermal activity throughout the reporting period; activity was more intense during May and October and relatively weaker from June through September (figure 95). The MODVOLC thermal algorithm, detected a total of 209 thermal alerts. There were 143 hotspots detected during May, eight during June, nine during September, and 49 during October. This activity was also reflected in infrared satellite images, where a lava flow was visible in the NW part of the crater on 7 May and strong activity was seen in the center of the crater on 4 October (figure 96). Another infrared satellite image taken on 12 May showed still active lava flows along the NW margin of the crater. According to OVG lava effusions were active during 7-29 May and moved to the N and NW parts of the crater beginning on 9 May. Strong summit crater incandescence was visible from Goma (27 km S) during the nights of 17, 19, and 20 May (figure 97). On 17 May there was an increase in eruptive activity, which peaked at 0100 on 20 May. Notable sulfur dioxide plumes drifted NW and W during 19-20 May (figure 98). Drone footage acquired in partnership with the USGS (United States Geological Survey) on 20 May captured images of narrow lava flows that traveled about 100 m down the W flank (figure 99). Data from the Rumangabo seismic station indicated a decreasing trend in activity during 17-21 May. Although weather clouds prevented clear views of the summit, a strong thermal signature on the NW flank was visible in an infrared satellite image on 22 May, based on an infrared satellite image. On 28 May the lava flows on the upper W flank began to cool and solidify. By 29 May seismicity returned to levels similar to those recorded before the 17 May increase. Lava effusion continued but was confined to the summit crater; periodic crater incandescence was observed.
Low-level activity was noted during June through October. On 1 June OVG reported that seismicity remained at lower levels and that crater incandescence had been absent for three days, though infrared satellite imagery showed continued lava effusion in the summit crater. The lava flows on the flanks covered an estimated 0.6 km2. Satellite imagery continued to show thermal activity confined to the lava lake through October (figure 96), although no lava flows or significant sulfur dioxide emissions were reported.
Geologic Background. Africa's most active volcano, Nyamulagira (also known as Nyamuragira), is a massive high-potassium basaltic shield about 25 km N of Lake Kivu and 13 km NNW of the steep-sided Nyiragongo volcano. The summit is truncated by a small 2 x 2.3 km caldera that has walls up to about 100 m high. Documented eruptions have occurred within the summit caldera, as well as from the numerous flank fissures and cinder cones. A lava lake in the summit crater, active since at least 1921, drained in 1938, at the time of a major flank eruption. Recent lava flows extend down the flanks more than 30 km from the summit as far as Lake Kivu; extensive lava flows from this volcano have covered 1,500 km2 of the western branch of the East African Rift.
Information Contacts: Observatoire Volcanologique de Goma (OVG), Departement de Geophysique, Centre de Recherche en Sciences Naturelles, Lwiro, D.S. Bukavu, DR Congo; Hawai'i Institute of Geophysics and Planetology (HIGP) - MODVOLC Thermal Alerts System, School of Ocean and Earth Science and Technology (SOEST), Univ. of Hawai'i, 2525 Correa Road, Honolulu, HI 96822, USA (URL: http://modis.higp.hawaii.edu/); MIROVA (Middle InfraRed Observation of Volcanic Activity), a collaborative project between the Universities of Turin and Florence (Italy) supported by the Centre for Volcanic Risk of the Italian Civil Protection Department (URL: http://www.mirovaweb.it/); NASA Global Sulfur Dioxide Monitoring Page, Atmospheric Chemistry and Dynamics Laboratory, NASA Goddard Space Flight Center (NASA/GSFC), 8800 Greenbelt Road, Goddard, Maryland, USA (URL: https://so2.gsfc.nasa.gov/); Copernicus Browser, Copernicus Data Space Ecosystem, European Space Agency (URL: https://dataspace.copernicus.eu/browser/); Charles Balagizi, Goma Volcano Observatory, Departement de Geophysique, Centre de Recherche en Sciences Naturelles, Lwiro, D.S. Bukavu, DR Congo.
Bagana (Papua New Guinea) — October 2023 Cite this Report
Bagana
Papua New Guinea
6.137°S, 155.196°E; summit elev. 1855 m
All times are local (unless otherwise noted)
Explosions, ash plumes, ashfall, and lava flows during April-September 2023
The remote volcano of Bagana is located in central Bougainville Island, Papua New Guinea. Recorded eruptions date back to 1842 and activity has consisted of effusive activity that has built a small lava dome in the summit crater and occasional explosions that produced pyroclastic flows. The most recent eruption has been ongoing since February 2000 and has produced occasional explosions, ash plumes, and lava flows. More recently, activity has been characterized by ongoing effusive activity and ash emissions (BGVN 48:04). This report updates activity from April through September 2023 that has consisted of explosions, ash plumes, ashfall, and lava flows, using information from the Darwin Volcanic Ash Advisory Center (VAAC) and satellite data.
An explosive eruption was reported on 7 July that generated a large gas-and-ash plume to high altitudes and caused significant ashfall in local communities; the eruption plume had reached upper tropospheric (16-18 km altitude) altitudes by 2200, according to satellite images. Sulfur dioxide plumes were detected in satellite images on 8 July and indicated that the plume was likely a mixture of gas, ice, and ash. A report issued by the Autonomous Bougainville Government (ABG) (Torokina District, Education Section) on 10 July noted that significant ash began falling during 2000-2100 on 7 July and covered most areas in the Vuakovi, Gotana (9 km SW), Koromaketo, Laruma (25 km W) and Atsilima (27 km NW) villages. Pyroclastic flows also occurred, according to ground-based reports; small deposits confined to one drainage were inspected by RVO during an overflight on 17 July and were confirmed to be from the 7 July event. Ashfall continued until 10 July and covered vegetation, which destroyed bushes and gardens and contaminated rivers and streams.
RVO reported another eruption on 14 July. The Darwin VAAC stated that an explosive event started around 0830 on 15 July and produced an ash plume that rose to 16.5 km altitude by 1000 and drifted N, according to satellite images. The plume continued to drift N and remained visible through 1900, and by 2150 it had dissipated.
Ashfall likely from both the 7 and 15 July events impacted about 8,111 people in Torokina (20 km SW), including Tsito/Vuakovi, Gotana, Koromaketo, Kenaia, Longkogari, Kenbaki, Piva (13 km SW), and Atsinima, and in the Tsitovi district, according to ABG. Significant ashfall was also reported in Ruruvu (22 km N) in the Wakunai District of Central Bougainville, though the thickness of these deposits could not be confirmed. An evacuation was called for the villages in Wakunai, where heavy ashfall had contaminated water sources; the communities of Ruruvu, Togarau, Kakarapaia, Karauturi, Atao, and Kuritaturi were asked to evacuate to a disaster center at the Wakunai District Station, and communities in Torokina were asked to evacuate to the Piva District station. According to a news article, more than 7,000 people needed temporary accommodations, with about 1,000 people in evacuation shelters. Ashfall had deposited over a broad area, contaminating water supplies, affecting crops, and collapsing some roofs and houses in rural areas. Schools were temporarily shut down. Intermittent ash emissions continued through the end of July and drifted NNW, NW, and SW. Fine ashfall was reported on the coast of Torokina, and ash plumes also drifted toward Laruma and Atsilima.
A small explosive eruption occurred at 2130 on 28 July that ejected material from the crater vents, according to reports from Torokina, in addition to a lava flow that contained two lobes. A second explosion was detected at 2157. Incandescence from the lava flow was visible from Piva as it descended the W flank around 2000 on 29 July (figure 47). The Darwin VAAC reported that a strong thermal anomaly was visible in satellite images during 30-31 July and that ash emissions rose to 2.4 km altitude and drifted WSW on 30 July. A ground report from RVO described localized emissions at 0900 on 31 July.
The Darwin VAAC reported that ash plumes were identified in satellite imagery at 0800 and 1220 on 12 August and rose to 2.1 km and 3 km altitude and drifted NW and W, respectively. A news report stated that aid was sent to more than 6,300 people that were adversely affected by the eruption. Photos taken during 17-19 August showed ash emissions rising no higher than 1 km above the summit and drifting SE. A small explosion generated an ash plume during the morning of 19 August. Deposits from small pyroclastic flows were also captured in the photos. Satellite images captured lava flows and pyroclastic flow deposits. Two temporary seismic stations were installed near Bagana on 17 August at distances of 7 km WSW (Vakovi station) and 11 km SW (Kepox station). The Kepox station immediately started to record continuous, low-frequency background seismicity.
Satellite data. Little to no thermal activity was detected during April through mid-July 2023; only one anomaly was recorded during early April and one during early June, according to MIROVA (Middle InfraRed Observation of Volcanic Activity) data (figure 48). Thermal activity increased in both power and frequency during mid-July through September, although there were still some short gaps in detected activity. MODVOLC also detected increased thermal activity during August; thermal hotspots were detected a total of five times on 19, 20, and 27 August. Weak thermal anomalies were also captured in infrared satellite images on clear weather days throughout the reporting period on 7, 12, and 17 April, 27 May, 1, 6, 16, and 31 July, and 19 September (figure 48); a strong thermal anomaly was visible on 31 July. Distinct sulfur dioxide plumes that drifted generally NW were intermittently captured by the TROPOMI instrument on the Sentinel-5P satellite and sometimes exceeded two Dobson Units (DUs) (figure 49).
Geologic Background. Bagana volcano, in a remote portion of central Bougainville Island, is frequently active. This massive symmetrical cone was largely constructed by an accumulation of viscous andesitic lava flows. The entire edifice could have been constructed in about 300 years at its present rate of lava production. Eruptive activity is characterized by non-explosive effusion of viscous lava that maintains a small lava dome in the summit crater, although occasional explosive activity produces pyroclastic flows. Lava flows with tongue-shaped lobes up to 50 m thick and prominent levees descend the flanks on all sides.
Information Contacts: Rabaul Volcano Observatory (RVO), Geohazards Management Division, Department of Mineral Policy and Geohazards Management (DMPGM), PO Box 3386, Kokopo, East New Britain Province, Papua New Guinea; Darwin Volcanic Ash Advisory Centre (VAAC), Bureau of Meteorology, Northern Territory Regional Office, PO Box 40050, Casuarina, NT 0811, Australia (URL: http://www.bom.gov.au/info/vaac/); MIROVA (Middle InfraRed Observation of Volcanic Activity), a collaborative project between the Universities of Turin and Florence (Italy) supported by the Centre for Volcanic Risk of the Italian Civil Protection Department (URL: http://www.mirovaweb.it/); Hawai'i Institute of Geophysics and Planetology (HIGP) - MODVOLC Thermal Alerts System, School of Ocean and Earth Science and Technology (SOEST), Univ. of Hawai'i, 2525 Correa Road, Honolulu, HI 96822, USA (URL: http://modis.higp.hawaii.edu/); NASA Global Sulfur Dioxide Monitoring Page, Atmospheric Chemistry and Dynamics Laboratory, NASA Goddard Space Flight Center (NASA/GSFC), 8800 Greenbelt Road, Goddard, Maryland, USA (URL: https://so2.gsfc.nasa.gov/); Copernicus Browser, Copernicus Data Space Ecosystem, European Space Agency (URL: https://dataspace.copernicus.eu/browser/); Autonomous Bougainville Government, P.O Box 322, Buka, AROB, PNG (URL: https://abg.gov.pg/); Andrew Tupper (Twitter: @andrewcraigtupp); Simon Carn, Geological and Mining Engineering and Sciences, Michigan Technological University, 1400 Townsend Drive, Houghton, MI 49931, USA (URL: http://www.volcarno.com/, Twitter: @simoncarn); Radio NZ (URL: https://www.rnz.co.nz/news/pacific/494464/more-than-7-000-people-in-bougainville-need-temporary-accommodation-after-eruption); USAID, 1300 Pennsylvania Ave, NW, Washington DC 20004, USA (URL: https://www.usaid.gov/pacific-islands/press-releases/aug-08-2023-united-states-provides-immediate-emergency-assistance-support-communities-affected-mount-bagana-volcanic-eruptions).
Mayon (Philippines) — October 2023 Cite this Report
Mayon
Philippines
13.257°N, 123.685°E; summit elev. 2462 m
All times are local (unless otherwise noted)
Lava flows, pyroclastic flows, ash emissions, and seismicity during April-September 2023
Mayon is located in the Philippines and has steep upper slopes capped by a small summit crater. Historical eruptions date back to 1616 CE that have been characterized by Strombolian eruptions, lava flows, pyroclastic flows, and mudflows. Eruptions mostly originated from a central conduit. Pyroclastic flows and mudflows have commonly descended many of the approximately 40 drainages that surround the volcano. The most recent eruption occurred during June through October 2022 and consisted of lava dome growth and gas-and-steam emissions (BGVN 47:12). A new eruption was reported during late April 2023 and has included lava flows, pyroclastic density currents, ash emissions, and seismicity. This report covers activity during April through September 2023 based on daily bulletins from the Philippine Institute of Volcanology and Seismology (PHIVOLCS).
During April through September 2023, PHIVOLCS reported near-daily rockfall events, frequent volcanic earthquakes, and sulfur dioxide measurements. Gas-and-steam emissions rose 100-900 m above the crater and drifted in different directions. Nighttime crater incandescence was often visible during clear weather and was accompanied by incandescent avalanches of material. Activity notably increased during June when lava flows were reported on the S, SE, and E flanks (figure 52). The MIROVA graph (Middle InfraRed Observation of Volcanic Activity) showed strong thermal activity coincident with these lava flows, which remained active through September (figure 53). According to the MODVOLC thermal algorithm, a total of 110 thermal alerts were detected during the reporting period: 17 during June, 40 during July, 27 during August, and 26 during September. During early June, pyroclastic density currents (PDCs) started to occur more frequently.
Low activity was reported during much of April and May; gas-and-steam emissions rose 100-900 m above the crater and generally drifted in different directions. A total of 52 rockfall events and 18 volcanic earthquakes were detected during April and 147 rockfall events and 13 volcanic events during May. Sulfur dioxide flux measurements ranged between 400-576 tons per day (t/d) during April, the latter of which was measured on 29 April and between 162-343 t/d during May, the latter of which was measured on 13 May.
Activity during June increased, characterized by lava flows, pyroclastic density currents (PDCs), crater incandescence and incandescent rockfall events, gas-and-steam emissions, and continued seismicity. Weather clouds often prevented clear views of the summit, but during clear days, moderate gas-and-steam emissions rose 100-2,500 m above the crater and drifted in multiple directions. A total of 6,237 rockfall events and 288 volcanic earthquakes were detected. The rockfall events often deposited material on the S and SE flanks within 700-1,500 m of the summit crater and ash from the events drifted SW, S, SE, NE, and E. Sulfur dioxide emissions ranged between 149-1,205 t/d, the latter of which was measured on 10 June. Short-term observations from EDM and electronic tiltmeter monitoring indicated that the upper slopes were inflating since February 2023. Longer-term ground deformation parameters based on EDM, precise leveling, continuous GPS, and electronic tilt monitoring indicated that the volcano remained inflated, especially on the NW and SE flanks. At 1000 on 5 June the Volcano Alert Level (VAL) was raised to 2 (on a 0-5 scale). PHIVOLCS noted that although low-level volcanic earthquakes, ground deformation, and volcanic gas emissions indicated unrest, the steep increase in rockfall frequency may indicate increased dome activity.
A total of 151 dome-collapse PDCs occurred during 8-9 and 11-30 June, traveled 500-2,000 m, and deposited material on the S flank within 2 km of the summit crater. During 8-9 June the VAL was raised to 3. At approximately 1947 on 11 June lava flow activity was reported; two lobes traveled within 500 m from the crater and deposited material on the S (Mi-isi), SE (Bonga), and E (Basud) flanks. Weak seismicity accompanied the lava flow and slight inflation on the upper flanks. This lava flow remained active through 30 June, moving down the S and SE flank as far as 2.5 km and 1.8 km, respectively and depositing material up to 3.3 km from the crater. During 15-16 June traces of ashfall from the PDCs were reported in Sitio Buga, Nabonton, City of Ligao and Purok, and San Francisco, Municipality of Guinobatan. During 28-29 June there were two PDCs generated by the collapse of the lava flow front, which generated a light-brown ash plume 1 km high. Satellite monitors detected significant concentrations of sulfur dioxide beginning on 29 June. On 30 June PDCs primarily affected the Basud Gully on the E flank, the largest of which occurred at 1301 and lasted eight minutes, based on the seismic record. Four PDCs generated between 1800 and 2000 that lasted approximately four minutes each traveled 3-4 km on the E flank and generated an ash plume that rose 1 km above the crater and drifted N and NW. Ashfall was recorded in Tabaco City.
Similar strong activity continued during July; slow lava effusion remained active on the S and SE flanks and traveled as far as 2.8 km and 2.8 km, respectively and material was deposited as far as 4 km from the crater. There was a total of 6,983 rockfall events and 189 PDCs that affected the S, SE, and E flanks. The volcano network detected a total of 2,124 volcanic earthquakes. Continuous gas-and-steam emissions rose 200-2,000 m above the crater and drifted in multiple directions. Sulfur dioxide emissions averaged 792-4,113 t/d, the latter of which was measured on 28 July. During 2-4 July three PDCs were generated from the collapse of the lava flow and resulting light brown plumes rose 200-300 m above the crater. Continuous tremor pulses were reported beginning at 1547 on 3 July through 7 July at 1200, at 2300 on 8 July and going through 0300 on 10 July, and at 2300 on 16 July, as recorded by the seismic network. During 6-9 July there were 10 lava flow-collapse-related PDCs that generated light brown plumes 300-500 m above the crater. During 10-11 July light ashfall was reported in some areas of Mabinit, Legazpi City, Budiao and Salvacion, Daraga, and Camalig, Albay. By 18 July the lava flow advanced 600 m on the E flank as well.
During 1733 on 18 July and 0434 on 19 July PHIVOLCS reported 30 “ashing” events, which are degassing events accompanied by audible thunder-like sounds and entrained ash at the crater, which produced short, dark plumes that drifted SW. These events each lasted 20-40 seconds, and plume heights ranged from 150-300 m above the crater, as recorded by seismic, infrasound, visual, and thermal monitors. Three more ashing events occurred during 19-20 July. Short-term observations from electronic tilt and GPS monitoring indicate deflation on the E lower flanks in early July and inflation on the NW middle flanks during the third week of July. Longer-term ground deformation parameters from EDM, precise leveling, continuous GPS, and electronic tilt monitoring indicated that the volcano was still generally inflated relative to baseline levels. A short-lived lava pulse lasted 28 seconds at 1956 on 21 July, which was accompanied by seismic and infrasound signals. By 22 July, the only lava flow that remained active was on the SE flank, and continued to extend 3.4 km, while those on the S and E flanks weakened markedly. One ashing event was detected during 30-31 July, whereas there were 57 detected during 31 July-1 August; according to PHIVOLCS beginning at approximately 1800 on 31 July eruptive activity was dominated by phases of intermittent ashing, as well as increased in the apparent rates of lava effusion from the summit crater. The ashing phases consisted of discrete events recorded as low-frequency volcanic earthquakes (LFVQ) typically 30 seconds in duration, based on seismic and infrasound signals. Gray ash plume rose 100 m above the crater and generally drifted NE. Shortly after these ashing events began, new lava began to effuse rapidly from the crater, feeding the established flowed on the SE, E, and E flanks and generating frequent rockfall events.
Intensified unrest persisted during August. There was a total of 4,141 rockfall events, 2,881 volcanic earthquakes, which included volcanic tremor events, 32 ashing events, and 101 PDCs detected throughout the month. On clear weather days, gas-and-steam emissions rose 300-1,500 m above the crater and drifted in different directions (figure 54). Sulfur dioxide emissions averaged 735-4,756 t/d, the higher value of which was measured on 16 August. During 1-2 August the rate of lava effusion decreased, but continued to feed the flows on the SE, S, and E flanks, maintaining their advances to 3.4 km, 2.8 km, and 1.1 km from the crater, respectively (figure 55). Rockfall and PDCs generated by collapses at the lava flow margins and from the summit dome deposited material within 4 km of the crater. During 3-4 August there were 10 tremor events detected that lasted 1-4 minutes. Short-lived lava pulse lasted 35 seconds and was accompanied by seismic and infrasound signals at 0442 on 6 August. Seven collapses were recorded at the front of the lava flow during 12-14 August.
During September, similar activity of slow lava effusion, PDCs, gas-and-steam emissions, and seismicity continued. There was a total of 4,452 rockfall events, 329 volcanic earthquakes, which included volcanic tremor events, two ashing events, and 85 PDCs recorded throughout the month. On clear weather days, gas-and-steam emissions rose 100-1,500 m above the crater and drifted in multiple directions. Sulfur dioxide emissions averaged 609-2,252 t/d, the higher average of which was measured on 6 September. Slow lava effusion continued advancing on the SE, S, and E flanks, maintaining lengths of 3.4 km, 2.8 km, and 1.1 km, respectively. Rockfall and PDC events generated by collapses along the lava flow margins and at the summit dome deposited material within 4 km of the crater.
Geologic Background. Symmetrical Mayon, which rises above the Albay Gulf NW of Legazpi City, is the most active volcano of the Philippines. The steep upper slopes are capped by a small summit crater. Recorded eruptions since 1616 CE range from Strombolian to basaltic Plinian, with cyclical activity beginning with basaltic eruptions, followed by longer periods of andesitic lava flows. Eruptions occur predominately from the central conduit and have also produced lava flows that travel far down the flanks. Pyroclastic density currents and mudflows have commonly swept down many of the approximately 40 ravines that radiate from the summit and have often damaged populated lowland areas. A violent eruption in 1814 killed more than 1,200 people and devastated several towns.
Information Contacts: Philippine Institute of Volcanology and Seismology (PHIVOLCS), Department of Science and Technology, University of the Philippines Campus, Diliman, Quezon City, Philippines (URL: http://www.phivolcs.dost.gov.ph/); MIROVA (Middle InfraRed Observation of Volcanic Activity), a collaborative project between the Universities of Turin and Florence (Italy) supported by the Centre for Volcanic Risk of the Italian Civil Protection Department (URL: http://www.mirovaweb.it/); Hawai'i Institute of Geophysics and Planetology (HIGP) - MODVOLC Thermal Alerts System, School of Ocean and Earth Science and Technology (SOEST), Univ. of Hawai'i, 2525 Correa Road, Honolulu, HI 96822, USA (URL: http://modis.higp.hawaii.edu/); Copernicus Browser, Copernicus Data Space Ecosystem, European Space Agency (URL: https://dataspace.copernicus.eu/browser/); William Rogers, Legazpi City, Albay Province, Philippines.
Nishinoshima (Japan) — October 2023 Cite this Report
Nishinoshima
Japan
27.247°N, 140.874°E; summit elev. 100 m
All times are local (unless otherwise noted)
Eruption plumes and gas-and-steam plumes during May-August 2023
Nishinoshima, located about 1,000 km S of Tokyo, is a small island in the Ogasawara Arc in Japan. The island is the summit of a massive submarine volcano that has prominent submarine peaks to the S, W, and NE. Eruptions date back to 1973 and the current eruption period began in October 2022. Recent activity has consisted of small ash plumes and fumarolic activity (BGVN 48:07). This report covers activity during May through August 2023, using information from monthly reports of the Japan Meteorological Agency (JMA) monthly reports and satellite data.
Activity during May through June was relatively low. The Japan Coast Guard (JCG) did overflights on 14 and 22 June and reported white gas-and-steam emissions rising 600 m and 1,200 m from the central crater of the pyroclastic cone, respectively (figure 125). In addition, multiple white gas-and-steam emissions rose from the inner rim of the W side of the crater and from the SE flank of the pyroclastic cone. Discolored brown-to-green water was observed around almost the entire perimeter of the island; on 22 June light green discolored water was observed off the S coast of the island.
Observations from the Himawari meteorological satellite confirmed an eruption on 9 and 10 July. An eruption plume rose 1.6 km above the crater and drifted N around 1300 on 9 July. Satellite images acquired at 1420 and 2020 on 9 July and at 0220 on 10 July showed continuing emissions that rose 1.3-1.6 km above the crater and drifted NE and N. The Tokyo VAAC reported that an ash plume seen by a pilot and identified in a satellite image at 0630 on 21 July rose to 3 km altitude and drifted S.
Aerial observations conducted by JCG on 8 August showed a white-and-gray plume rising from the central crater of the pyroclastic cone, and multiple white gas-and-steam emissions were rising from the inner edge of the western crater and along the NW-SE flanks of the island (figure 126). Brown-to-green discolored water was also noted around the perimeter of the island.
Intermittent low-to-moderate power thermal anomalies were recorded in the MIROVA graph (Middle InfraRed Observation of Volcanic Activity), showing an increase in both frequency and power beginning in July (figure 127). This increase in activity coincides with eruptive activity on 9 and 10 July, characterized by eruption plumes. According to the MODVOLC thermal alert algorithm, one thermal hotspot was recorded on 20 July. Weak thermal anomalies were also detected in infrared satellite imagery, accompanied by strong gas-and-steam plumes (figure 128).
Geologic Background. The small island of Nishinoshima was enlarged when several new islands coalesced during an eruption in 1973-74. Multiple eruptions that began in 2013 completely covered the previous exposed surface and continued to enlarge the island. The island is the summit of a massive submarine volcano that has prominent peaks to the S, W, and NE. The summit of the southern cone rises to within 214 m of the ocean surface 9 km SSE.
Information Contacts: Japan Meteorological Agency (JMA), 1-3-4 Otemachi, Chiyoda-ku, Tokyo 100-8122, Japan (URL: http://www.jma.go.jp/jma/indexe.html); Tokyo Volcanic Ash Advisory Center (VAAC), 1-3-4 Otemachi, Chiyoda-ku, Tokyo 100-8122, Japan (URL: http://ds.data.jma.go.jp/svd/vaac/data/); MIROVA (Middle InfraRed Observation of Volcanic Activity), a collaborative project between the Universities of Turin and Florence (Italy) supported by the Centre for Volcanic Risk of the Italian Civil Protection Department (URL: http://www.mirovaweb.it/); Copernicus Browser, Copernicus Data Space Ecosystem, European Space Agency (URL: https://dataspace.copernicus.eu/browser/).
Krakatau (Indonesia) — October 2023 Cite this Report
Krakatau
Indonesia
6.1009°S, 105.4233°E; summit elev. 285 m
All times are local (unless otherwise noted)
White gas-and-steam plumes and occasional ash plumes during May-August 2023
Krakatau is located in the Sunda Strait between Java and Sumatra, Indonesia. Caldera collapse during the catastrophic 1883 eruption destroyed Danan and Perbuwatan cones and left only a remnant of Rakata. The post-collapse cone of Anak Krakatau (Child of Krakatau) was constructed within the 1883 caldera at a point between the former Danan and Perbuwatan cones; it has been the site of frequent eruptions since 1927. The current eruption period began in May 2021 and has recently consisted of Strombolian eruptions and ash plumes (BGVN 48:07). This report describes lower levels of activity consisting of ash and white gas-and-steam plumes during May through August 2023, based on information provided by the Indonesian Center for Volcanology and Geological Hazard Mitigation, referred to as Pusat Vulkanologi dan Mitigasi Bencana Geologi (PVMBG), MAGMA Indonesia, and satellite data.
Activity was relatively low during May and June. Daily white gas-and-steam emissions rose 25-200 m above the crater and drifted in different directions. Five ash plumes were detected at 0519 on 10 May, 1241 on 11 May, 0920 on 12 May, 2320 on 12 May, and at 0710 on 13 May, and rose 1-2.5 km above the crater and drifted SW. A webcam image taken on 12 May showed ejection of incandescent material above the vent. A total of nine ash plumes were detected during 6-11 June: at 1434 and 00220 on 6 and 7 June the ash plumes rose 500 m above the crater and drifted NW, at 1537 on 8 June the ash plume rose 1 km above the crater and drifted SW, at 0746 and at 0846 on 9 June the ash plumes rose 800 m and 3 km above the crater and drifted SW, respectively, at 0423, 1431, and 1750 on 10 June the ash plumes rose 2 km, 1.5 km, and 3.5 km above the crater and drifted NW, respectively, and at 0030 on 11 June an ash plume rose 2 km above the crater and drifted NW. Webcam images taken on 10 and 11 June at 0455 and 0102, respectively, showed incandescent material ejected above the vent. On 19 June an ash plume at 0822 rose 1.5 km above the crater and drifted SE.
Similar low activity of white gas-and-steam emissions and few ash plumes were reported during July and August. Daily white gas-and-steam emissions rose 25-300 m above the crater and drifted in multiple directions. Three ash plumes were reported at 0843, 0851, and 0852 on 20 July that rose 500-2,000 m above the crater and drifted NW.
The MIROVA (Middle InfraRed Observation of Volcanic Activity) graph of MODIS thermal anomaly data showed intermittent low-to-moderate power thermal anomalies during May through August 2023 (figure 140). Although activity was often obscured by weather clouds, a thermal anomaly was visible in an infrared satellite image of the crater on 12 May, accompanied by an eruption plume that drifted SW (figure 141).
Geologic Background. The renowned Krakatau (frequently mis-named as Krakatoa) volcano lies in the Sunda Strait between Java and Sumatra. Collapse of an older edifice, perhaps in 416 or 535 CE, formed a 7-km-wide caldera. Remnants of that volcano are preserved in Verlaten and Lang Islands; subsequently the Rakata, Danan, and Perbuwatan cones were formed, coalescing to create the pre-1883 Krakatau Island. Caldera collapse during the catastrophic 1883 eruption destroyed Danan and Perbuwatan, and left only a remnant of Rakata. This eruption caused more than 36,000 fatalities, most as a result of tsunamis that swept the adjacent coastlines of Sumatra and Java. Pyroclastic surges traveled 40 km across the Sunda Strait and reached the Sumatra coast. After a quiescence of less than a half century, the post-collapse cone of Anak Krakatau (Child of Krakatau) was constructed within the 1883 caldera at a point between the former Danan and Perbuwatan cones. Anak Krakatau has been the site of frequent eruptions since 1927.
Information Contacts: Pusat Vulkanologi dan Mitigasi Bencana Geologi (PVMBG, also known as Indonesian Center for Volcanology and Geological Hazard Mitigation, CVGHM), Jalan Diponegoro 57, Bandung 40122, Indonesia (URL: http://www.vsi.esdm.go.id/); MAGMA Indonesia, Kementerian Energi dan Sumber Daya Mineral (URL: https://magma.esdm.go.id/v1); MIROVA (Middle InfraRed Observation of Volcanic Activity), a collaborative project between the Universities of Turin and Florence (Italy) supported by the Centre for Volcanic Risk of the Italian Civil Protection Department (URL: http://www.mirovaweb.it/); Copernicus Browser, Copernicus Data Space Ecosystem, European Space Agency (URL: https://dataspace.copernicus.eu/browser/).
Villarrica (Chile) — October 2023 Cite this Report
Villarrica
Chile
39.42°S, 71.93°W; summit elev. 2847 m
All times are local (unless otherwise noted)
Strombolian activity, gas-and-ash emissions, and crater incandescence during April-September 2023
Villarrica, in central Chile, consists of a 2-km-wide caldera that formed about 3,500 years ago and is located at the base of the presently active cone at the NW margin of a 6-km-wide caldera. Historical eruptions eruptions date back to 1558 and have been characterized by mild-to-moderate explosive activity with occasional lava effusions. The current eruption period began in December 2014 and has recently consisted of nighttime crater incandescence, ash emissions, and seismicity (BGVN 48:04). This report covers activity during April through September 2023 and describes occasional Strombolian activity, gas-and-ash emissions, and nighttime crater incandescence. Information for this report primarily comes from the Southern Andes Volcano Observatory (Observatorio Volcanológico de Los Andes del Sur, OVDAS), part of Chile's National Service of Geology and Mining (Servicio Nacional de Geología y Minería, SERNAGEOMIN) and satellite data.
Seismicity during April consisted of long period (LP) events and tremor (TRE); a total of 9,413 LP-type events and 759 TR-type events were detected throughout the month. Nighttime crater incandescence persisted and was visible in the degassing column. Sulfur dioxide data was obtained using Differential Absorption Optical Spectroscopy Equipment (DOAS) that showed an average value of 1,450 ± 198 tons per day (t/d) during 1-15 April and 1,129 ± 201 t/d during 16-30 April, with a maximum daily value of 2,784 t/d on 9 April. Gas-and-steam emissions of variable intensities rose above the active crater as high as 1.3 km above the crater on 13 April. Strombolian explosions were not observed and there was a slight decrease in the lava lake level.
There were 14,123 LP-type events and 727 TR-type events detected during May. According to sulfur dioxide measurements taken with DOAS equipment, the active crater emitted an average value of 1,826 ± 482 t/d during 1-15 May and 912 ± 41 t/d during 16-30 May, with a daily maximum value of 5,155 t/d on 13 May. Surveillance cameras showed continuous white gas-and-steam emissions that rose as high as 430 m above the crater on 27 May. Nighttime incandescence illuminated the gas column less than 300 m above the crater rim was and no pyroclastic emissions were reported. A landslide was identified on 13 May on the E flank of the volcano 50 m from the crater rim and extending 300 m away; SERNAGEOMIN noted that this event may have occurred on 12 May. During the morning of 27 and 28 May minor Strombolian explosions characterized by incandescent ejecta were recorded at the crater rim; the last reported Strombolian explosions had occurred at the end of March.
Seismic activity during June consisted of five volcano-tectonic (VT)-type events, 21,606 LP-type events, and 2,085 TR-type events. The average value of sulfur dioxide flux obtained by DOAS equipment was 1,420 ± 217 t/d during 1-15 June and 2,562 ± 804 t/d, with a maximum daily value of 4,810 t/d on 17 June. White gas-and-steam emissions rose less than 480 m above the crater; frequent nighttime crater incandescence was reflected in the degassing plume. On 12 June an emission rose 100 m above the crater and drifted NNW. On 15 June one or several emissions resulted in ashfall to the NE as far as 5.5 km from the crater, based on a Skysat satellite image. Several Strombolian explosions occurred within the crater; activity on 15 June was higher energy and ejected blocks 200-300 m on the NE slope. Surveillance cameras showed white gas-and-steam emissions rising 480 m above the crater on 16 June. On 19 and 24 June low-intensity Strombolian activity was observed, ejecting material as far as 200 m from the center of the crater to the E.
During July, seismicity included 29,319 LP-type events, 3,736 TR-type events, and two VT-type events. DOAS equipment recorded two days of sulfur dioxide emissions of 4,220 t/d and 1,009 t/d on 1 and 13 July, respectively. Constant nighttime incandescence was also recorded and was particularly noticeable when accompanied by eruptive columns on 12 and 16 July. Minor explosive events were detected in the crater. According to Skysat satellite images taken on 12, 13, and 16 July, ashfall deposits were identified 155 m S of the crater. According to POVI, incandescence was visible from two vents on the crater floor around 0336 on 12 July. Gas-and-ash emissions rose as high as 1.2 km above the crater on 13 July and drifted E and NW. A series of gas-and-steam pulses containing some ash deposited material on the upper E flank around 1551 on 13 July. During 16-31 July, average sulfur dioxide emissions of 1,679 ± 406 t/d were recorded, with a maximum daily value of 2,343 t/d on 28 July. Fine ash emissions were also reported on 16, 17, and 23 July.
Seismicity persisted during August, characterized by 27,011 LP-type events, 3,323 TR-type events, and three VT-type events. The average value of sulfur dioxide measurements taken during 1-15 August was 1,642 ± 270 t/d and 2,207 ± 4,549 t/d during 16-31 August, with a maximum daily value of 3,294 t/d on 27 August. Nighttime crater incandescence remained visible in degassing columns. White gas-and-steam emissions rose 480 m above the crater on 6 August. According to a Skysat satellite image from 6 August, ash accumulation was observed proximal to the crater and was mainly distributed toward the E slope. White gas-and-steam emissions rose 320 m above the crater on 26 August. Nighttime incandescence and Strombolian activity that generated ash emissions were reported on 27 August.
Seismicity during September was characterized by five VT-type events, 12,057 LP-type events, and 2,058 TR-type events. Nighttime incandescence persisted. On 2 September an ash emission rose 180 m above the crater and drifted SE at 1643 (figure 125) and a white gas-and-steam plume rose 320 m above the crater. According to the Buenos Aires VAAC, periods of continuous gas-and-ash emissions were visible in webcam images from 1830 on 2 September to 0110 on 3 September. Strombolian activity was observed on 2 September and during the early morning of 3 September, the latter event of which generated an ash emission that rose 60 m above the crater and drifted 100 m from the center of the crater to the NE and SW. Ashfall was reported to the SE and S as far as 750 m from the crater. The lava lake was active during 3-4 September and lava fountaining was visible for the first time since 26 March 2023, according to POVI. Fountains captured in webcam images at 2133 on 3 September and at 0054 on 4 September rose as high as 60 m above the crater rim and ejected material onto the upper W flank. Sulfur dioxide flux of 1,730 t/d and 1,281 t/d was measured on 3 and 4 September, respectively, according to data obtained by DOAS equipment.
Strong Strombolian activity and larger gas-and-ash plumes were reported during 18-20 September. On 18 September activity was also associated with energetic LP-type events and notable sulfur dioxide fluxes (as high as 4,277 t/d). On 19 September Strombolian activity and incandescence were observed. On 20 September at 0914 ash emissions rose 50 m above the crater and drifted SSE, accompanied by Strombolian activity that ejected material less than 100 m SSE, causing fall deposits on that respective flank. SERNAGEOMIN reported that a Planet Scope satellite image taken on 20 September showed the lava lake in the crater, measuring 32 m x 35 m and an area of 0.001 km2. Several ash emissions were recorded at 0841, 0910, 1251, 1306, 1312, 1315, and 1324 on 23 September and rose less than 150 m above the crater. The sulfur dioxide flux value was 698 t/d on 23 September and 1,097 t/d on 24 September. On 24 September the Volcanic Alert Level (VAL) was raised to Orange (the third level on a four-color scale). SENAPRED maintained the Alert Level at Yellow (the middle level on a three-color scale) for the communities of Villarrica, Pucón (16 km N), Curarrehue, and Panguipulli.
During 24-25 September there was an increase in seismic energy (observed at TR-events) and acoustic signals, characterized by 1 VT-type event, 213 LP-type events, and 124 TR-type events. Mainly white gas-and-steam emissions, in addition to occasional fine ash emissions were recorded. During the early morning of 25 September Strombolian explosions were reported and ejected material 250 m in all directions, though dominantly toward the NW. On 25 September the average value of sulfur dioxide flux was 760 t/d. Seismicity during 25-30 September consisted of five VT-type events, 1,937 LP-type events, and 456 TR-type events.
During 25-29 September moderate Strombolian activity was observed and ejected material as far as the crater rim. In addition, ash pulses lasting roughly 50 minutes were observed around 0700 and dispersed ENE. During 26-27 September a TR episode lasted 6.5 hours and was accompanied by discrete acoustic signals. Satellite images from 26 September showed a spatter cone on the crater floor with one vent that measured 10 x 14 m and a smaller vent about 35 m NE of the cone. SERNAGEOMIN reported an abundant number of bomb-sized blocks up to 150 m from the crater, as well as impact marks on the snow, which indicated explosive activity. A low-altitude ash emission was observed drifting NW around 1140 on 28 September, based on webcam images. Between 0620 and 0850 on 29 September an ash emission rose 60 m above the crater and drifted NW. During an overflight taken around 1000 on 29 September scientists observed molten material in the vent, a large accumulation of pyroclasts inside the crater, and energetic degassing, some of which contained a small amount of ash. Block-sized pyroclasts were deposited on the internal walls and near the crater, and a distal ash deposit was also visible. The average sulfur dioxide flux measured on 28 September was 344 t/d. Satellite images taken on 29 September ashfall was deposited roughly 3 km WNW from the crater and nighttime crater incandescence remained visible. The average sulfur dioxide flux value from 29 September was 199 t/d. On 30 September at 0740 a pulsating ash emission rose 1.1 km above the crater and drifted NNW (figure 126). Deposits on the S flank extended as far as 4.5 km from the crater rim, based on satellite images from 30 September.
Infrared MODIS satellite data processed by MIROVA (Middle InfraRed Observation of Volcanic Activity) showed intermittent thermal activity during April through September, with slightly stronger activity detected during late September (figure 127). Small clusters of thermal activity were detected during mid-June, early July, early August, and late September. According to the MODVOLC thermal alert system, a total of four thermal hotspots were detected on 7 July and 3 and 23 September. This activity was also intermittently captured in infrared satellite imagery on clear weather days (figure 128).
Geologic Background. The glacier-covered Villarrica stratovolcano, in the northern Lakes District of central Chile, is ~15 km south of the city of Pucon. A 2-km-wide caldera that formed about 3,500 years ago is located at the base of the presently active, dominantly basaltic to basaltic andesite cone at the NW margin of a 6-km-wide Pleistocene caldera. More than 30 scoria cones and fissure vents are present on the flanks. Plinian eruptions and pyroclastic flows that have extended up to 20 km from the volcano were produced during the Holocene. Lava flows up to 18 km long have issued from summit and flank vents. Eruptions documented since 1558 CE have consisted largely of mild-to-moderate explosive activity with occasional lava effusion. Glaciers cover 40 km2 of the volcano, and lahars have damaged towns on its flanks.
Information Contacts: Servicio Nacional de Geología y Minería (SERNAGEOMIN), Observatorio Volcanológico de Los Andes del Sur (OVDAS), Avda Sta María No. 0104, Santiago, Chile (URL: http://www.sernageomin.cl/); Proyecto Observación Villarrica Internet (POVI) (URL: http://www.povi.cl/); Sistema y Servicio Nacional de Prevención y Repuesta Ante Desastres (SENAPRED), Av. Beauchef 1671, Santiago, Chile (URL: https://web.senapred.cl/); Buenos Aires Volcanic Ash Advisory Center (VAAC), Servicio Meteorológico Nacional-Fuerza Aérea Argentina, 25 de mayo 658, Buenos Aires, Argentina (URL: http://www.smn.gov.ar/vaac/buenosaires/inicio.php); MIROVA (Middle InfraRed Observation of Volcanic Activity), a collaborative project between the Universities of Turin and Florence (Italy) supported by the Centre for Volcanic Risk of the Italian Civil Protection Department (URL: http://www.mirovaweb.it/); Hawai'i Institute of Geophysics and Planetology (HIGP) - MODVOLC Thermal Alerts System, School of Ocean and Earth Science and Technology (SOEST), Univ. of Hawai'i, 2525 Correa Road, Honolulu, HI 96822, USA (URL: http://modis.higp.hawaii.edu/); Copernicus Browser, Copernicus Data Space Ecosystem, European Space Agency (URL: https://dataspace.copernicus.eu/browser/).
Merapi (Indonesia) — October 2023 Cite this Report
Merapi
Indonesia
7.54°S, 110.446°E; summit elev. 2910 m
All times are local (unless otherwise noted)
Frequent incandescent avalanches during April-September 2023
Merapi, located just north of the major city of Yogyakarta in central Java, Indonesia, has had activity within the last 20 years characterized by pyroclastic flows and lahars accompanying growth and collapse of the steep-sided active summit lava dome. The current eruption period began in late December 2020 and has more recently consisted of ash plumes, intermittent incandescent avalanches of material, and pyroclastic flows (BGVN 48:04). This report covers activity during April through September 2023, based on information from Balai Penyelidikan dan Pengembangan Teknologi Kebencanaan Geologi (BPPTKG), the Center for Research and Development of Geological Disaster Technology, a branch of PVMBG which specifically monitors Merapi. Additional information comes from the Pusat Vulkanologi dan Mitigasi Bencana Geologi (PVMBG, also known as Indonesian Center for Volcanology and Geological Hazard Mitigation, CVGHM), MAGMA Indonesia, the Darwin Volcanic Ash Advisory Centre (VAAC), and various satellite data.
Activity during April through September 2023 primarily consisted of incandescent avalanches of material that mainly affected the SW and W flanks and traveled as far as 2.3 km from the summit (table 25) and white gas-and-steam emissions that rose 10-1,000 m above the crater.
Table 25. Monthly summary of avalanches and avalanche distances recorded at Merapi during April through September 2023. The number of reported avalanches does not include instances where possible avalanches were heard but could not be visually confirmed as a result of inclement weather. Data courtesy of BPPTKG (April-September 2023 daily reports).
| Month |
Average number of avalanches per day |
Distance avalanches traveled (m) |
| Apr 2023 |
19 |
1,200-2,000 |
| May 2023 |
22 |
500-2,000 |
| Jun 2023 |
18 |
1,200-2,000 |
| Jul 2023 |
30 |
300-2,000 |
| Aug 2023 |
25 |
400-2,300 |
| Sep 2023 |
23 |
600-2,000 |
BPPTKG reported that during April and May white gas-and-steam emissions rose 10-750 m above the crater, incandescent avalanches descended 500-2,000 m on the SW and W flanks (figure 135). Cloudy weather often prevented clear views of the summit, and sometimes avalanches could not be confirmed. According to a webcam image, a pyroclastic flow was visible on 17 April at 0531. During the week of 28 April and 4 May a pyroclastic flow was reported on the SW flank, traveling up to 2.5 km. According to a drone overflight taken on 17 May the SW lava dome volume was an estimated 2,372,800 cubic meters and the dome in the main crater was an estimated 2,337,300 cubic meters.
During June and July similar activity persisted with white gas-and-steam emissions rising 10-350 m above the crater and frequent incandescent avalanches that traveled 300-2,000 m down the SW, W, and S flanks (figure 136). Based on an analysis of aerial photos taken on 24 June the volume of the SW lava dome was approximately 2.5 million cubic meters. A pyroclastic flow was observed on 5 July that traveled 2.7 km on the SW flank. According to the Darwin VAAC multiple minor ash plumes were identified in satellite images on 19 July that rose to 3.7 km altitude and drifted S and SW. During 22, 25, and 26 July a total of 17 avalanches descended as far as 1.8 km on the S flank.
Frequent white gas-and-steam emissions continued during August and September, rising 10-450 m above the crater. Incandescent avalanches mainly affected the SW and W flanks and traveled 400-2,300 m from the vent (figure 137). An aerial survey conducted on 10 August was analyzed and reported that estimates of the SW dome volume was 2,764,300 cubic meters and the dome in the main crater was 2,369,800 cubic meters.
Frequent and moderate-power thermal activity continued throughout the reporting period, according to a MIROVA (Middle InfraRed Observation of Volcanic Activity) analysis of MODIS satellite data (figure 138). There was an increase in the number of detected anomalies during mid-May. The MODVOLC thermal algorithm recorded a total of 47 thermal hotspots: six during April, nine during May, eight during June, 15 during July, four during August, and five during September. Some of this activity was captured in infrared satellite imagery on clear weather days, sometimes accompanied by incandescent material on the SW flank (figure 139).
Geologic Background. Merapi, one of Indonesia's most active volcanoes, lies in one of the world's most densely populated areas and dominates the landscape immediately north of the major city of Yogyakarta. It is the youngest and southernmost of a volcanic chain extending NNW to Ungaran volcano. Growth of Old Merapi during the Pleistocene ended with major edifice collapse perhaps about 2,000 years ago, leaving a large arcuate scarp cutting the eroded older Batulawang volcano. Subsequent growth of the steep-sided Young Merapi edifice, its upper part unvegetated due to frequent activity, began SW of the earlier collapse scarp. Pyroclastic flows and lahars accompanying growth and collapse of the steep-sided active summit lava dome have devastated cultivated lands on the western-to-southern flanks and caused many fatalities.
Information Contacts: Balai Penyelidikan dan Pengembangan Teknologi Kebencanaan Geologi (BPPTKG), Center for Research and Development of Geological Disaster Technology (URL: http://merapi.bgl.esdm.go.id/, Twitter: @BPPTKG); MAGMA Indonesia, Kementerian Energi dan Sumber Daya Mineral (URL: https://magma.esdm.go.id/v1); Pusat Vulkanologi dan Mitigasi Bencana Geologi (PVMBG, also known as Indonesian Center for Volcanology and Geological Hazard Mitigation, CVGHM), Jalan Diponegoro 57, Bandung 40122, Indonesia (URL: http://www.vsi.esdm.go.id/); Darwin Volcanic Ash Advisory Centre (VAAC), Bureau of Meteorology, Northern Territory Regional Office, PO Box 40050, Casuarina, NT 0811, Australia (URL: http://www.bom.gov.au/info/vaac/); MIROVA (Middle InfraRed Observation of Volcanic Activity), a collaborative project between the Universities of Turin and Florence (Italy) supported by the Centre for Volcanic Risk of the Italian Civil Protection Department (URL: http://www.mirovaweb.it/); Hawai'i Institute of Geophysics and Planetology (HIGP) - MODVOLC Thermal Alerts System, School of Ocean and Earth Science and Technology (SOEST), Univ. of Hawai'i, 2525 Correa Road, Honolulu, HI 96822, USA (URL: http://modis.higp.hawaii.edu/); Copernicus Browser, Copernicus Data Space Ecosystem, European Space Agency (URL: https://dataspace.copernicus.eu/browser/); Øystein Lund Andersen (URL: https://www.oysteinlundandersen.com/, https://twitter.com/oysteinvolcano).
Ebeko
Russia
50.686°N, 156.014°E; summit elev. 1103 m
All times are local (unless otherwise noted)
Moderate explosive activity with ash plumes continued during June-November 2023
Ebeko, located on the N end of Paramushir Island in Russia’s Kuril Islands just S of the Kamchatka Peninsula, consists of three summit craters along a SSW-NNE line at the northern end of a complex of five volcanic cones. Observed eruptions date back to the late 18th century and have been characterized as small-to-moderate explosions from the summit crater, accompanied by intense fumarolic activity. The current eruptive period began in June 2022, consisting of frequent explosions, ash plumes, and thermal activity (BGVN 47:10, 48:06). This report covers similar activity during June-November 2023, based on information from the Kamchatka Volcanic Eruptions Response Team (KVERT) and satellite data.
Moderate explosive activity continued during June-November 2023 (figures 50 and 51). According to visual data from Severo-Kurilsk, explosions sent ash 2-3.5 km above the summit (3-4.5 km altitude) during most days during June through mid-September. Activity after mid-September was slightly weaker, with ash usually reaching less than 2 km above the summit. According to KVERT the volcano in October and November was, with a few exceptions, either quiet or obscured by clouds that prevented satellite observations. KVERT issued Volcano Observatory Notices for Aviation (VONA) on 8 and 12 June, 13 and 22 July, 3 and 21 August, and 31 October warning of potential aviation hazards from ash plumes drifting 3-15 km from the volcano. Based on satellite data, KVERT reported a persistent thermal anomaly whenever weather clouds permitted viewing.
Geologic Background. The flat-topped summit of the central cone of Ebeko volcano, one of the most active in the Kuril Islands, occupies the northern end of Paramushir Island. Three summit craters located along a SSW-NNE line form Ebeko volcano proper, at the northern end of a complex of five volcanic cones. Blocky lava flows extend west from Ebeko and SE from the neighboring Nezametnyi cone. The eastern part of the southern crater contains strong solfataras and a large boiling spring. The central crater is filled by a lake about 20 m deep whose shores are lined with steaming solfataras; the northern crater lies across a narrow, low barrier from the central crater and contains a small, cold crescentic lake. Historical activity, recorded since the late-18th century, has been restricted to small-to-moderate explosive eruptions from the summit craters. Intense fumarolic activity occurs in the summit craters, on the outer flanks of the cone, and in lateral explosion craters.
Information Contacts: Kamchatka Volcanic Eruptions Response Team (KVERT), Far Eastern Branch, Russian Academy of Sciences, 9 Piip Blvd., Petropavlovsk-Kamchatsky, 683006, Russia (URL: http://www.kscnet.ru/ivs/kvert/).
Search Bulletin Archive by Publication Date
Select a month and year from the drop-downs and click "Show Issue" to have that issue displayed in this tab.
The default month and year is the latest issue available.
Bulletin of the Global Volcanism Network - Volume 29, Number 11 (November 2004)
Managing Editor: Richard Wunderman
Cotopaxi (Ecuador)
Seismically quiet in January-April 2004; planning for emergency water supplies
Erta Ale (Ethiopia)
On 4-5 December 2004 visitors noted active hornitos but solidified lava lake
False Reports (Unknown)
Andaman Islands: False reports of eruptions and confusion following the M 9 earthquake
Fuego (Guatemala)
Explosions and lava flows continued in November-December 2003
Ijen (Indonesia)
News report cites increased activity beginning on 17 June 2004
Manam (Papua New Guinea)
Vigorous late-2004 eruptions cause 5 deaths and lead to large evacuations
Reventador (Ecuador)
Late 2004 visits find renewed venting and thick intracaldera lava flows 2 km long
Soputan (Indonesia)
12 December eruption covered villages with ash up to 2 cm thick
Cotopaxi (Ecuador) — November 2004 Cite this Report
Cotopaxi
Ecuador
0.677°S, 78.436°W; summit elev. 5911 m
All times are local (unless otherwise noted)
Seismically quiet in January-April 2004; planning for emergency water supplies
Seismicity at Cotopaxi during December 2003 through December 2004 yielded averages that generally remained within normal levels (table 3). Steam emissions continued, and sulfurous odors were occasionally reported. A plot of total seismicity each week during 2001-July 2004 portrayed numerous peaks and valleys in the range 50-200 events per week. Occasional excursions took the weekly totals to several hundred events in late 2001 and early 2002 (peaking at over 700 events per week during mid-October 2001). The 2004 data lacked such dramatic excursions.
Table 3. Annual summaries showing typical daily averages of various kinds of seismicity at Cotopaxi during 2001-2004. Courtesy of IG (shown on their website in the January 2005 report).
| Year |
Volcano-tectonic |
Hybrid |
Long-period |
Tornillo |
Tremor |
Total |
| 2001 |
3.1 |
1.0 |
10.2 |
0.1 |
0.2 |
11.3 |
| 2002 |
2.9 |
3.0 |
14.6 |
0.1 |
0.4 |
18.2 |
| 2003 |
1.2 |
3.7 |
9.3 |
0.0 |
1.4 |
14.2 |
| 2004 |
0.41 |
3.59 |
11.10 |
0.0 |
1.56 |
15.11 |
Planning for emergency water supplies. Although seismicity and other monitored parameters were moderate to low during most of 2003 (BGVN28:11 and 28:12), local authorities worked on a contingency plan for emergency drinking water in the event of a crisis at Cotopaxi.
The Quito metropolitan sanitation and drinking water company (EMAAP-Q) prepared a contingency plan for residents around Cotopaxi. The challenge was to provide for sufficient amounts of potable and sanitation water for some half a million people in the event of an eruption that contaminates their normal water supplies. This contingency plan was drawn up using experience gained from the operational emergency plan used to recover from the eruption in 1998-99 and the Reventador eruption in 2002.
During the Guagua Pichincha eruption, pyroclastic material impacted Quito, and ash fell into the water treatment plants and threatened the water supply systems. EMAAP-Q developed an operational and emergency plan. The plan was tested in 1999 when the volcano had two major eruptions that heat dropped ash on Quito and its infrastructure.
Geologic Background. The symmetrical, glacier-covered, Cotopaxi stratovolcano is Ecuador's most well-known volcano and one of its most active. The steep-sided cone is capped by nested summit craters, the largest of which is about 550 x 800 m in diameter. Deep valleys scoured by lahars radiate from the summit of the andesitic volcano, and large andesitic lava flows extend to its base. The modern edifice has been constructed since a major collapse sometime prior to about 5,000 years ago. Pyroclastic flows (often confused in historical accounts with lava flows) have accompanied many explosive eruptions, and lahars have frequently devastated adjacent valleys. Strong eruptions took place in 1744, 1768, and 1877. Pyroclastic flows descended all sides of the volcano in 1877, and lahars traveled more than 100 km into the Pacific Ocean and western Amazon basin. Smaller eruptions have been frequent since that time.
Information Contacts: Geophysical Institute (IG), Escuela Politécnica Nacional, Apartado 17-01-2759, Quito, Ecuador (URL: http://www.igepn.edu.ec/).
Erta Ale (Ethiopia) — November 2004 Cite this Report
Erta Ale
Ethiopia
13.601°N, 40.666°E; summit elev. 585 m
All times are local (unless otherwise noted)
On 4-5 December 2004 visitors noted active hornitos but solidified lava lake
Two teams sent reports on Erta Ale's behavior in December 2004. On 1-5 December the visiting team included Jacques-Marie Bardintzeff and a group from Ushuaia Nature, and on 4-5 December the team consisted of the volcanology travel group SVE-SVG. Both groups submitted similar reports and commented on substantial changes they observed compared to conditions described in past reports (most recently, BGVN 29:08). Although Erta Ale frequently contains a lava lake with an open surface of molten lava, that was not the case this time.
The lava lake's surface had chilled within the small (~ 200-m-diameter) S pit crater (figure 14). A solidified lava crust covered the crater floor. The crust's surface sat ~ 15 m below the W crater rim, and ~ 30 m below the E crater rim. On top of this crust stood four coalesced hornitos in the SE part of the S crater (figure 10). They were ~ 10 m high and represented the only portion of the crust where molten material was in evidence. Two hornitos emitted high temperature (more than 500°C) SO2-rich gas. Another hornito contained glowing molten lava. During the night of 4 December the SVE-SVG group saw degassing and incandescent lava at the summit of two of these hornitos. Bardintzeff described sampling molten material from 12 m depth, in one of the hornitos using a cable and an iron mass (figure 15).
The SVE-SVG team noted recent activity within the North crater, where an uplifted area termed a 'lava bulge' had solidified. It covered ~80% of the crater floor and rose to about 20-25 m below the crater rim. In the lava bulge's central area, strong and noisy degassing of SO2 spouted from several small hornitos. At the bulge's periphery the observers saw ten small incandescent vents. Subsequently, two plumes rose above the volcano.
Geologic Background. The Erta Ale basaltic shield volcano in Ethiopia has a 50-km-wide edifice that rises more than 600 m from below sea level in the Danakil depression. The volcano includes a 0.7 x 1.6 km summit crater hosting steep-sided pit craters. Another larger 1.8 x 3.1 km wide depression elongated parallel to the trend of the Erta Ale range is located SE of the summit and is bounded by curvilinear fault scarps on the SE side. Basaltic lava flows from these fissures have poured into the caldera and locally overflowed its rim. The summit caldera usually also holds at least one long-term lava lake that has been active since at least 1967, and possibly since 1906. Recent fissure eruptions have occurred on the N flank.
Information Contacts: Jacques-Marie Bardintzeff, Laboratoire de Pétrographie-Volcanologie, Bât. 504, Université Paris-Sud, F-91405, Orsay, France (URL: http://www.lave-volcans.com/bardintzeff.html); Henry Gaudru, Société Volcanologique Européenne (SVE), C.P.1-1211 Geneva 17- Switzerland (URL: http://www.sveurop.org/).
False Reports (Unknown) — November 2004 Cite this Report
False Reports
Unknown
Unknown, Unknown; summit elev. m
All times are local (unless otherwise noted)
Andaman Islands: False reports of eruptions and confusion following the M 9 earthquake
False reports of volcanism surfaced describing eruptions at Barren Island and Narcondum volcanoes (figure 1) following the 26 December 2004, M 9 earthquake off the W coast of northern Sumatra. Clarification was provided by Dornadula Chandrasekharam of the Indian Institute of Technology. He reported an absence of volcanic activity at these volcanoes, and at Sumatran volcanoes, as recently as 4 January 2005.
The erroneous accounts were discovered by Chandrasekharam while watching television news. He immediately contacted people in the Andaman region. Upon learning that these reports were incorrect, he contacted media sources and the Global Volcanism Network. Many Indian news sources that proclaimed eruptions at Barren Island later withdrew their reports. The erroneous information prevailed for a day to perhaps a week, although non-Indian news agencies were slower to recognize and acknowledge the error.
Regional tectonic setting. Figure 2 illustrates the rudiments of the regional tectonic setting, including the primary M 9 earthquake and aftershocks for the next 10 days. The tectonic reconstructions are far more complex than shown here, and the details are variously interpreted.
In terms of local time (in the Andaman Islands and India, i.e. India Standard Time), the epicenters shown occurred during the time interval 06:28:53 on 26 December to about 06:57 on 6 January. (In terms of UTC, this represents the interval 00:58:53 on 25 December to about 19:57 on 5 January 2004). This digital map was extracted by applying a video simulation of epicenters with time (Jones and others, 2002) to the recent seismic data.
The figure shows two prominent curving tectonic features crossing both Java-Sumatra and the Andaman Sea (the Nicobar and Andaman Islands region). One such curving feature is the volcanic front, on which lie all the active volcanoes of Java and Sumatra, and farther N, Barren Island and Narcondam. Outboard of that (to the W) is the second curving feature, the Sunda trench and islands adjacent to it (the Andaman Islands, and islands to the W of northern Sumatra hard-hit by the M 9 earthquake and tsunami). The trench reflects the sea-floor expression of the subduction zone, and represents the region where the M 9 earthquake occurred. The offset, often termed a 'megathrust,' involved 1,200 km of rupture along the subduction zone, and suddenly shifted the Indian Ocean's floor ~15 m towards Sumatra (Hopkin, 2005).
Regarding the M 9 earthquake, according to the USGS, the local time and date in terms of local time in N Sumatra at the epicenter was Sunday, 26 December 2004 at 07:58:53 (i.e., roughly 8 am). The USGS provided a table showing the time of the main shock in a variety of time zones.
Some excellent tutorials have provided background on the tectonic setting, the earthquake, and the tsunami. These have appeared in the press and on the web (eg. Sieh, 2004, 2005; NOAA, http://www.noaa.gov/tsunamis.html). Although large earthquakes may trigger volcanism (Linde and Sacks, 1998), so far this does not appear to be the case, at least at the volcanoes of Barren Island and Narcondum.
Mud volcanoes and ensuing confusion. Post-earthquake reports of active 'mud volcanoes' in the Andaman Islands caused panic and confusion in the region, and came at a particularly bad time. Chandrasekharam pointed out that in Andaman, like many other arc provinces, several mud volcanoes are present. These are not real volcanoes in the usual sense, but because they may build a small, low-profile cone of local extent around the hole through which the mud is thrown out, they are known as mud volcanoes (figure 3).
Some of the difficulty with the news reports was that the mud volcanoes' locations, numbers, and impacts remained vague, and that Barren Island became intertwined with story. An extreme example came from an irresponsible report in the tabloid India Daily(2 January 2005), which contained the title "Volcano[es] Barren-1 and Narcondam erupt in Andaman—Seismic disturbance can cause more tsunami." It continued with wild claims such as, "Severe seismic activities are seen in these islands... personnel who have reached these remote areas are facing shattering earth vibrations and high waves," and "Some scientists are predicting severe earthquake again in the North of Andaman Nicobar Islands. The effect can be severe on Myanmar, Andaman, Indi[a]'s east coast, Bangladesh and Sumatra...." They added, "Andaman's tribals strangely are unaffected as most of them somehow went [to] higher ground before the tsunami. So did the animals." Science journalism clearly has a lot to compete with (see Oldenburg, 2005, for more discussion of these topics).
One alleged mud volcano 'Barren-1' has a name so close to the volcano's name (Barren Island) that it was frequently confused. The mud volcano's name (if there is one) appears to be absent from the technical literature at the Geological Survey of India's website.
On a positive note, one mud volcano received consistent mention in a number of news articles and provided coverage generally congruent with geological data posted by the Geological Survey of India. According to an article in India News(with the leader, "Port Blair, 30 December"), "A mud volcano at the inhabited Baratang Island in Middle Andaman has erupted but the administration said there was no cause for concern. 'Mud keeps bubbling in the volcano, but on December 28, the eruption was up to three meters and there was considerable heat,' Inspector General of Police S. B. Deol said here."
"He [also] said the mud volcano was located on one side of the Baratang Island, which was about 100 km from Port Blair. People live on the other side, but there is no cause for concern."
A report in the India Dailywas nearly identical. Details on a Geological Survey of India website noted that the Baratang mud volcano began erupting on 27 December 2003 (figure 3 and caption). Mud volcanoes may have also occurred elsewhere in the region, but the available news reports consistently failed to disclose locations.
Often associated with active faults and with petroleum fields, mud volcanoes on land consist of low-lying surface mud extrusions that vary in size from meters to several kilometers across. They emit mud at temperatures significantly below magmatic, which are typically at least 800°C. Eruptions from mud volcanoes can reach heights of several hundred meters and consist of mud, fluids and gases, and sometimes burning hydrocarbons. Although in submarine environments mud volcanoes can be extensive, deadly mud volcano eruptions are extremely rare because their eruptions seldom move far enough to affect large areas of the land surface. Their greatest danger may be to curious onlookers who venture too close.
References.Jones, A., Siebert, L., Kimberly, P., and Luhr, J.F., 2002, Earthquakes and Eruptions, v. 2.0 (CD-ROM): Smithsonian Institution, Global Volcanism Program, Digital Information Series, GVP-2.
Hopkin, M., 2005, Triple slip of tectonic plates caused seafloor surge: Nature, v. 433, no. 3 (06 Jan 2005).
Linde, A.T., and Sacks, I.S., 1998, Triggering of volcanic eruptions: Nature, v. 395, p. 888-890.
Oldenburg, D., 2005, A sense of doom: Animal instinct for disaster—Scientists investigate wildlife's possible warning systems: The Washington Post (8 January 2005), p. C1, C3 (URL: http://www.washingtonpost.com/).
Sieh, K., 2004, The science behind the Aceh earthquake: Caltech Media Relations (30 December 2004), (URL: http://pr.caltech.edu/media/Press_Releases/PR12628.html).
Sieh, K., 2005, In Sumatra: Notes From a Geologist in the Field: Caltech Today (1 January 2005, URL: http://today.caltech.edu/today/).
U.S. National Earthquake Information Center (NEIC) (URL: https://earthquake.usgs.gov)./
U.S. National Oceanic and Atmospheric Administration (NOAA) (URL: http://www.noaa.gov/tsunamis.html).
Geologic Background. False or otherwise incorrect reports of volcanic activity.
Information Contacts: Dornadula Chandrasekharam, Department of Earth Sciences, Indian Institute of Technology, Bombay 400076, India; India News (URL: http://news.newkerala.com/india-news/); India Daily (URL: http://www.indiadaily.com/); The Washington Post, Washington DC, USA (URL: https://www.washingtonpost.com/); Geological Survey of India, 27 Jawaharlal Nehru road, Kolkata (Calcutta) 700016, India.
Fuego (Guatemala) — November 2004 Cite this Report
Fuego
Guatemala
14.4748°N, 90.8806°W; summit elev. 3799 m
All times are local (unless otherwise noted)
Explosions and lava flows continued in November-December 2003
Explosions and lava flows at Fuego continued after October 2003 (BGVN28:10). Similar activity prevailed through 2003 and 2004. This report discusses events during November-December 2003 and includes a table summarizing Fuego's 2003 behavior (table 3). A future report will discuss 2004 activity and will include a map showing critical place names. Several pyroclastic flows occurred in 2003.
Table 3. Representative examples of reported volcanism at Fuego during 2003. Courtesy of INSIVUMEH.
| Date |
Lava flows, incandescent avalanches, and pyroclasticflows (PFs) |
Ash column and ashfall |
Data source(s) |
| 08 Jan 2003 |
Lava flows. Two PFs (down Sta. Teresa drainage). |
Steam-and-ash to ~5.7 km a.s.l., drifted W. |
INSIVUMEH, CONRED, Washington VAAC, EFE via COMTEX, Prensa Libra |
| Mid Jan 2003 |
Incandescent avalanches down flanking canyons. |
~2 km above summit, drifting S and SW, depositing fine ash. |
INSIVUMEH, Washington VAAC |
| 28 Apr-01 May 2003 |
Incandescent avalanches. |
Intermittent ash eruptions, One ash plume reached ~7 km a.s.l., blown SW at 20-30 km/hour; some puffs visible over the coast. |
INSIVUMEH, Washington VAAC, US Air Force Weather Agency |
| 29 Jun 2003 |
Lava flows and avalanches down E flank (incandescence seen from city of Antigua and the coast). PFs extended ~1.5 km down the W flank. |
Ash fell in villages to W and SE; Ash clouds to ~900 m. |
INSIVUMEH |
| 09 Jul 2003 |
Lava dome collapse PFs. |
Strong explosions sent ash to ~2 km above summit; ash fell to W and SE of summit. |
Washington VAAC, Prensa Libre |
| 07 Aug 2003 |
-- |
A small ash emission seen on satellite imagery. The ash cloud drifted NW and covered an area about 3.5 x 3.5 km. |
Washington VAAC |
| 08 Sep 2003 |
-- |
Ash plumes; one drifted S and covered an area of 5 x 5 km; another rose to ~6 km a.s.l. |
Washington VAAC |
| 09 Oct 2003 |
-- |
A pilot saw Fuego ash reaching ~4.6 a.s.l. No ash was visible on satellite imagery. |
Washington VAAC |
| 17 Oct 2003 |
Small incandescent avalanche down the Sta. Teresa valley. |
A 33-minute-long eruption sent a gas-and-ash plume to ~1.5 km above the crater. |
INSIVUMEH |
| Nov-Dec 2003 |
Incandescent avalanches. |
4 November explosions threw material 150 m above crater rim; 18-19 November, gas-and-ash plumes up to 1.2 km above the crater; 28 Nov-1 Dec, 700-900 m above the crater; 7-9 December, 500 m above crater; 10-16 December, 200-1000 m above the crater, and 18-22 and 30 December, 'low-level plumes.' |
INSIVUMEH |
Tremor was common and at times abundant during 2003, including in the last two months of the year. On 21 November, almost continuous harmonic tremor was detected for a span of 21 hours. On 23 November intervals of tremor lasted between 0.5 and 3 hours.
The Washington VAAC archive contains 48 ash advisories on Fuego. The number of these advisories were as follows, during the stated months of 2003: 14 advisories in January (on the 8th, 9th, 11th, 12th, and 20th); 11 in April (on the 17th, 28th, 29th, and 30th); eight in May (1st and 2nd); three in June (30th), six in July (1st, 9th, and 10th), two in August (7th), two in September (29th); and two in October (9th). The most impressive plumes depicted in satellite-based graphics were for 28 April-1 May 2003, when they often stretched well out to sea, reaching ~ 160 km SW from Fuego. Otherwise, the graphics generally depicted much smaller plumes, in some cases very local ones. The graphic for 28 September showed small plumes from Fuego as well as simultaneous ones from Pacaya and Santa María.
Geologic Background. Volcán Fuego, one of Central America's most active volcanoes, is also one of three large stratovolcanoes overlooking Guatemala's former capital, Antigua. The scarp of an older edifice, Meseta, lies between Fuego and Acatenango to the north. Construction of Meseta dates back to about 230,000 years and continued until the late Pleistocene or early Holocene. Collapse of Meseta may have produced the massive Escuintla debris-avalanche deposit, which extends about 50 km onto the Pacific coastal plain. Growth of the modern Fuego volcano followed, continuing the southward migration of volcanism that began at the mostly andesitic Acatenango. Eruptions at Fuego have become more mafic with time, and most historical activity has produced basaltic rocks. Frequent vigorous eruptions have been recorded since the onset of the Spanish era in 1524, and have produced major ashfalls, along with occasional pyroclastic flows and lava flows.
Information Contacts: Instituto Nacional de Sismologia, Vulcanologia, Meteorologia e Hidrologia (INSIVUMEH), Unit of Volcanology, Geologic Department of Investigation and Services, 7a Av. 14-57, Zona 13, Guatemala City, Guatemala (URL: http://www.insivumeh.gob.gt/); Washington Volcanic Ash Advisory Center (VAAC), Satellite Analysis Branch, NOAA/NESDIS E/SP23, NOAA Science Center Room 401, 5200 Auth Road, Camp Springs, MD 20746, USA (URL: http://www.ssd.noaa.gov/); Charles R. Holliday, Air Force Weather Agency, Offutt Air Force Base, Nebraska 68113 USA; Prensa Libre (newspaper), 13 calle 9-31 zona 1, 01001 Guatemala City, Guatemala (URL: http://www.prensalibre.com/).
Ijen (Indonesia) — November 2004 Cite this Report
Ijen
Indonesia
8.058°S, 114.242°E; summit elev. 2769 m
All times are local (unless otherwise noted)
News report cites increased activity beginning on 17 June 2004
The Chief of the local National Park has been quoted as having reported an increase in activity beginning on 17 June 2004. This resulted in closing the area to visitors. Reuters quotes him as having said "There have been sulfuric rocks coming out of the edge of the crater and the fluid in it (the crater lake) has turned from green to white and has emitted hot foam. There are also increasing tremors."
Geologic Background. The Ijen volcano complex at the eastern end of Java consists of a group of small stratovolcanoes constructed within the 20-km-wide Ijen (Kendeng) caldera. The north caldera wall forms a prominent arcuate ridge, but elsewhere the rim was buried by post-caldera volcanoes, including Gunung Merapi, which forms the high point of the complex. Immediately west of the Gunung Merapi stratovolcano is the historically active Kawah Ijen crater, which contains a nearly 1-km-wide, turquoise-colored, acid lake. Kawah Ijen is the site of a labor-intensive mining operation in which baskets of sulfur are hand-carried from the crater floor. Many other post-caldera cones and craters are located within the caldera or along its rim. The largest concentration of cones forms an E-W zone across the southern side of the caldera. Coffee plantations cover much of the caldera floor; nearby waterfalls and hot springs are tourist destinations.
Information Contacts: Reuters News Service.
Manam (Papua New Guinea) — November 2004 Cite this Report
Manam
Papua New Guinea
4.08°S, 145.037°E; summit elev. 1807 m
All times are local (unless otherwise noted)
Vigorous late-2004 eruptions cause 5 deaths and lead to large evacuations
Several periods of eruption took place on the island of Manam during the last months of 2004. Rabaul Volcano Observatory (RVO) noted outbursts during 24-31 October (BGVN 29:10), 10-12 November, and on 6 December. Several other plumes were noted as well. Satellite-based alerts (MODVOLC) were noteworthy during this interval, having been absent for over 9 months.
On 6 December, the newspaper The National reported that these eruptions had killed five people, whose deaths were primarily related to respiratory complications from inhaling volcanic material. Volcanic ash damaged crops, water supplies, and houses. News accounts discussed evacuations, with the possibility of evacuating all or most of the island (figure 12). The news also mentioned food shortages after the 24 October eruption.
The government of Papua New Guinea presented a new website, The National Disaster Center, which broadly disseminates government disaster information including volcano reports and updates (see URL under Information Contacts, below). The website contained a Manam hazards map. Other documents on that site noted shifting winds and the lack of a clearly safe area on the island during the late 2004 crisis. It said that the government would sponsor large-scale evacuations beginning on 27 November 2004.
The eruptive episode that began on 24 October continued at least a week (figure 13). By 31 October, the eruption at Main Crater consisted of Strombolian activity, with ash and scoria emissions. Tephra of ~ 1 cm diameter were deposited in Warisi village on the SE side of the island. Small pyroclastic flows were generated, and fresh lava flowed into the NE radial valley. The lava flow followed the Boakure side of the valley, covering older flows from the 1992-1994 eruption. Beginning on the morning of the 31st, the amount of continuous volcanic tremor increased to moderate-to-high levels, so the Alert Level was increased from Stage 1 to Stage 2. Villagers were advised to remain away from Manam's four main radial valleys.
The Darwin Volcanic Ash Advisory Center reported the 24 October outburst (BGVN 29:11). On 31 October during 0813-1449 they noted a plume at ~ 13.7 km altitude drifting SE on visible satellite imagery. The Aviation Color Code was at Red, the highest level.
According to a news report, ". . . [~ 0.3 m] of ash with hot pumice" landed on the roofs of houses, and ash drifted as far W as Wewak, ~ 100 km away. Reportedly, ~ 4,000 villagers moved to safer areas.
On 2 November around 2325 a possible eruption may have produced a plume to ~ 7.6 km altitude, which drifted SE. Ash was visible on satellite imagery on 8 and 9 November at an altitude of ~ 3 km; on 9 November the plume extended, ~ 55 km to the NE.
A Strombolian eruption occurred during 10-11 November 2004. The ash column from the eruption was estimated to have risen ~ 5-6 km above the crater, and perhaps rose as high as ~ 9 km above the crater, according to an Air Niugini pilot. The activity was accompanied by continuous weak to moderate roaring and rumbling noises and frequent loud explosions. Light ash and scoria fall was reported near local villages. As of 2130 on 10 November ash reached 7 km altitude and 147 km to the SW. As of 12 November, the ash emissions reached 10 km altitude and extended laterally 74 km W to NW of the volcano.
During this reporting interval Darwin VAAC noted that a SE-drifting plume was visible on satellite imagery on 31 October during 0813-1449 at an altitude of ~ 13.7 km.
A satellite image from the Terra Moderate Resolution Imaging Spectroradiometer (MODIS) on 15 November shows a large brown ash plume blowing SW (figure 14).
According to RVO scientists, on 23-24 November Main Crater ejected glowing lava and discharged an ash cloud that rose ~ 10 km high. A lava flow was also reported to be heading for two villages on the island. At 1850 on 23 November, a phase of strong Strombolian eruption began producing a continuous, thick ash column that rose about 10 km above the summit. The ash cloud emissions were accompanied by projection of glowing lava fragments, loud roaring and rumbling noises, and occasional loud and banging noises that produced shock waves. A continuous bright red glow visible down the NE valley indicated emplacement of a lava flow.
The lava flow was reported heading NE towards villages of Kolang and Bokure 1. In addition to the lava, Manam emitted large rocks. Around this time the aviation red alert issued for aircraft noted that the ash plume extended 130 km SE of Manam.
Press accounts stated that emergency officials said an area was being cleared on the mainland for a possible full-scale evacuation of Manam's ~ 9,500 islanders. Evacuation was to become compulsory if activity intensified from Stage 3 (which was set by 22 November) to Stage 4. Some 20 bush homes had collapsed due to 'mud rain' (presumably, falling tephra), and five people had been injured.
RVO reported that a slight increase in eruptive activity from Main Crater began after 1600 on 26 November, which continued until 0800 on the 29th. Summit activity consisted of continuous forceful emission of thick dark gray ash clouds that rose less than 1 km above the summit before being blown NW. Fine ashfall to the NW at Zogari and Iassa villages was reported from about 1700. A single weak roar was heard between 0600 and 0700 on the 27th.
Seismicity was moderate to moderate-high at 2300 on the 26th and 0800 on the 27th. Volcanic tremors continued to be recorded suggesting the system remained dynamic and capable of ongoing variable eruptions, with sporadic more vigorous phases.
On 28-29 November, RVO reported that ash clouds were rising less than 1 km above the summit before being blown by the shifting NNE and NNW winds. Fine ashfall was reported at Warisi. Weak roaring noises were heard between 1900-2400 on the 28th. A weak glow with weak projections of incandescent lava fragments was visible during the night of the 28th, and Southern Crater released thin white vapor only.
Some press reports described 7,900 persons evacuated from Manam. According to the Planet Diary web site, about 9,000 people were evacuated by 1 December 2004 as the eruption grew more violent.
Mid-afternoon on 5 December RVO noted a slight change in activity at Southern Crater marked by commencement of sub-continuous weak to moderate roaring and rumbling noises. The noises continued until 1000 that day. As darkness fell, intervals of visibility occurred (eg., during 1800-1808, 2030-2108, and 2130-2200); observers saw sub-continuous lava fountaining. Meanwhile, from Main Crater there came a series of sub-continuous, forceful, moderately thick, gray-brown ash-laden clouds, which were occasionally visible above the weather clouds. The ash plume rose between about 600 and 900 m above the summit and drifted to the E and NE. Light ashfall and fine scoria fell at the villages Abaria and Bokure 1. Fluctuating audible noises consisted of low roars, 'jet engine' roars, and occasional still-louder roars. Although visibility was generally poor due to volcanic ash clouds from both craters, observers could still make out variable glow coming from the craters.
On 8 December 2004, The National reported that, according to RVO, Manam erupted starting on the morning of 6 December. Fist-sized scoria were thrown out of the vent into the air, hitting houses in the villages below. The eruption began at 0800 and peaked at 1150 with "seismicity continuing."
The National also reported that a pyroclastic flow occurred in the SE valley during the 6 December eruption, with ash and cloud directed NW. On the 6th, residents of Madang (~ 150 km E of Manam) described feeling tremor or ground motion; those in Wewak (~ 160 km to the W) reported similar sensations and also noted volcanically derived dust. Although ash from 6 December was apparently widespread, Googling for news of Manam ash in Irian Jaya failed to turn up any reports from there.
The Darwin VAAC reported ash plume sightings from satellites during 12-14 December, and the RVO reported moderate eruptions continuing in that period.
Fatalities. An article by Bonney Bonsella in The National showed pictures of Manam Islanders in evacuation. They waded through shallow surf to board through the open bow of a large beached landing craft. The article discussed fatalities during the eruption.
"The volcanic eruption on Manam Island in the Madang province has so far claimed five lives—two elderly women and three children between the ages of 5-13. The coordinator of the Manam evacuation exercise Camillus Dugumi confirmed the deaths, adding that the deaths were linked to respiratory complications resulting from inhaling volcanic ashes and dust. Mr Dugumi, who is also the district health programme manager, said one of the deaths was that of an elderly women from Bokure village recorded early last week at the Bogia District hospital. The women died after being admitted to the hospital for respiratory complications. One child, a little boy, died on Friday at the Asuramba care centre after suffering pneumonia."
"Three others—an adult women and two other children—had died during earlier volcanic activity on Manam."
Displaced residents. The above-mentioned article related that three State-owned plantations (called Asuramba, Potsdam, and Magem (and Daigul?)) were set aside, ". . . at least for the time being[,] to accommodate a speedy resettlement of the displaced Manam islanders." Another news article noted that these plantations are near the town of Bogia (figure 4). The National Disaster Center website noted that "The three plantations were bought off from the lessee in 1995 for K1.25 million following a National Executive Council decision for the purpose of resettlement of Manam Islanders displaced by volcanic activity." Controversies remain with respect to land issues. Still, that website noted that the long-term solution advocated by the President, Manam Local Level Government is to resettle the people of Manam on the mainland. For this purpose the Provincial Disaster Committee has identified State land to resettle the Manam Island people.
MODVOLC. The MODIS infrared instrument flown on the NASA Terra and Aqua satellites showed an impressive set of thermal alerts beginning 21 October 2004 (figure 15). Since the beginning of MODVOLC operations (BGVN 28:01) thermal alerts occurred at Manam during only two periods. The first, 7 April-21 May 2002, was related to increased Strombolian activity (BGVN 27:05). The second period, 21 October until at least 14 December 2004, was associated with the current crisis and was a time when alert ratios and summed radiances reached higher values than during the first period. These parameters are consistent with a highly active vent and/or lava flows, and in accord with vigorous Strombolian emissions seen in the field.
This analysis of MODIS thermal alerts (using the MODVOLC alert-detection algorithm) is based on data extracted from the MODIS Thermal Alerts website maintained by the University of Hawaii HIGP MODIS Thermal Alerts team.
Thermal alerts are based on an 'alert ratio,' and an alert is triggered whenever this ratio has a value more positive than -0.8. This threshold value was chosen empirically by inspection of images containing known volcanic sites at high temperature, and is the most negative value that avoids numerous false alarms. There are also some day-time alerts, which are based on the same algorithm but incorporating a correction for estimated solar reflection and a more stringent threshold whereby the alert ratio is required to be more positive than -0.6 in order to trigger an alert.
Geologic Background. The 10-km-wide island of Manam, lying 13 km off the northern coast of mainland Papua New Guinea, is one of the country's most active volcanoes. Four large radial valleys extend from the unvegetated summit of the conical basaltic-andesitic stratovolcano to its lower flanks. These valleys channel lava flows and pyroclastic avalanches that have sometimes reached the coast. Five small satellitic centers are located near the island's shoreline on the northern, southern, and western sides. Two summit craters are present; both are active, although most observed eruptions have originated from the southern crater, concentrating eruptive products during much of the past century into the SE valley. Frequent eruptions, typically of mild-to-moderate scale, have been recorded since 1616. Occasional larger eruptions have produced pyroclastic flows and lava flows that reached flat-lying coastal areas and entered the sea, sometimes impacting populated areas.
Information Contacts: Rabaul Volcano Observatory (RVO), P.O. Box 386, Rabaul, Papua New Guinea; National Disaster Centre, Department of Provincial Affairs and Local Level Government (Ministry of Inter-Government Relations), PO Box 4970, Boroko, National Capital District, Papua New Guinea (URL: http://www.pngndc.gov.pg/); David Innes, Flight Safety Office, Air Niugini; Andrew Tupper, Darwin Volcanic Ash Advisory Centre, Australian Bureau of Meteorology (URL: http://www.bom.gov.au/info/vaac); Jorgen Aabech, Skogbrynet 40B, N-1709 Sarpsborg, Norway (URL: http://www.vulkaner.no/); MODIS Thermal Alert System, Hawaii Institute of Geophysics and Planetology (HIGP), School of Ocean and Earth Science and Technology, University of Hawaii at Manoa (URL: http://modis.higp.hawaii.edu/); David Rothery and Charlotte Saunders, Department of Earth Sciences, The Open University, Milton Keynes, MK7 6AA, United Kingdom; Kevin Pamba and Bonney Bonsella, The National (URL: http://www.thenational.com.pg/).
Reventador (Ecuador) — November 2004 Cite this Report
Reventador
Ecuador
0.077°S, 77.656°W; summit elev. 3562 m
All times are local (unless otherwise noted)
Late 2004 visits find renewed venting and thick intracaldera lava flows 2 km long
A 16 December 2004 report from the Instituto Geofísico (IG) of the Escuela Politécnica Nacional calls attention to renewed lava effusion from the crater that lies within Reventador's large summit cone (figure 13). A block-lava flow escaped the cone's crater. It ran out at a breach in the S wall, and by 16 December it had advanced ~ 2 km farther. The flow advanced SE along a narrow, E-curving path, remaining atop lavas from 2002. Thus far in 2004, lava flows remained well within the larger caldera.
Reports in 2003 chiefly discussed events outside the caldera. A road, one gas pipeline, and two oil pipelines traverse Reventador's flanks 7 km ESE of the active vent. All of these installations were affected in 2003 (but not appreciably since then). The pipelines were destroyed due to heavy lahars coming down the Reventador river on 6 May 2003 (BGVN 28:06). Our last report (BGVN 28:11) discussed events during July through most of November 2003.
Lava venting in the crater likely began in early November 2004, a time when seismic station CONE registered dramatic increases in volcano-tectonic events (figure 14). In response to the elevated seismicity, the IG-EPN began more intensive monitoring, including overflights with thermal imaging, repeat visits to the remote volcano, and on 9 November 2004, installation of the additional short-period seismic station LAV3, ~ 2 km from the crater's vent.
A helicopter overflight by IG-EPN staff on 10 November 2004 confirmed the presence of a small lava dome, which appeared then to be confined to the crater floor. This feature was not present on photos taken during an IG overflight on 19 October 2004. During the 10 November overflight, a continuous 2.5 km-high gas column escaped from the crater, accompanied by sulfurous odors detected by personnel in the helicopter.
The date when lava began escaping the crater was not precisely known, but it was thought to have been around 22 November, coincident with the emergence of distinct seismic signals not previously observed at Reventador (figure 11). The signals occurred in swarms and consisted of low-frequency (1-10 Hz) waves of relatively low-amplitude. Their seismic records were emergent (i.e. growing in amplitude with time) and of long duration (up to 60 seconds). They are thought to have been possibly associated with rock falls from lava flowing down the cone's southern flank. As many as 200 of these events were recorded each day at station CONE.
A return visit to the crater rim on 28 November (this time on foot) documented abundant fresh lava in the crater (figure 15), a dramatic increase in the volume of lava there. At least 0.5 x 10⁶ m3 of new lava then covered the entire crater floor and appeared to be already flowing out of the southern breach and into the surrounding caldera. Because of cloudy weather, the exact extent of the flow remained indeterminate. The surface of this lava flow also extended to the N and reached a level ~ 20 m below the northern breach. Continuous lava extrusion or flowing or both were heard within the crater, making sounds akin to glass breaking, and vigorous roaring gas emissions originated from the crater's western margin. These gas emissions and other smaller fumaroles contributed to a plume that was continuously present, extending at least 1 km above the vent.
IG observers estimated that the total mid-December lava flow volume was ~ 3 x 10⁶ m3. The inferred 22 November date of flow onset would imply a steady-state extrusion rate of ~ 0.1 x 10⁶ m3 per day and a flow front advancing at ~ 80 m per day. These observations appear to conform with satellite thermal infrared observations, which noted no significant anomalies until the end of November, due presumably in large part to the lava being confined within the steep-walled crater. Inclement weather occurred and also may have impeded some of the satellite thermal observations.
The most recent visit to the crater rim, on 11 December 2004, traced the source of degassing and lava outflow to the most elevated portion of a small dome-like feature at the central western margin of the crater. Figure 16 shows how instrumentally aided nighttime incandescence observations disclosed both the vent area and surficial flow-textures extending S towards the southern breach of the cone. Figure 14 also documents a comparatively narrow arm of lava trending towards the cone's northern breach. Nighttime incandescence from the lava flow was also visible from local communities such as El Chaco, ~ 20 km distant.
Figure 17 illustrates the scene on 12 December 2004 during a visit to the front of the most advanced lobe of lava (for location, see star at end of flow lobe, figure 9). IG-EPN staff estimated the flow front at ~ 20 m high and saw incandescent blocks falling off of it.
Geologic Background. Volcán El Reventador is the most frequently active of a chain of Ecuadorian volcanoes in the Cordillera Real, well east of the principal volcanic axis. The forested, dominantly andesitic stratovolcano has 4-km-wide avalanche scarp open to the E formed by edifice collapse. A young, unvegetated, cone rises from the amphitheater floor to a height comparable to the rim. It has been the source of numerous lava flows as well as explosive eruptions visible from Quito, about 90 km ESE. Frequent lahars in this region of heavy rainfall have left extensive deposits on the scarp slope. The largest recorded eruption took place in 2002, producing a 17-km-high eruption column, pyroclastic flows that traveled up to 8 km, and lava flows from summit and flank vents.
Information Contacts: Patricio Ramón, Daniel Andrade, David Rivero, Alexandra Alvarado, Sandro Vaca, and Pete Hall, Geophysical Institute (IG), Escuela Politécnica Nacional, Apartado 17-01-2759, Quito, Ecuador (URL: http://www.igepn.edu.ec/); Jeffrey B. Johnson, Dept. of Earth Sciences, James Hall University of New Hampshire, Durham, NH 03824; MODIS Thermal Alert System, Hawaii Institute of Geophysics and Planetology (HIGP), School of Ocean and Earth Science and Technology, University of Hawaii at Manoa (URL: http://modis.higp.hawaii.edu/).
Soputan (Indonesia) — November 2004 Cite this Report
Soputan
Indonesia
1.112°N, 124.737°E; summit elev. 1785 m
All times are local (unless otherwise noted)
12 December eruption covered villages with ash up to 2 cm thick
Soputan erupted again on 12 December 2004. The Directorate of Volcanology and Geological Hazard Mitigation (DVGHM) noted that an eruption on 18 October 2004 sent a cloud ~ 600 meters above the crater. The previous eruptive episode occurred during July and August 2003 (BGVN 28:08, 28:10, and 28:11). A summary of ash plumes from mid-2003 through 12 December 2004 appears in table 6. Large discrepancies appeared in reported ash column heights; with the satellite estimates about 10 times larger than ground-based estimates.
Table 6. Reported ash plume altitudes recorded from Soputan, 18 July 2003-12 December 2004. Courtesy of DVGHM and Darwin VAAC.
| Date |
Description |
Source |
| 18 Jul 2003 |
~2 km above summit |
DVGHM |
| 02 Sep 2003 |
~2 km altitude |
Darwin VAAC |
| 04 Sep 2003 |
~3 km altitude (extending ~75 km N of the summit) |
Satellite imagery, Darwin VAAC |
| 18 Oct 2004 |
~600 m above summit |
DVGHM |
| 12 Dec 2004 |
~1 km above summit |
DVGHM |
| 12 Dec 2004 |
~10.7 km altitude |
Darwin VAAC |
The earliest details mentioned by DVGHM regarding the 2004 activity discussed 11 December 2004, a time when the tremor tended to rise, attaining peak-to-peak amplitudes of 0.5-3.0 mm. Observers also saw incandescence at the crater's rim.
At 0046 on 12 December tremor again registered with maximum peak-to-peak amplitudes of ~ 45 mm. At 0050 on 12 December Soputan erupted, sending an ash cloud up to 1 km. This was followed by discharge of a "hot cloud" (pyroclastic flow ?) to a distance of ~ 200 m E (from 'Aeseput,' a prominent NE-flank vent that formed in 1906). A lava flow spread W and S of Soputan. Observers could hear rumbling noise and thunder from their monitoring station ~ 11 km from the crater.
White-to-gray ash went E. At 0130 on 12 December a problem arose with the seismic sensors, perhaps because the solar panel was covered with ash. By 0600 the sensor was down. At 0500 that day a hot cloud occurred with a run out distance of ~ 150 m and a height of 200 m. Activity persisted until 1030. Soputan's summit then became visually obscured by clouds, but observers could still make out a white thin-to-medium plume to 70-80 m above the crater, and incandescence.
On the 13 December at 1752 observers felt an earthquake with a magnitude of MM I-II. The seismograph was then still inoperable.
News reports. A 13 December news report in The Daily Reform Voice stated that hundreds of hectares of paddy-fields and other agricultural land to the W of the Soputan was seriously impacted by tephra.
Thomas Dobat, a German expatriat living in Indonesia and concerned about the situation, sent Bulletin editors a translation of a 13 December 2004 article on Soputan taken from the Indonesian Journal Komentar. Similar to the above report, it also noted that hundreds of villages in 13 districts in Central Minahasa and in South Minahasa suffered from tephra fall emitted on 11-12 December. These eruptions of Soputan were accompanied by heavy thunder and lightning, which were heard in the town of Amurang.
Ash fell in nearly all of Central Minahasa and in parts of South Minahasa. The result was that in all areas of Central Minahasa, especially in the town of Tondano, houses, rice-fields, and roads were ash-covered up to 2 cm thick.
Geologic Background. The Soputan stratovolcano on the southern rim of the Quaternary Tondano caldera on the northern arm of Sulawesi Island is one of Sulawesi's most active volcanoes. The youthful, largely unvegetated volcano is the only active cone in the Sempu-Soputan volcanic complex, which includes the Soputan caldera, Rindengan, and Manimporok (3.5 km ESE). Kawah Masem maar was formed in the W part of the caldera and contains a crater lake; sulfur has been extracted from fumarolic areas in the maar since 1938. Recent eruptions have originated at both the summit crater and Aeseput, a prominent NE-flank vent that formed in 1906 and was the source of intermittent major lava flows until 1924.
Information Contacts: Directorate of Volcanology and Geological Hazard Mitigation, Jalan Diponegoro 57, Bandung 40122, Indonesia (URL: http://www.vsi.esdm.go.id/); Darwin Volcanic Ash Advisory Centre, Australian Bureau of Meteorology (URL: http://www.bom.gov.au/info/vaac); The Daily Reform Voice; Komentar; Thomas Dobat, Lorong Jerman, Kauditan II, 95372, Sulawesi Utara, Indonesia.