Recently Published Bulletin Reports
Erebus (Antarctica) Lava lake remains active; most thermal alerts recorded since 2019
Rincon de la Vieja (Costa Rica) Frequent phreatic explosions during July-December 2023
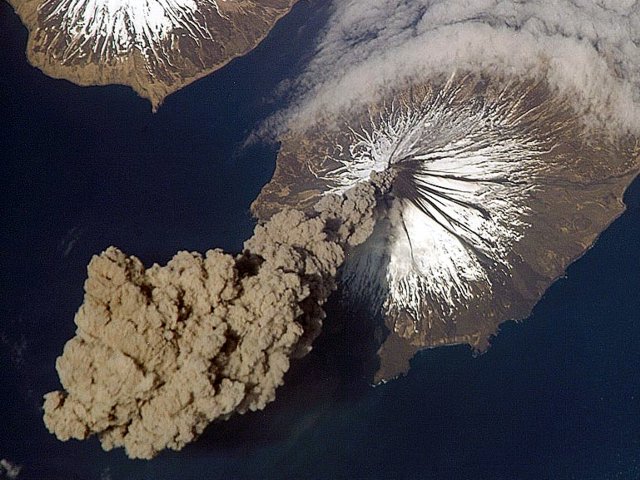
Bezymianny (Russia) Explosion on 18 October 2023 sends ash plume 8 km high; lava flows and incandescent avalanches
Kilauea (United States) Low-level lava effusions in the lava lake at Halema’uma’u during July-December 2022
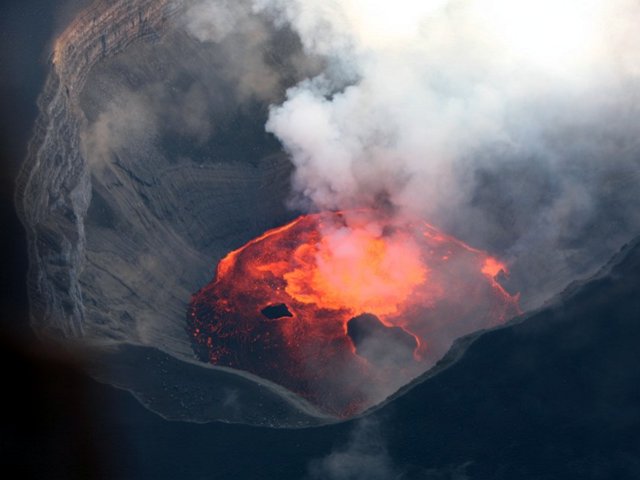
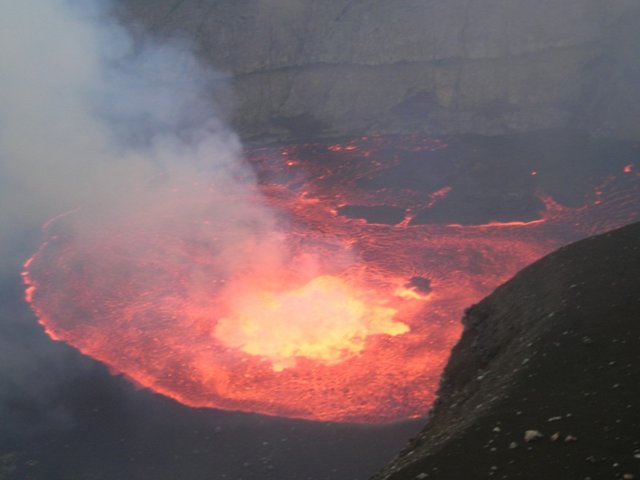
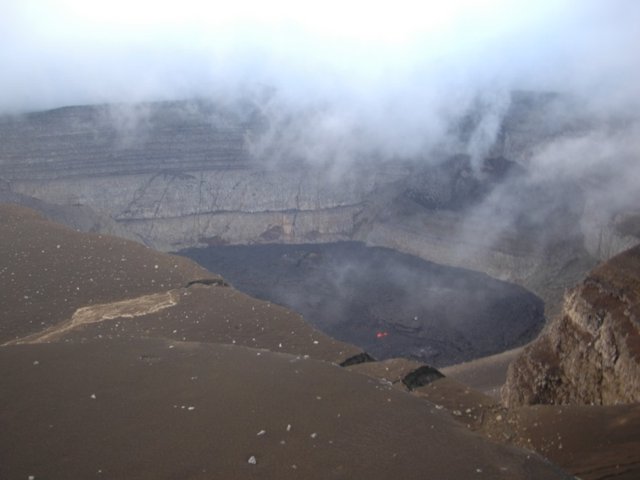
Nyamulagira (DR Congo) Lava flows and thermal activity during May-October 2023
Bagana (Papua New Guinea) Explosions, ash plumes, ashfall, and lava flows during April-September 2023
Mayon (Philippines) Lava flows, pyroclastic flows, ash emissions, and seismicity during April-September 2023
Nishinoshima (Japan) Eruption plumes and gas-and-steam plumes during May-August 2023
Krakatau (Indonesia) White gas-and-steam plumes and occasional ash plumes during May-August 2023
Villarrica (Chile) Strombolian activity, gas-and-ash emissions, and crater incandescence during April-September 2023
Merapi (Indonesia) Frequent incandescent avalanches during April-September 2023
Ebeko (Russia) Moderate explosive activity with ash plumes continued during June-November 2023
Erebus (Antarctica) — January 2024  Cite this Report
Erebus
Antarctica
77.53°S, 167.17°E; summit elev. 3794 m
All times are local (unless otherwise noted)
Lava lake remains active; most thermal alerts recorded since 2019
The lava lake in the summit crater of Erebus has been active since at least 1972. Located in Antarctica overlooking the McMurdo Station on Ross Island, it is the southernmost active volcano on the planet. Because of the remote location, activity is primarily monitored by satellites. This report covers activity during 2023.
The number of thermal alerts recorded by the Hawai'i Institute of Geophysics and Planetology’s MODVOLC Thermal Alerts System increased considerably in 2023 compared to the years 2020-2022 (table 9). In contrast to previous years, the MODIS instruments aboard the Aqua and Terra satellites captured data from Erebus every month during 2023. Consistent with previous years, the lowest number of anomalous pixels were recorded in January, November, and December.
Table 9. Number of monthly MODIS-MODVOLC thermal alert pixels recorded at Erebus during 2017-2023. See BGVN 42:06 for data from 2000 through 2016. The table was compiled using data provided by the HIGP – MODVOLC Thermal Alerts System.
| Year |
Jan |
Feb |
Mar |
Apr |
May |
Jun |
Jul |
Aug |
Sep |
Oct |
Nov |
Dec |
SUM |
| 2017 |
0 |
21 |
9 |
0 |
0 |
1 |
11 |
61 |
76 |
52 |
0 |
3 |
234 |
| 2018 |
0 |
21 |
58 |
182 |
55 |
17 |
137 |
172 |
103 |
29 |
0 |
0 |
774 |
| 2019 |
2 |
21 |
162 |
151 |
55 |
56 |
75 |
53 |
29 |
19 |
1 |
0 |
624 |
| 2020 |
0 |
2 |
16 |
18 |
4 |
4 |
1 |
3 |
18 |
3 |
1 |
6 |
76 |
| 2021 |
0 |
9 |
1 |
0 |
2 |
56 |
46 |
47 |
35 |
52 |
5 |
3 |
256 |
| 2022 |
1 |
13 |
55 |
22 |
15 |
32 |
39 |
19 |
31 |
11 |
0 |
0 |
238 |
| 2023 |
2 |
33 |
49 |
82 |
41 |
32 |
70 |
64 |
42 |
17 |
5 |
11 |
448 |
Sentinel-2 infrared images showed one or two prominent heat sources within the summit crater, accompanied by adjacent smaller sources, similar to recent years (see BGVN 46:01, 47:02, and 48:01). A unique image was obtained on 25 November 2023 by the OLI-2 (Operational Land Imager-2) on Landsat 9, showing the upper part of the volcano surrounded by clouds (figure 32).
Geologic Background. Mount Erebus, the world's southernmost historically active volcano, overlooks the McMurdo research station on Ross Island. It is the largest of three major volcanoes forming the crudely triangular Ross Island. The summit of the dominantly phonolitic volcano has been modified by one or two generations of caldera formation. A summit plateau at about 3,200 m elevation marks the rim of the youngest caldera, which formed during the late-Pleistocene and within which the modern cone was constructed. An elliptical 500 x 600 m wide, 110-m-deep crater truncates the summit and contains an active lava lake within a 250-m-wide, 100-m-deep inner crater; other lava lakes are sometimes present. The glacier-covered volcano was erupting when first sighted by Captain James Ross in 1841. Continuous lava-lake activity with minor explosions, punctuated by occasional larger Strombolian explosions that eject bombs onto the crater rim, has been documented since 1972, but has probably been occurring for much of the volcano's recent history.
Information Contacts: Hawai'i Institute of Geophysics and Planetology (HIGP) - MODVOLC Thermal Alerts System, School of Ocean and Earth Science and Technology (SOEST), Univ. of Hawai'i, 2525 Correa Road, Honolulu, HI 96822, USA (URL: http://modis.higp.hawaii.edu/); Copernicus Browser, Copernicus Data Space Ecosystem, European Space Agency (URL: https://dataspace.copernicus.eu/browser/); NASA Earth Observatory, EOS Project Science Office, NASA Goddard Space Flight Center, Goddard, Maryland, USA (URL: https://earthobservatory.nasa.gov/images/152134/erebus-breaks-through).
Rincon de la Vieja (Costa Rica) — January 2024 Cite this Report
Rincon de la Vieja
Costa Rica
10.83°N, 85.324°W; summit elev. 1916 m
All times are local (unless otherwise noted)
Frequent phreatic explosions during July-December 2023
Rincón de la Vieja is a volcanic complex in Costa Rica with a hot convecting acid lake that exhibits frequent weak phreatic explosions, gas-and-steam emissions, and occasional elevated sulfur dioxide levels (BGVN 45:10, 46:03, 46:11). The current eruption period began June 2021. This report covers activity during July-December 2023 and is based on weekly bulletins and occasional daily reports from the Observatorio Vulcanologico Sismologica de Costa Rica-Universidad Nacional (OVSICORI-UNA).
Numerous weak phreatic explosions continued during July-December 2023, along with gas-and-steam emissions and plumes that rose as high as 3 km above the crater rim. Many weekly OVSICORI-UNA bulletins included the previous week's number of explosions and emissions (table 9). For many explosions, the time of explosion was given (table 10). Frequent seismic activity (long-period earthquakes, volcano-tectonic earthquakes, and tremor) accompanied the phreatic activity.
Table 9. Number of reported weekly phreatic explosions and gas-and-steam emissions at Rincón de la Vieja, July-December 2023. Counts are reported for the week before the Weekly Bulletin date; not all reports included these data. Courtesy of OVSICORI-UNA.
| OVSICORI Weekly Bulletin |
Number of explosions |
Number of emissions |
| 28 Jul 2023 |
6 |
14 |
| 4 Aug 2023 |
10 |
12 |
| 1 Sep 2023 |
13 |
11 |
| 22 Sep 2023 |
12 |
13 |
| 29 Sep 2023 |
6 |
11 |
| 6 Oct 2023 |
12 |
5 |
| 13 Oct 2023 |
7 |
9 |
| 20 Oct 2023 |
1 |
15 |
| 27 Oct 2023 |
3 |
23 |
| 3 Nov 2023 |
3 |
10 |
| 17 Nov 2023 |
0 |
Some |
| 24 Nov 2023 |
0 |
14 |
| 8 Dec 2023 |
4 |
16 |
| 22 Dec 2023 |
8 |
18 |
Table 10. Summary of activity at Rincón de la Vieja during July-December 2023. Weak phreatic explosions and gas emissions are noted where the time of explosion was indicated in the weekly or daily bulletins. Height of plumes or emissions are distance above the crater rim. Courtesy of OVSICORI-UNA.
| Date |
Time |
Description of Activity |
| 1 Jul 2023 |
0156 |
Explosion. |
| 2 Jul 2023 |
0305 |
Explosion. |
| 4 Jul 2023 |
0229, 0635 |
Event at 0635 produced a gas-and-steam plume that rose 700 m and drifted W; seen by residents in Liberia (21 km SW). |
| 9 Jul 2023 |
1843 |
Explosion. |
| 21 Jul 2023 |
0705 |
Explosion. |
| 26 Jul 2023 |
1807 |
Explosion. |
| 28 Jul 2023 |
0802 |
Explosion generated a gas-and-steam plume that rose 500 m. |
| 30 Jul 2023 |
1250 |
Explosion. |
| 31 Jul 2023 |
2136 |
Explosion. |
| 11 Aug 2023 |
0828 |
Explosion. |
| 18 Aug 2023 |
1304 |
Explosion. |
| 21 Aug 2023 |
1224 |
Explosion generated gas-and-steam plumes rose 500-600 m. |
| 22 Aug 2023 |
0749 |
Explosion generated gas-and-steam plumes rose 500-600 m. |
| 24 Aug 2023 |
1900 |
Explosion. |
| 25 Aug 2023 |
0828 |
Event produced a steam-and-gas plume that rose 3 km and drifted NW. |
| 27-28 Aug 2023 |
0813 |
Four small events; the event at 0813 on 28 August lasted two minutes and generated a steam-and-gas plume that rose 2.5 km. |
| 1 Sep 2023 |
1526 |
Explosion generated plume that rose 2 km and ejected material onto the flanks. |
| 2-3 Sep 2023 |
- |
Small explosions detected in infrasound data. |
| 4 Sep 2023 |
1251 |
Gas-and-steam plume rose 1 km and drifted W. |
| 7 Nov 2023 |
1113 |
Explosion. |
| 8 Nov 2023 |
0722 |
Explosion. |
| 12 Nov 2023 |
0136 |
Small gas emissions. |
| 14 Nov 2023 |
0415 |
Small gas emissions. |
According to OVSICORI-UNA, during July-October the average weekly sulfur dioxide (SO2) flux ranged from 68 to 240 tonnes/day. However, in mid-November the flux increased to as high as 334 tonnes/day, the highest value measured in recent years. The high SO2 flux in mid-November was also detected by the TROPOMI instrument on the Sentinel-5P satellite (figure 43).
Geologic Background. Rincón de la Vieja, the largest volcano in NW Costa Rica, is a remote volcanic complex in the Guanacaste Range. The volcano consists of an elongated, arcuate NW-SE-trending ridge constructed within the 15-km-wide early Pleistocene Guachipelín caldera, whose rim is exposed on the south side. Sometimes known as the "Colossus of Guanacaste," it has an estimated volume of 130 km3 and contains at least nine major eruptive centers. Activity has migrated to the SE, where the youngest-looking craters are located. The twin cone of Santa María volcano, the highest peak of the complex, is located at the eastern end of a smaller, 5-km-wide caldera and has a 500-m-wide crater. A Plinian eruption producing the 0.25 km3 Río Blanca tephra about 3,500 years ago was the last major magmatic eruption. All subsequent eruptions, including numerous historical eruptions possibly dating back to the 16th century, have been from the prominent active crater containing a 500-m-wide acid lake located ENE of Von Seebach crater.
Information Contacts: Observatorio Vulcanológico Sismológica de Costa Rica-Universidad Nacional (OVSICORI-UNA), Apartado 86-3000, Heredia, Costa Rica (URL: http://www.ovsicori.una.ac.cr/); NASA Global Sulfur Dioxide Monitoring Page, Atmospheric Chemistry and Dynamics Laboratory, NASA Goddard Space Flight Center (NASA/GSFC), 8800 Greenbelt Road, Goddard MD 20771, USA (URL: https://so2.gsfc.nasa.gov/).
Bezymianny (Russia) — November 2023 Cite this Report
Bezymianny
Russia
55.972°N, 160.595°E; summit elev. 2882 m
All times are local (unless otherwise noted)
Explosion on 18 October 2023 sends ash plume 8 km high; lava flows and incandescent avalanches
Bezymianny, located on Russia’s Kamchatka Peninsula, has had eruptions since 1955 characterized by dome growth, explosions, pyroclastic flows, ash plumes, and ashfall. Activity during November 2022-April 2023 included gas-and-steam emissions, lava dome collapses generating avalanches, and persistent thermal activity. Similar eruptive activity continued from May through October 2023, described here based on information from weekly and daily reports of the Kamchatka Volcano Eruptions Response Team (KVERT), notices from Tokyo VAAC (Volcanic Ash Advisory Center), and from satellite data.
Overall activity decreased after the strong period of activity in late March through April 2023, which included ash explosions during 29 March and 7-8 April 2023 that sent plumes as high as 10-12 km altitude, along with dome growth and lava flows (BGVN 48:05). This reduced activity can be seen in the MIROVA thermal detection system graph (figure 56), which was consistent with data from the MODVOLC thermal detection system and with Sentinel-2 satellite images that showed persistent hotspots in the summit crater when conditions allowed observations. A renewed period of strong activity began in mid-October 2023.
Activity increased significantly on 17 October 2023 when large collapses began during 0700-0830 on the E flanks of the lava dome and continued to after 0930 the next day (figure 57). Ash plumes rose to an altitude of 4.5-5 km, extending 220 km NNE by 18 October. A large explosion at 1630 on 18 October produced an ash plume that rose to an altitude of 11 km (8 km above the summit) and drifted NNE and then NW, extending 900 km NW within two days at an altitude of 8 km. Minor ashfall was noted in Kozyrevsk (45 km WNW). At 0820 on 20 October an ash plume was identified in satellite images drifting 100 km ENE at altitudes of 4-4.5 km.
Lava flows and hot avalanches from the dome down the SE flank continued over the next few days, including 23 October when clear conditions allowed good observations (figures 58 and 59). A large thermal anomaly was observed over the volcano through 24 October, and in the summit crater on 30 October (figure 60). Strong fumarolic activity continued, with numerous avalanches and occasional incandescence. By the last week of October, volcanic activity had decreased to a level consistent with that earlier in the reporting period.
Aviation warnings were frequently updated during 17-20 October. KVERT issued a Volcano Observatory Notice for Aviation (VONA) on 17 October at 1419 and 1727 (0219 and 0527 UTC) raising the Aviation Color Code (ACC) from Yellow to Orange (second highest level). The next day, KVERT issued a VONA at 1705 (0505 UTC) raising the ACC to Red (highest level) but lowered it back to Orange at 2117 (0917 UTC). After another decrease to Yellow and back to Orange, the ACC was reduced to Yellow on 20 October at 1204 (0004 UTC). In addition, the Tokyo VAAC issued a series of Volcanic Ash Advisories beginning on 16 October and continuing through 30 October.
Geologic Background. The modern Bezymianny, much smaller than its massive neighbors Kamen and Kliuchevskoi on the Kamchatka Peninsula, was formed about 4,700 years ago over a late-Pleistocene lava-dome complex and an edifice built about 11,000-7,000 years ago. Three periods of intensified activity have occurred during the past 3,000 years. The latest period, which was preceded by a 1,000-year quiescence, began with the dramatic 1955-56 eruption. This eruption, similar to that of St. Helens in 1980, produced a large open crater that was formed by collapse of the summit and an associated lateral blast. Subsequent episodic but ongoing lava-dome growth, accompanied by intermittent explosive activity and pyroclastic flows, has largely filled the 1956 crater.
Information Contacts: Kamchatka Volcanic Eruptions Response Team (KVERT), Far Eastern Branch, Russian Academy of Sciences, 9 Piip Blvd., Petropavlovsk-Kamchatsky, 683006, Russia (URL: http://www.kscnet.ru/ivs/kvert/); Kamchatka Volcanological Station, Kamchatka Branch of Geophysical Survey, (KB GS RAS), Klyuchi, Kamchatka Krai, Russia (URL: http://volkstat.ru/); Tokyo Volcanic Ash Advisory Center (VAAC), 1-3-4 Otemachi, Chiyoda-ku, Tokyo 100-8122, Japan (URL: http://ds.data.jma.go.jp/svd/vaac/data/); Hawai'i Institute of Geophysics and Planetology (HIGP) - MODVOLC Thermal Alerts System, School of Ocean and Earth Science and Technology (SOEST), Univ. of Hawai'i, 2525 Correa Road, Honolulu, HI 96822, USA (URL: http://modis.higp.hawaii.edu/); MIROVA (Middle InfraRed Observation of Volcanic Activity), a collaborative project between the Universities of Turin and Florence (Italy) supported by the Centre for Volcanic Risk of the Italian Civil Protection Department (URL: http://www.mirovaweb.it/); Copernicus Browser, Copernicus Data Space Ecosystem, European Space Agency (URL: https://dataspace.copernicus.eu/browser/).chr
Kilauea (United States) — January 2023 Cite this Report
Kilauea
United States
19.421°N, 155.287°W; summit elev. 1222 m
All times are local (unless otherwise noted)
Low-level lava effusions in the lava lake at Halema’uma’u during July-December 2022
Kīlauea is the southeastern-most volcano in Hawaii and overlaps the E flank of the Mauna Loa volcano. Its East Rift Zone (ERZ) has been intermittently active for at least 2,000 years. An extended eruption period began in January 1983 and was characterized by open lava lakes and lava flows from the summit caldera and the East Rift Zone. During May 2018 magma migrated into the Lower East Rift Zone (LERZ) and opened 24 fissures along a 6-km-long NE-trending fracture zone that produced lava flows traveling in multiple directions. As lava emerged from the fissures, the lava lake at Halema'uma'u drained and explosions sent ash plumes to several kilometers altitude (BGVN 43:10).
The current eruption period started during September 2021 and has recently been characterized by lava effusions, spatter, and sulfur dioxide emissions in the active Halema’uma’u lava lake (BGVN 47:08). Lava effusions, some spatter, and sulfur dioxide emissions have continued during this reporting period of July through December 2022 using daily reports, volcanic activity notices, and abundant photo, map, and video data from the US Geological Survey's (USGS) Hawaiian Volcano Observatory (HVO).
Summary of activity during July-December 2022. Low-level effusions have continued at the western vent of the Halema’uma’u crater during July through early December 2022. Occasional weak ooze-outs (also called lava break outs) would occur along the margins of the crater floor. The overall level of the active lava lake throughout the reporting period gradually increased due to infilling, however it stagnated in mid-September (table 13). During September through November, activity began to decline, though lava effusions persisted at the western vent. By 9 December, the active part of the lava lake had completely crusted over, and incandescence was no longer visible.
Table 13. Summary of measurements taken during overflights at Kīlauea that show a gradual increase in the active lava lake level and the volume of lava effused since 29 September 2021. Lower activity was reported during September-October. Data collected during July-December 2022. Courtesy of HVO.
| Date: |
Level of the active lava lake (m): |
Cumulative volume of lava effused (million cubic meters): |
| 7 Jul 2022 |
130 |
95 |
| 19 Jul 2022 |
133 |
98 |
| 4 Aug 2022 |
136 |
102 |
| 16 Aug 2022 |
137 |
104 |
| 12 Sep 2022 |
143 |
111 |
| 5 Oct 2022 |
143 |
111 |
| 28 Oct 2022 |
143 |
111 |
Activity during July 2022. Lava effusions were reported from the western vent in the Halema’uma’u crater, along with occasional weak ooze-outs along the margins of the crater floor. The height of the lava lake was variable due to deflation-inflation tilt events; for example, the lake level dropped approximately 3-4 m during a summit deflation-inflation event reported on 1 July. Webcam images taken during the night of 6-12 July showed intermittent low-level spattering at the western vent that rose less than 10 m above the vent (figure 519). Measurements made during an overflight on 7 July indicated that the crater floor was infilled about 130 m and that 95 million cubic meters of lava had been effused since 29 September 2021. A single, relatively small lava ooze-out was active to the S of the lava lake. Around midnight on 8 July there were two brief periods of lava overflow onto the lake margins. On 9 July lava ooze-outs were reported near the SE and NE edges of the crater floor and during 10-11 July they occurred near the E, NE, and NW edges. On 16 July crater incandescence was reported, though the ooze-outs and spattering were not visible. On 18 July overnight webcam images showed incandescence in the western vent complex and two ooze-outs were reported around 0000 and 0200 on 19 July. By 0900 there were active ooze-outs along the SW edge of the crater floor. Measurements made from an overflight on 19 July indicated that the crater floor was infilled about 133 m and 98 million cubic meters of lava had erupted since 29 September 2021 (figure 520). On 20 July around 1600 active ooze-outs were visible along the N edge of the crater, which continued through the next day. Extensive ooze-outs occurred along the W margin during 24 July until 1900; on 26 July minor ooze-outs were noted along the N margin. Minor spattering was visible on 29 July along the E margin of the lake. The sulfur dioxide emission rates ranged 650-2,800 tons per day (t/d), the higher of which was measured on 8 July (figure 519).
Activity during August 2022. The eruption continued in the Halema’uma’u crater at the western vent. According to HVO the lava in the active lake remained at the level of the bounding levees. Occasional minor ooze-outs were observed along the margins of the crater floor. Strong nighttime crater incandescence was visible after midnight on 6 August over the western vent cone. During 6-7 August scattered small lava lobes were active along the crater floor and incandescence persisted above the western vent through 9 August. During 7-9 August HVO reported a single lava effusion source was active along the NW margin of the crater floor. Measurements from an overflight on 4 August indicated that the crater floor was infilled about 136 m total and that 102 million cubic meters of lava had been erupted since the start of the eruption. Lava breakouts were reported along the N, NE, E, S, and W margins of the crater during 10-16 August. Another overflight survey conducted on 16 August indicated that the crater floor infilled about 137 m and 104 million cubic meters of lava had been erupted since September 2021. Measured sulfur dioxide emissions rates ranged 1,150-2,450 t/d, the higher of which occurred on 8 August.
Activity during September 2022. During September, lava effusion continued from the western vent into the active lava lake and onto the crater floor. Intermittent minor ooze-outs were reported through the month. A small ooze-out was visible on the W crater floor margin at 0220 on 2 September, which showed decreasing surface activity throughout the day, but remained active through 3 September. On 3 September around 1900 a lava outbreak occurred along the NW margin of the crater floor but had stopped by the evening of 4 September. Field crews monitoring the summit lava lake on 9 September observed spattering on the NE margin of the lake that rose no higher than 10 m, before falling back onto the lava lake crust (figure 521). Overflight measurements on 12 September indicated that the crater floor was infilled a total of 143 m and 111 million cubic meters of lava had been erupted since September 2021. Extensive breakouts in the W and N part of the crater floor were reported at 1600 on 20 September and continued into 26 September. The active part of the lava lake dropped by 10 m while other parts of the crater floor dropped by several meters. Summit tiltmeters recorded a summit seismic swarm of more than 80 earthquakes during 1500-1800 on 21 September, which occurred about 1.5 km below Halema’uma’u; a majority of these were less than Mw 2. By 22 September the active part of the lava lake was infilled about 2 m. On 23 September the western vent areas exhibited several small spatter cones with incandescent openings, along with weak, sporadic spattering (figure 522). The sulfur dioxide emission rate ranged from 930 t/d to 2,000 t/d, the higher of which was measured on 6 September.
Activity during October 2022. Activity during October declined slightly compared to previous months, though lava effusions persisted from the western vent into the active lava lake and onto the crater floor during October (figure 523). Slight variations in the lava lake were noted throughout the month. HVO reported that around 0600 on 3 October the level of the lava lake has lowered slightly. Overflight measurements taken on 5 October indicated that the crater floor was infilled a total of about 143 m and that 111 million cubic meters of lava had been effused since September 2021. During 6-7 October the lake gradually rose 0.5 m. Sulfur dioxide measurements made on 22 October had an emission rate of 700 t/d. Another overflight taken on 28 October showed that there was little to no change in the elevation of the crater floor: the crater floor was infilled a total of 143 m and 111 million cubic meters of lava had erupted since the start of the eruption.
Activity during November 2022. Activity remained low during November, though HVO reported that lava from the western vent continued to effuse into the active lava lake and onto the crater floor throughout the month. The rate of sulfur dioxide emissions during November ranged from 300-600 t/d, the higher amount of which occurred on 9 November.
Activity during December 2022. Similar low activity was reported during December, with lava effusing from the western vent into the active lava lake and onto the crater floor. During 4-5 December the active part of the lava lake was slightly variable in elevation and fluctuated within 1 m. On 9 December HVO reported that lava was no longer erupting from the western vent in the Halema’uma’u crater and that sulfur dioxide emissions had returned to near pre-eruption background levels; during 10-11 December, the lava lake had completely crusted over, and no incandescence was visible (figure 524). Time lapse camera images covering the 4-10 December showed that the crater floor showed weak deflation and no inflation. Some passive events of crustal overturning were reported during 14-15 December, which brought fresh incandescent lava to the lake surface. The sulfur dioxide emission rate was approximately 200 t/d on 14 December. A smaller overturn event on 17 December and another that occurred around 0000 and into the morning of 20 December were also detected. A small seismic swarm was later detected on 30 December.
Geologic Background. Kilauea overlaps the E flank of the massive Mauna Loa shield volcano in the island of Hawaii. Eruptions are prominent in Polynesian legends; written documentation since 1820 records frequent summit and flank lava flow eruptions interspersed with periods of long-term lava lake activity at Halemaumau crater in the summit caldera until 1924. The 3 x 5 km caldera was formed in several stages about 1,500 years ago and during the 18th century; eruptions have also originated from the lengthy East and Southwest rift zones, which extend to the ocean in both directions. About 90% of the surface of the basaltic shield volcano is formed of lava flows less than about 1,100 years old; 70% of the surface is younger than 600 years. The long-term eruption from the East rift zone between 1983 and 2018 produced lava flows covering more than 100 km2, destroyed hundreds of houses, and added new coastline.
Information Contacts: Hawaiian Volcano Observatory (HVO), U.S. Geological Survey, PO Box 51, Hawai'i National Park, HI 96718, USA (URL: http://hvo.wr.usgs.gov/).
Nyamulagira (DR Congo) — November 2023 Cite this Report
Nyamulagira
DR Congo
1.408°S, 29.2°E; summit elev. 3058 m
All times are local (unless otherwise noted)
Lava flows and thermal activity during May-October 2023
Nyamulagira (also known as Nyamuragira) is a shield volcano in the Democratic Republic of Congo with the summit truncated by a small 2 x 2.3 km caldera with walls up to about 100 m high. Documented eruptions have occurred within the summit caldera, as well as from numerous flank fissures and cinder cones. The current eruption period began in April 2018 and has more recently been characterized by summit crater lava flows and thermal activity (BGVN 48:05). This report describes lava flows and variable thermal activity during May through October 2023, based on information from the Observatoire Volcanologique de Goma (OVG) and various satellite data.
Lava lake activity continued during May. The MIROVA (Middle InfraRed Observation of Volcanic Activity) system recorded moderate-to-strong thermal activity throughout the reporting period; activity was more intense during May and October and relatively weaker from June through September (figure 95). The MODVOLC thermal algorithm, detected a total of 209 thermal alerts. There were 143 hotspots detected during May, eight during June, nine during September, and 49 during October. This activity was also reflected in infrared satellite images, where a lava flow was visible in the NW part of the crater on 7 May and strong activity was seen in the center of the crater on 4 October (figure 96). Another infrared satellite image taken on 12 May showed still active lava flows along the NW margin of the crater. According to OVG lava effusions were active during 7-29 May and moved to the N and NW parts of the crater beginning on 9 May. Strong summit crater incandescence was visible from Goma (27 km S) during the nights of 17, 19, and 20 May (figure 97). On 17 May there was an increase in eruptive activity, which peaked at 0100 on 20 May. Notable sulfur dioxide plumes drifted NW and W during 19-20 May (figure 98). Drone footage acquired in partnership with the USGS (United States Geological Survey) on 20 May captured images of narrow lava flows that traveled about 100 m down the W flank (figure 99). Data from the Rumangabo seismic station indicated a decreasing trend in activity during 17-21 May. Although weather clouds prevented clear views of the summit, a strong thermal signature on the NW flank was visible in an infrared satellite image on 22 May, based on an infrared satellite image. On 28 May the lava flows on the upper W flank began to cool and solidify. By 29 May seismicity returned to levels similar to those recorded before the 17 May increase. Lava effusion continued but was confined to the summit crater; periodic crater incandescence was observed.
Low-level activity was noted during June through October. On 1 June OVG reported that seismicity remained at lower levels and that crater incandescence had been absent for three days, though infrared satellite imagery showed continued lava effusion in the summit crater. The lava flows on the flanks covered an estimated 0.6 km2. Satellite imagery continued to show thermal activity confined to the lava lake through October (figure 96), although no lava flows or significant sulfur dioxide emissions were reported.
Geologic Background. Africa's most active volcano, Nyamulagira (also known as Nyamuragira), is a massive high-potassium basaltic shield about 25 km N of Lake Kivu and 13 km NNW of the steep-sided Nyiragongo volcano. The summit is truncated by a small 2 x 2.3 km caldera that has walls up to about 100 m high. Documented eruptions have occurred within the summit caldera, as well as from the numerous flank fissures and cinder cones. A lava lake in the summit crater, active since at least 1921, drained in 1938, at the time of a major flank eruption. Recent lava flows extend down the flanks more than 30 km from the summit as far as Lake Kivu; extensive lava flows from this volcano have covered 1,500 km2 of the western branch of the East African Rift.
Information Contacts: Observatoire Volcanologique de Goma (OVG), Departement de Geophysique, Centre de Recherche en Sciences Naturelles, Lwiro, D.S. Bukavu, DR Congo; Hawai'i Institute of Geophysics and Planetology (HIGP) - MODVOLC Thermal Alerts System, School of Ocean and Earth Science and Technology (SOEST), Univ. of Hawai'i, 2525 Correa Road, Honolulu, HI 96822, USA (URL: http://modis.higp.hawaii.edu/); MIROVA (Middle InfraRed Observation of Volcanic Activity), a collaborative project between the Universities of Turin and Florence (Italy) supported by the Centre for Volcanic Risk of the Italian Civil Protection Department (URL: http://www.mirovaweb.it/); NASA Global Sulfur Dioxide Monitoring Page, Atmospheric Chemistry and Dynamics Laboratory, NASA Goddard Space Flight Center (NASA/GSFC), 8800 Greenbelt Road, Goddard, Maryland, USA (URL: https://so2.gsfc.nasa.gov/); Copernicus Browser, Copernicus Data Space Ecosystem, European Space Agency (URL: https://dataspace.copernicus.eu/browser/); Charles Balagizi, Goma Volcano Observatory, Departement de Geophysique, Centre de Recherche en Sciences Naturelles, Lwiro, D.S. Bukavu, DR Congo.
Bagana (Papua New Guinea) — October 2023 Cite this Report
Bagana
Papua New Guinea
6.137°S, 155.196°E; summit elev. 1855 m
All times are local (unless otherwise noted)
Explosions, ash plumes, ashfall, and lava flows during April-September 2023
The remote volcano of Bagana is located in central Bougainville Island, Papua New Guinea. Recorded eruptions date back to 1842 and activity has consisted of effusive activity that has built a small lava dome in the summit crater and occasional explosions that produced pyroclastic flows. The most recent eruption has been ongoing since February 2000 and has produced occasional explosions, ash plumes, and lava flows. More recently, activity has been characterized by ongoing effusive activity and ash emissions (BGVN 48:04). This report updates activity from April through September 2023 that has consisted of explosions, ash plumes, ashfall, and lava flows, using information from the Darwin Volcanic Ash Advisory Center (VAAC) and satellite data.
An explosive eruption was reported on 7 July that generated a large gas-and-ash plume to high altitudes and caused significant ashfall in local communities; the eruption plume had reached upper tropospheric (16-18 km altitude) altitudes by 2200, according to satellite images. Sulfur dioxide plumes were detected in satellite images on 8 July and indicated that the plume was likely a mixture of gas, ice, and ash. A report issued by the Autonomous Bougainville Government (ABG) (Torokina District, Education Section) on 10 July noted that significant ash began falling during 2000-2100 on 7 July and covered most areas in the Vuakovi, Gotana (9 km SW), Koromaketo, Laruma (25 km W) and Atsilima (27 km NW) villages. Pyroclastic flows also occurred, according to ground-based reports; small deposits confined to one drainage were inspected by RVO during an overflight on 17 July and were confirmed to be from the 7 July event. Ashfall continued until 10 July and covered vegetation, which destroyed bushes and gardens and contaminated rivers and streams.
RVO reported another eruption on 14 July. The Darwin VAAC stated that an explosive event started around 0830 on 15 July and produced an ash plume that rose to 16.5 km altitude by 1000 and drifted N, according to satellite images. The plume continued to drift N and remained visible through 1900, and by 2150 it had dissipated.
Ashfall likely from both the 7 and 15 July events impacted about 8,111 people in Torokina (20 km SW), including Tsito/Vuakovi, Gotana, Koromaketo, Kenaia, Longkogari, Kenbaki, Piva (13 km SW), and Atsinima, and in the Tsitovi district, according to ABG. Significant ashfall was also reported in Ruruvu (22 km N) in the Wakunai District of Central Bougainville, though the thickness of these deposits could not be confirmed. An evacuation was called for the villages in Wakunai, where heavy ashfall had contaminated water sources; the communities of Ruruvu, Togarau, Kakarapaia, Karauturi, Atao, and Kuritaturi were asked to evacuate to a disaster center at the Wakunai District Station, and communities in Torokina were asked to evacuate to the Piva District station. According to a news article, more than 7,000 people needed temporary accommodations, with about 1,000 people in evacuation shelters. Ashfall had deposited over a broad area, contaminating water supplies, affecting crops, and collapsing some roofs and houses in rural areas. Schools were temporarily shut down. Intermittent ash emissions continued through the end of July and drifted NNW, NW, and SW. Fine ashfall was reported on the coast of Torokina, and ash plumes also drifted toward Laruma and Atsilima.
A small explosive eruption occurred at 2130 on 28 July that ejected material from the crater vents, according to reports from Torokina, in addition to a lava flow that contained two lobes. A second explosion was detected at 2157. Incandescence from the lava flow was visible from Piva as it descended the W flank around 2000 on 29 July (figure 47). The Darwin VAAC reported that a strong thermal anomaly was visible in satellite images during 30-31 July and that ash emissions rose to 2.4 km altitude and drifted WSW on 30 July. A ground report from RVO described localized emissions at 0900 on 31 July.
The Darwin VAAC reported that ash plumes were identified in satellite imagery at 0800 and 1220 on 12 August and rose to 2.1 km and 3 km altitude and drifted NW and W, respectively. A news report stated that aid was sent to more than 6,300 people that were adversely affected by the eruption. Photos taken during 17-19 August showed ash emissions rising no higher than 1 km above the summit and drifting SE. A small explosion generated an ash plume during the morning of 19 August. Deposits from small pyroclastic flows were also captured in the photos. Satellite images captured lava flows and pyroclastic flow deposits. Two temporary seismic stations were installed near Bagana on 17 August at distances of 7 km WSW (Vakovi station) and 11 km SW (Kepox station). The Kepox station immediately started to record continuous, low-frequency background seismicity.
Satellite data. Little to no thermal activity was detected during April through mid-July 2023; only one anomaly was recorded during early April and one during early June, according to MIROVA (Middle InfraRed Observation of Volcanic Activity) data (figure 48). Thermal activity increased in both power and frequency during mid-July through September, although there were still some short gaps in detected activity. MODVOLC also detected increased thermal activity during August; thermal hotspots were detected a total of five times on 19, 20, and 27 August. Weak thermal anomalies were also captured in infrared satellite images on clear weather days throughout the reporting period on 7, 12, and 17 April, 27 May, 1, 6, 16, and 31 July, and 19 September (figure 48); a strong thermal anomaly was visible on 31 July. Distinct sulfur dioxide plumes that drifted generally NW were intermittently captured by the TROPOMI instrument on the Sentinel-5P satellite and sometimes exceeded two Dobson Units (DUs) (figure 49).
Geologic Background. Bagana volcano, in a remote portion of central Bougainville Island, is frequently active. This massive symmetrical cone was largely constructed by an accumulation of viscous andesitic lava flows. The entire edifice could have been constructed in about 300 years at its present rate of lava production. Eruptive activity is characterized by non-explosive effusion of viscous lava that maintains a small lava dome in the summit crater, although occasional explosive activity produces pyroclastic flows. Lava flows with tongue-shaped lobes up to 50 m thick and prominent levees descend the flanks on all sides.
Information Contacts: Rabaul Volcano Observatory (RVO), Geohazards Management Division, Department of Mineral Policy and Geohazards Management (DMPGM), PO Box 3386, Kokopo, East New Britain Province, Papua New Guinea; Darwin Volcanic Ash Advisory Centre (VAAC), Bureau of Meteorology, Northern Territory Regional Office, PO Box 40050, Casuarina, NT 0811, Australia (URL: http://www.bom.gov.au/info/vaac/); MIROVA (Middle InfraRed Observation of Volcanic Activity), a collaborative project between the Universities of Turin and Florence (Italy) supported by the Centre for Volcanic Risk of the Italian Civil Protection Department (URL: http://www.mirovaweb.it/); Hawai'i Institute of Geophysics and Planetology (HIGP) - MODVOLC Thermal Alerts System, School of Ocean and Earth Science and Technology (SOEST), Univ. of Hawai'i, 2525 Correa Road, Honolulu, HI 96822, USA (URL: http://modis.higp.hawaii.edu/); NASA Global Sulfur Dioxide Monitoring Page, Atmospheric Chemistry and Dynamics Laboratory, NASA Goddard Space Flight Center (NASA/GSFC), 8800 Greenbelt Road, Goddard, Maryland, USA (URL: https://so2.gsfc.nasa.gov/); Copernicus Browser, Copernicus Data Space Ecosystem, European Space Agency (URL: https://dataspace.copernicus.eu/browser/); Autonomous Bougainville Government, P.O Box 322, Buka, AROB, PNG (URL: https://abg.gov.pg/); Andrew Tupper (Twitter: @andrewcraigtupp); Simon Carn, Geological and Mining Engineering and Sciences, Michigan Technological University, 1400 Townsend Drive, Houghton, MI 49931, USA (URL: http://www.volcarno.com/, Twitter: @simoncarn); Radio NZ (URL: https://www.rnz.co.nz/news/pacific/494464/more-than-7-000-people-in-bougainville-need-temporary-accommodation-after-eruption); USAID, 1300 Pennsylvania Ave, NW, Washington DC 20004, USA (URL: https://www.usaid.gov/pacific-islands/press-releases/aug-08-2023-united-states-provides-immediate-emergency-assistance-support-communities-affected-mount-bagana-volcanic-eruptions).
Mayon (Philippines) — October 2023 Cite this Report
Mayon
Philippines
13.257°N, 123.685°E; summit elev. 2462 m
All times are local (unless otherwise noted)
Lava flows, pyroclastic flows, ash emissions, and seismicity during April-September 2023
Mayon is located in the Philippines and has steep upper slopes capped by a small summit crater. Historical eruptions date back to 1616 CE that have been characterized by Strombolian eruptions, lava flows, pyroclastic flows, and mudflows. Eruptions mostly originated from a central conduit. Pyroclastic flows and mudflows have commonly descended many of the approximately 40 drainages that surround the volcano. The most recent eruption occurred during June through October 2022 and consisted of lava dome growth and gas-and-steam emissions (BGVN 47:12). A new eruption was reported during late April 2023 and has included lava flows, pyroclastic density currents, ash emissions, and seismicity. This report covers activity during April through September 2023 based on daily bulletins from the Philippine Institute of Volcanology and Seismology (PHIVOLCS).
During April through September 2023, PHIVOLCS reported near-daily rockfall events, frequent volcanic earthquakes, and sulfur dioxide measurements. Gas-and-steam emissions rose 100-900 m above the crater and drifted in different directions. Nighttime crater incandescence was often visible during clear weather and was accompanied by incandescent avalanches of material. Activity notably increased during June when lava flows were reported on the S, SE, and E flanks (figure 52). The MIROVA graph (Middle InfraRed Observation of Volcanic Activity) showed strong thermal activity coincident with these lava flows, which remained active through September (figure 53). According to the MODVOLC thermal algorithm, a total of 110 thermal alerts were detected during the reporting period: 17 during June, 40 during July, 27 during August, and 26 during September. During early June, pyroclastic density currents (PDCs) started to occur more frequently.
Low activity was reported during much of April and May; gas-and-steam emissions rose 100-900 m above the crater and generally drifted in different directions. A total of 52 rockfall events and 18 volcanic earthquakes were detected during April and 147 rockfall events and 13 volcanic events during May. Sulfur dioxide flux measurements ranged between 400-576 tons per day (t/d) during April, the latter of which was measured on 29 April and between 162-343 t/d during May, the latter of which was measured on 13 May.
Activity during June increased, characterized by lava flows, pyroclastic density currents (PDCs), crater incandescence and incandescent rockfall events, gas-and-steam emissions, and continued seismicity. Weather clouds often prevented clear views of the summit, but during clear days, moderate gas-and-steam emissions rose 100-2,500 m above the crater and drifted in multiple directions. A total of 6,237 rockfall events and 288 volcanic earthquakes were detected. The rockfall events often deposited material on the S and SE flanks within 700-1,500 m of the summit crater and ash from the events drifted SW, S, SE, NE, and E. Sulfur dioxide emissions ranged between 149-1,205 t/d, the latter of which was measured on 10 June. Short-term observations from EDM and electronic tiltmeter monitoring indicated that the upper slopes were inflating since February 2023. Longer-term ground deformation parameters based on EDM, precise leveling, continuous GPS, and electronic tilt monitoring indicated that the volcano remained inflated, especially on the NW and SE flanks. At 1000 on 5 June the Volcano Alert Level (VAL) was raised to 2 (on a 0-5 scale). PHIVOLCS noted that although low-level volcanic earthquakes, ground deformation, and volcanic gas emissions indicated unrest, the steep increase in rockfall frequency may indicate increased dome activity.
A total of 151 dome-collapse PDCs occurred during 8-9 and 11-30 June, traveled 500-2,000 m, and deposited material on the S flank within 2 km of the summit crater. During 8-9 June the VAL was raised to 3. At approximately 1947 on 11 June lava flow activity was reported; two lobes traveled within 500 m from the crater and deposited material on the S (Mi-isi), SE (Bonga), and E (Basud) flanks. Weak seismicity accompanied the lava flow and slight inflation on the upper flanks. This lava flow remained active through 30 June, moving down the S and SE flank as far as 2.5 km and 1.8 km, respectively and depositing material up to 3.3 km from the crater. During 15-16 June traces of ashfall from the PDCs were reported in Sitio Buga, Nabonton, City of Ligao and Purok, and San Francisco, Municipality of Guinobatan. During 28-29 June there were two PDCs generated by the collapse of the lava flow front, which generated a light-brown ash plume 1 km high. Satellite monitors detected significant concentrations of sulfur dioxide beginning on 29 June. On 30 June PDCs primarily affected the Basud Gully on the E flank, the largest of which occurred at 1301 and lasted eight minutes, based on the seismic record. Four PDCs generated between 1800 and 2000 that lasted approximately four minutes each traveled 3-4 km on the E flank and generated an ash plume that rose 1 km above the crater and drifted N and NW. Ashfall was recorded in Tabaco City.
Similar strong activity continued during July; slow lava effusion remained active on the S and SE flanks and traveled as far as 2.8 km and 2.8 km, respectively and material was deposited as far as 4 km from the crater. There was a total of 6,983 rockfall events and 189 PDCs that affected the S, SE, and E flanks. The volcano network detected a total of 2,124 volcanic earthquakes. Continuous gas-and-steam emissions rose 200-2,000 m above the crater and drifted in multiple directions. Sulfur dioxide emissions averaged 792-4,113 t/d, the latter of which was measured on 28 July. During 2-4 July three PDCs were generated from the collapse of the lava flow and resulting light brown plumes rose 200-300 m above the crater. Continuous tremor pulses were reported beginning at 1547 on 3 July through 7 July at 1200, at 2300 on 8 July and going through 0300 on 10 July, and at 2300 on 16 July, as recorded by the seismic network. During 6-9 July there were 10 lava flow-collapse-related PDCs that generated light brown plumes 300-500 m above the crater. During 10-11 July light ashfall was reported in some areas of Mabinit, Legazpi City, Budiao and Salvacion, Daraga, and Camalig, Albay. By 18 July the lava flow advanced 600 m on the E flank as well.
During 1733 on 18 July and 0434 on 19 July PHIVOLCS reported 30 “ashing” events, which are degassing events accompanied by audible thunder-like sounds and entrained ash at the crater, which produced short, dark plumes that drifted SW. These events each lasted 20-40 seconds, and plume heights ranged from 150-300 m above the crater, as recorded by seismic, infrasound, visual, and thermal monitors. Three more ashing events occurred during 19-20 July. Short-term observations from electronic tilt and GPS monitoring indicate deflation on the E lower flanks in early July and inflation on the NW middle flanks during the third week of July. Longer-term ground deformation parameters from EDM, precise leveling, continuous GPS, and electronic tilt monitoring indicated that the volcano was still generally inflated relative to baseline levels. A short-lived lava pulse lasted 28 seconds at 1956 on 21 July, which was accompanied by seismic and infrasound signals. By 22 July, the only lava flow that remained active was on the SE flank, and continued to extend 3.4 km, while those on the S and E flanks weakened markedly. One ashing event was detected during 30-31 July, whereas there were 57 detected during 31 July-1 August; according to PHIVOLCS beginning at approximately 1800 on 31 July eruptive activity was dominated by phases of intermittent ashing, as well as increased in the apparent rates of lava effusion from the summit crater. The ashing phases consisted of discrete events recorded as low-frequency volcanic earthquakes (LFVQ) typically 30 seconds in duration, based on seismic and infrasound signals. Gray ash plume rose 100 m above the crater and generally drifted NE. Shortly after these ashing events began, new lava began to effuse rapidly from the crater, feeding the established flowed on the SE, E, and E flanks and generating frequent rockfall events.
Intensified unrest persisted during August. There was a total of 4,141 rockfall events, 2,881 volcanic earthquakes, which included volcanic tremor events, 32 ashing events, and 101 PDCs detected throughout the month. On clear weather days, gas-and-steam emissions rose 300-1,500 m above the crater and drifted in different directions (figure 54). Sulfur dioxide emissions averaged 735-4,756 t/d, the higher value of which was measured on 16 August. During 1-2 August the rate of lava effusion decreased, but continued to feed the flows on the SE, S, and E flanks, maintaining their advances to 3.4 km, 2.8 km, and 1.1 km from the crater, respectively (figure 55). Rockfall and PDCs generated by collapses at the lava flow margins and from the summit dome deposited material within 4 km of the crater. During 3-4 August there were 10 tremor events detected that lasted 1-4 minutes. Short-lived lava pulse lasted 35 seconds and was accompanied by seismic and infrasound signals at 0442 on 6 August. Seven collapses were recorded at the front of the lava flow during 12-14 August.
During September, similar activity of slow lava effusion, PDCs, gas-and-steam emissions, and seismicity continued. There was a total of 4,452 rockfall events, 329 volcanic earthquakes, which included volcanic tremor events, two ashing events, and 85 PDCs recorded throughout the month. On clear weather days, gas-and-steam emissions rose 100-1,500 m above the crater and drifted in multiple directions. Sulfur dioxide emissions averaged 609-2,252 t/d, the higher average of which was measured on 6 September. Slow lava effusion continued advancing on the SE, S, and E flanks, maintaining lengths of 3.4 km, 2.8 km, and 1.1 km, respectively. Rockfall and PDC events generated by collapses along the lava flow margins and at the summit dome deposited material within 4 km of the crater.
Geologic Background. Symmetrical Mayon, which rises above the Albay Gulf NW of Legazpi City, is the most active volcano of the Philippines. The steep upper slopes are capped by a small summit crater. Recorded eruptions since 1616 CE range from Strombolian to basaltic Plinian, with cyclical activity beginning with basaltic eruptions, followed by longer periods of andesitic lava flows. Eruptions occur predominately from the central conduit and have also produced lava flows that travel far down the flanks. Pyroclastic density currents and mudflows have commonly swept down many of the approximately 40 ravines that radiate from the summit and have often damaged populated lowland areas. A violent eruption in 1814 killed more than 1,200 people and devastated several towns.
Information Contacts: Philippine Institute of Volcanology and Seismology (PHIVOLCS), Department of Science and Technology, University of the Philippines Campus, Diliman, Quezon City, Philippines (URL: http://www.phivolcs.dost.gov.ph/); MIROVA (Middle InfraRed Observation of Volcanic Activity), a collaborative project between the Universities of Turin and Florence (Italy) supported by the Centre for Volcanic Risk of the Italian Civil Protection Department (URL: http://www.mirovaweb.it/); Hawai'i Institute of Geophysics and Planetology (HIGP) - MODVOLC Thermal Alerts System, School of Ocean and Earth Science and Technology (SOEST), Univ. of Hawai'i, 2525 Correa Road, Honolulu, HI 96822, USA (URL: http://modis.higp.hawaii.edu/); Copernicus Browser, Copernicus Data Space Ecosystem, European Space Agency (URL: https://dataspace.copernicus.eu/browser/); William Rogers, Legazpi City, Albay Province, Philippines.
Nishinoshima (Japan) — October 2023 Cite this Report
Nishinoshima
Japan
27.247°N, 140.874°E; summit elev. 100 m
All times are local (unless otherwise noted)
Eruption plumes and gas-and-steam plumes during May-August 2023
Nishinoshima, located about 1,000 km S of Tokyo, is a small island in the Ogasawara Arc in Japan. The island is the summit of a massive submarine volcano that has prominent submarine peaks to the S, W, and NE. Eruptions date back to 1973 and the current eruption period began in October 2022. Recent activity has consisted of small ash plumes and fumarolic activity (BGVN 48:07). This report covers activity during May through August 2023, using information from monthly reports of the Japan Meteorological Agency (JMA) monthly reports and satellite data.
Activity during May through June was relatively low. The Japan Coast Guard (JCG) did overflights on 14 and 22 June and reported white gas-and-steam emissions rising 600 m and 1,200 m from the central crater of the pyroclastic cone, respectively (figure 125). In addition, multiple white gas-and-steam emissions rose from the inner rim of the W side of the crater and from the SE flank of the pyroclastic cone. Discolored brown-to-green water was observed around almost the entire perimeter of the island; on 22 June light green discolored water was observed off the S coast of the island.
Observations from the Himawari meteorological satellite confirmed an eruption on 9 and 10 July. An eruption plume rose 1.6 km above the crater and drifted N around 1300 on 9 July. Satellite images acquired at 1420 and 2020 on 9 July and at 0220 on 10 July showed continuing emissions that rose 1.3-1.6 km above the crater and drifted NE and N. The Tokyo VAAC reported that an ash plume seen by a pilot and identified in a satellite image at 0630 on 21 July rose to 3 km altitude and drifted S.
Aerial observations conducted by JCG on 8 August showed a white-and-gray plume rising from the central crater of the pyroclastic cone, and multiple white gas-and-steam emissions were rising from the inner edge of the western crater and along the NW-SE flanks of the island (figure 126). Brown-to-green discolored water was also noted around the perimeter of the island.
Intermittent low-to-moderate power thermal anomalies were recorded in the MIROVA graph (Middle InfraRed Observation of Volcanic Activity), showing an increase in both frequency and power beginning in July (figure 127). This increase in activity coincides with eruptive activity on 9 and 10 July, characterized by eruption plumes. According to the MODVOLC thermal alert algorithm, one thermal hotspot was recorded on 20 July. Weak thermal anomalies were also detected in infrared satellite imagery, accompanied by strong gas-and-steam plumes (figure 128).
Geologic Background. The small island of Nishinoshima was enlarged when several new islands coalesced during an eruption in 1973-74. Multiple eruptions that began in 2013 completely covered the previous exposed surface and continued to enlarge the island. The island is the summit of a massive submarine volcano that has prominent peaks to the S, W, and NE. The summit of the southern cone rises to within 214 m of the ocean surface 9 km SSE.
Information Contacts: Japan Meteorological Agency (JMA), 1-3-4 Otemachi, Chiyoda-ku, Tokyo 100-8122, Japan (URL: http://www.jma.go.jp/jma/indexe.html); Tokyo Volcanic Ash Advisory Center (VAAC), 1-3-4 Otemachi, Chiyoda-ku, Tokyo 100-8122, Japan (URL: http://ds.data.jma.go.jp/svd/vaac/data/); MIROVA (Middle InfraRed Observation of Volcanic Activity), a collaborative project between the Universities of Turin and Florence (Italy) supported by the Centre for Volcanic Risk of the Italian Civil Protection Department (URL: http://www.mirovaweb.it/); Copernicus Browser, Copernicus Data Space Ecosystem, European Space Agency (URL: https://dataspace.copernicus.eu/browser/).
Krakatau (Indonesia) — October 2023 Cite this Report
Krakatau
Indonesia
6.1009°S, 105.4233°E; summit elev. 285 m
All times are local (unless otherwise noted)
White gas-and-steam plumes and occasional ash plumes during May-August 2023
Krakatau is located in the Sunda Strait between Java and Sumatra, Indonesia. Caldera collapse during the catastrophic 1883 eruption destroyed Danan and Perbuwatan cones and left only a remnant of Rakata. The post-collapse cone of Anak Krakatau (Child of Krakatau) was constructed within the 1883 caldera at a point between the former Danan and Perbuwatan cones; it has been the site of frequent eruptions since 1927. The current eruption period began in May 2021 and has recently consisted of Strombolian eruptions and ash plumes (BGVN 48:07). This report describes lower levels of activity consisting of ash and white gas-and-steam plumes during May through August 2023, based on information provided by the Indonesian Center for Volcanology and Geological Hazard Mitigation, referred to as Pusat Vulkanologi dan Mitigasi Bencana Geologi (PVMBG), MAGMA Indonesia, and satellite data.
Activity was relatively low during May and June. Daily white gas-and-steam emissions rose 25-200 m above the crater and drifted in different directions. Five ash plumes were detected at 0519 on 10 May, 1241 on 11 May, 0920 on 12 May, 2320 on 12 May, and at 0710 on 13 May, and rose 1-2.5 km above the crater and drifted SW. A webcam image taken on 12 May showed ejection of incandescent material above the vent. A total of nine ash plumes were detected during 6-11 June: at 1434 and 00220 on 6 and 7 June the ash plumes rose 500 m above the crater and drifted NW, at 1537 on 8 June the ash plume rose 1 km above the crater and drifted SW, at 0746 and at 0846 on 9 June the ash plumes rose 800 m and 3 km above the crater and drifted SW, respectively, at 0423, 1431, and 1750 on 10 June the ash plumes rose 2 km, 1.5 km, and 3.5 km above the crater and drifted NW, respectively, and at 0030 on 11 June an ash plume rose 2 km above the crater and drifted NW. Webcam images taken on 10 and 11 June at 0455 and 0102, respectively, showed incandescent material ejected above the vent. On 19 June an ash plume at 0822 rose 1.5 km above the crater and drifted SE.
Similar low activity of white gas-and-steam emissions and few ash plumes were reported during July and August. Daily white gas-and-steam emissions rose 25-300 m above the crater and drifted in multiple directions. Three ash plumes were reported at 0843, 0851, and 0852 on 20 July that rose 500-2,000 m above the crater and drifted NW.
The MIROVA (Middle InfraRed Observation of Volcanic Activity) graph of MODIS thermal anomaly data showed intermittent low-to-moderate power thermal anomalies during May through August 2023 (figure 140). Although activity was often obscured by weather clouds, a thermal anomaly was visible in an infrared satellite image of the crater on 12 May, accompanied by an eruption plume that drifted SW (figure 141).
Geologic Background. The renowned Krakatau (frequently mis-named as Krakatoa) volcano lies in the Sunda Strait between Java and Sumatra. Collapse of an older edifice, perhaps in 416 or 535 CE, formed a 7-km-wide caldera. Remnants of that volcano are preserved in Verlaten and Lang Islands; subsequently the Rakata, Danan, and Perbuwatan cones were formed, coalescing to create the pre-1883 Krakatau Island. Caldera collapse during the catastrophic 1883 eruption destroyed Danan and Perbuwatan, and left only a remnant of Rakata. This eruption caused more than 36,000 fatalities, most as a result of tsunamis that swept the adjacent coastlines of Sumatra and Java. Pyroclastic surges traveled 40 km across the Sunda Strait and reached the Sumatra coast. After a quiescence of less than a half century, the post-collapse cone of Anak Krakatau (Child of Krakatau) was constructed within the 1883 caldera at a point between the former Danan and Perbuwatan cones. Anak Krakatau has been the site of frequent eruptions since 1927.
Information Contacts: Pusat Vulkanologi dan Mitigasi Bencana Geologi (PVMBG, also known as Indonesian Center for Volcanology and Geological Hazard Mitigation, CVGHM), Jalan Diponegoro 57, Bandung 40122, Indonesia (URL: http://www.vsi.esdm.go.id/); MAGMA Indonesia, Kementerian Energi dan Sumber Daya Mineral (URL: https://magma.esdm.go.id/v1); MIROVA (Middle InfraRed Observation of Volcanic Activity), a collaborative project between the Universities of Turin and Florence (Italy) supported by the Centre for Volcanic Risk of the Italian Civil Protection Department (URL: http://www.mirovaweb.it/); Copernicus Browser, Copernicus Data Space Ecosystem, European Space Agency (URL: https://dataspace.copernicus.eu/browser/).
Villarrica (Chile) — October 2023 Cite this Report
Villarrica
Chile
39.42°S, 71.93°W; summit elev. 2847 m
All times are local (unless otherwise noted)
Strombolian activity, gas-and-ash emissions, and crater incandescence during April-September 2023
Villarrica, in central Chile, consists of a 2-km-wide caldera that formed about 3,500 years ago and is located at the base of the presently active cone at the NW margin of a 6-km-wide caldera. Historical eruptions eruptions date back to 1558 and have been characterized by mild-to-moderate explosive activity with occasional lava effusions. The current eruption period began in December 2014 and has recently consisted of nighttime crater incandescence, ash emissions, and seismicity (BGVN 48:04). This report covers activity during April through September 2023 and describes occasional Strombolian activity, gas-and-ash emissions, and nighttime crater incandescence. Information for this report primarily comes from the Southern Andes Volcano Observatory (Observatorio Volcanológico de Los Andes del Sur, OVDAS), part of Chile's National Service of Geology and Mining (Servicio Nacional de Geología y Minería, SERNAGEOMIN) and satellite data.
Seismicity during April consisted of long period (LP) events and tremor (TRE); a total of 9,413 LP-type events and 759 TR-type events were detected throughout the month. Nighttime crater incandescence persisted and was visible in the degassing column. Sulfur dioxide data was obtained using Differential Absorption Optical Spectroscopy Equipment (DOAS) that showed an average value of 1,450 ± 198 tons per day (t/d) during 1-15 April and 1,129 ± 201 t/d during 16-30 April, with a maximum daily value of 2,784 t/d on 9 April. Gas-and-steam emissions of variable intensities rose above the active crater as high as 1.3 km above the crater on 13 April. Strombolian explosions were not observed and there was a slight decrease in the lava lake level.
There were 14,123 LP-type events and 727 TR-type events detected during May. According to sulfur dioxide measurements taken with DOAS equipment, the active crater emitted an average value of 1,826 ± 482 t/d during 1-15 May and 912 ± 41 t/d during 16-30 May, with a daily maximum value of 5,155 t/d on 13 May. Surveillance cameras showed continuous white gas-and-steam emissions that rose as high as 430 m above the crater on 27 May. Nighttime incandescence illuminated the gas column less than 300 m above the crater rim was and no pyroclastic emissions were reported. A landslide was identified on 13 May on the E flank of the volcano 50 m from the crater rim and extending 300 m away; SERNAGEOMIN noted that this event may have occurred on 12 May. During the morning of 27 and 28 May minor Strombolian explosions characterized by incandescent ejecta were recorded at the crater rim; the last reported Strombolian explosions had occurred at the end of March.
Seismic activity during June consisted of five volcano-tectonic (VT)-type events, 21,606 LP-type events, and 2,085 TR-type events. The average value of sulfur dioxide flux obtained by DOAS equipment was 1,420 ± 217 t/d during 1-15 June and 2,562 ± 804 t/d, with a maximum daily value of 4,810 t/d on 17 June. White gas-and-steam emissions rose less than 480 m above the crater; frequent nighttime crater incandescence was reflected in the degassing plume. On 12 June an emission rose 100 m above the crater and drifted NNW. On 15 June one or several emissions resulted in ashfall to the NE as far as 5.5 km from the crater, based on a Skysat satellite image. Several Strombolian explosions occurred within the crater; activity on 15 June was higher energy and ejected blocks 200-300 m on the NE slope. Surveillance cameras showed white gas-and-steam emissions rising 480 m above the crater on 16 June. On 19 and 24 June low-intensity Strombolian activity was observed, ejecting material as far as 200 m from the center of the crater to the E.
During July, seismicity included 29,319 LP-type events, 3,736 TR-type events, and two VT-type events. DOAS equipment recorded two days of sulfur dioxide emissions of 4,220 t/d and 1,009 t/d on 1 and 13 July, respectively. Constant nighttime incandescence was also recorded and was particularly noticeable when accompanied by eruptive columns on 12 and 16 July. Minor explosive events were detected in the crater. According to Skysat satellite images taken on 12, 13, and 16 July, ashfall deposits were identified 155 m S of the crater. According to POVI, incandescence was visible from two vents on the crater floor around 0336 on 12 July. Gas-and-ash emissions rose as high as 1.2 km above the crater on 13 July and drifted E and NW. A series of gas-and-steam pulses containing some ash deposited material on the upper E flank around 1551 on 13 July. During 16-31 July, average sulfur dioxide emissions of 1,679 ± 406 t/d were recorded, with a maximum daily value of 2,343 t/d on 28 July. Fine ash emissions were also reported on 16, 17, and 23 July.
Seismicity persisted during August, characterized by 27,011 LP-type events, 3,323 TR-type events, and three VT-type events. The average value of sulfur dioxide measurements taken during 1-15 August was 1,642 ± 270 t/d and 2,207 ± 4,549 t/d during 16-31 August, with a maximum daily value of 3,294 t/d on 27 August. Nighttime crater incandescence remained visible in degassing columns. White gas-and-steam emissions rose 480 m above the crater on 6 August. According to a Skysat satellite image from 6 August, ash accumulation was observed proximal to the crater and was mainly distributed toward the E slope. White gas-and-steam emissions rose 320 m above the crater on 26 August. Nighttime incandescence and Strombolian activity that generated ash emissions were reported on 27 August.
Seismicity during September was characterized by five VT-type events, 12,057 LP-type events, and 2,058 TR-type events. Nighttime incandescence persisted. On 2 September an ash emission rose 180 m above the crater and drifted SE at 1643 (figure 125) and a white gas-and-steam plume rose 320 m above the crater. According to the Buenos Aires VAAC, periods of continuous gas-and-ash emissions were visible in webcam images from 1830 on 2 September to 0110 on 3 September. Strombolian activity was observed on 2 September and during the early morning of 3 September, the latter event of which generated an ash emission that rose 60 m above the crater and drifted 100 m from the center of the crater to the NE and SW. Ashfall was reported to the SE and S as far as 750 m from the crater. The lava lake was active during 3-4 September and lava fountaining was visible for the first time since 26 March 2023, according to POVI. Fountains captured in webcam images at 2133 on 3 September and at 0054 on 4 September rose as high as 60 m above the crater rim and ejected material onto the upper W flank. Sulfur dioxide flux of 1,730 t/d and 1,281 t/d was measured on 3 and 4 September, respectively, according to data obtained by DOAS equipment.
Strong Strombolian activity and larger gas-and-ash plumes were reported during 18-20 September. On 18 September activity was also associated with energetic LP-type events and notable sulfur dioxide fluxes (as high as 4,277 t/d). On 19 September Strombolian activity and incandescence were observed. On 20 September at 0914 ash emissions rose 50 m above the crater and drifted SSE, accompanied by Strombolian activity that ejected material less than 100 m SSE, causing fall deposits on that respective flank. SERNAGEOMIN reported that a Planet Scope satellite image taken on 20 September showed the lava lake in the crater, measuring 32 m x 35 m and an area of 0.001 km2. Several ash emissions were recorded at 0841, 0910, 1251, 1306, 1312, 1315, and 1324 on 23 September and rose less than 150 m above the crater. The sulfur dioxide flux value was 698 t/d on 23 September and 1,097 t/d on 24 September. On 24 September the Volcanic Alert Level (VAL) was raised to Orange (the third level on a four-color scale). SENAPRED maintained the Alert Level at Yellow (the middle level on a three-color scale) for the communities of Villarrica, Pucón (16 km N), Curarrehue, and Panguipulli.
During 24-25 September there was an increase in seismic energy (observed at TR-events) and acoustic signals, characterized by 1 VT-type event, 213 LP-type events, and 124 TR-type events. Mainly white gas-and-steam emissions, in addition to occasional fine ash emissions were recorded. During the early morning of 25 September Strombolian explosions were reported and ejected material 250 m in all directions, though dominantly toward the NW. On 25 September the average value of sulfur dioxide flux was 760 t/d. Seismicity during 25-30 September consisted of five VT-type events, 1,937 LP-type events, and 456 TR-type events.
During 25-29 September moderate Strombolian activity was observed and ejected material as far as the crater rim. In addition, ash pulses lasting roughly 50 minutes were observed around 0700 and dispersed ENE. During 26-27 September a TR episode lasted 6.5 hours and was accompanied by discrete acoustic signals. Satellite images from 26 September showed a spatter cone on the crater floor with one vent that measured 10 x 14 m and a smaller vent about 35 m NE of the cone. SERNAGEOMIN reported an abundant number of bomb-sized blocks up to 150 m from the crater, as well as impact marks on the snow, which indicated explosive activity. A low-altitude ash emission was observed drifting NW around 1140 on 28 September, based on webcam images. Between 0620 and 0850 on 29 September an ash emission rose 60 m above the crater and drifted NW. During an overflight taken around 1000 on 29 September scientists observed molten material in the vent, a large accumulation of pyroclasts inside the crater, and energetic degassing, some of which contained a small amount of ash. Block-sized pyroclasts were deposited on the internal walls and near the crater, and a distal ash deposit was also visible. The average sulfur dioxide flux measured on 28 September was 344 t/d. Satellite images taken on 29 September ashfall was deposited roughly 3 km WNW from the crater and nighttime crater incandescence remained visible. The average sulfur dioxide flux value from 29 September was 199 t/d. On 30 September at 0740 a pulsating ash emission rose 1.1 km above the crater and drifted NNW (figure 126). Deposits on the S flank extended as far as 4.5 km from the crater rim, based on satellite images from 30 September.
Infrared MODIS satellite data processed by MIROVA (Middle InfraRed Observation of Volcanic Activity) showed intermittent thermal activity during April through September, with slightly stronger activity detected during late September (figure 127). Small clusters of thermal activity were detected during mid-June, early July, early August, and late September. According to the MODVOLC thermal alert system, a total of four thermal hotspots were detected on 7 July and 3 and 23 September. This activity was also intermittently captured in infrared satellite imagery on clear weather days (figure 128).
Geologic Background. The glacier-covered Villarrica stratovolcano, in the northern Lakes District of central Chile, is ~15 km south of the city of Pucon. A 2-km-wide caldera that formed about 3,500 years ago is located at the base of the presently active, dominantly basaltic to basaltic andesite cone at the NW margin of a 6-km-wide Pleistocene caldera. More than 30 scoria cones and fissure vents are present on the flanks. Plinian eruptions and pyroclastic flows that have extended up to 20 km from the volcano were produced during the Holocene. Lava flows up to 18 km long have issued from summit and flank vents. Eruptions documented since 1558 CE have consisted largely of mild-to-moderate explosive activity with occasional lava effusion. Glaciers cover 40 km2 of the volcano, and lahars have damaged towns on its flanks.
Information Contacts: Servicio Nacional de Geología y Minería (SERNAGEOMIN), Observatorio Volcanológico de Los Andes del Sur (OVDAS), Avda Sta María No. 0104, Santiago, Chile (URL: http://www.sernageomin.cl/); Proyecto Observación Villarrica Internet (POVI) (URL: http://www.povi.cl/); Sistema y Servicio Nacional de Prevención y Repuesta Ante Desastres (SENAPRED), Av. Beauchef 1671, Santiago, Chile (URL: https://web.senapred.cl/); Buenos Aires Volcanic Ash Advisory Center (VAAC), Servicio Meteorológico Nacional-Fuerza Aérea Argentina, 25 de mayo 658, Buenos Aires, Argentina (URL: http://www.smn.gov.ar/vaac/buenosaires/inicio.php); MIROVA (Middle InfraRed Observation of Volcanic Activity), a collaborative project between the Universities of Turin and Florence (Italy) supported by the Centre for Volcanic Risk of the Italian Civil Protection Department (URL: http://www.mirovaweb.it/); Hawai'i Institute of Geophysics and Planetology (HIGP) - MODVOLC Thermal Alerts System, School of Ocean and Earth Science and Technology (SOEST), Univ. of Hawai'i, 2525 Correa Road, Honolulu, HI 96822, USA (URL: http://modis.higp.hawaii.edu/); Copernicus Browser, Copernicus Data Space Ecosystem, European Space Agency (URL: https://dataspace.copernicus.eu/browser/).
Merapi (Indonesia) — October 2023 Cite this Report
Merapi
Indonesia
7.54°S, 110.446°E; summit elev. 2910 m
All times are local (unless otherwise noted)
Frequent incandescent avalanches during April-September 2023
Merapi, located just north of the major city of Yogyakarta in central Java, Indonesia, has had activity within the last 20 years characterized by pyroclastic flows and lahars accompanying growth and collapse of the steep-sided active summit lava dome. The current eruption period began in late December 2020 and has more recently consisted of ash plumes, intermittent incandescent avalanches of material, and pyroclastic flows (BGVN 48:04). This report covers activity during April through September 2023, based on information from Balai Penyelidikan dan Pengembangan Teknologi Kebencanaan Geologi (BPPTKG), the Center for Research and Development of Geological Disaster Technology, a branch of PVMBG which specifically monitors Merapi. Additional information comes from the Pusat Vulkanologi dan Mitigasi Bencana Geologi (PVMBG, also known as Indonesian Center for Volcanology and Geological Hazard Mitigation, CVGHM), MAGMA Indonesia, the Darwin Volcanic Ash Advisory Centre (VAAC), and various satellite data.
Activity during April through September 2023 primarily consisted of incandescent avalanches of material that mainly affected the SW and W flanks and traveled as far as 2.3 km from the summit (table 25) and white gas-and-steam emissions that rose 10-1,000 m above the crater.
Table 25. Monthly summary of avalanches and avalanche distances recorded at Merapi during April through September 2023. The number of reported avalanches does not include instances where possible avalanches were heard but could not be visually confirmed as a result of inclement weather. Data courtesy of BPPTKG (April-September 2023 daily reports).
| Month |
Average number of avalanches per day |
Distance avalanches traveled (m) |
| Apr 2023 |
19 |
1,200-2,000 |
| May 2023 |
22 |
500-2,000 |
| Jun 2023 |
18 |
1,200-2,000 |
| Jul 2023 |
30 |
300-2,000 |
| Aug 2023 |
25 |
400-2,300 |
| Sep 2023 |
23 |
600-2,000 |
BPPTKG reported that during April and May white gas-and-steam emissions rose 10-750 m above the crater, incandescent avalanches descended 500-2,000 m on the SW and W flanks (figure 135). Cloudy weather often prevented clear views of the summit, and sometimes avalanches could not be confirmed. According to a webcam image, a pyroclastic flow was visible on 17 April at 0531. During the week of 28 April and 4 May a pyroclastic flow was reported on the SW flank, traveling up to 2.5 km. According to a drone overflight taken on 17 May the SW lava dome volume was an estimated 2,372,800 cubic meters and the dome in the main crater was an estimated 2,337,300 cubic meters.
During June and July similar activity persisted with white gas-and-steam emissions rising 10-350 m above the crater and frequent incandescent avalanches that traveled 300-2,000 m down the SW, W, and S flanks (figure 136). Based on an analysis of aerial photos taken on 24 June the volume of the SW lava dome was approximately 2.5 million cubic meters. A pyroclastic flow was observed on 5 July that traveled 2.7 km on the SW flank. According to the Darwin VAAC multiple minor ash plumes were identified in satellite images on 19 July that rose to 3.7 km altitude and drifted S and SW. During 22, 25, and 26 July a total of 17 avalanches descended as far as 1.8 km on the S flank.
Frequent white gas-and-steam emissions continued during August and September, rising 10-450 m above the crater. Incandescent avalanches mainly affected the SW and W flanks and traveled 400-2,300 m from the vent (figure 137). An aerial survey conducted on 10 August was analyzed and reported that estimates of the SW dome volume was 2,764,300 cubic meters and the dome in the main crater was 2,369,800 cubic meters.
Frequent and moderate-power thermal activity continued throughout the reporting period, according to a MIROVA (Middle InfraRed Observation of Volcanic Activity) analysis of MODIS satellite data (figure 138). There was an increase in the number of detected anomalies during mid-May. The MODVOLC thermal algorithm recorded a total of 47 thermal hotspots: six during April, nine during May, eight during June, 15 during July, four during August, and five during September. Some of this activity was captured in infrared satellite imagery on clear weather days, sometimes accompanied by incandescent material on the SW flank (figure 139).
Geologic Background. Merapi, one of Indonesia's most active volcanoes, lies in one of the world's most densely populated areas and dominates the landscape immediately north of the major city of Yogyakarta. It is the youngest and southernmost of a volcanic chain extending NNW to Ungaran volcano. Growth of Old Merapi during the Pleistocene ended with major edifice collapse perhaps about 2,000 years ago, leaving a large arcuate scarp cutting the eroded older Batulawang volcano. Subsequent growth of the steep-sided Young Merapi edifice, its upper part unvegetated due to frequent activity, began SW of the earlier collapse scarp. Pyroclastic flows and lahars accompanying growth and collapse of the steep-sided active summit lava dome have devastated cultivated lands on the western-to-southern flanks and caused many fatalities.
Information Contacts: Balai Penyelidikan dan Pengembangan Teknologi Kebencanaan Geologi (BPPTKG), Center for Research and Development of Geological Disaster Technology (URL: http://merapi.bgl.esdm.go.id/, Twitter: @BPPTKG); MAGMA Indonesia, Kementerian Energi dan Sumber Daya Mineral (URL: https://magma.esdm.go.id/v1); Pusat Vulkanologi dan Mitigasi Bencana Geologi (PVMBG, also known as Indonesian Center for Volcanology and Geological Hazard Mitigation, CVGHM), Jalan Diponegoro 57, Bandung 40122, Indonesia (URL: http://www.vsi.esdm.go.id/); Darwin Volcanic Ash Advisory Centre (VAAC), Bureau of Meteorology, Northern Territory Regional Office, PO Box 40050, Casuarina, NT 0811, Australia (URL: http://www.bom.gov.au/info/vaac/); MIROVA (Middle InfraRed Observation of Volcanic Activity), a collaborative project between the Universities of Turin and Florence (Italy) supported by the Centre for Volcanic Risk of the Italian Civil Protection Department (URL: http://www.mirovaweb.it/); Hawai'i Institute of Geophysics and Planetology (HIGP) - MODVOLC Thermal Alerts System, School of Ocean and Earth Science and Technology (SOEST), Univ. of Hawai'i, 2525 Correa Road, Honolulu, HI 96822, USA (URL: http://modis.higp.hawaii.edu/); Copernicus Browser, Copernicus Data Space Ecosystem, European Space Agency (URL: https://dataspace.copernicus.eu/browser/); Øystein Lund Andersen (URL: https://www.oysteinlundandersen.com/, https://twitter.com/oysteinvolcano).
Ebeko
Russia
50.686°N, 156.014°E; summit elev. 1103 m
All times are local (unless otherwise noted)
Moderate explosive activity with ash plumes continued during June-November 2023
Ebeko, located on the N end of Paramushir Island in Russia’s Kuril Islands just S of the Kamchatka Peninsula, consists of three summit craters along a SSW-NNE line at the northern end of a complex of five volcanic cones. Observed eruptions date back to the late 18th century and have been characterized as small-to-moderate explosions from the summit crater, accompanied by intense fumarolic activity. The current eruptive period began in June 2022, consisting of frequent explosions, ash plumes, and thermal activity (BGVN 47:10, 48:06). This report covers similar activity during June-November 2023, based on information from the Kamchatka Volcanic Eruptions Response Team (KVERT) and satellite data.
Moderate explosive activity continued during June-November 2023 (figures 50 and 51). According to visual data from Severo-Kurilsk, explosions sent ash 2-3.5 km above the summit (3-4.5 km altitude) during most days during June through mid-September. Activity after mid-September was slightly weaker, with ash usually reaching less than 2 km above the summit. According to KVERT the volcano in October and November was, with a few exceptions, either quiet or obscured by clouds that prevented satellite observations. KVERT issued Volcano Observatory Notices for Aviation (VONA) on 8 and 12 June, 13 and 22 July, 3 and 21 August, and 31 October warning of potential aviation hazards from ash plumes drifting 3-15 km from the volcano. Based on satellite data, KVERT reported a persistent thermal anomaly whenever weather clouds permitted viewing.
Geologic Background. The flat-topped summit of the central cone of Ebeko volcano, one of the most active in the Kuril Islands, occupies the northern end of Paramushir Island. Three summit craters located along a SSW-NNE line form Ebeko volcano proper, at the northern end of a complex of five volcanic cones. Blocky lava flows extend west from Ebeko and SE from the neighboring Nezametnyi cone. The eastern part of the southern crater contains strong solfataras and a large boiling spring. The central crater is filled by a lake about 20 m deep whose shores are lined with steaming solfataras; the northern crater lies across a narrow, low barrier from the central crater and contains a small, cold crescentic lake. Historical activity, recorded since the late-18th century, has been restricted to small-to-moderate explosive eruptions from the summit craters. Intense fumarolic activity occurs in the summit craters, on the outer flanks of the cone, and in lateral explosion craters.
Information Contacts: Kamchatka Volcanic Eruptions Response Team (KVERT), Far Eastern Branch, Russian Academy of Sciences, 9 Piip Blvd., Petropavlovsk-Kamchatsky, 683006, Russia (URL: http://www.kscnet.ru/ivs/kvert/).
Search Bulletin Archive by Publication Date
Select a month and year from the drop-downs and click "Show Issue" to have that issue displayed in this tab.
The default month and year is the latest issue available.
Bulletin of the Global Volcanism Network - Volume 31, Number 07 (July 2006)
Managing Editor: Richard Wunderman
Cleveland (United States)
Astronauts capture photo of 23 May eruption
Etna (Italy)
An upper E-flank fissure eruption lasting from 14 to 24 July 2006
Galeras (Colombia)
Ongoing dome growth and elevated seismicity, thousands evacuated in July 2006
Karthala (Comoros)
Seismic crisis on 28 May 2006 precedes lava lake eruption in Chahalé crater
Karymsky (Russia)
Ash plumes reaching 5 km; ongoing eruptions through at least mid-2006
Mayon (Philippines)
New eruptive pulse starting 13 July; lava flows; thousands evacuated
St. Helens (United States)
Eruption still extrudes dacitic dome lavas without energetic explosions
Sulu Range (Papua New Guinea)
Seismicity and emissions reported from volcano with no historical eruptions
Tungurahua (Ecuador)
14-15 July 2006 eruption, the strongest since onset of eruption in 1999
Cleveland (United States) — July 2006 Cite this Report
Cleveland
United States
52.825°N, 169.944°W; summit elev. 1730 m
All times are local (unless otherwise noted)
Astronauts capture photo of 23 May eruption
On 23 May 2006, the Alaska Volcano Observatory (AVO) received a report from the International Space Station indicating that a plume was observed moving W from Cleveland volcano at 2300 UTC (BGVN 31:06). A photograph of the plume taken from the International Space Station was released by the National Aeronautics and Space Administration (NASA) (figure 5).
Starting at about 2300 UTC, just before this image was taken, Cleveland underwent a short eruption. The volcanic plume was seen in Advanced Very High Resolution Radiometer (AVHRR) polar-orbiting satellite data beginning from 2307 UTC. By 0100 UTC on 24 May the ash plume had detached from the vent and was approximately 130 kilometers SW of the volcano. Satellite data showed a cloud height of about 6.1 km asl (table 1). The plume was no longer detectable in satellite imagery by 0057 UTC on 25 May. In response to the event, AVO raised the Level of Concern Color Code to 'Yellow.'
Table 1. Satellite observations of ash plume from Cleveland volcano. Courtesy of the Washington Volcanic Ash Advisory Center (VAAC).
| Date and Time (UTC) |
Plume altitude |
Direction and speed |
| 24 May 2006 (0200) |
8.2 km |
SW at 55 km/hour |
| 24 May 2006 (0800) |
6.7 km |
SW at 37-46 km/hour |
| 24 May 2006 (1400) |
6.1 km |
W at 37-46 km/hour |
The last eruption of Cleveland was 6 February 2006 (BGVN 31:01). Since 24 May 2006, no new information about ash emissions had been received, nor have indications of continuing activity been detected from satellite data for the volcano. This short-lived event was typical of recent Cleveland activity. On 7 August 2006, AVO downgraded the Level of Concern Color Code for Cleveland from 'Yellow' to 'Not Assigned." Because Cleveland is not monitored with real-time seismic instrumentation, during intervals of repose it does not receive an assignment of Color Code 'Green,' but instead is left 'Not Assigned.'
Geologic Background. The beautifully symmetrical Mount Cleveland stratovolcano is situated at the western end of the uninhabited Chuginadak Island. It lies SE across Carlisle Pass strait from Carlisle volcano and NE across Chuginadak Pass strait from Herbert volcano. Joined to the rest of Chuginadak Island by a low isthmus, Cleveland is the highest of the Islands of the Four Mountains group and is one of the most active of the Aleutian Islands. The native name, Chuginadak, refers to the Aleut goddess of fire, who was thought to reside on the volcano. Numerous large lava flows descend the steep-sided flanks. It is possible that some 18th-to-19th century eruptions attributed to Carlisle should be ascribed to Cleveland (Miller et al., 1998). In 1944 it produced the only known fatality from an Aleutian eruption. Recent eruptions have been characterized by short-lived explosive ash emissions, at times accompanied by lava fountaining and lava flows down the flanks.
Information Contacts: National Aeronautics and Space Administration (NASA) Earth Observatory (URL: http://earthobservatory.nasa.gov/); Washington Volcanic Ash Advisory Center (VAAC) (URL: http://www.ospo.noaa.gov/Products/atmosphere/vaac/); Jeffery Williams, NASA, ISS Crew Earth Observations and the Image Science & Analysis Group, Johnson Space Center 2101 NASA Parkway, Houston, TX 77058, USA.
Etna
Italy
37.748°N, 14.999°E; summit elev. 3357 m
All times are local (unless otherwise noted)
An upper E-flank fissure eruption lasting from 14 to 24 July 2006
This report covers the new eruption from an E-flank fissure during mid July 2006. Previously, on 7 September 2004, an eruptive period began that lasted until March 2005 (BGVN 29:09, 30:01). From March 2005 until November quiet degassing took place at the summit craters; on 16 December 2005 an explosive sequence at the summit was accompanied by an ash emission from the Bocca Nuova crater (BGVN 30:12). This report is from Sonia Calvari of the Istituto Nazionale di Geofisica e Vulcanologia (INGV) and covers the interval through 26 July. Brief mention is made at the end of the report about another episode starting on 31 August and going into at least mid-September.
On 14 July 2006 at 2330 a fissure opened on the E flank of the Southeast Crater (SEC) summit cone. Two vents along the fissure produced a lava flow spreading E to the Valle del Bove (figure 110). A helicopter survey carried out on 16 July at 0730 showed a braided lava flow field up to 1.7 km long. Based on the surface area and approximate volume of this lava flow field, workers estimated a mean output rate of ~ 2.6 m3/s during the first 32 hours of eruption. During the opening phase of the eruptive fissure, moderate strombolian emissions occurred at a third upper vent, located at about 3,100 m on the E flank of the SEC, just below the wide depression that cuts its eastern flank. It produced minor ash fallout on Catania. The composition of the ash was 80% juvenile, with small amount of lithics probably due to the opening phase of the vents.
On 17 July, the lava flow field was situated on the W wall of the Valle del Bove, and the two main flow fronts reached about 2,100 m elevation, spreading N of the Serra Giannicola Piccola ridge. The lava discharge peaked on 20 July (figure 111), when an effusion rate of ~ 10 m3/s drove the lava flow advance to a maximum distance of ~3 km within the Valle del Bove. The lava flow front widened at the base of Monte Centenari, at 1,800 m elevation, located at least 15 km from the closest villages. The effusion rate on 23 July decreased to ~3 m3/s. At that time the lava channels had narrowed and levees had partially collapsed. The eruption appeared to end on 24 July.
On 26 July, observers on the rim of the NE Crater heard strong explosions, and saw lapilli fall. This crater, together with the south pit within Bocca Nuova, showed significant thermal anomalies during a helicopter survey carried out on 24 July.
In the early morning of 31 August, Strombolian activity resumed at SEC's summit. In the next two weeks SEC was the scene of a series of dramatic events. By 11 September, lava from the SE flank of the SEC had advanced to reach ~3 km ESE. The resulting ribbon of lava was in places over 200 m wide. More details will follow in a subsequent report.
Geologic Background. Mount Etna, towering above Catania on the island of Sicily, has one of the world's longest documented records of volcanism, dating back to 1500 BCE. Historical lava flows of basaltic composition cover much of the surface of this massive volcano, whose edifice is the highest and most voluminous in Italy. The Mongibello stratovolcano, truncated by several small calderas, was constructed during the late Pleistocene and Holocene over an older shield volcano. The most prominent morphological feature of Etna is the Valle del Bove, a 5 x 10 km caldera open to the east. Two styles of eruptive activity typically occur, sometimes simultaneously. Persistent explosive eruptions, sometimes with minor lava emissions, take place from one or more summit craters. Flank vents, typically with higher effusion rates, are less frequently active and originate from fissures that open progressively downward from near the summit (usually accompanied by Strombolian eruptions at the upper end). Cinder cones are commonly constructed over the vents of lower-flank lava flows. Lava flows extend to the foot of the volcano on all sides and have reached the sea over a broad area on the SE flank.
Information Contacts: Sonia Calvari, Istituto Nazionale di Geofisica e Vulcanologia Sezione di Catania, Piazza Roma 2, 95123 Catania, Italy (URL: http://www.ct.ingv.it/); Reuters (URL: http://today.reuters.com/).
Galeras
Colombia
1.22°N, 77.37°W; summit elev. 4276 m
All times are local (unless otherwise noted)
Ongoing dome growth and elevated seismicity, thousands evacuated in July 2006
On 24 November 2005 an eruption began at Galeras that resulted in local ash fall (BGVN 31:01and 31:03). This report discusses behavior through mid-August 2006.
Through December 2005 to the end of March 2006, the lava dome in the main crater continued to grow and seismicity remained elevated. Because of an increase in tremor at Galeras on 28 March 2006, Instituto Colombiano de Geología y Minería (INGEOMINAS) raised the Alert Level from 3 (changes in the behavior of volcanic activity have been noted) to 2 (likely eruption in days or weeks). Although the seismic activity apparently decreased on 29 March, Galeras remained at Alert Level 2.
INGEOMINAS reported that Galeras remained at a critical state during April and May 2006, with a partially solidified lava dome in the main crater. Seismicity, deformation, gas emissions, and temperatures all decreased. During 10-17 April, there were small gas emissions from the volcano. During 9-15 May, there were small gas and sporadic ash emissions. During 12-19 June, ash columns reached heights of 0.6-1.4 km above the summit.
According to Reuters and BBC reports, an increase in volcanic activity 12 July prompted the Colombian government to order the evacuation of ~ 10,000 people living near Galeras. INGEOMINAS reported an increase in seismic activity and at least two explosive eruptions. Ash accumulated in the towns of La Florida and Nariño, about 10 km N, and in the town of Genoy, 5 km NE. The Alert Level was increased from 2 (likely eruption in days to weeks) to 1 (eruption imminent or occurring). On 13 July, because of decreased activity, the Alert Level was lowered from 1 to 3. Approximately 2,000 people had been taken to shelters.
On 17 July, INGEOMINAS reported that after the 12 July eruption of Galeras, seismic activity decreased considerably. Observations of the dome and secondary craters in the W sector after 12 July showed minor physical changes. Weak gas plumes were observed without associated seismic activity. Through the first two weeks of August 2006, seismic activity remained at low levels. Gas and steam emissions from the main crater continued. Galeras remained at Alert Level 3 (changes in the behavior of volcanic activity have been noted).
Geologic Background. Galeras, a stratovolcano with a large breached caldera located immediately west of the city of Pasto, is one of Colombia's most frequently active volcanoes. The dominantly andesitic complex has been active for more than 1 million years, and two major caldera collapse eruptions took place during the late Pleistocene. Long-term extensive hydrothermal alteration has contributed to large-scale edifice collapse on at least three occasions, producing debris avalanches that swept to the west and left a large open caldera inside which the modern cone has been constructed. Major explosive eruptions since the mid-Holocene have produced widespread tephra deposits and pyroclastic flows that swept all but the southern flanks. A central cone slightly lower than the caldera rim has been the site of numerous small-to-moderate eruptions since the time of the Spanish conquistadors.
Information Contacts: Diego Gomez Martinez, Observatorio Vulcanológico y Sismológico de Pasto (OVSP), INGEOMINAS, Carrera 31, 1807 Parque Infantil, PO Box 1795, Pasto, Colombia (URL: https://www2.sgc.gov.co/volcanes/index.html; Washington Volcanic Ash Advisory Center (VAAC), Satellite Analysis Branch (SAB), NOAA/NESDIS E/SP23, NOAA Science Center Room 401, 5200 Auth Road, Camp Springs, MD 20746, USA (URL: http://www.ospo.noaa.gov/Products/atmosphere/vaac/); El Pais (URL: http://elpais-cali.terra.com.co/paisonline/); Reuters; British Broadcasting Company (BBC) (URL: http://www.bbc.co.uk/).
Karthala
Comoros
11.75°S, 43.38°E; summit elev. 2361 m
All times are local (unless otherwise noted)
Seismic crisis on 28 May 2006 precedes lava lake eruption in Chahalé crater
On 28 May 2006, a magmatic eruption occurred inside the Chahalé caldera of Karthala volcano. Information in the previous report (BGVN 31:06) was based on newspaper accounts. This report comes from Hamidou Nassor, Julie Morin, Christopher Gomez, Magali Smietana, François Sauvestre, and Christopher Gomez. They noted some key references relating to Karthala, including a 2001 dissertation (Bachèlery and others, 1995; Krafft, 1982; and Nassor, 2001).
The 28 May 2006 crisis began with a few hours of elevated seismic activity, beginning around 1230 (local time). Three hours later, seismic stations recorded a small crisis that lasted for 6 hours and produced both SP and LP signals. Around 2107 the magmatic eruption began. Seismographs recorded a tremor only a few seconds later.
From the coast of the island a red cloud was visible above the volcano. Scientists at the Karthala observatory met with government representatives and confirmed a magmatic eruption. It was not yet known if the eruption had occurred on the caldera floor or inside the main crater. A trip to the volcano was necessary in order to assess the volcanic activity and determine the exact location of the eruption. Two hypotheses were proposed: (1) If the eruption was located in the N part of the caldera, the lava could flow outside the caldera, towards populated areas; (2) If the eruption was located inside the main crater, to the S, lava would remain inside the crater. The Comorian authorities helped the scientific team to get assistance from the South African Army (AMISEC) to fly over the volcano.
On the morning of 29 May 2006, the scientific team and AMISEC personnel flew over the volcano. They saw that the eruption was contained inside the main (Chahalé) crater, where the past three eruptions had occurred. A lava fountain was observed in the middle of the lava lake (figure 25). No lava flow was observed outside the caldera. Seismic records showed a tremor caused by the lava fountain; the fountain was apparently spurting since the beginning of the eruption.
On the morning of 31 May, the scientific team returned to Karthala with AMISEC forces. Part of the lake was still mobile and bubbling, but part had solidified on the surface in the SE and a few blocks were floating on the side of the lake (figure 26). No projectiles overshot the caldera rim.
On 1 June 2006 seismic monitoring indicated the end of the tremor phase. On 2 June scientists returned to the summit with AMISEC forces. They observed that the surface of the lava lake was solidified, but the deeper portions of the lake remained hot (figure 27).
References. Bachèlery, P., Damir, B.A., Desgrolard, F., Toutain, J.P, Coudray, J.P., Cheminée, J-L., Delmond, J.C., and Klein, J.L. 1995, L'éruption phréatique du Karthala (Grande Comore) en juillet 1991: C.R Acad. Sci. Paris, 320, série Iia, p. 691-698.
Krafft, M., 1982, L'éruption volcanique du Karthala en avril 1977 (Grande Comore, Océan Indien): C.R. Acad. Sci. Paris, t 294, série II, p. 753-758.
Nassor, H., 2001, Contribution ? l'étude du risque volcanique sur les grands volcans boucliers basaltiques: le Karthala et le Piton de la Fournaise: Ph.D. thesis, Univ. Reunion.
Geologic Background. The southernmost and largest of the two shield volcanoes forming Grand Comore Island (also known as Ngazidja Island), Karthala contains a 3 x 4 km summit caldera generated by repeated collapse. Elongated rift zones extend to the NNW and SE from the summit of the Hawaiian-style basaltic shield, which has an asymmetrical profile that is steeper to the S. The lower SE rift zone forms the Massif du Badjini, a peninsula at the SE tip of the island. Historical eruptions have modified the morphology of the compound, irregular summit caldera. More than twenty eruptions have been recorded since the 19th century from the summit caldera and vents on the N and S flanks. Many lava flows have reached the sea on both sides of the island. An 1860 lava flow from the summit caldera traveled ~13 km to the NW, reaching the W coast to the N of the capital city of Moroni.
Information Contacts: Hamidou Nassor (LSTUR) Université de la Réunion BP 7151, 15 Avenue, René Cassin, 97715 Saint-Denis; Julie Morin; Christopher Gomez, Laboratoire de géographie physique CNRS LGP; Magali Smietana, Universite de Rennes 1, France; Francois Sauvestre (CNDRS), BP 169, Moroni (URL: http://volcano.ipgp.jussieu.fr/karthala/stationkar.html).
Karymsky
Russia
54.049°N, 159.443°E; summit elev. 1513 m
All times are local (unless otherwise noted)
Ash plumes reaching 5 km; ongoing eruptions through at least mid-2006
During April, May and June 2006, intermittent eruptive activity at Karymsky continued. Pilots had previously reported ash emissions from Karymsky rising to 3-5 km altitude during January to April 2006, during which time Karymsky remained at Concern Color Code Orange (BGVN 31:04). The same color code stayed in effect through August 2006.
Based on interpretations of April-June 2006 seismic data, ash plumes rose to altitudes of between 3 and 8 km. Satellite imagery showed a large thermal anomaly at the volcano's crater from January to August 2006, and numerous ash plumes and deposits extended 10-200 km SE and E of the volcano.
During 10-16 June 2006, 400-600 shallow earthquakes occurred daily. Ash plumes up to 5 km altitude traveling SE were observed by pilots. On 19 June, the Advanced Spaceborne Thermal Emission and Reflection Radiometer (ASTER) on NASA's Terra satellite captured a false-color image of an ash plume from Karymsky (figure 12). During 21-27 June 200-700 shallow earthquakes occurred daily; during 23-30 June, 100-350 shallow earthquakes occurred daily.
According to the Tokyo VAAC, the Kamchatkan Experimental and Methodical Seismological Department (KEMSD) reported that during July 2006 ash plumes reached altitudes between 3 and 7 km. Approximately 100-350 shallow earthquakes occurred daily during 29 June to 3 July, and increased to 1,000 per day during 4-5 July.
Activity at Karymsky continued during 8-14 July, with 250-1000 shallow earthquakes occurring daily. Based on interpretations of seismic data, ash plumes reached altitudes of 5 km.
During August 2006, 100-300 shallow earthquakes occurred daily. Based on interpretations of seismic data, ash plumes reached altitudes of 3-3.7 km.
Geologic Background. Karymsky, the most active volcano of Kamchatka's eastern volcanic zone, is a symmetrical stratovolcano constructed within a 5-km-wide caldera that formed during the early Holocene. The caldera cuts the south side of the Pleistocene Dvor volcano and is located outside the north margin of the large mid-Pleistocene Polovinka caldera, which contains the smaller Akademia Nauk and Odnoboky calderas. Most seismicity preceding Karymsky eruptions originated beneath Akademia Nauk caldera, located immediately south. The caldera enclosing Karymsky formed about 7600-7700 radiocarbon years ago; construction of the stratovolcano began about 2000 years later. The latest eruptive period began about 500 years ago, following a 2300-year quiescence. Much of the cone is mantled by lava flows less than 200 years old. Historical eruptions have been vulcanian or vulcanian-strombolian with moderate explosive activity and occasional lava flows from the summit crater.
Information Contacts: Olga Girina, Kamchatka Volcanic Eruptions Response Team (KVERT), a cooperative program of the Institute of Volcanic Geology and Geochemistry, Far East Division, Russian Academy of Sciences, Piip Ave. 9, Petropavlovsk-Kamchatsky, 683006, Russia, the Kamchatka Experimental and Methodical Seismological Department (KEMSD), GS RAS (Russia), and the Alaska Volcano Observatory (USA); Alaska Volcano Observatory (AVO), a cooperative program of the U.S. Geological Survey, 4200 University Drive, Anchorage, AK 99508-4667, USA (URL: http://www.avo.alaska.edu/), the Geophysical Institute, University of Alaska, PO Box 757320, Fairbanks, AK 99775-7320, USA, and the Alaska Division of Geological and Geophysical Surveys, 794 University Ave., Suite 200, Fairbanks, AK 99709, USA; Tokyo Volcanic Ash Advisory Center (VAAC) (URL: https://ds.data.jma.go.jp/svd/vaac/data/).
Mayon
Philippines
13.257°N, 123.685°E; summit elev. 2462 m
All times are local (unless otherwise noted)
New eruptive pulse starting 13 July; lava flows; thousands evacuated
Mayon was last reported on in March 2006 (BGVN 31:03), discussing an eruption in February 2006. Low-level activity and seismicity prevailed through early July. This report covers an eruptive pulse that began on 13 July 2006 and continued through August 2006. On 13 July there were phreatic eruptions that produced light ashfall in the areas of Calbayog and Malilipot. At 2200 on 14 July, authorities raised the Alert Level from 1 to 3 due to moderate white steam drifting NE and lava flows extending 0.7-1.0 km from the summit onto the SE slopes. On 15 July, the lava flow continued its SE progression towards Bonga gully.
On 16 July, the 6 km radius hazard zone known as the Permanent Danger Zone (PDZ) established around the SE area, was extended to 7 km and during the period covered by this report the radius of the danger zone around the southern sector was extended to 8 km. On 18 July, the Philippine Institute of Volcanology and Seismology (PHIVOLCS) reported that the lava flow had reached 1 km in length and incandescent boulders had rolled 3 km towards the Bonga gully. Seismicity, reported SO2 fluxes, and posted alert levels appear in table 8.
Table 8. Mayon's reported seismicity, SO2 fluxes, and alert levels during 15 July 2006 to 24 August 2006. "?" indicates information not available. Courtesy of PHIVOLCS.
| Date |
Volcanic earthquakes |
Tremor episodes |
SO2 flux (t/d) |
Alert Level |
| 15 Jul 2006 |
-- |
111 |
2,211 |
3 |
| 17 Jul 2006 |
-- |
314 |
1,513 |
3 |
| 18 Jul 2006 |
-- |
-- |
-- |
3 |
| 19 Jul 2006 |
-- |
250 |
2,157 |
3 |
| 20 Jul 2006 |
-- |
-- |
-- |
-- |
| 21 Jul 2006 |
-- |
-- |
-- |
-- |
| 22 Jul 2006 |
-- |
-- |
-- |
-- |
| 23 Jul 2006 |
-- |
-- |
-- |
-- |
| 24 Jul 2006 |
11 |
324 |
7,020 |
3 |
| 25 Jul 2006 |
12 |
564 |
5,886 |
3 |
| 26 Jul 2006 |
7 |
316 |
9,275 |
3 |
| 27 Jul 2006 |
6 |
421 |
4,550 |
3 |
| 28 Jul 2006 |
8 |
423 |
8,724 |
3 |
| 29 Jul 2006 |
4 |
394 |
6,099 |
3 |
| 31 Jul 2006 |
-- |
388 |
12,548 |
3 |
| 01 Aug 2006 |
-- |
354 |
7,418 |
3 |
| 02 Aug 2006 |
16 |
450 |
7,050 |
3 |
| 03 Aug 2006 |
51 |
343 |
4,760 |
3 |
| 04 Aug 2006 |
18 |
354 |
2,965 |
3 |
| 05 Aug 2006 |
18 |
354 |
2,965 |
3 |
| 06 Aug 2006 |
12 |
371 |
1,919 |
3 |
| 07 Aug 2006 |
-- |
-- |
-- |
-- |
| 08 Aug 2006 |
109 |
344 |
12,745 |
4 |
| 09 Aug 2006 |
21 |
294 |
7,829 |
4 |
| 10 Aug 2006 |
3 |
501 |
6,573 |
4 |
| 11 Aug 2006 |
6 |
213 |
6,876 |
4 |
| 12 Aug 2006 |
6 |
191 |
3,423 |
4 |
| 13 Aug 2006 |
13 |
158 |
5,427 |
4 |
| 14 Aug 2006 |
16 |
152 |
3,493 |
4 |
| 16 Aug 2006 |
15 |
154 |
8,086 |
4 |
| 17 Aug 2006 |
5 |
130 |
2,937 |
4 |
| 18 Aug 2006 |
32 |
307 |
2,937 |
4 |
| 19 Aug 2006 |
22 |
240 |
2,712 |
4 |
| 20 Aug 2006 |
15 |
253 |
6,634 |
4 |
| 21 Aug 2006 |
15 |
274 |
5,390 |
4 |
| 22 Aug 2006 |
24 |
431 |
2,445 |
4 |
| 23 Aug 2006 |
10 |
316 |
5,215 |
4 |
| 24 Aug 2006 |
18 |
451 |
6,328 |
4 |
Pyroclastic flows on the SE slopes prompted approximately 100 families to evacuate on 20 July. On 22 July, lava flows advanced NE towards the Mabinit channel. By 24 July, lava flows had traveled SSE, ~4 km from the summit toward Bonga gully, and branched off to the W and E. Incandescent blocks shed from the toe and margins of the flows traveled SE and were visible at night. Additionally, on 24 July seismographs recorded more than 324 tremor episodes and 11 volcanic earthquakes. SO2 emissions from the summit crater reached 7,000 metric tons per day, several times larger than fluxes reported earlier.
PHIVOLCS reported lava flow advance in terms of straight-line distances, which progressed as follows: 26 July, 4.45 km; 27 July, 4.7 km; and 29 July, 5.4 km. During this time, SO2 rates remained high (table 8), suggesting fresh magma at shallow levels in the volcano. The number of tremor episodes and earthquakes also remained high. Tremor was thought to indicate near-continuous lava blocks detaching from the lava flows. Volcanic earthquakes were thought to reflect ascending magma. Figure 11 shows the lava flow front on 29 July.
On 29 July, light ash accumulation was reported about 12 km S and SE, in Daraga municipality and Legazpi City and vicinity, respectively. Emissions of sulfur-dioxide reached ~ 12,500 tons per day on 31 July, a record high for this reporting interval. By 1 August, in the SE sector of the Bonga gully, lava flows had advanced ~1.35 km, and in the SSE sector they had advanced a maximum distance of 5.8 km from the summit.
According to a Philippine Information Agency (PIA) press report, military and police checkpoints were set up on 2 August around the 6-km-radius PDZ to prohibit entry. A large lava deposit had grown on the SE flanks. The lava which faced Legazpi and Daraga, had piled up during the initial two weeks of the eruption and threatened to cross the PDZ. PHIVOLCS had reported that the advancing incandescent front of the lava flow was ~20 m high and 50 m wide (figure 12). PHIVOLCS estimated that the lava front could breach the 6-km-radius PDZ within two to three days.
An overflight of Mayon on 6 August revealed that lavas discharging from the summit crater extended along the Mabinit channel and spilled into the Bonga gully, E of the Mabinit channel. Due to the decreased supply of lava to the Mabinit channel, the flow there was expected to cease a short distance beyond the 6-km-radius PDZ. Six ash explosions sent ash columns up to 800 m above the summit, prompting PHIVOLCS to raise the alert level from 3 to 4, indicating an eruption is imminent. According to the Manila Bulletin Online, as many as 50,00 people in the Albay province were evacuated.
On 7 August, an advancing lava flow crossed 100 m beyond the 6-km-radius PDZ. According to the Manila Standard Today, authorities warned residents of more lava and fires as the lava flows crept along the Mabinit and Bonga gullies.
During 9-15 August, explosive activity continued at Mayon after a brief respite on 8 August. Based on interpretations of seismic data, minor explosions during 9-11 and 13-15 August were accompanied by lava extrusion and collapsing lava flow fronts that released blocks and small fragments. A drop in SO2 emissions on 9 August worried volcanologists that something had blocked the flow of magma in Mayon's conduit and could therefore cause a build up in pressure resulting in a larger eruption. Visual observations were commonly obscured by clouds. On 11 August an ash plume was seen drifting ESE. On 12 August, four explosions occurred; one produced a pyroclastic flow that traveled over the SE and E slopes and generated a plume that rose to an altitude of 500 m and then drifted NE. On 15 August, a brief break in the clouds allowed for a view and confirmed the presence of fresh pyroclastic deposits from activity in the previous days. Approximately 40,000 people remained in evacuation centers and authorities maintained an Extended Danger Zone at 8 km from the summit in the SE sector.
PHIVOLCS reported that explosions from Mayon continued during 16-19 August. On 17 August, ash-and-steam plumes drifted at least 5.3 km NE and reached the town Calbayog, where light ashfall was reported. Lava extrusion continued and on the SE slopes lava-flow fronts shed blocks and small fragments. On 18 August, the Mibinit and Bonga gully lava flows reached ~ 6.8 km SE from the summit. PHIVOLCS estimated the volume of erupted materials at between 36 and 41 million cubic meters.
Geologic Background. Symmetrical Mayon, which rises above the Albay Gulf NW of Legazpi City, is the most active volcano of the Philippines. The steep upper slopes are capped by a small summit crater. Recorded eruptions since 1616 CE range from Strombolian to basaltic Plinian, with cyclical activity beginning with basaltic eruptions, followed by longer periods of andesitic lava flows. Eruptions occur predominately from the central conduit and have also produced lava flows that travel far down the flanks. Pyroclastic density currents and mudflows have commonly swept down many of the approximately 40 ravines that radiate from the summit and have often damaged populated lowland areas. A violent eruption in 1814 killed more than 1,200 people and devastated several towns.
Information Contacts: Philippine Institute of Volcanology and Seismology (PHIVOLCS), PHIVOLCS Building, C.P. Garcia Avenue, U.P. Campus, Diliman, Quezon City, Philippines, Reuters Alert Network (URL: http://www.alertnet.org/thenews/newsdesk/MAN212904.htm); The Associated Press (URL: http://www.ap.org/); Manila Standard Today (URL: http://manilastandard.net/); Manila Bulletin Online (URL: http://www.mb.com.ph/).
St. Helens (United States) — July 2006 Cite this Report
St. Helens
United States
46.2°N, 122.18°W; summit elev. 2549 m
All times are local (unless otherwise noted)
Eruption still extrudes dacitic dome lavas without energetic explosions
The current and ongoing eruption of the St. Helens started on 11 October 2004. Extrusion of the growing lava dome has continued in the same quiescent mode exhibited over the past year, and levels of seismicity remained generally low, with low emissions of steam and volcanic gases and minor production of ash. From 1830 hours on 26 October 2004 to 15 August 2006, a total of 13,841 seismic triggers have occurred. Figures 65 and 66 summarize seismicity over the past year. A decade-long time-depth plot clearly shows the start of the current eruption (figure 67).
Pictures and movies taken in August 2006 with the Brutus camera (located on the E rim of the 1980 Mount St. Helens crater) showed continued extrusion of spine 7 on the growing lava dome (figure 68) (photos and movies are also available on the CVO website). Between 4-5 and 7-8 August a segment of the middle part of spine 7 temporarily stopped moving. At 1310 on 5 August a magnitude 3.6 earthquake occurred, and subsequent photographs showed that the "stuck" segment became unstuck. Motion again stopped sometime after 1310 on 7 August and much of 8 August, when a M 3.3 earthquake occurred at 2001 on 8 August. Clouds obscured the volcano from view on 9 August, but parted enough on 10 August to show that once again the segment became unstuck. One explanation by CVO scientists for these observations is that the large earthquakes were caused by parts of the spine sticking and then slipping.
Geologic Background. Prior to 1980, Mount St. Helens was a conical volcano sometimes known as the Fujisan of America. During the 1980 eruption the upper 400 m of the summit was removed by slope failure, leaving a 2 x 3.5 km breached crater now partially filled by a lava dome. There have been nine major eruptive periods beginning about 40-50,000 years ago, and it has been the most active volcano in the Cascade Range during the Holocene. Prior to 2,200 years ago, tephra, lava domes, and pyroclastic flows were erupted, forming the older edifice, but few lava flows extended beyond the base of the volcano. The modern edifice consists of basaltic as well as andesitic and dacitic products from summit and flank vents. Eruptions in the 19th century originated from the Goat Rocks area on the N flank, and were witnessed by early settlers.
Information Contacts: U.S. Geological Survey Cascades Volcano Observatory, Vancouver, WA (URL: https://volcanoes.usgs.gov/observatories/cvo/); The Pacific Northwest Seismograph Network, University of Washington Dept. of Earth and Space Sciences, Box 351310, Seattle, WA (URL: http://www.geophys.washington.edu/SEIS/PNSN/).
Sulu Range (Papua New Guinea) — July 2006 Cite this Report
Sulu Range
Papua New Guinea
5.5°S, 150.942°E; summit elev. 610 m
All times are local (unless otherwise noted)
Seismicity and emissions reported from volcano with no historical eruptions
On 7 July 2006, observers reported the first historical indication of volcanic activity in the Sulu Range of New Britain (in the nation of Papua New Guinea (PNG)). As shown on figure 1, the Sulu Range lies near the N coast of New Britain Island. This spot sits in the Province of West New Britain but in terms of geometry, lies closer to the middle of the island ~100 km E of the prominent, N-trending Willaumez Peninsula and ~200 km SW of Rabaul at the island's E end.
Rabaul Volcano Observatory (RVO) noted that ground observations at the Sulu Range, confirmed by aerial inspection, indicated that the emissions were coming from an area initially incorrectly disclosed as Mount Karai. (Karai is reportedly equivalent to Mount Ruckenberg, mentioned below.) Later reports correcting the initial vent location, stated that the eruption took place 2 km SW of Mount Karai between Ubia and Ululu volcanoes.
Considerable light on the Sulu Range and other volcanoes in the vicinity is shed by an Australian Bureau of Mineral Resources report by Johnson (1971). The coordinates and summit elevation given in the header above apply to the highest point in the Sulu Range, Mount Malopu (synonyms include "Malutu" and "Malobu").
Changes in our nomenclature. We indicate Walo hot springs on the lower map of figure 1, the only feature in this vicinity previously identified in our database on active volcanoes. Walo was listed as a thermal feature in the Melanesian portion of the Catalog of Active Volcanoes of the World (Fisher, 1957) and in Simkin and Siebert (1994). Walo rests in a low swampy area ~ 3 km W of the edge of the Sulu Range, which we apply broadly to a ~ 10 km diameter mountainous area with multiple peaks of ~ 500-600 m elevation. The highland areas associated with the Sulu Range's NE end contains a cone near the coast, which is labeled "Mount Ruckenberg (extinct volcano)" on the Bangula Sheet (Papua New Guinea 1:100,000 Topographic Survey, 1975).
The Sulu Range eruption has spurred restructuring of our naming conventions. Walo is now listed as a thermal feature associated with the larger volcanic field called the Sulu Range (and it preserves the Volcano Number that used to apply only to Walo, 0502-09=).
2006 eruption and earthquakes. RVO reported that there were indications as early as February 2006 that something was changing at Sulu Range because vegetation there was dying off. RVO noted that earthquakes began on 6 July and most river systems near Mount Karai had turned muddy due to the continuous shaking. Seismic activity was followed by the emission of puffs of white vapor from the area and loud booming and rumbling noises accompanied strong tremors.
Eruptions started with forceful dark emissions late on 7 and 8 July and decreased to moderate emissions by 10 July. At the settlement Bialla, ~20 km NE of the Sulu Range, tremors were felt. These were also picked up by the seismic stations at Garbuna and Ulawun (~100 km W and ENE, respectively).
In a report discussing 10-11 July, RVO reported that three villages N of Mount Karai had been evacuated. For the 10th, RVO described the activity as weak-to-moderate emission of white vapor with no evidence of ashfall and with occasional weak-to-moderate roaring noises accompanying the emissions. On the 11th, associated with earthquakes, white puffs discharged. Similar observations of white emissions prevailed through the 12th.
Earthquakes increased both in size and frequency of occurrence, and on 11 July at Bialla they took place every 10-20 minutes. Near Ubia volcano, seismicity was very elevated, with earthquakes every few minutes. At 0820 on 12 July a large earthquake of Modified Mercalli (MM) intensity VII or more occurred in the region. It disturbed the shoreline, which discolored the seawater; shaking also caused the sea surface to become choppy.
The USGS epicenter for the above-cited 12 July (local time) earthquake was listed at very nearly the same time (in UTC, on 11 July at 2222) with epicenter at 5.48°S, 150.83°E, a depth of 37 km and a body magnitude (mb) of 4.90. That spot lies 12 km NE of Sulu Range (using the coordinates listed in the header above). On a table of earthquakes the same day (11 July, UTC), seven others, mb 3.9-4.7 occurred within several hundred kilometers of Sulu Range. All took place earlier, but a pattern of substantial ongoing earthquakes also prevailed later as well.
RVO noted that from 1600 on 12 July to 0900 on 13 July high-frequency earthquakes occurring at the rate of one every minute were recorded on the seismograph deployed at Bialla. The earthquakes recorded were of varying (though unstated) magnitudes and towards 0900 decreased slightly to one every 30 minutes. Shortly afterwards, from 1000 to 1400 on 13 July, the seismograph was deployed in Kaiamu village on the small point immediately NW of the uplands portions of the Sulu Range, where it recorded continuous strings of high frequency earthquakes. Although the instrument was out of service after 1400 on the 13th, recording resumed that afternoon and seismic activity continued at a high level through 0900 on 15 July. During this time, the occurrence of felt earthquakes with maximum MM intensity V increased from one every 40-60 minutes to one every 2-3 minutes. Details of a subsequent decline in seismicity are sketchy.
The last reported visible emissions from the Sulu Range were on 12 July. By early August 2006 seismic activity had decreased to earthquakes of MM intensity I to II occurring at increasing intervals.
Again referring to USGS seismicity tables, the previously mentioned pattern of ongoing earthquakes on 11 July, generally mb 3.9-4.9, continued. An exception, the largest magnitude event during 9-18 July struck 31 km from Sulu Range, listed in UTC on 13 July at 2248; mb 5.1. It was at 39 km depth with epicenter ~12 km away. About 5 hours later a mb 4.7 event was recorded directly at volcano. On the 19th two larger earthquakes struck. One an Ms 6.4 centered 28 km away; the second, an Mw 5.90, 33 km away. These were the largest earthquakes within 50 km during 1 July to 11 September 2006.
References. Fisher N H, 1957, Melanesia: Catalog of Active Volcanoes of the World and Solfatara Fields, Rome, IAVCEI, v. 5, p. 1-105.
Johnson, R.W., 1971, Bamus volcano, Lake Hargy area, and Sulu Range, New Britain: Volcanic geology and petrology, Aust. Bur. Min. Res. Geol. Geophys. Rec, 1971/55, p. 1-36.
Papua New Guinea 1:100,000 Topographic Survey, 1975, Bangula Sheet, Sheet 9187, Series T601: Royal Australian Survey Corps (Reprinted by the National Mapping Bureau, 1985).
Simkin, T., and Siebert, L., 1994, Volcanoes of the World: Geoscience Press, Tucson, Arizona, 349 p. (ISBN 0-945005-12-1).
Geologic Background. The Sulu Range consists of a cluster of partially overlapping small stratovolcanoes and lava domes in north-central New Britain off Bangula Bay. The 610-m Mount Malopu at the southern end forms the high point of the basaltic-to-rhyolitic complex. Kaiamu maar forms a peninsula with a small lake extending about 1 km into Bangula Bay at the NW side of the Sulu Range. The Walo hydrothermal area, consisting of solfataras and mud pots, lies on the coastal plain west of the SW base of the Sulu Range. No historical eruptions are known from the Sulu Range, although some of the cones display a relatively undissected morphology. A vigorous new fumarolic vent opened in 2006, preceded by vegetation die-off, seismicity, and dust-producing landslides.
Information Contacts: Herman Patia and Steve Saunders, Rabaul Volcano Observatory (RVO), P.O. Box 386, Rabaul, Papua New Guinea.
Tungurahua (Ecuador) — July 2006 Cite this Report
Tungurahua
Ecuador
1.467°S, 78.442°W; summit elev. 5023 m
All times are local (unless otherwise noted)
14-15 July 2006 eruption, the strongest since onset of eruption in 1999
This report discusses Tungurahua's behavior during August 2005 through the end of July 2006. Material presented here was chiefly gleaned from a series of special reports issued in Spanish by the Instituto Geofísico of the Escuela Politécnica Nacional (IGEPN, hereafter IG). Daily reports for mid-2005 through early 2006 were dominated by descriptions of small plumes and minor ashfall; the reports also noted occasional small rain-generated lahars. For the most part 2005 was the quietest year since eruptions began in 1999, leading residents and volcanologists to ponder if emissions were terminating. This report omits much discussion of evacuations and hazard-status postings. Large eruptions with a Volcanic Explosivity Index (VEI) of 3 that continued into at least late August 2006 will be the subject of the next Bulletin report.
During late December 2005 seismometers detected sudden clusters of tremor and earthquakes. Intervals of quiet were broken by the arrival of signals with energy over a broad frequency range (figures 26 and 27). These signals and later manifestations at the surface in late March-early April were thought to be related to a new injection of magma. As a consequence, IG began to produce a series of special reports (table 10). Beginning in February 2006 and particularly during May-June 2006, the volcano was the scene of particularly significant events, including the largest detonations heard and seen since eruptions renewed in 1999. Other observations included a shift in eruptive style, and generation of some pyroclastic flows during the 14 July (VEI 2) eruption. Notable also were constant "roars" and vibrations of such strength and duration that they keep residents awake at night and caused some to voluntarily evacuate.
Table 10. A summary of special reports on Tungurahua issued by the IG during 2006 (reports numbered 1-8; See IG web page-Informes Especiales-Volcanicos).
| Date |
Special Report |
Key observation(s) |
| 18 Feb 2006 |
1 |
Moderate explosions and tephra falls in Puela (SW), Paillate (W), Ambato (NW) and Banos (N). |
| 07 Apr 2006 |
2 |
Episodes of strong volcanic tremor and increase in number of long-period seismic events, indicating new magma injection. |
| 25 Apr 2006 |
3 |
Notable banded tremor, the inferred product of new injected magma interacting with the hydrothermal system. |
| 12 May 2006 |
4 |
10 May-start of major increase in number of explosions, long-period seismic events and tremor episodes. Very strong detonations (12 per hour). Peak of energy release on 14 May, then decline. Aborted eruption. |
| 30 May 2006 |
5 |
Starting 16 May, significant decrease in activity and superficial manifestations. Explosions occur 2-3 times per day; columns of gases (water vapor mainly) with light ash content predominate. |
| 14 Jul 2006 |
6 |
Advisory of intensified eruptive activity; notable increase in emissions and strong detonations (at 2210 & 2250 UTC). Incandescent lava flung from crater. Strong ground movements reported on W flank. |
| 14 Jul 2006 |
8 |
Very strong detonations, period of calm, then ascent of 15-km-high, dark, ash-laden column. First pyroclastic flow (at 2250 UTC) and others to descend six valleys (quebradas) on the W-NW-N flanks. Intense lava fountaining; moderate ash and scoria fall to the W. |
| 15 Jul 2006 |
8 |
Unusually large discharges with a detonation (at 0559 UTC), leading to the largest registered since 1999. Plume rose to ~15 km altitude. The eruptive style later shifted to periodic detonations with intervals of calm. |
A map and table of commonly referred-to locations appeared in a previous issue (BGVN 29:01). Our last report on Tungurahua covered February 2004 to July 2005 (BGVN 30:06), during which time volcanic and seismic activity varied, but included some intervals with comparatively low activity and seismicity such as February to mid-July 2005.
Activity during June to mid-December 2005. From June 2005 through mid-December 2005, volcanic and seismic activity at Tungurahua was at relatively low levels. Low-energy plumes composed of gas, steam, and occasionally small amounts of ash were emitted frequently. Some noteworthy events during this interval follow.
On 7 June 2005, fine ash fell in the Puela sector, ~ 8 km SW. On 24 June, about an hour after an ash eruption, a narrow plume was identified in multispectral satellite imagery. The ash plume was at an altitude of ~ 5.5 km and extended 35-45 km W from the summit.
Ash plumes rose to an altitude of 5.8 km on 4 July. On 21 and 22 August, ash fell in the town of Bilbao, 8 km W of the volcano. On 25 August, ash fell NW of the volcano in the towns of Bilbao and Cusúa. On 1 September, ash fell ~ 8 km SW of the summit in the Puela sector.
On 10 September, a lahar affected an area near the new Baños-Penipe highway. On 14 September, a steam column with little ash reached ~ 300 m above the crater and drifted W; small amounts of ash fell in Puela. A small amount of ash fell in the towns of Cusúa and Bilbao during the morning of 21 September. Fumaroles on the outer edge of the crater were visible from Runtún (6 km NNE of the summit) after not being seen for 6 months. Steam-and-gas plumes rose ~ 1 km and drifted W. A pilot reported an ash plume on 29 September at an altitude of ~ 6.1 km.
During October, and November heavy rain caused lahars to travel down some of the gorges on the volcano's flanks. On 3 and 13 November lahars caused the temporary closure of the Baños-Riobamba highway, and a highway in Pampas. On 15 November ash plumes rose to ~ 9.1 km; on 23 November plumes rose to ~6.7 km.
On 13 December, lahars were generated at Tungurahua that traveled down the Juive (NNW) and Achupashal (W) gorges. On 14 December a steam-and-ash cloud rose ~ 1 km above the volcano. On 17 December, lahars were generated in the NW and W zone of the volcano. There were reports of lahars to the W in the Chontapamba sector that blocked the Baños-Penipe highway, in the Salado sector where the volume of water in the Vazcún increased by 70 percent, and in the NW (La Pampa) sector.
Return, incidence, and significance of broadband seismicity. An important variation in behavior was noted during late December 2005, with the appearance of long-period-earthquake swarms. The swarms preceded emissions and explosions. Such swarms were associated with mid-February 2006 ash-bearing explosions discussed below. After 21 March 2006, the swarms became yet more common and stronger. They were joined by low-frequency harmonic tremor.
Interpreted as related to the motion of magma, the tremor and swarms also seemed closely associated with lava fountains seen in the crater on 25 March 2006. Along with long-period earthquakes there were two episodes of high-amplitude tremor during 4-5 April 2006. Such seismicity had been absent for about a year. Small lava fountains witnessed on the night of 17 April 2006 were again preceded by long-period earthquakes and banded tremor.
As a result, IG distributed two special reports (##2 & 3). The latter contained a spectrogram for late April 2006, illustrating intervals of relative quiet (up to ~ 5 hours long) punctuated by broad-band signals (i.e. coincident earthquakes and tremor) sometimes in tight clusters lasting ~ 90 minutes.
January-May 2006. At the beginning of January 2006, explosions generated moderate amounts of ash, but seismicity remained low. Though clouds obscured the volcano during much of 18-24 January 2006, steam clouds with minor ash content were seen on 20 and 22 January. A discharge of muddy, sediment-laden water along W-flank valleys on 23-24 January blocked the highway. On 25 January light rain caused lahars to flow in the NW sector. The lahars descended a NNW-flank gorge from the village of Juive, causing the closure of the Baños-Penipe highway. Around 28 January, ash fell in the village of Puela. On 31 January, a steam-and-ash plume rose ~1 km above the volcano and drifted W. A small lahar closed a road in Pampas for 2 hours.
On 5 February at 0600, a moderate explosion sent a steam plume, with a small amount of ash, to ~ 1 km above the volcano; the plume drifted SW. Light rainfall on 7 February generated a lahar in the La Pampa area NW of the volcano.
During 6-14 February, several moderate-sized emissions of gas and ash occurred at Tungurahua, with plumes rising to ~ 500 m above the volcano. Long-period earthquakes increased in number on the 6th. An explosion around midnight on 12 February expelled incandescent volcanic material that traveled down the N flank of the volcano. A small amount of ash fell in the town of Puela, SW of the volcano.
IG issued a report (##1; Boletín Especial Volcán Tungurahua) on 18 February 2006 noting slight increases in activity that week. Explosions were moderate; however, ashfall occurred in some settlements bordering the volcano. IG summarized the week with a table similar to one below, with multiple cases of ash fall on local towns (table 11).
Table 11. A summary of Tungurahua's ash falls during an active interval, 13-18 February 2006, and the settlements affected. OVT stands for the Observatorio Volcán Tungurahua, a facility 13 km NW of the summit, down valley from the town of Patate. The report was issued at 1330 on the 18th, explaining why the entries only applied to the first half of that day. Courtesy of IG (special report ##1).
| Date |
Number of explosions |
Location and comment |
| 13 Feb 2006 |
1 |
Puela (~8 km SW of the summit), ashfall during the day. |
| 14 Feb 2006 |
4 |
Puela, ashfall during the afternoon. |
| 15 Feb 2006 |
4 |
No ashfall reported. |
| 16 Feb 2006 |
9 |
Runtun, ashfall at dawn; Observatory (OVT), Pelileo, Banos, and Garcia Moreno subjected to light ashfall in the morning; Bilbao, Cusua, Puela, Humbalo, Bolivar, and Pillate subjected to strong ashfall in the morning. |
| 17 Feb 2006 |
3 |
In Chacauco, Cusua, and Juive ash fell at dawn and part of the morning. In Pillate, Cotalo, Cusua, and Huambalo, ash in the morning. In Bilbao, ashfall all day; and Chogluntus, small ashfall during the afternoon. |
| 18 Feb 2006 |
1 |
Observations until about 1200. In Banos, OVT, Salasaca, Pondoa, Bilbao, San Juan, and Pelileo, ashfall at dawn. In Banos and Ambato, ashfall in both the morning and afternoon. |
Activity at Tungurahua during 28 February to 6 March consisted of low-level seismicity and emissions of steam and gas, with low ash content. An explosion on the 28th produced a plume composed of steam, gas, and some ash that reached ~ 3 km high.
In addition to the moderate explosions during 8-10 March, light drizzle produced muddy water in the gorges on the volcano's W flank. As a result the Baños-Penipe highway was closed for several hours. On 9 March, ash fell in the zone of Juive on the volcano's NW flank. On 10 March, ash fell in the towns of Pillate, Pondoa, Runtún, and Cusúa (on the W to NW to NNE flanks).
During 16-20 March, small-to-moderate explosions occurred at Tungurahua that consisted of gas, steam, and small amounts of ash. Plumes rose to ~ 3 km above the volcano. During 22-27 March, similar explosions consisted of gas, steam, and small amounts of ash. Plumes rose as high as ~ 1 km above the volcano on several days. An explosion on 26 March was accompanied by incandescent blocks that rolled down the volcano's NW flank.
On 18 February, small amounts of ashfall were reported at the observatory, Cotaló, Cusúa, and other settlements (table 11). On 19 February, rainfall generated a small mudflow SW of the volcano in the Quebrada Rea sector of Puela.
Table 12 summarizes observations associated with plumes and seismicity during 15 February to 8 May 2006. Many observations in that interval noted small-to-moderate explosions or other emissions. Ash plumes to 1-3 km above the volcano (6-8 km altitude) were typical.
Table 12. A compilation of some daily and weekly observations from Tungurahua during 15 February to 8 May 2006. Courtesy of IG.
| Date range |
Description of activity (plume heights in kilometers above the summit) |
| 15 Feb-19 Feb 2006 |
Ash plume as high as 3 km. |
| 26 Feb-27 Feb 2006 |
Steam and gas with low ash content; on the 26th, 1 plume to ~3 km; on the 27th, to 1 km. Both plumes drifted NW. |
| 28 Feb-06 Mar 2006 |
Steam and gas with low ash content; on the 28th, 1 plume to ~3 km. Low seismicity. |
| 08 Mar-10 Mar 2006 |
Several explosions with low ash content resulting in plumes under 2 km. |
| 16 Mar-20 Mar 2006 |
Small-to-moderate explosions consisting of gas, steam, and small amounts of ash. Plumes rose to ~3 km. |
| 22 Mar-27 Mar 2006 |
Small-to-moderate explosions consisting of gas, steam, and small amounts of ash. Plumes rose as high as ~1 km above the volcano on several days. |
| 29 Mar-02 Apr 2006 |
Small-to-moderate explosions consisting of gas, steam, and small amounts of ash. |
| 04 Apr-10 Apr 2006 |
Small-to-moderate explosions at Tungurahua consisting of gas, steam, and small amounts of ash. On the 9th, plumes rose to ~3 km. |
| 11 Apr-17 Apr 2006 |
Small-to-moderate explosions produced gas, steam, and small amounts of ash. On the 13th, plumes rose to ~2 km. High seismicity. |
| 19 Apr-23 Apr 2006 |
Small-to-moderate explosions produced gas, steam, and small amounts of ash. On the 19th, plumes rose to ~3 km. High seismicity. |
| 28 Apr-01 May 2006 |
Small-to-moderate explosions; gas, steam, and small amounts of ash. On the 28th, a plume rose to a maximum height of ~2 km. High seismicity. |
| 04 May-08 May 2006 |
Small-to-moderate explosions; gas, steam, and small amounts of ash. High seismicity, dominated by explosions and long-period earthquakes. |
During this 15 February to 8 May time interval ash affected localities as follows. During 29 March to 2 April, ash fell in the Bilbao, Choglontus, Puela, and Manzano sectors, and incandescent blocks rolled down the volcano's NW flank. Around 9 March, ash fell in the Baños, Guadalupe, Chogluntus, Bilbao, and Manzano sectors. Around 1500 on 9 March, several lahars traveled down W-flank gorges, disrupting traffic along the Baños-Penipe highway. An explosion on 26 March was accompanied by incandescent blocks that rolled down the NW flank. During 11-17 April, a small amount of ash fell in the Pondoa sector N of the volcano.
Increased activity starting 10 May 2006. Seismicity for mid-April 2006 to mid-August 2006 appears in figure 28. The figure shows the time sequence of hypocenters with various signal types given separate symbols. Between April and May there was a shallowing of event locations (indicated by the arrow on the left) from -4 km to +2 km. At that point, explosion signals suddenly began to dominate. Those explosion signals came from depths in the range from 0 to over +4 km depth. The 14 May seismic crisis seemingly ended without a large eruption. Explosion signals continued; however, they ceased dominating until around the time of the 14 July eruption when they again became the chief signal (circled area) just prior to the eruption breaking out at the surface.
IG put out special report ##4 with a cautionary tone. In the 48 hours starting around 10 May, there was a very important increase in activity. IG judged the anomalous, high-activity conditions as severe as previous ones during this crisis (specifically, equivalent to those of October-December 1999, August 2001, September 2002, and October 2003). The summary that follows largely omits the discussion of plausible scenarios aimed at public safety; however, the IG noted that if rapid escalation were to occur during the current unstable situation, they might not have time to issue alerts. They also noted that the eruption might calm.
During the roughly two-day interval, seismometers registered over 130 explosion signals, averaging about three explosions per hour, but with a maximum of 12 per hour. The general tendency was towards yet more increases in the number of explosion signals. The activity was accompanied by continuous signals described as harmonic tremor and emission-related tremor, and after 10 May these tremor signals were also more intense and frequent. In spite of the increase in explosion and tremor signals, emissions of magmatic gases (SO2) and ash stayed at relatively low levels.
First-hand observations during 10-12 May described extraordinarily loud explosions heard from 30-40 km away in Pillaro and from~ 31 km NW in Ambato, but absent 30 km SW in Riobamba. In settlements near the volcano, including Cusúa on the volcano's W foot, glass windows shattered. In some areas, roars were sufficiently intense that vibrations in windows and houses kept inhabitants awake at night. The intensities of eruptions from 10 May were reminiscent of the eruption's onset in 1999.
From the observatory in the Guadelupe sector (13 km NW of the cone) night observers saw the ejection and rolling descent of large glowing blocks of lava, and the crater gave off a permanent glow. However, ash emissions were considerably reduced; the chief component venting was steam with few other gases. The resulting outbursts were not continuous and they were too weak to form mushroom clouds. This was in contrast to other periods of high activity (e.g. August 2001, September 2002, and October 2003), when sustained ash-bearing eruption columns and ash falls were common.
IG special report ##4 noted that the tremor signals during a 48-hour interval after 10 May were the strongest recorded since the eruptions renewed in 1999. The number of explosions and their seismic energy were the highest recorded since the end of 2003, but was less than registered during November 1999 and mid-2000.
On 30 May IG issued its next special report (##5), which noted elevated eruptive activity during 8-14 May, but a clear decrease thereafter. During 10-21 May, the following instruments detected the stated numbers of explosions: seismometers, 801; and infrasonic recorders, 682. The peak in these explosions occurred on 14 May, a day when the instrument counts were as follows: seismometers, 221; infrasonic, 204. As in the previous report, inhabitants close to the volcano heard loud roars, and in some cases were sleepless due to vibrations heard or felt in their homes at night. These conditions convinced residents in Cusúa to move during the night. But starting the 16th, the number and intensity of explosions per day decreased drastically, with only 17 explosions recorded on the 16th, dropping in later days to 2 or 3 daily explosions. According to a local mayor, given the lack of noises and relative calm, evacuees from Cusúa returned home.
The lull in explosions coincided with ongoing fluctuations in seismicity. The IG interpreted this as a sign of continued instability linked to the motion of fluids at depth. The lull in explosion signals accompanied increased gas emissions, which gradually came to contain more and more ash. Small, local ash fall again began to occur. Starting 17 May it became common to see ash columns extending to 4 km above the summit, frequently blown NW.
Reports for the week following 17 May by the Washington VAAC also discussed the increasing ash plumes. On 18 May, an ash plume reached an altitude of 5.2 km above the crater and extended NW. The Washington VAAC also noted that on 19 May, the Instituto Geofísico observed an ash plume that reached an altitude of 12 km. On satellite imagery, ash plumes were visible on 20 and 23 May and extended SW. Hotspots were visible on satellite imagery 19, 20 and 23 May. The ash plume and incandescence on 23 May were also observed on the scene by Instituto Geofísico staff. On 25 May a significant meteorological advisory (SIGMET) indicated an ash plume to an altitude of 5 km. On 27 and 30 May, the VAAC reported that the Instituto Geofísico observed ash plumes at altitudes of 7.9 km and 5 km respectively. IG noted that behavior during the last few weeks of May seemed consistent with a gradual decrease from the state of elevated activity seen in mid-May.
Although satellite thermal data produced alerts during 8-14 May, these ceased later in the month. The reduced thermal flux was taken to suggest reduced manifestations in the crater during mid to late May. Coincident with that, deformation data suggested relative stability, particularly compared to the significant variations seen earlier in May.
During 28 June-4 July, small-to-moderate explosions at Tungurahua produced plumes composed of gas, steam, and small amounts of ash that reached 1.5 km above the summit. Light ashfall was reported in nearby localities during 29 June-2 July. On 29 June, reports of ground movement coincided with an explosive eruption that sent blocks of incandescent material as far as 1 km down the W flank.
During 5-11 July, seismic activity indicating explosions increased at Tungurahua. Incandescent blocks were ejected from the crater during 5 to 8 July, when blocks rolled approximately 1 km down the NW flank. Ash-and-steam plumes with moderate to no ash content were observed to reach maximum heights of 2.5 km above the summit and drifted to the W and NW.
Eruptive style changes after powerful discharges of mid-July 2006. On 14 and 15 July, IG issued its next special reports (##6, 7, and 8) documenting events surrounding the strongest eruption yet seen during the entire 1999-2006 eruptive process. The basis for the size assesment was made from the seismic record based on reduced displacement, sometimes called normalized or root-mean-square amplitude (a means to correct seismic data to a common reference point; McNutt, 2000) The largest discharge occurred at 0559 on 15 July.
On 14 July, seismicity was elevated above that seen in the previous several days. IG noted that at 1710 several large explosions were recorded on instruments, as well as heard by people. An eruption column formed, bearing moderate ash. It initially rose several kilometers but later was estimated to have attained ~ 15 km altitude. This was followed by 20 minutes of quiet. At 1733 a huge explosion presumably opened the conduit. Immediately local authorities were contacted and they evacuated people living on the lower NW-W flanks of the cone. Pyroclastic flows and explosion signals are notable in the seismic record (figure 29).
At 0050 on 14 July a pyroclastic flow poured down the NW flank (the Juive Grande drainage). An associated fine ashfall was noted 8 km SW in the town of Puela. Intense Strombolian activity ensued, including glowing blocks tossed 500 m above the crater that bounced downslope for considerable distances. Associated noises were particularly loud and heard widely, including in Ambato (30 km NW). Lookouts described these sounds as distinctive ("bramidos doble golpe;" roughly translated as 'double roars'), a new sound in the suite of those heard since 1999. In the Cusúa area, and up to 13 km NW in the sector of the Observatory of Guadelupe, residents felt intense ground movements.
At 1930 that day pumice fell on the W flank (the sector of Pillate) reaching a thickness of ~ 1 cm. About 10 minutes after the pumice fall, the IG issued the second special report (##7) on the 14 July events. It cautioned residents to remain away from the volcano's W side. The next special report (##8) noted that variations in activity prevailed through the end of 14 July, and that much of the first hour of 15 July brought decreased activity. Tremor continued on 15 July, often in episodes with durations of 4 to 5 minutes, separated by intervening calm intervals of similar duration.
After 0500 on 15 July the eruptive process changed, with the new regime characterized by sequences of abundant large explosions followed by intervals of calm lasting 30-40 minutes. A critical detonation occurred at 0559 on 15 July. On the basis of reduced displacement, it ranked as the largest since the eruption began in 1999. Other detonations with similar character followed the initial one. During 0500-0555 there were 20 large detonations. In assessing the 14-15 July eruptions, satellite analysis by both the Washington Volcanic Ash Advisory Center and the U.S. Air Force Weather Agency confirmed the highest ash-plume tops to altitudes of 15-16 km.
At sunup on 15 July observers found signs that a pyroclastic flow had descended a W-flank drainage (Achupashal valley, between Cusúa and Bilbao). The deposits filled the valley (to 5- to 10-m thickness). Small fires had ignited in the vegetation. A rockfall was also seen in the Bilbao area. Ash falls were reported, containing both ash and scoria fragments, affecting the cities of Penipe, Quero, Cevallo, Mocha, Riobamba, and Guaranda.
Additional fieldwork revealed that pyroclastic flows had traveled down at least six quebradas around the volcano, including Achupasal, Cusúa, Mandur, Hacienda, Juive Grande, and Vascún valleys (the latter, upslope from the western part of the touristic city of Baños).
Figures 30-33 depict the distribution of fresh deposits as well as some photos taken during the 14-15 July eruptions. Tilt and SO2 monitored at Tungurahua appear on figures 34 and 35. Satellite photos from 25 June and 18 July appeared on the NASA Earth Observatory website.
Reference. McNutt, S., 2000, Seismic monitoring, in Encyclopedia of Volcanoes: Academic Press (editor-in-chief, Haraldur Sigurdsson), p. 1095-1119, ISBN 0-12-643140-X.
Geologic Background. Tungurahua, a steep-sided andesitic-dacitic stratovolcano that towers more than 3 km above its northern base, is one of Ecuador's most active volcanoes. Three major edifices have been sequentially constructed since the mid-Pleistocene over a basement of metamorphic rocks. Tungurahua II was built within the past 14,000 years following the collapse of the initial edifice. Tungurahua II collapsed about 3,000 years ago and produced a large debris-avalanche deposit to the west. The modern glacier-capped stratovolcano (Tungurahua III) was constructed within the landslide scarp. Historical eruptions have all originated from the summit crater, accompanied by strong explosions and sometimes by pyroclastic flows and lava flows that reached populated areas at the volcano's base. Prior to a long-term eruption beginning in 1999 that caused the temporary evacuation of the city of Baños at the foot of the volcano, the last major eruption had occurred from 1916 to 1918, although minor activity continued until 1925.
Information Contacts: Geophysical Institute (IG), Escuela Politécnica Nacional, Apartado 17-01-2759, Quito, Ecuador (URL: http://www.igepn.edu.ec/).