Recently Published Bulletin Reports
Erebus (Antarctica) Lava lake remains active; most thermal alerts recorded since 2019
Rincon de la Vieja (Costa Rica) Frequent phreatic explosions during July-December 2023
Bezymianny (Russia) Explosion on 18 October 2023 sends ash plume 8 km high; lava flows and incandescent avalanches
Kilauea (United States) Low-level lava effusions in the lava lake at Halema’uma’u during July-December 2022
Nyamulagira (DR Congo) Lava flows and thermal activity during May-October 2023
Bagana (Papua New Guinea) Explosions, ash plumes, ashfall, and lava flows during April-September 2023
Mayon (Philippines) Lava flows, pyroclastic flows, ash emissions, and seismicity during April-September 2023
Nishinoshima (Japan) Eruption plumes and gas-and-steam plumes during May-August 2023
Krakatau (Indonesia) White gas-and-steam plumes and occasional ash plumes during May-August 2023
Villarrica (Chile) Strombolian activity, gas-and-ash emissions, and crater incandescence during April-September 2023
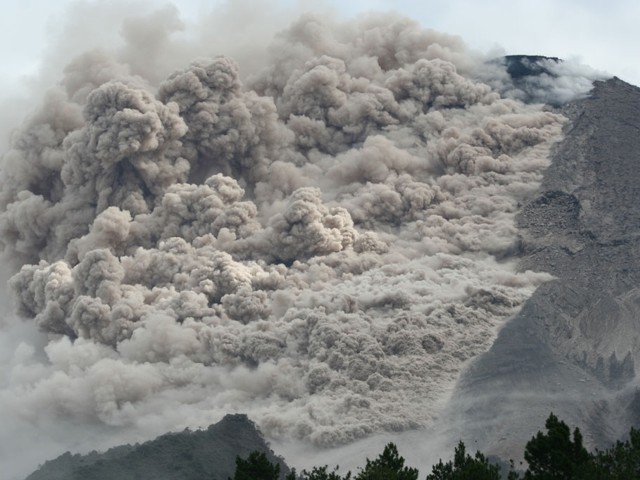
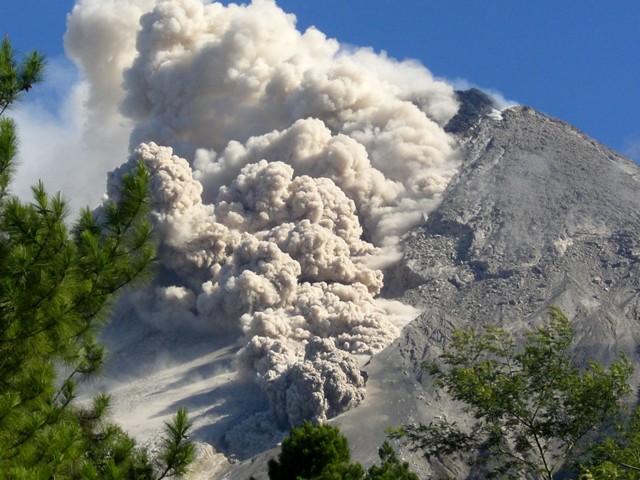
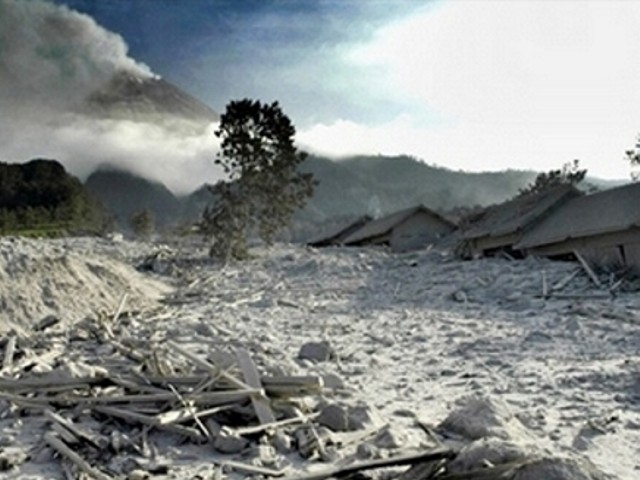
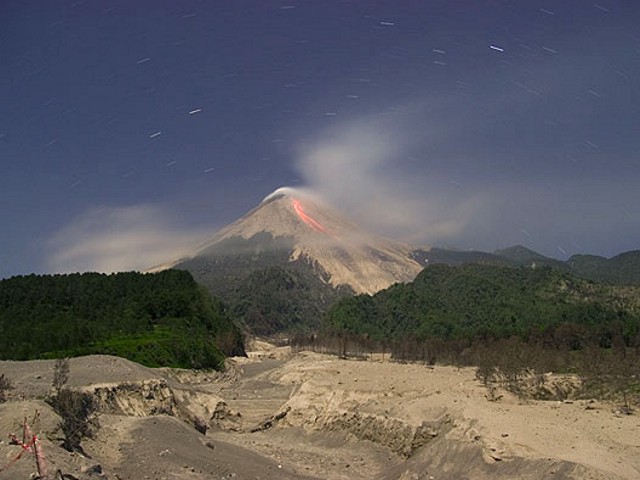
Merapi (Indonesia) Frequent incandescent avalanches during April-September 2023
Ebeko (Russia) Moderate explosive activity with ash plumes continued during June-November 2023
Erebus (Antarctica) — January 2024  Cite this Report
Erebus
Antarctica
77.53°S, 167.17°E; summit elev. 3794 m
All times are local (unless otherwise noted)
Lava lake remains active; most thermal alerts recorded since 2019
The lava lake in the summit crater of Erebus has been active since at least 1972. Located in Antarctica overlooking the McMurdo Station on Ross Island, it is the southernmost active volcano on the planet. Because of the remote location, activity is primarily monitored by satellites. This report covers activity during 2023.
The number of thermal alerts recorded by the Hawai'i Institute of Geophysics and Planetology’s MODVOLC Thermal Alerts System increased considerably in 2023 compared to the years 2020-2022 (table 9). In contrast to previous years, the MODIS instruments aboard the Aqua and Terra satellites captured data from Erebus every month during 2023. Consistent with previous years, the lowest number of anomalous pixels were recorded in January, November, and December.
Table 9. Number of monthly MODIS-MODVOLC thermal alert pixels recorded at Erebus during 2017-2023. See BGVN 42:06 for data from 2000 through 2016. The table was compiled using data provided by the HIGP – MODVOLC Thermal Alerts System.
| Year |
Jan |
Feb |
Mar |
Apr |
May |
Jun |
Jul |
Aug |
Sep |
Oct |
Nov |
Dec |
SUM |
| 2017 |
0 |
21 |
9 |
0 |
0 |
1 |
11 |
61 |
76 |
52 |
0 |
3 |
234 |
| 2018 |
0 |
21 |
58 |
182 |
55 |
17 |
137 |
172 |
103 |
29 |
0 |
0 |
774 |
| 2019 |
2 |
21 |
162 |
151 |
55 |
56 |
75 |
53 |
29 |
19 |
1 |
0 |
624 |
| 2020 |
0 |
2 |
16 |
18 |
4 |
4 |
1 |
3 |
18 |
3 |
1 |
6 |
76 |
| 2021 |
0 |
9 |
1 |
0 |
2 |
56 |
46 |
47 |
35 |
52 |
5 |
3 |
256 |
| 2022 |
1 |
13 |
55 |
22 |
15 |
32 |
39 |
19 |
31 |
11 |
0 |
0 |
238 |
| 2023 |
2 |
33 |
49 |
82 |
41 |
32 |
70 |
64 |
42 |
17 |
5 |
11 |
448 |
Sentinel-2 infrared images showed one or two prominent heat sources within the summit crater, accompanied by adjacent smaller sources, similar to recent years (see BGVN 46:01, 47:02, and 48:01). A unique image was obtained on 25 November 2023 by the OLI-2 (Operational Land Imager-2) on Landsat 9, showing the upper part of the volcano surrounded by clouds (figure 32).
Geologic Background. Mount Erebus, the world's southernmost historically active volcano, overlooks the McMurdo research station on Ross Island. It is the largest of three major volcanoes forming the crudely triangular Ross Island. The summit of the dominantly phonolitic volcano has been modified by one or two generations of caldera formation. A summit plateau at about 3,200 m elevation marks the rim of the youngest caldera, which formed during the late-Pleistocene and within which the modern cone was constructed. An elliptical 500 x 600 m wide, 110-m-deep crater truncates the summit and contains an active lava lake within a 250-m-wide, 100-m-deep inner crater; other lava lakes are sometimes present. The glacier-covered volcano was erupting when first sighted by Captain James Ross in 1841. Continuous lava-lake activity with minor explosions, punctuated by occasional larger Strombolian explosions that eject bombs onto the crater rim, has been documented since 1972, but has probably been occurring for much of the volcano's recent history.
Information Contacts: Hawai'i Institute of Geophysics and Planetology (HIGP) - MODVOLC Thermal Alerts System, School of Ocean and Earth Science and Technology (SOEST), Univ. of Hawai'i, 2525 Correa Road, Honolulu, HI 96822, USA (URL: http://modis.higp.hawaii.edu/); Copernicus Browser, Copernicus Data Space Ecosystem, European Space Agency (URL: https://dataspace.copernicus.eu/browser/); NASA Earth Observatory, EOS Project Science Office, NASA Goddard Space Flight Center, Goddard, Maryland, USA (URL: https://earthobservatory.nasa.gov/images/152134/erebus-breaks-through).
Rincon de la Vieja (Costa Rica) — January 2024 Cite this Report
Rincon de la Vieja
Costa Rica
10.83°N, 85.324°W; summit elev. 1916 m
All times are local (unless otherwise noted)
Frequent phreatic explosions during July-December 2023
Rincón de la Vieja is a volcanic complex in Costa Rica with a hot convecting acid lake that exhibits frequent weak phreatic explosions, gas-and-steam emissions, and occasional elevated sulfur dioxide levels (BGVN 45:10, 46:03, 46:11). The current eruption period began June 2021. This report covers activity during July-December 2023 and is based on weekly bulletins and occasional daily reports from the Observatorio Vulcanologico Sismologica de Costa Rica-Universidad Nacional (OVSICORI-UNA).
Numerous weak phreatic explosions continued during July-December 2023, along with gas-and-steam emissions and plumes that rose as high as 3 km above the crater rim. Many weekly OVSICORI-UNA bulletins included the previous week's number of explosions and emissions (table 9). For many explosions, the time of explosion was given (table 10). Frequent seismic activity (long-period earthquakes, volcano-tectonic earthquakes, and tremor) accompanied the phreatic activity.
Table 9. Number of reported weekly phreatic explosions and gas-and-steam emissions at Rincón de la Vieja, July-December 2023. Counts are reported for the week before the Weekly Bulletin date; not all reports included these data. Courtesy of OVSICORI-UNA.
| OVSICORI Weekly Bulletin |
Number of explosions |
Number of emissions |
| 28 Jul 2023 |
6 |
14 |
| 4 Aug 2023 |
10 |
12 |
| 1 Sep 2023 |
13 |
11 |
| 22 Sep 2023 |
12 |
13 |
| 29 Sep 2023 |
6 |
11 |
| 6 Oct 2023 |
12 |
5 |
| 13 Oct 2023 |
7 |
9 |
| 20 Oct 2023 |
1 |
15 |
| 27 Oct 2023 |
3 |
23 |
| 3 Nov 2023 |
3 |
10 |
| 17 Nov 2023 |
0 |
Some |
| 24 Nov 2023 |
0 |
14 |
| 8 Dec 2023 |
4 |
16 |
| 22 Dec 2023 |
8 |
18 |
Table 10. Summary of activity at Rincón de la Vieja during July-December 2023. Weak phreatic explosions and gas emissions are noted where the time of explosion was indicated in the weekly or daily bulletins. Height of plumes or emissions are distance above the crater rim. Courtesy of OVSICORI-UNA.
| Date |
Time |
Description of Activity |
| 1 Jul 2023 |
0156 |
Explosion. |
| 2 Jul 2023 |
0305 |
Explosion. |
| 4 Jul 2023 |
0229, 0635 |
Event at 0635 produced a gas-and-steam plume that rose 700 m and drifted W; seen by residents in Liberia (21 km SW). |
| 9 Jul 2023 |
1843 |
Explosion. |
| 21 Jul 2023 |
0705 |
Explosion. |
| 26 Jul 2023 |
1807 |
Explosion. |
| 28 Jul 2023 |
0802 |
Explosion generated a gas-and-steam plume that rose 500 m. |
| 30 Jul 2023 |
1250 |
Explosion. |
| 31 Jul 2023 |
2136 |
Explosion. |
| 11 Aug 2023 |
0828 |
Explosion. |
| 18 Aug 2023 |
1304 |
Explosion. |
| 21 Aug 2023 |
1224 |
Explosion generated gas-and-steam plumes rose 500-600 m. |
| 22 Aug 2023 |
0749 |
Explosion generated gas-and-steam plumes rose 500-600 m. |
| 24 Aug 2023 |
1900 |
Explosion. |
| 25 Aug 2023 |
0828 |
Event produced a steam-and-gas plume that rose 3 km and drifted NW. |
| 27-28 Aug 2023 |
0813 |
Four small events; the event at 0813 on 28 August lasted two minutes and generated a steam-and-gas plume that rose 2.5 km. |
| 1 Sep 2023 |
1526 |
Explosion generated plume that rose 2 km and ejected material onto the flanks. |
| 2-3 Sep 2023 |
- |
Small explosions detected in infrasound data. |
| 4 Sep 2023 |
1251 |
Gas-and-steam plume rose 1 km and drifted W. |
| 7 Nov 2023 |
1113 |
Explosion. |
| 8 Nov 2023 |
0722 |
Explosion. |
| 12 Nov 2023 |
0136 |
Small gas emissions. |
| 14 Nov 2023 |
0415 |
Small gas emissions. |
According to OVSICORI-UNA, during July-October the average weekly sulfur dioxide (SO2) flux ranged from 68 to 240 tonnes/day. However, in mid-November the flux increased to as high as 334 tonnes/day, the highest value measured in recent years. The high SO2 flux in mid-November was also detected by the TROPOMI instrument on the Sentinel-5P satellite (figure 43).
Geologic Background. Rincón de la Vieja, the largest volcano in NW Costa Rica, is a remote volcanic complex in the Guanacaste Range. The volcano consists of an elongated, arcuate NW-SE-trending ridge constructed within the 15-km-wide early Pleistocene Guachipelín caldera, whose rim is exposed on the south side. Sometimes known as the "Colossus of Guanacaste," it has an estimated volume of 130 km3 and contains at least nine major eruptive centers. Activity has migrated to the SE, where the youngest-looking craters are located. The twin cone of Santa María volcano, the highest peak of the complex, is located at the eastern end of a smaller, 5-km-wide caldera and has a 500-m-wide crater. A Plinian eruption producing the 0.25 km3 Río Blanca tephra about 3,500 years ago was the last major magmatic eruption. All subsequent eruptions, including numerous historical eruptions possibly dating back to the 16th century, have been from the prominent active crater containing a 500-m-wide acid lake located ENE of Von Seebach crater.
Information Contacts: Observatorio Vulcanológico Sismológica de Costa Rica-Universidad Nacional (OVSICORI-UNA), Apartado 86-3000, Heredia, Costa Rica (URL: http://www.ovsicori.una.ac.cr/); NASA Global Sulfur Dioxide Monitoring Page, Atmospheric Chemistry and Dynamics Laboratory, NASA Goddard Space Flight Center (NASA/GSFC), 8800 Greenbelt Road, Goddard MD 20771, USA (URL: https://so2.gsfc.nasa.gov/).
Bezymianny (Russia) — November 2023 Cite this Report
Bezymianny
Russia
55.972°N, 160.595°E; summit elev. 2882 m
All times are local (unless otherwise noted)
Explosion on 18 October 2023 sends ash plume 8 km high; lava flows and incandescent avalanches
Bezymianny, located on Russia’s Kamchatka Peninsula, has had eruptions since 1955 characterized by dome growth, explosions, pyroclastic flows, ash plumes, and ashfall. Activity during November 2022-April 2023 included gas-and-steam emissions, lava dome collapses generating avalanches, and persistent thermal activity. Similar eruptive activity continued from May through October 2023, described here based on information from weekly and daily reports of the Kamchatka Volcano Eruptions Response Team (KVERT), notices from Tokyo VAAC (Volcanic Ash Advisory Center), and from satellite data.
Overall activity decreased after the strong period of activity in late March through April 2023, which included ash explosions during 29 March and 7-8 April 2023 that sent plumes as high as 10-12 km altitude, along with dome growth and lava flows (BGVN 48:05). This reduced activity can be seen in the MIROVA thermal detection system graph (figure 56), which was consistent with data from the MODVOLC thermal detection system and with Sentinel-2 satellite images that showed persistent hotspots in the summit crater when conditions allowed observations. A renewed period of strong activity began in mid-October 2023.
Activity increased significantly on 17 October 2023 when large collapses began during 0700-0830 on the E flanks of the lava dome and continued to after 0930 the next day (figure 57). Ash plumes rose to an altitude of 4.5-5 km, extending 220 km NNE by 18 October. A large explosion at 1630 on 18 October produced an ash plume that rose to an altitude of 11 km (8 km above the summit) and drifted NNE and then NW, extending 900 km NW within two days at an altitude of 8 km. Minor ashfall was noted in Kozyrevsk (45 km WNW). At 0820 on 20 October an ash plume was identified in satellite images drifting 100 km ENE at altitudes of 4-4.5 km.
Lava flows and hot avalanches from the dome down the SE flank continued over the next few days, including 23 October when clear conditions allowed good observations (figures 58 and 59). A large thermal anomaly was observed over the volcano through 24 October, and in the summit crater on 30 October (figure 60). Strong fumarolic activity continued, with numerous avalanches and occasional incandescence. By the last week of October, volcanic activity had decreased to a level consistent with that earlier in the reporting period.
Aviation warnings were frequently updated during 17-20 October. KVERT issued a Volcano Observatory Notice for Aviation (VONA) on 17 October at 1419 and 1727 (0219 and 0527 UTC) raising the Aviation Color Code (ACC) from Yellow to Orange (second highest level). The next day, KVERT issued a VONA at 1705 (0505 UTC) raising the ACC to Red (highest level) but lowered it back to Orange at 2117 (0917 UTC). After another decrease to Yellow and back to Orange, the ACC was reduced to Yellow on 20 October at 1204 (0004 UTC). In addition, the Tokyo VAAC issued a series of Volcanic Ash Advisories beginning on 16 October and continuing through 30 October.
Geologic Background. The modern Bezymianny, much smaller than its massive neighbors Kamen and Kliuchevskoi on the Kamchatka Peninsula, was formed about 4,700 years ago over a late-Pleistocene lava-dome complex and an edifice built about 11,000-7,000 years ago. Three periods of intensified activity have occurred during the past 3,000 years. The latest period, which was preceded by a 1,000-year quiescence, began with the dramatic 1955-56 eruption. This eruption, similar to that of St. Helens in 1980, produced a large open crater that was formed by collapse of the summit and an associated lateral blast. Subsequent episodic but ongoing lava-dome growth, accompanied by intermittent explosive activity and pyroclastic flows, has largely filled the 1956 crater.
Information Contacts: Kamchatka Volcanic Eruptions Response Team (KVERT), Far Eastern Branch, Russian Academy of Sciences, 9 Piip Blvd., Petropavlovsk-Kamchatsky, 683006, Russia (URL: http://www.kscnet.ru/ivs/kvert/); Kamchatka Volcanological Station, Kamchatka Branch of Geophysical Survey, (KB GS RAS), Klyuchi, Kamchatka Krai, Russia (URL: http://volkstat.ru/); Tokyo Volcanic Ash Advisory Center (VAAC), 1-3-4 Otemachi, Chiyoda-ku, Tokyo 100-8122, Japan (URL: http://ds.data.jma.go.jp/svd/vaac/data/); Hawai'i Institute of Geophysics and Planetology (HIGP) - MODVOLC Thermal Alerts System, School of Ocean and Earth Science and Technology (SOEST), Univ. of Hawai'i, 2525 Correa Road, Honolulu, HI 96822, USA (URL: http://modis.higp.hawaii.edu/); MIROVA (Middle InfraRed Observation of Volcanic Activity), a collaborative project between the Universities of Turin and Florence (Italy) supported by the Centre for Volcanic Risk of the Italian Civil Protection Department (URL: http://www.mirovaweb.it/); Copernicus Browser, Copernicus Data Space Ecosystem, European Space Agency (URL: https://dataspace.copernicus.eu/browser/).chr
Kilauea (United States) — January 2023 Cite this Report
Kilauea
United States
19.421°N, 155.287°W; summit elev. 1222 m
All times are local (unless otherwise noted)
Low-level lava effusions in the lava lake at Halema’uma’u during July-December 2022
Kīlauea is the southeastern-most volcano in Hawaii and overlaps the E flank of the Mauna Loa volcano. Its East Rift Zone (ERZ) has been intermittently active for at least 2,000 years. An extended eruption period began in January 1983 and was characterized by open lava lakes and lava flows from the summit caldera and the East Rift Zone. During May 2018 magma migrated into the Lower East Rift Zone (LERZ) and opened 24 fissures along a 6-km-long NE-trending fracture zone that produced lava flows traveling in multiple directions. As lava emerged from the fissures, the lava lake at Halema'uma'u drained and explosions sent ash plumes to several kilometers altitude (BGVN 43:10).
The current eruption period started during September 2021 and has recently been characterized by lava effusions, spatter, and sulfur dioxide emissions in the active Halema’uma’u lava lake (BGVN 47:08). Lava effusions, some spatter, and sulfur dioxide emissions have continued during this reporting period of July through December 2022 using daily reports, volcanic activity notices, and abundant photo, map, and video data from the US Geological Survey's (USGS) Hawaiian Volcano Observatory (HVO).
Summary of activity during July-December 2022. Low-level effusions have continued at the western vent of the Halema’uma’u crater during July through early December 2022. Occasional weak ooze-outs (also called lava break outs) would occur along the margins of the crater floor. The overall level of the active lava lake throughout the reporting period gradually increased due to infilling, however it stagnated in mid-September (table 13). During September through November, activity began to decline, though lava effusions persisted at the western vent. By 9 December, the active part of the lava lake had completely crusted over, and incandescence was no longer visible.
Table 13. Summary of measurements taken during overflights at Kīlauea that show a gradual increase in the active lava lake level and the volume of lava effused since 29 September 2021. Lower activity was reported during September-October. Data collected during July-December 2022. Courtesy of HVO.
| Date: |
Level of the active lava lake (m): |
Cumulative volume of lava effused (million cubic meters): |
| 7 Jul 2022 |
130 |
95 |
| 19 Jul 2022 |
133 |
98 |
| 4 Aug 2022 |
136 |
102 |
| 16 Aug 2022 |
137 |
104 |
| 12 Sep 2022 |
143 |
111 |
| 5 Oct 2022 |
143 |
111 |
| 28 Oct 2022 |
143 |
111 |
Activity during July 2022. Lava effusions were reported from the western vent in the Halema’uma’u crater, along with occasional weak ooze-outs along the margins of the crater floor. The height of the lava lake was variable due to deflation-inflation tilt events; for example, the lake level dropped approximately 3-4 m during a summit deflation-inflation event reported on 1 July. Webcam images taken during the night of 6-12 July showed intermittent low-level spattering at the western vent that rose less than 10 m above the vent (figure 519). Measurements made during an overflight on 7 July indicated that the crater floor was infilled about 130 m and that 95 million cubic meters of lava had been effused since 29 September 2021. A single, relatively small lava ooze-out was active to the S of the lava lake. Around midnight on 8 July there were two brief periods of lava overflow onto the lake margins. On 9 July lava ooze-outs were reported near the SE and NE edges of the crater floor and during 10-11 July they occurred near the E, NE, and NW edges. On 16 July crater incandescence was reported, though the ooze-outs and spattering were not visible. On 18 July overnight webcam images showed incandescence in the western vent complex and two ooze-outs were reported around 0000 and 0200 on 19 July. By 0900 there were active ooze-outs along the SW edge of the crater floor. Measurements made from an overflight on 19 July indicated that the crater floor was infilled about 133 m and 98 million cubic meters of lava had erupted since 29 September 2021 (figure 520). On 20 July around 1600 active ooze-outs were visible along the N edge of the crater, which continued through the next day. Extensive ooze-outs occurred along the W margin during 24 July until 1900; on 26 July minor ooze-outs were noted along the N margin. Minor spattering was visible on 29 July along the E margin of the lake. The sulfur dioxide emission rates ranged 650-2,800 tons per day (t/d), the higher of which was measured on 8 July (figure 519).
Activity during August 2022. The eruption continued in the Halema’uma’u crater at the western vent. According to HVO the lava in the active lake remained at the level of the bounding levees. Occasional minor ooze-outs were observed along the margins of the crater floor. Strong nighttime crater incandescence was visible after midnight on 6 August over the western vent cone. During 6-7 August scattered small lava lobes were active along the crater floor and incandescence persisted above the western vent through 9 August. During 7-9 August HVO reported a single lava effusion source was active along the NW margin of the crater floor. Measurements from an overflight on 4 August indicated that the crater floor was infilled about 136 m total and that 102 million cubic meters of lava had been erupted since the start of the eruption. Lava breakouts were reported along the N, NE, E, S, and W margins of the crater during 10-16 August. Another overflight survey conducted on 16 August indicated that the crater floor infilled about 137 m and 104 million cubic meters of lava had been erupted since September 2021. Measured sulfur dioxide emissions rates ranged 1,150-2,450 t/d, the higher of which occurred on 8 August.
Activity during September 2022. During September, lava effusion continued from the western vent into the active lava lake and onto the crater floor. Intermittent minor ooze-outs were reported through the month. A small ooze-out was visible on the W crater floor margin at 0220 on 2 September, which showed decreasing surface activity throughout the day, but remained active through 3 September. On 3 September around 1900 a lava outbreak occurred along the NW margin of the crater floor but had stopped by the evening of 4 September. Field crews monitoring the summit lava lake on 9 September observed spattering on the NE margin of the lake that rose no higher than 10 m, before falling back onto the lava lake crust (figure 521). Overflight measurements on 12 September indicated that the crater floor was infilled a total of 143 m and 111 million cubic meters of lava had been erupted since September 2021. Extensive breakouts in the W and N part of the crater floor were reported at 1600 on 20 September and continued into 26 September. The active part of the lava lake dropped by 10 m while other parts of the crater floor dropped by several meters. Summit tiltmeters recorded a summit seismic swarm of more than 80 earthquakes during 1500-1800 on 21 September, which occurred about 1.5 km below Halema’uma’u; a majority of these were less than Mw 2. By 22 September the active part of the lava lake was infilled about 2 m. On 23 September the western vent areas exhibited several small spatter cones with incandescent openings, along with weak, sporadic spattering (figure 522). The sulfur dioxide emission rate ranged from 930 t/d to 2,000 t/d, the higher of which was measured on 6 September.
Activity during October 2022. Activity during October declined slightly compared to previous months, though lava effusions persisted from the western vent into the active lava lake and onto the crater floor during October (figure 523). Slight variations in the lava lake were noted throughout the month. HVO reported that around 0600 on 3 October the level of the lava lake has lowered slightly. Overflight measurements taken on 5 October indicated that the crater floor was infilled a total of about 143 m and that 111 million cubic meters of lava had been effused since September 2021. During 6-7 October the lake gradually rose 0.5 m. Sulfur dioxide measurements made on 22 October had an emission rate of 700 t/d. Another overflight taken on 28 October showed that there was little to no change in the elevation of the crater floor: the crater floor was infilled a total of 143 m and 111 million cubic meters of lava had erupted since the start of the eruption.
Activity during November 2022. Activity remained low during November, though HVO reported that lava from the western vent continued to effuse into the active lava lake and onto the crater floor throughout the month. The rate of sulfur dioxide emissions during November ranged from 300-600 t/d, the higher amount of which occurred on 9 November.
Activity during December 2022. Similar low activity was reported during December, with lava effusing from the western vent into the active lava lake and onto the crater floor. During 4-5 December the active part of the lava lake was slightly variable in elevation and fluctuated within 1 m. On 9 December HVO reported that lava was no longer erupting from the western vent in the Halema’uma’u crater and that sulfur dioxide emissions had returned to near pre-eruption background levels; during 10-11 December, the lava lake had completely crusted over, and no incandescence was visible (figure 524). Time lapse camera images covering the 4-10 December showed that the crater floor showed weak deflation and no inflation. Some passive events of crustal overturning were reported during 14-15 December, which brought fresh incandescent lava to the lake surface. The sulfur dioxide emission rate was approximately 200 t/d on 14 December. A smaller overturn event on 17 December and another that occurred around 0000 and into the morning of 20 December were also detected. A small seismic swarm was later detected on 30 December.
Geologic Background. Kilauea overlaps the E flank of the massive Mauna Loa shield volcano in the island of Hawaii. Eruptions are prominent in Polynesian legends; written documentation since 1820 records frequent summit and flank lava flow eruptions interspersed with periods of long-term lava lake activity at Halemaumau crater in the summit caldera until 1924. The 3 x 5 km caldera was formed in several stages about 1,500 years ago and during the 18th century; eruptions have also originated from the lengthy East and Southwest rift zones, which extend to the ocean in both directions. About 90% of the surface of the basaltic shield volcano is formed of lava flows less than about 1,100 years old; 70% of the surface is younger than 600 years. The long-term eruption from the East rift zone between 1983 and 2018 produced lava flows covering more than 100 km2, destroyed hundreds of houses, and added new coastline.
Information Contacts: Hawaiian Volcano Observatory (HVO), U.S. Geological Survey, PO Box 51, Hawai'i National Park, HI 96718, USA (URL: http://hvo.wr.usgs.gov/).
Nyamulagira (DR Congo) — November 2023 Cite this Report
Nyamulagira
DR Congo
1.408°S, 29.2°E; summit elev. 3058 m
All times are local (unless otherwise noted)
Lava flows and thermal activity during May-October 2023
Nyamulagira (also known as Nyamuragira) is a shield volcano in the Democratic Republic of Congo with the summit truncated by a small 2 x 2.3 km caldera with walls up to about 100 m high. Documented eruptions have occurred within the summit caldera, as well as from numerous flank fissures and cinder cones. The current eruption period began in April 2018 and has more recently been characterized by summit crater lava flows and thermal activity (BGVN 48:05). This report describes lava flows and variable thermal activity during May through October 2023, based on information from the Observatoire Volcanologique de Goma (OVG) and various satellite data.
Lava lake activity continued during May. The MIROVA (Middle InfraRed Observation of Volcanic Activity) system recorded moderate-to-strong thermal activity throughout the reporting period; activity was more intense during May and October and relatively weaker from June through September (figure 95). The MODVOLC thermal algorithm, detected a total of 209 thermal alerts. There were 143 hotspots detected during May, eight during June, nine during September, and 49 during October. This activity was also reflected in infrared satellite images, where a lava flow was visible in the NW part of the crater on 7 May and strong activity was seen in the center of the crater on 4 October (figure 96). Another infrared satellite image taken on 12 May showed still active lava flows along the NW margin of the crater. According to OVG lava effusions were active during 7-29 May and moved to the N and NW parts of the crater beginning on 9 May. Strong summit crater incandescence was visible from Goma (27 km S) during the nights of 17, 19, and 20 May (figure 97). On 17 May there was an increase in eruptive activity, which peaked at 0100 on 20 May. Notable sulfur dioxide plumes drifted NW and W during 19-20 May (figure 98). Drone footage acquired in partnership with the USGS (United States Geological Survey) on 20 May captured images of narrow lava flows that traveled about 100 m down the W flank (figure 99). Data from the Rumangabo seismic station indicated a decreasing trend in activity during 17-21 May. Although weather clouds prevented clear views of the summit, a strong thermal signature on the NW flank was visible in an infrared satellite image on 22 May, based on an infrared satellite image. On 28 May the lava flows on the upper W flank began to cool and solidify. By 29 May seismicity returned to levels similar to those recorded before the 17 May increase. Lava effusion continued but was confined to the summit crater; periodic crater incandescence was observed.
Low-level activity was noted during June through October. On 1 June OVG reported that seismicity remained at lower levels and that crater incandescence had been absent for three days, though infrared satellite imagery showed continued lava effusion in the summit crater. The lava flows on the flanks covered an estimated 0.6 km2. Satellite imagery continued to show thermal activity confined to the lava lake through October (figure 96), although no lava flows or significant sulfur dioxide emissions were reported.
Geologic Background. Africa's most active volcano, Nyamulagira (also known as Nyamuragira), is a massive high-potassium basaltic shield about 25 km N of Lake Kivu and 13 km NNW of the steep-sided Nyiragongo volcano. The summit is truncated by a small 2 x 2.3 km caldera that has walls up to about 100 m high. Documented eruptions have occurred within the summit caldera, as well as from the numerous flank fissures and cinder cones. A lava lake in the summit crater, active since at least 1921, drained in 1938, at the time of a major flank eruption. Recent lava flows extend down the flanks more than 30 km from the summit as far as Lake Kivu; extensive lava flows from this volcano have covered 1,500 km2 of the western branch of the East African Rift.
Information Contacts: Observatoire Volcanologique de Goma (OVG), Departement de Geophysique, Centre de Recherche en Sciences Naturelles, Lwiro, D.S. Bukavu, DR Congo; Hawai'i Institute of Geophysics and Planetology (HIGP) - MODVOLC Thermal Alerts System, School of Ocean and Earth Science and Technology (SOEST), Univ. of Hawai'i, 2525 Correa Road, Honolulu, HI 96822, USA (URL: http://modis.higp.hawaii.edu/); MIROVA (Middle InfraRed Observation of Volcanic Activity), a collaborative project between the Universities of Turin and Florence (Italy) supported by the Centre for Volcanic Risk of the Italian Civil Protection Department (URL: http://www.mirovaweb.it/); NASA Global Sulfur Dioxide Monitoring Page, Atmospheric Chemistry and Dynamics Laboratory, NASA Goddard Space Flight Center (NASA/GSFC), 8800 Greenbelt Road, Goddard, Maryland, USA (URL: https://so2.gsfc.nasa.gov/); Copernicus Browser, Copernicus Data Space Ecosystem, European Space Agency (URL: https://dataspace.copernicus.eu/browser/); Charles Balagizi, Goma Volcano Observatory, Departement de Geophysique, Centre de Recherche en Sciences Naturelles, Lwiro, D.S. Bukavu, DR Congo.
Bagana (Papua New Guinea) — October 2023 Cite this Report
Bagana
Papua New Guinea
6.137°S, 155.196°E; summit elev. 1855 m
All times are local (unless otherwise noted)
Explosions, ash plumes, ashfall, and lava flows during April-September 2023
The remote volcano of Bagana is located in central Bougainville Island, Papua New Guinea. Recorded eruptions date back to 1842 and activity has consisted of effusive activity that has built a small lava dome in the summit crater and occasional explosions that produced pyroclastic flows. The most recent eruption has been ongoing since February 2000 and has produced occasional explosions, ash plumes, and lava flows. More recently, activity has been characterized by ongoing effusive activity and ash emissions (BGVN 48:04). This report updates activity from April through September 2023 that has consisted of explosions, ash plumes, ashfall, and lava flows, using information from the Darwin Volcanic Ash Advisory Center (VAAC) and satellite data.
An explosive eruption was reported on 7 July that generated a large gas-and-ash plume to high altitudes and caused significant ashfall in local communities; the eruption plume had reached upper tropospheric (16-18 km altitude) altitudes by 2200, according to satellite images. Sulfur dioxide plumes were detected in satellite images on 8 July and indicated that the plume was likely a mixture of gas, ice, and ash. A report issued by the Autonomous Bougainville Government (ABG) (Torokina District, Education Section) on 10 July noted that significant ash began falling during 2000-2100 on 7 July and covered most areas in the Vuakovi, Gotana (9 km SW), Koromaketo, Laruma (25 km W) and Atsilima (27 km NW) villages. Pyroclastic flows also occurred, according to ground-based reports; small deposits confined to one drainage were inspected by RVO during an overflight on 17 July and were confirmed to be from the 7 July event. Ashfall continued until 10 July and covered vegetation, which destroyed bushes and gardens and contaminated rivers and streams.
RVO reported another eruption on 14 July. The Darwin VAAC stated that an explosive event started around 0830 on 15 July and produced an ash plume that rose to 16.5 km altitude by 1000 and drifted N, according to satellite images. The plume continued to drift N and remained visible through 1900, and by 2150 it had dissipated.
Ashfall likely from both the 7 and 15 July events impacted about 8,111 people in Torokina (20 km SW), including Tsito/Vuakovi, Gotana, Koromaketo, Kenaia, Longkogari, Kenbaki, Piva (13 km SW), and Atsinima, and in the Tsitovi district, according to ABG. Significant ashfall was also reported in Ruruvu (22 km N) in the Wakunai District of Central Bougainville, though the thickness of these deposits could not be confirmed. An evacuation was called for the villages in Wakunai, where heavy ashfall had contaminated water sources; the communities of Ruruvu, Togarau, Kakarapaia, Karauturi, Atao, and Kuritaturi were asked to evacuate to a disaster center at the Wakunai District Station, and communities in Torokina were asked to evacuate to the Piva District station. According to a news article, more than 7,000 people needed temporary accommodations, with about 1,000 people in evacuation shelters. Ashfall had deposited over a broad area, contaminating water supplies, affecting crops, and collapsing some roofs and houses in rural areas. Schools were temporarily shut down. Intermittent ash emissions continued through the end of July and drifted NNW, NW, and SW. Fine ashfall was reported on the coast of Torokina, and ash plumes also drifted toward Laruma and Atsilima.
A small explosive eruption occurred at 2130 on 28 July that ejected material from the crater vents, according to reports from Torokina, in addition to a lava flow that contained two lobes. A second explosion was detected at 2157. Incandescence from the lava flow was visible from Piva as it descended the W flank around 2000 on 29 July (figure 47). The Darwin VAAC reported that a strong thermal anomaly was visible in satellite images during 30-31 July and that ash emissions rose to 2.4 km altitude and drifted WSW on 30 July. A ground report from RVO described localized emissions at 0900 on 31 July.
The Darwin VAAC reported that ash plumes were identified in satellite imagery at 0800 and 1220 on 12 August and rose to 2.1 km and 3 km altitude and drifted NW and W, respectively. A news report stated that aid was sent to more than 6,300 people that were adversely affected by the eruption. Photos taken during 17-19 August showed ash emissions rising no higher than 1 km above the summit and drifting SE. A small explosion generated an ash plume during the morning of 19 August. Deposits from small pyroclastic flows were also captured in the photos. Satellite images captured lava flows and pyroclastic flow deposits. Two temporary seismic stations were installed near Bagana on 17 August at distances of 7 km WSW (Vakovi station) and 11 km SW (Kepox station). The Kepox station immediately started to record continuous, low-frequency background seismicity.
Satellite data. Little to no thermal activity was detected during April through mid-July 2023; only one anomaly was recorded during early April and one during early June, according to MIROVA (Middle InfraRed Observation of Volcanic Activity) data (figure 48). Thermal activity increased in both power and frequency during mid-July through September, although there were still some short gaps in detected activity. MODVOLC also detected increased thermal activity during August; thermal hotspots were detected a total of five times on 19, 20, and 27 August. Weak thermal anomalies were also captured in infrared satellite images on clear weather days throughout the reporting period on 7, 12, and 17 April, 27 May, 1, 6, 16, and 31 July, and 19 September (figure 48); a strong thermal anomaly was visible on 31 July. Distinct sulfur dioxide plumes that drifted generally NW were intermittently captured by the TROPOMI instrument on the Sentinel-5P satellite and sometimes exceeded two Dobson Units (DUs) (figure 49).
Geologic Background. Bagana volcano, in a remote portion of central Bougainville Island, is frequently active. This massive symmetrical cone was largely constructed by an accumulation of viscous andesitic lava flows. The entire edifice could have been constructed in about 300 years at its present rate of lava production. Eruptive activity is characterized by non-explosive effusion of viscous lava that maintains a small lava dome in the summit crater, although occasional explosive activity produces pyroclastic flows. Lava flows with tongue-shaped lobes up to 50 m thick and prominent levees descend the flanks on all sides.
Information Contacts: Rabaul Volcano Observatory (RVO), Geohazards Management Division, Department of Mineral Policy and Geohazards Management (DMPGM), PO Box 3386, Kokopo, East New Britain Province, Papua New Guinea; Darwin Volcanic Ash Advisory Centre (VAAC), Bureau of Meteorology, Northern Territory Regional Office, PO Box 40050, Casuarina, NT 0811, Australia (URL: http://www.bom.gov.au/info/vaac/); MIROVA (Middle InfraRed Observation of Volcanic Activity), a collaborative project between the Universities of Turin and Florence (Italy) supported by the Centre for Volcanic Risk of the Italian Civil Protection Department (URL: http://www.mirovaweb.it/); Hawai'i Institute of Geophysics and Planetology (HIGP) - MODVOLC Thermal Alerts System, School of Ocean and Earth Science and Technology (SOEST), Univ. of Hawai'i, 2525 Correa Road, Honolulu, HI 96822, USA (URL: http://modis.higp.hawaii.edu/); NASA Global Sulfur Dioxide Monitoring Page, Atmospheric Chemistry and Dynamics Laboratory, NASA Goddard Space Flight Center (NASA/GSFC), 8800 Greenbelt Road, Goddard, Maryland, USA (URL: https://so2.gsfc.nasa.gov/); Copernicus Browser, Copernicus Data Space Ecosystem, European Space Agency (URL: https://dataspace.copernicus.eu/browser/); Autonomous Bougainville Government, P.O Box 322, Buka, AROB, PNG (URL: https://abg.gov.pg/); Andrew Tupper (Twitter: @andrewcraigtupp); Simon Carn, Geological and Mining Engineering and Sciences, Michigan Technological University, 1400 Townsend Drive, Houghton, MI 49931, USA (URL: http://www.volcarno.com/, Twitter: @simoncarn); Radio NZ (URL: https://www.rnz.co.nz/news/pacific/494464/more-than-7-000-people-in-bougainville-need-temporary-accommodation-after-eruption); USAID, 1300 Pennsylvania Ave, NW, Washington DC 20004, USA (URL: https://www.usaid.gov/pacific-islands/press-releases/aug-08-2023-united-states-provides-immediate-emergency-assistance-support-communities-affected-mount-bagana-volcanic-eruptions).
Mayon (Philippines) — October 2023 Cite this Report
Mayon
Philippines
13.257°N, 123.685°E; summit elev. 2462 m
All times are local (unless otherwise noted)
Lava flows, pyroclastic flows, ash emissions, and seismicity during April-September 2023
Mayon is located in the Philippines and has steep upper slopes capped by a small summit crater. Historical eruptions date back to 1616 CE that have been characterized by Strombolian eruptions, lava flows, pyroclastic flows, and mudflows. Eruptions mostly originated from a central conduit. Pyroclastic flows and mudflows have commonly descended many of the approximately 40 drainages that surround the volcano. The most recent eruption occurred during June through October 2022 and consisted of lava dome growth and gas-and-steam emissions (BGVN 47:12). A new eruption was reported during late April 2023 and has included lava flows, pyroclastic density currents, ash emissions, and seismicity. This report covers activity during April through September 2023 based on daily bulletins from the Philippine Institute of Volcanology and Seismology (PHIVOLCS).
During April through September 2023, PHIVOLCS reported near-daily rockfall events, frequent volcanic earthquakes, and sulfur dioxide measurements. Gas-and-steam emissions rose 100-900 m above the crater and drifted in different directions. Nighttime crater incandescence was often visible during clear weather and was accompanied by incandescent avalanches of material. Activity notably increased during June when lava flows were reported on the S, SE, and E flanks (figure 52). The MIROVA graph (Middle InfraRed Observation of Volcanic Activity) showed strong thermal activity coincident with these lava flows, which remained active through September (figure 53). According to the MODVOLC thermal algorithm, a total of 110 thermal alerts were detected during the reporting period: 17 during June, 40 during July, 27 during August, and 26 during September. During early June, pyroclastic density currents (PDCs) started to occur more frequently.
Low activity was reported during much of April and May; gas-and-steam emissions rose 100-900 m above the crater and generally drifted in different directions. A total of 52 rockfall events and 18 volcanic earthquakes were detected during April and 147 rockfall events and 13 volcanic events during May. Sulfur dioxide flux measurements ranged between 400-576 tons per day (t/d) during April, the latter of which was measured on 29 April and between 162-343 t/d during May, the latter of which was measured on 13 May.
Activity during June increased, characterized by lava flows, pyroclastic density currents (PDCs), crater incandescence and incandescent rockfall events, gas-and-steam emissions, and continued seismicity. Weather clouds often prevented clear views of the summit, but during clear days, moderate gas-and-steam emissions rose 100-2,500 m above the crater and drifted in multiple directions. A total of 6,237 rockfall events and 288 volcanic earthquakes were detected. The rockfall events often deposited material on the S and SE flanks within 700-1,500 m of the summit crater and ash from the events drifted SW, S, SE, NE, and E. Sulfur dioxide emissions ranged between 149-1,205 t/d, the latter of which was measured on 10 June. Short-term observations from EDM and electronic tiltmeter monitoring indicated that the upper slopes were inflating since February 2023. Longer-term ground deformation parameters based on EDM, precise leveling, continuous GPS, and electronic tilt monitoring indicated that the volcano remained inflated, especially on the NW and SE flanks. At 1000 on 5 June the Volcano Alert Level (VAL) was raised to 2 (on a 0-5 scale). PHIVOLCS noted that although low-level volcanic earthquakes, ground deformation, and volcanic gas emissions indicated unrest, the steep increase in rockfall frequency may indicate increased dome activity.
A total of 151 dome-collapse PDCs occurred during 8-9 and 11-30 June, traveled 500-2,000 m, and deposited material on the S flank within 2 km of the summit crater. During 8-9 June the VAL was raised to 3. At approximately 1947 on 11 June lava flow activity was reported; two lobes traveled within 500 m from the crater and deposited material on the S (Mi-isi), SE (Bonga), and E (Basud) flanks. Weak seismicity accompanied the lava flow and slight inflation on the upper flanks. This lava flow remained active through 30 June, moving down the S and SE flank as far as 2.5 km and 1.8 km, respectively and depositing material up to 3.3 km from the crater. During 15-16 June traces of ashfall from the PDCs were reported in Sitio Buga, Nabonton, City of Ligao and Purok, and San Francisco, Municipality of Guinobatan. During 28-29 June there were two PDCs generated by the collapse of the lava flow front, which generated a light-brown ash plume 1 km high. Satellite monitors detected significant concentrations of sulfur dioxide beginning on 29 June. On 30 June PDCs primarily affected the Basud Gully on the E flank, the largest of which occurred at 1301 and lasted eight minutes, based on the seismic record. Four PDCs generated between 1800 and 2000 that lasted approximately four minutes each traveled 3-4 km on the E flank and generated an ash plume that rose 1 km above the crater and drifted N and NW. Ashfall was recorded in Tabaco City.
Similar strong activity continued during July; slow lava effusion remained active on the S and SE flanks and traveled as far as 2.8 km and 2.8 km, respectively and material was deposited as far as 4 km from the crater. There was a total of 6,983 rockfall events and 189 PDCs that affected the S, SE, and E flanks. The volcano network detected a total of 2,124 volcanic earthquakes. Continuous gas-and-steam emissions rose 200-2,000 m above the crater and drifted in multiple directions. Sulfur dioxide emissions averaged 792-4,113 t/d, the latter of which was measured on 28 July. During 2-4 July three PDCs were generated from the collapse of the lava flow and resulting light brown plumes rose 200-300 m above the crater. Continuous tremor pulses were reported beginning at 1547 on 3 July through 7 July at 1200, at 2300 on 8 July and going through 0300 on 10 July, and at 2300 on 16 July, as recorded by the seismic network. During 6-9 July there were 10 lava flow-collapse-related PDCs that generated light brown plumes 300-500 m above the crater. During 10-11 July light ashfall was reported in some areas of Mabinit, Legazpi City, Budiao and Salvacion, Daraga, and Camalig, Albay. By 18 July the lava flow advanced 600 m on the E flank as well.
During 1733 on 18 July and 0434 on 19 July PHIVOLCS reported 30 “ashing” events, which are degassing events accompanied by audible thunder-like sounds and entrained ash at the crater, which produced short, dark plumes that drifted SW. These events each lasted 20-40 seconds, and plume heights ranged from 150-300 m above the crater, as recorded by seismic, infrasound, visual, and thermal monitors. Three more ashing events occurred during 19-20 July. Short-term observations from electronic tilt and GPS monitoring indicate deflation on the E lower flanks in early July and inflation on the NW middle flanks during the third week of July. Longer-term ground deformation parameters from EDM, precise leveling, continuous GPS, and electronic tilt monitoring indicated that the volcano was still generally inflated relative to baseline levels. A short-lived lava pulse lasted 28 seconds at 1956 on 21 July, which was accompanied by seismic and infrasound signals. By 22 July, the only lava flow that remained active was on the SE flank, and continued to extend 3.4 km, while those on the S and E flanks weakened markedly. One ashing event was detected during 30-31 July, whereas there were 57 detected during 31 July-1 August; according to PHIVOLCS beginning at approximately 1800 on 31 July eruptive activity was dominated by phases of intermittent ashing, as well as increased in the apparent rates of lava effusion from the summit crater. The ashing phases consisted of discrete events recorded as low-frequency volcanic earthquakes (LFVQ) typically 30 seconds in duration, based on seismic and infrasound signals. Gray ash plume rose 100 m above the crater and generally drifted NE. Shortly after these ashing events began, new lava began to effuse rapidly from the crater, feeding the established flowed on the SE, E, and E flanks and generating frequent rockfall events.
Intensified unrest persisted during August. There was a total of 4,141 rockfall events, 2,881 volcanic earthquakes, which included volcanic tremor events, 32 ashing events, and 101 PDCs detected throughout the month. On clear weather days, gas-and-steam emissions rose 300-1,500 m above the crater and drifted in different directions (figure 54). Sulfur dioxide emissions averaged 735-4,756 t/d, the higher value of which was measured on 16 August. During 1-2 August the rate of lava effusion decreased, but continued to feed the flows on the SE, S, and E flanks, maintaining their advances to 3.4 km, 2.8 km, and 1.1 km from the crater, respectively (figure 55). Rockfall and PDCs generated by collapses at the lava flow margins and from the summit dome deposited material within 4 km of the crater. During 3-4 August there were 10 tremor events detected that lasted 1-4 minutes. Short-lived lava pulse lasted 35 seconds and was accompanied by seismic and infrasound signals at 0442 on 6 August. Seven collapses were recorded at the front of the lava flow during 12-14 August.
During September, similar activity of slow lava effusion, PDCs, gas-and-steam emissions, and seismicity continued. There was a total of 4,452 rockfall events, 329 volcanic earthquakes, which included volcanic tremor events, two ashing events, and 85 PDCs recorded throughout the month. On clear weather days, gas-and-steam emissions rose 100-1,500 m above the crater and drifted in multiple directions. Sulfur dioxide emissions averaged 609-2,252 t/d, the higher average of which was measured on 6 September. Slow lava effusion continued advancing on the SE, S, and E flanks, maintaining lengths of 3.4 km, 2.8 km, and 1.1 km, respectively. Rockfall and PDC events generated by collapses along the lava flow margins and at the summit dome deposited material within 4 km of the crater.
Geologic Background. Symmetrical Mayon, which rises above the Albay Gulf NW of Legazpi City, is the most active volcano of the Philippines. The steep upper slopes are capped by a small summit crater. Recorded eruptions since 1616 CE range from Strombolian to basaltic Plinian, with cyclical activity beginning with basaltic eruptions, followed by longer periods of andesitic lava flows. Eruptions occur predominately from the central conduit and have also produced lava flows that travel far down the flanks. Pyroclastic density currents and mudflows have commonly swept down many of the approximately 40 ravines that radiate from the summit and have often damaged populated lowland areas. A violent eruption in 1814 killed more than 1,200 people and devastated several towns.
Information Contacts: Philippine Institute of Volcanology and Seismology (PHIVOLCS), Department of Science and Technology, University of the Philippines Campus, Diliman, Quezon City, Philippines (URL: http://www.phivolcs.dost.gov.ph/); MIROVA (Middle InfraRed Observation of Volcanic Activity), a collaborative project between the Universities of Turin and Florence (Italy) supported by the Centre for Volcanic Risk of the Italian Civil Protection Department (URL: http://www.mirovaweb.it/); Hawai'i Institute of Geophysics and Planetology (HIGP) - MODVOLC Thermal Alerts System, School of Ocean and Earth Science and Technology (SOEST), Univ. of Hawai'i, 2525 Correa Road, Honolulu, HI 96822, USA (URL: http://modis.higp.hawaii.edu/); Copernicus Browser, Copernicus Data Space Ecosystem, European Space Agency (URL: https://dataspace.copernicus.eu/browser/); William Rogers, Legazpi City, Albay Province, Philippines.
Nishinoshima (Japan) — October 2023 Cite this Report
Nishinoshima
Japan
27.247°N, 140.874°E; summit elev. 100 m
All times are local (unless otherwise noted)
Eruption plumes and gas-and-steam plumes during May-August 2023
Nishinoshima, located about 1,000 km S of Tokyo, is a small island in the Ogasawara Arc in Japan. The island is the summit of a massive submarine volcano that has prominent submarine peaks to the S, W, and NE. Eruptions date back to 1973 and the current eruption period began in October 2022. Recent activity has consisted of small ash plumes and fumarolic activity (BGVN 48:07). This report covers activity during May through August 2023, using information from monthly reports of the Japan Meteorological Agency (JMA) monthly reports and satellite data.
Activity during May through June was relatively low. The Japan Coast Guard (JCG) did overflights on 14 and 22 June and reported white gas-and-steam emissions rising 600 m and 1,200 m from the central crater of the pyroclastic cone, respectively (figure 125). In addition, multiple white gas-and-steam emissions rose from the inner rim of the W side of the crater and from the SE flank of the pyroclastic cone. Discolored brown-to-green water was observed around almost the entire perimeter of the island; on 22 June light green discolored water was observed off the S coast of the island.
Observations from the Himawari meteorological satellite confirmed an eruption on 9 and 10 July. An eruption plume rose 1.6 km above the crater and drifted N around 1300 on 9 July. Satellite images acquired at 1420 and 2020 on 9 July and at 0220 on 10 July showed continuing emissions that rose 1.3-1.6 km above the crater and drifted NE and N. The Tokyo VAAC reported that an ash plume seen by a pilot and identified in a satellite image at 0630 on 21 July rose to 3 km altitude and drifted S.
Aerial observations conducted by JCG on 8 August showed a white-and-gray plume rising from the central crater of the pyroclastic cone, and multiple white gas-and-steam emissions were rising from the inner edge of the western crater and along the NW-SE flanks of the island (figure 126). Brown-to-green discolored water was also noted around the perimeter of the island.
Intermittent low-to-moderate power thermal anomalies were recorded in the MIROVA graph (Middle InfraRed Observation of Volcanic Activity), showing an increase in both frequency and power beginning in July (figure 127). This increase in activity coincides with eruptive activity on 9 and 10 July, characterized by eruption plumes. According to the MODVOLC thermal alert algorithm, one thermal hotspot was recorded on 20 July. Weak thermal anomalies were also detected in infrared satellite imagery, accompanied by strong gas-and-steam plumes (figure 128).
Geologic Background. The small island of Nishinoshima was enlarged when several new islands coalesced during an eruption in 1973-74. Multiple eruptions that began in 2013 completely covered the previous exposed surface and continued to enlarge the island. The island is the summit of a massive submarine volcano that has prominent peaks to the S, W, and NE. The summit of the southern cone rises to within 214 m of the ocean surface 9 km SSE.
Information Contacts: Japan Meteorological Agency (JMA), 1-3-4 Otemachi, Chiyoda-ku, Tokyo 100-8122, Japan (URL: http://www.jma.go.jp/jma/indexe.html); Tokyo Volcanic Ash Advisory Center (VAAC), 1-3-4 Otemachi, Chiyoda-ku, Tokyo 100-8122, Japan (URL: http://ds.data.jma.go.jp/svd/vaac/data/); MIROVA (Middle InfraRed Observation of Volcanic Activity), a collaborative project between the Universities of Turin and Florence (Italy) supported by the Centre for Volcanic Risk of the Italian Civil Protection Department (URL: http://www.mirovaweb.it/); Copernicus Browser, Copernicus Data Space Ecosystem, European Space Agency (URL: https://dataspace.copernicus.eu/browser/).
Krakatau (Indonesia) — October 2023 Cite this Report
Krakatau
Indonesia
6.1009°S, 105.4233°E; summit elev. 285 m
All times are local (unless otherwise noted)
White gas-and-steam plumes and occasional ash plumes during May-August 2023
Krakatau is located in the Sunda Strait between Java and Sumatra, Indonesia. Caldera collapse during the catastrophic 1883 eruption destroyed Danan and Perbuwatan cones and left only a remnant of Rakata. The post-collapse cone of Anak Krakatau (Child of Krakatau) was constructed within the 1883 caldera at a point between the former Danan and Perbuwatan cones; it has been the site of frequent eruptions since 1927. The current eruption period began in May 2021 and has recently consisted of Strombolian eruptions and ash plumes (BGVN 48:07). This report describes lower levels of activity consisting of ash and white gas-and-steam plumes during May through August 2023, based on information provided by the Indonesian Center for Volcanology and Geological Hazard Mitigation, referred to as Pusat Vulkanologi dan Mitigasi Bencana Geologi (PVMBG), MAGMA Indonesia, and satellite data.
Activity was relatively low during May and June. Daily white gas-and-steam emissions rose 25-200 m above the crater and drifted in different directions. Five ash plumes were detected at 0519 on 10 May, 1241 on 11 May, 0920 on 12 May, 2320 on 12 May, and at 0710 on 13 May, and rose 1-2.5 km above the crater and drifted SW. A webcam image taken on 12 May showed ejection of incandescent material above the vent. A total of nine ash plumes were detected during 6-11 June: at 1434 and 00220 on 6 and 7 June the ash plumes rose 500 m above the crater and drifted NW, at 1537 on 8 June the ash plume rose 1 km above the crater and drifted SW, at 0746 and at 0846 on 9 June the ash plumes rose 800 m and 3 km above the crater and drifted SW, respectively, at 0423, 1431, and 1750 on 10 June the ash plumes rose 2 km, 1.5 km, and 3.5 km above the crater and drifted NW, respectively, and at 0030 on 11 June an ash plume rose 2 km above the crater and drifted NW. Webcam images taken on 10 and 11 June at 0455 and 0102, respectively, showed incandescent material ejected above the vent. On 19 June an ash plume at 0822 rose 1.5 km above the crater and drifted SE.
Similar low activity of white gas-and-steam emissions and few ash plumes were reported during July and August. Daily white gas-and-steam emissions rose 25-300 m above the crater and drifted in multiple directions. Three ash plumes were reported at 0843, 0851, and 0852 on 20 July that rose 500-2,000 m above the crater and drifted NW.
The MIROVA (Middle InfraRed Observation of Volcanic Activity) graph of MODIS thermal anomaly data showed intermittent low-to-moderate power thermal anomalies during May through August 2023 (figure 140). Although activity was often obscured by weather clouds, a thermal anomaly was visible in an infrared satellite image of the crater on 12 May, accompanied by an eruption plume that drifted SW (figure 141).
Geologic Background. The renowned Krakatau (frequently mis-named as Krakatoa) volcano lies in the Sunda Strait between Java and Sumatra. Collapse of an older edifice, perhaps in 416 or 535 CE, formed a 7-km-wide caldera. Remnants of that volcano are preserved in Verlaten and Lang Islands; subsequently the Rakata, Danan, and Perbuwatan cones were formed, coalescing to create the pre-1883 Krakatau Island. Caldera collapse during the catastrophic 1883 eruption destroyed Danan and Perbuwatan, and left only a remnant of Rakata. This eruption caused more than 36,000 fatalities, most as a result of tsunamis that swept the adjacent coastlines of Sumatra and Java. Pyroclastic surges traveled 40 km across the Sunda Strait and reached the Sumatra coast. After a quiescence of less than a half century, the post-collapse cone of Anak Krakatau (Child of Krakatau) was constructed within the 1883 caldera at a point between the former Danan and Perbuwatan cones. Anak Krakatau has been the site of frequent eruptions since 1927.
Information Contacts: Pusat Vulkanologi dan Mitigasi Bencana Geologi (PVMBG, also known as Indonesian Center for Volcanology and Geological Hazard Mitigation, CVGHM), Jalan Diponegoro 57, Bandung 40122, Indonesia (URL: http://www.vsi.esdm.go.id/); MAGMA Indonesia, Kementerian Energi dan Sumber Daya Mineral (URL: https://magma.esdm.go.id/v1); MIROVA (Middle InfraRed Observation of Volcanic Activity), a collaborative project between the Universities of Turin and Florence (Italy) supported by the Centre for Volcanic Risk of the Italian Civil Protection Department (URL: http://www.mirovaweb.it/); Copernicus Browser, Copernicus Data Space Ecosystem, European Space Agency (URL: https://dataspace.copernicus.eu/browser/).
Villarrica (Chile) — October 2023 Cite this Report
Villarrica
Chile
39.42°S, 71.93°W; summit elev. 2847 m
All times are local (unless otherwise noted)
Strombolian activity, gas-and-ash emissions, and crater incandescence during April-September 2023
Villarrica, in central Chile, consists of a 2-km-wide caldera that formed about 3,500 years ago and is located at the base of the presently active cone at the NW margin of a 6-km-wide caldera. Historical eruptions eruptions date back to 1558 and have been characterized by mild-to-moderate explosive activity with occasional lava effusions. The current eruption period began in December 2014 and has recently consisted of nighttime crater incandescence, ash emissions, and seismicity (BGVN 48:04). This report covers activity during April through September 2023 and describes occasional Strombolian activity, gas-and-ash emissions, and nighttime crater incandescence. Information for this report primarily comes from the Southern Andes Volcano Observatory (Observatorio Volcanológico de Los Andes del Sur, OVDAS), part of Chile's National Service of Geology and Mining (Servicio Nacional de Geología y Minería, SERNAGEOMIN) and satellite data.
Seismicity during April consisted of long period (LP) events and tremor (TRE); a total of 9,413 LP-type events and 759 TR-type events were detected throughout the month. Nighttime crater incandescence persisted and was visible in the degassing column. Sulfur dioxide data was obtained using Differential Absorption Optical Spectroscopy Equipment (DOAS) that showed an average value of 1,450 ± 198 tons per day (t/d) during 1-15 April and 1,129 ± 201 t/d during 16-30 April, with a maximum daily value of 2,784 t/d on 9 April. Gas-and-steam emissions of variable intensities rose above the active crater as high as 1.3 km above the crater on 13 April. Strombolian explosions were not observed and there was a slight decrease in the lava lake level.
There were 14,123 LP-type events and 727 TR-type events detected during May. According to sulfur dioxide measurements taken with DOAS equipment, the active crater emitted an average value of 1,826 ± 482 t/d during 1-15 May and 912 ± 41 t/d during 16-30 May, with a daily maximum value of 5,155 t/d on 13 May. Surveillance cameras showed continuous white gas-and-steam emissions that rose as high as 430 m above the crater on 27 May. Nighttime incandescence illuminated the gas column less than 300 m above the crater rim was and no pyroclastic emissions were reported. A landslide was identified on 13 May on the E flank of the volcano 50 m from the crater rim and extending 300 m away; SERNAGEOMIN noted that this event may have occurred on 12 May. During the morning of 27 and 28 May minor Strombolian explosions characterized by incandescent ejecta were recorded at the crater rim; the last reported Strombolian explosions had occurred at the end of March.
Seismic activity during June consisted of five volcano-tectonic (VT)-type events, 21,606 LP-type events, and 2,085 TR-type events. The average value of sulfur dioxide flux obtained by DOAS equipment was 1,420 ± 217 t/d during 1-15 June and 2,562 ± 804 t/d, with a maximum daily value of 4,810 t/d on 17 June. White gas-and-steam emissions rose less than 480 m above the crater; frequent nighttime crater incandescence was reflected in the degassing plume. On 12 June an emission rose 100 m above the crater and drifted NNW. On 15 June one or several emissions resulted in ashfall to the NE as far as 5.5 km from the crater, based on a Skysat satellite image. Several Strombolian explosions occurred within the crater; activity on 15 June was higher energy and ejected blocks 200-300 m on the NE slope. Surveillance cameras showed white gas-and-steam emissions rising 480 m above the crater on 16 June. On 19 and 24 June low-intensity Strombolian activity was observed, ejecting material as far as 200 m from the center of the crater to the E.
During July, seismicity included 29,319 LP-type events, 3,736 TR-type events, and two VT-type events. DOAS equipment recorded two days of sulfur dioxide emissions of 4,220 t/d and 1,009 t/d on 1 and 13 July, respectively. Constant nighttime incandescence was also recorded and was particularly noticeable when accompanied by eruptive columns on 12 and 16 July. Minor explosive events were detected in the crater. According to Skysat satellite images taken on 12, 13, and 16 July, ashfall deposits were identified 155 m S of the crater. According to POVI, incandescence was visible from two vents on the crater floor around 0336 on 12 July. Gas-and-ash emissions rose as high as 1.2 km above the crater on 13 July and drifted E and NW. A series of gas-and-steam pulses containing some ash deposited material on the upper E flank around 1551 on 13 July. During 16-31 July, average sulfur dioxide emissions of 1,679 ± 406 t/d were recorded, with a maximum daily value of 2,343 t/d on 28 July. Fine ash emissions were also reported on 16, 17, and 23 July.
Seismicity persisted during August, characterized by 27,011 LP-type events, 3,323 TR-type events, and three VT-type events. The average value of sulfur dioxide measurements taken during 1-15 August was 1,642 ± 270 t/d and 2,207 ± 4,549 t/d during 16-31 August, with a maximum daily value of 3,294 t/d on 27 August. Nighttime crater incandescence remained visible in degassing columns. White gas-and-steam emissions rose 480 m above the crater on 6 August. According to a Skysat satellite image from 6 August, ash accumulation was observed proximal to the crater and was mainly distributed toward the E slope. White gas-and-steam emissions rose 320 m above the crater on 26 August. Nighttime incandescence and Strombolian activity that generated ash emissions were reported on 27 August.
Seismicity during September was characterized by five VT-type events, 12,057 LP-type events, and 2,058 TR-type events. Nighttime incandescence persisted. On 2 September an ash emission rose 180 m above the crater and drifted SE at 1643 (figure 125) and a white gas-and-steam plume rose 320 m above the crater. According to the Buenos Aires VAAC, periods of continuous gas-and-ash emissions were visible in webcam images from 1830 on 2 September to 0110 on 3 September. Strombolian activity was observed on 2 September and during the early morning of 3 September, the latter event of which generated an ash emission that rose 60 m above the crater and drifted 100 m from the center of the crater to the NE and SW. Ashfall was reported to the SE and S as far as 750 m from the crater. The lava lake was active during 3-4 September and lava fountaining was visible for the first time since 26 March 2023, according to POVI. Fountains captured in webcam images at 2133 on 3 September and at 0054 on 4 September rose as high as 60 m above the crater rim and ejected material onto the upper W flank. Sulfur dioxide flux of 1,730 t/d and 1,281 t/d was measured on 3 and 4 September, respectively, according to data obtained by DOAS equipment.
Strong Strombolian activity and larger gas-and-ash plumes were reported during 18-20 September. On 18 September activity was also associated with energetic LP-type events and notable sulfur dioxide fluxes (as high as 4,277 t/d). On 19 September Strombolian activity and incandescence were observed. On 20 September at 0914 ash emissions rose 50 m above the crater and drifted SSE, accompanied by Strombolian activity that ejected material less than 100 m SSE, causing fall deposits on that respective flank. SERNAGEOMIN reported that a Planet Scope satellite image taken on 20 September showed the lava lake in the crater, measuring 32 m x 35 m and an area of 0.001 km2. Several ash emissions were recorded at 0841, 0910, 1251, 1306, 1312, 1315, and 1324 on 23 September and rose less than 150 m above the crater. The sulfur dioxide flux value was 698 t/d on 23 September and 1,097 t/d on 24 September. On 24 September the Volcanic Alert Level (VAL) was raised to Orange (the third level on a four-color scale). SENAPRED maintained the Alert Level at Yellow (the middle level on a three-color scale) for the communities of Villarrica, Pucón (16 km N), Curarrehue, and Panguipulli.
During 24-25 September there was an increase in seismic energy (observed at TR-events) and acoustic signals, characterized by 1 VT-type event, 213 LP-type events, and 124 TR-type events. Mainly white gas-and-steam emissions, in addition to occasional fine ash emissions were recorded. During the early morning of 25 September Strombolian explosions were reported and ejected material 250 m in all directions, though dominantly toward the NW. On 25 September the average value of sulfur dioxide flux was 760 t/d. Seismicity during 25-30 September consisted of five VT-type events, 1,937 LP-type events, and 456 TR-type events.
During 25-29 September moderate Strombolian activity was observed and ejected material as far as the crater rim. In addition, ash pulses lasting roughly 50 minutes were observed around 0700 and dispersed ENE. During 26-27 September a TR episode lasted 6.5 hours and was accompanied by discrete acoustic signals. Satellite images from 26 September showed a spatter cone on the crater floor with one vent that measured 10 x 14 m and a smaller vent about 35 m NE of the cone. SERNAGEOMIN reported an abundant number of bomb-sized blocks up to 150 m from the crater, as well as impact marks on the snow, which indicated explosive activity. A low-altitude ash emission was observed drifting NW around 1140 on 28 September, based on webcam images. Between 0620 and 0850 on 29 September an ash emission rose 60 m above the crater and drifted NW. During an overflight taken around 1000 on 29 September scientists observed molten material in the vent, a large accumulation of pyroclasts inside the crater, and energetic degassing, some of which contained a small amount of ash. Block-sized pyroclasts were deposited on the internal walls and near the crater, and a distal ash deposit was also visible. The average sulfur dioxide flux measured on 28 September was 344 t/d. Satellite images taken on 29 September ashfall was deposited roughly 3 km WNW from the crater and nighttime crater incandescence remained visible. The average sulfur dioxide flux value from 29 September was 199 t/d. On 30 September at 0740 a pulsating ash emission rose 1.1 km above the crater and drifted NNW (figure 126). Deposits on the S flank extended as far as 4.5 km from the crater rim, based on satellite images from 30 September.
Infrared MODIS satellite data processed by MIROVA (Middle InfraRed Observation of Volcanic Activity) showed intermittent thermal activity during April through September, with slightly stronger activity detected during late September (figure 127). Small clusters of thermal activity were detected during mid-June, early July, early August, and late September. According to the MODVOLC thermal alert system, a total of four thermal hotspots were detected on 7 July and 3 and 23 September. This activity was also intermittently captured in infrared satellite imagery on clear weather days (figure 128).
Geologic Background. The glacier-covered Villarrica stratovolcano, in the northern Lakes District of central Chile, is ~15 km south of the city of Pucon. A 2-km-wide caldera that formed about 3,500 years ago is located at the base of the presently active, dominantly basaltic to basaltic andesite cone at the NW margin of a 6-km-wide Pleistocene caldera. More than 30 scoria cones and fissure vents are present on the flanks. Plinian eruptions and pyroclastic flows that have extended up to 20 km from the volcano were produced during the Holocene. Lava flows up to 18 km long have issued from summit and flank vents. Eruptions documented since 1558 CE have consisted largely of mild-to-moderate explosive activity with occasional lava effusion. Glaciers cover 40 km2 of the volcano, and lahars have damaged towns on its flanks.
Information Contacts: Servicio Nacional de Geología y Minería (SERNAGEOMIN), Observatorio Volcanológico de Los Andes del Sur (OVDAS), Avda Sta María No. 0104, Santiago, Chile (URL: http://www.sernageomin.cl/); Proyecto Observación Villarrica Internet (POVI) (URL: http://www.povi.cl/); Sistema y Servicio Nacional de Prevención y Repuesta Ante Desastres (SENAPRED), Av. Beauchef 1671, Santiago, Chile (URL: https://web.senapred.cl/); Buenos Aires Volcanic Ash Advisory Center (VAAC), Servicio Meteorológico Nacional-Fuerza Aérea Argentina, 25 de mayo 658, Buenos Aires, Argentina (URL: http://www.smn.gov.ar/vaac/buenosaires/inicio.php); MIROVA (Middle InfraRed Observation of Volcanic Activity), a collaborative project between the Universities of Turin and Florence (Italy) supported by the Centre for Volcanic Risk of the Italian Civil Protection Department (URL: http://www.mirovaweb.it/); Hawai'i Institute of Geophysics and Planetology (HIGP) - MODVOLC Thermal Alerts System, School of Ocean and Earth Science and Technology (SOEST), Univ. of Hawai'i, 2525 Correa Road, Honolulu, HI 96822, USA (URL: http://modis.higp.hawaii.edu/); Copernicus Browser, Copernicus Data Space Ecosystem, European Space Agency (URL: https://dataspace.copernicus.eu/browser/).
Merapi (Indonesia) — October 2023 Cite this Report
Merapi
Indonesia
7.54°S, 110.446°E; summit elev. 2910 m
All times are local (unless otherwise noted)
Frequent incandescent avalanches during April-September 2023
Merapi, located just north of the major city of Yogyakarta in central Java, Indonesia, has had activity within the last 20 years characterized by pyroclastic flows and lahars accompanying growth and collapse of the steep-sided active summit lava dome. The current eruption period began in late December 2020 and has more recently consisted of ash plumes, intermittent incandescent avalanches of material, and pyroclastic flows (BGVN 48:04). This report covers activity during April through September 2023, based on information from Balai Penyelidikan dan Pengembangan Teknologi Kebencanaan Geologi (BPPTKG), the Center for Research and Development of Geological Disaster Technology, a branch of PVMBG which specifically monitors Merapi. Additional information comes from the Pusat Vulkanologi dan Mitigasi Bencana Geologi (PVMBG, also known as Indonesian Center for Volcanology and Geological Hazard Mitigation, CVGHM), MAGMA Indonesia, the Darwin Volcanic Ash Advisory Centre (VAAC), and various satellite data.
Activity during April through September 2023 primarily consisted of incandescent avalanches of material that mainly affected the SW and W flanks and traveled as far as 2.3 km from the summit (table 25) and white gas-and-steam emissions that rose 10-1,000 m above the crater.
Table 25. Monthly summary of avalanches and avalanche distances recorded at Merapi during April through September 2023. The number of reported avalanches does not include instances where possible avalanches were heard but could not be visually confirmed as a result of inclement weather. Data courtesy of BPPTKG (April-September 2023 daily reports).
| Month |
Average number of avalanches per day |
Distance avalanches traveled (m) |
| Apr 2023 |
19 |
1,200-2,000 |
| May 2023 |
22 |
500-2,000 |
| Jun 2023 |
18 |
1,200-2,000 |
| Jul 2023 |
30 |
300-2,000 |
| Aug 2023 |
25 |
400-2,300 |
| Sep 2023 |
23 |
600-2,000 |
BPPTKG reported that during April and May white gas-and-steam emissions rose 10-750 m above the crater, incandescent avalanches descended 500-2,000 m on the SW and W flanks (figure 135). Cloudy weather often prevented clear views of the summit, and sometimes avalanches could not be confirmed. According to a webcam image, a pyroclastic flow was visible on 17 April at 0531. During the week of 28 April and 4 May a pyroclastic flow was reported on the SW flank, traveling up to 2.5 km. According to a drone overflight taken on 17 May the SW lava dome volume was an estimated 2,372,800 cubic meters and the dome in the main crater was an estimated 2,337,300 cubic meters.
During June and July similar activity persisted with white gas-and-steam emissions rising 10-350 m above the crater and frequent incandescent avalanches that traveled 300-2,000 m down the SW, W, and S flanks (figure 136). Based on an analysis of aerial photos taken on 24 June the volume of the SW lava dome was approximately 2.5 million cubic meters. A pyroclastic flow was observed on 5 July that traveled 2.7 km on the SW flank. According to the Darwin VAAC multiple minor ash plumes were identified in satellite images on 19 July that rose to 3.7 km altitude and drifted S and SW. During 22, 25, and 26 July a total of 17 avalanches descended as far as 1.8 km on the S flank.
Frequent white gas-and-steam emissions continued during August and September, rising 10-450 m above the crater. Incandescent avalanches mainly affected the SW and W flanks and traveled 400-2,300 m from the vent (figure 137). An aerial survey conducted on 10 August was analyzed and reported that estimates of the SW dome volume was 2,764,300 cubic meters and the dome in the main crater was 2,369,800 cubic meters.
Frequent and moderate-power thermal activity continued throughout the reporting period, according to a MIROVA (Middle InfraRed Observation of Volcanic Activity) analysis of MODIS satellite data (figure 138). There was an increase in the number of detected anomalies during mid-May. The MODVOLC thermal algorithm recorded a total of 47 thermal hotspots: six during April, nine during May, eight during June, 15 during July, four during August, and five during September. Some of this activity was captured in infrared satellite imagery on clear weather days, sometimes accompanied by incandescent material on the SW flank (figure 139).
Geologic Background. Merapi, one of Indonesia's most active volcanoes, lies in one of the world's most densely populated areas and dominates the landscape immediately north of the major city of Yogyakarta. It is the youngest and southernmost of a volcanic chain extending NNW to Ungaran volcano. Growth of Old Merapi during the Pleistocene ended with major edifice collapse perhaps about 2,000 years ago, leaving a large arcuate scarp cutting the eroded older Batulawang volcano. Subsequent growth of the steep-sided Young Merapi edifice, its upper part unvegetated due to frequent activity, began SW of the earlier collapse scarp. Pyroclastic flows and lahars accompanying growth and collapse of the steep-sided active summit lava dome have devastated cultivated lands on the western-to-southern flanks and caused many fatalities.
Information Contacts: Balai Penyelidikan dan Pengembangan Teknologi Kebencanaan Geologi (BPPTKG), Center for Research and Development of Geological Disaster Technology (URL: http://merapi.bgl.esdm.go.id/, Twitter: @BPPTKG); MAGMA Indonesia, Kementerian Energi dan Sumber Daya Mineral (URL: https://magma.esdm.go.id/v1); Pusat Vulkanologi dan Mitigasi Bencana Geologi (PVMBG, also known as Indonesian Center for Volcanology and Geological Hazard Mitigation, CVGHM), Jalan Diponegoro 57, Bandung 40122, Indonesia (URL: http://www.vsi.esdm.go.id/); Darwin Volcanic Ash Advisory Centre (VAAC), Bureau of Meteorology, Northern Territory Regional Office, PO Box 40050, Casuarina, NT 0811, Australia (URL: http://www.bom.gov.au/info/vaac/); MIROVA (Middle InfraRed Observation of Volcanic Activity), a collaborative project between the Universities of Turin and Florence (Italy) supported by the Centre for Volcanic Risk of the Italian Civil Protection Department (URL: http://www.mirovaweb.it/); Hawai'i Institute of Geophysics and Planetology (HIGP) - MODVOLC Thermal Alerts System, School of Ocean and Earth Science and Technology (SOEST), Univ. of Hawai'i, 2525 Correa Road, Honolulu, HI 96822, USA (URL: http://modis.higp.hawaii.edu/); Copernicus Browser, Copernicus Data Space Ecosystem, European Space Agency (URL: https://dataspace.copernicus.eu/browser/); Øystein Lund Andersen (URL: https://www.oysteinlundandersen.com/, https://twitter.com/oysteinvolcano).
Ebeko
Russia
50.686°N, 156.014°E; summit elev. 1103 m
All times are local (unless otherwise noted)
Moderate explosive activity with ash plumes continued during June-November 2023
Ebeko, located on the N end of Paramushir Island in Russia’s Kuril Islands just S of the Kamchatka Peninsula, consists of three summit craters along a SSW-NNE line at the northern end of a complex of five volcanic cones. Observed eruptions date back to the late 18th century and have been characterized as small-to-moderate explosions from the summit crater, accompanied by intense fumarolic activity. The current eruptive period began in June 2022, consisting of frequent explosions, ash plumes, and thermal activity (BGVN 47:10, 48:06). This report covers similar activity during June-November 2023, based on information from the Kamchatka Volcanic Eruptions Response Team (KVERT) and satellite data.
Moderate explosive activity continued during June-November 2023 (figures 50 and 51). According to visual data from Severo-Kurilsk, explosions sent ash 2-3.5 km above the summit (3-4.5 km altitude) during most days during June through mid-September. Activity after mid-September was slightly weaker, with ash usually reaching less than 2 km above the summit. According to KVERT the volcano in October and November was, with a few exceptions, either quiet or obscured by clouds that prevented satellite observations. KVERT issued Volcano Observatory Notices for Aviation (VONA) on 8 and 12 June, 13 and 22 July, 3 and 21 August, and 31 October warning of potential aviation hazards from ash plumes drifting 3-15 km from the volcano. Based on satellite data, KVERT reported a persistent thermal anomaly whenever weather clouds permitted viewing.
Geologic Background. The flat-topped summit of the central cone of Ebeko volcano, one of the most active in the Kuril Islands, occupies the northern end of Paramushir Island. Three summit craters located along a SSW-NNE line form Ebeko volcano proper, at the northern end of a complex of five volcanic cones. Blocky lava flows extend west from Ebeko and SE from the neighboring Nezametnyi cone. The eastern part of the southern crater contains strong solfataras and a large boiling spring. The central crater is filled by a lake about 20 m deep whose shores are lined with steaming solfataras; the northern crater lies across a narrow, low barrier from the central crater and contains a small, cold crescentic lake. Historical activity, recorded since the late-18th century, has been restricted to small-to-moderate explosive eruptions from the summit craters. Intense fumarolic activity occurs in the summit craters, on the outer flanks of the cone, and in lateral explosion craters.
Information Contacts: Kamchatka Volcanic Eruptions Response Team (KVERT), Far Eastern Branch, Russian Academy of Sciences, 9 Piip Blvd., Petropavlovsk-Kamchatsky, 683006, Russia (URL: http://www.kscnet.ru/ivs/kvert/).
Search Bulletin Archive by Publication Date
Select a month and year from the drop-downs and click "Show Issue" to have that issue displayed in this tab.
The default month and year is the latest issue available.
Bulletin of the Global Volcanism Network - Volume 32, Number 02 (February 2007)
Managing Editor: Richard Wunderman
Anatahan (United States)
Increased seismicity and plumes during February-March 2007
Etna (Italy)
Episodes of eruptions continue between 4 November and 14 December 2006
Ijen (Indonesia)
Acidic crater lake and active solfatara investigations
Kanlaon (Philippines)
Steam-and-ash explosions in June and July 2006
Langila (Papua New Guinea)
Emission of ash plumes continues through March 2007
Lastarria (Chile-Argentina)
Intense fumarolic emissions typical of activity since at least 1940
Lengai, Ol Doinyo (Tanzania)
March-April 2006 eruption sends lava down flanks
Lopevi (Vanuatu)
Three eruptive episodes between October 2005 and August 2006
Merapi (Indonesia)
March-July 2006 volcanic crisis; May earthquake killed ~5,800
Rabaul (Papua New Guinea)
Mild eruptive activity between December 2006 and March 2007
Ruapehu (New Zealand)
Minor October 2006 eruption and concern of impending lahar
Ulawun (Papua New Guinea)
Frequent ash plumes
Anatahan (United States) — February 2007 Cite this Report
Anatahan
United States
16.35°N, 145.67°E; summit elev. 790 m
All times are local (unless otherwise noted)
Increased seismicity and plumes during February-March 2007
Regular plume emissions seen in satellite imagery and by aviators during March-May 2006 (BGVN 31:05) apparently ended in June, with the last reported activity being a pilot report of an ash cloud on 26 June that reached 3 km altitude. A report issued by the U.S. Geological Survey (USGS) on 7 December noted that the Alert Level was being lowered to Green and that seismic activity at Anatahan was very low during late November and early December, although diffuse steam-and-gas plumes were occasionally visible on recent satellite images or by aviators.
According to the USGS, seismometers recorded tremor starting on 24 February (UTC) that continued at high levels through 17 March. During that time, recorded tremor occasionally increased to much higher values. In addition, OMI satellite spectrometer data showed occasionally high amounts of sulfur dioxide over Anatahan. Tremor levels increased significantly starting at 1625 on 9 March (UTC) and continued for over 40 hours. As of 13 March the tremor bursts were infrequent, and some were high amplitude. In addition, a distinct gas plume was visible in Moderate Resolution Imaging Spectroradiometer (MODIS) imagery, suggesting increased emissions. On that day the Alert Level was raised to Advisory.
The MODIS flying onboard the Aqua satellite captured a view of the plume on 18 March 2007 as emissions continued. In the image, the volcanic plume headed SE, then changed direction slightly and trended towards for the islands of Saipan and Tinian. The same day MODIS acquired this image, the U.S. Air Force Weather Agency reported an odor of sulfur, which would also suggest the presence of vog (volcanic smog) on Guam, ~200 km SW of Saipan. USGS and Emergency Management Office air quality instruments on Saipan recorded a maximum 5-minute average of 959 ppb sulfur dioxide and 99 ppb hydrogen sulfide on 18 March.
As of 24 March, the USGS was reporting that tremor levels after 17 March had remained low at pre-24 February levels. The plume visible in MODIS imagery had also remained weak but distinct since 18 March. On 24 March the Alert Level was lowered to Normal, with an aviation color code of Green. No confirmed ash eruptions had occurred after 3 September 2005.
Geologic Background. The elongate, 9-km-long island of Anatahan in the central Mariana Islands consists of a large stratovolcano with a 2.3 x 5 km compound summit caldera. The larger western portion of the caldera is 2.3 x 3 km wide, and its western rim forms the island's high point. Ponded lava flows overlain by pyroclastic deposits fill the floor of the western caldera, whose SW side is cut by a fresh-looking smaller crater. The 2-km-wide eastern portion of the caldera contained a steep-walled inner crater whose floor prior to the 2003 eruption was only 68 m above sea level. A submarine cone, named NE Anatahan, rises to within 460 m of the sea surface on the NE flank, and numerous other submarine vents are found on the NE-to-SE flanks. Sparseness of vegetation on the most recent lava flows had indicated that they were of Holocene age, but the first historical eruption did not occur until May 2003, when a large explosive eruption took place forming a new crater inside the eastern caldera.
Information Contacts: Juan Takai Camacho and Ramon Chong, Emergency Management Office of the Commonwealth of the Northern Mariana Islands (EMO-CNMI), PO Box 100007, Saipan, MP 96950, USA (URL: http://www.cnmihsem.gov.mp/); Frank Trusdell, U.S. Geological Survey, 345 Middlefield Road, Menlo Park, CA 94025-3591, USA (URL: https://volcanoes.usgs.gov/nmi/activity/); U.S. Air Force Weather Agency (AFWA)/XOGM, Offutt Air Force Base, NE 68113, USA; NASA Earth Observatory (URL: http://earthobservatory.nasa.gov/NaturalHazards/); Washington Volcanic Ash Advisory Center (VAAC), Satellite Analysis Branch (SAB), NOAA/NESDIS E/SP23, NOAA Science Center Room 401, 5200 Auth Road, Camp Springs, MD 20746, USA (URL: http://www.ospo.noaa.gov/Products/atmosphere/vaac/).
Etna
Italy
37.748°N, 14.999°E; summit elev. 3357 m
All times are local (unless otherwise noted)
Episodes of eruptions continue between 4 November and 14 December 2006
The 10-day-long eruption of Etna's Southeast Crater (SEC) in mid-July 2006 (BGVN 31:08 and 31:10) was considered by scientists at the Istituto Nazionale di Geofisica e Vulcanologia (INGV) to represent a distinct phase of 2006 activity for Etna. They identified a very different phase when eruptive activity shifted to SEC's summit vent between 31 August and early 15 September 2006. The latter activity led to lava overflows and repeated collapse on SEC's E side. The seven eruptive activity episodes previously described (BGVN 31:10) have since been renumbered slightly, with Episode 1 taking place between 31 August and 16 September.
The following report was compiled from recent reports by Boris Behncke and Sonia Calvari, based on daily observations by numerous staff members of the INGV Catania (INGV-CT). This issue overlaps with our previous Bulletin reports and then goes on through the end of 2006.
Overview of the 31 August to 14 December eruption. Figure 117 indicates key vents and lava flows during the period 4 September-7 December 2006. It excludes lavas emitted during the short but intense final episode (Episode 20, 11-14 December 2006), but they did not significantly extend beyond flow margins shown here. The longest lava flows of the reporting interval reached ~ 4.7 km SE from their source vent (figure 117).
Table 9 summarizes the 20 episodes of recent eruptive activity, as currently identified by the INGV staff. Note, however, that episode numbers have changed since discussed in BGVN 31:10. One earlier episode has been added (31 August-15 September). Former Episodes 1-7 as listed in BGVN 31:10 based on earlier INGV reports, have been renumbered to Episodes 2-8. Subsequent episodes (9 through 20) are the main subject of this report.
Table 9. List of eruptive episodes (1-20) at Etna as reported by INGV-CT for the interval 31 August-December 2006. "Former number" refers to the episode numbers stated in BGVN 31:10 but here revised. Geberal morning and afternoon times are indicated by am and pm, respectively. Courtesy of INGV-CT.
| Episode (former number) |
Dates (2006) |
Comments on onset of episode |
| 1 (new) |
31 Aug-15 Sep 2006 |
Eruptive activity shifted to SEC's summit vent (see BGVN 31:10). |
| 2 (1) |
22 Sep (pm)-27 Sep (am) |
Mild Strombolian explosions for first 2 days. |
| 3 (2) |
03 Oct (pm)-6 Oct (am) |
Started with Strombolian explosions from SEC summit, increasing in vigor during the following hours. |
| 4 (3) |
10 Oct (late pm)-11 Oct (late pm) |
Vigorous Strombolian activity and lava descending SE flank of SEC cone. |
| 5 (4) |
20 Oct (0500-late) |
Rapid increase in tremor amplitude, vigorous Strombolian activity in the central SEC summit and isolated large explosions from a vent near the E rim. |
| 6 (5) |
23 Oct (0600-?) |
Vigorous Strombolian activity and pulsating lava fountained from two vents at the summit of the SEC. |
| 7 (6) |
25 Oct (late pm)-26 Oct (late pm) |
Marked increase in tremor amplitude and ash emissions from the summit of the SEC, which produced only weak Strombolian activity. |
| 8 (7) |
27 Oct (pm) |
Increase in tremor amplitude and ash emissions from the SEC (see text for 26 Oct-4 Nov). |
| 9 |
29-30 Oct |
Pulse of activity. |
| 10 |
05 Nov (2004)-06 Nov (am) |
Strong eruptive episode started at SEC summit vent and continued with some fluctuations and intermittent ash emissions. |
| 11 |
08 Nov (until 2200) |
Ash emissions from summit of SEC, followed by vigorous Strombolian activity. |
| 12 |
10 Nov (2100)-11 Nov (1100) |
Tremor amplitude rapidly increased, bad weather hampered visual observations. |
| 13 |
16 Nov (0500-late pm) |
Lava issued from the 3,180-m vent, sharp increase in tremor amplitude, vigorous ash emissions at the SEC summit, these gradually replaced by intense Strombolian bursts. |
| 14 |
19 Nov (0400)-20 Nov (am) |
Strombolian activity at SEC occurred from two vents at the summit, lava flowed through the 16 November trench. |
| 15 |
21 Nov (1200)-23 Nov (0000) |
Inclement weather, a black ash plume rose to 1.5 km above the summit. |
| 16 |
24 Nov (0219-1530) |
Ash emissions mixed with Strombolian explosions at the SEC. |
| 17 |
27 Nov (0410-pm) |
SEC monitoring camera recorded thermal anomaly and an ash plume. |
| 18 |
31 Nov (1600)-03 Dec (am) |
Rising lava fountains followed 2 hours later by the '23 October pit' emitting dense ash and Strombolian explosions. |
| 19 |
06 Dec |
Increased tremor implied weak Strombolian activity and ash emission at SEC. |
| 20 |
11 Dec (0330)-14 Dec (pm) |
Strombolian explosions and voluminous lava flows from 2,800-m vent, ash from '23 October pit'. |
Episode 9. Although there were no real paroxysms of Strombolian activity or lava fountaining at the SEC during 26 October-4 November, clear pulses of activity occurred at the effusive vents at 2,800 and 3,050 m elevation, accompanied by ash emission or weak Strombolian explosions at the SEC. These events defined Episode 8, on 27 October, and Episode 29, which took place during 29-30 October. The clear pattern of distinct paroxysms from the SEC finally returned on 5 November and lasted through late that month, before the activity became again more continuous early in December.
Episode 10. Following one week of intermittent ash emissions and weak Strombolian activity on late 4 November, a new strong eruptive episode started at the SEC summit vent at 2004 on 5 November and continued with some fluctuations and intermittent ash emissions for the next 9.5 hours. Light ashfalls occurred over populated areas to the SE. At about 2147 on 5 November, the effusion rate increased at a vent at 3,050 m elevation at the S base of the central summit cone (C on figure 117) which had been continuously active since 27 October. A new lobe of lava traveled S of the summit cone complex across a flat area known as the Cratere del Piano.
An apparent increase in the effusion rate was also noted at the effusive fissure at 2,800 m elevation on the ESE flank (B on figure 117), with active lava lobes extending downslope. Lava effusion from the 3,050-m vent ended during the morning of 6 November, and for the following 48 hours, lava emission continued only at the 2,800-m vent.
Episode 11. Ash emissions from the summit of the SEC occurred on 8 November 2006, followed by vigorous Strombolian activity that continued until about 2200. Around 1600, lava started to flow from a new vent located in the saddle between the SEC cone and the adjacent main summit cone, at an elevation of ~ 3,180 m (D on figure 117). The lava reached the SW base of the SEC cone in a few minutes, where it bifurcated into several short lobes, the largest and westernmost lobe stopping at the E margin of the lava flow field from the 3,050-m vent. Lava from the 3,180-m vent had ceased flowing by about 1845, whereas spattering and lava effusion continued at the 3,050-m vent for some time. Spattering ended at that vent around 1930, but lava continued to flow for another 24 hours.
Episode 12. At 2100 on 10 November 2006, tremor amplitude rapidly increased. Bad weather hampered visual observations until 11 November, when it became evident that this episode was quite similar to its predecessor, with lava emission occurring from both the 3,050-m and 3,180-m vents. Strombolian activity from the SEC summit ceased at 1100 on 11 November. Lava emission from the 3,050-m vent continued until the following night, and the associated lava flow field grew mainly on its W side, with flow fronts descending to ~ 2,800 m. For the next five days, lava emission continued unabated from the 2,800-m-vent, whereas the SEC and all other vents remained inactive.
Episode 13. Following a sharp increase in tremor amplitude at 0500 on 16 November, vigorous ash emissions started at the SEC summit at 0507 and were gradually replaced by intense Strombolian bursts, marking the onset of this eruptive episode.
Very early during the episode, lava issued from the 3,180-m vent, forming a lobe ~ 100 m long before activity at this vent ceased.
Lava effusion from the summit started at 0615 on 16 November and triggered a series of rockfalls down the SE flank of the SEC cone, before the lava descended on the same flank. At 0626, brownish ash was emitted from a spot next to the effusive vent, and major rockfalls and avalanches started shortly thereafter. These originated at the S rim of what remained of the 2004/2005 collapse pit on the E flank of the SEC (see BGVN 30:01 and 30:12). Plumes rising from the descending avalanches contained both brownish ash and white steam. Avalanching was most intense between 0631 and 0640, after which the new lava flow rapidly descended the lower SE flank of the cone and began to extend beyond its base toward the area of the 2,800-m vent. At the same time, strong emissions of black ash marked the opening of another explosive vent next to the summit, and a third explosive vent became active in the same area. For the next several hours, the vents continued to eject ash and occasionally bombs, and to produce vigorous Strombolian activity.
At 0700 on 16 November emissions of white vapor occurred from the SE flank of the SEC cone; a few minutes later large rock avalanches started to descend that flank. Simultaneously a fissure began to open near the summit to downslope on the SSE flank, triggering local rockfalls and dust avalanches. This fissure initially propagated ~ 100 m downslope, then it temporarily stopped; but at 0720, it propagated another 150 m downslope. During the following 15 minutes, another fissure perpendicular to the earlier one cut SE across the flank, generating more rockfalls and dust avalanches. The resulting fissure system had the form of an inverted Y delimiting a block that was actively pushed outward by magma intruding into the cone's flank.
Lava began to issue from the lower end of the W branch of the fissure system at about 0810 on 16 November. At approximately the same time, the 3,050-m vent started to emit lava. By this time, the upper portion of the fissure cutting the SSE flank of the SEC cone had significantly enlarged and became a deep trench. Dense volumes of steam were emitted from this trench at 0831 and were followed a few minutes later by another series of rockfalls and avalanches. Direct observation from ~ 700 m showed that the most energetic of these avalanches resulted from the collapse of low fountains of gas and tephra at the lower end of the large trench. The avalanches and rockfalls lasted about 15 minutes, then a voluminous surge of lava issued from the lower end of the opening trench.
Over the next few hours this sequence of events (vapor emission?rockfalls and avalanches?lava emission) was repeated several times as the trench widened and propagated further downslope. During the few moments when steam and dust clouds cleared and the interior of the trench became visible, a cascade of very fluid lava was seen in the center of the trench. Apparently, the lava issued from a source high in the head wall of the trench, and at times spurted from the vent like a firehose.
At 1100 on 16 November, white steam plumes, rockfalls, and dust avalanches appeared high on the SE flank of the SEC cone, in the area where the summit lava flow was emitted. These phenomena marked a major collapse of the E wall of the trench, which eventually cut into the descending summit lava flow, diverting it into the trench. The original flow, which had descended immediately S of the 2,800-m vent down to ~ 2,600 m elevation, rapidly stopped, although lava continued to drain from the main flow channel and accumulated in a thickening lobe at the cone's base.
At about 1425 on 16 November, several vertical jets of black tephra shot upward from an area at ~ 150 m distance from the cone's base. These emissions were very distinct in color from the brownish dust clouds, which at the same time descended from the trench. The activity at the new site appeared to migrate rapidly both toward the SEC as dark plumes began to rise closer to the cone, while a ground-hugging plume of white vapor shot in the opposite direction. A few ten's of seconds later, very dense clouds of dark brown material began to appear at the base of the surging white cloud and formed a distinct flow that rapidly overtook the front of the white cloud while speeding toward SE. At the slope break along the W rim of the Valle del Bove (~ 2,800 m elevation), both clouds disappeared from view in weather clouds, but at the site where the activity had originated, a huge plume of white vapor soared skyward. White vapor continued to rise from the area and from the path of the white and dark brown clouds for more than 15 minutes.
Another explosive emission of white steam and dark brown plumes occurred at about 1455. Like the 1425 event, it generated ground-hugging clouds of steam and dark brown material, the latter again traveling faster. During the following hours, activity at the SEC gradually decreased, with several spectacular cascades of lava descending through the trench on the cone's SSE side. Steam explosions and rock avalanches occurred at the lower termination of the trench at 1525. Strombolian activity ceased at 1500 on 16 November, but lava emission continued until about midnight. This lava does not seem to have extended far from the base of the SEC cone, since investigation during the following day failed to reveal any fresh lava on top of the debris deposits emplaced during the major explosive events at 1425 and 1455. A minor lava flow was also fed from a new short fissure ~ 80 m E of the 3,050-m vent. During the evening a small lobe of lava was emitted from the accumulation at the SEC cone's base.
Fieldwork and aerial surveys during the two days following 16 November revealed that the 1425 and 1455 explosions and related volcaniclastic density currents (figure 118) had left two main types of deposit. One was of lobate shape and extended a few hundred meters from the source of the explosions to the SE, covering a footpath established by mountain guides to allow tourists to approach the persistently active 2,800-m vent.
On the ground the deposit consisted of very fine grained reddish-brown ash made up almost exclusively of lithic fragments. To the N the deposit gradually thickened and larger clasts were found on its surface, some of which represented fresh magmatic material. Close to the 2,800-m vent, the deposit abruptly graded into a sort of debris flow rich in lithics but with up to 25% of fresh magmatic clasts. These latter showed a peculiar flattened-out morphology. Where this deposit overlay the tourist path near the 2,800-m vent it was 1.52 m thick. In one place the flow had surrounded a plastic-coated sign warning tourists to stay on the path. The plastic lacked evidence of strong heating, indicating that the flow was relatively cool at this point along its path.
Volcanic tremor amplitude began to increase during the late afternoon of 18 November and, during a helicopter flight at 1800, the 2,800-m vent showed vigorous spattering. Active lava from the vent traveled ~ 3 km to Monte Centenari. Bright incandescence was also noted within the 3,180-m vent during this overflight.
Episode 14. At 0400 on 19 November, Strombolian activity at the SEC occurred from 2 vents at the summit while lava flowed through the 16 November trench and divided into numerous braiding lobes on top of the debris deposited 3 days earlier. The longest lobe traveled along the prominent channel in the main debris flow, passing immediately to the S of the 2,800-m vent and extending to an elevation of ~ 2,600 m. This episode was much less violent than its predecessor and lacked the explosions, surges, and flows characteristic of that event. Strombolian activity continued until the late evening, while lava effusion ended early on 20 November. As during previous episodes, lava had also briefly issued from the 3,050-m and 3,180-m vents. In addition, a flow of a few meters in length started from another fissure that opened at ~ 3,200 m, on the saddle between Bocca Nuova and SEC. This upper flow merged with the flow coming out from the 3,180-m vent.
Episode 15. This eruptive episode at the SEC started at 1200 on 21 November 2006, but direct observations were thwarted by inclement weather through nightfall. At about 1500, a black ash plume was seen rising above the cloud cover to ~ 1.5 km above the summit. Light ashfalls occurred along the Ionian coast near Giarre and further N, while at Rifugio Citelli (~ 6 km NE of the SEC), ash deposition was nearly continuous.
After 1900, the cloud cover gradually opened, allowing direct views of the strong Strombolian explosions generating jets sometimes over 300 m high. Lava once more flowed through the 16 November trench on the cone's SSE flank toward the 2,800-m vent. Likewise, the 3,050-m and 3,180-m-vents reactivated, although the latter apparently ceased erupting early during the episode. Lava flowed from the trench until shortly after midnight on 22 November. Bad weather precluded observations until the evening, when all activity was again limited to the 2,800-m vent.
Episode 16. At 0219 on 24 November, there began ash emissions mixed with Strombolian explosions. These were recorded by the INGV-CT thermal camera in Nicolosi (~ 15 km S of the SEC) with a significant anomaly occurring at the SEC summit. Strombolian activity at 0320 was accompanied by voluminous ash emission, which formed a plume that rose ~ 2 km above the summit before being blown to SE.
Two particularly powerful explosions occurred at 0452 and 0455. The latter was followed by lava extruding from a vent presumably located within the 16-November trench. At around 0535, lava began to issue from the 3,050-m vent, forming a small flow on the W side of the lava flow field emplaced since 26 October. A second minor flow issued from another vent located ~ 80 m SE of the 3,050-m vent. Vigorous ash emission from the summit of the SEC caused light ashfalls over populated areas between Zafferana and Acireale (figure 119).
A fracture opened at about 0817 at the SSE base of the SEC cone, producing a violent explosion and a rock avalanche that descended at a speed of several ten's of km/h toward the Valle del Bove, following the path of similar avalanches that had occurred on 16 November. Lava effusion continued from vents at the cone's base, where mild spattering was observed. Upslope from the effusive vent at 2,800 m elevation, a second fracture formed and commenced spattering and lava emission.
During the early afternoon a change in the wind direction drew the plume from its earlier SE-ward course toward Catania and adjacent areas, forcing the closure of the Fontanarossa International airport of Catania. The activity began to diminish, and by 1530 all explosive phenomena ceased. For several more hours lava continued to issue from two vents at the SEC cone's base.
Late in the afternoon of 24 November, weak sporadic Strombolian explosions occurred from a pit located on the E flank of the SEC cone, which had formed during the 23 October eruptive episode (hereafter, '23 October pit' identified as F on figure 117). On 25 November this vent produced pulsating ash emissions that continued intermittently for the next two days.
Episode 17. At around 0410 on 27 November, eruptive activity occurred at the SEC and the thermal monitoring camera at Nicolosi began to record a significant thermal anomaly at the crater and a W-drifting ash plume. Visual observations were hampered by inclement weather. Around 0730, the thermal camera at Nicolosi disclosed lava emission on the W side of the SEC cone, possibly from the vent at 3,180 m elevation in the saddle between the SEC and the Bocca Nuova. About 45 min later, lava emission became evident at the cone's SE base. No further visual observations were available after 0845, but the tremor amplitude remained high until the afternoon, when a sharp drop indicated the end of this eruptive episode.
Bad weather persisted until early on 29 November when observers saw ash emissions from the '23 October pit.' These emissions became more intense after 0545, and the tremor amplitude began to increase rapidly during the late morning. Intermittent, weak Strombolian activity from the '23 October pit' was visible after nightfall; this became notably stronger shortly after 0100 on 30 November and reached its highest intensity around 0130, after which there was a notable decrease. Ash emissions occurred from the same pit at dawn and again from 1240 onward, producing low ash plumes.
Episode 18. At around 1600 on 30 November 2006, lava fountains began to rise from the 2,800-m vent. Two hours later the '23 October pit' emitted a dense ash plume, and Strombolian explosions reached up to 150 m above the vent. At 2045, a fissure opened at ~ 3,100 m elevation, venting spatter several ten's of meters high and releasing a short lava flow towards the 2,800-m vent. After about 10 min the effusion rate at this new fissure diminished, but lava continued to escape at a decreasing rate for ~ 1 hour. The '23 October pit' remained vigorously active for the next 5 hours, producing incandescent jets and a dense tephra plume.
The new fissure at 3,100 m elevation revived around 0115 on 1 December, with vigorous spattering and a new surge of similarly directed lava. At the same time, the '23 October pit' emissions strongly increased. Like on the evening before, the new fissure at 3,100 m elevation remained active only for a short time; lava emission ceased by 0200 on 1 December.
The 2800-m vent produced the largest lava flows during the entire period of activity, in this episode extending lava flows to ~ 1,500 m elevation on the Valle del Bove floor, to a distance of ~ 4.7 km from their source.
Between 1-3 December, the '23 October pit' remained active with nearly continuous emissions of ash interspersed with Strombolian activity. This was accompanied by the 3,100-m fissure emitting low fountaining and lava; lava flows from that fissure were generally short and did not extend far beyond the 2,800-m vent. The last observed activity at the 3,100-m vent occurred during the morning of 3 December. Ash emissions from the '23 October pit' continued for another few days but became progressively weaker; likewise the lava emission at the 2,800-m vent diminished gradually.
Episode 19. Weak Strombolian activity and ash emission occurred at the SEC on the afternoon of 6 December, evidenced by increased tremor, but the amplitude dropped rapidly to very low levels implying that the SEC ceased erupting late on 6 December. Minor lava emissions continued from the 2,800-m vent. On the morning of 8 December, no eruptive activity was visible at any of the numerous vents of the previous weeks. Following several days of very low tremor amplitude, it began to increase again late on 10 December.
Episode 20. Eruptive activity resumed around 0330 on 11 December 2006 from the '23 October pit' on the SEC, with Strombolian explosions documented by INGV-CT's monitoring cameras. Simultaneously, lava emission started from the area of the 2,800-m vent, forming a flow that slowly descended toward the Valle del Bove. Bad weather hampered observations during the following days, but occasional clear views revealed ash emissions from the '23 October pit.' In addition, there were voluminous lava emissions from the 2,800-m vents, feeding a broad lava flow adjacent the N margin of the lava flowfield produced from the same vent between mid-October and early December. The 2,800-m vents generated vigorous Strombolian explosions from two vents that built up a pair of large hornitos, and lava emissions came from a third vent located on the lower E flank of the larger, more easterly of the hornitos. No activity occurred from any other of the numerous vents that had been active during the previous weeks at the summit and in the vicinity of the SEC. Late in the afternoon of 14 December, a sharp drop in tremor amplitude indicated that the end of this final eruptive episode was imminent, and field observations made on the following morning revealed the absence of eruptive activity.
INGV considered Etna's 2006 summit eruptions during 14 July-14 December and made a rough estimate of erupted lava volumes. The total volume produced during those 5 months amounted to ~ 15-20 x 106 m3.
There was a single, relatively small ash emission from Bocca Nuova on 19 March 2007, discharged without an associated seismic signal. This was followed ten days later by a brief episode of violent lava fountaining and tephra emission from the SEC. Details on that and subsequent activity will be reported in a future Bulletin.
References. Behncke, B., and Neri, M., 2006, Mappa delle colate laviche aggiornata al 20 Novembre 2006 (1 page PDF file on the INGV website) and Carta delle colate laviche emesse dall'Etna dal 4 Settembre al 7 Dicembre 2006 (Map of lava flow emissions at Etna from 4 September to 7 December 2006).
Behncke, B., Branca, S., Neri, M., and Norini, G., 2006, Rapporto eruzione Etna: mappatura dei campi lavici aggiornata al 7 Dicembre 2006 (Report of Etna eruption: map of lava flows up to 7 December 2006): INGV report WKRVGALT20061215.pdf.
Geologic Background. Mount Etna, towering above Catania on the island of Sicily, has one of the world's longest documented records of volcanism, dating back to 1500 BCE. Historical lava flows of basaltic composition cover much of the surface of this massive volcano, whose edifice is the highest and most voluminous in Italy. The Mongibello stratovolcano, truncated by several small calderas, was constructed during the late Pleistocene and Holocene over an older shield volcano. The most prominent morphological feature of Etna is the Valle del Bove, a 5 x 10 km caldera open to the east. Two styles of eruptive activity typically occur, sometimes simultaneously. Persistent explosive eruptions, sometimes with minor lava emissions, take place from one or more summit craters. Flank vents, typically with higher effusion rates, are less frequently active and originate from fissures that open progressively downward from near the summit (usually accompanied by Strombolian eruptions at the upper end). Cinder cones are commonly constructed over the vents of lower-flank lava flows. Lava flows extend to the foot of the volcano on all sides and have reached the sea over a broad area on the SE flank.
Information Contacts: Sonia Calvari and Boris Behncke, Istituto Nazionale di Geofisica e Vulcanologia-Catania (INGV-CT), Sezione di Catania, Piazza Roma 2, 95123 Catania, Italy (URL: http://www.ct.ingv.it/).
Ijen (Indonesia) — February 2007 Cite this Report
Ijen
Indonesia
8.058°S, 114.242°E; summit elev. 2769 m
All times are local (unless otherwise noted)
Acidic crater lake and active solfatara investigations
Scientists from Simon Fraser and McGill universities conducted preliminary geophysical and geochemical field studies at Ijen (figure 4) between 13 and 26 August 2006. During this period, volcanic activity was low and restricted to persistent degassing of the solfatara in the SE part of the crater.
Measurements of temperature and pH were made every morning during 14-19 August at four locations: the Banyupuhit River, ~ 5 km from the Banyupuhit River source, the acid lake in the summit crater, and the E shore of the crater lake. Temperatures of the Banyupuhit River were 16-20°C, always above atmospheric temperature by ~ 1-3°C; the pH was ~ 0.4. Lake temperatures varied between 31 and 43°C and the pH was -0.02. The color of the crater lake was generally homogeneous, although large black to brown linear patches, probably sulfur deposits from the solfatara, were observed on the turquoise-green surface. These ephemeral patches were of variable size (e.g. several ten's of meters long and a few meters wide) and moved across the lake during the course of the day, but were not always evident throughout the day. The area near the E shore appeared lighter than the rest of the lake, probably due to a spring at the bottom of the inner E slope.
Pipes driven into the fumaroles are used to extract gases for sulfur mining (figure 5). Temperatures measured 50 cm down into four of those pipes ranged from 224 to 248°C. These measurements almost certainly represent minimum estimates of the true temperatures due to heat loss along the length of the extraction pipes. After the gases had exited less than 50 cm from the pipes, temperatures had dropped below 120°C, the melting point of native sulfur.
A survey of sulfur dioxide (SO2) fluxes made by a portable spectrometer (FLYSPEC) on 21 and 23 August along the SE rim of the crater consisted of seven and twelve walking traverses through the plume, respectively. The gas plume produced directly from the active solfatara near the lake surface rose buoyantly before flowing over the crater rim. During the first survey (conducted over a 2-hour period), the concentration-pathlength of the gas in the plume fluctuated between 1,000 and 2,500 ppm-m. The wind speed (measured by handheld anemometer at plume height) during this time averaged 6.1 m/s and the resultant SO2 flux was therefore calculated to average 412 metric tons per day (t/d) with a standard deviation of 154 t/d. On 23 August, gas concentrations were somewhat lower, ranging between 500 and 2,000 ppm-m. The average wind speed during the survey period (2 hours) was 3.9 m/s and the resultant SO2 flux averaged 254 t/d, with a standard deviation of 117 t/d. Based on this very limited survey, the flux of SO2 was estimated to be 330 t/d.
Gravity surveys (Bouguer and dynamic) were conducted in the active crater and seven gravity stations were selected for future dynamic gravity monitoring. A digital elevation map was prepared (using digital photogrammetric mapping methods) to provide the spatial framework required for interpretation of the geophysical surveys.
The scientists also applied the self-potential (SP) method, also know as spontaneous potential, that measures electrical potentials developed in the Earth by electrochemical action between minerals and solutions with which they are in contact. SP mapping of the active summit crater showed two main hydrologic structures (figure 6). The first is a hydrogeologic zone on the E and NE rim characterized by a negative SP anomaly with a minimum at -100 mV (millivolts), an inverse SP/elevation gradient of -1.6 mV/m, and length of 1,500 m. This almost certainly represents inflow of meteoric water and groundwater.
The second structure is the main hydrothermal system located S, W, and N of the crater as well as in the southern inner slope of the crater, places where the surface expressions are solfataras. The SP maxima range between 48 and 60 mV and are located on the slope of the river below a dam on the outer W slope (+52 mV), on the N rim (+48 mV) and in the S part of the solfatara (+ 59 mV). Processing of the SP data along the crater profile by continuous wavelet transform (Mauri and others, 2006) shows that the hydrothermal fluid cells are near the surface (less than 200 m below the topographic surface) suggesting that the hydrothermal system is under high pressure with significant heat flux, as shown by the solfatara.
Reference. Mauri, G., Saracco, G., and Labazuy, P., 2006, Volcanic activity of the Piton de la Fournaise volcano characterized by temporal analysis of hydrothermal fluid movement, 1992 to 2005: AGU, Eos Trans, v. 87, no. 52, Fall Meet. Suppl., Abstract V51A-1653.
Geologic Background. The Ijen volcano complex at the eastern end of Java consists of a group of small stratovolcanoes constructed within the 20-km-wide Ijen (Kendeng) caldera. The north caldera wall forms a prominent arcuate ridge, but elsewhere the rim was buried by post-caldera volcanoes, including Gunung Merapi, which forms the high point of the complex. Immediately west of the Gunung Merapi stratovolcano is the historically active Kawah Ijen crater, which contains a nearly 1-km-wide, turquoise-colored, acid lake. Kawah Ijen is the site of a labor-intensive mining operation in which baskets of sulfur are hand-carried from the crater floor. Many other post-caldera cones and craters are located within the caldera or along its rim. The largest concentration of cones forms an E-W zone across the southern side of the caldera. Coffee plantations cover much of the caldera floor; nearby waterfalls and hot springs are tourist destinations.
Information Contacts: Guillaume Mauri and Glyn Williams-Jones, Department of Earth Sciences, Simon Fraser University, Burnaby, BC V5A 1S6, Canada (URL: http://www.sfu.ca/earth-sciences.html); Willy (A.E.) Williams-Jones, Department of Earth and Planetary Sciences, McGill University, Montreal, Quebec, Canada (URL: http://www.mcgill.ca/eps/); Deddy Mulyadi, Center of Volcanology and Geological Hazard Mitigation (CVGHM), Diponegoro 57, Bandung, Jawa Barat 40122, Indonesia (URL: http://vsi.esdm.go.id/).
Kanlaon (Philippines) — February 2007 Cite this Report
Kanlaon
Philippines
10.4096°N, 123.13°E; summit elev. 2422 m
All times are local (unless otherwise noted)
Steam-and-ash explosions in June and July 2006
After a year of quiet following ash ejections from Canlaon in May 2005 (BGVN 30:06), the Philippine Institute of Volcanology and Seismology (PHIVOLCS) reported that a new period of activity began on 3 June 2006. In total, twenty-three ash ejections occurred between 3 June and 25 July 2006. These outbursts were all water-driven in nature, characterized by emission of ash and steam that rose up to 2 km above the active crater. The prevailing winds dispersed ash in all directions. The seismic network, however, did not detect significant seismic activity before or after the ash emissions, supporting the idea that the explosions were very near-surface hydrothermal events.
Four explosive episodes that occurred over the days 3, 10, and 12 June ejected mainly steam with some ash, and affected only the summit crater and upper SW slopes. The event at 1430 on 3 June sent dirty white to grayish steam 800 m above the summit. The activity was observed until 1445 when thick clouds covered the summit. Another emission started at 2316 on 10 June and lasted until 0030 the next morning. The plume was estimated to attain heights of 700-1,000 m before drifting SW. After the ash emission, moderate to wispy steam plumes escaped, to maximum heights of 600 m above the summit. Another steam-and-ash episode during 0515-0535 on 12 June caused a plume to rise about 600 m before drifting SW. After the ash emission, generally weak to moderate steaming to a height of ~ 400 m returned. Plumes rose 600-1,000 m and drifted SW; ashfall was confined to the upper slopes. This new period of low-level unrest prompted PHIVOLCS to raise the hazard status to Alert Level 1 on 12 June, suspending all visits to within 4 km of the summit.
Three small steam-and-ash emissions without recorded seismicity occurred again between the afternoon of 13 June and the morning of the 14th. The grayish steam clouds rose ~ 900 m above the active crater and drifted NE and NW. Only traces of ash were observed over the N upper slope. An explosion from 0845 to 0924 on 14 June produced an ash and steam cloud, which rose up to 1.5 km above the summit and drifted N, affecting mainly the upper slopes. Voluminous grayish steam plumes were then seen rising up to 1.5 km above the summit crater after 1640 through the next morning. The seismic network detected only two low-frequency volcanic earthquakes. Kanlaon City proper experienced light ashfall starting at 1630 on 15 June after voluminous dirty white steam was observed rising 1.5-2 km above the summit crater a few hours earlier (from 1346 to 1520). As of 1800, ashfall was still wafting through the city.
The character of this episode changed on the afternoon of 19 June when two episodes of steam-and-ash emission sent clouds 600 m above the crater that drifted SW. Weak to moderate steaming was observed after the second explosion and during the morning observation on the 20th. The initial explosion was recorded by the Cabagnaan station's seismograph as low-frequency tremor with a duration of 13 minutes. One minute of tremor was recorded at the time of the second explosion. No precursor seismicity was detected. Traces of ashfall and sulfurous odors were reported at Barangay Cabagnaan proper in La Castellana. During the 24 hours before 0730 on 20 June, the seismic network detected two cases of low-frequency tremor and three small low-frequency volcanic earthquakes.
An additional six short steam-and-ash emissions took place during 21-25 June. The explosions produced grayish columns that rose 800-1,500 m above the crater and drifted NW, SW, and SSW. Volcanic seismicity was not associated with these events except for a single harmonic tremor before the emission on 25 June. Light ashfall was reported at Upper Cabagnaan in La Castellana. Weak to moderate steaming was observed after the explosions.
Steam-and-ash emissions were not reported again until the afternoon of 2 July. The grayish steam clouds then rose to heights of up to 1,000 m above the active crater and generally drifted NW. Another episode on the morning of 3 July produced a column to a height of 500 m above the crater. The seismograph at Cabagnaan recorded ten volcanic earthquakes while the seismograph at Sto. Bama near Guintubdan in La Carlota City recorded eight local seismic events during the 24 hour observation period that included these emissions.
An explosion-type earthquake with a 10 min, 25 sec duration was recorded at 0426 on 23 July, but cloud cover prevented observations. Traces of ash fell up to about 9 km ENE from the crater, affecting Barangays Pula, Malaiba, and Lumapao. When clouds cleared during 0630-0800 on 25 July, ash-laden steam clouds were seen rising up to 300 m above the crater drifting ENE and SE. Light ashfall was experienced at Gabok, Malaiba, and Lumapao of Kanlaon City, about 9 km from the crater. This emission was not reflected on the seismic record as only two small volcanic earthquakes were detected during the preceding 24 hours. Dirty white steam was observed on the morning of the 26th rising to a maximum of 100 m above the crater.
Explosions ceased after 25 July, and other activity, such as weak steaming and minor seismicity, showed a general trend towards quiescence. After three months with no further explosive emissions, on 2 November 2006 PHIVOLCS lowered the hazard status from Alert Level 1 to Alert Level 0, meaning the volcano has returned to normal conditions.
Geologic Background. Kanlaon volcano (also spelled Canlaon) forms the highest point on the Philippine island of Negros. The massive andesitic stratovolcano is covered with fissure-controlled pyroclastic cones and craters, many of which are filled by lakes. The largest debris avalanche known in the Philippines traveled 33 km SW from Kanlaon. The summit contains a 2-km-wide, elongated northern caldera with a crater lake and a smaller but higher active vent, Lugud crater, to the south. Eruptions recorded since 1866 have typically consisted of phreatic explosions of small-to-moderate size that produce minor local ashfall.
Information Contacts: Philippine Institute of Volcanology and Seismology (PHIVOLCS), Department of Science and Technology, PHIVOLCS Building, C.P. Garcia Avenue, Univ. of the Philippines Campus, Diliman, Quezon City, Philippines (URL: http://www.phivolcs.dost.gov.ph/).
Langila (Papua New Guinea) — February 2007 Cite this Report
Langila
Papua New Guinea
5.525°S, 148.42°E; summit elev. 1330 m
All times are local (unless otherwise noted)
Emission of ash plumes continues through March 2007
Moderate activity occurred at Langila between January and March 2006 (BGVN 31:05), with eruptive activity accompanied by a continuous ashfall, rumbling, and weak emissions of lava fragments. Since March 2006, activity has continued at Crater 2.
According to the Darwin Volcanic Ash Advisory Center (VAAC), eruptions at Crater 2 occurred in August 2006 and from October 2006 through March 2007, with explosions of incandescent lava fragments, roaring noises at regular intervals, and continuous emissions of gray-to-brown ash plumes. Plumes generally reached 2.3-3.3 km altitude, although on 31 October a small ash plume rose to an altitude of 4.6 km. Ash plumes were occasionally visible on satellite imagery. During October and through the first part of January 2007, plumes generally drifted N, NW, W, WNW, and NE; between the end of January and March, plumes drifted SE and SW.
Thermal anomalies detected by MODIS instruments on the Terra and Aqua satellites were absent after 2 January 2006 until 21 July 2006. The same system (the HIGP Thermal Alerts System) identified anomalies again on 24 and 31 October, 12 and 21 November, 16 and 27 December 2006, 6 January, 8 March, and 18 March 2007.
Geologic Background. Langila, one of the most active volcanoes of New Britain, consists of a group of four small overlapping composite basaltic-andesitic cones on the lower E flank of the extinct Talawe volcano in the Cape Gloucester area of NW New Britain. A rectangular, 2.5-km-long crater is breached widely to the SE; Langila was constructed NE of the breached crater of Talawe. An extensive lava field reaches the coast on the N and NE sides of Langila. Frequent mild-to-moderate explosive eruptions, sometimes accompanied by lava flows, have been recorded since the 19th century from three active craters at the summit. The youngest and smallest crater (no. 3 crater) was formed in 1960 and has a diameter of 150 m.
Information Contacts: Rabaul Volcano Observatory (RVO), PO Box 386, Rabaul, Papua New Guinea; Darwin Volcanic Ash Advisory Centre (VAAC), Bureau of Meteorology, Northern Territory Regional Office, PO Box 40050, Casuarina, Northern Territory 0811, Australia (URL: http://www.bom.gov.au/info/vaac/); Hawai'i Institute of Geophysics and Planetology (HIGP) Thermal Alerts System, School of Ocean and Earth Science and Technology (SOEST), Univ. of Hawai'i, 2525 Correa Road, Honolulu, HI 96822, USA (URL: http://modis.higp.hawaii.edu/).
Lastarria (Chile-Argentina) — February 2007 Cite this Report
Lastarria
Chile-Argentina
25.168°S, 68.507°W; summit elev. 5706 m
All times are local (unless otherwise noted)
Intense fumarolic emissions typical of activity since at least 1940
The rarely visited Lastarria has not erupted in historical time, but has displayed strong fumarolic activity (figure 1) for at least 67 years. This is the first Bulletin report ever issued on this volcano; it presents new images of the steaming edifice. On 2 February 2007, a group of scientists from the Servicio Nacional de Geología y Minería (SERNAGEOMIN) and the Corporación Nacional Forestal (CONAF) observed the fumarolic activity from a distance. The scientists were on a field trip to count flamingos and other Andean birds at Ramsar sites. The Ramsar Convention on Wetlands (http://www.ramsar.org/), named after a city in Iran, is an intergovernmental treaty that provides the framework for national action and international cooperation for the conservation and wise use of wetlands and their resources. The group noted steam plumes blowing NE at mid-day from ~ 47 km SW. Fumarolic gases were again seen, from ~ 35 km WSW, slowly moving down the W slope of the cone (figure 2). Steam plumes were seen intermittently throughout the afternoon.
Jose Antonio Naranjo, who has worked at Lastarria since 1983, is very familiar with its spectacular fumarolic activity. He confirmed that the observations of February 2007 reflect Lastarria's normal intense fumarolic emissions. Such activity has continued since at least 1940, when observed by Danko Slozilo. Naranjo noted that in 2007 he saw the same fumarole locations as those he observed in 1983 and in October 2002 (figure 3). The temperatures of these fumaroles were unchanged between 1983 and 2002.
References. Naranjo, J.A., 1985, Sulphur flows at Lastarria volcano in the North Chilean Andes: Nature, v. 313, no. 6005, p. 778-780.
Naranjo, J.A., 1986, Geology and evolution of the Lastarria volcanic complex, north Chilean Andes: Unpublished M Phil. Thesis, The Open University, England, 157 p.
Naranjo, J.A., and Francis, P., 1987, High velocity debris avalanche at Lastarria volcano in the north Chilean Andes: Bull. Volcanol., v. 49, p. 509-514.
Naranjo, J.A., 1988, Coladas de azufre de los volcanes Lastarria y Bayo en el norte de Chile: reologia, genesis e importancia en geologia planetaria: Revista Geologica de Chile, v. 15, no. 1, p. 3-12.
Naranjo, J.A., 1992, Chemistry and petrological evolution of Lastarria volcanic complex in the north Chilean Andes: Geol. Magazine, v. 129, p. 723-740.
Geologic Background. The NNW-trending edifice of 5706-m-high Lastarria volcano along the Chile-Argentina border contains five nested summit craters. The youngest feature is a lava dome that overlaps the northern crater rim. The large andesitic-dacitic Negriales lava field on the western flanks was erupted from a single SW-flank vent. A large debris-avalanche deposit is found on the SE flank. Recent pyroclastic-flow deposits form an extensive apron below the northern flanks of the volcano. Although no historical eruptions have been recorded, the youthful morphology of deposits suggests activity during historical time. Persistent fumarolic activity occurs at the summit and NW flank, and sulfur flows have been produced by melting of extensive sulfur deposits in the summit region.
Information Contacts: Héctor Cepeda and Margaret Mercado, Servicio Nacional de Geología y Minería (SERNAGEOMIN), Chile; Jorge Carabantes, Cristian Rivera, Eric Díaz, and Juan Soto, Corporación Nacional Forestal (CONAF), Chile; Jose Antonio Naranjo, Volcano Hazards Programme, Servicio Nacional de Geologia y Mineria, Chile.
Ol Doinyo Lengai (Tanzania) — February 2007 Cite this Report
Ol Doinyo Lengai
Tanzania
2.764°S, 35.914°E; summit elev. 2962 m
All times are local (unless otherwise noted)
March-April 2006 eruption sends lava down flanks
The previous Bulletin report (BGVN 31:03) discussed an unusually vigorous eruption during late March and early April 2006. This report revisits the March 2006 eruption and continues to the beginning of 2007, thanks in large part to the reports of many observers posted by Frederick Belton on his website.
March-April 2006 eruption. The March 2006 eruption was initially characterized in the Arusha Times as being more massive than the one in 1966. However, Celia Nyamweru noted that subsequent information indicated that the 2006-2007 event was smaller than the 1966-1967 event. During the March-April 2006 event, the volcano was reported to have emitted "red-hot rivers of molten rock and scalding fumes." Ibrahim Ole Sakay, a resident of Ngaresero (-1.3 km from the volcano) reported that the eruption began on the night of 24 March 2006, continuing the following day, and marked by "rumbling and spitting lava for more than a week."
Several news sources, including CNN, reported that on 30 March 2006 the eruption led to the evacuation of up to 3,000 people from several villages, some quite distant from the volcano. As of 5 April, there was a great deal of contradictory information about this eruption. Belton noted that news media and people distant from the volcano reported explosions, but that people living and working nearby reported a "smoke column" followed by a very large lava flow down the W flank, but no explosions or ash. All evidence now indicates that there was no explosive activity and that this was only a very large eruption of lava.
Visitor observations. Belton posted reports from a number of persons who observed the volcano before and shortly after the March 2006 eruption. One observer, Christoph Weber, drew a new map of the crater in February 2006 (figure 91). Belton visited the volcano in August 2006 and provided (figure 92) an update to Weber's February map as well as a photo of the recent changes (figure 93). The following text and table 11 were taken from observations by visitors, as reported by Belton on his website.
Table 11. Summary of visitors to Ol Doinyo Lengai and their brief observations (from a climb, crater overflight photos, or from the flank) from January 2006 to February 2007 (see figures 91 and 92 for crater features). Detailed observations prior to March 2006 were reported in BGVN 31:03; most of the later observations were detailed in the text. Courtesy of Frederick Belton.
| Date |
Reporting Visitor(s) |
Brief Observations |
| 04 Jan-06 Jan 2006 |
Bernard Donth |
Climb, 1100 hours, 4 Jan: lava from hornito T49B; spatter and little flows in all directions with eruption every 30 minutes; 1 larger flow reached NW Overflow. At 1500 hours activity decreased; no more flows during rest of stay. |
| 10 Jan 2006 |
Christian Mann and family |
Climb: no activity except some degassing from hornito T47. During previous weeks lava filled large open vent of T56B and flowed from there to possibly other locations onto NE part of crater floor. |
| 02 Feb-07 Feb 2006 |
Christoph Weber with film team |
Climb: see BGVN 31:03. |
| 13 Feb 2006 |
Christoph Weber |
Overflight: new lava flows from T58B and T56B vents. Crater rim overflow widths unchanged since Aug 2005. |
| 25 Feb-26 Feb 2006 |
Chris DeVries with McGill Univ. students |
Climb: see BGVN 31:03. |
| 11 Mar 2006 |
Cristine Mentzel |
Overflight: numerous small lava flows extending in all directions in the crater from the central cone cluster. |
| 13 Mar 2006 |
Rick and Heidi Rosen |
Overflight. |
| 14 Mar 2006 |
Serge and Sandrine Magnier |
Overflight: fresh lava on crater floor. Photos of lava show thin, fine textured aa flows, very black, originating from unidentifiable source in central cone cluster. |
| 29 Mar 2006 |
Locals reporting to Amos Bupunga |
Flank: lava flowed within 2 km of village, but no one vacated. |
| 01 Apr 2006 |
Dean Polley |
Overflight: photos of crater documenting partial collapse of T56B and T58B and possible existence of a lava lake there. |
| 01 Apr 2006 |
Matt Jones |
Climb. |
| 04 Apr 2006 |
Michael Dalton-Smith |
Overflight. |
| 05 Apr 2006 |
Michael Dalton-Smith |
Flank. |
| 07 or 08 Apr 2006 |
Amos Bupunga |
Climb: lava still being emitted only within the new lake. |
| 06 May-11 May 2006 |
Jean Perrin |
Climb: absence of lava lake activity; a thick ash layer was seen in the crater. |
| 12 May-13 May 2006 |
Tobias Fischer |
Climb. |
| 21 May-28 May 2006 |
Matthieu Kervyn |
Climb. |
| 13 Jul-15 Jul 2006 |
Steve Beresford, Michelle Carey, Mark and Rene Tait |
Climb. |
| 31 Jul-05 Aug 2006 |
Daniela Szczepanski, Andreas Ramsler, Norbert Fischer |
Climb: no activity other than smoking cones and rockfalls in the collapse zone. |
| 04 Aug-08 Aug 2006 |
Fred Belton, Peter and Jennifer Elliston |
Climb. |
| 20 Aug 2006 |
Ram Weinberger, Majura Songo |
Climb: no significant changes in crater since 8 Aug. |
| 22 Aug 2006 |
Helene Frume |
Climb: no eruptive activity and no visible change since 20 Aug. |
| 22 Sep 2006 |
Magda Kozbial |
Climb: no activity since the previous reported visit on 20 and 22 Aug; only noticeable change since early Aug was some additional collapse of CP1 on its W edge, which appeared to have destroyed all but a tiny remnant of T46. Smoke arose from the cracks in the ground near the crater (CP1) behind the biggest cone, mostly at the location of T46, and smell of sulfur quite strong. |
| 31 Jan-02 Feb 2007 |
Tom Pfeiffer |
Climb. |
When Rick and Heidi Rosen flew over on 13 March 2006, there appeared to be no activity and many lava flows had turned white. Several flows still contained dark areas, their surface color indicating that they were then only a few days old. Narrow flows extended in all directions from the central cone mound, and a small flow originating on the upper part of T49B extended across the NW crater rim overflow and a short distance down that flank. Lava also appeared to have reached the E crater rim overflow. Most of the flows appeared to have been subject to the same amount of weathering, except for the flow down the NW flank, which looked more recent.
After a 1 April 2006 climb, Matt Jones reported that there was a fairly large lava flow down the W flank. Residents in nearby Ngaresero village and the Ngorongoro District Commissioner said that activity started on 27 March 2006. At the summit in the dark, Jones noted no glowing from lava emissions. The new eruption left a big hole to the left of the climbing path to the crater that emitted a plume of steam. On the following day, abundant steam came from the hornitos and from fissures all around the rim. Two central hornito's had been blown open relatively recently.
According to people interviewed by Amos Bupunga, who visited later, lava had flowed out on 29 (30?) March 2006 and extended to ~ 2 km from a Maasai family village (boma) at Ol Doinyo Lengai's foot. Bupunga heard that residents did not vacate their village. In the crater, lava of unstated ages covered almost all of the NW to SE regions of the crater to a depth of 2 m. At its outlet over the crater's W rim, one or more lava flows was 2.5 m deep and 3 m wide.
On 4 April 2006, Michael Dalton-Smith flew over and observed a very large lava flow that traveled over 1 km down the mountain and into a gorge. He reported that a bush pilot observed a 30 March eruption consisting of a fountain and lava flow, without an ash cloud. Local pilots also noted that on 4 April the eruption stopped. No steam was seen, nor any evidence that the large lava flow was still hot or moving.
On 5 April, Dalton-Smith drove to the foot of the volcano and saw a huge lava fountain coming from one of the summit hornitos. The fountain stopped before he could photograph it, but from the previous overall structure of the hornitos, it appeared that a new one had been building. All hornitos emitted black plumes, and there appeared to be a lake at the summit about the size of the large hornito.
Amos Bupunga visited the crater on 7 or 8 April 2006, and, in addition to the above-mentioned information he gathered relevant to 29 or 30 March, he saw that the fresh lava coming to the surface remained inside the new lava lake.
Table 12 summarizes annual measurements from 2000 to 2006 of widths of lava flows leaving the crater at various rim overflows. The number and size of the overflows have generally grown, although the width of the NW overflow has remained 135 m since 2002.
Table 12. Annual crater rim overflow measurements taken during 2000 to 2006. Stated values are the width of the crater outflow area at the crater rim. Courtesy of Frederick Belton.
| Date |
NW overflow width |
E overflow width |
W overflow width |
N overflow width |
| Jul 2000 |
60 m |
38 m |
-- |
-- |
| 23 Jul 2001 |
106 m |
38 m |
-- |
-- |
| 05 Aug 2002 |
135 m |
39 m |
12 m |
-- |
| 02 Aug 2003 |
135 m |
44 m |
17 m |
-- |
| 16 Jul 2004 |
135 m |
47 m |
17 m |
-- |
| 07 Aug 2005 |
135 m |
72 m |
20 m |
1 m at three locations |
| 07 Aug 2006 |
135 m |
73 m |
23 m |
1 m at three locations |
Aerial photos made on 1 April by Dean Polley showed that there had been a huge collapse of the upper parts of hornitos T56B and T58B, which merged together and probably contained a lava lake (figure 94); as noted earlier, photos by Rick Rosen showed that the collapse had not occurred by 13 March 2006.
Polley's 1 April photos show that at the SE base of T58C (just behind the collapse pit) there appeared to be a new vent with prominent lava channels leading away to the SE. Lava from this vent seemingly filled up the low lying areas in the S crater, spilled across the W overflow and down the flank. A similar eruption probably occurred again on 3 April. It was likely that a large amount of the lava was flowing through buried tubes, typical during an eruption of long duration.
From 6-11 May 2006, Jean Perrin and four others from Reunion Island visited ol Doinyo Lengai and reported an absence of active lava flows but small gaseous emissions at some hornitos and plausible rare explosions (which may have also been the sound of rocks collapsing). Due to the very large collapse mentioned above, hornitos T56B, T58B, T58C, and T57B no longer existed. No lava lake activity was seen or heard in the collapsed area. The crater floor was covered with a thick ash layer and looked considerably different than before.
On 12-13 May 2006, Tobias Fischer reported seeing no activity, but the crater was filled with old lava much higher than what was seen the previous year. A very large collapsed cone with sharp rugged edges was noticed in the T58B area. Sulfur dioxide (SO2) flux was measured using a differential optical absorption spectrometer (mini-DOAS), but the fluxes measured were low, the same as in 2005. Sampled lava were later analyzed and their carbonatite compositions were identical to 2005 lavas. Some possible carbonatite tephra was also sampled. Coming from deep inside the volcano there were discrete rumblings lasting for several seconds and up to 10 seconds; these repeated up to 15 times per hour.
Matthieu Kervyn reported that during his visit to the volcano, 21-28 May 2006, he noted no eruptive activity at all except for fumaroles from cracks in the rim and from most of the hornitos (especially in the afternoons). The collapse pit in the middle was enlarging through rim collapse. Visual inspection showed that the collapse pit might soon cause instability of the very high T49B cone. Maasai guides were also expecting T49B to collapse soon. There were some tremors felt several times per hour within the N crater, as if rocks were collapsing beneath the crater.
During 13-15 July 2006, Steve Beresford, Michelle Carey, and Mark and Rene Tait visited the active crater. Activity at that time was limited to abundant fumarolic degassing from the crater rim and central hornitos. They noted a recent (several days old) major lava flow in the SE part of the N crater, its path emanating from the S end of the lava lake at the crater dominating the central N crater. The pre-March 2006 morphology of the N crater had been the scene of a prominent central hornito cluster (figure 91). During 13-15 July the group found much of that cluster destroyed, with the dominant feature on 13 July being a wide (120 x 120 m) crater hosting a recently active lava lake. The hosting crater's S margin was very unstable and periodic collapse of the crater walls was common over the two days of observation. The crater's N margin was marked by a steep collapse scarp in the T49B hornito. Talus breccia from this scarp partially infilled the N part of the lava lake. Numerous scarp collapses (associated with abundant seismic activity) highlighted the ephemeral nature of the current crater/lava lake outline. Marks around the lava lake recorded former high-stands of lava during recent months. SE- and S-draining tubes were present, both testifying to the lateral draining of lava.
The above group saw the S tubes that emanated from the central lava lake appeared to connect to the T37B hornito. The majority of the lava flow of the March-April eruption appeared to have come from this hornito. The reduction in lava lake level and southerly flow direction suggested that the lava lake dramatically drained to the S and may have provided the lava that escaped in the T37B eruption. Pyroclastics surrounding T37B suggested that early mild Strombolian/Hawaiian style activity preceded or accompanied effusion, as was typical of recent N crater volcanism. The lava flow itself was dominantly slabby to spiny pahoehoe with many aa and frothy pahoehoe breakouts along the E margin. This flow appeared similar to an inflated slabby pahoehoe flow field. Very small toothpaste pahoehoe flows emanated from the slabby pahoehoe flow front.
August 2006 map and its interpretation. During 4-8 August 2006, Fred Belton and Peter and Jennifer Elliston camped on the volcano. The visitors found degassing cones and fumaroles; no lava erupted. Occasional rockfalls occurred in the collapse zone.
To explain the August map and field relationships (figure 21), Belton and the visitors provided the following synopsis of the most recent activity and collateral observations. Some of the following revisits observations already discussed, but other points are new to this report and convey the significance of this stage where substantial lava flows descend out of the summit crater.
Prior to their arrival, lava had flowed from T37B and CP2 and spread over the SE part of the crater floor. Thermal anomaly satellite sensing data from MODIS, analyzed by Matthieu Kervyn, indicated that the eruption probably occurred on 20 June (UTC). An Aster image from June 29 shows new dark lava in the SE part of the crater. During the eruption, lava lakes existed in CP1 and CP2 and lava flowed from CP2 and T37B and covered most of the crater floor lying between T45, T37B, T37, and the crater rim. Lava also flowed across the E overflow and down the flank. The flow was composed of at least two distinct, differently weathered lavas that may have occurred within days or hours of one another. The first eruption phase produced a fine-textured aa no more than 40 cm thick and was the more extensive of the two flows, covering a large area of the crater floor and crossing the E rim overflow. The second phase produced a less extensive but much thicker flow, nearly 2 m deep in places, that stopped before reaching the crater rim or the E overflow. It consisted of broken, ropy pahoehoe slabs. Lava from this eruption and possibly from prior activity completely covered cone T24, which was no longer visible. The collapse of the E half of T46 has revealed an interior cave containing long thin stalactites.
Since March 2006, ~ 8,000 m2 of the central crater floor had collapsed. Photographs by several observers indicated that the collapse began just prior to or during the eruption of late March through early April 2006 and continued as an ongoing process. The current collapse zone consisted of two collapse pits, designated CP1 and CP2 in figure 92, plus a fractured area between the two pits and S of CP1 where large sections of terrain had broken away from the crater floor proper and subsided by 1-3 m. The displaced sections had tilted at various angles and were separated from one another and the crater floor by 1- to 2-m-wide fissures. The fissures contain numerous large boulders composed of lavas that were altered by weathering and then lithified.
Cones T58C, T56B, and T58B had collapsed into CP1 and were completely gone. Further enlargement of CP1 claimed the SW half of T57B, the SE base of T49B, and the E half of T46. The SW half of T37B had collapsed into CP2. Tall cone T49B, visible from the Rift Valley floor, appeared likely to collapse in the near future. Failure of its SE base resulted in a talus slope that spilled out onto the floor of CP1. CP1 and CP2 were each ~ 10 m deep with respect to the lowest point on their rims. CP2's floor and E side were talus-covered, but CP1 had a bi-level floor of slabby pahoehoe lava, the surface of a frozen lava lake. A wide lava channel exited CP2 to the SE, near the base of T37B, indicating that it contained a lava lake, which had overflowed onto the crater floor during the March-April eruption. From the lowest point of CP2, a tunnel sloped upward to CP1, connecting the pits. The floor of the tunnel was covered by talus from its unstable walls and roof.
A prominent open lava channel, with a smaller channel diverging from it, led SSE from CP1 past T37 and then wound W and NW to the W overflow, recording the route of the lava that flowed from T58C to Ol Doinyo Lengai's base during the exceptionally strong discharges of roughly 25 March-5 April 2006. Near CP1 the channel's path had thermally eroded to a depth of ~ 3 m, and remained nearly closed at the top. An overhanging ledge contained stalactites. The channel became indistinct in the S part of the crater, but regained prominence near the W overflow, where in places it attained a width of ~ 5 m and depth of ~ 2.5 m. A large chasm just below the W overflow carved by thermal erosion extended ~ 20 m down the flank, with a depth of 5 m and a width of ~ 12 m. Its sides appeared unstable and prone to collapse. Immediately downslope of the chasm, the lava entered an existing gully and could not be easily seen again until the slope moderated near the base of the volcano, at which place the lava chilled only a few meters from the climbing track. From there its path continued into an aa field at its terminus, ~3 km from the summit.
The terminus of the flow lies within 1 km of a Masai boma on the flank, the only habitation evacuated as a result of the eruption. The lava channel near the climbing track was ~ 3 m high and at one point formed a tumulus ~ 5 m in height (tumulus, an elliptical, domed structure formed on the surface of a pahoehoe flow on flat or gentle slopes, created when the upward pressure of slow-moving molten lava within a flow swells or pushes the overlying crust upward). A video of this segment of the lava flow (made during the eruption viewed from the escarpment to the W) showed a rapid, turbulent flow with blobs of lava becoming airborne. The lava near the base of Ol Doinyo Lengai had a dark gray-black coloration and appeared less weathered than might be expected based on its age of 4 months.
Lava flows from the same eruption also covered much of the S part of the crater floor to a depth of at least 2 m. Based on the indistinctness of the main lava channel in the S part of the crater, it appeared likely that the low areas of the S part of the crater were filled by lava prior to spilling over the W crater rim overflow and down the flank. Hornitos T27 and T30, formed in 1993, were completely covered by this flow.
Satellite IR data for 2006 (MODIS and MODLEN). Remote thermal monitoring by satellite using an algorithm called MODLEN was analyzed by Matthieu Kervyn. The analysis suggested an increase in volcanism around 11-13 March 2006. MODLEN is the name of a semi-automated algorithm using MODIS night-time imagery to record thermal activity and detect abnormally high-intensity eruptive events. It is built upon MODVOLC, an algorithm developed by the University of Hawaii, which provides a fully-automated global-coverage hot-spot-detection system. MODLEN was specifically tailored to Ol Doinyo Lengai's low-temperature and small scale eruptive activity (Kervyn and others, 2006a and 2006b).
Table 13 shows the MODIS/MODVOLC thermal anomalies for the year 2006. MODIS thermal alerts on 25, 27, and 29 March 2006 indicated a small but intense area of activity, possibly in the form of a large lava lake. A thermal alert at about 2255 on 29 March was consistent with eye-witness reports and air photos by Polley (mentioned above). A thermal alert for a large area of the flank on 3 April probably indicated a second lava flow to the base of the volcano.
Table 13. MODIS thermal anomalies detected at Ol Doinyo Lengai during 2006. Courtesy of Hawai'i Institute of Geophysics and Planetology.
| Date |
Time (UTC) |
Number of pixels |
Satellite |
| 23 Mar 2006 |
2325 |
1 |
Aqua |
| 25 Mar 2006 |
2020 |
5 |
Terra |
| 25 Mar 2006 |
2315 |
2 |
Aqua |
| 27 Mar 2006 |
2005 |
1 |
Terra |
| 27 Mar 2006 |
2300 |
2 |
Aqua |
| 29 Mar 2006 |
1955 |
1 |
Terra |
| 03 Apr 2006 |
0750 |
2 |
Terra |
| 03 Apr 2006 |
2010 |
3 |
Terra |
| 03 Apr 2006 |
2310 |
6 |
Aqua |
| 04 Apr 2006 |
1130 |
1 |
Aqua |
| 20 Jun 2006 |
2025 |
1 |
Terra |
| 20 Jun 2006 |
2320 |
1 |
Aqua |
Kervyn reported that the MODIS algorithm indicated a strong thermal anomaly in the crater on 20 June 2006 (table 13). He interpreted this anomaly as likely thermal signatures from new lava in the SE part of the crater and the lava lakes that later observers reported. No thermal alerts were detected through the remainder of 2006.
Early 2007 observations. Tom Pfeiffer reported that during a visit from 31 January-2 February 2007, no lava erupted from the summit vents. According to local Masai guides, the form of the central area of the crater with the large collapse pit near the tall hornito T49b appeared unchanged since the summer of 2006. From an open vent in the NE corner at the bottom of the pit at the base of the hornito, continuous sounds of loud sloshing suggested mobile lava in some caverns just beneath that area, an assumption confirmed by the glow of lava visible at night from a second, smaller vent located about 30 m S of the large vent in the base of the collapse pit. One guide confirmed he had seen spattering of lava from this vent some two weeks earlier. In addition to the loud sound of moving lava underground, a constant, deep rumbling could be heard from the ground, resembling the sounds of very distant thundering. It was strongest in the NW area of the crater between the collapse pit and the fissure vents of the March 2006 lava flow.
References. Kervyn, M., Harris, A.J.L., Mbede, E., Jacobs, P., and Ernst, G.G.J., 2006a, MODIS thermal remote sensing monitoring of low-intensity anomalies at volcanoes: Oldoinyo Lengai (Tanzania) and the MODLEN algorithm: Geophysical Research Abstracts, v. 8, p. 03887.
Kervyn, M., Harris, A.J.L., Mbede, E., Jacobs, P., and Ernst, G.G.J., 2006b, MODLEN: A semi-automated algorithm for monitoring small-scale thermal activity at Oldoinyo Lengai Volcano, Tanzania: International Association for Mathematical Geology XIth International Congress, Université de Liège, Belgium, 3-8 September 2006, paper SO9-15.
Geologic Background. The symmetrical Ol Doinyo Lengai is the only volcano known to have erupted carbonatite tephras and lavas in historical time. The prominent stratovolcano, known to the Maasai as "The Mountain of God," rises abruptly above the broad plain south of Lake Natron in the Gregory Rift Valley. The cone-building stage ended about 15,000 years ago and was followed by periodic ejection of natrocarbonatitic and nephelinite tephra during the Holocene. Historical eruptions have consisted of smaller tephra ejections and emission of numerous natrocarbonatitic lava flows on the floor of the summit crater and occasionally down the upper flanks. The depth and morphology of the northern crater have changed dramatically during the course of historical eruptions, ranging from steep crater walls about 200 m deep in the mid-20th century to shallow platforms mostly filling the crater. Long-term lava effusion in the summit crater beginning in 1983 had by the turn of the century mostly filled the northern crater; by late 1998 lava had begun overflowing the crater rim.
Information Contacts: Frederick Belton, Developmental Studies Department, PO Box 16, Middle Tennessee State University, Murfreesboro, TN 37132, USA (URL: http://oldoinyolengai.pbworks.com/); Christoph Weber, Volcano Expeditions International, Muehlweg 11, 74199 Untergruppenbach, Germany (URL: http://www.v-e-i.de/); Celia Nyamweru, Department of Anthropology, St. Lawrence University, Canton, NY 13617, USA (URL: http://blogs.stlawu.edu/lengai/); Matthieu Kervyn, University of Ghent, Geology Department, Ghent, Belgium (URL: http://homepages.vub.ac.be/~makervyn/); Arusha Times, Arusha, Tanzania (URL: http://www.arushatimes.co.tz/); Tom Pfeiffer, Volcano Discovery (URL: http://www.volcanodiscovery.com/); Hawai'i Institute of Geophysics and Planetology (HIGP) Thermal Alerts System, School of Ocean and Earth Science and Technology (SOEST), Univ. of Hawai'i, 2525 Correa Road, Honolulu, HI 96822, USA (URL: http://modis.higp.hawaii.edu/).
Lopevi (Vanuatu) — February 2007 Cite this Report
Lopevi
Vanuatu
16.507°S, 168.346°E; summit elev. 1413 m
All times are local (unless otherwise noted)
Three eruptive episodes between October 2005 and August 2006
Volcanic activity from Lopevi has continued intermittently since November 1998 (BGVN 24:02). Though there are no permanent residents on the island, which is known as Vanei Vollohulu in the local language, the nearby islands of Epi (~ 17 km SW) and Paama (~ 10 km WNW) are heavily populated. Ambrym, another active volcanic island 18 km NNW, is also at risk of ashfall from Lopevi. Ash plumes during active periods are often reported by aviators, and thermal anomalies are frequently detected by the MODIS instrument on the Terra and Aqua satellites. Ash plumes and lava flows have most recently been reported in January, May, and July 2006.
Activity during 2006. Vertical plumes were observed by aviators reaching altitudes of 2.1-2.4 km on the morning of 24 January, and ~ 2.7 km the next morning. Further advisories issued by the Wellington VAAC reported that "smoke" plumes with a "steady rate of growth" rose to ~ 2.1 km on the morning of 26 January and drifted S. Lava flowing down the S flank was also reported on the 26th.
Based on information from a pilot report, the Wellington VAAC reported that on 7 May 2006 a small ash plume was visible below an altitude of ~ 3 km and an active lava flow was observed. On 10 May, a slow moving plume reached 3 km altitude. The next day a plume rose to 4.6 km and trended SE. During 12-13 May, the plume heights lessened to 3 km as the eruption vigor reportedly decreased. News media also reported heavy ashfall on Ambrym and Paama from an eruption on 15 May. An official spokesperson for Vanuatu's National Disaster Management Office reported no new ashfall during 17-22 May.
A situation report from the UN Office for the Coordination of Humanitarian Affairs (OCHA) noted that the May eruptive episode caused heavy ashfall on Paama and SE Ambrym, affecting water supplies and crops. The total population of Paama is 1,572, comprised of 23 villages and 511 households. On the island of Paama, the two main cash crops of vanilla and pepper were damaged badly. On both islands, staple foods such as wild yams, kumala, taros, bananas, and coconut trees were either damaged or destroyed. Residents experienced health problems caused by the consumption of contaminated food and water as well as the inhalation of ash. Head pain, skin infections, diarrhea, vomiting and respiratory difficulties were reported.
The Wellington VAAC received pilot reports of an eruption plume on 5 July that reached an unknown altitude. Another pilot report indicated that the eruption may have started on 27 June. The eruption continued over the next few days, with dark ash plumes reaching altitudes of 3.7 km and drifting E and SE. No plumes were reported after the morning of 10 July.
MODIS thermal anomalies during 2005-2006. Thermal anomalies were detected by MODIS during 26-31 March 2005, though no corresponding explosive activity was reported. No hot spots were identified at Lopevi again until 27 October 2005, after which anomalies were present on most days through 26 January 2006; ash plumes were not reported until the end of this period, 24-26 January.
Later in 2006, thermal anomalies were detected by MODIS on most days during 25-28 April, 2-16 May, 25-28 May, 26 June-9 July, and 18 July-1 August 2006. The largest number of alert pixels (24) during this time occurred at 2225 on 2 May. These data indicated two significant episodes of activity that included both explosive activity and probably lava emission during 25 April-28 May and 26 June-1 August. Two periods of plumes observations discussed previously, during 7-15 May and 27 June-10 July, fall within these longer episodes defined by the thermal data. No MODIS thermal anomalies were detected between 2 August 2006 and mid-March 2007.
Geologic Background. The small 7-km-wide conical island of Lopevi, known locally as Vanei Vollohulu, is one of Vanuatu's most active volcanoes. A small summit crater containing a cinder cone is breached to the NW and tops an older cone that is rimmed by the remnant of a larger crater. The basaltic-to-andesitic volcano has been active during historical time at both summit and flank vents, primarily along a NW-SE-trending fissure that cuts across the island, producing moderate explosive eruptions and lava flows that reached the coast. Historical eruptions at the 1413-m-high volcano date back to the mid-19th century. The island was evacuated following major eruptions in 1939 and 1960. The latter eruption, from a NW-flank fissure vent, produced a pyroclastic flow that swept to the sea and a lava flow that formed a new peninsula on the western coast.
Information Contacts: Wellington Volcanic Ash Advisory Centre (VAAC), Meteorological Service of New Zealand Ltd (MetService), PO Box 722, Wellington, New Zealand (URL: http://www.metservice.com/vaac/, http://vaac.metservice.com/); MODVOLC Alerts Team, Hawai'i Institute of Geophysics and Planetology (HIGP), SOEST, University of Hawaii and Manoa, 168 East-West Road, Post 602, Honolulu, HI 96822, USA (URL: http://modis.higp.hawaii.edu/); Department of Geology, Mines, and Water Resources, PMB 01, Port-Vila, Vanuatu (URL: http://www.suds-en-ligne.ird.fr/fr/volcan/vanu_eng/lopevi1.htm); Port Vila Presse, PO Box 637, Port Vila, Efate, Vanuatu (URL: http://www.news.vu/en/); ReliefWeb, Office for the Coordination of Humanitarian Affairs, United Nations, New York, NY 10017, USA (URL: https://reliefweb.int/).
Merapi (Indonesia) — February 2007 Cite this Report
Merapi
Indonesia
7.54°S, 110.446°E; summit elev. 2910 m
All times are local (unless otherwise noted)
March-July 2006 volcanic crisis; May earthquake killed ~5,800
Merapi, one of the most dangerous volcanoes in the world owing to its perched lava dome and location in populous central Java, underwent vigorous dome growth during early to mid-2006, and its increasingly unstable summit dome released numerous pyroclastic flows and incandescent avalanches. Thousands of residents evacuated and the volcano became prominent in international news. The longest pyroclastic flows of mid-2006 took place on 8 and 14 June, with respective run-out distances from the summit area of ~ 5 and 7 km. Merapi's summit lies 32 km N of the large city of Yogyakarta.
This report contains summary notes on activity during 7 March to 1 July 2006. These notes were assembled and reported by scientists from the Merapi Volcano Observatory and the Center of Volcanology and Geological Hazard Mitigation (CVGHM), formerly the Volcanological Survey of Indonesia, and augments material presented previously (BGVN 31:05 and 31:06).
The USGS provided a satellite image with labels showing key drainages and features near the summit (figure 27). The dome's instability leads to pyroclastic flows and various kinds of rockfalls and other mass wasting episodes down the labeled drainages. During the 7 March to 1 July reporting interval, pyroclastic flows followed the headwaters of the Gendol , Krasak, Boyong, and Sat rivers, which trend to the SE, SW, SSW, and W, respectively.
Tectonic earthquake on 27 May 2006. The tectonics of Java are dominated by the subduction of the Australia plate to the NNE beneath the Sunda plate with a relative velocity of ~ 6 cm/year. The Australia plate dips NNE from the Java trench, attaining depths of 100-200 km beneath the island of Java, and depths of 600 km to the N of the island. The earthquake of 27 May 2006 occurred at shallow depth in the overriding Sunda plate, well above the dipping Australia plate.
The pace of volcanism and the intensity of the regional crisis increased after 27 May 2006. At 0553 that day, a destructive Mw 6.3 earthquake occurred leaving damage across central Java's southern coastal and inland areas (figure 28). The earthquake occurred at 10 km focal depth. The epicenter (at 7.962°S, 110.458°E) was 20 km SSE of Yogyakarta (population, 511,000; 6 million in the larger metro area). Some initial estimates put the earthquake at MR 5.9; this was later revised and even the newer (above-stated) seismic parameters are preliminary.
A US Geological Survey (USGS) summary stated that the earthquake caused 5,749 deaths, 38,568 injuries, and led to as many as 600,000 people displaced in the Bantul-Yogyakarta area. The shaking left more than 127,000 houses destroyed and an additional 451,000 houses damaged in the area, with the total loss estimated at ~3.1 billion US dollars. Modified Mercalli intensities were as follows: at Bantul and Klaten, IX; at Sleman and Yogyakarta, VIII; at Surakarta, V; at Salatiga and Blitar, IV; and at Surabaya, II. The earthquake was felt in much of Java and at Denpasar, Bali. The website of the US Geological Survey's Earthquake Hazards Program features a large number of photos (captioned in English) depicting various aspects of the earthquake.
Events during 7 March-1 July 2006. Tables 17 and 18 summarize some of the details during the reporting interval. Merapi's activity had increased to include volcanic earthquakes and deformation of the summit area a year earlier (in July 2005). Although the number of daily lava avalanches and pyroclastic flows had increased almost a week earlier, a tectonic earthquake, MR 6.3 (Richter scale magnitude), at 0555 (local time, WIB) on 27 May was followed by another significant increase in those events for another week (tables 17 and 18). Pyroclastic flows and lava avalanches between 10 May and 30 June were rare in the W-flank Sat drainage (31 May, 2 June, and 10 June), and did not descend into the Boyong drainage (SSW) after 4 June (table 18). The Krasak river drainage (SW) had material entering it on an almost daily basis after 27 May, except for a brief time during 14-19 June, with maximum run-out distances of 4 km. The Gendol drainage (SE) also experienced daily pyroclastic flows and lava avalanches starting on 28 May. Most of these flows to the SE did not extend more than 5 km, but on 14 June a pyroclastic flow descended 7 km.
Table 17. A compilation of seismic events at Merapi during 7 March to 1 July 2006. In creating this table Bulletin editors merged the category "landslides" with the category "lava avalanches". Similarly, the category "hot cloud reports" was interpreted to be equivalent to "pyroclastic flow" and those were also merged. Those mergers were driven by sudden shifts in terminology found in CVGHM reports. No data was available for 26-27 April, 29 April-5 May, 8 May, 12-21 May, 24-26 May, 9 June, or 16-18 June. * Earthquake, MR 6.3 (Richter scale magnitude) recorded at 0555 (local time, WIB). ** Incomplete data only 0000-0600 (local time). All data courtesy of CVGHM.
| Date |
Plume seen to (meters above summit) |
Lava avalanche signals |
Multiphase earthquakes |
Pyroclastic flow signals |
Tectonic earthquakes |
| 07-12 Mar 2006 |
-- |
-- |
198 |
-- |
-- |
| 13-19 Mar 2006 |
-- |
-- |
239 |
-- |
-- |
| 21 Apr 2006 |
-- |
13 |
162 |
-- |
1 |
| 22 Apr 2006 |
-- |
12 |
95 |
-- |
-- |
| 23 Apr 2006 |
-- |
5 |
60 |
-- |
1 |
| 24 Apr 2006 |
-- |
21 |
178 |
-- |
1 |
| 25 Apr 2006 |
200 |
6 |
25 |
-- |
-- |
| 28 Apr 2006 |
-- |
20 |
126 |
-- |
-- |
| 06 May 2006 |
-- |
82 |
95 |
-- |
-- |
| 07 May 2006 |
-- |
59 |
104 |
-- |
-- |
| 10 May 2006 |
-- |
133 |
153 |
-- |
-- |
| 11 May 2006 |
600 |
88 |
115 |
-- |
-- |
| 22 May 2006 |
-- |
309 |
56 |
25 |
-- |
| 23 May 2006 |
700 |
243 |
60 |
31 |
-- |
| 27 May 2006 * |
100 |
279 |
-- |
54 |
138 |
| 28 May 2006 |
1600 |
237 |
43 |
159 |
95 |
| 29 May 2006 |
500 |
332 |
18 |
88 |
57 |
| 30 May 2006 |
800 |
337 |
19 |
56 |
40 |
| 31 May 2006 |
800 |
276 |
36 |
127 |
24 |
| 01 Jun 2006 |
1300 |
315 |
35 |
144 |
13 |
| 02 Jun 2006 |
650 |
338 |
25 |
163 |
24 |
| 03 Jun 2006 |
800 |
488 |
79 |
107 |
16 |
| 04 Jun 2006 |
900 |
397 |
54 |
118 |
25 |
| 05 Jun 2006 |
400 |
300 |
9 |
157 |
17 |
| 06 Jun 2006 |
300 |
212 |
10 |
78 |
14 |
| 07 Jun 2006 |
275 |
256 |
12 |
66 |
8 |
| 08 Jun 2006 |
300 |
210 |
28 |
67 |
10 |
| 10 Jun 2006 |
900 |
337 |
37 |
34 |
4 |
| 11 Jun 2006 |
800 |
299 |
20 |
20 |
10 |
| 12 Jun 2006 |
350 |
264 |
31 |
22 |
8 |
| 13 Jun 2006 |
1200 |
273 |
88 |
28 |
5 |
| 14 Jun 2006 |
500 |
371 |
29 |
61 |
2 |
| 15 Jun 2006 |
900 |
260 |
100 |
27 |
6 |
| 19 Jun 2006 |
600 |
272 |
88 |
21 |
7 |
| 20 Jun 2006 |
1250 |
312 |
136 |
38 |
4 |
| 21 Jun 2006 |
-- |
256 |
65 |
15 |
4 |
| 22 Jun 2006 |
1200 |
319 |
39 |
4 |
5 |
| 23 Jun 2006 ** |
600 |
78 |
5 |
4 |
5 |
| 24 Jun 2006 |
1500 |
338 |
48 |
21 |
6 |
| 25 Jun 2006 |
800 |
321 |
32 |
18 |
17 |
| 26 Jun 2006 |
800 |
372 |
27 |
17 |
11 |
| 27 Jun 2006 |
1000 |
251 |
16 |
23 |
11 |
| 28 Jun 2006 |
1000 |
308 |
16 |
19 |
1 |
| 29 Jun 2006 |
700 |
290 |
11 |
15 |
12 |
| 30 Jun 2006 |
500 |
74 |
0 |
9 |
3 |
| 01 Jul 2006 ** |
350 |
250 |
4 |
13 |
4 |
Table 18. Record of run out distances (km) of pyroclastic flows and lava avalanches (the latter, in parentheses) toward river drainages on Merapi from 10 May to 30 June 2006. No data was reported for 16-18 June, and weather obscured views on21-22 June. Courtesy of CVGHM.
| Date |
Gendal (km) |
Krasak (km) |
Boyong (km) |
Sat (km) |
| 10 May 2006 |
0.2 |
1.5 |
-- |
-- |
| 20 May 2006 |
3.0 |
3.0 |
3.0 |
-- |
| 22 May 2006 |
-- |
3.5 |
-- |
-- |
| 27 May 2006 |
-- |
3.8 (2.0) |
(2.0) |
-- |
| 28 May 2006 |
3.0 (1.0) |
(2.5) |
(2.5) |
-- |
| 29 May 2006 |
1.0 (1.0) |
3.5 (2.0) |
(2.0) |
-- |
| 30 May 2006 |
2.0 (1.0) |
3.5 (2.0) |
(2.0) |
-- |
| 31 May 2006 |
2.0 (1.5) |
3.5 (2.5) |
3.5 (2.5) |
(2.5) |
| 01 Jun 2006 |
1.5 (1.5) |
2.0 (3.0) |
2.0 (3.0) |
-- |
| 02 Jun 2006 |
1.0 (1.0) |
3.0 |
3.0 |
(1.0) |
| 03 Jun 2006 |
4.0 (1.0) |
2.0 (1.0) |
2.0 (2.0) |
-- |
| 04 Jun 2006 |
4.0 (1.0) |
1.5 (2.0) |
1.5 (2.0) |
-- |
| 05 Jun 2006 |
3.0 (1.0) |
1.5 (2.0) |
-- |
-- |
| 06 Jun 2006 |
2.0 (1.0) |
(2.0) |
-- |
-- |
| 07 Jun 2006 |
3.0 (1.0) |
1.5 (2.0) |
-- |
-- |
| 08 Jun 2006 |
5.0 (1.0) |
4.0 (2.0) |
-- |
-- |
| 09 Jun 2006 |
4.0 |
-- |
-- |
-- |
| 10 Jun 2006 |
3.5 (1.0) |
(2.0) |
-- |
(3.0) |
| 11 Jun 2006 |
4.0 |
(3.0) |
-- |
-- |
| 12 Jun 2006 |
1.5 |
(3.0) |
-- |
-- |
| 13 Jun 2006 |
3.0 (1.0) |
(2.0) |
-- |
-- |
| 14 Jun 2006 |
7.0 |
-- |
-- |
-- |
| 15 Jun 2006 |
4.5 |
-- |
-- |
-- |
| 19 Jun 2006 |
3.0 (1.0) |
-- |
-- |
-- |
| 20 Jun 2006 |
3.5 (1.0) |
(2.0) |
-- |
-- |
| 23 Jun 2006 |
(1.0) |
(2.0) |
-- |
-- |
| 24 Jun 2006 |
4.0 (1.0) |
2.5 (2.5) |
-- |
-- |
| 25 Jun 2006 |
3.0 (1.0) |
(3.0) |
-- |
-- |
| 26 Jun 2006 |
4.5 (1.0) |
4.0 (3.0) |
-- |
-- |
| 28 Jun 2006 |
3.0 (1.0) |
(2.5) |
-- |
-- |
| 29 Jun 2006 |
2.0 (1.0) |
(2.5) |
-- |
-- |
| 30 Jun 2006 |
3.0 (1.0) |
(2.0) |
-- |
-- |
Because of the vigor of activity, the Alert Level rose in several steps as follows: 19 March (Green to Yellow), 12 April (Yellow to Orange), and 13 May (Orange to Red). The step to Red (which is the highest alert level, and sometimes also referred to as Level 4) followed clear deformation at the dome during elevated seismicity. On 28 April, a new lava dome emerged. By 20 May, pyroclastic flows several kilometers long were regularly seen passing down several key drainages (table 18). Figure 29 shows a 15 May pyroclastic flow (seen two days after the alert status rose to red).
Volcano enthusiasts and photographers Martin Rietze and Tom Pfeiffer viewed Merapi on the morning of 27 May, during the destructive earthquake, from a high-elevation parking area ~ 4 km S of the summit. Prior to the earthquake, Rietze took several spectacular photos of incandescent avalanches pouring down avalanche shoots (figure 30 A-B). During the earthquake, he described horizontal swinging motion and dull rumbling sounds lasting perhaps 20 seconds. Dust rose from the volcano. Plants rubbing together also produced a rustling noise. Cries and engine noises in the background came from distant residents responding to the earthquake. At ~1-minute intervals, Merapi emitted about six pyroclastic flows and a substantial ash cloud grew overhead, reaching several kilometers in altitude above them. The photo in figure 30 C depicts the scene on Merapi around that time (which Rietze lists as 0555 on 27 May). His companion, Tom Pfeiffer, also took photos just after the large earthquake (e.g., figure 30 D).
During early June the activity level of Merapi remained at red and on 4 June, the increase in volume of the new lava dome had caused the southern part of the crater wall called Gegerbuaya (1910 lavas) to collapse. Prior to its collapse, Gegerbuaya had functioned as a barrier to prevent pyroclastic flows moving southward from entering the Gendol River, which they did later in June.
On 8 June, multiple pyroclastic flows reached 4 km from the Krasak and Boyong Rivers and up to 4.5 km down the Gendol River. On 9 June, ash drifted W and NW and accumulated as ashfall ~ 1.5 mm thick. Pyroclastic flows traveled as far as 4 km toward the Gendol River. Figures 31 and 32 show pyroclastic flows on 7 and 10 June.
In the period after the hazard level was raised to red, the lava dome grew and by 22 May its volume was ~ 2.3 million cubic meters. The M 6.3 earthquake in S-Central Java on 27 May triggered additional activity at Merapi. The dome's growth rate increased from the previous rate of around 100,000 cubic meters/day, leading to a lava dome volume on 8 June 2006 of ~4.3 million cubic meters. That lava dome stood 116 m above the nominal summit elevation of Merapi's peak (Garuda peak).
Dome collapse created the longest pyroclastic flow of the reporting interval, which took place on 14 June 2006. That pyroclastic flow attained a run-out distance of 7.0 km (table 18, figures 33 and 34, and previously reported in BGVN 31:05).
At least in part owing to loss of topographic relief at the Gegerbuaya ridge along the S crater wall (figure 27), the 14 June pyroclastic flow took a different path. It crossed the former barrier and descended the Gendol drainage. As previously noted (BGVN 31:05), the 14 June pyroclastic flow took two lives when the underground bunker where the victims sought refuge was buried by the pyroclastic flow.
The bunker overridden on 14 June resides in Kaliadem village (~ 5 km SE of the summit). News stories showed pictures of the rescue attempt with initial digging commencing using picks and shovels, with the excavation by soldiers wearing dust masks and standing on boards or wooden platforms, presumably to reduce the heat flow from the fresh deposit. The article also noted that the soldiers wore heat-retardant clothes. A report from the Taipei Times of 16 June 2006 and credited to the Associated Press said that "The fierce heat melted the troops' shovels and the tires on a mechanical digger brought in to plow through more than 2 m of volcanic debris covering the bunker, built for protection from volcanic eruption . . .." Later news reports noted that authorities unearthed the bunker, which lay beneath more than 2 m of steaming pyroclastic flow deposit. The two bodies had suffered burns and the facility's door was ajar. A BBC report showed deeper portions of the hole being excavated by a large backhoe. They also noted that upon deeper excavation a probe into the deposit with a hand-held digital thermometer apparently indicated temperatures reached ~ 400°C. Several grim photographs circulated in the press showing the excavated entrance of the bunker and a team in the process of removing the victim's bodies. No report has been found discussing the exact reason for the bunker's failure, although several comments in the press suggested it was not designed to withstand burial by a pyroclastic flow.
Prior to that, on 13 June, the alert status dropped to orange, but it rose back to red again the next day after the pyroclastic flow and increases in multi-phased earthquakes. Activity remained stable but high through June 29 but began to decrease after 30 June. During July the intensity and frequency of pyroclastic flows and rock falls decreased. On 10 July, authorities reduced the alert status to orange on all but the S slopes. By the end of July 2006, pyroclastic flows had ceased.
Merapi's long-term dome growth continued at low to modest levels during the rest of 2006 and early 2007. The Darwin Volcanic Ash Advisory Center noted a plume to 6.1 km altitude drifting NE on 19 March 2007. These later incidents will be discussed in more detail in a forthcoming issue of the Bulletin.
MODVOLC Thermal Alerts. The Hawai'i Institute of Geophysics and Planetology MODIS Thermal Alert System web site lacked any thermal alerts for over a year preceding May 2006. Thermal alerts over Merapi began 14 May 2006 and extended through early September 2006 on nearly a daily basis. The alerts continued intermittently into 2007.
Reference. United Nations, 2006, Indonesia Earthquake 2006 Response Plan: United Nations, OCHA Situation Report No. 5, Issued 31 May 2006, GUDE EQ-2006-000064-IDN, 42 p.
Geologic Background. Merapi, one of Indonesia's most active volcanoes, lies in one of the world's most densely populated areas and dominates the landscape immediately north of the major city of Yogyakarta. It is the youngest and southernmost of a volcanic chain extending NNW to Ungaran volcano. Growth of Old Merapi during the Pleistocene ended with major edifice collapse perhaps about 2,000 years ago, leaving a large arcuate scarp cutting the eroded older Batulawang volcano. Subsequent growth of the steep-sided Young Merapi edifice, its upper part unvegetated due to frequent activity, began SW of the earlier collapse scarp. Pyroclastic flows and lahars accompanying growth and collapse of the steep-sided active summit lava dome have devastated cultivated lands on the western-to-southern flanks and caused many fatalities.
Information Contacts: Center of Volcanology and Geological Hazard Mitigation (CVGHM), Jalan Diponegoro 57, Bandung 40122, Indonesia (URL: http://vsi.esdm.go.id/); United Nations-Office for the Coordination of Humanitarian Affairs (OCHA), United Nations, New York, NY 10017, USA; National Earthquake Information Center, US Geological Survey, PO Box 25046, Denver Federal Center MS967, Denver, CO 80225, USA (URL: http://earthquake.usgs.gov/); Darwin Volcanic Ash Advisory Centre (VAAC), Bureau of Meteorology, Northern Territory Regional Office, PO Box 40050, Casuarina, Northern Territory 0811, Australia (URL: http://www.bom.gov.au/info/vaac/advisories/); John Pallister, Volcano Disaster Assistance Program, USGS Cascades Volcano Observatory, 1300 SE Cardinal Court, Suite 100, Vancouver, WA 98683-9589, USA (URL: http://volcanoes.usgs.gov/); Tom Pfeiffer and Martin Rietze, Volcano Discovery (URL: http://www.decadevolcano.net/), http://www.tboeckel.de/); Tarko Sudiarno, Agence France Presse (AFP) (URL: http://www.afp.com/english/home/); Taipei Times (URL: http://www.taipeitimes.com/); Associated Press (URL: http://www.ap.org/); Hawai'i Institute of Geophysics and Planetology (HIGP) Thermal Alerts System, School of Ocean and Earth Science and Technology (SOEST), Univ. of Hawai'i, 2525 Correa Road, Honolulu, HI 96822, USA (URL: http://modis.higp.hawaii.edu/).
Rabaul (Papua New Guinea) — February 2007 Cite this Report
Rabaul
Papua New Guinea
4.2459°S, 152.1937°E; summit elev. 688 m
All times are local (unless otherwise noted)
Mild eruptive activity between December 2006 and March 2007
As previously reported, the Rabaul Volcano Observatory noted a large, sustained Vulcanian eruption at Rabaul on 7 October 2006. Since that initial event at the Tavurvur cone, activity has varied in intensity (BGVN 31:10). During 13 December 2006 through the end of March 2007, generally mild eruptive activity continued, often with loud roaring noises and in some cases with ash plumes rising 1.5 to 3.7 km above Tavurvur's summit.
During December 2006, there was only low level seismicity, including high-frequency earthquakes and mild eruptive activity. During 24-29 December, ash clouds rose 1-3.7 km above the summit before being blown variably to the NE and SW. On 25, 27, and 28 December, fine ash fell downwind, including in Rabaul Town, and occasional roaring noises were heard. Seismic activity continued at low levels. No high-frequency earthquakes were recorded. Low seismicity continued during most of January.
During 4-10 January 2007 plumes occasionally bearing ash rose 0.9-3.3 km above the cone and drifted E and NE. Vapor emissions accompanied by pale gray ash clouds occurred on 13, 16, and 24 January. The emissions rose 0.4- 2.5 km above Tavurvur's summit and blew E, NE, and N. During 24-25 January there were nine low-frequency earthquakes recorded. Ground deformation measurements showed no significant movement apart from a slight deflation of about 1 cm during the last few days of January. From 29 January onwards, seismicity increased to a moderate level. Three high-frequency earthquakes were recorded, one on 27 January, and two on 30 January, all originating NE of the caldera. Low-frequency earthquakes began 24 January. A total of 16 events were recorded during 24-28 January, and a further 50-60 small events 29-31 January.
Two small explosions occurred at 0448 and 0548 on 27 January and a large explosion occurred at 0130 on 31 January. The latter explosion showered the cone's flanks. The accompanying ash clouds rose a couple of hundred meters straight above the summit. Fine ashfall occurred at Rabaul Town and surrounding areas.
Mild eruptive activity continued during early February with associated seismicity at very low levels. The small low-frequency earthquakes had declined in number by about half. Ground deformation data indicated a noticeable deflation of the caldera. Mild eruptive activity continued intermittently during the latter half of February, associated with low seismicity. Ash fell on surrounding villages on 20 February. On 16, 19, and 21 February, low-frequency earthquakes and white vapor emissions containing very low ash content rose as high as 3 km above Tavurvur's summit. The emissions were not accompanied by high-frequency signals or significant ground deformation.
Moderate explosions occurred on 21, 26, and 27 February. A larger explosion, at 1150 on 28 February, showered the cone's flanks with lava fragments. Thick ash clouds rose 2 km above the summit and blew NE.
Between 3 and 4 March, multiple explosions occurred; the biggest on 3, 4, and 8 March. The explosion's shockwaves rattled houses in Rabaul Town and surrounding villages. Thick ash and lava fragments showered the flanks of the cone. Other emissions consisted of white gray ash clouds that drifted E and SE. On 4 and 6 March ash plumes rose as high as 2.7 km above the summit. A weak glow was visible only during forceful emissions.
During 6 to 21 March, ash plumes intermittently rose as high as 3.7 km. From 16 to 25 March, multiple explosions again produced shockwaves felt in Rabaul Town, and ash fell in surrounding villages. Incandescent material was seen rolling down the cone's flanks. During the period 27-30 March only low level vapor emissions rising to 400 m above the cone were visible. Seismic activity continued to remain at a very low level, with just three or four short (< 30 second) low-frequency events. There were no high-frequency events.
Geologic Background. The low-lying Rabaul caldera on the tip of the Gazelle Peninsula at the NE end of New Britain forms a broad sheltered harbor utilized by what was the island's largest city prior to a major eruption in 1994. The outer flanks of the asymmetrical shield volcano are formed by thick pyroclastic-flow deposits. The 8 x 14 km caldera is widely breached on the east, where its floor is flooded by Blanche Bay and was formed about 1,400 years ago. An earlier caldera-forming eruption about 7,100 years ago is thought to have originated from Tavui caldera, offshore to the north. Three small stratovolcanoes lie outside the N and NE caldera rims. Post-caldera eruptions built basaltic-to-dacitic pyroclastic cones on the caldera floor near the NE and W caldera walls. Several of these, including Vulcan cone, which was formed during a large eruption in 1878, have produced major explosive activity during historical time. A powerful explosive eruption in 1994 occurred simultaneously from Vulcan and Tavurvur volcanoes and forced the temporary abandonment of Rabaul city.
Information Contacts: Steve Saunders and Herman Patia, Rabaul Volcanological Observatory (RVO), Department of Mining, Private Mail Bag, Port Moresby Post Office, National Capitol District, Papua, New Guinea; Andrew Tupper, Darwin Volcanic Ash Advisory Centre (VAAC), Bureau of Meteorology, Darwin, Australia.
Ruapehu (New Zealand) — February 2007 Cite this Report
Ruapehu
New Zealand
39.28°S, 175.57°E; summit elev. 2797 m
All times are local (unless otherwise noted)
Minor October 2006 eruption and concern of impending lahar
A moderate volcanic earthquake struck Ruapehu at 2230 on 4 October 2006. The M 2.8 event falsely triggered the lahar warning system. A visit to the crater lake on 7 October revealed evidence that a small hydrothermal eruption had occurred. Wave action reached up to 4-5 m above the lake surface around the basin, but was insufficient to overflow the tephra dam where it might have formed a lahar on the outer slopes. Since the last measurement (date not specified) the lake's temperature rose ~8°C, and the water level increased ~ 1 m. Both of these effects were expected. Seismic activity remained at typical background levels on 7 October 2006.
At about 1300 on 18 March 2007, Crater Lake partly emptied and its runoff traveled rapidly downstream as a powerful lahar. A subsequent issue will discuss that dramatic event and its impact.
Since the last report in February 2004 (BGVN 29:02), from May 2003 to October 2006, there were eight alerts issued by the Institute of Geological & Nuclear Sciences (IGNS, table 12), indicating appreciable changes in both the level of the lake and its temperature; these alerts can be compared with the temperature data (table 13).
Table 12. Institute of Geological & Nuclear Sciences (IGNS) alerts posted for Ruapehu volcano, May 2003 to October 2006. Compiled from IGNS reports.
| Alert Date |
Alert Comments |
| 26 May 2003 |
Steam plumes, volcanic tremor, Crater Lake temperatures increase |
| 15 Nov 2004 |
Volcanic tremor, Crater Lake temperature increase |
| 22 Aug 2005 |
Crater Lake temperature increase |
| 13 Sep 2005 |
Steam plumes |
| 18 Oct 2005 |
Crater Lake temperature decrease |
| 01 Nov 2005 |
Crater Lake temperature increase |
| 05 Oct 2006 |
Moderate (M 2.8) volcanic earthquake |
| 07 Oct 2006 |
Minor hydrothermal eruptions |
Table 13. Lake temperature data recorded at Ruapehu during 2003-2006. Some months have multiple sets of readings. Data were rounded to two significant figures. Compiled from IGNS reports.
| Date |
Crater Lake Temperature |
Notes |
| Jan 2003 |
42°C |
-- |
| 05 Mar 2003 |
30°C |
-- |
| 15 May 2003 |
42°C |
-- |
| 15 Mar 2004 |
35°C |
-- |
| Aug 2004 |
16°C |
-- |
| 13 Nov 2004 |
19°C |
-- |
| Feb 2005 |
39°C |
Peak for heating cycle. |
| 04 Aug 2005 |
23°C |
-- |
| 21 Aug 2005 |
32°C |
-- |
| 03 Sep 2005 |
39°C |
-- |
| 24 Sep 2005 |
34°C |
-- |
| 12 Oct 2005 |
30°C |
-- |
| 24 and 27 Oct 2005 |
35-36°C |
-- |
| Nov 2005-Sep 2006 |
15°C |
Unstated date between 27 October 2005 and 5 October 2006. |
| 05 Oct 2006 |
23°C |
After earthquake. |
Volcanic tremor was recorded during July 2005 and continued at varying levels. Although tremor is not unusual at Ruapehu, this was the strongest recorded since November 2004. Prominent steam plumes rose above Ruapehu on the morning of 13 September 2005. The crater lake temperature had recently risen from 23°C in August 2005 (table 13) to 39°C in early September 2005. By 12 October 2005 it had fallen to 30°C, indicating the end of the heating cycle. Thereafter, another cycle of lake heating took place in middle to late October 2005. During the period when the lake was at its hottest, steam plumes appeared on several days, but no eruptive activity was observed. Seismic activity continued at about normal levels except for a slight increase in the occurrence of volcanic earthquakes over the previous two weeks.
Lahar hazard. The last report on Ruapehu (BGVN 29:02) reviewed the government of New Zealand's efforts to lessen potential damage and loss of life from the possible collapse of the ash dam surrounding the lake that sits directly within the crater. An illustrative model of the most likely potential lahar was presented in the previous Bulletin (BGVN 29:02). Figure 27 provides more details on the regional geography.
According to IGNS and related government websites, the most likely lahar's path starts from a 7-m-thick tephra dam sitting above bedrock along the low point in Ruapehu's crater rim. This path descends along the Whangaehu valley, a drainage that initially travels radially down the cone to the E. Where the Whangaehu reaches beyond ~ 10 km from the rim (figure 27), the channel curves sharply S and then SW, ultimately crossing Ruapehu's S side. In contrast, just upstream of the above-mentioned bend, the intersecting Tongariro river flows N. At that connection between the two drainages (a divide), engineers added a 300-m-long embankment (a levee or bund), to keep substantial material from entering the Tongariro drainage. Engineers also added one or more chutes to direct some of the Whangaehu river S and away from the critical junction. Protecting the Tongariro river from sudden influx of water and debris protects infrastructure along and downstream of that river. For example, the Tongariro river enters Lake Taupo, a 30 x 40 km caldera lake. Lake Taupo drains to the N along the Waikato river and dams along that river generate hydroelectric power.
According to the Institute of Geological & Nuclear Sciences (IGNS), about 60 lahars have swept down the mountain's southern side in the past 150 years. Lahars are not limited to the Whangaehu valley as eruptive and mass wasting processes can result in sudden influx of water and debris in other drainages as well. Lahar episodes since 1945 appear on figure 28.
Figure 29 contains plots of the crater lake's surface elevation during the past several years. The plot is part of a poster available on the Department of Conservation website. The poster also notes the approximate volume of the crater lake, 107 m3. The tephra dam allows lake water to seep through it, considerably complicating estimates of the late-stage-filling rates, and any predicted date of overflow or related failure. Derek Cheng wrote an 8 January 2007 New Zealand Herald news piece stating that the lake then stood ~2.7 m below the dam's top. According to Chang's news story, the tephra dam allowed lake water to seep through it at a rate of ~10 L per second.
Crater Lake observations. Ruapehu's Crater Lake had warmed following periods of volcanic tremor, with heating cycles getting to temperatures ranging from about 15 to 40°C (eg., 39°C during February 2004 and ~36°C during late October 2006; table 13). The IGNS website notes that Ruapehu's heating cycles typically occur every 9-12 months and normally last 1-3 months.
An innovative approach to covering the current lahar hazard status can be found at the Department of Conservation website. As of early February 2007 the reports were "updated every 1-2 weeks depending on weather conditions and [field] site visits."
Reference. Keys, H.J.R., (date unknown), Lahars from Mount Ruapehu—mitigation and management; NZ Dept. of Conservation website (a poster conveyed as a PDF file; creation/publication date unknown) (URL: http://www.doc.govt.nz/templates/summary.aspx?id=42442).
Geologic Background. Ruapehu, one of New Zealand's most active volcanoes, is a complex stratovolcano constructed during at least four cone-building episodes dating back to about 200,000 years ago. The dominantly andesitic 110 km3 volcanic massif is elongated in a NNE-SSW direction and surrounded by another 100 km3 ring plain of volcaniclastic debris, including the NW-flank Murimoto debris-avalanche deposit. A series of subplinian eruptions took place between about 22,600 and 10,000 years ago, but pyroclastic flows have been infrequent. The broad summait area and flank contain at least six vents active during the Holocene. Frequent mild-to-moderate explosive eruptions have been recorded from the Te Wai a-Moe (Crater Lake) vent, and tephra characteristics suggest that the crater lake may have formed as recently as 3,000 years ago. Lahars resulting from phreatic eruptions at the summit crater lake are a hazard to a ski area on the upper flanks and lower river valleys.
Information Contacts: Institute of Geological & Nuclear Sciences (IGNS), Private Bag 2000, Wairakei, New Zealand (URL: http://www.gns.cri.nz/, https://www.geonet.org.nz/); New Zealand Department of Conservation, Private Bag, Turangi, New Zealand (URL: http://www.doc.govt.nz/).
Ulawun (Papua New Guinea) — February 2007 Cite this Report
Ulawun
Papua New Guinea
5.05°S, 151.33°E; summit elev. 2334 m
All times are local (unless otherwise noted)
Frequent ash plumes
A previous report (BGVN 31:02) described small earthquakes on 1-2 March 2006, accompanied by "gray-blue emissions." Subsequent ongoing eruptions continued at Ulawun through 18 January 2007, generating almost daily aviation reports describing plumes blowing W to NW and of generally modest height (table 3). The tallest plume of the reporting interval rose to 4.6 km altitude.
Table 3. A summary of key events at Ulawun observed during the reporting interval 22 March 2006-18 January 2007. Reported plumes did not attain an altitude of over 4 km except on 12 November, when they reached an altitude of 4.6 km. Information based primarily on satellite data and pilot reports from the Darwin VAAC and in a few cases, the US Air Force Weather Agency (AFWA).
| Date |
Comments |
| 22-28 Mar 2006 |
Ash visible at an altitude of ~3 km (pilot report). |
| 09 Apr 2006 |
Small low-level plume extending W. |
| 14 May 2006 |
An ash plume of unknown height. |
| 25 May 2006 |
Thin steam-and-ash plume. |
| 31 May 2006 |
A thin steam-and-ash plume reached an altitude of below 3 km. |
| 15 Aug 2006 |
Ash-and-steam plume to an altitude of ~3.7 km. |
| 25 Aug 2006 |
Steam-and-ash plumes reached altitudes of 3.7 km and drifted NW. |
| 27 Aug 2006 |
Steam-and-ash plumes reached altitudes of 3.7 km and drifted W. |
| 28 Aug 2006 |
Steam-and-ash plumes reached altitudes of 3.7 km and drifted SW. |
| 30 Aug 2006 |
Ash-and-steam plumes drifting SW. |
| 02 Sep 2006 |
Ash-and-steam plumes drifting S visible on satellite imagery. |
| 12 Nov 2006 |
Diffuse plume to altitude of 4.6 km drifted NW. |
| 16-18 Nov 2006 |
Diffuse plumes drifting N and NW. Ash-and-steam plume visible on 18 November. |
| 22 Nov 2006 |
Diffuse plume. |
| 28 Nov 2006 |
Ash-and-steam plume. |
| 29 Nov 2006 |
Diffuse ash-and-steam plume. The altitudes and drift directions were not reported. |
| 04 Dec 2006 |
Ash plume. Altitudes and drift directions not reported. |
| 09 Dec 2006 |
Diffuse plumes reaching altitudes of 4 km. |
| 11 Dec 2006 |
Plumes reached unreported altitudes. |
| 21 Dec 2006 |
Ash plumes drifting ENE. |
| 22 Dec 2006 |
Ash plumes drifting NW. |
| 25 Dec 2006 |
Ash plumes drifting SW. |
| 04 Jan 2007 |
Diffuse steam-and-ash plumes drifting SW. |
| 18 Jan 2007 |
Pilot report noted an ash plume to an altitude of 2.4 km drifting SW. |
No MODIS thermal alerts were identified between March 2006 and January 2007 on the Hawai'i Institute of Geophysics and Planetology MODIS Thermal Alert System web site. The lack of thermal anomalies may indicate explosive eruptions, and not lava emissions. However, such activity has occurred at the summit in the past. One such episode, in November 1985, generated Strombolian activity and pyroclastic flows (figure 11).
Four Volcanic Ash Advisory Centers (VAAC): Tokyo, Washington, Darwin, and Wellington, have an interest in this volcano, because plumes may enter their areas of responsibility (figure 12). The VAACs came into existence to keep aviators informed of volcanic hazards. A key player in their development was the International Civil Aviation Organization (ICAO), a United Nations Related Agency that is the recognized international authority regarding a large number of aviation isses. Nine VAAC were created, in Anchorage (Alaska), Buenos Aires (Argentina), Darwin (Australia), London (England), Montreal (Canada), Tokyo (Japan), Toulouse (France), Washington (United States), and Wellington (New Zealand). These centers are tasked with monitoring volcanic ash plumes and providing Volcanic Ash Advisories (VAA) whenever those plumes enter their assigned airspace. The VAACs are often integrated with aviation weather centers; many have developed back-up sites. For example, the Washington VAAC is backed-up by the US Air Force Weather Agency; the Tokyo by Japan Meteorological Association Headquarters, and Darwin by the National Meteorological & Oceanographic Centre.
Geologic Background. The symmetrical basaltic-to-andesitic Ulawun stratovolcano is the highest volcano of the Bismarck arc, and one of Papua New Guinea's most frequently active. The volcano, also known as the Father, rises above the N coast of the island of New Britain across a low saddle NE of Bamus volcano, the South Son. The upper 1,000 m is unvegetated. A prominent E-W escarpment on the south may be the result of large-scale slumping. Satellitic cones occupy the NW and E flanks. A steep-walled valley cuts the NW side, and a flank lava-flow complex lies to the south of this valley. Historical eruptions date back to the beginning of the 18th century. Twentieth-century eruptions were mildly explosive until 1967, but after 1970 several larger eruptions produced lava flows and basaltic pyroclastic flows, greatly modifying the summit crater.
Information Contacts: Rabaul Volcano Observatory (RVO), P. O. Box 386, Rabaul, Papua New Guinea; Darwin Volcanic Ash Advisory Centre (VAAC), Bureau of Meteorology, Northern Territory Regional Office, PO Box 40050, Casuarina, NT 0811, Australia (URL: http://www.bom.gov.au/info/vaac/); US Air Force Weather Agency (AFWA), Satellite Applications Branch, Offutt AFB, NE 68113-4039, USA; Hawai'i Institute of Geophysics and Planetology (HIGP) Thermal Alerts System, School of Ocean and Earth Science and Technology (SOEST), Univ. of Hawai'i, 2525 Correa Road, Honolulu, HI 96822, USA (URL: http://modis.higp.hawaii.edu/); James Mori, Disaster Prevention Research Institute, Kyoto University, Uji, Kyoto 611-0011, Japan (URL: http://eqh.dpri.kyoto-u.ac.jp/~mori/).