Recently Published Bulletin Reports
Erebus (Antarctica) Lava lake remains active; most thermal alerts recorded since 2019
Rincon de la Vieja (Costa Rica) Frequent phreatic explosions during July-December 2023
Bezymianny (Russia) Explosion on 18 October 2023 sends ash plume 8 km high; lava flows and incandescent avalanches
Kilauea (United States) Low-level lava effusions in the lava lake at Halema’uma’u during July-December 2022
Nyamulagira (DR Congo) Lava flows and thermal activity during May-October 2023
Bagana (Papua New Guinea) Explosions, ash plumes, ashfall, and lava flows during April-September 2023
Mayon (Philippines) Lava flows, pyroclastic flows, ash emissions, and seismicity during April-September 2023
Nishinoshima (Japan) Eruption plumes and gas-and-steam plumes during May-August 2023
Krakatau (Indonesia) White gas-and-steam plumes and occasional ash plumes during May-August 2023
Villarrica (Chile) Strombolian activity, gas-and-ash emissions, and crater incandescence during April-September 2023
Merapi (Indonesia) Frequent incandescent avalanches during April-September 2023
Ebeko (Russia) Moderate explosive activity with ash plumes continued during June-November 2023
Erebus (Antarctica) — January 2024  Cite this Report
Erebus
Antarctica
77.53°S, 167.17°E; summit elev. 3794 m
All times are local (unless otherwise noted)
Lava lake remains active; most thermal alerts recorded since 2019
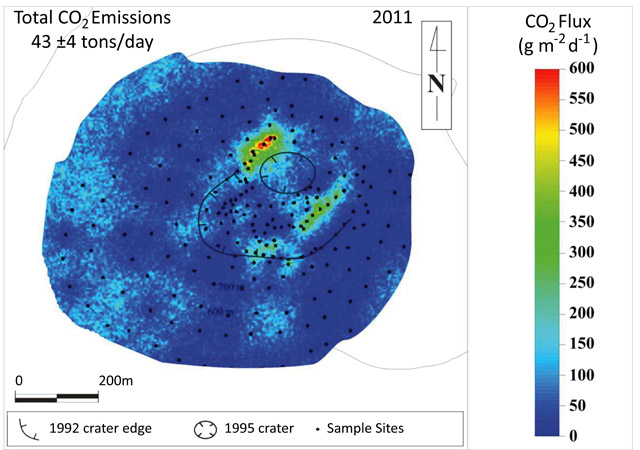
The lava lake in the summit crater of Erebus has been active since at least 1972. Located in Antarctica overlooking the McMurdo Station on Ross Island, it is the southernmost active volcano on the planet. Because of the remote location, activity is primarily monitored by satellites. This report covers activity during 2023.
The number of thermal alerts recorded by the Hawai'i Institute of Geophysics and Planetology’s MODVOLC Thermal Alerts System increased considerably in 2023 compared to the years 2020-2022 (table 9). In contrast to previous years, the MODIS instruments aboard the Aqua and Terra satellites captured data from Erebus every month during 2023. Consistent with previous years, the lowest number of anomalous pixels were recorded in January, November, and December.
Table 9. Number of monthly MODIS-MODVOLC thermal alert pixels recorded at Erebus during 2017-2023. See BGVN 42:06 for data from 2000 through 2016. The table was compiled using data provided by the HIGP – MODVOLC Thermal Alerts System.
| Year |
Jan |
Feb |
Mar |
Apr |
May |
Jun |
Jul |
Aug |
Sep |
Oct |
Nov |
Dec |
SUM |
| 2017 |
0 |
21 |
9 |
0 |
0 |
1 |
11 |
61 |
76 |
52 |
0 |
3 |
234 |
| 2018 |
0 |
21 |
58 |
182 |
55 |
17 |
137 |
172 |
103 |
29 |
0 |
0 |
774 |
| 2019 |
2 |
21 |
162 |
151 |
55 |
56 |
75 |
53 |
29 |
19 |
1 |
0 |
624 |
| 2020 |
0 |
2 |
16 |
18 |
4 |
4 |
1 |
3 |
18 |
3 |
1 |
6 |
76 |
| 2021 |
0 |
9 |
1 |
0 |
2 |
56 |
46 |
47 |
35 |
52 |
5 |
3 |
256 |
| 2022 |
1 |
13 |
55 |
22 |
15 |
32 |
39 |
19 |
31 |
11 |
0 |
0 |
238 |
| 2023 |
2 |
33 |
49 |
82 |
41 |
32 |
70 |
64 |
42 |
17 |
5 |
11 |
448 |
Sentinel-2 infrared images showed one or two prominent heat sources within the summit crater, accompanied by adjacent smaller sources, similar to recent years (see BGVN 46:01, 47:02, and 48:01). A unique image was obtained on 25 November 2023 by the OLI-2 (Operational Land Imager-2) on Landsat 9, showing the upper part of the volcano surrounded by clouds (figure 32).
Geologic Background. Mount Erebus, the world's southernmost historically active volcano, overlooks the McMurdo research station on Ross Island. It is the largest of three major volcanoes forming the crudely triangular Ross Island. The summit of the dominantly phonolitic volcano has been modified by one or two generations of caldera formation. A summit plateau at about 3,200 m elevation marks the rim of the youngest caldera, which formed during the late-Pleistocene and within which the modern cone was constructed. An elliptical 500 x 600 m wide, 110-m-deep crater truncates the summit and contains an active lava lake within a 250-m-wide, 100-m-deep inner crater; other lava lakes are sometimes present. The glacier-covered volcano was erupting when first sighted by Captain James Ross in 1841. Continuous lava-lake activity with minor explosions, punctuated by occasional larger Strombolian explosions that eject bombs onto the crater rim, has been documented since 1972, but has probably been occurring for much of the volcano's recent history.
Information Contacts: Hawai'i Institute of Geophysics and Planetology (HIGP) - MODVOLC Thermal Alerts System, School of Ocean and Earth Science and Technology (SOEST), Univ. of Hawai'i, 2525 Correa Road, Honolulu, HI 96822, USA (URL: http://modis.higp.hawaii.edu/); Copernicus Browser, Copernicus Data Space Ecosystem, European Space Agency (URL: https://dataspace.copernicus.eu/browser/); NASA Earth Observatory, EOS Project Science Office, NASA Goddard Space Flight Center, Goddard, Maryland, USA (URL: https://earthobservatory.nasa.gov/images/152134/erebus-breaks-through).
Rincon de la Vieja (Costa Rica) — January 2024 Cite this Report
Rincon de la Vieja
Costa Rica
10.83°N, 85.324°W; summit elev. 1916 m
All times are local (unless otherwise noted)
Frequent phreatic explosions during July-December 2023
Rincón de la Vieja is a volcanic complex in Costa Rica with a hot convecting acid lake that exhibits frequent weak phreatic explosions, gas-and-steam emissions, and occasional elevated sulfur dioxide levels (BGVN 45:10, 46:03, 46:11). The current eruption period began June 2021. This report covers activity during July-December 2023 and is based on weekly bulletins and occasional daily reports from the Observatorio Vulcanologico Sismologica de Costa Rica-Universidad Nacional (OVSICORI-UNA).
Numerous weak phreatic explosions continued during July-December 2023, along with gas-and-steam emissions and plumes that rose as high as 3 km above the crater rim. Many weekly OVSICORI-UNA bulletins included the previous week's number of explosions and emissions (table 9). For many explosions, the time of explosion was given (table 10). Frequent seismic activity (long-period earthquakes, volcano-tectonic earthquakes, and tremor) accompanied the phreatic activity.
Table 9. Number of reported weekly phreatic explosions and gas-and-steam emissions at Rincón de la Vieja, July-December 2023. Counts are reported for the week before the Weekly Bulletin date; not all reports included these data. Courtesy of OVSICORI-UNA.
| OVSICORI Weekly Bulletin |
Number of explosions |
Number of emissions |
| 28 Jul 2023 |
6 |
14 |
| 4 Aug 2023 |
10 |
12 |
| 1 Sep 2023 |
13 |
11 |
| 22 Sep 2023 |
12 |
13 |
| 29 Sep 2023 |
6 |
11 |
| 6 Oct 2023 |
12 |
5 |
| 13 Oct 2023 |
7 |
9 |
| 20 Oct 2023 |
1 |
15 |
| 27 Oct 2023 |
3 |
23 |
| 3 Nov 2023 |
3 |
10 |
| 17 Nov 2023 |
0 |
Some |
| 24 Nov 2023 |
0 |
14 |
| 8 Dec 2023 |
4 |
16 |
| 22 Dec 2023 |
8 |
18 |
Table 10. Summary of activity at Rincón de la Vieja during July-December 2023. Weak phreatic explosions and gas emissions are noted where the time of explosion was indicated in the weekly or daily bulletins. Height of plumes or emissions are distance above the crater rim. Courtesy of OVSICORI-UNA.
| Date |
Time |
Description of Activity |
| 1 Jul 2023 |
0156 |
Explosion. |
| 2 Jul 2023 |
0305 |
Explosion. |
| 4 Jul 2023 |
0229, 0635 |
Event at 0635 produced a gas-and-steam plume that rose 700 m and drifted W; seen by residents in Liberia (21 km SW). |
| 9 Jul 2023 |
1843 |
Explosion. |
| 21 Jul 2023 |
0705 |
Explosion. |
| 26 Jul 2023 |
1807 |
Explosion. |
| 28 Jul 2023 |
0802 |
Explosion generated a gas-and-steam plume that rose 500 m. |
| 30 Jul 2023 |
1250 |
Explosion. |
| 31 Jul 2023 |
2136 |
Explosion. |
| 11 Aug 2023 |
0828 |
Explosion. |
| 18 Aug 2023 |
1304 |
Explosion. |
| 21 Aug 2023 |
1224 |
Explosion generated gas-and-steam plumes rose 500-600 m. |
| 22 Aug 2023 |
0749 |
Explosion generated gas-and-steam plumes rose 500-600 m. |
| 24 Aug 2023 |
1900 |
Explosion. |
| 25 Aug 2023 |
0828 |
Event produced a steam-and-gas plume that rose 3 km and drifted NW. |
| 27-28 Aug 2023 |
0813 |
Four small events; the event at 0813 on 28 August lasted two minutes and generated a steam-and-gas plume that rose 2.5 km. |
| 1 Sep 2023 |
1526 |
Explosion generated plume that rose 2 km and ejected material onto the flanks. |
| 2-3 Sep 2023 |
- |
Small explosions detected in infrasound data. |
| 4 Sep 2023 |
1251 |
Gas-and-steam plume rose 1 km and drifted W. |
| 7 Nov 2023 |
1113 |
Explosion. |
| 8 Nov 2023 |
0722 |
Explosion. |
| 12 Nov 2023 |
0136 |
Small gas emissions. |
| 14 Nov 2023 |
0415 |
Small gas emissions. |
According to OVSICORI-UNA, during July-October the average weekly sulfur dioxide (SO2) flux ranged from 68 to 240 tonnes/day. However, in mid-November the flux increased to as high as 334 tonnes/day, the highest value measured in recent years. The high SO2 flux in mid-November was also detected by the TROPOMI instrument on the Sentinel-5P satellite (figure 43).
Geologic Background. Rincón de la Vieja, the largest volcano in NW Costa Rica, is a remote volcanic complex in the Guanacaste Range. The volcano consists of an elongated, arcuate NW-SE-trending ridge constructed within the 15-km-wide early Pleistocene Guachipelín caldera, whose rim is exposed on the south side. Sometimes known as the "Colossus of Guanacaste," it has an estimated volume of 130 km3 and contains at least nine major eruptive centers. Activity has migrated to the SE, where the youngest-looking craters are located. The twin cone of Santa María volcano, the highest peak of the complex, is located at the eastern end of a smaller, 5-km-wide caldera and has a 500-m-wide crater. A Plinian eruption producing the 0.25 km3 Río Blanca tephra about 3,500 years ago was the last major magmatic eruption. All subsequent eruptions, including numerous historical eruptions possibly dating back to the 16th century, have been from the prominent active crater containing a 500-m-wide acid lake located ENE of Von Seebach crater.
Information Contacts: Observatorio Vulcanológico Sismológica de Costa Rica-Universidad Nacional (OVSICORI-UNA), Apartado 86-3000, Heredia, Costa Rica (URL: http://www.ovsicori.una.ac.cr/); NASA Global Sulfur Dioxide Monitoring Page, Atmospheric Chemistry and Dynamics Laboratory, NASA Goddard Space Flight Center (NASA/GSFC), 8800 Greenbelt Road, Goddard MD 20771, USA (URL: https://so2.gsfc.nasa.gov/).
Bezymianny (Russia) — November 2023 Cite this Report
Bezymianny
Russia
55.972°N, 160.595°E; summit elev. 2882 m
All times are local (unless otherwise noted)
Explosion on 18 October 2023 sends ash plume 8 km high; lava flows and incandescent avalanches
Bezymianny, located on Russia’s Kamchatka Peninsula, has had eruptions since 1955 characterized by dome growth, explosions, pyroclastic flows, ash plumes, and ashfall. Activity during November 2022-April 2023 included gas-and-steam emissions, lava dome collapses generating avalanches, and persistent thermal activity. Similar eruptive activity continued from May through October 2023, described here based on information from weekly and daily reports of the Kamchatka Volcano Eruptions Response Team (KVERT), notices from Tokyo VAAC (Volcanic Ash Advisory Center), and from satellite data.
Overall activity decreased after the strong period of activity in late March through April 2023, which included ash explosions during 29 March and 7-8 April 2023 that sent plumes as high as 10-12 km altitude, along with dome growth and lava flows (BGVN 48:05). This reduced activity can be seen in the MIROVA thermal detection system graph (figure 56), which was consistent with data from the MODVOLC thermal detection system and with Sentinel-2 satellite images that showed persistent hotspots in the summit crater when conditions allowed observations. A renewed period of strong activity began in mid-October 2023.
Activity increased significantly on 17 October 2023 when large collapses began during 0700-0830 on the E flanks of the lava dome and continued to after 0930 the next day (figure 57). Ash plumes rose to an altitude of 4.5-5 km, extending 220 km NNE by 18 October. A large explosion at 1630 on 18 October produced an ash plume that rose to an altitude of 11 km (8 km above the summit) and drifted NNE and then NW, extending 900 km NW within two days at an altitude of 8 km. Minor ashfall was noted in Kozyrevsk (45 km WNW). At 0820 on 20 October an ash plume was identified in satellite images drifting 100 km ENE at altitudes of 4-4.5 km.
Lava flows and hot avalanches from the dome down the SE flank continued over the next few days, including 23 October when clear conditions allowed good observations (figures 58 and 59). A large thermal anomaly was observed over the volcano through 24 October, and in the summit crater on 30 October (figure 60). Strong fumarolic activity continued, with numerous avalanches and occasional incandescence. By the last week of October, volcanic activity had decreased to a level consistent with that earlier in the reporting period.
Aviation warnings were frequently updated during 17-20 October. KVERT issued a Volcano Observatory Notice for Aviation (VONA) on 17 October at 1419 and 1727 (0219 and 0527 UTC) raising the Aviation Color Code (ACC) from Yellow to Orange (second highest level). The next day, KVERT issued a VONA at 1705 (0505 UTC) raising the ACC to Red (highest level) but lowered it back to Orange at 2117 (0917 UTC). After another decrease to Yellow and back to Orange, the ACC was reduced to Yellow on 20 October at 1204 (0004 UTC). In addition, the Tokyo VAAC issued a series of Volcanic Ash Advisories beginning on 16 October and continuing through 30 October.
Geologic Background. The modern Bezymianny, much smaller than its massive neighbors Kamen and Kliuchevskoi on the Kamchatka Peninsula, was formed about 4,700 years ago over a late-Pleistocene lava-dome complex and an edifice built about 11,000-7,000 years ago. Three periods of intensified activity have occurred during the past 3,000 years. The latest period, which was preceded by a 1,000-year quiescence, began with the dramatic 1955-56 eruption. This eruption, similar to that of St. Helens in 1980, produced a large open crater that was formed by collapse of the summit and an associated lateral blast. Subsequent episodic but ongoing lava-dome growth, accompanied by intermittent explosive activity and pyroclastic flows, has largely filled the 1956 crater.
Information Contacts: Kamchatka Volcanic Eruptions Response Team (KVERT), Far Eastern Branch, Russian Academy of Sciences, 9 Piip Blvd., Petropavlovsk-Kamchatsky, 683006, Russia (URL: http://www.kscnet.ru/ivs/kvert/); Kamchatka Volcanological Station, Kamchatka Branch of Geophysical Survey, (KB GS RAS), Klyuchi, Kamchatka Krai, Russia (URL: http://volkstat.ru/); Tokyo Volcanic Ash Advisory Center (VAAC), 1-3-4 Otemachi, Chiyoda-ku, Tokyo 100-8122, Japan (URL: http://ds.data.jma.go.jp/svd/vaac/data/); Hawai'i Institute of Geophysics and Planetology (HIGP) - MODVOLC Thermal Alerts System, School of Ocean and Earth Science and Technology (SOEST), Univ. of Hawai'i, 2525 Correa Road, Honolulu, HI 96822, USA (URL: http://modis.higp.hawaii.edu/); MIROVA (Middle InfraRed Observation of Volcanic Activity), a collaborative project between the Universities of Turin and Florence (Italy) supported by the Centre for Volcanic Risk of the Italian Civil Protection Department (URL: http://www.mirovaweb.it/); Copernicus Browser, Copernicus Data Space Ecosystem, European Space Agency (URL: https://dataspace.copernicus.eu/browser/).chr
Kilauea (United States) — January 2023 Cite this Report
Kilauea
United States
19.421°N, 155.287°W; summit elev. 1222 m
All times are local (unless otherwise noted)
Low-level lava effusions in the lava lake at Halema’uma’u during July-December 2022
Kīlauea is the southeastern-most volcano in Hawaii and overlaps the E flank of the Mauna Loa volcano. Its East Rift Zone (ERZ) has been intermittently active for at least 2,000 years. An extended eruption period began in January 1983 and was characterized by open lava lakes and lava flows from the summit caldera and the East Rift Zone. During May 2018 magma migrated into the Lower East Rift Zone (LERZ) and opened 24 fissures along a 6-km-long NE-trending fracture zone that produced lava flows traveling in multiple directions. As lava emerged from the fissures, the lava lake at Halema'uma'u drained and explosions sent ash plumes to several kilometers altitude (BGVN 43:10).
The current eruption period started during September 2021 and has recently been characterized by lava effusions, spatter, and sulfur dioxide emissions in the active Halema’uma’u lava lake (BGVN 47:08). Lava effusions, some spatter, and sulfur dioxide emissions have continued during this reporting period of July through December 2022 using daily reports, volcanic activity notices, and abundant photo, map, and video data from the US Geological Survey's (USGS) Hawaiian Volcano Observatory (HVO).
Summary of activity during July-December 2022. Low-level effusions have continued at the western vent of the Halema’uma’u crater during July through early December 2022. Occasional weak ooze-outs (also called lava break outs) would occur along the margins of the crater floor. The overall level of the active lava lake throughout the reporting period gradually increased due to infilling, however it stagnated in mid-September (table 13). During September through November, activity began to decline, though lava effusions persisted at the western vent. By 9 December, the active part of the lava lake had completely crusted over, and incandescence was no longer visible.
Table 13. Summary of measurements taken during overflights at Kīlauea that show a gradual increase in the active lava lake level and the volume of lava effused since 29 September 2021. Lower activity was reported during September-October. Data collected during July-December 2022. Courtesy of HVO.
| Date: |
Level of the active lava lake (m): |
Cumulative volume of lava effused (million cubic meters): |
| 7 Jul 2022 |
130 |
95 |
| 19 Jul 2022 |
133 |
98 |
| 4 Aug 2022 |
136 |
102 |
| 16 Aug 2022 |
137 |
104 |
| 12 Sep 2022 |
143 |
111 |
| 5 Oct 2022 |
143 |
111 |
| 28 Oct 2022 |
143 |
111 |
Activity during July 2022. Lava effusions were reported from the western vent in the Halema’uma’u crater, along with occasional weak ooze-outs along the margins of the crater floor. The height of the lava lake was variable due to deflation-inflation tilt events; for example, the lake level dropped approximately 3-4 m during a summit deflation-inflation event reported on 1 July. Webcam images taken during the night of 6-12 July showed intermittent low-level spattering at the western vent that rose less than 10 m above the vent (figure 519). Measurements made during an overflight on 7 July indicated that the crater floor was infilled about 130 m and that 95 million cubic meters of lava had been effused since 29 September 2021. A single, relatively small lava ooze-out was active to the S of the lava lake. Around midnight on 8 July there were two brief periods of lava overflow onto the lake margins. On 9 July lava ooze-outs were reported near the SE and NE edges of the crater floor and during 10-11 July they occurred near the E, NE, and NW edges. On 16 July crater incandescence was reported, though the ooze-outs and spattering were not visible. On 18 July overnight webcam images showed incandescence in the western vent complex and two ooze-outs were reported around 0000 and 0200 on 19 July. By 0900 there were active ooze-outs along the SW edge of the crater floor. Measurements made from an overflight on 19 July indicated that the crater floor was infilled about 133 m and 98 million cubic meters of lava had erupted since 29 September 2021 (figure 520). On 20 July around 1600 active ooze-outs were visible along the N edge of the crater, which continued through the next day. Extensive ooze-outs occurred along the W margin during 24 July until 1900; on 26 July minor ooze-outs were noted along the N margin. Minor spattering was visible on 29 July along the E margin of the lake. The sulfur dioxide emission rates ranged 650-2,800 tons per day (t/d), the higher of which was measured on 8 July (figure 519).
Activity during August 2022. The eruption continued in the Halema’uma’u crater at the western vent. According to HVO the lava in the active lake remained at the level of the bounding levees. Occasional minor ooze-outs were observed along the margins of the crater floor. Strong nighttime crater incandescence was visible after midnight on 6 August over the western vent cone. During 6-7 August scattered small lava lobes were active along the crater floor and incandescence persisted above the western vent through 9 August. During 7-9 August HVO reported a single lava effusion source was active along the NW margin of the crater floor. Measurements from an overflight on 4 August indicated that the crater floor was infilled about 136 m total and that 102 million cubic meters of lava had been erupted since the start of the eruption. Lava breakouts were reported along the N, NE, E, S, and W margins of the crater during 10-16 August. Another overflight survey conducted on 16 August indicated that the crater floor infilled about 137 m and 104 million cubic meters of lava had been erupted since September 2021. Measured sulfur dioxide emissions rates ranged 1,150-2,450 t/d, the higher of which occurred on 8 August.
Activity during September 2022. During September, lava effusion continued from the western vent into the active lava lake and onto the crater floor. Intermittent minor ooze-outs were reported through the month. A small ooze-out was visible on the W crater floor margin at 0220 on 2 September, which showed decreasing surface activity throughout the day, but remained active through 3 September. On 3 September around 1900 a lava outbreak occurred along the NW margin of the crater floor but had stopped by the evening of 4 September. Field crews monitoring the summit lava lake on 9 September observed spattering on the NE margin of the lake that rose no higher than 10 m, before falling back onto the lava lake crust (figure 521). Overflight measurements on 12 September indicated that the crater floor was infilled a total of 143 m and 111 million cubic meters of lava had been erupted since September 2021. Extensive breakouts in the W and N part of the crater floor were reported at 1600 on 20 September and continued into 26 September. The active part of the lava lake dropped by 10 m while other parts of the crater floor dropped by several meters. Summit tiltmeters recorded a summit seismic swarm of more than 80 earthquakes during 1500-1800 on 21 September, which occurred about 1.5 km below Halema’uma’u; a majority of these were less than Mw 2. By 22 September the active part of the lava lake was infilled about 2 m. On 23 September the western vent areas exhibited several small spatter cones with incandescent openings, along with weak, sporadic spattering (figure 522). The sulfur dioxide emission rate ranged from 930 t/d to 2,000 t/d, the higher of which was measured on 6 September.
Activity during October 2022. Activity during October declined slightly compared to previous months, though lava effusions persisted from the western vent into the active lava lake and onto the crater floor during October (figure 523). Slight variations in the lava lake were noted throughout the month. HVO reported that around 0600 on 3 October the level of the lava lake has lowered slightly. Overflight measurements taken on 5 October indicated that the crater floor was infilled a total of about 143 m and that 111 million cubic meters of lava had been effused since September 2021. During 6-7 October the lake gradually rose 0.5 m. Sulfur dioxide measurements made on 22 October had an emission rate of 700 t/d. Another overflight taken on 28 October showed that there was little to no change in the elevation of the crater floor: the crater floor was infilled a total of 143 m and 111 million cubic meters of lava had erupted since the start of the eruption.
Activity during November 2022. Activity remained low during November, though HVO reported that lava from the western vent continued to effuse into the active lava lake and onto the crater floor throughout the month. The rate of sulfur dioxide emissions during November ranged from 300-600 t/d, the higher amount of which occurred on 9 November.
Activity during December 2022. Similar low activity was reported during December, with lava effusing from the western vent into the active lava lake and onto the crater floor. During 4-5 December the active part of the lava lake was slightly variable in elevation and fluctuated within 1 m. On 9 December HVO reported that lava was no longer erupting from the western vent in the Halema’uma’u crater and that sulfur dioxide emissions had returned to near pre-eruption background levels; during 10-11 December, the lava lake had completely crusted over, and no incandescence was visible (figure 524). Time lapse camera images covering the 4-10 December showed that the crater floor showed weak deflation and no inflation. Some passive events of crustal overturning were reported during 14-15 December, which brought fresh incandescent lava to the lake surface. The sulfur dioxide emission rate was approximately 200 t/d on 14 December. A smaller overturn event on 17 December and another that occurred around 0000 and into the morning of 20 December were also detected. A small seismic swarm was later detected on 30 December.
Geologic Background. Kilauea overlaps the E flank of the massive Mauna Loa shield volcano in the island of Hawaii. Eruptions are prominent in Polynesian legends; written documentation since 1820 records frequent summit and flank lava flow eruptions interspersed with periods of long-term lava lake activity at Halemaumau crater in the summit caldera until 1924. The 3 x 5 km caldera was formed in several stages about 1,500 years ago and during the 18th century; eruptions have also originated from the lengthy East and Southwest rift zones, which extend to the ocean in both directions. About 90% of the surface of the basaltic shield volcano is formed of lava flows less than about 1,100 years old; 70% of the surface is younger than 600 years. The long-term eruption from the East rift zone between 1983 and 2018 produced lava flows covering more than 100 km2, destroyed hundreds of houses, and added new coastline.
Information Contacts: Hawaiian Volcano Observatory (HVO), U.S. Geological Survey, PO Box 51, Hawai'i National Park, HI 96718, USA (URL: http://hvo.wr.usgs.gov/).
Nyamulagira (DR Congo) — November 2023 Cite this Report
Nyamulagira
DR Congo
1.408°S, 29.2°E; summit elev. 3058 m
All times are local (unless otherwise noted)
Lava flows and thermal activity during May-October 2023
Nyamulagira (also known as Nyamuragira) is a shield volcano in the Democratic Republic of Congo with the summit truncated by a small 2 x 2.3 km caldera with walls up to about 100 m high. Documented eruptions have occurred within the summit caldera, as well as from numerous flank fissures and cinder cones. The current eruption period began in April 2018 and has more recently been characterized by summit crater lava flows and thermal activity (BGVN 48:05). This report describes lava flows and variable thermal activity during May through October 2023, based on information from the Observatoire Volcanologique de Goma (OVG) and various satellite data.
Lava lake activity continued during May. The MIROVA (Middle InfraRed Observation of Volcanic Activity) system recorded moderate-to-strong thermal activity throughout the reporting period; activity was more intense during May and October and relatively weaker from June through September (figure 95). The MODVOLC thermal algorithm, detected a total of 209 thermal alerts. There were 143 hotspots detected during May, eight during June, nine during September, and 49 during October. This activity was also reflected in infrared satellite images, where a lava flow was visible in the NW part of the crater on 7 May and strong activity was seen in the center of the crater on 4 October (figure 96). Another infrared satellite image taken on 12 May showed still active lava flows along the NW margin of the crater. According to OVG lava effusions were active during 7-29 May and moved to the N and NW parts of the crater beginning on 9 May. Strong summit crater incandescence was visible from Goma (27 km S) during the nights of 17, 19, and 20 May (figure 97). On 17 May there was an increase in eruptive activity, which peaked at 0100 on 20 May. Notable sulfur dioxide plumes drifted NW and W during 19-20 May (figure 98). Drone footage acquired in partnership with the USGS (United States Geological Survey) on 20 May captured images of narrow lava flows that traveled about 100 m down the W flank (figure 99). Data from the Rumangabo seismic station indicated a decreasing trend in activity during 17-21 May. Although weather clouds prevented clear views of the summit, a strong thermal signature on the NW flank was visible in an infrared satellite image on 22 May, based on an infrared satellite image. On 28 May the lava flows on the upper W flank began to cool and solidify. By 29 May seismicity returned to levels similar to those recorded before the 17 May increase. Lava effusion continued but was confined to the summit crater; periodic crater incandescence was observed.
Low-level activity was noted during June through October. On 1 June OVG reported that seismicity remained at lower levels and that crater incandescence had been absent for three days, though infrared satellite imagery showed continued lava effusion in the summit crater. The lava flows on the flanks covered an estimated 0.6 km2. Satellite imagery continued to show thermal activity confined to the lava lake through October (figure 96), although no lava flows or significant sulfur dioxide emissions were reported.
Geologic Background. Africa's most active volcano, Nyamulagira (also known as Nyamuragira), is a massive high-potassium basaltic shield about 25 km N of Lake Kivu and 13 km NNW of the steep-sided Nyiragongo volcano. The summit is truncated by a small 2 x 2.3 km caldera that has walls up to about 100 m high. Documented eruptions have occurred within the summit caldera, as well as from the numerous flank fissures and cinder cones. A lava lake in the summit crater, active since at least 1921, drained in 1938, at the time of a major flank eruption. Recent lava flows extend down the flanks more than 30 km from the summit as far as Lake Kivu; extensive lava flows from this volcano have covered 1,500 km2 of the western branch of the East African Rift.
Information Contacts: Observatoire Volcanologique de Goma (OVG), Departement de Geophysique, Centre de Recherche en Sciences Naturelles, Lwiro, D.S. Bukavu, DR Congo; Hawai'i Institute of Geophysics and Planetology (HIGP) - MODVOLC Thermal Alerts System, School of Ocean and Earth Science and Technology (SOEST), Univ. of Hawai'i, 2525 Correa Road, Honolulu, HI 96822, USA (URL: http://modis.higp.hawaii.edu/); MIROVA (Middle InfraRed Observation of Volcanic Activity), a collaborative project between the Universities of Turin and Florence (Italy) supported by the Centre for Volcanic Risk of the Italian Civil Protection Department (URL: http://www.mirovaweb.it/); NASA Global Sulfur Dioxide Monitoring Page, Atmospheric Chemistry and Dynamics Laboratory, NASA Goddard Space Flight Center (NASA/GSFC), 8800 Greenbelt Road, Goddard, Maryland, USA (URL: https://so2.gsfc.nasa.gov/); Copernicus Browser, Copernicus Data Space Ecosystem, European Space Agency (URL: https://dataspace.copernicus.eu/browser/); Charles Balagizi, Goma Volcano Observatory, Departement de Geophysique, Centre de Recherche en Sciences Naturelles, Lwiro, D.S. Bukavu, DR Congo.
Bagana (Papua New Guinea) — October 2023 Cite this Report
Bagana
Papua New Guinea
6.137°S, 155.196°E; summit elev. 1855 m
All times are local (unless otherwise noted)
Explosions, ash plumes, ashfall, and lava flows during April-September 2023
The remote volcano of Bagana is located in central Bougainville Island, Papua New Guinea. Recorded eruptions date back to 1842 and activity has consisted of effusive activity that has built a small lava dome in the summit crater and occasional explosions that produced pyroclastic flows. The most recent eruption has been ongoing since February 2000 and has produced occasional explosions, ash plumes, and lava flows. More recently, activity has been characterized by ongoing effusive activity and ash emissions (BGVN 48:04). This report updates activity from April through September 2023 that has consisted of explosions, ash plumes, ashfall, and lava flows, using information from the Darwin Volcanic Ash Advisory Center (VAAC) and satellite data.
An explosive eruption was reported on 7 July that generated a large gas-and-ash plume to high altitudes and caused significant ashfall in local communities; the eruption plume had reached upper tropospheric (16-18 km altitude) altitudes by 2200, according to satellite images. Sulfur dioxide plumes were detected in satellite images on 8 July and indicated that the plume was likely a mixture of gas, ice, and ash. A report issued by the Autonomous Bougainville Government (ABG) (Torokina District, Education Section) on 10 July noted that significant ash began falling during 2000-2100 on 7 July and covered most areas in the Vuakovi, Gotana (9 km SW), Koromaketo, Laruma (25 km W) and Atsilima (27 km NW) villages. Pyroclastic flows also occurred, according to ground-based reports; small deposits confined to one drainage were inspected by RVO during an overflight on 17 July and were confirmed to be from the 7 July event. Ashfall continued until 10 July and covered vegetation, which destroyed bushes and gardens and contaminated rivers and streams.
RVO reported another eruption on 14 July. The Darwin VAAC stated that an explosive event started around 0830 on 15 July and produced an ash plume that rose to 16.5 km altitude by 1000 and drifted N, according to satellite images. The plume continued to drift N and remained visible through 1900, and by 2150 it had dissipated.
Ashfall likely from both the 7 and 15 July events impacted about 8,111 people in Torokina (20 km SW), including Tsito/Vuakovi, Gotana, Koromaketo, Kenaia, Longkogari, Kenbaki, Piva (13 km SW), and Atsinima, and in the Tsitovi district, according to ABG. Significant ashfall was also reported in Ruruvu (22 km N) in the Wakunai District of Central Bougainville, though the thickness of these deposits could not be confirmed. An evacuation was called for the villages in Wakunai, where heavy ashfall had contaminated water sources; the communities of Ruruvu, Togarau, Kakarapaia, Karauturi, Atao, and Kuritaturi were asked to evacuate to a disaster center at the Wakunai District Station, and communities in Torokina were asked to evacuate to the Piva District station. According to a news article, more than 7,000 people needed temporary accommodations, with about 1,000 people in evacuation shelters. Ashfall had deposited over a broad area, contaminating water supplies, affecting crops, and collapsing some roofs and houses in rural areas. Schools were temporarily shut down. Intermittent ash emissions continued through the end of July and drifted NNW, NW, and SW. Fine ashfall was reported on the coast of Torokina, and ash plumes also drifted toward Laruma and Atsilima.
A small explosive eruption occurred at 2130 on 28 July that ejected material from the crater vents, according to reports from Torokina, in addition to a lava flow that contained two lobes. A second explosion was detected at 2157. Incandescence from the lava flow was visible from Piva as it descended the W flank around 2000 on 29 July (figure 47). The Darwin VAAC reported that a strong thermal anomaly was visible in satellite images during 30-31 July and that ash emissions rose to 2.4 km altitude and drifted WSW on 30 July. A ground report from RVO described localized emissions at 0900 on 31 July.
The Darwin VAAC reported that ash plumes were identified in satellite imagery at 0800 and 1220 on 12 August and rose to 2.1 km and 3 km altitude and drifted NW and W, respectively. A news report stated that aid was sent to more than 6,300 people that were adversely affected by the eruption. Photos taken during 17-19 August showed ash emissions rising no higher than 1 km above the summit and drifting SE. A small explosion generated an ash plume during the morning of 19 August. Deposits from small pyroclastic flows were also captured in the photos. Satellite images captured lava flows and pyroclastic flow deposits. Two temporary seismic stations were installed near Bagana on 17 August at distances of 7 km WSW (Vakovi station) and 11 km SW (Kepox station). The Kepox station immediately started to record continuous, low-frequency background seismicity.
Satellite data. Little to no thermal activity was detected during April through mid-July 2023; only one anomaly was recorded during early April and one during early June, according to MIROVA (Middle InfraRed Observation of Volcanic Activity) data (figure 48). Thermal activity increased in both power and frequency during mid-July through September, although there were still some short gaps in detected activity. MODVOLC also detected increased thermal activity during August; thermal hotspots were detected a total of five times on 19, 20, and 27 August. Weak thermal anomalies were also captured in infrared satellite images on clear weather days throughout the reporting period on 7, 12, and 17 April, 27 May, 1, 6, 16, and 31 July, and 19 September (figure 48); a strong thermal anomaly was visible on 31 July. Distinct sulfur dioxide plumes that drifted generally NW were intermittently captured by the TROPOMI instrument on the Sentinel-5P satellite and sometimes exceeded two Dobson Units (DUs) (figure 49).
Geologic Background. Bagana volcano, in a remote portion of central Bougainville Island, is frequently active. This massive symmetrical cone was largely constructed by an accumulation of viscous andesitic lava flows. The entire edifice could have been constructed in about 300 years at its present rate of lava production. Eruptive activity is characterized by non-explosive effusion of viscous lava that maintains a small lava dome in the summit crater, although occasional explosive activity produces pyroclastic flows. Lava flows with tongue-shaped lobes up to 50 m thick and prominent levees descend the flanks on all sides.
Information Contacts: Rabaul Volcano Observatory (RVO), Geohazards Management Division, Department of Mineral Policy and Geohazards Management (DMPGM), PO Box 3386, Kokopo, East New Britain Province, Papua New Guinea; Darwin Volcanic Ash Advisory Centre (VAAC), Bureau of Meteorology, Northern Territory Regional Office, PO Box 40050, Casuarina, NT 0811, Australia (URL: http://www.bom.gov.au/info/vaac/); MIROVA (Middle InfraRed Observation of Volcanic Activity), a collaborative project between the Universities of Turin and Florence (Italy) supported by the Centre for Volcanic Risk of the Italian Civil Protection Department (URL: http://www.mirovaweb.it/); Hawai'i Institute of Geophysics and Planetology (HIGP) - MODVOLC Thermal Alerts System, School of Ocean and Earth Science and Technology (SOEST), Univ. of Hawai'i, 2525 Correa Road, Honolulu, HI 96822, USA (URL: http://modis.higp.hawaii.edu/); NASA Global Sulfur Dioxide Monitoring Page, Atmospheric Chemistry and Dynamics Laboratory, NASA Goddard Space Flight Center (NASA/GSFC), 8800 Greenbelt Road, Goddard, Maryland, USA (URL: https://so2.gsfc.nasa.gov/); Copernicus Browser, Copernicus Data Space Ecosystem, European Space Agency (URL: https://dataspace.copernicus.eu/browser/); Autonomous Bougainville Government, P.O Box 322, Buka, AROB, PNG (URL: https://abg.gov.pg/); Andrew Tupper (Twitter: @andrewcraigtupp); Simon Carn, Geological and Mining Engineering and Sciences, Michigan Technological University, 1400 Townsend Drive, Houghton, MI 49931, USA (URL: http://www.volcarno.com/, Twitter: @simoncarn); Radio NZ (URL: https://www.rnz.co.nz/news/pacific/494464/more-than-7-000-people-in-bougainville-need-temporary-accommodation-after-eruption); USAID, 1300 Pennsylvania Ave, NW, Washington DC 20004, USA (URL: https://www.usaid.gov/pacific-islands/press-releases/aug-08-2023-united-states-provides-immediate-emergency-assistance-support-communities-affected-mount-bagana-volcanic-eruptions).
Mayon (Philippines) — October 2023 Cite this Report
Mayon
Philippines
13.257°N, 123.685°E; summit elev. 2462 m
All times are local (unless otherwise noted)
Lava flows, pyroclastic flows, ash emissions, and seismicity during April-September 2023
Mayon is located in the Philippines and has steep upper slopes capped by a small summit crater. Historical eruptions date back to 1616 CE that have been characterized by Strombolian eruptions, lava flows, pyroclastic flows, and mudflows. Eruptions mostly originated from a central conduit. Pyroclastic flows and mudflows have commonly descended many of the approximately 40 drainages that surround the volcano. The most recent eruption occurred during June through October 2022 and consisted of lava dome growth and gas-and-steam emissions (BGVN 47:12). A new eruption was reported during late April 2023 and has included lava flows, pyroclastic density currents, ash emissions, and seismicity. This report covers activity during April through September 2023 based on daily bulletins from the Philippine Institute of Volcanology and Seismology (PHIVOLCS).
During April through September 2023, PHIVOLCS reported near-daily rockfall events, frequent volcanic earthquakes, and sulfur dioxide measurements. Gas-and-steam emissions rose 100-900 m above the crater and drifted in different directions. Nighttime crater incandescence was often visible during clear weather and was accompanied by incandescent avalanches of material. Activity notably increased during June when lava flows were reported on the S, SE, and E flanks (figure 52). The MIROVA graph (Middle InfraRed Observation of Volcanic Activity) showed strong thermal activity coincident with these lava flows, which remained active through September (figure 53). According to the MODVOLC thermal algorithm, a total of 110 thermal alerts were detected during the reporting period: 17 during June, 40 during July, 27 during August, and 26 during September. During early June, pyroclastic density currents (PDCs) started to occur more frequently.
Low activity was reported during much of April and May; gas-and-steam emissions rose 100-900 m above the crater and generally drifted in different directions. A total of 52 rockfall events and 18 volcanic earthquakes were detected during April and 147 rockfall events and 13 volcanic events during May. Sulfur dioxide flux measurements ranged between 400-576 tons per day (t/d) during April, the latter of which was measured on 29 April and between 162-343 t/d during May, the latter of which was measured on 13 May.
Activity during June increased, characterized by lava flows, pyroclastic density currents (PDCs), crater incandescence and incandescent rockfall events, gas-and-steam emissions, and continued seismicity. Weather clouds often prevented clear views of the summit, but during clear days, moderate gas-and-steam emissions rose 100-2,500 m above the crater and drifted in multiple directions. A total of 6,237 rockfall events and 288 volcanic earthquakes were detected. The rockfall events often deposited material on the S and SE flanks within 700-1,500 m of the summit crater and ash from the events drifted SW, S, SE, NE, and E. Sulfur dioxide emissions ranged between 149-1,205 t/d, the latter of which was measured on 10 June. Short-term observations from EDM and electronic tiltmeter monitoring indicated that the upper slopes were inflating since February 2023. Longer-term ground deformation parameters based on EDM, precise leveling, continuous GPS, and electronic tilt monitoring indicated that the volcano remained inflated, especially on the NW and SE flanks. At 1000 on 5 June the Volcano Alert Level (VAL) was raised to 2 (on a 0-5 scale). PHIVOLCS noted that although low-level volcanic earthquakes, ground deformation, and volcanic gas emissions indicated unrest, the steep increase in rockfall frequency may indicate increased dome activity.
A total of 151 dome-collapse PDCs occurred during 8-9 and 11-30 June, traveled 500-2,000 m, and deposited material on the S flank within 2 km of the summit crater. During 8-9 June the VAL was raised to 3. At approximately 1947 on 11 June lava flow activity was reported; two lobes traveled within 500 m from the crater and deposited material on the S (Mi-isi), SE (Bonga), and E (Basud) flanks. Weak seismicity accompanied the lava flow and slight inflation on the upper flanks. This lava flow remained active through 30 June, moving down the S and SE flank as far as 2.5 km and 1.8 km, respectively and depositing material up to 3.3 km from the crater. During 15-16 June traces of ashfall from the PDCs were reported in Sitio Buga, Nabonton, City of Ligao and Purok, and San Francisco, Municipality of Guinobatan. During 28-29 June there were two PDCs generated by the collapse of the lava flow front, which generated a light-brown ash plume 1 km high. Satellite monitors detected significant concentrations of sulfur dioxide beginning on 29 June. On 30 June PDCs primarily affected the Basud Gully on the E flank, the largest of which occurred at 1301 and lasted eight minutes, based on the seismic record. Four PDCs generated between 1800 and 2000 that lasted approximately four minutes each traveled 3-4 km on the E flank and generated an ash plume that rose 1 km above the crater and drifted N and NW. Ashfall was recorded in Tabaco City.
Similar strong activity continued during July; slow lava effusion remained active on the S and SE flanks and traveled as far as 2.8 km and 2.8 km, respectively and material was deposited as far as 4 km from the crater. There was a total of 6,983 rockfall events and 189 PDCs that affected the S, SE, and E flanks. The volcano network detected a total of 2,124 volcanic earthquakes. Continuous gas-and-steam emissions rose 200-2,000 m above the crater and drifted in multiple directions. Sulfur dioxide emissions averaged 792-4,113 t/d, the latter of which was measured on 28 July. During 2-4 July three PDCs were generated from the collapse of the lava flow and resulting light brown plumes rose 200-300 m above the crater. Continuous tremor pulses were reported beginning at 1547 on 3 July through 7 July at 1200, at 2300 on 8 July and going through 0300 on 10 July, and at 2300 on 16 July, as recorded by the seismic network. During 6-9 July there were 10 lava flow-collapse-related PDCs that generated light brown plumes 300-500 m above the crater. During 10-11 July light ashfall was reported in some areas of Mabinit, Legazpi City, Budiao and Salvacion, Daraga, and Camalig, Albay. By 18 July the lava flow advanced 600 m on the E flank as well.
During 1733 on 18 July and 0434 on 19 July PHIVOLCS reported 30 “ashing” events, which are degassing events accompanied by audible thunder-like sounds and entrained ash at the crater, which produced short, dark plumes that drifted SW. These events each lasted 20-40 seconds, and plume heights ranged from 150-300 m above the crater, as recorded by seismic, infrasound, visual, and thermal monitors. Three more ashing events occurred during 19-20 July. Short-term observations from electronic tilt and GPS monitoring indicate deflation on the E lower flanks in early July and inflation on the NW middle flanks during the third week of July. Longer-term ground deformation parameters from EDM, precise leveling, continuous GPS, and electronic tilt monitoring indicated that the volcano was still generally inflated relative to baseline levels. A short-lived lava pulse lasted 28 seconds at 1956 on 21 July, which was accompanied by seismic and infrasound signals. By 22 July, the only lava flow that remained active was on the SE flank, and continued to extend 3.4 km, while those on the S and E flanks weakened markedly. One ashing event was detected during 30-31 July, whereas there were 57 detected during 31 July-1 August; according to PHIVOLCS beginning at approximately 1800 on 31 July eruptive activity was dominated by phases of intermittent ashing, as well as increased in the apparent rates of lava effusion from the summit crater. The ashing phases consisted of discrete events recorded as low-frequency volcanic earthquakes (LFVQ) typically 30 seconds in duration, based on seismic and infrasound signals. Gray ash plume rose 100 m above the crater and generally drifted NE. Shortly after these ashing events began, new lava began to effuse rapidly from the crater, feeding the established flowed on the SE, E, and E flanks and generating frequent rockfall events.
Intensified unrest persisted during August. There was a total of 4,141 rockfall events, 2,881 volcanic earthquakes, which included volcanic tremor events, 32 ashing events, and 101 PDCs detected throughout the month. On clear weather days, gas-and-steam emissions rose 300-1,500 m above the crater and drifted in different directions (figure 54). Sulfur dioxide emissions averaged 735-4,756 t/d, the higher value of which was measured on 16 August. During 1-2 August the rate of lava effusion decreased, but continued to feed the flows on the SE, S, and E flanks, maintaining their advances to 3.4 km, 2.8 km, and 1.1 km from the crater, respectively (figure 55). Rockfall and PDCs generated by collapses at the lava flow margins and from the summit dome deposited material within 4 km of the crater. During 3-4 August there were 10 tremor events detected that lasted 1-4 minutes. Short-lived lava pulse lasted 35 seconds and was accompanied by seismic and infrasound signals at 0442 on 6 August. Seven collapses were recorded at the front of the lava flow during 12-14 August.
During September, similar activity of slow lava effusion, PDCs, gas-and-steam emissions, and seismicity continued. There was a total of 4,452 rockfall events, 329 volcanic earthquakes, which included volcanic tremor events, two ashing events, and 85 PDCs recorded throughout the month. On clear weather days, gas-and-steam emissions rose 100-1,500 m above the crater and drifted in multiple directions. Sulfur dioxide emissions averaged 609-2,252 t/d, the higher average of which was measured on 6 September. Slow lava effusion continued advancing on the SE, S, and E flanks, maintaining lengths of 3.4 km, 2.8 km, and 1.1 km, respectively. Rockfall and PDC events generated by collapses along the lava flow margins and at the summit dome deposited material within 4 km of the crater.
Geologic Background. Symmetrical Mayon, which rises above the Albay Gulf NW of Legazpi City, is the most active volcano of the Philippines. The steep upper slopes are capped by a small summit crater. Recorded eruptions since 1616 CE range from Strombolian to basaltic Plinian, with cyclical activity beginning with basaltic eruptions, followed by longer periods of andesitic lava flows. Eruptions occur predominately from the central conduit and have also produced lava flows that travel far down the flanks. Pyroclastic density currents and mudflows have commonly swept down many of the approximately 40 ravines that radiate from the summit and have often damaged populated lowland areas. A violent eruption in 1814 killed more than 1,200 people and devastated several towns.
Information Contacts: Philippine Institute of Volcanology and Seismology (PHIVOLCS), Department of Science and Technology, University of the Philippines Campus, Diliman, Quezon City, Philippines (URL: http://www.phivolcs.dost.gov.ph/); MIROVA (Middle InfraRed Observation of Volcanic Activity), a collaborative project between the Universities of Turin and Florence (Italy) supported by the Centre for Volcanic Risk of the Italian Civil Protection Department (URL: http://www.mirovaweb.it/); Hawai'i Institute of Geophysics and Planetology (HIGP) - MODVOLC Thermal Alerts System, School of Ocean and Earth Science and Technology (SOEST), Univ. of Hawai'i, 2525 Correa Road, Honolulu, HI 96822, USA (URL: http://modis.higp.hawaii.edu/); Copernicus Browser, Copernicus Data Space Ecosystem, European Space Agency (URL: https://dataspace.copernicus.eu/browser/); William Rogers, Legazpi City, Albay Province, Philippines.
Nishinoshima (Japan) — October 2023 Cite this Report
Nishinoshima
Japan
27.247°N, 140.874°E; summit elev. 100 m
All times are local (unless otherwise noted)
Eruption plumes and gas-and-steam plumes during May-August 2023
Nishinoshima, located about 1,000 km S of Tokyo, is a small island in the Ogasawara Arc in Japan. The island is the summit of a massive submarine volcano that has prominent submarine peaks to the S, W, and NE. Eruptions date back to 1973 and the current eruption period began in October 2022. Recent activity has consisted of small ash plumes and fumarolic activity (BGVN 48:07). This report covers activity during May through August 2023, using information from monthly reports of the Japan Meteorological Agency (JMA) monthly reports and satellite data.
Activity during May through June was relatively low. The Japan Coast Guard (JCG) did overflights on 14 and 22 June and reported white gas-and-steam emissions rising 600 m and 1,200 m from the central crater of the pyroclastic cone, respectively (figure 125). In addition, multiple white gas-and-steam emissions rose from the inner rim of the W side of the crater and from the SE flank of the pyroclastic cone. Discolored brown-to-green water was observed around almost the entire perimeter of the island; on 22 June light green discolored water was observed off the S coast of the island.
Observations from the Himawari meteorological satellite confirmed an eruption on 9 and 10 July. An eruption plume rose 1.6 km above the crater and drifted N around 1300 on 9 July. Satellite images acquired at 1420 and 2020 on 9 July and at 0220 on 10 July showed continuing emissions that rose 1.3-1.6 km above the crater and drifted NE and N. The Tokyo VAAC reported that an ash plume seen by a pilot and identified in a satellite image at 0630 on 21 July rose to 3 km altitude and drifted S.
Aerial observations conducted by JCG on 8 August showed a white-and-gray plume rising from the central crater of the pyroclastic cone, and multiple white gas-and-steam emissions were rising from the inner edge of the western crater and along the NW-SE flanks of the island (figure 126). Brown-to-green discolored water was also noted around the perimeter of the island.
Intermittent low-to-moderate power thermal anomalies were recorded in the MIROVA graph (Middle InfraRed Observation of Volcanic Activity), showing an increase in both frequency and power beginning in July (figure 127). This increase in activity coincides with eruptive activity on 9 and 10 July, characterized by eruption plumes. According to the MODVOLC thermal alert algorithm, one thermal hotspot was recorded on 20 July. Weak thermal anomalies were also detected in infrared satellite imagery, accompanied by strong gas-and-steam plumes (figure 128).
Geologic Background. The small island of Nishinoshima was enlarged when several new islands coalesced during an eruption in 1973-74. Multiple eruptions that began in 2013 completely covered the previous exposed surface and continued to enlarge the island. The island is the summit of a massive submarine volcano that has prominent peaks to the S, W, and NE. The summit of the southern cone rises to within 214 m of the ocean surface 9 km SSE.
Information Contacts: Japan Meteorological Agency (JMA), 1-3-4 Otemachi, Chiyoda-ku, Tokyo 100-8122, Japan (URL: http://www.jma.go.jp/jma/indexe.html); Tokyo Volcanic Ash Advisory Center (VAAC), 1-3-4 Otemachi, Chiyoda-ku, Tokyo 100-8122, Japan (URL: http://ds.data.jma.go.jp/svd/vaac/data/); MIROVA (Middle InfraRed Observation of Volcanic Activity), a collaborative project between the Universities of Turin and Florence (Italy) supported by the Centre for Volcanic Risk of the Italian Civil Protection Department (URL: http://www.mirovaweb.it/); Copernicus Browser, Copernicus Data Space Ecosystem, European Space Agency (URL: https://dataspace.copernicus.eu/browser/).
Krakatau (Indonesia) — October 2023 Cite this Report
Krakatau
Indonesia
6.1009°S, 105.4233°E; summit elev. 285 m
All times are local (unless otherwise noted)
White gas-and-steam plumes and occasional ash plumes during May-August 2023
Krakatau is located in the Sunda Strait between Java and Sumatra, Indonesia. Caldera collapse during the catastrophic 1883 eruption destroyed Danan and Perbuwatan cones and left only a remnant of Rakata. The post-collapse cone of Anak Krakatau (Child of Krakatau) was constructed within the 1883 caldera at a point between the former Danan and Perbuwatan cones; it has been the site of frequent eruptions since 1927. The current eruption period began in May 2021 and has recently consisted of Strombolian eruptions and ash plumes (BGVN 48:07). This report describes lower levels of activity consisting of ash and white gas-and-steam plumes during May through August 2023, based on information provided by the Indonesian Center for Volcanology and Geological Hazard Mitigation, referred to as Pusat Vulkanologi dan Mitigasi Bencana Geologi (PVMBG), MAGMA Indonesia, and satellite data.
Activity was relatively low during May and June. Daily white gas-and-steam emissions rose 25-200 m above the crater and drifted in different directions. Five ash plumes were detected at 0519 on 10 May, 1241 on 11 May, 0920 on 12 May, 2320 on 12 May, and at 0710 on 13 May, and rose 1-2.5 km above the crater and drifted SW. A webcam image taken on 12 May showed ejection of incandescent material above the vent. A total of nine ash plumes were detected during 6-11 June: at 1434 and 00220 on 6 and 7 June the ash plumes rose 500 m above the crater and drifted NW, at 1537 on 8 June the ash plume rose 1 km above the crater and drifted SW, at 0746 and at 0846 on 9 June the ash plumes rose 800 m and 3 km above the crater and drifted SW, respectively, at 0423, 1431, and 1750 on 10 June the ash plumes rose 2 km, 1.5 km, and 3.5 km above the crater and drifted NW, respectively, and at 0030 on 11 June an ash plume rose 2 km above the crater and drifted NW. Webcam images taken on 10 and 11 June at 0455 and 0102, respectively, showed incandescent material ejected above the vent. On 19 June an ash plume at 0822 rose 1.5 km above the crater and drifted SE.
Similar low activity of white gas-and-steam emissions and few ash plumes were reported during July and August. Daily white gas-and-steam emissions rose 25-300 m above the crater and drifted in multiple directions. Three ash plumes were reported at 0843, 0851, and 0852 on 20 July that rose 500-2,000 m above the crater and drifted NW.
The MIROVA (Middle InfraRed Observation of Volcanic Activity) graph of MODIS thermal anomaly data showed intermittent low-to-moderate power thermal anomalies during May through August 2023 (figure 140). Although activity was often obscured by weather clouds, a thermal anomaly was visible in an infrared satellite image of the crater on 12 May, accompanied by an eruption plume that drifted SW (figure 141).
Geologic Background. The renowned Krakatau (frequently mis-named as Krakatoa) volcano lies in the Sunda Strait between Java and Sumatra. Collapse of an older edifice, perhaps in 416 or 535 CE, formed a 7-km-wide caldera. Remnants of that volcano are preserved in Verlaten and Lang Islands; subsequently the Rakata, Danan, and Perbuwatan cones were formed, coalescing to create the pre-1883 Krakatau Island. Caldera collapse during the catastrophic 1883 eruption destroyed Danan and Perbuwatan, and left only a remnant of Rakata. This eruption caused more than 36,000 fatalities, most as a result of tsunamis that swept the adjacent coastlines of Sumatra and Java. Pyroclastic surges traveled 40 km across the Sunda Strait and reached the Sumatra coast. After a quiescence of less than a half century, the post-collapse cone of Anak Krakatau (Child of Krakatau) was constructed within the 1883 caldera at a point between the former Danan and Perbuwatan cones. Anak Krakatau has been the site of frequent eruptions since 1927.
Information Contacts: Pusat Vulkanologi dan Mitigasi Bencana Geologi (PVMBG, also known as Indonesian Center for Volcanology and Geological Hazard Mitigation, CVGHM), Jalan Diponegoro 57, Bandung 40122, Indonesia (URL: http://www.vsi.esdm.go.id/); MAGMA Indonesia, Kementerian Energi dan Sumber Daya Mineral (URL: https://magma.esdm.go.id/v1); MIROVA (Middle InfraRed Observation of Volcanic Activity), a collaborative project between the Universities of Turin and Florence (Italy) supported by the Centre for Volcanic Risk of the Italian Civil Protection Department (URL: http://www.mirovaweb.it/); Copernicus Browser, Copernicus Data Space Ecosystem, European Space Agency (URL: https://dataspace.copernicus.eu/browser/).
Villarrica (Chile) — October 2023 Cite this Report
Villarrica
Chile
39.42°S, 71.93°W; summit elev. 2847 m
All times are local (unless otherwise noted)
Strombolian activity, gas-and-ash emissions, and crater incandescence during April-September 2023
Villarrica, in central Chile, consists of a 2-km-wide caldera that formed about 3,500 years ago and is located at the base of the presently active cone at the NW margin of a 6-km-wide caldera. Historical eruptions eruptions date back to 1558 and have been characterized by mild-to-moderate explosive activity with occasional lava effusions. The current eruption period began in December 2014 and has recently consisted of nighttime crater incandescence, ash emissions, and seismicity (BGVN 48:04). This report covers activity during April through September 2023 and describes occasional Strombolian activity, gas-and-ash emissions, and nighttime crater incandescence. Information for this report primarily comes from the Southern Andes Volcano Observatory (Observatorio Volcanológico de Los Andes del Sur, OVDAS), part of Chile's National Service of Geology and Mining (Servicio Nacional de Geología y Minería, SERNAGEOMIN) and satellite data.
Seismicity during April consisted of long period (LP) events and tremor (TRE); a total of 9,413 LP-type events and 759 TR-type events were detected throughout the month. Nighttime crater incandescence persisted and was visible in the degassing column. Sulfur dioxide data was obtained using Differential Absorption Optical Spectroscopy Equipment (DOAS) that showed an average value of 1,450 ± 198 tons per day (t/d) during 1-15 April and 1,129 ± 201 t/d during 16-30 April, with a maximum daily value of 2,784 t/d on 9 April. Gas-and-steam emissions of variable intensities rose above the active crater as high as 1.3 km above the crater on 13 April. Strombolian explosions were not observed and there was a slight decrease in the lava lake level.
There were 14,123 LP-type events and 727 TR-type events detected during May. According to sulfur dioxide measurements taken with DOAS equipment, the active crater emitted an average value of 1,826 ± 482 t/d during 1-15 May and 912 ± 41 t/d during 16-30 May, with a daily maximum value of 5,155 t/d on 13 May. Surveillance cameras showed continuous white gas-and-steam emissions that rose as high as 430 m above the crater on 27 May. Nighttime incandescence illuminated the gas column less than 300 m above the crater rim was and no pyroclastic emissions were reported. A landslide was identified on 13 May on the E flank of the volcano 50 m from the crater rim and extending 300 m away; SERNAGEOMIN noted that this event may have occurred on 12 May. During the morning of 27 and 28 May minor Strombolian explosions characterized by incandescent ejecta were recorded at the crater rim; the last reported Strombolian explosions had occurred at the end of March.
Seismic activity during June consisted of five volcano-tectonic (VT)-type events, 21,606 LP-type events, and 2,085 TR-type events. The average value of sulfur dioxide flux obtained by DOAS equipment was 1,420 ± 217 t/d during 1-15 June and 2,562 ± 804 t/d, with a maximum daily value of 4,810 t/d on 17 June. White gas-and-steam emissions rose less than 480 m above the crater; frequent nighttime crater incandescence was reflected in the degassing plume. On 12 June an emission rose 100 m above the crater and drifted NNW. On 15 June one or several emissions resulted in ashfall to the NE as far as 5.5 km from the crater, based on a Skysat satellite image. Several Strombolian explosions occurred within the crater; activity on 15 June was higher energy and ejected blocks 200-300 m on the NE slope. Surveillance cameras showed white gas-and-steam emissions rising 480 m above the crater on 16 June. On 19 and 24 June low-intensity Strombolian activity was observed, ejecting material as far as 200 m from the center of the crater to the E.
During July, seismicity included 29,319 LP-type events, 3,736 TR-type events, and two VT-type events. DOAS equipment recorded two days of sulfur dioxide emissions of 4,220 t/d and 1,009 t/d on 1 and 13 July, respectively. Constant nighttime incandescence was also recorded and was particularly noticeable when accompanied by eruptive columns on 12 and 16 July. Minor explosive events were detected in the crater. According to Skysat satellite images taken on 12, 13, and 16 July, ashfall deposits were identified 155 m S of the crater. According to POVI, incandescence was visible from two vents on the crater floor around 0336 on 12 July. Gas-and-ash emissions rose as high as 1.2 km above the crater on 13 July and drifted E and NW. A series of gas-and-steam pulses containing some ash deposited material on the upper E flank around 1551 on 13 July. During 16-31 July, average sulfur dioxide emissions of 1,679 ± 406 t/d were recorded, with a maximum daily value of 2,343 t/d on 28 July. Fine ash emissions were also reported on 16, 17, and 23 July.
Seismicity persisted during August, characterized by 27,011 LP-type events, 3,323 TR-type events, and three VT-type events. The average value of sulfur dioxide measurements taken during 1-15 August was 1,642 ± 270 t/d and 2,207 ± 4,549 t/d during 16-31 August, with a maximum daily value of 3,294 t/d on 27 August. Nighttime crater incandescence remained visible in degassing columns. White gas-and-steam emissions rose 480 m above the crater on 6 August. According to a Skysat satellite image from 6 August, ash accumulation was observed proximal to the crater and was mainly distributed toward the E slope. White gas-and-steam emissions rose 320 m above the crater on 26 August. Nighttime incandescence and Strombolian activity that generated ash emissions were reported on 27 August.
Seismicity during September was characterized by five VT-type events, 12,057 LP-type events, and 2,058 TR-type events. Nighttime incandescence persisted. On 2 September an ash emission rose 180 m above the crater and drifted SE at 1643 (figure 125) and a white gas-and-steam plume rose 320 m above the crater. According to the Buenos Aires VAAC, periods of continuous gas-and-ash emissions were visible in webcam images from 1830 on 2 September to 0110 on 3 September. Strombolian activity was observed on 2 September and during the early morning of 3 September, the latter event of which generated an ash emission that rose 60 m above the crater and drifted 100 m from the center of the crater to the NE and SW. Ashfall was reported to the SE and S as far as 750 m from the crater. The lava lake was active during 3-4 September and lava fountaining was visible for the first time since 26 March 2023, according to POVI. Fountains captured in webcam images at 2133 on 3 September and at 0054 on 4 September rose as high as 60 m above the crater rim and ejected material onto the upper W flank. Sulfur dioxide flux of 1,730 t/d and 1,281 t/d was measured on 3 and 4 September, respectively, according to data obtained by DOAS equipment.
Strong Strombolian activity and larger gas-and-ash plumes were reported during 18-20 September. On 18 September activity was also associated with energetic LP-type events and notable sulfur dioxide fluxes (as high as 4,277 t/d). On 19 September Strombolian activity and incandescence were observed. On 20 September at 0914 ash emissions rose 50 m above the crater and drifted SSE, accompanied by Strombolian activity that ejected material less than 100 m SSE, causing fall deposits on that respective flank. SERNAGEOMIN reported that a Planet Scope satellite image taken on 20 September showed the lava lake in the crater, measuring 32 m x 35 m and an area of 0.001 km2. Several ash emissions were recorded at 0841, 0910, 1251, 1306, 1312, 1315, and 1324 on 23 September and rose less than 150 m above the crater. The sulfur dioxide flux value was 698 t/d on 23 September and 1,097 t/d on 24 September. On 24 September the Volcanic Alert Level (VAL) was raised to Orange (the third level on a four-color scale). SENAPRED maintained the Alert Level at Yellow (the middle level on a three-color scale) for the communities of Villarrica, Pucón (16 km N), Curarrehue, and Panguipulli.
During 24-25 September there was an increase in seismic energy (observed at TR-events) and acoustic signals, characterized by 1 VT-type event, 213 LP-type events, and 124 TR-type events. Mainly white gas-and-steam emissions, in addition to occasional fine ash emissions were recorded. During the early morning of 25 September Strombolian explosions were reported and ejected material 250 m in all directions, though dominantly toward the NW. On 25 September the average value of sulfur dioxide flux was 760 t/d. Seismicity during 25-30 September consisted of five VT-type events, 1,937 LP-type events, and 456 TR-type events.
During 25-29 September moderate Strombolian activity was observed and ejected material as far as the crater rim. In addition, ash pulses lasting roughly 50 minutes were observed around 0700 and dispersed ENE. During 26-27 September a TR episode lasted 6.5 hours and was accompanied by discrete acoustic signals. Satellite images from 26 September showed a spatter cone on the crater floor with one vent that measured 10 x 14 m and a smaller vent about 35 m NE of the cone. SERNAGEOMIN reported an abundant number of bomb-sized blocks up to 150 m from the crater, as well as impact marks on the snow, which indicated explosive activity. A low-altitude ash emission was observed drifting NW around 1140 on 28 September, based on webcam images. Between 0620 and 0850 on 29 September an ash emission rose 60 m above the crater and drifted NW. During an overflight taken around 1000 on 29 September scientists observed molten material in the vent, a large accumulation of pyroclasts inside the crater, and energetic degassing, some of which contained a small amount of ash. Block-sized pyroclasts were deposited on the internal walls and near the crater, and a distal ash deposit was also visible. The average sulfur dioxide flux measured on 28 September was 344 t/d. Satellite images taken on 29 September ashfall was deposited roughly 3 km WNW from the crater and nighttime crater incandescence remained visible. The average sulfur dioxide flux value from 29 September was 199 t/d. On 30 September at 0740 a pulsating ash emission rose 1.1 km above the crater and drifted NNW (figure 126). Deposits on the S flank extended as far as 4.5 km from the crater rim, based on satellite images from 30 September.
Infrared MODIS satellite data processed by MIROVA (Middle InfraRed Observation of Volcanic Activity) showed intermittent thermal activity during April through September, with slightly stronger activity detected during late September (figure 127). Small clusters of thermal activity were detected during mid-June, early July, early August, and late September. According to the MODVOLC thermal alert system, a total of four thermal hotspots were detected on 7 July and 3 and 23 September. This activity was also intermittently captured in infrared satellite imagery on clear weather days (figure 128).
Geologic Background. The glacier-covered Villarrica stratovolcano, in the northern Lakes District of central Chile, is ~15 km south of the city of Pucon. A 2-km-wide caldera that formed about 3,500 years ago is located at the base of the presently active, dominantly basaltic to basaltic andesite cone at the NW margin of a 6-km-wide Pleistocene caldera. More than 30 scoria cones and fissure vents are present on the flanks. Plinian eruptions and pyroclastic flows that have extended up to 20 km from the volcano were produced during the Holocene. Lava flows up to 18 km long have issued from summit and flank vents. Eruptions documented since 1558 CE have consisted largely of mild-to-moderate explosive activity with occasional lava effusion. Glaciers cover 40 km2 of the volcano, and lahars have damaged towns on its flanks.
Information Contacts: Servicio Nacional de Geología y Minería (SERNAGEOMIN), Observatorio Volcanológico de Los Andes del Sur (OVDAS), Avda Sta María No. 0104, Santiago, Chile (URL: http://www.sernageomin.cl/); Proyecto Observación Villarrica Internet (POVI) (URL: http://www.povi.cl/); Sistema y Servicio Nacional de Prevención y Repuesta Ante Desastres (SENAPRED), Av. Beauchef 1671, Santiago, Chile (URL: https://web.senapred.cl/); Buenos Aires Volcanic Ash Advisory Center (VAAC), Servicio Meteorológico Nacional-Fuerza Aérea Argentina, 25 de mayo 658, Buenos Aires, Argentina (URL: http://www.smn.gov.ar/vaac/buenosaires/inicio.php); MIROVA (Middle InfraRed Observation of Volcanic Activity), a collaborative project between the Universities of Turin and Florence (Italy) supported by the Centre for Volcanic Risk of the Italian Civil Protection Department (URL: http://www.mirovaweb.it/); Hawai'i Institute of Geophysics and Planetology (HIGP) - MODVOLC Thermal Alerts System, School of Ocean and Earth Science and Technology (SOEST), Univ. of Hawai'i, 2525 Correa Road, Honolulu, HI 96822, USA (URL: http://modis.higp.hawaii.edu/); Copernicus Browser, Copernicus Data Space Ecosystem, European Space Agency (URL: https://dataspace.copernicus.eu/browser/).
Merapi (Indonesia) — October 2023 Cite this Report
Merapi
Indonesia
7.54°S, 110.446°E; summit elev. 2910 m
All times are local (unless otherwise noted)
Frequent incandescent avalanches during April-September 2023
Merapi, located just north of the major city of Yogyakarta in central Java, Indonesia, has had activity within the last 20 years characterized by pyroclastic flows and lahars accompanying growth and collapse of the steep-sided active summit lava dome. The current eruption period began in late December 2020 and has more recently consisted of ash plumes, intermittent incandescent avalanches of material, and pyroclastic flows (BGVN 48:04). This report covers activity during April through September 2023, based on information from Balai Penyelidikan dan Pengembangan Teknologi Kebencanaan Geologi (BPPTKG), the Center for Research and Development of Geological Disaster Technology, a branch of PVMBG which specifically monitors Merapi. Additional information comes from the Pusat Vulkanologi dan Mitigasi Bencana Geologi (PVMBG, also known as Indonesian Center for Volcanology and Geological Hazard Mitigation, CVGHM), MAGMA Indonesia, the Darwin Volcanic Ash Advisory Centre (VAAC), and various satellite data.
Activity during April through September 2023 primarily consisted of incandescent avalanches of material that mainly affected the SW and W flanks and traveled as far as 2.3 km from the summit (table 25) and white gas-and-steam emissions that rose 10-1,000 m above the crater.
Table 25. Monthly summary of avalanches and avalanche distances recorded at Merapi during April through September 2023. The number of reported avalanches does not include instances where possible avalanches were heard but could not be visually confirmed as a result of inclement weather. Data courtesy of BPPTKG (April-September 2023 daily reports).
| Month |
Average number of avalanches per day |
Distance avalanches traveled (m) |
| Apr 2023 |
19 |
1,200-2,000 |
| May 2023 |
22 |
500-2,000 |
| Jun 2023 |
18 |
1,200-2,000 |
| Jul 2023 |
30 |
300-2,000 |
| Aug 2023 |
25 |
400-2,300 |
| Sep 2023 |
23 |
600-2,000 |
BPPTKG reported that during April and May white gas-and-steam emissions rose 10-750 m above the crater, incandescent avalanches descended 500-2,000 m on the SW and W flanks (figure 135). Cloudy weather often prevented clear views of the summit, and sometimes avalanches could not be confirmed. According to a webcam image, a pyroclastic flow was visible on 17 April at 0531. During the week of 28 April and 4 May a pyroclastic flow was reported on the SW flank, traveling up to 2.5 km. According to a drone overflight taken on 17 May the SW lava dome volume was an estimated 2,372,800 cubic meters and the dome in the main crater was an estimated 2,337,300 cubic meters.
During June and July similar activity persisted with white gas-and-steam emissions rising 10-350 m above the crater and frequent incandescent avalanches that traveled 300-2,000 m down the SW, W, and S flanks (figure 136). Based on an analysis of aerial photos taken on 24 June the volume of the SW lava dome was approximately 2.5 million cubic meters. A pyroclastic flow was observed on 5 July that traveled 2.7 km on the SW flank. According to the Darwin VAAC multiple minor ash plumes were identified in satellite images on 19 July that rose to 3.7 km altitude and drifted S and SW. During 22, 25, and 26 July a total of 17 avalanches descended as far as 1.8 km on the S flank.
Frequent white gas-and-steam emissions continued during August and September, rising 10-450 m above the crater. Incandescent avalanches mainly affected the SW and W flanks and traveled 400-2,300 m from the vent (figure 137). An aerial survey conducted on 10 August was analyzed and reported that estimates of the SW dome volume was 2,764,300 cubic meters and the dome in the main crater was 2,369,800 cubic meters.
Frequent and moderate-power thermal activity continued throughout the reporting period, according to a MIROVA (Middle InfraRed Observation of Volcanic Activity) analysis of MODIS satellite data (figure 138). There was an increase in the number of detected anomalies during mid-May. The MODVOLC thermal algorithm recorded a total of 47 thermal hotspots: six during April, nine during May, eight during June, 15 during July, four during August, and five during September. Some of this activity was captured in infrared satellite imagery on clear weather days, sometimes accompanied by incandescent material on the SW flank (figure 139).
Geologic Background. Merapi, one of Indonesia's most active volcanoes, lies in one of the world's most densely populated areas and dominates the landscape immediately north of the major city of Yogyakarta. It is the youngest and southernmost of a volcanic chain extending NNW to Ungaran volcano. Growth of Old Merapi during the Pleistocene ended with major edifice collapse perhaps about 2,000 years ago, leaving a large arcuate scarp cutting the eroded older Batulawang volcano. Subsequent growth of the steep-sided Young Merapi edifice, its upper part unvegetated due to frequent activity, began SW of the earlier collapse scarp. Pyroclastic flows and lahars accompanying growth and collapse of the steep-sided active summit lava dome have devastated cultivated lands on the western-to-southern flanks and caused many fatalities.
Information Contacts: Balai Penyelidikan dan Pengembangan Teknologi Kebencanaan Geologi (BPPTKG), Center for Research and Development of Geological Disaster Technology (URL: http://merapi.bgl.esdm.go.id/, Twitter: @BPPTKG); MAGMA Indonesia, Kementerian Energi dan Sumber Daya Mineral (URL: https://magma.esdm.go.id/v1); Pusat Vulkanologi dan Mitigasi Bencana Geologi (PVMBG, also known as Indonesian Center for Volcanology and Geological Hazard Mitigation, CVGHM), Jalan Diponegoro 57, Bandung 40122, Indonesia (URL: http://www.vsi.esdm.go.id/); Darwin Volcanic Ash Advisory Centre (VAAC), Bureau of Meteorology, Northern Territory Regional Office, PO Box 40050, Casuarina, NT 0811, Australia (URL: http://www.bom.gov.au/info/vaac/); MIROVA (Middle InfraRed Observation of Volcanic Activity), a collaborative project between the Universities of Turin and Florence (Italy) supported by the Centre for Volcanic Risk of the Italian Civil Protection Department (URL: http://www.mirovaweb.it/); Hawai'i Institute of Geophysics and Planetology (HIGP) - MODVOLC Thermal Alerts System, School of Ocean and Earth Science and Technology (SOEST), Univ. of Hawai'i, 2525 Correa Road, Honolulu, HI 96822, USA (URL: http://modis.higp.hawaii.edu/); Copernicus Browser, Copernicus Data Space Ecosystem, European Space Agency (URL: https://dataspace.copernicus.eu/browser/); Øystein Lund Andersen (URL: https://www.oysteinlundandersen.com/, https://twitter.com/oysteinvolcano).
Ebeko
Russia
50.686°N, 156.014°E; summit elev. 1103 m
All times are local (unless otherwise noted)
Moderate explosive activity with ash plumes continued during June-November 2023
Ebeko, located on the N end of Paramushir Island in Russia’s Kuril Islands just S of the Kamchatka Peninsula, consists of three summit craters along a SSW-NNE line at the northern end of a complex of five volcanic cones. Observed eruptions date back to the late 18th century and have been characterized as small-to-moderate explosions from the summit crater, accompanied by intense fumarolic activity. The current eruptive period began in June 2022, consisting of frequent explosions, ash plumes, and thermal activity (BGVN 47:10, 48:06). This report covers similar activity during June-November 2023, based on information from the Kamchatka Volcanic Eruptions Response Team (KVERT) and satellite data.
Moderate explosive activity continued during June-November 2023 (figures 50 and 51). According to visual data from Severo-Kurilsk, explosions sent ash 2-3.5 km above the summit (3-4.5 km altitude) during most days during June through mid-September. Activity after mid-September was slightly weaker, with ash usually reaching less than 2 km above the summit. According to KVERT the volcano in October and November was, with a few exceptions, either quiet or obscured by clouds that prevented satellite observations. KVERT issued Volcano Observatory Notices for Aviation (VONA) on 8 and 12 June, 13 and 22 July, 3 and 21 August, and 31 October warning of potential aviation hazards from ash plumes drifting 3-15 km from the volcano. Based on satellite data, KVERT reported a persistent thermal anomaly whenever weather clouds permitted viewing.
Geologic Background. The flat-topped summit of the central cone of Ebeko volcano, one of the most active in the Kuril Islands, occupies the northern end of Paramushir Island. Three summit craters located along a SSW-NNE line form Ebeko volcano proper, at the northern end of a complex of five volcanic cones. Blocky lava flows extend west from Ebeko and SE from the neighboring Nezametnyi cone. The eastern part of the southern crater contains strong solfataras and a large boiling spring. The central crater is filled by a lake about 20 m deep whose shores are lined with steaming solfataras; the northern crater lies across a narrow, low barrier from the central crater and contains a small, cold crescentic lake. Historical activity, recorded since the late-18th century, has been restricted to small-to-moderate explosive eruptions from the summit craters. Intense fumarolic activity occurs in the summit craters, on the outer flanks of the cone, and in lateral explosion craters.
Information Contacts: Kamchatka Volcanic Eruptions Response Team (KVERT), Far Eastern Branch, Russian Academy of Sciences, 9 Piip Blvd., Petropavlovsk-Kamchatsky, 683006, Russia (URL: http://www.kscnet.ru/ivs/kvert/).
Search Bulletin Archive by Publication Date
Select a month and year from the drop-downs and click "Show Issue" to have that issue displayed in this tab.
The default month and year is the latest issue available.
Bulletin of the Global Volcanism Network - Volume 37, Number 01 (January 2012)
Managing Editor: Richard Wunderman
Chiginagak (United States)
Acidic crater-lake water escaped in 2005 perturbing regional hydrosphere
Cleveland (United States)
Amendments to BGVN reports 2001-2011
Fourpeaked (United States)
Syn- and post-eruptive seismicity and emissions; magma intrusion model
Lengai, Ol Doinyo (Tanzania)
Update on observations; new reports on 2007-2008 eruptions
Martin (United States)
Seismic swarm in January 2006
Negro, Cerro (Nicaragua)
Non-eruptive activity; fumarole and seismic monitoring; new crater morphology
Spurr (United States)
Summit ice cauldron, debris flows through 2006; fumarolic activity continues
Chiginagak (United States) — January 2012 Cite this Report
Chiginagak
United States
57.135°N, 156.99°W; summit elev. 2221 m
All times are local (unless otherwise noted)
Acidic crater-lake water escaped in 2005 perturbing regional hydrosphere
We previously reported fumarolic activity from November 1997 to August 1998, but issued no subsequent Bulletin reports for Chiginagak. This report covers the formation of a summit ice cauldron and crater lake and subsequent draining of the lake resulting in the acidification of Mother Goose Lake during 2000-2010. Records of Chiginagak's past activity are poor. It is not seismically monitored and, because of its remote location, much of the information is limited to observations of nearby residents. The primary source of information for this report has been Alaska Volcano Observatory (AVO) annual reports (McGimsey and others, 1999; McGimsey and others, 2004; Neal and others, 2004; and McGimsey and others, 2008).
Increased fumarolic activity occurred from November 1997-August 1998. AVO reports that the activity during that time was a result of formation of new fumaroles on the N flank of the volcano. In November of 1997 an increase in steam emission led to increased snowmelt (BGVN 22:11). The steam was accompanied by the smell of sulfur. Through January 1998 a robust steam plume was observed by AVO several times. In March 1998 vigorous fumarolic activity continued, characterized by gray clouds and a strong sulfur smell that was reported up to 49 km away. In August 1998 a plume of black ash and greenish-yellow gas rose from the volcano's fumaroles. In late July-early August 2000 Chiginagak again released a larger than normal plume.
Glacial Outburst Flooding. Between November 2004 and May 2005 non-explosive geothermal activity melted the snow and ice filling Chiginagak's summit crater, forming an ice cauldron ~400 m wide and ~105 m deep. The melt waters formed an acidic lake within the cauldron. The water from the lake melted a tunnel through the summit ice, draining the cauldron. The resulting lahar flowed down the SW flank of the volcano probably in May 2005, photographed August 20, 2005 (figure 1).
The water from the cauldron continued downstream into Mother Goose Lake, ~27 km downstream to the NW of Chiginagak (figure 2) and in August 2005 Mother Goose Lake became acidic, with pH dropping to 2.9. This killed the majority of aquatic life in the lake and damaged flora surrounding both the lake and the rivers (Indecision Creek and Volcano Creek which transport water from Chiginagak to Mother Goose Lake and King Salmon River that flows from the lake). Below a pH of 4.5, essentially no large fish are able to survive (figure 3). It is not just the acidity that kills aquatic fauna but also high levels of metals such as Al and Fe. At a pH of 5, Al3+ becomes insoluble and has a toxic effect on fauna. The acidic water was accompanied by sulfurous, clay-rich debris and acidic aerosols. The high acidity of the lake prevented the annual salmon run that typically ascends into Mother Goose Lake.
The pH at Mother Goose Lake has been monitored since 2005 and the pH has slowly returned to normal. By 2010 the lake water returned towards normal conditions; pH reached 5.2 and a variety of fish have returned to the lake. By August 2011 the pH had reached 6.9.
In 2005, Kassel (2009) studied the slurry pH deposited at Mother Goose Lake. Slurry pH is the standard method for estimating pH of soils; it is similar to pore water measurements. The details of the process used can be found in Kassel (2009, p.27-30). The slurry pH of Mother Goose Lake in 2005 was approximately the same as the pH of the lake at that time. The assumption can be made that slurry pH reflects lake pH at the time of deposition. Based on slurry pH seen in core samples, at least 7 similar events have occurred at Mother Goose Lake in the last ~3,800 years, including the 2005 event. Only one of these events was associated with tephra deposits, therefore the majority of the events were seemingly triggered by non-explosive geothermal activity, similar to the event in 2005.
According to McGimsey and others (2008), "The area is remote, and the active fumaroles frequently produce visible steam plumes, which have been mistaken for eruptive activity. Unverified reports of minor activity are attributed to 1852, 1929, and 1971. An event similar to the outburst flooding in 2005 may have occurred in the early 1970s according to third-person accounts from a cabin owner on Mother Goose Lake, who reported flooding from the volcano, discoloration of the lakeshore, vegetation damage, and interruption of the annual salmon run (Jon Kent, local lodge owner, oral commun., 2004)."
References. US Environmental Protection Agency, 2008, Effects of Acid Rain - Surface Waters and Aquatic Animals, Updated 1 December 2008, Accessed 15 Febuary 2012 (URL: epa.gov/acidrain/effects/surface_water.html).
Kassel, CM, 2009, Lacustrine Evidence from Mother Goose Lake of Holocene Geothermal Activity at Mount Chiginagak, Alaska Peninsula, Northern Arizona University, 276 p.
McGimsey, RG, and Wallace, KL, 1999, 1997 Volcanic Activity in Alaska and Kamchatka: Summary of Events and Response of the Alaska Volcano Observatory, Open-File Report 99-448, U.S. Department of the Interior, U.S. Geological Survey, 42 p.
McGimsey, RG, Neal, CA, and Girina, O, 2004, 1998 Volcanic Activity in Alaska and Kamchatka: Summary of Events and Response of the Alaska Volcano Observatory, Open-File Report 03-423, U.S. Department of the Interior, U.S. Geological Survey.
McGimsey, RG, Neal, CA, Dixon, JP and Ushakov, S, 2008, 2005 Volcanic Activity in Alaska, Kamchatka, and the Kurile Islands: Summary of Events and Response of the Alaska Volcano Observatory, Scientific Investigations Report 2007-5269, U.S. Department of the Interior, U.S. Geological Survey.
Neal, CA, McGimsey, RG, and Chubarova, O, 2004, 2000 Volcanic Activity in Alaska and Kamchatka: Summary of Events and Response of the Alaska Volcano Observatory, Open-File Report 2004-1034, U.S. Department of the Interior, U.S. Geological Survey.
Schaefer, JR, Scott, WE, Evans, WC, Wang, B and McGimsey, RG, 2011, Summit Crater Lake Observations, and the Location, Chemistry, and pH of Water Samples Near Mount Chiginagak Volcano, Alaska: 2004-2011, Report of Investigations 2011-6, State of Alaska Department of Natural Resources, Division of Geological & Geophysical Surveys.
Geologic Background. The symmetrical, calc-alkaline Chiginagak stratovolcano located about 15 km NW of Chiginagak Bay contains a small summit crater, which is breached to the south, and one or more summit lava domes. Satellitic lava domes occur high on the NW and SE flanks of the glacier-mantled volcano. An unglaciated lava flow and an overlying pyroclastic-flow deposit extending east from the summit are the most recent products of Chiginagak. They most likely originated from a lava dome at 1687 m on the SE flank, 1 km from the summit of the volcano, which has variably been estimated to be from 2075 to 2221 m high. Brief ash eruptions were reported in July 1971 and August 1998. Fumarolic activity occurs at 1600 m elevation on the NE flank of the volcano, and two areas of hot-spring travertine deposition are located at the NW base of the volcano near Volcano Creek.
Information Contacts: Alaska Volcano Observatory (AVO), a cooperative program of a) U.S. Geological Survey, 4200 University Drive, Anchorage, AK 99508-4667, USA (URL: http://www.avo.alaska.edu/), b) Geophysical Institute, University of Alaska, PO Box 757320, Fairbanks, AK 99775-7320, USA, and c) Alaska Division of Geological & Geophysical Surveys, 794 University Ave., Suite 200, Fairbanks, AK 99709, USA; State of Alaska Department of Natural Resources, Division of Geological & Geophysical Surveys, 3354 College Rd., Fairbanks, Alaska 99709-3707, USA.
Cleveland (United States) — January 2012 Cite this Report
Cleveland
United States
52.825°N, 169.944°W; summit elev. 1730 m
All times are local (unless otherwise noted)
Amendments to BGVN reports 2001-2011
Our last report on Cleveland volcano, August 2011 (BGVN 36:08), described lava dome growth in August-September 2011. This report first addresses late 2011 to early 2012 observations, and then presents some amendments to Bulletin reports over the last decade.
Late 2011-early 2012. According to the Alaska Volcano Observatory (AVO), by the first week of October 2011 satellite images showed the lava dome was within 10 m of the crater rim on the SW and ENE sides of the crater. On 23 October, a TerraSAR-X satellite radar image of Cleveland showed no discernable growth in the lava dome over the course of the past several weeks. Instead, the 23 October image showed deflation or collapse of the dome.
On 3 November 2011, citing lack of dome growth evident in satellite images, AVO lowered both the Aviation Color Code to YELLOW and the Alert Level to ADVISORY. Throughout November, weather permitting, AVO continued to observe thermal anomalies and steam plumes in satellite imagery, consistent with cooling of the emplaced hot dome. Observations in early December 2011 showed continued deflation and cooling of the lava dome, which was about 1x10⁶ m3 in volume.
On 29 December 2011, AVO observed in satellite imagery a detached, drifting ash cloud at an altitude of ~4.6 km and ~80 km ESE of Cleveland. Ground-coupled airwaves from an explosion were also detected at the distant Okmok seismic network, placing the time of explosion at 1312 (UTC) on 29 December 29.
Based on the presence of an ash cloud, on 29 December AVO raised the aviation color code to ORANGE and the alert level to WATCH. On 30 December, with no new explosive activity, AVO lowered the aviation color code to YELLOW and the alert level to ADVISORY. Subsequent satellite images showed that the 25 December (recognized in retrospective data analysis) and 29 December explosions had largely removed the dome.
On 30 January 2012, satellite data showed another small dome within the summit crater, which measured ~ 40 m in diameter by 30 January. On 31 January, AVO raised the aviation color code to ORANGE and the volcano alert level to WATCH. No observations of elevated surface temperatures or ash emissions from Cleveland were noted during 15-21 February. On 17 February, AVO reported that partly-cloudy satellite observations over the past week revealed that the current lava dome had grown to about 60 m in diameter and occupied a small portion of the approximately 200-m diameter summit crater. On 19 February an elevated surface temperature was detected in satellite images. As of this date, there is no real-time seismic monitoring network on Mount Cleveland.
Amendments to Bulletin. According to Diefenbach, Guffanti, and Ewert, (2009), "During the past 29 years, 43 volcanoes within the United States have produced 95 eruptions and 32 episodes of unrest. More than half of the 30 eruptive volcanoes have erupted two or more times. The majority (77 percent) of U.S. eruptions has occurred in Alaska. Akutan volcano in Alaska has produced the most eruptions (11) in the past 29 years, followed by Veniaminof (10), Cleveland (9), and Pavlof (8)."
Because of the relative importance of Cleveland in the Aleutian chain as a source of active volcanism along a busy commercial airline route, we revisited the AVO web site recently to compare information available with that which we used to prepare the Bulletin in the past. As a prelude to this section, table 4 lists Cleveland eruptions reported by the AVO during 2001-2012 and the issues of the Bulletin covering a particular event.
Table 4. Dates of significant eruptions as reported by the AVO web site for Cleveland from January 2001 through January 2012, and related BGVN reports covering the respective eruptions. These data were accessed 9 February 2012; as of that date, the latest eruption reported by AVO was the one of 19 July 2011. From the AVO web site.
| Item |
Eruption dates (start-stop; ? = questionable event) |
BGVN issue(s) |
| a |
02 Feb-15 Apr 2001 |
26:01, 26:04 |
| b |
27 Apr-27 Sep 2005 |
30:09 |
| c |
06 Feb-06 Feb 2006 |
31:01, 31:06 |
| d |
23 May-23 May 2006 |
31:06, 31:07 |
| e |
24 Aug-28 Oct 2006 |
31:09 |
| f |
Jun 2007-28 Oct 2008 |
33:02, 33:07 |
| g |
02 Jan-21 Jan 2009 |
33:11 |
| h |
26 Jun-26 Jun 2009 |
34:10 |
| i |
02 Oct-02 Oct 2009 |
34:10 |
| j |
30 May-02 Jun 2010 |
35:06 |
| k |
12 Sep-12 Sep 2010 (?) |
36:05 |
| l |
19 Jul 2011 ± 7 days |
36:08 |
We amend some of our previous Bulletin reports with the following excerpts from USGS reports of Cleveland eruptions since 2001, ending with the last Bulletin containing a report on Cleveland (BGVN 36:08). The dates for the eruptions are the start and stop dates from the USGS reports.
Item a, Table 4 - BGVN 26:01: On 19 February 2001, Cleveland volcano erupted explosively at ~1430 UTC and AVO established the eruption termination date as 15 April 2001. However, after the eruption, AVO received reports indicating that precursory emission activity had taken place. Most graphic was a photograph taken on 2 February 2001 by a pilot flying by the volcano showing a dark, lobate deposit on the snow-covered SW flank and robust steaming from the summit crater.
Item a, Table 4 - BGVN 26:04: According to AVO, in 2001, ash fall from the February 2001 eruption of Cleveland was observed only at Nikolski over a ~5 hr on 19 February 2001. A sample from Nikolski showed that the ash was composed of glass shards, crystals, and lithics. The glass was dacitic and had a magmatic morphology rather than phreatomagmatic.
Item b, Table 4 - BGVN 30:09: On 27 April 2005, the Federal Aviation Association (FAA) alerted AVO of a pilot report of eruptive activity (ash cloud 4.6-5.5 km altitude) in the vicinity of Cleveland (based on coordinates from the pilots). Although satellite images and nearby seismic stations showed no evidence of activity, a one-time Urgent Pilot Report and a one-time SIGMET were issued.
Item c, Table 4 - BGVN 31:01: AVO noted that by the end of 6 January 2006 there were no further reports or images of ash production at Cleveland.
Item f, Table 4 - BGVN 33:02: Satellite data from February 2007 revealed evidence of recent activity involving ejection of bombs and debris on the upper flanks and generation of water-rich flows that traveled halfway to the coast. No ash emissions or ash fall deposits were observed. This level of activity -accompanied by persistent thermal anomalies - occurred throughout the spring and early summer. On 4 March 2008, a pilot reported minor ash to 1.5 km above sea level in the vicinity of Cleveland, and a weak thermal anomaly was observed the following day.
Item g, Table 4 - BGVN 33:11: The volcano was relatively quiet until 28 October 2008, when an ash cloud rising to ~4.6 km and drifting E was spotted in satellite imagery. On 29 October, another cloud, 160 km long and drifting NE at an altitude of 3.0 km with little or no ash was observed. A strong thermal anomaly over the summit of the volcano was noted on 30 October 2008, but given the low-level nature of the recent activity, AVO did not elevate the Color Code or Alert Level.
Item k, Table 4 - BGVN 36:05: AVO continued to detect thermal anomalies on 14, 15, 25, and 26 September 2010, and 1 October. During the other days, clouds prevented satellite observation of Cleveland. Although the weather usually prevented observations of Cleveland, weak thermal anomalies were also detected on 14, 19, 25, and 29 October 2010. Clouds completely obscured observations for the week of 1-6 November 2010, but thermal anomalies were again detected on 7 November. The weather then remained cloudy until 16,17, 25, 28, and 30 November 2010, when thermal anomalies were again visible. Thermal anomalies were also recorded on 6, 13, 14, 23, and 27 December 2010, and weak thermal anomalies were visible on 1, 11, and 16 January 2011. A weak thermal anomaly was observed on 1 February 2011, and on 9 February a pilot overflew Cleveland and reported minor, repetitive steam emissions rising hundreds of meters above the summit. The snow on the flanks was pristine, with no indication of recent ash emissions. Steam emissions are common at Cleveland and do not indicate an increased level of unrest.
References. Cervelli, P. F., and Cameron, C. E., 2008, Causation or coincidence? The correlations in time and space of the 2008 eruptions of Cleveland, Kasatochi, and Okmok Volcanoes, Alaska, EOS, Transactions of the American Geophysical Union, Fall Meeting 2008, abstract ##A53B-0278.
Diefenbach, A.K., Guffanti, M., and Ewert, J.W., 2009, Chronology and References of Volcanic Eruptions and Selected Unrest in the United States, 1980-2008, U.S. Geological Survey Open-File Report 2009-1118, 85 p (http://pubs.usgs.gov/of/2009/1118/).
Geologic Background. The beautifully symmetrical Mount Cleveland stratovolcano is situated at the western end of the uninhabited Chuginadak Island. It lies SE across Carlisle Pass strait from Carlisle volcano and NE across Chuginadak Pass strait from Herbert volcano. Joined to the rest of Chuginadak Island by a low isthmus, Cleveland is the highest of the Islands of the Four Mountains group and is one of the most active of the Aleutian Islands. The native name, Chuginadak, refers to the Aleut goddess of fire, who was thought to reside on the volcano. Numerous large lava flows descend the steep-sided flanks. It is possible that some 18th-to-19th century eruptions attributed to Carlisle should be ascribed to Cleveland (Miller et al., 1998). In 1944 it produced the only known fatality from an Aleutian eruption. Recent eruptions have been characterized by short-lived explosive ash emissions, at times accompanied by lava fountaining and lava flows down the flanks.
Information Contacts: Alaska Volcano Observatory (AVO), a cooperative program of a) U.S. Geological Survey, 4200 University Drive, Anchorage, AK 99508-4667, USA (URL: http://www.avo.alaska.edu/), b) Geophysical Institute, University of Alaska, PO Box 757320, Fairbanks, AK 99775-7320, USA, and c) Alaska Division of Geological & Geophysical Surveys, 794 University Ave., Suite 200, Fairbanks, AK 99709, USA; USAToday (URL: http://www.usatoday.com).
Fourpeaked (United States) — January 2012 Cite this Report
Fourpeaked
United States
58.77°N, 153.672°W; summit elev. 2105 m
All times are local (unless otherwise noted)
Syn- and post-eruptive seismicity and emissions; magma intrusion model
Following the 17 September 2006 phreatic eruption of Fourpeaked volcano and subsequent non-juvenile ash emissions and debris flows (Cervelli and West, 2007; BGVN 31:09), low level seismicity (up to M 1.8) and emissions (S02 fluxes up to almost 3,000 tons/day) continued during late 2006 and the first half of 2007. Small explosions occurred during February-April 2007 amidst declining gas emissions. The Alaska Volcano Observatory (AVO) lowered the Aviation Color Code and Volcano Alert Level from Yellow/Advisory to Green/Normal on 6 June 2007 (on a scale from Green/Normal to Red/Warning).
Seismic monitoring network. Prior to the 2006-2007 eruption and unrest, Fourpeaked lacked a monitoring network (BGVN 31:09). A network of monitoring instruments was deployed in stages following the onset of unrest in 2006 (figure 8). The network consisted of 4 short-period seismometers (3 newly-deployed and 1 pre-existing), 2 co-located pressure sensors, and a web camera. As a result of the stepwise deployment of the instruments, the precision and number of earthquakes successfully located by AVO increased during the active period. Following the network's successful operation through the winter of 2006-2007, Fourpeaked was formally recognized as the 31st seismically monitored Alaskan volcano on 3 May 2007.
November 2006-June 2007 activity. AVO reported that low level seismicity and persistent steaming (reaching up to several hundred meters above the summit) continued through the end of 2006. McGimsey and others (2011) reported that an airborne gas survey on 6 November 2006 showed continued elevated S02 emissions (~1,000 tons/day). The measured S02 flux measured soon after the 17 September eruption (figure 9) was more than 2,000 tons/day (McGimsey and others, 2011). In January 2007, AVO reported an earthquake swarm (swarm IV, figure 9), but stated that it was not considered unusual. Until 8 February, activity was typical of the past few months.
Beginning on 8 February 2007, AVO reported small explosive events that were registered on seismic and acoustic instruments, and a possible large steam plume that was noticed in a partly cloudy satellite view. A swarm of 13 locatable earthquakes occurred on 18 February, the largest of which was an M 1.8 event at ~4 km deep; this was the largest seismic event of the 2006-2007 Fourpeaked activity (McGimsey and others, 2011). A gas overflight on 22 February recorded S02 flux values below those measured in November.
Occasional small eruptions continued through March 2007, while seismicity gradually decreased (McGimsey and others 2011). In the last week of March, AVO reported decreased steam emissions from the vents at the summit. Explosive activity and declining gas emissions continued throughout April, and on 18 May, an aerial gas measurement revealed that the S02 flux had decreased to less than 90% of the measured values in September 2006 (Cervelli and West, 2007).
On 6 June 2007, citing declining seismicity and gas emissions, AVO lowered the Aviation Color Code from Yellow to Green, and the Volcanic Activity Alert Level from Advisory to Normal. They noted that "local hazards still [existed] near the summit, including jetting steam and/or very small explosions, unstable snow and ice, hot water and rock, and the possibility for high concentrations of dangerous volcanic gas."
Magma intrusion. Gardine and others (2011) analyzed seismic and gas emission data from the 2006-2007 Fourpeaked eruption and unrest (figure 9) in order to constrain the origin of the eruptive activity. Their findings suggested that the high levels of seismicity and gas emissions during the initial unrest indicated the intrusion of new magma into the upper 10 km of crust. They suggested that the intrusion reactivated fractures, allowing gases exsolved from the magma to be released at the surface. They argued that continued exsolution provided the gases released during the period of unrest, while local stress accumulation led to earthquake swarms (figure 9). They also suggested that the activity ceased only after the magma had cooled and degassed to a point where it became trapped and could no longer overcome the overburden pressure.
References. Cervelli, P.F. and West, M., 2007, The 2006 Eruption of Fourpeaked Volcano, Katmai National Park, Alaska, American Geophysical Union, Fall Meeting 2007, abstract ##V31E-0719.
Gardine, M., West, M., Werner, C., and Doukas, M., 2011, Evidence of magma intrusion at Fourpeaked volcano, Alaska in 2006-2007 from a rapid-response seismic network and volcanic gases, Journal of Volcanology and Geothermal Research, v. 200, issues 3-4, p. 192-200 (DOI: 10.1016/j.jvolgeores.2010.11.018).
McGimsey, R.G., Neal, C.A., Dixon, J.P., Malik, N., and Chibisova, M., 2011, 2007 Volcanic Activity in Alaska, Kamchatka, and the Kurile Islands: Summary of Events and Response of the Alaska Volcano Observatory, US Geological Society Scientific Investigations Report 2010-5242, 103 p.
Geologic Background. Poorly known Fourpeaked volcano in NE Katmai National Park consists of isolated outcrops surrounded by the Fourpeaked Glacier, which descends eastward almost to the Shelikof Strait. The orientation of andesitic lava flows and extensive hydrothermal alteration of rocks near the present summit suggest that it probably marks the vent area. Eruptive activity during the Holocene had not been confirmed prior to the first historical eruption in September 2006. A N-trending fissure extending 1 km from the summit produced minor ashfall.
Information Contacts: Alaska Volcano Observatory (AVO), a cooperative program of a) U.S. Geological Survey (USGS), 4200 University Drive, Anchorage, AK 99508-4667 USA (URL: http://www.avo.alaska.edu/), b) Geophysical Institute, University of Alaska, PO Box 757320, Fairbanks, AK 99775-7320, USA, and c) Alaska Division of Geological & Geophysical Surveys (ADGGS), 794 University Ave., Suite 200, Fairbanks, AK 99709, USA (URL: http://www.dggs.alaska.gov/).
Ol Doinyo Lengai (Tanzania) — January 2012 Cite this Report
Ol Doinyo Lengai
Tanzania
2.764°S, 35.914°E; summit elev. 2962 m
All times are local (unless otherwise noted)
Update on observations; new reports on 2007-2008 eruptions
This report on Ol Doinyo Lengai (hereafter, Lengai) is a continuation of previous Bulletin reports that were based in part on those found on Frederick Belton's Lengai web site (Belton, 2012). Our last report was in September 2010 (BGVN 35:09). Figures 149 and 150 show aerial photographs of Lengai in late 2010.
On 22 June 2011, Hans Schabel took a group of 8 conservation biologists to the Lengai summit up the regular approach along the NNW trail through the Pearly Gates (PG). During the ascent, the weather was cold, worsened by strong, increasingly sulfurous gusts from above. Minor fumaroles produced small clouds just above the PG. At the summit, conditions were relatively clear, making details of the crater rim and the pit visible. The slump on the E crater that Schabel first saw on his previous climb (16 January 2010, BGVN 35:05) had not expanded significantly, but some of the walls of the crater below had obviously slumped into big piles of rubble below. The group heard a 'whoosh' from two boiling, rolling, lava pools that spilled pitch-black lava into a growing lake flowing E in the crater floor (figure 151).
New Reports. Two recent research papers have been published concerning the 2007-2008 explosive eruptions of Lengai (BGVN 32:11, 33:02, 33:06, 33:08, 34:02, and 34:05). Kervyn and others (2010) and Keller and others (2010) summarize the first relatively closely documented 'cycle' from natrocarbonatite to carbonated nephelinite at Lengai. According to Kervyn and others (2010), on 4 September 2007, after 25 years of effusive natrocarbonatite eruptions, the eruptive activity of Lengai changed abruptly to episodic explosive eruptions. This transition was preceded by a voluminous lava eruption in March 2006, a year of quiescence, resumption of natrocarbonatite eruptions in June 2007, and a volcano-tectonic earthquake swarm in July 2007.
Keller and others (2010) noted that, with its paroxysmal ash eruption on 4 September 2007 and the highly explosive activity continuing in 2008, Lengai dramatically changed its behavior, crater morphology (figure 152), and magma composition after 25 years of quiet extrusion of fluid natrocarbonatite lava. This explosive activity resembled the explosive phases of 1917, 1940-1941, and 1966-1967, which were characterized by mixed ashes with dominantly nephelinitic and natrocarbonatitic components. Chemical analyses of the erupted products showed that the 2007-2008 explosive eruptions were associated with an undersaturated carbonated silicate melt. This new phase of explosive eruptions provided constraints on the factors causing the transition from natrocarbonatite effusive eruptions to explosive eruptions of carbonated nephelinite magma, variations observed repetitively in the last 100 years at Lengai.
Table 25 gives the summary of historical activity of Lengai from Keller and others (2010). The table shows the repeated occurrence of explosive paroxysms with documented or inferred natrocarbonatite activity in between the explosive eruptions.
Table 25. Synopis of the historical activity of Lengai, with observations covering about 100 years (since 1904 to 2008). References cited in the table are listed in the 'References to Table 25' section at the end of this Bulletin report. From Keller and others (2010).
| Date(s) |
Observations (references) |
| ca. 1880 |
First reports by early explorers: "Snow on the summit, Smoke at the summit." Volcanic activity reported by local people (Fischer, 1885; Neumann, 1894). |
| 1904 |
First ascent by F. Jaeger (Uhlig, 1905) |
| 1913 |
"Sodaschlammströme" (Reck and Schulze, 1921), from this inferred, effusive natrocarbonatite activity. Hornito morphology changed between photographs taken 1904 and 1915. Geological record: carbonatite platform below 1917 nephelinites (Keller and Krafft, 1990; Zaitsev and others, 2008a). |
| 1917 |
Major explosive eruption. Ash eruptions, nephelinite lavas, and agglomerates. Geological record: nephelinite lavas and agglomerates above carbonatite platform forming the western and eastern crater rim before the 2007/2008 events. |
| 1921, 1926 |
Eruption reports for 1921, 1926 classified as "minor" (Barns, 1921; Richard, 1942). |
| 1940-41 |
Explosive eruption. "Soda-rich ashes" (Richard, 1942). Geological record: "Surge-series" bracketed between 1917 and 1966/1967 pyroclastics in the summit area. Ashes, spherical lapilli, bomb field. Ashes mixed of silicate and carbonatite components. |
| 1954/1955 |
Explosive eruption classified as "minor" (Guest, 1956). |
| 1960 |
Effusive activity. First recognition and analysis of natrocarbonatites (Dawson, 1962). |
| 1966-67 |
Explosive eruptions (Dawson and others, 1968, 1992). "Mixed ashes." Geological record: "Grey series" ashes with spherical CWN lapilli on all slopes of the cone. Re-interpretation of the "Footprint Tuff" of Hay, 1983. |
| mid-1967 to 1983 |
Reported quiescence. |
| 1983-88 |
Minor explosive eruption, probably natrocarbonatitic (Nyamweru, 1997). |
| 1988-2007 |
Regularly documented effusive natrocarbonatite activity (Nyamweru, 1990; Keller and Krafft, 1990; Dawson and others, 1990, 1995; Keller and others, 2007; Kervyn and others, 2008). |
| 04 Sep 2007 |
Explosive paroxysm. |
| 2007-08 |
Since 4 Sep 2007 through early 2008, explosive eruptions with plumes over 10 km. Geological record: ashes, lapilli and scoriae of carbonated combeite-wollastonite-melilite nephelinite. |
References. Belton, F., 2012, Mountain of God (URL: http://oldoinyolengai.pbworks.com/w/page/33191422/Ol Doinyo Lengai2C The Mountain of God).
Keller, J., Klaudius, J., Kervyn, M., Ernst, G.G.J., and Mattsson, H.B., 2010, Fundamental changes in the activity of the natrocarbonatite volcano Oldoinyo Lengai, Tanzania: I. New magma composition during the 2007-2008 explosive eruptions, Bulletin of Volcanology, v. 72, no. 8, pp. 893-912. DOI 10.1007/s00445-010-0371-x.
Kervyn, M., Ernst, G.G.J., Keller, J., Vaughan, R.G., Klaudius, J., Pradal, E., Belton, F., Mattsson, H.B., Mbede, E., and Jacobs, P., 2010, Fundamental changes in the activity of the natrocarbonatite volcano Oldoinyo Lengai, Tanzania: II. Eruptive behaviour during the 2007-2008 explosive eruptions, Bulletin of Volcanology, v. 72, no. 8, pp. 913-931. DOI 10.1007/s00445-010-0360-0.
Klaudius, J., and Keller, J., 2006, Peralkaline silica lavas at Oldoinyo Lengai, Tanzania, Lithos, v. 91, no. 1-4, pp. 173-190.
Mattsson, H.B., and Reusser, E., 2010, Mineralogical and geochemical characterization of ashes from an early phase of the explosive September 2007 eruption of Oldoinyo Lengai (Tanzania), Journal of African Earth Sciences, v. 58, no. 5, pp. 752-763.
Wiedenmann, D., Keller, J., and Zaitsev, A.N., 2010, Melilite-group minerals at Oldoinyo Lengai, Tanzania, Lithos, v. 118, no. 1-2, pp. 112-118.
References to Table 25. Barns, T.A., 1921, The highlands of the Great Craters, Tanganyika Territory, Geographic Journal, v. 58, pp. 401-416.
Dawson, J.B., 1962, The geology of Oldoinyo Lengai, Bulletin of Volcanology, v. 24, pp. 348-387.
Dawson, J.B., Bowden, P., and Clark, G.C., 1968, Activity of the carbonatite volcano Oldoinyo Lengai, 1966, Geol Rundsch, v. 57, pp. 865-879.
Dawson, J.B., Pinkerton, H., Norton, G.E., and Pyle, D., 1990, Physicochemical properties of alkali carbonatite lavas: data from the 1988 eruption of Oldoinyo Lengai, Tanzania, Geology, v. 18, pp. 260-263.
Dawson, J.B., Smith, J.V., and Steele, I.M., 1992, 1966 ash eruption of the carbonatite volcano Oldoinyo Lengai: mineralogy of lapilli and mixing of silicate and carbonate magmas, Mineralogical Magazine, v. 56, pp. 1-16.
Dawson, J.B., Keller, J., and Nyamweru, C., 1995, Historic and recent eruptive activity of Oldoinyo Lengai. In: Bell K, Keller J (eds) Carbonatite volcanism: Oldoinyo Lengai and the petrogenesis of natrocarbonatites, IAVCEI Proceedings on Volcanology, v. 4. Springer, Berlin, pp. 4-22.
Fischer, G.A., 1885, Bericht über die im Auftrage der Geographischen Gesellschaft in Hamburg unternommene Reise in das Masai-Land 1882-1883. II: Begleitworte zur Original-Routenkarte, Mitt Geogr Ges Hamburg 1885, pp. 189-237.
Guest, N.J., 1956, The volcanic activity of Oldoinyo L'Engai, 1954, Rec Geol Surv Tanganyika, v. 4, pp. 56-59.
Hay, R.L., 1983, Natrocarbonatite tephra of Kerimasi volcano, Tanzania, Geology, v. 11, pp. 599-602.
Keller, J., and Krafft, M., 1990, Effusive natrocarbonatite activity of Oldoinyo Lengai, June 1988, Bulletin of Volcanology, v. 52, pp. 629-645.
Keller, J., Zaitsev, A.N., and Klaudius, J., 2007, Geochemistry and petrogenetic significance of natrocarbonatites at Oldoinyo Lengai, Tanzania: composition of lavas from 1988 to 2007, Goldschmidt Conference 2007, Cologne, Abstracts.
Kervyn, M., Klaudius, J., Keller, J., Kervyn, F., Mattsson, H., Belton, F., Mbede, E., Jacobs, P., and Ernst,G.G.J., 2008, Voluminous lava floods at Oldoinyo Lengai in 2006: chronology of events and insights into the shallow magmatic system. Bulletin of Volcanology, v. 70, pp. 1069-1086.
Neumann, O., 1894, In: Matschie, P., Nachrichten aus den deutschen Schutzgebieten. Deutsch-Ostafrika. Von der wissenschaftlichen Expedition Oskar Neumanns, Deutsches Kolonialblatt, v. 21, pp 421-424.
Nyamweru, C. 1990, Observations on changes in the active crater of Oldoinyo Lengai from 1960 to1988, Journal of African Earth Sciences, v. 11, pp. 385-390.
Nyamweru, C., 1997, Changes in the crater of Oldoinyo Lengai, Journal of African Earth Sciences, v. 25, pp. 43-53.
Reck, H., and Schulze, G., 1921, Ein Beitrag zur Kenntnis des Baues und der jüngsten Veränderung des L'Engai Vulkans im nördlichen Deutsch-Ostafrika, Z Vulk, v. 6, pp. 47-71.
Richard, J.J., 1942, Volcanological observations in East Africa. I Oldoinyo Lengai. The 1940-1 eruption, Journal of East Africa Uganda Natural Historical Society, v. 16, pp. 89-108.
Uhlig, C., 1905, Bericht über die Expedition der Otto-Winter-Stiftung nach den Umgebungen des Meru. Zeitschrift der Gesellschaft für Erdkunde zu Berlin, Jg 1905, pp. 120-123.
Zaitsev, A.N., Keller, J., Spratt, J., Perova, E.N., and Kearsley, A., 2008a, Nyerereite-pirssonite-calcite-shortite relationships in altered natrocarbonatites, Oldoinyo Lengai, Tanzania, Canadian Mineralogy, v. 46, pp. 1077-1094.
Zaitsev, A.N., Keller, J., Spratt, J., Jeffries, T.E., and Sharigin, V.V., 2008b, Chemical composition of nyerereite and gregoryite in natrocarbonatites of Oldoinyo Lengai Volcano, Tanzania, Procedings of the Russian Mineralogical Society, v. 137, pp. 101-111.
Geologic Background. The symmetrical Ol Doinyo Lengai is the only volcano known to have erupted carbonatite tephras and lavas in historical time. The prominent stratovolcano, known to the Maasai as "The Mountain of God," rises abruptly above the broad plain south of Lake Natron in the Gregory Rift Valley. The cone-building stage ended about 15,000 years ago and was followed by periodic ejection of natrocarbonatitic and nephelinite tephra during the Holocene. Historical eruptions have consisted of smaller tephra ejections and emission of numerous natrocarbonatitic lava flows on the floor of the summit crater and occasionally down the upper flanks. The depth and morphology of the northern crater have changed dramatically during the course of historical eruptions, ranging from steep crater walls about 200 m deep in the mid-20th century to shallow platforms mostly filling the crater. Long-term lava effusion in the summit crater beginning in 1983 had by the turn of the century mostly filled the northern crater; by late 1998 lava had begun overflowing the crater rim.
Information Contacts: Frederick Belton, Developmental Studies Department, PO Box 16, Middle Tennessee State University, Murfreesboro, TN 37132, USA (URL: http://oldoinyolengai.pbworks.com/); Laura Carmody, Department of Earth Science, University College London, Gower Street, London, WC1E 6BT, United Kingdom; Michael Dalton-Smith, Digital Crossing Productions (URL: http://digitalcrossing.ca/); Adrian P. Jones, Department of Earth Science, University College London, Gower Street, London, WC1E 6BT, United Kingdom; Sonja Joplin, One Heart Source (URL: http://www.oneheartsource.org); Matthew J. Genge, Department of Earth Science and Engineering, Royal School of Mines, Prince Consort Road, Imperial College London, SW7 2BP United Kingdom; Wendy Nelson, Department of Terrestrial Magnetism, Carnegie Institution of Washington, 5241 Broad Branch Rd, NW Washington, DC 20015, USA; Hans Schabel, retired forestry professor; Dave Simpson, Dave Simpson, professional guide, Kenya, East Africa (URL: http://www.davesimpsonsafaris.com); Ben Wilhelmi, commercial pilot (URL: http://benwilhelmi.typepad.com/benwilhelmi/).
Martin (United States) — January 2012 Cite this Report
Martin
United States
58.172°N, 155.361°W; summit elev. 1863 m
All times are local (unless otherwise noted)
Seismic swarm in January 2006
Activity at Mount Martin volcano since our last report (March 1995, BGVN 20:03) was marked by typical activity (summit fumarolic activity, often generating thick steam plumes reaching up to 1 km above the summit; Neal and others, 2009), occasionally interrupted by increased seismicity. The most notable event was a seismic swarm in January 2006.
Outstanding activity. An increase in seismicity during October 1996 was attributed to an actively degassing intrusion at the neighboring Mount Mageik volcano, ~7 km ENE of Martin (Jolly and McNutt, 1999). Other increases in seismicity occurred in December 1998, May-July 1999, January 2006 (the largest swarm at Martin since it has been monitored, discussed below), and May-June 2007 (figure 1).
January 2006 seismic swarm. The January 2006 Mount Martin seismic swarm included 860 locatable earthquakes (figures 1 and 2), more than four times the number of earthquakes seen during other periods of increased seismicity or seismic swarms since the region has been monitored. No recorded earthquakes during the swarm were much greater than M 2 (figure 2d), and a significant number of earthquakes were of magnitudes below the magnitude of completeness, Mc (figure 2a-c). Mc is the minimum magnitude needed to reliably locate an earthquake, reported by Dixon and Power (2009) to be Mc = 0.2 for Mount Martin.
Dixon and Power (2009) concluded that the pattern of the seismicity of the January 2006 swarm was characteristic of a volcanic earthquake sequence (as opposed to a tectonic earthquake sequence, which begins with a large mainshock) since the located hypocenters of the swarm occurred in the same space as those during previous background periods (figure 3). However, citing the short duration of the swarm, similar focal mechanisms compared to background periods, and the lack of long-period earthquakes, Dixon and Power (2009) stated that the data was not suggestive of a large intrusion of magma beneath Martin.
References. Dixon, J.P., and Power, J.A., 2009, The January 2006 Volcanic-tectonic earthquake swarm at Mount Martin, Alaska, in Haeussler, P.J., and Galloway, J.P., eds, Studies by the U.S. Geological Survey in Alaska, 2007: U.S. Geological Survey Professional Paper 1760-D, 17 p.
Jolly, A.D., McNutt, S.R., 1999, Seismicity at the volcanoes of Katmai National Park, Alaska; July 1995-December 1997, Journal of Volcanology and Geothermal Research, vol. 93, issues 3-4, pg. 173-190 (DOI: 10.1016/S0377-0273(99)00115-8).
Neal, C.A., McGimsey, R.G., Dixon, J.P., Manevich, A., and Rybin, A., 2009, 2006 Volcanic Activity in Alaska, Kamchatka, and the Kurile Islands: Summary of Events and Response of the Alaska Volcano Observatory, U.S. Geological Survey Scientific Investigations Report 2008-5214, 102 p.
Geologic Background. The mostly ice-covered Mount Martin stratovolcano lies at the SW end of the Katmai volcano cluster in Katmai National Park. The volcano was named for George C. Martin, the first person to visit and describe the area after the 1912 eruption. It is capped by a 300-m-wide summit crater, which is ice-free because of an almost-constant steam plume; it also contains a shallow acidic lake. The edifice was constructed entirely during the Holocene, and overlies glaciated lava flows of the adjacent mid- to late-Pleistocene Alagoshak volcano to the WSW. Martin consists of a small fragmental cone that was the source of ten thick overlapping blocky dacitic lava flows, largely uneroded by glaciers, that descend 10 km to the NW, cover 31 km2, and form about 95% of the eruptive volume of the volcano. Two reports of historical eruptions that originated from uncertain sources were attributed by Muller et al. (1954) to Martin.
Information Contacts: Alaska Volcano Observatory (AVO), a cooperative program of a) U.S. Geological Survey (USGS), 4200 University Drive, Anchorage, AK 99508-4667 USA (URL: http://www.avo.alaska.edu/), b) Geophysical Institute, University of Alaska, PO Box 757320, Fairbanks, AK 99775-7320, USA, and c) Alaska Division of Geological & Geophysical Surveys (ADGGS), 794 University Ave., Suite 200, Fairbanks, AK 99709, USA (URL: http://www.dggs.alaska.gov/).
Cerro Negro (Nicaragua) — January 2012 Cite this Report
Cerro Negro
Nicaragua
12.506°N, 86.702°W; summit elev. 728 m
All times are local (unless otherwise noted)
Non-eruptive activity; fumarole and seismic monitoring; new crater morphology
Cerro Negro remained non-eruptive from 2003 to 2011; explosive activity was last recorded in December 1999 (BGVN 24:11). Our last report reviewed Cerro Negro's fumarolic field observations, including descriptions of passive degassing and measurements of temperatures from June 2002 through May 2003, provided courtesy of Instituto Nicaragüense de Estudios Territoriales (INETER) and international collaborators (BGVN 28:07). No volcanic ash advisory reports for the area of Cerro Negro were released by the Washington VAAC office during 2003-2011. The following report reviews seismicity from 2003 to 2011, field observations, and emission measurements provided by INETER. The primary physical features of Cerro Negro highlighted in this report include the 1992 and 1995 central craters as well as the three 1999 craters, which continued to steam in 2007 (figure 15).
Figure 15 consists of a false-color image made from visible, near- and mid-infrared bands (3,7,2) to enhance geological features. Cerro Negro appears dark-red in the center of the image. The central cone, which was the source of many lava flows, lies immediately to the left of "1960" (the label dating the eruption associated with one of the lava flows). The tiny, arcuate pink and green zones at the central cone represent the rim of the nested craters there. Those craters are the scene of the highest fumarolic activity.
On the cone's S flanks, the three small cones created during the 1999 eruption appear as bright pink points. In figure 15 these appear immediately right of "1999".
Several volcanoes of the NW trending Marrabios range of Western Nicaragua are labeled on figure 15. Along the range to the SE is the historically active El Hoyo (Las Pilas) volcanic complex, which in figure 15 is partly cloud-covered. The complex includes Las Pilas, Cerro Grande, and Cerro Ojo de Agua eruptive centers. To the N and NW of Cerro Negro lie the volcanic centers Cerro la Mula and Rota.
Post-eruptive seismicity from 1999 to 2003. The INETER December 2003 report discussed seismicity after the small-scale, cone-forming events in 1999. INETER described Cerro Negro as relatively quiet since the 1999 episode; minor ash and gas explosions occurred as late as 25 December 1999. Earthquake counts from August 1999 to December 2003 ranged from 40 to 100 earthquakes per month, typically volcanic-tectonic (VT) events. Low amplitude tremor (frequency ranges of 8-19 Hz) was detected throughout 2003.
Figure 16 depicts multi-year seismicity and illustrates comparitive highs during 2003, particularly in January, September, and December when the the number of monthly earthquakes rose to over 100. These swarms led to counts roughly 10-fold higher than the 18-month interval of quiet from middle to late 2001. The later seismic swarm, occurring from 30 to 31 December, comprised 37 events too small to locate.
During 2003, INETER visited the volcano and found the scene without visible sign of change, without felt earthquakes, and lacking anomalous gas emissions. Fumarole temperatures from eight sites were in the range ~100-400°C. The only anomalous temperature increase in 2003 appeared at two fumaroles measuring ~550°C on 27 August. That was an increase of more than 200°C since July 2003.
2004 banded tremor and elevated seismicity. Although not ploted on figure 16, elevated seismicity continued through January, February, and March 2004. Banded tremor was recorded until 20 January, when it began to diminish. In January, RSAM was not greater than 50 units, but several cautionary public announcements were made regarding persistent tremor and its typical association with explosive activity.
Although INETER reported decreased tremor toward the end of January 2004, a seismic swarm occurred from 23 to 27 January. On 26 January the highest number of earthquakes registered (203 earthquakes, ~50 more than high of December 2003).
Of the ~1,200 earthquakes registered during January 2004, only three were located. During 3-29 February, ~400 events were registered and 33 were located. In March, 23 earthquakes were located and during the following months, significant events became rare averaging ~3 events located per month for the rest of the year. In March, tremor reached only 5 RSAM units.
Field visits by INETER determined that fumarole temperatures in March, May, June, and July 2004, ~50-350°C, spanned a wider range than those from the previous year. INETER had been measuring temperatures from several fumaroles (three to eight sites) within the crater since 1999 (figure 12 in BGVN 24:06 shows two primary fumarole locations in a map developed after major crater changes in 1995).
Press accounts regarding the seismic swarms. Officials interviewed by the newspaper La Prensa on 17 January 2004 included the mayor of León, who stated that the municipality's Emergency Committee was activated and on standby. The director of INETER's Volcanology program, Martha Navarro, also explained that caution was merited due to experience from Cerro Negro's 1999 escalation. Similar seismic tremor was recorded recently from the volcano, but conditions had clearly changed since 1999 and no explosions had occurred. The director also noted that on 11 January 2004 visiting scientists had looked for substantial sulfur-dioxide emissions but found them absent.
On 22 January 2004, a Civil Defense representative told La Prensa that recent reports of plumes from the crater were false and that no physical changes had occurred at Cerro Negro during the December-January seismic unrest. Passive degassing had been occurring at the summit and from fumaroles since the 1999 events but may have appeared anomalous to local observers. Regular monitoring by INETER had shown elevated temperatures from the fumaroles and steam frequently escaped from the three 1999 cinder cones (figure 15). According to La Prensa, the Civil Defense representative also shared details regarding new installations of seismic stations and gas-monitoring sites. A collaborative effort between Civil Defense and INETER made this possible.
2005-2011 rockfalls and altered crater morphology. Routine monitoring by INETER from 2005 through 2011 has been recorded in monthly reports available online in Spanish with English abstracts, works that chiefly documented passive degassing through this time period. Fumarole temperatures ranged from 13°C to ~400°C. In May 2003, seven fumaroles had elevated temperatures (BGVN 28:07), but in April 2008, six of these sites had ceased discharging measurable emissions. By July 2008, four fumarole sites were emitting gas and elevated temperatures ranging from 96 to 285°C that month and appeared stable through 2011.
INETER began reporting significant rockfalls along Cerro Negro's S and SW interior crater walls in 2009. These rockfalls continued through 2011 and released meter-sized blocks of coherent rock as well as highly altered material that collected within the crater (figure 17). INETER suggested that some of the large rockfalls may have been caused by large rainfalls, particularly those events during July 2009 and May-July 2010.
A significant geomorphic change at Cerro Negro was noted by INETER investigators on 11 January 2011. A N-trending fault had appeared since the last field visit (10 November 2010) on the SE interior crater wall (figure 18). Offset along the fault measured ~30 cm. Based on field relations INETER suggested this feature appeared gradually. The fault intersected fumarole ##1, a reliable site for thermal measurements. A major system of normal faults had already been documented to the NW of Cerro Negro, and the new fault on the cone appeared to trend parallel to it.
Seismicity at Cerro Negro remained generally low from 2005 through 2011 although tremor was detected regularly. At times, tremor was as low as 5 RSAM units (July 2009) and as high as 30 (December 2010 and September 2011). Numerous VT events were recorded in 2006 (~347) and in 2011 (~240) and accordingly, the number of significant located events was higher for those years as well, 25 and 32, respectively (table 4).
Table 4. Significant earthquakes located near Cerro Negro from 2003 through 2011. For each year, the table lists the number of located earthquakes, range of local magnitudes (ML), range of focal depths, and most frequently-occurring focal depth. Courtesy of INETER.
| Year |
# EQs |
ML |
Depth1 (km) |
Depth2 (km) |
| 2003 |
13 |
1.5-3.3 |
0-8 |
2 |
| 2004 |
86 |
0.6-2.7 |
0-13 |
0 |
| 2005 |
23 |
1.0-2.6 |
1-61 |
2 |
| 2006 |
25 |
0.8-3.3 |
1-157 |
2 |
| 2007 |
6 |
1.9-2.8 |
2-6 |
6 |
| 2008 |
5 |
0.5-3.1 |
1-194 |
2 |
| 2009 |
1 |
3.1 |
4 |
4 |
| 2010 |
6 |
1.5-2.8 |
2-88 |
3 |
| 2011 |
32 |
0.5-3.5 |
0-140 |
3 |
The range of focal depths was relatively large in 2006 and 2011. The deepest earthquake during 2003-2011 struck on 23 December 2008 with local magnitude (ML) 3.1 and located ~190 km below sea level. The most frequently occurring focal depth during 2005-2011 was very shallow, 2 km below sea level, under ML 3.5.
During field campaigns on 21-27 February 2011, a collaborative effort between Spain's Instituto Tecnológico y de Energías Renovables (ITER) and INETER mapped the spatial CO2-flux pattern. The team was able to map CO2 fluxes from multiple diffuse sources over the cone and within Cerro Negro's 1992 and 1995 craters (figure 19). An overall total CO2 flux of 43 tons per day was determined; a similar measurement was obtained in 2010 (44 tons per day). Collaborative efforts between ITER and INETER have applied this mapping technique since 1999 in order to locate anomalous areas of emissions from the cone and to calculate total flux (Dionis, S. and others 2010). These investigators noted that the years following the 1999 explosion were marked by decreasing levels of CO2 however, an increasing trend appeared from December 2008 to March 2009; values ranged from 12 tons per day to 38 tons per day.
References. Dionis, S., Melián, G., Barrancos, J., Padilla, G., Calvo, D., Rodríguez, F., Padrón, E., Nolasco, D., Hernández, Pedro A., Pérez, N. M., Ibarra, M., and Muñoz, A., 2010. Dynamics of diffuse CO2 emission and eruptive cycle at Cerro Negro volcano, Nicaragua, Cities on Volcanoes 6, Puerto de la Cruz, Tenerife, 31 May-4 June, 2010, Abs, p 103.
Hill, B. E., Connor, C.B, Jarzemba, M.S., La Femina, P.C., Navarro, M., and Strauch, W., 1998, 1995 eruptions of Cerro Negro volcano, Nicaragua, and risk assessment for future eruptions, Geological Society of America Bulletin, 110, no. 10;1231-1241.
NASA Landsat Program, 2003, Landsat ETM+ scene 7dt19991115, SLC-Off, USGS, Sioux Falls, Nov. 15, 1999.
McKnight, S.B. and Williams, S.N., 1997, Old cinder cone or young composite volcano?: The nature of Cerro Negro, Nicaragua, Geology, 25, 339-342.
Geologic Background. Nicaragua's youngest volcano, Cerro Negro, was created following an eruption that began in April 1850 about 2 km NW of the summit of Las Pilas volcano. It is the largest, southernmost, and most recent of a group of four youthful cinder cones constructed along a NNW-SSE-trending line in the central Marrabios Range. Strombolian-to-subplinian eruptions at intervals of a few years to several decades have constructed a roughly 250-m-high basaltic cone and an associated lava field constrained by topography to extend primarily NE and SW. Cone and crater morphology have varied significantly during its short eruptive history. Although it lies in a relatively unpopulated area, occasional heavy ashfalls have damaged crops and buildings.
Information Contacts: Instituto Nicaragüense de Estudios Territoriales (INETER), Apartado Postal 2110, Managua, Nicaragua (URL: http://www.ineter.gob.ni/); Global Land Cover Facility ( URL: http:// http://www.glcf.umiacs.umd.edu/); Instituto Tecnológico y de Energías Renovables (ITER), 38611 Granadilla, Tenerife, Canary Islands, Spain (URL: http://www.iter.es/); Washington Volcanic Ash Advisory Center (VAAC), Satellite Analysis Branch (SAB), NOAA/NESDIS E/SP23, NOAA Science Center Room 401, 5200 Auth Rd, Camp Springs, MD 20746, USA (URL: http://www.ospo.noaa.gov/Products/atmosphere/vaac/); La Prensa de Nicaragua, Managua, Nicaragua (URL: http://www.laprensa.com.ni/).
Spurr (United States) — January 2012 Cite this Report
Spurr
United States
61.299°N, 152.251°W; summit elev. 3374 m
All times are local (unless otherwise noted)
Summit ice cauldron, debris flows through 2006; fumarolic activity continues
The 2004 unrest at Mount Spurr (BGVN 29:10) continued for nearly two years before the Alaska Volcano Observatory (AVO) lowered the Level of Concern Color Code from Yellow to Green (on a scale from Green to Yellow to Orange to Red) on 21 February 2006. During those two years, hydrothermal and fumarolic activity within the ice-filled summit crater resulted in the formation of a summit ice cauldron and emplacement of debris-flow deposits on the upper slopes of Spurr. The summit crater and cauldron remained active after most other signs of unrest had declined. This report discusses observations of the development of the unrest following November 2004 (activity prior to that time covered in BGVN 29:10).
A depression in the summit ice was observed in its early stages in June 2004 (figures 12 and 13). The subsidence became more pronounced, and was recognized as an ice cauldron on 2 August, following debris flows emplaced in late July (figure 14). The cauldron housed a lake, whose water was described by Neal and others (2005) and McGimsey and others (2008) as "dark battleship gray" and turquoise in color, respectively, likely due to dissolved sulfur compounds (figure 15).
Ice cauldron widens. Neal and others (2005) reported that measurements made on 10 August and 30 October 2004 revealed enlargement of the ice cauldron from ~65 m x 95 m to ~130 m x 130 m in two and a half months' time. Gas measurements during the same time revealed that CO2 emissions had more than doubled (figure 16).
Forward Looking Infrared Radiometer (FLIR) measurements on 24 September showed that the crater lake was ~0 °C (substantially warmer than the surrounding ice and snow), and the surrounding exposed bedrock (and main fumarolic emission area) was as hot as ~39 °C (figure 15).
By the end of 2004, seismicity remained elevated, and most located earthquakes were within 0-5 km depth below sea level (figure 17; Neal and others 2005).
During 2005, growth of the summit ice cauldron continued (figures 18 and 19), and areas of exposed bedrock increased along the N and NW walls of the crater. According to McGimsey and others (2008), FLIR measurements on 25 April 2005 showed similar temperatures to those measured in September 2004 (figure 15).
May 2005 debris flow. A small debris flow was captured on webcam views of the summit on 2 May 2005 (figure 20). Observations a week later revealed that the cauldron lake level had dropped by ~15 m, and fumaroles on the N shore of the lake had been exposed (McGimsey and others, 2008). The fumaroles were described as vigorous by McGimsey and others (2008). FLIR measurements during an observation flight on 21 June indicated increasing temperatures of exposed bedrock within the crater (up to 60 °C; orange areas within the ice cauldron outline, figure 20) and observers noted strong upwelling within the N half of the cauldron lake.
The likely (or at least nearly) contemporaneous lake level drop and debris flow on 2 May were not associated with any significant ice collapse into the cauldron lake; Coombs and others (2006) thus concluded that the debris flows were the result of widening of englacial or subglacial pathways by erosion, heating, or glacial flow (cross-section, figure 20). They also interpreted the main source of the debris carried in the debris flows to be melted glacial ice containing layers of tephra and ash. The primary source of the tephra and ash layers was likely the 1992 eruptions of Crater Peak (Spurr's satellite cone and youngest vent) and possibly the 1989-90 eruptions of Mount Redoubt (Coombs and others, 2006). Some component of the debris was also likely sourced from the summit crater floor and wall rocks.
Snow/ice melts from summit crater. By 1 August 2005, the ice cauldron had reached its largest size (i.e. the snow/ice had melted from within the perimeter of the summit crater; figures 18 and 19), and was thus no longer termed the "ice cauldron", but simply the summit crater (McGimsey, personal communication, 2012). In September, the crater lake was observed to be completely ice-free, and most likely remained as such through mid January 2006. McGimsey and others (2008) reported that, as of 3 November 2005, ~5.4 x 10⁶ m3 of ice and snow had been melted and consumed by the summit lake.
Decreasing seismicity prompted the AVO to lower the Level of Concern Color Code from Yellow to Green on 21 February 2006. With the exception of an earthquake swarm during 11-12 April, seismicity continued to decrease, and reached background levels by May 2006. During the earthquake swarm, Neal and others (2009) reported 157 volcano-tectonic earthquakes (reaching M ~2.3) that occurred at less than 5 km depth below sea level and ~1-3 km W of the summit. FLIR measurements two days after the earthquake swarm revealed that fumaroles within the summit crater were as hot as 150 °C (Neal and others, 2009). By mid July, however, snow and ice had started accumulating on the lake's surface, and by 17 November 2006, a rise in the level of the lake was observed. As fumarolic activity continued, yellow, sulfur stained ice and snow, as well as a strong sulfur smell, was often reported by pilots passing the summit.
Since 2006, most of the sides and bottom of the summit crater have been covered by snow, with the exception of the fumarole field in the N part of the crater floor. As of the last observation flight, the fumarole field maintained a small patch of snow/ice free bedrock on the summit crater's floor, an area still active as of 28 August 2011 (figure 21). Later satellite imagery suggested that the fumarole field had been covered as the summit crater filled with snow and ice during the first part of the 2011-2012 winter (figure 22), but there have been no observation flights to confirm this as of 24 February 2012.
Coombs and others (2006) stated that the overall effect of the hydrothermal activity (including water/debris flow releases from the summit) on the glacial system of Spurr were likely minimal, pointing out that the volume of water released was relatively small and probably easily accommodated "without significant modification of the icemass."
References. Coombs, M.L., Neal, C.A., Wessels, R.L., and McGimsey, R.G., 2006, Geothermal disruption of summit glaciers at Mount Spurr Volcano, 2004-6: An unusual manifestation of volcanic unrest: U.S. Geological Survey Professional Paper 1732-B, 33 p.
Doukas, M.P., and McGee, K.A., 2007, A compilation of gas emission-rate data from volcanoes of Cook Inlet (Spurr, Crater Peak, Redoubt, Iliamna, and Augustine) and Alaska Peninsula (Douglas, Fourpeaked, Griggs, Mageik, Martin, Peulik, Ukinrek, and Veniaminof), Alaska, from 1995-2006: U.S. Geological Survey Open-File Report 2007-1400, 16 p.
McGimsey, R.G., Neal, C.A., Dixon, J.P., and Ushakov, S., 2008, 2005 Volcanic activity in Alaska, Kamchatka, and the Kurile Islands: Summary of events and response of the Alaska Volcano Observatory: U.S. Geological Survey Scientific Investigations Report 2007-5269, 94 p.
Neal, C.A., McGimsey, R.G., Dixon, J.P., Manevich, A., and Rybin, A., 2009, 2006 Volcanic activity in Alaska, Kamchatka, and the Kurile Islands: Summary of events and response of the Alaska Volcano Observatory: U.S. Geological Survey Scientific Investigations Report 2008-5214, 102 p.
Neal, C.A., McGimsey, R.G., Dixon, J., and Melnikov, D., 2005, 2004 Volcanic activity in Alaska and Kamchatka: Summary of events and response of the Alaska Volcano Observatory: U.S. Geological Survey Open-File Report 2005-1308, 71 p.
Geologic Background. Mount Spurr is the closest volcano to Anchorage, Alaska (130 km W) and just NE of Chakachamna Lake. The summit is a large lava dome at the center of a roughly 5-km-wide amphitheater open to the south formed by a late-Pleistocene or early Holocene debris avalanche and associated pyroclastic flows that destroyed an older edifice. The debris avalanche traveled more than 25 km SE, and the resulting deposit contains blocks as large as 100 m in diameter. Several ice-carved post-collapse cones or lava domes are present. The youngest vent, Crater Peak, formed at the southern end of the amphitheater and has been the source of about 40 identified Holocene tephra layers. Eruptions from Crater Peak in 1953 and 1992 deposited ash in Anchorage.
Information Contacts: Bruce Hopper, Game McGimsey, and Christina Neal, Alaska Volcano Observatory (AVO), a cooperative program of a) U.S. Geological Survey (USGS), 4200 University Drive, Anchorage, AK 99508-4667 USA (URL: http://www.avo.alaska.edu/), b) Geophysical Institute, University of Alaska, PO Box 757320, Fairbanks, AK 99775-7320, USA, and c) Alaska Division of Geological & Geophysical Surveys (ADGGS), 794 University Ave., Suite 200, Fairbanks, AK 99709, USA (URL: http://www.dggs.alaska.gov/); Digital Globe, Inc. (URL: http://www.digitalglobe.com/).