Recently Published Bulletin Reports
Erebus (Antarctica) Lava lake remains active; most thermal alerts recorded since 2019
Rincon de la Vieja (Costa Rica) Frequent phreatic explosions during July-December 2023
Bezymianny (Russia) Explosion on 18 October 2023 sends ash plume 8 km high; lava flows and incandescent avalanches
Kilauea (United States) Low-level lava effusions in the lava lake at Halema’uma’u during July-December 2022
Nyamulagira (DR Congo) Lava flows and thermal activity during May-October 2023
Bagana (Papua New Guinea) Explosions, ash plumes, ashfall, and lava flows during April-September 2023
Mayon (Philippines) Lava flows, pyroclastic flows, ash emissions, and seismicity during April-September 2023
Nishinoshima (Japan) Eruption plumes and gas-and-steam plumes during May-August 2023
Krakatau (Indonesia) White gas-and-steam plumes and occasional ash plumes during May-August 2023
Villarrica (Chile) Strombolian activity, gas-and-ash emissions, and crater incandescence during April-September 2023
Merapi (Indonesia) Frequent incandescent avalanches during April-September 2023
Ebeko (Russia) Moderate explosive activity with ash plumes continued during June-November 2023
Erebus (Antarctica) — January 2024  Cite this Report
Erebus
Antarctica
77.53°S, 167.17°E; summit elev. 3794 m
All times are local (unless otherwise noted)
Lava lake remains active; most thermal alerts recorded since 2019
The lava lake in the summit crater of Erebus has been active since at least 1972. Located in Antarctica overlooking the McMurdo Station on Ross Island, it is the southernmost active volcano on the planet. Because of the remote location, activity is primarily monitored by satellites. This report covers activity during 2023.
The number of thermal alerts recorded by the Hawai'i Institute of Geophysics and Planetology’s MODVOLC Thermal Alerts System increased considerably in 2023 compared to the years 2020-2022 (table 9). In contrast to previous years, the MODIS instruments aboard the Aqua and Terra satellites captured data from Erebus every month during 2023. Consistent with previous years, the lowest number of anomalous pixels were recorded in January, November, and December.
Table 9. Number of monthly MODIS-MODVOLC thermal alert pixels recorded at Erebus during 2017-2023. See BGVN 42:06 for data from 2000 through 2016. The table was compiled using data provided by the HIGP – MODVOLC Thermal Alerts System.
| Year |
Jan |
Feb |
Mar |
Apr |
May |
Jun |
Jul |
Aug |
Sep |
Oct |
Nov |
Dec |
SUM |
| 2017 |
0 |
21 |
9 |
0 |
0 |
1 |
11 |
61 |
76 |
52 |
0 |
3 |
234 |
| 2018 |
0 |
21 |
58 |
182 |
55 |
17 |
137 |
172 |
103 |
29 |
0 |
0 |
774 |
| 2019 |
2 |
21 |
162 |
151 |
55 |
56 |
75 |
53 |
29 |
19 |
1 |
0 |
624 |
| 2020 |
0 |
2 |
16 |
18 |
4 |
4 |
1 |
3 |
18 |
3 |
1 |
6 |
76 |
| 2021 |
0 |
9 |
1 |
0 |
2 |
56 |
46 |
47 |
35 |
52 |
5 |
3 |
256 |
| 2022 |
1 |
13 |
55 |
22 |
15 |
32 |
39 |
19 |
31 |
11 |
0 |
0 |
238 |
| 2023 |
2 |
33 |
49 |
82 |
41 |
32 |
70 |
64 |
42 |
17 |
5 |
11 |
448 |
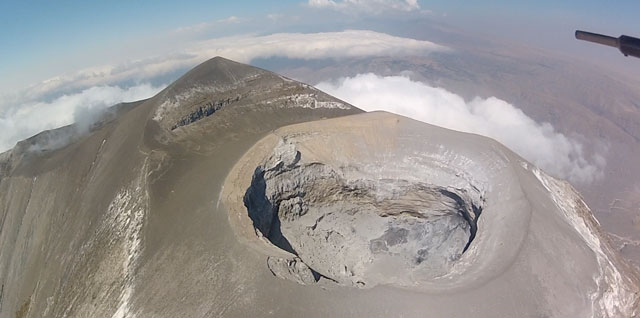
Sentinel-2 infrared images showed one or two prominent heat sources within the summit crater, accompanied by adjacent smaller sources, similar to recent years (see BGVN 46:01, 47:02, and 48:01). A unique image was obtained on 25 November 2023 by the OLI-2 (Operational Land Imager-2) on Landsat 9, showing the upper part of the volcano surrounded by clouds (figure 32).
Geologic Background. Mount Erebus, the world's southernmost historically active volcano, overlooks the McMurdo research station on Ross Island. It is the largest of three major volcanoes forming the crudely triangular Ross Island. The summit of the dominantly phonolitic volcano has been modified by one or two generations of caldera formation. A summit plateau at about 3,200 m elevation marks the rim of the youngest caldera, which formed during the late-Pleistocene and within which the modern cone was constructed. An elliptical 500 x 600 m wide, 110-m-deep crater truncates the summit and contains an active lava lake within a 250-m-wide, 100-m-deep inner crater; other lava lakes are sometimes present. The glacier-covered volcano was erupting when first sighted by Captain James Ross in 1841. Continuous lava-lake activity with minor explosions, punctuated by occasional larger Strombolian explosions that eject bombs onto the crater rim, has been documented since 1972, but has probably been occurring for much of the volcano's recent history.
Information Contacts: Hawai'i Institute of Geophysics and Planetology (HIGP) - MODVOLC Thermal Alerts System, School of Ocean and Earth Science and Technology (SOEST), Univ. of Hawai'i, 2525 Correa Road, Honolulu, HI 96822, USA (URL: http://modis.higp.hawaii.edu/); Copernicus Browser, Copernicus Data Space Ecosystem, European Space Agency (URL: https://dataspace.copernicus.eu/browser/); NASA Earth Observatory, EOS Project Science Office, NASA Goddard Space Flight Center, Goddard, Maryland, USA (URL: https://earthobservatory.nasa.gov/images/152134/erebus-breaks-through).
Rincon de la Vieja (Costa Rica) — January 2024 Cite this Report
Rincon de la Vieja
Costa Rica
10.83°N, 85.324°W; summit elev. 1916 m
All times are local (unless otherwise noted)
Frequent phreatic explosions during July-December 2023
Rincón de la Vieja is a volcanic complex in Costa Rica with a hot convecting acid lake that exhibits frequent weak phreatic explosions, gas-and-steam emissions, and occasional elevated sulfur dioxide levels (BGVN 45:10, 46:03, 46:11). The current eruption period began June 2021. This report covers activity during July-December 2023 and is based on weekly bulletins and occasional daily reports from the Observatorio Vulcanologico Sismologica de Costa Rica-Universidad Nacional (OVSICORI-UNA).
Numerous weak phreatic explosions continued during July-December 2023, along with gas-and-steam emissions and plumes that rose as high as 3 km above the crater rim. Many weekly OVSICORI-UNA bulletins included the previous week's number of explosions and emissions (table 9). For many explosions, the time of explosion was given (table 10). Frequent seismic activity (long-period earthquakes, volcano-tectonic earthquakes, and tremor) accompanied the phreatic activity.
Table 9. Number of reported weekly phreatic explosions and gas-and-steam emissions at Rincón de la Vieja, July-December 2023. Counts are reported for the week before the Weekly Bulletin date; not all reports included these data. Courtesy of OVSICORI-UNA.
| OVSICORI Weekly Bulletin |
Number of explosions |
Number of emissions |
| 28 Jul 2023 |
6 |
14 |
| 4 Aug 2023 |
10 |
12 |
| 1 Sep 2023 |
13 |
11 |
| 22 Sep 2023 |
12 |
13 |
| 29 Sep 2023 |
6 |
11 |
| 6 Oct 2023 |
12 |
5 |
| 13 Oct 2023 |
7 |
9 |
| 20 Oct 2023 |
1 |
15 |
| 27 Oct 2023 |
3 |
23 |
| 3 Nov 2023 |
3 |
10 |
| 17 Nov 2023 |
0 |
Some |
| 24 Nov 2023 |
0 |
14 |
| 8 Dec 2023 |
4 |
16 |
| 22 Dec 2023 |
8 |
18 |
Table 10. Summary of activity at Rincón de la Vieja during July-December 2023. Weak phreatic explosions and gas emissions are noted where the time of explosion was indicated in the weekly or daily bulletins. Height of plumes or emissions are distance above the crater rim. Courtesy of OVSICORI-UNA.
| Date |
Time |
Description of Activity |
| 1 Jul 2023 |
0156 |
Explosion. |
| 2 Jul 2023 |
0305 |
Explosion. |
| 4 Jul 2023 |
0229, 0635 |
Event at 0635 produced a gas-and-steam plume that rose 700 m and drifted W; seen by residents in Liberia (21 km SW). |
| 9 Jul 2023 |
1843 |
Explosion. |
| 21 Jul 2023 |
0705 |
Explosion. |
| 26 Jul 2023 |
1807 |
Explosion. |
| 28 Jul 2023 |
0802 |
Explosion generated a gas-and-steam plume that rose 500 m. |
| 30 Jul 2023 |
1250 |
Explosion. |
| 31 Jul 2023 |
2136 |
Explosion. |
| 11 Aug 2023 |
0828 |
Explosion. |
| 18 Aug 2023 |
1304 |
Explosion. |
| 21 Aug 2023 |
1224 |
Explosion generated gas-and-steam plumes rose 500-600 m. |
| 22 Aug 2023 |
0749 |
Explosion generated gas-and-steam plumes rose 500-600 m. |
| 24 Aug 2023 |
1900 |
Explosion. |
| 25 Aug 2023 |
0828 |
Event produced a steam-and-gas plume that rose 3 km and drifted NW. |
| 27-28 Aug 2023 |
0813 |
Four small events; the event at 0813 on 28 August lasted two minutes and generated a steam-and-gas plume that rose 2.5 km. |
| 1 Sep 2023 |
1526 |
Explosion generated plume that rose 2 km and ejected material onto the flanks. |
| 2-3 Sep 2023 |
- |
Small explosions detected in infrasound data. |
| 4 Sep 2023 |
1251 |
Gas-and-steam plume rose 1 km and drifted W. |
| 7 Nov 2023 |
1113 |
Explosion. |
| 8 Nov 2023 |
0722 |
Explosion. |
| 12 Nov 2023 |
0136 |
Small gas emissions. |
| 14 Nov 2023 |
0415 |
Small gas emissions. |
According to OVSICORI-UNA, during July-October the average weekly sulfur dioxide (SO2) flux ranged from 68 to 240 tonnes/day. However, in mid-November the flux increased to as high as 334 tonnes/day, the highest value measured in recent years. The high SO2 flux in mid-November was also detected by the TROPOMI instrument on the Sentinel-5P satellite (figure 43).
Geologic Background. Rincón de la Vieja, the largest volcano in NW Costa Rica, is a remote volcanic complex in the Guanacaste Range. The volcano consists of an elongated, arcuate NW-SE-trending ridge constructed within the 15-km-wide early Pleistocene Guachipelín caldera, whose rim is exposed on the south side. Sometimes known as the "Colossus of Guanacaste," it has an estimated volume of 130 km3 and contains at least nine major eruptive centers. Activity has migrated to the SE, where the youngest-looking craters are located. The twin cone of Santa María volcano, the highest peak of the complex, is located at the eastern end of a smaller, 5-km-wide caldera and has a 500-m-wide crater. A Plinian eruption producing the 0.25 km3 Río Blanca tephra about 3,500 years ago was the last major magmatic eruption. All subsequent eruptions, including numerous historical eruptions possibly dating back to the 16th century, have been from the prominent active crater containing a 500-m-wide acid lake located ENE of Von Seebach crater.
Information Contacts: Observatorio Vulcanológico Sismológica de Costa Rica-Universidad Nacional (OVSICORI-UNA), Apartado 86-3000, Heredia, Costa Rica (URL: http://www.ovsicori.una.ac.cr/); NASA Global Sulfur Dioxide Monitoring Page, Atmospheric Chemistry and Dynamics Laboratory, NASA Goddard Space Flight Center (NASA/GSFC), 8800 Greenbelt Road, Goddard MD 20771, USA (URL: https://so2.gsfc.nasa.gov/).
Bezymianny (Russia) — November 2023 Cite this Report
Bezymianny
Russia
55.972°N, 160.595°E; summit elev. 2882 m
All times are local (unless otherwise noted)
Explosion on 18 October 2023 sends ash plume 8 km high; lava flows and incandescent avalanches
Bezymianny, located on Russia’s Kamchatka Peninsula, has had eruptions since 1955 characterized by dome growth, explosions, pyroclastic flows, ash plumes, and ashfall. Activity during November 2022-April 2023 included gas-and-steam emissions, lava dome collapses generating avalanches, and persistent thermal activity. Similar eruptive activity continued from May through October 2023, described here based on information from weekly and daily reports of the Kamchatka Volcano Eruptions Response Team (KVERT), notices from Tokyo VAAC (Volcanic Ash Advisory Center), and from satellite data.
Overall activity decreased after the strong period of activity in late March through April 2023, which included ash explosions during 29 March and 7-8 April 2023 that sent plumes as high as 10-12 km altitude, along with dome growth and lava flows (BGVN 48:05). This reduced activity can be seen in the MIROVA thermal detection system graph (figure 56), which was consistent with data from the MODVOLC thermal detection system and with Sentinel-2 satellite images that showed persistent hotspots in the summit crater when conditions allowed observations. A renewed period of strong activity began in mid-October 2023.
Activity increased significantly on 17 October 2023 when large collapses began during 0700-0830 on the E flanks of the lava dome and continued to after 0930 the next day (figure 57). Ash plumes rose to an altitude of 4.5-5 km, extending 220 km NNE by 18 October. A large explosion at 1630 on 18 October produced an ash plume that rose to an altitude of 11 km (8 km above the summit) and drifted NNE and then NW, extending 900 km NW within two days at an altitude of 8 km. Minor ashfall was noted in Kozyrevsk (45 km WNW). At 0820 on 20 October an ash plume was identified in satellite images drifting 100 km ENE at altitudes of 4-4.5 km.
Lava flows and hot avalanches from the dome down the SE flank continued over the next few days, including 23 October when clear conditions allowed good observations (figures 58 and 59). A large thermal anomaly was observed over the volcano through 24 October, and in the summit crater on 30 October (figure 60). Strong fumarolic activity continued, with numerous avalanches and occasional incandescence. By the last week of October, volcanic activity had decreased to a level consistent with that earlier in the reporting period.
Aviation warnings were frequently updated during 17-20 October. KVERT issued a Volcano Observatory Notice for Aviation (VONA) on 17 October at 1419 and 1727 (0219 and 0527 UTC) raising the Aviation Color Code (ACC) from Yellow to Orange (second highest level). The next day, KVERT issued a VONA at 1705 (0505 UTC) raising the ACC to Red (highest level) but lowered it back to Orange at 2117 (0917 UTC). After another decrease to Yellow and back to Orange, the ACC was reduced to Yellow on 20 October at 1204 (0004 UTC). In addition, the Tokyo VAAC issued a series of Volcanic Ash Advisories beginning on 16 October and continuing through 30 October.
Geologic Background. The modern Bezymianny, much smaller than its massive neighbors Kamen and Kliuchevskoi on the Kamchatka Peninsula, was formed about 4,700 years ago over a late-Pleistocene lava-dome complex and an edifice built about 11,000-7,000 years ago. Three periods of intensified activity have occurred during the past 3,000 years. The latest period, which was preceded by a 1,000-year quiescence, began with the dramatic 1955-56 eruption. This eruption, similar to that of St. Helens in 1980, produced a large open crater that was formed by collapse of the summit and an associated lateral blast. Subsequent episodic but ongoing lava-dome growth, accompanied by intermittent explosive activity and pyroclastic flows, has largely filled the 1956 crater.
Information Contacts: Kamchatka Volcanic Eruptions Response Team (KVERT), Far Eastern Branch, Russian Academy of Sciences, 9 Piip Blvd., Petropavlovsk-Kamchatsky, 683006, Russia (URL: http://www.kscnet.ru/ivs/kvert/); Kamchatka Volcanological Station, Kamchatka Branch of Geophysical Survey, (KB GS RAS), Klyuchi, Kamchatka Krai, Russia (URL: http://volkstat.ru/); Tokyo Volcanic Ash Advisory Center (VAAC), 1-3-4 Otemachi, Chiyoda-ku, Tokyo 100-8122, Japan (URL: http://ds.data.jma.go.jp/svd/vaac/data/); Hawai'i Institute of Geophysics and Planetology (HIGP) - MODVOLC Thermal Alerts System, School of Ocean and Earth Science and Technology (SOEST), Univ. of Hawai'i, 2525 Correa Road, Honolulu, HI 96822, USA (URL: http://modis.higp.hawaii.edu/); MIROVA (Middle InfraRed Observation of Volcanic Activity), a collaborative project between the Universities of Turin and Florence (Italy) supported by the Centre for Volcanic Risk of the Italian Civil Protection Department (URL: http://www.mirovaweb.it/); Copernicus Browser, Copernicus Data Space Ecosystem, European Space Agency (URL: https://dataspace.copernicus.eu/browser/).chr
Kilauea (United States) — January 2023 Cite this Report
Kilauea
United States
19.421°N, 155.287°W; summit elev. 1222 m
All times are local (unless otherwise noted)
Low-level lava effusions in the lava lake at Halema’uma’u during July-December 2022
Kīlauea is the southeastern-most volcano in Hawaii and overlaps the E flank of the Mauna Loa volcano. Its East Rift Zone (ERZ) has been intermittently active for at least 2,000 years. An extended eruption period began in January 1983 and was characterized by open lava lakes and lava flows from the summit caldera and the East Rift Zone. During May 2018 magma migrated into the Lower East Rift Zone (LERZ) and opened 24 fissures along a 6-km-long NE-trending fracture zone that produced lava flows traveling in multiple directions. As lava emerged from the fissures, the lava lake at Halema'uma'u drained and explosions sent ash plumes to several kilometers altitude (BGVN 43:10).
The current eruption period started during September 2021 and has recently been characterized by lava effusions, spatter, and sulfur dioxide emissions in the active Halema’uma’u lava lake (BGVN 47:08). Lava effusions, some spatter, and sulfur dioxide emissions have continued during this reporting period of July through December 2022 using daily reports, volcanic activity notices, and abundant photo, map, and video data from the US Geological Survey's (USGS) Hawaiian Volcano Observatory (HVO).
Summary of activity during July-December 2022. Low-level effusions have continued at the western vent of the Halema’uma’u crater during July through early December 2022. Occasional weak ooze-outs (also called lava break outs) would occur along the margins of the crater floor. The overall level of the active lava lake throughout the reporting period gradually increased due to infilling, however it stagnated in mid-September (table 13). During September through November, activity began to decline, though lava effusions persisted at the western vent. By 9 December, the active part of the lava lake had completely crusted over, and incandescence was no longer visible.
Table 13. Summary of measurements taken during overflights at Kīlauea that show a gradual increase in the active lava lake level and the volume of lava effused since 29 September 2021. Lower activity was reported during September-October. Data collected during July-December 2022. Courtesy of HVO.
| Date: |
Level of the active lava lake (m): |
Cumulative volume of lava effused (million cubic meters): |
| 7 Jul 2022 |
130 |
95 |
| 19 Jul 2022 |
133 |
98 |
| 4 Aug 2022 |
136 |
102 |
| 16 Aug 2022 |
137 |
104 |
| 12 Sep 2022 |
143 |
111 |
| 5 Oct 2022 |
143 |
111 |
| 28 Oct 2022 |
143 |
111 |
Activity during July 2022. Lava effusions were reported from the western vent in the Halema’uma’u crater, along with occasional weak ooze-outs along the margins of the crater floor. The height of the lava lake was variable due to deflation-inflation tilt events; for example, the lake level dropped approximately 3-4 m during a summit deflation-inflation event reported on 1 July. Webcam images taken during the night of 6-12 July showed intermittent low-level spattering at the western vent that rose less than 10 m above the vent (figure 519). Measurements made during an overflight on 7 July indicated that the crater floor was infilled about 130 m and that 95 million cubic meters of lava had been effused since 29 September 2021. A single, relatively small lava ooze-out was active to the S of the lava lake. Around midnight on 8 July there were two brief periods of lava overflow onto the lake margins. On 9 July lava ooze-outs were reported near the SE and NE edges of the crater floor and during 10-11 July they occurred near the E, NE, and NW edges. On 16 July crater incandescence was reported, though the ooze-outs and spattering were not visible. On 18 July overnight webcam images showed incandescence in the western vent complex and two ooze-outs were reported around 0000 and 0200 on 19 July. By 0900 there were active ooze-outs along the SW edge of the crater floor. Measurements made from an overflight on 19 July indicated that the crater floor was infilled about 133 m and 98 million cubic meters of lava had erupted since 29 September 2021 (figure 520). On 20 July around 1600 active ooze-outs were visible along the N edge of the crater, which continued through the next day. Extensive ooze-outs occurred along the W margin during 24 July until 1900; on 26 July minor ooze-outs were noted along the N margin. Minor spattering was visible on 29 July along the E margin of the lake. The sulfur dioxide emission rates ranged 650-2,800 tons per day (t/d), the higher of which was measured on 8 July (figure 519).
Activity during August 2022. The eruption continued in the Halema’uma’u crater at the western vent. According to HVO the lava in the active lake remained at the level of the bounding levees. Occasional minor ooze-outs were observed along the margins of the crater floor. Strong nighttime crater incandescence was visible after midnight on 6 August over the western vent cone. During 6-7 August scattered small lava lobes were active along the crater floor and incandescence persisted above the western vent through 9 August. During 7-9 August HVO reported a single lava effusion source was active along the NW margin of the crater floor. Measurements from an overflight on 4 August indicated that the crater floor was infilled about 136 m total and that 102 million cubic meters of lava had been erupted since the start of the eruption. Lava breakouts were reported along the N, NE, E, S, and W margins of the crater during 10-16 August. Another overflight survey conducted on 16 August indicated that the crater floor infilled about 137 m and 104 million cubic meters of lava had been erupted since September 2021. Measured sulfur dioxide emissions rates ranged 1,150-2,450 t/d, the higher of which occurred on 8 August.
Activity during September 2022. During September, lava effusion continued from the western vent into the active lava lake and onto the crater floor. Intermittent minor ooze-outs were reported through the month. A small ooze-out was visible on the W crater floor margin at 0220 on 2 September, which showed decreasing surface activity throughout the day, but remained active through 3 September. On 3 September around 1900 a lava outbreak occurred along the NW margin of the crater floor but had stopped by the evening of 4 September. Field crews monitoring the summit lava lake on 9 September observed spattering on the NE margin of the lake that rose no higher than 10 m, before falling back onto the lava lake crust (figure 521). Overflight measurements on 12 September indicated that the crater floor was infilled a total of 143 m and 111 million cubic meters of lava had been erupted since September 2021. Extensive breakouts in the W and N part of the crater floor were reported at 1600 on 20 September and continued into 26 September. The active part of the lava lake dropped by 10 m while other parts of the crater floor dropped by several meters. Summit tiltmeters recorded a summit seismic swarm of more than 80 earthquakes during 1500-1800 on 21 September, which occurred about 1.5 km below Halema’uma’u; a majority of these were less than Mw 2. By 22 September the active part of the lava lake was infilled about 2 m. On 23 September the western vent areas exhibited several small spatter cones with incandescent openings, along with weak, sporadic spattering (figure 522). The sulfur dioxide emission rate ranged from 930 t/d to 2,000 t/d, the higher of which was measured on 6 September.
Activity during October 2022. Activity during October declined slightly compared to previous months, though lava effusions persisted from the western vent into the active lava lake and onto the crater floor during October (figure 523). Slight variations in the lava lake were noted throughout the month. HVO reported that around 0600 on 3 October the level of the lava lake has lowered slightly. Overflight measurements taken on 5 October indicated that the crater floor was infilled a total of about 143 m and that 111 million cubic meters of lava had been effused since September 2021. During 6-7 October the lake gradually rose 0.5 m. Sulfur dioxide measurements made on 22 October had an emission rate of 700 t/d. Another overflight taken on 28 October showed that there was little to no change in the elevation of the crater floor: the crater floor was infilled a total of 143 m and 111 million cubic meters of lava had erupted since the start of the eruption.
Activity during November 2022. Activity remained low during November, though HVO reported that lava from the western vent continued to effuse into the active lava lake and onto the crater floor throughout the month. The rate of sulfur dioxide emissions during November ranged from 300-600 t/d, the higher amount of which occurred on 9 November.
Activity during December 2022. Similar low activity was reported during December, with lava effusing from the western vent into the active lava lake and onto the crater floor. During 4-5 December the active part of the lava lake was slightly variable in elevation and fluctuated within 1 m. On 9 December HVO reported that lava was no longer erupting from the western vent in the Halema’uma’u crater and that sulfur dioxide emissions had returned to near pre-eruption background levels; during 10-11 December, the lava lake had completely crusted over, and no incandescence was visible (figure 524). Time lapse camera images covering the 4-10 December showed that the crater floor showed weak deflation and no inflation. Some passive events of crustal overturning were reported during 14-15 December, which brought fresh incandescent lava to the lake surface. The sulfur dioxide emission rate was approximately 200 t/d on 14 December. A smaller overturn event on 17 December and another that occurred around 0000 and into the morning of 20 December were also detected. A small seismic swarm was later detected on 30 December.
Geologic Background. Kilauea overlaps the E flank of the massive Mauna Loa shield volcano in the island of Hawaii. Eruptions are prominent in Polynesian legends; written documentation since 1820 records frequent summit and flank lava flow eruptions interspersed with periods of long-term lava lake activity at Halemaumau crater in the summit caldera until 1924. The 3 x 5 km caldera was formed in several stages about 1,500 years ago and during the 18th century; eruptions have also originated from the lengthy East and Southwest rift zones, which extend to the ocean in both directions. About 90% of the surface of the basaltic shield volcano is formed of lava flows less than about 1,100 years old; 70% of the surface is younger than 600 years. The long-term eruption from the East rift zone between 1983 and 2018 produced lava flows covering more than 100 km2, destroyed hundreds of houses, and added new coastline.
Information Contacts: Hawaiian Volcano Observatory (HVO), U.S. Geological Survey, PO Box 51, Hawai'i National Park, HI 96718, USA (URL: http://hvo.wr.usgs.gov/).
Nyamulagira (DR Congo) — November 2023 Cite this Report
Nyamulagira
DR Congo
1.408°S, 29.2°E; summit elev. 3058 m
All times are local (unless otherwise noted)
Lava flows and thermal activity during May-October 2023
Nyamulagira (also known as Nyamuragira) is a shield volcano in the Democratic Republic of Congo with the summit truncated by a small 2 x 2.3 km caldera with walls up to about 100 m high. Documented eruptions have occurred within the summit caldera, as well as from numerous flank fissures and cinder cones. The current eruption period began in April 2018 and has more recently been characterized by summit crater lava flows and thermal activity (BGVN 48:05). This report describes lava flows and variable thermal activity during May through October 2023, based on information from the Observatoire Volcanologique de Goma (OVG) and various satellite data.
Lava lake activity continued during May. The MIROVA (Middle InfraRed Observation of Volcanic Activity) system recorded moderate-to-strong thermal activity throughout the reporting period; activity was more intense during May and October and relatively weaker from June through September (figure 95). The MODVOLC thermal algorithm, detected a total of 209 thermal alerts. There were 143 hotspots detected during May, eight during June, nine during September, and 49 during October. This activity was also reflected in infrared satellite images, where a lava flow was visible in the NW part of the crater on 7 May and strong activity was seen in the center of the crater on 4 October (figure 96). Another infrared satellite image taken on 12 May showed still active lava flows along the NW margin of the crater. According to OVG lava effusions were active during 7-29 May and moved to the N and NW parts of the crater beginning on 9 May. Strong summit crater incandescence was visible from Goma (27 km S) during the nights of 17, 19, and 20 May (figure 97). On 17 May there was an increase in eruptive activity, which peaked at 0100 on 20 May. Notable sulfur dioxide plumes drifted NW and W during 19-20 May (figure 98). Drone footage acquired in partnership with the USGS (United States Geological Survey) on 20 May captured images of narrow lava flows that traveled about 100 m down the W flank (figure 99). Data from the Rumangabo seismic station indicated a decreasing trend in activity during 17-21 May. Although weather clouds prevented clear views of the summit, a strong thermal signature on the NW flank was visible in an infrared satellite image on 22 May, based on an infrared satellite image. On 28 May the lava flows on the upper W flank began to cool and solidify. By 29 May seismicity returned to levels similar to those recorded before the 17 May increase. Lava effusion continued but was confined to the summit crater; periodic crater incandescence was observed.
Low-level activity was noted during June through October. On 1 June OVG reported that seismicity remained at lower levels and that crater incandescence had been absent for three days, though infrared satellite imagery showed continued lava effusion in the summit crater. The lava flows on the flanks covered an estimated 0.6 km2. Satellite imagery continued to show thermal activity confined to the lava lake through October (figure 96), although no lava flows or significant sulfur dioxide emissions were reported.
Geologic Background. Africa's most active volcano, Nyamulagira (also known as Nyamuragira), is a massive high-potassium basaltic shield about 25 km N of Lake Kivu and 13 km NNW of the steep-sided Nyiragongo volcano. The summit is truncated by a small 2 x 2.3 km caldera that has walls up to about 100 m high. Documented eruptions have occurred within the summit caldera, as well as from the numerous flank fissures and cinder cones. A lava lake in the summit crater, active since at least 1921, drained in 1938, at the time of a major flank eruption. Recent lava flows extend down the flanks more than 30 km from the summit as far as Lake Kivu; extensive lava flows from this volcano have covered 1,500 km2 of the western branch of the East African Rift.
Information Contacts: Observatoire Volcanologique de Goma (OVG), Departement de Geophysique, Centre de Recherche en Sciences Naturelles, Lwiro, D.S. Bukavu, DR Congo; Hawai'i Institute of Geophysics and Planetology (HIGP) - MODVOLC Thermal Alerts System, School of Ocean and Earth Science and Technology (SOEST), Univ. of Hawai'i, 2525 Correa Road, Honolulu, HI 96822, USA (URL: http://modis.higp.hawaii.edu/); MIROVA (Middle InfraRed Observation of Volcanic Activity), a collaborative project between the Universities of Turin and Florence (Italy) supported by the Centre for Volcanic Risk of the Italian Civil Protection Department (URL: http://www.mirovaweb.it/); NASA Global Sulfur Dioxide Monitoring Page, Atmospheric Chemistry and Dynamics Laboratory, NASA Goddard Space Flight Center (NASA/GSFC), 8800 Greenbelt Road, Goddard, Maryland, USA (URL: https://so2.gsfc.nasa.gov/); Copernicus Browser, Copernicus Data Space Ecosystem, European Space Agency (URL: https://dataspace.copernicus.eu/browser/); Charles Balagizi, Goma Volcano Observatory, Departement de Geophysique, Centre de Recherche en Sciences Naturelles, Lwiro, D.S. Bukavu, DR Congo.
Bagana (Papua New Guinea) — October 2023 Cite this Report
Bagana
Papua New Guinea
6.137°S, 155.196°E; summit elev. 1855 m
All times are local (unless otherwise noted)
Explosions, ash plumes, ashfall, and lava flows during April-September 2023
The remote volcano of Bagana is located in central Bougainville Island, Papua New Guinea. Recorded eruptions date back to 1842 and activity has consisted of effusive activity that has built a small lava dome in the summit crater and occasional explosions that produced pyroclastic flows. The most recent eruption has been ongoing since February 2000 and has produced occasional explosions, ash plumes, and lava flows. More recently, activity has been characterized by ongoing effusive activity and ash emissions (BGVN 48:04). This report updates activity from April through September 2023 that has consisted of explosions, ash plumes, ashfall, and lava flows, using information from the Darwin Volcanic Ash Advisory Center (VAAC) and satellite data.
An explosive eruption was reported on 7 July that generated a large gas-and-ash plume to high altitudes and caused significant ashfall in local communities; the eruption plume had reached upper tropospheric (16-18 km altitude) altitudes by 2200, according to satellite images. Sulfur dioxide plumes were detected in satellite images on 8 July and indicated that the plume was likely a mixture of gas, ice, and ash. A report issued by the Autonomous Bougainville Government (ABG) (Torokina District, Education Section) on 10 July noted that significant ash began falling during 2000-2100 on 7 July and covered most areas in the Vuakovi, Gotana (9 km SW), Koromaketo, Laruma (25 km W) and Atsilima (27 km NW) villages. Pyroclastic flows also occurred, according to ground-based reports; small deposits confined to one drainage were inspected by RVO during an overflight on 17 July and were confirmed to be from the 7 July event. Ashfall continued until 10 July and covered vegetation, which destroyed bushes and gardens and contaminated rivers and streams.
RVO reported another eruption on 14 July. The Darwin VAAC stated that an explosive event started around 0830 on 15 July and produced an ash plume that rose to 16.5 km altitude by 1000 and drifted N, according to satellite images. The plume continued to drift N and remained visible through 1900, and by 2150 it had dissipated.
Ashfall likely from both the 7 and 15 July events impacted about 8,111 people in Torokina (20 km SW), including Tsito/Vuakovi, Gotana, Koromaketo, Kenaia, Longkogari, Kenbaki, Piva (13 km SW), and Atsinima, and in the Tsitovi district, according to ABG. Significant ashfall was also reported in Ruruvu (22 km N) in the Wakunai District of Central Bougainville, though the thickness of these deposits could not be confirmed. An evacuation was called for the villages in Wakunai, where heavy ashfall had contaminated water sources; the communities of Ruruvu, Togarau, Kakarapaia, Karauturi, Atao, and Kuritaturi were asked to evacuate to a disaster center at the Wakunai District Station, and communities in Torokina were asked to evacuate to the Piva District station. According to a news article, more than 7,000 people needed temporary accommodations, with about 1,000 people in evacuation shelters. Ashfall had deposited over a broad area, contaminating water supplies, affecting crops, and collapsing some roofs and houses in rural areas. Schools were temporarily shut down. Intermittent ash emissions continued through the end of July and drifted NNW, NW, and SW. Fine ashfall was reported on the coast of Torokina, and ash plumes also drifted toward Laruma and Atsilima.
A small explosive eruption occurred at 2130 on 28 July that ejected material from the crater vents, according to reports from Torokina, in addition to a lava flow that contained two lobes. A second explosion was detected at 2157. Incandescence from the lava flow was visible from Piva as it descended the W flank around 2000 on 29 July (figure 47). The Darwin VAAC reported that a strong thermal anomaly was visible in satellite images during 30-31 July and that ash emissions rose to 2.4 km altitude and drifted WSW on 30 July. A ground report from RVO described localized emissions at 0900 on 31 July.
The Darwin VAAC reported that ash plumes were identified in satellite imagery at 0800 and 1220 on 12 August and rose to 2.1 km and 3 km altitude and drifted NW and W, respectively. A news report stated that aid was sent to more than 6,300 people that were adversely affected by the eruption. Photos taken during 17-19 August showed ash emissions rising no higher than 1 km above the summit and drifting SE. A small explosion generated an ash plume during the morning of 19 August. Deposits from small pyroclastic flows were also captured in the photos. Satellite images captured lava flows and pyroclastic flow deposits. Two temporary seismic stations were installed near Bagana on 17 August at distances of 7 km WSW (Vakovi station) and 11 km SW (Kepox station). The Kepox station immediately started to record continuous, low-frequency background seismicity.
Satellite data. Little to no thermal activity was detected during April through mid-July 2023; only one anomaly was recorded during early April and one during early June, according to MIROVA (Middle InfraRed Observation of Volcanic Activity) data (figure 48). Thermal activity increased in both power and frequency during mid-July through September, although there were still some short gaps in detected activity. MODVOLC also detected increased thermal activity during August; thermal hotspots were detected a total of five times on 19, 20, and 27 August. Weak thermal anomalies were also captured in infrared satellite images on clear weather days throughout the reporting period on 7, 12, and 17 April, 27 May, 1, 6, 16, and 31 July, and 19 September (figure 48); a strong thermal anomaly was visible on 31 July. Distinct sulfur dioxide plumes that drifted generally NW were intermittently captured by the TROPOMI instrument on the Sentinel-5P satellite and sometimes exceeded two Dobson Units (DUs) (figure 49).
Geologic Background. Bagana volcano, in a remote portion of central Bougainville Island, is frequently active. This massive symmetrical cone was largely constructed by an accumulation of viscous andesitic lava flows. The entire edifice could have been constructed in about 300 years at its present rate of lava production. Eruptive activity is characterized by non-explosive effusion of viscous lava that maintains a small lava dome in the summit crater, although occasional explosive activity produces pyroclastic flows. Lava flows with tongue-shaped lobes up to 50 m thick and prominent levees descend the flanks on all sides.
Information Contacts: Rabaul Volcano Observatory (RVO), Geohazards Management Division, Department of Mineral Policy and Geohazards Management (DMPGM), PO Box 3386, Kokopo, East New Britain Province, Papua New Guinea; Darwin Volcanic Ash Advisory Centre (VAAC), Bureau of Meteorology, Northern Territory Regional Office, PO Box 40050, Casuarina, NT 0811, Australia (URL: http://www.bom.gov.au/info/vaac/); MIROVA (Middle InfraRed Observation of Volcanic Activity), a collaborative project between the Universities of Turin and Florence (Italy) supported by the Centre for Volcanic Risk of the Italian Civil Protection Department (URL: http://www.mirovaweb.it/); Hawai'i Institute of Geophysics and Planetology (HIGP) - MODVOLC Thermal Alerts System, School of Ocean and Earth Science and Technology (SOEST), Univ. of Hawai'i, 2525 Correa Road, Honolulu, HI 96822, USA (URL: http://modis.higp.hawaii.edu/); NASA Global Sulfur Dioxide Monitoring Page, Atmospheric Chemistry and Dynamics Laboratory, NASA Goddard Space Flight Center (NASA/GSFC), 8800 Greenbelt Road, Goddard, Maryland, USA (URL: https://so2.gsfc.nasa.gov/); Copernicus Browser, Copernicus Data Space Ecosystem, European Space Agency (URL: https://dataspace.copernicus.eu/browser/); Autonomous Bougainville Government, P.O Box 322, Buka, AROB, PNG (URL: https://abg.gov.pg/); Andrew Tupper (Twitter: @andrewcraigtupp); Simon Carn, Geological and Mining Engineering and Sciences, Michigan Technological University, 1400 Townsend Drive, Houghton, MI 49931, USA (URL: http://www.volcarno.com/, Twitter: @simoncarn); Radio NZ (URL: https://www.rnz.co.nz/news/pacific/494464/more-than-7-000-people-in-bougainville-need-temporary-accommodation-after-eruption); USAID, 1300 Pennsylvania Ave, NW, Washington DC 20004, USA (URL: https://www.usaid.gov/pacific-islands/press-releases/aug-08-2023-united-states-provides-immediate-emergency-assistance-support-communities-affected-mount-bagana-volcanic-eruptions).
Mayon (Philippines) — October 2023 Cite this Report
Mayon
Philippines
13.257°N, 123.685°E; summit elev. 2462 m
All times are local (unless otherwise noted)
Lava flows, pyroclastic flows, ash emissions, and seismicity during April-September 2023
Mayon is located in the Philippines and has steep upper slopes capped by a small summit crater. Historical eruptions date back to 1616 CE that have been characterized by Strombolian eruptions, lava flows, pyroclastic flows, and mudflows. Eruptions mostly originated from a central conduit. Pyroclastic flows and mudflows have commonly descended many of the approximately 40 drainages that surround the volcano. The most recent eruption occurred during June through October 2022 and consisted of lava dome growth and gas-and-steam emissions (BGVN 47:12). A new eruption was reported during late April 2023 and has included lava flows, pyroclastic density currents, ash emissions, and seismicity. This report covers activity during April through September 2023 based on daily bulletins from the Philippine Institute of Volcanology and Seismology (PHIVOLCS).
During April through September 2023, PHIVOLCS reported near-daily rockfall events, frequent volcanic earthquakes, and sulfur dioxide measurements. Gas-and-steam emissions rose 100-900 m above the crater and drifted in different directions. Nighttime crater incandescence was often visible during clear weather and was accompanied by incandescent avalanches of material. Activity notably increased during June when lava flows were reported on the S, SE, and E flanks (figure 52). The MIROVA graph (Middle InfraRed Observation of Volcanic Activity) showed strong thermal activity coincident with these lava flows, which remained active through September (figure 53). According to the MODVOLC thermal algorithm, a total of 110 thermal alerts were detected during the reporting period: 17 during June, 40 during July, 27 during August, and 26 during September. During early June, pyroclastic density currents (PDCs) started to occur more frequently.
Low activity was reported during much of April and May; gas-and-steam emissions rose 100-900 m above the crater and generally drifted in different directions. A total of 52 rockfall events and 18 volcanic earthquakes were detected during April and 147 rockfall events and 13 volcanic events during May. Sulfur dioxide flux measurements ranged between 400-576 tons per day (t/d) during April, the latter of which was measured on 29 April and between 162-343 t/d during May, the latter of which was measured on 13 May.
Activity during June increased, characterized by lava flows, pyroclastic density currents (PDCs), crater incandescence and incandescent rockfall events, gas-and-steam emissions, and continued seismicity. Weather clouds often prevented clear views of the summit, but during clear days, moderate gas-and-steam emissions rose 100-2,500 m above the crater and drifted in multiple directions. A total of 6,237 rockfall events and 288 volcanic earthquakes were detected. The rockfall events often deposited material on the S and SE flanks within 700-1,500 m of the summit crater and ash from the events drifted SW, S, SE, NE, and E. Sulfur dioxide emissions ranged between 149-1,205 t/d, the latter of which was measured on 10 June. Short-term observations from EDM and electronic tiltmeter monitoring indicated that the upper slopes were inflating since February 2023. Longer-term ground deformation parameters based on EDM, precise leveling, continuous GPS, and electronic tilt monitoring indicated that the volcano remained inflated, especially on the NW and SE flanks. At 1000 on 5 June the Volcano Alert Level (VAL) was raised to 2 (on a 0-5 scale). PHIVOLCS noted that although low-level volcanic earthquakes, ground deformation, and volcanic gas emissions indicated unrest, the steep increase in rockfall frequency may indicate increased dome activity.
A total of 151 dome-collapse PDCs occurred during 8-9 and 11-30 June, traveled 500-2,000 m, and deposited material on the S flank within 2 km of the summit crater. During 8-9 June the VAL was raised to 3. At approximately 1947 on 11 June lava flow activity was reported; two lobes traveled within 500 m from the crater and deposited material on the S (Mi-isi), SE (Bonga), and E (Basud) flanks. Weak seismicity accompanied the lava flow and slight inflation on the upper flanks. This lava flow remained active through 30 June, moving down the S and SE flank as far as 2.5 km and 1.8 km, respectively and depositing material up to 3.3 km from the crater. During 15-16 June traces of ashfall from the PDCs were reported in Sitio Buga, Nabonton, City of Ligao and Purok, and San Francisco, Municipality of Guinobatan. During 28-29 June there were two PDCs generated by the collapse of the lava flow front, which generated a light-brown ash plume 1 km high. Satellite monitors detected significant concentrations of sulfur dioxide beginning on 29 June. On 30 June PDCs primarily affected the Basud Gully on the E flank, the largest of which occurred at 1301 and lasted eight minutes, based on the seismic record. Four PDCs generated between 1800 and 2000 that lasted approximately four minutes each traveled 3-4 km on the E flank and generated an ash plume that rose 1 km above the crater and drifted N and NW. Ashfall was recorded in Tabaco City.
Similar strong activity continued during July; slow lava effusion remained active on the S and SE flanks and traveled as far as 2.8 km and 2.8 km, respectively and material was deposited as far as 4 km from the crater. There was a total of 6,983 rockfall events and 189 PDCs that affected the S, SE, and E flanks. The volcano network detected a total of 2,124 volcanic earthquakes. Continuous gas-and-steam emissions rose 200-2,000 m above the crater and drifted in multiple directions. Sulfur dioxide emissions averaged 792-4,113 t/d, the latter of which was measured on 28 July. During 2-4 July three PDCs were generated from the collapse of the lava flow and resulting light brown plumes rose 200-300 m above the crater. Continuous tremor pulses were reported beginning at 1547 on 3 July through 7 July at 1200, at 2300 on 8 July and going through 0300 on 10 July, and at 2300 on 16 July, as recorded by the seismic network. During 6-9 July there were 10 lava flow-collapse-related PDCs that generated light brown plumes 300-500 m above the crater. During 10-11 July light ashfall was reported in some areas of Mabinit, Legazpi City, Budiao and Salvacion, Daraga, and Camalig, Albay. By 18 July the lava flow advanced 600 m on the E flank as well.
During 1733 on 18 July and 0434 on 19 July PHIVOLCS reported 30 “ashing” events, which are degassing events accompanied by audible thunder-like sounds and entrained ash at the crater, which produced short, dark plumes that drifted SW. These events each lasted 20-40 seconds, and plume heights ranged from 150-300 m above the crater, as recorded by seismic, infrasound, visual, and thermal monitors. Three more ashing events occurred during 19-20 July. Short-term observations from electronic tilt and GPS monitoring indicate deflation on the E lower flanks in early July and inflation on the NW middle flanks during the third week of July. Longer-term ground deformation parameters from EDM, precise leveling, continuous GPS, and electronic tilt monitoring indicated that the volcano was still generally inflated relative to baseline levels. A short-lived lava pulse lasted 28 seconds at 1956 on 21 July, which was accompanied by seismic and infrasound signals. By 22 July, the only lava flow that remained active was on the SE flank, and continued to extend 3.4 km, while those on the S and E flanks weakened markedly. One ashing event was detected during 30-31 July, whereas there were 57 detected during 31 July-1 August; according to PHIVOLCS beginning at approximately 1800 on 31 July eruptive activity was dominated by phases of intermittent ashing, as well as increased in the apparent rates of lava effusion from the summit crater. The ashing phases consisted of discrete events recorded as low-frequency volcanic earthquakes (LFVQ) typically 30 seconds in duration, based on seismic and infrasound signals. Gray ash plume rose 100 m above the crater and generally drifted NE. Shortly after these ashing events began, new lava began to effuse rapidly from the crater, feeding the established flowed on the SE, E, and E flanks and generating frequent rockfall events.
Intensified unrest persisted during August. There was a total of 4,141 rockfall events, 2,881 volcanic earthquakes, which included volcanic tremor events, 32 ashing events, and 101 PDCs detected throughout the month. On clear weather days, gas-and-steam emissions rose 300-1,500 m above the crater and drifted in different directions (figure 54). Sulfur dioxide emissions averaged 735-4,756 t/d, the higher value of which was measured on 16 August. During 1-2 August the rate of lava effusion decreased, but continued to feed the flows on the SE, S, and E flanks, maintaining their advances to 3.4 km, 2.8 km, and 1.1 km from the crater, respectively (figure 55). Rockfall and PDCs generated by collapses at the lava flow margins and from the summit dome deposited material within 4 km of the crater. During 3-4 August there were 10 tremor events detected that lasted 1-4 minutes. Short-lived lava pulse lasted 35 seconds and was accompanied by seismic and infrasound signals at 0442 on 6 August. Seven collapses were recorded at the front of the lava flow during 12-14 August.
During September, similar activity of slow lava effusion, PDCs, gas-and-steam emissions, and seismicity continued. There was a total of 4,452 rockfall events, 329 volcanic earthquakes, which included volcanic tremor events, two ashing events, and 85 PDCs recorded throughout the month. On clear weather days, gas-and-steam emissions rose 100-1,500 m above the crater and drifted in multiple directions. Sulfur dioxide emissions averaged 609-2,252 t/d, the higher average of which was measured on 6 September. Slow lava effusion continued advancing on the SE, S, and E flanks, maintaining lengths of 3.4 km, 2.8 km, and 1.1 km, respectively. Rockfall and PDC events generated by collapses along the lava flow margins and at the summit dome deposited material within 4 km of the crater.
Geologic Background. Symmetrical Mayon, which rises above the Albay Gulf NW of Legazpi City, is the most active volcano of the Philippines. The steep upper slopes are capped by a small summit crater. Recorded eruptions since 1616 CE range from Strombolian to basaltic Plinian, with cyclical activity beginning with basaltic eruptions, followed by longer periods of andesitic lava flows. Eruptions occur predominately from the central conduit and have also produced lava flows that travel far down the flanks. Pyroclastic density currents and mudflows have commonly swept down many of the approximately 40 ravines that radiate from the summit and have often damaged populated lowland areas. A violent eruption in 1814 killed more than 1,200 people and devastated several towns.
Information Contacts: Philippine Institute of Volcanology and Seismology (PHIVOLCS), Department of Science and Technology, University of the Philippines Campus, Diliman, Quezon City, Philippines (URL: http://www.phivolcs.dost.gov.ph/); MIROVA (Middle InfraRed Observation of Volcanic Activity), a collaborative project between the Universities of Turin and Florence (Italy) supported by the Centre for Volcanic Risk of the Italian Civil Protection Department (URL: http://www.mirovaweb.it/); Hawai'i Institute of Geophysics and Planetology (HIGP) - MODVOLC Thermal Alerts System, School of Ocean and Earth Science and Technology (SOEST), Univ. of Hawai'i, 2525 Correa Road, Honolulu, HI 96822, USA (URL: http://modis.higp.hawaii.edu/); Copernicus Browser, Copernicus Data Space Ecosystem, European Space Agency (URL: https://dataspace.copernicus.eu/browser/); William Rogers, Legazpi City, Albay Province, Philippines.
Nishinoshima (Japan) — October 2023 Cite this Report
Nishinoshima
Japan
27.247°N, 140.874°E; summit elev. 100 m
All times are local (unless otherwise noted)
Eruption plumes and gas-and-steam plumes during May-August 2023
Nishinoshima, located about 1,000 km S of Tokyo, is a small island in the Ogasawara Arc in Japan. The island is the summit of a massive submarine volcano that has prominent submarine peaks to the S, W, and NE. Eruptions date back to 1973 and the current eruption period began in October 2022. Recent activity has consisted of small ash plumes and fumarolic activity (BGVN 48:07). This report covers activity during May through August 2023, using information from monthly reports of the Japan Meteorological Agency (JMA) monthly reports and satellite data.
Activity during May through June was relatively low. The Japan Coast Guard (JCG) did overflights on 14 and 22 June and reported white gas-and-steam emissions rising 600 m and 1,200 m from the central crater of the pyroclastic cone, respectively (figure 125). In addition, multiple white gas-and-steam emissions rose from the inner rim of the W side of the crater and from the SE flank of the pyroclastic cone. Discolored brown-to-green water was observed around almost the entire perimeter of the island; on 22 June light green discolored water was observed off the S coast of the island.
Observations from the Himawari meteorological satellite confirmed an eruption on 9 and 10 July. An eruption plume rose 1.6 km above the crater and drifted N around 1300 on 9 July. Satellite images acquired at 1420 and 2020 on 9 July and at 0220 on 10 July showed continuing emissions that rose 1.3-1.6 km above the crater and drifted NE and N. The Tokyo VAAC reported that an ash plume seen by a pilot and identified in a satellite image at 0630 on 21 July rose to 3 km altitude and drifted S.
Aerial observations conducted by JCG on 8 August showed a white-and-gray plume rising from the central crater of the pyroclastic cone, and multiple white gas-and-steam emissions were rising from the inner edge of the western crater and along the NW-SE flanks of the island (figure 126). Brown-to-green discolored water was also noted around the perimeter of the island.
Intermittent low-to-moderate power thermal anomalies were recorded in the MIROVA graph (Middle InfraRed Observation of Volcanic Activity), showing an increase in both frequency and power beginning in July (figure 127). This increase in activity coincides with eruptive activity on 9 and 10 July, characterized by eruption plumes. According to the MODVOLC thermal alert algorithm, one thermal hotspot was recorded on 20 July. Weak thermal anomalies were also detected in infrared satellite imagery, accompanied by strong gas-and-steam plumes (figure 128).
Geologic Background. The small island of Nishinoshima was enlarged when several new islands coalesced during an eruption in 1973-74. Multiple eruptions that began in 2013 completely covered the previous exposed surface and continued to enlarge the island. The island is the summit of a massive submarine volcano that has prominent peaks to the S, W, and NE. The summit of the southern cone rises to within 214 m of the ocean surface 9 km SSE.
Information Contacts: Japan Meteorological Agency (JMA), 1-3-4 Otemachi, Chiyoda-ku, Tokyo 100-8122, Japan (URL: http://www.jma.go.jp/jma/indexe.html); Tokyo Volcanic Ash Advisory Center (VAAC), 1-3-4 Otemachi, Chiyoda-ku, Tokyo 100-8122, Japan (URL: http://ds.data.jma.go.jp/svd/vaac/data/); MIROVA (Middle InfraRed Observation of Volcanic Activity), a collaborative project between the Universities of Turin and Florence (Italy) supported by the Centre for Volcanic Risk of the Italian Civil Protection Department (URL: http://www.mirovaweb.it/); Copernicus Browser, Copernicus Data Space Ecosystem, European Space Agency (URL: https://dataspace.copernicus.eu/browser/).
Krakatau (Indonesia) — October 2023 Cite this Report
Krakatau
Indonesia
6.1009°S, 105.4233°E; summit elev. 285 m
All times are local (unless otherwise noted)
White gas-and-steam plumes and occasional ash plumes during May-August 2023
Krakatau is located in the Sunda Strait between Java and Sumatra, Indonesia. Caldera collapse during the catastrophic 1883 eruption destroyed Danan and Perbuwatan cones and left only a remnant of Rakata. The post-collapse cone of Anak Krakatau (Child of Krakatau) was constructed within the 1883 caldera at a point between the former Danan and Perbuwatan cones; it has been the site of frequent eruptions since 1927. The current eruption period began in May 2021 and has recently consisted of Strombolian eruptions and ash plumes (BGVN 48:07). This report describes lower levels of activity consisting of ash and white gas-and-steam plumes during May through August 2023, based on information provided by the Indonesian Center for Volcanology and Geological Hazard Mitigation, referred to as Pusat Vulkanologi dan Mitigasi Bencana Geologi (PVMBG), MAGMA Indonesia, and satellite data.
Activity was relatively low during May and June. Daily white gas-and-steam emissions rose 25-200 m above the crater and drifted in different directions. Five ash plumes were detected at 0519 on 10 May, 1241 on 11 May, 0920 on 12 May, 2320 on 12 May, and at 0710 on 13 May, and rose 1-2.5 km above the crater and drifted SW. A webcam image taken on 12 May showed ejection of incandescent material above the vent. A total of nine ash plumes were detected during 6-11 June: at 1434 and 00220 on 6 and 7 June the ash plumes rose 500 m above the crater and drifted NW, at 1537 on 8 June the ash plume rose 1 km above the crater and drifted SW, at 0746 and at 0846 on 9 June the ash plumes rose 800 m and 3 km above the crater and drifted SW, respectively, at 0423, 1431, and 1750 on 10 June the ash plumes rose 2 km, 1.5 km, and 3.5 km above the crater and drifted NW, respectively, and at 0030 on 11 June an ash plume rose 2 km above the crater and drifted NW. Webcam images taken on 10 and 11 June at 0455 and 0102, respectively, showed incandescent material ejected above the vent. On 19 June an ash plume at 0822 rose 1.5 km above the crater and drifted SE.
Similar low activity of white gas-and-steam emissions and few ash plumes were reported during July and August. Daily white gas-and-steam emissions rose 25-300 m above the crater and drifted in multiple directions. Three ash plumes were reported at 0843, 0851, and 0852 on 20 July that rose 500-2,000 m above the crater and drifted NW.
The MIROVA (Middle InfraRed Observation of Volcanic Activity) graph of MODIS thermal anomaly data showed intermittent low-to-moderate power thermal anomalies during May through August 2023 (figure 140). Although activity was often obscured by weather clouds, a thermal anomaly was visible in an infrared satellite image of the crater on 12 May, accompanied by an eruption plume that drifted SW (figure 141).
Geologic Background. The renowned Krakatau (frequently mis-named as Krakatoa) volcano lies in the Sunda Strait between Java and Sumatra. Collapse of an older edifice, perhaps in 416 or 535 CE, formed a 7-km-wide caldera. Remnants of that volcano are preserved in Verlaten and Lang Islands; subsequently the Rakata, Danan, and Perbuwatan cones were formed, coalescing to create the pre-1883 Krakatau Island. Caldera collapse during the catastrophic 1883 eruption destroyed Danan and Perbuwatan, and left only a remnant of Rakata. This eruption caused more than 36,000 fatalities, most as a result of tsunamis that swept the adjacent coastlines of Sumatra and Java. Pyroclastic surges traveled 40 km across the Sunda Strait and reached the Sumatra coast. After a quiescence of less than a half century, the post-collapse cone of Anak Krakatau (Child of Krakatau) was constructed within the 1883 caldera at a point between the former Danan and Perbuwatan cones. Anak Krakatau has been the site of frequent eruptions since 1927.
Information Contacts: Pusat Vulkanologi dan Mitigasi Bencana Geologi (PVMBG, also known as Indonesian Center for Volcanology and Geological Hazard Mitigation, CVGHM), Jalan Diponegoro 57, Bandung 40122, Indonesia (URL: http://www.vsi.esdm.go.id/); MAGMA Indonesia, Kementerian Energi dan Sumber Daya Mineral (URL: https://magma.esdm.go.id/v1); MIROVA (Middle InfraRed Observation of Volcanic Activity), a collaborative project between the Universities of Turin and Florence (Italy) supported by the Centre for Volcanic Risk of the Italian Civil Protection Department (URL: http://www.mirovaweb.it/); Copernicus Browser, Copernicus Data Space Ecosystem, European Space Agency (URL: https://dataspace.copernicus.eu/browser/).
Villarrica (Chile) — October 2023 Cite this Report
Villarrica
Chile
39.42°S, 71.93°W; summit elev. 2847 m
All times are local (unless otherwise noted)
Strombolian activity, gas-and-ash emissions, and crater incandescence during April-September 2023
Villarrica, in central Chile, consists of a 2-km-wide caldera that formed about 3,500 years ago and is located at the base of the presently active cone at the NW margin of a 6-km-wide caldera. Historical eruptions eruptions date back to 1558 and have been characterized by mild-to-moderate explosive activity with occasional lava effusions. The current eruption period began in December 2014 and has recently consisted of nighttime crater incandescence, ash emissions, and seismicity (BGVN 48:04). This report covers activity during April through September 2023 and describes occasional Strombolian activity, gas-and-ash emissions, and nighttime crater incandescence. Information for this report primarily comes from the Southern Andes Volcano Observatory (Observatorio Volcanológico de Los Andes del Sur, OVDAS), part of Chile's National Service of Geology and Mining (Servicio Nacional de Geología y Minería, SERNAGEOMIN) and satellite data.
Seismicity during April consisted of long period (LP) events and tremor (TRE); a total of 9,413 LP-type events and 759 TR-type events were detected throughout the month. Nighttime crater incandescence persisted and was visible in the degassing column. Sulfur dioxide data was obtained using Differential Absorption Optical Spectroscopy Equipment (DOAS) that showed an average value of 1,450 ± 198 tons per day (t/d) during 1-15 April and 1,129 ± 201 t/d during 16-30 April, with a maximum daily value of 2,784 t/d on 9 April. Gas-and-steam emissions of variable intensities rose above the active crater as high as 1.3 km above the crater on 13 April. Strombolian explosions were not observed and there was a slight decrease in the lava lake level.
There were 14,123 LP-type events and 727 TR-type events detected during May. According to sulfur dioxide measurements taken with DOAS equipment, the active crater emitted an average value of 1,826 ± 482 t/d during 1-15 May and 912 ± 41 t/d during 16-30 May, with a daily maximum value of 5,155 t/d on 13 May. Surveillance cameras showed continuous white gas-and-steam emissions that rose as high as 430 m above the crater on 27 May. Nighttime incandescence illuminated the gas column less than 300 m above the crater rim was and no pyroclastic emissions were reported. A landslide was identified on 13 May on the E flank of the volcano 50 m from the crater rim and extending 300 m away; SERNAGEOMIN noted that this event may have occurred on 12 May. During the morning of 27 and 28 May minor Strombolian explosions characterized by incandescent ejecta were recorded at the crater rim; the last reported Strombolian explosions had occurred at the end of March.
Seismic activity during June consisted of five volcano-tectonic (VT)-type events, 21,606 LP-type events, and 2,085 TR-type events. The average value of sulfur dioxide flux obtained by DOAS equipment was 1,420 ± 217 t/d during 1-15 June and 2,562 ± 804 t/d, with a maximum daily value of 4,810 t/d on 17 June. White gas-and-steam emissions rose less than 480 m above the crater; frequent nighttime crater incandescence was reflected in the degassing plume. On 12 June an emission rose 100 m above the crater and drifted NNW. On 15 June one or several emissions resulted in ashfall to the NE as far as 5.5 km from the crater, based on a Skysat satellite image. Several Strombolian explosions occurred within the crater; activity on 15 June was higher energy and ejected blocks 200-300 m on the NE slope. Surveillance cameras showed white gas-and-steam emissions rising 480 m above the crater on 16 June. On 19 and 24 June low-intensity Strombolian activity was observed, ejecting material as far as 200 m from the center of the crater to the E.
During July, seismicity included 29,319 LP-type events, 3,736 TR-type events, and two VT-type events. DOAS equipment recorded two days of sulfur dioxide emissions of 4,220 t/d and 1,009 t/d on 1 and 13 July, respectively. Constant nighttime incandescence was also recorded and was particularly noticeable when accompanied by eruptive columns on 12 and 16 July. Minor explosive events were detected in the crater. According to Skysat satellite images taken on 12, 13, and 16 July, ashfall deposits were identified 155 m S of the crater. According to POVI, incandescence was visible from two vents on the crater floor around 0336 on 12 July. Gas-and-ash emissions rose as high as 1.2 km above the crater on 13 July and drifted E and NW. A series of gas-and-steam pulses containing some ash deposited material on the upper E flank around 1551 on 13 July. During 16-31 July, average sulfur dioxide emissions of 1,679 ± 406 t/d were recorded, with a maximum daily value of 2,343 t/d on 28 July. Fine ash emissions were also reported on 16, 17, and 23 July.
Seismicity persisted during August, characterized by 27,011 LP-type events, 3,323 TR-type events, and three VT-type events. The average value of sulfur dioxide measurements taken during 1-15 August was 1,642 ± 270 t/d and 2,207 ± 4,549 t/d during 16-31 August, with a maximum daily value of 3,294 t/d on 27 August. Nighttime crater incandescence remained visible in degassing columns. White gas-and-steam emissions rose 480 m above the crater on 6 August. According to a Skysat satellite image from 6 August, ash accumulation was observed proximal to the crater and was mainly distributed toward the E slope. White gas-and-steam emissions rose 320 m above the crater on 26 August. Nighttime incandescence and Strombolian activity that generated ash emissions were reported on 27 August.
Seismicity during September was characterized by five VT-type events, 12,057 LP-type events, and 2,058 TR-type events. Nighttime incandescence persisted. On 2 September an ash emission rose 180 m above the crater and drifted SE at 1643 (figure 125) and a white gas-and-steam plume rose 320 m above the crater. According to the Buenos Aires VAAC, periods of continuous gas-and-ash emissions were visible in webcam images from 1830 on 2 September to 0110 on 3 September. Strombolian activity was observed on 2 September and during the early morning of 3 September, the latter event of which generated an ash emission that rose 60 m above the crater and drifted 100 m from the center of the crater to the NE and SW. Ashfall was reported to the SE and S as far as 750 m from the crater. The lava lake was active during 3-4 September and lava fountaining was visible for the first time since 26 March 2023, according to POVI. Fountains captured in webcam images at 2133 on 3 September and at 0054 on 4 September rose as high as 60 m above the crater rim and ejected material onto the upper W flank. Sulfur dioxide flux of 1,730 t/d and 1,281 t/d was measured on 3 and 4 September, respectively, according to data obtained by DOAS equipment.
Strong Strombolian activity and larger gas-and-ash plumes were reported during 18-20 September. On 18 September activity was also associated with energetic LP-type events and notable sulfur dioxide fluxes (as high as 4,277 t/d). On 19 September Strombolian activity and incandescence were observed. On 20 September at 0914 ash emissions rose 50 m above the crater and drifted SSE, accompanied by Strombolian activity that ejected material less than 100 m SSE, causing fall deposits on that respective flank. SERNAGEOMIN reported that a Planet Scope satellite image taken on 20 September showed the lava lake in the crater, measuring 32 m x 35 m and an area of 0.001 km2. Several ash emissions were recorded at 0841, 0910, 1251, 1306, 1312, 1315, and 1324 on 23 September and rose less than 150 m above the crater. The sulfur dioxide flux value was 698 t/d on 23 September and 1,097 t/d on 24 September. On 24 September the Volcanic Alert Level (VAL) was raised to Orange (the third level on a four-color scale). SENAPRED maintained the Alert Level at Yellow (the middle level on a three-color scale) for the communities of Villarrica, Pucón (16 km N), Curarrehue, and Panguipulli.
During 24-25 September there was an increase in seismic energy (observed at TR-events) and acoustic signals, characterized by 1 VT-type event, 213 LP-type events, and 124 TR-type events. Mainly white gas-and-steam emissions, in addition to occasional fine ash emissions were recorded. During the early morning of 25 September Strombolian explosions were reported and ejected material 250 m in all directions, though dominantly toward the NW. On 25 September the average value of sulfur dioxide flux was 760 t/d. Seismicity during 25-30 September consisted of five VT-type events, 1,937 LP-type events, and 456 TR-type events.
During 25-29 September moderate Strombolian activity was observed and ejected material as far as the crater rim. In addition, ash pulses lasting roughly 50 minutes were observed around 0700 and dispersed ENE. During 26-27 September a TR episode lasted 6.5 hours and was accompanied by discrete acoustic signals. Satellite images from 26 September showed a spatter cone on the crater floor with one vent that measured 10 x 14 m and a smaller vent about 35 m NE of the cone. SERNAGEOMIN reported an abundant number of bomb-sized blocks up to 150 m from the crater, as well as impact marks on the snow, which indicated explosive activity. A low-altitude ash emission was observed drifting NW around 1140 on 28 September, based on webcam images. Between 0620 and 0850 on 29 September an ash emission rose 60 m above the crater and drifted NW. During an overflight taken around 1000 on 29 September scientists observed molten material in the vent, a large accumulation of pyroclasts inside the crater, and energetic degassing, some of which contained a small amount of ash. Block-sized pyroclasts were deposited on the internal walls and near the crater, and a distal ash deposit was also visible. The average sulfur dioxide flux measured on 28 September was 344 t/d. Satellite images taken on 29 September ashfall was deposited roughly 3 km WNW from the crater and nighttime crater incandescence remained visible. The average sulfur dioxide flux value from 29 September was 199 t/d. On 30 September at 0740 a pulsating ash emission rose 1.1 km above the crater and drifted NNW (figure 126). Deposits on the S flank extended as far as 4.5 km from the crater rim, based on satellite images from 30 September.
Infrared MODIS satellite data processed by MIROVA (Middle InfraRed Observation of Volcanic Activity) showed intermittent thermal activity during April through September, with slightly stronger activity detected during late September (figure 127). Small clusters of thermal activity were detected during mid-June, early July, early August, and late September. According to the MODVOLC thermal alert system, a total of four thermal hotspots were detected on 7 July and 3 and 23 September. This activity was also intermittently captured in infrared satellite imagery on clear weather days (figure 128).
Geologic Background. The glacier-covered Villarrica stratovolcano, in the northern Lakes District of central Chile, is ~15 km south of the city of Pucon. A 2-km-wide caldera that formed about 3,500 years ago is located at the base of the presently active, dominantly basaltic to basaltic andesite cone at the NW margin of a 6-km-wide Pleistocene caldera. More than 30 scoria cones and fissure vents are present on the flanks. Plinian eruptions and pyroclastic flows that have extended up to 20 km from the volcano were produced during the Holocene. Lava flows up to 18 km long have issued from summit and flank vents. Eruptions documented since 1558 CE have consisted largely of mild-to-moderate explosive activity with occasional lava effusion. Glaciers cover 40 km2 of the volcano, and lahars have damaged towns on its flanks.
Information Contacts: Servicio Nacional de Geología y Minería (SERNAGEOMIN), Observatorio Volcanológico de Los Andes del Sur (OVDAS), Avda Sta María No. 0104, Santiago, Chile (URL: http://www.sernageomin.cl/); Proyecto Observación Villarrica Internet (POVI) (URL: http://www.povi.cl/); Sistema y Servicio Nacional de Prevención y Repuesta Ante Desastres (SENAPRED), Av. Beauchef 1671, Santiago, Chile (URL: https://web.senapred.cl/); Buenos Aires Volcanic Ash Advisory Center (VAAC), Servicio Meteorológico Nacional-Fuerza Aérea Argentina, 25 de mayo 658, Buenos Aires, Argentina (URL: http://www.smn.gov.ar/vaac/buenosaires/inicio.php); MIROVA (Middle InfraRed Observation of Volcanic Activity), a collaborative project between the Universities of Turin and Florence (Italy) supported by the Centre for Volcanic Risk of the Italian Civil Protection Department (URL: http://www.mirovaweb.it/); Hawai'i Institute of Geophysics and Planetology (HIGP) - MODVOLC Thermal Alerts System, School of Ocean and Earth Science and Technology (SOEST), Univ. of Hawai'i, 2525 Correa Road, Honolulu, HI 96822, USA (URL: http://modis.higp.hawaii.edu/); Copernicus Browser, Copernicus Data Space Ecosystem, European Space Agency (URL: https://dataspace.copernicus.eu/browser/).
Merapi (Indonesia) — October 2023 Cite this Report
Merapi
Indonesia
7.54°S, 110.446°E; summit elev. 2910 m
All times are local (unless otherwise noted)
Frequent incandescent avalanches during April-September 2023
Merapi, located just north of the major city of Yogyakarta in central Java, Indonesia, has had activity within the last 20 years characterized by pyroclastic flows and lahars accompanying growth and collapse of the steep-sided active summit lava dome. The current eruption period began in late December 2020 and has more recently consisted of ash plumes, intermittent incandescent avalanches of material, and pyroclastic flows (BGVN 48:04). This report covers activity during April through September 2023, based on information from Balai Penyelidikan dan Pengembangan Teknologi Kebencanaan Geologi (BPPTKG), the Center for Research and Development of Geological Disaster Technology, a branch of PVMBG which specifically monitors Merapi. Additional information comes from the Pusat Vulkanologi dan Mitigasi Bencana Geologi (PVMBG, also known as Indonesian Center for Volcanology and Geological Hazard Mitigation, CVGHM), MAGMA Indonesia, the Darwin Volcanic Ash Advisory Centre (VAAC), and various satellite data.
Activity during April through September 2023 primarily consisted of incandescent avalanches of material that mainly affected the SW and W flanks and traveled as far as 2.3 km from the summit (table 25) and white gas-and-steam emissions that rose 10-1,000 m above the crater.
Table 25. Monthly summary of avalanches and avalanche distances recorded at Merapi during April through September 2023. The number of reported avalanches does not include instances where possible avalanches were heard but could not be visually confirmed as a result of inclement weather. Data courtesy of BPPTKG (April-September 2023 daily reports).
| Month |
Average number of avalanches per day |
Distance avalanches traveled (m) |
| Apr 2023 |
19 |
1,200-2,000 |
| May 2023 |
22 |
500-2,000 |
| Jun 2023 |
18 |
1,200-2,000 |
| Jul 2023 |
30 |
300-2,000 |
| Aug 2023 |
25 |
400-2,300 |
| Sep 2023 |
23 |
600-2,000 |
BPPTKG reported that during April and May white gas-and-steam emissions rose 10-750 m above the crater, incandescent avalanches descended 500-2,000 m on the SW and W flanks (figure 135). Cloudy weather often prevented clear views of the summit, and sometimes avalanches could not be confirmed. According to a webcam image, a pyroclastic flow was visible on 17 April at 0531. During the week of 28 April and 4 May a pyroclastic flow was reported on the SW flank, traveling up to 2.5 km. According to a drone overflight taken on 17 May the SW lava dome volume was an estimated 2,372,800 cubic meters and the dome in the main crater was an estimated 2,337,300 cubic meters.
During June and July similar activity persisted with white gas-and-steam emissions rising 10-350 m above the crater and frequent incandescent avalanches that traveled 300-2,000 m down the SW, W, and S flanks (figure 136). Based on an analysis of aerial photos taken on 24 June the volume of the SW lava dome was approximately 2.5 million cubic meters. A pyroclastic flow was observed on 5 July that traveled 2.7 km on the SW flank. According to the Darwin VAAC multiple minor ash plumes were identified in satellite images on 19 July that rose to 3.7 km altitude and drifted S and SW. During 22, 25, and 26 July a total of 17 avalanches descended as far as 1.8 km on the S flank.
Frequent white gas-and-steam emissions continued during August and September, rising 10-450 m above the crater. Incandescent avalanches mainly affected the SW and W flanks and traveled 400-2,300 m from the vent (figure 137). An aerial survey conducted on 10 August was analyzed and reported that estimates of the SW dome volume was 2,764,300 cubic meters and the dome in the main crater was 2,369,800 cubic meters.
Frequent and moderate-power thermal activity continued throughout the reporting period, according to a MIROVA (Middle InfraRed Observation of Volcanic Activity) analysis of MODIS satellite data (figure 138). There was an increase in the number of detected anomalies during mid-May. The MODVOLC thermal algorithm recorded a total of 47 thermal hotspots: six during April, nine during May, eight during June, 15 during July, four during August, and five during September. Some of this activity was captured in infrared satellite imagery on clear weather days, sometimes accompanied by incandescent material on the SW flank (figure 139).
Geologic Background. Merapi, one of Indonesia's most active volcanoes, lies in one of the world's most densely populated areas and dominates the landscape immediately north of the major city of Yogyakarta. It is the youngest and southernmost of a volcanic chain extending NNW to Ungaran volcano. Growth of Old Merapi during the Pleistocene ended with major edifice collapse perhaps about 2,000 years ago, leaving a large arcuate scarp cutting the eroded older Batulawang volcano. Subsequent growth of the steep-sided Young Merapi edifice, its upper part unvegetated due to frequent activity, began SW of the earlier collapse scarp. Pyroclastic flows and lahars accompanying growth and collapse of the steep-sided active summit lava dome have devastated cultivated lands on the western-to-southern flanks and caused many fatalities.
Information Contacts: Balai Penyelidikan dan Pengembangan Teknologi Kebencanaan Geologi (BPPTKG), Center for Research and Development of Geological Disaster Technology (URL: http://merapi.bgl.esdm.go.id/, Twitter: @BPPTKG); MAGMA Indonesia, Kementerian Energi dan Sumber Daya Mineral (URL: https://magma.esdm.go.id/v1); Pusat Vulkanologi dan Mitigasi Bencana Geologi (PVMBG, also known as Indonesian Center for Volcanology and Geological Hazard Mitigation, CVGHM), Jalan Diponegoro 57, Bandung 40122, Indonesia (URL: http://www.vsi.esdm.go.id/); Darwin Volcanic Ash Advisory Centre (VAAC), Bureau of Meteorology, Northern Territory Regional Office, PO Box 40050, Casuarina, NT 0811, Australia (URL: http://www.bom.gov.au/info/vaac/); MIROVA (Middle InfraRed Observation of Volcanic Activity), a collaborative project between the Universities of Turin and Florence (Italy) supported by the Centre for Volcanic Risk of the Italian Civil Protection Department (URL: http://www.mirovaweb.it/); Hawai'i Institute of Geophysics and Planetology (HIGP) - MODVOLC Thermal Alerts System, School of Ocean and Earth Science and Technology (SOEST), Univ. of Hawai'i, 2525 Correa Road, Honolulu, HI 96822, USA (URL: http://modis.higp.hawaii.edu/); Copernicus Browser, Copernicus Data Space Ecosystem, European Space Agency (URL: https://dataspace.copernicus.eu/browser/); Øystein Lund Andersen (URL: https://www.oysteinlundandersen.com/, https://twitter.com/oysteinvolcano).
Ebeko
Russia
50.686°N, 156.014°E; summit elev. 1103 m
All times are local (unless otherwise noted)
Moderate explosive activity with ash plumes continued during June-November 2023
Ebeko, located on the N end of Paramushir Island in Russia’s Kuril Islands just S of the Kamchatka Peninsula, consists of three summit craters along a SSW-NNE line at the northern end of a complex of five volcanic cones. Observed eruptions date back to the late 18th century and have been characterized as small-to-moderate explosions from the summit crater, accompanied by intense fumarolic activity. The current eruptive period began in June 2022, consisting of frequent explosions, ash plumes, and thermal activity (BGVN 47:10, 48:06). This report covers similar activity during June-November 2023, based on information from the Kamchatka Volcanic Eruptions Response Team (KVERT) and satellite data.
Moderate explosive activity continued during June-November 2023 (figures 50 and 51). According to visual data from Severo-Kurilsk, explosions sent ash 2-3.5 km above the summit (3-4.5 km altitude) during most days during June through mid-September. Activity after mid-September was slightly weaker, with ash usually reaching less than 2 km above the summit. According to KVERT the volcano in October and November was, with a few exceptions, either quiet or obscured by clouds that prevented satellite observations. KVERT issued Volcano Observatory Notices for Aviation (VONA) on 8 and 12 June, 13 and 22 July, 3 and 21 August, and 31 October warning of potential aviation hazards from ash plumes drifting 3-15 km from the volcano. Based on satellite data, KVERT reported a persistent thermal anomaly whenever weather clouds permitted viewing.
Geologic Background. The flat-topped summit of the central cone of Ebeko volcano, one of the most active in the Kuril Islands, occupies the northern end of Paramushir Island. Three summit craters located along a SSW-NNE line form Ebeko volcano proper, at the northern end of a complex of five volcanic cones. Blocky lava flows extend west from Ebeko and SE from the neighboring Nezametnyi cone. The eastern part of the southern crater contains strong solfataras and a large boiling spring. The central crater is filled by a lake about 20 m deep whose shores are lined with steaming solfataras; the northern crater lies across a narrow, low barrier from the central crater and contains a small, cold crescentic lake. Historical activity, recorded since the late-18th century, has been restricted to small-to-moderate explosive eruptions from the summit craters. Intense fumarolic activity occurs in the summit craters, on the outer flanks of the cone, and in lateral explosion craters.
Information Contacts: Kamchatka Volcanic Eruptions Response Team (KVERT), Far Eastern Branch, Russian Academy of Sciences, 9 Piip Blvd., Petropavlovsk-Kamchatsky, 683006, Russia (URL: http://www.kscnet.ru/ivs/kvert/).
Search Bulletin Archive by Publication Date
Select a month and year from the drop-downs and click "Show Issue" to have that issue displayed in this tab.
The default month and year is the latest issue available.
Bulletin of the Global Volcanism Network - Volume 38, Number 06 (June 2013)
Managing Editor: Richard Wunderman
Bravo, Cerro (Colombia)
In repose; 1st report disclosing background conditions and hazards
Dugong (Tonga)
New active submarine volcano found in North Lau Basin, E of Fiji
Kelimutu (Indonesia)
Crater water boils; diffuse, white plume increases to 50 m
Lengai, Ol Doinyo (Tanzania)
Still active in 2012-2013; J.B. Dawson obituary
Lobster (Tonga)
Hydrothermally active submarine volcano found in 2008
Manam (Papua New Guinea)
Sporadic heightened activity, 2011-2013; new vents
Reventador (Ecuador)
Lava dome's summit rises above rim in late 2012
Tolima, Nevado del (Colombia)
Non-eruptive during 2005-2012; hazard assessment and glacial retreat
Cerro Bravo (Colombia) — June 2013 Cite this Report
Cerro Bravo
Colombia
5.091°N, 75.293°W; summit elev. 3985 m
All times are local (unless otherwise noted)
In repose; 1st report disclosing background conditions and hazards
This report, our first for this volcano, covers the low-level activity of Cerro Bravo and monitoring efforts during 2006-2012 based on reporting by the Servicio Geológico Colombiano (SGC). Cerro Bravo was non-eruptive and the Alert Level remained at IV (Green; "volcanically active with stable behavior") due to minimal seismicity, gas emissions, and deformation.
Data availability. Government and academic investigations during 1980-1990 established the geology and preliminary hazard analysis for Cerro Bravo. Monthly SGC technical bulletins were available online from March 2006 through December 2012 and documented an increasing diversity of datasets that developed as the monitoring network expanded. Those bulletins highlighted low-level seismicity that was frequently dominated by surficial activity (rockfalls and other mass-wasting events); fluctuations in radon gas emissions were also noted and baseline data was established for emission rates. As of December 2012, three seismometers (two short-period and one triaxial station), one tiltmeter, two EDM leveling lines, and 10 diffuse radon detectors comprised the monitoring effort (figure 1).
Thouret and others (1990) presented a framework for regional volcanic activity after conducting an assessment of the Ruiz-Tolima Massif (figure 2). The investigators determined that, within a 2 Ma-long period, "recent explosive activity has migrated towards the intersections of the Palestina strike-slip fault and the N 50°W normal faults, first around [the volcanic centers] Quindío and Tolima, secondly in the Cerro Espana area, and most recently close to Cerro Bravo and Ruiz." Holocene activity at Cerro Bravo was characterized as dacitic with evidence of magma mixing. They also highlighted the role of caldera collapse within the region, including the case of Quebrada Seca Caldera, a major bounding feature of Cerro Bravo (figure 3). The concluding remarks included an emphasis on mass wasting at Cerro Bravo and lahar hazards for the ice-clad volcanoes in the region, mainly Nevado del Ruiz and Nevado del Tolima.
A government report prepared by Monsalve (1991) assessed the geology of the area and presented several hazard maps for pyroclastic flow, pyroclastic fall, ballistic projectiles, dome collapse, and lahar scenarios. Although ashfall could reach Manizales (~25 km W), most hazards in this study were centrally located around the immediate region of Cerro Bravo, for example pyroclastic flows and flank failures (figure 4). Hazard zones for lahars included the Río Guarino, Río Aguacatal, and Río Gualí which could extend as far as the town of Honda (~80 km E).
Seismicity during 2006-2012. During this reporting period, seismicity occurred at very low levels with 0-9 volcano-tectonic events (VT) recorded per month (table 1). Long-period earthquakes (LP) occurred more frequently with 0-80 events recorded per month. The SGC noted avalanche and rockfall signatures and, relative to the other years reviewed during this report, 2008 and 2011 had a notable number of surficial seismic signatures attributed to small avalanches and rockfalls. An average of 22 avalanche and 14 rockfall events occurred per month whereas the averages were between 1.5 and 10.7, respectively, during other years. The largest single rockfall event occurred in May 2012 and lasted for 34 seconds.
Table 1. Monthly seismicity at Cerro Bravo was tabulated by the occurrence of events: volcano-tectonic (VT), long-period (LP), rockfall, and largest earthquake magnitude. Courtesy of SGC.
| Date |
VT |
LP |
Rockfall |
Largest EQ |
| Mar 2006 |
3 |
4 |
2 |
1.62 |
| Apr 2006 |
1 |
5 |
12 |
1.77 |
| May 2006 |
7 |
12 |
15 |
2.15 |
| Jun 2006 |
3 |
12 |
37 |
2.19 |
| Jul 2006 |
0 |
1 |
3 |
1.01 |
| Aug 2006 |
4 |
1 |
7 |
1.49 |
| Sep 2006 |
2 |
0 |
19 |
1.53 |
| Oct 2006 |
2 |
1 |
7 |
0.64 |
| Nov 2006 |
0 |
0 |
5 |
-- |
| Dec 2006 |
0 |
0 |
0 |
-- |
| Jan 2007 |
0 |
0 |
0 |
-- |
| Feb 2007 |
0 |
1 |
0 |
0.7 |
| Mar 2007 |
1 |
7 |
0 |
1.73 |
| Apr 2007 |
2 |
2 |
0 |
2.2 |
| May 2007 |
9 |
7 |
4 |
2.44 |
| Jun 2007 |
4 |
3 |
3 |
2.02 |
| Jul 2007 |
1 |
2 |
0 |
1.67 |
| Aug 2007 |
4 |
3 |
0 |
2.29 |
| Sep 2007 |
0 |
3 |
8 |
1.67 |
| Oct 2007 |
3 |
2 |
1 |
1.77 |
| Nov 2007 |
1 |
1 |
0 |
1.91 |
| Dec 2007 |
1 |
0 |
2 |
0.81 |
| Jan 2008 |
1 |
0 |
0 |
1.3 |
| Feb 2008 |
1 |
0 |
0 |
0.64 |
| Mar 2008 |
1 |
3 |
11 |
2.13 |
| Apr 2008 |
1 |
0 |
2 |
1.9 |
| May 2008 |
0 |
2 |
54 |
1.01 |
| Jun 2008 |
0 |
1 |
74 |
0.81 |
| Jul 2008 |
0 |
0 |
34 |
-- |
| Aug 2008 |
1 |
0 |
44 |
1.73 |
| Sep 2008 |
0 |
0 |
7 |
-- |
| Oct 2008 |
0 |
0 |
25 |
-- |
| Nov 2008 |
0 |
0 |
11 |
-- |
| Dec 2008 |
0 |
79 |
3 |
3.4 |
| Jan 2009 |
1 |
9 |
6 |
2.52 |
| Feb 2009 |
0 |
2 |
6 |
2.22 |
| Mar 2009 |
1 |
6 |
2 |
2.32 |
| Apr 2009 |
0 |
0 |
12 |
-- |
| May 2009 |
1 |
0 |
18 |
0.88 |
| Jun 2009 |
0 |
0 |
1 |
-- |
| Jul 2009 |
0 |
0 |
0 |
-- |
| Aug 2009 |
0 |
0 |
8 |
-- |
| Sep 2009 |
0 |
3 |
2 |
2.1 |
| Oct 2009 |
0 |
2 |
11 |
1.4 |
| Nov 2009 |
0 |
0 |
0 |
-- |
| Dec 2009 |
0 |
1 |
0 |
0.86 |
| Jan 2010 |
1 |
0 |
0 |
1.23 |
| Feb 2010 |
0 |
0 |
5 |
-- |
| Mar 2010 |
0 |
2 |
5 |
1.33 |
| Apr 2010 |
0 |
3 |
0 |
2.1 |
| May 2010 |
1 |
5 |
1 |
1.89 |
| Jun 2010 |
0 |
1 |
16 |
1.59 |
| Jul 2010 |
0 |
5 |
2 |
1.98 |
| Aug 2010 |
0 |
0 |
1 |
-- |
| Sep 2010 |
1 |
8 |
18 |
1.91 |
| Oct 2010 |
0 |
0 |
6 |
-- |
| Nov 2010 |
0 |
5 |
64 |
2.08 |
| Dec 2010 |
0 |
0 |
6 |
-- |
| Jan 2011 |
0 |
1 |
1 |
1.75 |
| Feb 2011 |
0 |
0 |
0 |
-- |
| Mar 2011 |
0 |
3 |
3 |
1.7 |
| Apr 2011 |
0 |
0 |
26 |
-- |
| May 2011 |
0 |
2 |
30 |
1.67 |
| Jun 2011 |
0 |
6 |
40 |
2.43 |
| Jul 2011 |
0 |
0 |
14 |
-- |
| Aug 2011 |
2 |
16 |
19 |
1.67 |
| Sep 2011 |
1 |
1 |
12 |
0.64 |
| Oct 2011 |
0 |
0 |
9 |
-- |
| Nov 2011 |
3 |
3 |
13 |
1.82 |
| Dec 2011 |
0 |
3 |
5 |
2.37 |
| Jan 2012 |
0 |
2 |
5 |
0.86 |
| Feb 2012 |
1 |
2 |
1 |
1.93 |
| Mar 2012 |
0 |
0 |
2 |
-- |
| Apr 2012 |
1 |
1 |
3 |
1.8 |
| May 2012 |
0 |
0 |
2 |
-- |
| Jun 2012 |
0 |
0 |
3 |
-- |
| Jul 2012 |
1 |
0 |
0 |
1.11 |
| Aug 2012 |
0 |
0 |
1 |
-- |
| Sep 2012 |
0 |
1 |
1 |
2.22 |
| Oct 2012 |
0 |
0 |
6 |
-- |
| Nov 2012 |
0 |
1 |
0 |
1.61 |
| Dec 2012 |
0 |
0 |
0 |
-- |
The largest recorded earthquake magnitude, M 3.4, was recorded in December 2008. The average magnitude during this reporting period was M 1.7. An anomalous 2-hour-long signal was recorded in June 2006; that month, seismicity was slightly elevated (3 VT, 11 LP, and 37 rockfalls).
The SGC August 2008 bulletin highlighted a seismic swarm within the region of Cerro Bravo. The swarm was detected on 9 August 2008 comprising 65 earthquakes at an undetermined distance NE of Paramillo del Quindío (located ~40 km S of Cerro Bravo) at relatively shallow depths (2-5 km). The earthquakes had small magnitudes; the largest was M 1.14. A second swarm occurred on 30 December 2008, when ~80 LP earthquakes were detected. The largest event, an M 2.3 earthquake, occurred S of Cerro Bravo and caused shaking that was noted by residents of Manizales (particularly those in tall buildings).
A swarm of 67 earthquakes occurred during 17-29 November 2010. The SGC noted that rockfalls and avalanches were likely responsible for these events. That month, there were five LP earthquakes but no VT earthquakes were detected.
Rockfalls and avalanches were attributed to elevated seismicity in June 2011 when 40 events were detected that month. While those earthquakes were occurring, there were no associated geophysical or geochemical changes observed at the edifice.
Geochemical monitoring efforts. Radon and carbon dioxide data were recorded by the SGC during 2005 through 2012 (figure 5), although CO2 data became unavailable after October 2009. The SGC reported that background level emissions were classified as values 2 data rarely coincided with radon except for a prominent increase around June 2008 at that Cerro Bravo 2 station CO2 measured ~2.7% volume and the radon peak was ~900 pCi/L.
Surface deformation monitoring. In October 2009, the SGC installed reflectors and base stations for two EDM (Electronic Distance Measurement) lines (figure 1). An EDM survey was conducted three months later, beginning the establishment of long-term surface deformation monitoring. During 2009-2012, eight EDM surveys were conducted from the El Doce base and four EDM surveys were conducted from El Porton; the SGC stated that no significant changes were calculated from these datasets.
Monitoring with an electronic tilt station began in late March 2011 with an installation on the E flank (figure 1). Stable conditions were recorded by the tiltmeter up until December 2011 when decreasing trends suddenly began from both N and E components (figure 7). The SGC noted that from December 2011 to early April 2012 there was a total change of -5 & mu;m and -8 & mu;m (N and E components respectively). During April-December 2012, generally stable conditions resumed.
References. Lescinsky, D., 1990, Geology, volcanology and petrology of Cerro Bravo, a young dacitic stratovolcano in West-Central Colombia [Master's Thesis]: Hanover, NH, Dartmouth College, 244 pp.
Monsalve, M.L., 1991. Mapa preliminar de amenaza volcánica del Volcán Cerro Bravo, INGEOMINAS, Prepared for the Government of Tolima and CRE-Tolima.
Thouret, J.C., Cantagrel, J-M., Robin, C., Murcia, A., Salinas, R., and Cepeda, H., 1995, Quaternary eruptive history and hazard-zone model at Nevado del Tolima and Cerro Machin volcanoes, Colombia. Journal of Volcanology Geothermal Research, 66 (1-4):397-426.
Thouret, J.C., Murcia, A., Salinas, R., Parra, E., Cepeda, H., and Cantagrel, J-M., Stratigraphy and quaternary eruptive history of the Ruiz-Tolima volcanic massif (Colombia): Implications for assessment of volcanic hazards. Symposium International Géodynamique Andine: Résumés des communications. 15-17 May 1990, Grenoble, France. p. 391-393.
Geologic Background. Cerro Bravo is a relatively low dominantly dacitic lava-dome complex north of Nevado del Ruiz that was constructed within the Pleistocene Quebrada Seca caldera. A series of moderate plinian eruptions during the Holocene were accompanied by pyroclastic flows and lava dome growth. Although historical records of the roughly 4000-m-high Cerro Bravo eruptions have not been found, stratigraphic evidence indicates that it last erupted sometime between the 1595 and 1845 eruptions of Ruiz.
Information Contacts: María Luisa Monsalve, Gloria Patricia Cortés, and Cristian Mauricio López, Servicio Geológico Colombiano (SGC), Volcanological and Seismological Observatory, Avenida 12 Octubre 15-47, Manizales, Colombia (URL: https://www2.sgc.gov.co/volcanes/index.html).
Dugong
Tonga
15.431°S, 175.725°W; summit elev. -1170 m
All times are local (unless otherwise noted)
New active submarine volcano found in North Lau Basin, E of Fiji
According to the Australian Commonwealth Scientific and Industrial Research Organization (CSIRO), several large active submarine volcanoes, spreading ridges, and rift zones have been discovered in the Northwest Lau back-arc basin, NE of Fiji Island (figure 1), by a team of Australian and American scientists aboard the CSIRO Marine National Facility Research Vessel Southern Surveyor during a research cruise in Spring 2008 (CSIRO, 2008b). While mapping previously uncharted areas for submarine volcanic and hot spring activity with multibeam sonar and various other techniques, the team located several active volcanoes, one of which they named Dugong. The depth of Dugong is given in the InterRidge Vents Database [Ver. 3.1] (2013), and its location was plotted on figure 1 based on coordinates given in Lupton and others (2012).
As shown in figure 2, the greater Dugong structure is dominated by a 5-km-diameter caldera at a depth of 1,100 m. Dugong volcano is located ~60 km E of Lobster volcano, ~20 km WNW of Niuafo'ou volcano/island, and ~680 km NE of Suva, Fiji.
During the 6 week research expedition in the Pacific Ocean, scientists from the Australian National University (ANU), CSIRO Exploration & Mining, and the United States collaborated to survey the topography of the seafloor, analyzing rock types and formations, and monitoring deep sea hot spring activity around an area known as the North Lau Basin, 400 km NE of Fiji.
References. Arculus, R.J., 2008, Marine National Facility RV Southern Survey 2008 Program: Voyage Summary SS07/2008 Northern Lau Vents Expedition (NoLauVE), 23 p (URL: http://www.cmar.csiro.au/datacentre/process/data_files/cruise_docs/SS200807sum.pdf).
CSIRO, 2008a, Active submarine volcanoes found near Fiji, CSIRO web site (URL: http://www.csiro.au/Organisation-Structure/Divisions/Earth-Science--Resource-Engineering/SubmarineVolcanoes.aspx).
CSIRO, 2008b, Active submarine volcanoes found near Fiji, CSIRO media release (URL: http://www.scienceimage.csiro.au/mediarelease/mr08-93.html).
de Ronde, C.E.J, Baker, ET, Massoth, G.J, Lupton, J.E, Wright, I.C., Feely, R.A., and Greene, R.R., 2001, Intra-oceanic subduction-related hydrothermal venting, Kermadec volcanic arc, New Zealand, Earth and Planetary Science Letters, v. 193, p. 359-369.
Graham, I.J., Reyes, A.G., Wright, I.C., Peckett, K.M., Smith, I.E.M., and Arculus, R.J., 2008, Structure and petrology of newly discovered volcanic centers in the northern Kermadec-southern Tofua arc, South Pacific Ocean, Journal of Geophysical Research, v. 113, B08S02, doi:10.1029/2007JB005453.
InterRidge Vents Database Ver. 3.1, 2013, Vent Fields (URL: http://www.interridge.org/irvents/ventsfields?).
Keller, N.S., Arculus, R.J., Hermann, J., and Simon, R., 2008, Submarine back arc lava with arc signature: Fonualei Spreading Center, northeast Lau Basin, Tonga, Journal of Geophysical Research, v. 113, B08S07, doi:10.1029/2007JB005451.
Lupton, J.E., Arculus, R.J., Resing, J., Massoth, G.J., Greene, R.R., Evans, L.J., and Buck, N., 2012, Hydrothermal activity in the Northwest Lau Backarc Basin: Evidence from water column measurements, Geochemistry, Geophysics, Geosystems, v. 13, no. 5, doi: 10.1029/2011GC003891. Information Contacts. Commonwealth Scientific and Industrial Research Organization (CSIRO) (URL: http://www.csiro.au).
Geologic Background. This volcano was discovered during an Australian research cruise in 2008. The overall edifice is 45 km in diameter, with a 5-km-diameter summit caldera.
Information Contacts: Commonwealth Scientific and Industrial Research Organization (CSIRO) (URL: http://www.csiro.au); National Oceanic and Atmospheric Agency (NOAA) (URL: http://www.CSC.noaa.gov/crs/rs_apps/sensors/multi_beam.htm); Richard Arculus, Australian National University Research School of Earth Sciences; and Frederick Stein, Director, Marine National Facility, CSIRO.
Kelimutu (Indonesia) — June 2013 Cite this Report
Kelimutu
Indonesia
8.77°S, 121.82°E; summit elev. 1639 m
All times are local (unless otherwise noted)
Crater water boils; diffuse, white plume increases to 50 m
This volcano is well known for three summit crater lakes, each a different color. We last reported minor bubbling in a crater lake Tiwu Nua Muri Kooh Tai lake in 1995 (BGVN 20:06). Between 15 and 19 May 1995, rescuers searched for the body of a Dutch tourist who had fallen into the crater lake but they did not find it.
2013 activity.The Center of Volcanology and Geological Hazard Mitigation (CVGHM) reported that on 6, 10, and 12 June 2013, and during 14 June-9 July 2013, the color of the water in Kelimutu's Crater II (Tiwu Nua Muri Kooh Tai Crater) was bluish white. Diffuse white plumes rose as high as 50 m above the lake's surface and in some areas the water appeared or sounded like it was boiling. A sulfur odor was also reported. The water in Crater I (Tiwu Ata Polo) was light green and churned, and the water in Crater III (Tiwu Ata Mbupu) was mossy green.
On 3 June 2013, a change was observed in the color of the lake water in Crater II, going from blue to a café au lait (light tan), accompanied by white smoke under weak to medium pressure, rising 50 meters above the surface of the lake. From the southern side of Crater II a bubbling sound of boiling was heard near the wall separating Crater I from Crater II. The smell of sulphur gas was quite sharp in the vicinity of the crater and at nighttime a weak to medium smell of this gas could be discerned in Pemo Village which is 3 kms from the peak of Kelimutu. On 4 June 2013 at 1400 hours local time the status of Kelimutu was upgraded from Alert Level 1 (Normal) to Alert Level 2 (Waspada).
On 6 June 2013 water in Crater II was a bluish white (like a salty egg), with sparse to medium white smoke under weak to strong pressure extending up 10-35 meters above the lake surface. A weak to strong bubbling sound of boiling water was heard on the southern side of the crater. A medium to sharp smell of sulphurous gas was evident as was the withering vegetation.
On 10 June 2013 water in Crater II was still a bluish white with medium to dense white smoke extending up 40-50 m above the lake surface. A bubbling sound of boiling water could be heard on the southern side of the crater. A medium smell of sulphurous gases was discernible.
On 12 June 2013, smoke rising from the surface of the lake extended to only about 10-30 meters above the lip of the crater. There was a rather acrid smell of sulphurous fumes. Eruptive and hot air noises were audible two times and the water in the crater lake still appeared to be boiling.
From 14 June to 9 July 2013, water in Crater II visually still appeared bluish white with sparse white smoke rising from the surface of the lake about 2-10 meters into the atmosphere (dominant height was not observed). There was a weak to medium (with weak dominating) smell of sulphurous gases. At one point bubbling water was noticeable but it was clearly under weak pressure. Water from Crater III was calm and moss-green in color.
During 22-29 June 2013 sulfur dioxide concentrations in Crater II were occasionally 2.8 ppm, when the wind blew the gas towards the sensor. CVGHM noted that plumes rising from the lakes became lower and barely visible during 3 June-9 July, and that the hissing or "rustling sound" of water from near the dividing wall of craters I and II had gradually faded away. Based on visual observations, seismicity, and gas emissions, CVGHM lowered the Alert Level to 1 (on a scale of 1-4) on 12 July (figure 4).
During 13 - 18 June 2013, local tectonic quakes peaked at 139 before undergoing a decrease as of 17 June 2013. Shallow (VB) and deep (VA) volcanic earthquakes occurred intensely each day, reaching a a peak of 13 shallow volcanic quakes 19-24 June 2013 and then tended to decline (figure 5). Deep volcanic quakes peaked at 14 during 1-6 July 2013 and then subsided.
No thermal alerts were recorded by MODVOLC for the past twelve months beginning in mid-July 2012.
Geologic Background. Kelimutu is a small, but well-known, Indonesian compound volcano in central Flores Island with three summit crater lakes of varying colors. The western lake, Tiwi Ata Mbupu (Lake of Old People) is commonly blue. Tiwu Nua Muri Kooh Tai (Lake of Young Men and Maidens) and Tiwu Ata Polo (Bewitched, or Enchanted Lake), which share a common crater wall, are commonly colored green and red, respectively, although lake colors periodically vary. Active upwelling, probably fed by subaqueous fumaroles, occurs at the two eastern lakes. The scenic lakes are a popular tourist destination and have been the source of minor phreatic eruptions in historical time. The summit is elongated 2 km in a WNW-ESE direction; the older cones of Kelido (3 km N) and Kelibara (2 km S).
Information Contacts: Center of Volcanology and Geological Hazard Mitigation (CVGHM), Jalan Diponegoro 57, Bandung 40122, Indonesia (URL: http://www.vsi.esdm.go.id/); and Hawai'i Institute of Geophysics and Planetology (HIGP) MODVOLC Thermal System, School of Ocean and Earth Science and Technology (SOEST), Univ. of Hawai'i, 2525 Correa Road, Honolulu, HI 96822 USA (URL: http;//hotspot.higp.hawaii.edu/).
Ol Doinyo Lengai (Tanzania) — June 2013 Cite this Report
Ol Doinyo Lengai
Tanzania
2.764°S, 35.914°E; summit elev. 2962 m
All times are local (unless otherwise noted)
Still active in 2012-2013; J.B. Dawson obituary
We recently noted that Frederick Belton's web site on Ol Doinyo Lengai has been supplemented by a web site from the Ngare Sero Village Council entitled "Oldoinyo Lengai - The Mountain of God." This new web site has information on climbing, mountain safety, guides, equipment, and fees, as well as activity of the volcano as observed by guides and visitors. According to Belton, Lazaro Saitoti is maintaining the web site from both Arusha and Engare Sero, and it represents a potentially useful source of local information, with an emphasis on tourism.
Abigail Church forwarded to us two aerial photographs of Lengai's active crater and summit, one taken in June 2013 (figure 166) and the other in 28 July 2013 (figure 167). On 29 July, Church reported that she had flown over Lengai a few times in the last year or so, and that Lengai appeared to have small active vents still emitting lava. In addition, these aerial views recorded little other activity except for slippage off the steep walls. She noted that she was in touch with a number of pilots that are often flying over Lengai and that might contact her if they see anything unusual.
On 10 April 2013, Bonnie Betts climbed Lengai and, on Belton's web site is quoted as reporting: "We started at midnight in a thunderstorm with light rain, but it cleared up. You could hear the lava sloshing around inside the crater before getting to the top; also dark smoke could be seen coming from the crater while ascending in the night . . . Looking into the crater, you can see the lava sloshing back and forth in the dark, black tunnel, and then some would flow out with a different flowing swishing sound." Local guides expressed concerns to Betts that an extensive crack seen in the crater may be the beginning of a collapse of the inner wall of the pit crater. Figures 168 and 169 show photos taken during Betts' climb.
Belton received some photos and a description by Gian Schachenmann of a visit to Lengai on 17-18 June 2013. Schachenmann noted sloshing lava sounds from the spatter cone and big cracks on the rim where gases escaped (figure 170).
Death of John Barry Dawson, Lengai Legend. According to the Mitchell (2013), John B. Dawson, Emeritus Professor of Geology, Lakehead University, Thunder Bay, Ontario, Canada, died 2 February 2013. Excerpts from that obituary are found below.
Dawson was known for his extensive knowledge of kimberlite geology. Subsequent to graduation in 1960, Barry joined the Tanganyika Geological Survey, where he was employed to map areas of the then remote Angata Salei region near Lake Natron, a location of an active volcano. "The first ever descent into the crater of this volcano, Oldoinyo Lengai, (the Maasi Mountain of God), was made by Barry and Ray Pickering in October 1960. It was during this visit that he recognized the unique sodium carbonate volcanism and earned himself a permanent place in petrological history with the publication of his paper on these extraordinary rocks in the journal Nature (Dawson, 1962). Subsequently, he maintained an active research program on the petrology of Oldoinyo Lengai and other volcanoes in the Gregory Rift Valley."
"During this work he narrowly survived one violent silicate ash eruption of Oldoinyo Lengai in 1966, and was fortunate enough to observe, some 40 years later in 2007, the return to silicate pyroclastic activity from the quiet effusive natrocarbonatite eruptions. To the time of his death, Barry was actively involved in studies of Oldoinyo Lengai, Kerimasi, Mosonik and other Tanzanian volcanoes. He was especially pleased with the publication in 2009 [sic] of his comprehensive review of volcanic activity in the Gregory Rift" (Dawson, 2008).
References. Belton, F., 2013, Ol Doinyo Lengai, web site, URL: http://www.oldoinyolengai.pbworks.com.
Dawson, J.B., 1962. Sodium Carbonate Lavas from Oldoinyo Lengai, Tanganyika, Nature, v. 195, pp. 1075-1076.
Dawson, J.B., 2008, The Gregory Rift Valley and Neogene-Recent Volcanoes of Northern Tanzania, Geological Society, London, Memoir 33, pp. viii 102.
Mitchell, R.H., 2013, John Barry Dawson 1932-2013, Mineralogical Magazine, v. 77, no. 3, pp. 401-402.
Ngare Sero Village Council, 2013, Oldoinyo Lengai - The Mountain of God, web site, URL: http://www.oldoinyo-lengai.org
Geologic Background. The symmetrical Ol Doinyo Lengai is the only volcano known to have erupted carbonatite tephras and lavas in historical time. The prominent stratovolcano, known to the Maasai as "The Mountain of God," rises abruptly above the broad plain south of Lake Natron in the Gregory Rift Valley. The cone-building stage ended about 15,000 years ago and was followed by periodic ejection of natrocarbonatitic and nephelinite tephra during the Holocene. Historical eruptions have consisted of smaller tephra ejections and emission of numerous natrocarbonatitic lava flows on the floor of the summit crater and occasionally down the upper flanks. The depth and morphology of the northern crater have changed dramatically during the course of historical eruptions, ranging from steep crater walls about 200 m deep in the mid-20th century to shallow platforms mostly filling the crater. Long-term lava effusion in the summit crater beginning in 1983 had by the turn of the century mostly filled the northern crater; by late 1998 lava had begun overflowing the crater rim.
Information Contacts: Abigail Church, The Ker and Downey Safari Tradition, James Robertson, chairman, P.O. Box 86, Karen 00502, Kenya (URL: http://www.kerdowneysafaris.com/); Frederick A. Belton, University Studies Department, Middle Tennessee State University, Murfreesboro, TN (URL: http://www.oldoinyolengai.pbworks.com); Lazaro Saitoti, Chairman, Ngare Sero Village Council, and Lemra Kingi, Chairman Tourism, Ngare Sero Village Council, Arusha and Engare Sero, Tanzania (URL: http://www.oldoinyo-lengai.org); and Bonnie Betts (no contact information).
Lobster
Tonga
15.333°S, 176.283°W; summit elev. -1500 m
All times are local (unless otherwise noted)
Hydrothermally active submarine volcano found in 2008
The Australian Commonwealth Scientific and Industrial Research Organization (CSIRO) announced in press releases that several large active submarine volcanoes, spreading ridges, and rift zones had been discovered in the Northwest Lau back-arc basin, NE of Fiji Island (figure 1). The discoveries were made by a team of Australian and American scientists aboard the CSIRO Marine National Facility Research Vessel Southern Surveyor in Spring 2008 (CSIRO, 2008a). While mapping previously uncharted areas for submarine volcanic and hot spring activity, the team located several volcanoes, one of which they named Lobster. The depth of Lobster is given as 1,500 m in the InterRidge Vents Database [Ver. 3.1] (2013). The location of Lobster is shown in figure 1, based on coordinates given in Lupton and others (2012). The base maps in figure 1 came from Keller and others (2008), a study primarily discussing the area in the rectangle on the larger map. The sea floor was mapped with multibeam sonar. Lobster is located ~75 km NNW of Niuafo'ou volcano/island and ~680 km NE of Suva, Fiji (figure 1). Dugong volcano lies ~60 km E of Lobster.
Lobster volcano's caldera is 2x2.5 km in diameter with a floor at 1.5 km depth (figure 2). It was described as residing amid four radiating rift zones.
The caldera's rim is about 100 m high on the W side whereas only ~20 m high on the E side.
Dredge samples from Lobster recovered in 2008 contained olivine and plagioclase in pillow basalts. A dredge sample taken on the smooth caldera floor recovered fresh flows as well as thick, black aphyric pillows with glassy rinds.
Age. According to Arculus (2008) and Lupton and others (2012), active venting was identified in the form of high helium anomalies (δ3He), suspended particles (%T), and trace metals (manganese and iron) at 60 m off the bottom in the SE corner of the summit caldera. Lupton and others (2012) reported, in 2012, that the site was still active.
The expedition mapped the seafloor using a 30 kHz multibeam sonar with Global Positioning System (GPS) and an Inertial Motion Unit (IMU) to track the ship's position and attitude. They also made vertical conductivity, temperature, and depth (CTD) measurements as well as rock dredging. In addition, by lowering the CTD package up and down a few hundred meters from the bottom, while moving the ship, they obtained a far greater density of data. This technique, often informally referred to as a CTD tow-yo, is effective for mapping and sampling hydrothermal plumes.
References. Arculus, R.J., 2008, Marine National Facility RV Southern Survey 2008 Program: Voyage Summary SS07/2008 Northern Lau Vents Expedition (NoLauVE), 23 p (URL: http://www.cmar.csiro.au/datacentre/process/data_files/cruise_docs/SS200807sum.pdf).
CSIRO, 2008a, Active submarine volcanoes found near Fiji, CSIRO web site (URL: http://www.csiro.au/Organisation-Structure/Divisions/Earth-Science--Resource-Engineering/SubmarineVolcanoes.aspx).
CSIRO, 2008b, Active submarine volcanoes found near Fiji, CSIRO media release (URL: http://www.scienceimage.csiro.au/mediarelease/mr08-93.html).
de Ronde, C.E.J, Baker, ET, Massoth, G.J, Lupton, J.E, Wright, I.C., Feely, R.A., and Greene, R.R., 2001, Intra-oceanic subduction-related hydrothermal venting, Kermadec volcanic arc, New Zealand, Earth and Planetary Science Letters, v. 193, p. 359-369.
Graham, I.J., Reyes, A.G., Wright, I.C., Peckett, K.M., Smith, I.E.M., and Arculus, R.J., 2008, Structure and petrology of newly discovered volcanic centers in the northern Kermadec–southern Tofua arc, South Pacific Ocean, Journal of Geophysical Research, v. 113, B08S02, doi:10.1029/2007JB005453.
InterRidge Vents Database Ver. 3.1, 2013, Vent Fields (URL: http://www.interridge.org/irvents/ventsfields?).
Keller, N.S., Arculus, R.J., Hermann, J., and Simon, R., 2008, Submarine back-arc lava with arc signature: Fonualei Spreading Center, northeast Lau Basin, Tonga, Journal of Geophysical Research, v. 113, B08S07, doi:10.1029/2007JB005451.
Lupton, J.E., Arculus, R.J., Resing, J., Massoth, G.J., Greene, R.R., Evans, L.J., and Buck, N., 2012, Hydrothermal activity in the Northwest Lau Backarc Basin: Evidence from water column measurements, Geochemistry, Geophysics, Geosystems, v. 13, no. 5, doi: 10.1029/2011GC003891.
Geologic Background. Active hydrothermal venting was noted when this volcano was first discovered in 2008 by an Australian research expedition.
Information Contacts: Commonwealth Scientific and Industrial Research Organization (CSIRO) (URL: http://www.csiro.au).
Manam (Papua New Guinea) — June 2013 Cite this Report
Manam
Papua New Guinea
4.08°S, 145.037°E; summit elev. 1807 m
All times are local (unless otherwise noted)
Sporadic heightened activity, 2011-2013; new vents
Our last report on Manan (BGVN 36:06; figure 29) discussed field observations through 11 January 2011. The following summarizes available Rabaul Volcano Observatory (RVO) reports issued since that time through May 2013. Pyroclastic flows took place during the reporting interval, specifically four times on 16 June 2012, and another four times on 30 July 2012, all of which traveled down the SE valley. No injuries were reported. In addition there were lava fountains, several lava flows, and some cases of sustained emissions lasting hours. Occasional ash plumes triggered the Darwin Volcanic Ash Advisory Centre (Darwin VAAC) to issue notices. Some ash plumes drifted over 200 km. Loud noises, rumbling, tephra ejected above or outside the confines of the crater, and night glow were common observations.
2011 activity. During 1-19 August 2011, RVO reported Manam's summit area was obscured by weather clouds on most days. When the summit was clear to viewers on the mainland, 15-20 km away from Manam, both vents emitted white vapor plumes. Main Crater produced light-gray ash clouds during 13 and 17-18 August, and bright, steady incandescence was visible on most clear nights. August seismicity was dominated by volcanic tremor, but discrete high-frequency volcano-tectonic earthquakes were also recorded which, RVO noted, are not very common for Manam. An electronic tiltmeter located ~4 km SW from the summit craters continued to show inflation.
Based on analysis of satellite imagery, the Darwin VAAC reported a series of ash plumes which, during 18-21 August, rose to altitudes of 1.8-2.1 km and drifted 45-90 km NW and W. The VAAC next reported that on 18 October, ash plumes rose to 3.7 km altitude and drifted 150-170 km NW. During 19-21 October ash plumes rose to an altitude of 3.7 km and drifted 150-220 km W. For 11 November 2011, using both satellite imagery and a pilot observation, the VAAC reported an ash plume to an altitude of 3 km drifting up to ~90 km NE.
Activity continued in December 2011. Seismicity was assessed by Real-time Seismic Amplitude Measurements (RSAM) and varied at high levels between 200-350 RSAM. Both craters produced ash and lava fragments. The ash clouds rose to several hundred meters above the vents. Both vents often glowed at night, and expelled glowing fragments. Brown and grey ash was deposited in areas down wind. There were reports of a possible lava flow from the Southern Crater, with the 'V' shaped channel created by the 2005 blast being filled up.
2012 activity. RVO reported continued activity during January 2012. White vapor and grey-to-black ash emissions rising less than 200 m were observed from both craters throughout the month, sometimes with accompanying weak incandescent projections. From the Southern Crater, more sustained emissions on the evening of 20 January occurred with mainly black ash up to 400 m, trending to the SE. At that time low-energy projections observed at 3-4 minute intervals fell back inside the crater. Main Crater produced a bright steady glow and released thick white vapor with a strong blue tinge. On 23 January observers noted that there were possibly three vents emitting columns of vapor and ash. Seismicity during this time remained moderate to high, with a variable RSAM of 200-350.
RVO next reported mainly mild activity at Southern Crater during the first two weeks of May 2012. Diffuse white and blue vapor emerged during 5-6 and 13-14 May, and gray and gray-brown ash clouds were observed on 7, 9, and 12 May. Observers noted incandescence on the nights of 6, 8, 10-11, and 13-14 May, and glowing tephra occasionally falling outside of the crater.
Activity increased on 16 May 2012. Ash cloud colors changed from gray and gray-brown to gray and black. On 27 and 30 May Strombolian emissions occurred and, for periods lasting 1-2 hours, continuously ejected incandescent tephra. On 30 May two vents at the Southern Crater produced lava fountains. Ash plumes rose 100-400 m above the crater and drifted NW. Most of the tephra fell back into the crater, but some was channeled into the SE and SW valleys. Emissions from Main Crater were milder and characterized by white plumes and gray to gray-brown ash plumes noted during 6, 10-11, 13, 26, 28-29, and 31 May. Ash fell on the NW part of the island.
Seismicity during May 2012 maintained a moderate to moderately-high level and was associated with discrete low-frequency earthquakes and low-level, sporadic volcanic tremor in the background occurring during 1-9 May. Daily low frequency totals ranged between 880 and 970. The steady increase in RSAM observed in April continued until about 16 May, and fluctuated in an upward trend thereafter. The fluctuations reflected phases or episodes of low and moderate activity. The highest RSAM of 500 was reached on the 30th. After 30 May RSAM declined again to reach 350 by the end of May. Around this time tremor became dominant and overshadowed the discrete events, making it difficult to conduct event counts. The electronic tiltmeter (located 4 km SW) continued to show gentle uptilt towards the summit.
RVO reported low to moderate activity during 1-15 June 2012. Emissions consisted of gray and sometimes black ash clouds that rose from the crater on most days. Plumes drifted SE on 2 June and NW during 6-15 June. Ash fell in areas downwind between Yassa (WSW) and Baliau (NNW), and Warisi (ESE). Incandescent material was also ejected from the crater.
Pyroclastic flows on 16 June 2012 (at 0700, 0725, 0727, and 0729) all channelled into the SE valley. The last pyroclastic flow was perhaps the largest. It reached the lowest elevation, 300-400 m above sea level, but came to rest far from populated areas. Ash plumes from the pyroclastic flows rose ~1,000 m and drifted WSW and WNW. Small amounts of ash fell in villages between Dugulava (on the SW side of the island) and Yassa. Fine ash also fell in downwind areas on the mainland, including the Bogia government station (25 km SSW, on the mainland). Emissions from Main Crater were milder and mostly characterized by white and bluish plumes. Light gray plumes were noted during 2 and 8-9 June.
Ash fell in the NW part of the island. Weaker emissions occurred on 17 June, mostly consisting of steam with occasional ash. During 18-30 June gray and occasionally black ash clouds rose 100-150 m above the crater and drifted mainly NW. Incandescent tephra was ejected from the crater on most nights. Activity during 28-29 June was almost sub-Plinian. Emissions from Main Crater were milder and mostly characterized by white and bluish plumes. Gray ash plumes were emitted during 18, 23, 26-27, and 29 June. Incandescence from the crater was visible during 18, 20-22, and 24 June. Ash again fell in the NW part of the island. Seismic recording ceased during 12-27 June 2012 due to equipment failure at Bogia apparently caused by a lightning strike. During the period of data recording, seismicity remained at moderate to moderately high level, dominated by sub-continuous to continuous volcanic tremor. RSAM fluctuated between 250 and 550. High peaks in the RSAM between 4 and 10 June were associated with moderate to strong phases of eruptive activity described above. The electronic tiltmeter was generally stable during reporting period, but the long term trend showed slow inflation towards the summit area. When seismic recording resumed on 28 June 2012, the level of seismicity had risen slightly: RSAM 400-600. The high RSAM values corresponded to some of the moderate summit activity reported above. Seismicity was dominated by sub-continuous to continuous volcanic tremor. Around this time, the electronic tiltmeter remained out of service.
During the first half of June RVO recommended authorities declare a Stage 2 alert level. The level remained at Stage 2 for the remainder of June 2012. In their next available report, RVO noted that activity increased slightly during 15-31 July, except during 18-20 July when ash emissions decreased. During most of the reporting period, when visibility was clear, gray-to-sometimes-black ash plumes were observed rising 300-700 m above the crater discharging from two vents. The plumes mainly drifted NW, mainly affecting villages between Yassa and Kuluguma. Rumbling was heard on 25 July from Bogia. Bright glow visible at night was attributed to ejected incandescent tephra. Sub-Plinian activity occurred on most nights during 21-31 July. Small lava flows descended the SW flank.
Four pyroclastic flows traveled down the SE flank on 30 July (at 0638, 0640, during 1200-1300, and at 1428). The first event was the largest, and generated an ash plume that rose 1.8 km above the crater and drifted NW. As before, all four flows were again channeled into the SE valley. Emissions from Main Crater were milder and mostly characterized by white and bluish plumes, and occasional gray ash plumes. The Alert Level remained at Stage 2. Seismicity fluctuated, and was very high during 16-17 July 2012, dominated by sub-continuous to continuous volcanic tremors. RSAM ranged between 500 and 700. It declined thereafter to 150-300 units between 18 and 20 July before increasing again rapidly to 700 on the 21st. The reduced seismicity between 18 and 20 coincided with the reduced summit activity. Seismicity remained at a very high level (700 RSAM units) for the next few days before declining again to another low (300 RSAM units) on 26 July. There was one more phase of high activity (700 RSAM units) between 28 - 30 July, before RSAM became steady at 450 until the end of the month. The electronic tiltmeter remained out of service.
2013 activity. RVO reported that dark gray ash plumes were occasionally emitted from Manam's Southern Crater during 8-12 January. At about 1000 on 12 January a sub-Plinian eruption generated ash plumes that rose 1.4-1.5 km above the crater; activity peaked between 1200 and 1300. The ash plumes drifted SW, S, and SE, producing ashfall on the island in areas downwind and light ashfall in Bogia (23 km SSW). Activity decreased after 1600, and ash plumes rose only 500 m above the crater. At night ejected incandescent material was observed. Ejected material and ashfall was deposited in the SE and SW valleys. Ash plumes drifted S during 13-14 January. White vapor plumes rose from Main Crater during the reporting period. Based on observations of satellite imagery and wind data analyses, the Darwin VAAC reported that an ash plume rose to an altitude of 3 km a.s.l. on 28 January and drifted 22 km E. The next day an ash plume drifted 93 km NE, and then later another ash plume drifted 55 km NE at an altitude of 4.3 km a.s.l.
Seismicity was low on 8 January with RSAM value was 80. But beginning on 9 January it started to gradually increase, reaching a moderate level early on the 11th. RSAM had by then reached 200. Seismicity continued to increase, as RSAM reached 550 between 1000 and 1100, which coincided with the commencement of the small sub-Plinian eruption reported above. RSAM reached a peak of 620 at about 2300 on 12 January before it subsided to about 320 at 0500 on 13 January. RSAM fluctuated between 230 and 600 until the end of the reporting period. Seismicity was characterized by frequent small low frequency earthquakes during low to moderate seismicity and by sub-continuous to continuous volcanic tremors during high seismicity. Data from the electronic tiltmeter did not show any significant changes.
Based on observations of satellite imagery and wind data analyses, the Darwin VAAC reported that an ash plume rose to an altitude of 10.1 km a.s.l. on 12 February and drifted 55 km SW. On 16 February an ash plume rose to an altitude of 3.4 km a.s.l. and drifted over 35 km NW.
RVO reported that on 1 March Main and Southern Craters emitted small amounts of diffuse white vapor; the craters were either partially or totally obscured by meteorological cloud cover. On 4 and 7 March intermittent gray ash plumes rose 300 m, above the cloud cover. RSAM values remained at a near-background level of 120. A gradual increase began on 2 March, reaching a peak of about 350 on 6 March before declining again to 300 on 7 March. The increase in RSAM on the 6 March was attributed to a increase in the number and size of low frequency earthquakes and occasional sub-continuous volcanic tremors. Ground deformation data from the electronic tiltmeter fluctuated within a steady trend.
Based on analysis of satellite images, pilot observations, and wind data analyses, the VAAC reported that on 14 March an ash plume rose to altitudes of 6.1-7.6 km a.s.l. and drifted 110-150 km ESE.
Based on analysis of satellite imagery (MT Sat) and wind data analyses, the Darwin VAAC reported that on 10-11 April an ash plume rose to altitudes of ~ 2 km and and drifted 75 km W. RVO reported that Manam's high level of activity continued on 15 April. Ash plumes rose 500 m above the crater. A loud explosion was heard at 0804. At about 1950 dense ash plumes rose 2 km and drifted SW. At night loud jet-like noises were reported by residents in Bogia. Lava was observed flowing from a new vent on the headwall of SW valley during a brief clear period from 1800 to 1850. Ash and scoria fell in most villages between Dugulava, on the SW side of the island, and Kuluguma on the NW side. Similar activity continued during the first half of 16 April, including a small pyroclastic flow that occurred around 1359 that was channeled into SE valley. Thereafter, the activity was characterized by gentle light gray ash emissions until 20 April.
During the high activity between 13 and 16 April, the formation of two new sub-terminal vents was reported. The exact timing is unclear due to occasional cloud cover around the summit area. The first vent probably formed on 13 April on the side of the headwall of SW valley. The vent was seen releasing lava effusively into SW valley. The second vent formed sometime during the evening of the 15 April E of Southern Crater in SE valley at an approximately similar elevation as those formed in mid 2012.
Seismicity, reflecting activity at the summit, was high on 15 April with RSAM readings fluctuating ~ 700. It declined slowly from 16 April and, as of the 18 April, it reached a moderate level with RSAM of 370, then declined again to 220. The down-tilt or deflation towards the summit area stopped around 15 April. Subsequently, information from the electronic tiltmeter was stable.
RVO reported that on 23 April dense white vapor plumes occasionally rose from Southern Crater. During 25-28 April ash clouds rose from the new sub-terminal vent E of Southern Crater inside the SE valley. The ash clouds rose 600 m and drifted NW. Loud booming noises were heard each day; however, between 0700 and 1900 on 27 April the noises became more frequent, louder, and explosive in nature, and were heard at Bogia. Seismicity remained high and swung around in the latter part of 25 April and increased steadily until it reached peak activity on the 28 April, before dropping slightly. Corresponding RSAM values increased from 220 on the 25 April, to 650 on the 28 April, and thereafter dropped to 500. Seismicity was characterized by small to moderate low frequency earthquakes.
Information from the electronic tiltmeter did not show any significant movements. RVO reported that during 29 April-16 May activity at Manam was low, characterized by white and occasionally blue vapor plumes rising from Southern Crater. White vapor plumes also rose from Main Crater. Seismicity fluctuated at high level between 29 April and 1 May; RSAM ranged between 500-700. After 1 May it started to decline, reaching a low level on 4 May and remaining low for the remainder of the reporting period. The corresponding RSAM at low level ranged between 50 and 100. RVO reminded people to stay away from the four main radial valleys, and especially the SE and SW ones, because most products from the activity at Southern Crater were channeled into these two valleys. No significant surface deformation was detected by the electronic tiltmeter.
Digital book in press. A new academic, digital book has sections that clearly relate to Manam (Johnson, 2013, in press). From the table of contents, those sections are (9) Tony Taylor and an Eruption Time Cluster: 1951-1966, Evacuation of Manam and the 1956-66 Eruptions and (14) Eruptions of the Early Twenty-first Century: 1998-2008. Manam, 2004-5: Abandoning a Volcanic Island?
Reference. Johnson, RW, (2013, in press), Fire Mountains of the Islands: A History of Volcanic Eruptions and Disaster Management in Papua New Guinea and the Solomon Islands, Australian National University E-press (ANU E Press (URL: http://epress.anu.edu.au/).
Geologic Background. The 10-km-wide island of Manam, lying 13 km off the northern coast of mainland Papua New Guinea, is one of the country's most active volcanoes. Four large radial valleys extend from the unvegetated summit of the conical basaltic-andesitic stratovolcano to its lower flanks. These valleys channel lava flows and pyroclastic avalanches that have sometimes reached the coast. Five small satellitic centers are located near the island's shoreline on the northern, southern, and western sides. Two summit craters are present; both are active, although most observed eruptions have originated from the southern crater, concentrating eruptive products during much of the past century into the SE valley. Frequent eruptions, typically of mild-to-moderate scale, have been recorded since 1616. Occasional larger eruptions have produced pyroclastic flows and lava flows that reached flat-lying coastal areas and entered the sea, sometimes impacting populated areas.
Information Contacts: Rabaul Volcano Observatory (RVO), PO Box 386, Rabaul, Papua New Guinea; Darwin Volcanic Ash Advisory Centre (VAAC) (URL: http://www.bom.gov.au/info/vaac/).
Reventador (Ecuador) — June 2013 Cite this Report
Reventador
Ecuador
0.077°S, 77.656°W; summit elev. 3562 m
All times are local (unless otherwise noted)
Lava dome's summit rises above rim in late 2012
The last report on Reventador covered activity through 26 April 2012 (BGVN 37:03) and this one covers activity through April 2013.
In its Special Report of 9 November 2012, Ecuador's Instituto Geofísico-Escuela Politécnica Nacional (IG) summarized the new phase of activity that began in February 2012. The Special Report noted that lava flows traveled as far as 2 km from the crater down the N and S flanks. Later reports noted that in November-December 2012, lava flows reached 1.3 km in length; in January 2013 they reached up to 1.1 km in length. During this reporting interval, ash plumes rose as high as 5.2 km altitude both in August 2012 and November 2013.
The lava dome in the interior of the crater continued to grow and between November 2012 and January 2013 established a new summit that reached to at least 100 m above the E rim, having completely filled the crater developed in November 2002. This enabled blocks from the lava dome to roll down the flanks.
Table 6. A non-comprehensive synthesis of Reventador's steam and ash plumes generated during the reporting period. Courtesy of IG and the Washington VAAC.
| Date |
Plume altitude OR height above (3.5 km a.s.l.) rim / direction / distance |
Comments |
| 11 Aug 2012 |
Ash plume rising to 5.2 km trended W |
-- |
| 20 Sep 2012 |
Ash plume drifted 22 km SW |
-- |
| 17-18 Oct 2012 |
Steam and gas plume rose to 1 km and trended W |
-- |
| 3-4 Nov 2012 |
Steam and ash plume rose to 3 km above the crater. |
-- |
| 5 Nov 2012 |
Steam and ash plume rose to 3 km; ash plume rose to 2 km and drifted NW |
-- |
| 13 Nov 2012 |
Gas and ash plume rose to 5.2 km and drifted SE |
-- |
| 16 Nov 2012 |
Ash plume rose to 4 km above the rim and drifted W and NW |
Ashfall reported between Reventador and El Chaco (35 km SSW) |
| 22 January 2013 |
Gas and steam plume rose 1.5 km above the crater; white-to-light grey plumes rose 2 km and drifted W |
-- |
| 24 January 2013 |
Steam and ash plume rose 2 km |
-- |
| 29 January 2013 |
Gas plumes rose as high as 1 km and drifted NW and W |
-- |
| 29 January 2013 |
Overflight revealed steam and ash plume rising to 1.5 km above the lava dome; |
-- |
| 4 February 2013 |
Ash plume rose to 4 km and drifted NW |
-- |
| 7 February 2013 |
Ash plume rose to 3 km and drifted S |
-- |
| 2 March 2013 |
Ash plume rose to 4 km and drifted SW |
-- |
| 8 March 2013 |
Steam emission rose to 500 above the crater |
Glow reported |
| 12 March 2013 |
Emission rose to 2 km and drifted W |
-- |
| 13 March 2013 |
Ash plumes rose to 3 km |
-- |
| 16 March 2013 |
Ash plume rose to 1 km and drifted W |
-- |
| 31 March 2013 |
Steam emission rose to 500 above the crater and trended W |
-- |
| 8 April 2013 |
Emissions reached to 3 km above the crater |
-- |
| 12 April 2013 |
Steam emissions reached to 2 km |
-- |
Between late April and early August 2012, activity at Reventador remained moderate, and although cloud cover often obscured visual observations, there were occasional reports of steam emissions rising to as high as 1 km above the crater. Long-period (LP) earthquakes occurred with moderate-to-high intensity, a behavior interpreted as the movement of fluids at depths. Seismic signals attributed to rock fall were also prominent, inferred to come from lava flows that descended the N flank, as aerial observers witnessed on both 29 May and 4 June.
Based on analysis of satellite imagery, the Washington Volcanic Ash Advisory Center (VAAC) reported that on 12 August they detected a well-defined thermal anomaly. Thermal images obtained in overflights carried out on 17 and 18 October 2012 revealed a lava flow that descended the flank of the cone and verified that another flow had descended during the preceding days or weeks and at the moment of observation was still warm. The flows did not exceed 1 km in length, and in light of their location within the crater, were not a danger to the public (figure 39).
On 17 and 18 October, IG also verified the presence of a previously known lava dome within the crater, with steep slopes, the top of which was then the highest point of the volcano. Similar observations were carried out on 19 October by IGEPN technicians maintaining the monitoring network, who also stressed the continuous flow of lava blocks spilling off both the fronts of new flows and from the lava dome.
During 31 October-11 December 2012, the IG reported that although cloud cover often prevented visual observations, ash plumes were often seen.
Seismicity increased during this time period. Around 5 November, the seismic network detected an increase in the magnitude of volcanic tremor. IG reported that seismicity indicated falling rock and explosions during 14-15 November. Beginning 16 November IG's seismic network indicated a significant increase in tremor and in signals indicative of emissions and explosions. IG reported that scientists aboard an overflight on 23 November observed intense fumarolic activity and a new crater at the summit of the dome, which contained ash and large blocks. A thermal camera measured temperatures at the dome of ~ 300°C. Lava flows continued to be active on the dome flanks, and elongated block-and-ash deposits were also visible on the flanks. IG reported high seismicity during 5-11 December 2012, indicating multiple explosions almost daily. At least one lava flow was generated between November - December 2012 that descended the N flank to ~1.3 km in length.
2013. Throughout this January-April 2013 reporting period, cloud cover often prevented visual surface observations. The lava dome grew between November 2012 through January 2013 to at least 100 m above the E rim, completely filling the crater generated by the eruption of November 2002. Between November 2002 and 31 January 2013, ~ 20 lava flows had traveled down the N, SE, and S flanks, and affected zones within the caldera.
IG reported moderate seismicity during 16-21 January 2013. During the morning of 22 January seismicity, including tremor, increased significantly, signals indicating that rock falls were detected. Low frequency, high-energy tremor was detected by seismic stations around the volcano with an average of 20 seismic events and an average of 29 explosions. Explosions were heard. Lava flows traveled down the SW and N flanks. Observers reported lava fountains in the crater and lava flows on the flanks, both of which became more intense at 1800. Explosions produced white-to-light-gray plumes that rose 2 km and drifted W (figure 40).
During the night of 22 January a lava flow descending the SE flank had reached a width of 350 m and extended at least 1.1 km (figure 41). Other smaller lava flows up to 200 m long were observed on the N and S flanks.
During 23 January-7 February 2013 seismicity remained high. Lava flows were visible at night. Crater incandescence was observed at night during 29-30 January.
IG reported that seismicity became more moderate during 8-12 February; explosions were detected daily. Ashfall was reported in areas near the volcano on 9 February. Between 16-20 February, activity remained moderate, with continued ash emissions, but an absence of reported ashfall. For the remainder of February 2013, no reports of surface activity were received, and seismic signals ceased transmission.
According to the Washington VAAC, the IG reported that on 2 March lava flows were observed. IG reported that the seismic network recorded multiple explosions during 13-17 March. Observers reported falling and rolling incandescent material on Reventador's S flanks on 12 March. On 15 and 17 March explosions were detected by the seismic network. IG characterized activity as being at a moderate level for most of the remainder of March.
IG noted that moderate activity continued into April 2013 (table 6). Through 12 April seismicity remained moderate. On 15 April IG reported an increase in the number of seismic events. Seismic and surface activity remained moderate to high through 24 April, but became more moderate thereafter and remained so for the remainder of April 2013.
Geologic Background. Volcán El Reventador is the most frequently active of a chain of Ecuadorian volcanoes in the Cordillera Real, well east of the principal volcanic axis. The forested, dominantly andesitic stratovolcano has 4-km-wide avalanche scarp open to the E formed by edifice collapse. A young, unvegetated, cone rises from the amphitheater floor to a height comparable to the rim. It has been the source of numerous lava flows as well as explosive eruptions visible from Quito, about 90 km ESE. Frequent lahars in this region of heavy rainfall have left extensive deposits on the scarp slope. The largest recorded eruption took place in 2002, producing a 17-km-high eruption column, pyroclastic flows that traveled up to 8 km, and lava flows from summit and flank vents.
Information Contacts: Instituto Geofísico-Escuela Politécnica Nacional (IG), Casilla 17-01-2759, Quito, Ecuador (URL: http://www.igepn.edu.ec/); and Washington Volcanic Ash Advisory Center (VAAC), Satellite Analysis Branch (SAB), NOAA/NESDIS E/SP23, NOAA Science Center Room 401, 5200 Auth Rd, Camp Springs, MD 20746, USA (URL: http://www.ospo.noaa.gov/Products/atmosphere/vaac/).
Nevado del Tolima (Colombia) — June 2013 Cite this Report
Nevado del Tolima
Colombia
4.658°N, 75.33°W; summit elev. 5215 m
All times are local (unless otherwise noted)
Non-eruptive during 2005-2012; hazard assessment and glacial retreat
During 2005-2012, Nevado del Tolima was non-eruptive and the Alert Level remained at IV (Green; "volcanically active with stable behavior") due to minimal seismicity and deformation. The Servicio Geológico Colombiano (SGC) monitored Tolima with a seismic network, tilt measurements, and regular field observations. The greatest changes at Tolima during this time period were related to the summit glacier that generated significant seismicity and surface activity. Volcano-tectonic (VT) and long-period (LP) earthquakes were also detected with the monitoring network, although these events were frequently too small to locate.
In this report, we also highlight geological hazards investigations by Thouret and others (1995); among the hazards, runout distances for lahars were determined as well as potential ash distribution areas. Further, we include the results of long-term studies focused on the summit glacier (figure 2); investigators noted significant retreat based on aerial photos and later, with Landsat image analysis.
Seismicity during March 2006 - December 2012. Based on volcano-tectonic (VT) and long-period (LP) earthquake counts, the SGC reported that low-level seismicity persisted during this reporting period (table 1). The occurrence of earthquakes was highest during 2006 when 22-90 VT and 5-20 LP events per month were recorded. From 2007 through 2012, VT and LP events occurred at a lower rate (0-73 VT per month and 0-17 LP per month).
Table 1. Monthly seismicity at Nevado del Tolima was tabulated by the occurrence of events: volcano-tectonic (VT), long-period (LP), Glacier & Rockfall, Unclassified, and Largest Earthquake magnitude. Events considered "Unclassified" are attributed to icequakes or rockfalls that do not fulfill the amplitude or duration parameters in order to be included in the SGC database. Note that these values have been corrected by the SGC database and differ from "Technical Bulletin" reports. Courtesy of SGC.
| Month |
VT |
LP |
Glacier & Rockfall |
Unclassified |
Largest EQ |
| Mar 2006 |
48 |
17 |
1717 |
3295 |
1.58 |
| Apr 2006 |
22 |
20 |
1150 |
2572 |
0.64 |
| May 2006 |
35 |
17 |
1460 |
2331 |
0.95 |
| Jun 2006 |
43 |
8 |
675 |
1551 |
1.08 |
| Jul 2006 |
39 |
8 |
340 |
729 |
1.14 |
| Aug 2006 |
26 |
9 |
352 |
927 |
0.81 |
| Sep 2006 |
31 |
5 |
565 |
1254 |
1.01 |
| Oct 2006 |
81 |
7 |
904 |
1639 |
1.35 |
| Nov 2006 |
77 |
8 |
644 |
1735 |
1.53 |
| Dec 2006 |
90 |
9 |
632 |
2221 |
1.45 |
| Jan 2007 |
0 |
12 |
1218 |
2615 |
1.72 |
| Feb 2007 |
4 |
0 |
979 |
3825 |
1.65 |
| Mar 2007 |
7 |
1 |
1345 |
6513 |
0.64 |
| Apr 2007 |
1 |
1 |
1171 |
5939 |
1.01 |
| May 2007 |
21 |
0 |
1544 |
4129 |
1.02 |
| Jun 2007 |
5 |
0 |
615 |
2107 |
0.64 |
| Jul 2007 |
2 |
2 |
746 |
2165 |
1.14 |
| Aug 2007 |
6 |
0 |
524 |
1692 |
2.27 |
| Sep 2007 |
5 |
1 |
522 |
1472 |
0.7 |
| Oct 2007 |
4 |
1 |
472 |
1115 |
1.96 |
| Nov 2007 |
3 |
2 |
270 |
966 |
0.86 |
| Dec 2007 |
7 |
0 |
434 |
1080 |
1.73 |
| Jan 2008 |
3 |
0 |
318 |
968 |
0.55 |
| Feb 2008 |
2 |
0 |
210 |
805 |
0.73 |
| Mar 2008 |
1 |
0 |
275 |
1083 |
-0.4 |
| Apr 2008 |
7 |
0 |
256 |
1453 |
1.62 |
| May 2008 |
5 |
0 |
265 |
1931 |
2.63 |
| Jun 2008 |
2 |
0 |
109 |
1207 |
0.88 |
| Jul 2008 |
6 |
0 |
125 |
1148 |
1.4 |
| Aug 2008 |
73 |
0 |
158 |
974 |
1.14 |
| Sep 2008 |
12 |
0 |
118 |
864 |
1.02 |
| Oct 2008 |
12 |
2 |
204 |
1157 |
0.81 |
| Nov 2008 |
2 |
0 |
263 |
1515 |
0.35 |
| Dec 2008 |
7 |
0 |
197 |
1242 |
0.45 |
| Jan 2009 |
7 |
0 |
185 |
1490 |
0.64 |
| Feb 2009 |
1 |
0 |
117 |
1017 |
0.45 |
| Mar 2009 |
3 |
0 |
257 |
2272 |
0.88 |
| Apr 2009 |
6 |
0 |
279 |
2245 |
1.3 |
| May 2009 |
8 |
0 |
275 |
2360 |
0.73 |
| Jun 2009 |
1 |
0 |
212 |
1846 |
0.88 |
| Jul 2009 |
10 |
0 |
100 |
1127 |
0.95 |
| Aug 2009 |
3 |
0 |
146 |
1881 |
2.2 |
| Sep 2009 |
8 |
0 |
127 |
1867 |
0.64 |
| Oct 2009 |
1 |
0 |
176 |
2757 |
0.23 |
| Nov 2009 |
0 |
0 |
329 |
1994 |
0 |
| Dec 2009 |
1 |
0 |
414 |
2055 |
-0.21 |
| Jan 2010 |
4 |
0 |
678 |
1703 |
0.35 |
| Feb 2010 |
0 |
1 |
637 |
1551 |
0.75 |
| Mar 2010 |
6 |
1 |
698 |
1638 |
1.08 |
| Apr 2010 |
0 |
1 |
878 |
1344 |
0.43 |
| May 2010 |
1 |
2 |
742 |
1746 |
1.4 |
| Jun 2010 |
0 |
1 |
491 |
1307 |
0.91 |
| Jul 2010 |
0 |
1 |
505 |
1173 |
1.46 |
| Aug 2010 |
0 |
0 |
329 |
1337 |
0 |
| Sep 2010 |
0 |
1 |
425 |
860 |
0.7 |
| Oct 2010 |
0 |
1 |
204 |
434 |
0.1 |
| Nov 2010 |
5 |
2 |
314 |
1286 |
0.73 |
| Dec 2010 |
2 |
2 |
256 |
1075 |
1.3 |
| Jan 2011 |
0 |
0 |
197 |
1002 |
0 |
| Feb 2011 |
3 |
2 |
393 |
1805 |
0.81 |
| Mar 2011 |
1 |
3 |
978 |
443 |
1.45 |
| Apr 2011 |
0 |
1 |
1370 |
1043 |
0.91 |
| May 2011 |
1 |
4 |
1114 |
659 |
0.96 |
| Jun 2011 |
2 |
1 |
692 |
252 |
1.02 |
| Jul 2011 |
7 |
0 |
709 |
246 |
1.58 |
| Aug 2011 |
0 |
1 |
897 |
216 |
0.81 |
| Sep 2011 |
0 |
5 |
1404 |
388 |
1.22 |
| Oct 2011 |
1 |
0 |
1665 |
427 |
0.88 |
| Nov 2011 |
2 |
2 |
1890 |
601 |
0.73 |
| Dec 2011 |
3 |
2 |
1923 |
927 |
0.96 |
| Jan 2012 |
2 |
0 |
2033 |
740 |
0.55 |
| Feb 2012 |
2 |
0 |
1471 |
159 |
0.81 |
| Mar 2012 |
4 |
15 |
1348 |
95 |
0.75 |
| Apr 2012 |
9 |
17 |
1379 |
310 |
1.65 |
| May 2012 |
30 |
6 |
1740 |
417 |
1.58 |
| Jun 2012 |
2 |
0 |
1290 |
372 |
1.02 |
| Jul 2012 |
3 |
2 |
888 |
519 |
0.88 |
| Aug 2012 |
0 |
0 |
792 |
988 |
0 |
| Sep 2012 |
27 |
0 |
1077 |
847 |
1.45 |
| Oct 2012 |
3 |
4 |
1920 |
1359 |
0.64 |
| Nov 2012 |
2 |
4 |
1332 |
1289 |
1.08 |
| Dec 2012 |
12 |
1 |
1873 |
na |
1.2 |
Seismic signals attributed to glacial changes ("icequakes") and rockfalls dominated the records during 2006-2012. Frequently, more than 1,000 events were recorded per month. During 2008-2010, such events were slightly less frequent; an average of 313 earthquakes occurred per month. Coincidentally, LP events were significantly less frequent during that time period as well (less than one event per month). From March 2006 to July 2007, rockfall signals were attributed to surface activity mainly occurring on the N flank and related to small avalanches of ice and rock. The SGC noted that the general summit area was the source of shallow seismicity from mid 2010 through 2012.
Because of sparse activity and low-magnitude events, hypocentral depths of VT earthquakes were rarely calculated during 2006-2012 (table 2). Five earthquakes were located in September 2012, the most to be located in a single month. Three of these earthquakes were located > 5 km of the summit (NW and SE), while 2 were within 1 km (figure 3). That month, seismicity was relatively high compared with previous months; the SGC reported 27 VT earthquakes and 1,077 "Glacier & Rockfall" signals.
Table 2. The number of located VT earthquakes from Tolima during 2011-2012. Located earthquake information was not available for 2006-2010. Courtesy of SGC.
| Date |
Earthquakes |
Depths (km) |
Location from Summit |
| Mar 2011 |
1 |
2 |
~1 km, N |
| Jul 2012 |
1 |
4 |
~6 km, NW |
| Sep 2012 |
5 |
3 & 4 |
-- |
| Oct 2012 |
2 |
~3.5 |
-- |
Surface deformation monitoring. An electronic tilt station was installed in 2011 and, by May 2011, data from the Esmeralda station (~2 km W) was being relayed to the SGC Manizales observatory (figure 4). Through the rest of 2011 and 2012, tilt data suggested the effects of local temperatures and fluctuations were within the expected range of the instrument. Changes of 70-95 and 75-100 μrad from the N and E components, respectively, were recorded on a monthly basis. During August-December 2012, fluctuations in tilt were associated with changes in the summit glacier's mass as well as variability due to local temperature changes.
Hazard assessment. Geologic mapping and a hazards analysis were conducted by Thouret and others (1995) (figure 5). They emphasized that they relied on the same appraisal methods as applied by Parra and others (1986) for Nevado del Ruiz. Three scenarios were developed based on three known events of different magnitudes (VEI 3, VEI 3-4, and VEI 4-5); the two plots within the lower left-hand inset map of figure 6 show the major characteristics of those scenarios.
Parameters for possible pyroclastic surges and ash-cloud surges were assessed for major valleys in the region, particularly Río Combeima, Río Totare and Río San Romualdo valleys, and the headwaters of Río Toche valleys (figure 6).
Rock or debris avalanches and lahars were also considered in the study; the authors stated that such events could be triggered by an earthquake or intrusion, and mobilized material had the likelihood of channelization within the deep Río Combeima gorge, a dangerous scenario due to the connectivity of the drainages that influence areas as distant as Ibague and Río Coello. Recent debris-flow deposits from volcanic and glacial sources dominated the aerial extent of the mapped region, particularly along the N slopes and within channels.
Thouret and others (1995) determined that lava flows would be the least hazardous phenomenon likely to occur; "extrusive activity [at Tolima] has been short-lived and is likely to produce block-lava flows such as those of young-Tolima age. Highly viscous and slow-moving block-lava flows could reach only 5-6 km when channeled, and likely move to the southeast or south. However, the very steep south flank would enable lava flows to travel more than 6 km if the chemical composition, physical properties, and hence viscosity of erupted magma changed."
Tolima glacial retreat. While hazards due to glacial ice interactions and volcanism were noted by some investigators (Thouret and others, 1995), other investigations of glaciers were conducted in this region due to interests in global climate change. An assessment conducted in 1976 concluded that five snowcapped volcanoes were present within the Parque Nacional de los Nevados: Tolima, Nevado del Ruiz (~25 km N of Tolima), Santa Isabel (~18 km NNW of Tolima), El Cisne (~20 km N of Tolima), and El Quindío (~10 km W of Tolima) (Hoyos-Patiño, 1998). According to Hoyos-Patiño (1998), El Cisne and El Quindío had almost lost their ice caps by 1976, maintaining less than 1 km2 of ephemeral snow- and ice-covered areas.
Glaciers and snowfields mapped by Landsat images of Tolima's summit in 1976 calculated a total area of 3.8 km2; aerial photo analysis from 1978 determined that 11 glaciers were present with a total area of 2.22 km2. Based on 2001 Landsat 7 image analysis by Morris and others (2006), the area of glacial extent was 1.26 km2; they calculated a loss of 43% from 1959 to 2001 (figure 7). For comparison, the largest ice loss from this region of Colombia occurred at Nevado del Ruiz, where ice coverage decreased from 21.4 km2 to 10.92 km2 during 1959-2001.
References. Hoyos-Patiño, F., 1998: Glaciers of Colombia, p. I:11-30, in R. S. Williams and J. G. Ferrigno, eds: Satellite Image Atlas of Glaciers of the World: South America, U.S. Geological Survey Prof. Paper 1386-1, 1206 pp.
Morris, J.N., Poole, A.J., and Klein, A.G., 2006, Retreat of Tropical Glaciers in Colombia and Venezuela from 1984 to 2004 as Measured from ASTER and Landsat Images, 63rd Eastern Snow Conference, Newark, Delaware.
Thouret, J.C., Cantagrel, J-M., Robin, C., Murcia, A., Salinas, R., and Cepeda, H., 1995, Quaternary eruptive history and hazard-zone model at Nevado del Tolima and Cerro Machín volcanoes, Colombia. Journal of Volcanology Geothermal Research, 66 (1-4):397-426.
Geologic Background. The steep-sided, glacier-covered Nevado del Tolima volcano contrasts with the broad profile of Nevado del Ruiz to the north. The andesitic-dacitic younger Tolima formed during the past 40,000 years, rising above and largely obscuring a 3-km-wide late-Pleistocene caldera. The summit consists of a cluster of late-Pleistocene to Holocene lava domes associated with thick block-lava flows on the N and E flanks, and extensive pyroclastic-flow deposits. The summit contains a funnel-shaped crater 200-300 m deep. Holocene activity has included explosive eruptions ranging in size from moderate to Plinian, and the last major eruption took place about 3,600 years ago. Lava dome growth has produced block-and-ash flows that traveled primarily to the NE and SE. Minor explosive eruptions have been recorded in the 19th and 20th centuries.
Information Contacts: María Luisa Monsalve, Gloria Patricia Cortés, and Lina Constanza García, Servicio Geológico Colombiano (SGC), Volcanological and Seismological Observatory, Avenida 12 Octubre 15-47, Manizales, Colombia (URL: https://www2.sgc.gov.co/volcanes/index.html).