Recently Published Bulletin Reports
Erebus (Antarctica) Lava lake remains active; most thermal alerts recorded since 2019
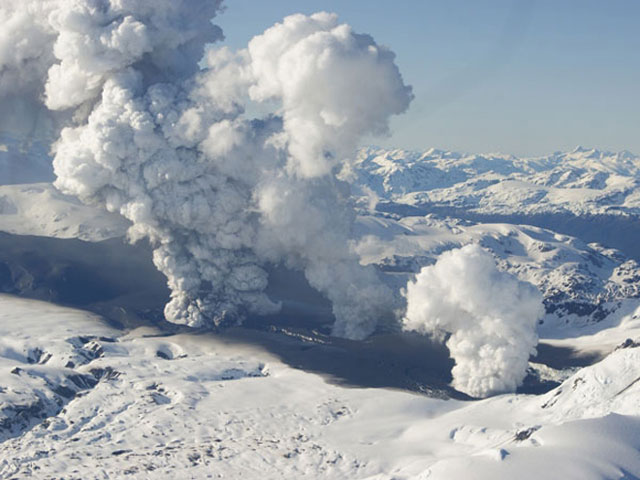
Rincon de la Vieja (Costa Rica) Frequent phreatic explosions during July-December 2023
Bezymianny (Russia) Explosion on 18 October 2023 sends ash plume 8 km high; lava flows and incandescent avalanches
Kilauea (United States) Low-level lava effusions in the lava lake at Halema’uma’u during July-December 2022
Nyamulagira (DR Congo) Lava flows and thermal activity during May-October 2023
Bagana (Papua New Guinea) Explosions, ash plumes, ashfall, and lava flows during April-September 2023
Mayon (Philippines) Lava flows, pyroclastic flows, ash emissions, and seismicity during April-September 2023
Nishinoshima (Japan) Eruption plumes and gas-and-steam plumes during May-August 2023
Krakatau (Indonesia) White gas-and-steam plumes and occasional ash plumes during May-August 2023
Villarrica (Chile) Strombolian activity, gas-and-ash emissions, and crater incandescence during April-September 2023
Merapi (Indonesia) Frequent incandescent avalanches during April-September 2023
Ebeko (Russia) Moderate explosive activity with ash plumes continued during June-November 2023
Erebus (Antarctica) — January 2024  Cite this Report
Erebus
Antarctica
77.53°S, 167.17°E; summit elev. 3794 m
All times are local (unless otherwise noted)
Lava lake remains active; most thermal alerts recorded since 2019
The lava lake in the summit crater of Erebus has been active since at least 1972. Located in Antarctica overlooking the McMurdo Station on Ross Island, it is the southernmost active volcano on the planet. Because of the remote location, activity is primarily monitored by satellites. This report covers activity during 2023.
The number of thermal alerts recorded by the Hawai'i Institute of Geophysics and Planetology’s MODVOLC Thermal Alerts System increased considerably in 2023 compared to the years 2020-2022 (table 9). In contrast to previous years, the MODIS instruments aboard the Aqua and Terra satellites captured data from Erebus every month during 2023. Consistent with previous years, the lowest number of anomalous pixels were recorded in January, November, and December.
Table 9. Number of monthly MODIS-MODVOLC thermal alert pixels recorded at Erebus during 2017-2023. See BGVN 42:06 for data from 2000 through 2016. The table was compiled using data provided by the HIGP – MODVOLC Thermal Alerts System.
| Year |
Jan |
Feb |
Mar |
Apr |
May |
Jun |
Jul |
Aug |
Sep |
Oct |
Nov |
Dec |
SUM |
| 2017 |
0 |
21 |
9 |
0 |
0 |
1 |
11 |
61 |
76 |
52 |
0 |
3 |
234 |
| 2018 |
0 |
21 |
58 |
182 |
55 |
17 |
137 |
172 |
103 |
29 |
0 |
0 |
774 |
| 2019 |
2 |
21 |
162 |
151 |
55 |
56 |
75 |
53 |
29 |
19 |
1 |
0 |
624 |
| 2020 |
0 |
2 |
16 |
18 |
4 |
4 |
1 |
3 |
18 |
3 |
1 |
6 |
76 |
| 2021 |
0 |
9 |
1 |
0 |
2 |
56 |
46 |
47 |
35 |
52 |
5 |
3 |
256 |
| 2022 |
1 |
13 |
55 |
22 |
15 |
32 |
39 |
19 |
31 |
11 |
0 |
0 |
238 |
| 2023 |
2 |
33 |
49 |
82 |
41 |
32 |
70 |
64 |
42 |
17 |
5 |
11 |
448 |
Sentinel-2 infrared images showed one or two prominent heat sources within the summit crater, accompanied by adjacent smaller sources, similar to recent years (see BGVN 46:01, 47:02, and 48:01). A unique image was obtained on 25 November 2023 by the OLI-2 (Operational Land Imager-2) on Landsat 9, showing the upper part of the volcano surrounded by clouds (figure 32).
Geologic Background. Mount Erebus, the world's southernmost historically active volcano, overlooks the McMurdo research station on Ross Island. It is the largest of three major volcanoes forming the crudely triangular Ross Island. The summit of the dominantly phonolitic volcano has been modified by one or two generations of caldera formation. A summit plateau at about 3,200 m elevation marks the rim of the youngest caldera, which formed during the late-Pleistocene and within which the modern cone was constructed. An elliptical 500 x 600 m wide, 110-m-deep crater truncates the summit and contains an active lava lake within a 250-m-wide, 100-m-deep inner crater; other lava lakes are sometimes present. The glacier-covered volcano was erupting when first sighted by Captain James Ross in 1841. Continuous lava-lake activity with minor explosions, punctuated by occasional larger Strombolian explosions that eject bombs onto the crater rim, has been documented since 1972, but has probably been occurring for much of the volcano's recent history.
Information Contacts: Hawai'i Institute of Geophysics and Planetology (HIGP) - MODVOLC Thermal Alerts System, School of Ocean and Earth Science and Technology (SOEST), Univ. of Hawai'i, 2525 Correa Road, Honolulu, HI 96822, USA (URL: http://modis.higp.hawaii.edu/); Copernicus Browser, Copernicus Data Space Ecosystem, European Space Agency (URL: https://dataspace.copernicus.eu/browser/); NASA Earth Observatory, EOS Project Science Office, NASA Goddard Space Flight Center, Goddard, Maryland, USA (URL: https://earthobservatory.nasa.gov/images/152134/erebus-breaks-through).
Rincon de la Vieja (Costa Rica) — January 2024 Cite this Report
Rincon de la Vieja
Costa Rica
10.83°N, 85.324°W; summit elev. 1916 m
All times are local (unless otherwise noted)
Frequent phreatic explosions during July-December 2023
Rincón de la Vieja is a volcanic complex in Costa Rica with a hot convecting acid lake that exhibits frequent weak phreatic explosions, gas-and-steam emissions, and occasional elevated sulfur dioxide levels (BGVN 45:10, 46:03, 46:11). The current eruption period began June 2021. This report covers activity during July-December 2023 and is based on weekly bulletins and occasional daily reports from the Observatorio Vulcanologico Sismologica de Costa Rica-Universidad Nacional (OVSICORI-UNA).
Numerous weak phreatic explosions continued during July-December 2023, along with gas-and-steam emissions and plumes that rose as high as 3 km above the crater rim. Many weekly OVSICORI-UNA bulletins included the previous week's number of explosions and emissions (table 9). For many explosions, the time of explosion was given (table 10). Frequent seismic activity (long-period earthquakes, volcano-tectonic earthquakes, and tremor) accompanied the phreatic activity.
Table 9. Number of reported weekly phreatic explosions and gas-and-steam emissions at Rincón de la Vieja, July-December 2023. Counts are reported for the week before the Weekly Bulletin date; not all reports included these data. Courtesy of OVSICORI-UNA.
| OVSICORI Weekly Bulletin |
Number of explosions |
Number of emissions |
| 28 Jul 2023 |
6 |
14 |
| 4 Aug 2023 |
10 |
12 |
| 1 Sep 2023 |
13 |
11 |
| 22 Sep 2023 |
12 |
13 |
| 29 Sep 2023 |
6 |
11 |
| 6 Oct 2023 |
12 |
5 |
| 13 Oct 2023 |
7 |
9 |
| 20 Oct 2023 |
1 |
15 |
| 27 Oct 2023 |
3 |
23 |
| 3 Nov 2023 |
3 |
10 |
| 17 Nov 2023 |
0 |
Some |
| 24 Nov 2023 |
0 |
14 |
| 8 Dec 2023 |
4 |
16 |
| 22 Dec 2023 |
8 |
18 |
Table 10. Summary of activity at Rincón de la Vieja during July-December 2023. Weak phreatic explosions and gas emissions are noted where the time of explosion was indicated in the weekly or daily bulletins. Height of plumes or emissions are distance above the crater rim. Courtesy of OVSICORI-UNA.
| Date |
Time |
Description of Activity |
| 1 Jul 2023 |
0156 |
Explosion. |
| 2 Jul 2023 |
0305 |
Explosion. |
| 4 Jul 2023 |
0229, 0635 |
Event at 0635 produced a gas-and-steam plume that rose 700 m and drifted W; seen by residents in Liberia (21 km SW). |
| 9 Jul 2023 |
1843 |
Explosion. |
| 21 Jul 2023 |
0705 |
Explosion. |
| 26 Jul 2023 |
1807 |
Explosion. |
| 28 Jul 2023 |
0802 |
Explosion generated a gas-and-steam plume that rose 500 m. |
| 30 Jul 2023 |
1250 |
Explosion. |
| 31 Jul 2023 |
2136 |
Explosion. |
| 11 Aug 2023 |
0828 |
Explosion. |
| 18 Aug 2023 |
1304 |
Explosion. |
| 21 Aug 2023 |
1224 |
Explosion generated gas-and-steam plumes rose 500-600 m. |
| 22 Aug 2023 |
0749 |
Explosion generated gas-and-steam plumes rose 500-600 m. |
| 24 Aug 2023 |
1900 |
Explosion. |
| 25 Aug 2023 |
0828 |
Event produced a steam-and-gas plume that rose 3 km and drifted NW. |
| 27-28 Aug 2023 |
0813 |
Four small events; the event at 0813 on 28 August lasted two minutes and generated a steam-and-gas plume that rose 2.5 km. |
| 1 Sep 2023 |
1526 |
Explosion generated plume that rose 2 km and ejected material onto the flanks. |
| 2-3 Sep 2023 |
- |
Small explosions detected in infrasound data. |
| 4 Sep 2023 |
1251 |
Gas-and-steam plume rose 1 km and drifted W. |
| 7 Nov 2023 |
1113 |
Explosion. |
| 8 Nov 2023 |
0722 |
Explosion. |
| 12 Nov 2023 |
0136 |
Small gas emissions. |
| 14 Nov 2023 |
0415 |
Small gas emissions. |
According to OVSICORI-UNA, during July-October the average weekly sulfur dioxide (SO2) flux ranged from 68 to 240 tonnes/day. However, in mid-November the flux increased to as high as 334 tonnes/day, the highest value measured in recent years. The high SO2 flux in mid-November was also detected by the TROPOMI instrument on the Sentinel-5P satellite (figure 43).
Geologic Background. Rincón de la Vieja, the largest volcano in NW Costa Rica, is a remote volcanic complex in the Guanacaste Range. The volcano consists of an elongated, arcuate NW-SE-trending ridge constructed within the 15-km-wide early Pleistocene Guachipelín caldera, whose rim is exposed on the south side. Sometimes known as the "Colossus of Guanacaste," it has an estimated volume of 130 km3 and contains at least nine major eruptive centers. Activity has migrated to the SE, where the youngest-looking craters are located. The twin cone of Santa María volcano, the highest peak of the complex, is located at the eastern end of a smaller, 5-km-wide caldera and has a 500-m-wide crater. A Plinian eruption producing the 0.25 km3 Río Blanca tephra about 3,500 years ago was the last major magmatic eruption. All subsequent eruptions, including numerous historical eruptions possibly dating back to the 16th century, have been from the prominent active crater containing a 500-m-wide acid lake located ENE of Von Seebach crater.
Information Contacts: Observatorio Vulcanológico Sismológica de Costa Rica-Universidad Nacional (OVSICORI-UNA), Apartado 86-3000, Heredia, Costa Rica (URL: http://www.ovsicori.una.ac.cr/); NASA Global Sulfur Dioxide Monitoring Page, Atmospheric Chemistry and Dynamics Laboratory, NASA Goddard Space Flight Center (NASA/GSFC), 8800 Greenbelt Road, Goddard MD 20771, USA (URL: https://so2.gsfc.nasa.gov/).
Bezymianny (Russia) — November 2023 Cite this Report
Bezymianny
Russia
55.972°N, 160.595°E; summit elev. 2882 m
All times are local (unless otherwise noted)
Explosion on 18 October 2023 sends ash plume 8 km high; lava flows and incandescent avalanches
Bezymianny, located on Russia’s Kamchatka Peninsula, has had eruptions since 1955 characterized by dome growth, explosions, pyroclastic flows, ash plumes, and ashfall. Activity during November 2022-April 2023 included gas-and-steam emissions, lava dome collapses generating avalanches, and persistent thermal activity. Similar eruptive activity continued from May through October 2023, described here based on information from weekly and daily reports of the Kamchatka Volcano Eruptions Response Team (KVERT), notices from Tokyo VAAC (Volcanic Ash Advisory Center), and from satellite data.
Overall activity decreased after the strong period of activity in late March through April 2023, which included ash explosions during 29 March and 7-8 April 2023 that sent plumes as high as 10-12 km altitude, along with dome growth and lava flows (BGVN 48:05). This reduced activity can be seen in the MIROVA thermal detection system graph (figure 56), which was consistent with data from the MODVOLC thermal detection system and with Sentinel-2 satellite images that showed persistent hotspots in the summit crater when conditions allowed observations. A renewed period of strong activity began in mid-October 2023.
Activity increased significantly on 17 October 2023 when large collapses began during 0700-0830 on the E flanks of the lava dome and continued to after 0930 the next day (figure 57). Ash plumes rose to an altitude of 4.5-5 km, extending 220 km NNE by 18 October. A large explosion at 1630 on 18 October produced an ash plume that rose to an altitude of 11 km (8 km above the summit) and drifted NNE and then NW, extending 900 km NW within two days at an altitude of 8 km. Minor ashfall was noted in Kozyrevsk (45 km WNW). At 0820 on 20 October an ash plume was identified in satellite images drifting 100 km ENE at altitudes of 4-4.5 km.
Lava flows and hot avalanches from the dome down the SE flank continued over the next few days, including 23 October when clear conditions allowed good observations (figures 58 and 59). A large thermal anomaly was observed over the volcano through 24 October, and in the summit crater on 30 October (figure 60). Strong fumarolic activity continued, with numerous avalanches and occasional incandescence. By the last week of October, volcanic activity had decreased to a level consistent with that earlier in the reporting period.
Aviation warnings were frequently updated during 17-20 October. KVERT issued a Volcano Observatory Notice for Aviation (VONA) on 17 October at 1419 and 1727 (0219 and 0527 UTC) raising the Aviation Color Code (ACC) from Yellow to Orange (second highest level). The next day, KVERT issued a VONA at 1705 (0505 UTC) raising the ACC to Red (highest level) but lowered it back to Orange at 2117 (0917 UTC). After another decrease to Yellow and back to Orange, the ACC was reduced to Yellow on 20 October at 1204 (0004 UTC). In addition, the Tokyo VAAC issued a series of Volcanic Ash Advisories beginning on 16 October and continuing through 30 October.
Geologic Background. The modern Bezymianny, much smaller than its massive neighbors Kamen and Kliuchevskoi on the Kamchatka Peninsula, was formed about 4,700 years ago over a late-Pleistocene lava-dome complex and an edifice built about 11,000-7,000 years ago. Three periods of intensified activity have occurred during the past 3,000 years. The latest period, which was preceded by a 1,000-year quiescence, began with the dramatic 1955-56 eruption. This eruption, similar to that of St. Helens in 1980, produced a large open crater that was formed by collapse of the summit and an associated lateral blast. Subsequent episodic but ongoing lava-dome growth, accompanied by intermittent explosive activity and pyroclastic flows, has largely filled the 1956 crater.
Information Contacts: Kamchatka Volcanic Eruptions Response Team (KVERT), Far Eastern Branch, Russian Academy of Sciences, 9 Piip Blvd., Petropavlovsk-Kamchatsky, 683006, Russia (URL: http://www.kscnet.ru/ivs/kvert/); Kamchatka Volcanological Station, Kamchatka Branch of Geophysical Survey, (KB GS RAS), Klyuchi, Kamchatka Krai, Russia (URL: http://volkstat.ru/); Tokyo Volcanic Ash Advisory Center (VAAC), 1-3-4 Otemachi, Chiyoda-ku, Tokyo 100-8122, Japan (URL: http://ds.data.jma.go.jp/svd/vaac/data/); Hawai'i Institute of Geophysics and Planetology (HIGP) - MODVOLC Thermal Alerts System, School of Ocean and Earth Science and Technology (SOEST), Univ. of Hawai'i, 2525 Correa Road, Honolulu, HI 96822, USA (URL: http://modis.higp.hawaii.edu/); MIROVA (Middle InfraRed Observation of Volcanic Activity), a collaborative project between the Universities of Turin and Florence (Italy) supported by the Centre for Volcanic Risk of the Italian Civil Protection Department (URL: http://www.mirovaweb.it/); Copernicus Browser, Copernicus Data Space Ecosystem, European Space Agency (URL: https://dataspace.copernicus.eu/browser/).chr
Kilauea (United States) — January 2023 Cite this Report
Kilauea
United States
19.421°N, 155.287°W; summit elev. 1222 m
All times are local (unless otherwise noted)
Low-level lava effusions in the lava lake at Halema’uma’u during July-December 2022
Kīlauea is the southeastern-most volcano in Hawaii and overlaps the E flank of the Mauna Loa volcano. Its East Rift Zone (ERZ) has been intermittently active for at least 2,000 years. An extended eruption period began in January 1983 and was characterized by open lava lakes and lava flows from the summit caldera and the East Rift Zone. During May 2018 magma migrated into the Lower East Rift Zone (LERZ) and opened 24 fissures along a 6-km-long NE-trending fracture zone that produced lava flows traveling in multiple directions. As lava emerged from the fissures, the lava lake at Halema'uma'u drained and explosions sent ash plumes to several kilometers altitude (BGVN 43:10).
The current eruption period started during September 2021 and has recently been characterized by lava effusions, spatter, and sulfur dioxide emissions in the active Halema’uma’u lava lake (BGVN 47:08). Lava effusions, some spatter, and sulfur dioxide emissions have continued during this reporting period of July through December 2022 using daily reports, volcanic activity notices, and abundant photo, map, and video data from the US Geological Survey's (USGS) Hawaiian Volcano Observatory (HVO).
Summary of activity during July-December 2022. Low-level effusions have continued at the western vent of the Halema’uma’u crater during July through early December 2022. Occasional weak ooze-outs (also called lava break outs) would occur along the margins of the crater floor. The overall level of the active lava lake throughout the reporting period gradually increased due to infilling, however it stagnated in mid-September (table 13). During September through November, activity began to decline, though lava effusions persisted at the western vent. By 9 December, the active part of the lava lake had completely crusted over, and incandescence was no longer visible.
Table 13. Summary of measurements taken during overflights at Kīlauea that show a gradual increase in the active lava lake level and the volume of lava effused since 29 September 2021. Lower activity was reported during September-October. Data collected during July-December 2022. Courtesy of HVO.
| Date: |
Level of the active lava lake (m): |
Cumulative volume of lava effused (million cubic meters): |
| 7 Jul 2022 |
130 |
95 |
| 19 Jul 2022 |
133 |
98 |
| 4 Aug 2022 |
136 |
102 |
| 16 Aug 2022 |
137 |
104 |
| 12 Sep 2022 |
143 |
111 |
| 5 Oct 2022 |
143 |
111 |
| 28 Oct 2022 |
143 |
111 |
Activity during July 2022. Lava effusions were reported from the western vent in the Halema’uma’u crater, along with occasional weak ooze-outs along the margins of the crater floor. The height of the lava lake was variable due to deflation-inflation tilt events; for example, the lake level dropped approximately 3-4 m during a summit deflation-inflation event reported on 1 July. Webcam images taken during the night of 6-12 July showed intermittent low-level spattering at the western vent that rose less than 10 m above the vent (figure 519). Measurements made during an overflight on 7 July indicated that the crater floor was infilled about 130 m and that 95 million cubic meters of lava had been effused since 29 September 2021. A single, relatively small lava ooze-out was active to the S of the lava lake. Around midnight on 8 July there were two brief periods of lava overflow onto the lake margins. On 9 July lava ooze-outs were reported near the SE and NE edges of the crater floor and during 10-11 July they occurred near the E, NE, and NW edges. On 16 July crater incandescence was reported, though the ooze-outs and spattering were not visible. On 18 July overnight webcam images showed incandescence in the western vent complex and two ooze-outs were reported around 0000 and 0200 on 19 July. By 0900 there were active ooze-outs along the SW edge of the crater floor. Measurements made from an overflight on 19 July indicated that the crater floor was infilled about 133 m and 98 million cubic meters of lava had erupted since 29 September 2021 (figure 520). On 20 July around 1600 active ooze-outs were visible along the N edge of the crater, which continued through the next day. Extensive ooze-outs occurred along the W margin during 24 July until 1900; on 26 July minor ooze-outs were noted along the N margin. Minor spattering was visible on 29 July along the E margin of the lake. The sulfur dioxide emission rates ranged 650-2,800 tons per day (t/d), the higher of which was measured on 8 July (figure 519).
Activity during August 2022. The eruption continued in the Halema’uma’u crater at the western vent. According to HVO the lava in the active lake remained at the level of the bounding levees. Occasional minor ooze-outs were observed along the margins of the crater floor. Strong nighttime crater incandescence was visible after midnight on 6 August over the western vent cone. During 6-7 August scattered small lava lobes were active along the crater floor and incandescence persisted above the western vent through 9 August. During 7-9 August HVO reported a single lava effusion source was active along the NW margin of the crater floor. Measurements from an overflight on 4 August indicated that the crater floor was infilled about 136 m total and that 102 million cubic meters of lava had been erupted since the start of the eruption. Lava breakouts were reported along the N, NE, E, S, and W margins of the crater during 10-16 August. Another overflight survey conducted on 16 August indicated that the crater floor infilled about 137 m and 104 million cubic meters of lava had been erupted since September 2021. Measured sulfur dioxide emissions rates ranged 1,150-2,450 t/d, the higher of which occurred on 8 August.
Activity during September 2022. During September, lava effusion continued from the western vent into the active lava lake and onto the crater floor. Intermittent minor ooze-outs were reported through the month. A small ooze-out was visible on the W crater floor margin at 0220 on 2 September, which showed decreasing surface activity throughout the day, but remained active through 3 September. On 3 September around 1900 a lava outbreak occurred along the NW margin of the crater floor but had stopped by the evening of 4 September. Field crews monitoring the summit lava lake on 9 September observed spattering on the NE margin of the lake that rose no higher than 10 m, before falling back onto the lava lake crust (figure 521). Overflight measurements on 12 September indicated that the crater floor was infilled a total of 143 m and 111 million cubic meters of lava had been erupted since September 2021. Extensive breakouts in the W and N part of the crater floor were reported at 1600 on 20 September and continued into 26 September. The active part of the lava lake dropped by 10 m while other parts of the crater floor dropped by several meters. Summit tiltmeters recorded a summit seismic swarm of more than 80 earthquakes during 1500-1800 on 21 September, which occurred about 1.5 km below Halema’uma’u; a majority of these were less than Mw 2. By 22 September the active part of the lava lake was infilled about 2 m. On 23 September the western vent areas exhibited several small spatter cones with incandescent openings, along with weak, sporadic spattering (figure 522). The sulfur dioxide emission rate ranged from 930 t/d to 2,000 t/d, the higher of which was measured on 6 September.
Activity during October 2022. Activity during October declined slightly compared to previous months, though lava effusions persisted from the western vent into the active lava lake and onto the crater floor during October (figure 523). Slight variations in the lava lake were noted throughout the month. HVO reported that around 0600 on 3 October the level of the lava lake has lowered slightly. Overflight measurements taken on 5 October indicated that the crater floor was infilled a total of about 143 m and that 111 million cubic meters of lava had been effused since September 2021. During 6-7 October the lake gradually rose 0.5 m. Sulfur dioxide measurements made on 22 October had an emission rate of 700 t/d. Another overflight taken on 28 October showed that there was little to no change in the elevation of the crater floor: the crater floor was infilled a total of 143 m and 111 million cubic meters of lava had erupted since the start of the eruption.
Activity during November 2022. Activity remained low during November, though HVO reported that lava from the western vent continued to effuse into the active lava lake and onto the crater floor throughout the month. The rate of sulfur dioxide emissions during November ranged from 300-600 t/d, the higher amount of which occurred on 9 November.
Activity during December 2022. Similar low activity was reported during December, with lava effusing from the western vent into the active lava lake and onto the crater floor. During 4-5 December the active part of the lava lake was slightly variable in elevation and fluctuated within 1 m. On 9 December HVO reported that lava was no longer erupting from the western vent in the Halema’uma’u crater and that sulfur dioxide emissions had returned to near pre-eruption background levels; during 10-11 December, the lava lake had completely crusted over, and no incandescence was visible (figure 524). Time lapse camera images covering the 4-10 December showed that the crater floor showed weak deflation and no inflation. Some passive events of crustal overturning were reported during 14-15 December, which brought fresh incandescent lava to the lake surface. The sulfur dioxide emission rate was approximately 200 t/d on 14 December. A smaller overturn event on 17 December and another that occurred around 0000 and into the morning of 20 December were also detected. A small seismic swarm was later detected on 30 December.
Geologic Background. Kilauea overlaps the E flank of the massive Mauna Loa shield volcano in the island of Hawaii. Eruptions are prominent in Polynesian legends; written documentation since 1820 records frequent summit and flank lava flow eruptions interspersed with periods of long-term lava lake activity at Halemaumau crater in the summit caldera until 1924. The 3 x 5 km caldera was formed in several stages about 1,500 years ago and during the 18th century; eruptions have also originated from the lengthy East and Southwest rift zones, which extend to the ocean in both directions. About 90% of the surface of the basaltic shield volcano is formed of lava flows less than about 1,100 years old; 70% of the surface is younger than 600 years. The long-term eruption from the East rift zone between 1983 and 2018 produced lava flows covering more than 100 km2, destroyed hundreds of houses, and added new coastline.
Information Contacts: Hawaiian Volcano Observatory (HVO), U.S. Geological Survey, PO Box 51, Hawai'i National Park, HI 96718, USA (URL: http://hvo.wr.usgs.gov/).
Nyamulagira (DR Congo) — November 2023 Cite this Report
Nyamulagira
DR Congo
1.408°S, 29.2°E; summit elev. 3058 m
All times are local (unless otherwise noted)
Lava flows and thermal activity during May-October 2023
Nyamulagira (also known as Nyamuragira) is a shield volcano in the Democratic Republic of Congo with the summit truncated by a small 2 x 2.3 km caldera with walls up to about 100 m high. Documented eruptions have occurred within the summit caldera, as well as from numerous flank fissures and cinder cones. The current eruption period began in April 2018 and has more recently been characterized by summit crater lava flows and thermal activity (BGVN 48:05). This report describes lava flows and variable thermal activity during May through October 2023, based on information from the Observatoire Volcanologique de Goma (OVG) and various satellite data.
Lava lake activity continued during May. The MIROVA (Middle InfraRed Observation of Volcanic Activity) system recorded moderate-to-strong thermal activity throughout the reporting period; activity was more intense during May and October and relatively weaker from June through September (figure 95). The MODVOLC thermal algorithm, detected a total of 209 thermal alerts. There were 143 hotspots detected during May, eight during June, nine during September, and 49 during October. This activity was also reflected in infrared satellite images, where a lava flow was visible in the NW part of the crater on 7 May and strong activity was seen in the center of the crater on 4 October (figure 96). Another infrared satellite image taken on 12 May showed still active lava flows along the NW margin of the crater. According to OVG lava effusions were active during 7-29 May and moved to the N and NW parts of the crater beginning on 9 May. Strong summit crater incandescence was visible from Goma (27 km S) during the nights of 17, 19, and 20 May (figure 97). On 17 May there was an increase in eruptive activity, which peaked at 0100 on 20 May. Notable sulfur dioxide plumes drifted NW and W during 19-20 May (figure 98). Drone footage acquired in partnership with the USGS (United States Geological Survey) on 20 May captured images of narrow lava flows that traveled about 100 m down the W flank (figure 99). Data from the Rumangabo seismic station indicated a decreasing trend in activity during 17-21 May. Although weather clouds prevented clear views of the summit, a strong thermal signature on the NW flank was visible in an infrared satellite image on 22 May, based on an infrared satellite image. On 28 May the lava flows on the upper W flank began to cool and solidify. By 29 May seismicity returned to levels similar to those recorded before the 17 May increase. Lava effusion continued but was confined to the summit crater; periodic crater incandescence was observed.
Low-level activity was noted during June through October. On 1 June OVG reported that seismicity remained at lower levels and that crater incandescence had been absent for three days, though infrared satellite imagery showed continued lava effusion in the summit crater. The lava flows on the flanks covered an estimated 0.6 km2. Satellite imagery continued to show thermal activity confined to the lava lake through October (figure 96), although no lava flows or significant sulfur dioxide emissions were reported.
Geologic Background. Africa's most active volcano, Nyamulagira (also known as Nyamuragira), is a massive high-potassium basaltic shield about 25 km N of Lake Kivu and 13 km NNW of the steep-sided Nyiragongo volcano. The summit is truncated by a small 2 x 2.3 km caldera that has walls up to about 100 m high. Documented eruptions have occurred within the summit caldera, as well as from the numerous flank fissures and cinder cones. A lava lake in the summit crater, active since at least 1921, drained in 1938, at the time of a major flank eruption. Recent lava flows extend down the flanks more than 30 km from the summit as far as Lake Kivu; extensive lava flows from this volcano have covered 1,500 km2 of the western branch of the East African Rift.
Information Contacts: Observatoire Volcanologique de Goma (OVG), Departement de Geophysique, Centre de Recherche en Sciences Naturelles, Lwiro, D.S. Bukavu, DR Congo; Hawai'i Institute of Geophysics and Planetology (HIGP) - MODVOLC Thermal Alerts System, School of Ocean and Earth Science and Technology (SOEST), Univ. of Hawai'i, 2525 Correa Road, Honolulu, HI 96822, USA (URL: http://modis.higp.hawaii.edu/); MIROVA (Middle InfraRed Observation of Volcanic Activity), a collaborative project between the Universities of Turin and Florence (Italy) supported by the Centre for Volcanic Risk of the Italian Civil Protection Department (URL: http://www.mirovaweb.it/); NASA Global Sulfur Dioxide Monitoring Page, Atmospheric Chemistry and Dynamics Laboratory, NASA Goddard Space Flight Center (NASA/GSFC), 8800 Greenbelt Road, Goddard, Maryland, USA (URL: https://so2.gsfc.nasa.gov/); Copernicus Browser, Copernicus Data Space Ecosystem, European Space Agency (URL: https://dataspace.copernicus.eu/browser/); Charles Balagizi, Goma Volcano Observatory, Departement de Geophysique, Centre de Recherche en Sciences Naturelles, Lwiro, D.S. Bukavu, DR Congo.
Bagana (Papua New Guinea) — October 2023 Cite this Report
Bagana
Papua New Guinea
6.137°S, 155.196°E; summit elev. 1855 m
All times are local (unless otherwise noted)
Explosions, ash plumes, ashfall, and lava flows during April-September 2023
The remote volcano of Bagana is located in central Bougainville Island, Papua New Guinea. Recorded eruptions date back to 1842 and activity has consisted of effusive activity that has built a small lava dome in the summit crater and occasional explosions that produced pyroclastic flows. The most recent eruption has been ongoing since February 2000 and has produced occasional explosions, ash plumes, and lava flows. More recently, activity has been characterized by ongoing effusive activity and ash emissions (BGVN 48:04). This report updates activity from April through September 2023 that has consisted of explosions, ash plumes, ashfall, and lava flows, using information from the Darwin Volcanic Ash Advisory Center (VAAC) and satellite data.
An explosive eruption was reported on 7 July that generated a large gas-and-ash plume to high altitudes and caused significant ashfall in local communities; the eruption plume had reached upper tropospheric (16-18 km altitude) altitudes by 2200, according to satellite images. Sulfur dioxide plumes were detected in satellite images on 8 July and indicated that the plume was likely a mixture of gas, ice, and ash. A report issued by the Autonomous Bougainville Government (ABG) (Torokina District, Education Section) on 10 July noted that significant ash began falling during 2000-2100 on 7 July and covered most areas in the Vuakovi, Gotana (9 km SW), Koromaketo, Laruma (25 km W) and Atsilima (27 km NW) villages. Pyroclastic flows also occurred, according to ground-based reports; small deposits confined to one drainage were inspected by RVO during an overflight on 17 July and were confirmed to be from the 7 July event. Ashfall continued until 10 July and covered vegetation, which destroyed bushes and gardens and contaminated rivers and streams.
RVO reported another eruption on 14 July. The Darwin VAAC stated that an explosive event started around 0830 on 15 July and produced an ash plume that rose to 16.5 km altitude by 1000 and drifted N, according to satellite images. The plume continued to drift N and remained visible through 1900, and by 2150 it had dissipated.
Ashfall likely from both the 7 and 15 July events impacted about 8,111 people in Torokina (20 km SW), including Tsito/Vuakovi, Gotana, Koromaketo, Kenaia, Longkogari, Kenbaki, Piva (13 km SW), and Atsinima, and in the Tsitovi district, according to ABG. Significant ashfall was also reported in Ruruvu (22 km N) in the Wakunai District of Central Bougainville, though the thickness of these deposits could not be confirmed. An evacuation was called for the villages in Wakunai, where heavy ashfall had contaminated water sources; the communities of Ruruvu, Togarau, Kakarapaia, Karauturi, Atao, and Kuritaturi were asked to evacuate to a disaster center at the Wakunai District Station, and communities in Torokina were asked to evacuate to the Piva District station. According to a news article, more than 7,000 people needed temporary accommodations, with about 1,000 people in evacuation shelters. Ashfall had deposited over a broad area, contaminating water supplies, affecting crops, and collapsing some roofs and houses in rural areas. Schools were temporarily shut down. Intermittent ash emissions continued through the end of July and drifted NNW, NW, and SW. Fine ashfall was reported on the coast of Torokina, and ash plumes also drifted toward Laruma and Atsilima.
A small explosive eruption occurred at 2130 on 28 July that ejected material from the crater vents, according to reports from Torokina, in addition to a lava flow that contained two lobes. A second explosion was detected at 2157. Incandescence from the lava flow was visible from Piva as it descended the W flank around 2000 on 29 July (figure 47). The Darwin VAAC reported that a strong thermal anomaly was visible in satellite images during 30-31 July and that ash emissions rose to 2.4 km altitude and drifted WSW on 30 July. A ground report from RVO described localized emissions at 0900 on 31 July.
The Darwin VAAC reported that ash plumes were identified in satellite imagery at 0800 and 1220 on 12 August and rose to 2.1 km and 3 km altitude and drifted NW and W, respectively. A news report stated that aid was sent to more than 6,300 people that were adversely affected by the eruption. Photos taken during 17-19 August showed ash emissions rising no higher than 1 km above the summit and drifting SE. A small explosion generated an ash plume during the morning of 19 August. Deposits from small pyroclastic flows were also captured in the photos. Satellite images captured lava flows and pyroclastic flow deposits. Two temporary seismic stations were installed near Bagana on 17 August at distances of 7 km WSW (Vakovi station) and 11 km SW (Kepox station). The Kepox station immediately started to record continuous, low-frequency background seismicity.
Satellite data. Little to no thermal activity was detected during April through mid-July 2023; only one anomaly was recorded during early April and one during early June, according to MIROVA (Middle InfraRed Observation of Volcanic Activity) data (figure 48). Thermal activity increased in both power and frequency during mid-July through September, although there were still some short gaps in detected activity. MODVOLC also detected increased thermal activity during August; thermal hotspots were detected a total of five times on 19, 20, and 27 August. Weak thermal anomalies were also captured in infrared satellite images on clear weather days throughout the reporting period on 7, 12, and 17 April, 27 May, 1, 6, 16, and 31 July, and 19 September (figure 48); a strong thermal anomaly was visible on 31 July. Distinct sulfur dioxide plumes that drifted generally NW were intermittently captured by the TROPOMI instrument on the Sentinel-5P satellite and sometimes exceeded two Dobson Units (DUs) (figure 49).
Geologic Background. Bagana volcano, in a remote portion of central Bougainville Island, is frequently active. This massive symmetrical cone was largely constructed by an accumulation of viscous andesitic lava flows. The entire edifice could have been constructed in about 300 years at its present rate of lava production. Eruptive activity is characterized by non-explosive effusion of viscous lava that maintains a small lava dome in the summit crater, although occasional explosive activity produces pyroclastic flows. Lava flows with tongue-shaped lobes up to 50 m thick and prominent levees descend the flanks on all sides.
Information Contacts: Rabaul Volcano Observatory (RVO), Geohazards Management Division, Department of Mineral Policy and Geohazards Management (DMPGM), PO Box 3386, Kokopo, East New Britain Province, Papua New Guinea; Darwin Volcanic Ash Advisory Centre (VAAC), Bureau of Meteorology, Northern Territory Regional Office, PO Box 40050, Casuarina, NT 0811, Australia (URL: http://www.bom.gov.au/info/vaac/); MIROVA (Middle InfraRed Observation of Volcanic Activity), a collaborative project between the Universities of Turin and Florence (Italy) supported by the Centre for Volcanic Risk of the Italian Civil Protection Department (URL: http://www.mirovaweb.it/); Hawai'i Institute of Geophysics and Planetology (HIGP) - MODVOLC Thermal Alerts System, School of Ocean and Earth Science and Technology (SOEST), Univ. of Hawai'i, 2525 Correa Road, Honolulu, HI 96822, USA (URL: http://modis.higp.hawaii.edu/); NASA Global Sulfur Dioxide Monitoring Page, Atmospheric Chemistry and Dynamics Laboratory, NASA Goddard Space Flight Center (NASA/GSFC), 8800 Greenbelt Road, Goddard, Maryland, USA (URL: https://so2.gsfc.nasa.gov/); Copernicus Browser, Copernicus Data Space Ecosystem, European Space Agency (URL: https://dataspace.copernicus.eu/browser/); Autonomous Bougainville Government, P.O Box 322, Buka, AROB, PNG (URL: https://abg.gov.pg/); Andrew Tupper (Twitter: @andrewcraigtupp); Simon Carn, Geological and Mining Engineering and Sciences, Michigan Technological University, 1400 Townsend Drive, Houghton, MI 49931, USA (URL: http://www.volcarno.com/, Twitter: @simoncarn); Radio NZ (URL: https://www.rnz.co.nz/news/pacific/494464/more-than-7-000-people-in-bougainville-need-temporary-accommodation-after-eruption); USAID, 1300 Pennsylvania Ave, NW, Washington DC 20004, USA (URL: https://www.usaid.gov/pacific-islands/press-releases/aug-08-2023-united-states-provides-immediate-emergency-assistance-support-communities-affected-mount-bagana-volcanic-eruptions).
Mayon (Philippines) — October 2023 Cite this Report
Mayon
Philippines
13.257°N, 123.685°E; summit elev. 2462 m
All times are local (unless otherwise noted)
Lava flows, pyroclastic flows, ash emissions, and seismicity during April-September 2023
Mayon is located in the Philippines and has steep upper slopes capped by a small summit crater. Historical eruptions date back to 1616 CE that have been characterized by Strombolian eruptions, lava flows, pyroclastic flows, and mudflows. Eruptions mostly originated from a central conduit. Pyroclastic flows and mudflows have commonly descended many of the approximately 40 drainages that surround the volcano. The most recent eruption occurred during June through October 2022 and consisted of lava dome growth and gas-and-steam emissions (BGVN 47:12). A new eruption was reported during late April 2023 and has included lava flows, pyroclastic density currents, ash emissions, and seismicity. This report covers activity during April through September 2023 based on daily bulletins from the Philippine Institute of Volcanology and Seismology (PHIVOLCS).
During April through September 2023, PHIVOLCS reported near-daily rockfall events, frequent volcanic earthquakes, and sulfur dioxide measurements. Gas-and-steam emissions rose 100-900 m above the crater and drifted in different directions. Nighttime crater incandescence was often visible during clear weather and was accompanied by incandescent avalanches of material. Activity notably increased during June when lava flows were reported on the S, SE, and E flanks (figure 52). The MIROVA graph (Middle InfraRed Observation of Volcanic Activity) showed strong thermal activity coincident with these lava flows, which remained active through September (figure 53). According to the MODVOLC thermal algorithm, a total of 110 thermal alerts were detected during the reporting period: 17 during June, 40 during July, 27 during August, and 26 during September. During early June, pyroclastic density currents (PDCs) started to occur more frequently.
Low activity was reported during much of April and May; gas-and-steam emissions rose 100-900 m above the crater and generally drifted in different directions. A total of 52 rockfall events and 18 volcanic earthquakes were detected during April and 147 rockfall events and 13 volcanic events during May. Sulfur dioxide flux measurements ranged between 400-576 tons per day (t/d) during April, the latter of which was measured on 29 April and between 162-343 t/d during May, the latter of which was measured on 13 May.
Activity during June increased, characterized by lava flows, pyroclastic density currents (PDCs), crater incandescence and incandescent rockfall events, gas-and-steam emissions, and continued seismicity. Weather clouds often prevented clear views of the summit, but during clear days, moderate gas-and-steam emissions rose 100-2,500 m above the crater and drifted in multiple directions. A total of 6,237 rockfall events and 288 volcanic earthquakes were detected. The rockfall events often deposited material on the S and SE flanks within 700-1,500 m of the summit crater and ash from the events drifted SW, S, SE, NE, and E. Sulfur dioxide emissions ranged between 149-1,205 t/d, the latter of which was measured on 10 June. Short-term observations from EDM and electronic tiltmeter monitoring indicated that the upper slopes were inflating since February 2023. Longer-term ground deformation parameters based on EDM, precise leveling, continuous GPS, and electronic tilt monitoring indicated that the volcano remained inflated, especially on the NW and SE flanks. At 1000 on 5 June the Volcano Alert Level (VAL) was raised to 2 (on a 0-5 scale). PHIVOLCS noted that although low-level volcanic earthquakes, ground deformation, and volcanic gas emissions indicated unrest, the steep increase in rockfall frequency may indicate increased dome activity.
A total of 151 dome-collapse PDCs occurred during 8-9 and 11-30 June, traveled 500-2,000 m, and deposited material on the S flank within 2 km of the summit crater. During 8-9 June the VAL was raised to 3. At approximately 1947 on 11 June lava flow activity was reported; two lobes traveled within 500 m from the crater and deposited material on the S (Mi-isi), SE (Bonga), and E (Basud) flanks. Weak seismicity accompanied the lava flow and slight inflation on the upper flanks. This lava flow remained active through 30 June, moving down the S and SE flank as far as 2.5 km and 1.8 km, respectively and depositing material up to 3.3 km from the crater. During 15-16 June traces of ashfall from the PDCs were reported in Sitio Buga, Nabonton, City of Ligao and Purok, and San Francisco, Municipality of Guinobatan. During 28-29 June there were two PDCs generated by the collapse of the lava flow front, which generated a light-brown ash plume 1 km high. Satellite monitors detected significant concentrations of sulfur dioxide beginning on 29 June. On 30 June PDCs primarily affected the Basud Gully on the E flank, the largest of which occurred at 1301 and lasted eight minutes, based on the seismic record. Four PDCs generated between 1800 and 2000 that lasted approximately four minutes each traveled 3-4 km on the E flank and generated an ash plume that rose 1 km above the crater and drifted N and NW. Ashfall was recorded in Tabaco City.
Similar strong activity continued during July; slow lava effusion remained active on the S and SE flanks and traveled as far as 2.8 km and 2.8 km, respectively and material was deposited as far as 4 km from the crater. There was a total of 6,983 rockfall events and 189 PDCs that affected the S, SE, and E flanks. The volcano network detected a total of 2,124 volcanic earthquakes. Continuous gas-and-steam emissions rose 200-2,000 m above the crater and drifted in multiple directions. Sulfur dioxide emissions averaged 792-4,113 t/d, the latter of which was measured on 28 July. During 2-4 July three PDCs were generated from the collapse of the lava flow and resulting light brown plumes rose 200-300 m above the crater. Continuous tremor pulses were reported beginning at 1547 on 3 July through 7 July at 1200, at 2300 on 8 July and going through 0300 on 10 July, and at 2300 on 16 July, as recorded by the seismic network. During 6-9 July there were 10 lava flow-collapse-related PDCs that generated light brown plumes 300-500 m above the crater. During 10-11 July light ashfall was reported in some areas of Mabinit, Legazpi City, Budiao and Salvacion, Daraga, and Camalig, Albay. By 18 July the lava flow advanced 600 m on the E flank as well.
During 1733 on 18 July and 0434 on 19 July PHIVOLCS reported 30 “ashing” events, which are degassing events accompanied by audible thunder-like sounds and entrained ash at the crater, which produced short, dark plumes that drifted SW. These events each lasted 20-40 seconds, and plume heights ranged from 150-300 m above the crater, as recorded by seismic, infrasound, visual, and thermal monitors. Three more ashing events occurred during 19-20 July. Short-term observations from electronic tilt and GPS monitoring indicate deflation on the E lower flanks in early July and inflation on the NW middle flanks during the third week of July. Longer-term ground deformation parameters from EDM, precise leveling, continuous GPS, and electronic tilt monitoring indicated that the volcano was still generally inflated relative to baseline levels. A short-lived lava pulse lasted 28 seconds at 1956 on 21 July, which was accompanied by seismic and infrasound signals. By 22 July, the only lava flow that remained active was on the SE flank, and continued to extend 3.4 km, while those on the S and E flanks weakened markedly. One ashing event was detected during 30-31 July, whereas there were 57 detected during 31 July-1 August; according to PHIVOLCS beginning at approximately 1800 on 31 July eruptive activity was dominated by phases of intermittent ashing, as well as increased in the apparent rates of lava effusion from the summit crater. The ashing phases consisted of discrete events recorded as low-frequency volcanic earthquakes (LFVQ) typically 30 seconds in duration, based on seismic and infrasound signals. Gray ash plume rose 100 m above the crater and generally drifted NE. Shortly after these ashing events began, new lava began to effuse rapidly from the crater, feeding the established flowed on the SE, E, and E flanks and generating frequent rockfall events.
Intensified unrest persisted during August. There was a total of 4,141 rockfall events, 2,881 volcanic earthquakes, which included volcanic tremor events, 32 ashing events, and 101 PDCs detected throughout the month. On clear weather days, gas-and-steam emissions rose 300-1,500 m above the crater and drifted in different directions (figure 54). Sulfur dioxide emissions averaged 735-4,756 t/d, the higher value of which was measured on 16 August. During 1-2 August the rate of lava effusion decreased, but continued to feed the flows on the SE, S, and E flanks, maintaining their advances to 3.4 km, 2.8 km, and 1.1 km from the crater, respectively (figure 55). Rockfall and PDCs generated by collapses at the lava flow margins and from the summit dome deposited material within 4 km of the crater. During 3-4 August there were 10 tremor events detected that lasted 1-4 minutes. Short-lived lava pulse lasted 35 seconds and was accompanied by seismic and infrasound signals at 0442 on 6 August. Seven collapses were recorded at the front of the lava flow during 12-14 August.
During September, similar activity of slow lava effusion, PDCs, gas-and-steam emissions, and seismicity continued. There was a total of 4,452 rockfall events, 329 volcanic earthquakes, which included volcanic tremor events, two ashing events, and 85 PDCs recorded throughout the month. On clear weather days, gas-and-steam emissions rose 100-1,500 m above the crater and drifted in multiple directions. Sulfur dioxide emissions averaged 609-2,252 t/d, the higher average of which was measured on 6 September. Slow lava effusion continued advancing on the SE, S, and E flanks, maintaining lengths of 3.4 km, 2.8 km, and 1.1 km, respectively. Rockfall and PDC events generated by collapses along the lava flow margins and at the summit dome deposited material within 4 km of the crater.
Geologic Background. Symmetrical Mayon, which rises above the Albay Gulf NW of Legazpi City, is the most active volcano of the Philippines. The steep upper slopes are capped by a small summit crater. Recorded eruptions since 1616 CE range from Strombolian to basaltic Plinian, with cyclical activity beginning with basaltic eruptions, followed by longer periods of andesitic lava flows. Eruptions occur predominately from the central conduit and have also produced lava flows that travel far down the flanks. Pyroclastic density currents and mudflows have commonly swept down many of the approximately 40 ravines that radiate from the summit and have often damaged populated lowland areas. A violent eruption in 1814 killed more than 1,200 people and devastated several towns.
Information Contacts: Philippine Institute of Volcanology and Seismology (PHIVOLCS), Department of Science and Technology, University of the Philippines Campus, Diliman, Quezon City, Philippines (URL: http://www.phivolcs.dost.gov.ph/); MIROVA (Middle InfraRed Observation of Volcanic Activity), a collaborative project between the Universities of Turin and Florence (Italy) supported by the Centre for Volcanic Risk of the Italian Civil Protection Department (URL: http://www.mirovaweb.it/); Hawai'i Institute of Geophysics and Planetology (HIGP) - MODVOLC Thermal Alerts System, School of Ocean and Earth Science and Technology (SOEST), Univ. of Hawai'i, 2525 Correa Road, Honolulu, HI 96822, USA (URL: http://modis.higp.hawaii.edu/); Copernicus Browser, Copernicus Data Space Ecosystem, European Space Agency (URL: https://dataspace.copernicus.eu/browser/); William Rogers, Legazpi City, Albay Province, Philippines.
Nishinoshima (Japan) — October 2023 Cite this Report
Nishinoshima
Japan
27.247°N, 140.874°E; summit elev. 100 m
All times are local (unless otherwise noted)
Eruption plumes and gas-and-steam plumes during May-August 2023
Nishinoshima, located about 1,000 km S of Tokyo, is a small island in the Ogasawara Arc in Japan. The island is the summit of a massive submarine volcano that has prominent submarine peaks to the S, W, and NE. Eruptions date back to 1973 and the current eruption period began in October 2022. Recent activity has consisted of small ash plumes and fumarolic activity (BGVN 48:07). This report covers activity during May through August 2023, using information from monthly reports of the Japan Meteorological Agency (JMA) monthly reports and satellite data.
Activity during May through June was relatively low. The Japan Coast Guard (JCG) did overflights on 14 and 22 June and reported white gas-and-steam emissions rising 600 m and 1,200 m from the central crater of the pyroclastic cone, respectively (figure 125). In addition, multiple white gas-and-steam emissions rose from the inner rim of the W side of the crater and from the SE flank of the pyroclastic cone. Discolored brown-to-green water was observed around almost the entire perimeter of the island; on 22 June light green discolored water was observed off the S coast of the island.
Observations from the Himawari meteorological satellite confirmed an eruption on 9 and 10 July. An eruption plume rose 1.6 km above the crater and drifted N around 1300 on 9 July. Satellite images acquired at 1420 and 2020 on 9 July and at 0220 on 10 July showed continuing emissions that rose 1.3-1.6 km above the crater and drifted NE and N. The Tokyo VAAC reported that an ash plume seen by a pilot and identified in a satellite image at 0630 on 21 July rose to 3 km altitude and drifted S.
Aerial observations conducted by JCG on 8 August showed a white-and-gray plume rising from the central crater of the pyroclastic cone, and multiple white gas-and-steam emissions were rising from the inner edge of the western crater and along the NW-SE flanks of the island (figure 126). Brown-to-green discolored water was also noted around the perimeter of the island.
Intermittent low-to-moderate power thermal anomalies were recorded in the MIROVA graph (Middle InfraRed Observation of Volcanic Activity), showing an increase in both frequency and power beginning in July (figure 127). This increase in activity coincides with eruptive activity on 9 and 10 July, characterized by eruption plumes. According to the MODVOLC thermal alert algorithm, one thermal hotspot was recorded on 20 July. Weak thermal anomalies were also detected in infrared satellite imagery, accompanied by strong gas-and-steam plumes (figure 128).
Geologic Background. The small island of Nishinoshima was enlarged when several new islands coalesced during an eruption in 1973-74. Multiple eruptions that began in 2013 completely covered the previous exposed surface and continued to enlarge the island. The island is the summit of a massive submarine volcano that has prominent peaks to the S, W, and NE. The summit of the southern cone rises to within 214 m of the ocean surface 9 km SSE.
Information Contacts: Japan Meteorological Agency (JMA), 1-3-4 Otemachi, Chiyoda-ku, Tokyo 100-8122, Japan (URL: http://www.jma.go.jp/jma/indexe.html); Tokyo Volcanic Ash Advisory Center (VAAC), 1-3-4 Otemachi, Chiyoda-ku, Tokyo 100-8122, Japan (URL: http://ds.data.jma.go.jp/svd/vaac/data/); MIROVA (Middle InfraRed Observation of Volcanic Activity), a collaborative project between the Universities of Turin and Florence (Italy) supported by the Centre for Volcanic Risk of the Italian Civil Protection Department (URL: http://www.mirovaweb.it/); Copernicus Browser, Copernicus Data Space Ecosystem, European Space Agency (URL: https://dataspace.copernicus.eu/browser/).
Krakatau (Indonesia) — October 2023 Cite this Report
Krakatau
Indonesia
6.1009°S, 105.4233°E; summit elev. 285 m
All times are local (unless otherwise noted)
White gas-and-steam plumes and occasional ash plumes during May-August 2023
Krakatau is located in the Sunda Strait between Java and Sumatra, Indonesia. Caldera collapse during the catastrophic 1883 eruption destroyed Danan and Perbuwatan cones and left only a remnant of Rakata. The post-collapse cone of Anak Krakatau (Child of Krakatau) was constructed within the 1883 caldera at a point between the former Danan and Perbuwatan cones; it has been the site of frequent eruptions since 1927. The current eruption period began in May 2021 and has recently consisted of Strombolian eruptions and ash plumes (BGVN 48:07). This report describes lower levels of activity consisting of ash and white gas-and-steam plumes during May through August 2023, based on information provided by the Indonesian Center for Volcanology and Geological Hazard Mitigation, referred to as Pusat Vulkanologi dan Mitigasi Bencana Geologi (PVMBG), MAGMA Indonesia, and satellite data.
Activity was relatively low during May and June. Daily white gas-and-steam emissions rose 25-200 m above the crater and drifted in different directions. Five ash plumes were detected at 0519 on 10 May, 1241 on 11 May, 0920 on 12 May, 2320 on 12 May, and at 0710 on 13 May, and rose 1-2.5 km above the crater and drifted SW. A webcam image taken on 12 May showed ejection of incandescent material above the vent. A total of nine ash plumes were detected during 6-11 June: at 1434 and 00220 on 6 and 7 June the ash plumes rose 500 m above the crater and drifted NW, at 1537 on 8 June the ash plume rose 1 km above the crater and drifted SW, at 0746 and at 0846 on 9 June the ash plumes rose 800 m and 3 km above the crater and drifted SW, respectively, at 0423, 1431, and 1750 on 10 June the ash plumes rose 2 km, 1.5 km, and 3.5 km above the crater and drifted NW, respectively, and at 0030 on 11 June an ash plume rose 2 km above the crater and drifted NW. Webcam images taken on 10 and 11 June at 0455 and 0102, respectively, showed incandescent material ejected above the vent. On 19 June an ash plume at 0822 rose 1.5 km above the crater and drifted SE.
Similar low activity of white gas-and-steam emissions and few ash plumes were reported during July and August. Daily white gas-and-steam emissions rose 25-300 m above the crater and drifted in multiple directions. Three ash plumes were reported at 0843, 0851, and 0852 on 20 July that rose 500-2,000 m above the crater and drifted NW.
The MIROVA (Middle InfraRed Observation of Volcanic Activity) graph of MODIS thermal anomaly data showed intermittent low-to-moderate power thermal anomalies during May through August 2023 (figure 140). Although activity was often obscured by weather clouds, a thermal anomaly was visible in an infrared satellite image of the crater on 12 May, accompanied by an eruption plume that drifted SW (figure 141).
Geologic Background. The renowned Krakatau (frequently mis-named as Krakatoa) volcano lies in the Sunda Strait between Java and Sumatra. Collapse of an older edifice, perhaps in 416 or 535 CE, formed a 7-km-wide caldera. Remnants of that volcano are preserved in Verlaten and Lang Islands; subsequently the Rakata, Danan, and Perbuwatan cones were formed, coalescing to create the pre-1883 Krakatau Island. Caldera collapse during the catastrophic 1883 eruption destroyed Danan and Perbuwatan, and left only a remnant of Rakata. This eruption caused more than 36,000 fatalities, most as a result of tsunamis that swept the adjacent coastlines of Sumatra and Java. Pyroclastic surges traveled 40 km across the Sunda Strait and reached the Sumatra coast. After a quiescence of less than a half century, the post-collapse cone of Anak Krakatau (Child of Krakatau) was constructed within the 1883 caldera at a point between the former Danan and Perbuwatan cones. Anak Krakatau has been the site of frequent eruptions since 1927.
Information Contacts: Pusat Vulkanologi dan Mitigasi Bencana Geologi (PVMBG, also known as Indonesian Center for Volcanology and Geological Hazard Mitigation, CVGHM), Jalan Diponegoro 57, Bandung 40122, Indonesia (URL: http://www.vsi.esdm.go.id/); MAGMA Indonesia, Kementerian Energi dan Sumber Daya Mineral (URL: https://magma.esdm.go.id/v1); MIROVA (Middle InfraRed Observation of Volcanic Activity), a collaborative project between the Universities of Turin and Florence (Italy) supported by the Centre for Volcanic Risk of the Italian Civil Protection Department (URL: http://www.mirovaweb.it/); Copernicus Browser, Copernicus Data Space Ecosystem, European Space Agency (URL: https://dataspace.copernicus.eu/browser/).
Villarrica (Chile) — October 2023 Cite this Report
Villarrica
Chile
39.42°S, 71.93°W; summit elev. 2847 m
All times are local (unless otherwise noted)
Strombolian activity, gas-and-ash emissions, and crater incandescence during April-September 2023
Villarrica, in central Chile, consists of a 2-km-wide caldera that formed about 3,500 years ago and is located at the base of the presently active cone at the NW margin of a 6-km-wide caldera. Historical eruptions eruptions date back to 1558 and have been characterized by mild-to-moderate explosive activity with occasional lava effusions. The current eruption period began in December 2014 and has recently consisted of nighttime crater incandescence, ash emissions, and seismicity (BGVN 48:04). This report covers activity during April through September 2023 and describes occasional Strombolian activity, gas-and-ash emissions, and nighttime crater incandescence. Information for this report primarily comes from the Southern Andes Volcano Observatory (Observatorio Volcanológico de Los Andes del Sur, OVDAS), part of Chile's National Service of Geology and Mining (Servicio Nacional de Geología y Minería, SERNAGEOMIN) and satellite data.
Seismicity during April consisted of long period (LP) events and tremor (TRE); a total of 9,413 LP-type events and 759 TR-type events were detected throughout the month. Nighttime crater incandescence persisted and was visible in the degassing column. Sulfur dioxide data was obtained using Differential Absorption Optical Spectroscopy Equipment (DOAS) that showed an average value of 1,450 ± 198 tons per day (t/d) during 1-15 April and 1,129 ± 201 t/d during 16-30 April, with a maximum daily value of 2,784 t/d on 9 April. Gas-and-steam emissions of variable intensities rose above the active crater as high as 1.3 km above the crater on 13 April. Strombolian explosions were not observed and there was a slight decrease in the lava lake level.
There were 14,123 LP-type events and 727 TR-type events detected during May. According to sulfur dioxide measurements taken with DOAS equipment, the active crater emitted an average value of 1,826 ± 482 t/d during 1-15 May and 912 ± 41 t/d during 16-30 May, with a daily maximum value of 5,155 t/d on 13 May. Surveillance cameras showed continuous white gas-and-steam emissions that rose as high as 430 m above the crater on 27 May. Nighttime incandescence illuminated the gas column less than 300 m above the crater rim was and no pyroclastic emissions were reported. A landslide was identified on 13 May on the E flank of the volcano 50 m from the crater rim and extending 300 m away; SERNAGEOMIN noted that this event may have occurred on 12 May. During the morning of 27 and 28 May minor Strombolian explosions characterized by incandescent ejecta were recorded at the crater rim; the last reported Strombolian explosions had occurred at the end of March.
Seismic activity during June consisted of five volcano-tectonic (VT)-type events, 21,606 LP-type events, and 2,085 TR-type events. The average value of sulfur dioxide flux obtained by DOAS equipment was 1,420 ± 217 t/d during 1-15 June and 2,562 ± 804 t/d, with a maximum daily value of 4,810 t/d on 17 June. White gas-and-steam emissions rose less than 480 m above the crater; frequent nighttime crater incandescence was reflected in the degassing plume. On 12 June an emission rose 100 m above the crater and drifted NNW. On 15 June one or several emissions resulted in ashfall to the NE as far as 5.5 km from the crater, based on a Skysat satellite image. Several Strombolian explosions occurred within the crater; activity on 15 June was higher energy and ejected blocks 200-300 m on the NE slope. Surveillance cameras showed white gas-and-steam emissions rising 480 m above the crater on 16 June. On 19 and 24 June low-intensity Strombolian activity was observed, ejecting material as far as 200 m from the center of the crater to the E.
During July, seismicity included 29,319 LP-type events, 3,736 TR-type events, and two VT-type events. DOAS equipment recorded two days of sulfur dioxide emissions of 4,220 t/d and 1,009 t/d on 1 and 13 July, respectively. Constant nighttime incandescence was also recorded and was particularly noticeable when accompanied by eruptive columns on 12 and 16 July. Minor explosive events were detected in the crater. According to Skysat satellite images taken on 12, 13, and 16 July, ashfall deposits were identified 155 m S of the crater. According to POVI, incandescence was visible from two vents on the crater floor around 0336 on 12 July. Gas-and-ash emissions rose as high as 1.2 km above the crater on 13 July and drifted E and NW. A series of gas-and-steam pulses containing some ash deposited material on the upper E flank around 1551 on 13 July. During 16-31 July, average sulfur dioxide emissions of 1,679 ± 406 t/d were recorded, with a maximum daily value of 2,343 t/d on 28 July. Fine ash emissions were also reported on 16, 17, and 23 July.
Seismicity persisted during August, characterized by 27,011 LP-type events, 3,323 TR-type events, and three VT-type events. The average value of sulfur dioxide measurements taken during 1-15 August was 1,642 ± 270 t/d and 2,207 ± 4,549 t/d during 16-31 August, with a maximum daily value of 3,294 t/d on 27 August. Nighttime crater incandescence remained visible in degassing columns. White gas-and-steam emissions rose 480 m above the crater on 6 August. According to a Skysat satellite image from 6 August, ash accumulation was observed proximal to the crater and was mainly distributed toward the E slope. White gas-and-steam emissions rose 320 m above the crater on 26 August. Nighttime incandescence and Strombolian activity that generated ash emissions were reported on 27 August.
Seismicity during September was characterized by five VT-type events, 12,057 LP-type events, and 2,058 TR-type events. Nighttime incandescence persisted. On 2 September an ash emission rose 180 m above the crater and drifted SE at 1643 (figure 125) and a white gas-and-steam plume rose 320 m above the crater. According to the Buenos Aires VAAC, periods of continuous gas-and-ash emissions were visible in webcam images from 1830 on 2 September to 0110 on 3 September. Strombolian activity was observed on 2 September and during the early morning of 3 September, the latter event of which generated an ash emission that rose 60 m above the crater and drifted 100 m from the center of the crater to the NE and SW. Ashfall was reported to the SE and S as far as 750 m from the crater. The lava lake was active during 3-4 September and lava fountaining was visible for the first time since 26 March 2023, according to POVI. Fountains captured in webcam images at 2133 on 3 September and at 0054 on 4 September rose as high as 60 m above the crater rim and ejected material onto the upper W flank. Sulfur dioxide flux of 1,730 t/d and 1,281 t/d was measured on 3 and 4 September, respectively, according to data obtained by DOAS equipment.
Strong Strombolian activity and larger gas-and-ash plumes were reported during 18-20 September. On 18 September activity was also associated with energetic LP-type events and notable sulfur dioxide fluxes (as high as 4,277 t/d). On 19 September Strombolian activity and incandescence were observed. On 20 September at 0914 ash emissions rose 50 m above the crater and drifted SSE, accompanied by Strombolian activity that ejected material less than 100 m SSE, causing fall deposits on that respective flank. SERNAGEOMIN reported that a Planet Scope satellite image taken on 20 September showed the lava lake in the crater, measuring 32 m x 35 m and an area of 0.001 km2. Several ash emissions were recorded at 0841, 0910, 1251, 1306, 1312, 1315, and 1324 on 23 September and rose less than 150 m above the crater. The sulfur dioxide flux value was 698 t/d on 23 September and 1,097 t/d on 24 September. On 24 September the Volcanic Alert Level (VAL) was raised to Orange (the third level on a four-color scale). SENAPRED maintained the Alert Level at Yellow (the middle level on a three-color scale) for the communities of Villarrica, Pucón (16 km N), Curarrehue, and Panguipulli.
During 24-25 September there was an increase in seismic energy (observed at TR-events) and acoustic signals, characterized by 1 VT-type event, 213 LP-type events, and 124 TR-type events. Mainly white gas-and-steam emissions, in addition to occasional fine ash emissions were recorded. During the early morning of 25 September Strombolian explosions were reported and ejected material 250 m in all directions, though dominantly toward the NW. On 25 September the average value of sulfur dioxide flux was 760 t/d. Seismicity during 25-30 September consisted of five VT-type events, 1,937 LP-type events, and 456 TR-type events.
During 25-29 September moderate Strombolian activity was observed and ejected material as far as the crater rim. In addition, ash pulses lasting roughly 50 minutes were observed around 0700 and dispersed ENE. During 26-27 September a TR episode lasted 6.5 hours and was accompanied by discrete acoustic signals. Satellite images from 26 September showed a spatter cone on the crater floor with one vent that measured 10 x 14 m and a smaller vent about 35 m NE of the cone. SERNAGEOMIN reported an abundant number of bomb-sized blocks up to 150 m from the crater, as well as impact marks on the snow, which indicated explosive activity. A low-altitude ash emission was observed drifting NW around 1140 on 28 September, based on webcam images. Between 0620 and 0850 on 29 September an ash emission rose 60 m above the crater and drifted NW. During an overflight taken around 1000 on 29 September scientists observed molten material in the vent, a large accumulation of pyroclasts inside the crater, and energetic degassing, some of which contained a small amount of ash. Block-sized pyroclasts were deposited on the internal walls and near the crater, and a distal ash deposit was also visible. The average sulfur dioxide flux measured on 28 September was 344 t/d. Satellite images taken on 29 September ashfall was deposited roughly 3 km WNW from the crater and nighttime crater incandescence remained visible. The average sulfur dioxide flux value from 29 September was 199 t/d. On 30 September at 0740 a pulsating ash emission rose 1.1 km above the crater and drifted NNW (figure 126). Deposits on the S flank extended as far as 4.5 km from the crater rim, based on satellite images from 30 September.
Infrared MODIS satellite data processed by MIROVA (Middle InfraRed Observation of Volcanic Activity) showed intermittent thermal activity during April through September, with slightly stronger activity detected during late September (figure 127). Small clusters of thermal activity were detected during mid-June, early July, early August, and late September. According to the MODVOLC thermal alert system, a total of four thermal hotspots were detected on 7 July and 3 and 23 September. This activity was also intermittently captured in infrared satellite imagery on clear weather days (figure 128).
Geologic Background. The glacier-covered Villarrica stratovolcano, in the northern Lakes District of central Chile, is ~15 km south of the city of Pucon. A 2-km-wide caldera that formed about 3,500 years ago is located at the base of the presently active, dominantly basaltic to basaltic andesite cone at the NW margin of a 6-km-wide Pleistocene caldera. More than 30 scoria cones and fissure vents are present on the flanks. Plinian eruptions and pyroclastic flows that have extended up to 20 km from the volcano were produced during the Holocene. Lava flows up to 18 km long have issued from summit and flank vents. Eruptions documented since 1558 CE have consisted largely of mild-to-moderate explosive activity with occasional lava effusion. Glaciers cover 40 km2 of the volcano, and lahars have damaged towns on its flanks.
Information Contacts: Servicio Nacional de Geología y Minería (SERNAGEOMIN), Observatorio Volcanológico de Los Andes del Sur (OVDAS), Avda Sta María No. 0104, Santiago, Chile (URL: http://www.sernageomin.cl/); Proyecto Observación Villarrica Internet (POVI) (URL: http://www.povi.cl/); Sistema y Servicio Nacional de Prevención y Repuesta Ante Desastres (SENAPRED), Av. Beauchef 1671, Santiago, Chile (URL: https://web.senapred.cl/); Buenos Aires Volcanic Ash Advisory Center (VAAC), Servicio Meteorológico Nacional-Fuerza Aérea Argentina, 25 de mayo 658, Buenos Aires, Argentina (URL: http://www.smn.gov.ar/vaac/buenosaires/inicio.php); MIROVA (Middle InfraRed Observation of Volcanic Activity), a collaborative project between the Universities of Turin and Florence (Italy) supported by the Centre for Volcanic Risk of the Italian Civil Protection Department (URL: http://www.mirovaweb.it/); Hawai'i Institute of Geophysics and Planetology (HIGP) - MODVOLC Thermal Alerts System, School of Ocean and Earth Science and Technology (SOEST), Univ. of Hawai'i, 2525 Correa Road, Honolulu, HI 96822, USA (URL: http://modis.higp.hawaii.edu/); Copernicus Browser, Copernicus Data Space Ecosystem, European Space Agency (URL: https://dataspace.copernicus.eu/browser/).
Merapi (Indonesia) — October 2023 Cite this Report
Merapi
Indonesia
7.54°S, 110.446°E; summit elev. 2910 m
All times are local (unless otherwise noted)
Frequent incandescent avalanches during April-September 2023
Merapi, located just north of the major city of Yogyakarta in central Java, Indonesia, has had activity within the last 20 years characterized by pyroclastic flows and lahars accompanying growth and collapse of the steep-sided active summit lava dome. The current eruption period began in late December 2020 and has more recently consisted of ash plumes, intermittent incandescent avalanches of material, and pyroclastic flows (BGVN 48:04). This report covers activity during April through September 2023, based on information from Balai Penyelidikan dan Pengembangan Teknologi Kebencanaan Geologi (BPPTKG), the Center for Research and Development of Geological Disaster Technology, a branch of PVMBG which specifically monitors Merapi. Additional information comes from the Pusat Vulkanologi dan Mitigasi Bencana Geologi (PVMBG, also known as Indonesian Center for Volcanology and Geological Hazard Mitigation, CVGHM), MAGMA Indonesia, the Darwin Volcanic Ash Advisory Centre (VAAC), and various satellite data.
Activity during April through September 2023 primarily consisted of incandescent avalanches of material that mainly affected the SW and W flanks and traveled as far as 2.3 km from the summit (table 25) and white gas-and-steam emissions that rose 10-1,000 m above the crater.
Table 25. Monthly summary of avalanches and avalanche distances recorded at Merapi during April through September 2023. The number of reported avalanches does not include instances where possible avalanches were heard but could not be visually confirmed as a result of inclement weather. Data courtesy of BPPTKG (April-September 2023 daily reports).
| Month |
Average number of avalanches per day |
Distance avalanches traveled (m) |
| Apr 2023 |
19 |
1,200-2,000 |
| May 2023 |
22 |
500-2,000 |
| Jun 2023 |
18 |
1,200-2,000 |
| Jul 2023 |
30 |
300-2,000 |
| Aug 2023 |
25 |
400-2,300 |
| Sep 2023 |
23 |
600-2,000 |
BPPTKG reported that during April and May white gas-and-steam emissions rose 10-750 m above the crater, incandescent avalanches descended 500-2,000 m on the SW and W flanks (figure 135). Cloudy weather often prevented clear views of the summit, and sometimes avalanches could not be confirmed. According to a webcam image, a pyroclastic flow was visible on 17 April at 0531. During the week of 28 April and 4 May a pyroclastic flow was reported on the SW flank, traveling up to 2.5 km. According to a drone overflight taken on 17 May the SW lava dome volume was an estimated 2,372,800 cubic meters and the dome in the main crater was an estimated 2,337,300 cubic meters.
During June and July similar activity persisted with white gas-and-steam emissions rising 10-350 m above the crater and frequent incandescent avalanches that traveled 300-2,000 m down the SW, W, and S flanks (figure 136). Based on an analysis of aerial photos taken on 24 June the volume of the SW lava dome was approximately 2.5 million cubic meters. A pyroclastic flow was observed on 5 July that traveled 2.7 km on the SW flank. According to the Darwin VAAC multiple minor ash plumes were identified in satellite images on 19 July that rose to 3.7 km altitude and drifted S and SW. During 22, 25, and 26 July a total of 17 avalanches descended as far as 1.8 km on the S flank.
Frequent white gas-and-steam emissions continued during August and September, rising 10-450 m above the crater. Incandescent avalanches mainly affected the SW and W flanks and traveled 400-2,300 m from the vent (figure 137). An aerial survey conducted on 10 August was analyzed and reported that estimates of the SW dome volume was 2,764,300 cubic meters and the dome in the main crater was 2,369,800 cubic meters.
Frequent and moderate-power thermal activity continued throughout the reporting period, according to a MIROVA (Middle InfraRed Observation of Volcanic Activity) analysis of MODIS satellite data (figure 138). There was an increase in the number of detected anomalies during mid-May. The MODVOLC thermal algorithm recorded a total of 47 thermal hotspots: six during April, nine during May, eight during June, 15 during July, four during August, and five during September. Some of this activity was captured in infrared satellite imagery on clear weather days, sometimes accompanied by incandescent material on the SW flank (figure 139).
Geologic Background. Merapi, one of Indonesia's most active volcanoes, lies in one of the world's most densely populated areas and dominates the landscape immediately north of the major city of Yogyakarta. It is the youngest and southernmost of a volcanic chain extending NNW to Ungaran volcano. Growth of Old Merapi during the Pleistocene ended with major edifice collapse perhaps about 2,000 years ago, leaving a large arcuate scarp cutting the eroded older Batulawang volcano. Subsequent growth of the steep-sided Young Merapi edifice, its upper part unvegetated due to frequent activity, began SW of the earlier collapse scarp. Pyroclastic flows and lahars accompanying growth and collapse of the steep-sided active summit lava dome have devastated cultivated lands on the western-to-southern flanks and caused many fatalities.
Information Contacts: Balai Penyelidikan dan Pengembangan Teknologi Kebencanaan Geologi (BPPTKG), Center for Research and Development of Geological Disaster Technology (URL: http://merapi.bgl.esdm.go.id/, Twitter: @BPPTKG); MAGMA Indonesia, Kementerian Energi dan Sumber Daya Mineral (URL: https://magma.esdm.go.id/v1); Pusat Vulkanologi dan Mitigasi Bencana Geologi (PVMBG, also known as Indonesian Center for Volcanology and Geological Hazard Mitigation, CVGHM), Jalan Diponegoro 57, Bandung 40122, Indonesia (URL: http://www.vsi.esdm.go.id/); Darwin Volcanic Ash Advisory Centre (VAAC), Bureau of Meteorology, Northern Territory Regional Office, PO Box 40050, Casuarina, NT 0811, Australia (URL: http://www.bom.gov.au/info/vaac/); MIROVA (Middle InfraRed Observation of Volcanic Activity), a collaborative project between the Universities of Turin and Florence (Italy) supported by the Centre for Volcanic Risk of the Italian Civil Protection Department (URL: http://www.mirovaweb.it/); Hawai'i Institute of Geophysics and Planetology (HIGP) - MODVOLC Thermal Alerts System, School of Ocean and Earth Science and Technology (SOEST), Univ. of Hawai'i, 2525 Correa Road, Honolulu, HI 96822, USA (URL: http://modis.higp.hawaii.edu/); Copernicus Browser, Copernicus Data Space Ecosystem, European Space Agency (URL: https://dataspace.copernicus.eu/browser/); Øystein Lund Andersen (URL: https://www.oysteinlundandersen.com/, https://twitter.com/oysteinvolcano).
Ebeko
Russia
50.686°N, 156.014°E; summit elev. 1103 m
All times are local (unless otherwise noted)
Moderate explosive activity with ash plumes continued during June-November 2023
Ebeko, located on the N end of Paramushir Island in Russia’s Kuril Islands just S of the Kamchatka Peninsula, consists of three summit craters along a SSW-NNE line at the northern end of a complex of five volcanic cones. Observed eruptions date back to the late 18th century and have been characterized as small-to-moderate explosions from the summit crater, accompanied by intense fumarolic activity. The current eruptive period began in June 2022, consisting of frequent explosions, ash plumes, and thermal activity (BGVN 47:10, 48:06). This report covers similar activity during June-November 2023, based on information from the Kamchatka Volcanic Eruptions Response Team (KVERT) and satellite data.
Moderate explosive activity continued during June-November 2023 (figures 50 and 51). According to visual data from Severo-Kurilsk, explosions sent ash 2-3.5 km above the summit (3-4.5 km altitude) during most days during June through mid-September. Activity after mid-September was slightly weaker, with ash usually reaching less than 2 km above the summit. According to KVERT the volcano in October and November was, with a few exceptions, either quiet or obscured by clouds that prevented satellite observations. KVERT issued Volcano Observatory Notices for Aviation (VONA) on 8 and 12 June, 13 and 22 July, 3 and 21 August, and 31 October warning of potential aviation hazards from ash plumes drifting 3-15 km from the volcano. Based on satellite data, KVERT reported a persistent thermal anomaly whenever weather clouds permitted viewing.
Geologic Background. The flat-topped summit of the central cone of Ebeko volcano, one of the most active in the Kuril Islands, occupies the northern end of Paramushir Island. Three summit craters located along a SSW-NNE line form Ebeko volcano proper, at the northern end of a complex of five volcanic cones. Blocky lava flows extend west from Ebeko and SE from the neighboring Nezametnyi cone. The eastern part of the southern crater contains strong solfataras and a large boiling spring. The central crater is filled by a lake about 20 m deep whose shores are lined with steaming solfataras; the northern crater lies across a narrow, low barrier from the central crater and contains a small, cold crescentic lake. Historical activity, recorded since the late-18th century, has been restricted to small-to-moderate explosive eruptions from the summit craters. Intense fumarolic activity occurs in the summit craters, on the outer flanks of the cone, and in lateral explosion craters.
Information Contacts: Kamchatka Volcanic Eruptions Response Team (KVERT), Far Eastern Branch, Russian Academy of Sciences, 9 Piip Blvd., Petropavlovsk-Kamchatsky, 683006, Russia (URL: http://www.kscnet.ru/ivs/kvert/).
Search Bulletin Archive by Publication Date
Select a month and year from the drop-downs and click "Show Issue" to have that issue displayed in this tab.
The default month and year is the latest issue available.
Bulletin of the Global Volcanism Network - Volume 38, Number 12 (December 2013)
Managing Editor: Richard Wunderman
Chirinkotan (Russia)
Gas-and-steam emissions and occasional thermal anomalies, beginning May 2013
Chirpoi (Russia)
Periodic steam-and-gas emissions and thermal anomalies, November 2012-April 2014
Colima (Mexico)
Episode of lava effusion following the January 2013 sequence of explosions
Hudson, Cerro (Chile)
October 2011 earthquakes and eruption with ash, causing evacuation
Karthala (Comoros)
Increased nighttime incandescence during 9-10 May 2012
Mauna Kea (United States)
In repose; background conditions and hazards
San Cristobal (Nicaragua)
Explosions on 7 June 2013; gas-and-ash emissions in early 2014
Stromboli (Italy)
Small-to-moderate eruptions continue through February 2013
Chirinkotan (Russia) — December 2013 Cite this Report
Chirinkotan
Russia
48.98°N, 153.48°E; summit elev. 724 m
All times are local (unless otherwise noted)
Gas-and-steam emissions and occasional thermal anomalies, beginning May 2013
In 1979-1980, an eruption at Chirinkotan included a series of ash explosions and a lava flow (SEAN 05:06). In October and November 1986, airborne observers saw a column of thick gas and ash, and then fumarolic activity (SEAN 12:04). This report discusses events during 2013 through April 2014. The location of Chirinkotan in the Kuril Islands is shown in figure 1.
According to the Sakhalin Volcanic Eruption Response Team (SVERT), gas-and-steam emissions occurred frequently in 2013-2014 (table 1). The Aviation Color Code was Green on 24-25 May 2013, when emissions were first reported, but raised to Yellow during early June 2013, where it has remained through April 2014, the end of this report. The volcano was often obscured by clouds.
According to the U.S. Geological Survey, an M 8.3 earthquake occurred on 24 May 2013 beneath the Sea of Okhotsk, at a point is 656 km N of the volcano. The focal depth of the earthquake was ~ 600 km. The first reported gas-and-steam emission from Chirinkotan, which is in the Sea of Okhotsk, was on 24-25 May, suggesting a possible link between the two events.
Table 1. SVERT-reported dates on which gas-and-steam emissions were observed from 24 May 2013 through 30 April 2014, based on analysis of satellite images. Thermal alerts detected by SVERT and the MODVOLC satellite thermal alert system are also noted.
| Date |
Comments |
| 24-25 May 2013 |
Gas-and-steam emissions |
| 05, 07, 09 Jun |
Gas-and-steam emissions |
| 11 Jun |
Strong gas-and-steam emission, possibly with ash |
| 13 Jun |
SVERT-reported thermal alert |
| 16 Jun |
Gas-and-steam emissions |
| 21 Jun |
SVERT-reported thermal alert |
| 23 Jun |
Gas-and-steam emissions |
| 03 Jul |
Gas-and-steam emissions |
| 04 Jul |
SVERT-reported thermal alert |
| 12 Jul |
Gas-and-steam emissions and SVERT-reported thermal alert on 12-13 Jul |
| 16, 18 Jul |
Gas-and-steam emissions and SVERT-reported thermal alert |
| 22 Jul |
MODVOLC thermal alert and SVERT-reported thermal alert |
| 25 Jul |
Gas-and-steam emissions |
| 29-31 Jul |
SVERT-reported thermal alert |
| 02 Aug |
MODVOLC thermal alert |
| 05-09 Aug |
Gas-and-steam emissions and SVERT-reported thermal alerts on 5, 7, and 9 Aug |
| 12 Aug |
SVERT-reported thermal alert |
| 01 Sep |
MODVOLC thermal alert (twice) and SVERT-reported thermal alert |
| 28 Sep |
MODVOLC thermal alert |
| 04 Oct |
MODVOLC thermal alert (3 pixels) |
| 17-19 Oct |
Gas-and-steam emissions drifted 30-60 km SE and SVERT-reported thermal alert |
| 21-25 Oct |
Gas-and-steam emissions and SVERT-reported thermal alert on 24 Oct |
| 29-31 Oct |
Gas-and-steam emissions and SVERT-reported thermal alert |
| 04 Nov |
MODVOLC thermal alert (2 pixels) and SVERT-reported thermal alert |
| 05-06 Nov |
Gas-and-steam emissions drifted 55-100 km SE and SVERT-reported thermal alerts |
| 11 Nov |
MODVOLC thermal alert (2 pixels) |
| 13 Nov |
MODVOLC thermal alert (2 times) and SVERT-reported thermal alert |
| 14-15 Nov |
Gas-and-steam emissions and SVERT-reported thermal alert |
| 22 Nov |
SVERT-reported thermal alert |
| 25 Nov |
Gas-and-steam emissions drifted more than 50 km SE |
| 27 Nov |
MODVOLC thermal alert |
| 01 Dec |
MODVOLC thermal alert (4 pixels) |
| 02-04, 9 Dec |
SVERT-reported thermal alerts |
| 11 Dec |
MODVOLC thermal alert |
| 12, 15 Dec |
SVERT-reported thermal alerts |
| 18 Dec |
Gas-and-steam emissions |
| 25-26 Dec |
SVERT-reported thermal alert |
| 09, 12, 15 Jan 2014 |
SVERT-reported thermal alert |
| 17 Jan |
Gas-and-steam emissions and SVERT-reported thermal alert |
| 21 Jan |
SVERT-reported thermal alert |
| 08 Feb |
MODVOLC thermal alert and SVERT-reported thermal alert |
| 09 Feb |
Gas-and-steam emissions |
| 12, 15 Feb |
SVERT-reported thermal alerts |
| 16 Feb |
Gas-and-steam emissions |
| 20, 25 Feb |
SVERT-reported thermal alert |
| 27 Feb |
Gas-and-steam emissions |
| 04 Mar |
SVERT-reported thermal alert |
| 07 Mar |
MODVOLC thermal alert |
| 08 Mar |
MODVOLC thermal alert (2 times, 3 pixels on Terra satellite) |
| 12 Mar |
Gas-and-steam emissions drifted 80 km SE and MODVOLC thermal alert |
| 17 Mar |
MODVOLC thermal alert |
| 20 Mar |
Gas-and-steam emissions drifted 80 km SE |
| 21-24 Mar |
Gas-and-steam emissions |
| 26 Mar |
Gas-and-steam emissions drifted 80 km SE |
| 27 Mar |
Gas-and-steam emissions drifted 170 km SE |
| 09 Apr |
Gas-and-steam emissions drifted 170 km SE |
| 14, 15, 17 Apr |
SVERT-reported thermal alert |
| 20, 25, 27 Apr |
Gas-and-steam emissions |
| 29 Apr |
SVERT-reported thermal alert |
Geologic Background. The small, mostly unvegetated 3-km-wide island of Chirinkotan occupies the far end of an E-W volcanic chain that extends nearly 50 km W of the central part of the main Kuril Islands arc. It is the emergent summit of a volcano that rises 3000 m from the floor of the Kuril Basin. A small 1-km-wide caldera about 300-400 m deep is open to the SW. Lava flows from a cone within the breached crater reached the shore of the island. Historical eruptions have been recorded since the 18th century. Lava flows were observed by the English fur trader Captain Snow in the 1880s.
Information Contacts: Sakhalin Volcanic Eruption Response Team (SVERT) (URL in English: http://www.imgg.ru/?id_d=659); Hawai'i Institute of Geophysics and Planetology (HIGP), MODVOLC Thermal Alerts System, School of Ocean and Earth Science and Technology (SOEST), Univ. of Hawai'i, 2525 Correa Road, Honolulu, HI 96822, USA (URL: http://modis.higp.hawaii.edu/); and Earthquake Hazards Program, US Geological Survey (URL: http://earthquake.usgs.gov/).
Chirpoi (Russia) — December 2013 Cite this Report
Chirpoi
Russia
46.532°N, 150.871°E; summit elev. 742 m
All times are local (unless otherwise noted)
Periodic steam-and-gas emissions and thermal anomalies, November 2012-April 2014
On 6 November 1986, weak fumarolic activity was observed during an aerial survey (SEAN 12:04). The Sakhalin Volcanic Eruption Response Team (SVERT) noted that emissions were again observed in November 2012. This report covers steam-and-gas plumes and emissions and thermal alerts between 20 November 2012 and 30 April 2014.
SVERT's monitoring of Chirpoi is hampered by the lack of surface instruments or seismic network. The volcano is primarily monitored by satellites; cloud cover, however, often prevents space-borne observations. The location of Chirpoi in the Kuril Islands is shown in figure 1.
SVERT reported thermal anomalies at a volcano of Chirpoi called Snow, starting on 17 November 2012. Periods of steam-and-gas began on 15 December 2012. This activity continued through at least April 2014, based upon analysis of satellite images (table 1). Cloud cover often obscured views of the volcano.
Table 1. Steam-and-gas plumes and emissions from Snow, a Chirpoi volcano, between 21 November 2012 and 30 April 2014, based on analysis of satellite images. Cloud cover frequently prevented observations. Courtesy of SVERT.
| Year |
Dates |
Plume drift |
| 2012 |
15 and 19 Dec |
-- |
| 2013 |
9 and 11 Jan |
-- |
| 2013 |
1, 7, 10, 14-15, 19-22, 25 Feb |
-- |
| 2013 |
1, 3, 5 Mar |
-- |
| 2013 |
23 Jul |
-- |
| 2013 |
9 and 12 Aug |
-- |
| 2013 |
22-23, 29-31 Oct |
-- |
| 2013 |
4, 6, 25 Nov |
Drifted 90 km SE on 25 Nov |
| 2014 |
15, 20, and 27 Mar |
-- |
| 2014 |
13 Apr |
-- |
A search of MODVOLC thermal alerts at Chirpoi since 1980 found no such alerts until a they began at Snow on 11 November 2012. Between that date and 24 December 2012, many thermal alerts were reported. According to SVERT, this may have indicated a lava flow on the SE flank. No further alerts were reported until 8 July 2013; between 8 July and October 2013, thermal alerts were issued on six days. The only alerts between November 2013 and 30 April 2014 were on 10 March, 27-28 March, and 14, 16, 18, 21, 27, 29-30 April 2014.
Based on SVERT weekly reports on 12 and 19 November 2012, the Aviation Color Code increased from Green to Yellow between 5 and 19 November 2012, and remained Yellow through at least April 2014. (Green indicates a normal, non-eruptive state; Yellow indicates elevated unrest above background level.)
Geologic Background. Chirpoi, a small island lying between the larger islands of Simushir and Urup, contains a half dozen volcanic edifices constructed within an 8-9 km wide, partially submerged caldera. The southern rim of the caldera is exposed on nearby Brat Chirpoev Island. The symmetrical Cherny volcano, which forms the central cone of the island, erupted twice during the 18th and 19th centuries. The youngest volcano, Snow, originated between 1770 and 1810. It is composed almost entirely of lava flows, many of which have reached the sea on the southern coast. No recorded eruptions are known from Brat Chirpoev, but its youthful morphology suggests recent Strombolian activity.
Information Contacts: Sakhalin Volcanic Eruption Response Team (SVERT) (URL in English: http://www.imgg.ru/?id_d=659); and Hawai'i Institute of Geophysics and Planetology (HIGP), MODVOLC Thermal Alerts System, School of Ocean and Earth Science and Technology (SOEST), Univ. of Hawai'i, 2525 Correa Road, Honolulu, HI 96822, USA (URL: http://modis.higp.hawaii.edu/).
Colima
Mexico
19.514°N, 103.62°W; summit elev. 3850 m
All times are local (unless otherwise noted)
Episode of lava effusion following the January 2013 sequence of explosions
[Following 18-months of calm at Volcán de Colima (BGVN 38:04), a sequence of intermediate-to-small size Vulcanian explosions began in January 2013.] This sequence of explosions excavated a 250,000 m3 crater in the 2007-2011 lava dome (figure 105). Episodes of effusive activity within the new crater were recorded between the explosive events. An infrared image shows fresh magma at the crater base (figure 106).
Activity during 2013. [There were three stages of activity at Colima during 2013, defined based on data from seismic and video monitoring (figure 107).] The first stage (St. 1) refers to the sequence of explosions described in (BGVN 38:04). On 15 February and the end of March (St. 2), video observations indicated continued gradual lava dome growth in the new crater. The dome increased in height at the rate of ~1 m/day. As a result, during this interval the [summit elevation] increased from 3,843 to 3,874 m. The dome continued to fill the crater through the end of March (figure 108). During April-November 2013 the third stage (St. 3) of significant dome growth stopped. The February-March lava dome growth was accompanied by an increase in the frequency and energy of the small explosions. Once the dome filled the crater a small lava flow traveled toward the W. Due to the steepness of this flank, much of the fresh material descended as rockfalls, whose frequency increased from April.
During the third stage, the daily number of small explosions and rockfalls was quite stable. This stage was associated with the occurrence of 14 lahars that began with the rainy season being registered between 11 June and 8 October 2013 descending the flanks of the volcano (figure 109). The largest, lasting around 6 hours, occurred on 16 September 2013, when the Pacific coast was affected by tropical cyclone Manuel.
Activity during 2014. On 21 January 2014 the Washington VAAC first reported scattered ash emissions drifting S at 4.9 km altitude followed by a second and third emission that drifted SSW and S, respectively. Smaller ash emissions were noted throughout the following weeks. For example, Washington VAAC reported that on 7 February a small emission rose and drifted E then SE, followed by a later one the same day that drifted SE. From data provided by the Mexico Meteorological Watch Office, on 28 February an ash emission drifted 15 km SE at altitudes up to 4.6 km, and the following day, on 1 March, two emissions were reported drifting NNW, followed by three other plumes later the same day. The Washington VACC continued to report on activity as seen from satellite imaging, noting another emission on 6 March that drifted NE before dissipating and ; an emission on 12 March that drifted 25 km NNE before similarly dissipating; and a 19 March emission, which rose to 4.6 km and drifted E before dissipating 30 km from the source. A separate later plume followed on 22 March and drifted N.
Geologic Background. The Colima complex is the most prominent volcanic center of the western Mexican Volcanic Belt. It consists of two southward-younging volcanoes, Nevado de Colima (the high point of the complex) on the north and the historically active Volcán de Colima at the south. A group of late-Pleistocene cinder cones is located on the floor of the Colima graben west and east of the complex. Volcán de Colima (also known as Volcán Fuego) is a youthful stratovolcano constructed within a 5-km-wide scarp, breached to the south, that has been the source of large debris avalanches. Major slope failures have occurred repeatedly from both the Nevado and Colima cones, producing thick debris-avalanche deposits on three sides of the complex. Frequent recorded eruptions date back to the 16th century. Occasional major explosive eruptions have destroyed the summit (most recently in 1913) and left a deep, steep-sided crater that was slowly refilled and then overtopped by lava dome growth.
Information Contacts: Observatorio Vulcanologico de la Universidad de Colima (Colima Volcanological Observatory), Calle Manuel Payno, 209 Colima, Col., 28045 Mexico (URL: http://www.ucol.mex/volc/); Facultad de Ciencias, Universidad de Colima; and Washington Volcanic Ash Advisory Center (VAAC), NOAA Science Center Room 401, 5200 Auth road, Camp Springs, MD 20746, USA (URL: http://www.ospo.noaa.gov/Products/atmosphere/vaac/).
Cerro Hudson (Chile) — December 2013 Cite this Report
Cerro Hudson
Chile
45.9°S, 72.97°W; summit elev. 1905 m
All times are local (unless otherwise noted)
October 2011 earthquakes and eruption with ash, causing evacuation
A large eruption occurred at Cerro Hudson on 8 August 1991 (BGVN 16:07-18:02), which was followed by minor non-eruptive activity that caused sulfurous odors, increased river flows and turbidity, and noise at least through early 1995 (BGVN 20:02). This report describes a minor eruption during 25-26 October 2011. Cerro Hudson is located in Patagonia in the Aysén Region of Chile (figure 1).
According to the Southern Andes Volcanological Observatory-National Geology and Mining Service (OVDAS-SERNAGEOMIN), seismicity increased during 25-26 October 2011. On 25 October, an M 4.6 volcano-tectonic earthquake occurred at a depth of 19 km, followed by a seismic swarm. More than 100 events, with depths ranging from 15 to 25 km, were recorded through the next day; twelve were M 3, and three were M 4. Most of the earthquakes were volcano-tectonic events with magnitudes below 3.6 and located W of the caldera at depths between 3 and 25 km. The earthquake hypocenters became shallower over time. OVDAS-SERNAGEOMIN did not detect any explosive event or episodes of high intensity harmonic tremor (as reported on 28 October).
During a 24-hour period beginning at 1600 on 27 October, an average of one earthquake per hour was recorded. Most were long-period with magnitudes less than 2.2. On 27 October, an M 3.6 VT earthquake occurred on the SW edge of the crater.
On 26 and 27 October, OVDAS-SERNAGEOMIN and local authorities flew over the caldera and observed three new craters along the SSE edge of the caldera, with approximate diameters of 200, 300, and 500 m. Mostly white plumes rose above the two smaller craters. The largest, southern-most crater emitted a plume with more ash that rose more than 5 km above the crater. Satellite imagery showed a plume drifting 12 km SE. The scientists also observed lahars in the Huemules river, to the W. In response, OVDAS-SERNAGEOMIN raised the Alert Level to 5 (Red), the highest level. According to the Oficina Nacional de Emergencia - Ministerio del Interior (ONEMI), 140 people were evacuated from areas within a 45-km radius of the volcano, defined as a high-risk zone. The hazard lay not only with earthquakes and eruption, but also with the possibility of flooding resulting from to glacier melt.
During another overflight on 28 October scientists observed a gas plume with a very low ash content rising 3-4 km above the craters. Seismicity continued to decrease during 28-29 October. Plumes were observed on 29 October (figure 9). Scientists conducting an overflight noted that one ash plume rose 1 km above the craters and drifted 5-8 km NE. They also confirmed that a large lahar descended the volcano and flowed into the drainage system including the Huemules river during the initial phase of the eruption. During another observation flight on 30 October, scientists saw ash plumes rising 0.8 km from two of the three craters.
On 31 October, scientists observed gas plumes rising 0.5 km above the craters and drifting SE. Around 31 October, they also noted subsequent minor explosions and ash emissions. On 1 November, scientists observed an explosion and an accompanying ash plume that rose 1.5 km above the active craters.
On 2 November, OVDAS-SERNAGEOMIN reported that the Alert Level for Cerro Hudson had been lowered to 4 (Yellow), noting that the eruption that began on 26 October had ceased. ONEMI reported that the 140 evacuees were permitted to return home. Analysis of ash deposited on the edge of the crater during the eruption indicated the presence of juvenile basalt. During 1-6 November between 16 and 110 earthquakes per day were recorded, and satellite images showed drifting plumes daily.
According to OVDAS-SERNAGEOMIN, satellite imagery and an area web camera showed no plumes during 7-15 November. Seismic activity decreased significantly, reaching no more than four earthquakes per hour.
The NASA Earth Observatory photographed Cerro Hudson on 17 November 2011 (figure 10) and weeks later (figure 11).
Geologic Background. The ice-filled, 10-km-wide caldera of Cerro Hudson volcano was not recognized until its first 20th-century eruption in 1971. It is the southernmost volcano in the Chilean Andes, related to subduction of the Nazca plate beneath the South American plate. The massive volcano covers an area of 300 km2. The compound caldera is drained through a breach on its NW rim, which has been the source of mudflows down the Río de Los Huemeles. Two cinder cones occur N of the volcano and others occupy the SW and SE flanks. This volcano has been the source of several major Holocene explosive eruptions. An eruption about 6,700 years ago was one of the largest known in the southern Andes during the Holocene; another eruption about 3,600 years ago also produced more than 10 km3 of tephra. An eruption in 1991 formed a new 800-m-wide crater in the SW portion of the caldera.
Information Contacts: SERNAGEOMIN (Southern Andes Volcanological Observatory-National Geology and Mining Service), Avda Sta María No. 0104, Santiago, Chile (URL: http://www.sernageomin.cl/); NASA Earth Observatory, EOS Project Science Office, NASA Goddard Space Flight Center, Goddard, Maryland, USA (URL: http://earthobservatory.nasa.gov/); Oficina Nacional de Emergencia - Ministerio del Interior (ONEMI), Beaucheff 1637 / 1671, Santiago, Chile (URL: http://www.onemi.cl/); and El Mercurio (URL: http://www.elmercurio.cl/).
Karthala (Comoros) — December 2013 Cite this Report
Karthala
Comoros
11.75°S, 43.38°E; summit elev. 2361 m
All times are local (unless otherwise noted)
Increased nighttime incandescence during 9-10 May 2012
Our last report on activity at Karthala, located in the Comoros Islands, covered elevated seismicity and a subsequent eruption in January 2007 (BGVN 32:01). The volcano was then quiet until May 2012.
U.S. Embassy Comoros Officer, Michael Zorick informed us that residents on Karthala's W flank, in the villages of Mde and Mkazi (each ~12 km from the summit), reported observing intensified red glow toward the volcano summit during the night of 9-10 May 2012. He further indicated that there was no perceptible seismic activity.
A search for thermal alerts on the MODVOLC website revealed an absence of alerts after those associated with the 2007 eruption.
Geologic Background. The southernmost and largest of the two shield volcanoes forming Grand Comore Island (also known as Ngazidja Island), Karthala contains a 3 x 4 km summit caldera generated by repeated collapse. Elongated rift zones extend to the NNW and SE from the summit of the Hawaiian-style basaltic shield, which has an asymmetrical profile that is steeper to the S. The lower SE rift zone forms the Massif du Badjini, a peninsula at the SE tip of the island. Historical eruptions have modified the morphology of the compound, irregular summit caldera. More than twenty eruptions have been recorded since the 19th century from the summit caldera and vents on the N and S flanks. Many lava flows have reached the sea on both sides of the island. An 1860 lava flow from the summit caldera traveled ~13 km to the NW, reaching the W coast to the N of the capital city of Moroni.
Information Contacts: Michael P. Zorick, Comoros Officer, Embassy of the United States of America, Antananarivo, Madagascar; and Hawai'i Institute of Geophysics and Planetology (HIGP), MODVOLC Thermal Alerts System, School of Ocean and Earth Science and Technology (SOEST), Univ. of Hawai'i, 2525 Correa Road, Honolulu, HI 96822, USA (URL: http://modis.higp.hawaii.edu/).
Mauna Kea (United States) — December 2013 Cite this Report
Mauna Kea
United States
19.82°N, 155.47°W; summit elev. 4205 m
All times are local (unless otherwise noted)
In repose; background conditions and hazards
This is the first Bulletin report for Mauna Kea, the tallest volcano on the Island of Hawai`i (figures 1, 2, and 3). Although the most recent eruption occurred ~4,500 years ago, this volcano has the potential to reawaken. This report presents early observations by Western explorers; discussions from Hawaiian Volcano Observatory (HVO) scientists focusing on the potential for future eruptions; seismicity during 2000-2013; and a recent report by HVO scientists highlighting drastic changes at an alpine lake, Lake Waiau.
Eruptive style and activity status. Mauna Kea is presently considered a volcano exhibiting quiescence that has, according to the known geologic record, an extensive history of lapsed activity. Between 6,000 and 4,000 years ago, eruptions occurred at at least seven separate vents. The record indicates that compared with Mauna Loa, which erupted every few years to few tens of years, and Hualalai, which erupted every few hundred years, Mauna Kea has exhibited long breaks in activity (USGS, 2002).
Based on the occurrence of 12 eruptions within a 10,000 year period, Mauna Kea's recurrence interval is ~1,000 years (Geohazards Consultants International, Inc., 2000). According to the Mauna Kea Science Reserve Master Plan released by the Geohazards Consultants International, Inc. in March 2000:
"Mauna Kea's post-glacial eruptions have been episodic rather than periodic, however, with a particular concentration of eruptive activity between 4,400-5,600 years ago. The 1,000 year recurrence interval of the past 10,000 years does not thus indicate that an eruption is 'overdue', but does reinforce the likelihood that eruptions will occur sporadically in the future."
This pattern of activity might also imply that the next eruption of Mauna Kea could be followed by others at much shorter intervals, representing a potential clustering of events in the given time interval (Jim Kauahikaua, personal communication, 30 May 2014).
Mauna Kea's most recent eruption occurred ~4,500 years ago, generating both lava flows and cinder cones. This activity is considered characteristic of a volcanic system that had evolved past the shield-building stage to the post-shield stage (Hoover and Fodor, 1997). The above-stated age determinations were made based on radiocarbon dating of charcoal collected within the Humu`ula soil (Porter, 1971; Wolfe and others, 1997); this soil lies directly beneath the S flank lava flows of Pu`ukole and Pu`u Loa Loa (figure 4).
The designations of shield-building and post-shield stages come from a system of structural development that represents the current understanding of Hawaiian volcanism. Significant cinder cone eruptions are a hallmark of the post-shield stage as well as: "(1) the absence of a summit caldera and elongated fissure vents that radiate across its summit; (2) steeper and more irregular topography (for example, the upper flanks of Mauna Kea are twice as steep as those of Mauna Loa; [figure 5]); and (3) different chemical compositions of the lava" (Clague and Dalrymple, 1987; USGS, 2002).
Gravity model. Investigations by Kauahikaua and others (2000) determined a three-dimensional gravity model for the Island of Hawai`i distinguished the five volcanic centers comprising the island: Kohala, Mauna Kea, Hualalai, Mauna Loa, and Kīlauea (figure 6). The base data for that map came from more than 3,300 gravity measurements made above sea level. Positive gravity anomalies define gravitationally dense zones caused by intrusions and cumulates beneath the summit and known rift zones of each of the five volcanoes composing the island. Figure 6 maps the 3-dimensional structure as modeled from the gravity data and expresses the gravity anomalies in terms of elevation from the overlying ground surface.
"Mauna Kea has an elliptical-shaped core, slightly elongated east-west, with a broad, linear feature trending southeast. This linear feature may be a buried rift zone of Mauna Kea, although no surface expressions of those rift zones have been mapped (Kauahikaua and others, 2000)."
The submarine feature known as the Hilo Ridge was also included in the density study with data contributed by GLORIA (a side-scan sonar) as well as satellites ERS-1, Geosat, and Seasat. Prior to this investigation, the Hilo Ridge had been attributed to Mauna Kea as its possible rift zone; however, the authors determined a stronger connection with Kohala due to multiple factors including the strongly NW-trending linear zone that extends ~80 km from the modelled core of Kohala.
Early European observations. An early survey of Hawai`i was conducted by Archibald Menzies, a botanist who accompanied Captain George Vancouver during the cruises of 1792-1794. Menzies successfully ascended Mauna Loa in February 1794 (a team from Captain Cook's crew had unsuccessfully attempted the summit in 1779; see figure 7). Menzies estimated the heights of Mauna Loa and Mauna Kea to within 31 m of the currently accepted value, "a remarkable surveying feat for that time" (Wright and others, 1992b).
The first petrologist to study Mauna Kea, R.A. Daly, determined not only that Mauna Kea's upper flanks were dominated by lava flows more rich in silica (he called them "andesite" although current classifications label them "hawaiite"), but also that the edifice had been modified by glaciers (Wolfe and others, 1997; Daly, 1911). Stearns and Macdonald (1946) and Washington (1923) expanded the knowledge base of Mauna Kea's geochemistry, and Gregory and Wentworth (1937) established that the glacial features from the most recent glacial episode (40,000 to 13,000 years ago) were interspersed with primary volcanic material. Wolfe and others (1997) determined that "eruptive activity of Mauna Kea was partly contemporaneous with that at Kohala, Hualalai, and Mauna Loa, and the volcano boundaries are undoubtedly complex."
HVO Volcano Watch article highlights a Mauna Kea forecast. The potential for a future eruption from Mauna Kea was addressed in a Volcano Watch article posted in June 2000 by then Scientist-in-Charge, Don Swanson, from the Hawaiian Volcano Observatory (HVO) (Swanson, 2000ab). The article addresses not only eruption frequency but also trends in eruption style, the potential response of the telescope installation at Mauna Kea's summit, and a general forecast for a likely scenario in the future.
"The next eruption of Mauna Kea."
"Mauna Kea's peaceful appearance is misleading. The volcano is not dead. It erupted many times between 60,000 and 4,000 years ago, and some periods of quiet during that time apparently lasted longer than 4,000 years. Given that record, future eruptions seem almost certain.
"Before the next one, we should have ample warning provided by our current seismic and geodetic monitoring systems. A number of earthquakes occur beneath Mauna Kea each year, and you can bet that we pay close attention to them. However, they all appear to be associated with tectonic faulting rather than movement of magma.
"The telescopes on top of the volcano may be the first to indicate that something is amiss. The coordinates used for tracking their observations will begin to drift unexpectedly as the volcano is swelling. In a sense, the telescopes will serve as very expensive tiltmeters.
"We cannot now say when the next eruption will take place, except that it is unlikely to be in the next several months, given the current lack of any precursory signs. Whether the timing is years, centuries, or millennia is entirely unclear.
"But we can say something about the probable nature of the next eruption, because we know what the most recent ones were like, thanks to recently published research by Ed Wolfe [see Wolfe and others, 1997], former staff member of HVO, and colleagues.
"The next eruption could take place anywhere on the upper flanks of the volcano. As Mauna Kea evolved from its early shield stage (equivalent to Kīlauea and Mauna Loa today) to its present postshield stage, the volcano lost its rift zones. Consequently, the postshield eruptions are not concentrated along narrow zones but instead are scattered across the mountain. [See figure 6.]
"For example, the most recent eruptive period, 6,000-4,000 years ago, involved eight vents on the south flank of the volcano between Kala`i`eha cone (near Humu`ula) and Pu`ukole (east of Hale Pohaku). During this same period, eruptions took place on the northeast flank at Pu`u Lehu and Pu`u Kanakaleonui. Lava from Pu`u Kanakaleonui flowed more than 20 km (12 miles) northeastward, entering the sea to form Laupahoehoe Point.
"The next eruption will likely produce a lava flow, because each eruption in the past 60,000 years has done so. The longest flows will reach 15-25 km (9-15 miles) downslope. Most of each flow will be `a`a, but pahoehoe may form near vents.
"A prominent cinder cone will probably be constructed at each vent. The cinder cones responsible for the "bumpy" appearance of Mauna Kea's surface formed during the 60,000-4,000-year interval. The cones mentioned by name above, and several others, were built during the latest eruptive period 6,000-4,000 years ago. The next eruption will likely produce a similar cone.
"Cinder cones form at vents that are point sources, not elongate fissures. All activity is concentrated at one place, so that fountaining and spattering build a high cone rather than a long rampart. Past eruptions-and hence future ones--probably lasted months to several years, providing enough time to construct a substantial cone. Those eruptions spread voluminous ash deposits far beyond the cinder cones themselves, and the next eruption will probably do so, too.
"Possibly, however, there will not be enough spattering to build a lasting cone. Such an eruption happened about 1 km (0.6 miles) southeast of Hale Pohaku, when a vent put out a moderate volume of lava without building a spatter or cinder cone.
"The next eruption of Mauna Kea is unlikely to occur in our lifetimes, but it could. There is no reason to fear such an eruption. It would not threaten human life, provided due care were taken, though it could prove devastating to property and infrastructure, particularly if a lava flow traveled to the Hamakua coast or the Waimea area."
Mauna Kea's seismicity. HVO has monitored and maintained the record of seismicity for the entire region of Hawai`i. The seismicity detected beneath Mauna Kea has been characterized as "infrequent and sparse." Notable seismicity occurred in 1994, 2001, and 2011, when earthquakes were large enough to be felt by the general public. Island-wide instrumentation allowed excellent location data for the local seismicity (figure 8).
HVO reported that, several times each year, earthquakes from Mauna Kea cause shaking that is noted by local populations - especially the operators of the Mauna Kea astronomical observatory, who rely on stable instrumentation in order to make precise observations. Reports of felt earthquakes from Mauna Kea correlated with magnitude 2.1-4.9 earthquakes during 1973-2012.
Elevated seismicity during October-December 2011 resulted in 30 felt earthquakes. Approximately 570 people reported the M 4.5 earthquake that occurred on 20 October 2011 and also 10 of the aftershocks that followed (figure 9). HVO reported that, like many of Mauna Kea's earthquakes, these earthquakes were "most likely caused by structural adjustments within the Earth's crust due to the heavy load of Mauna Kea." With an estimated volume of >30,000 km3, Mauna Kea rises ~10,000 m above the seafloor, causing stress to accumulate from the mass of the volcano (Lockwood and Hazlett, 2010).
Earthquake swarms at Mauna Kea. HVO reported that earthquake swarms occasionally occur at Mauna Kea. On 23 February 2001, a swarm of ~15 events was detected within a 21-hour period. These earthquakes were mainly located ~15 km S of Pa`auilo (~3 km NW of Kuka`iau, figure 10), at a depth of 8-11 km.
Lake Waiau recedes. The cinder cone Pu`uwaiau, located within 2 km of the summit, has contained a freshwater lake that was considered permanent by Wolfe and others (1997) (figures 11 and 12). Lake Waiau has likely persisted due to the once-glassy cinders and bombs that have weathered to smectite with zeolites within the void spaces. These alteration products may serve as a weak cement between the pyroclasts and reduce the permeability of the cinder cone's base. Sporadic winter storms have provided most, if not all, of the water captured in this considerably arid region (Patrick and Delparte, 2014). Contributions from permafrost were also proposed by Woodcock (1980), but the presence of permafrost has not been confirmed near Lake Waiau.
Patrick and Delparte (2014) reported that the lake size before 2010 was 5,000-7,000 m2 with a depth of ~3 m, but recently, the size has been decreasing rapidly. In the recent past, the lake was known to overflow through the Pohakuloa Gulch when water levels exceeded the rim (as recently as February 2002) (Ehlmann and others, 2005).
Researchers have determined that Lake Waiau is sensitive to precipitation levels (Woodcock, 1980) and that ongoing drought conditions could be driving the lake's change (Patrick and Delparte, 2014). Based on the National Drought Mitigation Center's data, since 2008, and notably in March 2010, precipitation has been sparse at the summit of Mauna Kea.
In December 2013, scientists visited the lake and observed an unprecedented sight (figure 13). Lake Waiau measured a mere 115 m2 and was roughly 10-20 cm deep (Patrick and Delparte, 2014). While the lake size was known to fluctuate over time, this dramatic reduction has caused concern, given the possibility of losing a specialized ecosystem as well as a prominent feature of Hawaiian ethnogeography. Mauna Kea's summit is considered "one of the most sacred spots in the Hawaiian Islands. Archaeological sites near the summit attest to its prolonged spiritual importance...(Patrick and Delparte, 2014)."
USGS scientists at HVO as well as collaborators, including Idaho State University, continued to study the conditions at Lake Waiau after the significant survey was conducted in December 2013. As of May 2014, strong winter rains had partially restored the lake, providing stronger evidence that the multi-year shrinkage was due to the ongoing drought as opposed to changes in the volcanic system.
A note regarding the name Mauna Kea. The popular translation of the Hawaiian name Mauna Kea is frequently "White Mountain," however, significant discussions have focused on the source of the name. There has been growing consensus that Mauna Kea is a shortened form of Mauna a Wakea, which refers to the sky father Wakea.
According to testaments presented in the Final Environmental Impact Statement of the Federal Highway Administration Project No. A-AD-6(1) which included potential cultural impacts on the island by expanding State Routes 190 and 200, "The mountain is the sacred child of Wakea, and it is the source for the land. The mountains and land were genealogically connected to native Hawaiians through the original ancestor, Wakea [sky father] and Papa [earth mother]."
Ethnographic research conducted prior to 1999 and released in the impact statement concluded that the summit area of Mauna Kea was eligible for the National Register of Historic Places due to traditional cultural property.
A note regarding Hawaiian names and nomenclature. As previously noted in other Bulletin reports, according to Runyon (2006), "The U.S. Board on Geographic Names (BGN) is responsible for establishing and maintaining uniform geographical name usage throughout all departments and agencies of the United States government. As such, the Board collects and promulgates every name that is considered official for Federal use. The official vehicle for promulgating these names and their locative attributes is the Geographic Names Information System (GNIS).
"Until the 1990's, it was also Federal policy to omit most diacritics and writing marks from placenames on Federal maps and documents. The few exceptions included the Spanish tilde and the French accent marks, but otherwise the special characters found in indigenous names were always dropped. In more recent years, however, the BGN has amended its policy to permit the inclusion of such marks, thus more accurately reflecting the true representation of the native language. An example of this has been the addition of the glottal stop (okina) and macron (kahako) to placenames of Hawaiian origin, which prior to 1995 had always been omitted. The BGN staff, under the direction and guidance of the Hawaii State Geographic Names Authority, has been restoring systemically these marks to each Hawaiian name listed in GNIS."
GVP will strive to conform to GNIS nomenclature. It remains a technological challenge, but a goal.
References: Clague, D.A., and Dalrymple, G.B., 1987, The Hawaiian-Emperor volcanic chain. Part I. Geologic evolution, chap. 1 of Decker, R.W, Wright, T.L., and Stauffer, PH., eds., Volcanism in Hawaii: U.S. Geological Survey Professional Paper 1350, v. 1, p. 5-54.
Daly, R.A., 1911, Magmatic differentiation in Hawaii: Journal of Geology, v. 19, no. 4, p. 289-316.
Federal Highway Administration, 1999, Final Environmental Impact Statement Part 1: Hawaii State Route 200, Mamalahoa Highway (SR 190) to Milepost 6 Saddle Road, County of Hawai`i, State of Hawai`i, FHWA Project No. A-AD-6(1).
Ehlmann, B.L., Arvidson, R.E., Jolliff, B.L., Johnson, S.S., Ebel, B., Lovenduski, N., Morris, J.D., Beyers, J.A., Snider, N.O., and Criss, R.E., 2005. Hydrologic and isotopic modeling of Alpine Lake Waiau, Mauna Kea, Hawai`i. University of Hawaii Press, p. 1-15.
Fitzpatrick, G.L, 1986. The early mapping of Hawaii. Honolulu: Editions Limited, vol. 1, 160 pp.
Geohazards Consultants International, Inc., Mauna Kea Science Reserve Master Plan, Volcano, HI, March 2000, 22 p.
Gregory, H.E., and Wentworth, C.K., 1937, General features and glacial geology of Mauna Kea, Hawaii: Geological Society of America Bulletin, v. 48, no. 12, p. 1719-1742.
Holt, Rinehart, and Winston (2006), Hawaii. Retrieved from http://go.hrw.com/atlas/norm_htm/hawaii.htm.
Hoover, S.R. and Fodor, R.V., 1997, Magma-reservoir crystallization processes: small-scale dikes in cumulate gabbros, Mauna Kea Volcano, Hawaii, Bulletin of Volcanology, 59, p. 186-197.
Kauahikaua, J., Hildenbrand, T., & Webring, M., 2000. Deep magmatic structures of Hawaiian volcanoes, imaged by three-dimensional gravity models. Geology, 28, 10, p. 883.
Lockwood, J.P., and Hazlett, R.W., 2010. Volcanoes: Global Perspectives, Wiley-Blackwell, Hoboken, NJ, ix, 539 p.
Okubo, P.G. and Nakata, J.S., 2011, Earthquakes in Hawai`i-An Underappreciated but Serious Hazard, Fact Sheet 2011-3013, USGS Fact Sheet, September 2011. (http://pubs.usgs.gov/fs/2011/3013/)
Patrick, M. R. and Delparte, D., 2014, Tracking Dramatic Changes at Hawaii's Only Alpine Lake: EOS (Transactions, American Geophysical Union), Vol. 95, No. 14, p. 117-118.
Porter, S.C., 1971, Holocene Eruptions of Mauna Kea Volcano, Hawaii, Science, Vol. 172 no. 3981 p. 375-377.
Stearns, H.T., and Macdonald, G.A., 1946, Geology and ground-water resources of the Island of Hawaii: Hawaii Division of Hydrography Bulletin 9, 363 p.
Swanson, D.A., (June 2000a). The next eruption of Mauna Kea. Volcano Watch. Retrieved from http://hvo.wr.usgs.gov/volcanowatch/archive/2000/00_06_01.html.
Swanson, D.A., 2000b, Don't be fooled by seemingly peaceful Mauna Kea Volcano--it could erupt again: Hawaii Tribune-Herald, June 4, p. 2.
USGS-HVO (May 2002). Mauna Kea Hawai`i's Tallest Volcano. Other Volcanoes. Retrieved from http://hvo.wr.usgs.gov/volcanoes/maunakea/.
Washington, H.S., 1923, Petrology of the Hawaiian Islands; I, Kohala and Mauna Kea, Hawaii: American Journal of Science, ser. 5, v. 5, no. 30, p. 465-502.
Wolfe, E.W., Wise, W.S., and Dalrymple, G.B., 1997, The geology and petrology of Mauna Kea volcano, Hawaii: a study of postshield volcanism. U.S. Geological Survey Professional Paper 1557, Washington, D.C.: U.S. G.P.O.
Woodcock, A., 1980. Hawaiian alpine lake level, rainfall trends, and spring flow, Pacific Science, 34, p. 195–209.
Wright, T.L., Chu, J.Y., Esposo, J., Heliker, C., Hodge, J., Lockwood, J.P., and Vogt, S.M., 1992a, Map showing lava-flow hazard zones, island of Hawaii: U.S. Geological Survey Miscellaneous Field Studies Map MF-2193, scale 1:250,000.
Wright, T.L., Takahashi, T.J., and Griggs, J.D., 1992b, Hawai`i Volcano Watch: A Pictorial History, 1779-1991, University of Hawaii Press, Honolulu, 162 p.
Geologic Background. Mauna Kea, Hawaii's highest volcano, reaches 4205 m, only 35 m above its neighbor, Mauna Loa. In contrast to Mauna Loa, Mauna Kea lacks a summit caldera and is capped by a profusion of cinder cones and pyroclastic deposits. It's rift zones are less pronounced than on neighboring volcanoes, and the eruption of voluminous, late-stage pyroclastic material has buried much of the early basaltic shield volcano, creating a steeper and more irregular profile. This transition took place about 200,000 to 250,000 years ago, and much of Mauna Kea, whose Hawaiian name means "White Mountain," was constructed during the Pleistocene. Its age and high altitude make it the only Hawaiian volcano with glacial moraines. A road that reaches a cluster of astronomical observatories on the summit also provides access to seasonal tropical skiing. The latest eruptions produced a series of cinder cones and lava flows from vents on the northern and southern flanks during the early- to mid-Holocene.
Information Contacts: Hawaiian Volcano Observatory (HVO), U.S. Geological Survey, PO Box 51, Hawai`i National Park, HI 96718, USA (URL: https://volcanoes.usgs.gov/observatories/hvo/); Richard Wainscoat, University of Hawaii at Manoa, Institute for Astronomy (URL: http://www.ifa.hawaii.edu/, http://www.ifa.hawaii.edu/images/aerial-tour-95/); Scott Rowland, University of Hawaii at Manoa, School of Ocean and Earth Science and Technology (URL: http://www.soest.hawaii.edu/); and Hawaii News Now (URL: http://www.hawaiinewsnow.com/).
San Cristobal (Nicaragua) — December 2013 Cite this Report
San Cristobal
Nicaragua
12.702°N, 87.004°W; summit elev. 1745 m
All times are local (unless otherwise noted)
Explosions on 7 June 2013; gas-and-ash emissions in early 2014
Our last Bulletin report covered seismicity and explosions at San Cristóbal through 31 December 2012 (BGVN 38:01).
2013. The Instituto Nicaragüense de Estudios Territoriales (INETER) reported that on 7 June 2013 seven explosions at San Cristóbal, that ejected gas and ash, were detected by the seismic station located on the W flank. The explosions occurred at 0615, 0645, 0653, 0911, 1137, 1139, and 1143, and were observed by civil defense and INETER staff. The largest explosion, at 1139, generated a plume that rose 100 m. Sulfur dioxide (SO2) emissions, which had been low, increased. A report later that afternoon stated that gas-and-ash explosions decreased, but RSAM values almost tripled to between 80 and 100 units due to increased tremor. INETER noted that tremor is frequently detected at San Cristóbal, and for the public not to be alarmed. A small mud flow, producing no damage, occurred at 1710.
2014. INETER reported that seismic tremor increased at 0340 on 17 January; RSAM values increased to 460 units from a baseline of 70 units. Twelve gas emissions were observed between 1259 and 1315, and RSAM climbed to 649 units. A report at 1700 noted that RSAM values decreased to 100 and no additional gas emissions were observed. The next day RSAM values fluctuated between 90 and 190 units.
INETER reported that a gas emission with small amounts of ash rose from San Cristóbal between 0641 and 0850 on 4 February. Although there was no increase noted, the report stated that seismicity decreased to background levels. By the afternoon SO2 emission values were 2,000-3,000 tons per day, the normal levels, and on 7 February, they were 1,000 tons per day. RSAM fluctuated between 20 and 140 units, which is considered normal.
Based on analysis of satellite images, the Washington VAAC reported that on 11 April a gas plume from San Cristóbal that possibly contained small amounts of ash drifted 20 km W. A thermal anomaly was present in short wave infrared satellite images. Periods of elevated seismicity were also detected.
Geologic Background. The San Cristóbal volcanic complex, consisting of five principal volcanic edifices, forms the NW end of the Marrabios Range. The symmetrical 1745-m-high youngest cone, named San Cristóbal (also known as El Viejo), is Nicaragua's highest volcano and is capped by a 500 x 600 m wide crater. El Chonco, with several flank lava domes, is located 4 km W of San Cristóbal; it and the eroded Moyotepe volcano, 4 km NE of San Cristóbal, are of Pleistocene age. Volcán Casita, containing an elongated summit crater, lies immediately east of San Cristóbal and was the site of a catastrophic landslide and lahar in 1998. The Plio-Pleistocene La Pelona caldera is located at the eastern end of the complex. Historical eruptions from San Cristóbal, consisting of small-to-moderate explosive activity, have been reported since the 16th century. Some other 16th-century eruptions attributed to Casita volcano are uncertain and may pertain to other Marrabios Range volcanoes.
Information Contacts: Instituto Nicaragüense de Estudios Territoriales (INETER), Apartado Postal 2110, Managua, Nicaragua (URL: http://www.ineter.gob.ni/); and Washington Volcanic Ash Advisory Center (VAAC), Satellite Analysis Branch (SAB), NOAA/NESDIS E/SP23, NOAA Science Center Room 401, 5200 Auth Rd, Camp Springs, MD 20746, USA (URL: http://www.ospo.noaa.gov/Products/atmosphere/vaac/).
Stromboli (Italy) — December 2013 Cite this Report
Stromboli
Italy
38.789°N, 15.213°E; summit elev. 924 m
All times are local (unless otherwise noted)
Small-to-moderate eruptions continue through February 2013
Our last report, (BGVN 36:09), covered activity at Stromboli through 11 October 2011, characterized by explosions, spattering, rockslides, and occasional lava flows. Similar activity persisted through February 2013. Stromboli (volcano and island) sits N of Sicily in the Tyrrhenian sea along the N side of the Aeolian archipelago.
Activity during 2011. The activity documented in October 2011 continued into November, December, and January 2012, and was concentrated at the two active vent areas in the northern and southern portions of the crater terrace. The wide array of activity noted above fluctuated. There were, along with frequent episodes of spattering, in particular on 10 December 2011. The spattering episodes occurred in the southern area and did not lead to the formation of any lava flows.
Activity during 2012. Stromboli exhibited two periods of isolated activity early in 2012, discussed next. On 16 February there were two sequences of up to 6 explosion earthquakes of medium-high amplitude, and ~9 Very Long Period (VLP) events per hour.
On 6 March, instruments detected both tremor coupled with a strong explosion and at least three major explosions. The first event, at 0643 UTC, presented a VLP component with amplitude ~10-times higher than the daily average. The last event, at 0645, was also of very high amplitude. The VLP events occurred at a rate of ~12 per hour, at a low level with a single event of high amplitude, corresponding to the first event in the sequence at 0643. The VLP sequence was followed by an increase in tremor lasting ~30 minutes. The tremor amplitude was medium-low with its peak corresponding to the earlier events seen around 0643.
On 22 November 2012, the persistent explosive activity at Stromboli showed a clear increase, with episodes of spattering and low lava fountains from two vents in the northern and central portions of the crater terrace.
Beginning on 23 December 2012, repeated lava overflows from the crater terrace generated small lava flows down the northern and northwestern sectors of the Sciara del Fuoco (see images below), and were accompanied by numerous landslides.
Major lava flows occurred on the evening of 23 December 2012 (to the N), during 25-27 December 2012 (to the NW), and on the morning of 7 January 2013 (to the NW). Lava vented from points just below the rim of the northernmost explosive vent on the crater terrace. During the intervals between the main effusive episodes, lava vented at extremely low, releasing numerous incandescent blocks down the Sciara del Fuoco (the area within the sector collapse). At times, small lava flows advanced for a few tens of meters before disintegrating into blocks, such as on the morning of 10 January 2013 (see the last photo in the sequence below in figure 82).
Around this time, in all cases, the effusion of lava was preceded, and often accompanied, by intense explosive activity on the crater terrace.
More insight into behavior at Stromboli during this December 2012-March 2013 eruptive phase can be found in Di Traglia and others (2014). They applied the ground-based InSAR monitoring system at Stromboli volcano, linking changes in displacement and other field-monitored observations to volcanism.
Activity during January-February 2013. A new phase of intermittent effusive activity at Stromboli consisting of small overflows of lava from the crater terrace began on 8 February 2013 and continued with significant fluctuations until the morning of 17 February. During this interval, several episodes of effusive activity occurred, which produced lava flows reaching several tens to a few hundred meters in length in the northern and northwestern sectors of the Sciara del Fuoco.
Spattering from vent N2, which lies at the top of a hornito perched on the NW rim of the crater terrace, continued for a few hours, and then diminished during the late afternoon of 14 February. See Figure 83. Subsequently, effusive activity diminished considerably, producing only very small lava overflows that extended a few tens of meters downslope to the NW. On the morning of 17 February, all effusive activity ceased and mild Strombolian activity resumed.
After an interval of 10 days of normal Strombolian activity, Stromboli again produced small lava overflows from the crater terrace from the afternoon of 27 February 2013 through the following night. A second episode of lava overflow started on the evening of 1 March and ceased the next afternoon. Both overflows were fed by continuous spattering from vent N2.
Reference. Di Traglia, F., Intrieri, E., Nolesini, T., Bardi, F., Del Ventisette, C., Ferrigno, F., Frangioni, S., Frodella, W., Gigli, G., Lotti, A., Tacconi Stefanelli, C., Tanteri, L., Leva, D., Casagli, N., 2014, The ground-based InSAR monitoring system at Stromboli volcano: linking changes in displacement rate and intensity of persistent volcanic activity, Bulletin of Volcanology 76:786DOI 10.1007/s00445-013-0786-2.
Geologic Background. Spectacular incandescent nighttime explosions at Stromboli have long attracted visitors to the "Lighthouse of the Mediterranean" in the NE Aeolian Islands. This volcano has lent its name to the frequent mild explosive activity that has characterized its eruptions throughout much of historical time. The small island is the emergent summit of a volcano that grew in two main eruptive cycles, the last of which formed the western portion of the island. The Neostromboli eruptive period took place between about 13,000 and 5,000 years ago. The active summit vents are located at the head of the Sciara del Fuoco, a prominent scarp that formed about 5,000 years ago due to a series of slope failures which extends to below sea level. The modern volcano has been constructed within this scarp, which funnels pyroclastic ejecta and lava flows to the NW. Essentially continuous mild Strombolian explosions, sometimes accompanied by lava flows, have been recorded for more than a millennium.
Information Contacts: Boris Behncke and Mauro Coltelli, Istituto Nazionale di Geofisica e Vulcanologia (INGV) Osservatorio Etneo (Catania), 95125 Catania (URL: http://www.ct.ingv.it/).