Recently Published Bulletin Reports
Erebus (Antarctica) Lava lake remains active; most thermal alerts recorded since 2019
Rincon de la Vieja (Costa Rica) Frequent phreatic explosions during July-December 2023
Bezymianny (Russia) Explosion on 18 October 2023 sends ash plume 8 km high; lava flows and incandescent avalanches
Kilauea (United States) Low-level lava effusions in the lava lake at Halema’uma’u during July-December 2022
Nyamulagira (DR Congo) Lava flows and thermal activity during May-October 2023
Bagana (Papua New Guinea) Explosions, ash plumes, ashfall, and lava flows during April-September 2023
Mayon (Philippines) Lava flows, pyroclastic flows, ash emissions, and seismicity during April-September 2023
Nishinoshima (Japan) Eruption plumes and gas-and-steam plumes during May-August 2023
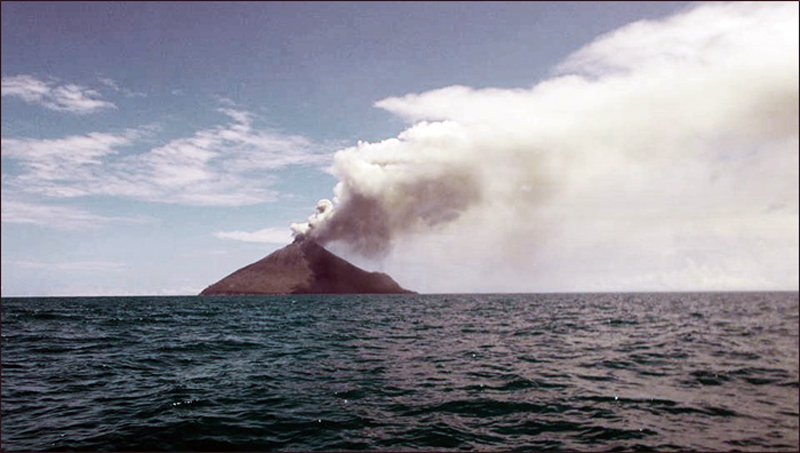
Krakatau (Indonesia) White gas-and-steam plumes and occasional ash plumes during May-August 2023
Villarrica (Chile) Strombolian activity, gas-and-ash emissions, and crater incandescence during April-September 2023
Merapi (Indonesia) Frequent incandescent avalanches during April-September 2023
Ebeko (Russia) Moderate explosive activity with ash plumes continued during June-November 2023
Erebus (Antarctica) — January 2024  Cite this Report
Erebus
Antarctica
77.53°S, 167.17°E; summit elev. 3794 m
All times are local (unless otherwise noted)
Lava lake remains active; most thermal alerts recorded since 2019
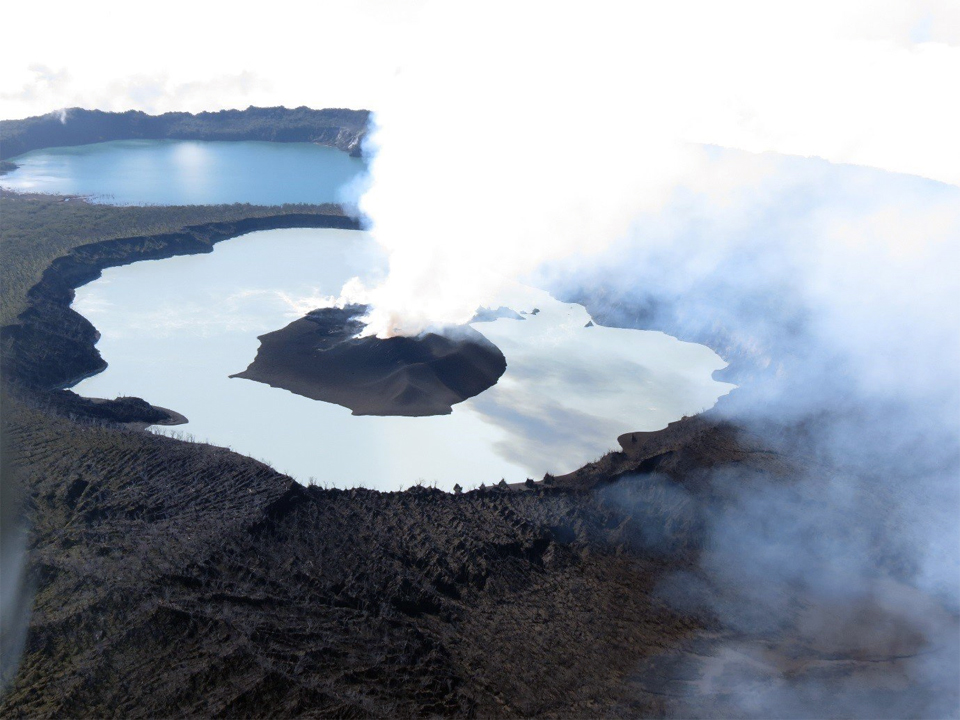
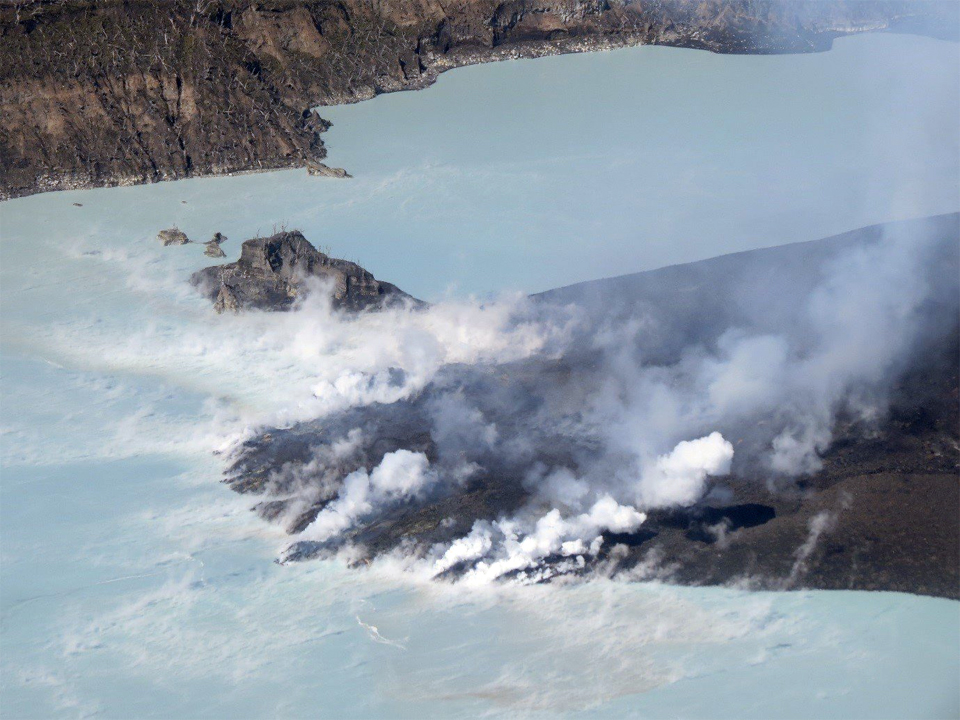
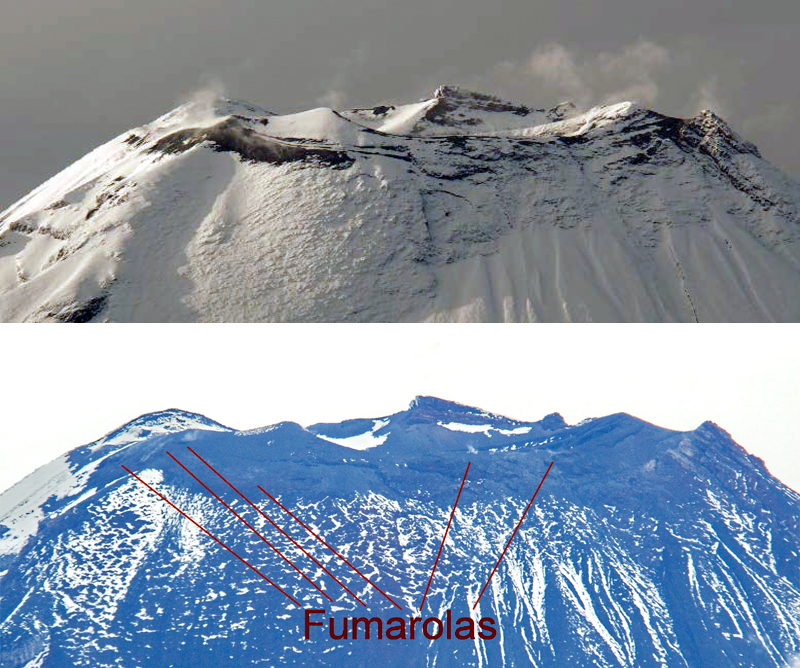
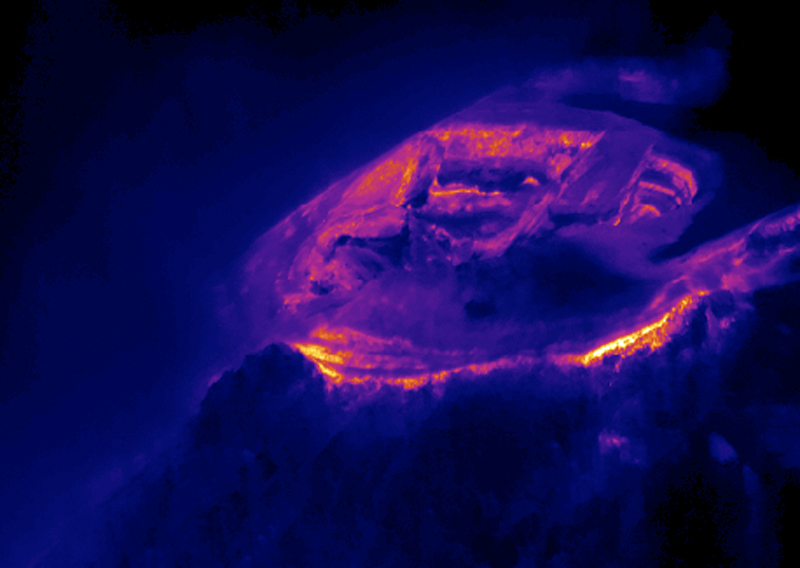
The lava lake in the summit crater of Erebus has been active since at least 1972. Located in Antarctica overlooking the McMurdo Station on Ross Island, it is the southernmost active volcano on the planet. Because of the remote location, activity is primarily monitored by satellites. This report covers activity during 2023.
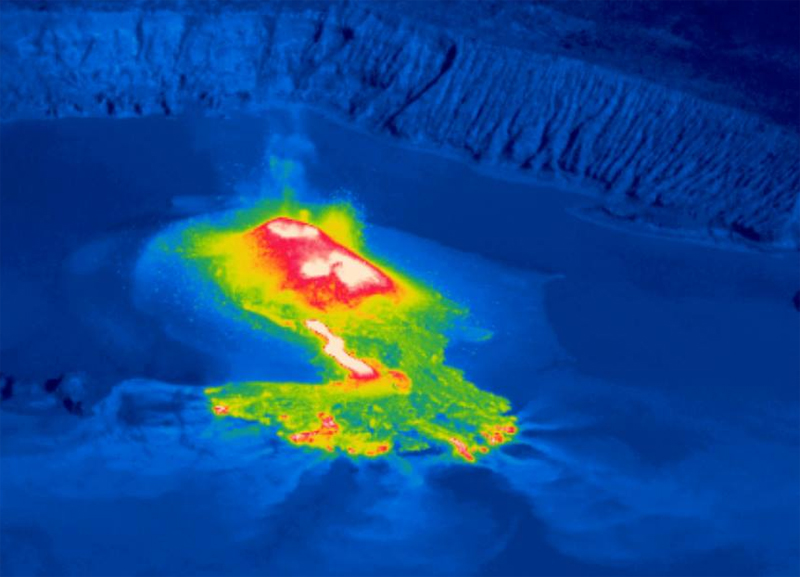
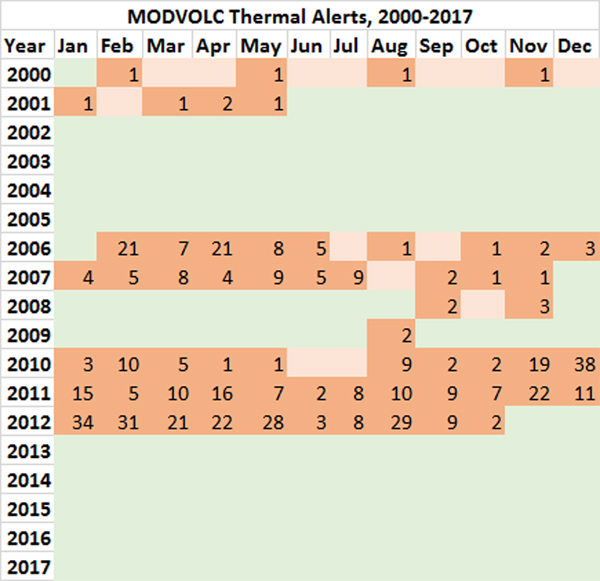
The number of thermal alerts recorded by the Hawai'i Institute of Geophysics and Planetology’s MODVOLC Thermal Alerts System increased considerably in 2023 compared to the years 2020-2022 (table 9). In contrast to previous years, the MODIS instruments aboard the Aqua and Terra satellites captured data from Erebus every month during 2023. Consistent with previous years, the lowest number of anomalous pixels were recorded in January, November, and December.
Table 9. Number of monthly MODIS-MODVOLC thermal alert pixels recorded at Erebus during 2017-2023. See BGVN 42:06 for data from 2000 through 2016. The table was compiled using data provided by the HIGP – MODVOLC Thermal Alerts System.
| Year |
Jan |
Feb |
Mar |
Apr |
May |
Jun |
Jul |
Aug |
Sep |
Oct |
Nov |
Dec |
SUM |
| 2017 |
0 |
21 |
9 |
0 |
0 |
1 |
11 |
61 |
76 |
52 |
0 |
3 |
234 |
| 2018 |
0 |
21 |
58 |
182 |
55 |
17 |
137 |
172 |
103 |
29 |
0 |
0 |
774 |
| 2019 |
2 |
21 |
162 |
151 |
55 |
56 |
75 |
53 |
29 |
19 |
1 |
0 |
624 |
| 2020 |
0 |
2 |
16 |
18 |
4 |
4 |
1 |
3 |
18 |
3 |
1 |
6 |
76 |
| 2021 |
0 |
9 |
1 |
0 |
2 |
56 |
46 |
47 |
35 |
52 |
5 |
3 |
256 |
| 2022 |
1 |
13 |
55 |
22 |
15 |
32 |
39 |
19 |
31 |
11 |
0 |
0 |
238 |
| 2023 |
2 |
33 |
49 |
82 |
41 |
32 |
70 |
64 |
42 |
17 |
5 |
11 |
448 |
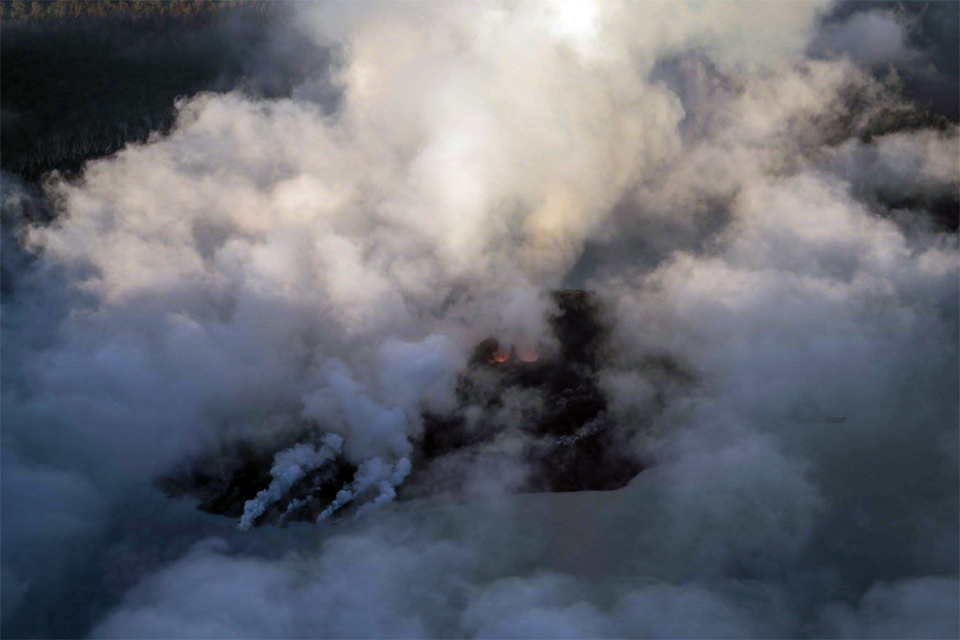
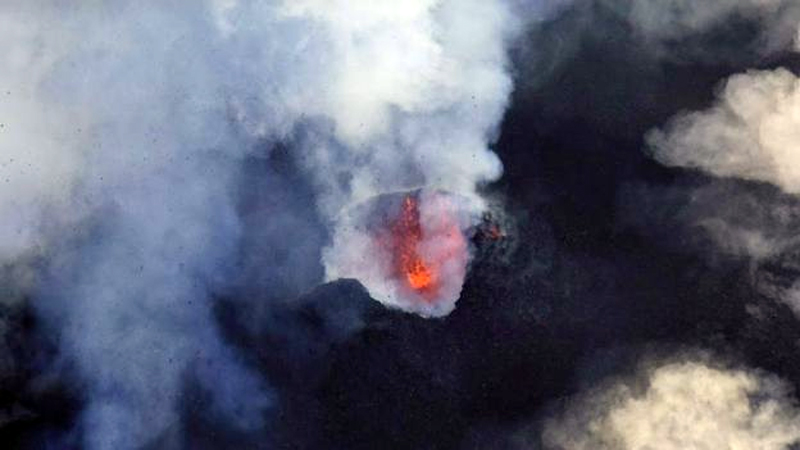
Sentinel-2 infrared images showed one or two prominent heat sources within the summit crater, accompanied by adjacent smaller sources, similar to recent years (see BGVN 46:01, 47:02, and 48:01). A unique image was obtained on 25 November 2023 by the OLI-2 (Operational Land Imager-2) on Landsat 9, showing the upper part of the volcano surrounded by clouds (figure 32).
Geologic Background. Mount Erebus, the world's southernmost historically active volcano, overlooks the McMurdo research station on Ross Island. It is the largest of three major volcanoes forming the crudely triangular Ross Island. The summit of the dominantly phonolitic volcano has been modified by one or two generations of caldera formation. A summit plateau at about 3,200 m elevation marks the rim of the youngest caldera, which formed during the late-Pleistocene and within which the modern cone was constructed. An elliptical 500 x 600 m wide, 110-m-deep crater truncates the summit and contains an active lava lake within a 250-m-wide, 100-m-deep inner crater; other lava lakes are sometimes present. The glacier-covered volcano was erupting when first sighted by Captain James Ross in 1841. Continuous lava-lake activity with minor explosions, punctuated by occasional larger Strombolian explosions that eject bombs onto the crater rim, has been documented since 1972, but has probably been occurring for much of the volcano's recent history.
Information Contacts: Hawai'i Institute of Geophysics and Planetology (HIGP) - MODVOLC Thermal Alerts System, School of Ocean and Earth Science and Technology (SOEST), Univ. of Hawai'i, 2525 Correa Road, Honolulu, HI 96822, USA (URL: http://modis.higp.hawaii.edu/); Copernicus Browser, Copernicus Data Space Ecosystem, European Space Agency (URL: https://dataspace.copernicus.eu/browser/); NASA Earth Observatory, EOS Project Science Office, NASA Goddard Space Flight Center, Goddard, Maryland, USA (URL: https://earthobservatory.nasa.gov/images/152134/erebus-breaks-through).
Rincon de la Vieja (Costa Rica) — January 2024 Cite this Report
Rincon de la Vieja
Costa Rica
10.83°N, 85.324°W; summit elev. 1916 m
All times are local (unless otherwise noted)
Frequent phreatic explosions during July-December 2023
Rincón de la Vieja is a volcanic complex in Costa Rica with a hot convecting acid lake that exhibits frequent weak phreatic explosions, gas-and-steam emissions, and occasional elevated sulfur dioxide levels (BGVN 45:10, 46:03, 46:11). The current eruption period began June 2021. This report covers activity during July-December 2023 and is based on weekly bulletins and occasional daily reports from the Observatorio Vulcanologico Sismologica de Costa Rica-Universidad Nacional (OVSICORI-UNA).
Numerous weak phreatic explosions continued during July-December 2023, along with gas-and-steam emissions and plumes that rose as high as 3 km above the crater rim. Many weekly OVSICORI-UNA bulletins included the previous week's number of explosions and emissions (table 9). For many explosions, the time of explosion was given (table 10). Frequent seismic activity (long-period earthquakes, volcano-tectonic earthquakes, and tremor) accompanied the phreatic activity.
Table 9. Number of reported weekly phreatic explosions and gas-and-steam emissions at Rincón de la Vieja, July-December 2023. Counts are reported for the week before the Weekly Bulletin date; not all reports included these data. Courtesy of OVSICORI-UNA.
| OVSICORI Weekly Bulletin |
Number of explosions |
Number of emissions |
| 28 Jul 2023 |
6 |
14 |
| 4 Aug 2023 |
10 |
12 |
| 1 Sep 2023 |
13 |
11 |
| 22 Sep 2023 |
12 |
13 |
| 29 Sep 2023 |
6 |
11 |
| 6 Oct 2023 |
12 |
5 |
| 13 Oct 2023 |
7 |
9 |
| 20 Oct 2023 |
1 |
15 |
| 27 Oct 2023 |
3 |
23 |
| 3 Nov 2023 |
3 |
10 |
| 17 Nov 2023 |
0 |
Some |
| 24 Nov 2023 |
0 |
14 |
| 8 Dec 2023 |
4 |
16 |
| 22 Dec 2023 |
8 |
18 |
Table 10. Summary of activity at Rincón de la Vieja during July-December 2023. Weak phreatic explosions and gas emissions are noted where the time of explosion was indicated in the weekly or daily bulletins. Height of plumes or emissions are distance above the crater rim. Courtesy of OVSICORI-UNA.
| Date |
Time |
Description of Activity |
| 1 Jul 2023 |
0156 |
Explosion. |
| 2 Jul 2023 |
0305 |
Explosion. |
| 4 Jul 2023 |
0229, 0635 |
Event at 0635 produced a gas-and-steam plume that rose 700 m and drifted W; seen by residents in Liberia (21 km SW). |
| 9 Jul 2023 |
1843 |
Explosion. |
| 21 Jul 2023 |
0705 |
Explosion. |
| 26 Jul 2023 |
1807 |
Explosion. |
| 28 Jul 2023 |
0802 |
Explosion generated a gas-and-steam plume that rose 500 m. |
| 30 Jul 2023 |
1250 |
Explosion. |
| 31 Jul 2023 |
2136 |
Explosion. |
| 11 Aug 2023 |
0828 |
Explosion. |
| 18 Aug 2023 |
1304 |
Explosion. |
| 21 Aug 2023 |
1224 |
Explosion generated gas-and-steam plumes rose 500-600 m. |
| 22 Aug 2023 |
0749 |
Explosion generated gas-and-steam plumes rose 500-600 m. |
| 24 Aug 2023 |
1900 |
Explosion. |
| 25 Aug 2023 |
0828 |
Event produced a steam-and-gas plume that rose 3 km and drifted NW. |
| 27-28 Aug 2023 |
0813 |
Four small events; the event at 0813 on 28 August lasted two minutes and generated a steam-and-gas plume that rose 2.5 km. |
| 1 Sep 2023 |
1526 |
Explosion generated plume that rose 2 km and ejected material onto the flanks. |
| 2-3 Sep 2023 |
- |
Small explosions detected in infrasound data. |
| 4 Sep 2023 |
1251 |
Gas-and-steam plume rose 1 km and drifted W. |
| 7 Nov 2023 |
1113 |
Explosion. |
| 8 Nov 2023 |
0722 |
Explosion. |
| 12 Nov 2023 |
0136 |
Small gas emissions. |
| 14 Nov 2023 |
0415 |
Small gas emissions. |
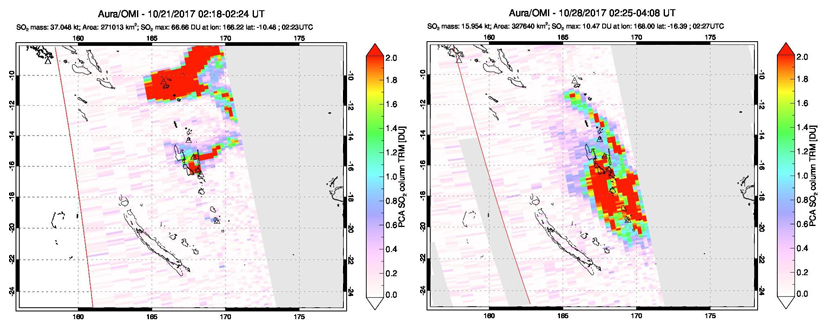
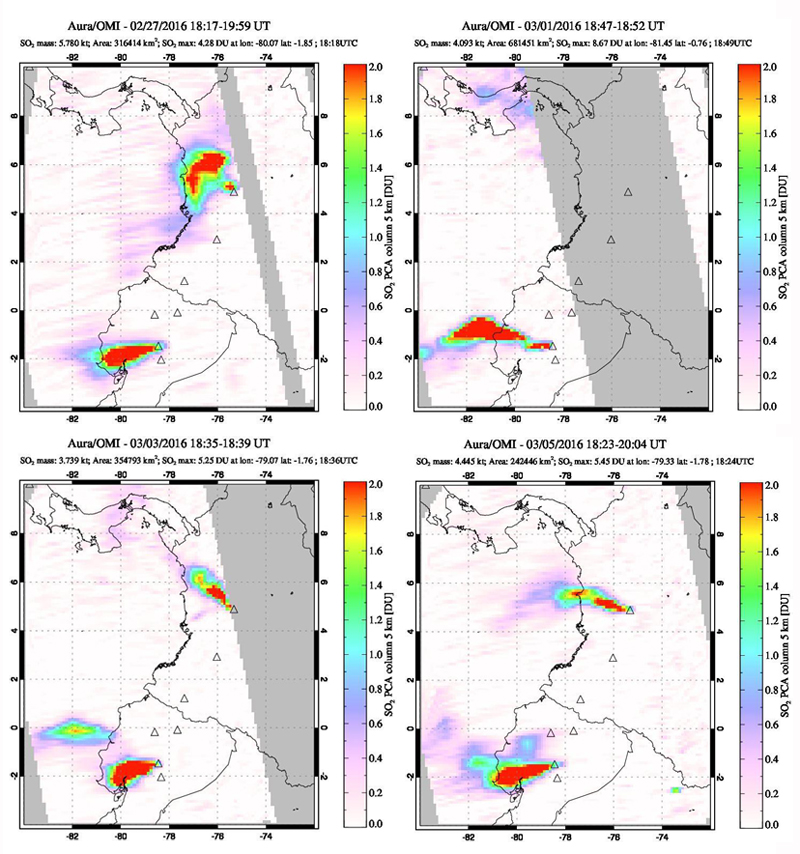
According to OVSICORI-UNA, during July-October the average weekly sulfur dioxide (SO2) flux ranged from 68 to 240 tonnes/day. However, in mid-November the flux increased to as high as 334 tonnes/day, the highest value measured in recent years. The high SO2 flux in mid-November was also detected by the TROPOMI instrument on the Sentinel-5P satellite (figure 43).
Geologic Background. Rincón de la Vieja, the largest volcano in NW Costa Rica, is a remote volcanic complex in the Guanacaste Range. The volcano consists of an elongated, arcuate NW-SE-trending ridge constructed within the 15-km-wide early Pleistocene Guachipelín caldera, whose rim is exposed on the south side. Sometimes known as the "Colossus of Guanacaste," it has an estimated volume of 130 km3 and contains at least nine major eruptive centers. Activity has migrated to the SE, where the youngest-looking craters are located. The twin cone of Santa María volcano, the highest peak of the complex, is located at the eastern end of a smaller, 5-km-wide caldera and has a 500-m-wide crater. A Plinian eruption producing the 0.25 km3 Río Blanca tephra about 3,500 years ago was the last major magmatic eruption. All subsequent eruptions, including numerous historical eruptions possibly dating back to the 16th century, have been from the prominent active crater containing a 500-m-wide acid lake located ENE of Von Seebach crater.
Information Contacts: Observatorio Vulcanológico Sismológica de Costa Rica-Universidad Nacional (OVSICORI-UNA), Apartado 86-3000, Heredia, Costa Rica (URL: http://www.ovsicori.una.ac.cr/); NASA Global Sulfur Dioxide Monitoring Page, Atmospheric Chemistry and Dynamics Laboratory, NASA Goddard Space Flight Center (NASA/GSFC), 8800 Greenbelt Road, Goddard MD 20771, USA (URL: https://so2.gsfc.nasa.gov/).
Bezymianny (Russia) — November 2023 Cite this Report
Bezymianny
Russia
55.972°N, 160.595°E; summit elev. 2882 m
All times are local (unless otherwise noted)
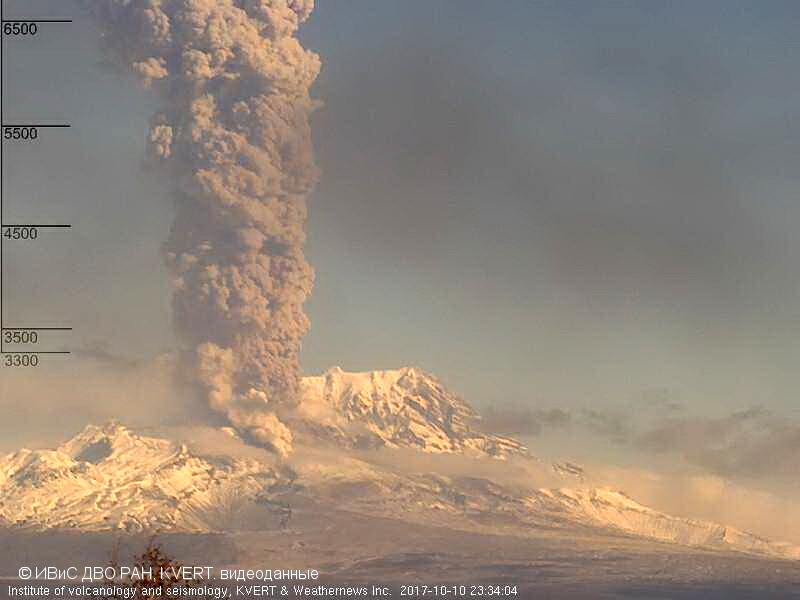
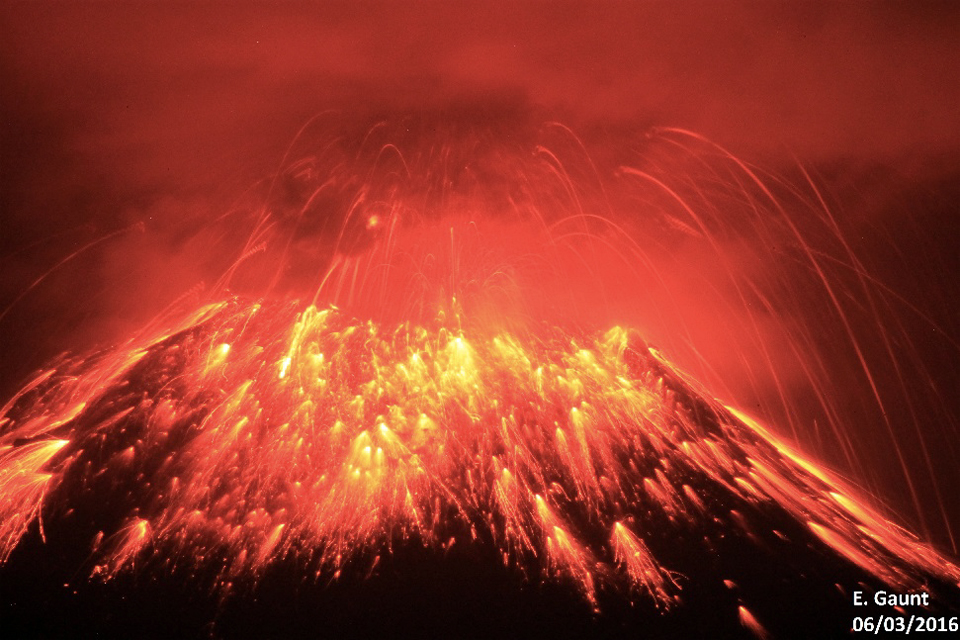
Explosion on 18 October 2023 sends ash plume 8 km high; lava flows and incandescent avalanches
Bezymianny, located on Russia’s Kamchatka Peninsula, has had eruptions since 1955 characterized by dome growth, explosions, pyroclastic flows, ash plumes, and ashfall. Activity during November 2022-April 2023 included gas-and-steam emissions, lava dome collapses generating avalanches, and persistent thermal activity. Similar eruptive activity continued from May through October 2023, described here based on information from weekly and daily reports of the Kamchatka Volcano Eruptions Response Team (KVERT), notices from Tokyo VAAC (Volcanic Ash Advisory Center), and from satellite data.
Overall activity decreased after the strong period of activity in late March through April 2023, which included ash explosions during 29 March and 7-8 April 2023 that sent plumes as high as 10-12 km altitude, along with dome growth and lava flows (BGVN 48:05). This reduced activity can be seen in the MIROVA thermal detection system graph (figure 56), which was consistent with data from the MODVOLC thermal detection system and with Sentinel-2 satellite images that showed persistent hotspots in the summit crater when conditions allowed observations. A renewed period of strong activity began in mid-October 2023.
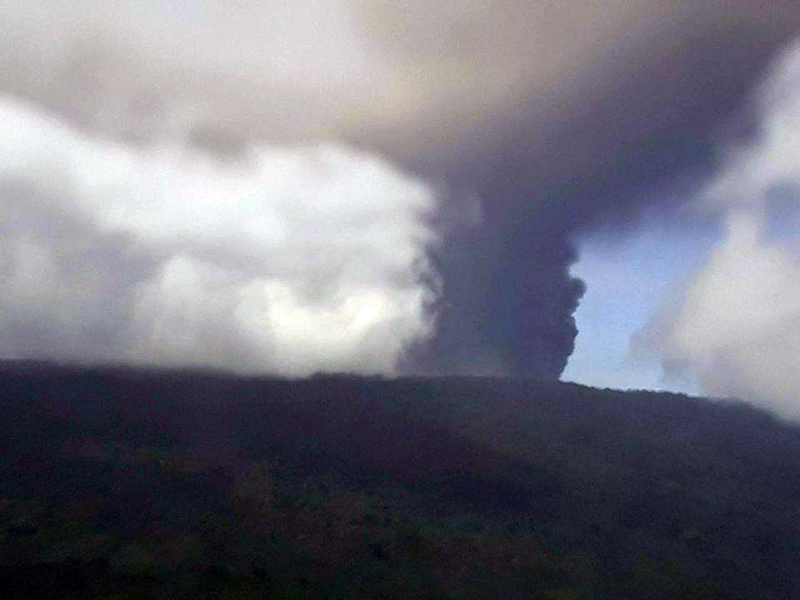
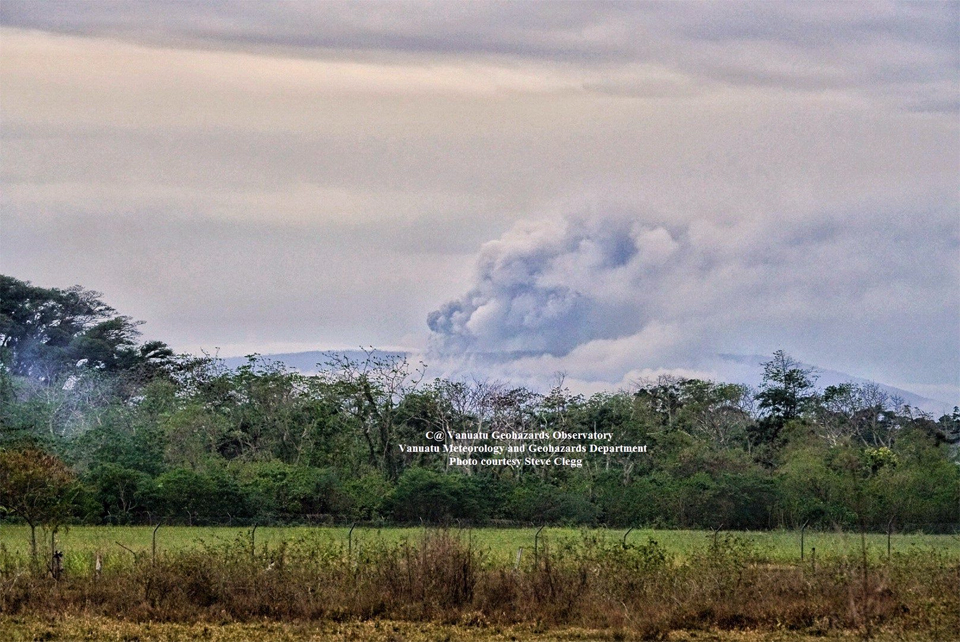
Activity increased significantly on 17 October 2023 when large collapses began during 0700-0830 on the E flanks of the lava dome and continued to after 0930 the next day (figure 57). Ash plumes rose to an altitude of 4.5-5 km, extending 220 km NNE by 18 October. A large explosion at 1630 on 18 October produced an ash plume that rose to an altitude of 11 km (8 km above the summit) and drifted NNE and then NW, extending 900 km NW within two days at an altitude of 8 km. Minor ashfall was noted in Kozyrevsk (45 km WNW). At 0820 on 20 October an ash plume was identified in satellite images drifting 100 km ENE at altitudes of 4-4.5 km.
Lava flows and hot avalanches from the dome down the SE flank continued over the next few days, including 23 October when clear conditions allowed good observations (figures 58 and 59). A large thermal anomaly was observed over the volcano through 24 October, and in the summit crater on 30 October (figure 60). Strong fumarolic activity continued, with numerous avalanches and occasional incandescence. By the last week of October, volcanic activity had decreased to a level consistent with that earlier in the reporting period.
Aviation warnings were frequently updated during 17-20 October. KVERT issued a Volcano Observatory Notice for Aviation (VONA) on 17 October at 1419 and 1727 (0219 and 0527 UTC) raising the Aviation Color Code (ACC) from Yellow to Orange (second highest level). The next day, KVERT issued a VONA at 1705 (0505 UTC) raising the ACC to Red (highest level) but lowered it back to Orange at 2117 (0917 UTC). After another decrease to Yellow and back to Orange, the ACC was reduced to Yellow on 20 October at 1204 (0004 UTC). In addition, the Tokyo VAAC issued a series of Volcanic Ash Advisories beginning on 16 October and continuing through 30 October.
Geologic Background. The modern Bezymianny, much smaller than its massive neighbors Kamen and Kliuchevskoi on the Kamchatka Peninsula, was formed about 4,700 years ago over a late-Pleistocene lava-dome complex and an edifice built about 11,000-7,000 years ago. Three periods of intensified activity have occurred during the past 3,000 years. The latest period, which was preceded by a 1,000-year quiescence, began with the dramatic 1955-56 eruption. This eruption, similar to that of St. Helens in 1980, produced a large open crater that was formed by collapse of the summit and an associated lateral blast. Subsequent episodic but ongoing lava-dome growth, accompanied by intermittent explosive activity and pyroclastic flows, has largely filled the 1956 crater.
Information Contacts: Kamchatka Volcanic Eruptions Response Team (KVERT), Far Eastern Branch, Russian Academy of Sciences, 9 Piip Blvd., Petropavlovsk-Kamchatsky, 683006, Russia (URL: http://www.kscnet.ru/ivs/kvert/); Kamchatka Volcanological Station, Kamchatka Branch of Geophysical Survey, (KB GS RAS), Klyuchi, Kamchatka Krai, Russia (URL: http://volkstat.ru/); Tokyo Volcanic Ash Advisory Center (VAAC), 1-3-4 Otemachi, Chiyoda-ku, Tokyo 100-8122, Japan (URL: http://ds.data.jma.go.jp/svd/vaac/data/); Hawai'i Institute of Geophysics and Planetology (HIGP) - MODVOLC Thermal Alerts System, School of Ocean and Earth Science and Technology (SOEST), Univ. of Hawai'i, 2525 Correa Road, Honolulu, HI 96822, USA (URL: http://modis.higp.hawaii.edu/); MIROVA (Middle InfraRed Observation of Volcanic Activity), a collaborative project between the Universities of Turin and Florence (Italy) supported by the Centre for Volcanic Risk of the Italian Civil Protection Department (URL: http://www.mirovaweb.it/); Copernicus Browser, Copernicus Data Space Ecosystem, European Space Agency (URL: https://dataspace.copernicus.eu/browser/).chr
Kilauea (United States) — January 2023 Cite this Report
Kilauea
United States
19.421°N, 155.287°W; summit elev. 1222 m
All times are local (unless otherwise noted)
Low-level lava effusions in the lava lake at Halema’uma’u during July-December 2022
Kīlauea is the southeastern-most volcano in Hawaii and overlaps the E flank of the Mauna Loa volcano. Its East Rift Zone (ERZ) has been intermittently active for at least 2,000 years. An extended eruption period began in January 1983 and was characterized by open lava lakes and lava flows from the summit caldera and the East Rift Zone. During May 2018 magma migrated into the Lower East Rift Zone (LERZ) and opened 24 fissures along a 6-km-long NE-trending fracture zone that produced lava flows traveling in multiple directions. As lava emerged from the fissures, the lava lake at Halema'uma'u drained and explosions sent ash plumes to several kilometers altitude (BGVN 43:10).
The current eruption period started during September 2021 and has recently been characterized by lava effusions, spatter, and sulfur dioxide emissions in the active Halema’uma’u lava lake (BGVN 47:08). Lava effusions, some spatter, and sulfur dioxide emissions have continued during this reporting period of July through December 2022 using daily reports, volcanic activity notices, and abundant photo, map, and video data from the US Geological Survey's (USGS) Hawaiian Volcano Observatory (HVO).
Summary of activity during July-December 2022. Low-level effusions have continued at the western vent of the Halema’uma’u crater during July through early December 2022. Occasional weak ooze-outs (also called lava break outs) would occur along the margins of the crater floor. The overall level of the active lava lake throughout the reporting period gradually increased due to infilling, however it stagnated in mid-September (table 13). During September through November, activity began to decline, though lava effusions persisted at the western vent. By 9 December, the active part of the lava lake had completely crusted over, and incandescence was no longer visible.
Table 13. Summary of measurements taken during overflights at Kīlauea that show a gradual increase in the active lava lake level and the volume of lava effused since 29 September 2021. Lower activity was reported during September-October. Data collected during July-December 2022. Courtesy of HVO.
| Date: |
Level of the active lava lake (m): |
Cumulative volume of lava effused (million cubic meters): |
| 7 Jul 2022 |
130 |
95 |
| 19 Jul 2022 |
133 |
98 |
| 4 Aug 2022 |
136 |
102 |
| 16 Aug 2022 |
137 |
104 |
| 12 Sep 2022 |
143 |
111 |
| 5 Oct 2022 |
143 |
111 |
| 28 Oct 2022 |
143 |
111 |
Activity during July 2022. Lava effusions were reported from the western vent in the Halema’uma’u crater, along with occasional weak ooze-outs along the margins of the crater floor. The height of the lava lake was variable due to deflation-inflation tilt events; for example, the lake level dropped approximately 3-4 m during a summit deflation-inflation event reported on 1 July. Webcam images taken during the night of 6-12 July showed intermittent low-level spattering at the western vent that rose less than 10 m above the vent (figure 519). Measurements made during an overflight on 7 July indicated that the crater floor was infilled about 130 m and that 95 million cubic meters of lava had been effused since 29 September 2021. A single, relatively small lava ooze-out was active to the S of the lava lake. Around midnight on 8 July there were two brief periods of lava overflow onto the lake margins. On 9 July lava ooze-outs were reported near the SE and NE edges of the crater floor and during 10-11 July they occurred near the E, NE, and NW edges. On 16 July crater incandescence was reported, though the ooze-outs and spattering were not visible. On 18 July overnight webcam images showed incandescence in the western vent complex and two ooze-outs were reported around 0000 and 0200 on 19 July. By 0900 there were active ooze-outs along the SW edge of the crater floor. Measurements made from an overflight on 19 July indicated that the crater floor was infilled about 133 m and 98 million cubic meters of lava had erupted since 29 September 2021 (figure 520). On 20 July around 1600 active ooze-outs were visible along the N edge of the crater, which continued through the next day. Extensive ooze-outs occurred along the W margin during 24 July until 1900; on 26 July minor ooze-outs were noted along the N margin. Minor spattering was visible on 29 July along the E margin of the lake. The sulfur dioxide emission rates ranged 650-2,800 tons per day (t/d), the higher of which was measured on 8 July (figure 519).
Activity during August 2022. The eruption continued in the Halema’uma’u crater at the western vent. According to HVO the lava in the active lake remained at the level of the bounding levees. Occasional minor ooze-outs were observed along the margins of the crater floor. Strong nighttime crater incandescence was visible after midnight on 6 August over the western vent cone. During 6-7 August scattered small lava lobes were active along the crater floor and incandescence persisted above the western vent through 9 August. During 7-9 August HVO reported a single lava effusion source was active along the NW margin of the crater floor. Measurements from an overflight on 4 August indicated that the crater floor was infilled about 136 m total and that 102 million cubic meters of lava had been erupted since the start of the eruption. Lava breakouts were reported along the N, NE, E, S, and W margins of the crater during 10-16 August. Another overflight survey conducted on 16 August indicated that the crater floor infilled about 137 m and 104 million cubic meters of lava had been erupted since September 2021. Measured sulfur dioxide emissions rates ranged 1,150-2,450 t/d, the higher of which occurred on 8 August.
Activity during September 2022. During September, lava effusion continued from the western vent into the active lava lake and onto the crater floor. Intermittent minor ooze-outs were reported through the month. A small ooze-out was visible on the W crater floor margin at 0220 on 2 September, which showed decreasing surface activity throughout the day, but remained active through 3 September. On 3 September around 1900 a lava outbreak occurred along the NW margin of the crater floor but had stopped by the evening of 4 September. Field crews monitoring the summit lava lake on 9 September observed spattering on the NE margin of the lake that rose no higher than 10 m, before falling back onto the lava lake crust (figure 521). Overflight measurements on 12 September indicated that the crater floor was infilled a total of 143 m and 111 million cubic meters of lava had been erupted since September 2021. Extensive breakouts in the W and N part of the crater floor were reported at 1600 on 20 September and continued into 26 September. The active part of the lava lake dropped by 10 m while other parts of the crater floor dropped by several meters. Summit tiltmeters recorded a summit seismic swarm of more than 80 earthquakes during 1500-1800 on 21 September, which occurred about 1.5 km below Halema’uma’u; a majority of these were less than Mw 2. By 22 September the active part of the lava lake was infilled about 2 m. On 23 September the western vent areas exhibited several small spatter cones with incandescent openings, along with weak, sporadic spattering (figure 522). The sulfur dioxide emission rate ranged from 930 t/d to 2,000 t/d, the higher of which was measured on 6 September.
Activity during October 2022. Activity during October declined slightly compared to previous months, though lava effusions persisted from the western vent into the active lava lake and onto the crater floor during October (figure 523). Slight variations in the lava lake were noted throughout the month. HVO reported that around 0600 on 3 October the level of the lava lake has lowered slightly. Overflight measurements taken on 5 October indicated that the crater floor was infilled a total of about 143 m and that 111 million cubic meters of lava had been effused since September 2021. During 6-7 October the lake gradually rose 0.5 m. Sulfur dioxide measurements made on 22 October had an emission rate of 700 t/d. Another overflight taken on 28 October showed that there was little to no change in the elevation of the crater floor: the crater floor was infilled a total of 143 m and 111 million cubic meters of lava had erupted since the start of the eruption.
Activity during November 2022. Activity remained low during November, though HVO reported that lava from the western vent continued to effuse into the active lava lake and onto the crater floor throughout the month. The rate of sulfur dioxide emissions during November ranged from 300-600 t/d, the higher amount of which occurred on 9 November.
Activity during December 2022. Similar low activity was reported during December, with lava effusing from the western vent into the active lava lake and onto the crater floor. During 4-5 December the active part of the lava lake was slightly variable in elevation and fluctuated within 1 m. On 9 December HVO reported that lava was no longer erupting from the western vent in the Halema’uma’u crater and that sulfur dioxide emissions had returned to near pre-eruption background levels; during 10-11 December, the lava lake had completely crusted over, and no incandescence was visible (figure 524). Time lapse camera images covering the 4-10 December showed that the crater floor showed weak deflation and no inflation. Some passive events of crustal overturning were reported during 14-15 December, which brought fresh incandescent lava to the lake surface. The sulfur dioxide emission rate was approximately 200 t/d on 14 December. A smaller overturn event on 17 December and another that occurred around 0000 and into the morning of 20 December were also detected. A small seismic swarm was later detected on 30 December.
Geologic Background. Kilauea overlaps the E flank of the massive Mauna Loa shield volcano in the island of Hawaii. Eruptions are prominent in Polynesian legends; written documentation since 1820 records frequent summit and flank lava flow eruptions interspersed with periods of long-term lava lake activity at Halemaumau crater in the summit caldera until 1924. The 3 x 5 km caldera was formed in several stages about 1,500 years ago and during the 18th century; eruptions have also originated from the lengthy East and Southwest rift zones, which extend to the ocean in both directions. About 90% of the surface of the basaltic shield volcano is formed of lava flows less than about 1,100 years old; 70% of the surface is younger than 600 years. The long-term eruption from the East rift zone between 1983 and 2018 produced lava flows covering more than 100 km2, destroyed hundreds of houses, and added new coastline.
Information Contacts: Hawaiian Volcano Observatory (HVO), U.S. Geological Survey, PO Box 51, Hawai'i National Park, HI 96718, USA (URL: http://hvo.wr.usgs.gov/).
Nyamulagira (DR Congo) — November 2023 Cite this Report
Nyamulagira
DR Congo
1.408°S, 29.2°E; summit elev. 3058 m
All times are local (unless otherwise noted)
Lava flows and thermal activity during May-October 2023
Nyamulagira (also known as Nyamuragira) is a shield volcano in the Democratic Republic of Congo with the summit truncated by a small 2 x 2.3 km caldera with walls up to about 100 m high. Documented eruptions have occurred within the summit caldera, as well as from numerous flank fissures and cinder cones. The current eruption period began in April 2018 and has more recently been characterized by summit crater lava flows and thermal activity (BGVN 48:05). This report describes lava flows and variable thermal activity during May through October 2023, based on information from the Observatoire Volcanologique de Goma (OVG) and various satellite data.
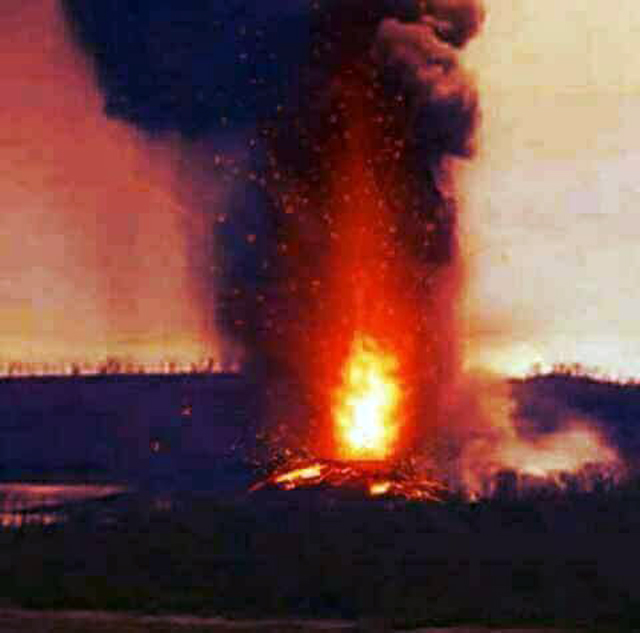
Lava lake activity continued during May. The MIROVA (Middle InfraRed Observation of Volcanic Activity) system recorded moderate-to-strong thermal activity throughout the reporting period; activity was more intense during May and October and relatively weaker from June through September (figure 95). The MODVOLC thermal algorithm, detected a total of 209 thermal alerts. There were 143 hotspots detected during May, eight during June, nine during September, and 49 during October. This activity was also reflected in infrared satellite images, where a lava flow was visible in the NW part of the crater on 7 May and strong activity was seen in the center of the crater on 4 October (figure 96). Another infrared satellite image taken on 12 May showed still active lava flows along the NW margin of the crater. According to OVG lava effusions were active during 7-29 May and moved to the N and NW parts of the crater beginning on 9 May. Strong summit crater incandescence was visible from Goma (27 km S) during the nights of 17, 19, and 20 May (figure 97). On 17 May there was an increase in eruptive activity, which peaked at 0100 on 20 May. Notable sulfur dioxide plumes drifted NW and W during 19-20 May (figure 98). Drone footage acquired in partnership with the USGS (United States Geological Survey) on 20 May captured images of narrow lava flows that traveled about 100 m down the W flank (figure 99). Data from the Rumangabo seismic station indicated a decreasing trend in activity during 17-21 May. Although weather clouds prevented clear views of the summit, a strong thermal signature on the NW flank was visible in an infrared satellite image on 22 May, based on an infrared satellite image. On 28 May the lava flows on the upper W flank began to cool and solidify. By 29 May seismicity returned to levels similar to those recorded before the 17 May increase. Lava effusion continued but was confined to the summit crater; periodic crater incandescence was observed.
Low-level activity was noted during June through October. On 1 June OVG reported that seismicity remained at lower levels and that crater incandescence had been absent for three days, though infrared satellite imagery showed continued lava effusion in the summit crater. The lava flows on the flanks covered an estimated 0.6 km2. Satellite imagery continued to show thermal activity confined to the lava lake through October (figure 96), although no lava flows or significant sulfur dioxide emissions were reported.
Geologic Background. Africa's most active volcano, Nyamulagira (also known as Nyamuragira), is a massive high-potassium basaltic shield about 25 km N of Lake Kivu and 13 km NNW of the steep-sided Nyiragongo volcano. The summit is truncated by a small 2 x 2.3 km caldera that has walls up to about 100 m high. Documented eruptions have occurred within the summit caldera, as well as from the numerous flank fissures and cinder cones. A lava lake in the summit crater, active since at least 1921, drained in 1938, at the time of a major flank eruption. Recent lava flows extend down the flanks more than 30 km from the summit as far as Lake Kivu; extensive lava flows from this volcano have covered 1,500 km2 of the western branch of the East African Rift.
Information Contacts: Observatoire Volcanologique de Goma (OVG), Departement de Geophysique, Centre de Recherche en Sciences Naturelles, Lwiro, D.S. Bukavu, DR Congo; Hawai'i Institute of Geophysics and Planetology (HIGP) - MODVOLC Thermal Alerts System, School of Ocean and Earth Science and Technology (SOEST), Univ. of Hawai'i, 2525 Correa Road, Honolulu, HI 96822, USA (URL: http://modis.higp.hawaii.edu/); MIROVA (Middle InfraRed Observation of Volcanic Activity), a collaborative project between the Universities of Turin and Florence (Italy) supported by the Centre for Volcanic Risk of the Italian Civil Protection Department (URL: http://www.mirovaweb.it/); NASA Global Sulfur Dioxide Monitoring Page, Atmospheric Chemistry and Dynamics Laboratory, NASA Goddard Space Flight Center (NASA/GSFC), 8800 Greenbelt Road, Goddard, Maryland, USA (URL: https://so2.gsfc.nasa.gov/); Copernicus Browser, Copernicus Data Space Ecosystem, European Space Agency (URL: https://dataspace.copernicus.eu/browser/); Charles Balagizi, Goma Volcano Observatory, Departement de Geophysique, Centre de Recherche en Sciences Naturelles, Lwiro, D.S. Bukavu, DR Congo.
Bagana (Papua New Guinea) — October 2023 Cite this Report
Bagana
Papua New Guinea
6.137°S, 155.196°E; summit elev. 1855 m
All times are local (unless otherwise noted)
Explosions, ash plumes, ashfall, and lava flows during April-September 2023
The remote volcano of Bagana is located in central Bougainville Island, Papua New Guinea. Recorded eruptions date back to 1842 and activity has consisted of effusive activity that has built a small lava dome in the summit crater and occasional explosions that produced pyroclastic flows. The most recent eruption has been ongoing since February 2000 and has produced occasional explosions, ash plumes, and lava flows. More recently, activity has been characterized by ongoing effusive activity and ash emissions (BGVN 48:04). This report updates activity from April through September 2023 that has consisted of explosions, ash plumes, ashfall, and lava flows, using information from the Darwin Volcanic Ash Advisory Center (VAAC) and satellite data.
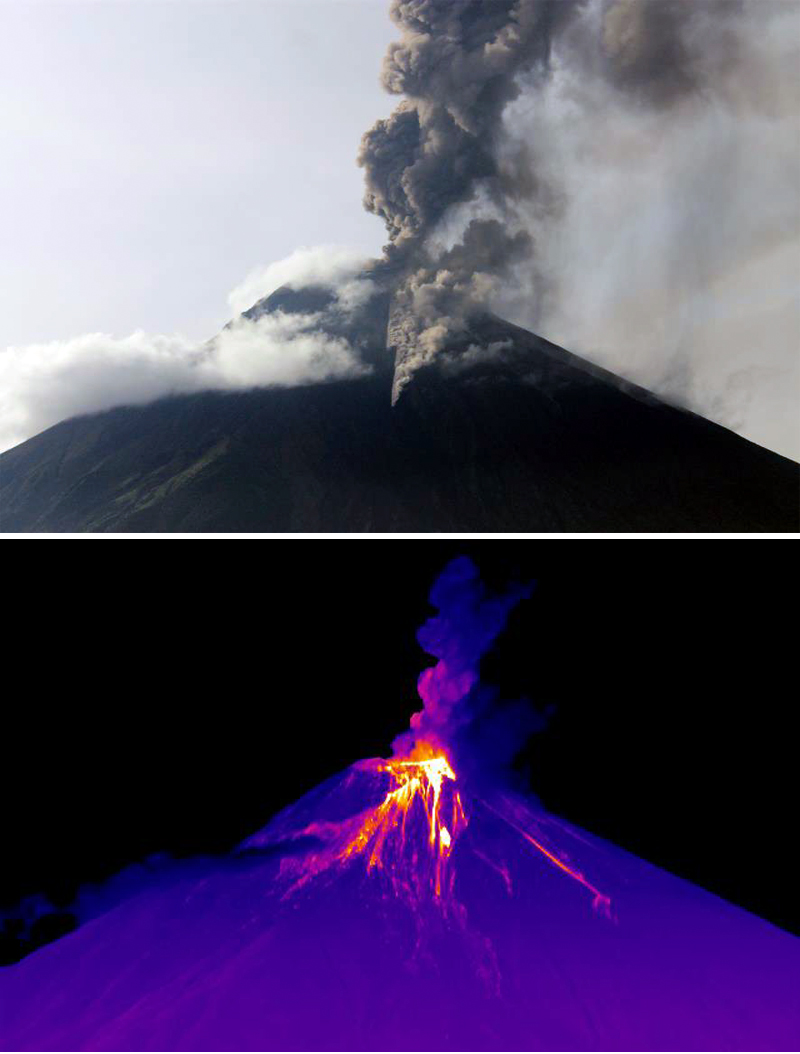
An explosive eruption was reported on 7 July that generated a large gas-and-ash plume to high altitudes and caused significant ashfall in local communities; the eruption plume had reached upper tropospheric (16-18 km altitude) altitudes by 2200, according to satellite images. Sulfur dioxide plumes were detected in satellite images on 8 July and indicated that the plume was likely a mixture of gas, ice, and ash. A report issued by the Autonomous Bougainville Government (ABG) (Torokina District, Education Section) on 10 July noted that significant ash began falling during 2000-2100 on 7 July and covered most areas in the Vuakovi, Gotana (9 km SW), Koromaketo, Laruma (25 km W) and Atsilima (27 km NW) villages. Pyroclastic flows also occurred, according to ground-based reports; small deposits confined to one drainage were inspected by RVO during an overflight on 17 July and were confirmed to be from the 7 July event. Ashfall continued until 10 July and covered vegetation, which destroyed bushes and gardens and contaminated rivers and streams.
RVO reported another eruption on 14 July. The Darwin VAAC stated that an explosive event started around 0830 on 15 July and produced an ash plume that rose to 16.5 km altitude by 1000 and drifted N, according to satellite images. The plume continued to drift N and remained visible through 1900, and by 2150 it had dissipated.
Ashfall likely from both the 7 and 15 July events impacted about 8,111 people in Torokina (20 km SW), including Tsito/Vuakovi, Gotana, Koromaketo, Kenaia, Longkogari, Kenbaki, Piva (13 km SW), and Atsinima, and in the Tsitovi district, according to ABG. Significant ashfall was also reported in Ruruvu (22 km N) in the Wakunai District of Central Bougainville, though the thickness of these deposits could not be confirmed. An evacuation was called for the villages in Wakunai, where heavy ashfall had contaminated water sources; the communities of Ruruvu, Togarau, Kakarapaia, Karauturi, Atao, and Kuritaturi were asked to evacuate to a disaster center at the Wakunai District Station, and communities in Torokina were asked to evacuate to the Piva District station. According to a news article, more than 7,000 people needed temporary accommodations, with about 1,000 people in evacuation shelters. Ashfall had deposited over a broad area, contaminating water supplies, affecting crops, and collapsing some roofs and houses in rural areas. Schools were temporarily shut down. Intermittent ash emissions continued through the end of July and drifted NNW, NW, and SW. Fine ashfall was reported on the coast of Torokina, and ash plumes also drifted toward Laruma and Atsilima.
A small explosive eruption occurred at 2130 on 28 July that ejected material from the crater vents, according to reports from Torokina, in addition to a lava flow that contained two lobes. A second explosion was detected at 2157. Incandescence from the lava flow was visible from Piva as it descended the W flank around 2000 on 29 July (figure 47). The Darwin VAAC reported that a strong thermal anomaly was visible in satellite images during 30-31 July and that ash emissions rose to 2.4 km altitude and drifted WSW on 30 July. A ground report from RVO described localized emissions at 0900 on 31 July.
The Darwin VAAC reported that ash plumes were identified in satellite imagery at 0800 and 1220 on 12 August and rose to 2.1 km and 3 km altitude and drifted NW and W, respectively. A news report stated that aid was sent to more than 6,300 people that were adversely affected by the eruption. Photos taken during 17-19 August showed ash emissions rising no higher than 1 km above the summit and drifting SE. A small explosion generated an ash plume during the morning of 19 August. Deposits from small pyroclastic flows were also captured in the photos. Satellite images captured lava flows and pyroclastic flow deposits. Two temporary seismic stations were installed near Bagana on 17 August at distances of 7 km WSW (Vakovi station) and 11 km SW (Kepox station). The Kepox station immediately started to record continuous, low-frequency background seismicity.
Satellite data. Little to no thermal activity was detected during April through mid-July 2023; only one anomaly was recorded during early April and one during early June, according to MIROVA (Middle InfraRed Observation of Volcanic Activity) data (figure 48). Thermal activity increased in both power and frequency during mid-July through September, although there were still some short gaps in detected activity. MODVOLC also detected increased thermal activity during August; thermal hotspots were detected a total of five times on 19, 20, and 27 August. Weak thermal anomalies were also captured in infrared satellite images on clear weather days throughout the reporting period on 7, 12, and 17 April, 27 May, 1, 6, 16, and 31 July, and 19 September (figure 48); a strong thermal anomaly was visible on 31 July. Distinct sulfur dioxide plumes that drifted generally NW were intermittently captured by the TROPOMI instrument on the Sentinel-5P satellite and sometimes exceeded two Dobson Units (DUs) (figure 49).
Geologic Background. Bagana volcano, in a remote portion of central Bougainville Island, is frequently active. This massive symmetrical cone was largely constructed by an accumulation of viscous andesitic lava flows. The entire edifice could have been constructed in about 300 years at its present rate of lava production. Eruptive activity is characterized by non-explosive effusion of viscous lava that maintains a small lava dome in the summit crater, although occasional explosive activity produces pyroclastic flows. Lava flows with tongue-shaped lobes up to 50 m thick and prominent levees descend the flanks on all sides.
Information Contacts: Rabaul Volcano Observatory (RVO), Geohazards Management Division, Department of Mineral Policy and Geohazards Management (DMPGM), PO Box 3386, Kokopo, East New Britain Province, Papua New Guinea; Darwin Volcanic Ash Advisory Centre (VAAC), Bureau of Meteorology, Northern Territory Regional Office, PO Box 40050, Casuarina, NT 0811, Australia (URL: http://www.bom.gov.au/info/vaac/); MIROVA (Middle InfraRed Observation of Volcanic Activity), a collaborative project between the Universities of Turin and Florence (Italy) supported by the Centre for Volcanic Risk of the Italian Civil Protection Department (URL: http://www.mirovaweb.it/); Hawai'i Institute of Geophysics and Planetology (HIGP) - MODVOLC Thermal Alerts System, School of Ocean and Earth Science and Technology (SOEST), Univ. of Hawai'i, 2525 Correa Road, Honolulu, HI 96822, USA (URL: http://modis.higp.hawaii.edu/); NASA Global Sulfur Dioxide Monitoring Page, Atmospheric Chemistry and Dynamics Laboratory, NASA Goddard Space Flight Center (NASA/GSFC), 8800 Greenbelt Road, Goddard, Maryland, USA (URL: https://so2.gsfc.nasa.gov/); Copernicus Browser, Copernicus Data Space Ecosystem, European Space Agency (URL: https://dataspace.copernicus.eu/browser/); Autonomous Bougainville Government, P.O Box 322, Buka, AROB, PNG (URL: https://abg.gov.pg/); Andrew Tupper (Twitter: @andrewcraigtupp); Simon Carn, Geological and Mining Engineering and Sciences, Michigan Technological University, 1400 Townsend Drive, Houghton, MI 49931, USA (URL: http://www.volcarno.com/, Twitter: @simoncarn); Radio NZ (URL: https://www.rnz.co.nz/news/pacific/494464/more-than-7-000-people-in-bougainville-need-temporary-accommodation-after-eruption); USAID, 1300 Pennsylvania Ave, NW, Washington DC 20004, USA (URL: https://www.usaid.gov/pacific-islands/press-releases/aug-08-2023-united-states-provides-immediate-emergency-assistance-support-communities-affected-mount-bagana-volcanic-eruptions).
Mayon (Philippines) — October 2023 Cite this Report
Mayon
Philippines
13.257°N, 123.685°E; summit elev. 2462 m
All times are local (unless otherwise noted)
Lava flows, pyroclastic flows, ash emissions, and seismicity during April-September 2023
Mayon is located in the Philippines and has steep upper slopes capped by a small summit crater. Historical eruptions date back to 1616 CE that have been characterized by Strombolian eruptions, lava flows, pyroclastic flows, and mudflows. Eruptions mostly originated from a central conduit. Pyroclastic flows and mudflows have commonly descended many of the approximately 40 drainages that surround the volcano. The most recent eruption occurred during June through October 2022 and consisted of lava dome growth and gas-and-steam emissions (BGVN 47:12). A new eruption was reported during late April 2023 and has included lava flows, pyroclastic density currents, ash emissions, and seismicity. This report covers activity during April through September 2023 based on daily bulletins from the Philippine Institute of Volcanology and Seismology (PHIVOLCS).
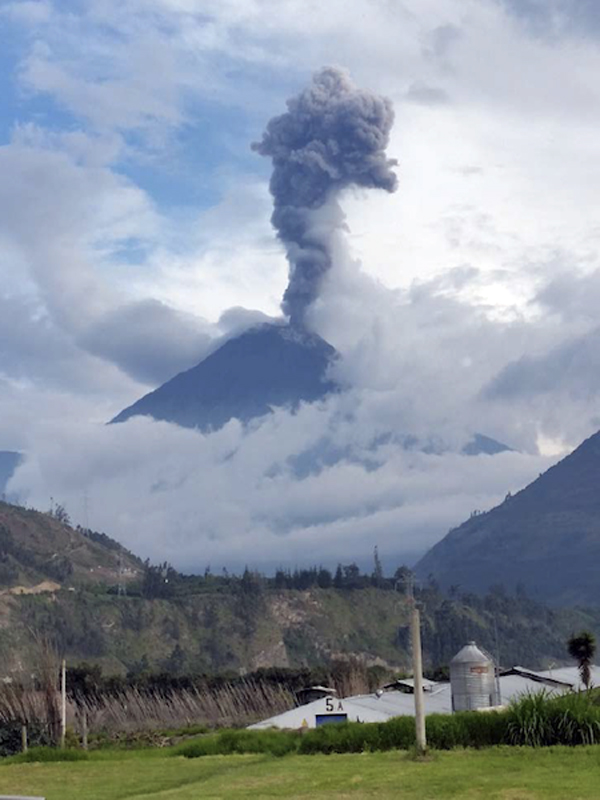
During April through September 2023, PHIVOLCS reported near-daily rockfall events, frequent volcanic earthquakes, and sulfur dioxide measurements. Gas-and-steam emissions rose 100-900 m above the crater and drifted in different directions. Nighttime crater incandescence was often visible during clear weather and was accompanied by incandescent avalanches of material. Activity notably increased during June when lava flows were reported on the S, SE, and E flanks (figure 52). The MIROVA graph (Middle InfraRed Observation of Volcanic Activity) showed strong thermal activity coincident with these lava flows, which remained active through September (figure 53). According to the MODVOLC thermal algorithm, a total of 110 thermal alerts were detected during the reporting period: 17 during June, 40 during July, 27 during August, and 26 during September. During early June, pyroclastic density currents (PDCs) started to occur more frequently.
Low activity was reported during much of April and May; gas-and-steam emissions rose 100-900 m above the crater and generally drifted in different directions. A total of 52 rockfall events and 18 volcanic earthquakes were detected during April and 147 rockfall events and 13 volcanic events during May. Sulfur dioxide flux measurements ranged between 400-576 tons per day (t/d) during April, the latter of which was measured on 29 April and between 162-343 t/d during May, the latter of which was measured on 13 May.
Activity during June increased, characterized by lava flows, pyroclastic density currents (PDCs), crater incandescence and incandescent rockfall events, gas-and-steam emissions, and continued seismicity. Weather clouds often prevented clear views of the summit, but during clear days, moderate gas-and-steam emissions rose 100-2,500 m above the crater and drifted in multiple directions. A total of 6,237 rockfall events and 288 volcanic earthquakes were detected. The rockfall events often deposited material on the S and SE flanks within 700-1,500 m of the summit crater and ash from the events drifted SW, S, SE, NE, and E. Sulfur dioxide emissions ranged between 149-1,205 t/d, the latter of which was measured on 10 June. Short-term observations from EDM and electronic tiltmeter monitoring indicated that the upper slopes were inflating since February 2023. Longer-term ground deformation parameters based on EDM, precise leveling, continuous GPS, and electronic tilt monitoring indicated that the volcano remained inflated, especially on the NW and SE flanks. At 1000 on 5 June the Volcano Alert Level (VAL) was raised to 2 (on a 0-5 scale). PHIVOLCS noted that although low-level volcanic earthquakes, ground deformation, and volcanic gas emissions indicated unrest, the steep increase in rockfall frequency may indicate increased dome activity.
A total of 151 dome-collapse PDCs occurred during 8-9 and 11-30 June, traveled 500-2,000 m, and deposited material on the S flank within 2 km of the summit crater. During 8-9 June the VAL was raised to 3. At approximately 1947 on 11 June lava flow activity was reported; two lobes traveled within 500 m from the crater and deposited material on the S (Mi-isi), SE (Bonga), and E (Basud) flanks. Weak seismicity accompanied the lava flow and slight inflation on the upper flanks. This lava flow remained active through 30 June, moving down the S and SE flank as far as 2.5 km and 1.8 km, respectively and depositing material up to 3.3 km from the crater. During 15-16 June traces of ashfall from the PDCs were reported in Sitio Buga, Nabonton, City of Ligao and Purok, and San Francisco, Municipality of Guinobatan. During 28-29 June there were two PDCs generated by the collapse of the lava flow front, which generated a light-brown ash plume 1 km high. Satellite monitors detected significant concentrations of sulfur dioxide beginning on 29 June. On 30 June PDCs primarily affected the Basud Gully on the E flank, the largest of which occurred at 1301 and lasted eight minutes, based on the seismic record. Four PDCs generated between 1800 and 2000 that lasted approximately four minutes each traveled 3-4 km on the E flank and generated an ash plume that rose 1 km above the crater and drifted N and NW. Ashfall was recorded in Tabaco City.
Similar strong activity continued during July; slow lava effusion remained active on the S and SE flanks and traveled as far as 2.8 km and 2.8 km, respectively and material was deposited as far as 4 km from the crater. There was a total of 6,983 rockfall events and 189 PDCs that affected the S, SE, and E flanks. The volcano network detected a total of 2,124 volcanic earthquakes. Continuous gas-and-steam emissions rose 200-2,000 m above the crater and drifted in multiple directions. Sulfur dioxide emissions averaged 792-4,113 t/d, the latter of which was measured on 28 July. During 2-4 July three PDCs were generated from the collapse of the lava flow and resulting light brown plumes rose 200-300 m above the crater. Continuous tremor pulses were reported beginning at 1547 on 3 July through 7 July at 1200, at 2300 on 8 July and going through 0300 on 10 July, and at 2300 on 16 July, as recorded by the seismic network. During 6-9 July there were 10 lava flow-collapse-related PDCs that generated light brown plumes 300-500 m above the crater. During 10-11 July light ashfall was reported in some areas of Mabinit, Legazpi City, Budiao and Salvacion, Daraga, and Camalig, Albay. By 18 July the lava flow advanced 600 m on the E flank as well.
During 1733 on 18 July and 0434 on 19 July PHIVOLCS reported 30 “ashing” events, which are degassing events accompanied by audible thunder-like sounds and entrained ash at the crater, which produced short, dark plumes that drifted SW. These events each lasted 20-40 seconds, and plume heights ranged from 150-300 m above the crater, as recorded by seismic, infrasound, visual, and thermal monitors. Three more ashing events occurred during 19-20 July. Short-term observations from electronic tilt and GPS monitoring indicate deflation on the E lower flanks in early July and inflation on the NW middle flanks during the third week of July. Longer-term ground deformation parameters from EDM, precise leveling, continuous GPS, and electronic tilt monitoring indicated that the volcano was still generally inflated relative to baseline levels. A short-lived lava pulse lasted 28 seconds at 1956 on 21 July, which was accompanied by seismic and infrasound signals. By 22 July, the only lava flow that remained active was on the SE flank, and continued to extend 3.4 km, while those on the S and E flanks weakened markedly. One ashing event was detected during 30-31 July, whereas there were 57 detected during 31 July-1 August; according to PHIVOLCS beginning at approximately 1800 on 31 July eruptive activity was dominated by phases of intermittent ashing, as well as increased in the apparent rates of lava effusion from the summit crater. The ashing phases consisted of discrete events recorded as low-frequency volcanic earthquakes (LFVQ) typically 30 seconds in duration, based on seismic and infrasound signals. Gray ash plume rose 100 m above the crater and generally drifted NE. Shortly after these ashing events began, new lava began to effuse rapidly from the crater, feeding the established flowed on the SE, E, and E flanks and generating frequent rockfall events.
Intensified unrest persisted during August. There was a total of 4,141 rockfall events, 2,881 volcanic earthquakes, which included volcanic tremor events, 32 ashing events, and 101 PDCs detected throughout the month. On clear weather days, gas-and-steam emissions rose 300-1,500 m above the crater and drifted in different directions (figure 54). Sulfur dioxide emissions averaged 735-4,756 t/d, the higher value of which was measured on 16 August. During 1-2 August the rate of lava effusion decreased, but continued to feed the flows on the SE, S, and E flanks, maintaining their advances to 3.4 km, 2.8 km, and 1.1 km from the crater, respectively (figure 55). Rockfall and PDCs generated by collapses at the lava flow margins and from the summit dome deposited material within 4 km of the crater. During 3-4 August there were 10 tremor events detected that lasted 1-4 minutes. Short-lived lava pulse lasted 35 seconds and was accompanied by seismic and infrasound signals at 0442 on 6 August. Seven collapses were recorded at the front of the lava flow during 12-14 August.
During September, similar activity of slow lava effusion, PDCs, gas-and-steam emissions, and seismicity continued. There was a total of 4,452 rockfall events, 329 volcanic earthquakes, which included volcanic tremor events, two ashing events, and 85 PDCs recorded throughout the month. On clear weather days, gas-and-steam emissions rose 100-1,500 m above the crater and drifted in multiple directions. Sulfur dioxide emissions averaged 609-2,252 t/d, the higher average of which was measured on 6 September. Slow lava effusion continued advancing on the SE, S, and E flanks, maintaining lengths of 3.4 km, 2.8 km, and 1.1 km, respectively. Rockfall and PDC events generated by collapses along the lava flow margins and at the summit dome deposited material within 4 km of the crater.
Geologic Background. Symmetrical Mayon, which rises above the Albay Gulf NW of Legazpi City, is the most active volcano of the Philippines. The steep upper slopes are capped by a small summit crater. Recorded eruptions since 1616 CE range from Strombolian to basaltic Plinian, with cyclical activity beginning with basaltic eruptions, followed by longer periods of andesitic lava flows. Eruptions occur predominately from the central conduit and have also produced lava flows that travel far down the flanks. Pyroclastic density currents and mudflows have commonly swept down many of the approximately 40 ravines that radiate from the summit and have often damaged populated lowland areas. A violent eruption in 1814 killed more than 1,200 people and devastated several towns.
Information Contacts: Philippine Institute of Volcanology and Seismology (PHIVOLCS), Department of Science and Technology, University of the Philippines Campus, Diliman, Quezon City, Philippines (URL: http://www.phivolcs.dost.gov.ph/); MIROVA (Middle InfraRed Observation of Volcanic Activity), a collaborative project between the Universities of Turin and Florence (Italy) supported by the Centre for Volcanic Risk of the Italian Civil Protection Department (URL: http://www.mirovaweb.it/); Hawai'i Institute of Geophysics and Planetology (HIGP) - MODVOLC Thermal Alerts System, School of Ocean and Earth Science and Technology (SOEST), Univ. of Hawai'i, 2525 Correa Road, Honolulu, HI 96822, USA (URL: http://modis.higp.hawaii.edu/); Copernicus Browser, Copernicus Data Space Ecosystem, European Space Agency (URL: https://dataspace.copernicus.eu/browser/); William Rogers, Legazpi City, Albay Province, Philippines.
Nishinoshima (Japan) — October 2023 Cite this Report
Nishinoshima
Japan
27.247°N, 140.874°E; summit elev. 100 m
All times are local (unless otherwise noted)
Eruption plumes and gas-and-steam plumes during May-August 2023
Nishinoshima, located about 1,000 km S of Tokyo, is a small island in the Ogasawara Arc in Japan. The island is the summit of a massive submarine volcano that has prominent submarine peaks to the S, W, and NE. Eruptions date back to 1973 and the current eruption period began in October 2022. Recent activity has consisted of small ash plumes and fumarolic activity (BGVN 48:07). This report covers activity during May through August 2023, using information from monthly reports of the Japan Meteorological Agency (JMA) monthly reports and satellite data.
Activity during May through June was relatively low. The Japan Coast Guard (JCG) did overflights on 14 and 22 June and reported white gas-and-steam emissions rising 600 m and 1,200 m from the central crater of the pyroclastic cone, respectively (figure 125). In addition, multiple white gas-and-steam emissions rose from the inner rim of the W side of the crater and from the SE flank of the pyroclastic cone. Discolored brown-to-green water was observed around almost the entire perimeter of the island; on 22 June light green discolored water was observed off the S coast of the island.
Observations from the Himawari meteorological satellite confirmed an eruption on 9 and 10 July. An eruption plume rose 1.6 km above the crater and drifted N around 1300 on 9 July. Satellite images acquired at 1420 and 2020 on 9 July and at 0220 on 10 July showed continuing emissions that rose 1.3-1.6 km above the crater and drifted NE and N. The Tokyo VAAC reported that an ash plume seen by a pilot and identified in a satellite image at 0630 on 21 July rose to 3 km altitude and drifted S.
Aerial observations conducted by JCG on 8 August showed a white-and-gray plume rising from the central crater of the pyroclastic cone, and multiple white gas-and-steam emissions were rising from the inner edge of the western crater and along the NW-SE flanks of the island (figure 126). Brown-to-green discolored water was also noted around the perimeter of the island.
Intermittent low-to-moderate power thermal anomalies were recorded in the MIROVA graph (Middle InfraRed Observation of Volcanic Activity), showing an increase in both frequency and power beginning in July (figure 127). This increase in activity coincides with eruptive activity on 9 and 10 July, characterized by eruption plumes. According to the MODVOLC thermal alert algorithm, one thermal hotspot was recorded on 20 July. Weak thermal anomalies were also detected in infrared satellite imagery, accompanied by strong gas-and-steam plumes (figure 128).
Geologic Background. The small island of Nishinoshima was enlarged when several new islands coalesced during an eruption in 1973-74. Multiple eruptions that began in 2013 completely covered the previous exposed surface and continued to enlarge the island. The island is the summit of a massive submarine volcano that has prominent peaks to the S, W, and NE. The summit of the southern cone rises to within 214 m of the ocean surface 9 km SSE.
Information Contacts: Japan Meteorological Agency (JMA), 1-3-4 Otemachi, Chiyoda-ku, Tokyo 100-8122, Japan (URL: http://www.jma.go.jp/jma/indexe.html); Tokyo Volcanic Ash Advisory Center (VAAC), 1-3-4 Otemachi, Chiyoda-ku, Tokyo 100-8122, Japan (URL: http://ds.data.jma.go.jp/svd/vaac/data/); MIROVA (Middle InfraRed Observation of Volcanic Activity), a collaborative project between the Universities of Turin and Florence (Italy) supported by the Centre for Volcanic Risk of the Italian Civil Protection Department (URL: http://www.mirovaweb.it/); Copernicus Browser, Copernicus Data Space Ecosystem, European Space Agency (URL: https://dataspace.copernicus.eu/browser/).
Krakatau (Indonesia) — October 2023 Cite this Report
Krakatau
Indonesia
6.1009°S, 105.4233°E; summit elev. 285 m
All times are local (unless otherwise noted)
White gas-and-steam plumes and occasional ash plumes during May-August 2023
Krakatau is located in the Sunda Strait between Java and Sumatra, Indonesia. Caldera collapse during the catastrophic 1883 eruption destroyed Danan and Perbuwatan cones and left only a remnant of Rakata. The post-collapse cone of Anak Krakatau (Child of Krakatau) was constructed within the 1883 caldera at a point between the former Danan and Perbuwatan cones; it has been the site of frequent eruptions since 1927. The current eruption period began in May 2021 and has recently consisted of Strombolian eruptions and ash plumes (BGVN 48:07). This report describes lower levels of activity consisting of ash and white gas-and-steam plumes during May through August 2023, based on information provided by the Indonesian Center for Volcanology and Geological Hazard Mitigation, referred to as Pusat Vulkanologi dan Mitigasi Bencana Geologi (PVMBG), MAGMA Indonesia, and satellite data.
Activity was relatively low during May and June. Daily white gas-and-steam emissions rose 25-200 m above the crater and drifted in different directions. Five ash plumes were detected at 0519 on 10 May, 1241 on 11 May, 0920 on 12 May, 2320 on 12 May, and at 0710 on 13 May, and rose 1-2.5 km above the crater and drifted SW. A webcam image taken on 12 May showed ejection of incandescent material above the vent. A total of nine ash plumes were detected during 6-11 June: at 1434 and 00220 on 6 and 7 June the ash plumes rose 500 m above the crater and drifted NW, at 1537 on 8 June the ash plume rose 1 km above the crater and drifted SW, at 0746 and at 0846 on 9 June the ash plumes rose 800 m and 3 km above the crater and drifted SW, respectively, at 0423, 1431, and 1750 on 10 June the ash plumes rose 2 km, 1.5 km, and 3.5 km above the crater and drifted NW, respectively, and at 0030 on 11 June an ash plume rose 2 km above the crater and drifted NW. Webcam images taken on 10 and 11 June at 0455 and 0102, respectively, showed incandescent material ejected above the vent. On 19 June an ash plume at 0822 rose 1.5 km above the crater and drifted SE.
Similar low activity of white gas-and-steam emissions and few ash plumes were reported during July and August. Daily white gas-and-steam emissions rose 25-300 m above the crater and drifted in multiple directions. Three ash plumes were reported at 0843, 0851, and 0852 on 20 July that rose 500-2,000 m above the crater and drifted NW.
The MIROVA (Middle InfraRed Observation of Volcanic Activity) graph of MODIS thermal anomaly data showed intermittent low-to-moderate power thermal anomalies during May through August 2023 (figure 140). Although activity was often obscured by weather clouds, a thermal anomaly was visible in an infrared satellite image of the crater on 12 May, accompanied by an eruption plume that drifted SW (figure 141).
Geologic Background. The renowned Krakatau (frequently mis-named as Krakatoa) volcano lies in the Sunda Strait between Java and Sumatra. Collapse of an older edifice, perhaps in 416 or 535 CE, formed a 7-km-wide caldera. Remnants of that volcano are preserved in Verlaten and Lang Islands; subsequently the Rakata, Danan, and Perbuwatan cones were formed, coalescing to create the pre-1883 Krakatau Island. Caldera collapse during the catastrophic 1883 eruption destroyed Danan and Perbuwatan, and left only a remnant of Rakata. This eruption caused more than 36,000 fatalities, most as a result of tsunamis that swept the adjacent coastlines of Sumatra and Java. Pyroclastic surges traveled 40 km across the Sunda Strait and reached the Sumatra coast. After a quiescence of less than a half century, the post-collapse cone of Anak Krakatau (Child of Krakatau) was constructed within the 1883 caldera at a point between the former Danan and Perbuwatan cones. Anak Krakatau has been the site of frequent eruptions since 1927.
Information Contacts: Pusat Vulkanologi dan Mitigasi Bencana Geologi (PVMBG, also known as Indonesian Center for Volcanology and Geological Hazard Mitigation, CVGHM), Jalan Diponegoro 57, Bandung 40122, Indonesia (URL: http://www.vsi.esdm.go.id/); MAGMA Indonesia, Kementerian Energi dan Sumber Daya Mineral (URL: https://magma.esdm.go.id/v1); MIROVA (Middle InfraRed Observation of Volcanic Activity), a collaborative project between the Universities of Turin and Florence (Italy) supported by the Centre for Volcanic Risk of the Italian Civil Protection Department (URL: http://www.mirovaweb.it/); Copernicus Browser, Copernicus Data Space Ecosystem, European Space Agency (URL: https://dataspace.copernicus.eu/browser/).
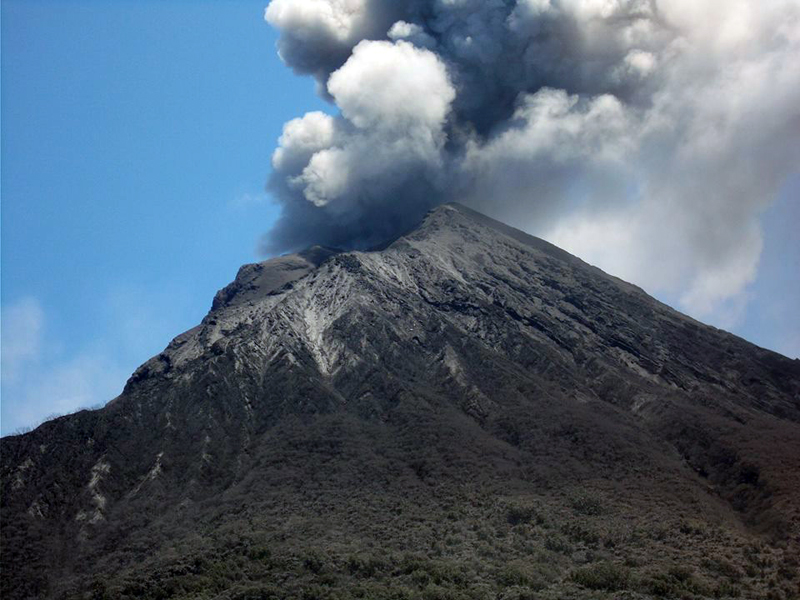
Villarrica (Chile) — October 2023 Cite this Report
Villarrica
Chile
39.42°S, 71.93°W; summit elev. 2847 m
All times are local (unless otherwise noted)
Strombolian activity, gas-and-ash emissions, and crater incandescence during April-September 2023
Villarrica, in central Chile, consists of a 2-km-wide caldera that formed about 3,500 years ago and is located at the base of the presently active cone at the NW margin of a 6-km-wide caldera. Historical eruptions eruptions date back to 1558 and have been characterized by mild-to-moderate explosive activity with occasional lava effusions. The current eruption period began in December 2014 and has recently consisted of nighttime crater incandescence, ash emissions, and seismicity (BGVN 48:04). This report covers activity during April through September 2023 and describes occasional Strombolian activity, gas-and-ash emissions, and nighttime crater incandescence. Information for this report primarily comes from the Southern Andes Volcano Observatory (Observatorio Volcanológico de Los Andes del Sur, OVDAS), part of Chile's National Service of Geology and Mining (Servicio Nacional de Geología y Minería, SERNAGEOMIN) and satellite data.
Seismicity during April consisted of long period (LP) events and tremor (TRE); a total of 9,413 LP-type events and 759 TR-type events were detected throughout the month. Nighttime crater incandescence persisted and was visible in the degassing column. Sulfur dioxide data was obtained using Differential Absorption Optical Spectroscopy Equipment (DOAS) that showed an average value of 1,450 ± 198 tons per day (t/d) during 1-15 April and 1,129 ± 201 t/d during 16-30 April, with a maximum daily value of 2,784 t/d on 9 April. Gas-and-steam emissions of variable intensities rose above the active crater as high as 1.3 km above the crater on 13 April. Strombolian explosions were not observed and there was a slight decrease in the lava lake level.
There were 14,123 LP-type events and 727 TR-type events detected during May. According to sulfur dioxide measurements taken with DOAS equipment, the active crater emitted an average value of 1,826 ± 482 t/d during 1-15 May and 912 ± 41 t/d during 16-30 May, with a daily maximum value of 5,155 t/d on 13 May. Surveillance cameras showed continuous white gas-and-steam emissions that rose as high as 430 m above the crater on 27 May. Nighttime incandescence illuminated the gas column less than 300 m above the crater rim was and no pyroclastic emissions were reported. A landslide was identified on 13 May on the E flank of the volcano 50 m from the crater rim and extending 300 m away; SERNAGEOMIN noted that this event may have occurred on 12 May. During the morning of 27 and 28 May minor Strombolian explosions characterized by incandescent ejecta were recorded at the crater rim; the last reported Strombolian explosions had occurred at the end of March.
Seismic activity during June consisted of five volcano-tectonic (VT)-type events, 21,606 LP-type events, and 2,085 TR-type events. The average value of sulfur dioxide flux obtained by DOAS equipment was 1,420 ± 217 t/d during 1-15 June and 2,562 ± 804 t/d, with a maximum daily value of 4,810 t/d on 17 June. White gas-and-steam emissions rose less than 480 m above the crater; frequent nighttime crater incandescence was reflected in the degassing plume. On 12 June an emission rose 100 m above the crater and drifted NNW. On 15 June one or several emissions resulted in ashfall to the NE as far as 5.5 km from the crater, based on a Skysat satellite image. Several Strombolian explosions occurred within the crater; activity on 15 June was higher energy and ejected blocks 200-300 m on the NE slope. Surveillance cameras showed white gas-and-steam emissions rising 480 m above the crater on 16 June. On 19 and 24 June low-intensity Strombolian activity was observed, ejecting material as far as 200 m from the center of the crater to the E.
During July, seismicity included 29,319 LP-type events, 3,736 TR-type events, and two VT-type events. DOAS equipment recorded two days of sulfur dioxide emissions of 4,220 t/d and 1,009 t/d on 1 and 13 July, respectively. Constant nighttime incandescence was also recorded and was particularly noticeable when accompanied by eruptive columns on 12 and 16 July. Minor explosive events were detected in the crater. According to Skysat satellite images taken on 12, 13, and 16 July, ashfall deposits were identified 155 m S of the crater. According to POVI, incandescence was visible from two vents on the crater floor around 0336 on 12 July. Gas-and-ash emissions rose as high as 1.2 km above the crater on 13 July and drifted E and NW. A series of gas-and-steam pulses containing some ash deposited material on the upper E flank around 1551 on 13 July. During 16-31 July, average sulfur dioxide emissions of 1,679 ± 406 t/d were recorded, with a maximum daily value of 2,343 t/d on 28 July. Fine ash emissions were also reported on 16, 17, and 23 July.
Seismicity persisted during August, characterized by 27,011 LP-type events, 3,323 TR-type events, and three VT-type events. The average value of sulfur dioxide measurements taken during 1-15 August was 1,642 ± 270 t/d and 2,207 ± 4,549 t/d during 16-31 August, with a maximum daily value of 3,294 t/d on 27 August. Nighttime crater incandescence remained visible in degassing columns. White gas-and-steam emissions rose 480 m above the crater on 6 August. According to a Skysat satellite image from 6 August, ash accumulation was observed proximal to the crater and was mainly distributed toward the E slope. White gas-and-steam emissions rose 320 m above the crater on 26 August. Nighttime incandescence and Strombolian activity that generated ash emissions were reported on 27 August.
Seismicity during September was characterized by five VT-type events, 12,057 LP-type events, and 2,058 TR-type events. Nighttime incandescence persisted. On 2 September an ash emission rose 180 m above the crater and drifted SE at 1643 (figure 125) and a white gas-and-steam plume rose 320 m above the crater. According to the Buenos Aires VAAC, periods of continuous gas-and-ash emissions were visible in webcam images from 1830 on 2 September to 0110 on 3 September. Strombolian activity was observed on 2 September and during the early morning of 3 September, the latter event of which generated an ash emission that rose 60 m above the crater and drifted 100 m from the center of the crater to the NE and SW. Ashfall was reported to the SE and S as far as 750 m from the crater. The lava lake was active during 3-4 September and lava fountaining was visible for the first time since 26 March 2023, according to POVI. Fountains captured in webcam images at 2133 on 3 September and at 0054 on 4 September rose as high as 60 m above the crater rim and ejected material onto the upper W flank. Sulfur dioxide flux of 1,730 t/d and 1,281 t/d was measured on 3 and 4 September, respectively, according to data obtained by DOAS equipment.
Strong Strombolian activity and larger gas-and-ash plumes were reported during 18-20 September. On 18 September activity was also associated with energetic LP-type events and notable sulfur dioxide fluxes (as high as 4,277 t/d). On 19 September Strombolian activity and incandescence were observed. On 20 September at 0914 ash emissions rose 50 m above the crater and drifted SSE, accompanied by Strombolian activity that ejected material less than 100 m SSE, causing fall deposits on that respective flank. SERNAGEOMIN reported that a Planet Scope satellite image taken on 20 September showed the lava lake in the crater, measuring 32 m x 35 m and an area of 0.001 km2. Several ash emissions were recorded at 0841, 0910, 1251, 1306, 1312, 1315, and 1324 on 23 September and rose less than 150 m above the crater. The sulfur dioxide flux value was 698 t/d on 23 September and 1,097 t/d on 24 September. On 24 September the Volcanic Alert Level (VAL) was raised to Orange (the third level on a four-color scale). SENAPRED maintained the Alert Level at Yellow (the middle level on a three-color scale) for the communities of Villarrica, Pucón (16 km N), Curarrehue, and Panguipulli.
During 24-25 September there was an increase in seismic energy (observed at TR-events) and acoustic signals, characterized by 1 VT-type event, 213 LP-type events, and 124 TR-type events. Mainly white gas-and-steam emissions, in addition to occasional fine ash emissions were recorded. During the early morning of 25 September Strombolian explosions were reported and ejected material 250 m in all directions, though dominantly toward the NW. On 25 September the average value of sulfur dioxide flux was 760 t/d. Seismicity during 25-30 September consisted of five VT-type events, 1,937 LP-type events, and 456 TR-type events.
During 25-29 September moderate Strombolian activity was observed and ejected material as far as the crater rim. In addition, ash pulses lasting roughly 50 minutes were observed around 0700 and dispersed ENE. During 26-27 September a TR episode lasted 6.5 hours and was accompanied by discrete acoustic signals. Satellite images from 26 September showed a spatter cone on the crater floor with one vent that measured 10 x 14 m and a smaller vent about 35 m NE of the cone. SERNAGEOMIN reported an abundant number of bomb-sized blocks up to 150 m from the crater, as well as impact marks on the snow, which indicated explosive activity. A low-altitude ash emission was observed drifting NW around 1140 on 28 September, based on webcam images. Between 0620 and 0850 on 29 September an ash emission rose 60 m above the crater and drifted NW. During an overflight taken around 1000 on 29 September scientists observed molten material in the vent, a large accumulation of pyroclasts inside the crater, and energetic degassing, some of which contained a small amount of ash. Block-sized pyroclasts were deposited on the internal walls and near the crater, and a distal ash deposit was also visible. The average sulfur dioxide flux measured on 28 September was 344 t/d. Satellite images taken on 29 September ashfall was deposited roughly 3 km WNW from the crater and nighttime crater incandescence remained visible. The average sulfur dioxide flux value from 29 September was 199 t/d. On 30 September at 0740 a pulsating ash emission rose 1.1 km above the crater and drifted NNW (figure 126). Deposits on the S flank extended as far as 4.5 km from the crater rim, based on satellite images from 30 September.
Infrared MODIS satellite data processed by MIROVA (Middle InfraRed Observation of Volcanic Activity) showed intermittent thermal activity during April through September, with slightly stronger activity detected during late September (figure 127). Small clusters of thermal activity were detected during mid-June, early July, early August, and late September. According to the MODVOLC thermal alert system, a total of four thermal hotspots were detected on 7 July and 3 and 23 September. This activity was also intermittently captured in infrared satellite imagery on clear weather days (figure 128).
Geologic Background. The glacier-covered Villarrica stratovolcano, in the northern Lakes District of central Chile, is ~15 km south of the city of Pucon. A 2-km-wide caldera that formed about 3,500 years ago is located at the base of the presently active, dominantly basaltic to basaltic andesite cone at the NW margin of a 6-km-wide Pleistocene caldera. More than 30 scoria cones and fissure vents are present on the flanks. Plinian eruptions and pyroclastic flows that have extended up to 20 km from the volcano were produced during the Holocene. Lava flows up to 18 km long have issued from summit and flank vents. Eruptions documented since 1558 CE have consisted largely of mild-to-moderate explosive activity with occasional lava effusion. Glaciers cover 40 km2 of the volcano, and lahars have damaged towns on its flanks.
Information Contacts: Servicio Nacional de Geología y Minería (SERNAGEOMIN), Observatorio Volcanológico de Los Andes del Sur (OVDAS), Avda Sta María No. 0104, Santiago, Chile (URL: http://www.sernageomin.cl/); Proyecto Observación Villarrica Internet (POVI) (URL: http://www.povi.cl/); Sistema y Servicio Nacional de Prevención y Repuesta Ante Desastres (SENAPRED), Av. Beauchef 1671, Santiago, Chile (URL: https://web.senapred.cl/); Buenos Aires Volcanic Ash Advisory Center (VAAC), Servicio Meteorológico Nacional-Fuerza Aérea Argentina, 25 de mayo 658, Buenos Aires, Argentina (URL: http://www.smn.gov.ar/vaac/buenosaires/inicio.php); MIROVA (Middle InfraRed Observation of Volcanic Activity), a collaborative project between the Universities of Turin and Florence (Italy) supported by the Centre for Volcanic Risk of the Italian Civil Protection Department (URL: http://www.mirovaweb.it/); Hawai'i Institute of Geophysics and Planetology (HIGP) - MODVOLC Thermal Alerts System, School of Ocean and Earth Science and Technology (SOEST), Univ. of Hawai'i, 2525 Correa Road, Honolulu, HI 96822, USA (URL: http://modis.higp.hawaii.edu/); Copernicus Browser, Copernicus Data Space Ecosystem, European Space Agency (URL: https://dataspace.copernicus.eu/browser/).
Merapi (Indonesia) — October 2023 Cite this Report
Merapi
Indonesia
7.54°S, 110.446°E; summit elev. 2910 m
All times are local (unless otherwise noted)
Frequent incandescent avalanches during April-September 2023
Merapi, located just north of the major city of Yogyakarta in central Java, Indonesia, has had activity within the last 20 years characterized by pyroclastic flows and lahars accompanying growth and collapse of the steep-sided active summit lava dome. The current eruption period began in late December 2020 and has more recently consisted of ash plumes, intermittent incandescent avalanches of material, and pyroclastic flows (BGVN 48:04). This report covers activity during April through September 2023, based on information from Balai Penyelidikan dan Pengembangan Teknologi Kebencanaan Geologi (BPPTKG), the Center for Research and Development of Geological Disaster Technology, a branch of PVMBG which specifically monitors Merapi. Additional information comes from the Pusat Vulkanologi dan Mitigasi Bencana Geologi (PVMBG, also known as Indonesian Center for Volcanology and Geological Hazard Mitigation, CVGHM), MAGMA Indonesia, the Darwin Volcanic Ash Advisory Centre (VAAC), and various satellite data.
Activity during April through September 2023 primarily consisted of incandescent avalanches of material that mainly affected the SW and W flanks and traveled as far as 2.3 km from the summit (table 25) and white gas-and-steam emissions that rose 10-1,000 m above the crater.
Table 25. Monthly summary of avalanches and avalanche distances recorded at Merapi during April through September 2023. The number of reported avalanches does not include instances where possible avalanches were heard but could not be visually confirmed as a result of inclement weather. Data courtesy of BPPTKG (April-September 2023 daily reports).
| Month |
Average number of avalanches per day |
Distance avalanches traveled (m) |
| Apr 2023 |
19 |
1,200-2,000 |
| May 2023 |
22 |
500-2,000 |
| Jun 2023 |
18 |
1,200-2,000 |
| Jul 2023 |
30 |
300-2,000 |
| Aug 2023 |
25 |
400-2,300 |
| Sep 2023 |
23 |
600-2,000 |
BPPTKG reported that during April and May white gas-and-steam emissions rose 10-750 m above the crater, incandescent avalanches descended 500-2,000 m on the SW and W flanks (figure 135). Cloudy weather often prevented clear views of the summit, and sometimes avalanches could not be confirmed. According to a webcam image, a pyroclastic flow was visible on 17 April at 0531. During the week of 28 April and 4 May a pyroclastic flow was reported on the SW flank, traveling up to 2.5 km. According to a drone overflight taken on 17 May the SW lava dome volume was an estimated 2,372,800 cubic meters and the dome in the main crater was an estimated 2,337,300 cubic meters.
During June and July similar activity persisted with white gas-and-steam emissions rising 10-350 m above the crater and frequent incandescent avalanches that traveled 300-2,000 m down the SW, W, and S flanks (figure 136). Based on an analysis of aerial photos taken on 24 June the volume of the SW lava dome was approximately 2.5 million cubic meters. A pyroclastic flow was observed on 5 July that traveled 2.7 km on the SW flank. According to the Darwin VAAC multiple minor ash plumes were identified in satellite images on 19 July that rose to 3.7 km altitude and drifted S and SW. During 22, 25, and 26 July a total of 17 avalanches descended as far as 1.8 km on the S flank.
Frequent white gas-and-steam emissions continued during August and September, rising 10-450 m above the crater. Incandescent avalanches mainly affected the SW and W flanks and traveled 400-2,300 m from the vent (figure 137). An aerial survey conducted on 10 August was analyzed and reported that estimates of the SW dome volume was 2,764,300 cubic meters and the dome in the main crater was 2,369,800 cubic meters.
Frequent and moderate-power thermal activity continued throughout the reporting period, according to a MIROVA (Middle InfraRed Observation of Volcanic Activity) analysis of MODIS satellite data (figure 138). There was an increase in the number of detected anomalies during mid-May. The MODVOLC thermal algorithm recorded a total of 47 thermal hotspots: six during April, nine during May, eight during June, 15 during July, four during August, and five during September. Some of this activity was captured in infrared satellite imagery on clear weather days, sometimes accompanied by incandescent material on the SW flank (figure 139).
Geologic Background. Merapi, one of Indonesia's most active volcanoes, lies in one of the world's most densely populated areas and dominates the landscape immediately north of the major city of Yogyakarta. It is the youngest and southernmost of a volcanic chain extending NNW to Ungaran volcano. Growth of Old Merapi during the Pleistocene ended with major edifice collapse perhaps about 2,000 years ago, leaving a large arcuate scarp cutting the eroded older Batulawang volcano. Subsequent growth of the steep-sided Young Merapi edifice, its upper part unvegetated due to frequent activity, began SW of the earlier collapse scarp. Pyroclastic flows and lahars accompanying growth and collapse of the steep-sided active summit lava dome have devastated cultivated lands on the western-to-southern flanks and caused many fatalities.
Information Contacts: Balai Penyelidikan dan Pengembangan Teknologi Kebencanaan Geologi (BPPTKG), Center for Research and Development of Geological Disaster Technology (URL: http://merapi.bgl.esdm.go.id/, Twitter: @BPPTKG); MAGMA Indonesia, Kementerian Energi dan Sumber Daya Mineral (URL: https://magma.esdm.go.id/v1); Pusat Vulkanologi dan Mitigasi Bencana Geologi (PVMBG, also known as Indonesian Center for Volcanology and Geological Hazard Mitigation, CVGHM), Jalan Diponegoro 57, Bandung 40122, Indonesia (URL: http://www.vsi.esdm.go.id/); Darwin Volcanic Ash Advisory Centre (VAAC), Bureau of Meteorology, Northern Territory Regional Office, PO Box 40050, Casuarina, NT 0811, Australia (URL: http://www.bom.gov.au/info/vaac/); MIROVA (Middle InfraRed Observation of Volcanic Activity), a collaborative project between the Universities of Turin and Florence (Italy) supported by the Centre for Volcanic Risk of the Italian Civil Protection Department (URL: http://www.mirovaweb.it/); Hawai'i Institute of Geophysics and Planetology (HIGP) - MODVOLC Thermal Alerts System, School of Ocean and Earth Science and Technology (SOEST), Univ. of Hawai'i, 2525 Correa Road, Honolulu, HI 96822, USA (URL: http://modis.higp.hawaii.edu/); Copernicus Browser, Copernicus Data Space Ecosystem, European Space Agency (URL: https://dataspace.copernicus.eu/browser/); Øystein Lund Andersen (URL: https://www.oysteinlundandersen.com/, https://twitter.com/oysteinvolcano).
Ebeko
Russia
50.686°N, 156.014°E; summit elev. 1103 m
All times are local (unless otherwise noted)
Moderate explosive activity with ash plumes continued during June-November 2023
Ebeko, located on the N end of Paramushir Island in Russia’s Kuril Islands just S of the Kamchatka Peninsula, consists of three summit craters along a SSW-NNE line at the northern end of a complex of five volcanic cones. Observed eruptions date back to the late 18th century and have been characterized as small-to-moderate explosions from the summit crater, accompanied by intense fumarolic activity. The current eruptive period began in June 2022, consisting of frequent explosions, ash plumes, and thermal activity (BGVN 47:10, 48:06). This report covers similar activity during June-November 2023, based on information from the Kamchatka Volcanic Eruptions Response Team (KVERT) and satellite data.
Moderate explosive activity continued during June-November 2023 (figures 50 and 51). According to visual data from Severo-Kurilsk, explosions sent ash 2-3.5 km above the summit (3-4.5 km altitude) during most days during June through mid-September. Activity after mid-September was slightly weaker, with ash usually reaching less than 2 km above the summit. According to KVERT the volcano in October and November was, with a few exceptions, either quiet or obscured by clouds that prevented satellite observations. KVERT issued Volcano Observatory Notices for Aviation (VONA) on 8 and 12 June, 13 and 22 July, 3 and 21 August, and 31 October warning of potential aviation hazards from ash plumes drifting 3-15 km from the volcano. Based on satellite data, KVERT reported a persistent thermal anomaly whenever weather clouds permitted viewing.
Geologic Background. The flat-topped summit of the central cone of Ebeko volcano, one of the most active in the Kuril Islands, occupies the northern end of Paramushir Island. Three summit craters located along a SSW-NNE line form Ebeko volcano proper, at the northern end of a complex of five volcanic cones. Blocky lava flows extend west from Ebeko and SE from the neighboring Nezametnyi cone. The eastern part of the southern crater contains strong solfataras and a large boiling spring. The central crater is filled by a lake about 20 m deep whose shores are lined with steaming solfataras; the northern crater lies across a narrow, low barrier from the central crater and contains a small, cold crescentic lake. Historical activity, recorded since the late-18th century, has been restricted to small-to-moderate explosive eruptions from the summit craters. Intense fumarolic activity occurs in the summit craters, on the outer flanks of the cone, and in lateral explosion craters.
Information Contacts: Kamchatka Volcanic Eruptions Response Team (KVERT), Far Eastern Branch, Russian Academy of Sciences, 9 Piip Blvd., Petropavlovsk-Kamchatsky, 683006, Russia (URL: http://www.kscnet.ru/ivs/kvert/).
Search Bulletin Archive by Publication Date
Select a month and year from the drop-downs and click "Show Issue" to have that issue displayed in this tab.
The default month and year is the latest issue available.
Bulletin of the Global Volcanism Network - Volume 43, Number 02 (February 2018)
Managing Editor: Edward Venzke
Aira (Japan)
Explosions gradually decrease in frequency during 2015-2016
Ambae (Vanuatu)
New eruption begins in early September 2017, forcing evacuation of thousands
Ambrym (Vanuatu)
Elevated seismicity in early August 2017-early November 2017, lava lakes remain
Fernandina (Ecuador)
Brief fissure eruption sends lava flow down the SW flank in early September 2017
Fuego (Guatemala)
Seven eruptive episodes during July-December 2017
Sheveluch (Russia)
Ash explosions, pyroclastic flows, and lava dome growth continue through January 2018
Stromboli (Italy)
Moderate increase in thermal energy and explosion rate, April-August 2017
Tinakula (Solomon Islands)
Short-lived ash emission and large SO2 plume 21-26 October 2017; historical eruption accounts
Tungurahua (Ecuador)
Ash emissions, explosions, and pyroclastic flows 26 February-16 March 2016; no further activity through 2017
Yasur (Vanuatu)
Typical ongoing eruptive activity and thermal anomalies through January 2018
Aira
Japan
31.5772°N, 130.6589°E; summit elev. 1117 m
All times are local (unless otherwise noted)
Explosions gradually decrease in frequency during 2015-2016
Sakurajima rises from Kagoshima Bay, which fills the Aira Caldera near the southern tip of Japan's Kyushu Island. Frequent explosive and occasional effusive activity has been ongoing for centuries. The Minamidake summit cone has been the location of persistent activity since 1955; the Showa crater on its E flank has been the most active site since 2006. Tens of explosions and ash-bearing emissions have been occurring monthly for the last several years and were continuous through October 2015. After a three-month break, activity resumed in February 2016 and lasted through August 2016. No further activity was reported through December 2016. The Japan Meteorological Agency (JMA) provided regular reports on activity, and the Tokyo VAAC (Volcanic Ash Advisory Center) issued hundreds of reports about ash plumes during 2015-2016.
The number of explosive events at the Showa crater of Sakurajima increased from January-May 2015. During the period, ash emissions commonly rose 3,000 m above the crater rim, and a few exceeded 4,000 m; tephra was often ejected 1.3 km and as far as 1.8 km from the crater. Incandescence was observed every week; multiple MODVOLC thermal alerts were reported monthly from January-June 2015. The Tokyo VAAC issued 845 reports between 1 January and 14 October 2015. The number of monthly explosions decreased sharply during June-August. Tiltmeter and strainmeter data indicated continuing inflation through mid-August when the inflation rate increased significantly for a brief period. This was followed by deflation for the remainder of 2015. Pyroclastic flows were reported in March, April, and June. Minor emissions occurred at Minamidake crater in May, June, and August. Activity increased at both craters during September, with the first substantial explosion at Minamidake in almost a year. An emission from Showa on 2 November 2015 was noted in a JMA weekly report, but its composition was not described; the last confirmed ash emission of the year was on 14 October 2015.
After three months of quiet, a substantial explosion at Showa in early February 2016 marked the beginning of a new eruptive episode that continued through the end of July, after which explosive activity ceased at Showa for the remainder of the year (figure 49). Minor emissions were reported at Minamidake through August 2016. Pyroclastic flows occurred in April and June from explosions at the Showa crater. Inflation was measured again beginning in April 2016 and continued through December 2016.
Activity during January-May 2015. JMA reported 61 explosions from the Showa crater during January 2015, twice the number recorded in December 2014 (figure 50). Explosions on 4 and 30 January sent ejecta as far as 1.8 km from the crater. The maximum plume height reported by JMA was 4,000 m above the crater rim on 23 January. Lapilli up to 2 cm in diameter from recent explosions were found in Kurokami (3.5 km E) and Arimura (3 km S) during JMA field visits on 16 and 30 January.
The number of explosions increased to 88 during February 2015, with events on 21 and 22 February sending tephra 1.8 km from the crater. Plumes rose as much as 3,500 m above the rim during the month. During a field survey on 4 March scientists observed ash deposits with fragments up to 2 cm in diameter, in an area 3 km S of Showa Crater. JMA reported that the largest number of explosions they have recorded in a month, 178, occurred at the crater in March. Numerous plumes rose 3,300 m above the crater. A small pyroclastic flow on 17 March traveled 600 m SE.
Seismicity below the island increased briefly between 31 March and 2 April 2015. An explosion on 17 April sent tephra 1.8 km from the crater rim. Two pyroclastic flows were reported on 18 and 28 April 2015; Showa crater had 112 explosions throughout the month. The pyroclastic flow on 28 April travelled 500 m down the SE flank. The highest ash plume rose 4,000 m on 24 April. JMA calculated that about 1.2 million tons of ash fell during April, the largest monthly amount recorded since 2006.
Several of the 169 explosions at the Showa crater during May 2015 produced ejecta that was deposited up to 1.8 km from the crater. Many explosions had plume heights exceeding 3,000 m. A small emission, rising 200 m, was observed from the Minamidaki crater on 12 May and was the first in several months. JMA scientists observed 2-cm-diameter tephra in the vicinity of Kurojin-cho, Kagoshima-shi on 14 May, likely from an explosion the previous day; significant ashfall covered the ground as well. The highest ash plume of the month rose 4,300 m above the Showa crater on 21 May 2015 (figures 51 and 52).
Activity during June-December 2015. Five of the 64 explosions recorded during June produced ejecta that landed up to 1.3 km from the Showa Crater (figure 53). A 3,300-m-high ash plume on 1 June was the highest for the month. After three explosions on 4 June, a small pyroclastic flow traveled 400 m down the E flank. A second small event on 22 June at Minamidake produced a gray plume that rose 200 m.
Activity decreased significantly beginning in July 2015, with 14 explosions reported from the Showa Crater, and declined further during August with only 5 explosions. A small explosion from the Minamidake crater on 16 July sent emissions likely containing ash (described as "non-white") to 200 m. A rapid increase in seismicity directly beneath Minamidake began on 15 August and lasted about 48 hours; along with tiltmeter and strainmeter observations of rapid inflation (figure 54), this led JMA to briefly raise the Alert Level from 3 (Do not approach the volcano) to 4 (Prepare to evacuate) an a scale of 1-5. They lowered it back to 3 on 1 September 2015. Only small explosions with tephra ejected up to 800 m were recorded during the rest of the August. Minor emissions occurred at Minamidake Crater on 30 August.
Incandescence at the Showa Crater was observed several times during September 2015; 46 explosive events were reported. The first significant explosions at the Minamidake summit crater since 7 November 2014 occurred on 13 and 28 September. The 28 September plume rose to 2,700 m above the crater rim. Tiltmeter data indicated no additional inflation since the rapid ground deformation of 15-16 August. The last explosive event of 2015 reported by JMA at the Showa crater was on 17 September and at the Minamidaki crater on 29 September.
The Tokyo VAAC reported an ash emission on 14 October 2015 that rose to 1.8 km and drifted SW. This was the last VAAC report until 5 February 2016. No explosions were recorded at the Showa crater in October, but minor ash emissions were reported on 14, 15, 21, 22, and 30 October. No activity was observed at Minamidake. Data from continuous GNSS (Global Navigation Satellite System) observations suggested that deflation began after the 15 August rapid inflation event.
A minor emission was reported by JMA from the Showa crater on 2 November 2015, the last emission reported for the year. After not having explosive activity since late September, JMA lowered the Alert Level to 2 (Do not approach the crater) on 25 November, reducing the exclusion area to 1 km around the two craters. Only steam plumes rising 50-200 m above the Showa crater and 50-600 m above the Minamidake crater were observed during December 2015.
Aerial observation on 2 December 2015 revealed 100-m-high steam plumes around the floor of the Showa crater. Thermal observations showed high heat flow around the edges and at the center of the crater floor, unchanged since the previous observation in August 2015; 200-m-high steam plumes around the Minamidake crater prevented observation of the crater floor.
Activity during 2016. No explosive activity was observed at Showa or Minamidake craters from October 2015 to 5 February 2016. JMA raised the Alert Level back to 3 after a substantial explosion on 5 February sent incandescent tephra up to 1.8 km from the Showa crater; lightning was observed in the ash cloud (figure 55). The Tokyo VAAC reported that an ash plume visible in satellite imagery was at 3 km altitude drifting SE. Multiple explosions continued from the Showa crater for the rest of February with ash plumes rising to 2.2 km above the crater, and tephra was frequently ejected 1.3 km from the crater. Four MODVOLC thermal alerts in February were the only alerts for 2016. At the Minamidake summit crater, minor emissions occurred on 8, 9, and 20 February with plumes rising 800 m above the crater rim.
Eight explosions at the Showa crater were reported by JMA, and six at the Minamidake summit crater during March 2016. Ash plumes at Minamidake on 4, 8, and 11 March rose 1,600-1,900 m above the crater rim; on 25 and 26 March they rose 2,000 m. Minor emissions were also noted on 14 and 15 March. Three explosions from the Showa Crater on 26 March sent ash plumes 2,700 m high (figure 56); tephra as large as 8 mm in diameter was found in areas 4 km E.
Activity increased during April 2016 with 51 emission events that included 15 explosions at Showa, and JMA reported inflation again after several months of stability. Reports of falling tephra, 2 cm in diameter, came from a town 3 km S after explosions were witnessed during 1-3 April. On 1 April, an explosion at Minamidake summit crater produced an ash plume which rose 800 m above its crater rim; another on 3 April rose 1,700 m. Minor emissions also occurred at Minamidake on 5, 6, and 9 April. Explosions on 6 and 8 April at Showa sent ash plumes 3,500-3,700 m high and tephra 1.3 km. During the 8 April explosion at Showa, a small pyroclastic flow traveled 400 m down the E flank, the first since June 2015. A 2,200-m-high ash plume rose from Showa crater on 17 April. Minor emissions that rose 800 m were detected at Minamidake on 20 and 28 April. Two explosions occurred on 27 April at Showa, followed by additional explosions on 28, 29, and 30 April; the events generated ash plumes that rose 3,000 m. Pyroclastic flows were generated during the events of 28 and 30 April; they each flowed about 500 m, SE and E, respectively.
A large explosion at the Showa crater on 1 May sent an ash plume to 4,100 m above the crater rim (figure 57). It was the first time since 21 May 2015 that a plume rose higher than 4,000 m. At the Minamidake summit crater, ash emissions on 1 and 13 May rose 3,500 and 3,700 m, respectively, the first plumes at Minamidake over 3,000 m since October 2009. An explosion on 8 May at Showa sent an ash plume over 3,300 m above the crater rim, and tephra reached 1,300 m from the crater. Numerous ash emissions continued throughout the month, some with plumes rising to 3,500 m. The Tokyo VAAC issued 26 reports between 13 and 22 May. Activity diminished toward the end of the month, but minor inflation continued.
Multiple ash emissions in early June 2016 produced plumes as high as 2,000 m above the Showa crater rim. An explosion on 3 June produced a pyroclastic flow that traveled 400 m SE, and tephra that was ejected 800 m from the crater. An emission at the Minamidake crater on 3 June rose 1,500m high. No further explosive activity was reported for June; only a minor emission from the Showa crater on 29 June. During the month, the Tokyo VAAC issued only six reports (during 2-3 June).
Two explosive events were recorded at Showa crater in July 2016. An explosion occurred on 2 July that produced a 1,200-m-high ash plume and sent large blocks 800 m from the crater. A substantial explosion on 26 July at Showa sent blocks 800 m from the crater, and produced an ash plume that rose 5,000 m. A minor amount of ashfall on the W and SW flanks of Sakurajima was observed, and ashfall was confirmed in a wide area from Kagoshima City (10 km W) to Hioki City (25 km NW). The Tokyo VAAC reported an ash plume drifting SW at 6.1 km altitude that day.
Minor emissions were observed at the Minamidake crater intermittently throughout August 2016, but no emissions or explosions were reported from Showa. The Tokyo VAAC reported a low-level ash plume on 22 August at 1.2 km altitude drifting 50 km SW (figure 58). This was the last VAAC report for 2016. Although there were no emissions or explosive activity reported from either crater during September-December 2016, inflation of the volcano continued, and thus the Alert Level remained at 3.
Geologic Background. The Aira caldera in the northern half of Kagoshima Bay contains the post-caldera Sakurajima volcano, one of Japan's most active. Eruption of the voluminous Ito pyroclastic flow accompanied formation of the 17 x 23 km caldera about 22,000 years ago. The smaller Wakamiko caldera was formed during the early Holocene in the NE corner of the caldera, along with several post-caldera cones. The construction of Sakurajima began about 13,000 years ago on the southern rim and built an island that was joined to the Osumi Peninsula during the major explosive and effusive eruption of 1914. Activity at the Kitadake summit cone ended about 4,850 years ago, after which eruptions took place at Minamidake. Frequent eruptions since the 8th century have deposited ash on the city of Kagoshima, located across Kagoshima Bay only 8 km from the summit. The largest recorded eruption took place during 1471-76.
Information Contacts: Japan Meteorological Agency (JMA), Otemachi, 1-3-4, Chiyoda-ku Tokyo 100-8122, Japan (URL: http://www.jma.go.jp/jma/indexe.html); Tokyo Volcanic Ash Advisory Center (VAAC), 1-3-4 Otemachi, Chiyoda-ku, Tokyo, Japan (URL: http://ds.data.jma.go.jp/svd/vaac/data/); Hawai'i Institute of Geophysics and Planetology (HIGP), MODVOLC Thermal Alerts System, School of Ocean and Earth Science and Technology (SOEST), Univ. of Hawai'i, 2525 Correa Road, Honolulu, HI 96822, USA (URL: http://modis.higp.hawaii.edu/); NASA Earth Observatory, EOS Project Science Office, NASA Goddard Space Flight Center, Goddard, Maryland, USA (URL: http://earthobservatory.nasa.gov/); Japan Aerospace Exploration Agency (JAXA) (URL: http://global.jaxa.jp/); Associated Press (URL: http://www.ap.org/); Tom Pfeiffer, Volcano Discovery (URL: http://www.volcanodiscovery.com/ ); Naoto Yoshidome, Twitter (URL: https://twitter.com); Minaminihon Broadcasting Co., Ltd (MBC). (http://www.mbc.co.jp/web-cam/).
Ambae
Vanuatu
15.389°S, 167.835°E; summit elev. 1496 m
All times are local (unless otherwise noted)
New eruption begins in early September 2017, forcing evacuation of thousands
Ambae (formerly called Aoba) is a large basaltic shield volcano in the New Hebrides arc that has generated periodic phreatic and pyroclastic explosions originating in the summit crater lakes Manaro Lakua and Voui during the last 25 years; the central edifice with the active summit craters is also commonly referred to as Lombenben, Manaro Voui, or simply the Manaro volcano. From late November 2005 to mid-February 2006 explosions from Lake Voui resulted in the formation of a pyroclastic cone in the lake. By late November 2006 the side of the cone was breached, and its central crater filled with lake water (figure 30, BGVN 31:12). The Vanuatu Meteorology and Geo-Hazards Department (VMGD) reported intermittent increases in degassing activity between 2006 and August 2017, and minor ash emissions during June-July 2011 and August 2016. An explosive eruption from a new pyroclastic cone in the lake began in mid-September 2017 and lasted through mid-November. This report summarizes activity between 2010 and the new eruption in September 2017 and provides details for the eruption through December 2017, with information provided primarily by the Vanuatu Geohazards Observatory of VMGD, the Wellington Volcanic Ash Advisory Center (VAAC), and satellite data from several sources.
Local ashfall around the pyroclastic cone in Lake Voui during June-July 2011 and August 2016 were the only eruptive events between February 2006 and September 2017, although intermittent SO2 emissions were noted throughout the period. Renewed explosive activity was reported beginning on 6 September 2017. Lava was first observed on 22 September emerging from a vent at the summit of the pyroclastic cone. Ash plumes and fountaining lava persisted for a few weeks as the pyroclastic cone increased in size. Activity became more intermittent by mid-October, but explosions still produced ash plumes; the highest was reported at 9.1 km altitude. Pulses of thermal activity suggesting lava flows continued through early November. The last ash emission of the year was reported on 23 November 2017, after which only steam and gas were noted.
Activity during 2010-August 2017. After several years of quiet since early 2006, substantial gas plumes were observed beginning in December 2009 and the Volcanic Alert Level was raised to 1 (on a 0-5 scale). Plumes of gas emissions were observed during 6-11 April 2010, and steam emissions were photographed during 3-4 June 2010 (figure 32).
Sulfur dioxide emissions were often elevated, and plumes were identified multiple times with satellite instruments during 2011 (figure 33). Local ashfall around the crater of the pyroclastic cone in Lake Voui was reported after explosions and seismicity on 4 June 2011; additional explosions occurred on 10 July 2011. Compared to January 2010, the cone was significantly eroded when photographed on 12 July 2011.
While no ash emissions or explosions were reported during 2012 from Ambae, SO2 plumes were recorded by satellite instruments every month except June and August (figure 34). Villagers in Ambanga reported a "phase of minor activity" beginning in December 2012. Increased SO2 plumes were recorded in satellite data during December as well (figure 35). Nearby Ambrym often produces large SO2 plumes which obscure SO2 emissions from Ambae.
Site observations during 30 January-2 February 2013 confirmed continuing degassing at Lake Voui, and remnants of the old pyroclastic cone still visible in the lake. The Aura satellite instrument detected SO2 emissions a number of times throughout 2013-2016 (figure 36), and VMGD noted continuing unrest multiple times during 2015.
VMGD reported that during 18-19 August 2016 a steam plume was accompanied by a small ash emission in the caldera area. The Vanuatu Volcanic Alert Level (VVAL) was raised from 1 to 2 on 21 August 2016 and remained there for just over a year. Changing conditions were first reported by VMGD on 30 August 2017.
Activity during September-December 2017. The Alert Level was raised to 3 on 6 September 2017, indicating that a minor eruption was occurring. A week later VMGD reminded residents of the 3 km danger zone around the lake and added a 1 km exclusion zone within that area (figure 37). Explosive activity began building a new pyroclastic cone in Lake Voui, and ash plumes generated local ashfall on the island.
On 22 September 2017, lava was observed at the surface by VMGD staff, there was a MODVOLC thermal alert, and a volcanic ash advisory was issued by the Wellington VAAC. The VAAC report estimated the ash plume observed in satellite data to be at an altitude of 3 km drifting E. On 23 September the VMGD stated that activity had continued to increase, prompting them to raise the VVAL to 4, indicating that a moderate eruption was taking place. They warned that ejecta and gas would affect an area within 6.5 km of Lake Voui, and many communities were at risk from various types of volcanic activity (figure 38). A dense plume of dark ash was photographed on 23 September by airplane travelers going to Ambae (figure 39).
Eruptive activity increased over the next few days. Larger explosions generated ash plumes that caused local ashfall. A photo taken on 24 September showed incandescent ejections and an ash plume rising from the pyroclastic cone (figure 40). The Wellington VAAC reported intermittent emissions that day at 2.4 km altitude drifting N, and again on 26 September at 2.1 km altitude drifting W. The New Zealand Defense Force conducted an overflight on 25 September 2017 and witnessed incandescence at the summit and lava flowing into the lake (figures 41, 42, and 43).
A 27 September a news article from ABC.net stated that about 8,000 residents had been evacuated from the northern and southern parts of the island to eastern and western areas. An overflight by the New Zealand Defence Force showed ongoing activity. Multiple MODVOLC thermal alerts were issued nearly every day from 22 September through 7 October.
Photographs and thermal infrared images taken by VMGD during observation flights on 30 September and 1 October 2017 showed explosions of tephra, and lava flowing from small vents into the lake (figures 44-48). The number of vents on the cone varied from 2 to 4 during the observation flights.
On 6 October 2017, the VMGD noted that there was no evidence of the eruption escalating; the Alert Level was lowered to 3 and residents and tourists were reminded to stay outside of the Red Zone, defined as a 3 km radius around the active cone. The Wellington VAAC reported ash emissions on 9 October visible in satellite imagery spreading N of the island as high as 3.7 km altitude. They reported low-level (2.4-4.6 km) ash plumes daily through 15 October. A short-lived eruption on 13 October produced an ash plume clearly visible in satellite imagery that rose to 9.1 km altitude.
Webcam observations and seismic analysis reported on 13 October by VMGD indicated ongoing minor explosive activity and ash emission from vents on the cone in Lake Voui over the previous several days (figure 49). Lava had apparently ceased flowing to the lake. The local population from Ambae and neighboring islands could still hear some of the explosions, see volcanic ash and gas plumes, and see incandescence at night. Multiple MODVOLC thermal alerts were issued on 15 and 16 October, and again during 19-23 October. Wellington VAAC reports during 22-23 October indicated intermittent low-level ash plumes at 2.4-3.7 km altitude moving E.
A new surge of activity created multiple MODVOLC thermal alerts between 27 October and 1 November 2017. The Wellington VAAC reported an ash plume on 29 October at 6.1 km altitude drifting SE. The activity ceased, and the plume dissipated by the end of the day. VMGD reported on 31 October that seismic activity was ongoing, and explosions could be seen in webcam photos; incandescence and explosions were also heard and seen from neighboring islands at night.
Webcam photos from 5 and 6 November showed that ash emissions and incandescent explosions continued (figures 50 and 51). The Wellington VAAC reported an ash emission rising to 4.3 km altitude and drifting W on 5 November. By the next day the altitude of the ash plume had dropped to 2.1 km. This was followed late on 6 November by an ash emission reported at 3.9 km altitude extending 25 km W and SW of the volcano, which continued through the next day. Another emission on 8 November drifted W at 3 km altitude for several hours before dissipating. Fourteen MODVOLC thermal alerts were issued on 5 November, and two more the next day. A final alert on 9 November was the last for 2017.
VGO reported on 8 November 2017 that the eruption had been continuing, and photos taken during the first week of the month confirmed that the pyroclastic cone in Lake Voui continued to grow in height and size, with frequent explosions and ash plumes. The Wellington VAAC reported a ground observation of an ongoing minor eruption on 21 November that produced an ash plume that rose to 1.8 km altitude. By the following day, the plume appeared to be mostly steam. A new eruption the next day (23 November) produced a plume estimated at 3.7 km altitude moving W. An ash emission later that day was estimated at 3 km altitude drifting N based on satellite imagery. It had dissipated by the following day, and there were no further VAAC reports issued during 2017.
By 7 December 2017, activity had decreased significantly, and emissions consisted of only steam and gas plumes; VMGD lowered the Alert Level from 3 to 2, and reduced the restricted area to within 2 km of the active vent in Lake Voui, noting that the eruption had ceased. The MIROVA plot of Log Radiative Power at Ambae (Aoba) correlates well with visual and thermal observations of activity between 23 September and early November 2017 (figure 52). Significant quantities of SO2 were released at Ambae during October-December 2017 (figure 53). SO2 emissions continued into December after the ash emissions ceased.
Geologic Background. The island of Ambae, also known as Aoba, is a massive 2,500 km3 basaltic shield that is the most voluminous volcano of the New Hebrides archipelago. A pronounced NE-SW-trending rift zone with numerous scoria cones gives the 16 x 38 km island an elongated form. A broad pyroclastic cone containing three crater lakes (Manaro Ngoru, Voui, and Manaro Lakua) is located at the summit within the youngest of at least two nested calderas, the largest of which is 6 km in diameter. That large central edifice is also called Manaro Voui or Lombenben volcano. Post-caldera explosive eruptions formed the summit craters about 360 years ago. A tuff cone was constructed within Lake Voui (or Vui) about 60 years later. The latest known flank eruption, about 300 years ago, destroyed the population of the Nduindui area near the western coast.
Information Contacts: Geo-Hazards Division, Vanuatu Meteorology and Geo-Hazards Department, Ministry of Climate Change Adaptation, Meteorology, Geo-Hazards, Energy, Environment and Disaster Management, Private Mail Bag 9054, Lini Highway, Port Vila, Vanuatu (URL: http://www.vmgd.gov.vu/, https://www.facebook.com/VanuatuGeohazardsObservatory/); Hawai'i Institute of Geophysics and Planetology (HIGP), MODVOLC Thermal Alerts System, School of Ocean and Earth Science and Technology (SOEST), Univ. of Hawai'i, 2525 Correa Road, Honolulu, HI 96822, USA (URL: http://modis.higp.hawaii.edu/); MIROVA (Middle InfraRed Observation of Volcanic Activity), a collaborative project between the Universities of Turin and Florence (Italy) supported by the Centre for Volcanic Risk of the Italian Civil Protection Department (URL: http://www.mirovaweb.it/); Wellington Volcanic Ash Advisory Centre (VAAC), Meteorological Service of New Zealand Ltd (MetService), PO Box 722, Wellington, New Zealand (URL: http://www.metservice.com/vaac/, http://www.ssd.noaa.gov/VAAC/OTH/NZ/messages.html); NASA Goddard Space Flight Center (NASA/GSFC), Global Sulfur Dioxide Monitoring Page, Atmospheric Chemistry and Dynamics Laboratory, 8800 Greenbelt Road, Goddard, Maryland, USA (URL: https://so2.gsfc.nasa.gov/); New Zealand Defence Force (URL: http://www.nzdf.mil.nz/); BBC News (URL: http://www.bbc.com/news); ABC News (http://abcnews.go.com/); Batik Bong Shem, Facebook (URL: https://www.facebook.com/batick.shem); Yumi Toktok Stret News, Facebook URL: https://www.facebook.com/ytsnews.today/); Geoff Reid NZ, Facebook (URL: https://www.facebook.com/GeoffReidNZ/).
Ambrym (Vanuatu) — February 2018 Cite this Report
Ambrym
Vanuatu
16.25°S, 168.12°E; summit elev. 1334 m
All times are local (unless otherwise noted)
Elevated seismicity in early August 2017-early November 2017, lava lakes remain
Occasional weak eruptions and low-level ash emissions are typical of activity at Ambrym. The most recent ash emission was on 3 April 2017 (BGVN 42:05). The current report summarizes activity from late April through December 2017.
On 30 August 2017, the Vanuatu Meteorology and Geo-Hazards Department (VMGD) reported that "drastic changes" at Ambrym prompted an increase in the Alert Level from 2 to 3 (on a scale of 0-5). Areas deemed hazardous were near and around the active vents (Benbow, Maben-Mbwelesu, Niri-Mbwelesu and Mbwelesu), and in downwind areas prone to ashfall. According to a news report (Radio New Zealand), a representative of VMGD indicated that the Alert Level change was based on increased seismicity detected since the beginning of August, but which became more notable on 25 August.
According to VMGD, aerial observations on 24 and 30 September, and 1 and 6 October, combined with analysis of seismic data, confirmed that minor eruptive activity within the caldera was characterized by hot volcanic gas and steam emissions. Areas deemed hazardous were within a 2-km radius from Benbow Crater and a 3-km radius from Marum Crater.
A news report (The Vanuatu Independent) quoted an official from VMGD as stating that on 8 November 2017 at 0500, the Niri-Mbwelesu eruptive vent emitted a minor ash plume. On 7 December 2017, VGO lowered the Alert Level to 2, noting that activity had stabilized by the end of November and was characterized by gas-and-steam emissions. Seismicity had also declined. The report reminded the public to stay outside of the Permanent Danger Zone, defined as a 1-km radius from Benbow Crater and a 2.7-km radius from Marum Crater.
During the reporting period, thermal anomalies based on MODIS satellite instruments and analyzed using the MODVOLC algorithm, continued to be numerous every month, possibly reflecting lava lakes in Benbow and Marum craters. The MIROVA (Middle InfraRed Observation of Volcanic Activity) system also detected numerous hotspots every month within 5 km of the volcano.
Geologic Background. Ambrym, a large basaltic volcano with a 12-km-wide caldera, is one of the most active volcanoes of the New Hebrides Arc. A thick, almost exclusively pyroclastic sequence, initially dacitic then basaltic, overlies lava flows of a pre-caldera shield volcano. The caldera was formed during a major Plinian eruption with dacitic pyroclastic flows about 1,900 years ago. Post-caldera eruptions, primarily from Marum and Benbow cones, have partially filled the caldera floor and produced lava flows that ponded on the floor or overflowed through gaps in the caldera rim. Post-caldera eruptions have also formed a series of scoria cones and maars along a fissure system oriented ENE-WSW. Eruptions have apparently occurred almost yearly during historical time from cones within the caldera or from flank vents. However, from 1850 to 1950, reporting was mostly limited to extra-caldera eruptions that would have affected local populations.
Information Contacts: Geo-Hazards Division, Vanuatu Meteorology and Geo-Hazards Department, Ministry of Climate Change Adaptation, Meteorology, Geo-Hazards, Energy, Environment and Disaster Management, Private Mail Bag 9054, Lini Highway, Port Vila, Vanuatu (URL: http://www.vmgd.gov.vu/, https://www.facebook.com/VanuatuGeohazardsObservatory/); Radio New Zealand (URL: https://www.radionz.co.nz); The Vanuatu Independent (URL: https://vanuatuindependent.com/); Hawai'i Institute of Geophysics and Planetology (HIGP), MODVOLC Thermal Alerts System, School of Ocean and Earth Science and Technology (SOEST), Univ. of Hawai'i, 2525 Correa Road, Honolulu, HI 96822, USA (URL: http://modis.higp.hawaii.edu/); Middle InfraRed Observation of Volcanic Activity (MIROVA), Mirova (collaborative project between the Universities of Turin and Florence, Italy)(URL: http://www.mirovaweb.it).
Fernandina (Ecuador) — February 2018 Cite this Report
Fernandina
Ecuador
0.37°S, 91.55°W; summit elev. 1476 m
All times are local (unless otherwise noted)
Brief fissure eruption sends lava flow down the SW flank in early September 2017
Eruptions at Fernandina Island in the Galapagos often occur from vents located around the caldera rim along boundary faults and fissures, and occasionally from side vents on the flank. The last eruption in 2009 generated fountaining basaltic lava along several fissure vents. Lava flowed down the SW flank and entered the sea for a few weeks during April 2009. A new eruption began on 4 September 2017 after eight years of no surface activity, and lasted for about one week. Information about this new eruption was provided by Ecuador's Institudo Geofisica, Escuela Politécnica Nacional (IG-EPN), the Dirección del Parque Nacional Galápagos (DPNG), the Washington Volcanic Ash Advisory Center (VAAC), and several sources of satellite data.
A brief fissure vent eruption began on 4 September 2017 at Fernandina, located at the SW rim of the caldera. Small amounts of ash were noted in the plume that rose 2.5 km, but most of the emission was steam and SO2. Vegetation fires were ignited on the SW flank, but lava did not reach the ocean. There was no sign of volcanic activity within the summit crater. A significant area with thermal anomalies was seen in infrared satellite data through 7 September.
Eruption of early September 2017. After eight years of little activity, Fernandina (La Cumbre) began a new eruptive phase on 4 September 2017, at approximately 1225 (Galápagos time) (figure 22). Inflation between March 2015 and September 2017 was 17 cm centered on the caldera; 5 cm of that inflation occurred in the last two months before the eruption (figure 23).
Seismic activity began with hybrid-type earthquakes (fractures with fluid movements) followed by Long Period (LP) earthquakes (fluid movements). The seismic network of the Geophysical Institute installed in the Galapagos began to detect activity at the volcano around 0955 on 4 September 2017. The beginning of the eruption was associated with a volcanic tremor that began at 1225. At 1428, an eruptive column was visible in satellite imagery, interpreted at an approximate height of 4,000 m above the crater, drifting WNW (figure 24).
The Washington VAAC reported that satellite imagery indicated a lava eruption which produced a plume of steam and gas that rose to 2,400 m above sea level and extended about 60 km W of the summit. While initially no ash was reported in the plume, a few hours later a new VAAC report suggested that minor ash was possibly present, although it was most likely primarily SO2. Satellite data reported by the NASA Goddard Space Flight Center showed SO2 emissions on 4-6 and 8 September (figure 25).
Thermal alerts indicative of fresh lava flows from the rim of the summit crater were first reported by MODVOLC on 4 September 2017 (UTC), and abundant through 7 September (figure 26). No thermal anomalies were recorded in MODVOLC data on 8 September. An additional group of alert pixels was recorded on 9 September, but it's not clear if they were caused by fresh lava flows or burning fires; a few more intermittent pixels were recorded through 20 September. The MIROVA system also captured a significant spike in heatflow at Fernandina during the same period (figure 27). Some of the anomalies measured by both systems were likely the result of the fires caused by the lava flows as well as the flows themselves.
Incandescence was first observed during the night of 4 September (figure 28). Lava flows apparently originated from a circumferential fissure near the fissure of the 2005 eruption on the SSW rim of the caldera. The lava flowed down the S and SW flanks but did not reach the sea. Active lava flows were observed during the night of 5 September (figure 29). The intensity of the eruption decreased significantly after about 48 hours.
A technical team from the Directorate of the Galapagos National Park (DPNG) made an aerial inspection using the seaplane Sea Wolf on 7 September 2017. They observed a radial fissure in the same area where the 2005 eruption occurred, and several lava flows. No recent volcanic activity or any landslides were seen inside the caldera. The lava flows had ceased movement, but there were isolated fires burning patches of vegetation surrounded by older lava flows (figures 30 and 31). The lava had traveled from the summit crater at about 1,200 m down to 500 m elevation. While lava was not observed flowing into the sea, coastal monitoring by the park rangers showed water vapor on the SW coast, so it was possible that lava had reached the ocean through subsurface lava tubes.
Geologic Background. Fernandina, the most active of Galápagos volcanoes and the one closest to the Galápagos mantle plume, is a basaltic shield volcano with a deep 5 x 6.5 km summit caldera. The volcano displays the classic "overturned soup bowl" profile of Galápagos shield volcanoes. Its caldera is elongated in a NW-SE direction and formed during several episodes of collapse. Circumferential fissures surround the caldera and were instrumental in growth of the volcano. Reporting has been poor in this uninhabited western end of the archipelago, and even a 1981 eruption was not witnessed at the time. In 1968 the caldera floor dropped 350 m following a major explosive eruption. Subsequent eruptions, mostly from vents located on or near the caldera boundary faults, have produced lava flows inside the caldera as well as those in 1995 that reached the coast from a SW-flank vent. Collapse of a nearly 1 km3 section of the east caldera wall during an eruption in 1988 produced a debris-avalanche deposit that covered much of the caldera floor and absorbed the caldera lake.
Information Contacts: Instituto Geofísico (IG-EPN), Escuela Politécnica Nacional, Casilla 17-01-2759, Quito, Ecuador (URL: http://www.igepn.edu.ec ); Dirección del Parque Nacional Galápagos (DPNG), Isla Santa Cruz, Galápagos, Ecuador (URL: http://www.galapagos.gob.ec/); MIROVA (Middle InfraRed Observation of Volcanic Activity), a collaborative project between the Universities of Turin and Florence (Italy) supported by the Centre for Volcanic Risk of the Italian Civil Protection Department (URL: http://www.mirovaweb.it/); Hawai'i Institute of Geophysics and Planetology (HIGP), MODVOLC Thermal Alerts System, School of Ocean and Earth Science and Technology (SOEST), Univ. of Hawai'i, 2525 Correa Road, Honolulu, HI 96822, USA (URL: http://modis.higp.hawaii.edu/); NASA Goddard Space Flight Center (NASA/GSFC), Global Sulfur Dioxide Monitoring Page, Atmospheric Chemistry and Dynamics Laboratory, 8800 Greenbelt Road, Goddard, Maryland, USA (URL: http://so2.gsfc.nasa.gov/index.html ); Galapagos Conservancy, (URL:https://www.galapagos.org).
Fuego (Guatemala) — February 2018 Cite this Report
Fuego
Guatemala
14.4748°N, 90.8806°W; summit elev. 3799 m
All times are local (unless otherwise noted)
Seven eruptive episodes during July-December 2017
Guatemala's Volcán de Fuego was continuously active throughout 2017, and has been erupting vigorously since 2002; historical observations of eruptions date back to 1531. These eruptions have resulted in major ashfalls, pyroclastic flows, lava flows, and damaging lahars. Reports of activity are provided by the Instituto Nacional de Sismologia, Vulcanología, Meteorología e Hidrologia (INSIVUMEH), and aviation alerts of ash plumes are issued by the Washington Volcanic Ash Advisory Center (VAAC). Satellite data from NASA, NOAA, and other sources provide valuable information about heat flow and gas emissions.
Activity remained high at Fuego throughout July-December 2017. Background levels of activity included frequent explosions (4-6 per hour) with incandescent material rising 150 m above the summit and sending blocks 200 m down the flanks. Block avalanches commonly traveled down the major ravines for hundreds of meters. Ash plumes regularly rose 500-1,000 m above the summit (4.3-4.8 km altitude); ashfall affected communities SW of the summit within 15 km every week. During the multiple short-lived (48-hour or less) eruptive episodes, the hourly explosion rates increased significantly (6-12 per hour), and incandescent material often rose 300 m above the summit; one or more lava flows would also travel more than a kilometer down major ravines. Higher ash plumes (often rising to 5-6 km altitude) during the eruptive episodes sent ash plumes drifting hundreds of kilometers in various directions causing ashfall in cities tens of kilometers away in various directions. Pyroclastic flows often accompanied the eruptive episodes. Seven episodes were reported by INSIVUMEH during July-December 2017 (table 17); they are clearly discernible as periods of higher heat flow in the MIROVA thermal anomaly data (figure 73) as well.
Table 17. Eruptive episodes at Fuego during July-December 2017. Information provided primarily by INSIVUMEH. Some ash plume information is from the Washington VAAC.
| Dates |
Episode |
Ash plume height |
Ash plume drift |
Ashfall areas |
Lava flow distances |
Lava flow drainages |
Pyroclastic flows |
| 11-12 Jul 2017 |
6 |
5.1 km |
35 km W |
10-20 km WSW |
2.3 km, 1.7 km |
Las Lajas, Santa Teresa |
-- |
| 07-08 Aug 2017 |
7 |
-- |
20 km W |
10-20 km W |
1.5 km, 700 m |
Ceniza, Santa Teresa |
-- |
| 19-21 Aug 2017 |
8 |
6.1 km |
75 km W, SW, WNW |
20 km WSW |
1.4 km, 1.2 km |
Ceniza, Santa Teresa (Seca) |
Santa Teresa |
| 12-13 Sep 2017 |
9 |
4.6 km |
65 km N |
10-20 km WSW |
1.3 km |
Seca (Santa Teresa) |
Seca (Santa Teresa) |
| 27-28 Sep 2017 |
10 |
4.7 km |
25 km W |
More than 30 km N, E |
800 m, 500 m |
Seca, Las Lajas |
-- |
| 05-07 Nov 2017 |
11 |
4.8 km |
25 km W, SW |
8-12 km SW |
1.2 km, 800 m |
Seca, Ceniza |
-- |
| 10-11 Dec 2017 |
12 |
5.0 km |
20 km S, SW |
20 km S, SW |
1.5 km |
Seca, Taniluyá, Ceniza |
-- |
Activity during July 2017. Activity increased at Fuego during July 2017, compared with the previous month. INSIVUMEH reported that explosions per hour increased during 6-7 July from 4-7 to 7-10; a lava flow also traveled 1.5 km down Las Lajas ravine. Incandescent material was ejected 100-200 m above the crater rim and caused avalanches of material that traveled down the Ceniza (SSW), Taniluyá (SW), Santa Teresa (SW), and Trinidad (S) drainages (figure 74). Ash plumes during 7-9 July caused ashfall in Santa Sofía (12 km SW), Morelia (9 km SW), Panimaché I and II (8 km SW), El Porvenir (8 km ENE), Sangre de Cristo (8 km WSW), and possibly San Pedro Yepocapa (8 km N).
The Washington VAAC reported dense ash emissions seen in satellite data on 10 July extending WNW 60 km from the summit at 4.6 km altitude. They noted that ashfall was reported 10 km SW from the summit the following morning. The 6th eruptive episode of the year occurred on 11-12 July 2017. Explosions generated ash plumes that rose as high as 1.3 km above the crater and drifted 35 km W, and shock waves rattled nearby structures. Ash fell in areas to the SW. Two lava flows were fed by lava fountains 150-250 m high; one flow traveled 2.3 km down the Las Lajas drainage and another traveled 1.7 km down the Santa Teresa (SW) drainage. The increased activity levels lasted for about 31 hours, with tens of explosions. Weak-to-moderate explosions continued afterwards, generating ash plumes that rose 850 m and drifted 6 km W.
Multiple explosions continued generating ash plumes and block avalanches during 13-14 July. On 16 July, a 30-m-wide, 2-m-deep, hot lahar descended tributaries of the Pantaleón (W) drainage, carrying blocks more than 2 m in diameter, branches, and tree trunks. The lahars again overtook the road between communities on the SW flank, isolating the village of Sangre de Cristo (8 km WSW) and the Palo Verde estate. The Washington VAAC estimated that the ash plumes released early on 16 July rose to 5.2 km altitude, and drifted SE from the summit. By afternoon they had risen to 5.8 km and were drifting SW, extending about 75 km. Explosions during 17-18 July produced dense ash plumes that drifted 15 km W and NW causing ashfall in Panimache, Morelia, and Santa Sofía. Satellite imagery on 19 July showed an ash plume extending 65 km WNW of the summit in a narrow band at 4.3 km altitude. Similar plumes were reported daily between 19-23 July at 4.3-4.9 km altitude drifting generally W up to about 50 km before dissipating (figure 75).
Activity during August 2017. MODVOLC thermal alerts that were issued on 28 and 30 July confirmed the continuing incandescent summit activity which produced block avalanches down the major drainages. Multiple daily alerts were also issued during 15 days of August. Coordinadora Nacional Para la Reduccion de Desastres (CONRED) reported increased activity on 4 August that included 300-m-high ejections of incandescent material and a lava flow that traveled 600 m down the Ceniza ravine. During 7-8 August two lava fountains rose 150 m high, prompting INSIVUMEH to announce the seventh effusive episode at Fuego in 2017. The fountains fed lava flows, 1.5 km and 700 m long, in the Ceniza and the Santa Teresa ravines (figure 76). Explosions (occurring at a rate of 6-8 per hour) produced ash plumes that drifted 20 km W, causing ashfall in Panimache, Morelia, Santa Sofía, El Porvenir, and Yepocapa. The Washington VAAC also noted increasing ash emissions on 7 August. Weather clouds prevented observations from satellite images on 7 and 8 August, but the VAAC reported a "" strong hotspot in infrared imagery on 8 August. Although the lava flow in the Ceniza drainage remained active, explosive activity decreased to an average of three explosions per hour the following week, with ash emissions rising to 4.4-4.6 km and drifting 10 or more km W and SW, bringing ashfall to communities on the W and SW flank.
Activity intensified again during 19-20 August, when constant explosions generated ash plumes that rose 2.3 km above the crater and drifted more than 50 km W and SW. INSIVUMEH reported that the eighth effusive episode at Fuego in 2017 began on 20 August and lasted for about 48 hours. Two lava fountains, each 300 m high, fed lava flows that traveled 1.4 km SSW down the Ceniza ravine and 1.2 km W down the Seca (Santa Teresa) ravine (figure 77). Incandescent block avalanches occurred throughout the crater. Pyroclastic flows (figure 78) were concentrated in the Santa Teresa ravine, possibly filling the drainage with deposits (similar to activity from 5 May) and increasing the chances for lahars. A bright hotspot was visible in satellite imagery from 19-21 August. Seismicity remained elevated through 21 August. During 21 August, the Washington VAAC reported the ash plume near 5.5 km altitude extending 75 km WNW. A remnant cloud of ash was detected in satellite imagery over 200 km WNW of the summit in extreme SE Mexico late on 21 August.
INSIVUMEH reported that on 25 August multiple lahars descended the Pantaleón, Cenizas, El Jute, and Las Lajas drainages on Fuego's W, SSW, and SE flanks. The lahar in the Pantaleón river (fed by the Santa Teresa and El Mineral rivers) was 35 m wide, 2.5-3 m deep, and carried trees and blocks more than 2-3 m in diameter. The Cenizas lahar was about 25 m wide, 3 m deep, and carried blocks up to 2 m in diameter. The lahars in El Jute and Las Lajas drainages were 20 m wide, 1.5 m deep, and carried tree debris and blocks up to 2 m in diameter.
Explosions during 26-29 August generated ash plumes that rose as high as 950 m above the crater and drifted 7-12 km SW, W, and NW. The Washington VAAC reported near continuous emissions of ash on 28 August moving WSW and extending about 100 km at 4.6 km altitude, rising to 5.8 km altitude the following day. Incandescent material was ejected 100-200 m above the crater rim and caused avalanches of material around the crater area. Explosions were audible within a 20-km radius, and shock waves vibrated local structures. Ash fell in areas downwind including Panimache I and II, Morelia, Finca Palo verde, Sangre de Cristo, and El Porvenir. On 29 August, lahars 10 m wide and 1.5 m deep again descended the Santa Teresa and El Mineral drainages, carrying tree debris and blocks up to 2 m in diameter.
Activity during September 2017. Lahars were reported in the Santa Teresa and El Mineral drainages intermittently during September. Ash emissions continued to cause ashfall in communities within 10 km W and SW throughout the month. Continuous ejection of incandescent blocks rose 200-300 m above the crater and sent material 300 m down the flanks. The Washington VAAC reported a continuous plume of ash detected in satellite imagery and in the webcam extending about 95 km WSW on 8 September at 4.6 km altitude. INISVUMEH reported that the increase in activity during 8 September fed a lava flow that traveled 800 m down Barranca Seca.
The ninth eruptive episode of 2017 began late on 12 September and lasted about 35 hours (figure 79). Pyroclastic flows descended the Seca (Santa Teresa) ravine on the W flank, along with a lava flow that traveled 1.3 km during the episode. Ashfall was reported in Morelia, Palo Verde Estate, Sangre de Cristo, El Porvenir, Santa Sofía, and Panimaché I and II. The Washington VAAC reported that an ash plume extended about 65 km N from the summit on 13 September at 4.6 km altitude. After several days of weather clouds obscuring the satellite images, they reported a plume drifting W on 17 September extending 95 km from the summit. A hotspot intermittently appeared during 13-17 September.
The Washington VAAC reported weak puffs of ash drifting N and quickly dissipating on 25 September, and another ash plume extending 15 km W on 28 September at 4.6 km. Hotspots were also observed both days in satellite images. INSIVUMEH reported eruptive episode 10 during 27-28 September, lasting about 40 hours. The ash plume generated during the episode drifted in multiple directions simultaneously (figure 80) and resulted in ashfall more than 30 km from the crater, primarily N and NE, in La Soledad (7 km N), Pastores (20 km NNE), San Miguel Dueñas (10 km NE) and Antigua Guatemala (20 km NE). The incandescent material reached 300 meters above the crater and fed two lava flows, the first went 300 m down the Seca Canyon, and the second traveled 500 m down Las Lajas Canyon.
Seven lahars were recorded during September in the main ravines of Fuego, on days 3, 4, 5, 6, 8, 27, and 29, as a result of the unusually large amount of rainfall during the month (1,059 mm) (figure 81). The larger ones at the beginning of the month contained blocks up to 3 m in diameter, and many were warm enough to generate steam with strong odors of SO2. Several roads were damaged.
Activity during October 2017. Overall activity was quieter during October 2017. Background levels of activity included incandescent material rising up to 250 m above the summit and falling a similar distance down the flanks, and ash plumes rising to 4.4-5.0 km altitude and drifting more than 25 km W, NW, and E. Eight to twelve explosions per hour were not uncommon, although 4-6 per hour were more typical. A few of the block avalanches traveled 2 km down the flanks. The communities that experienced persistent ashfall were all located 10-20 km SW, and included Morelia, Palo Verde Farm, Sangre de Cristo, El Porvenir, Santa Sofía, and Panimaché I and II. Due to the wind conditions and increased activity during the first week of October, ashfall was also reported farther away in Guatemala City (40 km NE), Antigua Guatemala, Villa Nueva (30 km ENE) and San Miguel Petapa (35 km ENE). INSIVUMEH reported three increases in explosive activity during the month on 2, 3, and 5 October, but they did not develop into eruptive episodes.
Four lahars were reported on 1, 2, and 4 October in the Seca and Mineral drainages. They carried blocks of volcanic rocks and debris as large as 3 m in diameter and were 6-12 m wide and 1-2 m deep. The Washington VAAC reported a series of explosions on 4 October, after which ash emissions were seen in multispectral imagery at 5.2 km altitude drifting SW that reached as far as 75 km. They reported occasional puffs of ash on 15 October extending up to 95 km W of the summit. By 17 October, imagery showed continuous emissions with an ash plume extending 95 km SSW from the summit before dissipating. A possible ash plume was reported by the Washington VAAC on 31 October extending 45 km W from the summit at 4.3 km altitude.
Activity during November 2017. There were numerous periods of intermittent ash emissions during November. Continuous emissions often drifted 65-100 km or more SW or W at altitudes around 4.6-5.2 km during periods of activity. INSIVUMEH reported that during 2-3 November tremor at Fuego increased. Explosions during the first week averaged 5-8 per hour and ash plumes rose as high as 1.3 km above the crater. Incandescent material was ejected 300 m above the crater, causing avalanches that were confined to the crater. The 11th eruptive episode in 2017 began on 5 November and lasted for two days. Lava flowed 1-1.2 km W down the Seca drainage and 800 m SSW down the Ceniza drainage. Avalanches of material from the ends of the lava flows descended the flanks and reached vegetated areas.
Ashfall was reported in areas downwind in the communities 8-12 km SW including Morelia, Santa Sofia, Palo Verde Farm, and Panimaché I and II throughout the month. Shockwaves from explosions often rattled windows and roofs around the volcano. Avalanche blocks were reported in the Cenizas, Trinidad, Taniluyá and Seca canyons. Multiple VAAC reports were issued on 25 days of November, and multiple daily MODVOLC thermal alerts were issued on 20 days of the month. On 10 November the emissions extended about 275 km WSW from the summit. A lahar during the third week descended the Seca and el Mineral drainages.
Activity during December 2017. Explosions averaged 4-8 per hour during most of December sending incandescent material 200-250 m above the crater. INSIVUMEH reported that the 12th eruptive episode at Fuego in 2017 began on 10 December and, based on seismicity, lasted for about 36 hours. Ash plumes from moderate-to-strong explosions rose as high as 1.2 km above the crater rim and drifted 20 km S and SW. Lava flowed as far as 1.5 km W down the Seca (Santa Teresa), SW down the Taniluyá, and SSW down the Ceniza ravines. Ash fell many times in the communities of La Rochela, San Andrés Osuna, Morelia, and Panimaché I and II. On 12 December there was an average of 10 explosions per hour, generating avalanches in the Ceniza and Taniluyá drainages and ashfall in nearby areas. Ashfall was also reported in San Miguel Dueñas, Alotenango, and Ciudad Vieja (13.5 km NE) on 14 December.
Multiple MODVOLC thermal alerts appeared on 20 days during December, and the Washington VAAC issued 91 reports of continuous or intermittent ash plume activity. During eruptive episode 12 on 11 December, they reported an intense hot spot seen at the crater in satellite imagery despite meteoric cloud cover. For most of the second half of December, either continuous or intermittent ash emissions drifted 100-150 km WNW from the summit before dissipating. The Washington VAAC reported an ash emission on 20 December drifting WNW at 5.8 km altitude that extended over 300 km from the summit. A remnant of the plume was observed almost 450 km away late on 20 December before dissipating. Plumes were repeatedly observed over 200 km from the summit during 20-25 December.
Geologic Background. Volcán Fuego, one of Central America's most active volcanoes, is also one of three large stratovolcanoes overlooking Guatemala's former capital, Antigua. The scarp of an older edifice, Meseta, lies between Fuego and Acatenango to the north. Construction of Meseta dates back to about 230,000 years and continued until the late Pleistocene or early Holocene. Collapse of Meseta may have produced the massive Escuintla debris-avalanche deposit, which extends about 50 km onto the Pacific coastal plain. Growth of the modern Fuego volcano followed, continuing the southward migration of volcanism that began at the mostly andesitic Acatenango. Eruptions at Fuego have become more mafic with time, and most historical activity has produced basaltic rocks. Frequent vigorous eruptions have been recorded since the onset of the Spanish era in 1524, and have produced major ashfalls, along with occasional pyroclastic flows and lava flows.
Information Contacts: Coordinadora Nacional para la Reducción de Desastres (CONRED), Av. Hincapié 21-72, Zona 13, Guatemala City, Guatemala (URL: http://conred.gob.gt/www/index.php ); Instituto Nacional de Sismologia, Vulcanologia, Meteorologia e Hydrologia (INSIVUMEH), Unit of Volcanology, Geologic Department of Investigation and Services, 7a Av. 14-57, Zona 13, Guatemala City, Guatemala (URL: http://www.insivumeh.gob.gt/ ); MIROVA (Middle InfraRed Observation of Volcanic Activity), a collaborative project between the Universities of Turin and Florence (Italy) supported by the Centre for Volcanic Risk of the Italian Civil Protection Department (URL: http://www.mirovaweb.it/); Hawai'i Institute of Geophysics and Planetology (HIGP), MODVOLC Thermal Alerts System, School of Ocean and Earth Science and Technology (SOEST), Univ. of Hawai'i, 2525 Correa Road, Honolulu, HI 96822, USA (URL: http://modis.higp.hawaii.edu/).
Sheveluch (Russia) — February 2018 Cite this Report
Sheveluch
Russia
56.653°N, 161.36°E; summit elev. 3283 m
All times are local (unless otherwise noted)
Ash explosions, pyroclastic flows, and lava dome growth continue through January 2018
An eruption at Sheveluch has been ongoing since 1999, and volcanic activity was previously described through August 2017 (BGVN 42:08). Ongoing activity consists of pyroclastic flows, explosions, and lava dome growth with a viscous lava flow in the N. Strong fumarole activity, ash explosions, hot avalanches and incandescence from the dome accompany this process. Explosions and ash flows were reported by Kamchatka Volcanic Eruption Response Team (KVERT) during the August 2017 through January 2018 period.
During this report period the Aviation Color Code (ACC) remained at Orange (the second highest level on a four-color scale), except for 10 January 2018 when it was briefly elevated to Red (highest level) and lowered back to Orange later the same day. Satellite infrared data also showed increased activity on this day. Ash plume altitudes ranged from a low of 5 km to a high of 11 km on 10 January 2018. The farthest lateral extent of the ash plume was reported at 990 km to the NE on 8 November 2017.
On 4 and 8 August 2017 large ash clouds reached altitudes of 6.5 km and approximately 10 km, respectively. Ashfall was reported in Klyuchi Village (50 km SW) on 8 August and drifted about 180 km E, NW, and NE during 12 and 15-16 August. On 7 September ash plumes rose to 8-10 km altitude and drifted NE, SE, and S; another ash plume was photographed on 8 September (figure 47). On 15-22 September ash plumes rose to 9-10 km altitude and drifted about 400 km NW, E, and SE. Explosions on 10 October generated ash plumes to 10 km altitude and drifted about 250 km N (figure 48). Plumes comprised of re-suspended ash drifted about 350 km SE on 12 October and about 230 km SE on 13 October.
Explosions on 2 and 8 November generated ash plumes that rose to an altitude of 8 km and drifted approximately 990 km NE. Weather prevented observations on the other days from 4-10, 12-17, and 19-24 November. A strong explosive event on 5 December generated ash plumes that rose to altitudes of 10.5 km and 5 km and drifted NE and E, respectively. Explosions on 26 December generated an ash plume that rose to an altitude of 8 km and drifted about 300 km NE.
On 10 January 2018 satellite images captured an ash cloud with a dimension of 192 x 132 km drifting 230 km NE from explosions rising to altitudes of 10-11 km. In response, KVERT raised the ACC to Red. Later that same day, satellite images showed the ash cloud expanded to 350 x 180 km in dimension and had drifted 400 km E; the ACC was lowered back to Orange. The 10 January explosions began at 1035 with resulting ash that drifted about 900 km E during 10-11 January.
Thermal anomalies. As reported by KVERT, satellite imagery continue to detect the existence of a thermal anomaly over Sheveluch. The anomaly was reported on 10-30 days every month from August 2017 through January 2018. Detections of the thermal anomaly were lower in certain months because cloudy conditions obscured satellite imagery. The MIROVA system detected numerous hotspots every month during August 2017-January 2018, most of which were about 5 km or less from the summit with mainly low to a few high power signatures in August, September 2017 and January 2018. Thermal anomalies based on MODIS satellite instruments analyzed using the MODVOLC algorithm were detected in 11-12 August 2017 and 10 January 2018 corresponding to the explosive eruptions on those days.
Geologic Background. The high, isolated massif of Sheveluch volcano (also spelled Shiveluch) rises above the lowlands NNE of the Kliuchevskaya volcano group. The 1,300 km3 andesitic volcano is one of Kamchatka's largest and most active volcanic structures, with at least 60 large eruptions during the Holocene. The summit of roughly 65,000-year-old Stary Shiveluch is truncated by a broad 9-km-wide late-Pleistocene caldera breached to the south. Many lava domes occur on its outer flanks. The Molodoy Shiveluch lava dome complex was constructed during the Holocene within the large open caldera; Holocene lava dome extrusion also took place on the flanks of Stary Shiveluch. Widespread tephra layers from these eruptions have provided valuable time markers for dating volcanic events in Kamchatka. Frequent collapses of dome complexes, most recently in 1964, have produced debris avalanches whose deposits cover much of the floor of the breached caldera.
Information Contacts: Kamchatka Volcanic Eruptions Response Team (KVERT), Far East Division, Russian Academy of Sciences, 9 Piip Blvd., Petropavlovsk-Kamchatsky, 683006, Russia (URL: http://www.kscnet.ru/ivs/kvert/); Institute of Volcanology and Seismology, Far Eastern Branch, Russian Academy of Sciences (IVS FEB RAS), 9 Piip Blvd., Petropavlovsk-Kamchatsky 683006, Russia (URL: http://www.kscnet.ru/ivs/eng/); Hawai'i Institute of Geophysics and Planetology (HIGP) - MODVOLC Thermal Alerts System, School of Ocean and Earth Science and Technology (SOEST), Univ. of Hawai'i, 2525 Correa Road, Honolulu, HI 96822, USA (URL: http://modis.higp.hawaii.edu/); MIROVA (Middle InfraRed Observation of Volcanic Activity), a collaborative project between the Universities of Turin and Florence (Italy) supported by the Centre for Volcanic Risk of the Italian Civil Protection Department (URL: http://www.mirovaweb.it/).
Stromboli (Italy) — February 2018 Cite this Report
Stromboli
Italy
38.789°N, 15.213°E; summit elev. 924 m
All times are local (unless otherwise noted)
Moderate increase in thermal energy and explosion rate, April-August 2017
Confirmed historical eruptions at Italy's Stromboli volcano go back 2,000 years as this island volcano in the Tyrrhenian Sea has been a natural beacon for eons with its near-constant fountains of lava. Eruptive activity at the summit consistently occurs from multiple vents at both a north crater area (N Area) and a southern crater group (S or CS Area) on the Terrazza Craterica at the head of the Sciara del Fuoco, a large scarp that runs from the summit down the NW side of the island (figures 102 and 103). Thermal and visual cameras placed on the nearby Pizzo Sopra La Fossa monitor activity at the Terrazza Craterica. Eruptive activity continued at low to moderate levels during 2015 and 2016, with intermittent periods of frequent explosions from both crater areas that sent ash, lapilli, and bombs across the Terrazza Craterica and onto the head of the Sciara del Fuoco (BGVN 42:07).
This report covers activity from January-October 2017. Activity similar to 2016 continued through March 2017 when an increase began in explosion rates. The increase peaked during June and then declined through August, returning to background levels in September (figures 104). Thermal energy increased beginning in early May and lasted through mid-August (figure 105). Multiple MODVOLC thermal alerts were issued for Stromboli between 4 May and 25 August 2017. Weekly reports of activity were provided by the Instituto Nazionale de Geofisica e Vulcanologia (INGV), Sezione de Catania, which monitors the gas geochemistry, deformation, and seismology, as well as the surficial activity.
Activity during January 2017 consisted of low to moderate intensity explosions from the southern crater area (S Area), and low intensity explosions at the northern crater area (N Area). Two vents in the S Area generated explosive activity. Modest explosions with ash and lapilli occurred regularly from the southernmost vent, and rare explosions were observed from the northernmost vent (figure 106). At the northern crater area (N Area) the southern vent was active, generating ash and lapilli that was ejected a few tens of meters from the vent. There were no explosions from the northern vent in the N Area.
There were no notable changes in activity until the second week of February 2017 when explosive activity returned to the northern vent of the N Area. During the third week of February, a gradual increase in the rate and intensity of the explosions at both areas was observed which lasted throughout the rest of the month (figure 107). Coarse pyroclastic material was ejected onto the Terrazza Craterica and occasionally onto the Sciara del Fuoco. The stronger explosions generated modest plumes of dilute ash that quickly dissipated.
During the first week of March 2017, the most active vents were the southernmost vent of the S Area and the northernmost vent of the N Area. The strongest explosions from the northern vent of the N Area produced dilute ash emissions and pyroclastic ejecta that landed on the upper part of the Sciara del Fuoco. By the third week of March, and through the end of the month, most of the activity had shifted to the vents in the N Area and diminished in the S Area. On 28 March, Etna Observatory personnel restored operations at both the infrared and visible cameras on the Pizzo sopra la Fossa which allowed for more detailed observations of the activity at the summit (figure 108).
Throughout April 2017, the N1 vent produced low (less than 80 m high) to medium (80-150 m) intensity explosions containing ash, lapilli, and bombs. The N2 vent showed sporadic low intensity explosive activity with occasional ash emissions until 20 April when more coarse (lapilli and bombs) material was ejected. Vent C showed continuous degassing throughout the month, and low intensity explosions began there during the third week of April, causing intense spattering on 29 April. The S1 vent showed sporadic and weak explosive activity of low intensity with the ejection of coarse material until the third week when activity ceased. Vent S2 showed explosive activity of medium-low intensity (less than 120 m high) of coarse material sometimes mixed with ash. Explosion rates were around 2-10 events per hour during the first half of the month, rising to 10-15 per hour for the second half of April.
In the N Area, the N1 and N2 vents continued with a similar level of activity throughout May 2017 (figure 109). Explosions of low to medium intensity sent coarse ejecta of lapilli and bombs up to 150 m high at N1 and 120 m high at N2. The rate of explosions in the N Area ranged from 4-12 per hour.
In the S Area, activity was more variable during May, and the rate of explosions ranged from 2-10 per hour. Vent C also continued with intense degassing and low-intensity explosions and spattering. On 13 May, two emission points were observed at vent C, one a few meters S of the other. Vent S1 showed no activity until late in the second week of May when low to moderate intensity explosions rose up to 150 m with coarse ejecta. During 14-15 May, a second vent opened a few meters north of S1, and simultaneous explosions from both S1 vents sent jets of gas and incandescent material into the air. Activity decreased to low intensity explosions (less than 80 m high) with ejecta during the third week, but then increased significantly during the last week of the month. Ejecta reached 200 m high from the S1 vents (figure 110). The southern S1 vent built a surrounding hornito and produced high and narrow jets of incandescent material, while the northern emission point produced more modest jets of gas and material. Vent S2 was quiet for most of May, producing only low-intensity explosions of coarse material sometimes mixed with ash for a few days near the beginning of the month.
An increase in activity during June 2017 was apparent at both the N and S Areas (figure 111). Video taken by drone and from the summit during 10-12 June shows periodic explosions with ash, lapilli, and bombs ejected around the Terrazza Craterica (See Information Contacts for link). Vent N1 was characterized by low to medium-high intensity explosive activity that ejected lapilli and bombs to 200 m and was sometimes accompanied by ash that drifted S over the island. N2 also showed variable activity which ranged from low to high intensity (ejecta rising over 200 m high) during the first week, and low to medium-high (ejecta rose to 150 m) for the rest of the month (figure 112). Numerous bombs and lapilli were deposited both inside and outside the crater rim. Intense spattering was reported at N2 on 11, 12, 18, 19, and 26 June. The explosion rate in the N Area was 9-18 per hour.
In the CS Area, sporadic low-intensity explosions (less than 80 m high) characterized vent C, with modest spattering reported on 11, 12, 13, 26, 30 June 2017. Activity at S1 continued from two vents simultaneously with low to medium intensity explosive activity (figure 113 and 114). The vent at S2 reactivated briefly on 3 June after about a month of quiet with weak spattering activity but was not active again during the month. The CS Area was characterized by an explosion frequency of 1-10 per hour.
During July 2017, thermal activity at the vents remained moderate to high; explosions at the N1 vent sent lapilli and bombs, sometimes mixed with ash, to 200 m above the vent. At vent N2, lapilli and bombs were ejected outside the crater rim, sometimes rolling down the Sciara del Fuoco to the ocean. The hourly frequency of explosions ranged from 5-18. At S1, both vents exploded simultaneously with lapilli, bombs and occasional ash rising to 150 m numerous times.
Beginning in the afternoon of 26 July, an explosive sequence at the CS Area lasting about 90 seconds was recorded with the thermal and visible image cameras on the Pizzo sopra la Fossa (figure 115). It began with explosions from vents C and S1, followed by a second explosion at S2. More explosions from C and S1 sent debris to the SE and were followed by fountaining to about 50 m from the vents for about a minute. INGV personnel witnessed 10-cm-diameter bombs on the SW side of the Pizzo at about 850 m elevation during a 30 July site visit.
A return to background activity during August consisted of explosions of varying intensity from low (less than 80 m) to medium-low (ejecta sometimes reached 120 m in height) at both the N and CS Area vents. Explosion frequency ranged from 2-11 per hour, decreasing significantly by the end of the month. Activity continued to diminish during September. Periodic spattering from vent C occurred. Only one vent was active in the CS Area during the month. A brief increase in intensity at vent N1 during 8-9 September sent ejecta over 150 m high. By the end of September, few explosions reached over 80 m in height. A brief episode of intense spattering at vent C on 24 September sent bombs and lapilli to 40 m above the vent. Explosion frequency averaged only 2-6 per hour by the end of September.
Continuous spattering, occasionally intense, from vent C continued during October. The vents in the N Area produced low to moderate intensity explosions, and one vent in the CS Area produced low intensity explosions. A strong explosive sequence in the CS Area lasted for about five minutes on 23 October 2017 (figure 116). The first explosion of the sequence came from vent C and lasted 30 seconds. It destroyed the hornito formed around the vent. About a minute later, two explosions occurred at the S1 vent, reaching about 120 m in height and dispersing to the SE. Another explosion at vent C about 3 minutes later sent ejecta 100 m high. The event ended with a series of small ash emissions that rose a few tens of meters. Low intensity activity continued from both areas through the end of October, with low explosion rates of around 2-6 per hour.
Geologic Background. Spectacular incandescent nighttime explosions at Stromboli have long attracted visitors to the "Lighthouse of the Mediterranean" in the NE Aeolian Islands. This volcano has lent its name to the frequent mild explosive activity that has characterized its eruptions throughout much of historical time. The small island is the emergent summit of a volcano that grew in two main eruptive cycles, the last of which formed the western portion of the island. The Neostromboli eruptive period took place between about 13,000 and 5,000 years ago. The active summit vents are located at the head of the Sciara del Fuoco, a prominent scarp that formed about 5,000 years ago due to a series of slope failures which extends to below sea level. The modern volcano has been constructed within this scarp, which funnels pyroclastic ejecta and lava flows to the NW. Essentially continuous mild Strombolian explosions, sometimes accompanied by lava flows, have been recorded for more than a millennium.
Information Contacts: Istituto Nazionale di Geofisica e Vulcanologia (INGV), Sezione di Catania, Piazza Roma 2, 95123 Catania, Italy, (URL: http://www.ct.ingv.it/en/); MIROVA (Middle InfraRed Observation of Volcanic Activity), a collaborative project between the Universities of Turin and Florence (Italy) supported by the Centre for Volcanic Risk of the Italian Civil Protection Department (URL: http://www.mirovaweb.it/); Hawai'i Institute of Geophysics and Planetology (HIGP), MODVOLC Thermal Alerts System, School of Ocean and Earth Science and Technology (SOEST), Univ. of Hawai'i, 2525 Correa Road, Honolulu, HI 96822, USA (URL: http://modis.higp.hawaii.edu/); Martin Rietze, Taubenstr. 1, D-82223 Eichenau, Germany (URL: https://mrietze.com/, https://www.youtube.com/channel/UC5LzAA_nyNWEUfpcUFOCpJw/videos, http://mrietze.com/web16/Stromb_Vesuv17.htm).
Tinakula (Solomon Islands) — February 2018 Cite this Report
Tinakula
Solomon Islands
10.386°S, 165.804°E; summit elev. 796 m
All times are local (unless otherwise noted)
Short-lived ash emission and large SO2 plume 21-26 October 2017; historical eruption accounts
Remote Tinakula lies 100 km NE of the Solomon Trench at the N end of the Santa Cruz Islands, part of the country of the Solomon Islands, which generally lie 400 km to the W. It has been uninhabited since an eruption with lava flows and ash explosions in 1971 when the small population was evacuated (CSLP 87-71). The nearest inhabitants live on Te Motu (Trevanion) Island (about 30 km S), Nupani (40 km N), and the Reef Islands (60 km E); they occasionally report explosion noises from Tinakula. Ashfall from larger explosions has historically reached these islands. The last reported evidence of activity came from MODVOLC thermal alerts between August 2010 and October 2012, and observations of incandescent lava blocks rolling into the sea in May 2012. A new eruptive episode with a large ash explosion and substantial SO2 plume during 21-26 October 2017 is reported below, along with newly available historical newspaper accounts of earlier eruptions.
Reports of ash plumes are issued by the Wellington Volcanic Ash Advisory Center (VAAC); the National Disaster Management Office (NDMO) of the Solomon Islands Government also issues situation reports when significant activity is reported. Satellite data from infrared, visual, and SO2 monitoring instruments are an important source of information for this remote volcano. News reports from local (and social) media are often the only sources of information for the smaller events. Recently identified 19th- and 20th-century newspaper accounts of eruptive activity witnessed by sailors passing nearby is a valuable new resource for previously unreported events.
Eruption of 21-26 October 2017. Reports of a substantial explosion with an ash plume from Tinakula appeared on social media and in the local press during 22-26 October 2017. Staff from the Lata Met Service Office approached the island by boat on 23 October to make direct observations (figures 17-19). A video clip from the Himawari8 Satellite showing the ash plume explosion was posted by Stephan Armbruster on Twitter on 22 October. The Solomon Islands NDMO issued a situation report on 26 October showing ashfall covering vegetation on the island. According to the NDMO, ashfall was concentrated on the island, although a small amount of ash drifted SE and was reported to briefly contaminate drinking water in several communities in the nearby Reef Islands (60 km ENE) . Ashfall was also reported on Fenualoa Island (50 km ENE) (Radio New Zealand). The eruption was categorized by NMDO as a VEI 3. A team of geologists from NDMO brought seismic monitoring equipment to Tinakula in early November, and measured a high frequency volcanic tremor on 5 November 2017.
The Wellington VAAC first reported an ash plume visible in satellite imagery shortly after midnight (UTC) on 21 October 2017. The plume was estimated to be at 4.6 km altitude and drifting N. About 90 minutes later they reported a second eruption with a much higher plume drifting SE at 10.7 km altitude using IR imagery cloud top temperatures to estimate the altitude. They reported ongoing ash emissions visible in satellite imagery drifting SE at 6.1 km altitude throughout the morning, dropping to 3 km altitude by the end of the day. The following day, 22 October, intermittent ash emissions were reported at 3.7 km altitude moving E. By that afternoon, they had dropped to 2.4 km, and had lowered to 1.8 km by late on 23 October. Ongoing low-level ash emission (2.1 km altitude) continued through 25 October; by early on 26 October, there was no further evidence of ongoing activity.
No MODVOLC thermal alerts were associated with this event, but there was a brief MIROVA signal from the MODIS infrared data during 20-23 October 2017 (figure 20). A major SO2 plume was released from Tinakula on 21 October, and a smaller one was recorded on 28 October as well (figure 21).
Summary of activity during 1971-2012. After the 1971 eruption, intermittent ash emissions, lava bombs, and pyroclastic flows were reported by geologists and sailors passing nearby in 1984, 1985, 1989-1990, 1995, and 1999. Infrared MODIS thermal data was first reported as MODVOLC thermal alerts beginning in 2000 and has provided satellite-based confirmation of thermal activity since then. Months with thermal activity included February 2000-May 2001, February 2006-November 2007, September-November 2008, August 2009, and January 2010-October 2012 (figure 22). No additional thermal alerts were issued through 2017. Since 2004, SO2 data has been gathered by satellite instruments and processed by NASA Goddard Space Flight Center; in February and April 2006 small SO2 plumes were recorded (figure 23).
Eruption reports during 1868-1932. Reports of eruptions at Tinakula between 1868 and 1932 have recently been found in 19th and 20th century newspaper accounts from Australia and New Zealand (table 6). The accounts describe incandescence, water discoloration of the sea, explosions, ash plumes, and lava flows extending from the summit to the ocean.
Table 6. Newly discovered historical newspaper accounts of volcanic activity from ships passing near Tinakula between 1868 and 1932. This is not a full eruptive history for the time period. Online links provided in the References section. Courtesy of Steve Hutcheon.
| Date |
Account |
Reference |
| 17 Oct 1868 |
Passed Volcano Island, one of the South (sic) Cruz group, on the 17th of October. It was then in active operation, vomiting forth immense volumes of fire and smoke. Note; Volcano Island is another name for Tinakula. |
The Age, Melbourne, 10 November 1868, page 2b; also in The Argus, Melbourne, 10 November 1868, page 4b |
| 9 Oct 1869 |
On the 9th October sighted three low islands, also Volcano Island; the discharge from the latter was plainly visible. |
The Empire, Sydney, 27 October 1869, page 2a |
| 29/30 Nov 1871 |
During the night, the active volcano, Tinakula, was passed. Large masses of red hot lava were emitted; and the sight is described as being very imposing and grand. |
The Sydney Morning Herald, 19 February 1872, page 6a |
| 20 Jun 1887 |
When his vessel was off the Santa Cruz group Mount Tinakula became an active volcano. It broke out at 4 o'clock on the morning of June 20 and viewed from the ship's deck presented a most grand spectacle. The water for miles round was of a pea green color and had the appearance of being very shallow. |
The Daily Telegraph, Sydney, NSW, 20 July 1887, page 4f |
| ~23 Aug 1910 |
Tinakula Island was found to be in an active state of eruption, and presented a fine sight. The ship Tambo departed Tarawa 19 August and arrived in Sydney on 31 August 1910. |
The Daily Telegraph, Sydney, NSW, 1 September 1910, page 7a |
| 2/3 May 1932 |
The steamer passed within half a mile of the active volcano of Tinakula. It was at night, and the passengers obtained a remarkable view of the red hot lava streams flowing from the summit, which is 2000 ft. high, to the water's edge. Three eruptions occurred while the vessel was within view of the island, each preceded by an explosion which sounded like thunder. |
The New Zealand Herald, Auckland, NZ, 27 June 1932, page 6a; The Auckland Star, 10 September 1932 page 1h (Supplement) |
References. The Age (Melbourne, Victoria) 10 November 1868, page 2b (URL: http://nla.gov.au/nla.news-article177002744).
The Empire (Sydney, NSW) 27 October 1869, page 2a, (URL: http://nla.gov.au/nla.news-article60895166).
The Sydney Morning Herald (NSW) 19 Februay 1872, page 6a (URL: http://nla.gov.au/nla.news-article13252748).
The Daily Telegraph (Sydney, NSW) 1887 20 July, page 4f (URL: http://nla.gov.au/nla.news-article239817295).
The Daily Telegraph (Sydney, NSW) 1 September 1910, page 7a (URL: http://nla.gov.au/nla.news-article237993807; http://nla.gov.au/nla.news-article15183461 ).
The New Zealand Herald (Auckland, NZ) 27 June 1932, page 6a (URL: https://paperspast.natlib.govt.nz/newspapers/NZH19320627.2.19 ).
The Auckland Star (NZ) 10 September 1932, page 1h (Supplement) (URL: https://paperspast.natlib.govt.nz/newspapers/AS19320910.2.180.6 ).
Geologic Background. The small 3.5-km-wide island of Tinakula is the exposed summit of a massive stratovolcano at the NW end of the Santa Cruz islands. It has a breached summit crater that extends from the summit to below sea level. Landslides enlarged this scarp in 1965, creating an embayment on the NW coast. The Mendana cone is located on the SE side. The dominantly andesitic volcano has frequently been observed in eruption since the era of Spanish exploration began in 1595. In about 1840, an explosive eruption apparently produced pyroclastic flows that swept all sides of the island, killing its inhabitants. Recorded eruptions have frequently originated from a cone constructed within the large breached crater. These have left the upper flanks and the steep apron of lava flows and volcaniclastic debris within the breach unvegetated.
Information Contacts: National Disaster Management Office (NDMO), Solomon Islands Government, Prince Philip Highway, Ranadi, Solomon Islands (URL: http://www.ndmo.gov.sb); Wellington Volcanic Ash Advisory Centre (VAAC), Meteorological Service of New Zealand Ltd (MetService), PO Box 722, Wellington, New Zealand (URL: http://www.metservice.com/vaac/, http://www.ssd.noaa.gov/VAAC/OTH/NZ/messages.html); Hawai'i Institute of Geophysics and Planetology (HIGP), MODVOLC Thermal Alerts System, School of Ocean and Earth Science and Technology (SOEST), Univ. of Hawai'i, 2525 Correa Road, Honolulu, HI 96822, USA (URL: http://modis.higp.hawaii.edu/); MIROVA (Middle InfraRed Observation of Volcanic Activity), a collaborative project between the Universities of Turin and Florence (Italy) supported by the Centre for Volcanic Risk of the Italian Civil Protection Department (URL: http://www.mirovaweb.it/); NASA Goddard Space Flight Center (NASA/GSFC), Global Sulfur Dioxide Monitoring Page, Atmospheric Chemistry and Dynamics Laboratory, 8800 Greenbelt Road, Goddard, Maryland, USA (URL: http://so2.gsfc.nasa.gov/index.html ); Radio New Zealand (URL: http://www.radionz.co.nz/international/pacific-news/342267/solomons-pm-calls-for-calm-in-communities-close-to-volcano); Solomon Islands Broadcasting Corporation, SIBC Voice of the Nation, Honiara, Solomon Islands (URL: http://www.sibconline.com.sb/no-its-not-snow-in-the-solomons-its-ash-from-the-tinakula-volcano/); Andy Prata, AIRES Atmospheric Industrial Research and Environmental Solutions, Melbourne, Australia (URL: https://www.aires.space/, https://twitter.com/andyprata/status/922177129944625157); Gamara Okzman Bencarson, Facebook.
Tungurahua (Ecuador) — February 2018 Cite this Report
Tungurahua
Ecuador
1.467°S, 78.442°W; summit elev. 5023 m
All times are local (unless otherwise noted)
Ash emissions, explosions, and pyroclastic flows 26 February-16 March 2016; no further activity through 2017
Episodic eruptive activity at Ecuador's Tungurahua has persisted since November 2011. Periods of activity over several weeks that included ash plumes, Strombolian activity, pyroclastic flows, and lava flows were often followed by quiescence for a similar time span. This type of activity continued throughout 2015 (BGVN 42:08, 42:12); Strombolian activity, significant ash emissions, and SO2 plumes in mid-November 2015 marked the last significant activity for that year. The next episode began in late February 2016 and is discussed below with information provided by the Observatorio del Volcán Tungurahua (OVT) of the Instituto Geofísico (IG-EPN) of Ecuador, aviation alerts from the Washington Volcanic Ash Advisory Center (VAAC), and other sources of satellite data.
The latest eruptive episode at Tungurahua lasted from 26 February-16 March 2016. Multiple explosions with ash plumes that rose 3-8 km were frequent. Incandescent blocks were ejected up to 1,500 m down most flanks. Pyroclastic flows affected many of the ravines, although no communities reported damage. Significant SO2 emissions were recorded by satellite data between 27 February-8 March. An inflationary trend was recorded from early March through late September 2016, after which a period of deflation began. Tungurahua had occasional seismic swarms after the eruption, but no reported surface activity for the remainder of 2016 and 2017.
IG reported an ash emission on 5 January 2016 that rose 2 km above the crater and drifted NE, causing minor ashfall in the Pondoa and Bilbao sectors. Otherwise, no volcanic activity was reported until a new episode began on 26 February 2016 with a seismic swarm followed by a series of explosions and ash plumes that rose 3-8 km above the crater (figures 96 and 97). Incandescent blocks were ejected up to a kilometer down the NW, W, and SW flanks (figure 98). Pyroclastic flows were also generated that descended through the gorges of Juive, La Hacienda, Mandur and Cusúa, reaching distances of 500-1,500 m (figure 99).
Continuous emissions with low to moderate ash content drifted W and SW on 27 February. The communities most affected by ashfall were Choglontus, Cotaló, El Manzano, Palitahua, Bilbao, Pillate, Juive, Ambato, Tisaleo, Riobamba, and Quero. The ash was mostly fine-grained, except in the area near Pillate and Choglontus, where the grain size reached up to 3 mm and consisted of reddish, black, gray, and beige fragments (figure 100). On the morning of 1 March 2015, several pyroclastic flows were observed descending through the Juive, Mandur, Achupashal, La Hacienda, and Romero ravines; they traveled 1.5-1.7 km (figure 101).
Ash emissions were constant throughout the first week in March (figures 102 and 103). During 1-5 March they drifted NW, SW and E, with ashfall reported in the towns of Pillate, Manzano, Choglontus, Palictahua and El Altar (figure 104). Incandescent blocks descended most of the flanks (figure 105). Beginning on 6 March, plumes drifted SW and S, with variable ash content. Pyroclastic flows along the W and NW flanks descended the Cusua, Juive, Mandur, Ashupashal, Romero, and Rhea drainages (figure 106), the farthest traveled went 2.2 km down the Ashupashal on 7 March. In addition to ash and other explosive debris, daily sulfur dioxide emissions were identified from 27 February-8 March 2016 by the OMI instrument on the Aura satellite (figure 107).
Beginning on 28 February, a strong inflationary trend (almost 3 cm) was observed in the GPS data at the Mazón (SW flank) station. Three inclinometers on the NW flank also indicated inflation during 28 February-4 March.
Episodic explosions on 8 March 2016 produced plumes with high ash contents that rose 6 km. Small pyroclastic flows descended the NW flank in the Mandur, Rea, Achupashal, and La Hacienda ravines. Sporadic emissions continued for most of the second week of March, with varying ash contents, reaching between 1.5 and 4 km above the crater and drifting to the SSW. Reports of ashfall were received in the sectors of Choglontús, Manzano, Pillate, El Altar, and Palitahua, and minor ashfall in Juive and Cusúa. Several ash plumes (figure 108) and a small pyroclastic flow were observed on 13 March 2016. The Manzano lookout reported loud noises on 14 March, and ashfall in the afternoon, but weather obscured views of emissions. Rainy weather on 16 March also obscured views, but Manzano, Chacauco, Cusúa, and Juive lookouts reported ashfall and explosions. There were no further reports from the observatory of ash emissions, ashfall, or explosions; only minor steam plumes were observed on clear days after 16 March 2016.
The Washington VAAC reported possible ash emissions on 31 March 2016, but information from OVT indicated no surface activity. Intense rain on 28 March generated a small lahar that descended through the La Pampa ravine. Significant rainfall on 2 April caused lahars to affect Vazcun, Juive, Pondoa, Bilbao, Achupashal, Chontapamba and Malpayacu drainages. Seismicity continued to decrease throughout April 2016. A small swarm of Long Period seismic events (LP's) occurred between 1 and 20 May that were associated with fluid movements. The Washington VAAC reported ash emissions on 3, 8, and 13 May, but OVT reported no surface activity during the entire month (figure 109).
In a Special Report released on 2 June 2016, IG-EPN noted a clear inflationary trend in data collected from two stations at Tungurahua since the end of the eruption in mid-March. The Retu inclinometer, located N of the crater, showed inflation on the radial axis of about 600 μrad (microradians), and about 200 μrad on the tangential axis. The same axis at the Mandur inclinometer (on the NW flank) had a smaller but distinct (~30 μrad) inflationary signal (figure 110).
A Washington VAAC report on 1 June 2016 noted that the Guayaquil Meteorological Weather Office (MWO) reported an ash plume at Tungurahua, but OVT confirmed no surface activity. A very small lahar was recorded in the La Pampa ravine on 2 June. Although there were rains of varying intensity many days during June, they did not generate significant lahars, except one of medium size that occurred on 21 June in the Achupashal ravine. The Washington VAAC noted a report from the Guayaquil MWO of an ash emission on 5 July, but it was not detected in satellite imagery, and the OVT reported no surface activity. There was no surface activity reported by OVT from July to mid-September (figure 111), and internal seismicity remained very low. Occasional rainy periods generated muddy water in the ravines, but no significant lahars were reported.
A significant increase in the number of LP seismic events began on 12 September 2016, and a small seismic swarm was recorded on 18 September (figure 112). Small fumaroles were visible at the edges of the crater on 15 and 16 September (figure 113). At this same time, the inflationary trend that had been ongoing since the eruption earlier in the year switched to deflation as measured at the Retu inclinometer.
Another increase in LP seismicity and tremors occurred on 24 September, but there were no reports of surface activity other than minor steam fumaroles. Seismicity remained elevated through early October; a one-hour tremor event was reported on 1 October. Seismicity decreased gradually over the following two weeks. Low-energy steam and gas emissions from fumaroles located on the S and SW flanks were observed during a flyover on 7 October 2016. This corresponded to the warmest areas revealed in the thermal image of the summit (figure 114). with a TMA (maximum apparent temperature) of 47.9°C and 36.5°C.
Re-suspended ash from high winds in mid-November 2016 caused several VAAC notices to be issued, but no new emissions were reported by OVT through the end of 2016.
Tungurahua remained quiet throughout 2017. A 90-minute seismic swarm on 8 January 2017 and a minor increase in seismicity in the second half of March were the only seismic events above background levels. There were no emissions except for occasional minor fumarolic activity around the crater rim. Periods of heavy rainfall occasionally produced muddy water in the ravines; the only lahars were reported during 5-6 January, late April and 15 November.
Geologic Background. Tungurahua, a steep-sided andesitic-dacitic stratovolcano that towers more than 3 km above its northern base, is one of Ecuador's most active volcanoes. Three major edifices have been sequentially constructed since the mid-Pleistocene over a basement of metamorphic rocks. Tungurahua II was built within the past 14,000 years following the collapse of the initial edifice. Tungurahua II collapsed about 3,000 years ago and produced a large debris-avalanche deposit to the west. The modern glacier-capped stratovolcano (Tungurahua III) was constructed within the landslide scarp. Historical eruptions have all originated from the summit crater, accompanied by strong explosions and sometimes by pyroclastic flows and lava flows that reached populated areas at the volcano's base. Prior to a long-term eruption beginning in 1999 that caused the temporary evacuation of the city of Baños at the foot of the volcano, the last major eruption had occurred from 1916 to 1918, although minor activity continued until 1925.
Information Contacts: Instituto Geofísico (IG), Escuela Politécnica Nacional, Casilla 17-01-2759, Quito, Ecuador (URL: http://www.igepn.edu.ec ); NASA Goddard Space Flight Center (NASA/GSFC), Global Sulfur Dioxide Monitoring Page, Atmospheric Chemistry and Dynamics Laboratory, 8800 Greenbelt Road, Goddard, Maryland, USA (URL: https://so2.gsfc.nasa.gov/); Washington Volcanic Ash Advisory Center (VAAC), Satellite Analysis Branch (SAB), NOAA/NESDIS OSPO, NOAA Science Center Room 401, 5200 Auth Rd, Camp Springs, MD 20746, USA (URL: www.ospo.noaa.gov/Products/atmosphere/vaac, archive at: http://www.ssd.noaa.gov/VAAC/archive.html).
Yasur
Vanuatu
19.532°S, 169.447°E; summit elev. 361 m
All times are local (unless otherwise noted)
Typical ongoing eruptive activity and thermal anomalies through January 2018
Regular monitoring reports about Yasur from the Vanuatu Meteorology and Geo-Hazards Department (VMGD) indicated that the centuries-long eruptive activity continued from mid-June 2017 through January 2018. VMGD volcano bulletins on 21 July, 30 August, 29 September, 31 October, and 8 December 2017, and 30 January 2018, stated that major unrest was continuing, and the Alert Level remained at 2 (on a scale of 0-4). Based on seismic data, explosions continued to be intense. Visitors were reminded of the closed 395-m-radius Permanent Exclusion Zone (figure 47) and that volcanic ash and gas could impact other areas near the volcano due to trade winds.
During the reporting period thermal anomalies based on MODIS satellite instruments analyzed using the MODVOLC algorithm were numerous every month. The MIROVA (Middle InfraRed Observation of Volcanic Activity) system also detected numerous hotspots every month (figure 48).
Geologic Background. Yasur has exhibited essentially continuous Strombolian and Vulcanian activity at least since Captain Cook observed ash eruptions in 1774. This style of activity may have continued for the past 800 years. Located at the SE tip of Tanna Island in Vanuatu, this pyroclastic cone has a nearly circular, 400-m-wide summit crater. The active cone is largely contained within the small Yenkahe caldera, and is the youngest of a group of Holocene volcanic centers constructed over the down-dropped NE flank of the Pleistocene Tukosmeru volcano. The Yenkahe horst is located within the Siwi ring fracture, a 4-km-wide open feature associated with eruption of the andesitic Siwi pyroclastic sequence. Active tectonism along the Yenkahe horst accompanying eruptions has raised Port Resolution harbor more than 20 m during the past century.
Information Contacts: Geo-Hazards Division, Vanuatu Meteorology and Geo-Hazards Department, Ministry of Climate Change Adaptation, Meteorology, Geo-Hazards, Energy, Environment and Disaster Management, Private Mail Bag 9054, Lini Highway, Port Vila, Vanuatu (URL: http://www.vmgd.gov.vu/, https://www.facebook.com/VanuatuGeohazardsObservatory/); Radio New Zealand (URL: https://www.radionz.co.nz); Hawai'i Institute of Geophysics and Planetology (HIGP) - MODVOLC Thermal Alerts System, School of Ocean and Earth Science and Technology (SOEST), Univ. of Hawai'i, 2525 Correa Road, Honolulu, HI 96822, USA (URL: http://modis.higp.hawaii.edu/); MIROVA (Middle InfraRed Observation of Volcanic Activity), a collaborative project between the Universities of Turin and Florence (Italy) supported by the Centre for Volcanic Risk of the Italian Civil Protection Department (URL: http://www.mirovaweb.it/).