Recently Published Bulletin Reports
Erebus (Antarctica) Lava lake remains active; most thermal alerts recorded since 2019
Rincon de la Vieja (Costa Rica) Frequent phreatic explosions during July-December 2023
Bezymianny (Russia) Explosion on 18 October 2023 sends ash plume 8 km high; lava flows and incandescent avalanches
Kilauea (United States) Low-level lava effusions in the lava lake at Halema’uma’u during July-December 2022
Nyamulagira (DR Congo) Lava flows and thermal activity during May-October 2023
Bagana (Papua New Guinea) Explosions, ash plumes, ashfall, and lava flows during April-September 2023
Mayon (Philippines) Lava flows, pyroclastic flows, ash emissions, and seismicity during April-September 2023
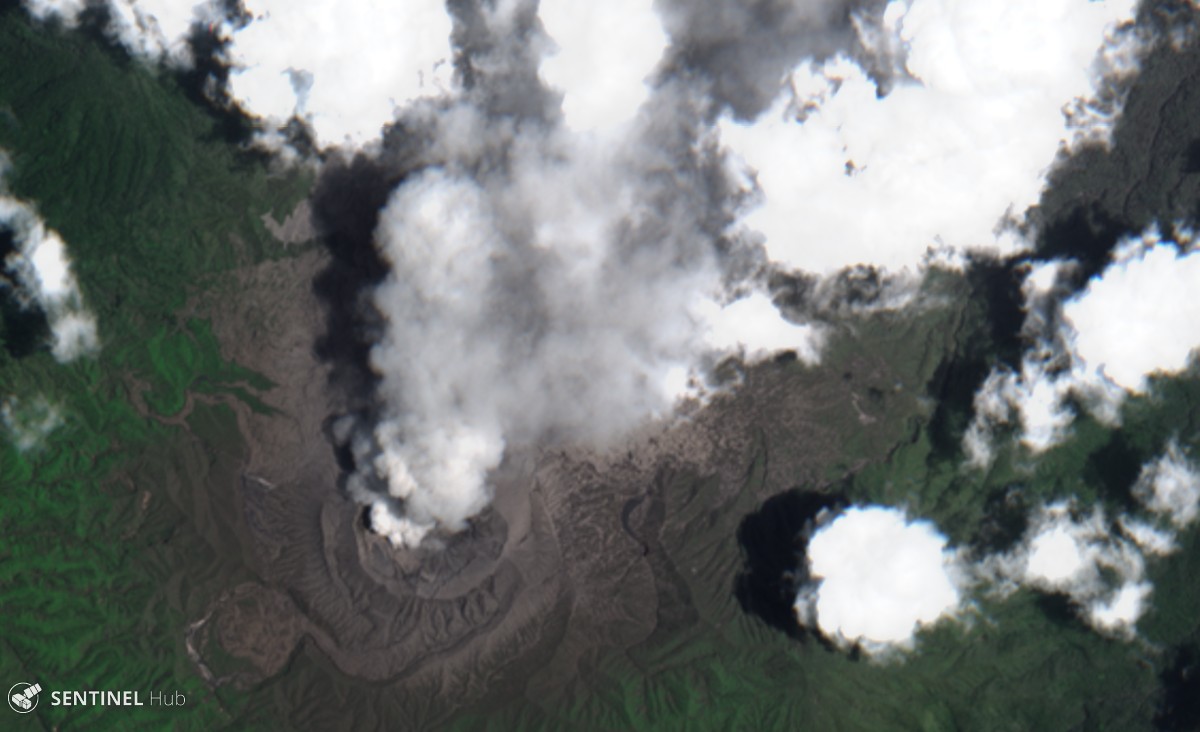
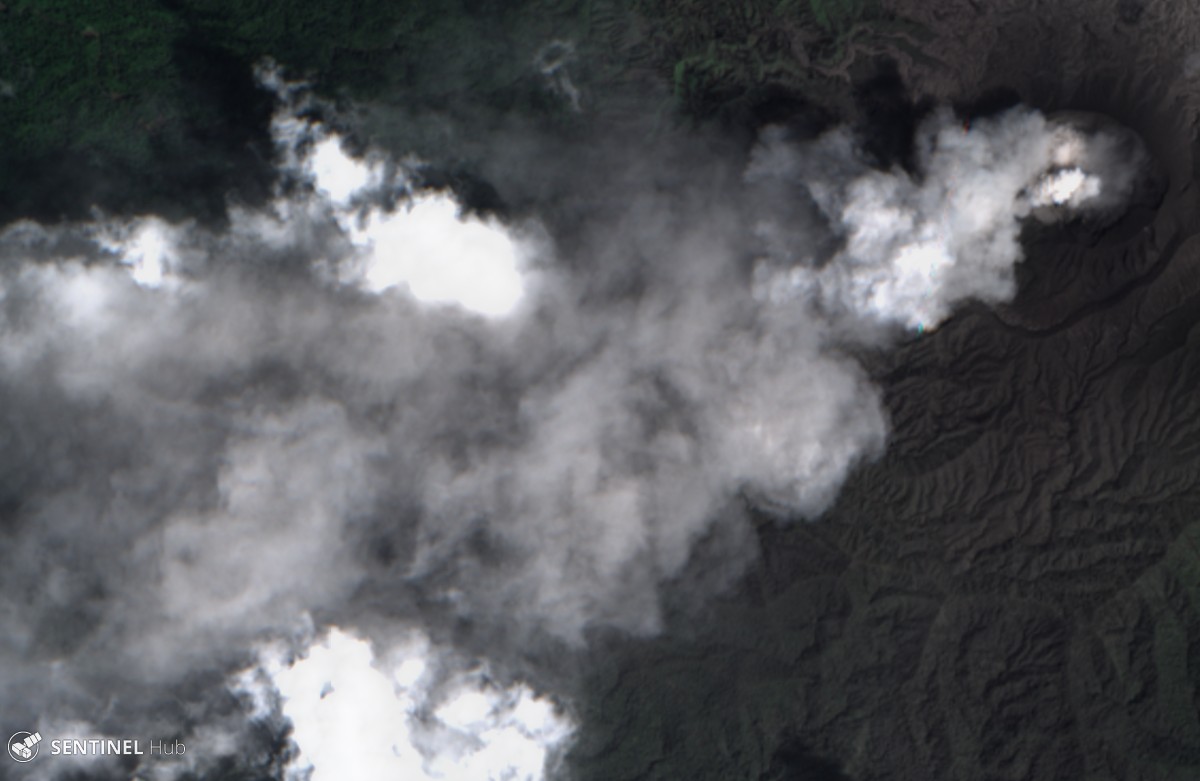
Nishinoshima (Japan) Eruption plumes and gas-and-steam plumes during May-August 2023
Krakatau (Indonesia) White gas-and-steam plumes and occasional ash plumes during May-August 2023
Villarrica (Chile) Strombolian activity, gas-and-ash emissions, and crater incandescence during April-September 2023
Merapi (Indonesia) Frequent incandescent avalanches during April-September 2023
Ebeko (Russia) Moderate explosive activity with ash plumes continued during June-November 2023
Erebus (Antarctica) — January 2024  Cite this Report
Erebus
Antarctica
77.53°S, 167.17°E; summit elev. 3794 m
All times are local (unless otherwise noted)
Lava lake remains active; most thermal alerts recorded since 2019
The lava lake in the summit crater of Erebus has been active since at least 1972. Located in Antarctica overlooking the McMurdo Station on Ross Island, it is the southernmost active volcano on the planet. Because of the remote location, activity is primarily monitored by satellites. This report covers activity during 2023.
The number of thermal alerts recorded by the Hawai'i Institute of Geophysics and Planetology’s MODVOLC Thermal Alerts System increased considerably in 2023 compared to the years 2020-2022 (table 9). In contrast to previous years, the MODIS instruments aboard the Aqua and Terra satellites captured data from Erebus every month during 2023. Consistent with previous years, the lowest number of anomalous pixels were recorded in January, November, and December.
Table 9. Number of monthly MODIS-MODVOLC thermal alert pixels recorded at Erebus during 2017-2023. See BGVN 42:06 for data from 2000 through 2016. The table was compiled using data provided by the HIGP – MODVOLC Thermal Alerts System.
| Year |
Jan |
Feb |
Mar |
Apr |
May |
Jun |
Jul |
Aug |
Sep |
Oct |
Nov |
Dec |
SUM |
| 2017 |
0 |
21 |
9 |
0 |
0 |
1 |
11 |
61 |
76 |
52 |
0 |
3 |
234 |
| 2018 |
0 |
21 |
58 |
182 |
55 |
17 |
137 |
172 |
103 |
29 |
0 |
0 |
774 |
| 2019 |
2 |
21 |
162 |
151 |
55 |
56 |
75 |
53 |
29 |
19 |
1 |
0 |
624 |
| 2020 |
0 |
2 |
16 |
18 |
4 |
4 |
1 |
3 |
18 |
3 |
1 |
6 |
76 |
| 2021 |
0 |
9 |
1 |
0 |
2 |
56 |
46 |
47 |
35 |
52 |
5 |
3 |
256 |
| 2022 |
1 |
13 |
55 |
22 |
15 |
32 |
39 |
19 |
31 |
11 |
0 |
0 |
238 |
| 2023 |
2 |
33 |
49 |
82 |
41 |
32 |
70 |
64 |
42 |
17 |
5 |
11 |
448 |
Sentinel-2 infrared images showed one or two prominent heat sources within the summit crater, accompanied by adjacent smaller sources, similar to recent years (see BGVN 46:01, 47:02, and 48:01). A unique image was obtained on 25 November 2023 by the OLI-2 (Operational Land Imager-2) on Landsat 9, showing the upper part of the volcano surrounded by clouds (figure 32).
Geologic Background. Mount Erebus, the world's southernmost historically active volcano, overlooks the McMurdo research station on Ross Island. It is the largest of three major volcanoes forming the crudely triangular Ross Island. The summit of the dominantly phonolitic volcano has been modified by one or two generations of caldera formation. A summit plateau at about 3,200 m elevation marks the rim of the youngest caldera, which formed during the late-Pleistocene and within which the modern cone was constructed. An elliptical 500 x 600 m wide, 110-m-deep crater truncates the summit and contains an active lava lake within a 250-m-wide, 100-m-deep inner crater; other lava lakes are sometimes present. The glacier-covered volcano was erupting when first sighted by Captain James Ross in 1841. Continuous lava-lake activity with minor explosions, punctuated by occasional larger Strombolian explosions that eject bombs onto the crater rim, has been documented since 1972, but has probably been occurring for much of the volcano's recent history.
Information Contacts: Hawai'i Institute of Geophysics and Planetology (HIGP) - MODVOLC Thermal Alerts System, School of Ocean and Earth Science and Technology (SOEST), Univ. of Hawai'i, 2525 Correa Road, Honolulu, HI 96822, USA (URL: http://modis.higp.hawaii.edu/); Copernicus Browser, Copernicus Data Space Ecosystem, European Space Agency (URL: https://dataspace.copernicus.eu/browser/); NASA Earth Observatory, EOS Project Science Office, NASA Goddard Space Flight Center, Goddard, Maryland, USA (URL: https://earthobservatory.nasa.gov/images/152134/erebus-breaks-through).
Rincon de la Vieja (Costa Rica) — January 2024 Cite this Report
Rincon de la Vieja
Costa Rica
10.83°N, 85.324°W; summit elev. 1916 m
All times are local (unless otherwise noted)
Frequent phreatic explosions during July-December 2023
Rincón de la Vieja is a volcanic complex in Costa Rica with a hot convecting acid lake that exhibits frequent weak phreatic explosions, gas-and-steam emissions, and occasional elevated sulfur dioxide levels (BGVN 45:10, 46:03, 46:11). The current eruption period began June 2021. This report covers activity during July-December 2023 and is based on weekly bulletins and occasional daily reports from the Observatorio Vulcanologico Sismologica de Costa Rica-Universidad Nacional (OVSICORI-UNA).
Numerous weak phreatic explosions continued during July-December 2023, along with gas-and-steam emissions and plumes that rose as high as 3 km above the crater rim. Many weekly OVSICORI-UNA bulletins included the previous week's number of explosions and emissions (table 9). For many explosions, the time of explosion was given (table 10). Frequent seismic activity (long-period earthquakes, volcano-tectonic earthquakes, and tremor) accompanied the phreatic activity.
Table 9. Number of reported weekly phreatic explosions and gas-and-steam emissions at Rincón de la Vieja, July-December 2023. Counts are reported for the week before the Weekly Bulletin date; not all reports included these data. Courtesy of OVSICORI-UNA.
| OVSICORI Weekly Bulletin |
Number of explosions |
Number of emissions |
| 28 Jul 2023 |
6 |
14 |
| 4 Aug 2023 |
10 |
12 |
| 1 Sep 2023 |
13 |
11 |
| 22 Sep 2023 |
12 |
13 |
| 29 Sep 2023 |
6 |
11 |
| 6 Oct 2023 |
12 |
5 |
| 13 Oct 2023 |
7 |
9 |
| 20 Oct 2023 |
1 |
15 |
| 27 Oct 2023 |
3 |
23 |
| 3 Nov 2023 |
3 |
10 |
| 17 Nov 2023 |
0 |
Some |
| 24 Nov 2023 |
0 |
14 |
| 8 Dec 2023 |
4 |
16 |
| 22 Dec 2023 |
8 |
18 |
Table 10. Summary of activity at Rincón de la Vieja during July-December 2023. Weak phreatic explosions and gas emissions are noted where the time of explosion was indicated in the weekly or daily bulletins. Height of plumes or emissions are distance above the crater rim. Courtesy of OVSICORI-UNA.
| Date |
Time |
Description of Activity |
| 1 Jul 2023 |
0156 |
Explosion. |
| 2 Jul 2023 |
0305 |
Explosion. |
| 4 Jul 2023 |
0229, 0635 |
Event at 0635 produced a gas-and-steam plume that rose 700 m and drifted W; seen by residents in Liberia (21 km SW). |
| 9 Jul 2023 |
1843 |
Explosion. |
| 21 Jul 2023 |
0705 |
Explosion. |
| 26 Jul 2023 |
1807 |
Explosion. |
| 28 Jul 2023 |
0802 |
Explosion generated a gas-and-steam plume that rose 500 m. |
| 30 Jul 2023 |
1250 |
Explosion. |
| 31 Jul 2023 |
2136 |
Explosion. |
| 11 Aug 2023 |
0828 |
Explosion. |
| 18 Aug 2023 |
1304 |
Explosion. |
| 21 Aug 2023 |
1224 |
Explosion generated gas-and-steam plumes rose 500-600 m. |
| 22 Aug 2023 |
0749 |
Explosion generated gas-and-steam plumes rose 500-600 m. |
| 24 Aug 2023 |
1900 |
Explosion. |
| 25 Aug 2023 |
0828 |
Event produced a steam-and-gas plume that rose 3 km and drifted NW. |
| 27-28 Aug 2023 |
0813 |
Four small events; the event at 0813 on 28 August lasted two minutes and generated a steam-and-gas plume that rose 2.5 km. |
| 1 Sep 2023 |
1526 |
Explosion generated plume that rose 2 km and ejected material onto the flanks. |
| 2-3 Sep 2023 |
- |
Small explosions detected in infrasound data. |
| 4 Sep 2023 |
1251 |
Gas-and-steam plume rose 1 km and drifted W. |
| 7 Nov 2023 |
1113 |
Explosion. |
| 8 Nov 2023 |
0722 |
Explosion. |
| 12 Nov 2023 |
0136 |
Small gas emissions. |
| 14 Nov 2023 |
0415 |
Small gas emissions. |
According to OVSICORI-UNA, during July-October the average weekly sulfur dioxide (SO2) flux ranged from 68 to 240 tonnes/day. However, in mid-November the flux increased to as high as 334 tonnes/day, the highest value measured in recent years. The high SO2 flux in mid-November was also detected by the TROPOMI instrument on the Sentinel-5P satellite (figure 43).
Geologic Background. Rincón de la Vieja, the largest volcano in NW Costa Rica, is a remote volcanic complex in the Guanacaste Range. The volcano consists of an elongated, arcuate NW-SE-trending ridge constructed within the 15-km-wide early Pleistocene Guachipelín caldera, whose rim is exposed on the south side. Sometimes known as the "Colossus of Guanacaste," it has an estimated volume of 130 km3 and contains at least nine major eruptive centers. Activity has migrated to the SE, where the youngest-looking craters are located. The twin cone of Santa María volcano, the highest peak of the complex, is located at the eastern end of a smaller, 5-km-wide caldera and has a 500-m-wide crater. A Plinian eruption producing the 0.25 km3 Río Blanca tephra about 3,500 years ago was the last major magmatic eruption. All subsequent eruptions, including numerous historical eruptions possibly dating back to the 16th century, have been from the prominent active crater containing a 500-m-wide acid lake located ENE of Von Seebach crater.
Information Contacts: Observatorio Vulcanológico Sismológica de Costa Rica-Universidad Nacional (OVSICORI-UNA), Apartado 86-3000, Heredia, Costa Rica (URL: http://www.ovsicori.una.ac.cr/); NASA Global Sulfur Dioxide Monitoring Page, Atmospheric Chemistry and Dynamics Laboratory, NASA Goddard Space Flight Center (NASA/GSFC), 8800 Greenbelt Road, Goddard MD 20771, USA (URL: https://so2.gsfc.nasa.gov/).
Bezymianny (Russia) — November 2023 Cite this Report
Bezymianny
Russia
55.972°N, 160.595°E; summit elev. 2882 m
All times are local (unless otherwise noted)
Explosion on 18 October 2023 sends ash plume 8 km high; lava flows and incandescent avalanches
Bezymianny, located on Russia’s Kamchatka Peninsula, has had eruptions since 1955 characterized by dome growth, explosions, pyroclastic flows, ash plumes, and ashfall. Activity during November 2022-April 2023 included gas-and-steam emissions, lava dome collapses generating avalanches, and persistent thermal activity. Similar eruptive activity continued from May through October 2023, described here based on information from weekly and daily reports of the Kamchatka Volcano Eruptions Response Team (KVERT), notices from Tokyo VAAC (Volcanic Ash Advisory Center), and from satellite data.
Overall activity decreased after the strong period of activity in late March through April 2023, which included ash explosions during 29 March and 7-8 April 2023 that sent plumes as high as 10-12 km altitude, along with dome growth and lava flows (BGVN 48:05). This reduced activity can be seen in the MIROVA thermal detection system graph (figure 56), which was consistent with data from the MODVOLC thermal detection system and with Sentinel-2 satellite images that showed persistent hotspots in the summit crater when conditions allowed observations. A renewed period of strong activity began in mid-October 2023.
Activity increased significantly on 17 October 2023 when large collapses began during 0700-0830 on the E flanks of the lava dome and continued to after 0930 the next day (figure 57). Ash plumes rose to an altitude of 4.5-5 km, extending 220 km NNE by 18 October. A large explosion at 1630 on 18 October produced an ash plume that rose to an altitude of 11 km (8 km above the summit) and drifted NNE and then NW, extending 900 km NW within two days at an altitude of 8 km. Minor ashfall was noted in Kozyrevsk (45 km WNW). At 0820 on 20 October an ash plume was identified in satellite images drifting 100 km ENE at altitudes of 4-4.5 km.
Lava flows and hot avalanches from the dome down the SE flank continued over the next few days, including 23 October when clear conditions allowed good observations (figures 58 and 59). A large thermal anomaly was observed over the volcano through 24 October, and in the summit crater on 30 October (figure 60). Strong fumarolic activity continued, with numerous avalanches and occasional incandescence. By the last week of October, volcanic activity had decreased to a level consistent with that earlier in the reporting period.
Aviation warnings were frequently updated during 17-20 October. KVERT issued a Volcano Observatory Notice for Aviation (VONA) on 17 October at 1419 and 1727 (0219 and 0527 UTC) raising the Aviation Color Code (ACC) from Yellow to Orange (second highest level). The next day, KVERT issued a VONA at 1705 (0505 UTC) raising the ACC to Red (highest level) but lowered it back to Orange at 2117 (0917 UTC). After another decrease to Yellow and back to Orange, the ACC was reduced to Yellow on 20 October at 1204 (0004 UTC). In addition, the Tokyo VAAC issued a series of Volcanic Ash Advisories beginning on 16 October and continuing through 30 October.
Geologic Background. The modern Bezymianny, much smaller than its massive neighbors Kamen and Kliuchevskoi on the Kamchatka Peninsula, was formed about 4,700 years ago over a late-Pleistocene lava-dome complex and an edifice built about 11,000-7,000 years ago. Three periods of intensified activity have occurred during the past 3,000 years. The latest period, which was preceded by a 1,000-year quiescence, began with the dramatic 1955-56 eruption. This eruption, similar to that of St. Helens in 1980, produced a large open crater that was formed by collapse of the summit and an associated lateral blast. Subsequent episodic but ongoing lava-dome growth, accompanied by intermittent explosive activity and pyroclastic flows, has largely filled the 1956 crater.
Information Contacts: Kamchatka Volcanic Eruptions Response Team (KVERT), Far Eastern Branch, Russian Academy of Sciences, 9 Piip Blvd., Petropavlovsk-Kamchatsky, 683006, Russia (URL: http://www.kscnet.ru/ivs/kvert/); Kamchatka Volcanological Station, Kamchatka Branch of Geophysical Survey, (KB GS RAS), Klyuchi, Kamchatka Krai, Russia (URL: http://volkstat.ru/); Tokyo Volcanic Ash Advisory Center (VAAC), 1-3-4 Otemachi, Chiyoda-ku, Tokyo 100-8122, Japan (URL: http://ds.data.jma.go.jp/svd/vaac/data/); Hawai'i Institute of Geophysics and Planetology (HIGP) - MODVOLC Thermal Alerts System, School of Ocean and Earth Science and Technology (SOEST), Univ. of Hawai'i, 2525 Correa Road, Honolulu, HI 96822, USA (URL: http://modis.higp.hawaii.edu/); MIROVA (Middle InfraRed Observation of Volcanic Activity), a collaborative project between the Universities of Turin and Florence (Italy) supported by the Centre for Volcanic Risk of the Italian Civil Protection Department (URL: http://www.mirovaweb.it/); Copernicus Browser, Copernicus Data Space Ecosystem, European Space Agency (URL: https://dataspace.copernicus.eu/browser/).chr
Kilauea (United States) — January 2023 Cite this Report
Kilauea
United States
19.421°N, 155.287°W; summit elev. 1222 m
All times are local (unless otherwise noted)
Low-level lava effusions in the lava lake at Halema’uma’u during July-December 2022
Kīlauea is the southeastern-most volcano in Hawaii and overlaps the E flank of the Mauna Loa volcano. Its East Rift Zone (ERZ) has been intermittently active for at least 2,000 years. An extended eruption period began in January 1983 and was characterized by open lava lakes and lava flows from the summit caldera and the East Rift Zone. During May 2018 magma migrated into the Lower East Rift Zone (LERZ) and opened 24 fissures along a 6-km-long NE-trending fracture zone that produced lava flows traveling in multiple directions. As lava emerged from the fissures, the lava lake at Halema'uma'u drained and explosions sent ash plumes to several kilometers altitude (BGVN 43:10).
The current eruption period started during September 2021 and has recently been characterized by lava effusions, spatter, and sulfur dioxide emissions in the active Halema’uma’u lava lake (BGVN 47:08). Lava effusions, some spatter, and sulfur dioxide emissions have continued during this reporting period of July through December 2022 using daily reports, volcanic activity notices, and abundant photo, map, and video data from the US Geological Survey's (USGS) Hawaiian Volcano Observatory (HVO).
Summary of activity during July-December 2022. Low-level effusions have continued at the western vent of the Halema’uma’u crater during July through early December 2022. Occasional weak ooze-outs (also called lava break outs) would occur along the margins of the crater floor. The overall level of the active lava lake throughout the reporting period gradually increased due to infilling, however it stagnated in mid-September (table 13). During September through November, activity began to decline, though lava effusions persisted at the western vent. By 9 December, the active part of the lava lake had completely crusted over, and incandescence was no longer visible.
Table 13. Summary of measurements taken during overflights at Kīlauea that show a gradual increase in the active lava lake level and the volume of lava effused since 29 September 2021. Lower activity was reported during September-October. Data collected during July-December 2022. Courtesy of HVO.
| Date: |
Level of the active lava lake (m): |
Cumulative volume of lava effused (million cubic meters): |
| 7 Jul 2022 |
130 |
95 |
| 19 Jul 2022 |
133 |
98 |
| 4 Aug 2022 |
136 |
102 |
| 16 Aug 2022 |
137 |
104 |
| 12 Sep 2022 |
143 |
111 |
| 5 Oct 2022 |
143 |
111 |
| 28 Oct 2022 |
143 |
111 |
Activity during July 2022. Lava effusions were reported from the western vent in the Halema’uma’u crater, along with occasional weak ooze-outs along the margins of the crater floor. The height of the lava lake was variable due to deflation-inflation tilt events; for example, the lake level dropped approximately 3-4 m during a summit deflation-inflation event reported on 1 July. Webcam images taken during the night of 6-12 July showed intermittent low-level spattering at the western vent that rose less than 10 m above the vent (figure 519). Measurements made during an overflight on 7 July indicated that the crater floor was infilled about 130 m and that 95 million cubic meters of lava had been effused since 29 September 2021. A single, relatively small lava ooze-out was active to the S of the lava lake. Around midnight on 8 July there were two brief periods of lava overflow onto the lake margins. On 9 July lava ooze-outs were reported near the SE and NE edges of the crater floor and during 10-11 July they occurred near the E, NE, and NW edges. On 16 July crater incandescence was reported, though the ooze-outs and spattering were not visible. On 18 July overnight webcam images showed incandescence in the western vent complex and two ooze-outs were reported around 0000 and 0200 on 19 July. By 0900 there were active ooze-outs along the SW edge of the crater floor. Measurements made from an overflight on 19 July indicated that the crater floor was infilled about 133 m and 98 million cubic meters of lava had erupted since 29 September 2021 (figure 520). On 20 July around 1600 active ooze-outs were visible along the N edge of the crater, which continued through the next day. Extensive ooze-outs occurred along the W margin during 24 July until 1900; on 26 July minor ooze-outs were noted along the N margin. Minor spattering was visible on 29 July along the E margin of the lake. The sulfur dioxide emission rates ranged 650-2,800 tons per day (t/d), the higher of which was measured on 8 July (figure 519).
Activity during August 2022. The eruption continued in the Halema’uma’u crater at the western vent. According to HVO the lava in the active lake remained at the level of the bounding levees. Occasional minor ooze-outs were observed along the margins of the crater floor. Strong nighttime crater incandescence was visible after midnight on 6 August over the western vent cone. During 6-7 August scattered small lava lobes were active along the crater floor and incandescence persisted above the western vent through 9 August. During 7-9 August HVO reported a single lava effusion source was active along the NW margin of the crater floor. Measurements from an overflight on 4 August indicated that the crater floor was infilled about 136 m total and that 102 million cubic meters of lava had been erupted since the start of the eruption. Lava breakouts were reported along the N, NE, E, S, and W margins of the crater during 10-16 August. Another overflight survey conducted on 16 August indicated that the crater floor infilled about 137 m and 104 million cubic meters of lava had been erupted since September 2021. Measured sulfur dioxide emissions rates ranged 1,150-2,450 t/d, the higher of which occurred on 8 August.
Activity during September 2022. During September, lava effusion continued from the western vent into the active lava lake and onto the crater floor. Intermittent minor ooze-outs were reported through the month. A small ooze-out was visible on the W crater floor margin at 0220 on 2 September, which showed decreasing surface activity throughout the day, but remained active through 3 September. On 3 September around 1900 a lava outbreak occurred along the NW margin of the crater floor but had stopped by the evening of 4 September. Field crews monitoring the summit lava lake on 9 September observed spattering on the NE margin of the lake that rose no higher than 10 m, before falling back onto the lava lake crust (figure 521). Overflight measurements on 12 September indicated that the crater floor was infilled a total of 143 m and 111 million cubic meters of lava had been erupted since September 2021. Extensive breakouts in the W and N part of the crater floor were reported at 1600 on 20 September and continued into 26 September. The active part of the lava lake dropped by 10 m while other parts of the crater floor dropped by several meters. Summit tiltmeters recorded a summit seismic swarm of more than 80 earthquakes during 1500-1800 on 21 September, which occurred about 1.5 km below Halema’uma’u; a majority of these were less than Mw 2. By 22 September the active part of the lava lake was infilled about 2 m. On 23 September the western vent areas exhibited several small spatter cones with incandescent openings, along with weak, sporadic spattering (figure 522). The sulfur dioxide emission rate ranged from 930 t/d to 2,000 t/d, the higher of which was measured on 6 September.
Activity during October 2022. Activity during October declined slightly compared to previous months, though lava effusions persisted from the western vent into the active lava lake and onto the crater floor during October (figure 523). Slight variations in the lava lake were noted throughout the month. HVO reported that around 0600 on 3 October the level of the lava lake has lowered slightly. Overflight measurements taken on 5 October indicated that the crater floor was infilled a total of about 143 m and that 111 million cubic meters of lava had been effused since September 2021. During 6-7 October the lake gradually rose 0.5 m. Sulfur dioxide measurements made on 22 October had an emission rate of 700 t/d. Another overflight taken on 28 October showed that there was little to no change in the elevation of the crater floor: the crater floor was infilled a total of 143 m and 111 million cubic meters of lava had erupted since the start of the eruption.
Activity during November 2022. Activity remained low during November, though HVO reported that lava from the western vent continued to effuse into the active lava lake and onto the crater floor throughout the month. The rate of sulfur dioxide emissions during November ranged from 300-600 t/d, the higher amount of which occurred on 9 November.
Activity during December 2022. Similar low activity was reported during December, with lava effusing from the western vent into the active lava lake and onto the crater floor. During 4-5 December the active part of the lava lake was slightly variable in elevation and fluctuated within 1 m. On 9 December HVO reported that lava was no longer erupting from the western vent in the Halema’uma’u crater and that sulfur dioxide emissions had returned to near pre-eruption background levels; during 10-11 December, the lava lake had completely crusted over, and no incandescence was visible (figure 524). Time lapse camera images covering the 4-10 December showed that the crater floor showed weak deflation and no inflation. Some passive events of crustal overturning were reported during 14-15 December, which brought fresh incandescent lava to the lake surface. The sulfur dioxide emission rate was approximately 200 t/d on 14 December. A smaller overturn event on 17 December and another that occurred around 0000 and into the morning of 20 December were also detected. A small seismic swarm was later detected on 30 December.
Geologic Background. Kilauea overlaps the E flank of the massive Mauna Loa shield volcano in the island of Hawaii. Eruptions are prominent in Polynesian legends; written documentation since 1820 records frequent summit and flank lava flow eruptions interspersed with periods of long-term lava lake activity at Halemaumau crater in the summit caldera until 1924. The 3 x 5 km caldera was formed in several stages about 1,500 years ago and during the 18th century; eruptions have also originated from the lengthy East and Southwest rift zones, which extend to the ocean in both directions. About 90% of the surface of the basaltic shield volcano is formed of lava flows less than about 1,100 years old; 70% of the surface is younger than 600 years. The long-term eruption from the East rift zone between 1983 and 2018 produced lava flows covering more than 100 km2, destroyed hundreds of houses, and added new coastline.
Information Contacts: Hawaiian Volcano Observatory (HVO), U.S. Geological Survey, PO Box 51, Hawai'i National Park, HI 96718, USA (URL: http://hvo.wr.usgs.gov/).
Nyamulagira (DR Congo) — November 2023 Cite this Report
Nyamulagira
DR Congo
1.408°S, 29.2°E; summit elev. 3058 m
All times are local (unless otherwise noted)
Lava flows and thermal activity during May-October 2023
Nyamulagira (also known as Nyamuragira) is a shield volcano in the Democratic Republic of Congo with the summit truncated by a small 2 x 2.3 km caldera with walls up to about 100 m high. Documented eruptions have occurred within the summit caldera, as well as from numerous flank fissures and cinder cones. The current eruption period began in April 2018 and has more recently been characterized by summit crater lava flows and thermal activity (BGVN 48:05). This report describes lava flows and variable thermal activity during May through October 2023, based on information from the Observatoire Volcanologique de Goma (OVG) and various satellite data.
Lava lake activity continued during May. The MIROVA (Middle InfraRed Observation of Volcanic Activity) system recorded moderate-to-strong thermal activity throughout the reporting period; activity was more intense during May and October and relatively weaker from June through September (figure 95). The MODVOLC thermal algorithm, detected a total of 209 thermal alerts. There were 143 hotspots detected during May, eight during June, nine during September, and 49 during October. This activity was also reflected in infrared satellite images, where a lava flow was visible in the NW part of the crater on 7 May and strong activity was seen in the center of the crater on 4 October (figure 96). Another infrared satellite image taken on 12 May showed still active lava flows along the NW margin of the crater. According to OVG lava effusions were active during 7-29 May and moved to the N and NW parts of the crater beginning on 9 May. Strong summit crater incandescence was visible from Goma (27 km S) during the nights of 17, 19, and 20 May (figure 97). On 17 May there was an increase in eruptive activity, which peaked at 0100 on 20 May. Notable sulfur dioxide plumes drifted NW and W during 19-20 May (figure 98). Drone footage acquired in partnership with the USGS (United States Geological Survey) on 20 May captured images of narrow lava flows that traveled about 100 m down the W flank (figure 99). Data from the Rumangabo seismic station indicated a decreasing trend in activity during 17-21 May. Although weather clouds prevented clear views of the summit, a strong thermal signature on the NW flank was visible in an infrared satellite image on 22 May, based on an infrared satellite image. On 28 May the lava flows on the upper W flank began to cool and solidify. By 29 May seismicity returned to levels similar to those recorded before the 17 May increase. Lava effusion continued but was confined to the summit crater; periodic crater incandescence was observed.
Low-level activity was noted during June through October. On 1 June OVG reported that seismicity remained at lower levels and that crater incandescence had been absent for three days, though infrared satellite imagery showed continued lava effusion in the summit crater. The lava flows on the flanks covered an estimated 0.6 km2. Satellite imagery continued to show thermal activity confined to the lava lake through October (figure 96), although no lava flows or significant sulfur dioxide emissions were reported.
Geologic Background. Africa's most active volcano, Nyamulagira (also known as Nyamuragira), is a massive high-potassium basaltic shield about 25 km N of Lake Kivu and 13 km NNW of the steep-sided Nyiragongo volcano. The summit is truncated by a small 2 x 2.3 km caldera that has walls up to about 100 m high. Documented eruptions have occurred within the summit caldera, as well as from the numerous flank fissures and cinder cones. A lava lake in the summit crater, active since at least 1921, drained in 1938, at the time of a major flank eruption. Recent lava flows extend down the flanks more than 30 km from the summit as far as Lake Kivu; extensive lava flows from this volcano have covered 1,500 km2 of the western branch of the East African Rift.
Information Contacts: Observatoire Volcanologique de Goma (OVG), Departement de Geophysique, Centre de Recherche en Sciences Naturelles, Lwiro, D.S. Bukavu, DR Congo; Hawai'i Institute of Geophysics and Planetology (HIGP) - MODVOLC Thermal Alerts System, School of Ocean and Earth Science and Technology (SOEST), Univ. of Hawai'i, 2525 Correa Road, Honolulu, HI 96822, USA (URL: http://modis.higp.hawaii.edu/); MIROVA (Middle InfraRed Observation of Volcanic Activity), a collaborative project between the Universities of Turin and Florence (Italy) supported by the Centre for Volcanic Risk of the Italian Civil Protection Department (URL: http://www.mirovaweb.it/); NASA Global Sulfur Dioxide Monitoring Page, Atmospheric Chemistry and Dynamics Laboratory, NASA Goddard Space Flight Center (NASA/GSFC), 8800 Greenbelt Road, Goddard, Maryland, USA (URL: https://so2.gsfc.nasa.gov/); Copernicus Browser, Copernicus Data Space Ecosystem, European Space Agency (URL: https://dataspace.copernicus.eu/browser/); Charles Balagizi, Goma Volcano Observatory, Departement de Geophysique, Centre de Recherche en Sciences Naturelles, Lwiro, D.S. Bukavu, DR Congo.
Bagana (Papua New Guinea) — October 2023 Cite this Report
Bagana
Papua New Guinea
6.137°S, 155.196°E; summit elev. 1855 m
All times are local (unless otherwise noted)
Explosions, ash plumes, ashfall, and lava flows during April-September 2023
The remote volcano of Bagana is located in central Bougainville Island, Papua New Guinea. Recorded eruptions date back to 1842 and activity has consisted of effusive activity that has built a small lava dome in the summit crater and occasional explosions that produced pyroclastic flows. The most recent eruption has been ongoing since February 2000 and has produced occasional explosions, ash plumes, and lava flows. More recently, activity has been characterized by ongoing effusive activity and ash emissions (BGVN 48:04). This report updates activity from April through September 2023 that has consisted of explosions, ash plumes, ashfall, and lava flows, using information from the Darwin Volcanic Ash Advisory Center (VAAC) and satellite data.
An explosive eruption was reported on 7 July that generated a large gas-and-ash plume to high altitudes and caused significant ashfall in local communities; the eruption plume had reached upper tropospheric (16-18 km altitude) altitudes by 2200, according to satellite images. Sulfur dioxide plumes were detected in satellite images on 8 July and indicated that the plume was likely a mixture of gas, ice, and ash. A report issued by the Autonomous Bougainville Government (ABG) (Torokina District, Education Section) on 10 July noted that significant ash began falling during 2000-2100 on 7 July and covered most areas in the Vuakovi, Gotana (9 km SW), Koromaketo, Laruma (25 km W) and Atsilima (27 km NW) villages. Pyroclastic flows also occurred, according to ground-based reports; small deposits confined to one drainage were inspected by RVO during an overflight on 17 July and were confirmed to be from the 7 July event. Ashfall continued until 10 July and covered vegetation, which destroyed bushes and gardens and contaminated rivers and streams.
RVO reported another eruption on 14 July. The Darwin VAAC stated that an explosive event started around 0830 on 15 July and produced an ash plume that rose to 16.5 km altitude by 1000 and drifted N, according to satellite images. The plume continued to drift N and remained visible through 1900, and by 2150 it had dissipated.
Ashfall likely from both the 7 and 15 July events impacted about 8,111 people in Torokina (20 km SW), including Tsito/Vuakovi, Gotana, Koromaketo, Kenaia, Longkogari, Kenbaki, Piva (13 km SW), and Atsinima, and in the Tsitovi district, according to ABG. Significant ashfall was also reported in Ruruvu (22 km N) in the Wakunai District of Central Bougainville, though the thickness of these deposits could not be confirmed. An evacuation was called for the villages in Wakunai, where heavy ashfall had contaminated water sources; the communities of Ruruvu, Togarau, Kakarapaia, Karauturi, Atao, and Kuritaturi were asked to evacuate to a disaster center at the Wakunai District Station, and communities in Torokina were asked to evacuate to the Piva District station. According to a news article, more than 7,000 people needed temporary accommodations, with about 1,000 people in evacuation shelters. Ashfall had deposited over a broad area, contaminating water supplies, affecting crops, and collapsing some roofs and houses in rural areas. Schools were temporarily shut down. Intermittent ash emissions continued through the end of July and drifted NNW, NW, and SW. Fine ashfall was reported on the coast of Torokina, and ash plumes also drifted toward Laruma and Atsilima.
A small explosive eruption occurred at 2130 on 28 July that ejected material from the crater vents, according to reports from Torokina, in addition to a lava flow that contained two lobes. A second explosion was detected at 2157. Incandescence from the lava flow was visible from Piva as it descended the W flank around 2000 on 29 July (figure 47). The Darwin VAAC reported that a strong thermal anomaly was visible in satellite images during 30-31 July and that ash emissions rose to 2.4 km altitude and drifted WSW on 30 July. A ground report from RVO described localized emissions at 0900 on 31 July.
The Darwin VAAC reported that ash plumes were identified in satellite imagery at 0800 and 1220 on 12 August and rose to 2.1 km and 3 km altitude and drifted NW and W, respectively. A news report stated that aid was sent to more than 6,300 people that were adversely affected by the eruption. Photos taken during 17-19 August showed ash emissions rising no higher than 1 km above the summit and drifting SE. A small explosion generated an ash plume during the morning of 19 August. Deposits from small pyroclastic flows were also captured in the photos. Satellite images captured lava flows and pyroclastic flow deposits. Two temporary seismic stations were installed near Bagana on 17 August at distances of 7 km WSW (Vakovi station) and 11 km SW (Kepox station). The Kepox station immediately started to record continuous, low-frequency background seismicity.
Satellite data. Little to no thermal activity was detected during April through mid-July 2023; only one anomaly was recorded during early April and one during early June, according to MIROVA (Middle InfraRed Observation of Volcanic Activity) data (figure 48). Thermal activity increased in both power and frequency during mid-July through September, although there were still some short gaps in detected activity. MODVOLC also detected increased thermal activity during August; thermal hotspots were detected a total of five times on 19, 20, and 27 August. Weak thermal anomalies were also captured in infrared satellite images on clear weather days throughout the reporting period on 7, 12, and 17 April, 27 May, 1, 6, 16, and 31 July, and 19 September (figure 48); a strong thermal anomaly was visible on 31 July. Distinct sulfur dioxide plumes that drifted generally NW were intermittently captured by the TROPOMI instrument on the Sentinel-5P satellite and sometimes exceeded two Dobson Units (DUs) (figure 49).
Geologic Background. Bagana volcano, in a remote portion of central Bougainville Island, is frequently active. This massive symmetrical cone was largely constructed by an accumulation of viscous andesitic lava flows. The entire edifice could have been constructed in about 300 years at its present rate of lava production. Eruptive activity is characterized by non-explosive effusion of viscous lava that maintains a small lava dome in the summit crater, although occasional explosive activity produces pyroclastic flows. Lava flows with tongue-shaped lobes up to 50 m thick and prominent levees descend the flanks on all sides.
Information Contacts: Rabaul Volcano Observatory (RVO), Geohazards Management Division, Department of Mineral Policy and Geohazards Management (DMPGM), PO Box 3386, Kokopo, East New Britain Province, Papua New Guinea; Darwin Volcanic Ash Advisory Centre (VAAC), Bureau of Meteorology, Northern Territory Regional Office, PO Box 40050, Casuarina, NT 0811, Australia (URL: http://www.bom.gov.au/info/vaac/); MIROVA (Middle InfraRed Observation of Volcanic Activity), a collaborative project between the Universities of Turin and Florence (Italy) supported by the Centre for Volcanic Risk of the Italian Civil Protection Department (URL: http://www.mirovaweb.it/); Hawai'i Institute of Geophysics and Planetology (HIGP) - MODVOLC Thermal Alerts System, School of Ocean and Earth Science and Technology (SOEST), Univ. of Hawai'i, 2525 Correa Road, Honolulu, HI 96822, USA (URL: http://modis.higp.hawaii.edu/); NASA Global Sulfur Dioxide Monitoring Page, Atmospheric Chemistry and Dynamics Laboratory, NASA Goddard Space Flight Center (NASA/GSFC), 8800 Greenbelt Road, Goddard, Maryland, USA (URL: https://so2.gsfc.nasa.gov/); Copernicus Browser, Copernicus Data Space Ecosystem, European Space Agency (URL: https://dataspace.copernicus.eu/browser/); Autonomous Bougainville Government, P.O Box 322, Buka, AROB, PNG (URL: https://abg.gov.pg/); Andrew Tupper (Twitter: @andrewcraigtupp); Simon Carn, Geological and Mining Engineering and Sciences, Michigan Technological University, 1400 Townsend Drive, Houghton, MI 49931, USA (URL: http://www.volcarno.com/, Twitter: @simoncarn); Radio NZ (URL: https://www.rnz.co.nz/news/pacific/494464/more-than-7-000-people-in-bougainville-need-temporary-accommodation-after-eruption); USAID, 1300 Pennsylvania Ave, NW, Washington DC 20004, USA (URL: https://www.usaid.gov/pacific-islands/press-releases/aug-08-2023-united-states-provides-immediate-emergency-assistance-support-communities-affected-mount-bagana-volcanic-eruptions).
Mayon (Philippines) — October 2023 Cite this Report
Mayon
Philippines
13.257°N, 123.685°E; summit elev. 2462 m
All times are local (unless otherwise noted)
Lava flows, pyroclastic flows, ash emissions, and seismicity during April-September 2023
Mayon is located in the Philippines and has steep upper slopes capped by a small summit crater. Historical eruptions date back to 1616 CE that have been characterized by Strombolian eruptions, lava flows, pyroclastic flows, and mudflows. Eruptions mostly originated from a central conduit. Pyroclastic flows and mudflows have commonly descended many of the approximately 40 drainages that surround the volcano. The most recent eruption occurred during June through October 2022 and consisted of lava dome growth and gas-and-steam emissions (BGVN 47:12). A new eruption was reported during late April 2023 and has included lava flows, pyroclastic density currents, ash emissions, and seismicity. This report covers activity during April through September 2023 based on daily bulletins from the Philippine Institute of Volcanology and Seismology (PHIVOLCS).
During April through September 2023, PHIVOLCS reported near-daily rockfall events, frequent volcanic earthquakes, and sulfur dioxide measurements. Gas-and-steam emissions rose 100-900 m above the crater and drifted in different directions. Nighttime crater incandescence was often visible during clear weather and was accompanied by incandescent avalanches of material. Activity notably increased during June when lava flows were reported on the S, SE, and E flanks (figure 52). The MIROVA graph (Middle InfraRed Observation of Volcanic Activity) showed strong thermal activity coincident with these lava flows, which remained active through September (figure 53). According to the MODVOLC thermal algorithm, a total of 110 thermal alerts were detected during the reporting period: 17 during June, 40 during July, 27 during August, and 26 during September. During early June, pyroclastic density currents (PDCs) started to occur more frequently.
Low activity was reported during much of April and May; gas-and-steam emissions rose 100-900 m above the crater and generally drifted in different directions. A total of 52 rockfall events and 18 volcanic earthquakes were detected during April and 147 rockfall events and 13 volcanic events during May. Sulfur dioxide flux measurements ranged between 400-576 tons per day (t/d) during April, the latter of which was measured on 29 April and between 162-343 t/d during May, the latter of which was measured on 13 May.
Activity during June increased, characterized by lava flows, pyroclastic density currents (PDCs), crater incandescence and incandescent rockfall events, gas-and-steam emissions, and continued seismicity. Weather clouds often prevented clear views of the summit, but during clear days, moderate gas-and-steam emissions rose 100-2,500 m above the crater and drifted in multiple directions. A total of 6,237 rockfall events and 288 volcanic earthquakes were detected. The rockfall events often deposited material on the S and SE flanks within 700-1,500 m of the summit crater and ash from the events drifted SW, S, SE, NE, and E. Sulfur dioxide emissions ranged between 149-1,205 t/d, the latter of which was measured on 10 June. Short-term observations from EDM and electronic tiltmeter monitoring indicated that the upper slopes were inflating since February 2023. Longer-term ground deformation parameters based on EDM, precise leveling, continuous GPS, and electronic tilt monitoring indicated that the volcano remained inflated, especially on the NW and SE flanks. At 1000 on 5 June the Volcano Alert Level (VAL) was raised to 2 (on a 0-5 scale). PHIVOLCS noted that although low-level volcanic earthquakes, ground deformation, and volcanic gas emissions indicated unrest, the steep increase in rockfall frequency may indicate increased dome activity.
A total of 151 dome-collapse PDCs occurred during 8-9 and 11-30 June, traveled 500-2,000 m, and deposited material on the S flank within 2 km of the summit crater. During 8-9 June the VAL was raised to 3. At approximately 1947 on 11 June lava flow activity was reported; two lobes traveled within 500 m from the crater and deposited material on the S (Mi-isi), SE (Bonga), and E (Basud) flanks. Weak seismicity accompanied the lava flow and slight inflation on the upper flanks. This lava flow remained active through 30 June, moving down the S and SE flank as far as 2.5 km and 1.8 km, respectively and depositing material up to 3.3 km from the crater. During 15-16 June traces of ashfall from the PDCs were reported in Sitio Buga, Nabonton, City of Ligao and Purok, and San Francisco, Municipality of Guinobatan. During 28-29 June there were two PDCs generated by the collapse of the lava flow front, which generated a light-brown ash plume 1 km high. Satellite monitors detected significant concentrations of sulfur dioxide beginning on 29 June. On 30 June PDCs primarily affected the Basud Gully on the E flank, the largest of which occurred at 1301 and lasted eight minutes, based on the seismic record. Four PDCs generated between 1800 and 2000 that lasted approximately four minutes each traveled 3-4 km on the E flank and generated an ash plume that rose 1 km above the crater and drifted N and NW. Ashfall was recorded in Tabaco City.
Similar strong activity continued during July; slow lava effusion remained active on the S and SE flanks and traveled as far as 2.8 km and 2.8 km, respectively and material was deposited as far as 4 km from the crater. There was a total of 6,983 rockfall events and 189 PDCs that affected the S, SE, and E flanks. The volcano network detected a total of 2,124 volcanic earthquakes. Continuous gas-and-steam emissions rose 200-2,000 m above the crater and drifted in multiple directions. Sulfur dioxide emissions averaged 792-4,113 t/d, the latter of which was measured on 28 July. During 2-4 July three PDCs were generated from the collapse of the lava flow and resulting light brown plumes rose 200-300 m above the crater. Continuous tremor pulses were reported beginning at 1547 on 3 July through 7 July at 1200, at 2300 on 8 July and going through 0300 on 10 July, and at 2300 on 16 July, as recorded by the seismic network. During 6-9 July there were 10 lava flow-collapse-related PDCs that generated light brown plumes 300-500 m above the crater. During 10-11 July light ashfall was reported in some areas of Mabinit, Legazpi City, Budiao and Salvacion, Daraga, and Camalig, Albay. By 18 July the lava flow advanced 600 m on the E flank as well.
During 1733 on 18 July and 0434 on 19 July PHIVOLCS reported 30 “ashing” events, which are degassing events accompanied by audible thunder-like sounds and entrained ash at the crater, which produced short, dark plumes that drifted SW. These events each lasted 20-40 seconds, and plume heights ranged from 150-300 m above the crater, as recorded by seismic, infrasound, visual, and thermal monitors. Three more ashing events occurred during 19-20 July. Short-term observations from electronic tilt and GPS monitoring indicate deflation on the E lower flanks in early July and inflation on the NW middle flanks during the third week of July. Longer-term ground deformation parameters from EDM, precise leveling, continuous GPS, and electronic tilt monitoring indicated that the volcano was still generally inflated relative to baseline levels. A short-lived lava pulse lasted 28 seconds at 1956 on 21 July, which was accompanied by seismic and infrasound signals. By 22 July, the only lava flow that remained active was on the SE flank, and continued to extend 3.4 km, while those on the S and E flanks weakened markedly. One ashing event was detected during 30-31 July, whereas there were 57 detected during 31 July-1 August; according to PHIVOLCS beginning at approximately 1800 on 31 July eruptive activity was dominated by phases of intermittent ashing, as well as increased in the apparent rates of lava effusion from the summit crater. The ashing phases consisted of discrete events recorded as low-frequency volcanic earthquakes (LFVQ) typically 30 seconds in duration, based on seismic and infrasound signals. Gray ash plume rose 100 m above the crater and generally drifted NE. Shortly after these ashing events began, new lava began to effuse rapidly from the crater, feeding the established flowed on the SE, E, and E flanks and generating frequent rockfall events.
Intensified unrest persisted during August. There was a total of 4,141 rockfall events, 2,881 volcanic earthquakes, which included volcanic tremor events, 32 ashing events, and 101 PDCs detected throughout the month. On clear weather days, gas-and-steam emissions rose 300-1,500 m above the crater and drifted in different directions (figure 54). Sulfur dioxide emissions averaged 735-4,756 t/d, the higher value of which was measured on 16 August. During 1-2 August the rate of lava effusion decreased, but continued to feed the flows on the SE, S, and E flanks, maintaining their advances to 3.4 km, 2.8 km, and 1.1 km from the crater, respectively (figure 55). Rockfall and PDCs generated by collapses at the lava flow margins and from the summit dome deposited material within 4 km of the crater. During 3-4 August there were 10 tremor events detected that lasted 1-4 minutes. Short-lived lava pulse lasted 35 seconds and was accompanied by seismic and infrasound signals at 0442 on 6 August. Seven collapses were recorded at the front of the lava flow during 12-14 August.
During September, similar activity of slow lava effusion, PDCs, gas-and-steam emissions, and seismicity continued. There was a total of 4,452 rockfall events, 329 volcanic earthquakes, which included volcanic tremor events, two ashing events, and 85 PDCs recorded throughout the month. On clear weather days, gas-and-steam emissions rose 100-1,500 m above the crater and drifted in multiple directions. Sulfur dioxide emissions averaged 609-2,252 t/d, the higher average of which was measured on 6 September. Slow lava effusion continued advancing on the SE, S, and E flanks, maintaining lengths of 3.4 km, 2.8 km, and 1.1 km, respectively. Rockfall and PDC events generated by collapses along the lava flow margins and at the summit dome deposited material within 4 km of the crater.
Geologic Background. Symmetrical Mayon, which rises above the Albay Gulf NW of Legazpi City, is the most active volcano of the Philippines. The steep upper slopes are capped by a small summit crater. Recorded eruptions since 1616 CE range from Strombolian to basaltic Plinian, with cyclical activity beginning with basaltic eruptions, followed by longer periods of andesitic lava flows. Eruptions occur predominately from the central conduit and have also produced lava flows that travel far down the flanks. Pyroclastic density currents and mudflows have commonly swept down many of the approximately 40 ravines that radiate from the summit and have often damaged populated lowland areas. A violent eruption in 1814 killed more than 1,200 people and devastated several towns.
Information Contacts: Philippine Institute of Volcanology and Seismology (PHIVOLCS), Department of Science and Technology, University of the Philippines Campus, Diliman, Quezon City, Philippines (URL: http://www.phivolcs.dost.gov.ph/); MIROVA (Middle InfraRed Observation of Volcanic Activity), a collaborative project between the Universities of Turin and Florence (Italy) supported by the Centre for Volcanic Risk of the Italian Civil Protection Department (URL: http://www.mirovaweb.it/); Hawai'i Institute of Geophysics and Planetology (HIGP) - MODVOLC Thermal Alerts System, School of Ocean and Earth Science and Technology (SOEST), Univ. of Hawai'i, 2525 Correa Road, Honolulu, HI 96822, USA (URL: http://modis.higp.hawaii.edu/); Copernicus Browser, Copernicus Data Space Ecosystem, European Space Agency (URL: https://dataspace.copernicus.eu/browser/); William Rogers, Legazpi City, Albay Province, Philippines.
Nishinoshima (Japan) — October 2023 Cite this Report
Nishinoshima
Japan
27.247°N, 140.874°E; summit elev. 100 m
All times are local (unless otherwise noted)
Eruption plumes and gas-and-steam plumes during May-August 2023
Nishinoshima, located about 1,000 km S of Tokyo, is a small island in the Ogasawara Arc in Japan. The island is the summit of a massive submarine volcano that has prominent submarine peaks to the S, W, and NE. Eruptions date back to 1973 and the current eruption period began in October 2022. Recent activity has consisted of small ash plumes and fumarolic activity (BGVN 48:07). This report covers activity during May through August 2023, using information from monthly reports of the Japan Meteorological Agency (JMA) monthly reports and satellite data.
Activity during May through June was relatively low. The Japan Coast Guard (JCG) did overflights on 14 and 22 June and reported white gas-and-steam emissions rising 600 m and 1,200 m from the central crater of the pyroclastic cone, respectively (figure 125). In addition, multiple white gas-and-steam emissions rose from the inner rim of the W side of the crater and from the SE flank of the pyroclastic cone. Discolored brown-to-green water was observed around almost the entire perimeter of the island; on 22 June light green discolored water was observed off the S coast of the island.
Observations from the Himawari meteorological satellite confirmed an eruption on 9 and 10 July. An eruption plume rose 1.6 km above the crater and drifted N around 1300 on 9 July. Satellite images acquired at 1420 and 2020 on 9 July and at 0220 on 10 July showed continuing emissions that rose 1.3-1.6 km above the crater and drifted NE and N. The Tokyo VAAC reported that an ash plume seen by a pilot and identified in a satellite image at 0630 on 21 July rose to 3 km altitude and drifted S.
Aerial observations conducted by JCG on 8 August showed a white-and-gray plume rising from the central crater of the pyroclastic cone, and multiple white gas-and-steam emissions were rising from the inner edge of the western crater and along the NW-SE flanks of the island (figure 126). Brown-to-green discolored water was also noted around the perimeter of the island.
Intermittent low-to-moderate power thermal anomalies were recorded in the MIROVA graph (Middle InfraRed Observation of Volcanic Activity), showing an increase in both frequency and power beginning in July (figure 127). This increase in activity coincides with eruptive activity on 9 and 10 July, characterized by eruption plumes. According to the MODVOLC thermal alert algorithm, one thermal hotspot was recorded on 20 July. Weak thermal anomalies were also detected in infrared satellite imagery, accompanied by strong gas-and-steam plumes (figure 128).
Geologic Background. The small island of Nishinoshima was enlarged when several new islands coalesced during an eruption in 1973-74. Multiple eruptions that began in 2013 completely covered the previous exposed surface and continued to enlarge the island. The island is the summit of a massive submarine volcano that has prominent peaks to the S, W, and NE. The summit of the southern cone rises to within 214 m of the ocean surface 9 km SSE.
Information Contacts: Japan Meteorological Agency (JMA), 1-3-4 Otemachi, Chiyoda-ku, Tokyo 100-8122, Japan (URL: http://www.jma.go.jp/jma/indexe.html); Tokyo Volcanic Ash Advisory Center (VAAC), 1-3-4 Otemachi, Chiyoda-ku, Tokyo 100-8122, Japan (URL: http://ds.data.jma.go.jp/svd/vaac/data/); MIROVA (Middle InfraRed Observation of Volcanic Activity), a collaborative project between the Universities of Turin and Florence (Italy) supported by the Centre for Volcanic Risk of the Italian Civil Protection Department (URL: http://www.mirovaweb.it/); Copernicus Browser, Copernicus Data Space Ecosystem, European Space Agency (URL: https://dataspace.copernicus.eu/browser/).
Krakatau (Indonesia) — October 2023 Cite this Report
Krakatau
Indonesia
6.1009°S, 105.4233°E; summit elev. 285 m
All times are local (unless otherwise noted)
White gas-and-steam plumes and occasional ash plumes during May-August 2023
Krakatau is located in the Sunda Strait between Java and Sumatra, Indonesia. Caldera collapse during the catastrophic 1883 eruption destroyed Danan and Perbuwatan cones and left only a remnant of Rakata. The post-collapse cone of Anak Krakatau (Child of Krakatau) was constructed within the 1883 caldera at a point between the former Danan and Perbuwatan cones; it has been the site of frequent eruptions since 1927. The current eruption period began in May 2021 and has recently consisted of Strombolian eruptions and ash plumes (BGVN 48:07). This report describes lower levels of activity consisting of ash and white gas-and-steam plumes during May through August 2023, based on information provided by the Indonesian Center for Volcanology and Geological Hazard Mitigation, referred to as Pusat Vulkanologi dan Mitigasi Bencana Geologi (PVMBG), MAGMA Indonesia, and satellite data.
Activity was relatively low during May and June. Daily white gas-and-steam emissions rose 25-200 m above the crater and drifted in different directions. Five ash plumes were detected at 0519 on 10 May, 1241 on 11 May, 0920 on 12 May, 2320 on 12 May, and at 0710 on 13 May, and rose 1-2.5 km above the crater and drifted SW. A webcam image taken on 12 May showed ejection of incandescent material above the vent. A total of nine ash plumes were detected during 6-11 June: at 1434 and 00220 on 6 and 7 June the ash plumes rose 500 m above the crater and drifted NW, at 1537 on 8 June the ash plume rose 1 km above the crater and drifted SW, at 0746 and at 0846 on 9 June the ash plumes rose 800 m and 3 km above the crater and drifted SW, respectively, at 0423, 1431, and 1750 on 10 June the ash plumes rose 2 km, 1.5 km, and 3.5 km above the crater and drifted NW, respectively, and at 0030 on 11 June an ash plume rose 2 km above the crater and drifted NW. Webcam images taken on 10 and 11 June at 0455 and 0102, respectively, showed incandescent material ejected above the vent. On 19 June an ash plume at 0822 rose 1.5 km above the crater and drifted SE.
Similar low activity of white gas-and-steam emissions and few ash plumes were reported during July and August. Daily white gas-and-steam emissions rose 25-300 m above the crater and drifted in multiple directions. Three ash plumes were reported at 0843, 0851, and 0852 on 20 July that rose 500-2,000 m above the crater and drifted NW.
The MIROVA (Middle InfraRed Observation of Volcanic Activity) graph of MODIS thermal anomaly data showed intermittent low-to-moderate power thermal anomalies during May through August 2023 (figure 140). Although activity was often obscured by weather clouds, a thermal anomaly was visible in an infrared satellite image of the crater on 12 May, accompanied by an eruption plume that drifted SW (figure 141).
Geologic Background. The renowned Krakatau (frequently mis-named as Krakatoa) volcano lies in the Sunda Strait between Java and Sumatra. Collapse of an older edifice, perhaps in 416 or 535 CE, formed a 7-km-wide caldera. Remnants of that volcano are preserved in Verlaten and Lang Islands; subsequently the Rakata, Danan, and Perbuwatan cones were formed, coalescing to create the pre-1883 Krakatau Island. Caldera collapse during the catastrophic 1883 eruption destroyed Danan and Perbuwatan, and left only a remnant of Rakata. This eruption caused more than 36,000 fatalities, most as a result of tsunamis that swept the adjacent coastlines of Sumatra and Java. Pyroclastic surges traveled 40 km across the Sunda Strait and reached the Sumatra coast. After a quiescence of less than a half century, the post-collapse cone of Anak Krakatau (Child of Krakatau) was constructed within the 1883 caldera at a point between the former Danan and Perbuwatan cones. Anak Krakatau has been the site of frequent eruptions since 1927.
Information Contacts: Pusat Vulkanologi dan Mitigasi Bencana Geologi (PVMBG, also known as Indonesian Center for Volcanology and Geological Hazard Mitigation, CVGHM), Jalan Diponegoro 57, Bandung 40122, Indonesia (URL: http://www.vsi.esdm.go.id/); MAGMA Indonesia, Kementerian Energi dan Sumber Daya Mineral (URL: https://magma.esdm.go.id/v1); MIROVA (Middle InfraRed Observation of Volcanic Activity), a collaborative project between the Universities of Turin and Florence (Italy) supported by the Centre for Volcanic Risk of the Italian Civil Protection Department (URL: http://www.mirovaweb.it/); Copernicus Browser, Copernicus Data Space Ecosystem, European Space Agency (URL: https://dataspace.copernicus.eu/browser/).
Villarrica (Chile) — October 2023 Cite this Report
Villarrica
Chile
39.42°S, 71.93°W; summit elev. 2847 m
All times are local (unless otherwise noted)
Strombolian activity, gas-and-ash emissions, and crater incandescence during April-September 2023
Villarrica, in central Chile, consists of a 2-km-wide caldera that formed about 3,500 years ago and is located at the base of the presently active cone at the NW margin of a 6-km-wide caldera. Historical eruptions eruptions date back to 1558 and have been characterized by mild-to-moderate explosive activity with occasional lava effusions. The current eruption period began in December 2014 and has recently consisted of nighttime crater incandescence, ash emissions, and seismicity (BGVN 48:04). This report covers activity during April through September 2023 and describes occasional Strombolian activity, gas-and-ash emissions, and nighttime crater incandescence. Information for this report primarily comes from the Southern Andes Volcano Observatory (Observatorio Volcanológico de Los Andes del Sur, OVDAS), part of Chile's National Service of Geology and Mining (Servicio Nacional de Geología y Minería, SERNAGEOMIN) and satellite data.
Seismicity during April consisted of long period (LP) events and tremor (TRE); a total of 9,413 LP-type events and 759 TR-type events were detected throughout the month. Nighttime crater incandescence persisted and was visible in the degassing column. Sulfur dioxide data was obtained using Differential Absorption Optical Spectroscopy Equipment (DOAS) that showed an average value of 1,450 ± 198 tons per day (t/d) during 1-15 April and 1,129 ± 201 t/d during 16-30 April, with a maximum daily value of 2,784 t/d on 9 April. Gas-and-steam emissions of variable intensities rose above the active crater as high as 1.3 km above the crater on 13 April. Strombolian explosions were not observed and there was a slight decrease in the lava lake level.
There were 14,123 LP-type events and 727 TR-type events detected during May. According to sulfur dioxide measurements taken with DOAS equipment, the active crater emitted an average value of 1,826 ± 482 t/d during 1-15 May and 912 ± 41 t/d during 16-30 May, with a daily maximum value of 5,155 t/d on 13 May. Surveillance cameras showed continuous white gas-and-steam emissions that rose as high as 430 m above the crater on 27 May. Nighttime incandescence illuminated the gas column less than 300 m above the crater rim was and no pyroclastic emissions were reported. A landslide was identified on 13 May on the E flank of the volcano 50 m from the crater rim and extending 300 m away; SERNAGEOMIN noted that this event may have occurred on 12 May. During the morning of 27 and 28 May minor Strombolian explosions characterized by incandescent ejecta were recorded at the crater rim; the last reported Strombolian explosions had occurred at the end of March.
Seismic activity during June consisted of five volcano-tectonic (VT)-type events, 21,606 LP-type events, and 2,085 TR-type events. The average value of sulfur dioxide flux obtained by DOAS equipment was 1,420 ± 217 t/d during 1-15 June and 2,562 ± 804 t/d, with a maximum daily value of 4,810 t/d on 17 June. White gas-and-steam emissions rose less than 480 m above the crater; frequent nighttime crater incandescence was reflected in the degassing plume. On 12 June an emission rose 100 m above the crater and drifted NNW. On 15 June one or several emissions resulted in ashfall to the NE as far as 5.5 km from the crater, based on a Skysat satellite image. Several Strombolian explosions occurred within the crater; activity on 15 June was higher energy and ejected blocks 200-300 m on the NE slope. Surveillance cameras showed white gas-and-steam emissions rising 480 m above the crater on 16 June. On 19 and 24 June low-intensity Strombolian activity was observed, ejecting material as far as 200 m from the center of the crater to the E.
During July, seismicity included 29,319 LP-type events, 3,736 TR-type events, and two VT-type events. DOAS equipment recorded two days of sulfur dioxide emissions of 4,220 t/d and 1,009 t/d on 1 and 13 July, respectively. Constant nighttime incandescence was also recorded and was particularly noticeable when accompanied by eruptive columns on 12 and 16 July. Minor explosive events were detected in the crater. According to Skysat satellite images taken on 12, 13, and 16 July, ashfall deposits were identified 155 m S of the crater. According to POVI, incandescence was visible from two vents on the crater floor around 0336 on 12 July. Gas-and-ash emissions rose as high as 1.2 km above the crater on 13 July and drifted E and NW. A series of gas-and-steam pulses containing some ash deposited material on the upper E flank around 1551 on 13 July. During 16-31 July, average sulfur dioxide emissions of 1,679 ± 406 t/d were recorded, with a maximum daily value of 2,343 t/d on 28 July. Fine ash emissions were also reported on 16, 17, and 23 July.
Seismicity persisted during August, characterized by 27,011 LP-type events, 3,323 TR-type events, and three VT-type events. The average value of sulfur dioxide measurements taken during 1-15 August was 1,642 ± 270 t/d and 2,207 ± 4,549 t/d during 16-31 August, with a maximum daily value of 3,294 t/d on 27 August. Nighttime crater incandescence remained visible in degassing columns. White gas-and-steam emissions rose 480 m above the crater on 6 August. According to a Skysat satellite image from 6 August, ash accumulation was observed proximal to the crater and was mainly distributed toward the E slope. White gas-and-steam emissions rose 320 m above the crater on 26 August. Nighttime incandescence and Strombolian activity that generated ash emissions were reported on 27 August.
Seismicity during September was characterized by five VT-type events, 12,057 LP-type events, and 2,058 TR-type events. Nighttime incandescence persisted. On 2 September an ash emission rose 180 m above the crater and drifted SE at 1643 (figure 125) and a white gas-and-steam plume rose 320 m above the crater. According to the Buenos Aires VAAC, periods of continuous gas-and-ash emissions were visible in webcam images from 1830 on 2 September to 0110 on 3 September. Strombolian activity was observed on 2 September and during the early morning of 3 September, the latter event of which generated an ash emission that rose 60 m above the crater and drifted 100 m from the center of the crater to the NE and SW. Ashfall was reported to the SE and S as far as 750 m from the crater. The lava lake was active during 3-4 September and lava fountaining was visible for the first time since 26 March 2023, according to POVI. Fountains captured in webcam images at 2133 on 3 September and at 0054 on 4 September rose as high as 60 m above the crater rim and ejected material onto the upper W flank. Sulfur dioxide flux of 1,730 t/d and 1,281 t/d was measured on 3 and 4 September, respectively, according to data obtained by DOAS equipment.
Strong Strombolian activity and larger gas-and-ash plumes were reported during 18-20 September. On 18 September activity was also associated with energetic LP-type events and notable sulfur dioxide fluxes (as high as 4,277 t/d). On 19 September Strombolian activity and incandescence were observed. On 20 September at 0914 ash emissions rose 50 m above the crater and drifted SSE, accompanied by Strombolian activity that ejected material less than 100 m SSE, causing fall deposits on that respective flank. SERNAGEOMIN reported that a Planet Scope satellite image taken on 20 September showed the lava lake in the crater, measuring 32 m x 35 m and an area of 0.001 km2. Several ash emissions were recorded at 0841, 0910, 1251, 1306, 1312, 1315, and 1324 on 23 September and rose less than 150 m above the crater. The sulfur dioxide flux value was 698 t/d on 23 September and 1,097 t/d on 24 September. On 24 September the Volcanic Alert Level (VAL) was raised to Orange (the third level on a four-color scale). SENAPRED maintained the Alert Level at Yellow (the middle level on a three-color scale) for the communities of Villarrica, Pucón (16 km N), Curarrehue, and Panguipulli.
During 24-25 September there was an increase in seismic energy (observed at TR-events) and acoustic signals, characterized by 1 VT-type event, 213 LP-type events, and 124 TR-type events. Mainly white gas-and-steam emissions, in addition to occasional fine ash emissions were recorded. During the early morning of 25 September Strombolian explosions were reported and ejected material 250 m in all directions, though dominantly toward the NW. On 25 September the average value of sulfur dioxide flux was 760 t/d. Seismicity during 25-30 September consisted of five VT-type events, 1,937 LP-type events, and 456 TR-type events.
During 25-29 September moderate Strombolian activity was observed and ejected material as far as the crater rim. In addition, ash pulses lasting roughly 50 minutes were observed around 0700 and dispersed ENE. During 26-27 September a TR episode lasted 6.5 hours and was accompanied by discrete acoustic signals. Satellite images from 26 September showed a spatter cone on the crater floor with one vent that measured 10 x 14 m and a smaller vent about 35 m NE of the cone. SERNAGEOMIN reported an abundant number of bomb-sized blocks up to 150 m from the crater, as well as impact marks on the snow, which indicated explosive activity. A low-altitude ash emission was observed drifting NW around 1140 on 28 September, based on webcam images. Between 0620 and 0850 on 29 September an ash emission rose 60 m above the crater and drifted NW. During an overflight taken around 1000 on 29 September scientists observed molten material in the vent, a large accumulation of pyroclasts inside the crater, and energetic degassing, some of which contained a small amount of ash. Block-sized pyroclasts were deposited on the internal walls and near the crater, and a distal ash deposit was also visible. The average sulfur dioxide flux measured on 28 September was 344 t/d. Satellite images taken on 29 September ashfall was deposited roughly 3 km WNW from the crater and nighttime crater incandescence remained visible. The average sulfur dioxide flux value from 29 September was 199 t/d. On 30 September at 0740 a pulsating ash emission rose 1.1 km above the crater and drifted NNW (figure 126). Deposits on the S flank extended as far as 4.5 km from the crater rim, based on satellite images from 30 September.
Infrared MODIS satellite data processed by MIROVA (Middle InfraRed Observation of Volcanic Activity) showed intermittent thermal activity during April through September, with slightly stronger activity detected during late September (figure 127). Small clusters of thermal activity were detected during mid-June, early July, early August, and late September. According to the MODVOLC thermal alert system, a total of four thermal hotspots were detected on 7 July and 3 and 23 September. This activity was also intermittently captured in infrared satellite imagery on clear weather days (figure 128).
Geologic Background. The glacier-covered Villarrica stratovolcano, in the northern Lakes District of central Chile, is ~15 km south of the city of Pucon. A 2-km-wide caldera that formed about 3,500 years ago is located at the base of the presently active, dominantly basaltic to basaltic andesite cone at the NW margin of a 6-km-wide Pleistocene caldera. More than 30 scoria cones and fissure vents are present on the flanks. Plinian eruptions and pyroclastic flows that have extended up to 20 km from the volcano were produced during the Holocene. Lava flows up to 18 km long have issued from summit and flank vents. Eruptions documented since 1558 CE have consisted largely of mild-to-moderate explosive activity with occasional lava effusion. Glaciers cover 40 km2 of the volcano, and lahars have damaged towns on its flanks.
Information Contacts: Servicio Nacional de Geología y Minería (SERNAGEOMIN), Observatorio Volcanológico de Los Andes del Sur (OVDAS), Avda Sta María No. 0104, Santiago, Chile (URL: http://www.sernageomin.cl/); Proyecto Observación Villarrica Internet (POVI) (URL: http://www.povi.cl/); Sistema y Servicio Nacional de Prevención y Repuesta Ante Desastres (SENAPRED), Av. Beauchef 1671, Santiago, Chile (URL: https://web.senapred.cl/); Buenos Aires Volcanic Ash Advisory Center (VAAC), Servicio Meteorológico Nacional-Fuerza Aérea Argentina, 25 de mayo 658, Buenos Aires, Argentina (URL: http://www.smn.gov.ar/vaac/buenosaires/inicio.php); MIROVA (Middle InfraRed Observation of Volcanic Activity), a collaborative project between the Universities of Turin and Florence (Italy) supported by the Centre for Volcanic Risk of the Italian Civil Protection Department (URL: http://www.mirovaweb.it/); Hawai'i Institute of Geophysics and Planetology (HIGP) - MODVOLC Thermal Alerts System, School of Ocean and Earth Science and Technology (SOEST), Univ. of Hawai'i, 2525 Correa Road, Honolulu, HI 96822, USA (URL: http://modis.higp.hawaii.edu/); Copernicus Browser, Copernicus Data Space Ecosystem, European Space Agency (URL: https://dataspace.copernicus.eu/browser/).
Merapi (Indonesia) — October 2023 Cite this Report
Merapi
Indonesia
7.54°S, 110.446°E; summit elev. 2910 m
All times are local (unless otherwise noted)
Frequent incandescent avalanches during April-September 2023
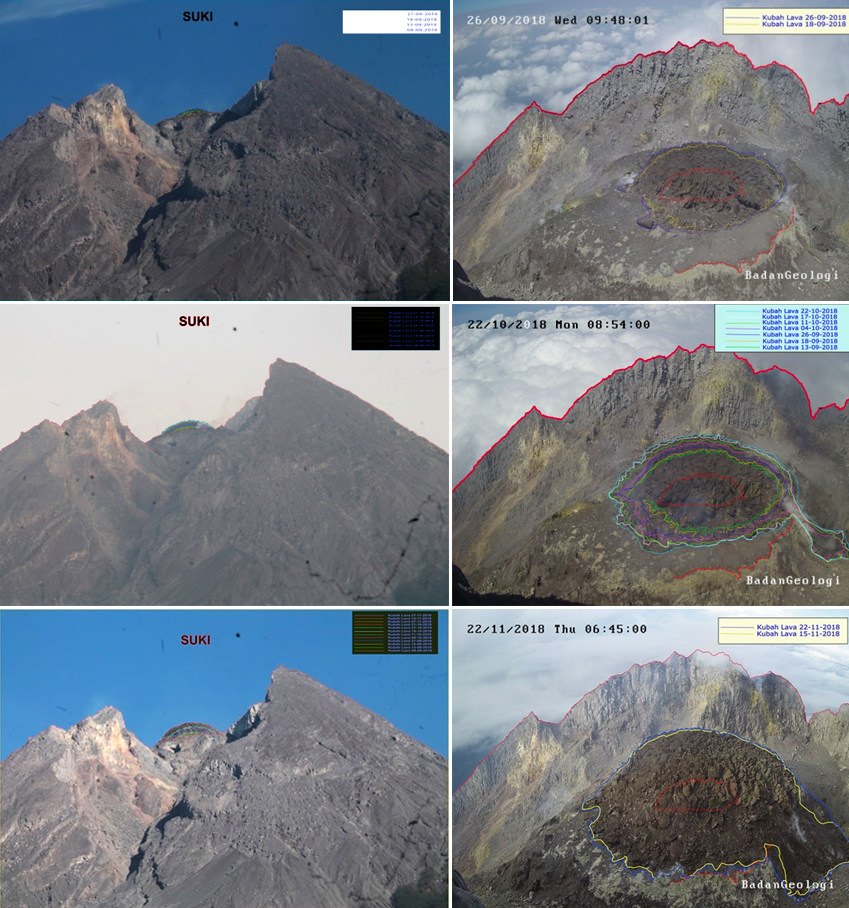
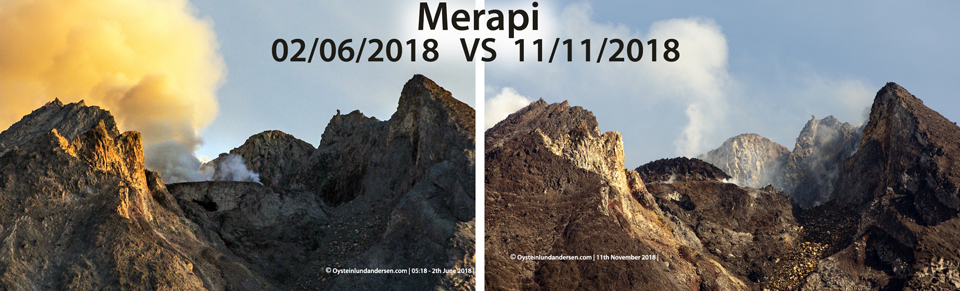
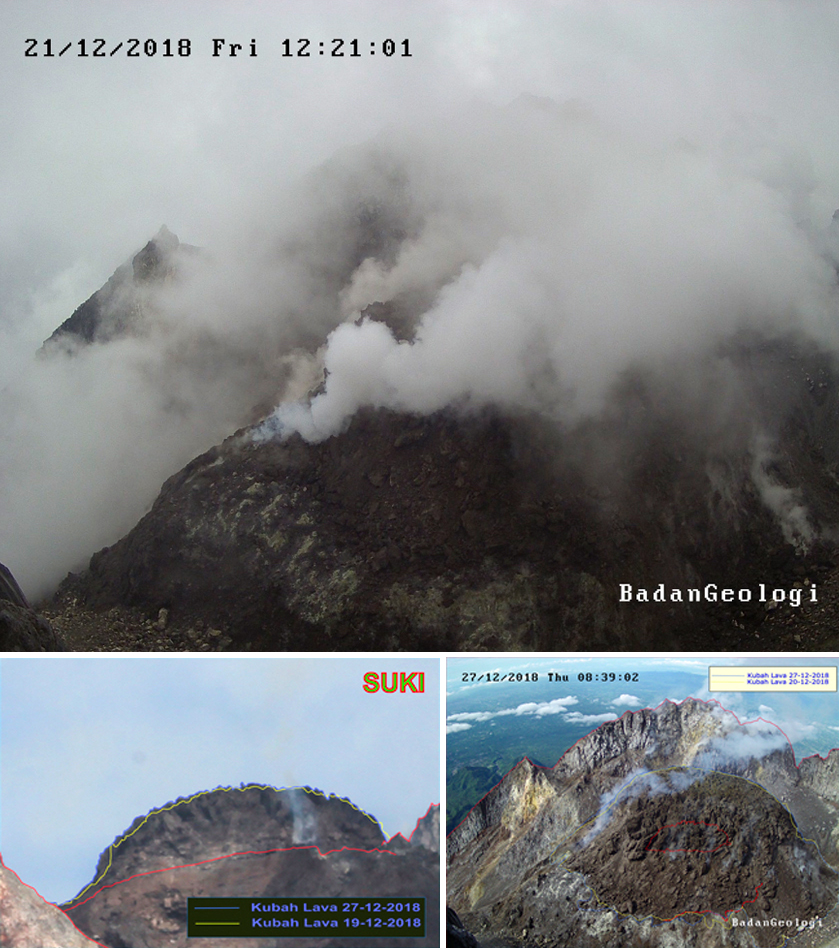
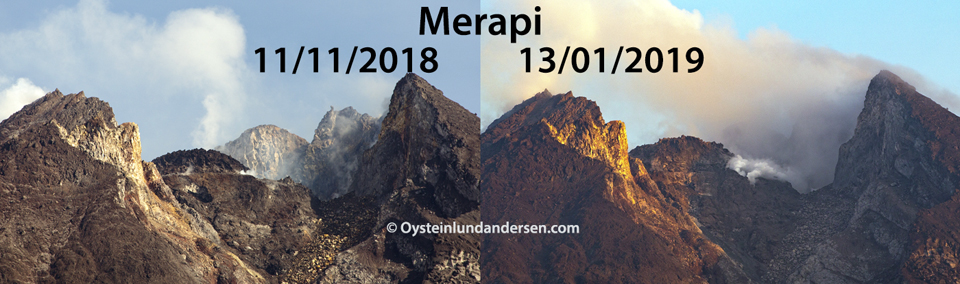
Merapi, located just north of the major city of Yogyakarta in central Java, Indonesia, has had activity within the last 20 years characterized by pyroclastic flows and lahars accompanying growth and collapse of the steep-sided active summit lava dome. The current eruption period began in late December 2020 and has more recently consisted of ash plumes, intermittent incandescent avalanches of material, and pyroclastic flows (BGVN 48:04). This report covers activity during April through September 2023, based on information from Balai Penyelidikan dan Pengembangan Teknologi Kebencanaan Geologi (BPPTKG), the Center for Research and Development of Geological Disaster Technology, a branch of PVMBG which specifically monitors Merapi. Additional information comes from the Pusat Vulkanologi dan Mitigasi Bencana Geologi (PVMBG, also known as Indonesian Center for Volcanology and Geological Hazard Mitigation, CVGHM), MAGMA Indonesia, the Darwin Volcanic Ash Advisory Centre (VAAC), and various satellite data.
Activity during April through September 2023 primarily consisted of incandescent avalanches of material that mainly affected the SW and W flanks and traveled as far as 2.3 km from the summit (table 25) and white gas-and-steam emissions that rose 10-1,000 m above the crater.
Table 25. Monthly summary of avalanches and avalanche distances recorded at Merapi during April through September 2023. The number of reported avalanches does not include instances where possible avalanches were heard but could not be visually confirmed as a result of inclement weather. Data courtesy of BPPTKG (April-September 2023 daily reports).
| Month |
Average number of avalanches per day |
Distance avalanches traveled (m) |
| Apr 2023 |
19 |
1,200-2,000 |
| May 2023 |
22 |
500-2,000 |
| Jun 2023 |
18 |
1,200-2,000 |
| Jul 2023 |
30 |
300-2,000 |
| Aug 2023 |
25 |
400-2,300 |
| Sep 2023 |
23 |
600-2,000 |
BPPTKG reported that during April and May white gas-and-steam emissions rose 10-750 m above the crater, incandescent avalanches descended 500-2,000 m on the SW and W flanks (figure 135). Cloudy weather often prevented clear views of the summit, and sometimes avalanches could not be confirmed. According to a webcam image, a pyroclastic flow was visible on 17 April at 0531. During the week of 28 April and 4 May a pyroclastic flow was reported on the SW flank, traveling up to 2.5 km. According to a drone overflight taken on 17 May the SW lava dome volume was an estimated 2,372,800 cubic meters and the dome in the main crater was an estimated 2,337,300 cubic meters.
During June and July similar activity persisted with white gas-and-steam emissions rising 10-350 m above the crater and frequent incandescent avalanches that traveled 300-2,000 m down the SW, W, and S flanks (figure 136). Based on an analysis of aerial photos taken on 24 June the volume of the SW lava dome was approximately 2.5 million cubic meters. A pyroclastic flow was observed on 5 July that traveled 2.7 km on the SW flank. According to the Darwin VAAC multiple minor ash plumes were identified in satellite images on 19 July that rose to 3.7 km altitude and drifted S and SW. During 22, 25, and 26 July a total of 17 avalanches descended as far as 1.8 km on the S flank.
Frequent white gas-and-steam emissions continued during August and September, rising 10-450 m above the crater. Incandescent avalanches mainly affected the SW and W flanks and traveled 400-2,300 m from the vent (figure 137). An aerial survey conducted on 10 August was analyzed and reported that estimates of the SW dome volume was 2,764,300 cubic meters and the dome in the main crater was 2,369,800 cubic meters.
Frequent and moderate-power thermal activity continued throughout the reporting period, according to a MIROVA (Middle InfraRed Observation of Volcanic Activity) analysis of MODIS satellite data (figure 138). There was an increase in the number of detected anomalies during mid-May. The MODVOLC thermal algorithm recorded a total of 47 thermal hotspots: six during April, nine during May, eight during June, 15 during July, four during August, and five during September. Some of this activity was captured in infrared satellite imagery on clear weather days, sometimes accompanied by incandescent material on the SW flank (figure 139).
Geologic Background. Merapi, one of Indonesia's most active volcanoes, lies in one of the world's most densely populated areas and dominates the landscape immediately north of the major city of Yogyakarta. It is the youngest and southernmost of a volcanic chain extending NNW to Ungaran volcano. Growth of Old Merapi during the Pleistocene ended with major edifice collapse perhaps about 2,000 years ago, leaving a large arcuate scarp cutting the eroded older Batulawang volcano. Subsequent growth of the steep-sided Young Merapi edifice, its upper part unvegetated due to frequent activity, began SW of the earlier collapse scarp. Pyroclastic flows and lahars accompanying growth and collapse of the steep-sided active summit lava dome have devastated cultivated lands on the western-to-southern flanks and caused many fatalities.
Information Contacts: Balai Penyelidikan dan Pengembangan Teknologi Kebencanaan Geologi (BPPTKG), Center for Research and Development of Geological Disaster Technology (URL: http://merapi.bgl.esdm.go.id/, Twitter: @BPPTKG); MAGMA Indonesia, Kementerian Energi dan Sumber Daya Mineral (URL: https://magma.esdm.go.id/v1); Pusat Vulkanologi dan Mitigasi Bencana Geologi (PVMBG, also known as Indonesian Center for Volcanology and Geological Hazard Mitigation, CVGHM), Jalan Diponegoro 57, Bandung 40122, Indonesia (URL: http://www.vsi.esdm.go.id/); Darwin Volcanic Ash Advisory Centre (VAAC), Bureau of Meteorology, Northern Territory Regional Office, PO Box 40050, Casuarina, NT 0811, Australia (URL: http://www.bom.gov.au/info/vaac/); MIROVA (Middle InfraRed Observation of Volcanic Activity), a collaborative project between the Universities of Turin and Florence (Italy) supported by the Centre for Volcanic Risk of the Italian Civil Protection Department (URL: http://www.mirovaweb.it/); Hawai'i Institute of Geophysics and Planetology (HIGP) - MODVOLC Thermal Alerts System, School of Ocean and Earth Science and Technology (SOEST), Univ. of Hawai'i, 2525 Correa Road, Honolulu, HI 96822, USA (URL: http://modis.higp.hawaii.edu/); Copernicus Browser, Copernicus Data Space Ecosystem, European Space Agency (URL: https://dataspace.copernicus.eu/browser/); Øystein Lund Andersen (URL: https://www.oysteinlundandersen.com/, https://twitter.com/oysteinvolcano).
Ebeko
Russia
50.686°N, 156.014°E; summit elev. 1103 m
All times are local (unless otherwise noted)
Moderate explosive activity with ash plumes continued during June-November 2023
Ebeko, located on the N end of Paramushir Island in Russia’s Kuril Islands just S of the Kamchatka Peninsula, consists of three summit craters along a SSW-NNE line at the northern end of a complex of five volcanic cones. Observed eruptions date back to the late 18th century and have been characterized as small-to-moderate explosions from the summit crater, accompanied by intense fumarolic activity. The current eruptive period began in June 2022, consisting of frequent explosions, ash plumes, and thermal activity (BGVN 47:10, 48:06). This report covers similar activity during June-November 2023, based on information from the Kamchatka Volcanic Eruptions Response Team (KVERT) and satellite data.
Moderate explosive activity continued during June-November 2023 (figures 50 and 51). According to visual data from Severo-Kurilsk, explosions sent ash 2-3.5 km above the summit (3-4.5 km altitude) during most days during June through mid-September. Activity after mid-September was slightly weaker, with ash usually reaching less than 2 km above the summit. According to KVERT the volcano in October and November was, with a few exceptions, either quiet or obscured by clouds that prevented satellite observations. KVERT issued Volcano Observatory Notices for Aviation (VONA) on 8 and 12 June, 13 and 22 July, 3 and 21 August, and 31 October warning of potential aviation hazards from ash plumes drifting 3-15 km from the volcano. Based on satellite data, KVERT reported a persistent thermal anomaly whenever weather clouds permitted viewing.
Geologic Background. The flat-topped summit of the central cone of Ebeko volcano, one of the most active in the Kuril Islands, occupies the northern end of Paramushir Island. Three summit craters located along a SSW-NNE line form Ebeko volcano proper, at the northern end of a complex of five volcanic cones. Blocky lava flows extend west from Ebeko and SE from the neighboring Nezametnyi cone. The eastern part of the southern crater contains strong solfataras and a large boiling spring. The central crater is filled by a lake about 20 m deep whose shores are lined with steaming solfataras; the northern crater lies across a narrow, low barrier from the central crater and contains a small, cold crescentic lake. Historical activity, recorded since the late-18th century, has been restricted to small-to-moderate explosive eruptions from the summit craters. Intense fumarolic activity occurs in the summit craters, on the outer flanks of the cone, and in lateral explosion craters.
Information Contacts: Kamchatka Volcanic Eruptions Response Team (KVERT), Far Eastern Branch, Russian Academy of Sciences, 9 Piip Blvd., Petropavlovsk-Kamchatsky, 683006, Russia (URL: http://www.kscnet.ru/ivs/kvert/).
Search Bulletin Archive by Publication Date
Select a month and year from the drop-downs and click "Show Issue" to have that issue displayed in this tab.
The default month and year is the latest issue available.
Bulletin of the Global Volcanism Network - Volume 44, Number 04 (April 2019)
Managing Editor: Edward Venzke
Dukono (Indonesia)
Numerous ash explosions from October 2018 through March 2019
Erta Ale (Ethiopia)
Continued summit activity and lava flow to the E during April 2018-March 2019
Etna (Italy)
Lava flows from NSEC scoria cone and SE flank fissure in December 2018; ash emissions through March 2019
Fuego (Guatemala)
Frequent explosive activity with ash plumes, avalanches, lava flows, and lahars from July 2018 through March 2019
Heard (Australia)
Thermal hotspots continue during October 2018-March 2019 at the summit and on the upper flanks
Merapi (Indonesia)
Dome appears at summit on 12 August 2018; grows to 447,000 m3 by late March 2019
Rincon de la Vieja (Costa Rica)
Occasional weak phreatic explosions continue through February 2019
San Cristobal (Nicaragua)
Weak ash explosions in January and March 2019
Semeru (Indonesia)
Decreased activity after October 2018
Turrialba (Costa Rica)
Frequent passive ash emissions continue through February 2019
Dukono
Indonesia
1.6992°N, 127.8783°E; summit elev. 1273 m
All times are local (unless otherwise noted)
Numerous ash explosions from October 2018 through March 2019
The eruption at Dukono that began in 1933 has showered the area with ash from frequent explosions (BGVN 43:04, 43:12). The Pusat Vulkanologi dan Mitigasi Bencana Geologi (PVMBG), also known as the Center for Volcanology and Geological Hazard Mitigation (CVGHM), is responsible for monitoring this volcano.
This long-term pattern of intermittent ash explosions continued during October 2018-March 2019, with ash plumes rising to between 1.5 and 2.7 km altitude, or about 300-1,500 m above the summit (table 19). Although meteorological clouds often obscured views, satellite imagery captured typical ash plumes on 28 September 2018 (figure 10) and 5 February 2019 (figure 11). Instruments aboard NASA satellites (TROPOMI and OMPS) detected high levels of sulfur dioxide near or directly above the volcano on multiple days during January-March 2019. The Alert Level remained at 2 (on a scale of 1-4), and visitors were warned to remain outside of the 2-km exclusion zone.
Table 19. Monthly summary of reported ash plumes from Dukono for October 2018-March 2019. The direction of drift for the ash plume through each month was highly variable. Data courtesy of the Darwin VAAC and PVMBG.
| Month |
Plume Altitude (km) |
Notable Plume Drift |
| Oct 2018 |
1.5-2.1 |
-- |
| Nov 2018 |
1.5-2.1 |
-- |
| Dec 2018 |
1.5-2.4 |
-- |
| Jan 2019 |
1.8-2.1 |
-- |
| Feb 2019 |
1.8-2.7 |
-- |
| Mar 2019 |
1.5-2.4 |
-- |
Geologic Background. The Dukono complex in northern Halmahera is on an edifice with a broad, low profile containing multiple peaks and overlapping craters. Almost continuous explosive eruptions, sometimes accompanied by lava flows, have occurred since 1933. During a major eruption in 1550 CE, a lava flow filled in the strait between Halmahera and the Gunung Mamuya cone, 10 km NE. Malupang Wariang, 1 km SW of the summit crater complex, contains a 700 x 570 m crater that has also had reported eruptions.
Information Contacts: Pusat Vulkanologi dan Mitigasi Bencana Geologi (PVMBG, also known as Indonesian Center for Volcanology and Geological Hazard Mitigation, CVGHM), Jalan Diponegoro 57, Bandung 40122, Indonesia (URL: http://www.vsi.esdm.go.id/); Darwin Volcanic Ash Advisory Centre (VAAC), Bureau of Meteorology, Northern Territory Regional Office, PO Box 40050, Casuarina, NT 0811, Australia (URL: http://www.bom.gov.au/info/vaac/); Global Sulfur Dioxide Monitoring Page, Atmospheric Chemistry and Dynamics Laboratory, NASA Goddard Space Flight Center (NASA/GSFC), 8800 Greenbelt Road, Goddard, Maryland, USA (URL: https://so2.gsfc.nasa.gov/); Sentinel Hub Playground (URL: https://www.sentinel-hub.com/explore/sentinel-playground).
Erta Ale (Ethiopia) — April 2019 Cite this Report
Erta Ale
Ethiopia
13.601°N, 40.666°E; summit elev. 585 m
All times are local (unless otherwise noted)
Continued summit activity and lava flow to the E during April 2018-March 2019
Erta Ale is the most active volcano in Ethiopia, containing multiple active pit craters within both the summit and southeast calderas. Multiple recent lava flows are visible as darker-colored areas on the broad flanks. A new fissure eruption began in January 2017, forming a lava lake and multiple large lava flow fields during January 2017-March 2018. This report summarizes activity during April 2018 through March 2019 and is based on satellite data.
During April 2018 through March 2019 minor activity continued in the calderas and along the active lava flow to the E. Several persistent thermal anomalies were present in both the summit and southeast calderas (figure 88). A small lava outbreak was detected in Sentinel-2 thermal data on 25 December 2018 located approximately 6 km from the vent. Numerous small outbreak flows at the distal end of the lava flow located around 10-15 km away from the vent (figure 89).
Thermal activity using MODIS detected by the MIROVA system has been stable with a slight decrease in energy since January 2019 (figure 90). The number of thermal alerts identified by the MODVOLC system was typically below 20/month (figure 91), but with notably lower numbers in April, August, September, and November 2018, and February-March 2019. There were 30 alerts noted in December 2018.
Sentinel-1 imagery analyzed by Christopher Moore, University of Leeds (Moore et al., in prep, 2019), show a lowering of the lava lake level down to 70-90 m below the rim in October 2018, consistent with broader recent trends. Lava lake activity since late 2014 can be broken down into four stages: the pre-eruption stage during October 2014-January 2017 when the level was stable at less than 20 m below the rim; the initial fissure eruption during 11-28 January 2017 when there was a rapid drop from a state of overflowing down to 80-100 m below the rim; the early stage of the eruption period during January 2017 through mid-2017 when there was a gradual rise up to 50-70 m below the rim; and the late eruption stage during mid-2017 through October 2018 when there was a gradual drop down to 70-90 m below the rim.
Reference: Moore, C., Wright, T., Hooper, A., and Biggs, J., In Prep. Insights into the Shallow Plumbing System of Erta 'Ale Volcano, Ethiopia, from the Long-Lived 2017 Eruption.
Geologic Background. The Erta Ale basaltic shield volcano in Ethiopia has a 50-km-wide edifice that rises more than 600 m from below sea level in the Danakil depression. The volcano includes a 0.7 x 1.6 km summit crater hosting steep-sided pit craters. Another larger 1.8 x 3.1 km wide depression elongated parallel to the trend of the Erta Ale range is located SE of the summit and is bounded by curvilinear fault scarps on the SE side. Basaltic lava flows from these fissures have poured into the caldera and locally overflowed its rim. The summit caldera usually also holds at least one long-term lava lake that has been active since at least 1967, and possibly since 1906. Recent fissure eruptions have occurred on the N flank.
Information Contacts: MIROVA (Middle InfraRed Observation of Volcanic Activity), a collaborative project between the Universities of Turin and Florence (Italy) supported by the Centre for Volcanic Risk of the Italian Civil Protection Department (URL: http://www.mirovaweb.it/); Hawai'i Institute of Geophysics and Planetology (HIGP) - MODVOLC Thermal Alerts System, School of Ocean and Earth Science and Technology (SOEST), Univ. of Hawai'i, 2525 Correa Road, Honolulu, HI 96822, USA (URL: http://modis.higp.hawaii.edu/); Sentinel Hub Playground (URL: https://www.sentinel-hub.com/explore/sentinel-playground); Christopher Moore, Institute of Geophysics and Tectonics, School of Earth and Environment, University of Leeds, Woodhouse Lane, Leeds, LS2 9JT, United Kingdom (URL: https://environment.leeds.ac.uk/see/pgr/2207/chris-moore).
Etna
Italy
37.748°N, 14.999°E; summit elev. 3357 m
All times are local (unless otherwise noted)
Lava flows from NSEC scoria cone and SE flank fissure in December 2018; ash emissions through March 2019
Italy's Mount Etna on the island of Sicily has had historically recorded eruptions for the past 3,500 years and has been erupting continuously since September 2013 through at least March 2019. Lava flows, explosive eruptions with ash plumes, and Strombolian lava fountains commonly occur from its summit areas that include the Northeast Crater (NEC), the Voragine-Bocca Nuova (or Central) complex (VOR-BN), the Southeast Crater (SEC, formed in 1978), and the New Southeast Crater (NSEC, formed in 2011). A new crater, referred to as the "cono della sella" (saddle cone), emerged during early 2017 in the area between SEC and NSEC and has become the highest part of the SEC-NSEC complex. After several months of low-level activity in early 2018, increases in Strombolian activity at several vents began in mid-July (BGVN 43:08). This was followed by new lava flows emerging from the saddle cone and the E vent of the NSEC complex in late August and discontinuous Strombolian activity and intermittent ash emissions through November 2018 (BGVN 43:12). An eruption from a new fissure produced a lava flow into the Valle del Bove in late December 2018 and is covered in this report along with activity through March 2019 that included frequent ash emissions. Information is provided primarily by the Osservatorio Etneo (OE), part of the Catania Branch of Italy's Istituo Nazionale di Geofisica e Vulcanologica (INGV).
For the first three weeks of December 2018, Strombolian activity and ash emissions continued from the summit vents. A series of small flows from multiple vents near the scoria cone inside NSEC formed a small flow field on the E flank mid-month. A lateral eruption from a fissure on the SE flank of NSEC opened on 24 December and produced a series of flows that traveled E into the Valle del Bove for three days. Sporadic ash emissions, some with dense plumes and significant SO2 emissions, were typical throughout January and February 2019. Activity declined significantly during March 2019 to minor ash emissions and ongoing outgassing from the summit vents. The MIROVA plot of thermal energy recorded the increased heat from the lava flows during December 2018, along with minor pulses from the ash emissions and Strombolian activity in January and February (figure 240).
Activity during December 2018. Strombolian activity, with modest ash emissions, continued from the Bocca Nuova, NSEC, and NEC during the first three weeks of December. Lava flowed from the scoria cone located within the E vent of NSEC and was associated with incandescent blocks rolling down the E flank of NSEC. Variable Strombolian activity at the scoria cone beginning on 4 December produced continuous overlapping small flows from several vents near the scoria cone for two weeks (figure 241). Intermittent explosions lasted 5-10 minutes with similar length pauses; activity increased on 16 December with near-continuous lava effusion. Several small flows traveled NE, E, and SE down the E flank of NSEC during the second and third weeks of the month (figure 242). A few flows reached the base of the cone at 2,900 m elevation and were almost a kilometer in length. Small collapses of portions of the lava field also produced minor plumes of ash.
A lateral eruption and intense seismic swarm began on 24 December 2018 from a nearly 2-km-long fissure trending NNW-SSE on the SE flank of NSEC; it produced a flow into the Valle del Bove and covered about 1 km2 (figures 243). The other summit craters produced intense Strombolian activity and abundant ash emissions during 24-27 December. Beginning around 0800 local time on 24 December, degassing intensity from the summit craters increased significantly. In the following hours, intermittent reddish-gray ash emissions rose from Bocca Nuova and NEC becoming continuous by late morning. Shortly after noon, an eruptive fissure opened up at the southeastern base of NSEC, releasing intense Strombolian activity which rapidly formed a dense plume of dark ash. A second smaller fissure located between NSEC and NEC also opened at the same time and produced weaker Strombolian activity that lasted a few tens of minutes. Over the following two hours, the main fissure spread SE, crossing over the western edge of the Valle del Bove and reaching down to 2,400 m elevation. Continuous Strombolian activity of variable intensity occurred at NEC and Bocca Nuova. The ash cloud created by the multiple eruptive vents generated a dense plume that drifted SE, producing ashfall mainly in the area around Zafferana Etnea and Santa Venerina (figure 244).
As the fissure opened it fed several flows that descended the W face of the Valle del Bove (figure 245), past Serra Giannicola Grande, merged into a single flow at the base of the wall, and continued E across the valley floor. Ash emissions decreased significantly from Bocca Nuova and NEC after 1430 on 24 December. By 1800 the fissure was active mainly at the lower end where it continued to feed the flow in the Valle del Bove with strong Strombolian activity and abundant ash emissions. Around 1830 intense Strombolian activity resumed at Bocca Nuova along with abundant ash emissions which gradually decreased overnight. Effusive activity from the fissure continued through 26 December when it decreased significantly; new lava feeding the flow ended on 27 December, but the flow front continued to move slowly (figure 246). Degassing continued at Bocca Nuova, forming a dilute ash plume that drifted hundreds of km S before dissipating. A persistent SO2 plume was measured with satellite instruments drifting SSE during 25-30 December while the eruptive fissure was active (figure 247).
A significant increase in the release of seismic strain and frequency of earthquakes began around 0830 on 24 December 2018. Around 300 events occurred during the first three hours of increased seismicity which continued throughout the week, with over 2,000 events recorded in different areas around Etna. The initial swarm was located in the summit area near the fissure with events located 0-3 km below sea level; subsequent seismicity was located in the Valle del Bove and included multiple earthquakes with magnitudes greater than M 4.0. The E and SW slopes of the volcano were also affected by seismic events. The largest earthquake (M 4.8) was recorded on 26 December at 0319 local time, located about 1 km below sea level between the towns of Fleri and Pennisi on the Faglia Fiandaca fault. It was widely felt in many urban centers and caused damage in some areas. INGV noted that it was likely not generated by movement of magmatic material in the epicentral area.
Activity during January 2019. No lava flow activity was reported in January, but sporadic ash emissions and weak Strombolian activity persisted at NEC and Bocca Nuova (figure 248); occasional nighttime incandescent bursts were seen from Voragine. During one of these ash-emission episodes, on the evening of 18 January, fine ashfall was reported on the SE flank in the towns of Zafferana Etnea and Santa Venerina. Slight increases in volcanic tremor amplitude accompanied incandescent flashes from Voragine crater on the evenings of 16 and 18 January and in the early morning of 21 January (figure 249). On 19 January gas emissions and explosions were reported from a new vent near the NE edge of VOR, about 40 m NW from the 7 August 2016 vent (figure 250).
Newly available higher resolution SO2 data from the TROPOMI Tropospheric Monitoring Instrument on board the Copernicus Sentinel-5 Precursor (S5P) satellite showed persistent SO2 plumes from Etna that drifted significant distances in multiple directions before dissipating for much of the month. The strongest plumes were recorded during 16-22 January 2019 (figure 251).
Ash emissions intensified during the last week of January. During the morning of 23 January 2019 a dense ash plume drifted ENE from NEC, producing ashfall on the E flank of the volcano as far as the coast, including in Giarre (figure 252). Discontinuous ash emissions were reported from Bocca Nuova on 25 January; the following morning ash emissions intensified again from NEC and drifted S, producing ashfall in the S flank as far as Catania (figure 253). Emissions persisted until sometime during the night of 26-27 January. The ashfall from 22-23 and 26 January were analyzed by INGV personnel; the components were 95-97% lithic fragments and crystals with only 3-5% juvenile material. An ash plume from Bocca Nuova on 28 January drifted E and produced ashfall in the Valle del Bove. Ash emission decreased from Bocca Nuova on 29-30 January; only dilute ash was observed from NEC during the last few days of the month.
Activity during February 2019. Typical degassing and discontinuous explosive activity from the summit characterized Etna during February. An explosion was observed at NEC at 0230 UTC on 2 February which initially produced a dense ash plume that drifted NE, producing ashfall in the summit area and the Piano Provenzana. Ash emission decreased throughout the day. Repeated ash emissions were visible beginning in the afternoon of 6 February from NEC after several days of cloudy weather. Continuous ash emissions were observed overnight on 7-8 February, producing a dilute plume that drifted S then SE. A similar dilute ash emission was observed on 9 February; the plume drifted SW. Analysis of the ash by INGV indicated a similar composition to the samples measured two weeks prior. Webcams captured numerous pulsating ash emissions from NEC in mid-February, many of which produced substantial SO2 plumes (figure 254). Emissions increased in intensity and frequency and were nearly continuous during most of the third week, with plumes drifting W, S, and SE resulting in ashfall in those directions, and also led to temporary air space closures in Catania and Comiso (figures 255 and 256). Also during the third week, Strombolian activity took place at BN-1, while pulsating degassing was observed at BN-2. Incandescent degassing continued at the vent located on the N edge of Voragine. Irregular ash emissions that rapidly dispersed near the summit were produced by BN on 26 and 27 February.
Activity during March 2019. Discontinuous and moderate outgassing characterized activity at all the summit vents of Etna throughout March 2018 after an ash plume from Bocca Nuova on 2 March reached 4 km above the crater. The ash plume was accompanied by seismic activity that INGV concluded was likely related to an intra-crater collapse. The discontinuous degassing was interrupted on 16 March by a single small emission of brown ash from Bocca Nuova which rapidly dissipated (figure 257). During a site visit on 30 March, INGV personnel noted pulsating degassing with apparent temperatures above 250°C from the new vent formed in mid-January at the E rim of Voragine (figure 258). At NEC, low-temperature pulsating degassing was occurring at the vent at the bottom of the crater and from fumaroles along the inner walls (figure 259).
Geologic Background. Mount Etna, towering above Catania on the island of Sicily, has one of the world's longest documented records of volcanism, dating back to 1500 BCE. Historical lava flows of basaltic composition cover much of the surface of this massive volcano, whose edifice is the highest and most voluminous in Italy. The Mongibello stratovolcano, truncated by several small calderas, was constructed during the late Pleistocene and Holocene over an older shield volcano. The most prominent morphological feature of Etna is the Valle del Bove, a 5 x 10 km caldera open to the east. Two styles of eruptive activity typically occur, sometimes simultaneously. Persistent explosive eruptions, sometimes with minor lava emissions, take place from one or more summit craters. Flank vents, typically with higher effusion rates, are less frequently active and originate from fissures that open progressively downward from near the summit (usually accompanied by Strombolian eruptions at the upper end). Cinder cones are commonly constructed over the vents of lower-flank lava flows. Lava flows extend to the foot of the volcano on all sides and have reached the sea over a broad area on the SE flank.
Information Contacts: Sezione di Catania - Osservatorio Etneo, Istituto Nazionale di Geofisica e Vulcanologia (INGV), Sezione di Catania, Piazza Roma 2, 95123 Catania, Italy (URL: http://www.ct.ingv.it/it/ ); Blog INGVvulcani, Istituto Nazionale di Geofisica e Vulcanologia (INGV); (URL: http://ingvvulcani.wordpress.com); MIROVA (Middle InfraRed Observation of Volcanic Activity), a collaborative project between the Universities of Turin and Florence (Italy) supported by the Centre for Volcanic Risk of the Italian Civil Protection Department (URL: http://www.mirovaweb.it/); Global Sulfur Dioxide Monitoring Page, Atmospheric Chemistry and Dynamics Laboratory, NASA Goddard Space Flight Center (NASA/GSFC), 8800 Greenbelt Road, Goddard, Maryland, USA (URL: https://so2.gsfc.nasa.gov/).
Fuego
Guatemala
14.4748°N, 90.8806°W; summit elev. 3799 m
All times are local (unless otherwise noted)
Frequent explosive activity with ash plumes, avalanches, lava flows, and lahars from July 2018 through March 2019
Fuego is one of Guatemala's most active volcanoes, regularly producing ash plumes and incandescent ballistic ejecta, along with lava flows, avalanches, pyroclastic flows, and lahars down the ravines (barrancas) and rivers (figure 104). Frequent ash plumes have been recorded in recent years (figure 105). A major eruptive event occurred on 3-5 June that resulted in fatalities. Thermal data show an increase in activity from November 2018, that continued through the reporting period (figure 106). This report summarizes activity from July 2018 through March 2019 based on reports by Instituto Nacional de Sismologia, Vulcanología, Meteorología e Hidrologia (INSIVUMEH) and the National Office of Disaster Management (CONRED), Washington Volcanic Ash Advisory Center (VAAC), satellite data.
Gas emissions and avalanches characterized activity in early July 2018; an increase was reported on the 4th. Avalanches descended through the Cenizas, Las Lajas, and Santa Teresa ravines on the 6th. One explosion every two hours on 8 July produced ash plumes up to 4.3 km altitude (500 m above the crater) that dispersed towards the SW. Avalanches down the flanks accompanied this activity. On 10 July ash plumes rose to 4.2 and 5 km altitude dispersing to the SW, and ashfall was reported in Morelia and Panimache (figure 107). Avalanches continued on the 19-20 and 23-24 July and weak explosions on the 23-24 produced low ash plumes that dispersed to the N. Hot lahars containing blocks 2-3 m in diameter and tree trunks and branches were generated in the Taniluyá, Ceniza, El Jute, and Las Lajas ravines on 30 and 31 July, and 2 and 9 August.
During August and September, weak to moderate explosions produced ash plumes that rose to 4.7 km altitude and incandescent material was ejected to 150 m above the crater, producing avalanches down the ravines. Additional hot lahars carrying boulders and tree branches occurred on 29 August-2 September and 21-27 September down the Honda (E), El Jute (SE), Las Lajas (SE), Cenizas (SSW), Taniluyá (SW), Seca (W), Santa Teresa (W), Niagara (W), Mineral, and Pantaleón (W) drainages.
An increase in activity occurred on 29 September with degassing pulses lasting 3-4 hours recorded and heard. Avalanches occurred on the flanks and weak-moderate explosions occurred at a rate of 10-15 per hour with ash plumes rising up to 4.7 km. Hot lahars traveled down the Seca, Santa Teresa, and Mineral ravines, transporting blocks up to 3 m in diameter along with tree trunks and branches. Similar lahars were generated in the Las Lajas ravine on 5, 8, and 9 October (figure 108). The lahars were hot and smelled of sulfur, and they carried blocks 1-3 m in diameter.
On 12 October activity increased and produced incandescent ejecta up to 100-200 m above the crater and out to 300 m away from the crater, avalanches in the ravines, and a lava flow with a length of 800-1,000 m, that had reached 1,500 m by the 13th. Ash plumes reached 4.8 km altitude and dispersed up to 12 km towards the S and SE. Explosions occurred at a rate of 8-10 per hour with shockwaves that were reported near the volcano. At 1640 a pyroclastic flow was generated down the Seca ravine (figure 109). Similar activity continued through the 13th, with ash plumes reaching 5 km and ashfall reported in communities including Panimache I, Morelia, Santa Sofia, Sangre de Cristo, El Porvenir, and Palo Verde Estate. This episode of increased activity continued for 32 hours. Lahars traveled down the Ceniza and Seca ravines, the Achiguate River, and the Mineral and Taniluyá ravines (both tributaries of the Pantaleón river). A 30-m-wide lahar with a depth of 2 m was reported on 16 October that carried blocks up to 2 m in diameter, tree trunks, and branches. More lahars descended the Las Lajas ravine on the 17-18, and 20 October. Explosions continued through to the end of October, with increased activity on 31 October.
Frequent activity continued into November with elevated activity reported on the 2 and 4-6 November. On 6 November ash plumes rose to 4.8 km altitude and traveled 20 km W and SW resulted in ashfall on communities including Panimache, El Porvenir, Morelia, Santa Sofia, Sangre de Cristo, Palo Verde Estate, and San Pedro Yepocapa. Constant explosions ejected incandescent material to 300 m above the crater. A lava flow 1-1.2 km long observed in the Ceniza ravine generated avalanches from the front of the flow, which continued through the 9th.
Activity increased again on 17 November, initiating the fifth eruptive phase of 2018. There were 10-15 explosions recorded per hour along with ash plumes up to 4.7 km that dispersed 10-15 km to the W and SW. Incandescent material was ejected up to 200-300 m above the crater, and avalanches were generated. A new lava flow reached 800 m down the Ceniza ravine. Ashfall was reported in Panimaché I, Morelia, Santa Sofia, El Porvenir, Sangre de Cristo, Palo Verde Estate, Yepocapa, and other communities.
The elevated activity continued through 18 November with 12-17 explosions per hour and a constant ash plume to 5 km altitude, dispersing to the W and SW for 20-25 km. Moderate avalanches traveled down the Ceniza, Taniluyá, and Seca ravines out to the vegetation line. Incandescent blocks were ejected up to 400 m above the crater. Ashfall was reported in communities including Panimaché I, Morelia, Santa Sofia, Sangre de Cristo, and Palo Verde Estate. Avalanches from the front of the lava flow traveled down the Taniluyá and Seca ravines.
Ash plumes rose to 7 km altitude on the 19th and dispersed 50-60 km towards the W, SW, and NE (figure 110). Incandescent ballistic ejecta reached 1 km above the crater and scattered to over 1 km from the crater (figure 111), with the explosions shaking houses over 15 km away to the W and SW, and avalanches moved down the Seca, Ceniza, Taniluyá, Las Lajas, and Honda ravines reaching the vegetation. Two new lava flows formed, extending to 300 m down the Seca and Santa Teresa ravines. Pyroclastic flows traveled down the Seca, Las Lajas, and Honda ravines. Ashfall due to the generation of pyroclastic flows was reported in Panimaché I and II, Santa Sofía, Sangre de Cristo, Palo Verde Estate, and in Alotenango and Antigua, Guatemala, to the NE. CONRED reported the evacuation of 3,925 people. INSIVUMEH reported that the eruption phase was over at 1800 on 19 November after 32 hours of increased activity.
Explosions continued through 20 November at a rate of 8-13 per hour, ejecting incandescent material up to 200 m above the crater and ash plumes to at least 4.6 km that drifted 20-25 km NW, W, and SW. Avalanches continued with some reaching the vegetation. Ashfall was reported in communities including Panimaché, El Porvenir, Morelia, Santa Sofia, Sangre de Cristo, Palo Verde Estate, and San Pedro Yepocapa.
Similar activity continued through to the end of November with explosions producing shockwaves felt out to 25 km; some explosions were heard in Guatemala City, 40 km ENE. Ash plumes rose to 5 km (figures 112 and 113) and dispersed 20 km W, S, and SW, and ash fell in communities including Panimaché, El Porvenir, Morelia, Santa Sofia, Sangre de Cristo, Palo Verde Estate, San Pedro Yepocapa, Alotenango, and San Miguel Dueñas. Explosions were recorded 10 to 18 per hour. Incandescent ejecta rose to 200 m above the crater and resulted in avalanches in the Las Lajas, Ceniza, El jute, Honda, Taniluyá, Trinidad, and Seca ravines with some reaching the vegetation line. Some avalanches entrained large blocks up to 3 m in diameter that produced ash plumes as they traveled down the ravines. Hot lahars were generated in the Seca, Santa Maria, and Mineral ravines, carrying blocks up to 3 m in diameter (figure 114).
During December white to light gray fumarolic plumes rose to a maximum height of 4.5 km. Ash plumes reached up to 5.2 km and dispersed to a maximum of 25 km S, SW, and W. There were 3-15 explosions recorded per hour with shockwaves, incandescent ejecta reaching 300 m above the crater, and avalanches down the Seca, Taniluyá, Ceniza, Trinidad, Las Lajas, and Honda ravines. Ashfall was reported in communities including Panimaché I and II, Morelia, Santa Sofia, El Porvenir, Palo Verde Estate, Sangre de Cristo, Yepocapa, La Rochela, San Andrés Osuna, Ceylon, Alotenango, and San Pedro.
Similar activity continued through January 2019 with fumarolic plumes rising to a maximum of 4.4 km altitude, ash plumes reaching 4.8 km and dispersing over 15 km to the NE, WSW, and NW; 3-25 explosions per hour sent shockwaves and avalanches in multiple directions. Ashfall was reported in Panimaché, Morelia, Santa Sofia, Sangre de Cristo, Palo Verde Estate, and San Pedro Yepocapa. Also in Alotenango, La Reunion, and El Porvenir, Alotenango.
An increase in activity began on 21 January with moderate to strong explosions producing ash plumes up to 5 km altitude that dispersed 12 km W and SW. The explosions were heard over 15 km away and shook windows and roofs out to 12 km away. Avalanches were triggered in multiple ravines. On 22 January there were 15-25 recorded explosions per hour, each lasting 2-3 minutes and producing ash plumes to 4.8 km and incandescent ejecta up to 300 m above the crater (figure 115).
Frequent explosions continued during February through to late-March, with a range of 8-18 per hour, producing ash plumes rising to 4.8 km (figure 116), and dispersing out to 15 km in multiple directions. Incandescent ejecta rose to 350 m above the crater and resulted in avalanches down multiple ravines. Ashfall was reported in communities including El Rodeo, El Zapote, Ceylon, La Roche-la, Panimache, Morelia, Santa Sofia, Sangre de Cristo, San Miguel Dueñas, Ciudad Vieja, and Alotenango, Verde Estate, San Pedro Yepocapa, La Rochelle, and San Andrés Osuna.
On 22 March there was an increase in the number and energy of explosions with 15-20 per hour. Accompanying ash plumes rose to 5 km altitude and dispersed 25-30 km S, W, SW, E, and SE, depositing ash in La Rochela, Ceylon, Osuna, Las Palmas, Siquinalá, and Santa Lucia Cotzumalguapa. Explosions were heard over 20 km from the volcano. Incandescent ejecta rose to 300 m above the crater and moderate to strong avalanches flowed down the Seca, Taniluyá, Ceniza, Trinidad, Las Lajas and Honda ravines. Explosions increased to 14-32 events per hour by 31 March, continuing to produce ash plumes up to 5 km and depositing ash on nearby communities and causing avalanches down the flanks. A new lava flow reached 800 m down the Seca ravine.
Geologic Background. Volcán Fuego, one of Central America's most active volcanoes, is also one of three large stratovolcanoes overlooking Guatemala's former capital, Antigua. The scarp of an older edifice, Meseta, lies between Fuego and Acatenango to the north. Construction of Meseta dates back to about 230,000 years and continued until the late Pleistocene or early Holocene. Collapse of Meseta may have produced the massive Escuintla debris-avalanche deposit, which extends about 50 km onto the Pacific coastal plain. Growth of the modern Fuego volcano followed, continuing the southward migration of volcanism that began at the mostly andesitic Acatenango. Eruptions at Fuego have become more mafic with time, and most historical activity has produced basaltic rocks. Frequent vigorous eruptions have been recorded since the onset of the Spanish era in 1524, and have produced major ashfalls, along with occasional pyroclastic flows and lava flows.
Information Contacts: Instituto Nacional de Sismologia, Vulcanologia, Meteorologia e Hydrologia (INSIVUMEH), Unit of Volcanology, Geologic Department of Investigation and Services, 7a Av. 14-57, Zona 13, Guatemala City, Guatemala (URL: http://www.insivumeh.gob.gt/); Coordinadora Nacional para la Reducción de Desastres (CONRED), Av. Hincapié 21-72, Zona 13, Guatemala City, Guatemala (URL: http://conred.gob.gt/www/index.php); Washington Volcanic Ash Advisory Center (VAAC), Satellite Analysis Branch (SAB), NOAA/NESDIS OSPO, NOAA Science Center Room 401, 5200 Auth Rd, Camp Springs, MD 20746, USA (URL: www.ospo.noaa.gov/Products/atmosphere/vaac, archive at: http://www.ssd.noaa.gov/VAAC/archive.html); Sentinel Hub Playground (URL: https://www.sentinel-hub.com/explore/sentinel-playground); MIROVA (Middle InfraRed Observation of Volcanic Activity), a collaborative project between the Universities of Turin and Florence (Italy) supported by the Centre for Volcanic Risk of the Italian Civil Protection Department (URL: http://www.mirovaweb.it/); Rudiger Escobar Wolf, Michigan Technologicla University, 630 Dow Environmental Sciences, 1400 Townsend Drive, Houghton, MI 49931, USA (URL: https://www.mtu.edu/geo/department/staff/wolf.html); William Chigna, CONRED (URL: https://twitter.com/william_chigna); BBC News (URL: https://www.bbc.com; https://www.bbc.com/news/world-latin-america-46261168?intlink_from_url=https://www.bbc.com/news/topics/c4n0j0d82l0t/guatemala-volcano&link_location=live-reporting-story); European Pressphoto Agency (URL: http://www.epa.eu/); Agence France-Presse (URL: http://www.afp.com/).
Heard
Australia
53.106°S, 73.513°E; summit elev. 2745 m
All times are local (unless otherwise noted)
Thermal hotspots continue during October 2018-March 2019 at the summit and on the upper flanks
Heard Island, in the Southern Indian Ocean, includes the large Big Ben stratovolcano and the smaller, apparently inactive, Mt. Dixon. Because of the island's remoteness, satellites are the primary monitoring tool. Big Ben has been active intermittently since 1910, and was active during October 2017-September 2018 (BGVN 43:10). Activity continued during October 2018-March 2019.
Satellite photos using Sentinel Hub showed hotspots every month between October 2018 and March 2019. Because the area was frequently covered by a heavy cloud layer, most of the hotspot signals were partially obscured. Though thermal anomalies are usually seen at summit vents, on 18 October 2018 an anomaly was present about 300 m down the E flank. Similarly, on 1 January 2019, a weak anomaly beginning about 200 m down the NW flank was about 300 m long (figure 40).
The MIROVA (Middle InfraRed Observation of Volcanic Activity) system detected three hotspots, two in October and one in early November 2018, all of low radiative power. There were no MODVOLC alert pixels during this period.
Geologic Background. Heard Island on the Kerguelen Plateau in the southern Indian Ocean consists primarily of the emergent portion of two volcanic structures. The large glacier-covered composite basaltic-to-trachytic cone of Big Ben comprises most of the island, and the smaller Mt. Dixon lies at the NW tip of the island across a narrow isthmus. Little is known about the structure of Big Ben because of its extensive ice cover. The active Mawson Peak forms the island's high point and lies within a 5-6 km wide caldera breached to the SW side of Big Ben. Small satellitic scoria cones are mostly located on the northern coast. Several subglacial eruptions have been reported at this isolated volcano, but observations are infrequent and additional activity may have occurred.
Information Contacts: Sentinel Hub Playground (URL: https://www.sentinel-hub.com/explore/sentinel-playground); Hawai'i Institute of Geophysics and Planetology (HIGP) - MODVOLC Thermal Alerts System, School of Ocean and Earth Science and Technology (SOEST), Univ. of Hawai'i, 2525 Correa Road, Honolulu, HI 96822, USA (URL: http://modis.higp.hawaii.edu/); MIROVA (Middle InfraRed Observation of Volcanic Activity), a collaborative project between the Universities of Turin and Florence (Italy) supported by the Centre for Volcanic Risk of the Italian Civil Protection Department (URL: http://www.mirovaweb.it/).
Merapi
Indonesia
7.54°S, 110.446°E; summit elev. 2910 m
All times are local (unless otherwise noted)
Dome appears at summit on 12 August 2018; grows to 447,000 m3 by late March 2019
Merapi volcano in central Java, Indonesia (figure 69), has a lengthy history of major eruptive episodes. Activity has included lava flows, pyroclastic flows, lahars, Plinian explosions with heavy ashfall, incandescent block avalanches, and dome growth and destruction. Fatalities from these events were reported in 1994, 2006, and during a major event in 2010 (BGVN 36:01) where hundreds were killed and hundreds of thousands of people were evacuated. Renewed phreatic explosions in May 2018 cancelled airline fights and generated significant SO2 plumes in the atmosphere. The volcano then remained quiet until an explosion on 11 August 2018 marked the beginning of the growth of a new lava dome. The period June 2018 through March 2019 is covered in this report with information provided primarily by Balai Penyelidikan dan Pengembangan Teknologi Kebencanaan Geologi (BPPTKG), the Center for Research and Development of Geological Disaster Technology, a branch of PVMBG, which monitors activity specifically at Merapi.
The first sign of renewed activity at Merapi came with an explosion and the appearance of a lava dome at the summit on 12 August 2018. The growth rate of the dome fluctuated between August 2018 and January 2019, with a low rate of 1,000 m3/day in late September to a high of 6,200 m3/day in mid-October. By mid-December the dome was large enough to send block avalanches down the Kali Gendol ravine on the SSE flank. The rate of dome growth declined rapidly during January 2019, when most of the new lava moved down the ravine in numerous block avalanches. By late March 2019 the dome had reached 472,000 m3 in volume and block avalanches were occurring every few days.
After the eruptive events between 11 May and 1 June 2018, seismicity fluctuated at levels slightly above normal during June and July, with the highest levels recorded on 18 and 29 July. A VONA on 3 June reported a plume of steam that rose 800 m above the summit; for the rest of June the plume heights gradually decreased to a maximum of 400 m by the third week. During July steam plume heights varied from 30 to 350 m above the summit.
On 1 August 2018 an explosion was heard at the Babadan Post. An explosion on 11 August was heard by residents of Deles on the SE flank. Photos taken in a survey by drone the following day indicated the presence of new material in the middle of the 2010 dome fracture (figure 70). The presence of a new lava dome was confirmed with a site visit on 18 August 2018. The dome was 55 m long and 25 m wide, and about 5 m below the 2010 dome surface (figure 71). As of 23 August, the volume of the dome was 23,000 m3, growing at an average rate of 2,700 m3/day. By the end of the month the volume was estimated to be 54,000 m3 with a growth rate of 4,000 m3/day (figure 72). Throughout the month, persistent steam plumes rose 50-200 m above the summit.
During September-November 2018 the summit dome grew at varying rates from 1,000 to 6,200 m3/day (table 22). At the beginning of September its volume was 54,000 m3; it had reached 329,000 m3 by the end of November (figure 73). Steam plumes in September rose from 100 to 450 m above the summit. They were lower in October, rising only 50-100 m high. During November they rose 100 to400 m above the summit. Intermittent seismic activity remained above background levels. By mid-November, the growth of the dome was clearly visible from the ground 4.5 km S of the summit (figure 74).
Table 22. The volume and growth rate of the lava dome at Merapi was measured weekly from late August 2018 through January 2019. Data courtesy of BPPTKG Merapi weekly reports.
| Date |
Size (m3) |
Rate (m3 / day) |
| 23 Aug 2018 |
23,000 |
2,700 |
| 30 Aug 2018 |
54,000 |
4,000 |
| 06 Sep 2018 |
82,000 |
3,900 |
| 13 Sep 2018 |
103,000 |
3,000 |
| 20 Sep 2018 |
122,000 |
3,000 |
| 27 Sep 2018 |
129,000 |
1,000 |
| 04 Oct 2018 |
135,000 |
1,000 |
| 11 Oct 2018 |
160,000 |
3,100 |
| 18 Oct 2018 |
201,000 |
6,200 |
| 21 Oct 2018 |
219,000 |
6,100 |
| 31 Oct 2018 |
248,000 |
2,900 |
| 07 Nov 2018 |
273,000 |
3,500 |
| 14 Nov 2018 |
290,000 |
2,400 |
| 21 Nov 2018 |
308,000 |
2,600 |
| 29 Nov 2018 |
329,000 |
2,500 |
| 06 Dec 2018 |
344,000 |
2,200 |
| 13 Dec 2018 |
359,000 |
2,200 |
| 19 Dec 2018 |
370,000 |
2,000 |
| 27 Dec 2018 |
389,000 |
2,300 |
| 03 Jan 2019 |
415,000 |
3,800 |
| 10 Jan 2019 |
439,000 |
3,400 |
| 16 Jan 2019 |
453,000 |
2,300 |
| 22 Jan 2019 |
461,000 |
1,300 |
| 29 Jan 2019 |
461,000 |
-- |
| 07 Feb 2019 |
461,000 |
-- |
| 14 Feb 2019 |
461,000 |
-- |
| 21 Feb 2019 |
466,000 |
-- |
| 05 Mar 2019 |
470,000 |
-- |
| 21 Mar 2019 |
472,000 |
-- |
The lava dome continued to grow during December 2018, producing steam plumes that rose 50-200 m. As the height of the dome increased, block avalanches began descending into the upper reaches of Kali Gendol ravine on the SSE flank. Avalanches on 16 and 19 December reached 300 m down the drainage; on 21 December a larger avalanche lasted for 129 seconds and traveled 1 km based on the duration of the seismic data (figure 75). By the end of December BPPTKG measured the volume of the dome as 389,000 m3.
The rate of dome growth declined steadily during January 2019, and by the third week most of the lava extrusion was collapsing as block avalanches into the upper part of Kali Gendol, and dome growth had slowed. Steam plumes rose 50-450 m during the month. In spite of slowing growth, a comparison of the dome size between 11 November 2018 and 13 January 2019 indicated an increase in volume of over 150,000 m3 of material (figure 76). Incandescence at the dome and in the block avalanches was visible at night when the summit was clear (figures 77 and 78). Three block avalanches occurred during the evening of 29 January; the first traveled 1.4 km, the second 1.35 km, and the third 1.1 km down the ravine; each one lasted for about two minutes. By the end of January the size of the dome was reported by BPPTKG to be about 461,000 m3.
Numerous block avalanches were observed during February 2019 as almost all of the lava extrusion was moving down the slope. Multiple avalanches were reported on 7, 11, 18, 25, and 27 February, with traveling distances ranging from 200 to 2,000 m. Steam plumes did not rise more than 375 m during the month. By the end of February, the dome had only grown slightly to 466,000 m3. Seventeen block avalanches were reported during March 2019; they traveled distances ranging from 500 to 1,900 m down the Kali Gendol ravine. A drone measurement on 5 March determined the volume of the dome to be 470,000 m3; it was only 2,000 m3 larger when measured again on 21 March.
Geologic Background. Merapi, one of Indonesia's most active volcanoes, lies in one of the world's most densely populated areas and dominates the landscape immediately north of the major city of Yogyakarta. It is the youngest and southernmost of a volcanic chain extending NNW to Ungaran volcano. Growth of Old Merapi during the Pleistocene ended with major edifice collapse perhaps about 2,000 years ago, leaving a large arcuate scarp cutting the eroded older Batulawang volcano. Subsequent growth of the steep-sided Young Merapi edifice, its upper part unvegetated due to frequent activity, began SW of the earlier collapse scarp. Pyroclastic flows and lahars accompanying growth and collapse of the steep-sided active summit lava dome have devastated cultivated lands on the western-to-southern flanks and caused many fatalities.
Information Contacts: Balai Penyelidikan dan Pengembangan Teknologi Kebencanaan Geologi (BPPTKG), Center for Research and Development of Geological Disaster Technology (URL: http://merapi.bgl.esdm.go.id/, Twitter: @BPPTKG); Pusat Vulkanologi dan Mitigasi Bencana Geologi (PVMBG, also known as Indonesian Center for Volcanology and Geological Hazard Mitigation, CVGHM), Jalan Diponegoro 57, Bandung 40122, Indonesia (URL: http://www.vsi.esdm.go.id/); Øystein Lund Andersen (Twitter: @OysteinLAnderse, https://twitter.com/OysteinLAnderse, URL: https://www.oysteinlundandersen.com/).
Rincon de la Vieja (Costa Rica) — April 2019 Cite this Report
Rincon de la Vieja
Costa Rica
10.83°N, 85.324°W; summit elev. 1916 m
All times are local (unless otherwise noted)
Occasional weak phreatic explosions continue through February 2019
Intermittent small phreatic explosions from the acid lake of Rincón de la Vieja's active crater has most recently occurred since 2011 (BGVN 42:08, 43:03, and 43:09). This activity continued through at least February 2019. The volcano is monitored by the Observatorio Vulcanologico Sismologica de Costa Rica-Universidad Nacional (OVSICORI-UNA), and the information below comes from its weekly bulletins between 18 August 2018 and 28 February 2019. Weather conditions often prevented webcam views and estimates of plume heights. The volcano was in Activity Level 3 throughout the reporting period (volcano erupting, steady state).
According to OVSICORI-UNA, two distinct, 2-minute-long explosions occurred on 31 August 2018 beginning at 0434 and 1305. Several hours after the eruption tremor became continuous but low-frequency long-period (LP) earthquakes ceased. OVSICORI-UNA reported a gas emission late on 7 September. An unconfirmed small phreatic explosion occurred on 11 September at 0634, and another on 17 September at 1014. The seismic record showed continuous background tremor and very sporadic LP earthquakes.
Intermittent background tremor was recorded during the first half of October, along with a few emissions and phreatic explosions. Deformation measurements during October showed a contraction between the N and S of the volcano, with subsidence. On 17 October there was another phreatic explosion, and thereafter tremor disappeared and seismicity decreased. On 23 and 27 October seismic stations signaled additional possible phreatic explosions.
OVSICORI-UNA reported that a series of explosions began at 1945 on 4 November and consisted of at least three 2-minute-long episodes. The next day at 1511 a plume of water vapor and diffuse gas, recorded by a webcam and visible to residents to the N, rose about 100 m above the crater rim and drifted W. On 9 November a 2-minute-long explosion began at 1703. Another explosion on 27 November at 0237 produced a plume of water vapor and gas that rose 600 m above the crater rim and drifted SW. A short 1-minute explosion began at 1054 on 3 December.
Based on OVSICORI-UNA weekly bulletins, activity remained stable in January 2019 with small-amplitude phreatic explosions on 11, 12, and 14 January. More energetic phreatomagmatic explosions on 17 and 20 January produced lahars. Several small-amplitude explosions were detected at the end of the month. During January, a few LPs, no VTs, and intermittent tremor were recorded.
OVSICORI-UNA reported that two small-scale explosions occurred on 1 February, along with possible events at 1906 and 1950 on 5 February and at 0120 on 6 February. An event at 0000 on 6 February was also recorded; the report noted that poor weather conditions prevented visual observations of the crater. On 16 and 17 February strong degassing was observed. No LPs were recorded, but two significant VTs were detected on 17 and 22 February near or under the crater.
Geologic Background. Rincón de la Vieja, the largest volcano in NW Costa Rica, is a remote volcanic complex in the Guanacaste Range. The volcano consists of an elongated, arcuate NW-SE-trending ridge constructed within the 15-km-wide early Pleistocene Guachipelín caldera, whose rim is exposed on the south side. Sometimes known as the "Colossus of Guanacaste," it has an estimated volume of 130 km3 and contains at least nine major eruptive centers. Activity has migrated to the SE, where the youngest-looking craters are located. The twin cone of Santa María volcano, the highest peak of the complex, is located at the eastern end of a smaller, 5-km-wide caldera and has a 500-m-wide crater. A Plinian eruption producing the 0.25 km3 Río Blanca tephra about 3,500 years ago was the last major magmatic eruption. All subsequent eruptions, including numerous historical eruptions possibly dating back to the 16th century, have been from the prominent active crater containing a 500-m-wide acid lake located ENE of Von Seebach crater.
Information Contacts: Observatorio Vulcanologico Sismologica de Costa Rica-Universidad Nacional (OVSICORI-UNA), Apartado 86-3000, Heredia, Costa Rica (URL: http://www.ovsicori.una.ac.cr/).
San Cristobal (Nicaragua) — April 2019 Cite this Report
San Cristobal
Nicaragua
12.702°N, 87.004°W; summit elev. 1745 m
All times are local (unless otherwise noted)
Weak ash explosions in January and March 2019
San Cristóbal has produced occasional weak explosions since 1999, with intermittent gas-and-ash emissions. The only reported explosion during the first half of 2018 was on 22 April, the first since November 2017 (BGVN 43:03). The current report covers activity between 1 August 2018 and 1 May 2019. The volcano is monitored by the Instituto Nicaragüense de Estudios Territoriales (INETER).
According to INETER, a series of explosions occurred on 9 January 2019 that lasted several hours. INETER stated that one explosion occurred at 1643; the Washington VAAC's first advisory stated that an explosion occurred at 1145 (local time). The weak explosions, which occurred after a period of heightened seismic activity, generated an ash plume that reached 200 m above the edge of the crater and drifted W. The Washington VAAC reported volcanic ash plumes on 10-11 January extending about 92 km SW, and on 24-25 January extending about 185 km WSW. A low-energy explosion was detected by the seismic network at 1550 on 4 March 2019. The event produced a gas-and-ash plume that rose 400 m above the crater rim and drifted SW.
Monitoring data reported by INETER (table 6) showed elevated levels of seismicity during October 2018 through January 2019. Sulfur dioxide was also measured at higher levels in January 2019.
Table 6. Monthly sulfur dioxide measurements and seismicity reported at San Cristóbal during August 2018-March 2019. "Most" indicates that type of seismicity was dominant that month. Data courtesy of INETER.
| Month |
Average SO2 |
Total earthquakes |
Degassing-type earthquakes |
Volcano-tectonic (VT) earthquakes |
| Aug 2018 |
461 t/d |
6,464 |
6,147 |
251 |
| Sep 2018 |
893 t/d |
9,659 |
9,586 |
73 |
| Oct 2018 |
269 t/d |
11,698 |
3,509 |
8,189 |
| Nov 2018 |
-- |
19,593 |
19,586 |
7 |
| Dec 2018 |
-- |
30,901 |
-- |
Most |
| Jan 2019 |
1,286 t/d |
11,504 |
Most |
Very few |
| Feb 2019 |
695 t/d |
3,470 |
Most |
Very few |
| Mar 2019 |
-- |
3,882 |
Most |
Very few |
Geologic Background. The San Cristóbal volcanic complex, consisting of five principal volcanic edifices, forms the NW end of the Marrabios Range. The symmetrical 1745-m-high youngest cone, named San Cristóbal (also known as El Viejo), is Nicaragua's highest volcano and is capped by a 500 x 600 m wide crater. El Chonco, with several flank lava domes, is located 4 km W of San Cristóbal; it and the eroded Moyotepe volcano, 4 km NE of San Cristóbal, are of Pleistocene age. Volcán Casita, containing an elongated summit crater, lies immediately east of San Cristóbal and was the site of a catastrophic landslide and lahar in 1998. The Plio-Pleistocene La Pelona caldera is located at the eastern end of the complex. Historical eruptions from San Cristóbal, consisting of small-to-moderate explosive activity, have been reported since the 16th century. Some other 16th-century eruptions attributed to Casita volcano are uncertain and may pertain to other Marrabios Range volcanoes.
Information Contacts: Instituto Nicaragüense de Estudios Territoriales (INETER), Apartado Postal 2110, Managua, Nicaragua (URL: http://webserver2.ineter.gob.ni/vol/dep-vol.html); Washington Volcanic Ash Advisory Center (VAAC), Satellite Analysis Branch (SAB), NOAA/NESDIS OSPO, NOAA Science Center Room 401, 5200 Auth Rd, Camp Springs, MD 20746, USA (URL: www.ospo.noaa.gov/Products/atmosphere/vaac, archive at: http://www.ssd.noaa.gov/VAAC/archive.html).
Semeru
Indonesia
8.108°S, 112.922°E; summit elev. 3657 m
All times are local (unless otherwise noted)
Decreased activity after October 2018
The ongoing eruption at Semeru has been characterized by numerous ash explosions and thermal anomalies, but activity apparently diminished in 2018 (BGVN 43:01 and 43:09); this decreased activity continued through at least February 2019. The current report summarizes activity from 24 August 2018 to 28 February 2019.
The Indonesian volcano monitoring agency, Pusat Vulkanologi dan Mitigasi Bencana Geologi (PVMBG, also known as Indonesian Center for Volcanology and Geological Hazard Mitigation, CVGHM), reported ongoing daily seismicity, dominated by explosion earthquakes and emission-related events from late November through February (figure 35). Ash plumes resulting in aviation advisories by the Darwin Volcanic Ash Advisory Centre (VAAC) were reported on 4, 6-7, and 19 September, and 12 October 2018. The next significant ash plume reported by the VAAC wasn't until 24 February 2019 (table 23).
Table 23. Summary of ash plumes at Semeru during 25 August 2018 through February 2019. The summit is at 3,657 m elevation. Data courtesy of Darwin VAAC.
| Date |
Plume altitude (km) |
Plume drift |
Remarks |
| 04 Sep 2018 |
4.3 |
W |
-- |
| 06-07 Sep 2018 |
4.3 |
SW |
-- |
| 19 Sep 2018 |
4 |
SSW |
Possible ash-and-steam plume. |
| 12 Oct 2018 |
4.5 |
W |
Discrete eruption. |
| 24 Feb 2019 |
4.3 |
W |
Discrete volcanic ash eruption. |
Thermal anomalies using MODIS satellite instruments processed by the MODVOLC algorithm were only recorded on 26, 28, and 30 August 2018, and 22 and 31 October 2018. The MIROVA (Middle InfraRed Observation of Volcanic Activity) system detected numerous hotspots within 5 km of the volcano during August and early September, with a significant decrease in frequency through October (figure 36); only a few scattered hotspots were recorded from November 2018 through February 2019.
Geologic Background. Semeru, the highest volcano on Java, and one of its most active, lies at the southern end of a volcanic massif extending north to the Tengger caldera. The steep-sided volcano, also referred to as Mahameru (Great Mountain), rises above coastal plains to the south. Gunung Semeru was constructed south of the overlapping Ajek-ajek and Jambangan calderas. A line of lake-filled maars was constructed along a N-S trend cutting through the summit, and cinder cones and lava domes occupy the eastern and NE flanks. Summit topography is complicated by the shifting of craters from NW to SE. Frequent 19th and 20th century eruptions were dominated by small-to-moderate explosions from the summit crater, with occasional lava flows and larger explosive eruptions accompanied by pyroclastic flows that have reached the lower flanks of the volcano.
Information Contacts: Pusat Vulkanologi dan Mitigasi Bencana Geologi (PVMBG, also known as Indonesian Center for Volcanology and Geological Hazard Mitigation, CVGHM), Jalan Diponegoro 57, Bandung 40122, Indonesia (URL: http://www.vsi.esdm.go.id/); MAGMA Indonesia, Kementerian Energi dan Sumber Daya Mineral (URL: https://magma.vsi.esdm.go.id/); Darwin Volcanic Ash Advisory Centre (VAAC), Bureau of Meteorology, Northern Territory Regional Office, PO Box 40050, Casuarina, NT 0811, Australia (URL: http://www.bom.gov.au/info/vaac/); MIROVA (Middle InfraRed Observation of Volcanic Activity), a collaborative project between the Universities of Turin and Florence (Italy) supported by the Centre for Volcanic Risk of the Italian Civil Protection Department (URL: http://www.mirovaweb.it/); Hawai'i Institute of Geophysics and Planetology (HIGP) - MODVOLC Thermal Alerts System, School of Ocean and Earth Science and Technology (SOEST), Univ. of Hawai'i, 2525 Correa Road, Honolulu, HI 96822, USA (URL: http://modis.higp.hawaii.edu/).
Turrialba (Costa Rica) — April 2019 Cite this Report
Turrialba
Costa Rica
10.025°N, 83.767°W; summit elev. 3340 m
All times are local (unless otherwise noted)
Frequent passive ash emissions continue through February 2019
This report summarizes activity at Turrialba during September 2018-February 2019. During this period there was similar activity as described earlier in 2018 (BGVN 43:09), with occasional ash explosions and numerous, sometimes continuous, periods of gas-and-ash emissions (table 8). Data were provided by the Observatorio Vulcanologico Sismologica de Costa Rica-Universidad Nacional (OVSICORI-UNA).
Table 8. Ash emissions at Turrialba, September 2018-February 2019. Cloudy weather sometimes obscured observations. Maximum plume height is above the crater rim. Information courtesy of OVSICORI-UNA.
| Date |
Time |
Max plume height |
Plume drift |
Remarks |
| 27 Aug-05 Sep 2018 |
-- |
100 m |
SW, W |
Continuous gas-and-ash emissions. |
| 06 Sep 2018 |
-- |
-- |
-- |
Mostly gas, punctuated by small sporadic ash plumes. |
| 10 Sep 2018 |
1210 |
300 m |
NW |
-- |
| 01-13 Sep 2018 |
-- |
-- |
-- |
Continuous gas-and-ash emissions. |
| 17-18 Sep 2018 |
-- |
300 m |
SW, NW |
-- |
| 27 Sep 2018 |
0915 |
200 m |
NW |
-- |
| 30 Sep-01 Oct 2018 |
-- |
500 m |
NW, NE |
-- |
| 03 Oct 2018 |
-- |
-- |
-- |
Incandescence. |
| 08 Oct 2018 |
0800 |
500 m |
N |
-- |
| 10-16 Oct 2018 |
-- |
1,000 m |
Various |
Intermittent emissions; some explosions, including an energetic one on 14 Oct at 1712. Clouds prevented estimate of plume height. |
| 17-23 Oct 2018 |
-- |
200-500 m |
E, NW, SW |
Periodic gas-and-ash emissions. Frequent Strombolian events since 5 Oct. |
| 25-30 Oct 2018 |
-- |
-- |
-- |
Periodic ash emissions when weather conditions allowed observations. |
| 26 Oct 2018 |
0134 |
500 m |
NE |
Ashfall in neighborhoods of Coronado (San José, 35 km WSW) and San Isidro de Heredia (Heredia, 38 km W). |
| 29 Oct 2018 |
0231 |
500 m |
NW |
-- |
| 30 Oct 2018 |
1406 |
500 m |
W |
-- |
| 24 Oct-01 Nov 2018 |
-- |
500 m |
-- |
Continuous emissions. |
| 01-06 Nov 2018 |
0530-0640 |
500 m |
SW |
-- |
| 02 Nov 2018 |
1523, 1703 |
500 m |
-- |
-- |
| 03 Nov 2018 |
0109 |
500 m |
-- |
Short (2-3 minutes) duration events. Ashfall reported in Coronado. |
| 05 Nov 2018 |
0620 |
600 m |
NW |
-- |
| 06-11 Nov 2018 |
-- |
500 m |
-- |
Low-level, continuous gas-and-ash emissions occasionally punctuated by energetic explosions that sent plumes as high as 500 m and caused ashfall in several areas downwind, including Cascajal de Coronado, Desamparados (35 km WSW), San Antonio, Guadalupe (32 km WSW), Sabanilla, San Pedro Montes de Oca, Moravia (31 km WSW), Heredia, and Coronado (San José, 35 km WSW). Weather prevented observations on 12 Nov. |
| 13-19 Nov 2018 |
-- |
-- |
-- |
Periodic, passive ash emissions visible in webcam images or during cloudy conditions inferred from the seismic data. |
| 22 Nov 2018 |
0710 |
100 m |
W |
-- |
| 23 Nov 2018 |
-- |
-- |
-- |
Frequent pulses of ash. |
| 23-25 Nov 2018 |
-- |
500 m |
-- |
Occasional Strombolian explosions ejected lava bombs deposited near the crater; residents of Cascajal de Coronado reported hearing several booming sounds. |
| 26-27 Nov 2018 |
-- |
-- |
-- |
Passive emissions with small quantities of ash visible. Minor ashfall in San Jose (Cascajal de Coronado and Dulce Nombre), San Pedro Montes de Oca, and neighborhoods of Heredia. |
| 28 Nov-03 Dec 2018 |
-- |
500 m |
N, NW, SW |
Ashfall in Santo Domingo (36 km WSW) on 2 Dec. |
| 05 Dec 2018 |
-- |
-- |
-- |
Minor emission. |
| 06 Dec 2018 |
-- |
-- |
S |
Emission. |
| 08 Dec 2018 |
0749 |
500 m |
NW |
-- |
| 09 Dec 2018 |
-- |
1,000 m |
-- |
Ashfall in areas of Valle Central. |
| 10 Dec 2018 |
-- |
-- |
-- |
Emissions periodically observed during periods of clear viewing. Ashfall in Moravia (31 km WSW) and Santa Ana, and residents of Heredia noted a sulfur odor. |
| 11-12 Dec 2018 |
-- |
500 m |
NW, SW |
The Tico Times stated some flights were delayed at San Jose airport, 67 km away. |
| 13 Dec 2018 |
-- |
-- |
-- |
Pulsing ash emissions; ashfall in Guadalupe (32 km WSW) and Valle Central. |
| 14-16 Dec 2018 |
-- |
-- |
W, SW |
Emissions with diffuse amounts of ash. |
| 05-06 Jan 2019 |
0815 |
-- |
-- |
Increased after midnight on 6 Jan. |
| 28 Jan-04 Feb 2019 |
-- |
-- |
-- |
Minor, sporadic ash emissions rose to low heights during most days. |
| 01 Feb 2019 |
0640 |
1,500 m |
NW |
-- |
| 08 Feb 2019 |
0540 |
200 m |
-- |
Sporadic ash emissions for more than one hour. |
| 11 Feb 2019 |
-- |
-- |
-- |
Very small ash emission. |
| 13-15 Feb 2019 |
200-300 m |
NW, W, SW |
Almost continuous gas emissions with minor ash content. |
| 15 Feb 2019 |
1330 |
1,000 m |
W |
-- |
| 18 Feb 2019 |
1310 |
500 m |
W |
-- |
| 21 Feb 2019 |
-- |
300 m |
NW |
Frequent ash pulses. |
| 22-24 Feb 2019 |
-- |
300 m |
NW, SW |
Frequent ash emissions of variable intensity and duration. On 22 Feb ash fell in Santa Cruz (31 km WSW) and Santa Ana, and a sulfur odor was evident in Moravia. |
| 28 Feb 2019 |
1050 |
500 m |
SW |
Ash pulses. |
According to OVSICORI-UNA's annual summary for 2018, a slow decline in activity occurred after the volcano reached its highest emission rate during 2016. Activity during 2018 was consistent with an open system, generating frequent passive ash emissions. The volcano emitted ash on 58% of the days during the year. Some explosions were large enough to eject ballistics more than 400 m around the crater. Typical activity can be seen in a photo from 11 September 2018 (figure 50) and satellite imagery on 7 November 2018 (figure 51).
During January into early February 2019, passive ash emissions continued irregularly and with less intensity and duration. Emissions sometimes lacked ash. In their report of 4 February 2019, OVSICORI-UNA indicated that passive ash emissions were weak and slow. For the rest of February, they characterized ash emissions as frequent, but of low intensity.
Seismic activity. On 1 November 2018 OVSICORI-UNA reported that seismicity remained high, and involved low-amplitude banded volcanic tremor along with long-period (LP) and volcano-tectonic (VT) earthquakes. In late January-early February 2019, OVSICORI-UNA reported that seismicity remained relatively stable, although a small increase was associated with the hydrothermal system. VT earthquakes were absent, and tremors had decreased in both energy and duration. The number of low-frequency LP volcanic earthquakes remained stable, although they had decreasing amplitudes. No explosions were documented, and emissions were weak and had short durations and very dilute ash content.
Thermal anomalies. No thermal anomalies were recorded during the reporting period using MODIS satellite instruments processed by MODVOLC algorithm. The MIROVA (Middle InfraRed Observation of Volcanic Activity) system detected five scattered hotspots during September-October 2018, none during November-December 2018, and two during January-February 2019. All were within 2 km of the volcano and of low radiative power.
Gas measurements. Significant sulfur dioxide levels near the volcano were recorded by NASA's satellite-borne ozone instruments only on 29 September 2018 (both NPP/OMPS and Aura/OMI instruments) and on 11 February 2019 (Sentinel 5P/TROPOMI instrument). OVSICORI-UNA's gas measuring instruments were compromised in September 2018 through January 2019 due to vandalism. In early February, however, they detected hydrogen sulfide for the first time since 2016.
Geologic Background. Turrialba, the easternmost of Costa Rica's Holocene volcanoes, is a large vegetated basaltic-to-dacitic stratovolcano located across a broad saddle NE of Irazú volcano overlooking the city of Cartago. The massive edifice covers an area of 500 km2. Three well-defined craters occur at the upper SW end of a broad 800 x 2200 m summit depression that is breached to the NE. Most activity originated from the summit vent complex, but two pyroclastic cones are located on the SW flank. Five major explosive eruptions have occurred during the past 3500 years. A series of explosive eruptions during the 19th century were sometimes accompanied by pyroclastic flows. Fumarolic activity continues at the central and SW summit craters.
Information Contacts: Observatorio Vulcanologico Sismologica de Costa Rica-Universidad Nacional (OVSICORI-UNA), Apartado 86-3000, Heredia, Costa Rica (URL: http://www.ovsicori.una.ac.cr/); Red Sismologica Nacional (RSN) a collaboration between a) the Sección de Sismología, Vulcanología y Exploración Geofísica de la Escuela Centroamericana de Geología de la Universidad de Costa Rica (UCR), and b) the Área de Amenazas y Auscultación Sismológica y Volcánica del Instituto Costarricense de Electricidad (ICE), Costa Rica (URL: https://rsn.ucr.ac.cr/); Sentinel Hub Playground (URL: https://www.sentinel-hub.com/explore/sentinel-playground); Hawai'i Institute of Geophysics and Planetology (HIGP) - MODVOLC Thermal Alerts System, School of Ocean and Earth Science and Technology (SOEST), Univ. of Hawai'i, 2525 Correa Road, Honolulu, HI 96822, USA (URL: http://hotspot.higp.hawaii.edu/); MIROVA (Middle InfraRed Observation of Volcanic Activity), a collaborative project between the Universities of Turin and Florence (Italy) supported by the Centre for Volcanic Risk of the Italian Civil Protection Department (URL: http://www.mirovaweb.it/); Global Sulfur Dioxide Monitoring Page, Atmospheric Chemistry and Dynamics Laboratory, NASA Goddard Space Flight Center (NASA/GSFC), 8800 Greenbelt Road, Goddard, Maryland, USA (URL: https://so2.gsfc.nasa.gov/); Costa Rica Star (URL: https://news.co.cr); The Tico Times (URL: https://ticotimes.net).