Recently Published Bulletin Reports
Manam (Papua New Guinea) Few ash plumes during November-December 2022
Krakatau (Indonesia) Strombolian activity and ash plumes during November 2022-April 2023
Stromboli (Italy) Strombolian explosions and lava flows continue during January-April 2023
Nishinoshima (Japan) Small ash plumes and fumarolic activity during November 2022 through April 2023
Karangetang (Indonesia) Lava flows, incandescent avalanches, and ash plumes during January-June 2023
Ahyi (United States) Intermittent hydroacoustic signals and discolored plumes during November 2022-June 2023
Kadovar (Papua New Guinea) An ash plume and weak thermal anomaly during May 2023
San Miguel (El Salvador) Small gas-and-ash explosions during March and May 2023
Semisopochnoi (United States) Occasional explosions, ash deposits, and gas-and-steam plumes during December 2022-May 2023
Ebeko (Russia) Continued explosions, ash plumes, and ashfall during October 2022-May 2023
Home Reef (Tonga) Discolored plumes continued during November 2022-April 2023
Ambae (Vanuatu) New lava flow, ash plumes, and sulfur dioxide plumes during February-May 2023
Manam (Papua New Guinea) — July 2023  Cite this Report
Manam
Papua New Guinea
4.08°S, 145.037°E; summit elev. 1807 m
All times are local (unless otherwise noted)
Few ash plumes during November-December 2022
Manam is a 10-km-wide island that consists of two active summit craters: the Main summit crater and the South summit crater and is located 13 km off the northern coast of mainland Papua New Guinea. Frequent mild-to-moderate eruptions have been recorded since 1616. The current eruption period began during June 2014 and has more recently been characterized by intermittent ash plumes and thermal activity (BGVN 47:11). This report updates activity that occurred from November 2022 through May 2023 based on information from the Darwin Volcanic Ash Advisory Center (VAAC) and various satellite data.
Ash plumes were reported during November and December 2022 by the Darwin VAAC. On 7 November an ash plume rose to 2.1 km altitude and drifted NE based on satellite images and weather models. On 14 November an ash plume rose to 2.1 km altitude and drifted W based on RVO webcam images. On 20 November ash plumes rose to 1.8 km altitude and drifted NW. On 26 December an ash plume rose to 3 km altitude and drifted S and SSE.
Intermittent sulfur dioxide plumes were detected using the TROPOMI instrument on the Sentinel-5P satellite, some of which exceeded at least two Dobson Units (DU) and drifted in different directions (figure 93). Occasional low-to-moderate power thermal anomalies were recorded by the MIROVA (Middle InfraRed Observation of Volcanic Activity) system; less than five anomalies were recorded each month during November 2022 through May 2023 (figure 94). Two thermal hotspots were detected by the MODVOLC thermal alerts system on 10 December 2022. On clear weather days, thermal activity was also captured in infrared satellite imagery in both the Main and South summit craters, accompanied by gas-and-steam emissions (figure 95).
Geologic Background. The 10-km-wide island of Manam, lying 13 km off the northern coast of mainland Papua New Guinea, is one of the country's most active volcanoes. Four large radial valleys extend from the unvegetated summit of the conical basaltic-andesitic stratovolcano to its lower flanks. These valleys channel lava flows and pyroclastic avalanches that have sometimes reached the coast. Five small satellitic centers are located near the island's shoreline on the northern, southern, and western sides. Two summit craters are present; both are active, although most observed eruptions have originated from the southern crater, concentrating eruptive products during much of the past century into the SE valley. Frequent eruptions, typically of mild-to-moderate scale, have been recorded since 1616. Occasional larger eruptions have produced pyroclastic flows and lava flows that reached flat-lying coastal areas and entered the sea, sometimes impacting populated areas.
Information Contacts: Rabaul Volcano Observatory (RVO), Geohazards Management Division, Department of Mineral Policy and Geohazards Management (DMPGM), PO Box 3386, Kokopo, East New Britain Province, Papua New Guinea; Darwin Volcanic Ash Advisory Centre (VAAC), Bureau of Meteorology, Northern Territory Regional Office, PO Box 40050, Casuarina, NT 0811, Australia (URL: http://www.bom.gov.au/info/vaac/); MIROVA (Middle InfraRed Observation of Volcanic Activity), a collaborative project between the Universities of Turin and Florence (Italy) supported by the Centre for Volcanic Risk of the Italian Civil Protection Department (URL: http://www.mirovaweb.it/); Hawai'i Institute of Geophysics and Planetology (HIGP) - MODVOLC Thermal Alerts System, School of Ocean and Earth Science and Technology (SOEST), Univ. of Hawai'i, 2525 Correa Road, Honolulu, HI 96822, USA (URL: http://modis.higp.hawaii.edu/); NASA Global Sulfur Dioxide Monitoring Page, Atmospheric Chemistry and Dynamics Laboratory, NASA Goddard Space Flight Center (NASA/GSFC), 8800 Greenbelt Road, Goddard, Maryland, USA (URL: https://so2.gsfc.nasa.gov/); Copernicus Browser, Copernicus Data Space Ecosystem, European Space Agency (URL: https://dataspace.copernicus.eu/browser/).
Krakatau (Indonesia) — July 2023 Cite this Report
Krakatau
Indonesia
6.1009°S, 105.4233°E; summit elev. 285 m
All times are local (unless otherwise noted)
Strombolian activity and ash plumes during November 2022-April 2023
Krakatau is located in the Sunda Strait between Java and Sumatra, Indonesia. Caldera collapse during the catastrophic 1883 eruption destroyed Danan and Perbuwatan cones and left only a remnant of Rakata. The post-collapse cone of Anak Krakatau (Child of Krakatau) was constructed within the 1883 caldera at a point between the former Danan and Perbuwatan cones; it has been the site of frequent eruptions since 1927. The current eruption period began in May 2021 and has recently consisted of explosions, ash plumes, and thermal activity (BGVN 47:11). This report covers activity during November 2022 through April 2023 based on information provided by the Indonesian Center for Volcanology and Geological Hazard Mitigation, referred to as Pusat Vulkanologi dan Mitigasi Bencana Geologi (PVMBG), MAGMA Indonesia, the Darwin Volcanic Ash Advisory Center (VAAC), and several sources of satellite data.
Activity was relatively low during November and December 2022. Daily white gas-and-steam plumes rose 25-100 m above the summit and drifted in different directions. Gray ash plumes rose 200 m above the summit and drifted NE at 1047 and at 2343 on 11 November. On 14 November at 0933 ash plumes rose 300 m above the summit and drifted E. An ash plume was reported at 0935 on 15 December that rose 100 m above the summit and drifted NE. An eruptive event at 1031 later that day generated an ash plume that rose 700 m above the summit and drifted NE. A gray ash plume at 1910 rose 100 m above the summit and drifted E. Incandescent material was ejected above the vent based on an image taken at 1936.
During January 2023 daily white gas-and-steam plumes rose 25-300 m above the summit and drifted in multiple directions. Gray-to-brown ash plumes were reported at 1638 on 3 January, at 1410 and 1509 on 4 January, and at 0013 on 5 January that rose 100-750 m above the summit and drifted NE and E; the gray-to-black ash plume at 1509 on 4 January rose as high as 3 km above the summit and drifted E. Gray ash plumes were recorded at 1754, 2241, and 2325 on 11 January and at 0046 on 12 January and rose 200-300 m above the summit and drifted NE. Toward the end of January, PVMBG reported that activity had intensified; Strombolian activity was visible in webcam images taken at 0041, 0043, and 0450 on 23 January. Multiple gray ash plumes throughout the day rose 200-500 m above the summit and drifted E and SE (figure 135). Webcam images showed progressively intensifying Strombolian activity at 1919, 1958, and 2113 on 24 January; a gray ash plume at 1957 rose 300 m above the summit and drifted E (figure 135). Eruptive events at 0231 and 2256 on 25 January and at 0003 on 26 January ejected incandescent material from the vent, based on webcam images. Gray ash plumes observed during 26-27 January rose 300-500 m above the summit and drifted NE, E, and SE.
Low levels of activity were reported during February and March. Daily white gas-and-steam plumes rose 25-300 m above the summit and drifted in different directions. The Darwin VAAC reported that continuous ash emissions rose to 1.5-1.8 km altitude and drifted W and NW during 1240-1300 on 10 March, based on satellite images, weather models, and PVMBG webcams. White-and-gray ash plumes rose 500 m and 300 m above the summit and drifted SW at 1446 and 1846 on 18 March, respectively. An eruptive event was recorded at 2143, though it was not visible due to darkness. Multiple ash plumes were reported during 27-29 March that rose as high as 2.5 km above the summit and drifted NE, W, and SW (figure 136). Webcam images captured incandescent ejecta above the vent at 0415 and around the summit area at 2003 on 28 March and at 0047 above the vent on 29 March.
Daily white gas-and-steam plumes rose 25-300 m above the summit and drifted in multiple directions during April and May. White-and-gray and black plumes rose 50-300 m above the summit on 2 and 9 April. On 11 May at 1241 a gray ash plume rose 1-3 km above the summit and drifted SW. On 12 May at 0920 a gray ash plume rose 2.5 km above the summit and drifted SW and at 2320 an ash plume rose 1.5 km above the summit and drifted SW. An accompanying webcam image showed incandescent ejecta. On 13 May at 0710 a gray ash plume rose 2 km above the summit and drifted SW (figure 137).
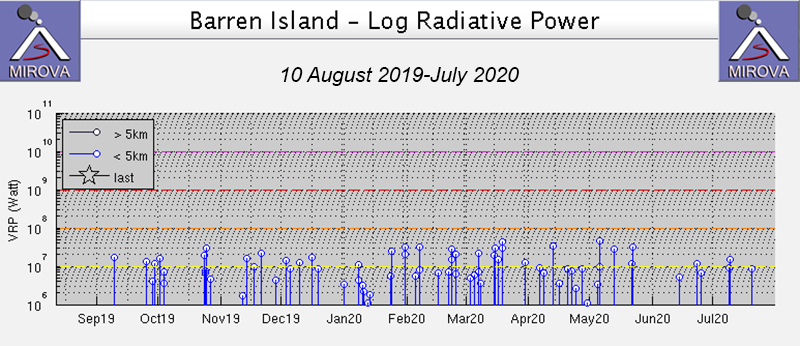
The MIROVA (Middle InfraRed Observation of Volcanic Activity) graph of MODIS thermal anomaly data showed intermittent low-to-moderate power thermal anomalies during November 2022 through April 2023 (figure 138). Some of this thermal activity was also visible in infrared satellite imagery at the crater, accompanied by gas-and-steam and ash plumes that drifted in different directions (figure 139).
Geologic Background. The renowned Krakatau (frequently mis-named as Krakatoa) volcano lies in the Sunda Strait between Java and Sumatra. Collapse of an older edifice, perhaps in 416 or 535 CE, formed a 7-km-wide caldera. Remnants of that volcano are preserved in Verlaten and Lang Islands; subsequently the Rakata, Danan, and Perbuwatan cones were formed, coalescing to create the pre-1883 Krakatau Island. Caldera collapse during the catastrophic 1883 eruption destroyed Danan and Perbuwatan, and left only a remnant of Rakata. This eruption caused more than 36,000 fatalities, most as a result of tsunamis that swept the adjacent coastlines of Sumatra and Java. Pyroclastic surges traveled 40 km across the Sunda Strait and reached the Sumatra coast. After a quiescence of less than a half century, the post-collapse cone of Anak Krakatau (Child of Krakatau) was constructed within the 1883 caldera at a point between the former Danan and Perbuwatan cones. Anak Krakatau has been the site of frequent eruptions since 1927.
Information Contacts: Pusat Vulkanologi dan Mitigasi Bencana Geologi (PVMBG, also known as Indonesian Center for Volcanology and Geological Hazard Mitigation, CVGHM), Jalan Diponegoro 57, Bandung 40122, Indonesia (URL: http://www.vsi.esdm.go.id/); MAGMA Indonesia, Kementerian Energi dan Sumber Daya Mineral (URL: https://magma.esdm.go.id/v1); Darwin Volcanic Ash Advisory Centre (VAAC), Bureau of Meteorology, Northern Territory Regional Office, PO Box 40050, Casuarina, NT 0811, Australia (URL: http://www.bom.gov.au/info/vaac/); MIROVA (Middle InfraRed Observation of Volcanic Activity), a collaborative project between the Universities of Turin and Florence (Italy) supported by the Centre for Volcanic Risk of the Italian Civil Protection Department (URL: http://www.mirovaweb.it/); Copernicus Browser, Copernicus Data Space Ecosystem, European Space Agency (URL: https://dataspace.copernicus.eu/browser/).
Stromboli
Italy
38.789°N, 15.213°E; summit elev. 924 m
All times are local (unless otherwise noted)
Strombolian explosions and lava flows continue during January-April 2023
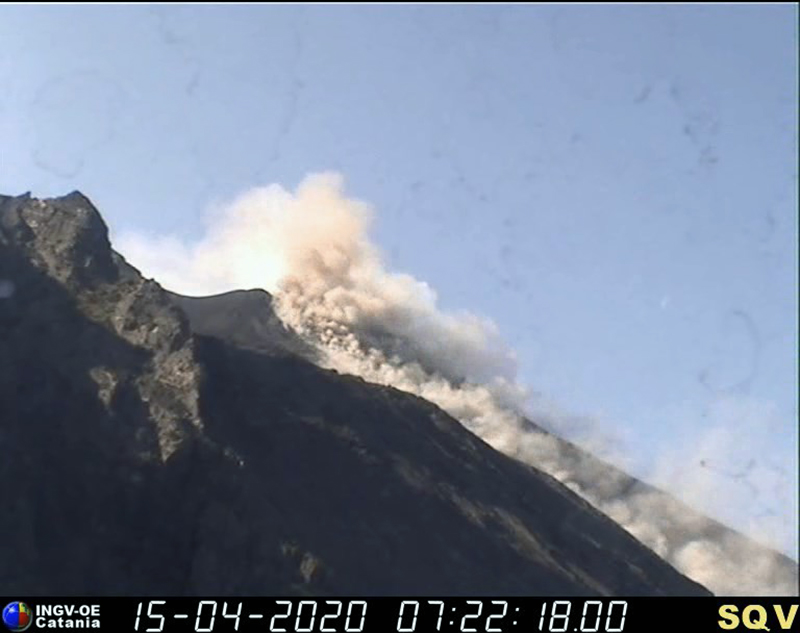
Stromboli, located in Italy, has exhibited nearly constant lava fountains for the past 2,000 years; recorded eruptions date back to 350 BCE. Eruptive activity occurs at the summit from multiple vents, which include a north crater area (N area) and a central-southern crater (CS area) on a terrace known as the ‘terrazza craterica’ at the head of the Sciara del Fuoco, a large scarp that runs from the summit down the NW side of the volcano-island. Activity typically consists of Strombolian explosions, incandescent ejecta, lava flows, and pyroclastic flows. Thermal and visual monitoring cameras are located on the nearby Pizzo Sopra La Fossa, above the terrazza craterica, and at multiple flank locations. The current eruption period has been ongoing since 1934 and recent activity has consisted of frequent Strombolian explosions and lava flows (BGVN 48:02). This report updates activity during January through April 2023 primarily characterized by Strombolian explosions and lava flows based on reports from Italy's Istituto Nazionale di Geofisica e Vulcanologia (INGV) and various satellite data.
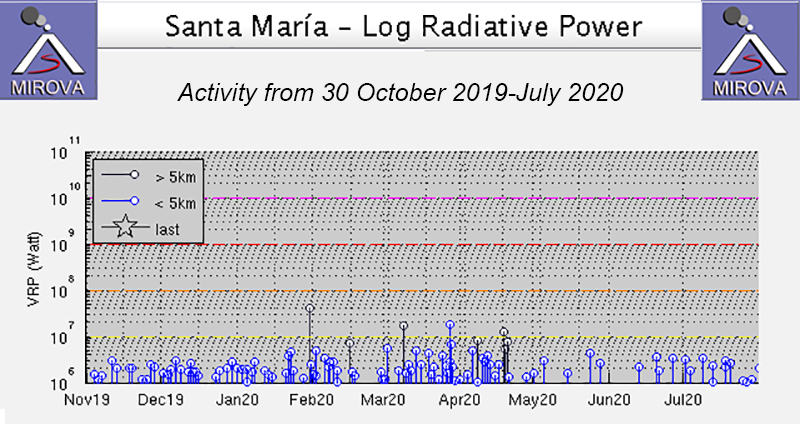
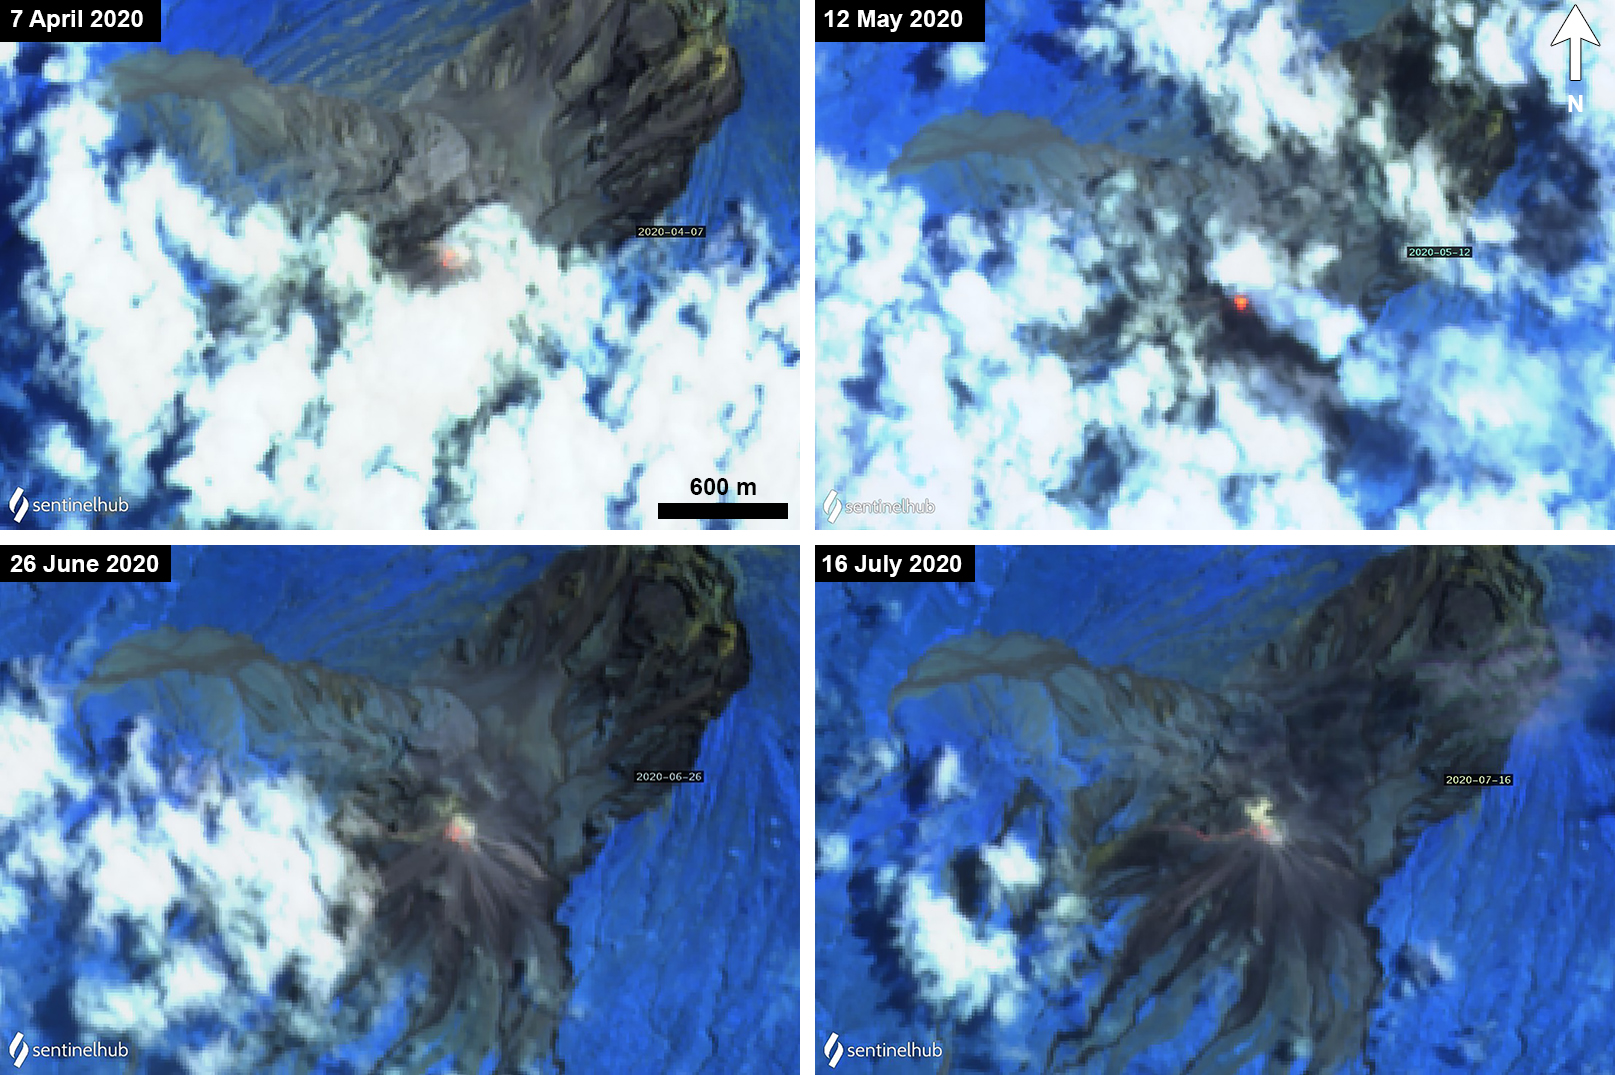
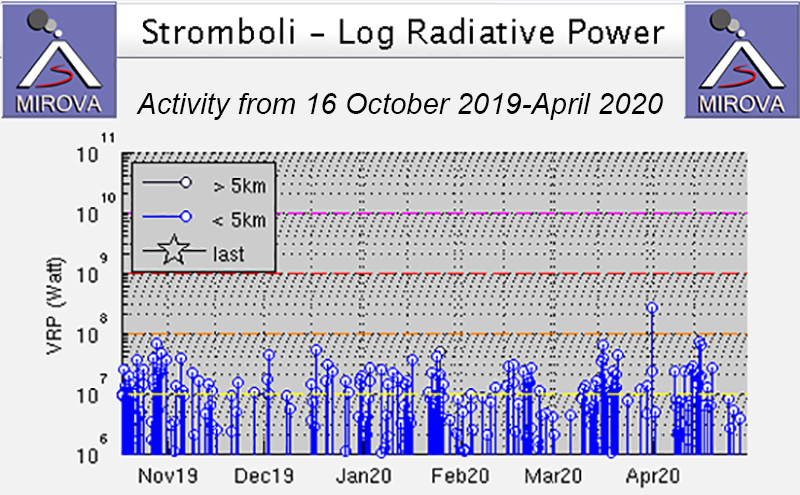
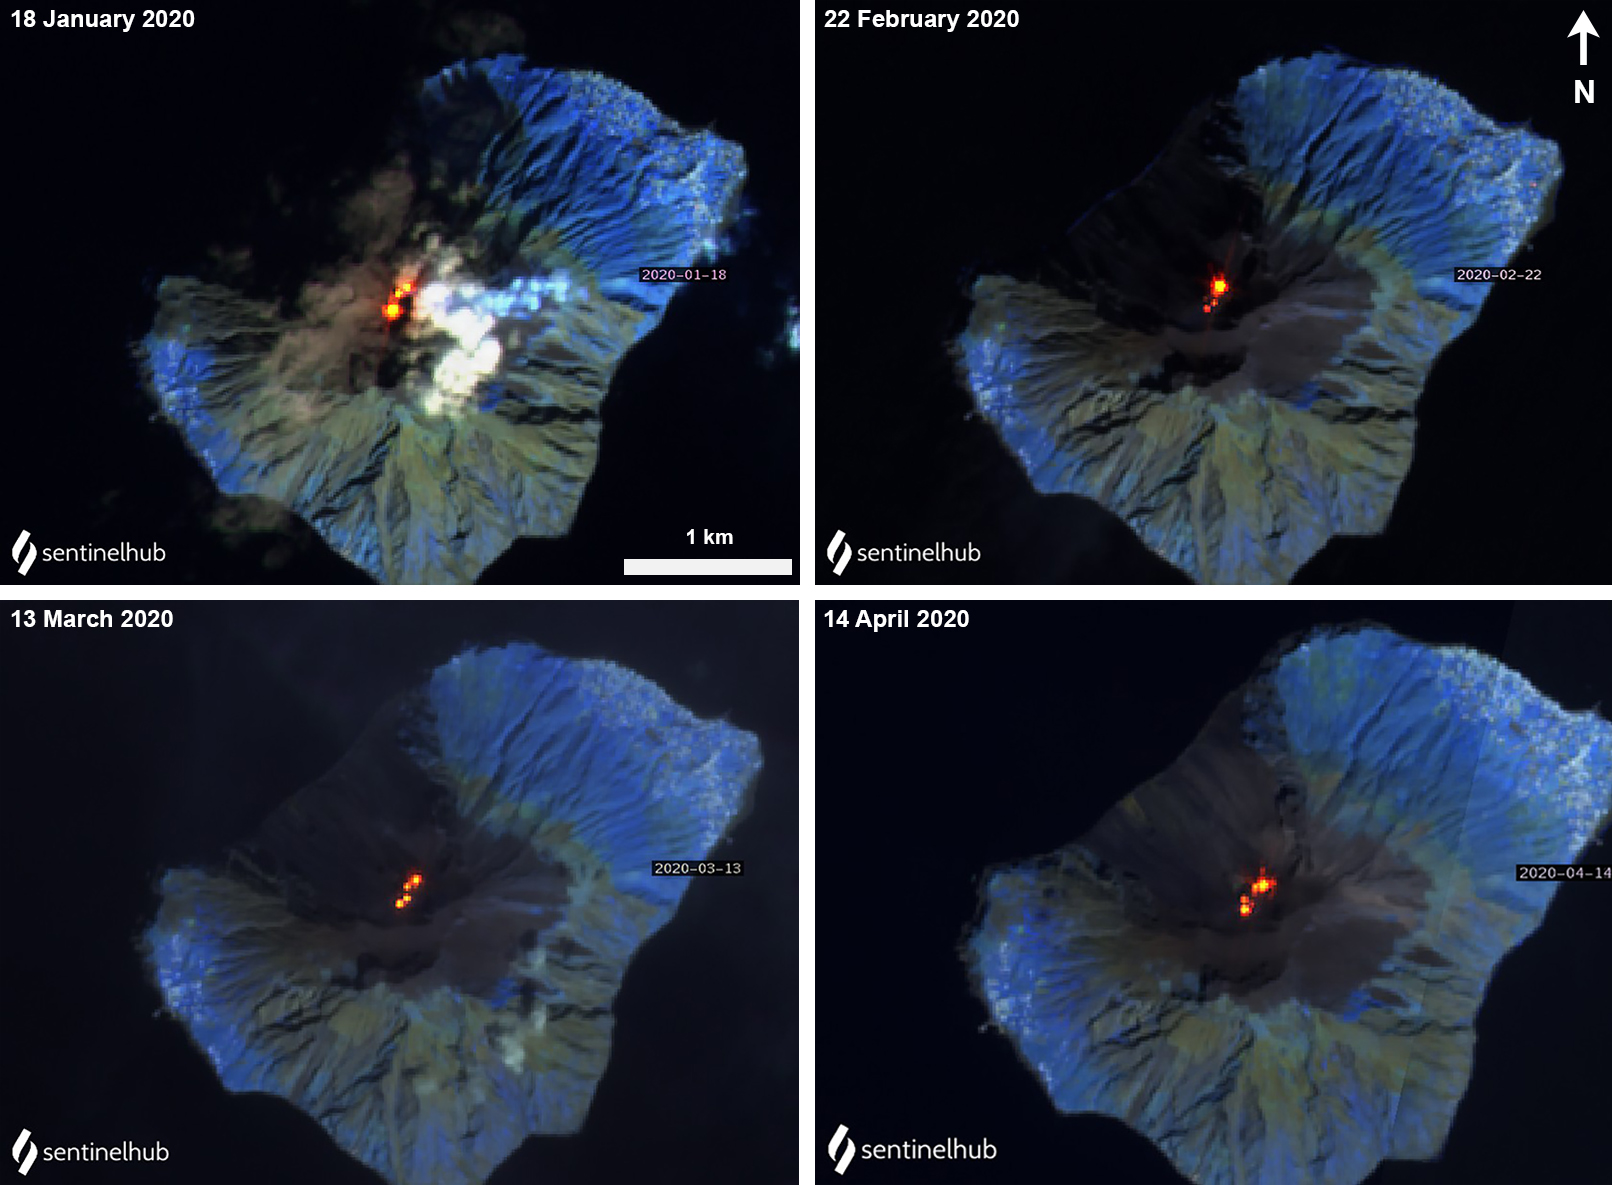
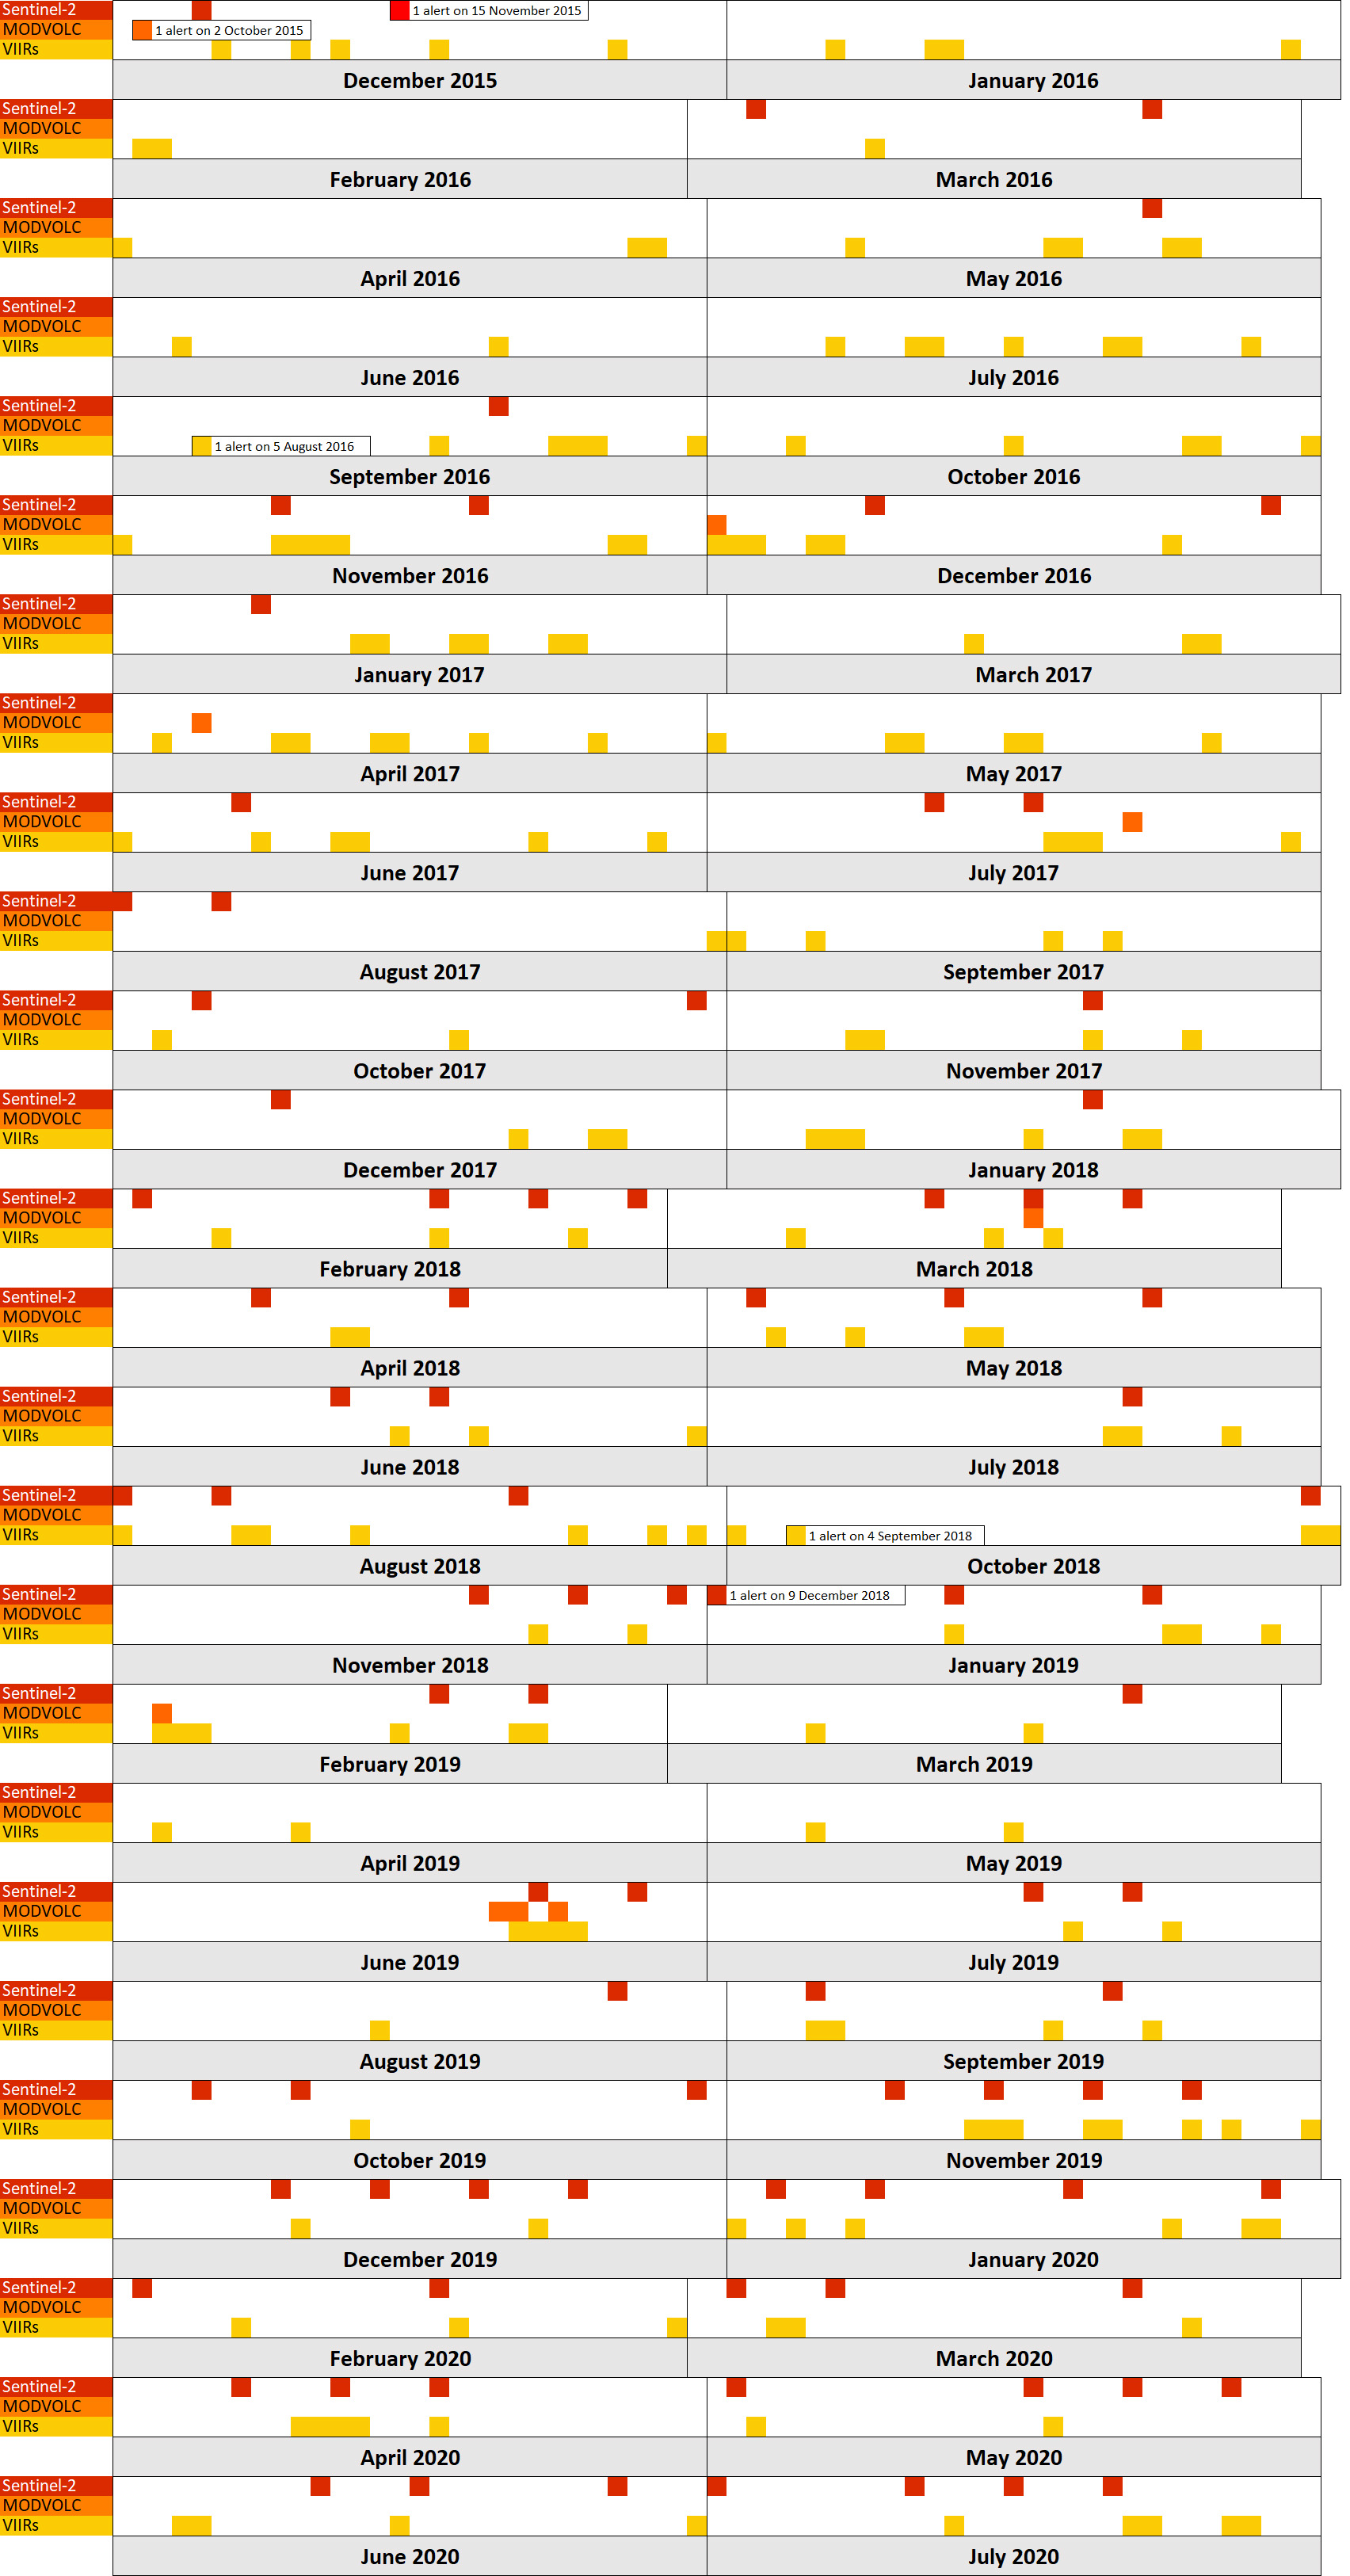
Frequent explosive activity continued throughout the reporting period, generally in the low-to-medium range, based on the number of hourly explosions in the summit crater (figure 253, table 16). Intermittent thermal activity was recorded by the MIROVA (Middle InfraRed Observation of Volcanic Activity) analysis of MODIS satellite data (figure 254). According to data collected by the MODVOLC thermal algorithm, a total of 9 thermal alerts were detected: one on 2 January 2023, one on 1 February, five on 24 March, and two on 26 March. The stronger pulses of thermal activity likely reflected lava flow events. Infrared satellite imagery captured relatively strong thermal hotspots at the two active summit craters on clear weather days, showing an especially strong event on 8 March (figure 255).
Table 16. Summary of type, frequency, and intensity of explosive activity at Stromboli by month during January-April 2023; information from webcam observations. Courtesy of INGV weekly reports.
| Month |
Explosive Activity |
| Jan 2023 |
Typical Strombolian activity with spattering and lava overflows in the N crater area. Explosions were reported from 4 vents in the N area and 1-2 vents in the CS area. The average hourly frequency of explosions was low-to-medium (1-12 events/hour). The intensity of the explosions varied from low (less than 80 m high) to medium (less than 150 m high) in the N crater area and up to high (greater than 150 m high) in the CS crater area. |
| Feb 2023 |
Typical Strombolian activity with spattering in the N crater area. Explosions were reported from 2-3 vents in the N area and 1-4 vents in the CS area. The average hourly frequency of explosions was low-to-medium (1-14 events/hour). The intensity of the explosions varied from low (less than 80 m high) to medium (less than 150 m high) in the N crater area and up to high (greater than 150 m high) in the CS crater area. |
| Mar 2023 |
Typical Strombolian activity with spattering and lava overflows in the N crater area. Explosions were reported from 2-3 vents in the N area and 2-4 vents in the CS area. The average hourly frequency of explosions was low-to-medium (1-18 events/hour). The intensity of the explosions varied from low (less than 80 m high) to medium (less than 150 m high) in the N crater area and up to high (greater than 150 m high) in the CS crater area. |
| Apr 2023 |
Typical Strombolian activity. Explosions were reported from 2 vents in the N area and 2-3 vents in the CS area. The average hourly frequency of explosions was low-to-high (1-16 events/hour). The intensity of the explosions varied from low (less than 80 m high) to medium (less than 150 m high) in both the N and CS crater areas. |
Activity during January-February 2023. Strombolian explosions were reported in the N crater area, as well as lava effusion. Explosive activity in the N crater area ejected coarse material (bombs and lapilli). Intense spattering was observed in both the N1 and N2 craters. In the CS crater area, explosions generally ejected fine material (ash), sometimes to heights greater than 250 m. The intensity of the explosions was characterized as low-to-medium in the N crater and medium-to-high in the CS crater. After intense spattering activity from the N crater area, a lava overflow began at 2136 on 2 January that flowed part way down the Sciara del Fuoco, possibly moving down the drainage that formed in October, out of view from webcams. The flow remained active for a couple of hours before stopping and beginning to cool. A second lava flow was reported at 0224 on 4 January that similarly remained active for a few hours before stopping and cooling. Intense spattering was observed on 11 and 13 January from the N1 crater. After intense spattering activity at the N2 crater at 1052 on 17 January another lava flow started to flow into the upper part of the Sciara del Fuoco (figure 256), dividing into two: one that traveled in the direction of the drainage formed in October, and the other one moving parallel to the point of emission. By the afternoon, the rate of the flow began to decrease, and at 1900 it started to cool. A lava flow was reported at 1519 on 24 January following intense spattering in the N2 area, which began to flow into the upper part of the Sciara del Fuoco. By the morning of 25 January, the lava flow had begun to cool. During 27 January the frequency of eruption in the CS crater area increased to 6-7 events/hour compared to the typical 1-7 events/hour; the following two days showed a decrease in frequency to less than 1 event/hour. Starting at 1007 on 30 January a high-energy explosive sequence was produced by vents in the CS crater area. The sequence began with an initial energetic pulse that lasted 45 seconds, ejecting predominantly coarse products 300 m above the crater that fell in an ESE direction. Subsequent and less intense explosions ejected material 100 m above the crater. The total duration of this event lasted approximately two minutes. During 31 January through 6, 13, and 24 February spattering activity was particularly intense for short periods in the N2 crater.
An explosive sequence was reported on 16 February that was characterized by a major explosion in the CS crater area (figure 257). The sequence began at 1817 near the S2 crater that ejected material radially. A few seconds later, lava fountains were observed in the central part of the crater. Three explosions of medium intensity (material was ejected less than 150 m high) were recorded at the S2 crater. The first part of this sequence lasted approximately one minute, according to INGV, and material rose 300 m above the crater and then was deposited along the Sciara del Fuoco. The second phase began at 1818 at the S1 crater; it lasted seven seconds and material was ejected 150 m above the crater. Another event 20 seconds later lasted 12 seconds, also ejecting material 150 m above the crater. The sequence ended with at least three explosions of mostly fine material from the S1 crater. The total duration of this sequence was about two minutes.
Short, intense spattering activity was noted above the N1 crater on 27 and 28 February. A lava overflow was first reported at 0657 from the N2 crater on 27 February that flowed into the October 2022 drainage. By 1900 the flow had stopped. A second lava overflow also in the N crater area occurred at 2149, which overlapped the first flow and then stopped by 0150 on 28 February. Material detached from both the lava overflows rolled down the Sciara del Fuoco, some of which was visible in webcam images.
Activity during March-April 2023. Strombolian activity continued with spattering activity and lava overflows in the N crater area during March. Explosive activity at the N crater area varied from low (less than 80 m high) to medium (less than 150 m high) and ejected coarse material, such as bombs and lapilli. Spattering was observed above the N1 crater, while explosive activity at the CS crater area varied from medium to high (greater than 150 m high) and ejected coarse material. Intense spattering activity was observed for short periods on 6 March above the N1 crater. At approximately 0610 a lava overflow was reported around the N2 crater on 8 March, which then flowed into the October 2022 drainage. By 1700 the flow started to cool. A second overflow began at 1712 on 9 March and overlapped the previous flow. It had stopped by 2100. Material from both flows was deposited along the Sciara del Fuoco, though much of the activity was not visible in webcam images. On 11 March a lava overflow was observed at 0215 that overlapped the two previous flows in the October 2022 drainage. By late afternoon on 12 March, it had stopped.
During a field excursion on 16 March, scientists noted that a vent in the central crater area was degassing. Another vent showed occasional Strombolian activity that emitted ash and lapilli. During 1200-1430 low-to-medium intense activity was reported; the N1 crater emitted ash emissions and the N2 crater emitted both ash and coarse material. Some explosions also occurred in the CS crater area that ejected coarse material. The C crater in the CS crater area occasionally showed gas jetting and low intensity explosions on 17 and 22 March; no activity was observed at the S1 crater. Intense, longer periods of spattering were reported in the N1 crater on 19, 24, and 25 March. Around 2242 on 23 March a lava overflow began from the N1 crater that, after about an hour, began moving down the October 2022 drainage and flow along the Sciara del Fuoco (figure 258). Between 0200 and 0400 on 26 March the flow rate increased, which generated avalanches of material from collapses at the advancing flow front. By early afternoon, the flow began to cool. On 25 March at 1548 an explosive sequence began from one of the vents at S2 in the CS crater area (figure 258). Fine ash mixed with coarse material was ejected 300 m above the crater rim and drifted SSE. Some modest explosions around Vent C were detected at 1549 on 25 March, which included an explosion at 1551 that ejected coarse material. The entire explosive sequence lasted approximately three minutes.
During April explosions persisted in both the N and CS crater areas. Fine material was ejected less than 80 m above the N crater rim until 6 April, followed by ejection of coarser material. Fine material was also ejected less than 80 m above the CS crater rim. The C and S2 crater did not show significant eruptive activity. On 7 April an explosive sequence was detected in the CS crater area at 1203 (figure 259). The first explosion lasted approximately 18 seconds and ejected material 400 m above the crater rim, depositing pyroclastic material in the upper part of the Sciara del Fuoco. At 1204 a second, less intense explosion lasted approximately four seconds and deposited pyroclastic products outside the crater area and near Pizzo Sopra La Fossa. A third explosion at 1205 was mainly composed of ash that rose about 150 m above the crater and lasted roughly 20 seconds. A fourth explosion occurred at 1205 about 28 seconds after the third explosion and ejected a mixture of coarse and fine material about 200 m above the crater; the explosion lasted roughly seven seconds. Overall, the entire explosive sequence lasted about two minutes and 20 seconds. After the explosive sequence on 7 April, explosions in both the N and CS crater areas ejected material as high as 150 m above the crater.
On 21 April research scientists from INGV made field observations in the summit area of Stromboli, and some lapilli samples were collected. In the N crater area near the N1 crater, a small cone was observed with at least two active vents, one of which was characterized by Strombolian explosions. The other vent produced explosions that ejected ash and chunks of cooled lava. At the N2 crater at least one vent was active and frequently emitted ash. In the CS crater area, a small cone contained 2-3 degassing vents and a smaller, possible fissure area also showed signs of degassing close to the Pizzo Sopra La Fossa. In the S part of the crater, three vents were active: a small hornito was characterized by modest and rare explosions, a vent that intermittently produced weak Strombolian explosions, and a vent at the end of the terrace that produced frequent ash emissions. Near the S1 crater there was a hornito that generally emitted weak gas-and-steam emissions, sometimes associated with “gas rings”. On 22 April another field inspection was carried out that reported two large sliding surfaces on the Sciara del Fuoco that showed where blocks frequently descended toward the sea. A thermal anomaly was detected at 0150 on 29 April.
Geologic Background. Spectacular incandescent nighttime explosions at Stromboli have long attracted visitors to the "Lighthouse of the Mediterranean" in the NE Aeolian Islands. This volcano has lent its name to the frequent mild explosive activity that has characterized its eruptions throughout much of historical time. The small island is the emergent summit of a volcano that grew in two main eruptive cycles, the last of which formed the western portion of the island. The Neostromboli eruptive period took place between about 13,000 and 5,000 years ago. The active summit vents are located at the head of the Sciara del Fuoco, a prominent scarp that formed about 5,000 years ago due to a series of slope failures which extends to below sea level. The modern volcano has been constructed within this scarp, which funnels pyroclastic ejecta and lava flows to the NW. Essentially continuous mild Strombolian explosions, sometimes accompanied by lava flows, have been recorded for more than a millennium.
Information Contacts: Istituto Nazionale di Geofisica e Vulcanologia (INGV), Sezione di Catania, Piazza Roma 2, 95123 Catania, Italy, (URL: http://www.ct.ingv.it/en/); MIROVA (Middle InfraRed Observation of Volcanic Activity), a collaborative project between the Universities of Turin and Florence (Italy) supported by the Centre for Volcanic Risk of the Italian Civil Protection Department (URL: http://www.mirovaweb.it/); Hawai'i Institute of Geophysics and Planetology (HIGP) - MODVOLC Thermal Alerts System, School of Ocean and Earth Science and Technology (SOEST), Univ. of Hawai'i, 2525 Correa Road, Honolulu, HI 96822, USA (URL: http://modis.higp.hawaii.edu/); Copernicus Browser, Copernicus Data Space Ecosystem, European Space Agency (URL: https://dataspace.copernicus.eu/browser/).
Nishinoshima (Japan) — July 2023 Cite this Report
Nishinoshima
Japan
27.247°N, 140.874°E; summit elev. 100 m
All times are local (unless otherwise noted)
Small ash plumes and fumarolic activity during November 2022 through April 2023
Nishinoshima is a small island located about 1,000 km S of Tokyo in the Ogasawara Arc in Japan. The island is the summit of a massive submarine volcano that has prominent peaks to the S, W, and NE. Eruptions date back to 1973; the most recent eruption period began in October 2022 and was characterized by ash plumes and fumarolic activity (BGVN 47:12). This report describes ash plumes and fumarolic activity during November 2022 through April 2023 based on monthly reports from the Japan Meteorological Agency (JMA) monthly reports and satellite data.
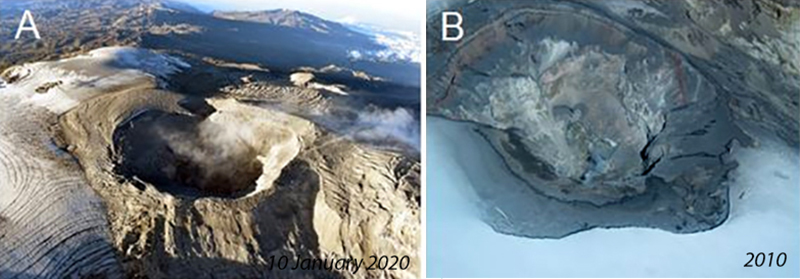
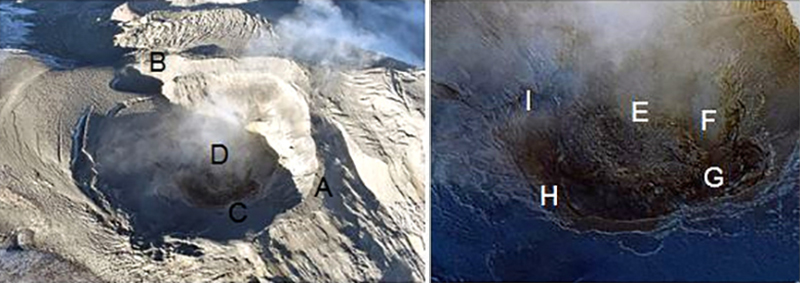
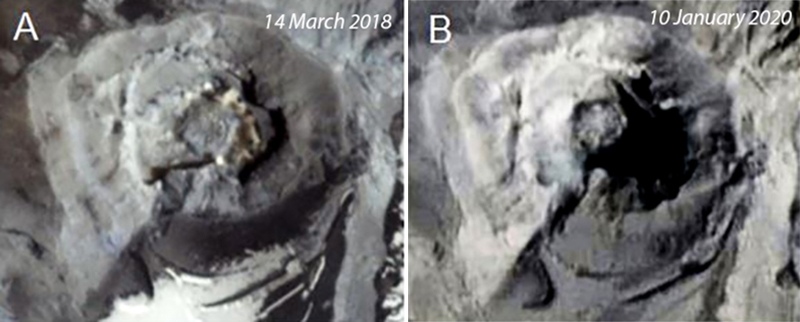
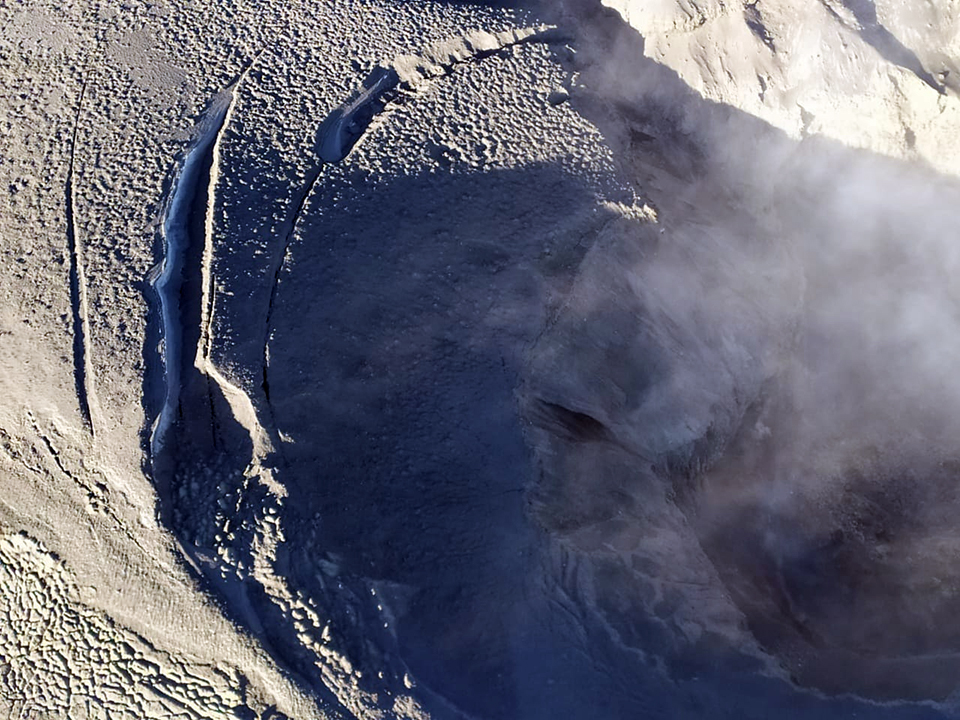
The most recent eruptive activity prior to the reporting internal occurred on 12 October 2022, when an ash plume rose 3.5 km above the crater rim. An aerial observation conducted by the Japan Coast Guard (JCG) on 25 November reported that white fumaroles rose approximately 200 m above the central crater of a pyroclastic cone (figure 119), and multiple plumes were observed on the ESE flank of the cone. Discolored water ranging from reddish-brown to brown and yellowish-green were visible around the perimeter of the island (figure 119). No significant activity was reported in December.
During an overflight conducted by JCG on 25 January 2023 intermittent activity and small, blackish-gray plumes rose 900 m above the central part of the crater were observed (figure 120). The fumarolic zone of the E flank and base of the cone had expanded and emissions had intensified. Dark brown discolored water was visible around the perimeter of the island.
No significant activity was reported during February through March. Ash plumes at 1050 and 1420 on 11 April rose 1.9 km above the crater rim and drifted NW and N. These were the first ash plumes observed since 12 October 2022. On 14 April JCG carried out an overflight and reported that no further eruptive activity was visible, although white gas-and-steam plumes were visible from the central crater and rose 900 m high (figure 121). Brownish and yellow-green discolored water surrounded the island.
Intermittent low-to-moderate power thermal anomalies were recorded in the MIROVA graph (Middle InfraRed Observation of Volcanic Activity) during November 2022 through April 2023 (figure 123). A cluster of six to eight anomalies were detected during November while a smaller number were detected during the following months: two to three during December, one during mid-January 2023, one during February, five during March, and two during April. Thermal activity was also reflected in infrared satellite data at the summit crater, accompanied by occasional gas-and-steam plumes (figure 124).
Geologic Background. The small island of Nishinoshima was enlarged when several new islands coalesced during an eruption in 1973-74. Multiple eruptions that began in 2013 completely covered the previous exposed surface and continued to enlarge the island. The island is the summit of a massive submarine volcano that has prominent peaks to the S, W, and NE. The summit of the southern cone rises to within 214 m of the ocean surface 9 km SSE.
Information Contacts: Japan Meteorological Agency (JMA), 1-3-4 Otemachi, Chiyoda-ku, Tokyo 100-8122, Japan (URL: http://www.jma.go.jp/jma/indexe.html); MIROVA (Middle InfraRed Observation of Volcanic Activity), a collaborative project between the Universities of Turin and Florence (Italy) supported by the Centre for Volcanic Risk of the Italian Civil Protection Department (URL: http://www.mirovaweb.it/); Copernicus Browser, Copernicus Data Space Ecosystem, European Space Agency (URL: https://dataspace.copernicus.eu/browser/).
Karangetang (Indonesia) — July 2023 Cite this Report
Karangetang
Indonesia
2.781°N, 125.407°E; summit elev. 1797 m
All times are local (unless otherwise noted)
Lava flows, incandescent avalanches, and ash plumes during January-June 2023
Karangetang (also known as Api Siau), at the northern end of the island of Siau, Indonesia, contains five summit craters along a N-S line. More than 40 eruptions have been recorded since 1675; recent eruptions have included frequent explosive activity, sometimes accompanied by pyroclastic flows and lahars. Lava dome growth has occurred in the summit craters and collapses of lava flow fronts have produced pyroclastic flows. The two active summit craters are Kawah Dua (the N crater) and Kawah Utama (the S crater, also referred to as the “Main Crater”). The most recent eruption began in late November 2018 and has more recently consisted of weak thermal activity and gas-and-steam emissions (BGVN 48:01). This report updates activity characterized by lava flows, incandescent avalanches, and ash plumes during January through June 2023 using reports from Pusat Vulkanologi dan Mitigasi Bencana Geologi (PVMBG, also known as CVGHM, or the Center of Volcanology and Geological Hazard Mitigation), MAGMA Indonesia, the Darwin VAAC (Volcano Ash Advisory Center), and satellite data.
Activity during January was relatively low and mainly consisted of white gas-and-steam emissions that rose 25-150 m above Main Crater (S crater) and drifted in different directions. Incandescence was visible from the lava dome in Kawah Dua (the N crater). Weather conditions often prevented clear views of the summit. On 18 January the number of seismic signals that indicated avalanches of material began to increase. In addition, there were a total of 71 earthquakes detected during the month.
Activity continued to increase during the first week of February. Material from Main Crater traveled as far as 800 m down the Batuawang (S) and Batang (W) drainages and as far as 1 km W down the Beha (W) drainage on 4 February. On 6 February 43 earthquake events were recorded, and on 7 February, 62 events were recorded. White gas-and-steam emissions rose 25-250 m above both summit craters throughout the month. PVMBG reported an eruption began during the evening of 8 February around 1700. Photos showed incandescent material at Main Crater. Incandescent material had also descended the flank in at least two unconfirmed directions as far as 2 km from Main Crater, accompanied by ash plumes (figure 60). As a result, PVMBG increased the Volcano Alert Level (VAL) to 3 (the second highest level on a 1-4 scale).
Occasional nighttime webcam images showed three main incandescent lava flows of differing lengths traveling down the S, SW, and W flanks (figure 61). Incandescent rocks were visible on the upper flanks, possibly from ejected or collapsed material from the crater, and incandescence was the most intense at the summit. Based on analyses of satellite imagery and weather models, the Darwin VAAC reported that daily ash plumes during 16-20 February rose to 2.1-3 km altitude and drifted NNE, E, and SE. BNPB reported on 16 February that as many as 77 people were evacuated and relocated to the East Siau Museum. A webcam image taken at 2156 on 17 February possibly showed incandescent material descending the SE flank. Ash plumes rose to 2.1 km altitude and drifted SE during 22-23 February, according to the Darwin VAAC.
Incandescent avalanches of material and summit incandescence at Main Crater continued during March. White gas-and-steam emissions during March generally rose 25-150 m above the summit crater; on 31 March gas-and-steam emissions rose 200-400 m high. An ash plume rose to 2.4 km altitude and drifted S at 1710 on 9 March and a large thermal anomaly was visible in images taken at 0550 and 0930 on 10 March. Incandescent material was visible at the summit and on the flanks based on webcam images taken at 0007 and 2345 on 16 March, at 1828 on 17 March, at 1940 on 18 March, at 2311 on 19 March, and at 2351 on 20 March. Incandescence was most intense on 18 and 20 March and webcam images showed possible Strombolian explosions (figure 62). An ash plume rose to 2.4 km altitude and drifted SW on 18 March, accompanied by a thermal anomaly.
Summit crater incandescence at Main Crater and on the flanks persisted during April. Incandescent material at the S crater and on the flanks was reported at 0016 on 1 April. The lava flows had stopped by 1 April according to PVMBG, although incandescence was still visible up to 10 m high. Seismic signals indicating effusion decreased and by 6 April they were no longer detected. Incandescence was visible from both summit craters. On 26 April the VAL was lowered to 2 (the second lowest level on a 1-4 scale). White gas-and-steam emissions rose 25-200 m above the summit crater.
During May white gas-and-steam emissions generally rose 50-250 m above the summit, though it was often cloudy, which prevented clear views; on 21 May gas-and-steam emissions rose 50-400 m high. Nighttime N summit crater incandescence rose 10-25 m above the lava dome, and less intense incandescence was noted above Main Crater, which reached about 10 m above the dome. Sounds of falling rocks at Main Crater were heard on 15 May and the seismic network recorded 32 rockfall events in the crater on 17 May. Avalanches traveled as far as 1.5 km down the SW and S flanks, accompanied by rumbling sounds on 18 May. Incandescent material descending the flanks was captured in a webcam image at 2025 on 19 May (figure 63) and on 29 May; summit crater incandescence was observed in webcam images at 2332 on 26 May and at 2304 on 29 May. On 19 May the VAL was again raised to 3.
Occasional Main Crater incandescence was reported during June, as well as incandescent material on the flanks. White gas-and-steam emissions rose 10-200 m above the summit crater. Ash plumes rose to 2.1 km altitude and drifted SE and E during 2-4 June, according to the Darwin VAAC. Material on the flanks of Main Crater were observed at 2225 on 7 June, at 2051 on 9 June, at 0007 on 17 June, and at 0440 on 18 June. Webcam images taken on 21, 25, and 27 June showed incandescence at Main Crater and from material on the flanks.
MIROVA (Middle InfraRed Observation of Volcanic Activity) analysis of MODIS satellite data showed strong thermal activity during mid-February through March and mid-May through June, which represented incandescent avalanches and lava flows (figure 64). During April through mid-May the power of the anomalies decreased but frequent anomalies were still detected. Brief gaps in activity occurred during late March through early April and during mid-June. Infrared satellite images showed strong lava flows mainly affecting the SW and S flanks, accompanied by gas-and-steam emissions (figure 65). According to data recorded by the MODVOLC thermal algorithm, there were a total of 79 thermal hotspots detected: 28 during February, 24 during March, one during April, five during May, and 21 during June.
Geologic Background. Karangetang (Api Siau) volcano lies at the northern end of the island of Siau, about 125 km NNE of the NE-most point of Sulawesi. The stratovolcano contains five summit craters along a N-S line. It is one of Indonesia's most active volcanoes, with more than 40 eruptions recorded since 1675 and many additional small eruptions that were not documented (Neumann van Padang, 1951). Twentieth-century eruptions have included frequent explosive activity sometimes accompanied by pyroclastic flows and lahars. Lava dome growth has occurred in the summit craters; collapse of lava flow fronts have produced pyroclastic flows.
Information Contacts: Pusat Vulkanologi dan Mitigasi Bencana Geologi (PVMBG, also known as Indonesian Center for Volcanology and Geological Hazard Mitigation, CVGHM), Jalan Diponegoro 57, Bandung 40122, Indonesia (URL: http://www.vsi.esdm.go.id/); MAGMA Indonesia, Kementerian Energi dan Sumber Daya Mineral (URL: https://magma.esdm.go.id/v1); Badan Nasional Penanggulangan Bencana (BNPB), National Disaster Management Agency, Graha BNPB - Jl. Scout Kav.38, East Jakarta 13120, Indonesia (URL: http://www.bnpb.go.id/); Darwin Volcanic Ash Advisory Centre (VAAC), Bureau of Meteorology, Northern Territory Regional Office, PO Box 40050, Casuarina, NT 0811, Australia (URL: http://www.bom.gov.au/info/vaac/); MIROVA (Middle InfraRed Observation of Volcanic Activity), a collaborative project between the Universities of Turin and Florence (Italy) supported by the Centre for Volcanic Risk of the Italian Civil Protection Department (URL: http://www.mirovaweb.it/); Hawai'i Institute of Geophysics and Planetology (HIGP) - MODVOLC Thermal Alerts System, School of Ocean and Earth Science and Technology (SOEST), Univ. of Hawai'i, 2525 Correa Road, Honolulu, HI 96822, USA (URL: http://modis.higp.hawaii.edu/); Copernicus Browser, Copernicus Data Space Ecosystem, European Space Agency (URL: https://dataspace.copernicus.eu/browser/); IDN Times, Jl. Jend. Gatot Subroto Kav. 27 3rd Floor Kuningan, Jakarta, Indonesia 12950, Status of Karangetang Volcano in Sitaro Islands Increases (URL: https://sulsel.idntimes.com/news/indonesia/savi/status-gunung-api-karangetang-di-kepulauan-sitaro-meningkat?page=all).
Ahyi (United States) — July 2023 Cite this Report
Ahyi
United States
20.42°N, 145.03°E; summit elev. -75 m
All times are local (unless otherwise noted)
Intermittent hydroacoustic signals and discolored plumes during November 2022-June 2023
Ahyi seamount is a large, conical submarine volcano that rises to within 75 m of the ocean surface about 18 km SE of the island of Farallon de Pajaros in the Northern Marianas. The remote location of the seamount has made eruptions difficult to document, but seismic stations installed in the region confirmed an eruption in the vicinity in 2001. No new activity was detected until April-May 2014 when an eruption was detected by NOAA (National Oceanic and Atmospheric Administration) divers, hydroacoustic sensors, and seismic stations (BGVN 42:04). New activity was first detected on 15 November by hydroacoustic sensors that were consistent with submarine volcanic activity. This report covers activity during November 2022 through June 2023 based on daily and weekly reports from the US Geological Survey.
Starting in mid-October, hydroacoustic sensors at Wake Island (2.2 km E) recorded signals consistent with submarine volcanic activity, according to a report from the USGS issued on 15 November 2022. A combined analysis of the hydroacoustic signals and seismic stations located at Guam and Chichijima Island, Japan, suggested that the source of this activity was at or near the Ahyi seamount. After a re-analysis of a satellite image of the area that was captured on 6 November, USGS confirmed that there was no evidence of discoloration at the ocean surface. Few hydroacoustic and seismic signals continued through November, including on 18 November, which USGS suggested signified a decline or pause in unrest. A VONA (Volcano Observatory Notice for Aviation) reported that a discolored water plume was persistently visible in satellite data starting on 18 November (figure 6). Though clouds often obscured clear views of the volcano, another discolored water plume was captured in a satellite image on 26 November. The Aviation Color Code (ACC) was raised to Yellow (the second lowest level on a four-color scale) and the Volcano Alert Level (VAL) was raised to Advisory (the second lowest level on a four-level scale) on 29 November.
During December, occasional detections were recorded on the Wake Island hydrophone sensors and discolored water over the seamount remained visible. During 2-7, 10-12, and 16-31 December possible explosion signals were detected. A small area of discolored water was observed in high-resolution Sentinel-2 satellite images during 1-6 December (figure 7). High-resolution satellite images recorded discolored water plumes on 13 December that originated from the summit region; no observations indicated that activity breached the ocean surface. A possible underwater plume was visible in satellite images on 18 December, and during 19-20 December a definite but diffuse underwater plume located SSE from the main vent was reported. An underwater plume was visible in a satellite image taken on 26 December (figure 7).
Hydrophone sensors continued to detect signals consistent with possible explosions during 1-8 January 2023. USGS reported that the number of detections decreased during 4-5 January. The hydrophone sensors experienced a data outage that started at 0118 on 8 January and continued through 10 January, though according to USGS, possible explosions were recorded prior to the data outage and likely continued during the outage. A discolored water plume originating from the summit region was detected in a partly cloudy satellite image on 8 January. On 11-12 and 15-17 January possible explosion signals were recorded again. One small signal was detected during 22-23 January and several signals were recorded on 25 and 31 January. During 27-31 January a plume of discolored water was observed above the seamount in satellite imagery (figure 8).
Low levels of activity continued during February and March, based on data from pressure sensors on Wake Island. During 1 and 4-6 February activity was reported, and a submarine plume was observed on 4 February (figure 8). Possible explosion signals were detected during 7-8, 10, 13-14, and 24 February. During 1-2 and 3-5 March a plume of discolored water was observed in satellite imagery (figure 8). Almost continuous hydroacoustic signals were detected in remote pressure sensor data on Wake Island 2,270 km E from the volcano during 7-13 March. During 12-13 March water discoloration around the seamount was observed in satellite imagery, despite cloudy weather. By 14 March discolored water extended about 35 km, but no direction was noted. USGS reported that the continuous hydroacoustic signals detected during 13-14 March stopped abruptly on 14 March and no new detections were observed. Three 30 second hydroacoustic detections were reported during 17-19 March, but no activity was visible due to cloudy weather. A data outage was reported during 21-22 March, making pressure sensor data unavailable; a discolored water plume was, however, visible in satellite data. A possible underwater explosion signal was detected by pressure sensors at Wake Island on 26, 29, and 31 March, though the cause and origin of these events were unclear.
Similar low activity continued during April, May, and June. Several signals were detected during 1-3 April in pressure sensors at Wake Island. USGS suggested that these may be related to underwater explosions or earthquakes at the volcano, but no underwater plumes were visible in clear satellite images. The pressure sensors had data outages during 12-13 April and no data were recorded; no underwater plumes were visible in satellite images, although cloudy weather obscured most clear views. Eruptive activity was reported starting at 2210 on 21 May. On 22 May a discolored water plume that extended 4 km was visible in satellite images, though no direction was recorded. During 23-24 May some signals were detected by the underwater pressure sensors. Possible hydroacoustic signals were detected during 2-3 and 6-8 June. Multiple hydroacoustic signals were detected during 9-11 and 16-17 June, although no activity was visible in satellite images. One hydroacoustic signal was detected during 23-24 June, but there was some uncertainty about its association with volcanic activity. A single possible hydroacoustic signal was detected during 30 June to 1 July.
Geologic Background. Ahyi seamount is a large conical submarine volcano that rises to within 75 m of the ocean surface ~18 km SE of the island of Farallon de Pajaros in the northern Marianas. Water discoloration has been observed there, and in 1979 the crew of a fishing boat felt shocks over the summit area, followed by upwelling of sulfur-bearing water. On 24-25 April 2001 an explosive eruption was detected seismically by a station on Rangiroa Atoll, Tuamotu Archipelago. The event was well constrained (+/- 15 km) at a location near the southern base of Ahyi. An eruption in April-May 2014 was detected by NOAA divers, hydroacoustic sensors, and seismic stations.
Information Contacts: US Geological Survey, Volcano Hazards Program (USGS-VHP), 12201 Sunrise Valley Drive, Reston, VA, USA, https://volcanoes.usgs.gov/index.html; Copernicus Browser, Copernicus Data Space Ecosystem, European Space Agency (URL: https://dataspace.copernicus.eu/browser/).
Kadovar (Papua New Guinea) — June 2023 Cite this Report
Kadovar
Papua New Guinea
3.608°S, 144.588°E; summit elev. 365 m
All times are local (unless otherwise noted)
An ash plume and weak thermal anomaly during May 2023
Kadovar is a 2-km-wide island that is the emergent summit of a Bismarck Sea stratovolcano. It lies off the coast of New Guinea, about 25 km N of the mouth of the Sepik River. Prior to an eruption that began in 2018, a lava dome formed the high point of the volcano, filling an arcuate landslide scarp open to the S. Submarine debris-avalanche deposits occur to the S of the island. The current eruption began in January 2018 and has comprised lava effusion from vents at the summit and at the E coast; more recent activity has consisted of ash plumes, weak thermal activity, and gas-and-steam plumes (BGVN 48:02). This report covers activity during February through May 2023 using information from the Darwin Volcanic Ash Advisory Center (VAAC) and satellite data.
Activity during the reporting period was relatively low and mainly consisted of white gas-and-steam plumes that were visible in natural color satellite images on clear weather days (figure 67). According to a Darwin VAAC report, at 2040 on 6 May an ash plume rose to 4.6 km altitude and drifted W; by 2300 the plume had dissipated. MODIS satellite instruments using the MODVOLC thermal algorithm detected a single thermal hotspot on the SE side of the island on 7 May. Weak thermal activity was also detected in a satellite image on the E side of the island on 14 May, accompanied by a white gas-and-steam plume that drifted SE (figure 68).
Geologic Background. The 2-km-wide island of Kadovar is the emergent summit of a Bismarck Sea stratovolcano of Holocene age. It is part of the Schouten Islands, and lies off the coast of New Guinea, about 25 km N of the mouth of the Sepik River. Prior to an eruption that began in 2018, a lava dome formed the high point of the andesitic volcano, filling an arcuate landslide scarp open to the south; submarine debris-avalanche deposits occur in that direction. Thick lava flows with columnar jointing forms low cliffs along the coast. The youthful island lacks fringing or offshore reefs. A period of heightened thermal phenomena took place in 1976. An eruption began in January 2018 that included lava effusion from vents at the summit and at the E coast.
Information Contacts: Darwin Volcanic Ash Advisory Centre (VAAC), Bureau of Meteorology, Northern Territory Regional Office, PO Box 40050, Casuarina, NT 0811, Australia (URL: http://www.bom.gov.au/info/vaac/); Hawai'i Institute of Geophysics and Planetology (HIGP) - MODVOLC Thermal Alerts System, School of Ocean and Earth Science and Technology (SOEST), Univ. of Hawai'i, 2525 Correa Road, Honolulu, HI 96822, USA (URL: http://modis.higp.hawaii.edu/); Copernicus Browser, Copernicus Data Space Ecosystem, European Space Agency (URL: https://dataspace.copernicus.eu/browser/).
San Miguel (El Salvador) — June 2023 Cite this Report
San Miguel
El Salvador
13.434°N, 88.269°W; summit elev. 2130 m
All times are local (unless otherwise noted)
Small gas-and-ash explosions during March and May 2023
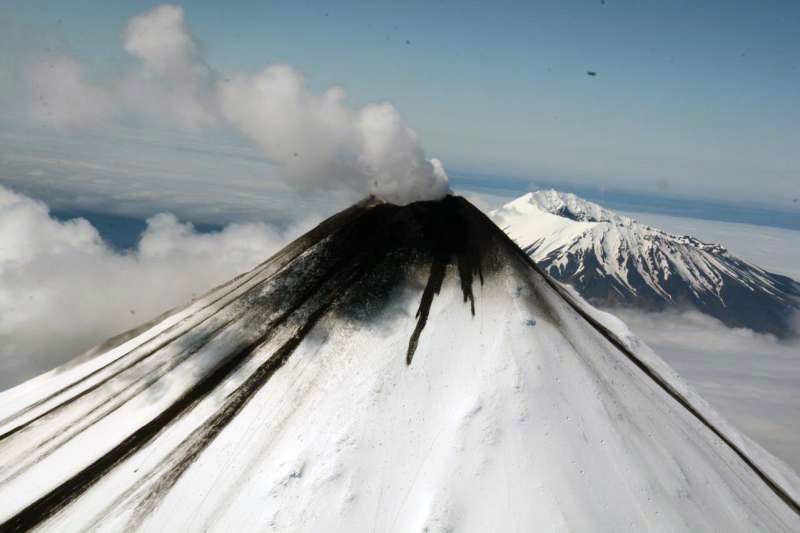
San Miguel in El Salvador is a broad, deep crater complex that has been frequently modified by eruptions recorded since the early 16th century and consists of the summit known locally as Chaparrastique. Flank eruptions have produced lava flows that extended to the N, NE, and SE during the 17-19th centuries. The most recent activity has consisted of minor ash eruptions from the summit crater. The current eruption period began in November 2022 and has been characterized by frequent phreatic explosions, gas-and-ash emissions, and sulfur dioxide plumes (BGVN 47:12). This report describes small gas-and-ash explosions during December 2022 through May 2023 based on special reports from the Ministero de Medio Ambiente y Recursos Naturales (MARN).
Activity has been relatively low since the last recorded explosions on 29 November 2022. Seismicity recorded by the San Miguel Volcano Station (VSM) located on the N flank at 1.7 km elevation had decreased by 7 December. Sulfur dioxide gas measurements taken with DOAS (Differential Optical Absorption Spectroscopy) mobile equipment were below typical previously recorded values: 300 tons per day (t/d). During December, small explosions were recorded by the seismic network and manifested as gas-and-steam emissions.
Gas-and-ash explosions in the crater occurred during January 2023, which were recorded by the seismic network. Sulfur dioxide values remained low, between 300-400 t/d through 10 March. At 0817 on 14 January a gas-and-ash emission was visible in webcam images, rising just above the crater rim. Some mornings during February, small gas-and-steam plumes were visible in the crater. On 7 March at 2252 MARN noted an increase in degassing from the central crater; gas emissions were constantly observed through the early morning hours on 8 March. During the early morning of 8 March through the afternoon on 9 March, 12 emissions were registered, some accompanied by ash. The last gas-and-ash emission was recorded at 1210 on 9 March; very fine ashfall was reported in El Tránsito (10 km S), La Morita (6 km W), and La Piedrita (3 km W). The smell of sulfur was reported in Piedra Azul (5 km SW). On 16 March MARN reported that gas-and-steam emissions decreased.
Low degassing and very low seismicity were reported during April; no explosions have been detected between 9 March and 27 May. The sulfur dioxide emissions remained between 350-400 t/d; during 13-20 April sulfur dioxide values fluctuated between 30-300 t/d. Activity remained low through most of May; on 23 May seismicity increased. An explosion was detected at 1647 on 27 May generated a gas-and-ash plume that rose 700 m high (figure 32); a decrease in seismicity and gas emissions followed. The DOAS station installed on the W flank recorded sulfur dioxide values that reached 400 t/d on 27 May; subsequent measurements showed a decrease to 268 t/d on 28 May and 100 t/d on 29 May.
Geologic Background. The symmetrical cone of San Miguel, one of the most active volcanoes in El Salvador, rises from near sea level to form one of the country's most prominent landmarks. A broad, deep, crater complex that has been frequently modified by eruptions recorded since the early 16th century caps the truncated unvegetated summit, also known locally as Chaparrastique. Flanks eruptions of the basaltic-andesitic volcano have produced many lava flows, including several during the 17th-19th centuries that extended to the N, NE, and SE. The SE-flank flows are the largest and form broad, sparsely vegetated lava fields crossed by highways and a railroad skirting the base of the volcano. Flank vent locations have migrated higher on the edifice during historical time, and the most recent activity has consisted of minor ash eruptions from the summit crater.
Information Contacts: Ministero de Medio Ambiente y Recursos Naturales (MARN), Km. 5½ Carretera a Nueva San Salvador, Avenida las Mercedes, San Salvador, El Salvador (URL: http://www.snet.gob.sv/ver/vulcanologia).
Semisopochnoi (United States) — June 2023 Cite this Report
Semisopochnoi
United States
51.93°N, 179.58°E; summit elev. 1221 m
All times are local (unless otherwise noted)
Occasional explosions, ash deposits, and gas-and-steam plumes during December 2022-May 2023
Semisopochnoi is located in the western Aleutians, is 20-km-wide at sea level, and contains an 8-km-wide caldera. The three-peaked Mount Young (formerly Cerberus) was constructed within the caldera during the Holocene. Each of these peaks contains a summit crater; the lava flows on the N flank appear younger than those on the S side. The current eruption period began in early February 2021 and has more recently consisted of intermittent explosions and ash emissions (BGVN 47:12). This report updates activity during December 2022 through May 2023 using daily, weekly, and special reports from the Alaska Volcano Observatory (AVO). AVO monitors the volcano using local seismic and infrasound sensors, satellite data, web cameras, and remote infrasound and lightning networks.
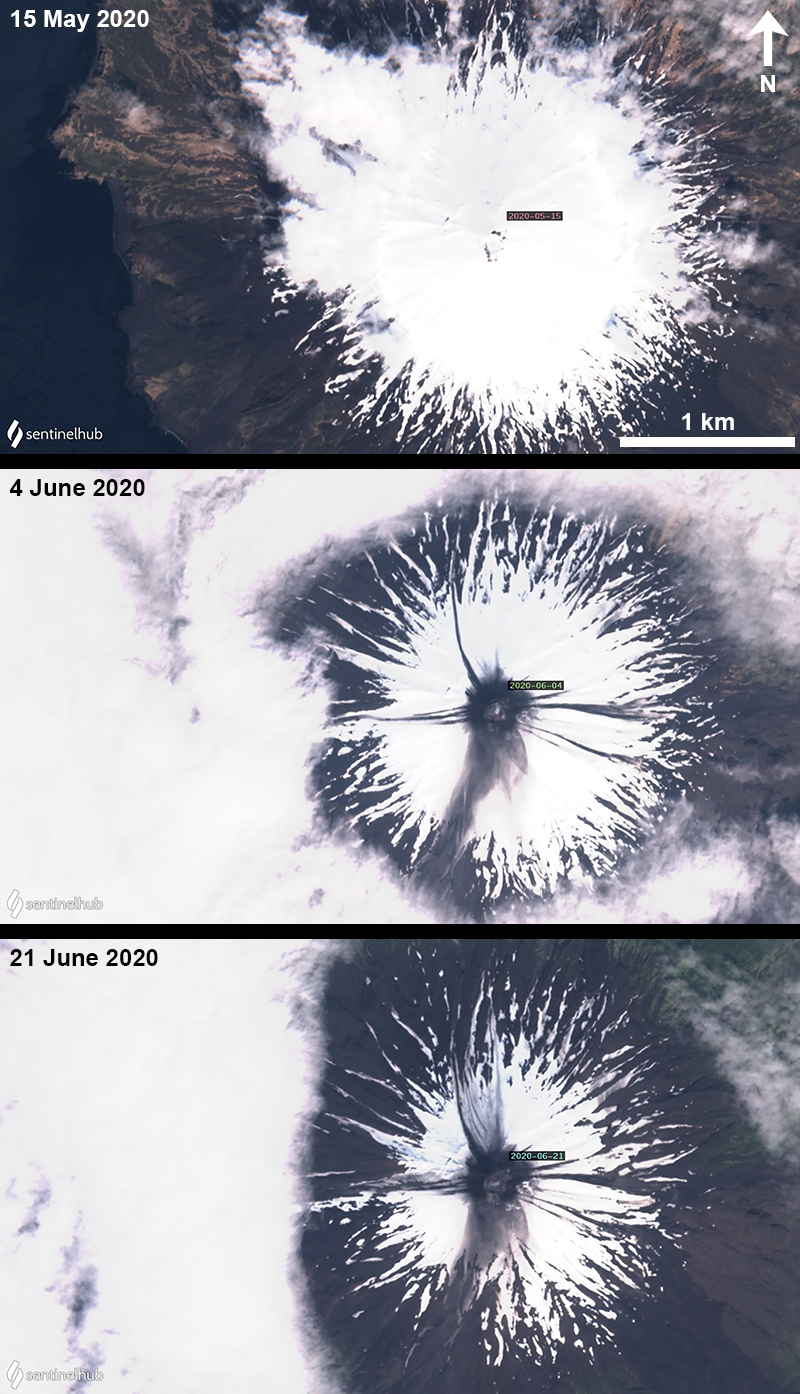
Activity during most of December 2022 was relatively quiet; according to AVO no eruptive or explosive activity was observed since 7 November 2022. Intermittent tremor and occasional small earthquakes were observed in geophysical data. Continuous gas-and-steam emissions were observed from the N crater of Mount Young in webcam images on clear weather days (figure 25). On 24 December, there was a slight increase in earthquake activity and several small possible explosion signals were detected in infrasound data. Eruptive activity resumed on 27 December at the N crater of Mount Young; AVO issued a Volcano Activity Notice (VAN) that reported minor ash deposits on the flanks of Mount Young that extended as far as 1 km from the vent, according to webcam images taken during 27-28 December (figure 26). No ash plumes were observed in webcam or satellite imagery, but a persistent gas-and-steam plume that might have contained some ash rose to 1.5 km altitude. As a result, AVO raised the Aviation Color Code (ACC) to Orange (the second highest level on a four-color scale) and the Volcano Alert Level (VAL) to Watch (the second highest level on a four-level scale). Possible explosions were detected during 21 December 2022 through 1 January 2023 and seismic tremor was recorded during 30-31 December.
During January 2023 eruptive activity continued at the active N crater of Mount Young. Minor ash deposits were observed on the flanks, extending about 2 km SSW, based on webcam images from 1 and 3 January. A possible explosion occurred during 1-2 January based on elevated seismicity recorded on local seismometers and an infrasound signal recorded minutes later by an array at Adak. Though no ash plumes were observed in webcam or satellite imagery, a persistent gas-and-steam plume rose to 1.5 km altitude that might have carried minor traces of ash. Ash deposits were accompanied by periods of elevated seismicity and infrasound signals from the local geophysical network, which AVO reported were likely due to weak explosive activity. Low-level explosive activity was also detected during 2-3 January, with minor gas-and-steam emissions and a new ash deposit that was visible in webcam images. Low-level explosive activity was detected in geophysical data during 4-5 January, with elevated seismicity and infrasound signals observed on local stations. Volcanic tremor was detected during 7-9 January and very weak explosive activity was detected in seismic and infrasound data on 9 January. Weak seismic and infrasound signals were recorded on 17 January, which indicated minor explosive activity, but no ash emissions were observed in clear webcam images; a gas-and-steam plume continued to rise to 1.5 km altitude. During 29-30 January, ash deposits near the summit were observed on fresh snow, according to webcam images.
The active N cone at Mount Young continued to produce a gas-and-steam plume during February, but no ash emissions or explosive events were detected. Seismicity remained elevated with faint tremor during early February. Gas-and-steam emissions from the N crater were observed in clear webcam images on 11-13 and 16 February; no explosive activity was detected in seismic, infrasound, or satellite data. Seismicity has also decreased, with no significant seismic tremor observed since 25 January. Therefore, the ACC was lowered to Yellow (the second lowest level on a four-color scale) and the VAL was lowered to Advisory (the second lowest level on a four-color scale) on 22 February.
Gas-and-steam emissions persisted during March from the N cone of Mount Young, based on clear webcam images. A few brief episodes of weak tremor were detected in seismic data, although seismicity decreased over the month. A gas-and-steam plume detected in satellite data extended 150 km on 18 March. Low-level ash emissions from the N cone at Mount Young were observed in several webcam images during 18-19 March, in addition to small explosions and volcanic tremor. The ACC was raised to Orange and the VAL increased to Watch on 19 March. A small explosion was detected in seismic and infrasound data on 21 March.
Low-level unrest continued during April, although cloudy weather often obscured views of the summit; periods of seismic tremor and local earthquakes were recorded. During 3-4 April a gas-and-steam plume was visible traveling more than 200 km overnight; no ash was evident in the plume, according to AVO. A gas-and-steam plume was observed during 4-6 April that extended 400 km but did not seem to contain ash. Small explosions were detected in seismic and infrasound data on 5 April. Occasional clear webcam images showed continuing gas-and-steam emissions rose from Mount Young, but no ash deposits were observed on the snow. On 19 April small explosions and tremor were detected in seismic and infrasound data. A period of seismic tremor was detected during 22-25 April, with possible weak explosions on 25 April. Ash deposits were visible near the crater rim, but it was unclear if these deposits were recent or due to older deposits.
Occasional small earthquakes were recorded during May, but there were no signs of explosive activity seen in geophysical data. Gas-and-steam emissions continued from the N crater of Mount Young, based on webcam images, and seismicity remained slightly elevated. A new, light ash deposit was visible during the morning of 5 May on fresh snow on the NW flank of Mount Young. During 10 May periods of volcanic tremor were observed. The ACC was lowered to Yellow and the VAL to Advisory on 17 May due to no additional evidence of activity.
Geologic Background. Semisopochnoi, the largest subaerial volcano of the western Aleutians, is 20 km wide at sea level and contains an 8-km-wide caldera. It formed as a result of collapse of a low-angle, dominantly basaltic volcano following the eruption of a large volume of dacitic pumice. The high point of the island is Anvil Peak, a double-peaked late-Pleistocene cone that forms much of the island's northern part. The three-peaked Mount Cerberus (renamed Mount Young in 2023) was constructed within the caldera during the Holocene. Each of the peaks contains a summit crater; lava flows on the N flank appear younger than those on the south side. Other post-caldera volcanoes include the symmetrical Sugarloaf Peak SSE of the caldera and Lakeshore Cone, a small cinder cone at the edge of Fenner Lake in the NE part of the caldera. Most documented eruptions have originated from Young, although Coats (1950) considered that both Sugarloaf and Lakeshore Cone could have been recently active.
Information Contacts: Alaska Volcano Observatory (AVO), a cooperative program of a) U.S. Geological Survey, 4200 University Drive, Anchorage, AK 99508-4667 USA (URL: https://avo.alaska.edu/), b) Geophysical Institute, University of Alaska, PO Box 757320, Fairbanks, AK 99775-7320, USA, and c) Alaska Division of Geological & Geophysical Surveys, 794 University Ave., Suite 200, Fairbanks, AK 99709, USA (URL: http://dggs.alaska.gov/).
Ebeko
Russia
50.686°N, 156.014°E; summit elev. 1103 m
All times are local (unless otherwise noted)
Continued explosions, ash plumes, and ashfall during October 2022-May 2023
Ebeko, located on the N end of Paramushir Island in the Kuril Islands, consists of three summit craters along a SSW-NNE line at the northern end of a complex of five volcanic cones. Eruptions date back to the late 18th century and have been characterized as small-to-moderate explosions from the summit crater, accompanied by intense fumarolic activity. The current eruption period began in June 2022 and has recently consisted of frequent explosions, ash plumes, and thermal activity (BGVN 47:10). This report covers similar activity during October 2022 through May 2023, based on information from the Kamchatka Volcanic Eruptions Response Team (KVERT) and satellite data.
Activity during October consisted of explosive activity, ash plumes, and occasional thermal anomalies. Visual data by volcanologists from Severo-Kurilsk showed explosions producing ash clouds up to 2.1-3 km altitude which drifted E, N, NE, and SE during 1-8, 10, 16, and 18 October. KVERT issued several Volcano Observatory Notices for Aviation (VONA) on 7, 13-15, and 27 October 2022, stating that explosions generated ash plumes that rose to 2.3-4 km altitude and drifted 5 km E, NE, and SE. Ashfall was reported in Severo-Kurilsk (Paramushir Island, about 7 km E) on 7 and 13 October. Satellite data showed a thermal anomaly over the volcano on 15-16 October. Visual data showed ash plumes rising to 2.5-3.6 km altitude on 22, 25-29, and 31 October and moving NE due to constant explosions.
Similar activity continued during November, with explosions, ash plumes, and ashfall occurring. KVERT issued VONAs on 1-2, 4, 6-7, 9, 13, and 16 November that reported explosions and resulting ash plumes that rose to 1.7-3.6 km altitude and drifted 3-5 km SE, ESE, E, and NE. On 1 November ash plumes extended as far as 110 km SE. On 5, 8, 12, and 24-25 November explosions and ash plumes rose to 2-3.1 km altitude and drifted N and E. Ashfall was observed in Severo-Kurilsk on 7 and 16 November. A thermal anomaly was visible during 1-4, 16, and 20 November. Explosions during 26 November rose as high as 2.7 km altitude and drifted NE (figure 45).
Explosions and ash plumes continued to occur in December. During 1-2 and 4 December volcanologists from Severo-Kurilsk observed explosions that sent ash to 1.9-2.5 km altitude and drifted NE and SE (figure 46). VONAs were issued on 5, 9, and 16 December reporting that explosions generated ash plumes rising to 1.9 km, 2.6 km, and 2.4 km altitude and drifted 5 km SE, E, and NE, respectively. A thermal anomaly was visible in satellite imagery on 16 December. On 18 and 27-28 December explosions produced ash plumes that rose to 2.5 km altitude and drifted NE and SE. On 31 December an ash plume rose to 2 km altitude and drifted NE.
Explosions continued during January 2023, based on visual observations by volcanologists from Severo-Kurilsk. During 1-7 January explosions generated ash plumes that rose to 4 km altitude and drifted NE, E, W, and SE. According to VONAs issued by KVERT on 2, 4, 10, and 23 January, explosions produced ash plumes that rose to 2-4 km altitude and drifted 5 km N, NE, E, and ENE; the ash plume that rose to 4 km altitude occurred on 10 January (figure 47). Satellite data showed a thermal anomaly during 3-4, 10, 13, 16, 21, 22, and 31 January. KVERT reported that an ash cloud on 4 January moved 12 km NE. On 6 and 9-11 January explosions sent ash plumes to 4.5 km altitude and drifted W and ESE. On 13 January an ash plume rose to 3 km altitude and drifted SE. During 20-24 January ash plumes from explosions rose to 3.7 km altitude and drifted SE, N, and NE. On 21 January the ash plume drifted as far as 40 km NE. During 28-29 and 31 January and 1 February ash plumes rose to 4 km altitude and drifted NE.
During February, explosions, ash plumes, and ashfall were reported. During 1, 4-5 and 7-8 February explosions generated ash plumes that rose to 4.5 km altitude and drifted E and NE; ashfall was observed on 5 and 8 February. On 6 February an explosion produced an ash plume that rose to 3 km altitude and drifted 7 km E, causing ashfall in Severo-Kurilsk. A thermal anomaly was visible in satellite data on 8, 9, 13, and 21 February. Explosions on 9 and 12-13 February produced ash plumes that rose to 4 km altitude and drifted E and NE; the ash cloud on 12 February extended as far as 45 km E. On 22 February explosions sent ash to 3 km altitude that drifted E. During 24 and 26-27 February ash plumes rose to 4 km altitude and drifted E. On 28 February an explosion sent ash to 2.5-3 km altitude and drifted 5 km E; ashfall was observed in Severo-Kurilsk.
Activity continued during March; visual observations showed that explosions generated ash plumes that rose to 3.6 km altitude on 3, 5-7, and 9-12 March and drifted E, NE, and NW. Thermal anomalies were visible on 10, 13, and 29-30 March in satellite imagery. On 18, 21-23, 26, and 29-30 March explosions produced ash plumes that rose to 2.8 km altitude and drifted NE and E; the ash plumes during 22-23 March extended up to 76 km E. A VONA issued on 21 March reported an explosion that produced an ash plume that rose to 2.8 km altitude and drifted 5 km E. Another VONA issued on 23 March reported that satellite data showed an ash plume rising to 3 km altitude and drifted 14 km E.
Explosions during April continued to generate ash plumes. On 1 and 4 April an ash plume rose to 2.8-3.5 km altitude and drifted SE and NE. A thermal anomaly was visible in satellite imagery during 1-6 April. Satellite data showed ash plumes and clouds rising to 2-3 km altitude and drifting up to 12 km SW and E on 3 and 6 April (figure 48). KVERT issued VONAs on 3, 5, 14, 16 April describing explosions that produced ash plumes rising to 3 km, 3.5 km, 3.5 km, and 3 km altitude and drifting 5 km S, 5 km NE and SE, 72 km NNE, and 5 km NE, respectively. According to satellite data, the resulting ash cloud from the explosion on 14 April was 25 x 7 km in size and drifted 72-104 km NNE during 14-15 April. According to visual data by volcanologists from Severo-Kurilsk explosions sent ash up to 3.5 km altitude that drifted NE and E during 15-16, 22, 25-26, and 29 April.
The explosive eruption continued during May. Explosions during 3-4, 6-7, and 9-10 May generated ash plumes that rose to 4 km altitude and drifted SW and E. Satellite data showed a thermal anomaly on 3, 9, 13-14, and 24 May. During 12-16, 23-25, and 27-28 May ash plumes rose to 3.5 km altitude and drifted in different directions due to explosions. Two VONA notices were issued on 16 and 25 May, describing explosions that generated ash plumes rising to 3 km and 3.5 km altitude, respectively and extending 5 km E. The ash cloud on 25 May drifted 75 km SE.
Thermal activity in the summit crater, occasionally accompanied by ash plumes and ash deposits on the SE and E flanks due to frequent explosions, were visible in infrared and true color satellite images (figure 49).
Geologic Background. The flat-topped summit of the central cone of Ebeko volcano, one of the most active in the Kuril Islands, occupies the northern end of Paramushir Island. Three summit craters located along a SSW-NNE line form Ebeko volcano proper, at the northern end of a complex of five volcanic cones. Blocky lava flows extend west from Ebeko and SE from the neighboring Nezametnyi cone. The eastern part of the southern crater contains strong solfataras and a large boiling spring. The central crater is filled by a lake about 20 m deep whose shores are lined with steaming solfataras; the northern crater lies across a narrow, low barrier from the central crater and contains a small, cold crescentic lake. Historical activity, recorded since the late-18th century, has been restricted to small-to-moderate explosive eruptions from the summit craters. Intense fumarolic activity occurs in the summit craters, on the outer flanks of the cone, and in lateral explosion craters.
Information Contacts: Kamchatka Volcanic Eruptions Response Team (KVERT), Far Eastern Branch, Russian Academy of Sciences, 9 Piip Blvd., Petropavlovsk-Kamchatsky, 683006, Russia (URL: http://www.kscnet.ru/ivs/kvert/); MIROVA (Middle InfraRed Observation of Volcanic Activity), a collaborative project between the Universities of Turin and Florence (Italy) supported by the Centre for Volcanic Risk of the Italian Civil Protection Department (URL: http://www.mirovaweb.it/); Copernicus Browser, Copernicus Data Space Ecosystem, European Space Agency (URL: https://dataspace.copernicus.eu/browser/).
Home Reef
Tonga
18.992°S, 174.775°W; summit elev. -10 m
All times are local (unless otherwise noted)
Discolored plumes continued during November 2022-April 2023
Home Reef is a submarine volcano located in the central Tonga islands between Lateiki (Metis Shoal) and Late Island. The first recorded eruption occurred in the mid-19th century, when an ephemeral island formed. An eruption in 1984 produced a 12-km-high eruption plume, a large volume of floating pumice, and an ephemeral island 500 x 1,500 m wide, with cliffs 30-50 m high that enclosed a water-filled crater. Another island-forming eruption in 2006 produced widespread pumice rafts that drifted as far as Australia; by 2008 the island had eroded below sea level. The previous eruption occurred during October 2022 and was characterized by a new island-forming eruption, lava effusion, ash plumes, discolored water, and gas-and-steam plumes (BGVN 47:11). This report covers discolored water plumes during November 2022 through April 2023 using satellite data.
Discolored plumes continued during the reporting period and were observed in true color satellite images on clear weather days. Satellite images show light green-yellow discolored water extending W on 8 and 28 November 2022 (figure 31), and SW on 18 November. Light green-yellow plumes extended W on 3 December, S on 13 December, SW on 18 December, and W and S on 23 December (figure 31). On 12 January 2023 discolored green-yellow plumes extended to the NE, E, SE, and N. The plume moved SE on 17 January and NW on 22 January. Faint discolored water in February was visible moving NE on 1 February. A discolored plume extended NW on 8 and 28 March and NW on 13 March (figure 31). During April, clear weather showed green-blue discolored plumes moving S on 2 April, W on 7 April, and NE and S on 12 April. A strong green-yellow discolored plume extended E and NE on 22 April for several kilometers (figure 31).
Geologic Background. Home Reef, a submarine volcano midway between Metis Shoal and Late Island in the central Tonga islands, was first reported active in the mid-19th century, when an ephemeral island formed. An eruption in 1984 produced a 12-km-high eruption plume, large amounts of floating pumice, and an ephemeral 500 x 1,500 m island, with cliffs 30-50 m high that enclosed a water-filled crater. In 2006 an island-forming eruption produced widespread dacitic pumice rafts that drifted as far as Australia. Another island was built during a September-October 2022 eruption.
Information Contacts: Copernicus Browser, Copernicus Data Space Ecosystem, European Space Agency (URL: https://dataspace.copernicus.eu/browser/).
Ambae
Vanuatu
15.389°S, 167.835°E; summit elev. 1496 m
All times are local (unless otherwise noted)
New lava flow, ash plumes, and sulfur dioxide plumes during February-May 2023
Ambae, also known as Aoba, is a large basaltic shield volcano in Vanuatu. A broad pyroclastic cone containing three crater lakes (Manaro Ngoru, Voui, and Manaro Lakua) is located at the summit within the youngest of at least two nested calderas. Periodic phreatic and pyroclastic explosions have been reported since the 16th century. A large eruption more than 400 years ago resulted in a volcanic cone within the summit crater that is now filled by Lake Voui; the similarly sized Lake Manaro fills the western third of the caldera. The previous eruption ended in August 2022 that was characterized by gas-and-steam and ash emissions and explosions of wet tephra (BGVN 47:10). This report covers a new eruption during February through May 2023 that consisted of a new lava flow, ash plumes, and sulfur dioxide emissions, using information from the Vanuatu Meteorology and Geo-Hazards Department (VMGD) and satellite data.
During the reporting period, the Alert Level remained at a 2 (on a scale of 0-5), which has been in place since December 2021. Activity during October 2022 through March 2023 remained relatively low and mostly consisted of gas-and-steam emissions in Lake Voui. VMGD reported that at 1300 on 15 November a satellite image captured a strong amount of sulfur dioxide rising above the volcano (figure 99), and that seismicity slightly increased. The southern and northern part of the island reported a strong sulfur dioxide smell and heard explosions. On 20 February 2023 a gas-and-ash plume rose 1.3 km above the summit and drifted SSW, according to a webcam image (figure 100). Gas-and-steam and possibly ash emissions continued on 23 February and volcanic earthquakes were recorded by the seismic network.
During April, volcanic earthquakes and gas-and-steam and ash emissions were reported from the cone in Lake Voui. VMGD reported that activity increased during 5-7 April; high gas-and-steam and ash plumes were visible, accompanied by nighttime incandescence. According to a Wellington VAAC report, a low-level ash plume rose as high as 2.5 km above the summit and drifted W and SW on 5 April, based on satellite imagery. Reports in Saratamata stated that a dark ash plume drifted to the WSW, but no loud explosion was heard. Webcam images from 2100 showed incandescence above the crater and reflected in the clouds. According to an aerial survey, field observations, and satellite data, water was no longer present in the lake. A lava flow was reported effusing from the vent and traveling N into the dry Lake Voui, which lasted three days. The next morning at 0745 on 6 April a gas-and-steam and ash plume rose 5.4 km above the summit and drifted ESE, based on information from VMGD (figure 101). The Wellington VAAC also reported that light ashfall was observed on the island. Intermittent gas-and-steam and ash emissions were visible on 7 April, some of which rose to an estimated 3 km above the summit and drifted E. Webcam images during 0107-0730 on 7 April showed continuing ash emissions. A gas-and-steam and ash plume rose 695 m above the summit crater at 0730 on 19 April and drifted ESE, based on a webcam image (figure 102).
According to visual and infrared satellite data, water was visible in Lake Voui as late as 24 March 2023 (figure 103). The vent in the caldera showed a gas-and-steam plume drifted SE. On 3 April thermal activity was first detected, accompanied by a gas-and-ash plume that drifted W (figure 103). The lava flow moved N within the dry lake and was shown cooling by 8 April. By 23 April much of the water in the lake had returned. Occasional sulfur dioxide plumes were detected by the TROPOMI instrument on the Sentinel-5P satellite that exceeded 2 Dobson Units (DU) and drifted in different directions (figure 104).
Geologic Background. The island of Ambae, also known as Aoba, is a massive 2,500 km3 basaltic shield that is the most voluminous volcano of the New Hebrides archipelago. A pronounced NE-SW-trending rift zone with numerous scoria cones gives the 16 x 38 km island an elongated form. A broad pyroclastic cone containing three crater lakes (Manaro Ngoru, Voui, and Manaro Lakua) is located at the summit within the youngest of at least two nested calderas, the largest of which is 6 km in diameter. That large central edifice is also called Manaro Voui or Lombenben volcano. Post-caldera explosive eruptions formed the summit craters about 360 years ago. A tuff cone was constructed within Lake Voui (or Vui) about 60 years later. The latest known flank eruption, about 300 years ago, destroyed the population of the Nduindui area near the western coast.
Information Contacts: Geo-Hazards Division, Vanuatu Meteorology and Geo-Hazards Department (VMGD), Ministry of Climate Change Adaptation, Meteorology, Geo-Hazards, Energy, Environment and Disaster Management, Private Mail Bag 9054, Lini Highway, Port Vila, Vanuatu (URL: http://www.vmgd.gov.vu/, https://www.facebook.com/VanuatuGeohazardsObservatory/); Wellington Volcanic Ash Advisory Centre (VAAC), Meteorological Service of New Zealand Ltd (MetService), PO Box 722, Wellington, New Zealand (URL: http://www.metservice.com/vaac/, http://www.ssd.noaa.gov/VAAC/OTH/NZ/messages.html); MIROVA (Middle InfraRed Observation of Volcanic Activity), a collaborative project between the Universities of Turin and Florence (Italy) supported by the Centre for Volcanic Risk of the Italian Civil Protection Department (URL: http://www.mirovaweb.it/); Global Sulfur Dioxide Monitoring Page, Atmospheric Chemistry and Dynamics Laboratory, NASA Goddard Space Flight Center (NASA/GSFC), 8800 Greenbelt Road, Goddard, Maryland, USA (URL: https://so2.gsfc.nasa.gov/); Copernicus Browser, Copernicus Data Space Ecosystem, European Space Agency (URL: https://dataspace.copernicus.eu/browser/).
Search Bulletin Archive by Publication Date
Select a month and year from the drop-downs and click "Show Issue" to have that issue displayed in this tab.
The default month and year is the latest issue available.
Bulletin of the Global Volcanism Network - Volume 45, Number 08 (August 2020)
Managing Editor: Edward Venzke
Barren Island (India)
Intermittent weak thermal anomalies during February-July 2020
Cleveland (United States)
Explosion on 1 June 2020 produced an ash plume and destroyed the January 2019 lava dome
Pacaya (Guatemala)
Strombolian explosions, multiple lava flows, and the formation of a small cone during February-July 2020
Popocatepetl (Mexico)
Intermittent crater incandescence and frequent ash explosions during March-July 2020
Reventador (Ecuador)
Frequent explosions, ash emissions, and incandescent block avalanches during February-July 2020
Ruiz, Nevado del (Colombia)
Lava dome confirmed inside Arenas crater; intermittent thermal anomalies and ash emissions, January-June 2020
Sangeang Api (Indonesia)
Two ash plumes and small thermal anomalies during February-June 2020
Santa Maria (Guatemala)
Daily explosions with ash plumes, block avalanches, and pyroclastic flows during March-July 2020
Stromboli (Italy)
Strombolian explosions persist at both summit craters during January-April 2020
Tofua (Tonga)
Intermittent thermal anomalies in the Lofia crater from October 2015 through July 2020
Barren Island (India) — August 2020 Cite this Report
Barren Island
India
12.278°N, 93.858°E; summit elev. 354 m
All times are local (unless otherwise noted)
Intermittent weak thermal anomalies during February-July 2020
Barren Island is a remote island east of India in the Andaman Islands. Its most recent eruptive period began in September 2018 with volcanism characterized by thermal anomalies and small ash plumes (BGVN 45:02). This report updates information from February through July 2020 using various satellite data as a primary source of information.
MIROVA (Middle InfraRed Observation of Volcanic Activity) analysis of MODIS satellite data showed intermittent low-power thermal anomalies within 5 km of the summit from early September 2019 through July 2020 (figure 44). The frequency of the thermal anomalies decreased during mid-May 2020 with only six detected between June and July 2020. Sentinel-2 thermal satellite imagery showed weak thermal hotspots in the summit crater on 5 and 10 February, and 5 April (figure 45). In comparison, Suomi NPP/VIIRS sensor data registered elevated temperatures during 13-14 May and 18 July. Intermittent gas-and-steam emissions were also observed in Sentinel-2 satellite imagery on days with little to no cloud coverage. A small ash plume was observed in Sentinel-2 satellite imagery drifting NW on 24 June; there was no thermal anomaly detected that day (figure 46).
Geologic Background. Barren Island, a possession of India in the Andaman Sea about 135 km NE of Port Blair in the Andaman Islands, is the only historically active volcano along the N-S volcanic arc extending between Sumatra and Burma (Myanmar). It is the emergent summit of a volcano that rises from a depth of about 2250 m. The small, uninhabited 3-km-wide island contains a roughly 2-km-wide caldera with walls 250-350 m high. The caldera, which is open to the sea on the west, was created during a major explosive eruption in the late Pleistocene that produced pyroclastic-flow and -surge deposits. Historical eruptions have changed the morphology of the pyroclastic cone in the center of the caldera, and lava flows that fill much of the caldera floor have reached the sea along the western coast.
Information Contacts: MIROVA (Middle InfraRed Observation of Volcanic Activity), a collaborative project between the Universities of Turin and Florence (Italy) supported by the Centre for Volcanic Risk of the Italian Civil Protection Department (URL: http://www.mirovaweb.it/); Sentinel Hub Playground (URL: https://www.sentinel-hub.com/explore/sentinel-playground); NASA Worldview (URL: https://worldview.earthdata.nasa.gov/).
Cleveland (United States) — August 2020 Cite this Report
Cleveland
United States
52.825°N, 169.944°W; summit elev. 1730 m
All times are local (unless otherwise noted)
Explosion on 1 June 2020 produced an ash plume and destroyed the January 2019 lava dome
Cleveland is located in the western portion of Chuginadak Island, a remote island that is part of the east central Aleutians. Recent activity has been dominated by small ash explosions, intermittent lava dome growth, gas-and-steam emissions, and occasional thermal anomalies. The previous report described an ash explosion on 9 January 2019 that was followed by lava dome growth; by February the lava dome had begun to slowly subside (BGVN 45:03). This report covers activity during February-July 2020 using information primarily from the Alaska Volcano Observatory (AVO) and satellite data. According to AVO, local seismic, infrasound, and web camera data were unavailable due to an ongoing equipment failure.
Activity during February-May 2020 was relatively low and mainly consisted of weak gas-and-steam emissions and elevated surface temperatures near the summit, according to AVO. Sentinel-2 thermal satellite imagery highlights both gas-and-steam emissions and these higher surface temperatures near the summit crater (figure 34).
According to AVO, infrasound sensors recorded a small explosion on 1 June at 2232 local time, producing an ash plume that rose to an altitude of 6.7 km and drifted S, though clouds prevented the detection of the ash plume at the time in satellite imagery. The explosion destroyed the January 2019 lava dome and ejected a large amount of material from the summit crater. AVO raised the Volcano Alert Level (VAL) to Watch (second highest of four) and the Aviation Color Code (ACC) to Orange (second highest of four). No significant volcanic activity was noted after the 1 June explosion, although a gas-and-steam plume was visible on 3 June rising from the ash-covered summit (figure 35). As a result, on 17 June AVO lowered the VAL to Advisory and the ACC to Yellow.
A comparison of images from before the 1 June event and afterwards showed initial ash deposits on the S flank on 4 June and ash and debris flow deposits on all flanks on 21 June (figure 36). Analysis of satellite imagery from 22 June revealed that ejecta had traveled as far as 1.4 km from the summit crater (figure 37). By that time volcanic debris flows had carried material 2.9 km down the E flank and more than 2.7 km down the N flank. This event also caused a thermal anomaly detected in the MIROVA (Middle InfraRed Observation of Volcanic Activity) analysis of MODIS satellite data.
Geologic Background. The beautifully symmetrical Mount Cleveland stratovolcano is situated at the western end of the uninhabited Chuginadak Island. It lies SE across Carlisle Pass strait from Carlisle volcano and NE across Chuginadak Pass strait from Herbert volcano. Joined to the rest of Chuginadak Island by a low isthmus, Cleveland is the highest of the Islands of the Four Mountains group and is one of the most active of the Aleutian Islands. The native name, Chuginadak, refers to the Aleut goddess of fire, who was thought to reside on the volcano. Numerous large lava flows descend the steep-sided flanks. It is possible that some 18th-to-19th century eruptions attributed to Carlisle should be ascribed to Cleveland (Miller et al., 1998). In 1944 it produced the only known fatality from an Aleutian eruption. Recent eruptions have been characterized by short-lived explosive ash emissions, at times accompanied by lava fountaining and lava flows down the flanks.
Information Contacts: Alaska Volcano Observatory (AVO), a cooperative program of a) U.S. Geological Survey, 4200 University Drive, Anchorage, AK 99508-4667 USA (URL: https://avo.alaska.edu/), b) Geophysical Institute, University of Alaska, PO Box 757320, Fairbanks, AK 99775-7320, USA, and c) Alaska Division of Geological & Geophysical Surveys, 794 University Ave., Suite 200, Fairbanks, AK 99709, USA (URL: http://dggs.alaska.gov/); MIROVA (Middle InfraRed Observation of Volcanic Activity), a collaborative project between the Universities of Turin and Florence (Italy) supported by the Centre for Volcanic Risk of the Italian Civil Protection Department (URL: http://www.mirovaweb.it/); Sentinel Hub Playground (URL: https://www.sentinel-hub.com/explore/sentinel-playground).
Pacaya (Guatemala) — August 2020 Cite this Report
Pacaya
Guatemala
14.382°N, 90.601°W; summit elev. 2569 m
All times are local (unless otherwise noted)
Strombolian explosions, multiple lava flows, and the formation of a small cone during February-July 2020
Pacaya, located in Guatemala, is a highly active volcano that has previously produced continuous Strombolian explosions, multiple lava flows, and the formation of a small cone within the crater due to the constant deposition of ejected material (BGVN 45:02). This reporting period updates information from February through July 2020 consisting of similar activity that dominantly originates from the Mackenney crater. Information primarily comes from reports by the Instituto Nacional de Sismologia, Vulcanologia, Meteorologia e Hydrologia (INSIVUMEH) in Guatemala and various satellite data.
Strombolian explosions were recorded consistently throughout this reporting period. During February 2020, explosions ejected incandescent material 100 m above the Mackenney crater. At night and during the early morning the explosions were accompanied by incandescence from lava flows. Multiple lava flows were active during most of February, traveling primarily down the SW and NW flanks and reaching 500 m on 25 February. On 5 February the lava flow on the SW flank divided into three flows measuring 200, 150, and 100 m. White and occasionally blue gas-and-steam emissions rose up to 2.7 km altitude on 11 and 14 February and drifted in multiple directions. On 16 February Matthew Watson utilized UAVs (Unmanned Aerial Vehicle) to take detailed, close up photos of Pacaya and report that there were five active vents at the summit exhibiting lava flows from the summit, gas-and-steam emissions, and small Strombolian explosions (figure 122).
Activity remained consistent during March with Strombolian explosions ejecting material 100 m above the crater accompanied by occasional incandescence and white and occasionally blue gas-and-steam emissions drifting in multiple directions. Multiple lava flows were detected on the NW and W flanks reaching as far as 400 m on 9-10 March.
In April, frequent Strombolian explosions were accompanied by active lava flows moving dominantly down the SW flank and white gas-and-steam emissions. These repeated explosions ejected material up to 100 m above the crater and then deposited it within the Mackenney crater, forming a small cone. On 27 April seismicity increased at 2140 due to a lava flow moving SW as far as 400 m (figure 123); there were also six strong explosions and a fissure opened on the NW flank in front of the Los Llanos Village, allowing gas-and-steam to rise.
During May, Strombolian explosions continued to eject incandescent material up to 100 m above the Mackenney crater, accompanied by active lava flows on 1-2, 17-18, 22, 25-26, and 29-30 May down the SE, SW, NW, and NE flanks up to 700 m on 30 May. White gas-and-steam emissions continued to be observed up to 100 m above the crater drifting in multiple directions. Between the end of May and mid-June, the plateau between the Mackenney cone and the Cerro Chiquito had become inundated with lava flows (figure 124).
Lava flows extended 700 m on 8 June down multiple flanks. On 9 June, a lava flow traveled N and NW 500 m and originating from a vent on the N flank about 100 m below the Mackenney crater. Active lava flows continued to originate from this vent through at least 19 June while white gas-and-steam emissions were observed rising 300 m above the crater. At night and during the early mornings of 24 and 29 June Strombolian explosions were observed ejecting incandescent material up to 200 m above the crater (figure 125). These explosions continued to destroy and then rebuild the small cone within the Mackenney crater with fresh ejecta. Active lava flows on the SW flank were mostly 100-600 m long but had advanced to 2 km by 30 June.
On 10 July a 1.2 km lava flow divided in two which moved on the NE and N flanks. On 11 July, another 800 m lava flow divided in two, on the N and NE flanks (figure 126). On 14 and 19 July, INSIVUMEH registered constant seismic tremors and stated they were associated with the lava flows. No active lava flows were observed on 18-19 July, though some may have continued to advance on the SW, NW, N, and NE flanks. On 20 July, lava emerged from a vent at the NW base of the Mackenney cone near Cerro Chino, extending SE. Strombolian explosions ejected incandescent material up to 200 m above the crater on 22 July, accompanied by active incandescent lava flows on the SW, N, NW, NE, and W flanks. Three lava flows on the NW flank were observed on 22-24 July originating from the base of the Mackenney cone. Explosive activity during 22 July vibrated the windows and roofs of the houses in the villages of San Francisco de Sales, El Patrocinio, El Rodeo, and others located 4 km from the volcano. The lava flow activity had decreased by 25 July, but remnants of the lava flow on the NW flank persisted with weak incandescence observed at night, which was no longer observed by 26 July. Strombolian explosions continued to be detected through the rest of the month, accompanied by frequent white gas-and-steam emissions that extended up to 2 km from the volcano; no active lava flows were observed.
During February through July 2020, multiple lava flows and thermal anomalies within the Mackenney crater were detected in Sentinel-2 thermal satellite imagery (figure 127). These lava flows were observed moving down multiple flanks and were occasionally accompanied by white gas-and-steam emissions. Thermal anomalies were also recorded by the MIROVA (Middle InfraRed Observation of Volcanic Activity) system during 10 August through July 2020 within 5 km of the crater summit (figure 128). There were a few breaks in thermal activity from early to mid-March, late April, early May, and early June; however, each of these gaps were followed by a pulse of strong and frequent thermal anomalies. According to the MODVOLC algorithm, 77 thermal alerts were recorded within the summit crater during February through July 2020.
Geologic Background. Eruptions from Pacaya are frequently visible from Guatemala City, the nation's capital. This complex basaltic volcano was constructed just outside the southern topographic rim of the 14 x 16 km Pleistocene Amatitlán caldera. A cluster of dacitic lava domes occupies the southern caldera floor. The post-caldera Pacaya massif includes the older Pacaya Viejo and Cerro Grande stratovolcanoes and the currently active Mackenney stratovolcano. Collapse of Pacaya Viejo between 600 and 1,500 years ago produced a debris-avalanche deposit that extends 25 km onto the Pacific coastal plain and left an arcuate scarp inside which the modern Pacaya volcano (Mackenney cone) grew. The NW-flank Cerro Chino crater was last active in the 19th century. During the past several decades, activity has consisted of frequent Strombolian eruptions with intermittent lava flow extrusion that has partially filled in the caldera moat and covered the flanks of Mackenney cone, punctuated by occasional larger explosive eruptions that partially destroy the summit.
Information Contacts: Instituto Nacional de Sismologia, Vulcanologia, Meteorologia e Hydrologia (INSIVUMEH), Unit of Volcanology, Geologic Department of Investigation and Services, 7a Av. 14-57, Zona 13, Guatemala City, Guatemala (URL: http://www.insivumeh.gob.gt/); MIROVA (Middle InfraRed Observation of Volcanic Activity), a collaborative project between the Universities of Turin and Florence (Italy) supported by the Centre for Volcanic Risk of the Italian Civil Protection Department (URL: http://www.mirovaweb.it/); Hawai'i Institute of Geophysics and Planetology (HIGP) - MODVOLC Thermal Alerts System, School of Ocean and Earth Science and Technology (SOEST), Univ. of Hawai'i, 2525 Correa Road, Honolulu, HI 96822, USA (URL: http://modis.higp.hawaii.edu/); Sentinel Hub Playground (URL: https://www.sentinel-hub.com/explore/sentinel-playground); Matthew Watson, School of Earth Sciences at the University of Bristol (Twitter: @Matthew__Watson, https://twitter.com/Matthew__Watson); William Chigna, CONRED (URL: https://twitter.com/william_chigna).
Popocatepetl (Mexico) — August 2020 Cite this Report
Popocatepetl
Mexico
19.023°N, 98.622°W; summit elev. 5393 m
All times are local (unless otherwise noted)
Intermittent crater incandescence and frequent ash explosions during March-July 2020
Volcán Popocatépetl is a highly active stratovolcano in Mexico that has had frequent historical eruptions dating back to the 14th century. The current eruption has been ongoing since January 2005 and has more recently consisted of lava dome growth and destruction, frequent explosions, ash plumes, and incandescent ejecta. Activity through February 2020 was characterized by hundreds of daily low-intensity emissions that included gas-and-steam and small amounts of ash, and multiple daily minor and moderate explosions that sent ash plumes more than 1 km above the crater (BGVN 45:04). This report covers similar activity from March through July 2020 using information primarily from México's Centro Nacional de Prevención de Desastres (CENAPRED), the Washington Volcanic Ash Advisory Center (VAAC), and various satellite data.
Volcanism at Popocatépetl remained highly active, characterized by daily low-intensity emissions which included gas-and-steam emissions that contained small amounts of ash and frequent minor to moderate explosions that resulted in ash plumes rising as high as 2 km above the crater (figure 152). The Washington VAAC issued a total of 544 volcanic ash advisories spanning the reporting period with plumes reaching typically between 5.5 and 7.3 km altitude. Three VAAC notices reported three notable plumes; two rose to 7.6 km altitude during 6 and 10 March and one rose to 7.9 km altitude during 27 July. In addition, hundreds of minutes of daily tremor activity often corresponded with ash emissions. Thermal anomalies recorded by the MIROVA (Middle InfraRed Observation of Volcanic Activity) system during 19 November 2019 through July 2020 occurred frequently into early May (figure 153). During May, the frequency of these thermal anomalies decreased, but the power remained consistent to previous months; a majority of the activity was detected within 5 km of the crater summit. The MODVOLC thermal alert data recorded a total of nine thermal signatures primarily within the summit crater during 23 and 30 March, 1, 8, 23, and 25 April, 17 June, and 26 July. Significantly strong activity during late July is noted in the daily reports, the Washington VAAC notices, the MIROVA graph, and the NASA SO2 map.
Sulfur dioxide emissions were measured using the Sentinel-5P/TROPOMI satellite instrument for multiple days each month from March through July 2020 (figure 154). The intensity and drift direction of these SO2 plumes varied; stronger plumes were detected in late July (figure 155). SO2 plumes were detected on most days during the reporting period. Sentinel-2 satellite imagery showed a persistent thermal anomaly occasionally accompanied by an ash plume within the summit crater during March, April, June, and July (figure 156).
During 7-8 March three minor explosions recorded at 1931, 2120, and 0723 were accompanied by gas-and-steam emissions containing light amounts of ash that drifted NW (figure 157). As a result, slight ashfall was detected in Tetela del Volcán (20 km SW). The next day, on 9 March, a minor explosion at 0746 resulted in slight ashfall in Amecameca (20 km NW). A moderate explosion at 0824 on 10 March was accompanied by gas-and-steam emissions containing light amounts of ash drifting NE, E, and SE. Two more explosions that day at 1307 and 1315 produced an ash plume that rose to a maximum of 2 km above the crater drifting E and SE; slight ashfall was observed in Amecameca and Tetela del Volcán. On 17 March a minor explosion at 2210 ejected incandescent material onto the flanks and produced an ash plume up to 1.2 km above the crater, drifting SE (figure 157). Gas-and-steam emissions containing some amount of ash accompanying the explosion drifted NE, SE, and E, rising 1-1.5 km above the crater. Slight ashfall was reported in Tetela del Volcán, San Andrés and Hueyapan (16 km SW), and Ocuituco (24 km SW). At night, crater incandescence was observed on 29 March in addition to an explosion at 2144 which resulted in slight ashfall in Tlalmanalco (26 km NW) and Amecameca.
Similar activity continued into April, though there were no reports of ashfall in nearby towns during this month. Volcanism primarily consisted of gas-and-steam emissions, which contained light amounts of ash. At night, occasional crater incandescence was observed throughout the month. On 8 April a minor explosion at 1715 produced an ash plume that rose to a high of 2 km above the crater. On 14 April an explosion at 2316 ejected incandescent material onto the surrounding flanks and resulted in an ash plume rising 1.5 km above the crater drifting NE (figure 158). On 21 April another minor explosion at 2143 ejected incandescent material that was accompanied by gas-and-steam emissions and a dense gray ash plume (figure 158).
Continued activity during May was characterized by minor explosions, gas-and-steam emissions, incandescent ejecta, and ash plumes; intermittent crater incandescence was observed at night. Like in April, no ashfall was reported during the month. On 2 May at 1102 and 5 May at 0054 minor explosions produced ash plumes that rose 1 km above the crater and drifted SW. On 18 May two minor explosions produced a dense gray ash plume and gas-and-steam emissions drifting E and SE (figure 159). On 21 May an explosion at 0302 ejected incandescent material on the surrounding flanks, accompanied by crater incandescence, gas-and-steam emissions, and ash that drifted S and SE (figure 159).
During 7-8 June minor explosions at 0904 and 0253, respectively, produced ash plumes rising 1-2 km above the crater and drifting SSE and SSW. Occasional crater incandescence was observed at night, sometimes accompanied by incandescent material on the flanks. Through 13 June gas-and-steam emissions containing minor amounts of ash dominated the activity in the crater, drifting in multiple directions. An overflight conducted on 13 June by National Guard, Instituto de Geofísica de la Universidad Nacional Autónoma de México (UNAM), and CENAPRED scientists noted that the inner crater was 350-380 m in diameter and 100-150 m deep; the crater floor was covered in tephra and the remains of a lava dome were observed, which may have been seen in May. On 19 June two moderate explosions detected at 0456 and 0718, as well as a third minor explosion at 0733, ejected incandescent material onto the flanks and produced gas-and-steam emissions with light amounts of ash that drifted SW (figure 160). Some ashfall was observed in Zacualpan de Amilpas (30 km SW), Temoac, and Amayuca. An ash emission on 27 June drifted NW (figure 160), resulting in ashfall in several towns including Amecameca, Tenango del Aire (28 km NW), Temamatla, Cocotitlán, Juchitepec, Tepetlixpa (20 km W), Chalco (38 km NW) and Ozumba (18 km W), and Xochimilco (56 km NW).
Intermittent nightly crater incandescence and predominantly gas-and-steam emissions consisting of light amounts of ash persisted in July. During a majority of the month the explosion rate was lower compared to previous months, but by the end the rate and strength of the explosions had significantly increased. Starting on 23 July an explosion produced an ash plume accompanied by gas-and-steam emissions rising 2 km above the crater drifting SW. Explosions continued through the end of July, resulting in ash plumes up to 1.5 km above the crater, gas-and-steam emissions drifting dominantly NW and SW, dense SO2 plumes, incandescent ejecta visible on the flanks, minor ashfall, and crater incandescence (figure 161). According to the National Center for Civil Protectino Communication and Operation (CENACOM), minor ashfall was reported on 23, 25, and 27-28 July in Tetela del Volcán, Ocuituco, Atlatlahucán (30 km WSW), Yecapixtla (20 km W), Yautepec (50 km WSW), Jiutepec (60 km WSW), Ayapango (22 km NW), Temamatla, Ecatepec, Valle de Chalco, Texcoco, Tezoyuca, Tepetlaoxtoc, Naucalpan, Atizapán, Huixquilucan, Nicolás Romero, and Tlalnepantla (40 km W), as well as in Tlalmanalco, Juchitepec, Tepetlixpa, Atlautla (17 km W), Ozumba, Ecatzingo (15 km SW), Xochimilco, Iztacalco (64 km NW), Iztapalapa (57 km NW), and Gustavo A Madero.
Geologic Background. Volcán Popocatépetl, whose name is the Aztec word for smoking mountain, rises 70 km SE of Mexico City to form North America's 2nd-highest volcano. The glacier-clad stratovolcano contains a steep-walled, 400 x 600 m wide crater. The generally symmetrical volcano is modified by the sharp-peaked Ventorrillo on the NW, a remnant of an earlier volcano. At least three previous major cones were destroyed by gravitational failure during the Pleistocene, producing massive debris-avalanche deposits covering broad areas to the south. The modern volcano was constructed south of the late-Pleistocene to Holocene El Fraile cone. Three major Plinian eruptions, the most recent of which took place about 800 CE, have occurred since the mid-Holocene, accompanied by pyroclastic flows and voluminous lahars that swept basins below the volcano. Frequent historical eruptions, first recorded in Aztec codices, have occurred since Pre-Columbian time.
Information Contacts: Centro Nacional de Prevención de Desastres (CENAPRED), Av. Delfín Madrigal No.665. Coyoacan, México D.F. 04360, México (URL: http://www.cenapred.unam.mx/), Daily Report Archive http://www.cenapred.unam.mx:8080/reportesVolcanGobMX/BuscarReportesVolcan); Washington Volcanic Ash Advisory Center (VAAC), Satellite Analysis Branch (SAB), NOAA/NESDIS OSPO, NOAA Science Center Room 401, 5200 Auth Rd, Camp Springs, MD 20746, USA (URL: www.ospo.noaa.gov/Products/atmosphere/vaac, archive at: http://www.ssd.noaa.gov/VAAC/archive.html); Global Sulfur Dioxide Monitoring Page, Atmospheric Chemistry and Dynamics Laboratory, NASA Goddard Space Flight Center (NASA/GSFC), 8800 Greenbelt Road, Goddard, Maryland, USA (URL: https://so2.gsfc.nasa.gov/); MIROVA (Middle InfraRed Observation of Volcanic Activity), a collaborative project between the Universities of Turin and Florence (Italy) supported by the Centre for Volcanic Risk of the Italian Civil Protection Department (URL: http://www.mirovaweb.it/); Sentinel Hub Playground (URL: https://www.sentinel-hub.com/explore/sentinel-playground).
Reventador (Ecuador) — August 2020 Cite this Report
Reventador
Ecuador
0.077°S, 77.656°W; summit elev. 3562 m
All times are local (unless otherwise noted)
Frequent explosions, ash emissions, and incandescent block avalanches during February-July 2020
Reventador is a stratovolcano located in the Cordillera Real, Ecuador with historical eruptions dating back to the 16th century. The most recent eruptive period began in 2008 and has continued through July 2020 with activity characterized by frequent explosions, ash emissions, and incandescent block avalanches (BGVN 45:02). This report covers volcanism from February through July 2020 using information primarily from the Instituto Geofísico (IG-EPN), the Washington Volcano Ash Advisory Center (VAAC), and various infrared satellite data.
During February to July 2020, IG-EPN reported almost daily explosions, gas-and-steam and ash emissions, and frequent crater incandescence. The highest average number of explosions per day was 26 in March, followed by an average of 25 explosions per day in June (table 12). Ash plumes rose to a maximum height of 2.5 km above the crater during this reporting period with the highest plume height recorded on 5 May 2020. Frequently at night, crater incandescence was observed, occasionally accompanied by incandescent block avalanches traveling as far as 900 m downslope from the summit of the volcano.
Table 12. Monthly summary of eruptive events recorded at Reventador from February through July 2020. Data courtesy of IG-EPN (February to July 2020 daily reports).
| Month |
Average Number of Explosions per day |
Max plume height above the crater |
| Feb 2020 |
17 |
1.3 km |
| Mar 2020 |
26 |
2.2 km |
| Apr 2020 |
21 |
1.4 km |
| May 2020 |
22 |
2.5 km |
| Jun 2020 |
25 |
1.3 km |
| Jul 2020 |
15 |
1.4 km |
During February 2020 there were between 2 and 32 explosions recorded each day, accompanied by gas-and-steam and ash emissions that rose about 700-1,300 m above the crater. At night and early morning crater incandescence was observed frequently throughout the reporting period from 1 February and onward. Incandescent block avalanches were also detected intermittently beginning on 5 February when incandescent blocks rolled 300-800 m downslope from the summit on all sides of the volcano. On 6 and 21 February, gas-and-steam and ash emissions rose to a high of 1.3 km above the crater, according to Washington VAAC notices (figure 125).
Between 7 and 47 daily explosions were detected during March. On 17 March, rainfall generated two small lahars, accompanied by ash emissions that rose 1 km above the crater drifting NW. That same day, ashfall was reported in San Rafael (8 km ESE) SE of the volcano (figure 126). On 19 March ashfall was also reported in El Chaco (30 km SW), according to SNGR-Umeva-Orellana. At night, crater incandescence was observed and was occasionally accompanied by block avalanches traveling as far as 900 m downslope of the summit. Gas-and-steam and ash emissions continued, rising to 2.2 km above the crater on 28 March, according to the Washington VAAC notices.
Activity persisted in April, characterized by almost daily gas-and-steam and ash emissions that rose to 1.4 km above the crater (figure 127) and intermittent crater incandescence observed at night and in the morning. The number of daily explosions detected per day ranged between 2 and 40, many of which were accompanied by block avalanches that traveled as far as 800 m downslope from the summit.
During May, volcanism remained consistent, characterized by intermittent crater incandescence, gas-and-steam and ash emissions that rose 2.5 km above the crater, and daily explosions that ranged between 6 and 56 per day. On 14 May a Washington VAAC advisory stated there were three ash emissions that rose to a maximum of about 2.5 km above the crater and drifted W. At night, crater incandescence was observed accompanied by incandescent blocks that traveled 300 m below the summit on the SE flank; the furthest blocks traveled during this month was 800 m downslope.
The average number of daily explosions increased from 22 in May to 25 in June, and ranged between 0 and 51 per day, accompanied by gas-and-steam and ash emissions that rose 1.3 km above the crater (figure 128). At night, crater incandescence continued to be observed with occasional blocks rolling down the flanks up to 800 m downslope from the summit.
By July, the average number of daily explosions decreased to 15 and gas-and-steam and ash emissions continued (figure 129). The maximum ash plume height during this month reached 1.4 km above the crater, according to a Washington VAAC advisory. Explosions still continued, ranging between 2 and 38 per day; explosions were not recorded in every daily report during this month. At night, crater incandescence was commonly observed and was sometimes accompanied by incandescent block avalanches that traveled as far as 800 m downslope from the summit. On 1 July a webcam image showed an explosion that produced an ash plume that rose 1 km above the crater drifting W and small pyroclastic flows near the cone. Another explosion on 5 July resulted in an ash plume that rose up to 1 km above the crater drifting W and NW accompanied by crater incandescence, a block avalanche that moved up to 800 m downslope, and a pyroclastic flow. On 22 and 24 July explosions ejected blocks that traveled downslope from the summit and were accompanied by pyroclastic flows that traveled down the N flank for 600 m.
MIROVA (Middle InfraRed Observation of Volcanic Activity) analysis of MODIS satellite data showed intermittent thermal anomalies within 5 km of the summit during 5 October 2019 and July 2020 (figure 130). There was a small decline in power from late April to late May, followed by a brief break in thermal anomalies from late May to mid-June 2020. In comparison, the MODVOLC algorithm identified nine thermal alerts between February and July 2020 near the crater summit on 5 February (2), 7 February (2), 12 February (1), 22 March (1), 27 April (1), 10 June (1), and 7 July (1). Some thermal anomalies can be seen in Sentinel-2 thermal satellite imagery on days with little cloud cover (figure 131).
Geologic Background. Volcán El Reventador is the most frequently active of a chain of Ecuadorian volcanoes in the Cordillera Real, well east of the principal volcanic axis. The forested, dominantly andesitic stratovolcano has 4-km-wide avalanche scarp open to the E formed by edifice collapse. A young, unvegetated, cone rises from the amphitheater floor to a height comparable to the rim. It has been the source of numerous lava flows as well as explosive eruptions visible from Quito, about 90 km ESE. Frequent lahars in this region of heavy rainfall have left extensive deposits on the scarp slope. The largest recorded eruption took place in 2002, producing a 17-km-high eruption column, pyroclastic flows that traveled up to 8 km, and lava flows from summit and flank vents.
Information Contacts: Instituto Geofísico, Escuela Politécnica Nacional (IG-EPN), Casilla 17-01-2759, Quito, Ecuador (URL: http://www.igepn.edu.ec/); Washington Volcanic Ash Advisory Center (VAAC), Satellite Analysis Branch (SAB), NOAA/NESDIS OSPO, NOAA Science Center Room 401, 5200 Auth Rd, Camp Springs, MD 20746, USA (URL: www.ospo.noaa.gov/Products/atmosphere/vaac, archive at: http://www.ssd.noaa.gov/VAAC/archive.html); Hawai'i Institute of Geophysics and Planetology (HIGP) - MODVOLC Thermal Alerts System, School of Ocean and Earth Science and Technology (SOEST), Univ. of Hawai'i, 2525 Correa Road, Honolulu, HI 96822, USA (URL: http://modis.higp.hawaii.edu/); MIROVA (Middle InfraRed Observation of Volcanic Activity), a collaborative project between the Universities of Turin and Florence (Italy) supported by the Centre for Volcanic Risk of the Italian Civil Protection Department (URL: http://www.mirovaweb.it/); Sentinel Hub Playground (URL: https://www.sentinel-hub.com/explore/sentinel-playground).
Nevado del Ruiz (Colombia) — August 2020 Cite this Report
Nevado del Ruiz
Colombia
4.892°N, 75.324°W; summit elev. 5279 m
All times are local (unless otherwise noted)
Lava dome confirmed inside Arenas crater; intermittent thermal anomalies and ash emissions, January-June 2020
Colombia’s broad, glacier-capped Nevado del Ruiz has an eruption history documented back 8,600 years, and historical observations since 1570. It’s profound notoriety stems from an eruption on 13 November 1985 that produced an ash plume and pyroclastic flows onto the glacier, triggering large lahars that washed down 11 valleys, inundating most severely the towns of Armero (46 km W) and Chinchiná (34 km E) where approximately 25,000 residents were killed. It remains the second deadliest volcanic eruption of the 20th century after Mt. Pelee killed 28,000 in 1902. Ruiz remained quiet for 20 years after the September 1985-July 1991 eruption until a new explosive event occurred in February 2012; a series of explosive events lasted into 2013. Renewed activity beginning in November 2014 included ash and gas-and-steam plumes, ashfall, and the appearance of a lava dome inside the Arenas crater in August 2015 which has regularly displayed thermal anomalies through 2019. This report covers ongoing activity from January-June 2020 using information primarily from reports by the Servicio Geologico Colombiano (SGC) and the Observatorio Vulcanológico y Sismológico de Manizales, the Washington Volcanic Ash Advisory Center (VAAC) notices, and various sources of satellite data.
Gas and ash emissions continued at Nevado del Ruiz throughout January-June 2020; they generally rose to 5.8-6.1 km altitude with the highest reported plume at 7 km altitude during early March. SGC confirmed the presence of the growing lava dome inside Arenas crater during an overflight in January; infrared satellite imagery indicated a continued heat source from the dome through April. SGC interpreted repeated episodes of ‘drumbeat seismicity’ as an indication of continued dome growth throughout the period. Small- to moderate-density sulfur dioxide emissions were measured daily with satellite instruments. The MIROVA graph of thermal activity indicated a heat source consistent with a growing dome from January through April (figure 102).
Activity during January-March 2020. During January 2020 some of the frequent tremor seismic events were associated with gas and ash emissions, and several episodes of "drumbeat” seismicity were recorded; they have been related by SGC to the growth of the lava dome on the floor of the Arenas crater. An overflight on 10 January, with the support of the Colombian Air Force, confirmed the presence of the dome which was first proposed in August 2015 (BGVN 42:06) (figure 103). The Arenas crater had dimensions of 900 x 980 m elongate to the SW-NE and was about 300 m deep (figure 104). The dome inside the crater was estimated to be 173 m in diameter and 60 m high with an approximate volume of 1,500,000 m3 (figures 105 and 106). In addition to the dome, the scientists also noted ash deposits on the summit ice cap (figure 107). The Washington VAAC reported an ash plume on 19 January that rose to 5.5 km altitude and drifted SW, dissipating quickly. On 30 January they reported an ash plume visible in satellite imagery extending 15 km NW from the summit at 5.8 km altitude. A single MODVOLC alert was issued on 15 January and data from the VIIRS satellite instrument reported thermal anomalies inside the summit crater on 14 days of the month. Sulfur dioxide plumes with DU values greater than 2 were recorded by the TROPOMI satellite instrument daily during the month.
The Washington VAAC reported multiple ash plumes during February 2020. On 4 February an ash plume was observed in satellite imagery drifting 35 km W from the summit at 5.8 km altitude. The following day a plume rose to 6.1 km altitude and extended 37 km W from the summit before dissipating by the end of the day (figure 108). On 6 February an ash cloud was observed in satellite imagery centered 45 km W of the summit at 5.8 km altitude. Although it had dissipated by midday, a hotspot remained in shortwave imagery until the evening. Late in the day another plume rose to 6.7 km altitude and drifted W. Diffuse ash was seen in satellite imagery on 13 February fanning towards the W at 5.8 km altitude. On 18 February at 1720 UTC the Bogota Meteorological Weather Office (MWO) reported an ash emission drifting NW at 5.8 km altitude; a second plume was reported a few hours later at the same altitude. Intermittent emissions continued the next day at 5.8-6.1 km altitude that reached as far as 50 km NW before dissipating. A plume on 21 February rose to 6.7 km altitude and drifted W (figure 109). Occasional emissions on 25 February at the same altitude reached 25 km SW of the summit before dissipating. A discrete ash emission around 1550 UTC on 26 February rose to 6.1 km altitude and drifted W. Two similar plumes were reported the next day. On 28 and 29 February plumes rose to 5.8 km altitude and drifted W.
SGC reported several episodes of drumbeat type seismicity on 2, 8, 9, and 27 February which they attributed to effusion related to the growing lava dome in the summit crater. Sentinel-2 satellite imagery showed ring-shaped thermal anomalies characteristic of dome growth within Arenas crater several times during January and February (figure 110). The VIIRS satellite instrument recorded thermal anomalies on twelve days during February.
On 4, 14, and 19 March 2020 thermal anomalies were visible in Sentinel-2 satellite data from within the Arenas crater. Thermal anomalies were recorded by the VIIRS satellite instrument on eight days during the month. Several episodes of drumbeat seismicity were recorded during the first half of the month and on 30-31 March. Distinct SO2 plumes with DU values greater than 2 were recorded by the TROPOMI satellite instrument daily throughout February and March (figure 111). The Washington VAAC reported an ash emission on 1 March that rose to 5.8 km altitude and drifted NW; it was centered 15 km from the summit when detected in satellite imagery. The next day a plume was seen in satellite imagery moving SW at 7.0 km altitude, extending nearly 40 km from the summit. Additional ash emissions were reported on 4, 14, 15, 21, 28, 29, and 31 March; the plumes rose to 5.8-6.7 km altitude and drifted generally W, some reaching 45 km from the summit before dissipating.
Activity during April-June 2020. The Washington VAAC reported an ash emission that rose to 6.7 km altitude and drifted W on 1 April 2020. On 2 April, emission plumes were visible from the community of Tena in the Cundinamarca municipality which is located 100 km ESE (figure 112). The unusually clear skies were attributed to the reduction in air pollution in nearby Bogota resulting from the COVID-19 Pandemic quarantine. On 4 April the Bogota MWO reported an emission drifting SW at 5.8 km altitude. An ash plume on 8 April rose to 6.7 km altitude and drifted W. On 25 April the last reported ash plume from the Washington VAAC for the period rose to 6.1 km altitude and was observed in satellite imagery moving W at 30 km from the summit; after that, only steam and gas emissions were observed.
Distinct SO2 plumes with DU values greater than 2 were recorded by the TROPOMI satellite instrument daily throughout the month. On 13 April, a Sentinel-2 thermal image showed a hot spot inside the Arenas crater largely obscured by steam and clouds. Cloudy images through May and June prevented observation of additional thermal anomalies in satellite imagery, but the VIIRS thermal data indicated anomalies on 3, 4, and 26 April. SGC reported low-energy episodes of drumbeat seismicity on 4, 9, 10, 12, 15, 16, 20, and 23 April which they interpreted as related to growth of the lava dome inside the Arenas crater. The seismic events were located 1.5-2.0 km below the floor of the crater.
Small emissions of ash and gas were reported by SGC during May 2020 and the first half of June, with the primary drift direction being NW. Gas and steam plumes rose 560-1,400 m above the summit during May and June (figure 113). Drumbeat seismicity was reported a few times each month. Sulfur dioxide emissions continued daily; increased SO2 activity was recorded during 10-13 June (figure 114).
Geologic Background. Nevado del Ruiz is a broad, glacier-covered volcano in central Colombia that covers more than 200 km2. Three major edifices, composed of andesitic and dacitic lavas and andesitic pyroclastics, have been constructed since the beginning of the Pleistocene. The modern cone consists of a broad cluster of lava domes built within the caldera of an older edifice. The 1-km-wide, 240-m-deep Arenas crater occupies the summit. The prominent La Olleta pyroclastic cone located on the SW flank may also have been active in historical time. Steep headwalls of massive landslides cut the flanks. Melting of its summit icecap during historical eruptions, which date back to the 16th century, has resulted in devastating lahars, including one in 1985 that was South America's deadliest eruption.
Information Contacts: El Servicio Geológico Colombiano (SGC), Diagonal 53 No. 34-53 - Bogotá D.C., Colombia (URL: https://www.sgc.gov.co/volcanes, https://twitter.com/sgcol); Global Sulfur Dioxide Monitoring Page, Atmospheric Chemistry and Dynamics Laboratory, NASA Goddard Space Flight Center (NASA/GSFC), 8800 Greenbelt Road, Goddard, Maryland, USA (URL: https://so2.gsfc.nasa.gov/); Washington Volcanic Ash Advisory Center (VAAC), Satellite Analysis Branch (SAB), NOAA/NESDIS OSPO, NOAA Science Center Room 401, 5200 Auth Rd, Camp Springs, MD 20746, USA (URL: www.ospo.noaa.gov/Products/atmosphere/vaac, archive at: http://www.ssd.noaa.gov/VAAC/archive.html); MIROVA (Middle InfraRed Observation of Volcanic Activity), a collaborative project between the Universities of Turin and Florence (Italy) supported by the Centre for Volcanic Risk of the Italian Civil Protection Department (URL: http://www.mirovaweb.it/); Hawai'i Institute of Geophysics and Planetology (HIGP) - MODVOLC Thermal Alerts System, School of Ocean and Earth Science and Technology (SOEST), Univ. of Hawai'i, 2525 Correa Road, Honolulu, HI 96822, USA (URL: http://modis.higp.hawaii.edu/); NASA Worldview (URL: https://worldview.earthdata.nasa.gov/); Sentinel Hub Playground (URL: https://www.sentinel-hub.com/explore/sentinel-playground); Camilo Cupitre (URL: https://twitter.com/Ccupitre/status/1225207439701704709); Manuel MR (URL: https://twitter.com/ElPlanetaManuel/status/1230837262088384512); Semana Sostenible (URL: https://sostenibilidad.semana.com/actualidad/articulo/fumarola-del-nevado-del-ruiz-fue-captada-desde-tena-cundinamarca/49597); Carlos-Enrique Ruiz (URL: https://twitter.com/Aleph43/status/1271800027841794049).
Sangeang Api (Indonesia) — August 2020 Cite this Report
Sangeang Api
Indonesia
8.2°S, 119.07°E; summit elev. 1912 m
All times are local (unless otherwise noted)
Two ash plumes and small thermal anomalies during February-June 2020
Sangeang Api is a 13-km-wide island located off the NE coast of Sumbawa Island, part of Indonesia's Lesser Sunda Islands. Documentation of historical eruptions date back to 1512. The most recent eruptive episode began in July 2017 and included frequent Strombolian explosions, ash plumes, and block avalanches. The previous report (BGVN 45:02) described activity consisting of a new lava flow originating from the active Doro Api summit crater, short-lived explosions, and ash-and-gas emissions. This report updates information during February through July 2020 using information from the Darwin Volcanic Ash Advisory Center (VAAC) reports, Pusat Vulkanologi dan Mitigasi Bencana Geologi (PVMBG, or CVGHM) reports, and various satellite data.
Volcanism during this reporting period was relatively low compared to the previous reports (BGVN 44:05 and BGVN 45:02). A Darwin VAAC notice reported an ash plume rose 2.1 km altitude and drifted E on 10 May 2020. Another ash plume rose to a maximum of 3 km altitude drifting NE on 10 June, as seen in HIMAWARI-8 satellite imagery.
The MIROVA (Middle InfraRed Observation of Volcanic Activity) analysis of MODIS satellite data detected a total of 12 low power thermal anomalies within 5 km from the summit during February through May 2020 (figure 42). No thermal anomalies were recorded during June and July according to the MIROVA graph. Though the MODVOLC algorithm did not detect any thermal signatures between February to July, many small thermal hotspots within the summit crater could be seen in Sentinel-2 thermal satellite imagery (figure 43).
Geologic Background. Sangeang Api volcano, one of the most active in the Lesser Sunda Islands, forms a small 13-km-wide island off the NE coast of Sumbawa Island. Two large trachybasaltic-to-tranchyandesitic volcanic cones, Doro Api and Doro Mantoi, were constructed in the center and on the eastern rim, respectively, of an older, largely obscured caldera. Flank vents occur on the south side of Doro Mantoi and near the northern coast. Intermittent eruptions have been recorded since 1512, most of them during in the 20th century.
Information Contacts: Pusat Vulkanologi dan Mitigasi Bencana Geologi (PVMBG, also known as Indonesian Center for Volcanology and Geological Hazard Mitigation, CVGHM), Jalan Diponegoro 57, Bandung 40122, Indonesia (URL: http://www.vsi.esdm.go.id/); Darwin Volcanic Ash Advisory Centre (VAAC), Bureau of Meteorology, Northern Territory Regional Office, PO Box 40050, Casuarina, NT 0811, Australia (URL: http://www.bom.gov.au/info/vaac/); MIROVA (Middle InfraRed Observation of Volcanic Activity), a collaborative project between the Universities of Turin and Florence (Italy) supported by the Centre for Volcanic Risk of the Italian Civil Protection Department (URL: http://www.mirovaweb.it/); Hawai'i Institute of Geophysics and Planetology (HIGP) - MODVOLC Thermal Alerts System, School of Ocean and Earth Science and Technology (SOEST), Univ. of Hawai'i, 2525 Correa Road, Honolulu, HI 96822, USA (URL: http://modis.higp.hawaii.edu/); Sentinel Hub Playground (URL: https://www.sentinel-hub.com/explore/sentinel-playground).
Santa Maria (Guatemala) — August 2020 Cite this Report
Santa Maria
Guatemala
14.757°N, 91.552°W; summit elev. 3745 m
All times are local (unless otherwise noted)
Daily explosions with ash plumes, block avalanches, and pyroclastic flows during March-July 2020
Santa María is a stratovolcano located in Guatemala, which includes the Santiaguito lava-dome complex on the W flank. The youngest and more recently active of the four vents is the Caliente cone, characterized by explosions, ash plumes, pyroclastic flows, and lahars (BGVN 45:04). A lava dome appeared in the summit crater of Caliente in October 2016 and has continued to grow. The Caliente vent is at about 2.5 km elevation, and the summit of the volcano is around 3.7 km elevation. Daily explosions, ash plumes, ashfall, and block avalanches continued during this reporting period of March-July 2020 with information primarily from INSIVUMEH (Instituto Nacional de Sismologia, Vulcanologia, Meterologia e Hidrologia), the Washington VAAC (Volcanic Ash Advisory Center), and various satellite data.
Constant white gas-and-steam emissions from the Caliente dome reached 2.8-3.4 km altitude throughout March-July 2020. Multiple explosions were registered each day, many of which were accompanied by ash plumes rising to 3-3.7 km altitude and drifting in multiple directions up to 15 km from the Caliente dome. Block avalanches, ash plumes, and a few weak to moderate pyroclastic flows were prominent during this reporting period, according to INSIVUMEH. Intermittent incandescence was also observed in the Caliente dome. Occasional ashfall was observed in nearby communities.
During March, the STG3 seismic station registered weak to moderate explosions that produced ash plumes rising to 3.5 km altitude drifting in multiple directions as far as 1.5 km from the Caliente dome. The explosions also generated weak to moderate block avalanches along the S, E, SE, and SW flanks on the Caliente dome. Occasional incandescence in the Caliente crater was observed at night. Some ashfall was reported in the villages of Loma Linda, San Marcos, and Palajunoj on 5, 8, 13-14, 16, 20, and 28-29 March, and the mountainous areas of Monte Carlo on 30 March.
Explosions continued in April (figure 108), producing ash plumes up to 3.5 km altitude drifting in multiple directions as far as 1.2 km. Constant block avalanches were reported on the S, E, SE, and SW flanks of the Caliente dome, occasionally accompanied by incandescence. Intermittent ashfall was reported in the villages of Loma Linda and San Marcos during the month, including fine ashfall on the volcanic perimeter. On 21 April weak explosions produced an ash plume rising 3.4 km altitude drifting W and SW, resulting in ashfall in Loma Linda and San Marcos and block avalanches on the S, E, and SE flanks (figure 109). On 24 April fine ashfall was also reported in Finca La Florida (5 km S) and Santa Marta (5-6 km SW).
During May, continuous explosions produced ash plumes up to 3.5 km altitude drifting in multiple directions as far as 1 km from the Caliente dome. Constant weak and moderate block avalanches were observed on the S, SW, and SE flanks of the Caliente dome accompanied by some fine ashfall on the volcanic perimeter and white gas-and-steam emissions that rose 3.1 km altitude. On 7 and 17 May heavy rain on the upper part of the volcanic complex generated lahars that carried ash and blocks up to 1-2 m in diameter. Incandescence was intermittently observed at night.
Explosions from the Caliente dome in June were accompanied by ash plumes typically rising to 3.5 km altitude and drifting in different directions up to 1 km. Intermittent fine ashfall was reported around the volcanic; ashfall was also observed in the areas of Finca San José on 3 June, Loma Linda on 20 June, and Monte Carlo and surrounding areas on 22 June. Heavy rain on the upper part of the volcanic complex on 8 June generated lahars that carried ash and blocks up to 1-2 m in diameter. During the early morning on 9 June explosions produced an ash plume that rose to a maximum altitude of 3.7 km that drifted S and SW as far as 12-15 km from the Caliente dome. Weak and moderate pyroclastic flows and block avalanches on the S, SW, and SE flanks were also generated from these explosions. An explosion at 0535 on 19 June produced an ash plume that rose 3.5 km altitude and a small pyroclastic flow on the SW flank that reached the base of the Caliente dome. Incandescent pulses were visible at night and during the early morning on 19, 24, and 29 June. A Washington VAAC notice on 25 June reported a small ash plume drifting WNW, but it was not visible in satellite imagery. White gas-and-steam emissions continued rising to 3.4 km altitude while occasional incandescence was observed in the Caliente dome and on the S and SE flanks during the night and early morning.
Activity during July was similar to that of previous months. White gas-and-steam plumes continued to rise from the Caliente dome to 3.2 km altitude. STG3 seismic station registered weak to moderate explosions produced ash plumes up to 3.5 km altitude, resulting in occasional fine ashfall on the volcanic perimeter, in the villages of San Marcos and Loma Linda, Palajunoj on 20 and 30 July, and over Palajunoj and Fca Patrocinio on 25 July. Moderate to strong block avalanches were detected on the S, SW, and SE flanks. Incandescence at night was observed on most nights and during the early morning in the Caliente dome; incandescent pulses were reported on 4 July, according to INSIVUMEH. On 10-11 July the STG3 seismic station registered weak and moderate explosions that produced ash plumes up to 3-3.4 km altitude drifting W up to 12 km from the Caliente dome. Small pyroclastic flows and block avalanches on the W and NW flanks accompanied the explosions, resulting in ashfall in the villages of San Marcos and Loma Linda Palajunoj (figure 110). On 21 July weak and moderate explosions produced ash plumes up to 3.4 km altitude, resulting in slight ashfall on the volcanic perimeter, and moderate to strong avalanches on the S, SW, and SE flanks, some of which were accompanied by pyroclastic flows. During 25-26 and 31 July moderate and strong block avalanches on the W, NW, S, SW, and SE flanks were accompanied by pyroclastic flows.
MIROVA (Middle InfraRed Observation of Volcanic Activity) analysis of MODIS satellite data detected frequent thermal anomalies during March to mid-April 2020; after May the frequency and power of these anomalies decreased, but continued through July (figure 111). Some of these thermal anomalies were observed in Sentinel-2 thermal satellite imagery, originating from the summit of the Caliente cone (figure 112).
Geologic Background. Symmetrical, forest-covered Santa María volcano is part of a chain of large stratovolcanoes that rise above the Pacific coastal plain of Guatemala. The sharp-topped, conical profile is cut on the SW flank by a 1.5-km-wide crater. The oval-shaped crater extends from just below the summit to the lower flank, and was formed during a catastrophic eruption in 1902. The renowned Plinian eruption of 1902 that devastated much of SW Guatemala followed a long repose period after construction of the large basaltic-andesite stratovolcano. The massive dacitic Santiaguito lava-dome complex has been growing at the base of the 1902 crater since 1922. Compound dome growth at Santiaguito has occurred episodically from four vents, with activity progressing E towards the most recent, Caliente. Dome growth has been accompanied by almost continuous minor explosions, with periodic lava extrusion, larger explosions, pyroclastic flows, and lahars.
Information Contacts: Instituto Nacional de Sismologia, Vulcanologia, Meteorologia e Hydrologia (INSIVUMEH), Unit of Volcanology, Geologic Department of Investigation and Services, 7a Av. 14-57, Zona 13, Guatemala City, Guatemala (URL: http://www.insivumeh.gob.gt/ ); MIROVA (Middle InfraRed Observation of Volcanic Activity), a collaborative project between the Universities of Turin and Florence (Italy) supported by the Centre for Volcanic Risk of the Italian Civil Protection Department (URL: http://www.mirovaweb.it/); Sentinel Hub Playground (URL: https://www.sentinel-hub.com/explore/sentinel-playground); Washington Volcanic Ash Advisory Center (VAAC), Satellite Analysis Branch (SAB), NOAA/NESDIS OSPO, NOAA Science Center Room 401, 5200 Auth Rd, Camp Springs, MD 20746, USA (URL: www.ospo.noaa.gov/Products/atmosphere/vaac, archive at: http://www.ssd.noaa.gov/VAAC/archive.html).
Stromboli
Italy
38.789°N, 15.213°E; summit elev. 924 m
All times are local (unless otherwise noted)
Strombolian explosions persist at both summit craters during January-April 2020
Stromboli is a stratovolcano located in the northeastern-most part of the Aeolian Islands composed of two active summit vents: the Northern (N) Crater and the Central-South (CS) Crater that are situated at the head of the Sciara del Fuoco, a large scarp that runs from the summit down the NW side of the volcano. The ongoing eruption began in 1934 and has been characterized by regular Strombolian explosions in both summit craters, ash plumes, and occasional lava flows (BGVN 45:08). This report updates activity from January to April 2020 with information primarily from daily and weekly reports by Italy's Istituto Nazionale di Geofisica e Vulcanologia (INGV) and various satellite data.
Activity was consistent during this reporting period. Explosion rates ranged from 1-20 per hour and were of variable intensity, producing material that rose from less than 80 to over 250 m above the vents (table 8). Strombolian explosions were often accompanied by gas-and-steam emissions, spattering, and lava flows which has resulted in fallout deposited on the Sciara del Fuoco and incandescent blocks rolling toward the coast up to a few hundred meters down the slopes of the volcano. According to INGV, the average SO2 emissions measured 300-650 tons/day.
Table 8. Summary of activity at Stromboli during January-April 2020. Low-intensity activity indicates ejecta rising less than 80 m, medium-intensity is ejecta rising less than 150 m, and high-intensity is ejecta rising over 200 m above the vent. Data courtesy of INGV.
| Month |
Activity |
| Jan 2020 |
Strombolian activity and degassing continued with some spattering. Explosion rates varied from 2-20 per hour. Ejected material rose 80-150 m above the N crater and 150-200 m above the CS crater. A small cone is growing on the S1 crater and has produced some explosions and ejected coarse material mixed with fine ash. The average SO2 emissions measured 300 tons/day. |
| Feb 2020 |
Strombolian activity and degassing continued. Explosion rates varied from 2-14 per hour. Ejected material rose 80-200 m above the N crater and 80-250 m above the CS crater. The average SO2 emissions measured 300 tons/day. |
| Mar 2020 |
Strombolian activity and degassing continued with discontinuous spattering. Explosion rates varied from 1-16 per hour. Ejected material rose 80-150 m above the N crater and 150-250 m above the CS crater. Intense spattering was observed in the N crater. The average SO2 emissions measured 300-650 tons/day. |
| Apr 2020 |
Strombolian activity and degassing continued with spattering. Explosion rates varied from 1-17 per hour. Ejected material rose 80-150 m above the N crater and 150-250 m above the CS crater. Spattering was observed in the N crater. The average SO2 emissions measured 300-650 tons/day. |
During January 2020, explosive activity mainly originated from three vents in the N crater and at least three vents in the CS crater. Ejecta from numerous Strombolian explosions covered the slopes on the upper Sciara del Fuoco, some of which rolled hundreds of meters down toward the coast. Explosion rates varied from 2-12 per hour in the N crater and 9-14 per hour in the CS crater; ejected material rose 80-200 m above the craters. According to INGV, a small cone growing in the S1 crater produced some explosions that ejected coarse material mixed with fine ash. On 18 and 19 January a lava flow was observed, both of which originated in the N crater. In addition, two explosions were detected in the N crater that was associated with two landslide events.
Explosive activity in February primarily originated from 2-3 eruptive vents in the N crater and at least three vents in the CS crater (figure 177). The Strombolian explosions ejected material 80-250 m above the craters, some of which fell onto the upper part of the Sciara. Explosion rates varied from 3-12 per hour in the N crater and 2-14 per hour in the CS crater (figure 178). On 3 February a short-lived lava flow was reported in the N crater.
Ongoing explosive activity continued into March, originating from three eruptive vents in the N crater and at least three vents in the CS crater. Ejected lapilli and bombs rose 80-250 m above the craters resulting in fallout covering the slopes in the upper Sciara del Fuoco with blocks rolling down the slopes toward the coast and explosions varied from 4-13 per hour in the N crater and 1-16 per hour in the CS crater. Discontinuous spattering was observed during 9-19 March. On 19 March, intense spattering was observed in the N crater, which produced a lava flow that stretched along the upper part of the Sciara for a few hundred meters. Another lava flow was detected in the N crater on 28 March for about 4 hours into 29 March, which resulted in incandescent blocks breaking off the front of the flow and rolling down the slope of the volcano. On 30 March a lava flow originated from the N crater and remained active until the next day on 31 March. Landslides accompanied by incandescent blocks rolling down the Sciara del Fuoco were also observed.
Strombolian activity accompanied by gas-and-steam emissions continued into April, primarily produced in 3-4 eruptive vents in the N crater and 2-3 vents in the CS crater. Ejected material from these explosions rose 80-250 m above the craters, resulting in fallout products covering the slopes on the Sciara and blocks rolling down the slopes. Explosions varied from 4-15 per hour in the N crater and 1-10 per hour in the CS crater. On 1 April a thermal anomaly was detected in satellite imagery accompanied by gas-and-steam and ash emissions downstream of the Sciara del Fuoco. A lava flow was observed on 15 April in the N crater accompanied by gas-and-steam and ash emissions; at the front of the flow incandescent blocks detached and rolled down the Sciara (figure 179). This flow continued until 16 April, ending by 0956; a thermal anomaly persisted downslope from the lava flow. Spatter was ejected tens of meters from the vent. Another lava flow was detected on 19 April in the N crater, followed by detached blocks from the front of the flow rolling down the slopes. Spattering continued during 20-21 April.
Moderate thermal activity occurred frequently during 16 October to April 2020 as recorded in the MIROVA Log Radiative Power graph using MODIS infrared satellite information (figure 180). The MODVOLC thermal alerts recorded a total of 14 thermal signatures over the course of nine different days between late February and mid-April. Many of these thermal signatures were captured as hotspots in Sentinel-2 thermal satellite imagery in both summit craters (figure 181).
Geologic Background. Spectacular incandescent nighttime explosions at Stromboli have long attracted visitors to the "Lighthouse of the Mediterranean" in the NE Aeolian Islands. This volcano has lent its name to the frequent mild explosive activity that has characterized its eruptions throughout much of historical time. The small island is the emergent summit of a volcano that grew in two main eruptive cycles, the last of which formed the western portion of the island. The Neostromboli eruptive period took place between about 13,000 and 5,000 years ago. The active summit vents are located at the head of the Sciara del Fuoco, a prominent scarp that formed about 5,000 years ago due to a series of slope failures which extends to below sea level. The modern volcano has been constructed within this scarp, which funnels pyroclastic ejecta and lava flows to the NW. Essentially continuous mild Strombolian explosions, sometimes accompanied by lava flows, have been recorded for more than a millennium.
Information Contacts: Istituto Nazionale di Geofisica e Vulcanologia (INGV), Sezione di Catania, Piazza Roma 2, 95123 Catania, Italy (URL: http://www.ct.ingv.it/en/, Facebook: https://www.facebook.com/ingvvulcani/); MIROVA (Middle InfraRed Observation of Volcanic Activity), a collaborative project between the Universities of Turin and Florence (Italy) supported by the Centre for Volcanic Risk of the Italian Civil Protection Department (URL: http://www.mirovaweb.it/); Hawai'i Institute of Geophysics and Planetology (HIGP) - MODVOLC Thermal Alerts System, School of Ocean and Earth Science and Technology (SOEST), Univ. of Hawai'i, 2525 Correa Road, Honolulu, HI 96822, USA (URL: http://modis.higp.hawaii.edu/); Sentinel Hub Playground (URL: https://www.sentinel-hub.com/explore/sentinel-playground).
Tofua
Tonga
19.75°S, 175.07°W; summit elev. 515 m
All times are local (unless otherwise noted)
Intermittent thermal anomalies in the Lofia crater from October 2015 through July 2020
Tofua is a remote volcano located in the central part of the Tonga Islands group. The summit contains a 5-km-wide caldera; three post-caldera cones were constructed at the N end of a caldera lake. The easternmost cone has three craters that have produced young basaltic-andesite lava flows, some of which traveled into the caldera lake. The largest and northernmost of the cones, Lofia, has a steep-sided crater that is 70 m wide and 120 m deep and has been the source of historical eruptions, first reported in the 18th century. The previous report described few thermal alerts primarily during the latter part of 2014 using satellite data (BGVN 40:04), after which no thermal anomalies were detected between 18 October 2014 and 1 October 2015. A new eruptive period began on 2 October 2015 when a thermal anomaly was detected on the N end of the caldera. A posting of satellite imagery by Cultur Volcan about this ongoing activity resulted in this report; it updates activity from July 2015-July 2020 and includes information from various satellite data, primarily looking at thermal anomalies.
Summary of activity during October 2015-July 2020. No ash advisories from the Wellington Volcanic Ash Advisory Centre were issued during the reporting period. There was no activity detected in available satellite data from 18 October 2014 to 1 October 2015; however, on 2 October 2015 the MODVOLC system registered a single MODIS thermal anomaly in the N end of the caldera, marking the beginning of a new eruptive period. Intermittent hotspots were detected by Sentinel-2 thermal satellite imagery, Suomi NPP/VIIRS sensor data, and the MODVOLC system throughout the reporting period, with more frequent anomalies observed beginning in February 2018 through July 2020 (figure 8).
Sentinel-2 thermal satellite imagery and NASA Worldview captured intermittent variable-strength thermal anomalies during November 2015 through July 2020, primarily in the Lofia crater on the N end of the caldera lake (figures 9 and 10). Activity was relatively lower from November 2015 through 2017 compared to that of 2018 through July 2020. Some anomalies may have been obscured by cloud coverage. A significant thermal anomaly was observed during 22 June 2019, located in the N end of the caldera. Planet Labs satellite imagery shows gas-and-steam emissions rising from the Lofia crater and drifting NW during March and May 2020 (figure 11).
Geologic Background. The low, forested Tofua Island in the central part of the Tonga Islands group is the emergent summit of a large stratovolcano that was seen in eruption by Captain Cook in 1774. The summit contains a 5-km-wide caldera whose walls drop steeply about 500 m. Three post-caldera cones were constructed at the northern end of a cold fresh-water caldera lake, whose surface lies only 30 m above sea level. The easternmost cone has three craters and produced young basaltic-andesite lava flows, some of which traveled into the caldera lake. The largest and northernmost of the cones, Lofia, has a steep-sided crater that is 70 m wide and 120 m deep and has been the source of historical eruptions, first reported in the 18th century. The fumarolically active crater of Lofia has a flat floor formed by a ponded lava flow.
Information Contacts: Hawai'i Institute of Geophysics and Planetology (HIGP) - MODVOLC Thermal Alerts System, School of Ocean and Earth Science and Technology (SOEST), Univ. of Hawai'i, 2525 Correa Road, Honolulu, HI 96822, USA (URL: http://modis.higp.hawaii.edu/); Sentinel Hub Playground (URL: https://www.sentinel-hub.com/explore/sentinel-playground); NASA Worldview (URL: https://worldview.earthdata.nasa.gov/); Planet Labs, Inc. (URL: https://www.planet.com/); Cultur Volcan, Journal d’un volcanophile, (URL: https://laculturevolcan.blogspot.com).