Recently Published Bulletin Reports
Aira (Japan) Intermittent explosions, eruption plumes, and ashfall during January-June 2023
Suwanosejima (Japan) Frequent eruption plumes, explosions, and incandescent ejecta during January-June 2023
Semeru (Indonesia) Ash plumes, incandescent avalanches, and pyroclastic flows during January-June 2023
Manam (Papua New Guinea) Few ash plumes during November-December 2022
Krakatau (Indonesia) Strombolian activity and ash plumes during November 2022-April 2023
Stromboli (Italy) Strombolian explosions and lava flows continue during January-April 2023
Nishinoshima (Japan) Small ash plumes and fumarolic activity during November 2022 through April 2023
Karangetang (Indonesia) Lava flows, incandescent avalanches, and ash plumes during January-June 2023
Ahyi (United States) Intermittent hydroacoustic signals and discolored plumes during November 2022-June 2023
Kadovar (Papua New Guinea) An ash plume and weak thermal anomaly during May 2023
San Miguel (El Salvador) Small gas-and-ash explosions during March and May 2023
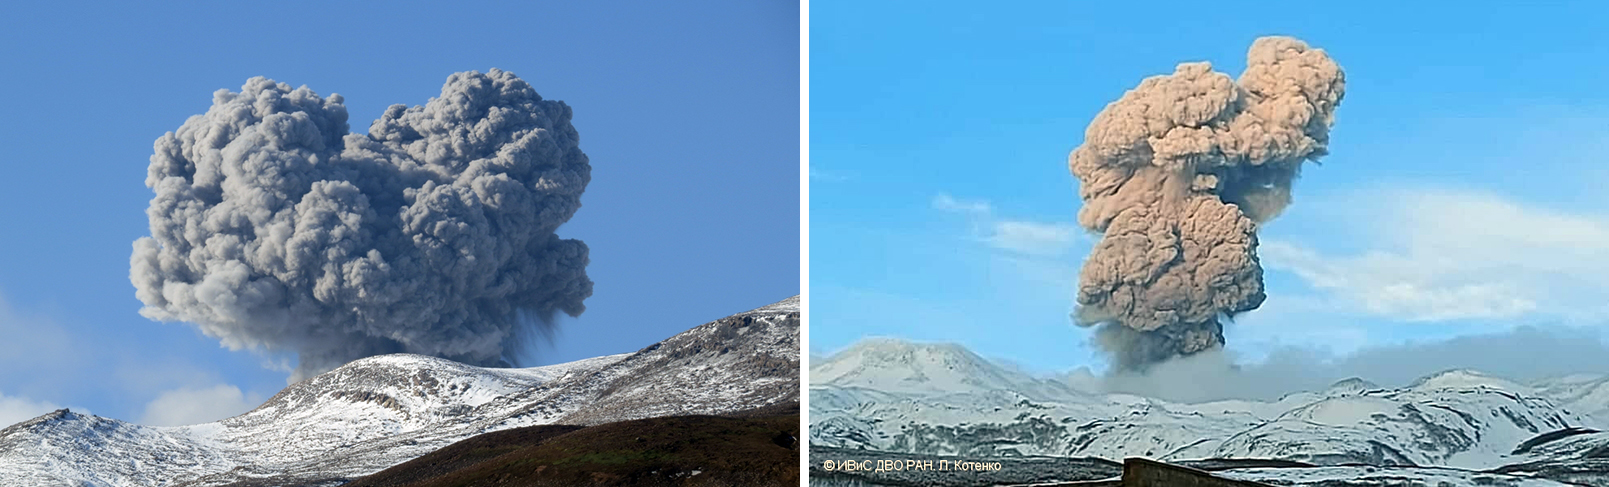
Ebeko (Russia) Continued explosions, ash plumes, and ashfall during October 2022-May 2023
Aira
Japan
31.5772°N, 130.6589°E; summit elev. 1117 m
All times are local (unless otherwise noted)
Intermittent explosions, eruption plumes, and ashfall during January-June 2023
Aira caldera, located in the northern half of Kagoshima Bay, contains the active post-caldera Sakurajima volcano near the southern tip of Japan’s Kyushu Island. Eruptions date back to the 8th century and have deposited ash on Kagoshima, one of Kyushu’s largest cities, 10 km W from the summit. The Minamidake summit cone and crater has had persistent activity since 1955; the Showa crater on the E flank has also been intermittently active since 2006. The current eruption period began during late March 2017 and has more recently consisted of explosions, ash plumes, and ashfall (BGVN 48:01). This report covers activity during January through June 2023, characterized by intermittent explosions, eruption events, eruption plumes, and ashfall from both summit craters, according to monthly activity reports from the Japan Meteorological Agency (JMA) and satellite data.
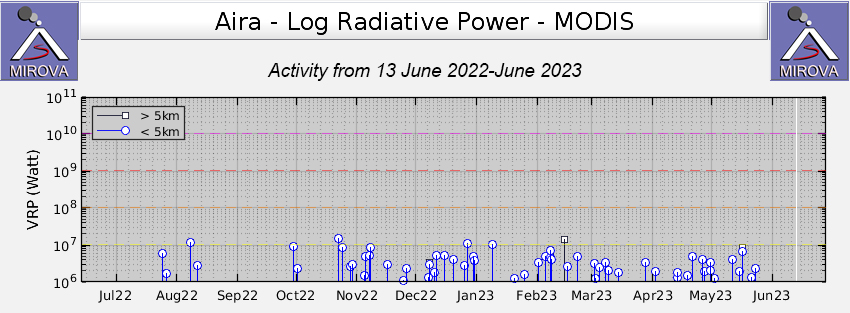
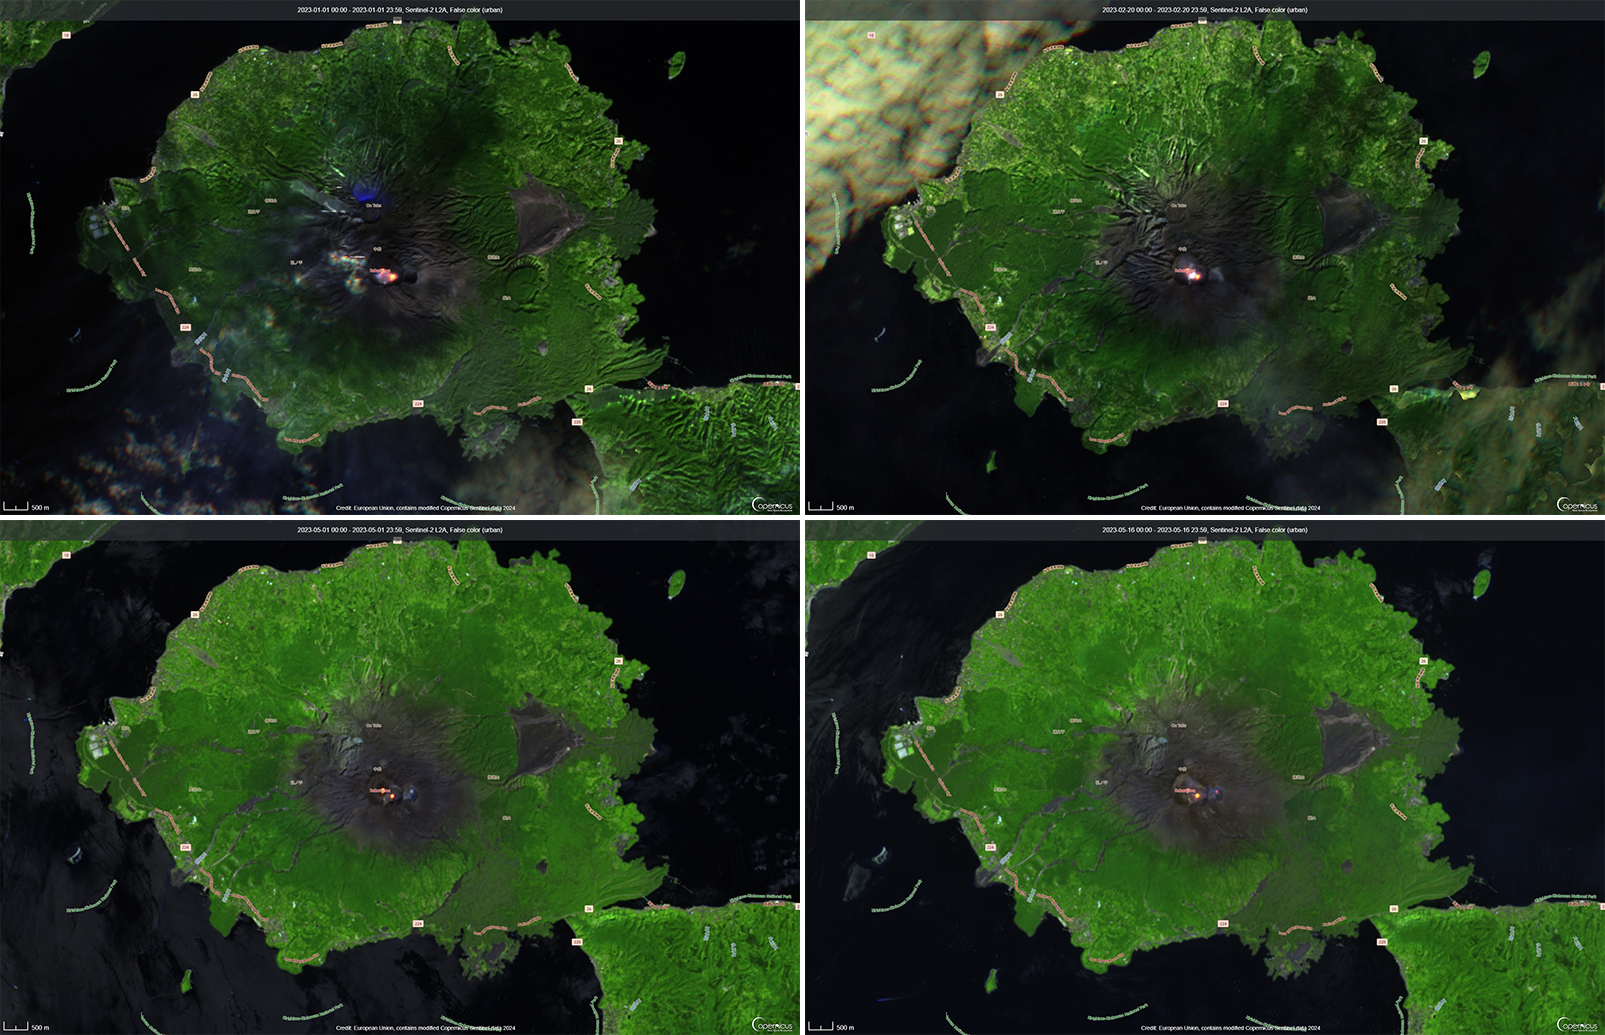
Thermal activity remained at low levels during this reporting period; less than ten thermal anomalies were detected each month by the MIROVA (Middle InfraRed Observation of Volcanic Activity) system (figure 139). Occasional thermal anomalies were visible in infrared satellite images mainly at the Minamidake crater (Vent A is located to the left and Vent B is located to the right) and during May, in the Showa crater on the E flank (figure 140).
Table 29. Number of monthly explosive events, days of ashfall, area of ash covered, and sulfur dioxide emissions from Sakurajima’s Minamidake crater at Aira during January-June 2023. Note that smaller ash events are not listed. Ashfall days were measured at Kagoshima Local Meteorological Observatory, and ashfall amounts represent material covering all the Kagoshima Prefecture. Data courtesy of JMA monthly reports.
| Month |
Explosive events |
Days of ashfall |
Ashfall amount (g/m3) |
SO2 emissions (tons/day) |
| Jan 2023 |
9 |
2 |
2 |
1,000-2,800 |
| Feb 2023 |
11 |
7 |
6 |
1,900-3,500 |
| Mar 2023 |
8 |
6 |
9 |
2,100-3,500 |
| Apr 2023 |
0 |
4 |
3 |
1,800-2,700 |
| May 2023 |
10 |
13 |
10 |
1,800-3,900 |
| Jun 2023 |
2 |
8 |
3 |
1,400-1,900 |
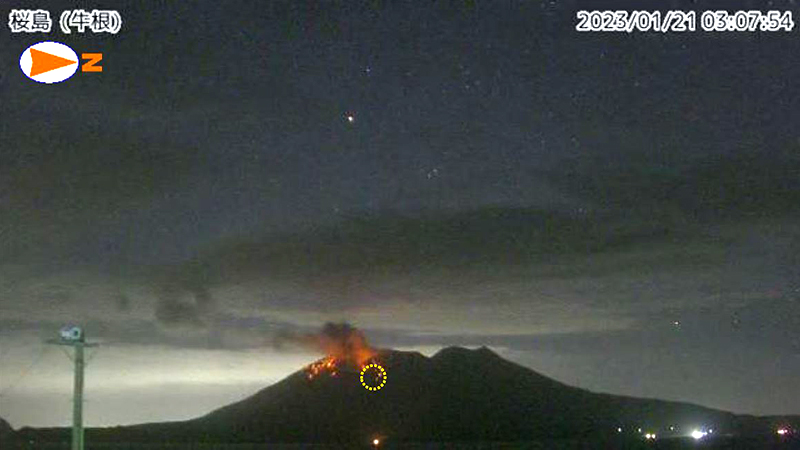
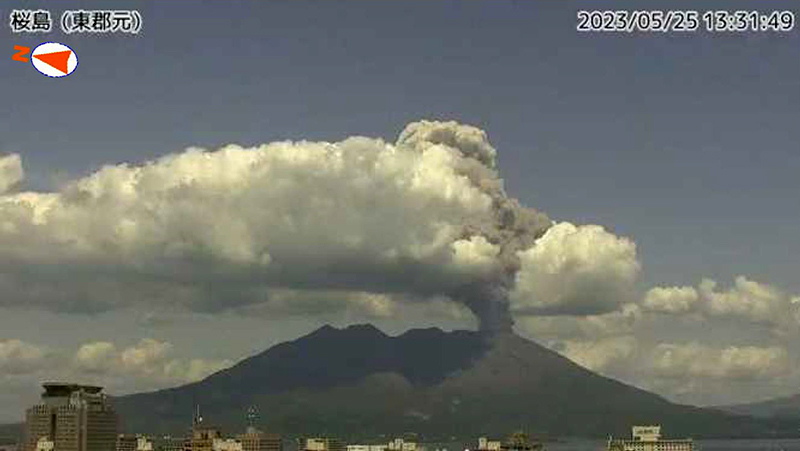
JMA reported that during January 2023, there were 14 eruptions, nine of which were explosion events. Accompanying eruption plumes rose 2.4 km above the crater rim. Large blocks were ejected 800-1,100 m from the Minamidake crater. Nighttime incandescence was observed in the Minamidake crater using a high-sensitivity surveillance camera. No eruptions in the Showa crater were reported, though there was a gradual increase in the amount of white gas-and-steam emissions beginning around mid-January. Seismicity consisted of 121 volcanic earthquakes, which was higher than the 78 earthquakes in December. The Kagoshima Local Meteorological Observatory reported a total of 2 g/m2 of ashfall was observed over the course of two days of the month. According to field surveys, daily sulfur dioxide emissions ranged from 1,000-2,800 tons/day (t/d); emissions have remained at comparable, elevated, levels since July 2022. Explosions were reported on 3 January at 1615, 8 January at 0642 and 1955, 18 January at 1215, 19 January at 0659, 21 January at 0307, and 28 January at 2342 where eruption plumes rose 1-2.4 km above the Minamidake crater and drifted SE and S. The explosion at 0307 on 21 January generated an eruption plume 1.6 km above the crater rim and ejected large blocks 800-1,100 m from the crater rim; crater incandescence was also visible (figure 141). On 28 January at 2342 an explosion produced an eruption plume that rose 2-2.2 km above the Minamidake summit crater and drifted SE.
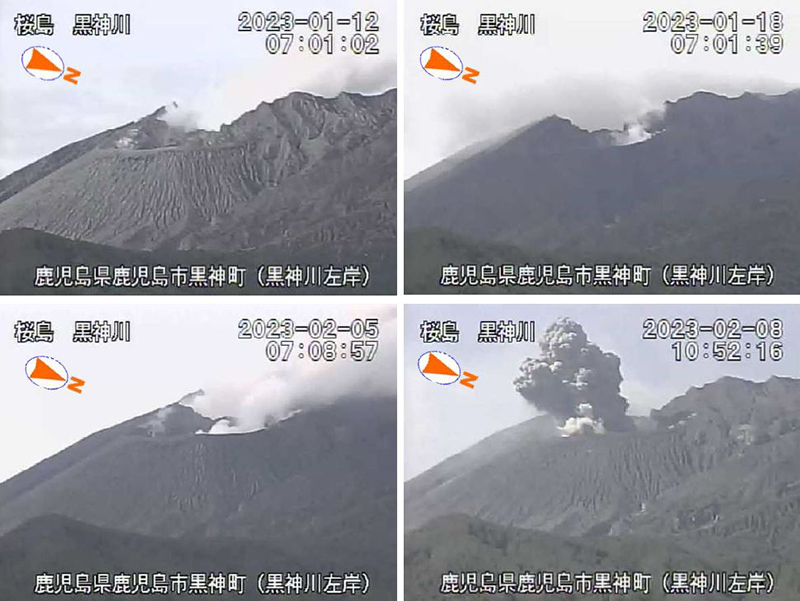
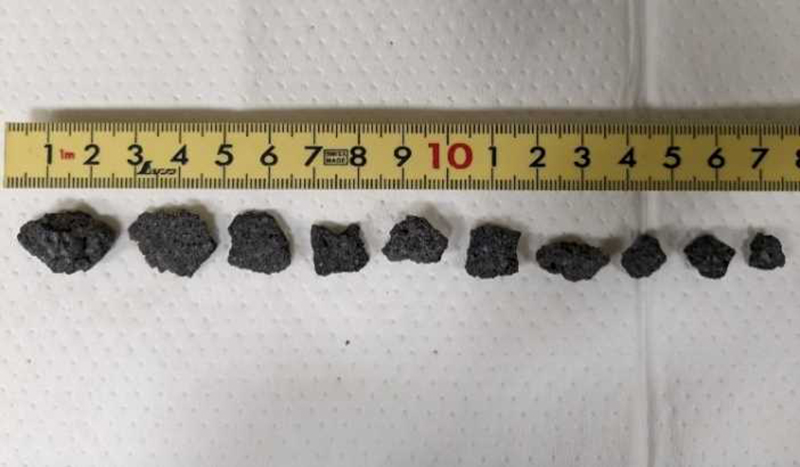
There were 26 eruptions reported during February, 11 of which were explosion events. Eruption plumes rose 2.4 km above the crater rim. Large blocks were ejected 800-1,100 m from the Minamidake summit crater, and daily nighttime crater incandescence continued. Occasional eruptive activity was observed in the Showa crater starting on 8 February, which included four eruptions (figure 142). The last time activity was reported in the Showa crater was early April 2018, according to JMA. There were 130 volcanic earthquakes detected during the month. Sulfur dioxide emissions ranged from 1,900-3,500 t/d. On 8 February large blocks were ejected 300-500 m from the Showa crater and an accompanying eruption plume rose 1.5 km above the crater rim. Summit crater incandescence was also visible at night during 8 and 21-26 February at the Showa crater. Weak crater incandescence was also reported on 8 February at the Minamidake summit crater. Explosions were recorded at 1815 on 9 February, at 1007 on 11 February, at 1448 on 14 February, at 0851 on 16 February, at 0206 on 19 February, at 2025 on 20 February, at 0937 and at 1322 on 21 February, and at 0558 on 28 February. Volcanic plumes rose 300-2,000 m above the Minamidake crater and drifted N, E, S, SE, and NE. An explosion at 1448 on 14 February at the Minamidake summit crater ejected large blocks 800-1,100 m from the crater. The eruption plume rose 800-1,200 m above the crater and drifted S. A field survey conducted on 14 February showed that the ejected volcanic clasts measured up to 3 cm in diameter, though most were smaller in size, and were deposited in Arimura, Kagoshima City (3 km SE) (figure 143). An aerial survey conducted by the Japan Maritime Self-Defense Force Air Group (JMSDF) on 21 February confirmed white gas-and-steam plumes rising from the N side of the Showa crater and water was visible at the bottom of the crater. Ashfall measurements showed that a total of 6 g/m2 fell over seven days during the month at the Kagoshima Local Metrological Observatory.
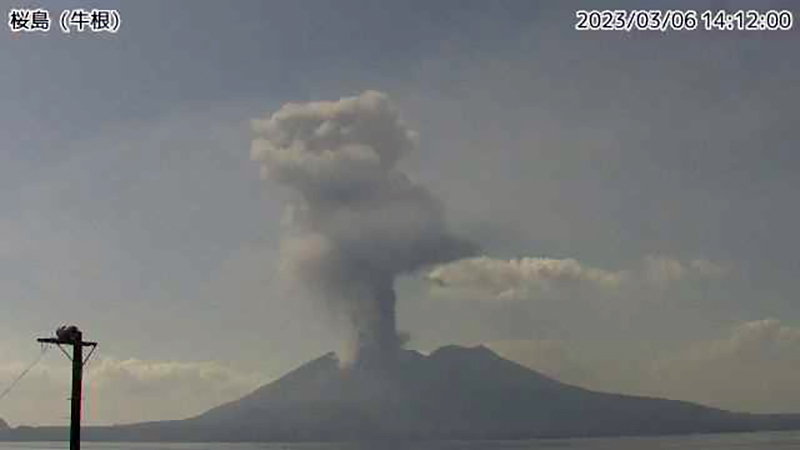
During March, 22 eruptions were reported, eight of which were explosion events. Volcanic plumes rose 2.8 km above the crater rim. There were four eruptions recorded at the Showa crater, for a total of eight eruptions during February and March. Large volcanic blocks were ejected 1,000-1,300 m from the Minamidake crater and nighttime incandescence remained visible at night, based on webcam images. Blocks ejected from the Showa crater traveled 500-800 m and accompanying eruption plumes rose 2.7 km above the crater rim. Nighttime crater incandescence was reported during 4-5 March at the Showa crater, based on webcam images. Seismicity included 97 volcanic earthquakes detected throughout the month. According to the Kagoshima Local Meteorological Observatory, a total of 9 g/m2 ashfall was observed over six days of the month. A field survey reported that 2,100-3,500 t/d of sulfur dioxide was released during the month. An eruption was detected at the Showa crater at 1404 on 6 March, that ejected blocks 500-800 m from the crater, accompanied by an eruption plume that rose 2.7 km above the crater rim (figure 144). Explosions were detected at 0116 on 3 March, at 2157 on 4 March, at 1322 on 8 March, at 2228 on 11 March, at 0418 on 14 March, and at 0035 on 22 March. Eruption plumes rose 1-2.8 km above the Minamidake crater and drifted SE, NE, NW, S, and SW. At 0035 on 22 March an explosion generated an eruption plume that rose 1.2 km above the Minamidake crater and drifted SW. Material was ejected 1-1.3 km from the Minamidake crater.
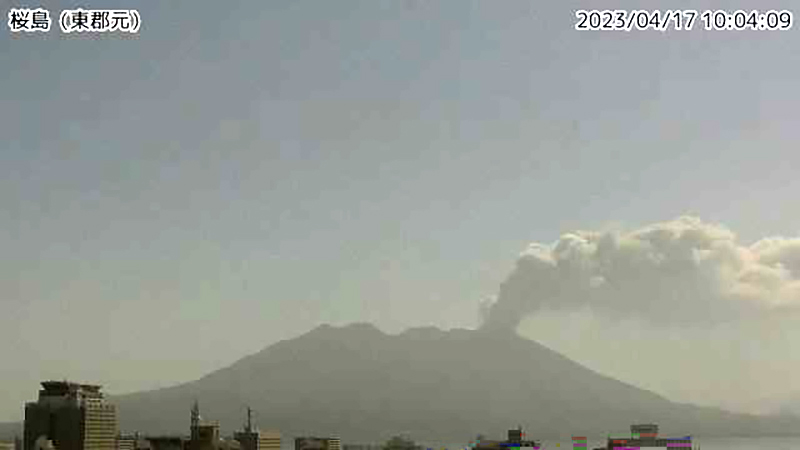
Two eruption events were reported in the Minamidake summit crater during April, neither of which were explosions; no eruptions occurred at the Showa crater. Eruption plumes rose 1.5 km above the crater rim and nighttime crater incandescence persisted nightly at the Minamidake crater. The number of volcanic earthquakes deceased to 38 and according to the Kagoshima Local Meteorological Observatory, a total of 3 g/m2 of ash fell over a period of four days during the month. The amount of sulfur dioxide released during the month ranged 1,800-2,700 t/d. An eruption event at 0955 on 17 April generated an eruption plume that rose 1.5 km above the crater rim (figure 145).
Eruptive activity during May consisted of 17 eruptions, 10 of which were explosion events. Volcanic plumes rose 2.3 km above the crater rim and large ejecta traveled 800-1,100 m from the Minamidake summit crater. Activity at the Showa crater was characterized by 11 eruption events and material was ejected 300-500 m from the crater. Nighttime crater incandescence was observed at both summit craters. The number of monthly volcanic earthquakes increased to 88 and the amount of ashfall recorded was 10 g/m2 over a period of 13 days during the month. According to a field survey, the amount of sulfur dioxide released ranged 1,800-3,900 t/d.
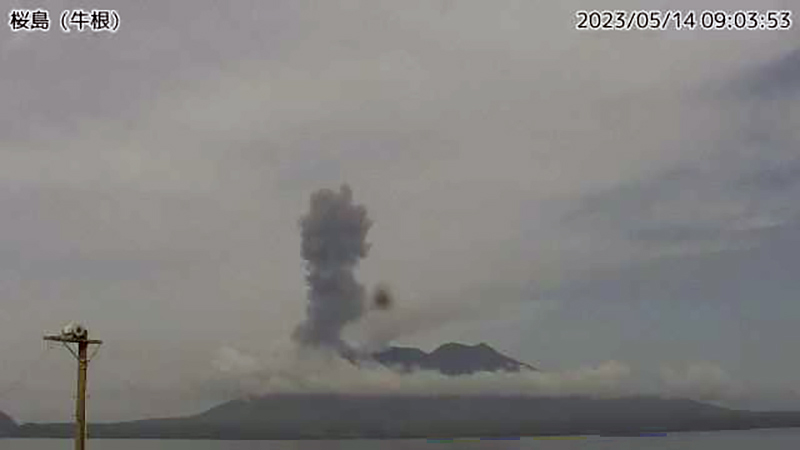
Explosions were recorded at 0422 on 2 May, at 0241 and at 1025 on 3 May, at 1315 on 9 May, at 2027 on 17 May, at 0610 on 24 May, at 1327 on 25 May, at 0647 and 1441 on 26 May, and at 1520 on 28 May. Resulting eruption plumes rose 400-1,800 m above the Minamidake crater and drifted SW, W, and N. On 14 May an eruption plume was visible above the Showa crater at 0859 that rose 1.7 km above the crater rim (figure 146). An eruption event at the Minamidake summit crater occurred at 1327 on 25 May; the eruption plume rose 2.3 km above the crater rim (figure 147).
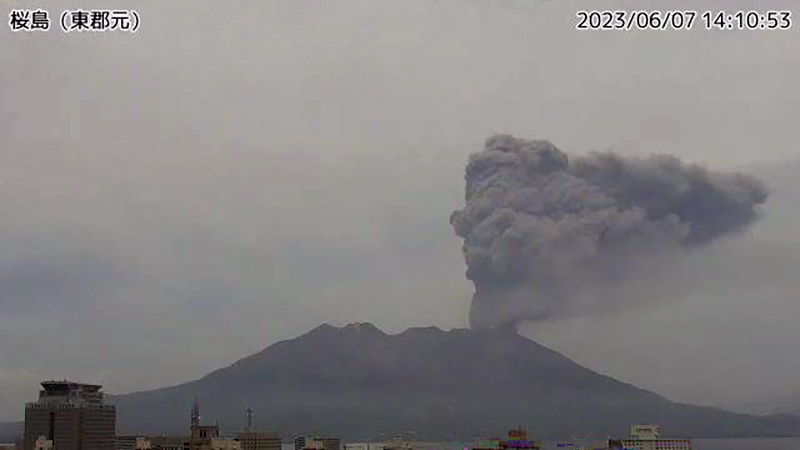
JMA reported four eruptions occurred during June, two of which were explosion events. Eruption plumes rose as high as 2.5 km above the Minamidake crater rim and large volcanic blocks were ejected 500-700 m from the crater rim. At the Showa crater, seven eruptions occurred, one of which was an explosion event. Eruption plumes rose 1.5 km above the Showa crater rim and large material was ejected 500 m from the crater rim. Nighttime incandescence was reported for both summit craters. There were 73 volcanic earthquakes detected during the month and a total of 3 g/m2 of ashfall during eight days of the month. According to a field survey, the amount of sulfur dioxide emissions released ranged 1,400-1,900 t/d. On 5 June at 0012 an explosion generated an eruption plume that rose 400-1,000 m above the Minamidake crater and drifted SE. An explosion at the Minamidake crater occurred at 1401 on 7 June that generated an eruption plume that rose 2.5 km above the crater and drifted SE (figure 148). A single explosion was reported at the Showa crater at 0438 on 22 June. The eruption plume rose 600 m above the crater rim and large blocks were ejected 500 m from the crater rim. This is the first report of an explosion at the Showa crater since October 2017, according to JMA.
Geologic Background. The Aira caldera in the northern half of Kagoshima Bay contains the post-caldera Sakurajima volcano, one of Japan's most active. Eruption of the voluminous Ito pyroclastic flow accompanied formation of the 17 x 23 km caldera about 22,000 years ago. The smaller Wakamiko caldera was formed during the early Holocene in the NE corner of the caldera, along with several post-caldera cones. The construction of Sakurajima began about 13,000 years ago on the southern rim and built an island that was joined to the Osumi Peninsula during the major explosive and effusive eruption of 1914. Activity at the Kitadake summit cone ended about 4,850 years ago, after which eruptions took place at Minamidake. Frequent eruptions since the 8th century have deposited ash on the city of Kagoshima, located across Kagoshima Bay only 8 km from the summit. The largest recorded eruption took place during 1471-76.
Information Contacts: Japan Meteorological Agency (JMA), 1-3-4 Otemachi, Chiyoda-ku, Tokyo 100-8122, Japan (URL: http://www.jma.go.jp/jma/indexe.html); MIROVA (Middle InfraRed Observation of Volcanic Activity), a collaborative project between the Universities of Turin and Florence (Italy) supported by the Centre for Volcanic Risk of the Italian Civil Protection Department (URL: http://www.mirovaweb.it/); Copernicus Browser, Copernicus Data Space Ecosystem, European Space Agency (URL: https://dataspace.copernicus.eu/browser/).
Suwanosejima (Japan) — July 2023  Cite this Report
Suwanosejima
Japan
29.638°N, 129.714°E; summit elev. 796 m
All times are local (unless otherwise noted)
Frequent eruption plumes, explosions, and incandescent ejecta during January-June 2023
Suwanosejima is located in the northern Ryukyu Islands, Japan, and is an 8-km-long island that consists of a stratovolcano and two active summit craters. Volcanism during the 20th century is characterized by Strombolian explosions, ash plumes, and ashfall. The current eruption began in October 2004 and has more recently consisted of intermittent explosions, eruption plumes, ashfall, and incandescent ejecta (BGVN 48:01). Similar activity continued during this reporting period of January through June 2023, based on monthly report from the Japan Meteorological Agency (JMA) and satellite data.
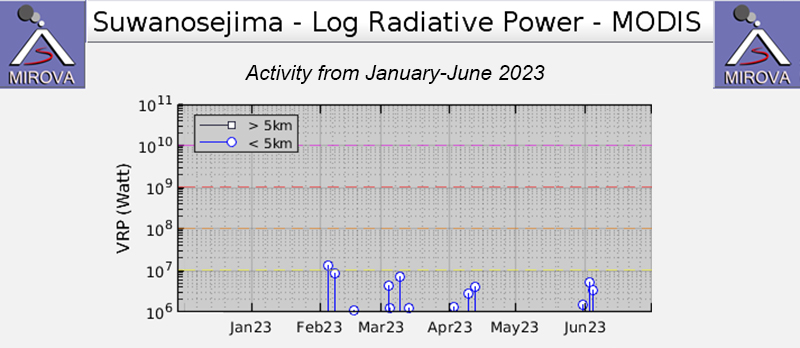
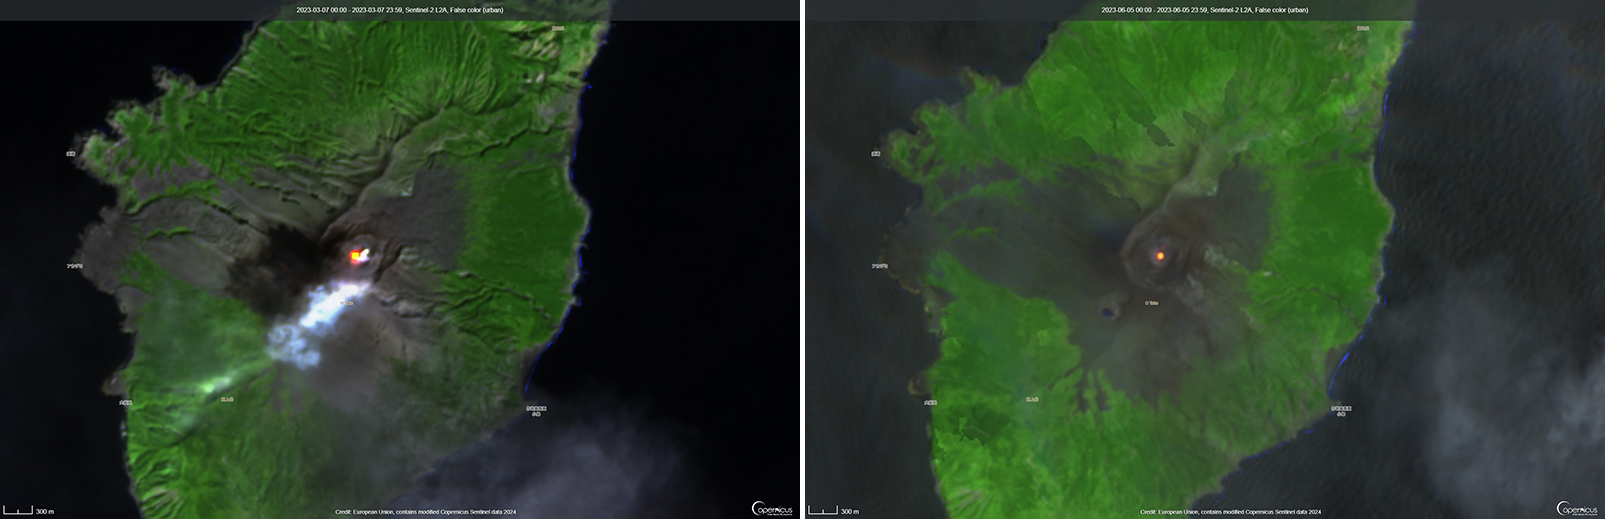
The MIROVA (Middle InfraRed Observation of Volcanic Activity) Log Radiative Power graph of the MODIS thermal anomaly data showed low thermal activity throughout the reporting period (figure 76). Three anomalies were detected during February, four during March, three during April, one during late May, and two during early June. A single thermal hotspot was detected by the MODVOLC thermal alerts system on the NE flank on 7 February. There were only two clear weather days in infrared satellite imagery that showed a thermal anomaly on 7 March and 5 June (figure 77).
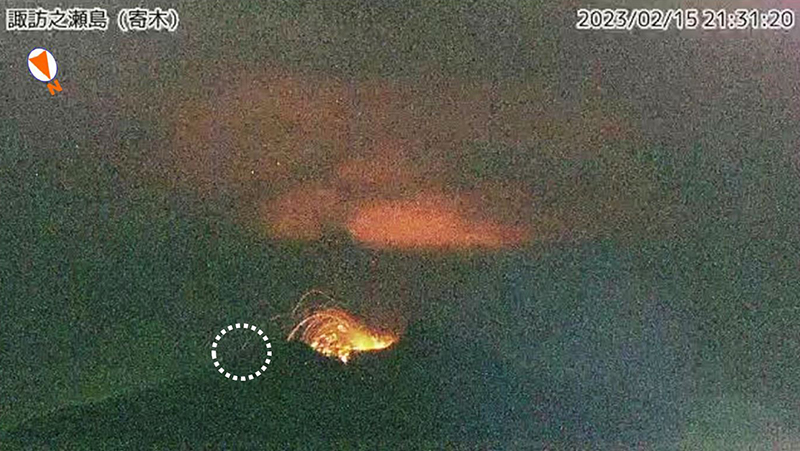
Activity in the Otake crater during January 2023 was relatively low, which prompted JMA to lower the Volcano Alert Level (VAL) from 3 to 2 (on a 5-level scale) on 24 January. The number of explosions recorded during the month was 13. There were 50 volcanic earthquakes detected on the W side of the island, which was roughly comparable to December (44), although near the Otake crater, there were 188 earthquakes recorded, which excluded earthquakes associated with explosions. An aerial overflight conducted on 11 January by the Japan Maritime Self-Defense Force Air Group (JMSDF) reported a gray-white plume rising from the Otake crater. During 26-30 January there was a brief increase in the number of explosions. An eruption at 0331 on 26 January generated an eruption plume that rose 1.7 km above the crater rim and ejected large blocks 400 m S from the crater. Nighttime crater incandescence was visible in a highly sensitive surveillance camera starting on 26 January. According to the Toshima Village Office, Suwanosejima Branch Office, ashfall was occasionally observed in the village (3.5 km SSW). According to observations conducted by the University of Tokyo Graduate School of Science, Kyoto University Disaster Prevention Research Institute, Toshima Village, and JMA, the amount of sulfur dioxide emissions released during the month was 200-600 tons per day (t/d).
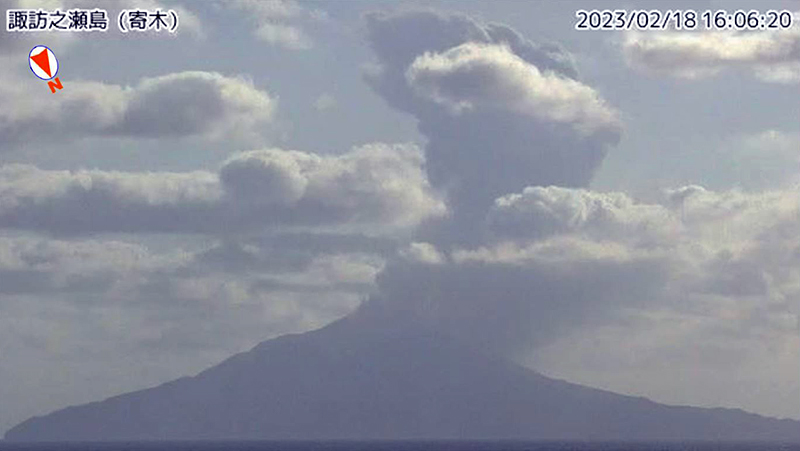
Eruptive activity in the Otake crater continued during February; the total number of explosions increased during this month from 13 to 56. There were 119 volcanic earthquakes detected on the W side of the island and 449 near the Otake crater, excluding earthquakes associated with explosions. During 15-21 February there was a brief increase in the number of explosions, and large blocks were ejected as far as 1 km from the crater. An explosion at 2131 on 15 March ejected material 900 m SE (figure 78). Eruptions on 18 and 27 February generated plumes that rose 2 km above the crater (figure 79). By 21 February the number of explosions reached 42, though no large-scale volcanic earthquakes were reported. Nighttime crater incandescence continued from late January through February. Ashfall was also occasionally observed in Toshima Village. The amount of sulfur dioxide emissions released during the month was 700 t/d.
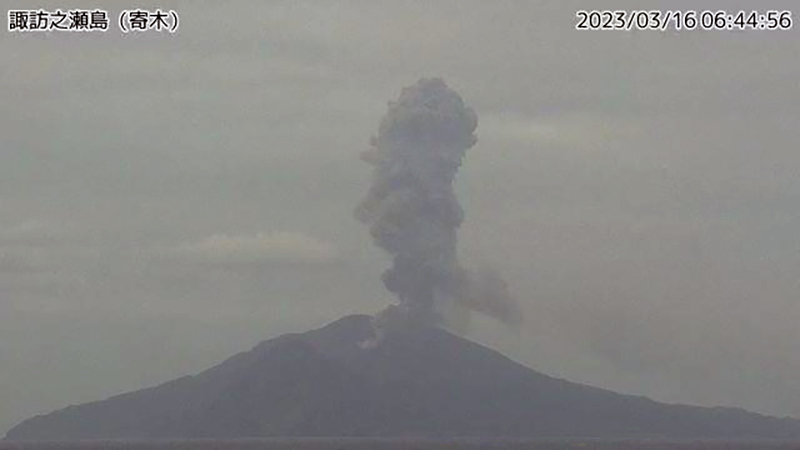
The number of explosions at the Otake crater increased during 2-5 March; 28 explosions were detected during this time. Large volcanic blocks were ejected 500 m from the crater. As a result, the VAL was increased to 3 on 5 March. There were 65 explosions recorded throughout the month. On the W side of the island, 63 volcanic earthquakes were reported, and closer to the Otake crater, 422 were detected, excluding earthquakes associated with explosions. Nighttime crater incandescence continued, as well as occasional ashfall in Toshima Village. On 16 March an eruption produced a volcanic plume that rose 2.4 km above the crater rim (figure 80). The amount of sulfur dioxide emissions released during the month was 200-1,100 t/d.
Eruptive activity continued at the Otake crater during April. Eruption plumes rose as high as 2 km above the crater rim and large blocks were ejected as far as 500 m from the crater. The number of explosions decreased to one throughout the month, although nighttime crater incandescence remained visible in the surveillance camera. Rumbling and ashfall continued intermittently in Toshima Village. There were 32 volcanic earthquakes detected, and 129 volcanic earthquakes near the Otake crater, not including those associated with explosions. According to JMA, the amount of sulfur dioxide released during the month was 200-1,400 t/d. On 16 April at 0402 an eruption ejected incandescent material 500 m S from the crater.
Activity continued at the Otake crater in May. An eruption plume rose 1.8 km above the crater rim and large volcanic blocks were ejected 300 m from the crater. The number of explosions remained low throughout the month (7) and nighttime crater incandescence persisted. Occasional ashfall was reported in Toshima Village. As many as 44 volcanic earthquakes were recorded on the W side of the island, and 205 were recorded closer to the Otake crater, which was higher compared to the previous month. Generally, the amount of sulfur dioxide released during the month ranged 400-700 t/d, but on 19 May the amount increased to 2,600 t/d. On 16 May an eruption produced a volcanic plume that rose 1.8 km above the crater rim.
Eruptive activity was relatively low in June; the number of explosions generally decreased and on 9 June the VAL was lowered to 2. Nighttime crater incandescence continued, and according to the Toshima Village Office, rumbling and ashfall were also noted occasionally. There were 31 explosions throughout the month and 28 volcanic earthquakes detected on the W side of the island and as many as 722 volcanic earthquakes were recorded near the Otake crater. During 13-19 June, JMA reported a brief increase in the number of explosions. On 15 June at 2200 an eruption generated a volcanic plume that rose 2 km above the crater rim. An eruption on 16 June at 2147 ejected material 400 m SE from the crater. The amount of sulfur dioxide emitted was relatively low, at 100 t/d on 27 June.
Geologic Background. The 8-km-long island of Suwanosejima in the northern Ryukyu Islands consists of an andesitic stratovolcano with two active summit craters. The summit is truncated by a large breached crater extending to the sea on the E flank that was formed by edifice collapse. One of Japan's most frequently active volcanoes, it was in a state of intermittent Strombolian activity from Otake, the NE summit crater, between 1949 and 1996, after which periods of inactivity lengthened. The largest recorded eruption took place in 1813-14, when thick scoria deposits covered residential areas, and the SW crater produced two lava flows that reached the western coast. At the end of the eruption the summit of Otake collapsed, forming a large debris avalanche and creating an open collapse scarp extending to the eastern coast. The island remained uninhabited for about 70 years after the 1813-1814 eruption. Lava flows reached the eastern coast of the island in 1884. Only about 50 people live on the island.
Information Contacts: Japan Meteorological Agency (JMA), 1-3-4 Otemachi, Chiyoda-ku, Tokyo 100-8122, Japan (URL: http://www.jma.go.jp/jma/indexe.html); MIROVA (Middle InfraRed Observation of Volcanic Activity), a collaborative project between the Universities of Turin and Florence (Italy) supported by the Centre for Volcanic Risk of the Italian Civil Protection Department (URL: http://www.mirovaweb.it/); Hawai'i Institute of Geophysics and Planetology (HIGP) - MODVOLC Thermal Alerts System, School of Ocean and Earth Science and Technology (SOEST), Univ. of Hawai'i, 2525 Correa Road, Honolulu, HI 96822, USA (URL: http://modis.higp.hawaii.edu/); Copernicus Browser, Copernicus Data Space Ecosystem, European Space Agency (URL: https://dataspace.copernicus.eu/browser/).
Semeru
Indonesia
8.108°S, 112.922°E; summit elev. 3657 m
All times are local (unless otherwise noted)
Ash plumes, incandescent avalanches, and pyroclastic flows during January-June 2023
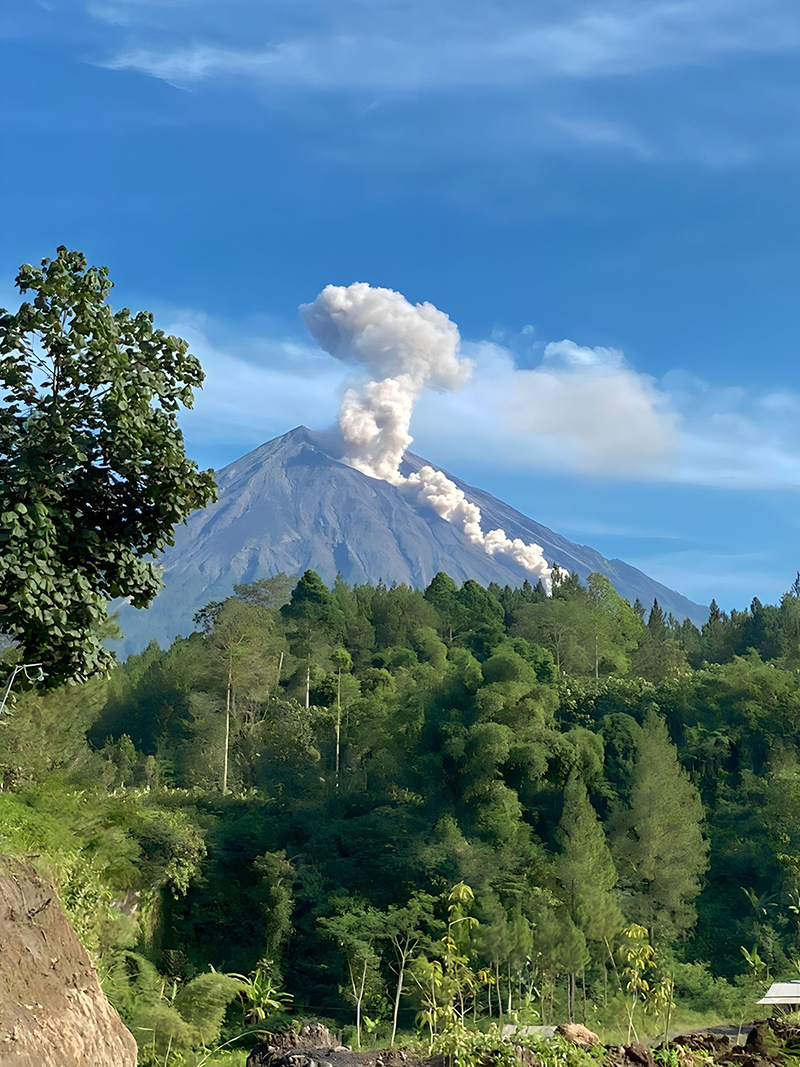
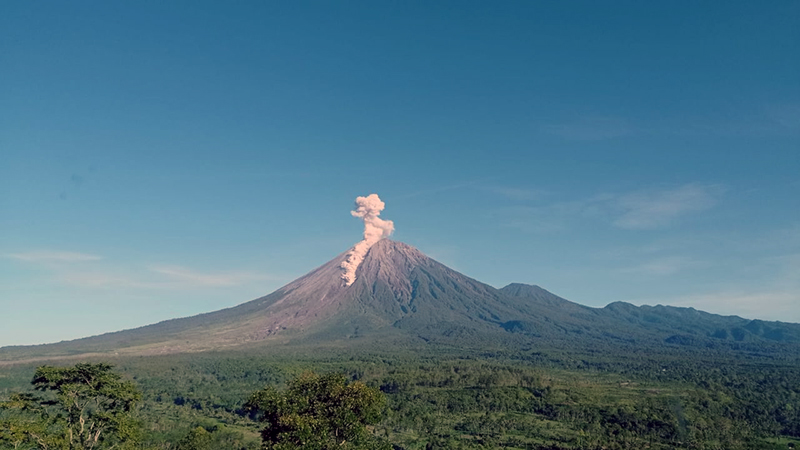
Semeru contains the active Jonggring-Seloko vent at the Mahameru summit and is located in East Java, Indonesia. Frequent 19th and 20th century eruptions were dominated by small-to-moderate explosions from the summit crater, with occasional lava flows and larger explosive eruptions accompanied by pyroclastic flows that have reached the lower flanks of the volcano. The current eruption began in June 2017 and more recently has been characterized by intermittent gas-and-ash plumes and incandescent avalanches (BGVN 48:01). This report updates activity such as ash plumes, incandescent avalanches, and pyroclastic flows from January through June 2023, based on information from daily, VONA, and special reports from the Pusat Vulkanologi dan Mitigasi Bencana Geologi (PVMBG, also known as Indonesian Center for Volcanology and Geological Hazard Mitigation, CVGHM), MAGMA Indonesia, and various satellite data.
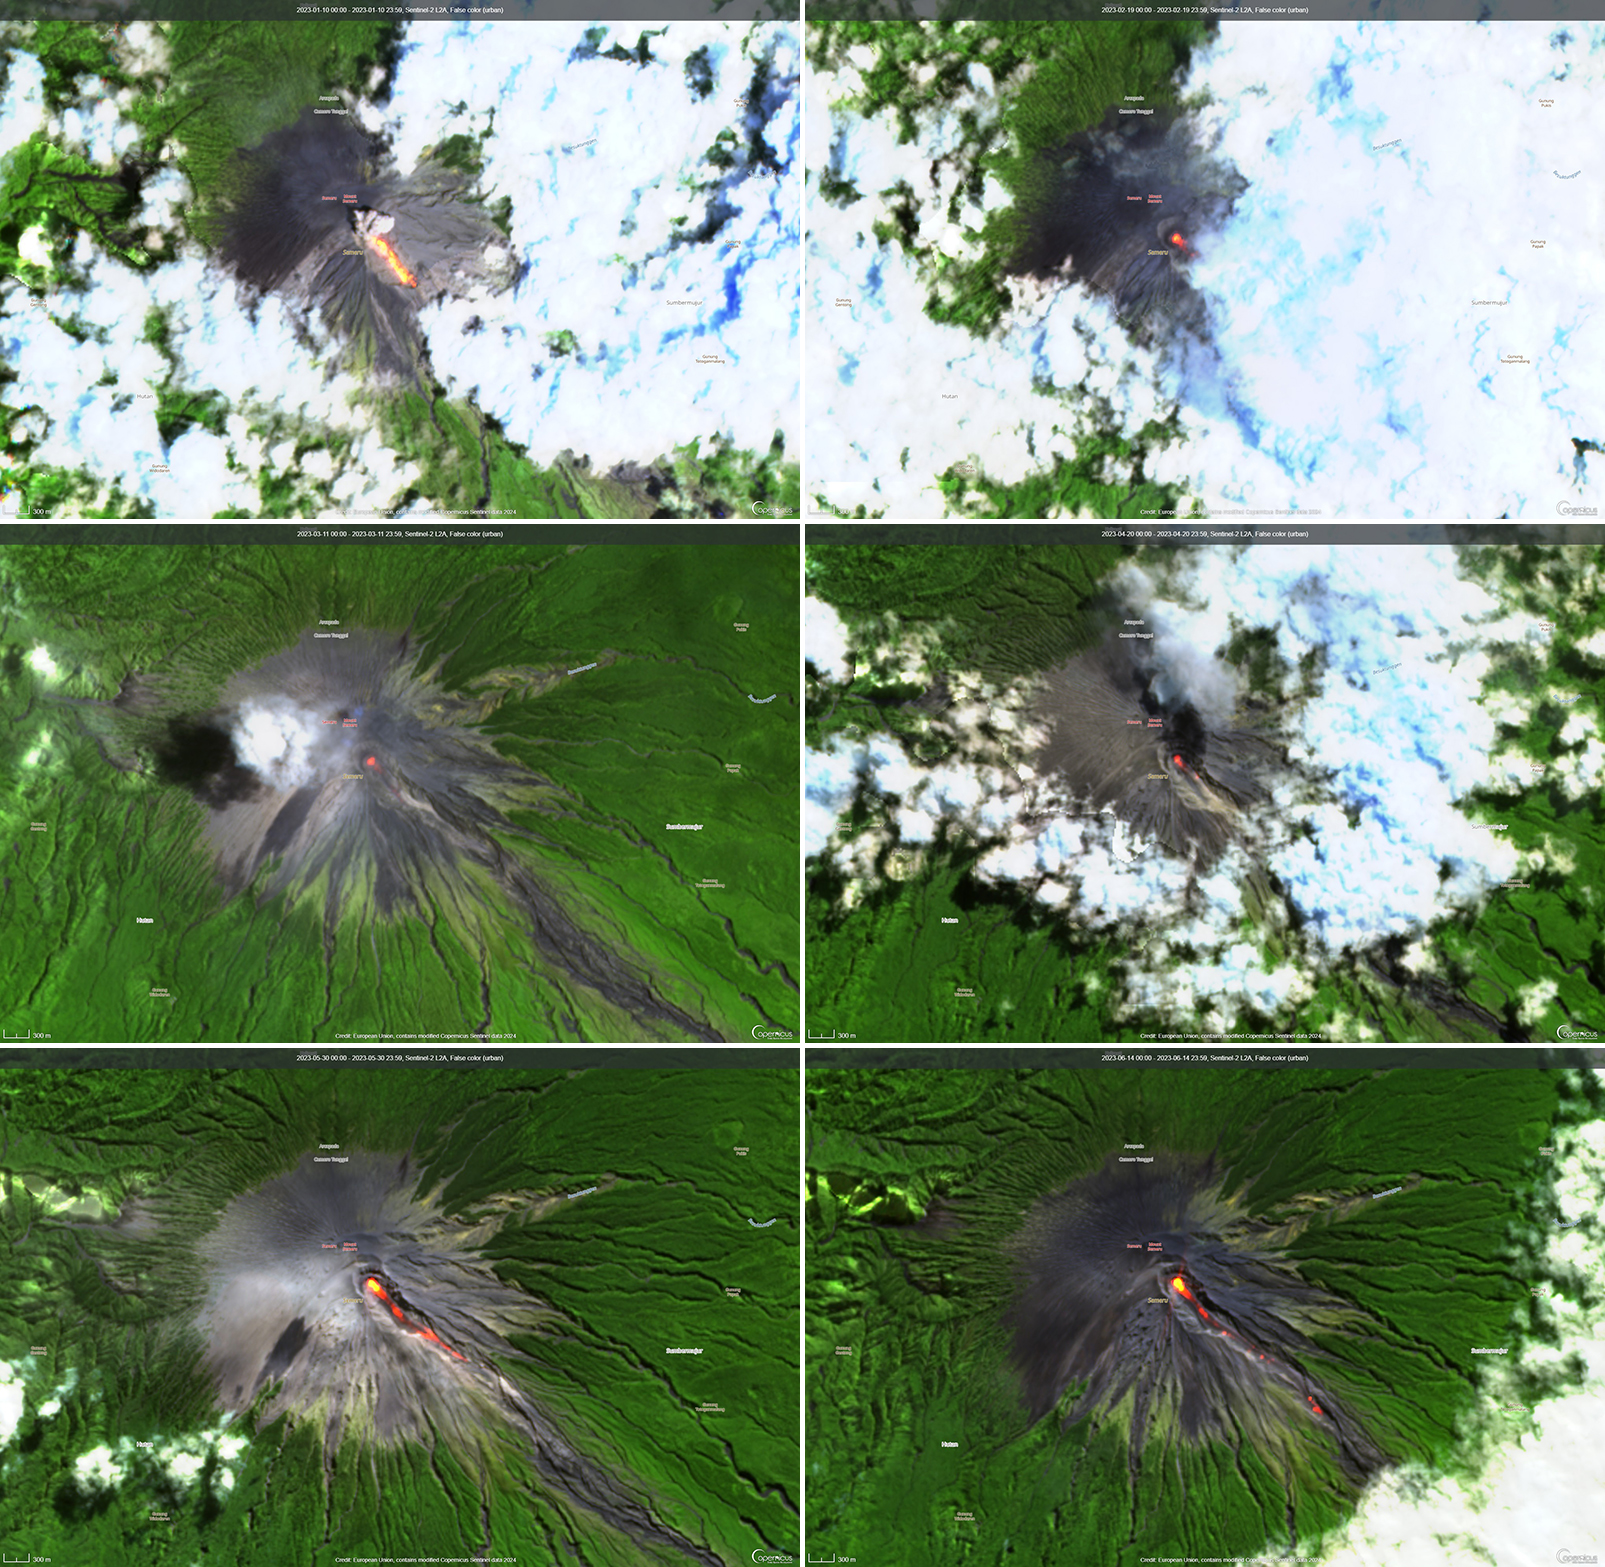
Activity during January and February mainly consisted of frequent ash plumes and white-and-gray emissions. The ash plumes during January rose 200-1,000 m above the crater and drifted in different directions. The white-and-gray emissions rose 200-1,000 m above the crater. A photo was posted on social media that showed an incandescent lava flow extending 500 m from the summit crater on the SE flank at 0027 on 8 January (figure 83). Video posted to social media on 5 February showed a pyroclastic flow descending the SE flank and ash plumes rising along the path and drifting N. Ash plumes rose 1 km above the crater at 0802 on 13 January, at 0536 on 17 January, at 0628 on 19 January and drifted SW, W, and SE, respectively. White, gray, and brown emissions were reported on 15 and 17 January that rose 300-1,000 m above the crater. During February, ash plumes rose 200-1,500 m above the crater and drifted mainly N and NE. White-and-gray emissions rose 100-1,000 m above the crater.
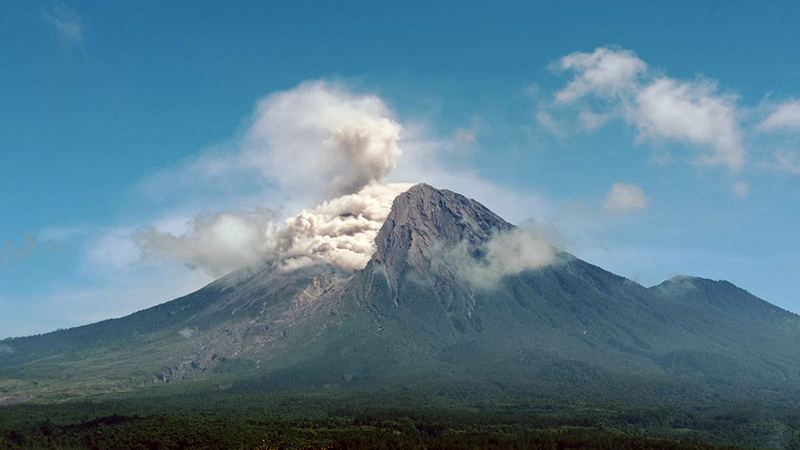
Similar activity consisting of frequent ash plumes and gas-and-steam emissions continued through March and April. During March, ash plumes rose 300-1,200 m above the crater and drifted in multiple directions. On 25 March at 0738 an ash plume rose 1.2 km above the crater and drifted SE. Occasional white-and-gray emissions rose 50-1,000 m above the crater. Ash plumes in April rose 400-1,200 m above the crater and drifted in different directions. An ash plume on 3 April rose 1.2 km above the crater and drifted SE and S at 0538. On 8 April a photo and videos were posted on social media showing a pyroclastic flow moving 1.5 km down the SE flank, accompanied by an ash plume (figure 84). New material was deposited along the crater, according to a local news source. Another pyroclastic flow occurred at 0710 on 18 April that descended up to 2 km from the crater to the SE (figure 85). White-and-gray emissions rose 100-800 m above the crater during April.
Ash plumes and white-and-gray emissions persisted during May and June. During May, ash plumes rose 300-1,200 m above the crater and drifted generally N and S. On 13 May around 1012 a pyroclastic flow was observed moving 1.5 km down the SE flank, accompanied by an ash plume (figure 86). On 27 May an ash plume rose 1.2 km above the crater and drifted S and SW at 0819. White-and-gray emissions rose 100-800 m above the crater. Ash plumes during June rose 200-1,500 m above the crater and generally drifted N and SW. A webcam image showed incandescent material at the summit and on the flanks at 0143 on 23 June that traveled 3.5 km. According to a local news source, a pyroclastic flow traveled 5 km down the SE flank at 1910 on 26 June; the accompanying an ash plume rose as high as 1.5 km above the crater and drifted NE and E. Dominantly white gas-and-steam emissions rose 50-300 m above the crater.
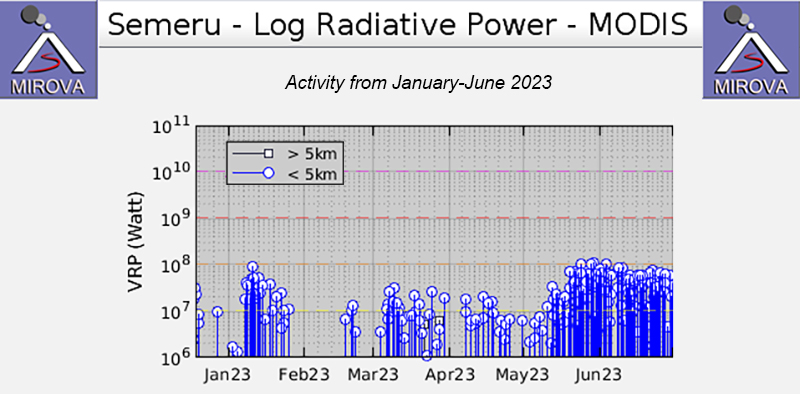
MIROVA (Middle InfraRed Observation of Volcanic Activity) analysis of MODIS satellite data showed frequent and moderate-power thermal anomalies during January through June 2023 (figure 87). There was a short gap in activity during late January through late February, followed by low-power and less frequent anomalies through April. During mid-May, there was an increase in both power and frequency of the anomalies. A total of 73 thermal hotspots were detected, based on data from the MODVOLC thermal algorithm. There were 10 detected in January, four in March, two in April, 17 in May, and 40 in June. Infrared satellite images showed persistent thermal activity at the summit crater during the reporting period; strong incandescent avalanches of material were occasionally captured in these images and affected the SE flank (figure 88).
Geologic Background. Semeru, the highest volcano on Java, and one of its most active, lies at the southern end of a volcanic massif extending north to the Tengger caldera. The steep-sided volcano, also referred to as Mahameru (Great Mountain), rises above coastal plains to the south. Gunung Semeru was constructed south of the overlapping Ajek-ajek and Jambangan calderas. A line of lake-filled maars was constructed along a N-S trend cutting through the summit, and cinder cones and lava domes occupy the eastern and NE flanks. Summit topography is complicated by the shifting of craters from NW to SE. Frequent 19th and 20th century eruptions were dominated by small-to-moderate explosions from the summit crater, with occasional lava flows and larger explosive eruptions accompanied by pyroclastic flows that have reached the lower flanks of the volcano.
Information Contacts: Pusat Vulkanologi dan Mitigasi Bencana Geologi (PVMBG, also known as Indonesian Center for Volcanology and Geological Hazard Mitigation, CVGHM), Jalan Diponegoro 57, Bandung 40122, Indonesia (URL: http://www.vsi.esdm.go.id/); MAGMA Indonesia, Kementerian Energi dan Sumber Daya Mineral (URL: https://magma.esdm.go.id/v1); Badan Nasional Penanggulangan Bencana (BNPB), National Disaster Management Agency, Graha BNPB - Jl. Scout Kav.38, East Jakarta 13120, Indonesia (URL: http://www.bnpb.go.id/); MIROVA (Middle InfraRed Observation of Volcanic Activity), a collaborative project between the Universities of Turin and Florence (Italy) supported by the Centre for Volcanic Risk of the Italian Civil Protection Department (URL: http://www.mirovaweb.it/); Hawai'i Institute of Geophysics and Planetology (HIGP) - MODVOLC Thermal Alerts System, School of Ocean and Earth Science and Technology (SOEST), Univ. of Hawai'i, 2525 Correa Road, Honolulu, HI 96822, USA (URL: http://modis.higp.hawaii.edu/); Copernicus Browser, Copernicus Data Space Ecosystem, European Space Agency (URL: https://dataspace.copernicus.eu/browser/); Info Semeru (Twitter: @info_semeru, https://twitter.com/info_semeru).
Manam (Papua New Guinea) — July 2023 Cite this Report
Manam
Papua New Guinea
4.08°S, 145.037°E; summit elev. 1807 m
All times are local (unless otherwise noted)
Few ash plumes during November-December 2022
Manam is a 10-km-wide island that consists of two active summit craters: the Main summit crater and the South summit crater and is located 13 km off the northern coast of mainland Papua New Guinea. Frequent mild-to-moderate eruptions have been recorded since 1616. The current eruption period began during June 2014 and has more recently been characterized by intermittent ash plumes and thermal activity (BGVN 47:11). This report updates activity that occurred from November 2022 through May 2023 based on information from the Darwin Volcanic Ash Advisory Center (VAAC) and various satellite data.
Ash plumes were reported during November and December 2022 by the Darwin VAAC. On 7 November an ash plume rose to 2.1 km altitude and drifted NE based on satellite images and weather models. On 14 November an ash plume rose to 2.1 km altitude and drifted W based on RVO webcam images. On 20 November ash plumes rose to 1.8 km altitude and drifted NW. On 26 December an ash plume rose to 3 km altitude and drifted S and SSE.
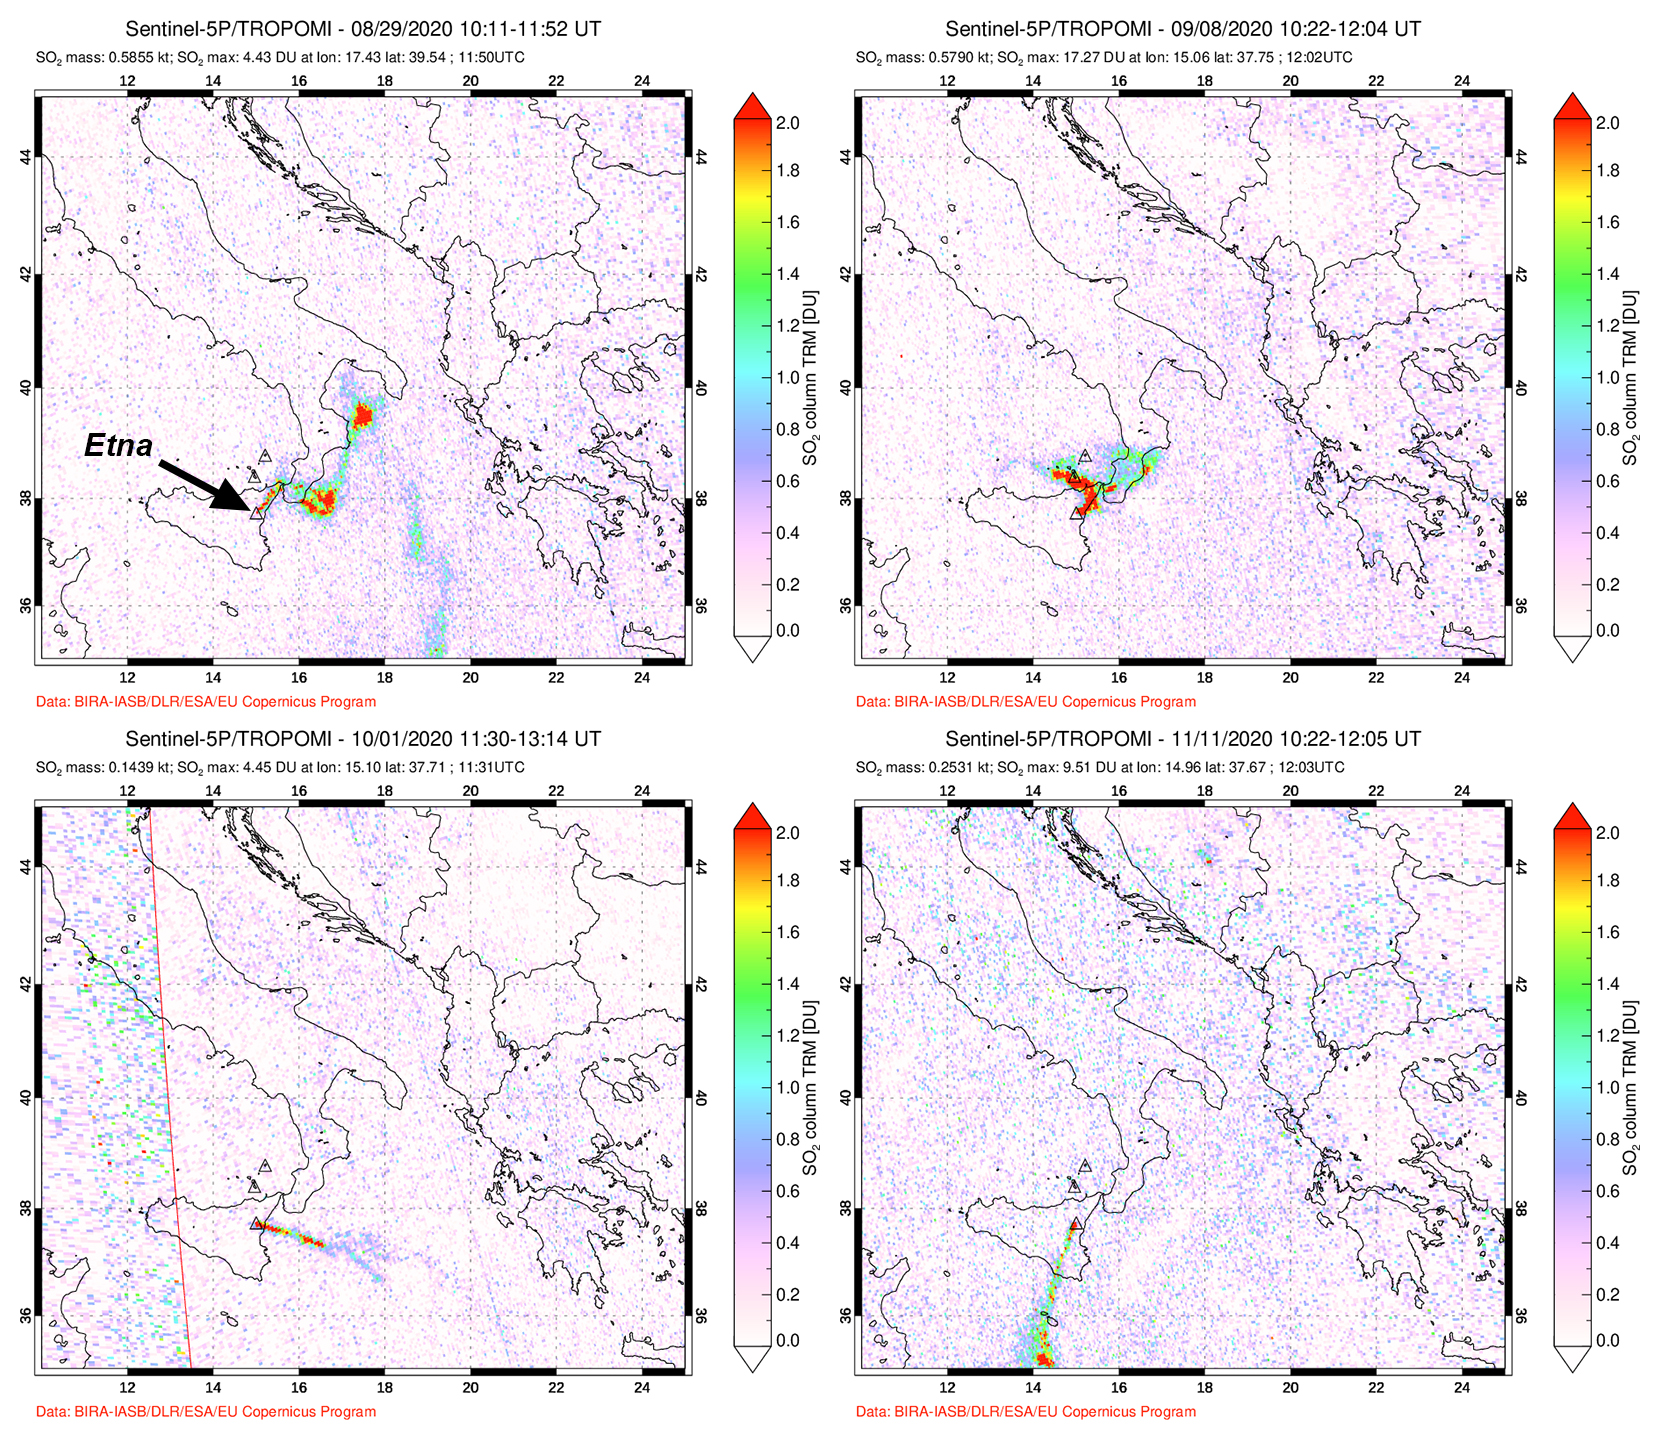
Intermittent sulfur dioxide plumes were detected using the TROPOMI instrument on the Sentinel-5P satellite, some of which exceeded at least two Dobson Units (DU) and drifted in different directions (figure 93). Occasional low-to-moderate power thermal anomalies were recorded by the MIROVA (Middle InfraRed Observation of Volcanic Activity) system; less than five anomalies were recorded each month during November 2022 through May 2023 (figure 94). Two thermal hotspots were detected by the MODVOLC thermal alerts system on 10 December 2022. On clear weather days, thermal activity was also captured in infrared satellite imagery in both the Main and South summit craters, accompanied by gas-and-steam emissions (figure 95).
Geologic Background. The 10-km-wide island of Manam, lying 13 km off the northern coast of mainland Papua New Guinea, is one of the country's most active volcanoes. Four large radial valleys extend from the unvegetated summit of the conical basaltic-andesitic stratovolcano to its lower flanks. These valleys channel lava flows and pyroclastic avalanches that have sometimes reached the coast. Five small satellitic centers are located near the island's shoreline on the northern, southern, and western sides. Two summit craters are present; both are active, although most observed eruptions have originated from the southern crater, concentrating eruptive products during much of the past century into the SE valley. Frequent eruptions, typically of mild-to-moderate scale, have been recorded since 1616. Occasional larger eruptions have produced pyroclastic flows and lava flows that reached flat-lying coastal areas and entered the sea, sometimes impacting populated areas.
Information Contacts: Rabaul Volcano Observatory (RVO), Geohazards Management Division, Department of Mineral Policy and Geohazards Management (DMPGM), PO Box 3386, Kokopo, East New Britain Province, Papua New Guinea; Darwin Volcanic Ash Advisory Centre (VAAC), Bureau of Meteorology, Northern Territory Regional Office, PO Box 40050, Casuarina, NT 0811, Australia (URL: http://www.bom.gov.au/info/vaac/); MIROVA (Middle InfraRed Observation of Volcanic Activity), a collaborative project between the Universities of Turin and Florence (Italy) supported by the Centre for Volcanic Risk of the Italian Civil Protection Department (URL: http://www.mirovaweb.it/); Hawai'i Institute of Geophysics and Planetology (HIGP) - MODVOLC Thermal Alerts System, School of Ocean and Earth Science and Technology (SOEST), Univ. of Hawai'i, 2525 Correa Road, Honolulu, HI 96822, USA (URL: http://modis.higp.hawaii.edu/); NASA Global Sulfur Dioxide Monitoring Page, Atmospheric Chemistry and Dynamics Laboratory, NASA Goddard Space Flight Center (NASA/GSFC), 8800 Greenbelt Road, Goddard, Maryland, USA (URL: https://so2.gsfc.nasa.gov/); Copernicus Browser, Copernicus Data Space Ecosystem, European Space Agency (URL: https://dataspace.copernicus.eu/browser/).
Krakatau (Indonesia) — July 2023 Cite this Report
Krakatau
Indonesia
6.1009°S, 105.4233°E; summit elev. 285 m
All times are local (unless otherwise noted)
Strombolian activity and ash plumes during November 2022-April 2023
Krakatau is located in the Sunda Strait between Java and Sumatra, Indonesia. Caldera collapse during the catastrophic 1883 eruption destroyed Danan and Perbuwatan cones and left only a remnant of Rakata. The post-collapse cone of Anak Krakatau (Child of Krakatau) was constructed within the 1883 caldera at a point between the former Danan and Perbuwatan cones; it has been the site of frequent eruptions since 1927. The current eruption period began in May 2021 and has recently consisted of explosions, ash plumes, and thermal activity (BGVN 47:11). This report covers activity during November 2022 through April 2023 based on information provided by the Indonesian Center for Volcanology and Geological Hazard Mitigation, referred to as Pusat Vulkanologi dan Mitigasi Bencana Geologi (PVMBG), MAGMA Indonesia, the Darwin Volcanic Ash Advisory Center (VAAC), and several sources of satellite data.
Activity was relatively low during November and December 2022. Daily white gas-and-steam plumes rose 25-100 m above the summit and drifted in different directions. Gray ash plumes rose 200 m above the summit and drifted NE at 1047 and at 2343 on 11 November. On 14 November at 0933 ash plumes rose 300 m above the summit and drifted E. An ash plume was reported at 0935 on 15 December that rose 100 m above the summit and drifted NE. An eruptive event at 1031 later that day generated an ash plume that rose 700 m above the summit and drifted NE. A gray ash plume at 1910 rose 100 m above the summit and drifted E. Incandescent material was ejected above the vent based on an image taken at 1936.
During January 2023 daily white gas-and-steam plumes rose 25-300 m above the summit and drifted in multiple directions. Gray-to-brown ash plumes were reported at 1638 on 3 January, at 1410 and 1509 on 4 January, and at 0013 on 5 January that rose 100-750 m above the summit and drifted NE and E; the gray-to-black ash plume at 1509 on 4 January rose as high as 3 km above the summit and drifted E. Gray ash plumes were recorded at 1754, 2241, and 2325 on 11 January and at 0046 on 12 January and rose 200-300 m above the summit and drifted NE. Toward the end of January, PVMBG reported that activity had intensified; Strombolian activity was visible in webcam images taken at 0041, 0043, and 0450 on 23 January. Multiple gray ash plumes throughout the day rose 200-500 m above the summit and drifted E and SE (figure 135). Webcam images showed progressively intensifying Strombolian activity at 1919, 1958, and 2113 on 24 January; a gray ash plume at 1957 rose 300 m above the summit and drifted E (figure 135). Eruptive events at 0231 and 2256 on 25 January and at 0003 on 26 January ejected incandescent material from the vent, based on webcam images. Gray ash plumes observed during 26-27 January rose 300-500 m above the summit and drifted NE, E, and SE.
Low levels of activity were reported during February and March. Daily white gas-and-steam plumes rose 25-300 m above the summit and drifted in different directions. The Darwin VAAC reported that continuous ash emissions rose to 1.5-1.8 km altitude and drifted W and NW during 1240-1300 on 10 March, based on satellite images, weather models, and PVMBG webcams. White-and-gray ash plumes rose 500 m and 300 m above the summit and drifted SW at 1446 and 1846 on 18 March, respectively. An eruptive event was recorded at 2143, though it was not visible due to darkness. Multiple ash plumes were reported during 27-29 March that rose as high as 2.5 km above the summit and drifted NE, W, and SW (figure 136). Webcam images captured incandescent ejecta above the vent at 0415 and around the summit area at 2003 on 28 March and at 0047 above the vent on 29 March.
Daily white gas-and-steam plumes rose 25-300 m above the summit and drifted in multiple directions during April and May. White-and-gray and black plumes rose 50-300 m above the summit on 2 and 9 April. On 11 May at 1241 a gray ash plume rose 1-3 km above the summit and drifted SW. On 12 May at 0920 a gray ash plume rose 2.5 km above the summit and drifted SW and at 2320 an ash plume rose 1.5 km above the summit and drifted SW. An accompanying webcam image showed incandescent ejecta. On 13 May at 0710 a gray ash plume rose 2 km above the summit and drifted SW (figure 137).
The MIROVA (Middle InfraRed Observation of Volcanic Activity) graph of MODIS thermal anomaly data showed intermittent low-to-moderate power thermal anomalies during November 2022 through April 2023 (figure 138). Some of this thermal activity was also visible in infrared satellite imagery at the crater, accompanied by gas-and-steam and ash plumes that drifted in different directions (figure 139).
Geologic Background. The renowned Krakatau (frequently mis-named as Krakatoa) volcano lies in the Sunda Strait between Java and Sumatra. Collapse of an older edifice, perhaps in 416 or 535 CE, formed a 7-km-wide caldera. Remnants of that volcano are preserved in Verlaten and Lang Islands; subsequently the Rakata, Danan, and Perbuwatan cones were formed, coalescing to create the pre-1883 Krakatau Island. Caldera collapse during the catastrophic 1883 eruption destroyed Danan and Perbuwatan, and left only a remnant of Rakata. This eruption caused more than 36,000 fatalities, most as a result of tsunamis that swept the adjacent coastlines of Sumatra and Java. Pyroclastic surges traveled 40 km across the Sunda Strait and reached the Sumatra coast. After a quiescence of less than a half century, the post-collapse cone of Anak Krakatau (Child of Krakatau) was constructed within the 1883 caldera at a point between the former Danan and Perbuwatan cones. Anak Krakatau has been the site of frequent eruptions since 1927.
Information Contacts: Pusat Vulkanologi dan Mitigasi Bencana Geologi (PVMBG, also known as Indonesian Center for Volcanology and Geological Hazard Mitigation, CVGHM), Jalan Diponegoro 57, Bandung 40122, Indonesia (URL: http://www.vsi.esdm.go.id/); MAGMA Indonesia, Kementerian Energi dan Sumber Daya Mineral (URL: https://magma.esdm.go.id/v1); Darwin Volcanic Ash Advisory Centre (VAAC), Bureau of Meteorology, Northern Territory Regional Office, PO Box 40050, Casuarina, NT 0811, Australia (URL: http://www.bom.gov.au/info/vaac/); MIROVA (Middle InfraRed Observation of Volcanic Activity), a collaborative project between the Universities of Turin and Florence (Italy) supported by the Centre for Volcanic Risk of the Italian Civil Protection Department (URL: http://www.mirovaweb.it/); Copernicus Browser, Copernicus Data Space Ecosystem, European Space Agency (URL: https://dataspace.copernicus.eu/browser/).
Stromboli
Italy
38.789°N, 15.213°E; summit elev. 924 m
All times are local (unless otherwise noted)
Strombolian explosions and lava flows continue during January-April 2023
Stromboli, located in Italy, has exhibited nearly constant lava fountains for the past 2,000 years; recorded eruptions date back to 350 BCE. Eruptive activity occurs at the summit from multiple vents, which include a north crater area (N area) and a central-southern crater (CS area) on a terrace known as the ‘terrazza craterica’ at the head of the Sciara del Fuoco, a large scarp that runs from the summit down the NW side of the volcano-island. Activity typically consists of Strombolian explosions, incandescent ejecta, lava flows, and pyroclastic flows. Thermal and visual monitoring cameras are located on the nearby Pizzo Sopra La Fossa, above the terrazza craterica, and at multiple flank locations. The current eruption period has been ongoing since 1934 and recent activity has consisted of frequent Strombolian explosions and lava flows (BGVN 48:02). This report updates activity during January through April 2023 primarily characterized by Strombolian explosions and lava flows based on reports from Italy's Istituto Nazionale di Geofisica e Vulcanologia (INGV) and various satellite data.
Frequent explosive activity continued throughout the reporting period, generally in the low-to-medium range, based on the number of hourly explosions in the summit crater (figure 253, table 16). Intermittent thermal activity was recorded by the MIROVA (Middle InfraRed Observation of Volcanic Activity) analysis of MODIS satellite data (figure 254). According to data collected by the MODVOLC thermal algorithm, a total of 9 thermal alerts were detected: one on 2 January 2023, one on 1 February, five on 24 March, and two on 26 March. The stronger pulses of thermal activity likely reflected lava flow events. Infrared satellite imagery captured relatively strong thermal hotspots at the two active summit craters on clear weather days, showing an especially strong event on 8 March (figure 255).
Table 16. Summary of type, frequency, and intensity of explosive activity at Stromboli by month during January-April 2023; information from webcam observations. Courtesy of INGV weekly reports.
| Month |
Explosive Activity |
| Jan 2023 |
Typical Strombolian activity with spattering and lava overflows in the N crater area. Explosions were reported from 4 vents in the N area and 1-2 vents in the CS area. The average hourly frequency of explosions was low-to-medium (1-12 events/hour). The intensity of the explosions varied from low (less than 80 m high) to medium (less than 150 m high) in the N crater area and up to high (greater than 150 m high) in the CS crater area. |
| Feb 2023 |
Typical Strombolian activity with spattering in the N crater area. Explosions were reported from 2-3 vents in the N area and 1-4 vents in the CS area. The average hourly frequency of explosions was low-to-medium (1-14 events/hour). The intensity of the explosions varied from low (less than 80 m high) to medium (less than 150 m high) in the N crater area and up to high (greater than 150 m high) in the CS crater area. |
| Mar 2023 |
Typical Strombolian activity with spattering and lava overflows in the N crater area. Explosions were reported from 2-3 vents in the N area and 2-4 vents in the CS area. The average hourly frequency of explosions was low-to-medium (1-18 events/hour). The intensity of the explosions varied from low (less than 80 m high) to medium (less than 150 m high) in the N crater area and up to high (greater than 150 m high) in the CS crater area. |
| Apr 2023 |
Typical Strombolian activity. Explosions were reported from 2 vents in the N area and 2-3 vents in the CS area. The average hourly frequency of explosions was low-to-high (1-16 events/hour). The intensity of the explosions varied from low (less than 80 m high) to medium (less than 150 m high) in both the N and CS crater areas. |
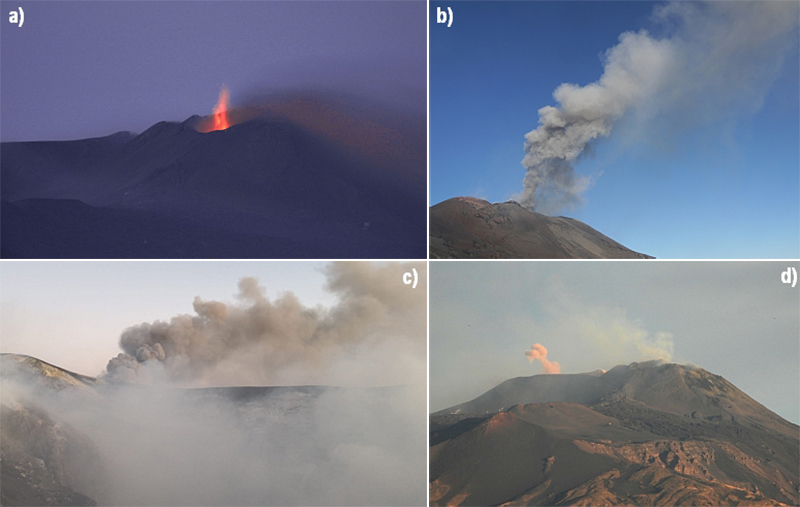
Activity during January-February 2023. Strombolian explosions were reported in the N crater area, as well as lava effusion. Explosive activity in the N crater area ejected coarse material (bombs and lapilli). Intense spattering was observed in both the N1 and N2 craters. In the CS crater area, explosions generally ejected fine material (ash), sometimes to heights greater than 250 m. The intensity of the explosions was characterized as low-to-medium in the N crater and medium-to-high in the CS crater. After intense spattering activity from the N crater area, a lava overflow began at 2136 on 2 January that flowed part way down the Sciara del Fuoco, possibly moving down the drainage that formed in October, out of view from webcams. The flow remained active for a couple of hours before stopping and beginning to cool. A second lava flow was reported at 0224 on 4 January that similarly remained active for a few hours before stopping and cooling. Intense spattering was observed on 11 and 13 January from the N1 crater. After intense spattering activity at the N2 crater at 1052 on 17 January another lava flow started to flow into the upper part of the Sciara del Fuoco (figure 256), dividing into two: one that traveled in the direction of the drainage formed in October, and the other one moving parallel to the point of emission. By the afternoon, the rate of the flow began to decrease, and at 1900 it started to cool. A lava flow was reported at 1519 on 24 January following intense spattering in the N2 area, which began to flow into the upper part of the Sciara del Fuoco. By the morning of 25 January, the lava flow had begun to cool. During 27 January the frequency of eruption in the CS crater area increased to 6-7 events/hour compared to the typical 1-7 events/hour; the following two days showed a decrease in frequency to less than 1 event/hour. Starting at 1007 on 30 January a high-energy explosive sequence was produced by vents in the CS crater area. The sequence began with an initial energetic pulse that lasted 45 seconds, ejecting predominantly coarse products 300 m above the crater that fell in an ESE direction. Subsequent and less intense explosions ejected material 100 m above the crater. The total duration of this event lasted approximately two minutes. During 31 January through 6, 13, and 24 February spattering activity was particularly intense for short periods in the N2 crater.
An explosive sequence was reported on 16 February that was characterized by a major explosion in the CS crater area (figure 257). The sequence began at 1817 near the S2 crater that ejected material radially. A few seconds later, lava fountains were observed in the central part of the crater. Three explosions of medium intensity (material was ejected less than 150 m high) were recorded at the S2 crater. The first part of this sequence lasted approximately one minute, according to INGV, and material rose 300 m above the crater and then was deposited along the Sciara del Fuoco. The second phase began at 1818 at the S1 crater; it lasted seven seconds and material was ejected 150 m above the crater. Another event 20 seconds later lasted 12 seconds, also ejecting material 150 m above the crater. The sequence ended with at least three explosions of mostly fine material from the S1 crater. The total duration of this sequence was about two minutes.
Short, intense spattering activity was noted above the N1 crater on 27 and 28 February. A lava overflow was first reported at 0657 from the N2 crater on 27 February that flowed into the October 2022 drainage. By 1900 the flow had stopped. A second lava overflow also in the N crater area occurred at 2149, which overlapped the first flow and then stopped by 0150 on 28 February. Material detached from both the lava overflows rolled down the Sciara del Fuoco, some of which was visible in webcam images.
Activity during March-April 2023. Strombolian activity continued with spattering activity and lava overflows in the N crater area during March. Explosive activity at the N crater area varied from low (less than 80 m high) to medium (less than 150 m high) and ejected coarse material, such as bombs and lapilli. Spattering was observed above the N1 crater, while explosive activity at the CS crater area varied from medium to high (greater than 150 m high) and ejected coarse material. Intense spattering activity was observed for short periods on 6 March above the N1 crater. At approximately 0610 a lava overflow was reported around the N2 crater on 8 March, which then flowed into the October 2022 drainage. By 1700 the flow started to cool. A second overflow began at 1712 on 9 March and overlapped the previous flow. It had stopped by 2100. Material from both flows was deposited along the Sciara del Fuoco, though much of the activity was not visible in webcam images. On 11 March a lava overflow was observed at 0215 that overlapped the two previous flows in the October 2022 drainage. By late afternoon on 12 March, it had stopped.
During a field excursion on 16 March, scientists noted that a vent in the central crater area was degassing. Another vent showed occasional Strombolian activity that emitted ash and lapilli. During 1200-1430 low-to-medium intense activity was reported; the N1 crater emitted ash emissions and the N2 crater emitted both ash and coarse material. Some explosions also occurred in the CS crater area that ejected coarse material. The C crater in the CS crater area occasionally showed gas jetting and low intensity explosions on 17 and 22 March; no activity was observed at the S1 crater. Intense, longer periods of spattering were reported in the N1 crater on 19, 24, and 25 March. Around 2242 on 23 March a lava overflow began from the N1 crater that, after about an hour, began moving down the October 2022 drainage and flow along the Sciara del Fuoco (figure 258). Between 0200 and 0400 on 26 March the flow rate increased, which generated avalanches of material from collapses at the advancing flow front. By early afternoon, the flow began to cool. On 25 March at 1548 an explosive sequence began from one of the vents at S2 in the CS crater area (figure 258). Fine ash mixed with coarse material was ejected 300 m above the crater rim and drifted SSE. Some modest explosions around Vent C were detected at 1549 on 25 March, which included an explosion at 1551 that ejected coarse material. The entire explosive sequence lasted approximately three minutes.
During April explosions persisted in both the N and CS crater areas. Fine material was ejected less than 80 m above the N crater rim until 6 April, followed by ejection of coarser material. Fine material was also ejected less than 80 m above the CS crater rim. The C and S2 crater did not show significant eruptive activity. On 7 April an explosive sequence was detected in the CS crater area at 1203 (figure 259). The first explosion lasted approximately 18 seconds and ejected material 400 m above the crater rim, depositing pyroclastic material in the upper part of the Sciara del Fuoco. At 1204 a second, less intense explosion lasted approximately four seconds and deposited pyroclastic products outside the crater area and near Pizzo Sopra La Fossa. A third explosion at 1205 was mainly composed of ash that rose about 150 m above the crater and lasted roughly 20 seconds. A fourth explosion occurred at 1205 about 28 seconds after the third explosion and ejected a mixture of coarse and fine material about 200 m above the crater; the explosion lasted roughly seven seconds. Overall, the entire explosive sequence lasted about two minutes and 20 seconds. After the explosive sequence on 7 April, explosions in both the N and CS crater areas ejected material as high as 150 m above the crater.
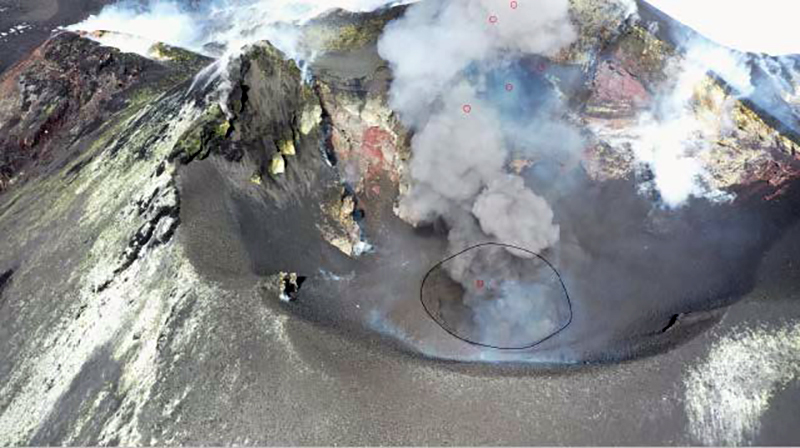
On 21 April research scientists from INGV made field observations in the summit area of Stromboli, and some lapilli samples were collected. In the N crater area near the N1 crater, a small cone was observed with at least two active vents, one of which was characterized by Strombolian explosions. The other vent produced explosions that ejected ash and chunks of cooled lava. At the N2 crater at least one vent was active and frequently emitted ash. In the CS crater area, a small cone contained 2-3 degassing vents and a smaller, possible fissure area also showed signs of degassing close to the Pizzo Sopra La Fossa. In the S part of the crater, three vents were active: a small hornito was characterized by modest and rare explosions, a vent that intermittently produced weak Strombolian explosions, and a vent at the end of the terrace that produced frequent ash emissions. Near the S1 crater there was a hornito that generally emitted weak gas-and-steam emissions, sometimes associated with “gas rings”. On 22 April another field inspection was carried out that reported two large sliding surfaces on the Sciara del Fuoco that showed where blocks frequently descended toward the sea. A thermal anomaly was detected at 0150 on 29 April.
Geologic Background. Spectacular incandescent nighttime explosions at Stromboli have long attracted visitors to the "Lighthouse of the Mediterranean" in the NE Aeolian Islands. This volcano has lent its name to the frequent mild explosive activity that has characterized its eruptions throughout much of historical time. The small island is the emergent summit of a volcano that grew in two main eruptive cycles, the last of which formed the western portion of the island. The Neostromboli eruptive period took place between about 13,000 and 5,000 years ago. The active summit vents are located at the head of the Sciara del Fuoco, a prominent scarp that formed about 5,000 years ago due to a series of slope failures which extends to below sea level. The modern volcano has been constructed within this scarp, which funnels pyroclastic ejecta and lava flows to the NW. Essentially continuous mild Strombolian explosions, sometimes accompanied by lava flows, have been recorded for more than a millennium.
Information Contacts: Istituto Nazionale di Geofisica e Vulcanologia (INGV), Sezione di Catania, Piazza Roma 2, 95123 Catania, Italy, (URL: http://www.ct.ingv.it/en/); MIROVA (Middle InfraRed Observation of Volcanic Activity), a collaborative project between the Universities of Turin and Florence (Italy) supported by the Centre for Volcanic Risk of the Italian Civil Protection Department (URL: http://www.mirovaweb.it/); Hawai'i Institute of Geophysics and Planetology (HIGP) - MODVOLC Thermal Alerts System, School of Ocean and Earth Science and Technology (SOEST), Univ. of Hawai'i, 2525 Correa Road, Honolulu, HI 96822, USA (URL: http://modis.higp.hawaii.edu/); Copernicus Browser, Copernicus Data Space Ecosystem, European Space Agency (URL: https://dataspace.copernicus.eu/browser/).
Nishinoshima (Japan) — July 2023 Cite this Report
Nishinoshima
Japan
27.247°N, 140.874°E; summit elev. 100 m
All times are local (unless otherwise noted)
Small ash plumes and fumarolic activity during November 2022 through April 2023
Nishinoshima is a small island located about 1,000 km S of Tokyo in the Ogasawara Arc in Japan. The island is the summit of a massive submarine volcano that has prominent peaks to the S, W, and NE. Eruptions date back to 1973; the most recent eruption period began in October 2022 and was characterized by ash plumes and fumarolic activity (BGVN 47:12). This report describes ash plumes and fumarolic activity during November 2022 through April 2023 based on monthly reports from the Japan Meteorological Agency (JMA) monthly reports and satellite data.
The most recent eruptive activity prior to the reporting internal occurred on 12 October 2022, when an ash plume rose 3.5 km above the crater rim. An aerial observation conducted by the Japan Coast Guard (JCG) on 25 November reported that white fumaroles rose approximately 200 m above the central crater of a pyroclastic cone (figure 119), and multiple plumes were observed on the ESE flank of the cone. Discolored water ranging from reddish-brown to brown and yellowish-green were visible around the perimeter of the island (figure 119). No significant activity was reported in December.
During an overflight conducted by JCG on 25 January 2023 intermittent activity and small, blackish-gray plumes rose 900 m above the central part of the crater were observed (figure 120). The fumarolic zone of the E flank and base of the cone had expanded and emissions had intensified. Dark brown discolored water was visible around the perimeter of the island.
No significant activity was reported during February through March. Ash plumes at 1050 and 1420 on 11 April rose 1.9 km above the crater rim and drifted NW and N. These were the first ash plumes observed since 12 October 2022. On 14 April JCG carried out an overflight and reported that no further eruptive activity was visible, although white gas-and-steam plumes were visible from the central crater and rose 900 m high (figure 121). Brownish and yellow-green discolored water surrounded the island.
Intermittent low-to-moderate power thermal anomalies were recorded in the MIROVA graph (Middle InfraRed Observation of Volcanic Activity) during November 2022 through April 2023 (figure 123). A cluster of six to eight anomalies were detected during November while a smaller number were detected during the following months: two to three during December, one during mid-January 2023, one during February, five during March, and two during April. Thermal activity was also reflected in infrared satellite data at the summit crater, accompanied by occasional gas-and-steam plumes (figure 124).
Geologic Background. The small island of Nishinoshima was enlarged when several new islands coalesced during an eruption in 1973-74. Multiple eruptions that began in 2013 completely covered the previous exposed surface and continued to enlarge the island. The island is the summit of a massive submarine volcano that has prominent peaks to the S, W, and NE. The summit of the southern cone rises to within 214 m of the ocean surface 9 km SSE.
Information Contacts: Japan Meteorological Agency (JMA), 1-3-4 Otemachi, Chiyoda-ku, Tokyo 100-8122, Japan (URL: http://www.jma.go.jp/jma/indexe.html); MIROVA (Middle InfraRed Observation of Volcanic Activity), a collaborative project between the Universities of Turin and Florence (Italy) supported by the Centre for Volcanic Risk of the Italian Civil Protection Department (URL: http://www.mirovaweb.it/); Copernicus Browser, Copernicus Data Space Ecosystem, European Space Agency (URL: https://dataspace.copernicus.eu/browser/).
Karangetang (Indonesia) — July 2023 Cite this Report
Karangetang
Indonesia
2.781°N, 125.407°E; summit elev. 1797 m
All times are local (unless otherwise noted)
Lava flows, incandescent avalanches, and ash plumes during January-June 2023
Karangetang (also known as Api Siau), at the northern end of the island of Siau, Indonesia, contains five summit craters along a N-S line. More than 40 eruptions have been recorded since 1675; recent eruptions have included frequent explosive activity, sometimes accompanied by pyroclastic flows and lahars. Lava dome growth has occurred in the summit craters and collapses of lava flow fronts have produced pyroclastic flows. The two active summit craters are Kawah Dua (the N crater) and Kawah Utama (the S crater, also referred to as the “Main Crater”). The most recent eruption began in late November 2018 and has more recently consisted of weak thermal activity and gas-and-steam emissions (BGVN 48:01). This report updates activity characterized by lava flows, incandescent avalanches, and ash plumes during January through June 2023 using reports from Pusat Vulkanologi dan Mitigasi Bencana Geologi (PVMBG, also known as CVGHM, or the Center of Volcanology and Geological Hazard Mitigation), MAGMA Indonesia, the Darwin VAAC (Volcano Ash Advisory Center), and satellite data.
Activity during January was relatively low and mainly consisted of white gas-and-steam emissions that rose 25-150 m above Main Crater (S crater) and drifted in different directions. Incandescence was visible from the lava dome in Kawah Dua (the N crater). Weather conditions often prevented clear views of the summit. On 18 January the number of seismic signals that indicated avalanches of material began to increase. In addition, there were a total of 71 earthquakes detected during the month.
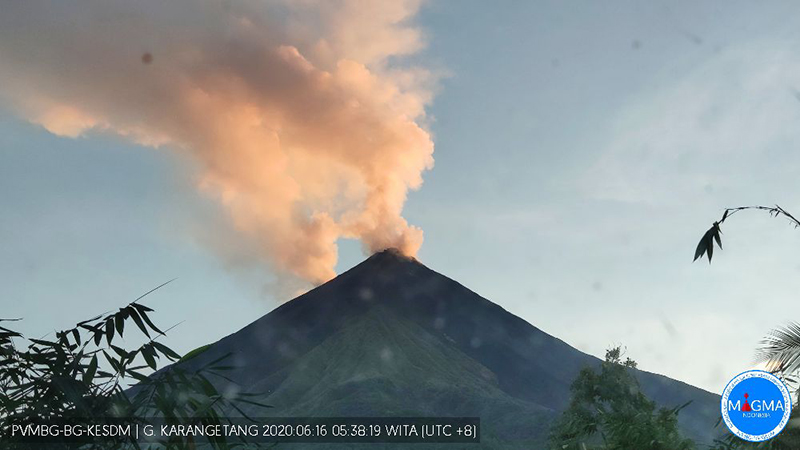
Activity continued to increase during the first week of February. Material from Main Crater traveled as far as 800 m down the Batuawang (S) and Batang (W) drainages and as far as 1 km W down the Beha (W) drainage on 4 February. On 6 February 43 earthquake events were recorded, and on 7 February, 62 events were recorded. White gas-and-steam emissions rose 25-250 m above both summit craters throughout the month. PVMBG reported an eruption began during the evening of 8 February around 1700. Photos showed incandescent material at Main Crater. Incandescent material had also descended the flank in at least two unconfirmed directions as far as 2 km from Main Crater, accompanied by ash plumes (figure 60). As a result, PVMBG increased the Volcano Alert Level (VAL) to 3 (the second highest level on a 1-4 scale).
Occasional nighttime webcam images showed three main incandescent lava flows of differing lengths traveling down the S, SW, and W flanks (figure 61). Incandescent rocks were visible on the upper flanks, possibly from ejected or collapsed material from the crater, and incandescence was the most intense at the summit. Based on analyses of satellite imagery and weather models, the Darwin VAAC reported that daily ash plumes during 16-20 February rose to 2.1-3 km altitude and drifted NNE, E, and SE. BNPB reported on 16 February that as many as 77 people were evacuated and relocated to the East Siau Museum. A webcam image taken at 2156 on 17 February possibly showed incandescent material descending the SE flank. Ash plumes rose to 2.1 km altitude and drifted SE during 22-23 February, according to the Darwin VAAC.
Incandescent avalanches of material and summit incandescence at Main Crater continued during March. White gas-and-steam emissions during March generally rose 25-150 m above the summit crater; on 31 March gas-and-steam emissions rose 200-400 m high. An ash plume rose to 2.4 km altitude and drifted S at 1710 on 9 March and a large thermal anomaly was visible in images taken at 0550 and 0930 on 10 March. Incandescent material was visible at the summit and on the flanks based on webcam images taken at 0007 and 2345 on 16 March, at 1828 on 17 March, at 1940 on 18 March, at 2311 on 19 March, and at 2351 on 20 March. Incandescence was most intense on 18 and 20 March and webcam images showed possible Strombolian explosions (figure 62). An ash plume rose to 2.4 km altitude and drifted SW on 18 March, accompanied by a thermal anomaly.
Summit crater incandescence at Main Crater and on the flanks persisted during April. Incandescent material at the S crater and on the flanks was reported at 0016 on 1 April. The lava flows had stopped by 1 April according to PVMBG, although incandescence was still visible up to 10 m high. Seismic signals indicating effusion decreased and by 6 April they were no longer detected. Incandescence was visible from both summit craters. On 26 April the VAL was lowered to 2 (the second lowest level on a 1-4 scale). White gas-and-steam emissions rose 25-200 m above the summit crater.
During May white gas-and-steam emissions generally rose 50-250 m above the summit, though it was often cloudy, which prevented clear views; on 21 May gas-and-steam emissions rose 50-400 m high. Nighttime N summit crater incandescence rose 10-25 m above the lava dome, and less intense incandescence was noted above Main Crater, which reached about 10 m above the dome. Sounds of falling rocks at Main Crater were heard on 15 May and the seismic network recorded 32 rockfall events in the crater on 17 May. Avalanches traveled as far as 1.5 km down the SW and S flanks, accompanied by rumbling sounds on 18 May. Incandescent material descending the flanks was captured in a webcam image at 2025 on 19 May (figure 63) and on 29 May; summit crater incandescence was observed in webcam images at 2332 on 26 May and at 2304 on 29 May. On 19 May the VAL was again raised to 3.
Occasional Main Crater incandescence was reported during June, as well as incandescent material on the flanks. White gas-and-steam emissions rose 10-200 m above the summit crater. Ash plumes rose to 2.1 km altitude and drifted SE and E during 2-4 June, according to the Darwin VAAC. Material on the flanks of Main Crater were observed at 2225 on 7 June, at 2051 on 9 June, at 0007 on 17 June, and at 0440 on 18 June. Webcam images taken on 21, 25, and 27 June showed incandescence at Main Crater and from material on the flanks.
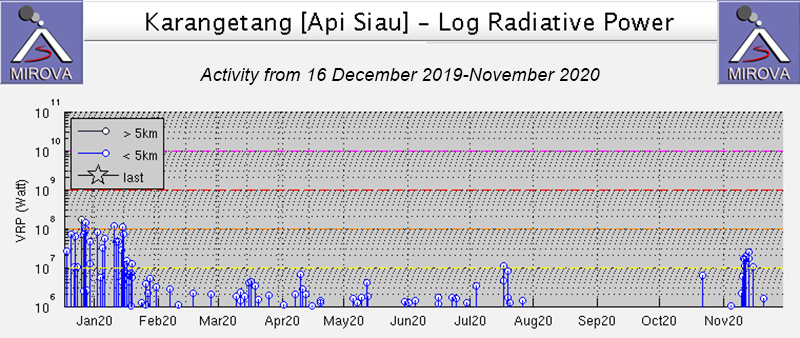
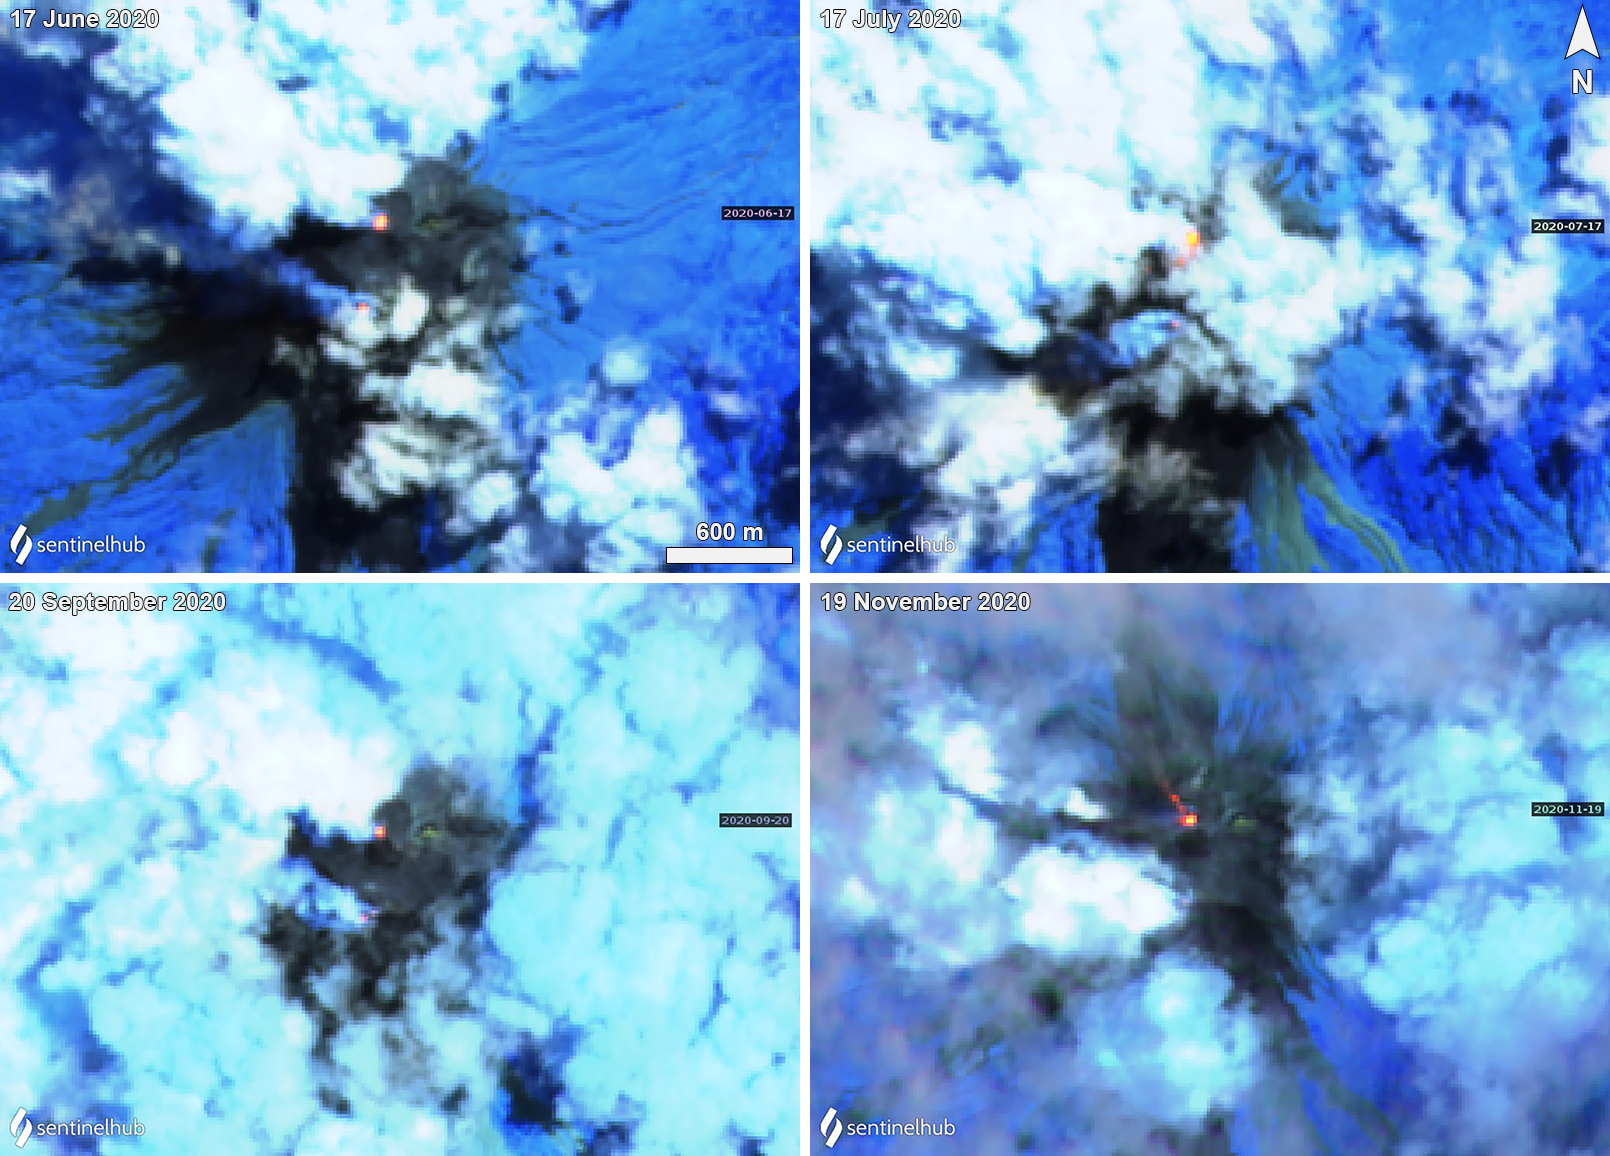
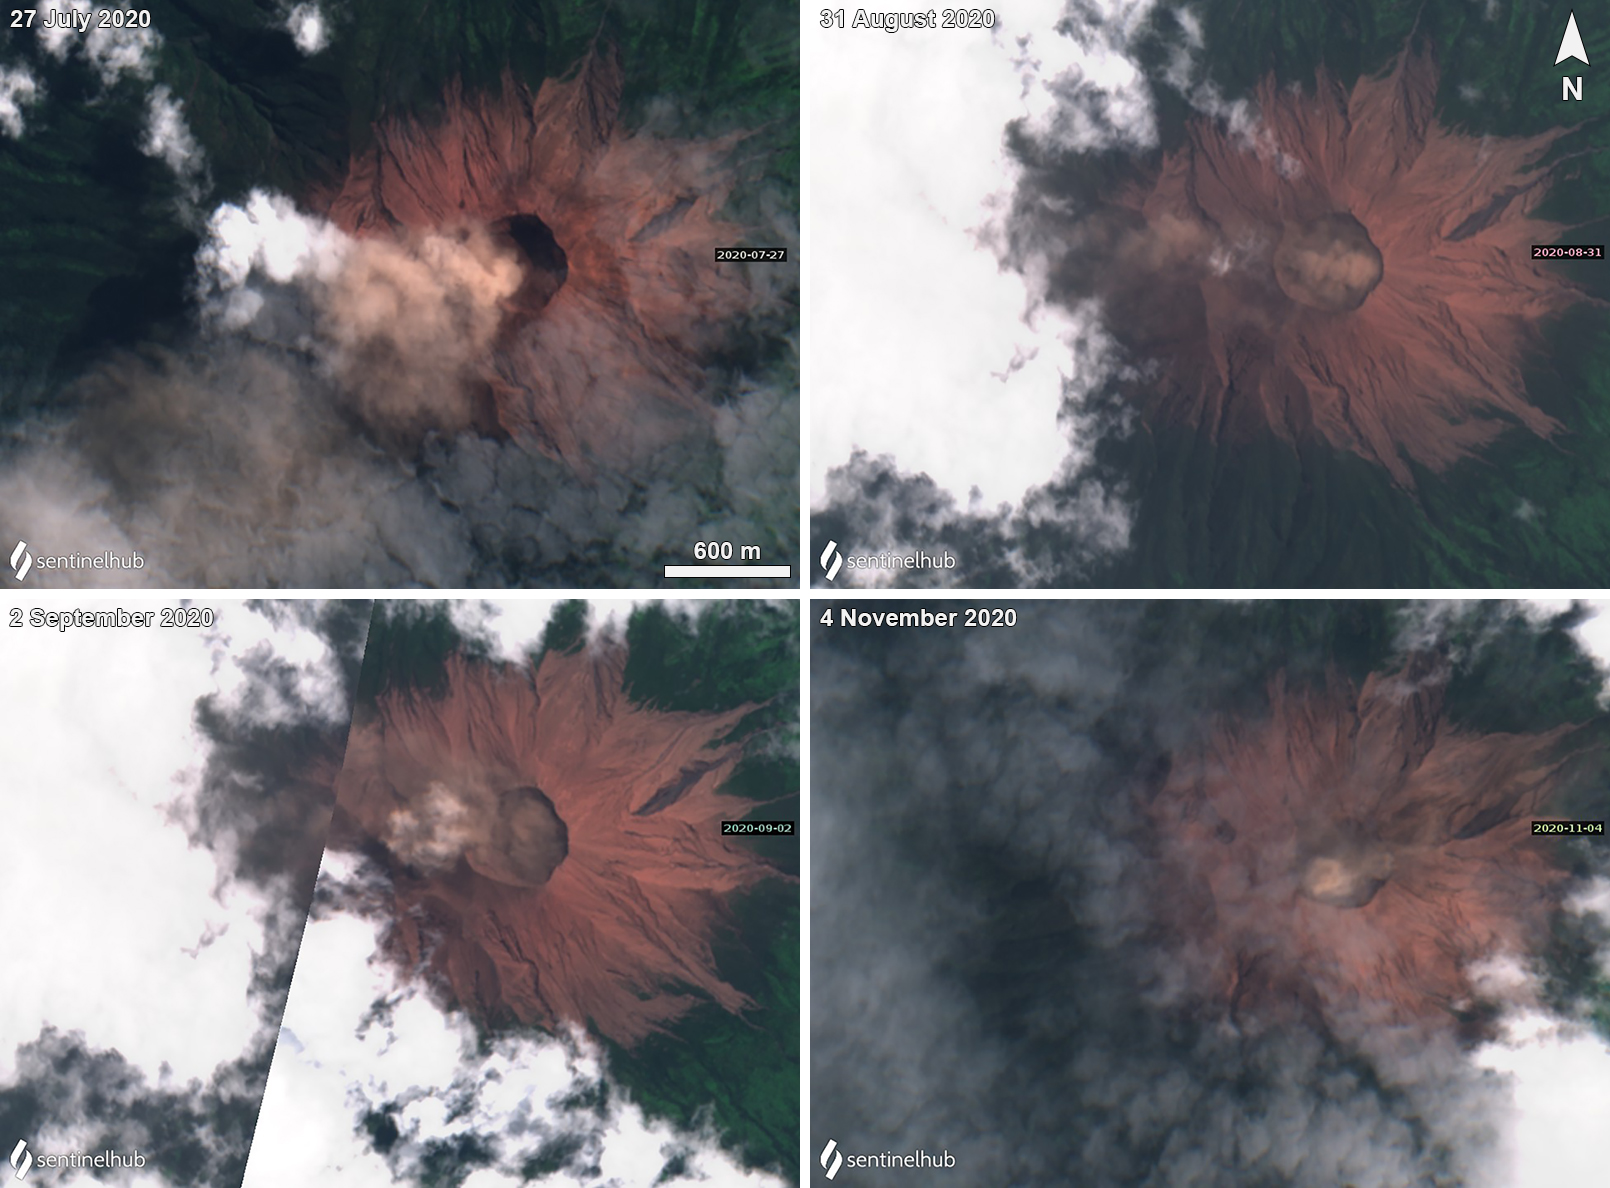
MIROVA (Middle InfraRed Observation of Volcanic Activity) analysis of MODIS satellite data showed strong thermal activity during mid-February through March and mid-May through June, which represented incandescent avalanches and lava flows (figure 64). During April through mid-May the power of the anomalies decreased but frequent anomalies were still detected. Brief gaps in activity occurred during late March through early April and during mid-June. Infrared satellite images showed strong lava flows mainly affecting the SW and S flanks, accompanied by gas-and-steam emissions (figure 65). According to data recorded by the MODVOLC thermal algorithm, there were a total of 79 thermal hotspots detected: 28 during February, 24 during March, one during April, five during May, and 21 during June.
Geologic Background. Karangetang (Api Siau) volcano lies at the northern end of the island of Siau, about 125 km NNE of the NE-most point of Sulawesi. The stratovolcano contains five summit craters along a N-S line. It is one of Indonesia's most active volcanoes, with more than 40 eruptions recorded since 1675 and many additional small eruptions that were not documented (Neumann van Padang, 1951). Twentieth-century eruptions have included frequent explosive activity sometimes accompanied by pyroclastic flows and lahars. Lava dome growth has occurred in the summit craters; collapse of lava flow fronts have produced pyroclastic flows.
Information Contacts: Pusat Vulkanologi dan Mitigasi Bencana Geologi (PVMBG, also known as Indonesian Center for Volcanology and Geological Hazard Mitigation, CVGHM), Jalan Diponegoro 57, Bandung 40122, Indonesia (URL: http://www.vsi.esdm.go.id/); MAGMA Indonesia, Kementerian Energi dan Sumber Daya Mineral (URL: https://magma.esdm.go.id/v1); Badan Nasional Penanggulangan Bencana (BNPB), National Disaster Management Agency, Graha BNPB - Jl. Scout Kav.38, East Jakarta 13120, Indonesia (URL: http://www.bnpb.go.id/); Darwin Volcanic Ash Advisory Centre (VAAC), Bureau of Meteorology, Northern Territory Regional Office, PO Box 40050, Casuarina, NT 0811, Australia (URL: http://www.bom.gov.au/info/vaac/); MIROVA (Middle InfraRed Observation of Volcanic Activity), a collaborative project between the Universities of Turin and Florence (Italy) supported by the Centre for Volcanic Risk of the Italian Civil Protection Department (URL: http://www.mirovaweb.it/); Hawai'i Institute of Geophysics and Planetology (HIGP) - MODVOLC Thermal Alerts System, School of Ocean and Earth Science and Technology (SOEST), Univ. of Hawai'i, 2525 Correa Road, Honolulu, HI 96822, USA (URL: http://modis.higp.hawaii.edu/); Copernicus Browser, Copernicus Data Space Ecosystem, European Space Agency (URL: https://dataspace.copernicus.eu/browser/); IDN Times, Jl. Jend. Gatot Subroto Kav. 27 3rd Floor Kuningan, Jakarta, Indonesia 12950, Status of Karangetang Volcano in Sitaro Islands Increases (URL: https://sulsel.idntimes.com/news/indonesia/savi/status-gunung-api-karangetang-di-kepulauan-sitaro-meningkat?page=all).
Ahyi (United States) — July 2023 Cite this Report
Ahyi
United States
20.42°N, 145.03°E; summit elev. -75 m
All times are local (unless otherwise noted)
Intermittent hydroacoustic signals and discolored plumes during November 2022-June 2023
Ahyi seamount is a large, conical submarine volcano that rises to within 75 m of the ocean surface about 18 km SE of the island of Farallon de Pajaros in the Northern Marianas. The remote location of the seamount has made eruptions difficult to document, but seismic stations installed in the region confirmed an eruption in the vicinity in 2001. No new activity was detected until April-May 2014 when an eruption was detected by NOAA (National Oceanic and Atmospheric Administration) divers, hydroacoustic sensors, and seismic stations (BGVN 42:04). New activity was first detected on 15 November by hydroacoustic sensors that were consistent with submarine volcanic activity. This report covers activity during November 2022 through June 2023 based on daily and weekly reports from the US Geological Survey.
Starting in mid-October, hydroacoustic sensors at Wake Island (2.2 km E) recorded signals consistent with submarine volcanic activity, according to a report from the USGS issued on 15 November 2022. A combined analysis of the hydroacoustic signals and seismic stations located at Guam and Chichijima Island, Japan, suggested that the source of this activity was at or near the Ahyi seamount. After a re-analysis of a satellite image of the area that was captured on 6 November, USGS confirmed that there was no evidence of discoloration at the ocean surface. Few hydroacoustic and seismic signals continued through November, including on 18 November, which USGS suggested signified a decline or pause in unrest. A VONA (Volcano Observatory Notice for Aviation) reported that a discolored water plume was persistently visible in satellite data starting on 18 November (figure 6). Though clouds often obscured clear views of the volcano, another discolored water plume was captured in a satellite image on 26 November. The Aviation Color Code (ACC) was raised to Yellow (the second lowest level on a four-color scale) and the Volcano Alert Level (VAL) was raised to Advisory (the second lowest level on a four-level scale) on 29 November.
During December, occasional detections were recorded on the Wake Island hydrophone sensors and discolored water over the seamount remained visible. During 2-7, 10-12, and 16-31 December possible explosion signals were detected. A small area of discolored water was observed in high-resolution Sentinel-2 satellite images during 1-6 December (figure 7). High-resolution satellite images recorded discolored water plumes on 13 December that originated from the summit region; no observations indicated that activity breached the ocean surface. A possible underwater plume was visible in satellite images on 18 December, and during 19-20 December a definite but diffuse underwater plume located SSE from the main vent was reported. An underwater plume was visible in a satellite image taken on 26 December (figure 7).
Hydrophone sensors continued to detect signals consistent with possible explosions during 1-8 January 2023. USGS reported that the number of detections decreased during 4-5 January. The hydrophone sensors experienced a data outage that started at 0118 on 8 January and continued through 10 January, though according to USGS, possible explosions were recorded prior to the data outage and likely continued during the outage. A discolored water plume originating from the summit region was detected in a partly cloudy satellite image on 8 January. On 11-12 and 15-17 January possible explosion signals were recorded again. One small signal was detected during 22-23 January and several signals were recorded on 25 and 31 January. During 27-31 January a plume of discolored water was observed above the seamount in satellite imagery (figure 8).
Low levels of activity continued during February and March, based on data from pressure sensors on Wake Island. During 1 and 4-6 February activity was reported, and a submarine plume was observed on 4 February (figure 8). Possible explosion signals were detected during 7-8, 10, 13-14, and 24 February. During 1-2 and 3-5 March a plume of discolored water was observed in satellite imagery (figure 8). Almost continuous hydroacoustic signals were detected in remote pressure sensor data on Wake Island 2,270 km E from the volcano during 7-13 March. During 12-13 March water discoloration around the seamount was observed in satellite imagery, despite cloudy weather. By 14 March discolored water extended about 35 km, but no direction was noted. USGS reported that the continuous hydroacoustic signals detected during 13-14 March stopped abruptly on 14 March and no new detections were observed. Three 30 second hydroacoustic detections were reported during 17-19 March, but no activity was visible due to cloudy weather. A data outage was reported during 21-22 March, making pressure sensor data unavailable; a discolored water plume was, however, visible in satellite data. A possible underwater explosion signal was detected by pressure sensors at Wake Island on 26, 29, and 31 March, though the cause and origin of these events were unclear.
Similar low activity continued during April, May, and June. Several signals were detected during 1-3 April in pressure sensors at Wake Island. USGS suggested that these may be related to underwater explosions or earthquakes at the volcano, but no underwater plumes were visible in clear satellite images. The pressure sensors had data outages during 12-13 April and no data were recorded; no underwater plumes were visible in satellite images, although cloudy weather obscured most clear views. Eruptive activity was reported starting at 2210 on 21 May. On 22 May a discolored water plume that extended 4 km was visible in satellite images, though no direction was recorded. During 23-24 May some signals were detected by the underwater pressure sensors. Possible hydroacoustic signals were detected during 2-3 and 6-8 June. Multiple hydroacoustic signals were detected during 9-11 and 16-17 June, although no activity was visible in satellite images. One hydroacoustic signal was detected during 23-24 June, but there was some uncertainty about its association with volcanic activity. A single possible hydroacoustic signal was detected during 30 June to 1 July.
Geologic Background. Ahyi seamount is a large conical submarine volcano that rises to within 75 m of the ocean surface ~18 km SE of the island of Farallon de Pajaros in the northern Marianas. Water discoloration has been observed there, and in 1979 the crew of a fishing boat felt shocks over the summit area, followed by upwelling of sulfur-bearing water. On 24-25 April 2001 an explosive eruption was detected seismically by a station on Rangiroa Atoll, Tuamotu Archipelago. The event was well constrained (+/- 15 km) at a location near the southern base of Ahyi. An eruption in April-May 2014 was detected by NOAA divers, hydroacoustic sensors, and seismic stations.
Information Contacts: US Geological Survey, Volcano Hazards Program (USGS-VHP), 12201 Sunrise Valley Drive, Reston, VA, USA, https://volcanoes.usgs.gov/index.html; Copernicus Browser, Copernicus Data Space Ecosystem, European Space Agency (URL: https://dataspace.copernicus.eu/browser/).
Kadovar (Papua New Guinea) — June 2023 Cite this Report
Kadovar
Papua New Guinea
3.608°S, 144.588°E; summit elev. 365 m
All times are local (unless otherwise noted)
An ash plume and weak thermal anomaly during May 2023
Kadovar is a 2-km-wide island that is the emergent summit of a Bismarck Sea stratovolcano. It lies off the coast of New Guinea, about 25 km N of the mouth of the Sepik River. Prior to an eruption that began in 2018, a lava dome formed the high point of the volcano, filling an arcuate landslide scarp open to the S. Submarine debris-avalanche deposits occur to the S of the island. The current eruption began in January 2018 and has comprised lava effusion from vents at the summit and at the E coast; more recent activity has consisted of ash plumes, weak thermal activity, and gas-and-steam plumes (BGVN 48:02). This report covers activity during February through May 2023 using information from the Darwin Volcanic Ash Advisory Center (VAAC) and satellite data.
Activity during the reporting period was relatively low and mainly consisted of white gas-and-steam plumes that were visible in natural color satellite images on clear weather days (figure 67). According to a Darwin VAAC report, at 2040 on 6 May an ash plume rose to 4.6 km altitude and drifted W; by 2300 the plume had dissipated. MODIS satellite instruments using the MODVOLC thermal algorithm detected a single thermal hotspot on the SE side of the island on 7 May. Weak thermal activity was also detected in a satellite image on the E side of the island on 14 May, accompanied by a white gas-and-steam plume that drifted SE (figure 68).
Geologic Background. The 2-km-wide island of Kadovar is the emergent summit of a Bismarck Sea stratovolcano of Holocene age. It is part of the Schouten Islands, and lies off the coast of New Guinea, about 25 km N of the mouth of the Sepik River. Prior to an eruption that began in 2018, a lava dome formed the high point of the andesitic volcano, filling an arcuate landslide scarp open to the south; submarine debris-avalanche deposits occur in that direction. Thick lava flows with columnar jointing forms low cliffs along the coast. The youthful island lacks fringing or offshore reefs. A period of heightened thermal phenomena took place in 1976. An eruption began in January 2018 that included lava effusion from vents at the summit and at the E coast.
Information Contacts: Darwin Volcanic Ash Advisory Centre (VAAC), Bureau of Meteorology, Northern Territory Regional Office, PO Box 40050, Casuarina, NT 0811, Australia (URL: http://www.bom.gov.au/info/vaac/); Hawai'i Institute of Geophysics and Planetology (HIGP) - MODVOLC Thermal Alerts System, School of Ocean and Earth Science and Technology (SOEST), Univ. of Hawai'i, 2525 Correa Road, Honolulu, HI 96822, USA (URL: http://modis.higp.hawaii.edu/); Copernicus Browser, Copernicus Data Space Ecosystem, European Space Agency (URL: https://dataspace.copernicus.eu/browser/).
San Miguel (El Salvador) — June 2023 Cite this Report
San Miguel
El Salvador
13.434°N, 88.269°W; summit elev. 2130 m
All times are local (unless otherwise noted)
Small gas-and-ash explosions during March and May 2023
San Miguel in El Salvador is a broad, deep crater complex that has been frequently modified by eruptions recorded since the early 16th century and consists of the summit known locally as Chaparrastique. Flank eruptions have produced lava flows that extended to the N, NE, and SE during the 17-19th centuries. The most recent activity has consisted of minor ash eruptions from the summit crater. The current eruption period began in November 2022 and has been characterized by frequent phreatic explosions, gas-and-ash emissions, and sulfur dioxide plumes (BGVN 47:12). This report describes small gas-and-ash explosions during December 2022 through May 2023 based on special reports from the Ministero de Medio Ambiente y Recursos Naturales (MARN).
Activity has been relatively low since the last recorded explosions on 29 November 2022. Seismicity recorded by the San Miguel Volcano Station (VSM) located on the N flank at 1.7 km elevation had decreased by 7 December. Sulfur dioxide gas measurements taken with DOAS (Differential Optical Absorption Spectroscopy) mobile equipment were below typical previously recorded values: 300 tons per day (t/d). During December, small explosions were recorded by the seismic network and manifested as gas-and-steam emissions.
Gas-and-ash explosions in the crater occurred during January 2023, which were recorded by the seismic network. Sulfur dioxide values remained low, between 300-400 t/d through 10 March. At 0817 on 14 January a gas-and-ash emission was visible in webcam images, rising just above the crater rim. Some mornings during February, small gas-and-steam plumes were visible in the crater. On 7 March at 2252 MARN noted an increase in degassing from the central crater; gas emissions were constantly observed through the early morning hours on 8 March. During the early morning of 8 March through the afternoon on 9 March, 12 emissions were registered, some accompanied by ash. The last gas-and-ash emission was recorded at 1210 on 9 March; very fine ashfall was reported in El Tránsito (10 km S), La Morita (6 km W), and La Piedrita (3 km W). The smell of sulfur was reported in Piedra Azul (5 km SW). On 16 March MARN reported that gas-and-steam emissions decreased.
Low degassing and very low seismicity were reported during April; no explosions have been detected between 9 March and 27 May. The sulfur dioxide emissions remained between 350-400 t/d; during 13-20 April sulfur dioxide values fluctuated between 30-300 t/d. Activity remained low through most of May; on 23 May seismicity increased. An explosion was detected at 1647 on 27 May generated a gas-and-ash plume that rose 700 m high (figure 32); a decrease in seismicity and gas emissions followed. The DOAS station installed on the W flank recorded sulfur dioxide values that reached 400 t/d on 27 May; subsequent measurements showed a decrease to 268 t/d on 28 May and 100 t/d on 29 May.
Geologic Background. The symmetrical cone of San Miguel, one of the most active volcanoes in El Salvador, rises from near sea level to form one of the country's most prominent landmarks. A broad, deep, crater complex that has been frequently modified by eruptions recorded since the early 16th century caps the truncated unvegetated summit, also known locally as Chaparrastique. Flanks eruptions of the basaltic-andesitic volcano have produced many lava flows, including several during the 17th-19th centuries that extended to the N, NE, and SE. The SE-flank flows are the largest and form broad, sparsely vegetated lava fields crossed by highways and a railroad skirting the base of the volcano. Flank vent locations have migrated higher on the edifice during historical time, and the most recent activity has consisted of minor ash eruptions from the summit crater.
Information Contacts: Ministero de Medio Ambiente y Recursos Naturales (MARN), Km. 5½ Carretera a Nueva San Salvador, Avenida las Mercedes, San Salvador, El Salvador (URL: http://www.snet.gob.sv/ver/vulcanologia).
Ebeko
Russia
50.686°N, 156.014°E; summit elev. 1103 m
All times are local (unless otherwise noted)
Continued explosions, ash plumes, and ashfall during October 2022-May 2023
Ebeko, located on the N end of Paramushir Island in the Kuril Islands, consists of three summit craters along a SSW-NNE line at the northern end of a complex of five volcanic cones. Eruptions date back to the late 18th century and have been characterized as small-to-moderate explosions from the summit crater, accompanied by intense fumarolic activity. The current eruption period began in June 2022 and has recently consisted of frequent explosions, ash plumes, and thermal activity (BGVN 47:10). This report covers similar activity during October 2022 through May 2023, based on information from the Kamchatka Volcanic Eruptions Response Team (KVERT) and satellite data.
Activity during October consisted of explosive activity, ash plumes, and occasional thermal anomalies. Visual data by volcanologists from Severo-Kurilsk showed explosions producing ash clouds up to 2.1-3 km altitude which drifted E, N, NE, and SE during 1-8, 10, 16, and 18 October. KVERT issued several Volcano Observatory Notices for Aviation (VONA) on 7, 13-15, and 27 October 2022, stating that explosions generated ash plumes that rose to 2.3-4 km altitude and drifted 5 km E, NE, and SE. Ashfall was reported in Severo-Kurilsk (Paramushir Island, about 7 km E) on 7 and 13 October. Satellite data showed a thermal anomaly over the volcano on 15-16 October. Visual data showed ash plumes rising to 2.5-3.6 km altitude on 22, 25-29, and 31 October and moving NE due to constant explosions.
Similar activity continued during November, with explosions, ash plumes, and ashfall occurring. KVERT issued VONAs on 1-2, 4, 6-7, 9, 13, and 16 November that reported explosions and resulting ash plumes that rose to 1.7-3.6 km altitude and drifted 3-5 km SE, ESE, E, and NE. On 1 November ash plumes extended as far as 110 km SE. On 5, 8, 12, and 24-25 November explosions and ash plumes rose to 2-3.1 km altitude and drifted N and E. Ashfall was observed in Severo-Kurilsk on 7 and 16 November. A thermal anomaly was visible during 1-4, 16, and 20 November. Explosions during 26 November rose as high as 2.7 km altitude and drifted NE (figure 45).
Explosions and ash plumes continued to occur in December. During 1-2 and 4 December volcanologists from Severo-Kurilsk observed explosions that sent ash to 1.9-2.5 km altitude and drifted NE and SE (figure 46). VONAs were issued on 5, 9, and 16 December reporting that explosions generated ash plumes rising to 1.9 km, 2.6 km, and 2.4 km altitude and drifted 5 km SE, E, and NE, respectively. A thermal anomaly was visible in satellite imagery on 16 December. On 18 and 27-28 December explosions produced ash plumes that rose to 2.5 km altitude and drifted NE and SE. On 31 December an ash plume rose to 2 km altitude and drifted NE.
Explosions continued during January 2023, based on visual observations by volcanologists from Severo-Kurilsk. During 1-7 January explosions generated ash plumes that rose to 4 km altitude and drifted NE, E, W, and SE. According to VONAs issued by KVERT on 2, 4, 10, and 23 January, explosions produced ash plumes that rose to 2-4 km altitude and drifted 5 km N, NE, E, and ENE; the ash plume that rose to 4 km altitude occurred on 10 January (figure 47). Satellite data showed a thermal anomaly during 3-4, 10, 13, 16, 21, 22, and 31 January. KVERT reported that an ash cloud on 4 January moved 12 km NE. On 6 and 9-11 January explosions sent ash plumes to 4.5 km altitude and drifted W and ESE. On 13 January an ash plume rose to 3 km altitude and drifted SE. During 20-24 January ash plumes from explosions rose to 3.7 km altitude and drifted SE, N, and NE. On 21 January the ash plume drifted as far as 40 km NE. During 28-29 and 31 January and 1 February ash plumes rose to 4 km altitude and drifted NE.
During February, explosions, ash plumes, and ashfall were reported. During 1, 4-5 and 7-8 February explosions generated ash plumes that rose to 4.5 km altitude and drifted E and NE; ashfall was observed on 5 and 8 February. On 6 February an explosion produced an ash plume that rose to 3 km altitude and drifted 7 km E, causing ashfall in Severo-Kurilsk. A thermal anomaly was visible in satellite data on 8, 9, 13, and 21 February. Explosions on 9 and 12-13 February produced ash plumes that rose to 4 km altitude and drifted E and NE; the ash cloud on 12 February extended as far as 45 km E. On 22 February explosions sent ash to 3 km altitude that drifted E. During 24 and 26-27 February ash plumes rose to 4 km altitude and drifted E. On 28 February an explosion sent ash to 2.5-3 km altitude and drifted 5 km E; ashfall was observed in Severo-Kurilsk.
Activity continued during March; visual observations showed that explosions generated ash plumes that rose to 3.6 km altitude on 3, 5-7, and 9-12 March and drifted E, NE, and NW. Thermal anomalies were visible on 10, 13, and 29-30 March in satellite imagery. On 18, 21-23, 26, and 29-30 March explosions produced ash plumes that rose to 2.8 km altitude and drifted NE and E; the ash plumes during 22-23 March extended up to 76 km E. A VONA issued on 21 March reported an explosion that produced an ash plume that rose to 2.8 km altitude and drifted 5 km E. Another VONA issued on 23 March reported that satellite data showed an ash plume rising to 3 km altitude and drifted 14 km E.
Explosions during April continued to generate ash plumes. On 1 and 4 April an ash plume rose to 2.8-3.5 km altitude and drifted SE and NE. A thermal anomaly was visible in satellite imagery during 1-6 April. Satellite data showed ash plumes and clouds rising to 2-3 km altitude and drifting up to 12 km SW and E on 3 and 6 April (figure 48). KVERT issued VONAs on 3, 5, 14, 16 April describing explosions that produced ash plumes rising to 3 km, 3.5 km, 3.5 km, and 3 km altitude and drifting 5 km S, 5 km NE and SE, 72 km NNE, and 5 km NE, respectively. According to satellite data, the resulting ash cloud from the explosion on 14 April was 25 x 7 km in size and drifted 72-104 km NNE during 14-15 April. According to visual data by volcanologists from Severo-Kurilsk explosions sent ash up to 3.5 km altitude that drifted NE and E during 15-16, 22, 25-26, and 29 April.
The explosive eruption continued during May. Explosions during 3-4, 6-7, and 9-10 May generated ash plumes that rose to 4 km altitude and drifted SW and E. Satellite data showed a thermal anomaly on 3, 9, 13-14, and 24 May. During 12-16, 23-25, and 27-28 May ash plumes rose to 3.5 km altitude and drifted in different directions due to explosions. Two VONA notices were issued on 16 and 25 May, describing explosions that generated ash plumes rising to 3 km and 3.5 km altitude, respectively and extending 5 km E. The ash cloud on 25 May drifted 75 km SE.
Thermal activity in the summit crater, occasionally accompanied by ash plumes and ash deposits on the SE and E flanks due to frequent explosions, were visible in infrared and true color satellite images (figure 49).
Geologic Background. The flat-topped summit of the central cone of Ebeko volcano, one of the most active in the Kuril Islands, occupies the northern end of Paramushir Island. Three summit craters located along a SSW-NNE line form Ebeko volcano proper, at the northern end of a complex of five volcanic cones. Blocky lava flows extend west from Ebeko and SE from the neighboring Nezametnyi cone. The eastern part of the southern crater contains strong solfataras and a large boiling spring. The central crater is filled by a lake about 20 m deep whose shores are lined with steaming solfataras; the northern crater lies across a narrow, low barrier from the central crater and contains a small, cold crescentic lake. Historical activity, recorded since the late-18th century, has been restricted to small-to-moderate explosive eruptions from the summit craters. Intense fumarolic activity occurs in the summit craters, on the outer flanks of the cone, and in lateral explosion craters.
Information Contacts: Kamchatka Volcanic Eruptions Response Team (KVERT), Far Eastern Branch, Russian Academy of Sciences, 9 Piip Blvd., Petropavlovsk-Kamchatsky, 683006, Russia (URL: http://www.kscnet.ru/ivs/kvert/); MIROVA (Middle InfraRed Observation of Volcanic Activity), a collaborative project between the Universities of Turin and Florence (Italy) supported by the Centre for Volcanic Risk of the Italian Civil Protection Department (URL: http://www.mirovaweb.it/); Copernicus Browser, Copernicus Data Space Ecosystem, European Space Agency (URL: https://dataspace.copernicus.eu/browser/).
Search Bulletin Archive by Publication Date
Select a month and year from the drop-downs and click "Show Issue" to have that issue displayed in this tab.
The default month and year is the latest issue available.
Bulletin of the Global Volcanism Network - Volume 45, Number 12 (December 2020)
Managing Editor: Edward Venzke
Copahue (Chile-Argentina)
New eruption in June-October 2020 with crater incandescence, ash plumes, and local ashfall
Ebeko (Russia)
Continued explosions, ash plumes, and ashfall; June-November 2020
Etna (Italy)
Strombolian explosions and ash plumes persist from multiple craters during August-November 2020
Fuego (Guatemala)
Daily explosions, ash emissions, and block avalanches during August-November 2020
Karangetang (Indonesia)
Hot material on the NW flank in November 2020; intermittent crater thermal anomalies
Kerinci (Indonesia)
Intermittent ash plumes and gas-and-steam emissions during June-November 2020
Masaya (Nicaragua)
Lava lake continues accompanied by gas-and-steam emissions during June-November 2020
Nyamulagira (DR Congo)
Numerous thermal anomalies and gas emissions from the lava lake through November 2020
Nyiragongo (DR Congo)
Strong thermal anomalies and gas emission from lava lake through November 2020
Raung (Indonesia)
Explosions with ash plumes and a thermal anomaly at the summit crater, July-October 2020
Whakaari/White Island (New Zealand)
Gas-and-steam emissions with some re-suspended ash in November 2020
Copahue (Chile-Argentina) — December 2020 Cite this Report
Copahue
Chile-Argentina
37.856°S, 71.183°W; summit elev. 2953 m
All times are local (unless otherwise noted)
New eruption in June-October 2020 with crater incandescence, ash plumes, and local ashfall
Copahue is an elongated composite cone located along the Chile-Argentina border. The E summit crater consists of an acidic 300-m-wide crater lake which is characterized by intense fumarolic activity. Previous activity consisted of continuous gas-and-ash emissions during early November 2019, accompanied by nighttime incandescence, minor SO2 plumes, and the reappearance of the lake in the El Agrio crater during early December 2019 (BGVN 45:03). This report, covering March-November 2020, describes an eruption with gas-and-ash plumes from mid-June through late October, accompanied by thermal anomalies visible in satellite imagery and small SO2 plumes. Primary information for this report comes from the Servicio Nacional de Geología y Minería (SERNAGEOMIN) Observatorio Volcanológico de Los Andes del Sur (OVDAS), the Buenos Aires Volcanic Ash Advisory Center (VAAC), and various satellite data.
Activity during March-May 2020 was relatively low and consisted primarily of seismicity, sulfur dioxide emissions, and occasional white gas-and-steam emissions rising 300-900 m above the El Agrio crater. On 20 March a series of volcano-tectonic seismic events were detected SSW of the volcano; satellite images showed a decrease in the size of the crater lake. SO2 emissions had daily averages of 487-636 tons, with the highest value reaching 1,884 tons/day on 16 May. During April slight subsidence was reported in the crater, occurring at a maximum rate of 0.3 cm/month.
Activity during most of June and July consisted of occasional white gas-and-steam emissions rising 350-500 m above the El Agrio crater and SO2 emissions averaging 592-1,950 tons/day; a high value of 1,897 tons/day was reported on 13 June. However, on 16 June a period of increased seismicity was accompanied by crater incandescence and gas emissions containing some ash. SO2 plumes increased slightly in July with values of 2,100 and 1,713 tons/day on 2 and 4 July, respectively. Another ash plume was observed by local residents on 16 July, accompanied by elevated seismicity and SO2 emissions of 4,684 tons/day. On 20 July residents of La Araucanía described an odor that indicated hydrogen sulfide gas emissions. A photo on 23 July showed an ash plume rising above the crater (figure 55).
Beginning in early August, and continuing through September 2020, the Sentinel-2 MODIS Thermal Volcanic Activity graph provided by the MIROVA system identified a small cluster of thermal anomalies in the summit area (figure 56). Thermal anomalies during this time were also captured in Sentinel-2 thermal satellite imagery, showing a persistent hotspot of varying strength in the summit crater (figure 57). This thermal activity was accompanied by small sulfur dioxide plumes identified by the TROPOMI instrument on the Sentinel-5P satellite, which exceeded two Dobson Units (DU). Distinct SO2 emissions greater than two DUs were detected on 6, 11, 21, 22, and 29 August, 1 and 6 September, and 4 and 15 October (figure 58).
During August, approximately 133 explosive events were detected, in addition to the gas-and-steam and SO2 emissions (figure 59). On 3 August pulses of ash emissions were reported by SERNAGEOMIN, which resulted in a 2.2-km-long tephra deposit estimated to have a volume of 1 km3. Gray gas-and-ash emissions were observed on 6 August, followed by a thermal anomaly detected in satellite imagery beginning on 8 August. Sulfur dioxide emissions were elevated compared to previous months, measuring an average of 2,641 tons/day with high values of 4,498 tons/day on 12 August that increased to 4,627 tons/day by 27 August. During 16-31 August webcams recorded gas-and-ash plumes rising as high as 1.7 km altitude and were sometimes accompanied by nighttime crater incandescence. Plumes drifted in multiple directions as far as 4.3 km N, 9 km NE, 8 km E, 4 km SE, 4 km SW, 9 km W, and 4.4 km NW.
Elevated activity continued into September with 2-10 explosive events detected during the month; during 1-15 September webcams recorded gas-and-ash plumes rising to 1.1 km altitude, drifting 6-15 km SW and SE, which were sometimes accompanied by nighttime crater incandescence (figure 60). On 7 September a Buenos Aires VAAC advisory reported an ash plume rising to 3.7 km altitude drifting SE. On 11 September a webcam showed a weak gas emission, possibly containing some ash. Three episodes of gas-and-steam plumes were reported, rising 100-1,040 m above the crater, sometimes accompanied by incandescence. SO2 emissions were in the 1,499-1,714 tons/day range, with a high value of 4,522 tons/day on 28 September. SERNAGEOMIN reported repetitive explosions in the acid lake area alongside fumarolic activity, ejecting some material 1.7 km N, 1.2 km SE, and 4 km E of the crater.
Persistent activity in October consisted of gas-and-steam plumes, ash emissions, and SO2 emissions. The gas-and-steam plumes rose 1.4 km above the crater, occasionally accompanied by nighttime incandescence. On 5 October the SO2 emissions were at a high value of 3,824 tons/day. During 12-15 October ash emissions resulted in a wide distribution of ashfall that reached 6.8 km NE, 7 km SE, and 6.7 km SW (figure 61). A pilot reported an ash plume rose to 3.7 km altitude drifting SE, according to a VAAC advisory, though the plume was not visible in satellite data. Sentinel-2 satellite imagery recorded strong gas-and-ash plumes during August-October, drifting generally S and E, which resulted in ash deposits on the nearby flanks (figure 62). Continued emissions had covered all of the flanks with ash by late October.
Similar activity during November decreased, primarily characterized by gas-and-steam plumes and SO2 emissions. White gas-and-steam emissions, possibly with some ash content, were observed with a webcam on 9 and 12 November, accompanied by low but continuous seismicity. During 11-12 November SO2 emissions were at a high value of 904 tons/day. A white gas-and-steam plume was observed on 15 November rising 760 m above the crater; typical degassing rose 200-300 m above the crater, according to SERNAGEOMIN. The daily average of SO2 emissions ranged 366-582 tons.
Geologic Background. Volcán Copahue is an elongated composite cone constructed along the Chile-Argentina border within the 6.5 x 8.5 km wide Trapa-Trapa caldera that formed between 0.6 and 0.4 million years ago near the NW margin of the 20 x 15 km Pliocene Caviahue (Del Agrio) caldera. The eastern summit crater, part of a 2-km-long, ENE-WSW line of nine craters, contains a briny, acidic 300-m-wide crater lake (also referred to as El Agrio or Del Agrio) and displays intense fumarolic activity. Acidic hot springs occur below the eastern outlet of the crater lake, contributing to the acidity of the Río Agrio, and another geothermal zone is located within Caviahue caldera about 7 km NE of the summit. Infrequent mild-to-moderate explosive eruptions have been recorded since the 18th century. Twentieth-century eruptions from the crater lake have ejected pyroclastic rocks and chilled liquid sulfur fragments.
Information Contacts: Servicio Nacional de Geología y Minería (SERNAGEOMIN), Observatorio Volcanológico de Los Andes del Sur (OVDAS), Avda Sta María No. 0104, Santiago, Chile (URL: http://www.sernageomin.cl/); MIROVA (Middle InfraRed Observation of Volcanic Activity), a collaborative project between the Universities of Turin and Florence (Italy) supported by the Centre for Volcanic Risk of the Italian Civil Protection Department (URL: http://www.mirovaweb.it/); Global Sulfur Dioxide Monitoring Page, Atmospheric Chemistry and Dynamics Laboratory, NASA Goddard Space Flight Center (NASA/GSFC), 8800 Greenbelt Road, Goddard, Maryland, USA (URL: https://so2.gsfc.nasa.gov/); Sentinel Hub Playground (URL: https://www.sentinel-hub.com/explore/sentinel-playground); Valentina Sepulveda, Hotel Caviahue, Caviahue, Argentina (URL: https://twitter.com/valecaviahue, Twitter: @valecaviahue).
Ebeko
Russia
50.686°N, 156.014°E; summit elev. 1103 m
All times are local (unless otherwise noted)
Continued explosions, ash plumes, and ashfall; June-November 2020
Volcanism at Ebeko, located on the N end of the Paramushir Island in the Kuril Islands, has been ongoing since October 2016, characterized by frequent moderate explosions, ash plumes, and ashfall in Severo-Kurilsk (7 km ESE) (BGVN 45:05). Similar activity during this reporting period of June through November 2020 continues, consisting of frequent explosions, dense ash plumes, and occasional ashfall. Information for this report primarily comes from the Kamchatka Volcanic Eruptions Response Team (KVERT) and satellite data.
Activity during June was characterized by frequent, almost daily explosions and ash plumes that rose to 1.6-4.6 km altitude and drifted in various directions, according to KVERT reports and information from the Tokyo VAAC advisories using HIMAWARI-8 satellite imagery and KBGS (Kamchatka Branch of the Geophysical Service) seismic data. Satellite imagery showed persistent thermal anomalies over the summit crater. On 1 June explosions generated an ash plume up to 4.5 km altitude drifting E and S, in addition to several smaller ash plumes that rose to 2.3-3 km altitude drifting E, NW, and NE, according to KVERT VONA notices. Explosions on 11 June generated an ash plume that rose 2.6 km altitude and drifted as far as 85 km N and NW. Explosions continued during 21-30 June, producing ash plumes that rose 2-4 km altitude, drifting up to 5 km in different directions (figure 26); many of these eruptive events were accompanied by thermal anomalies that were observed in satellite imagery.
Explosions continued in July, producing ash plumes rising 2-5.2 km altitude and drifting for 3-30 km in different directions. On 3, 6, 15 July explosions generated an ash plume that rose 3-4 km altitude that drifted N, NE, and SE, resulting in ashfall in Severo-Kurilsk. According to a Tokyo VAAC advisory, an eruption on 4 July produced an ash plume that rose up to 5.2 km altitude drifting S. On 22 July explosions produced an ash cloud measuring 11 x 13 km in size and that rose to 3 km altitude drifting 30 km SE. Frequent thermal anomalies were identified in satellite imagery accompanying these explosions.
In August, explosions persisted with ash plumes rising 1.7-4 km altitude drifting for 3-10 km in multiple directions. Intermittent thermal anomalies were detected in satellite imagery, according to KVERT. On 9 and 22 August explosions sent ash up to 2.5-3 km altitude drifting W, S, E, and SE, resulting in ashfall in Severo-Kurilsk. Moderate gas-and-steam activity was reported occasionally during the month.
Almost daily explosions in September generated dense ash plumes that rose 1.5-4.3 km altitude and drifted 3-5 km in different directions. Moderate gas-and-steam emissions were often accompanied by thermal anomalies visible in satellite imagery. During 14-15 September explosions sent ash plumes up to 2.5-3 km altitude drifting SE and NE, resulting in ashfall in Severo-Kurilsk. On 22 September a dense gray ash plume rose to 3 km altitude and drifted S. The ash plume on 26 September was at 3.5 km altitude and drifted SE (figure 27).
During October, near-daily ash explosions continued, rising 1.7-4 km altitude drifting in many directions. Intermittent thermal anomalies were identified in satellite imagery. During 7-8, 9-10, and 20-22 October ashfall was reported in Severo-Kurilsk.
Explosions in November produced dense gray ash plumes that rose to 1.5-5.2 km altitude and drifted as far as 5-10 km, mainly NE, SE, E, SW, and ENE. According to KVERT, thermal anomalies were visible in satellite imagery throughout the month. On clear weather days on 8 and 11 November Sentinel-2 satellite imagery showed ashfall deposits SE of the summit crater from recent activity (figure 28). During 15-17 November explosions sent ash up to 3.5 km altitude drifting NE, E, and SE which resulted in ashfall in Severo-Kurilsk on 17 November. Similar ashfall was observed on 22-24 and 28 November due to ash rising to 1.8-3 km altitude (figure 29). Explosions on 29 November sent an ash plume up to 4.5 km altitude drifting E (figure 29). A Tokyo VAAC advisory reported that an ash plume drifting SSE on 30 November reached an altitude of 3-5.2 km.
MIROVA (Middle InfraRed Observation of Volcanic Activity) analysis of MODIS satellite data shows a pulse in low-power thermal activity beginning in early June through early August (figure 30). On clear weather days, the thermal anomalies in the summit crater are observed in Sentinel-2 thermal satellite imagery, accompanied by occasional white-gray ash plumes (figure 31). Additionally, the MODVOLC algorithm detected a single thermal anomaly on 26 June.
Geologic Background. The flat-topped summit of the central cone of Ebeko volcano, one of the most active in the Kuril Islands, occupies the northern end of Paramushir Island. Three summit craters located along a SSW-NNE line form Ebeko volcano proper, at the northern end of a complex of five volcanic cones. Blocky lava flows extend west from Ebeko and SE from the neighboring Nezametnyi cone. The eastern part of the southern crater contains strong solfataras and a large boiling spring. The central crater is filled by a lake about 20 m deep whose shores are lined with steaming solfataras; the northern crater lies across a narrow, low barrier from the central crater and contains a small, cold crescentic lake. Historical activity, recorded since the late-18th century, has been restricted to small-to-moderate explosive eruptions from the summit craters. Intense fumarolic activity occurs in the summit craters, on the outer flanks of the cone, and in lateral explosion craters.
Information Contacts: Kamchatka Volcanic Eruptions Response Team (KVERT), Far Eastern Branch, Russian Academy of Sciences, 9 Piip Blvd., Petropavlovsk-Kamchatsky, 683006, Russia (URL: http://www.kscnet.ru/ivs/kvert/); Kamchatka Branch of the Geophysical Service, Russian Academy of Sciences (KB GS RAS) (URL: http://www.emsd.ru/); Tokyo Volcanic Ash Advisory Center (VAAC), 1-3-4 Otemachi, Chiyoda-ku, Tokyo 100-8122, Japan (URL: http://ds.data.jma.go.jp/svd/vaac/data/); MIROVA (Middle InfraRed Observation of Volcanic Activity), a collaborative project between the Universities of Turin and Florence (Italy) supported by the Centre for Volcanic Risk of the Italian Civil Protection Department (URL: http://www.mirovaweb.it/); Hawai'i Institute of Geophysics and Planetology (HIGP) - MODVOLC Thermal Alerts System, School of Ocean and Earth Science and Technology (SOEST), Univ. of Hawai'i, 2525 Correa Road, Honolulu, HI 96822, USA (URL: http://modis.higp.hawaii.edu/); Sentinel Hub Playground (URL: https://www.sentinel-hub.com/explore/sentinel-playground).
Etna
Italy
37.748°N, 14.999°E; summit elev. 3357 m
All times are local (unless otherwise noted)
Strombolian explosions and ash plumes persist from multiple craters during August-November 2020
Etna, on the island of Sicily, Italy, and has had documented eruptions dating back 3,500 years. Its most recent eruptive period began in September 2013 and has continued through November 2020, characterized by frequent Strombolian explosions, effusive activity, and ash plumes. Activity has commonly originated from the summit areas, including the Northeast Crater (NEC), the Voragine-Bocca Nuova (or Central) complex (VOR-BN), the Southeast Crater (SEC, formed in 1978), and the New Southeast Crater (NSEC, formed in 2011). The newest crater, referred to as the "cono della sella" (saddle cone), emerged during early 2017 in the area between SEC and NSEC. This report from August through November 2020 updates activity consisting of frequent Strombolian explosions, ash plumes, summit crater incandescence, degassing, and some ashfall based on information primarily from weekly reports by the Osservatorio Etneo (OE), part of the Catania Branch of Italy's Istituo Nazionale di Geofisica e Vulcanologica (INGV).
Summary of activity during August-November 2020. Intra-crater Strombolian explosions that varied in frequency and intensity throughout the reporting period, and the accompanying ash emissions that rose to a maximum altitude of 4.5 km, primarily originated from the Northeast Crater (NEC), the New Southeast Crater (NSEC), and intermittently from the Voragine Crater (VOR). Degassing of variable intensity typically occurred at the VOR and the Bocca Nuova (BN) Crater. At night, occasional summit crater incandescence was visible in webcam images, accompanied by explosions and gas-and-ash emissions. On 14 August strong Strombolian explosions produced an ash plume that rose to 4.5 km altitude and drifted SE, resulting in ashfall between Pedara, Trecastagni, and Viagrande. INGV reported that the central pit crater at the bottom of BN continued to widen, and on 9 September scientists observed that a new pit crater had formed NW of the central depression and was widening due to crater wall collapses. During late October to 1 November, INGV reported that small lava flows originated from scoria cones in the NEC and were visible from the edge of the crater but did not spill over.
MIROVA (Middle InfraRed Observation of Volcanic Activity) analysis of MODIS satellite data shows frequent thermal activity of varying strength throughout the reporting period (figure 308). In late October, the frequency of the thermal anomalies increased, and continued through November. According to the MODVOLC thermal algorithm, a total of 31 alerts were detected in the summit craters during August through November; thermal anomalies were reported for five days in August, four days in September, four days in October, and eight days in November. Frequent Strombolian activity contributed to distinct SO2 plumes that drifted in multiple directions (figure 309).
Activity during August-September 2020. During August, INGV reported intra-crater Strombolian explosions in the NEC, VOR, and NSEC (including the cono della sella) craters, which produced discontinuous ash emissions rising above each crater (figure 310). Gas-and-steam emissions were the dominant activity in the BN crater. INGV noted that the central pit crater on the floor of BN had been gradually widening since April. On 2 August a slight increase in explosivity resulted in minor ashfall in Trecastagni and Acicastello. Explosive activity occasionally ejected material above the crater rim up to several tens of meters. On the morning of 7 August incandescent Strombolian activity was visible in the NSEC (figure 311). During the evening of 10-11 August surveillance cameras showed the explosions ejecting incandescent material on the surrounding flanks. On 14 August intense Strombolian activity in the saddle cone of the NSEC produced an ash plume that rose to 4-4.5 km altitude and drifted SE, resulting in ashfall between Pedara, Trecastagni, and Viagrande. By the evening activity had sharply declined, according to a VONA (Volcano Observatory Notice for Aviation) report, though sporadic ash emissions continued. A new series of ash emissions associated with explosions of varying intensity began on 15 August in the NSEC. A resulting ash plume rose to 4-4.5 km altitude and drifted ESE. On 17 August gas-and-steam emissions were seen rising above the VOR crater, accompanied by persistent Strombolian explosions. Between the afternoon and early morning of 20-21 August surveillance cameras showed an increased intensity and frequency of ash emissions above the NSEC and NEC that rose to 4-4.5 km altitude and drifted SSE. INGV-OE scientists reported minor ashfall in Trecastagni, Viagrande, and Catania. During 24-30 August ground observers reported that the intra-crater explosions in the NEC originated from two explosive vents; the BN crater exhibited gas-and-steam emissions from the central pit crater, which continued to widen. During 25-26 August explosive activity increased at the NSEC with ash emissions rising to 4.5 km and drifting SSE, which resulted in modest ashfall in Catania, Viagrande, and Trecastagni; by morning, the volume of ash emissions had decreased, though explosions persisted. During 28-29 August discontinuous and modest ash emissions originating from the NSEC rose 4.5 km altitude drifting E and ENE but did not result in ashfall. Emissions had stopped by 1747 on 29 August, though intense gas-and-steam emissions continued, occasionally accompanied by mild explosive activity (figure 312).
Strombolian activity of varying intensity continued in the NSEC and NEC during September, producing sporadic ash emissions (figure 313). The BN and VOR craters were characterized by gas-and-steam emissions. Explosions in the NSEC ejected coarse pyroclastic material above the crater rim several tens of meters, some of which were deposited on the S flank, and accompanied by sporadic ash emissions; these explosions continued to widen the depression in the saddle cone of the NSEC. Intermittent nighttime crater incandescence was observed in the NSEC. Sporadic and weak ash emissions were observed in the VOR. On 9 September INGV scientists reported intense degassing from the center pit crater in the BN. To the NW of this center depression, a new pit crater had formed and began to widen due to the collapse of the crater walls (figure 314). On 26 September explosions in the NSEC produced an ash plume that rose to 4 km altitude and drifted E, though no ashfall was reported.
Activity during October-November 2020. Similar variable Strombolian activity continued into October in the NSEC (cono della sella) and NEC; isolated and weak ash emissions were visible in the VOR crater and gas-and-steam emissions continued in both the VOR and BN craters. On 1 October an increase in explosive activity in the NSEC occurred around 0800, which produced an ash plume rising to 4.5 km altitude, drifting E. Ash emissions on 3 October were mostly confined to the summit crater, but some drifted toward the Valle del Bove. On 7 October Strombolian explosions in the NSEC generated an ash plume that rose to 4.5 km altitude drifting E and ESE. INGV personnel reported ashfall as a result in the Citelli Refuge. On 9 October drone observations showed at least three active scoria cones on the floor of the NEC with diameters of 30-40 m and heights of 10 m; a fourth vent was later reported in November (figure 315). INGV reported that activity characterized by Strombolian explosions and spatter was fed by these vents, accompanied by intense intra-crater fumarolic activity.
During 12-18 October surveillance cameras captured incandescence in the NEC and pyroclastic material seen during more intense explosions. During the week of 19-25 October several thermal anomalies were detected on the NEC and BN crater floor. Particularly at night, thermal and surveillance cameras observed incandescent ejecta rising above the NSEC (figure 316). On 23 October a helicopter overflight along the W side of Etna showed continued explosions at the NSEC, which produced both ash emissions and incandescent shreds of lava. An associated ash plume rose to 4.5 km altitude and drifted SSE. Sporadic ash emissions were also observed in the BN crater (figure 316). During 26 October to 1 November occasional Strombolian activity resumed in the VOR which ejected material over the crater rim. The BN crater activity was characterized by small intra-crater collapses and consequent ash emissions. In the NEC, similar explosive activity persisted with the addition of small lava flows from the scoria cones, which were visible from the crater edge, though activity remained confined to the crater.
Activity in November continued with variable Strombolian explosions accompanied by discontinuous ash emissions from the NSEC, NEC, and BN. During more intense explosions, ejecta reached several tens of meters above the crater, sometimes falling just outside the crater rim. Intensive degassing in the BN crater revealed occasional reddish ash in the new W pit crater that formed in September. The central pit crater was primarily characterized by intense gas-and-steam emissions and intra-crater wall collapses. Four vents were observed on the bottom of the NEC during 2-8 November, though only three of them produced Strombolian explosions, the fourth was quiet. On 5 November Strombolian explosions in BN originated from the W pit crater; coarser material was ejected above the pit crater rim. By 12 November Strombolian activity had decreased, explosions in the BN had deposited material on the S flank. Out of the three active NEC scoria cones, only one was continuously exploding, the second had discontinuous explosions, and the third was primarily emitting gas-and-steam. On 15 November faint ash emissions from the E side of the NSEC were observed (figure 317). On 20 November sporadic explosive activity continued from the NSEC and BN, the former of which occasionally ejected material above the crater rim (figure 318).
Geologic Background. Mount Etna, towering above Catania on the island of Sicily, has one of the world's longest documented records of volcanism, dating back to 1500 BCE. Historical lava flows of basaltic composition cover much of the surface of this massive volcano, whose edifice is the highest and most voluminous in Italy. The Mongibello stratovolcano, truncated by several small calderas, was constructed during the late Pleistocene and Holocene over an older shield volcano. The most prominent morphological feature of Etna is the Valle del Bove, a 5 x 10 km caldera open to the east. Two styles of eruptive activity typically occur, sometimes simultaneously. Persistent explosive eruptions, sometimes with minor lava emissions, take place from one or more summit craters. Flank vents, typically with higher effusion rates, are less frequently active and originate from fissures that open progressively downward from near the summit (usually accompanied by Strombolian eruptions at the upper end). Cinder cones are commonly constructed over the vents of lower-flank lava flows. Lava flows extend to the foot of the volcano on all sides and have reached the sea over a broad area on the SE flank.
Information Contacts: Sezione di Catania - Osservatorio Etneo, Istituto Nazionale di Geofisica e Vulcanologia (INGV), Sezione di Catania, Piazza Roma 2, 95123 Catania, Italy (URL: http://www.ct.ingv.it/it/); MIROVA (Middle InfraRed Observation of Volcanic Activity), a collaborative project between the Universities of Turin and Florence (Italy) supported by the Centre for Volcanic Risk of the Italian Civil Protection Department (URL: http://www.mirovaweb.it/); Hawai'i Institute of Geophysics and Planetology (HIGP) - MODVOLC Thermal Alerts System, School of Ocean and Earth Science and Technology (SOEST), Univ. of Hawai'i, 2525 Correa Road, Honolulu, HI 96822, USA (URL: http://modis.higp.hawaii.edu/); Global Sulfur Dioxide Monitoring Page, Atmospheric Chemistry and Dynamics Laboratory, NASA Goddard Space Flight Center (NASA/GSFC), 8800 Greenbelt Road, Goddard, Maryland, USA (URL: https://so2.gsfc.nasa.gov/); Boris Behncke, Istituto Nazionale di Geofisica e Vulcanologia (INGV), Sezione di Catania, Piazza Roma 2, 95123 Catania, Italy (URL: https://twitter.com/etnaboris).
Fuego (Guatemala) — December 2020 Cite this Report
Fuego
Guatemala
14.473°N, 90.88°W; summit elev. 3763 m
All times are local (unless otherwise noted)
Daily explosions, ash emissions, and block avalanches during August-November 2020
Guatemala's Volcán de Fuego has been erupting vigorously since 2002 with reported eruptions dating back to 1531. These eruptions have resulted in major ashfalls, pyroclastic flows, lava flows, and damaging lahars, including a series of explosions and pyroclastic flows in early June 2018 that caused several hundred fatalities. Eruptive activity consisting of explosions with ash emissions, block avalanches, and lava flows began again after a short break and has continued; activity during August-November 2020 is covered in this report. Daily reports are provided by the Instituto Nacional de Sismologia, Vulcanología, Meteorología e Hidrologia (INSIVUMEH); aviation alerts of ash plumes are issued by the Washington Volcanic Ash Advisory Center (VAAC). Satellite data provide valuable information about heat flow and emissions.
Summary of activity during August-November 2020. Eruptive activity continued at Fuego during August-November 2020, very similar to that during the first part of the year (table 22). Ash emissions were reported daily by INSIVUMEH with explosions often in the 6-12 per hour range. Most of the ash plumes rose to 4.5-4.7 km altitude and generally drifted SW, W, or NW, although rarely the wind direction changed and sent ash to the S and SE. Multiple daily advisories were issued throughout the period by the Washington VAAC warning aviators about ash plumes, which were often visible on the observatory webcam (figure 136). Some of the communities located SW of the volcano received ashfall virtually every day during the period. Block avalanches descended the major drainages daily as well. Sounds were heard and vibrations felt from the explosions most days, usually 7-12 km away. The stronger explosions could be felt and heard 20 km or more from the volcano. During late August and early September a lava flow was active on the SW flank, reaching 700 m in length during the second week of September.
Table 22. Eruptive activity was consistently high at Fuego throughout August – November 2020 with multiple explosions every hour, ash plumes, block avalanches, and near-daily ashfall in the communities in certain directions within 10-20 km of the volcano. Courtesy of INSIVUMEH daily reports.
| Month |
Explosions per hour |
Ash Plume Heights (km) |
Ash plume distance (km) and direction |
Drainages affected by block avalanches |
Communities reporting ashfall |
| Aug 2020 |
2-15 |
4.3-4.8 |
SW, W, NW, S, N, 8-20 km |
Seca, Taniluya, Ceniza, Trinidad, Las Lajas, Honda, Santa Teresa |
Panimaché I and II, Morelia, Rochela, Finca Palo Verde, Yepocapa, Santa Sofia, El Porvenir, Palo Verde, Sangre de Cristo, Santa Lucía Cotzumalguapa |
| Sep 2020 |
3-16 |
4.3-4.9 |
W, SW, NW, N, S, 8-20 km |
Seca, Taniluya, Ceniza, Trinidad, Las Lajas, Honda, Santa Teresa |
Panimaché I and II, Morelia, Santa Sofía, Finca Palo Verde, Sangre de Cristo, Yepocapa, Porvenir, Yucales, Ojo de Agua, Finca La Conchita |
| Oct 2020 |
3-19 |
4.1-4.8 |
SW, W, S, SE, N, E, 10-20 km |
Seca, Taniluya, Ceniza, Trinidad, Las Lajas, Honda, Santa Teresa |
Panimache I and II, Morelia, Sangre de Cristo, Yepocapa, La Rochela, El Porvenir, Ceilán, Santa Sofía, Yucales, Finca Palo Verde |
| Nov 2020 |
4-14 |
4.0-4.8 |
S, SW, SE, W, NW, 10-35 km |
Seca, Taniluya, Ceniza, Trinidad, Las Lajas, Honda, Santa Teresa El Jute |
Panimaché I and II, Sangre de Cristo, Morelia, Ceilan, La Rochela, El Zapote, Santa Sofía, Yucales, San Juan Alotenango, Ciudad Vieja, San Miguel Dueñas y Antigua Guatemala, Palo Verde, El Porvenir, San Pedro Yepocapa, Quisaché, Santa Emilia |
The frequent explosions, block avalanches, and lava flows produced a strong thermal signal throughout the period that was recorded in both the MIROVA project Log Radiative Power graph (figure 137) and in numerous Sentinel-2 satellite images (figure 138). MODVOLC data produced thermal alerts 4-6 days each month. At least one lahar was recorded each month; they were most frequent in September and October.
Activity during August-November 2020. The number of explosions per hour at Fuego during August 2020 was most often 7-10, with a few days that were higher at 10-15. The ash plumes usually rose to 4.5-4.8 km altitude and drifted SW or W up to 15 km. Incandescence was visible 100-300 m above the summit crater on most nights. All of the major drainages including the Seca, Santa Teresa, Ceniza, Trinidad, Taniluyá, Las Lajas, and Honda were affected by block avalanches virtually every day. In addition, the communities of Panimaché I and II, Morelia, Santa Sofía, Finca Palo Verde, El Porvenir, San Pedro Yepocapa, and Sangre de Cristo reported ashfall almost every day. Sounds and vibrations were reported multiple days every week, often up to 12 km from the volcano, but occasionally as far as 20 km away. Lahars carrying blocks of rocks and debris 1-2 m in diameter descended the SE flank in the Las Lajas and Honda ravines on 6 August. On 27 August a lava flow 150 m long appeared in the Ceniza ravine. It increased in length over the subsequent few days, reaching 550 m long on 30 August, with frequent block avalanches falling off the front of the flow.
The lava flow in the Ceniza ravine was reported at 100 m long on 5 September. It grew to 200 m on 7 September and reached 700 m long on 12 September. It remained 200-350 m long through 19 September, although instruments monitored by INSIVUMEH indicated that effusive activity was decreasing after 16 September (figure 139). A second flow was 200 m long in the Seca ravine on 19 September. By 22 September, active flows were no longer observed. The explosion rate varied from a low of 3-5 on 1 September to a high of 12-16 on 4, 13, 18, and 22-23 September. Ash plumes rose to 4.5-4.9 km altitude nearly every day and drifted W, NW, and SW occasionally as far as 20 km before dissipating. In addition to the active flow in the Ceniza ravine, block avalanches persisted in the other ravines throughout the month. Ashfall continued in the same communities as in August, but was also reported in Yucales on 4 September along with Ojo de Agua and Finca La Conchita on 17 September. The Las Lajas, Honda, and El Jute ravines were the sites of lahars carrying blocks up to 1.5 m in diameter on 8 and 18 September. On 19 and 24 September lahars again descended Las Lajas and El Jute ravines; the Ceniza ravine had a lahar on 19 September.
The same activity continued during October 2020 with regard to explosion rates, plume altitudes, distances, and directions of drift. All of the major ravines were affected by block avalanches and the same communities located W and SW of the summit reported ashfall. In addition, ashfall was reported in La Rochela on 2, 3, 7-9 and 30 October, in Ceilán on 3 and 7-9 October, and in Yucales on 5, 14, 18 and 19 October. Multiple strong explosions with abundant ash were reported in a special bulletin on 14 October; high levels of explosive activity were recorded during 16-23 October. Vibrations and sounds were often felt up to 15 km away and heard as far as 25 km from the volcano during that period. Particularly strong block avalanches were present in the Seca and Ceniza ravines on 20, 25, and 30 October. Abundant rain on 9 October resulted in lahars descending all of the major ravines. The lahar in the Las Lajas ravine overflowed and forced the closure of route RN-14 road affecting the community of San Miguel on the SE flank (figure 140). Heavy rains on 15 October produced lahars in the Ceniza, Las Lajas, and Hondas ravines with blocks up to 2 m in diameter. Multiple lahars on 27 October affected Las Lajas, El Jute, and Honda ravines.
On 8 November 2020 a lahar descended the Seca ravine, carrying rocks and debris up to 1 meter in diameter. During the second week of November 2020, the wind direction changed towards the SE and E and brought ashfall to San Juan Alotenango, Ciudad Vieja, San Miguel Dueñas, and Antigua Guatemala on 8 November. Especially strong block avalanches were noted in the Seca and Ceniza ravines on 14, 19, 24, and 29 November. During a period of stronger activity in the fourth week of November, vibrations were felt and explosions heard more than 20 km away on 22 November and more than 25 km away on 27 November. In addition to the other communities affected by ashfall during August-November, Quisaché and Santa Emilia reported ashfall on 30 November.
Geologic Background. Volcán Fuego, one of Central America's most active volcanoes, is also one of three large stratovolcanoes overlooking Guatemala's former capital, Antigua. The scarp of an older edifice, Meseta, lies between Fuego and Acatenango to the north. Construction of Meseta dates back to about 230,000 years and continued until the late Pleistocene or early Holocene. Collapse of Meseta may have produced the massive Escuintla debris-avalanche deposit, which extends about 50 km onto the Pacific coastal plain. Growth of the modern Fuego volcano followed, continuing the southward migration of volcanism that began at the mostly andesitic Acatenango. Eruptions at Fuego have become more mafic with time, and most historical activity has produced basaltic rocks. Frequent vigorous historical eruptions have been recorded since the onset of the Spanish era in 1524, and have produced major ashfalls, along with occasional pyroclastic flows and lava flows.
Information Contacts: Instituto Nacional de Sismologia, Vulcanologia, Meteorologia e Hydrologia (INSIVUMEH), Unit of Volcanology, Geologic Department of Investigation and Services, 7a Av. 14-57, Zona 13, Guatemala City, Guatemala (URL: http://www.insivumeh.gob.gt/ ); MIROVA (Middle InfraRed Observation of Volcanic Activity), a collaborative project between the Universities of Turin and Florence (Italy) supported by the Centre for Volcanic Risk of the Italian Civil Protection Department (URL: http://www.mirovaweb.it/); Sentinel Hub Playground (URL: https://www.sentinel-hub.com/explore/sentinel-playground);Hawai'i Institute of Geophysics and Planetology (HIGP) - MODVOLC Thermal Alerts System, School of Ocean and Earth Science and Technology (SOEST), Univ. of Hawai'i, 2525 Correa Road, Honolulu, HI 96822, USA (URL: http://modis.higp.hawaii.edu/); Washington Volcanic Ash Advisory Center (VAAC), Satellite Analysis Branch (SAB), NOAA/NESDIS OSPO, NOAA Science Center Room 401, 5200 Auth Rd, Camp Springs, MD 20746, USA (URL: www.ospo.noaa.gov/Products/atmosphere/vaac, archive at: http://www.ssd.noaa.gov/VAAC/archive.html).
Karangetang (Indonesia) — December 2020 Cite this Report
Karangetang
Indonesia
2.781°N, 125.407°E; summit elev. 1797 m
All times are local (unless otherwise noted)
Hot material on the NW flank in November 2020; intermittent crater thermal anomalies
Karangetang (also known as Api Siau) is located on the island of Siau in the Sitaro Regency, North Sulawesi, Indonesia and consists of two active summit craters: a N crater (Kawah Dua) and a S crater (Kawah Utama, also referred to as the “Main Crater”). More than 50 eruptions have been observed since 1675. The current eruption began in November 2018 and has recently been characterized by frequent incandescent block avalanches, thermal anomalies in the crater, and gas-and-steam plumes (BGVN 45:06). This report covers activity from June through November 2020, which includes dominantly crater anomalies, few ash plumes, and gas-and-steam emissions. Information primarily comes from the Pusat Vulkanologi dan Mitigasi Bencana Geologi (PVMBG, also known as CVGHM, or the Center of Volcanology and Geological Hazard Mitigation), MAGMA Indonesia, and various satellite data.
Activity decreased significantly after mid-January 2020 and has been characterized by dominantly gas-and-steam emissions and occasional ash plumes, according to PVMBG. Daily gas-and-steam emissions were observed rising 25-600 m above the Main Crater (S crater) during the reporting period and intermittent emissions rising 25-300 m above Kawah Dua (N crater).
The only activity reported by PVMBG in June, August, and October was daily gas-and-steam emissions above the Main Crater and Kawah Dua (figure 47). MIROVA (Middle InfraRed Observation of Volcanic Activity) analysis of MODIS satellite data shows intermittent low-power thermal anomalies during June through late July, which includes a slight increase in power during late July (figure 48). During 14-15 July strong rumbling from Kawah Dua was accompanied by white-gray emissions that rose 150-200 m above the crater. Crater incandescence was observed up to 10 m above the crater. According to webcam imagery from MAGMA Indonesia, intermittent incandescence was observed at night from both craters through 25 July. In a Volcano Observatory Notice for Aviation (VONA) issued on 5 September, PVMBG reported an ash plume that rose 800 m above the crater.
Thermal activity increased briefly during mid-November when hot material was reported extending 500-1,000 m NW of the Main Crater, accompanied by gas-and-steam emissions rising 200 m above the crater. Corresponding detection of MODIS thermal anomalies was seen in MIROVA graphs (see figure 48), and the MODVOLC system showed alerts on 13 and 15 November. On 16 November blue emissions were observed above the Main Crater drifting W. Sentinel-2 thermal images showed elevated temperatures in both summit craters throughout the reporting period, accompanied by gas-and-steam emissions and movement of hot material on the NW flank on 19 November (figure 49). White gas-and-steam emissions rose to a maximum height of 300 m above Kawah Dua on 22 November and 600 m above the Main Crater on 28 November.
Geologic Background. Karangetang (Api Siau) volcano lies at the northern end of the island of Siau, about 125 km NNE of the NE-most point of Sulawesi. The stratovolcano contains five summit craters along a N-S line. It is one of Indonesia's most active volcanoes, with more than 40 eruptions recorded since 1675 and many additional small eruptions that were not documented (Neumann van Padang, 1951). Twentieth-century eruptions have included frequent explosive activity sometimes accompanied by pyroclastic flows and lahars. Lava dome growth has occurred in the summit craters; collapse of lava flow fronts have produced pyroclastic flows.
Information Contacts: Pusat Vulkanologi dan Mitigasi Bencana Geologi (PVMBG, also known as Indonesian Center for Volcanology and Geological Hazard Mitigation, CVGHM), Jalan Diponegoro 57, Bandung 40122, Indonesia (URL: http://www.vsi.esdm.go.id/); MAGMA Indonesia, Kementerian Energi dan Sumber Daya Mineral (URL: https://magma.vsi.esdm.go.id/); MIROVA (Middle InfraRed Observation of Volcanic Activity), a collaborative project between the Universities of Turin and Florence (Italy) supported by the Centre for Volcanic Risk of the Italian Civil Protection Department (URL: http://www.mirovaweb.it/); Hawai'i Institute of Geophysics and Planetology (HIGP) - MODVOLC Thermal Alerts System, School of Ocean and Earth Science and Technology (SOEST), Univ. of Hawai'i, 2525 Correa Road, Honolulu, HI 96822, USA (URL: http://modis.higp.hawaii.edu/); Sentinel Hub Playground (URL: https://www.sentinel-hub.com/explore/sentinel-playground).
Kerinci (Indonesia) — December 2020 Cite this Report
Kerinci
Indonesia
1.697°S, 101.264°E; summit elev. 3800 m
All times are local (unless otherwise noted)
Intermittent ash plumes and gas-and-steam emissions during June-November 2020
Kerinci, located in Sumatra, Indonesia, has had numerous explosive eruptions since 1838, with more recent activity characterized by gas-and-steam and ash plumes. The current eruptive episode began in April 2018 and has recently consisted of intermittent brown ash emissions and white gas-and-steam emissions (BGVN 45:07); similar activity continued from June through November 2020. Information primarily comes from the Pusat Vulkanologi dan Mitigasi Bencana Geologi (PVMBG, also known as CVGHM, or the Center of Volcanology and Geological Hazard Mitigation), MAGMA Indonesia, the Darwin Volcanic Ash Advisory Centre (VAAC), and satellite data.
Activity has been characterized by dominantly white and brown gas-and-steam emissions and occasional ash plumes, according to PVMBG. Near daily gas-and-steam emissions were observed rising 50-6,400 m above the crater throughout the reporting period: beginning in late July and continuing intermittently though November. [Sentinel-2 satellite imagery showed frequent brown emissions rising above the summit crater at varying intensities and drifting in different directions from 27 July 2020 to 4 November, though the intensity gradually declined over time (figure 21).]
During June through July the only activity reported by PVMBG consisted of white gas-and-steam emissions and brown emissions. On 4 June white gas-and-steam emissions rose to a maximum height of 6.4 km above the crater. White-and-brown emissions rose to a maximum height of 700 m above the crater on 2 June and 28 July.
Continuous white-and-brown gas-and-steam emissions were reported in August that rose 50-1,000 m above the crater. The number of ash plumes reported during this month increased compared to the previous months. In a Volcano Observatory Notice for Aviation (VONA) issued on 7 August at 1024, PVMBG reported an ash plume that rose 600 m above the crater and drifted E, SE, and NE. In addition, the Darwin VAAC released two notices that described continuous minor ash emissions rising to 4.3 km altitude and drifting E and NE. On 9 August an ash plume rose 600 m above the crater and drifted ENE at 1140. An ash plume was observed rising to a maximum of 1 km above the crater, drifting E, SE, and NE on 12 August at 1602, according to a PVMBG VONA and Darwin VAAC advisory. The following day, brown emissions rose to a maximum of 1 km above the crater and were accompanied by a 600-m-high ash plume that drifted ENE at 1225. Ground observers on 15 August reported an eruption column that rose to 4.6 km altitude; PVMBG described brown ash emissions up to 800 m above the crater drifting NW at 0731 (figure 22). During 20-21 August pilots reported an ash plume rising 150-770 m above the crater drifting NE and SW, respectively.
Activity in September had decreased slightly compared to the previous month, characterized by only white-and-brown gas-and-steam emissions that rose 50-300 m above the crater; solely brown emissions were observed on 30 September and rose 50-100 m above the crater. This low level of activity persisted into October, with white gas-and-steam emissions to 50-200 m above the crater and brown emissions rising 50-300 m above the crater. On 16 October PVMBG released a VONA at 0340 that reported an ash plume rising 687 m above the crater and drifting NE. On 17 October white, brown, and black ash plumes that rose 100-800 m above the crater drifted NE according to both PVMBG and a Darwin VAAC advisory (figure 23). During 18-19 October white, brown, and black ash emissions rose up to 400 m above the crater and drifted NE and E.
Geologic Background. Gunung Kerinci in central Sumatra forms Indonesia's highest volcano and is one of the most active in Sumatra. It is capped by an unvegetated young summit cone that was constructed NE of an older crater remnant. There is a deep 600-m-wide summit crater often partially filled by a small crater lake that lies on the NE crater floor, opposite the SW-rim summit. The massive 13 x 25 km wide volcano towers 2400-3300 m above surrounding plains and is elongated in a N-S direction. Frequently active, Kerinci has been the source of numerous moderate explosive eruptions since its first recorded eruption in 1838.
Information Contacts: Pusat Vulkanologi dan Mitigasi Bencana Geologi (PVMBG, also known as Indonesian Center for Volcanology and Geological Hazard Mitigation, CVGHM), Jalan Diponegoro 57, Bandung 40122, Indonesia (URL: http://www.vsi.esdm.go.id/); MAGMA Indonesia, Kementerian Energi dan Sumber Daya Mineral (URL: https://magma.vsi.esdm.go.id/); Darwin Volcanic Ash Advisory Centre (VAAC), Bureau of Meteorology, Northern Territory Regional Office, PO Box 40050, Casuarina, NT 0811, Australia (URL: http://www.bom.gov.au/info/vaac/); Sentinel Hub Playground (URL: https://www.sentinel-hub.com/explore/sentinel-playground).
Masaya (Nicaragua) — December 2020 Cite this Report
Masaya
Nicaragua
11.9844°N, 86.1688°W; summit elev. 594 m
All times are local (unless otherwise noted)
Lava lake continues accompanied by gas-and-steam emissions during June-November 2020
Masaya, located in Nicaragua, includes the Nindirí, San Pedro, and San Juan craters, as well as the currently active Santiago crater. The Santiago crater has contained an active lava lake since December 2015 (BGVN 41:08), and often produces gas-and-steam emissions. Similar activity is described in this report which updates information from June through November 2020 using reports from the Instituto Nicareguense de Estudios Territoriales (INETER) and various satellite data.
Volcanism at Masaya has been relatively quiet and primarily characterized by an active lava lake and gas-and-steam emissions. From January to November 2020 there were 8,551 seismic events recorded. A majority of these events were described as low-frequency earthquakes, though a few were classified as volcano-tectonic. MIROVA (Middle InfraRed Observation of Volcanic Activity) analysis of MODIS satellite data showed few low-power thermal anomalies during June through November (figure 87). A small cluster of low-power thermal activity was detected in July and consisted of seven thermal anomalies out of a total of thirteen thermal anomalies recorded during the reporting period. Thermal activity was also observed in Sentinel-2 satellite imagery, which showed a constant thermal anomaly in the Santiago crater at the lava lake during July through October, occasionally accompanied by a gas-and-steam plume (figure 88). Small and intermittent sulfur dioxide emissions appeared in satellite data during each month of the reporting period, excluding July, some of which exceeded two Dobson Units (DU) (figure 89). On 6 July, 11 and 13 August, 7 September, during October, and 9 and 13 November, INETER scientists took SO2 measurements by making several transects using a mobile DOAS spectrometer that sampled for gases downwind of the volcano. Average values during these months were 1,202 tons/day (t/d), 1,383 t/d, 2,089 t/d, 950 t/d, and 819 t/d, respectively, with the highest average reported in September.
During June and July persistent gas-and-steam emissions were reported rising above the open lava lake in the Santiago crater (figure 90). On 20 June INETER scientists measured the gases on the S side, inside the Nindirí crater (SW side), and La Cruz (NW side). A perceptible gas-and-steam plume was noted rising above the Nindirí crater and drifting W. Crater wall collapses were observed on the E wall of the Santiago crater; the lava lake remained, but the level of the lake had decreased compared to previous months. During July, thermal measurements were taken of the fumaroles and near the lava lake using a FLIR SC620 thermal camera. INETER reported that the temperature measured 576°C, which had significantly increased from 163°C noted in the previous month.
Small crater wall collapses were detected on the NW and E wall of the Santiago crater, accompanied by abundant gas-and-steam emissions during August (figure 91). On 7 August thermal measurements were taken of the fumaroles and near the lava lake, which showed another temperature increase to 771°C. Continuous collapse of the crater walls began to excavate depressions in the crater floor and along the walls. Similar activity was observed in September with abundant gas-and-steam emissions in the Santiago crater, as well as collapses of the E wall (figure 91). Temperature measurements taken during this month had decreased slightly compared to August, to 688°C.
Activity in October and November remained consistent with continued wall collapses in the Santiago crater, particularly on the S and E wall, due to fractures in the rocks and erosion, accompanied by gas-and-steam emissions. INETER reported that the level of the lava lake had decreased due to continuous internal wall collapses, which had caused some obstruction in the lava lake and allowed for material to accumulate within the crater. On 9 October thermal measurements were taken of the fumaroles and near the lava lake using a FLIR SC620 thermal camera (figure 92). The temperature had increased again compared to September, to 823°C. By 26 November, the temperature had decreased slightly to 800°C, though activity remained similar.
Geologic Background. Masaya volcano in Nicaragua has erupted frequently since the time of the Spanish Conquistadors, when an active lava lake prompted attempts to extract the volcano's molten "gold" until it was found to be basalt rock upon cooling. It lies within the massive Pleistocene Las Sierras caldera and is itself a broad, 6 x 11 km basaltic caldera with steep-sided walls up to 300 m high. The caldera is filled on its NW end by more than a dozen vents that erupted along a circular, 4-km-diameter fracture system. The Nindirí and Masaya cones, the source of observed eruptions, were constructed at the southern end of the fracture system and contain multiple summit craters, including the currently active Santiago crater. A major basaltic Plinian tephra erupted from Masaya about 6,500 years ago. Recent lava flows cover much of the caldera floor and there is a lake at the far eastern end. A lava flow from the 1670 eruption overtopped the north caldera rim. Periods of long-term vigorous gas emission at roughly quarter-century intervals have caused health hazards and crop damage.
Information Contacts: Instituto Nicaragüense de Estudios Territoriales (INETER), Apartado Postal 2110, Managua, Nicaragua (URL: http://www.ineter.gob.ni/); MIROVA (Middle InfraRed Observation of Volcanic Activity), a collaborative project between the Universities of Turin and Florence (Italy) supported by the Centre for Volcanic Risk of the Italian Civil Protection Department (URL: http://www.mirovaweb.it/); NASA Global Sulfur Dioxide Monitoring Page, Atmospheric Chemistry and Dynamics Laboratory, NASA Goddard Space Flight Center (NASA/GSFC), 8800 Greenbelt Road, Goddard, Maryland, USA (URL: https://so2.gsfc.nasa.gov/); Sentinel Hub Playground (URL: https://www.sentinel-hub.com/explore/sentinel-playground).
Nyamulagira (DR Congo) — December 2020 Cite this Report
Nyamulagira
DR Congo
1.408°S, 29.2°E; summit elev. 3058 m
All times are local (unless otherwise noted)
Numerous thermal anomalies and gas emissions from the lava lake through November 2020
Nyamuragira (also known as Nyamulagira) is a shield volcano in the Democratic Republic of the Congo with a 2 x 2.3 km caldera at the summit. A summit crater lies in the NE part of the caldera. In the recent past, the volcano has been characterized by intra-caldera lava flows, lava emissions from its lava lake, thermal anomalies, gas-and-steam emissions, and moderate seismicity (BGVN 44:12, 45:06). This report reviews activity during June-November 2020, based on satellite data.
MIROVA (Middle InfraRed Observation of Volcanic Activity) analysis of MODIS satellite data showed numerous thermal anomalies associated with the volcano during June-November 2020, although some decrease was noted during the last half of August and between mid-October to mid-November (figure 84). Between six and seven thermal hotspots per month were identified by MODVOLC during June-November 2020, with as many as 4 pixels on 11 August. In the MODVOLC system, two main hotspot groupings are visible, the largest being at the summit crater, on the E side of the caldera.
Sentinel-2 satellite images showed several hotspots in the summit crater throughout the reporting period (figure 85). By 26 July and thereafter, hotspots were also visible in the SW portion of the caldera, and perhaps just outside the SW caldera rim. Gas-and-steam emissions from the lava lake were also visible throughout the period.
Geologic Background. Africa's most active volcano, Nyamulagira (also known as Nyamuragira), is a massive high-potassium basaltic shield about 25 km N of Lake Kivu and 13 km NNW of the steep-sided Nyiragongo volcano. The summit is truncated by a small 2 x 2.3 km caldera that has walls up to about 100 m high. Documented eruptions have occurred within the summit caldera, as well as from the numerous flank fissures and cinder cones. A lava lake in the summit crater, active since at least 1921, drained in 1938, at the time of a major flank eruption. Recent lava flows extend down the flanks more than 30 km from the summit as far as Lake Kivu; extensive lava flows from this volcano have covered 1,500 km2 of the western branch of the East African Rift.
Information Contacts: Observatoire Volcanologique de Goma (OVG), Departement de Geophysique, Centre de Recherche en Sciences Naturelles, Lwiro, D.S. Bukavu, DR Congo; MIROVA (Middle InfraRed Observation of Volcanic Activity), a collaborative project between the Universities of Turin and Florence (Italy) supported by the Centre for Volcanic Risk of the Italian Civil Protection Department (URL: http://www.mirovaweb.it/); Hawai'i Institute of Geophysics and Planetology (HIGP) - MODVOLC Thermal Alerts System, School of Ocean and Earth Science and Technology (SOEST), Univ. of Hawai'i, 2525 Correa Road, Honolulu, HI 96822, USA (URL: http://modis.higp.hawaii.edu/); Sentinel Hub Playground (URL: https://www.sentinel-hub.com/exp).
Nyiragongo (DR Congo) — December 2020 Cite this Report
Nyiragongo
DR Congo
1.52°S, 29.25°E; summit elev. 3470 m
All times are local (unless otherwise noted)
Strong thermal anomalies and gas emission from lava lake through November 2020
Nyiragongo is a stratovolcano in the DR Congo with a deep summit crater containing a lava lake and a small active cone. During June 2018-May 2020, the volcano exhibited strong thermal signals primarily due to the lava lake, along with incandescence, seismicity, and gas-and-steam plumes (BGVN 44:05, 44:12, 45:06). The volcano is monitored by the Observatoire Volcanologique de Goma (OVG). This report summarizes activity during June-November 2020, based on satellite data.
Infrared MODIS satellite data showed almost daily strong thermal activity during June-November 2020 from MIROVA (Middle InfraRed Observation of Volcanic Activity), consistent with a large lava lake. Numerous hotspots were also identified every month by MODVOLC. Although clouds frequently obscured the view from space, a clear Sentinel-2 image in early June showed a gas-and-steam plume as well as a strong thermal anomaly (figure 76).
During the first half of June 2020, OVG reported that SO2 levels had decreased compared to levels in May (7,000 tons/day); during the second half of June the SO2 flux began to increase again. High levels of sulfur dioxide were recorded almost every day in the region above or near the volcano by the TROPOspheric Monitoring Instrument (TROPOMI) aboard the Copernicus Sentinel-5 Precursor satellite (figure 77). According to OVG, SO2 flux ranged from 819-5,819 tons/day during June. The number of days with a high SO2 flux decreased somewhat in July and August, with high levels recorded during about half of the days. The volume of SO2 emissions slightly increased in early July, based on data from the DOAS station in Rusayo, measuring 6,787 tons/day on 8 July (the highest value reported during this reporting period), and then declined to 509 tons/day by 20 July. The SO2 flux continued to gradually decline, with high values of 5,153 tons/day in August and 4,468 tons/day in September. The number of days with high SO2 decreased further in September and October but returned to about half of the days in November.
During 12-13 July a multidisciplinary team of OVG scientists visited the volcano to take measurements of the crater using a TCRM1102 Plus2 laser. They noted that the crater had expanded by 47.3 mm in the SW area, due to the rise in the lava lake level since early 2020. The OVG team took photos of the small cone in the lava lake that has been active since 2014, recently characterized by white gas-and-steam emissions (figure 78). OVG noted that the active lava lake had subsided roughly 20 m (figure78).
Geologic Background. The Nyiragongo stratovolcano contained a lava lake in its deep summit crater that was active for half a century before draining catastrophically through its outer flanks in 1977. The steep slopes contrast to the low profile of its neighboring shield volcano, Nyamuragira. Benches in the steep-walled, 1.2-km-wide summit crater mark levels of former lava lakes, which have been observed since the late-19th century. Two older stratovolcanoes, Baruta and Shaheru, are partially overlapped by Nyiragongo on the north and south. About 100 cones are located primarily along radial fissures south of Shaheru, east of the summit, and along a NE-SW zone extending as far as Lake Kivu. Many cones are buried by voluminous lava flows that extend long distances down the flanks, which is characterized by the eruption of foiditic rocks. The extremely fluid 1977 lava flows caused many fatalities, as did lava flows that inundated portions of the major city of Goma in January 2002.
Information Contacts: Observatoire Volcanologique de Goma (OVG), Departement de Geophysique, Centre de Recherche en Sciences Naturelles, Lwiro, D.S. Bukavu, DR Congo; MIROVA (Middle InfraRed Observation of Volcanic Activity), a collaborative project between the Universities of Turin and Florence (Italy) supported by the Centre for Volcanic Risk of the Italian Civil Protection Department (URL: http://www.mirovaweb.it/); Hawai'i Institute of Geophysics and Planetology (HIGP) - MODVOLC Thermal Alerts System, School of Ocean and Earth Science and Technology (SOEST), Univ. of Hawai'i, 2525 Correa Road, Honolulu, HI 96822, USA (URL: http://modis.higp.hawaii.edu/); Sentinel Hub Playground (URL: https://www.sentinel-hub.com/explore/sentinel-playground); NASA Global Sulfur Dioxide Monitoring Page, Atmospheric Chemistry and Dynamics Laboratory, NASA Goddard Space Flight Center (NASA/GSFC), 8800 Greenbelt Road, Goddard, Maryland, USA (URL: https://so2.gsfc.nasa.gov/).
Raung (Indonesia) — December 2020 Cite this Report
Raung
Indonesia
8.119°S, 114.056°E; summit elev. 3260 m
All times are local (unless otherwise noted)
Explosions with ash plumes and a thermal anomaly at the summit crater, July-October 2020
A massive stratovolcano in easternmost Java, Raung has over sixty recorded eruptions dating back to the late 16th Century. Explosions with ash plumes, Strombolian activity, and lava flows from a cinder cone within the 2-km-wide summit crater have been the most common activity. Pusat Vulkanologi dan Mitigasi Bencana Geologi (PVMBG, also known as Indonesian Center for Volcanology and Geological Hazard Mitigation, CVGHM) has installed webcams to monitor activity in recent years. An eruption from late 2014 through August 2015 produced a large volume of lava within the summit crater and formed a new pyroclastic cone in the same location as the previous one. The eruption that began in July 2020 is covered in this report with information provided by PVMBG, the Darwin Volcanic Ash Advisory Center (VAAC), and several sources of satellite data.
The 2015 eruption was the largest in several decades; Strombolian activity was reported for many months and fresh lava flows covered the crater floor (BGVN 45:09). Raung was quiet after the eruption ended in August of that year until July of 2020 when seismicity increased on 13 July and brown emissions were first reported on 16 July. Tens of explosions with ash emissions were reported daily during the remainder of July 2020. Explosive activity decreased during August, but thermal activity didn’t decrease until mid-September. The last ash emissions were reported on 3 October and the last thermal anomaly in satellite data was recorded on 7 October 2020.
Eruption during July-October 2020. No further reports of activity were issued after August 2015 until July 2020. Clear Google Earth imagery from October 2017 and April 2018 indicated the extent of the lava from the 2015 eruption, but no sign of further activity (figure 31). By August 2019, many features from the 2015 eruption were still clearly visible from the crater rim (figure 32).
PVMBG reported that the number and type of seismic events around the summit of Raung increased beginning on 13 July 2020, and on 16 July the height of the emissions from the crater rose to 100 m and the emission color changed from white to brown. About three hours later the emissions changed to gray and white. The webcams captured emissions rising 50-200 m above the summit that included 60 explosions of gray and reddish ash plumes (figure 33). The Raung Volcano Observatory released a VONA reporting an explosion with an ash plume that drifted N at 1353 local time (0653 UTC). The best estimate of the ash cloud height was 3,432 m based on ground observation. They raised the Aviation Color Code from unassigned to Orange. About 90 minutes later they reported a second seismic event and ash cloud that rose to 3,532 m, again based on ground observation. The Darwin VAAC reported that neither ash plume was visible in satellite imagery. The following day, on 17 July, PVMBG reported 26 explosions between midnight and 0600 that produced brown ash plumes which rose 200 m above the crater. Based on these events, PVMBG raised the Alert Level of Raung from I (Normal) to II (Alert) on a I-II-III-IV scale. By the following day they reported 95 explosive seismic events had occurred. They continued to observe gray ash plumes rising 100-200 m above the summit on clear days and 10-30 daily explosive seismic events through the end of July; plume heights dropped to 50-100 m and the number of explosive events dropped below ten per day during the last few days of the month.
After a long period of no activity, MIROVA data showed an abrupt return to thermal activity on 16 July 2020; a strong pulse of heat lasted into early August before diminishing (figure 34). MODVOLC thermal alert data recorded two alerts each on 18 and 20 July, and one each on 21 and 30 July. Satellite images showed no evidence of thermal activity inside the summit crater from September 2015 through early July 2020. Sentinel-2 satellite imagery first indicated a strong thermal anomaly inside the pyroclastic cone within the crater on 19 July 2020; it remained on 24 and 29 July (figure 35). A small SO2 signature was measured by the TROPOMI instrument on the Sentinel-5P satellite on 25 July.
After an explosion on 1 August 2020 emissions from the crater were not observed again until steam plumes were seen rising 100 m on 7 August. They were reported rising 100-200 m above the summit intermittently until a dense gray ash plume was reported by PVMBG on 11 August rising 200 m. After that, diffuse steam plumes no more than 100 m high were reported for the rest of the month except for white to brown emissions to 100 m on 21 August. Thermal anomalies of a similar brightness to July from the same point within the summit crater were recorded in satellite imagery on 3, 8, 13, 18, and 23 August. Single MODVOLC thermal alerts were reported on 1, 8, 12, and 19 August.
In early September dense steam plumes rose 200 m above the crater a few times but were mostly 50 m high or less. White and gray emissions rose 50-300 m above the summit on 15, 20, 27, and 30 September. Thermal anomalies were still present in the same spot in Sentinel-2 satellite imagery on 2, 7, 12, 17, and 27 September, although the signal was weaker than during July and August (figure 36). PVMBG reported gray emissions rising 100-300 m above the summit on 1 October 2020 and two seismic explosion events. Gray emissions rose 50-200 m the next day and nine explosions were recorded. On 3 October, emissions were still gray but only rose 50 m above the crater and no explosions were reported. No emissions were observed from the summit crater for the remainder of the month. Sentinel-2 satellite imagery showed a hot spot within the summit crater on 2 and 7 October, but clear views of the crater on 12, 17, and 22 October showed no heat source within the crater (figure 37).
Geologic Background. Raung, one of Java's most active volcanoes, is a massive stratovolcano in easternmost Java that was constructed SW of the rim of Ijen caldera. The unvegetated summit is truncated by a dramatic steep-walled, 2-km-wide caldera that has been the site of frequent historical eruptions. A prehistoric collapse of Gunung Gadung on the W flank produced a large debris avalanche that traveled 79 km, reaching nearly to the Indian Ocean. Raung contains several centers constructed along a NE-SW line, with Gunung Suket and Gunung Gadung stratovolcanoes being located to the NE and W, respectively.
Information Contacts: Pusat Vulkanologi dan Mitigasi Bencana Geologi (PVMBG, also known as Indonesian Center for Volcanology and Geological Hazard Mitigation, CVGHM), Jalan Diponegoro 57, Bandung 40122, Indonesia (URL: http://www.vsi.esdm.go.id/); Hawai'i Institute of Geophysics and Planetology (HIGP) - MODVOLC Thermal Alerts System, School of Ocean and Earth Science and Technology (SOEST), Univ. of Hawai'i, 2525 Correa Road, Honolulu, HI 96822, USA (URL: http://modis.higp.hawaii.edu/); Darwin Volcanic Ash Advisory Centre (VAAC), Bureau of Meteorology, Northern Territory Regional Office, PO Box 40050, Casuarina, NT 0811, Australia (URL: http://www.bom.gov.au/info/vaac/); MIROVA (Middle InfraRed Observation of Volcanic Activity), a collaborative project between the Universities of Turin and Florence (Italy) supported by the Centre for Volcanic Risk of the Italian Civil Protection Department (URL: http://www.mirovaweb.it/); Global Sulfur Dioxide Monitoring Page, Atmospheric Chemistry and Dynamics Laboratory, NASA Goddard Space Flight Center (NASA/GSFC), 8800 Greenbelt Road, Goddard, Maryland, USA (URL: https://so2.gsfc.nasa.gov/); Google Earth (URL: https://www.google.com/earth/); Sentinel Hub Playground (URL: https://www.sentinel-hub.com/explore/sentinel-playground); Tom Pfeiffer, Volcano Discovery (URL: http://www.volcanodiscovery.com/); MJ (URL: https://twitter.com/MieJamaludin/status/1167613617191043072).
Whakaari/White Island (New Zealand) — December 2020 Cite this Report
Whakaari/White Island
New Zealand
37.52°S, 177.18°E; summit elev. 294 m
All times are local (unless otherwise noted)
Gas-and-steam emissions with some re-suspended ash in November 2020
Whakaari/White Island, located in the Bay of Plenty 50 km offshore of North Island, has been New Zealand’s most active volcano since 1976. Activity has been previously characterized by phreatic activity, explosions, and ash emissions (BGVN 42:05). The most recent eruption occurred on 9 December 2019, which consisted of an explosion that generated an ash plume and pyroclastic surge that affected the entire crater area, resulting in 21 fatalities and many injuries (BGVN 45:02). This report updates information from February through November 2020, which includes dominantly gas-and-steam emissions along with elevated surface temperatures, using reports from the New Zealand GeoNet Project, the Wellington Volcanic Ash Advisory Centre (VAAC), and satellite data.
Activity at Whakaari/White Island has declined and has been dominated by white gas-and-steam emissions during the reporting period; no explosive eruptive activity has been detected since 9 December 2019. During February through 22 June, the Volcanic Activity Level (VAL) remained at a 2 (moderate to heightened volcanic unrest) and the Aviation Color Code was Yellow. GeoNet reported that satellite data showed some subsidence along the W wall of the Main Crater and near the 1914 landslide scarp, though the rate had reduced compared to previous months. Thermal infrared data indicated that the fumarolic gases and five lobes of lava that were first observed in early January 2020 in the Main Crater were 550-570°C on 4 February and 660°C on 19 February. A small pond of water had begun to form in the vent area and exhibited small-scale gas-and-steam-driven water jetting, similar to the activity during September-December 2019. Gas data showed a steady decline in SO2 and CO2 levels, though overall they were still slightly elevated.
Similar activity was reported in March and April; the temperatures of the fumaroles and lava in the Main Crater were 746°C on 10 March, the highest recorded temperature to date. SO2 and CO2 gas emissions remained elevated, though had overall decreased since December 2019. Small-scale water jetting continued to be observed in the vent area. During April, public reports mentioned heightened gas-and-steam activity, but no eruptions were detected. A GeoNet report issued on 16 April stated that high temperatures were apparent in the vent area at night.
Whakaari remained at an elevated state of unrest during May, consisting of dominantly gas-and-steam emissions. Monitoring flights noted that SO2 and CO2 emissions had increased briefly during 20-27 May. On 20 May, the lava lobes remained hot, with temperatures around 500°C; a nighttime glow from the gas emissions surrounding the lava was visible in webcam images. Tremor levels remained low with occasional slightly elevated episodes, which included some shallow-source volcanic earthquakes. Satellite-based measurements recorded several centimeters of subsidence in the ground around the active vent area since December 2019. During a gas observation flight on 28 May there was a short-lived gas pulse, accompanied by an increase in SO2 and CO2 emissions, and minor inflation in the vent area (figure 96).
An observation flight made on 3 June reported a decline in gas flux compared to the measurements made on 28 May. Thermal infrared images taken during the flight showed that the lava lobes were still hot, at 450°C, and continued to generate incandescence that was visible at night in webcams. On 16 June the VAL was lowered to 1 (minor volcanic unrest) and on 22 June the Aviation Color Code had decreased to Green.
Minor volcanic unrest continued in July; the level of volcanic tremors has remained generally low, with the exception of two short bursts of moderate volcanic tremors in at the beginning of the month. Temperatures in the active vents remained high (540°C) and volcanic gases persisted at moderate rate, similar to those measured since May, according to an observation flight made during the week of 30 July. Subsidence continued to be observed in the active vent area, as well as along the main crater wall, S and W of the active vents. Recent rainfall has created small ponds of water on the crater floor, though they did not infiltrate the vent areas.
Gas-and-steam emissions persisted during August through October at relatively high rates (figures 97 and 98). A short episode of moderate volcanic tremor was detected in early August, but otherwise seismicity remained low. Updated temperatures of the active vent area were 440°C on 15 September, which had decreased 100°C since July. Rain continued to collect at the crater floor, forming a small lake; minor areas of gas-and-steam emissions can be seen in this lake. Ongoing subsidence was observed on the Main Crater wall and S and W of the 2019 active vents.
Activity during November was primarily characterized by persistent, moderate-to-large gas-and-steam plumes that drifted downwind for several kilometers but did not reach the mainland. The SO2 flux was 618 tons/day and the CO2 flux was 2,390 tons/day. New observations on 11 November noted some occasional ash deposits on the webcams in conjunction with mainland reports of a darker than usual plume (figure 99). Satellite images provided by MetService, courtesy of the Japan Meteorological Agency, confirmed the ash emission, but later images showed little to no apparent ash; GNS confirmed that no eruptive activity had occurred. Initial analyses indicated that the ash originated from loose material around the vent was being entrained into the gas-and-steam plumes. Observations from an overflight on 12 November showed that there was no substantial change in the location and size of the active vents; rainfall continued to collect on the floor of the 1978/90 Crater, reforming the shallow lake. A small sequence of earthquakes was detected close to the volcano with several episodes of slightly increased volcanic tremors.
During 12-14 November the Wellington VAAC issued multiple advisories noting gas, steam, and ash plumes that rose to 1.5-1.8 km altitude and drifted E and SE, based on satellite data, reports from pilots, and reports from GeoNet. As a result, the VAL was increased to 2 and the Aviation Color Code was raised to Yellow. Scientists on another observation flight on 16 November reported that small amounts of ash continued to be present in gas-and-steam emissions, though laboratory analyses showed that this ash was resuspended material and not from new eruptive or magmatic activity. The SO2 and CO2 flux remained above background levels but were slightly lower than the previous week’s measurements: 710 tons/day and 1,937 tons/day. Seismicity was similar to the previous week, characterized by a sequence of small earthquakes, a larger than normal volcanic earthquake located near the volcano, and ongoing low-level volcanic tremors. During 16-17 November plumes with resuspended ash were observed rising to 460 m altitude, drifting E and NE, according to a VAAC advisory (figure 99). During 20-24 November gas-and-steam emissions that contained a minor amount of resuspended ash rose to 1.2 km altitude and drifted in multiple directions, based on webcam and satellite images and information from GeoNet.
MIROVA (Middle InfraRed Observation of Volcanic Activity) analysis of MODIS satellite data shows a total of eleven low-power thermal anomalies during January to late March 2020; a single weak thermal anomaly was detected in early July (figure 100). The elevated surface temperatures during February-May 2020 were detected in Sentinel-2 thermal satellite images in the Main Crater area, occasionally accompanied by gas-and-steam emissions (figure 101). Persistent white gas-and-steam emissions rising above the Main Crater area were observed in satellite imagery on clear weather days and drifting in multiple directions (figure 102). The small lake that had formed due to rainfall was also visible to the E of the active vents.
Geologic Background. The uninhabited Whakaari/White Island is the 2 x 2.4 km emergent summit of a 16 x 18 km submarine volcano in the Bay of Plenty about 50 km offshore of North Island. The island consists of two overlapping andesitic-to-dacitic stratovolcanoes. The SE side of the crater is open at sea level, with the recent activity centered about 1 km from the shore close to the rear crater wall. Volckner Rocks, sea stacks that are remnants of a lava dome, lie 5 km NW. Descriptions of volcanism since 1826 have included intermittent moderate phreatic, phreatomagmatic, and Strombolian eruptions; activity there also forms a prominent part of Maori legends. The formation of many new vents during the 19th and 20th centuries caused rapid changes in crater floor topography. Collapse of the crater wall in 1914 produced a debris avalanche that buried buildings and workers at a sulfur-mining project. Explosive activity in December 2019 took place while tourists were present, resulting in many fatalities. The official government name Whakaari/White Island is a combination of the full Maori name of Te Puia o Whakaari ("The Dramatic Volcano") and White Island (referencing the constant steam plume) given by Captain James Cook in 1769.
Information Contacts: New Zealand GeoNet Project, a collaboration between the Earthquake Commission and GNS Science, Wairakei Research Centre, Private Bag 2000, Taupo 3352, New Zealand (URL: http://www.geonet.org.nz/); GNS Science, Wairakei Research Centre, Private Bag 2000, Taupo 3352, New Zealand (URL: http://www.gns.cri.nz/); Wellington Volcanic Ash Advisory Centre (VAAC), Meteorological Service of New Zealand Ltd (MetService), PO Box 722, Wellington, New Zealand (URL: http://www.metservice.com/vaac/, http://www.ssd.noaa.gov/VAAC/OTH/NZ/messages.html); MIROVA (Middle InfraRed Observation of Volcanic Activity), a collaborative project between the Universities of Turin and Florence (Italy) supported by the Centre for Volcanic Risk of the Italian Civil Protection Department (URL: http://www.mirovaweb.it/); Sentinel Hub Playground (URL: https://www.sentinel-hub.com/explore/sentinel-playground); Brad Scott, GNS Science, Wairakei Research Centre, Private Bag 2000, Taupo 3352, New Zealand (URL: https://twitter.com/Eruptn).