PVMBG issued VONAs noting recent increased gas emissions at Batu Tara but no confirmed eruptions. Ground-based observers reported that at 1453 and 1617 on 28 April gas emissions rose 1-1.2 km above the summit and drifted W. At 0054 on 2 May gas emissions rose 500 m and drifted W. The Alert Level remained at 1 (on a scale of 1-4).
Source: Pusat Vulkanologi dan Mitigasi Bencana Geologi (PVMBG, also known as CVGHM)
Ash plumes frequent during June 2014-October 2015; explosions observed in November 2015
The long-lasting eruption at Batu Tara exhibited frequent eruptive activity, both Strombolian and Vulcanian styles, previously reported through May 2014 (BGVN 39:01). This report describes events from May 2014 to June 2016. The material here was compiled largely from events reported by the Darwin Volcano Ash Advisory Center (VAAC) and expeditions by Volcano Discovery. The activity observed by visitors on 26 November 2015 corresponds to the end of frequent thermal anomalies. There were no further reports of ash plumes or regular thermal anomalies through October 2016.
Nearly daily to weekly thermal alerts were measured by MODIS thermal sensors from Aqua and Terra satellites during January 2007 to 27 October 2013. The nearly daily to weekly alerts began again on 11 January 2014 and continued until 25 November 2015; no thermal alerts were observed afterward through mid-June 2016. MIROVA noted low-to-moderate radiative power from MODIS sensors from mid-May to late November 2015 (figure 18), then infrequent low to moderate thermal anomalies (1-2 per month) through approximately 25 May 2016; no alerts after that were detected, at least through 21 June 2016.
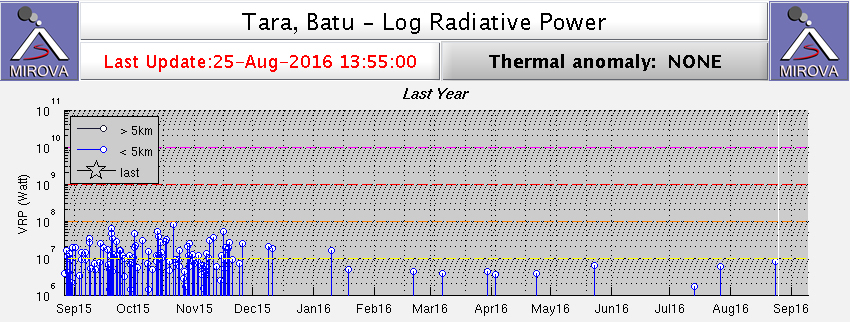 |
Figure 18. Graph of the log radiative power of thermal anomalies at Batu Tara identified in MODIS data by MIROVA during September 2015-August 2016. Courtesy of MIROVA. |
Ash plumes were frequently reported by the Darwin VAAC from 22 March 2014 to mid-June 2016 (table 7). The shortest air route between Jakarta, Indonesia, and Sydney, Australia, is directly over Batu Tara, whose frequent ash plumes are to be avoided. Ash plumes were reported by the VAAC at least once a month during March-June 2014, with several reports in June. Only one ash emission was reported four months later, on 1 November. Ash plumes were identified in satellite data during April and May 2015, and again during September and October.
Table 7. Ash plumes from Batu Tara reported from March 2014 to October 2015. Courtesy of Darwin VAAC.
| Date(s) | Ash plume altitude (km) | Ash plume drift |
| 22 Mar 2014 | -- | 20 km W |
| 26 Mar 2014 | -- | 10 km W |
| 27-28 Apr 2014 | 3 | 35-55 N, NE |
| 16-18 May 2014 | 2.4 | 55-75 km NW, W |
| 26-27 May 2014 | 1.2-2.1 | 25-95 km NW, W |
| 06 Jun 2014 | 2.1 | 150 NW |
| 07-09 Jun 2014 | 2.1 | 35 km W, NW |
| 13 June 2014 | 2.1 | 55 km SW |
| 16 Jun 2014 | 1.5 | 37 km NW |
| 26 Jun 2014 | -- | 35-55 km NW, W |
| 01 Nov 2014 | 1.2-1.5 | 95 km NE |
| 07 Apr 2015 | 3 | NW |
| 06-09 May 2015 | 2.1 | 55-85 km W, WNW |
| 16-19 May 2015 | 2.6 | 35-95 km W, NW |
| 21-22 May 2015 | 2.5 | 80 km W |
| 15 Sep 2015 | 1.5 | 185 km NW |
| 07-08, 13 Oct 2015 | 1.5-2.1 | 90-100 km NW, W |
| 14-19 Oct 2015 | 1.8-2.1 | 45-130 km WSW, W |
| 21-27 Oct 2015 | 1.5 | 35-65 km SW, W |
Visitor observations, July and November 2015. Volcano Discovery made a video during an expedition on 3 July 2015 that showed a pyroclastic flow generated by an explosion travelling down a scarp and out over the ocean for ~150 m (figure 18). The report stated that a "strong Strombolian explosion from Batu Tara volcano occurred on the evening of 2 July 2015. The eruption is preceded by a gradual build-up with increasing degassing and rockfalls as a result of inflation of the crater. Immediately before the explosion, glow becomes visible as the magma is about to break through the crust sealing the vent." Photos by Tom Pfeifer on 3 July showed an explosion followed by a pyroclastic flow that traveled down a scarp towards the ocean.
Volcano Discovery further reported that during another visit over 23-26 November 2015 the activity "was characterized by mild, ash-rich Strombolian eruptions at intervals between 10-30 minutes alternated/interrupted by much more powerful Vulcanian-type explosions that produced shock waves and ejected dense columns of tephra (ash, blocks and incandescent lava bombs) in a single, cannon-shot like explosion." The explosions "sent ballistics to several hundred meters of height all over the upper half of the volcano. During the first two observation days, these explosions occurred at intervals between 3-10 hours, but became the dominant type of activity during the last 24 hours of our stay, when they occurred at shorter intervals of 1-2 hours typically. Ash plumes from some of these explosions rose more than 1 km from the crater." They noted that the activity was at similar levels as during previous visits between 2012 and June 2015.
Information Contacts: Darwin Volcanic Ash Advisory Centre (VAAC), Bureau of Meteorology, Northern Territory Regional Office, PO Box 40050, Casuarina, NT 0811, Australia (URL: http://www.bom.gov.au/info/vaac/); MIROVA, a collaborative project between the Universities of Turin and Florence (Italy) supported by the Centre for Volcanic Risk of the Italian Civil Protection Department (URL: http://www.mirovaweb.it/); Hawai'i Institute of Geophysics and Planetology (HIGP), MODVOLC Thermal Alerts System, School of Ocean and Earth Science and Technology (SOEST), Univ. of Hawai'i, 2525 Correa Road, Honolulu, HI 96822, USA (URL: http://modis.higp.hawaii.edu/, http://modis.higp.hawaii.edu/); Tom Pfeiffer, Volcano Discovery (URL: https://www.volcanodiscovery.com/photos/batu-tara/nov2015expedition.html, https://www.volcanodiscovery.com/batu-tara-videos.html).
2022: January
| April
2015: April
| May
| July
| September
| October
2014: March
| April
| May
| June
| August
| October
2013: January
| February
| March
| April
| May
| July
| August
| September
| November
2012: April
| May
| June
| July
| August
| September
| October
| December
2011: March
| April
| May
| June
| July
| August
| September
| October
2010: January
| March
| April
| May
| June
| July
| August
| September
| October
2009: January
| March
| April
| May
| June
| July
| August
| September
| October
| November
2008: January
| March
| April
| May
| June
| July
| August
| October
| November
| December
2007: March
| April
| May
| June
| September
| October
2006: June
PVMBG issued VONAs noting recent increased gas emissions at Batu Tara but no confirmed eruptions. Ground-based observers reported that at 1453 and 1617 on 28 April gas emissions rose 1-1.2 km above the summit and drifted W. At 0054 on 2 May gas emissions rose 500 m and drifted W. The Alert Level remained at 1 (on a scale of 1-4).
Source: Pusat Vulkanologi dan Mitigasi Bencana Geologi (PVMBG, also known as CVGHM)
Based on analyses of satellite imagery, the Darwin VAAC reported that on 31 January an ash plume from Batu Tara rose to an altitude of 1.5 km (5,000 ft) a.s.l. and drifted ESE.
Source: Darwin Volcanic Ash Advisory Centre (VAAC)
Based on analyses of satellite imagery, the Darwin VAAC reported that during 22-26 October ash plumes from Batu Tara rose to altitudes of 1.5 km (5,000 ft) a.s.l. and drifted 35-65 km SW and W.
Source: Darwin Volcanic Ash Advisory Centre (VAAC)
Based on analysis of satellite imagery and wind data, the Darwin VAAC reported that during 14-19 October ash plumes from Batu Tara rose to altitudes of 1.8-2.1 km (6,000-7,000 ft) a.s.l. and drifted 45-130 km WSW and W.
Source: Darwin Volcanic Ash Advisory Centre (VAAC)
Based on analysis of satellite imagery and wind data, the Darwin VAAC reported that during 7-8 and 13 October ash plumes from Batu Tara rose to altitudes of 1.5-2.1 km (5,000-7,000 ft) a.s.l. and drifted 90-100 km NW and W.
Source: Darwin Volcanic Ash Advisory Centre (VAAC)
Based on a pilot observation, the Darwin VAAC reported that on 15 September an ash plume from Batu Tara drifted 185 km NW at an altitude of 1.5 km (5,000 ft) a.s.l.
Source: Darwin Volcanic Ash Advisory Centre (VAAC)
Based on analyses of satellite imagery and wind data, the Darwin VAAC reported that on 15 September ash plumes from Batu Tara rose to an altitude of 1.5 km (5,000 ft) a.s.l. and drifted 185 km NW.
Source: Darwin Volcanic Ash Advisory Centre (VAAC)
During 30 June-4 July observers at Batu Tara noted Strombolian eruptions of varying intensity at intervals ranging between 10 and 50 minutes. Three pyroclastic flows traveled as far as 200 m over the sea during a 16-hour period of elevated activity between 2 and 3 July.
Source: Volcano Discovery
Based on analyses of satellite imagery and wind data, the Darwin VAAC reported that during 21-22 May ash plumes from Batu Tara rose to an altitude of 2.5 km (8,000 ft) a.s.l. and drifted over 80 km W.
Source: Darwin Volcanic Ash Advisory Centre (VAAC)
Based on analyses of satellite imagery and wind data, the Darwin VAAC reported that during 16-19 May ash plumes from Batu Tara rose to an altitude of 2.5 km (8,000 ft) a.s.l. and drifted 35-95 km W and NW.
Source: Darwin Volcanic Ash Advisory Centre (VAAC)
Based on analyses of satellite imagery and wind data, the Darwin VAAC reported that during 6-9 May ash plumes from Batu Tara rose to an altitude of 2.1 km (7,000 ft) a.s.l. and drifted 55-85 km W and WNW.
Source: Darwin Volcanic Ash Advisory Centre (VAAC)
According to the Darwin VAAC a pilot observed an ash plume in the vicinity of Batu Tara on 7 April. The plume drifted NW at an altitude of 3 km (10,000 ft) a.s.l.
Source: Darwin Volcanic Ash Advisory Centre (VAAC)
Based on analyses of satellite imagery and wind data, the Darwin VAAC reported that on 1 November ash plumes from Batu Tara rose to altitudes of 1.2-1.5 km (4,000-5,000 ft) a.s.l. and drifted almost 95 km NE.
Source: Darwin Volcanic Ash Advisory Centre (VAAC)
Based on analyses of satellite data, the Darwin VAAC reported an ash plume from Batu Tara on 26 June that drifted 35-55 km NW and W. The Aviation Color Code remained at Orange.
Source: Darwin Volcanic Ash Advisory Centre (VAAC)
Based on analyses of satellite data, the Darwin VAAC reported an ash plume from Batu Tara on 15 June rising to an altitude of 2.1 km (7,000 ft) a.s.l. and drifting 55 km SW. During 16 June the plume was slightly lower, at 1.5 km (5,000 ft) a.s.l., extending 37 km NW.
Source: Darwin Volcanic Ash Advisory Centre (VAAC)
Based on analyses of satellite imagery and wind data, the Darwin VAAC reported that on 6 June an ash plume from Batu Tara rose to an altitude of 2.1 km (7,000 ft) a.s.l. and drifted 150 km NW. During 7-9 June ash plumes rose to an altitude of 2.1 km (7,000 ft) a.s.l. and drifted over 35 km NW and W.
Source: Darwin Volcanic Ash Advisory Centre (VAAC)
Based on analyses of satellite imagery and wind data, the Darwin VAAC reported that during 26-27 May ash plumes from Batu Tara rose to altitudes of 1.2-2.1 km (4,000-7,000 ft) a.s.l. and drifted 25-95 km NW and W.
Source: Darwin Volcanic Ash Advisory Centre (VAAC)
Based on analyses of satellite imagery and wind data, the Darwin VAAC reported that during 16-18 May ash plumes from Batu Tara rose to an altitude of 2.4 km (8,000 ft) a.s.l. and drifted 55-75 km NW and W.
Source: Darwin Volcanic Ash Advisory Centre (VAAC)
Based on analyses of satellite imagery and wind data, the Darwin VAAC reported that during 27-28 April ash plumes from Batu Tara rose to an altitude of 3 km (10,000 ft) a.s.l. and drifted 35-55 km NE and N.
Source: Darwin Volcanic Ash Advisory Centre (VAAC)
Based on analyses of satellite imagery and wind data, the Darwin Volcanic Ash Advisory Centre (VAAC) reported that on 26 March an ash plume from Batu Tara drifted almost 30 km W.
Source: Darwin Volcanic Ash Advisory Centre (VAAC)
Based on analyses of satellite imagery and wind data, the Darwin VAAC reported that on 22 March an ash plume from Batu Tara drifted almost 20 km W.
Source: Darwin Volcanic Ash Advisory Centre (VAAC)
Based on analyses of satellite imagery and wind data, the Darwin Volcanic Ash Advisory Centre (VAAC) reported that on 6 November an ash plume from Batu Tara drifted almost 20 km W.
Source: Darwin Volcanic Ash Advisory Centre (VAAC)
Based on analyses of satellite imagery and wind data, the Darwin Volcanic Ash Advisory Centre (VAAC) reported that during 18-21 September ash plumes from Batu Tara rose to altitudes of 2.1-2.7 km (7,000-9,000 ft) a.s.l. and drifted 35-100 km WSW, W, NW, N, and NE.
Source: Darwin Volcanic Ash Advisory Centre (VAAC)
Based on analyses of satellite imagery and wind data, the Darwin Volcanic Ash Advisory Centre (VAAC) reported that during 13-17 September ash plumes from Batu Tara rose to an altitude of 2.1 km (7,000 ft) a.s.l. and drifted 45-65 km W, NW, and N.
Source: Darwin Volcanic Ash Advisory Centre (VAAC)
Based on analyses of satellite imagery and wind data, the Darwin Volcanic Ash Advisory Centre (VAAC) reported that on 5 September an ash plume from Batu Tara rose to an altitude of 2.1 km (7,000 ft) a.s.l. and drifted 75 km W.
Source: Darwin Volcanic Ash Advisory Centre (VAAC)
Based on analyses of satellite imagery and wind data, the Darwin Volcanic Ash Advisory Centre (VAAC) reported that during 2-3 September ash plumes from Batu Tara rose to an altitude of 2.1 km (7,000 ft) a.s.l. and drifted 75 km W.
Source: Darwin Volcanic Ash Advisory Centre (VAAC)
Based on analyses of satellite imagery and wind data, the Darwin Volcanic Ash Advisory Centre (VAAC) reported that on 16 August an ash plume from Batu Tara rose to an altitude of 1.5 km (5,000 ft) a.s.l. and drifted 130 km W.
Source: Darwin Volcanic Ash Advisory Centre (VAAC)
Based on analyses of satellite imagery and wind data, the Darwin Volcanic Ash Advisory Centre (VAAC) reported that on 14 July an ash plume from Batu Tara rose to an altitude of 2.1 km (7,000 ft) a.s.l. and drifted about 40 km NW.
Source: Darwin Volcanic Ash Advisory Centre (VAAC)
Based on analyses of satellite imagery and wind data, the Darwin Volcanic Ash Advisory Centre (VAAC) reported that during 1 and 6-7 May ash plumes from Batu Tara rose to an altitude of 2.1 km (7,000 ft) a.s.l. and drifted 45-55 km NW and W.
Source: Darwin Volcanic Ash Advisory Centre (VAAC)
Based on analyses of satellite imagery and wind data, the Darwin Volcanic Ash Advisory Centre (VAAC) reported that during 24-30 April ash plumes from Batu Tara rose to altitudes of 1.5-2.1 km (5,000-7,000 ft) a.s.l. and drifted 35-110 km W, WNW, and NW.
Source: Darwin Volcanic Ash Advisory Centre (VAAC)
Based on analyses of satellite imagery and wind data, the Darwin Volcanic Ash Advisory Centre (VAAC) reported that during 17 and 20-21 April ash plumes from Batu Tara rose to an altitude of 2.1 km (7,000 ft) a.s.l. and drifted 45-55 km N, NW, and W. On 23 April an ash plume rose to an altitude of 1.5 km (5,000 ft) a.s.l. and drifted 18-27 km NW.
Source: Darwin Volcanic Ash Advisory Centre (VAAC)
Based on analyses of satellite imagery and wind data, the Darwin Volcanic Ash Advisory Centre (VAAC) reported that during 13-16 April ash plumes from Batu Tara rose to altitudes of 1.5-2.1 km (5,000-7,000 ft) a.s.l. and drifted 25-45 km NW, N, NE, and SE.
Source: Darwin Volcanic Ash Advisory Centre (VAAC)
Based on analyses of satellite imagery and wind data, the Darwin Volcanic Ash Advisory Centre (VAAC) reported that during 5-7 April ash plumes from Batu Tara rose to an altitude of 2.1 km (7,000 ft) a.s.l. and drifted 35-45 km SW, WSW, and NW.
Source: Darwin Volcanic Ash Advisory Centre (VAAC)
Based on analyses of satellite imagery and wind data, the Darwin Volcanic Ash Advisory Centre (VAAC) reported that during 30 March-1 April ash plumes from Batu Tara rose to altitudes of 2.4-3 km (8,000-10,000 ft) a.s.l. and drifted 55-75 km NE.
Source: Darwin Volcanic Ash Advisory Centre (VAAC)
Based on analyses of satellite imagery and wind data, the Darwin Volcanic Ash Advisory Centre (VAAC) reported that on 20 March ash plumes from Batu Tara drifted 110 km NW. During 21-26 March ash plumes rose to altitudes of 2.1-3 km (7,000-10,000 ft) a.s.l. and drifted 35-95 km SW, W, N, NW, and NE.
Source: Darwin Volcanic Ash Advisory Centre (VAAC)
Based on analyses of satellite imagery and wind data, the Darwin Volcanic Ash Advisory Centre (VAAC) reported that on 17 March ash plumes from Batu Tara rose to an altitude of 3 km (10,000 ft) a.s.l. and drifted 55-95 km NW. During 18-19 March ash plumes drifted 55-110 km NW and WNW.
Source: Darwin Volcanic Ash Advisory Centre (VAAC)
Based on analyses of satellite imagery and wind data, the Darwin Volcanic Ash Advisory Centre (VAAC) reported that during 8-9 March ash plumes from Batu Tara rose to an altitude of 2.4 km (8,000 ft) a.s.l. and drifted over 45 km E.
Source: Darwin Volcanic Ash Advisory Centre (VAAC)
Based on analyses of satellite imagery and wind data, the Darwin Volcanic Ash Advisory Centre (VAAC) reported that on 13 February ash plumes from Batu Tara rose to altitudes of 2.1 km (7,000 ft) a.s.l. and drifted over 35 km N. On 18 February ash plumes rose to an altitude of 1.5 km (5,000 ft) a.s.l. and drifted 37 km NE.
Source: Darwin Volcanic Ash Advisory Centre (VAAC)
Based on analyses of satellite imagery and wind data, the Darwin Volcanic Ash Advisory Centre (VAAC) reported that during 6 and 8-12 February ash plumes from Batu Tara rose to altitudes of 2.1-3.7 km (7,000-12,000 ft) a.s.l. and drifted 35-75 km W, NW, and N.
Source: Darwin Volcanic Ash Advisory Centre (VAAC)
Based on analyses of satellite imagery and wind data, the Darwin Volcanic Ash Advisory Centre (VAAC) reported that on 29 January ash plumes from Batu Tara rose to an altitude of 1.8 km (6,000 ft) a.s.l. and drifted E. Ash plumes rose to an altitude of 2.1 km (7,000 ft) a.s.l. and drifted over 110 km W on 4 February and 55 km W on 5 February.
Source: Darwin Volcanic Ash Advisory Centre (VAAC)
Based on analyses of satellite imagery and wind data, the Darwin Volcanic Ash Advisory Centre (VAAC) reported that during 27-28 January ash plumes from Batu Tara rose to altitudes of 1.8-2.1 km (6,000-7,000 ft) a.s.l. and drifted 37 km NE and E.
Source: Darwin Volcanic Ash Advisory Centre (VAAC)
Based on analyses of satellite imagery and wind data, the Darwin Volcanic Ash Advisory Centre (VAAC) reported that on 14 December ash plumes from Batu Tara rose to an altitude of 2.4 km (8,000 ft) a.s.l. and drifted 75 km NW.
Source: Darwin Volcanic Ash Advisory Centre (VAAC)
Based on analyses of satellite imagery, the Darwin Volcanic Ash Advisory Centre (VAAC) reported that during 6-7 October ash plumes from Batu Tara rose to an altitude of 2.4 km (8,000 ft) a.s.l. and drifted 45 km W.
Source: Darwin Volcanic Ash Advisory Centre (VAAC)
Based on analyses of satellite imagery, the Darwin Volcanic Ash Advisory Centre (VAAC) reported that during 26-28 September ash plumes from Batu Tara rose to an altitude of 2.4 km (8,000 ft) a.s.l. and drifted 18-37 km NW, W, and SW.
Source: Darwin Volcanic Ash Advisory Centre (VAAC)
Based on analyses of satellite imagery, the Darwin Volcanic Ash Advisory Centre (VAAC) reported that on 25 September an ash plume from Batu Tara rose to an altitude of 2.4 km (8,000 ft) a.s.l. and drifted 28 km NW.
Source: Darwin Volcanic Ash Advisory Centre (VAAC)
Based on analyses of satellite imagery, the Darwin Volcanic Ash Advisory Centre (VAAC) reported that during 12-16 September ash plumes from Batu Tara rose to an altitude of 2.1 km (7,000 ft) a.s.l. and drifted 28-130 km W and NW.
Source: Darwin Volcanic Ash Advisory Centre (VAAC)
Based on analyses of satellite imagery, the Darwin Volcanic Ash Advisory Centre (VAAC) reported that during 5-11 August ash plumes from Batu Tara rose to an altitude of 2.1 km (7,000 ft) a.s.l. and drifted 55-75 km W, WNW, and NW.
Source: Darwin Volcanic Ash Advisory Centre (VAAC)
Based on analyses of satellite imagery, the Darwin Volcanic Ash Advisory Centre (VAAC) reported that during 30 August-4 September ash plumes from Batu Tara rose to altitudes of 1.8-2.1 km (6,000-7,000 ft) a.s.l. and drifted 45-55 km W and NW.
Source: Darwin Volcanic Ash Advisory Centre (VAAC)
Based on analyses of satellite imagery, the Darwin Volcanic Ash Advisory Centre (VAAC) reported that on 22 August ash plumes from Batu Tara rose to an altitude of 2.1 km (7,000 ft) a.s.l. and drifted 45 km W. During 25-7 August ash plumes rose to an altitude of 1.8 km (6,000 ft) a.s.l. and drifted 35-110 km W.
Source: Darwin Volcanic Ash Advisory Centre (VAAC)
Based on analyses of satellite imagery, the Darwin Volcanic Ash Advisory Centre (VAAC) reported that during 15-21 August ash plumes from Batu Tara rose to an altitude of 2.1 km (7,000 ft) a.s.l. and drifted 35-95 km W, NW, and NNW.
Source: Darwin Volcanic Ash Advisory Centre (VAAC)
Based on analyses of satellite imagery, the Darwin Volcanic Ash Advisory Centre (VAAC) reported that during 11-14 August ash plumes from Batu Tara rose to an altitude of 2.1 km (7,000 ft) a.s.l. and drifted 25-75 km NW and W.
Source: Darwin Volcanic Ash Advisory Centre (VAAC)
Based on analyses of satellite imagery, the Darwin Volcanic Ash Advisory Centre (VAAC) reported that during 1-2 and 4-7 August ash plumes from Batu Tara rose to altitudes of 1.8-2.1 km (6,000-7,000 ft) a.s.l. and drifted 37-65 km NW and W.
Source: Darwin Volcanic Ash Advisory Centre (VAAC)
Based on analyses of satellite imagery, the Darwin Volcanic Ash Advisory Centre (VAAC) reported that during 24-31 July ash plumes from Batu Tara rose to an altitude of 2.1 km (7,000 ft) a.s.l. and drifted 37-110 km W, NW, and N.
Source: Darwin Volcanic Ash Advisory Centre (VAAC)
Based on analyses of satellite imagery, the Darwin Volcanic Ash Advisory Centre (VAAC) reported that ash plumes from Batu Tara rose to an altitude of 2.1 km (7,000 ft) a.s.l. and drifted 45 km W during 22-23 July and 110 km N and NW on 24 July.
Source: Darwin Volcanic Ash Advisory Centre (VAAC)
Based on analyses of satellite imagery, the Darwin Volcanic Ash Advisory Centre (VAAC) reported that during 13-15 July ash plumes from Batu Tara rose to an altitude of 2.4 km (8,000 ft) a.s.l. and drifted 55-110 km NW and W.
Source: Darwin Volcanic Ash Advisory Centre (VAAC)
Based on analyses of satellite imagery, the Darwin Volcanic Ash Advisory Centre (VAAC) reported that on 8 July an ash plume from Batu Tara rose to an altitude of 1.5 km (5,000 ft) a.s.l. and drifted almost 95 km SW.
Source: Darwin Volcanic Ash Advisory Centre (VAAC)
Based on analyses of satellite imagery, the Darwin VAAC reported that on 27 June ash plumes from Batu Tara rose to an altitude of 1.8 km (6,000 ft) a.s.l. and drifted almost 30 km NW.
Source: Darwin Volcanic Ash Advisory Centre (VAAC)
Based on analyses of satellite imagery, the Darwin VAAC reported that on 19 June ash plumes from Batu Tara rose to an altitude of 2.4 km (8,000 ft) a.s.l. During 24-26 June ash plumes rose to an altitude of 1.8 km (6,000 ft) a.s.l. and drifted 15-95 km NNW and NW.
Source: Darwin Volcanic Ash Advisory Centre (VAAC)
Based on analyses of satellite imagery, the Darwin VAAC reported that on 18 June ash plumes from Batu Tara rose to an altitude of 2.4 km (8,000 ft) a.s.l. and drifted 110-150 km W.
Source: Darwin Volcanic Ash Advisory Centre (VAAC)
Based on analyses of satellite imagery, the Darwin VAAC reported that during 4-5 and 9-12 June ash plumes from Batu Tara rose to altitudes of 1.8-3 km (6,000-10,000 ft) a.s.l. and drifted 37-93 km NW and W.
Source: Darwin Volcanic Ash Advisory Centre (VAAC)
Based on analyses of satellite imagery, the Darwin VAAC reported that during 2-5 June ash plumes from Batu Tara rose to an altitude of 1.8 km (6,000 ft) a.s.l. and drifted 37-110 km NW.
Source: Darwin Volcanic Ash Advisory Centre (VAAC)
Based on analyses of satellite imagery, the Darwin VAAC reported that during 18 and 20-21 May ash plumes from Batu Tara rose to altitudes of 2.4-3 km (8,000-10,000 ft) a.s.l. and drifted 27-55 km N and NW.
Source: Darwin Volcanic Ash Advisory Centre (VAAC)
Based on analyses of satellite imagery, the Darwin VAAC reported that during 2-4 May ash plumes from Batu Tara rose to an altitude of 2.4 km (8,000 ft) a.s.l. and drifted 37 km NW.
Source: Darwin Volcanic Ash Advisory Centre (VAAC)
Based on analyses of satellite imagery, the Darwin VAAC reported that during 25-26 April ash plumes from Batu Tara rose to an altitude of 2.4 km (8,000 ft) a.s.l. and drifted 37 km W and SW. During 30 April-1 May ash plumes again rose to an altitude of 2.4 km (8,000 ft) a.s.l. then drifted 37-55 km NW.
Source: Darwin Volcanic Ash Advisory Centre (VAAC)
Based on analyses of satellite imagery, the Darwin VAAC reported that on 27 October an ash plume from Batu Tara rose to an altitude of 2.1 km (7,000 ft) a.s.l. and drifted about 45 km W.
Source: Darwin Volcanic Ash Advisory Centre (VAAC)
Based on analyses of satellite imagery, the Darwin VAAC reported that during 21-24 September ash plumes from Batu Tara rose to an altitude of 2.1 km (7,000 ft) a.s.l. and drifted 37-65 km W, WNW, and NW.
Source: Darwin Volcanic Ash Advisory Centre (VAAC)
Based on analyses of satellite imagery, the Darwin VAAC reported that during 13-20 September ash plumes from Batu Tara rose to an altitude of 2.1 km (7,000 ft) a.s.l. and drifted 25-75 km W, WNW, and NW.
Source: Darwin Volcanic Ash Advisory Centre (VAAC)
Based on analyses of satellite imagery, the Darwin VAAC reported that during 8-13 September ash plumes from Batu Tara rose to an altitude of 2.1 km (7,000 ft) a.s.l. and drifted 37-65 km NW and W.
Source: Darwin Volcanic Ash Advisory Centre (VAAC)
Based on analyses of satellite imagery, the Darwin VAAC reported that during 23-30 August ash plumes from Batu Tara rose to an altitude of 2.1 km (7,000 ft) a.s.l. and drifted 20-90 km N, NW, and W.
Source: Darwin Volcanic Ash Advisory Centre (VAAC)
Based on analyses of satellite imagery, the Darwin VAAC reported that during 9-11 July ash plumes from Batu Tara rose to altitudes of 1.5-3 km (5,000-10,000 ft) a.s.l. and drifted 75 km W and NW.
Source: Darwin Volcanic Ash Advisory Centre (VAAC)
Based on analyses of satellite imagery, the Darwin VAAC reported that during 1-3 July ash plumes from Batu Tara rose to an altitude of 2.4 km (8,000 ft) a.s.l. and drifted 75 km NW.
Source: Darwin Volcanic Ash Advisory Centre (VAAC)
Based on analyses of satellite imagery, the Darwin VAAC reported that during 22-25 June ash plumes from Batu Tara rose to an altitude of 2.4 km (8,000 ft) a.s.l. and drifted 35-75 km W and NW.
Source: Darwin Volcanic Ash Advisory Centre (VAAC)
Based on analyses of satellite imagery, the Darwin VAAC reported that during 16-20 June ash plumes from Batu Tara rose to an altitude of 2.4 km (8,000 ft) a.s.l. and drifted 55-75 km W, NW, and N.
Source: Darwin Volcanic Ash Advisory Centre (VAAC)
Based on analyses of satellite imagery, the Darwin VAAC reported that during 8-13 June ash plumes from Batu Tara rose to an altitude of 2.4 km (8,000 ft) a.s.l. and drifted 55-75 km NW, N, and E.
Source: Darwin Volcanic Ash Advisory Centre (VAAC)
Based on analyses of satellite imagery, the Darwin VAAC reported that during 1-7 June ash plumes from Batu Tara rose to altitudes of 1.8-2.4 km (6,000-8,000 ft) a.s.l. and drifted 40-130 km NW, W, and SW.
Source: Darwin Volcanic Ash Advisory Centre (VAAC)
Based on analyses of satellite imagery, the Darwin VAAC reported that during 24-27 May ash plumes from Batu Tara rose to an altitude of 2.4 km (8,000 ft) a.s.l. and drifted less than 40 km W, NW, and N.
Source: Darwin Volcanic Ash Advisory Centre (VAAC)
Based on analyses of satellite imagery, the Darwin VAAC reported that during 17 and 19-22 May ash plumes from Batu Tara rose to altitudes of 1.8-2.4 km (6,000-8,000 ft) a.s.l. and drifted 75-110 km W, NW, and N.
Source: Darwin Volcanic Ash Advisory Centre (VAAC)
Based on analyses of satellite imagery, the Darwin VAAC reported that on 15 and 17 May ash plumes from Batu Tara rose to an altitude of 1.8 km (6,000 ft) a.s.l. and drifted 75-130 km W and NW.
Source: Darwin Volcanic Ash Advisory Centre (VAAC)
Based on analyses of satellite imagery, the Darwin VAAC reported that during 4-7 May ash plumes from Batu Tara rose to altitudes of 0.9-2.1 km (3,000-7,000 ft) a.s.l. and drifted 18-75 km NW, W, and SW.
Source: Darwin Volcanic Ash Advisory Centre (VAAC)
Based on analyses of satellite imagery, the Darwin VAAC reported that during 28 April-3 May ash plumes from Batu Tara rose to an altitude of 3 km (10,000 ft) a.s.l. and drifted 10-130 km N, NW, W, and SW.
Source: Darwin Volcanic Ash Advisory Centre (VAAC)
Based on analyses of satellite imagery, the Darwin VAAC reported that on 20 March an ash plume from Batu Tara rose to an altitude of 2.1 km (7,000 ft) a.s.l. and drifted less than 30 km NE.
Source: Darwin Volcanic Ash Advisory Centre (VAAC)
Based on analyses of satellite imagery, the Darwin VAAC reported that on 6 October ash plumes from Batu Tara rose to an altitude of 1.5 km (5,000 ft) a.s.l. and drifted 55 km W.
Source: Darwin Volcanic Ash Advisory Centre (VAAC)
Based on analyses of satellite imagery, the Darwin VAAC reported that during 29 September-5 October ash plumes from Batu Tara rose to an altitude of 1.5 km (5,000 ft) a.s.l. and drifted 35-95 km W and NW.
Source: Darwin Volcanic Ash Advisory Centre (VAAC)
Based on analyses of satellite imagery, the Darwin VAAC reported that during 18-20 September ash plumes from Batu Tara rose to an altitude of 1.5 km (5,000 ft) a.s.l. and drifted 35-95 km W and NW.
Source: Darwin Volcanic Ash Advisory Centre (VAAC)
Based on analyses of satellite imagery, the Darwin VAAC reported that on 8 September an ash plume from Batu Tara rose to an altitude of 2.4 km (8,000 ft) a.s.l. and drifted 55 km NW.
Source: Darwin Volcanic Ash Advisory Centre (VAAC)
Based on analyses of satellite imagery, the Darwin VAAC reported that during 1-7 September ash plumes from Batu Tara rose to altitudes of 1.5-2.4 km (5,000-8,000 ft) a.s.l. and drifted 45-65 km W and NW.
Source: Darwin Volcanic Ash Advisory Centre (VAAC)
Based on analyses of satellite imagery, the Darwin VAAC reported that during 26-28 August ash plumes from Batu Tara rose to an altitude of 1.5 km (5,000 ft) a.s.l. and drifted 55-75 km. The plumes drifted W and NW during 27-28 August.
Source: Darwin Volcanic Ash Advisory Centre (VAAC)
Based on analyses of satellite imagery, the Darwin VAAC reported that during 20-23 August ash plumes from Batu Tara drifted 25-65 km NW and W at an altitude of 1.5 km (5,000 ft) a.s.l.
Source: Darwin Volcanic Ash Advisory Centre (VAAC)
Based on analyses of satellite imagery, the Darwin VAAC reported that during 13-17 August ash plumes from Batu Tara drifted 35-95 km NW and W at altitudes of 1.5-3 km (5,000-10,000 ft) a.s.l.
Source: Darwin Volcanic Ash Advisory Centre (VAAC)
Based on analyses of satellite imagery, the Darwin VAAC reported that during 9-10 August ash plumes from Batu Tara drifted NW and SW at an altitude of 1.5 km (5,000 ft) a.s.l.
Source: Darwin Volcanic Ash Advisory Centre (VAAC)
Based on analyses of satellite imagery, the Darwin VAAC reported that during 30-31 July an ash plume from Batu Tara drifted 65 km NW at an altitude of 1.5 km (5,000 ft) a.s.l.
Source: Darwin Volcanic Ash Advisory Centre (VAAC)
Based on analyses of satellite imagery, the Darwin VAAC reported that on 21 July an ash plume from Batu Tara drifted 55 km NW at an altitude of 1.5 km (5,000 ft) a.s.l.
Source: Darwin Volcanic Ash Advisory Centre (VAAC)
Based on analyses of satellite imagery, the Darwin VAAC reported that during 18-20 July ash plumes from Batu Tara rose to an altitude of 1.5 km (5,000 ft) a.s.l. and drifted more than 35 km NW.
Source: Darwin Volcanic Ash Advisory Centre (VAAC)
Based on analyses of satellite imagery, the Darwin VAAC reported that during 19-20 June ash plumes from Batu Tara rose to an altitude of 3 km (10,000 ft) a.s.l. and drifted more than 35 km NW.
Source: Darwin Volcanic Ash Advisory Centre (VAAC)
Based on analyses of satellite imagery, the Darwin VAAC reported that during 9 and 11-15 June ash plumes from Batu Tara rose to an altitude of 2.4 km (8,000 ft) a.s.l. and drifted 35-65 km W and NW.
Source: Darwin Volcanic Ash Advisory Centre (VAAC)
Based on analyses of satellite imagery, the Darwin VAAC reported that during 2-7 June ash plumes from Batu Tara rose to an altitude of 2.4 km (8,000 ft) a.s.l. and drifted 20-65 km W, NW, and N.
Source: Darwin Volcanic Ash Advisory Centre (VAAC)
Based on analyses of satellite imagery, the Darwin VAAC reported that on 20 May an ash plume from Batu Tara rose to an altitude of 2.4 km (8,000 ft) a.s.l. and drifted 65 km W.
Source: Darwin Volcanic Ash Advisory Centre (VAAC)
Based on analyses of satellite imagery, the Darwin VAAC reported that on 28 and 30 April and during 1-3 May ash plumes from Batu Tara rose to altitudes of 2.1-2.4 km (7,000-8,000 ft) a.s.l. and drifted 35-95 km SW, W, and NW.
Source: Darwin Volcanic Ash Advisory Centre (VAAC)
Based on analyses of satellite imagery, the Darwin VAAC reported that during 25-27 April ash plumes from Batu Tara rose to an altitude of 2.1 km (7,000 ft) a.s.l. and drifted 45-85 km W and N.
Source: Darwin Volcanic Ash Advisory Centre (VAAC)
Based on analyses of satellite imagery, the Darwin VAAC reported that during 6-11 April ash plumes from Batu Tara rose to an altitude of 2.1 km (7,000 ft) a.s.l. and drifted 25-75 km NW, NE, E, and SE.
Source: Darwin Volcanic Ash Advisory Centre (VAAC)
Based on analyses of satellite imagery, the Darwin VAAC reported that on 5 April an ash plume from Batu Tara rose to an altitude of 2.1 km (7,000 ft) a.s.l. and drifted more than 35 km N.
Source: Darwin Volcanic Ash Advisory Centre (VAAC)
Based on analyses of satellite imagery, the Darwin VAAC reported that during 24-26 March ash plumes from Batu Tara rose to an altitude of 2.4 km (8,000 ft) a.s.l. and drifted about 10-120 km W, NW, and NE.
Source: Darwin Volcanic Ash Advisory Centre (VAAC)
Based on analyses of satellite imagery, the Darwin VAAC reported that during 17-18 and 22-23 March ash plumes from Batu Tara rose to an altitude of 2.4 km (8,000 ft) a.s.l. and drifted about 30-95 km NW.
Source: Darwin Volcanic Ash Advisory Centre (VAAC)
Based on analyses of satellite imagery, the Darwin VAAC reported that during 10-16 March ash plumes from Batu Tara rose to altitudes of 2.1-2.4 km (7,000-8,000 ft) a.s.l. and drifted about 20-150 km N, NW, W, SW, and SSE.
Source: Darwin Volcanic Ash Advisory Centre (VAAC)
Based on analyses of satellite imagery, the Darwin VAAC reported that during 8-9 March ash plumes from Batu Tara rose to altitudes of 1.5-2.4 km (5,000-8,000 ft) a.s.l. and drifted 45-120 km W and NW.
Source: Darwin Volcanic Ash Advisory Centre (VAAC)
Based on analyses of satellite imagery, the Darwin VAAC reported that on 23 January an ash plume from Batu Tara rose to an altitude of 1.5 km (5,000 ft) a.s.l. and drifted 25 km E.
Source: Darwin Volcanic Ash Advisory Centre (VAAC)
Based on analyses of satellite imagery, the Darwin VAAC reported that on 24 November an ash plume from Batu Tara rose to an altitude of 2.4 km (8,000 ft) a.s.l. and drifted 90 km NW.
Source: Darwin Volcanic Ash Advisory Centre (VAAC)
Based on analyses of satellite imagery, the Darwin VAAC reported that on 27 October ash plumes from Batu Tara were seen drifting 65 km W and NW at an altitude of 2.1 km (7,000 ft) a.s.l.
Source: Darwin Volcanic Ash Advisory Centre (VAAC)
Based on analyses of satellite imagery, the Darwin VAAC reported that during 14-16 October ash plumes from Batu Tara were seen drifting 25-185 km W and N at an altitude of 1.8 km (6,000 ft) a.s.l.
Source: Darwin Volcanic Ash Advisory Centre (VAAC)
Based on analyses of satellite imagery, the Darwin VAAC reported that on 6 October an ash plume from Batu Tara was seen drifting 65 km W at an altitude of 2.4 km (8,000 ft) a.s.l.
Source: Darwin Volcanic Ash Advisory Centre (VAAC)
Based on analyses of satellite imagery, the Darwin VAAC reported that during 30 September-3 October and 5-6 October ash plumes from Batu Tara rose to an altitude of 2.4 km (8,000 ft) a.s.l. and drifted 25-75 km W, NW, and N.
Source: Darwin Volcanic Ash Advisory Centre (VAAC)
Based on analyses of satellite imagery, the Darwin VAAC reported that during 23-29 September ash plumes from Batu Tara rose to altitudes of 1.5-2.4 km (5,000-8,000 ft) a.s.l. and drifted 15-75 km W and NW.
Source: Darwin Volcanic Ash Advisory Centre (VAAC)
Based on analyses of satellite imagery, the Darwin VAAC reported that during 16-19 and 21-22 September ash plumes from Batu Tara rose to an altitude of 1.5 km (5,000 ft) a.s.l. and drifted 20-65 km W, NW, N, and NE.
Source: Darwin Volcanic Ash Advisory Centre (VAAC)
Based on analyses of satellite imagery, the Darwin VAAC reported that during 9-11 and 14-15 September ash plumes from Batu Tara rose to an altitude of 1.5 m (5,000 ft) a.s.l. and drifted 25-45 km W and NW.
Source: Darwin Volcanic Ash Advisory Centre (VAAC)
Based on analyses of satellite imagery, the Darwin VAAC reported that during 2-8 September ash plumes from Batu Tara rose to an altitude of 1.5 m (5,000 ft) a.s.l. and drifted 10-55 km W and NW.
Source: Darwin Volcanic Ash Advisory Centre (VAAC)
Based on analyses of satellite imagery, the Darwin VAAC reported that during 26 August-1 September ash plumes from Batu Tara rose to altitudes of 1.5-2.4 m (5,000-8,000 ft) a.s.l. and drifted 15-55 km W, NW, and N.
Source: Darwin Volcanic Ash Advisory Centre (VAAC)
Based on analyses of satellite imagery, the Darwin VAAC reported that during 19 and 21-25 August ash plumes from Batu Tara rose to an altitude of 1.5 m (5,000 ft) a.s.l. and drifted 35-150 km W, WNW, and NW.
Source: Darwin Volcanic Ash Advisory Centre (VAAC)
Based on analyses of satellite imagery, the Darwin VAAC reported that during 12-13 and 15-17 August ash plumes from Batu Tara rose to altitudes of 1.5-3 m (5,000-7,000 ft) a.s.l. and drifted 5-110 km W, NW, and N.
Source: Darwin Volcanic Ash Advisory Centre (VAAC)
Based on analyses of satellite imagery, the Darwin VAAC reported that during 4-7 August ash plumes from Batu Tara rose to altitudes of 1.5-2.1 km (5,000-7,000 ft) a.s.l. and drifted 45-90 km W, NW, and N.
Source: Darwin Volcanic Ash Advisory Centre (VAAC)
Based on analyses of satellite imagery, the Darwin VAAC reported that on 29-31 July ash plumes from Batu Tara rose to an altitude of 1.5 km (5,000 ft) a.s.l. and drifted as far away as 37 km NW and N.
Source: Darwin Volcanic Ash Advisory Centre (VAAC)
Based on analyses of satellite imagery, the Darwin VAAC reported that on 23 July an ash plume from Batu Tara rose to an altitude of 2.4 km (8,000 ft) a.s.l. and drifted 55 km W. On 27 and 28 July, ash plumes rose to an altitude of 1.5 km (5,000 ft) a.s.l. and drifted as far away as 150 km NW.
Source: Darwin Volcanic Ash Advisory Centre (VAAC)
Based on analyses of satellite imagery, the Darwin VAAC reported that during 15-18 July ash plumes from Batu Tara rose to an altitude of 1.5 km (5,000 ft) a.s.l. and drifted 20-55 km in multiple directions.
Source: Darwin Volcanic Ash Advisory Centre (VAAC)
Based on analysis of satellite imagery, the Darwin VAAC reported that on 8 July ash plumes from Batu Tara rose to an altitude of 2.4 km (8,000 ft) a.s.l. and drifted 55 km W and NW. During 12-14 July, ash plumes rose to an altitude of 1.5 km (5,000 ft) a.s.l. and drifted 25-55 km W, NW, and N.
Source: Darwin Volcanic Ash Advisory Centre (VAAC)
Based on analysis of satellite imagery, the Darwin VAAC reported that during 1-7 July ash plumes from Batu Tara rose to altitudes of 1.5-2.4 km (5,000-8,000 ft) a.s.l. and drifted 35-110 km W, NW, and N. A thermal anomaly was detected on 3 July.
Source: Darwin Volcanic Ash Advisory Centre (VAAC)
Based on analysis of satellite imagery, the Darwin VAAC reported that during 25-30 June ash plumes from Batu Tara rose to an altitude of 1.5 km (5,000 ft) a.s.l. and drifted 35-130 km SW, W, and NW.
Source: Darwin Volcanic Ash Advisory Centre (VAAC)
Based on analysis of satellite imagery, the Darwin VAAC reported that during 10-16 June ash plumes from Batu Tara rose to altitudes of 1.5-2.4 km (5,000-8,000 ft) a.s.l. and drifted 25-185 km SW, NW, N, and NE.
Source: Darwin Volcanic Ash Advisory Centre (VAAC)
Based on analysis of satellite imagery, the Darwin VAAC reported that during 3-8 June ash plumes from Batu Tara rose to an altitude of 2.4 km (8,000 ft) a.s.l. and drifted 40-75 km NW, W, and SW. On 9 June, an ash plume drifted 140 km W.
Source: Darwin Volcanic Ash Advisory Centre (VAAC)
Based on analysis of satellite imagery, the Darwin VAAC reported that during 27 May-2 June ash plumes from Batu Tara rose to an altitude of 2.4 km (8,000 ft) a.s.l. and drifted 25-75 km NW, W, and SW. A thermal anomaly was also identified on satellite imagery on 29 May.
Source: Darwin Volcanic Ash Advisory Centre (VAAC)
Based on analysis of satellite imagery, the Darwin VAAC reported that on 20 May ash plumes from Batu Tara rose to an altitude of 3 km (10,000 ft) a.s.l. and drifted 65 km NW. On 26 May, an ash plume rose to an altitude of 2.4 km (8,000 ft) a.s.l. and drifted 55 km NW. A thermal anomaly was also identified on satellite imagery.
Source: Darwin Volcanic Ash Advisory Centre (VAAC)
Based on analysis of satellite imagery, the Darwin VAAC reported that during 14-19 May ash plumes from Batu Tara rose to an altitude of 3 km (10,000 ft) a.s.l. and drifted 35-75 km W, NW, and N.
Source: Darwin Volcanic Ash Advisory Centre (VAAC)
Based on analysis of satellite imagery, the Darwin VAAC reported that on 5 May an ash plume from Batu Tara rose to an altitude of 2.4 km (8,000 ft) a.s.l. and drifted 55 km W.
Source: Darwin Volcanic Ash Advisory Centre (VAAC)
Based on analysis of satellite imagery, the Darwin VAAC reported that during 29-30 April and 3-4 May ash plumes from Batu Tara rose to altitudes of 2.4-3 km (8,000-10,000 ft) a.s.l. and drifted 45-185 km NW and W.
Source: Darwin Volcanic Ash Advisory Centre (VAAC)
Based on analysis of satellite imagery, the Darwin VAAC reported that during 24-25 and 28 April ash plumes from Batu Tara rose to an altitude of 3 km (10,000 ft) a.s.l. and drifted up to 110 km in multiple directions.
Source: Darwin Volcanic Ash Advisory Centre (VAAC)
Based on analysis of satellite imagery, the Darwin VAAC reported that during 15-16 April ash plumes from Batu Tara rose to altitudes of 1.8-2.4 km (6,000-8,000 ft) a.s.l. and drifted 35-75 km W and NW.
Source: Darwin Volcanic Ash Advisory Centre (VAAC)
Based on analysis of satellite imagery, the Darwin VAAC reported that during 11-12 and 14 April ash plumes from Batu Tara rose to altitudes of 1.8-2.4 km (6,000-8,000 ft) a.s.l. and drifted 35-90 km W and NW.
Source: Darwin Volcanic Ash Advisory Centre (VAAC)
Based on analysis of satellite imagery, the Darwin VAAC reported that during 5-6 April ash plumes from Batu Tara rose to an altitude of 2.4 km (8,000 ft) a.s.l. and drifted 40-210 km W.
Source: Darwin Volcanic Ash Advisory Centre (VAAC)
Based on analysis of satellite imagery, the Darwin VAAC reported that during 25-27 March ash plumes from Batu Tara rose to an altitude of 2.1 km (7,000 ft) a.s.l. and drifted about 30-110 km NW.
Source: Darwin Volcanic Ash Advisory Centre (VAAC)
Based on analysis of satellite imagery, the Darwin VAAC reported that on 20 March an ash plume from Batu Tara rose to an altitude of 2.4 km (8,000 ft) a.s.l. and drifted NW.
Source: Darwin Volcanic Ash Advisory Centre (VAAC)
Based on analysis of satellite imagery, the Darwin VAAC reported that on 11 March ash plumes from Batu Tara rose to an altitude of 2.1 km (7,000 ft) a.s.l. and drifted N and NW.
Source: Darwin Volcanic Ash Advisory Centre (VAAC)
Based on analysis of satellite imagery, the Darwin VAAC reported that on 9 and 10 March ash plumes from Batu Tara rose to an altitude of 2.1 km (7,000 ft) a.s.l. Plumes drifted 37 km in areas NE to NW on 9 March, and NE and N on 10 March.
Source: Darwin Volcanic Ash Advisory Centre (VAAC)
Based on analysis of satellite imagery, the Darwin VAAC reported that on 7 January ash plumes from Batu Tara rose to an altitude of 2.4 km (8,000 ft) a.s.l. and drifted NE and ENE.
Source: Darwin Volcanic Ash Advisory Centre (VAAC)
Based on analysis of satellite imagery, the Darwin VAAC reported that on 6 January an ash plume from Batu Tara rose to an altitude of 2.4 km (8,000 ft) a.s.l. and drifted ENE.
Source: Darwin Volcanic Ash Advisory Centre (VAAC)
Based on analysis of satellite imagery, the Darwin VAAC reported that during 6-7 December ash plumes from Batu Tara rose to an altitude of 1.5 km (5,000 ft) a.s.l. and drifted about 55 km NW and SW.
Source: Darwin Volcanic Ash Advisory Centre (VAAC)
Based on analysis of satellite imagery, the Darwin VAAC reported that during 9-10 November ash plumes from Batu Tara rose to an altitude of 1.5 km (5,000 ft) a.s.l. and drifted NW.
Source: Darwin Volcanic Ash Advisory Centre (VAAC)
Based on analysis of satellite imagery, the Darwin VAAC reported that during 16-20 October ash plumes from Batu Tara rose to altitudes of 1.5-2.4 km (5,000-8,000 ft) a.s.l. and drifted W.
Source: Darwin Volcanic Ash Advisory Centre (VAAC)
Based on analysis of satellite imagery, the Darwin VAAC reported that during 3-4 October a low-level ash plume from Batu Tara drifted W and NW.
Source: Darwin Volcanic Ash Advisory Centre (VAAC)
Based on analysis of satellite imagery, the Darwin VAAC reported that on 2 September a low-level ash plume from Batu Tara drifted W.
Source: Darwin Volcanic Ash Advisory Centre (VAAC)
Scientists on a boat passing Batu Tara about 24 km to the N observed six distinct eruptions of ash plumes from the westernmost area of the summit crater during a 45-minute period on 25 August. The plumes rose to an estimated altitude of 1.1-1.5 km (3,600-5,000 ft) a.s.l. and drifted W.
Source: Tristram Burley, personal communication
Based on analysis of satellite imagery, the Darwin VAAC reported that during 14-17 August ash plumes from Batu Tara rose to an altitude of 1.5 km (5,000 ft) a.s.l. and drifted W.
Source: Darwin Volcanic Ash Advisory Centre (VAAC)
Based on a pilot report and observations of satellite imagery, the Darwin VAAC reported that during 6-8 and 10-11 August ash plumes from Batu Tara rose to an altitude of 1.5 km (5,000 ft) a.s.l. and drifted W and NW.
Source: Darwin Volcanic Ash Advisory Centre (VAAC)
Based on observations of satellite imagery, the Darwin VAAC reported that during 30-31 July diffuse plumes from Batu Tara rose to an altitude of 1.5 km (5,000 ft) a.s.l. and drifted W.
Source: Darwin Volcanic Ash Advisory Centre (VAAC)
Based on observations of satellite imagery, the Darwin VAAC reported that during 24-29 July ash plumes from Batu Tara rose to an altitude of 1.5-3.7 km (5,000-12,000 ft) a.s.l. and drifted WSW, W, NW, and N.
Source: Darwin Volcanic Ash Advisory Centre (VAAC)
Based on observations of satellite imagery, the Darwin VAAC reported that during 16-18 July ash plumes from Batu Tara rose to an altitude of 1.8 km (6,000 ft) a.s.l. and drifted W. A thermal anomaly was noted on satellite imagery on 16 July.
Source: Darwin Volcanic Ash Advisory Centre (VAAC)
Intermittent ash plumes from Batu Tara continued to be reported by the Darwin Volcanic Ash Advisory Centre (VAAC) during 9-14 July 2008 based on satellite imagery. On 9 July the plume rose to 1.8 km (6,000 ft) altitude a.s.l. and drifted as far as 65 km WNW. A similar plume was seen during 14-15 July.
Source: Darwin Volcanic Ash Advisory Centre (VAAC)
Based on observations of satellite imagery, the Darwin VAAC reported that during 2-5 and 8-9 July low-level ash plumes from Batu Tara rose to an altitude of 1.8 km (6,000 ft) a.s.l. and drifted W and NW.
Source: Darwin Volcanic Ash Advisory Centre (VAAC)
Based on observations of satellite imagery, the Darwin VAAC reported that on 28 and 30 June, and on 1 July low-level ash plumes from Batu Tara rose to an altitude of 1.8 km (6,000 ft) a.s.l. and drifted W and WNW.
Source: Darwin Volcanic Ash Advisory Centre (VAAC)
Based on observations of satellite imagery and pilot reports, the Darwin VAAC reported that during 19-22 June, low-level ash plumes from Batu Tara rose to an altitude of 1.5 km (5,000 ft) a.s.l. and drifted NW and W. A thermal anomaly was noted on satellite imagery on 20 June.
Source: Darwin Volcanic Ash Advisory Centre (VAAC)
Based on observations of satellite imagery, the Darwin VAAC reported that low-level plumes from Batu Tara rose to an altitude of 2.1 km (7,000 ft) a.s.l. and drifted NW during 14-15 June. A thermal anomaly was noted on satellite imagery on 14 June.
Source: Darwin Volcanic Ash Advisory Centre (VAAC)
Based on observations of satellite imagery, the Darwin VAAC reported that low-level plumes from Batu Tara rose to altitudes of 1.8-3 km (6,000-10,000 ft) a.s.l. and drifted WNW and NW during 29 May-1 June. On 1 June a thermal anomaly was noted.
Source: Darwin Volcanic Ash Advisory Centre (VAAC)
Based on observations of satellite imagery, the Darwin VAAC reported that low-level plumes from Batu Tara rose to an altitude of 1.8 km (6,000 ft) a.s.l. and drifted NW and W during 11-13 May. On 12 and 13 May a thermal anomaly at the summit was noted.
Source: Darwin Volcanic Ash Advisory Centre (VAAC)
Based on observations of satellite imagery, the Darwin VAAC reported that low-level plumes from Batu Tara rose to an altitude of 3 km (10,000 ft) a.s.l. and drifted NW on 3 and 7 May.
Source: Darwin Volcanic Ash Advisory Centre (VAAC)
The Darwin VAAC reported that low-level ash-and-steam plumes from Batu Tara were observed on satellite imagery during 25-26 April.
Source: Darwin Volcanic Ash Advisory Centre (VAAC)
The Darwin VAAC reported that low-level ash-and-steam plumes from Batu Tara were observed on satellite imagery during 20-21 April.
Source: Darwin Volcanic Ash Advisory Centre (VAAC)
Based on observations of satellite imagery, the Darwin VAAC reported that a low-level eruption plume from Batu Tara rose to an altitude of 2.4 km (8,000 ft) a.s.l. on 13 April and drifted NW. On 14 April, a steam-and-ash plume visible on satellite imagery again rose to an altitude of about 2.4 km (8,000 ft) a.s.l. and drifted W and NW.
Source: Darwin Volcanic Ash Advisory Centre (VAAC)
Based on observations of satellite imagery, the Darwin VAAC reported that on 12 March an ash-and-steam plume from Batu Tara rose to an altitude of 2.1 km (7,000 ft) a.s.l. and drifted SE.
Source: Darwin Volcanic Ash Advisory Centre (VAAC)
Based on observations of satellite imagery, the Darwin VAAC reported that on 11 March, an ash-and-steam plume from Batu Tara rose to an altitude of 3 km (10,000 ft) a.s.l. and drifted SW.
Source: Darwin Volcanic Ash Advisory Centre (VAAC)
On 4 February, CVGHM reported that since 9 October 2007, white plumes from Batu Tara were a daily occurrence. On 8 January, gray plumes rose to an altitude of 1.5 km (4,900 ft) a.s.l. and drifted E. On 26 and 30 January, white plumes rose to altitudes of 1.5-1.7 km (4,900-5,600 ft) a.s.l. and also drifted E. The Darwin VAAC reported that eruption plumes were observed from a ship on 31 January, but ash was not identified on satellite imagery. The Alert level remained at 1 (on a scale of 1-4).
Sources: Pusat Vulkanologi dan Mitigasi Bencana Geologi (PVMBG, also known as CVGHM); Darwin Volcanic Ash Advisory Centre (VAAC)
Based on visual observations, CVGHM lowered the Alert Level for Batu Tara to 1 (on a scale of 1-4) on 9 October. In March 2007, ash plumes rose to a maximum altitude of 4.3 km (14,000 ft) a.s.l. During 3 September-9 October, plumes rose to an altitude of approximately 1.4 km (4,600 ft) a.s.l.
Based on observations of satellite imagery, the Darwin VAAC reported that an ash plume rose to an altitude of 3 km (10,000 ft) a.s.l. on 13 October and drifted N and W.
Sources: Pusat Vulkanologi dan Mitigasi Bencana Geologi (PVMBG, also known as CVGHM); Darwin Volcanic Ash Advisory Centre (VAAC)
Based on observations of satellite imagery, the Darwin VAAC reported that on 18 September, diffuse ash plumes from Batu Tara rose to an altitude of 2.4 km (8,000 ft) a.s.l. and drifted W.
Source: Darwin Volcanic Ash Advisory Centre (VAAC)
Based on visual observations, CVGHM reported that on 19 June an ash plume from Batu Tara rose to an altitude of 1.7 km (5,600 ft) a.s.l. Clouds inhibited visual observations on the other days during 18-25 June. The Alert Level remained at 2 (on a scale of 1-4).
Source: Pusat Vulkanologi dan Mitigasi Bencana Geologi (PVMBG, also known as CVGHM)
Based on satellite imagery and information from CVGHM, the Darwin VAAC reported that during 10-12 May, diffuse ash plumes from Batu Tara rose to an altitude of 1.5 km (5,000 ft) a.s.l. and drifted W.
Source: Darwin Volcanic Ash Advisory Centre (VAAC)
Based on satellite imagery and CVGHM, the Darwin VAAC reported that a diffuse ash plume from Batu Tara drifted W on 5 May.
Source: Darwin Volcanic Ash Advisory Centre (VAAC)
Based on a pilot report, the Darwin VAAC reported that on 27 April a plume from Batu Tara rose to an altitude of 3 km (10,000 ft) a.s.l. and drifted W.
Sources: Pusat Vulkanologi dan Mitigasi Bencana Geologi (PVMBG, also known as CVGHM); Darwin Volcanic Ash Advisory Centre (VAAC)
Based on satellite imagery and direct observations by CVGHM, the Darwin VAAC reported that on 11 April a diffuse plume from Batu Tara rose to an altitude of 1.5 km (5,000 ft) a.s.l. and drifted W. On 17 April, CVGHM lowered the Alert Level from 3 to 2 (on a scale of 1-4).
Sources: Pusat Vulkanologi dan Mitigasi Bencana Geologi (PVMBG, also known as CVGHM); Darwin Volcanic Ash Advisory Centre (VAAC)
CVGHM reported that observations of Batu Tara from 30 March indicated that the E side of the volcano was most impacted by recent activity. Plant life on the E side was affected by hot ashfall and incandescent rockslides and cooled lava flows were observed at the E foot of the volcano. Steam and occasional ash plumes rose from the area where hot material interacted with the sea. White plumes rose from the summit to an altitude of approximately 1.7 km (5,600 ft) a.s.l. and drifted E. Based on satellite imagery and information from CVGHM, the Darwin VAAC reported that diffuse plumes rose to altitudes of 1.5 km (5,000 ft) a.s.l. and drifted W and NW during 4-10 April. On 5 April, plumes rose to 3 km (10,000 ft) a.s.l.
Sources: Pusat Vulkanologi dan Mitigasi Bencana Geologi (PVMBG, also known as CVGHM); Darwin Volcanic Ash Advisory Centre (VAAC)
Based on satellite imagery and CVGHM, the Darwin VAAC reported that during 29 March-3 April semi-continuous emissions from Batu Tara produced diffuse plumes. The plumes rose to altitudes of 1.5-3 km (5,000-10,000 ft) a.s.l. and drifted E and N.
Source: Darwin Volcanic Ash Advisory Centre (VAAC)
Based on reports from fishermen and people in coastal communities about 50 km away, CVGHM reported that eruption plumes from Batu Tara rose to altitudes of 1.2-2.2 km (3,900-7,200 ft) a.s.l. and drifted E during 18-19 March. In response, the Alert Level was raised from 1 to 2 (on a scale of 1-4). Based on information from CVGHM and satellite imagery, the Darwin VAAC reported that continuous diffuse plumes rose to 1.5 km (5,000 ft) a.s.l. and drifted mainly SE during 21-27 March.
Sources: Pusat Vulkanologi dan Mitigasi Bencana Geologi (PVMBG, also known as CVGHM); Darwin Volcanic Ash Advisory Centre (VAAC)
Based on satellite imagery and CVGHM, the Darwin VAAC reported that during 14-16 and 19-20 March emissions from Batu Tara produced diffuse plumes that drifted NE, SE, and E. Plumes rose to 1.2 km (3,900 ft) a.s.l. on 19 and 20 March.
Source: Darwin Volcanic Ash Advisory Centre (VAAC)
Based on satellite imagery, the Darwin VAAC reported that an ash cloud from Batu Tara reached an altitude of 4.3 km (14,000 ft) a.s.l. on 13 March and drifted N. The plume was identified on 14 March drifting NE.
Source: Darwin Volcanic Ash Advisory Centre (VAAC)
Based on a pilot report, the Darwin VAAC reported that an ash cloud from Batu Tara reached an altitude of 1.5 km (5,000 ft) a.s.l. and drifted NW. Ash was not identified on satellite imagery.
Source: Darwin Volcanic Ash Advisory Centre (VAAC)
Reports are organized chronologically and indexed below by Month/Year (Publication Volume:Number), and include a one-line summary. Click on the index link or scroll down to read the reports.
Thermal anomalies beginning January 2007; ash plumes during March-October
On 1 July 2006 a pilot reported an ash cloud from Batu Tara drifting NW at 1.5 km altitude, but the Darwin VAAC could not identify ash in MTSAT satellite imagery around the same time. No other evidence or reports could confirm a renewal of activity at this small uninhabited island volcano, which last erupted during 1847-1852. Starting in January 2007, there were satellite thermal anomalies suggesting an eruption. Two months later observers issued reports of ash plumes from explosive activity.
MODIS infrared satellite data, compiled and analyzed by the Hawai'i Institute of Geophysics and Planetology (HIGP) Thermal Alerts System, first showed anomalies at Batu Tara on 17 January 2007. For almost a year thermal signatures typically were detected every 1-3 days, sometimes every 4-5 days, with rare gaps of 6-7 days. After no anomalies during 9-17 January 2008, regular hotspots returned and were continuing at the end of the month.
The Darwin VAAC reported that an ash cloud seen in MTSAT and Terra MODIS imagery at 1633 on 13 March 2007 reached an altitude of 4.3 km and drifted N. By 0833 on 14 March the plume was seen extending about 90 km NE, after which it dissipated. Later that day the low-level plume was 55 km long towards the ENE.
A continuous low-level plume, at or below summit level, was observed on imagery on 15 March extending SE from the summit to a distance of 65 km. The plume later shifted around towards the E, to a distance of ~ 37 km, on 16 March. Imagery on 17 March showed another direction change, to the NE, extending a maximum of 74 km. Government officials, residents, and fishermen on Lembata Island (formerly known as Lomblen), ~ 50 km S, observed plumes rising from Batu Tara during 17-19 March, but there was no night glow. The plumes on 19 March were reportedly 500-1,500 m high and blowing E. Although meteorological clouds interfered with satellite observations, the Centre of Volcanology and Geological Hazard Mitigation (CVGHM) reported continuous eruptions with ash to 500 m above the summit on 20 March. A continuous thin plume was also seen on satellite imagery extending 37 km NE on 20 March. Similar activity continued through 21-22 March, with low-level plumes identified in imagery out to distances of 46-56 km towards the E and SE.
High waves on 22 March prevented a science team from landing on the island, where CVGHM had hoped to install instruments that could be monitored from the observation post at Lewotolo volcano, ~ 52 km SSW. Observations on 22 March described ash plumes from the summit crater rising as high as 2 km and ashfall killing trees within a 500-m radius of the summit on the southern and eastern slopes. White emissions with intermittent dense gray plumes also originated from a location on the E foot of the mountain, with the clouds rising up to 250 m. A small cone grew there with a crater diameter of ~ 10 m. From a vantage point on Lembata, other observers reported minor ashfall, smelled sulfur odors, heard explosion noises, and saw incandescent blocks ejected to heights of ~ 500 m that landed in the sea.
Meteorological clouds continued to intermittently obscure satellite observations during 23-30 March, but available clear imagery and CVGHM reports indicated continuing plumes at low altitudes extending as far as 90 km downwind (figures 1 and 2). Infrared anomalies also continued to be recorded during this time. On the morning of 31 March a plume was seen extending about 150 km NNW.
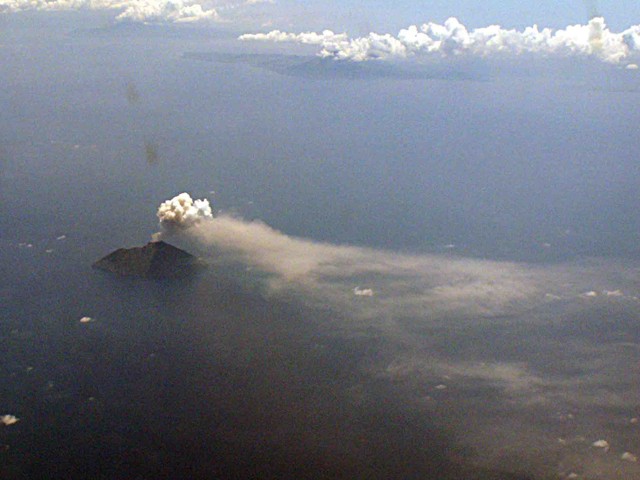 |
Figure 1. Aerial photograph of Batu Tara erupting in late March 2007 with an ash plume blowing NE. View is towards the SSE from a Garuda Boeing 737 flight between Timika, Papua New Guinea and Bali, Indonesia. Lembata Island is in the right background. Courtesy of Michael Thirnbeck. |
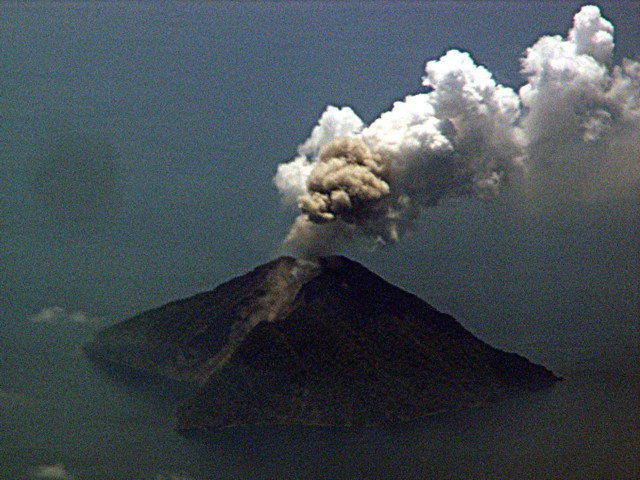 |
Figure 2. Aerial photograph of Batu Tara erupting in late March 2007 showing a steam plume and a smaller ash puff. View is towards the SE from a Garuda Boeing 737 flight between Timika, Papua New Guinea and Bali, Indonesia. The bay on the left opens to the E. Courtesy of Michael Thirnbeck. |
CVGHM reported observations from 30 March that indicated the E side of the volcano had been most impacted by recent activity. Plant life on the E side was affected by hot ashfall. White plumes rose from the summit to an altitude of ~ 1.7 km and drifted E. Incandescent rockslides and cooled lava flows were observed at the E foot of the volcano. Steam and occasional ash plumes rose from the area where hot material interacted with the sea.
Semi-continuous eruptions through 3 April produced low-level plumes, generally to altitudes of 1.5-3 km, reported by ground observers and seen in satellite imagery to distance of 37-56 km downwind in various directions. On 5 April, plumes rose to 3 km altitude. Based on satellite imagery the CVGHM reported that on 5 April a lava flow on the E slope created a central levee with debris fans on either side. The delta-like shape spanned about 450 m across. A lava flow also extended 100 m into the water. Diffuse plumes seen in satellite imagery rose to altitudes of 1.5 km and drifted W and NW during 4-11 April. Explosive activity producing noticeable ash plumes generally declined in April, and on the 12th the hazard status was lowered to Alert Level 2. However, hotspots continued to be recorded on an almost daily basis.
A pilot reported a low-level ash plume extending 90 km W on 27 April, but ash could not be identified in satellite data. Based on satellite imagery and CVGHM, the Darwin VAAC issued reports of diffuse low ash plumes drifting W during 5 and 10-12 May. On 19 June an ash plume rose to an altitude of 1.7 km. Clouds inhibited visual observations on the other days during 18-25 June. However, on 19 June, a dense white plume rising to 1,000 m high was observed. Between 28 June and 1 July, diffuse white plume was observed rising to 50-150 m. An ash column reached 750 m above the summit.
Based on observations of satellite imagery, the Darwin VAAC reported that on 18 September, diffuse ash plumes rose to an altitude of 2.4 km and drifted W for 140 km. CVGHM lowered the Alert Level to 1 on 9 October. During 3 September-9 October, plumes rose to an altitude of approximately 1.4 km, 700 m above the summit. Satellite imagery showed an ash plume on 13 October that rose to an altitude of 3 km and drifted N and W. Despite time gaps when plumes were not seen and the decreased frequency of explosion plumes, MODIS data recorded thermal anomalies at least every few days throughout April-October 2007, and continuing into February 2008.
Information Contacts: Center of Volcanology and Geological Hazard Mitigation (CVGHM), Diponegoro 57, Bandung, Jawa Barat 40122, Indonesia (URL: http://vsi.esdm.go.id/); Darwin Volcanic Ash Advisory Centre (VAAC), Bureau of Meteorology, Northern Territory Regional Office, PO Box 40050, Casuarina, Northern Territory 0811, Australia (URL: http://www.bom.gov.au/info/vaac/); Michael Thirnbeck, Jakarta, Indonesia (URL: http://www.flickr.com/photos/thirnbeck/); Hawai'i Institute of Geophysics and Planetology (HIGP) Thermal Alerts System, School of Ocean and Earth Science and Technology (SOEST), Univ. of Hawai'i, 2525 Correa Road, Honolulu, HI 96822, USA (URL: http://modis.higp.hawaii.edu/).
Satellite thermal anomalies indicate that near-daily eruptions continue
Our last report (the first ever for this volcano) covered eruptive activity through 13 October 2007 (BGVN 32:12). This report continues coverage through early April 2008.
Thermal anomalies were first measured by the MODIS satellites on 17 January 2007 (1420 UTC). According to the Hawai'i Institute of Geophysics and Planetology (HIGP) Thermal Alerts System, through the end of 2007 anomalies were measured every 1 to 7 days. This trend of nearly daily anomalies continued up to 9 April 2008, with the following exceptions: a 10-day gap beginning 21 December 2007, a 10-day gap beginning 8 January 2008, and a 21-day gap beginning 2 February 2008.
The regularity and repeating character of the thermal anomalies suggest ongoing venting of hot fragmental material or lava flows, similar to March and April 2007 (BGVN 32:12). However, the late 2007 and early 2008 behavior and deposits have not been observed.
On 4 February 2008, the Center of Volcanology and Geological Hazard Mitigation (CVGHM) reported that since 9 October 2007, white plumes were a daily occurrence. On 8 January 2008, gray plumes rose to 1.5 km altitude and drifted E. On 26 January, white plumes rose to altitudes of 1.7 km and drifted E. On 30 January, white plumes rose to altitudes of 1.5 km. and drifted E. The Darwin VAAC reported that eruption plumes were observed from a ship on 31 January, but ash was not seen in satellite imagery. The Alert level remained at 1 (on a scale of 1-4).
On 11 March the Darwin VAAC reported that satellite imagery that day revealed an ash-and-steam plume from Batu Tara that rose to an altitude of 3 km and drifted SW. On 12 March satellite imagery revealed an ash-and-steam plume at an altitude of 2.1 km moving SE.
Information Contacts: Darwin Volcanic Ash Advisory Centre, Bureau of Meteorology, Commonwealth of Australia (URL: http://www.bom.gov.au/info/vaac); Center of Volcanology and Geological Hazard Mitigation (CVGHM), Jalan Diponegoro 57, Bandung 40122, Indonesia (URL: http://www.vsi.esdm.go.id/); Hawai'i Institute of Geophysics and Planetology (HIGP) Thermal Alerts System, School of Ocean and Earth Science and Technology (SOEST), Univ. of Hawai'i, 2525 Correa Road, Honolulu, HI 96822, USA (URL: http://modis.higp.hawaii.edu/).
Frequent ash plumes continued during March-August 2008
Our last report on Batu Tara (BGVN 33:02), also known as Palau Komba, covered eruptive activity from 13 October 2007 through 12 March 2008. Satellite imagery during that period revealed near daily thermal anomalies and frequent plumes, at least some of which were ash-bearing. Ash or ash-and-steam plumes continued to be seen between 12 March and 25 August 2008 (table 1).
Table 1. Ash or ash-and-steam plume activity from Batu Tara, based on observations of satellite imagery and pilot reports. Courtesy of the Darwin Volcanic Ash Advisory Centre (VAAC).
| Date | Plume top altitude (km) | Drift direction(s) | Remarks |
| 12 Mar 2008 | 2.1 | SE | -- |
| 13 Apr 2008 | 2.4 | NW | -- |
| 14 Apr 2008 | 2.4 | NW, W | -- |
| 20-21 Apr 2008 | -- | -- | -- |
| 25-26 Apr 2008 | -- | -- | -- |
| 03 May 2008 | 3 | NW | -- |
| 07 May 2008 | 3 | NW | -- |
| 11-13 May 2008 | 1.8 | NW, W | Thermal anomaly on 12-13 May |
| 29 May-1 Jun 2008 | 1.8-3 | WNW, NW | Thermal anomaly on 1 June |
| 14-15 Jun 2008 | 2.1 | NW | Thermal anomaly on 14 June |
| 19-22 Jun 2008 | 1.5 | NW, W | Thermal anomaly on 20 June |
| 28 Jun 2008 | 1.8 | W, WNW | -- |
| 30 Jun 2008 | 1.8 | W, WNW | -- |
| 01 Jul 2008 | 1.8 | W, WNW | -- |
| 02-05 Jul 2008 | 1.8 | W, NW | -- |
| 08-09 Jul 2008 | 1.8 | W, NW | -- |
| 09-15 Jul 2008 | 1.8 | WNW | Thermal anomaly on 9 July |
| 16-18 Jul 2008 | 1.8 | W | Thermal anomaly on 16 July |
| 24-29 Jul 2008 | 1.5-3.7 | WSW, W, NW, N | -- |
| 30-31 Jul 2008 | 1.5 | W | -- |
| 06-08 Aug 2008 | 1.5 | W, NW | -- |
| 10-11 Aug 2008 | 1.5 | W, NW | -- |
| 14-17 Aug 2008 | 1.5 | W | -- |
| 25 Aug 2008 | 1.1-1.5 | W | Also see Tristan Burley's observations in text. |
Tristram Burley, a marine geophysicist, was on the 67-m-long motor vessel MV Bergen Surveyor passing 24 km to the N of Batu Tara on 25 August (figures 3 and 4). He observed six distinct eruptions of ash plumes from the westernmost area of the summit crater during a 45-minute period. The plumes were produced periodically roughly every 7 minutes. They rose to an estimated 350-750 m above the summit and drifted W. The N side of the island, the only part visible to him, showed no visible evidence of either lava flows or pyroclastic density currents accompanying the eruption plumes.
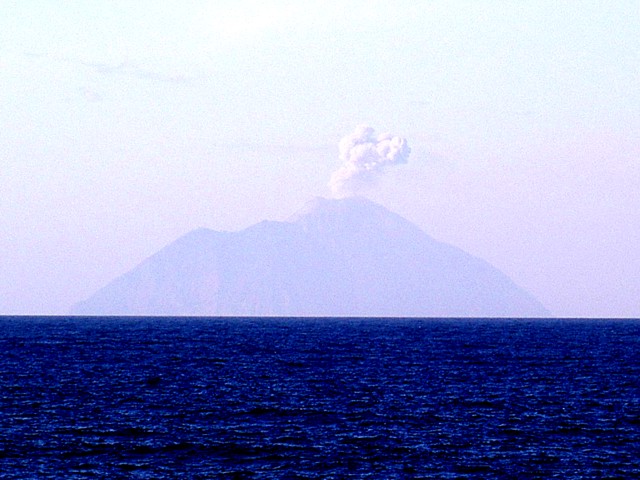 |
Figure 3. Photo of an ash plume erupting from Batu Tara on 25 August 2008, as taken from the MV Bergen Surveyor, which was about 24 km N of the volcano. Courtesy of Tristan Burley and Kenneth Rae. [Note that color has been adjusted to enhance visibility of the volcano.] |
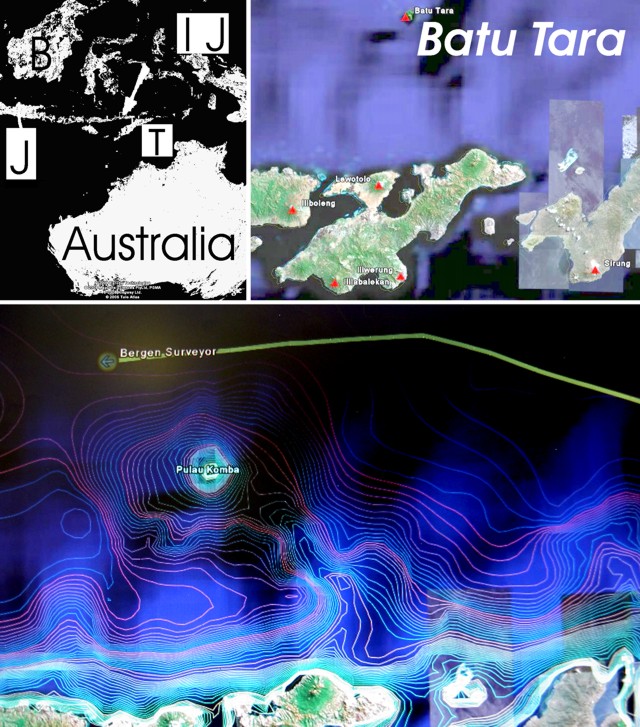 |
Figure 4. A series of maps to illustrate the setting and location of Batu Tara in the Lesser Sunda Islands of Indonesia. At upper left is a large-scale index map centered on Batu Tara (arrow tip), identifying Australia, Timor Island (T), Irian Jaya (IJ), Java (J), and Borneo (B). The map at upper right (from Google Earth) indicates Holocene volcanoes (small triangles). For scale, Batu Tara lies ~47 km N of the coast of Lembata Island (formerly Lomblen Island). At bottom is a bathymetric map of Batu Tara ("Palau Komba") and the W-traveling path of the MV Bergen Surveyor on 25 August 2008. Courtesy of Tristan Burley and Kenneth Rae. |
Information Contacts: Darwin Volcanic Ash Advisory Centre, Bureau of Meteorology, Commonwealth of Australia (URL: http://www.bom.gov.au/info/vaac); Tristram Burley, Benfield UCL Hazard Research Centre, Department of Earth Sciences, UCL, 136 Gower Street (Lewis Building), London, WC1E 6BT UK (URL: https://www.ucl.ac.uk/hazardcentre).
Low ash plumes during 2008 into January 2009
Activity at Batu Tara has been frequent since early 2007 (BGVN 32:12), with thermal anomalies and ash plumes continuing through August 2008 (BGVN 33:02 and 33:07). The volcano has remained active into early March 2009 with occasional low-level ash plumes (table 2). Based on analysis of satellite imagery, the Darwin VAAC reported ash plumes on 2 September, 3-4 October, 16-20 October, 9-10 November, and 6-7 December 2008. The plumes did not rise higher than 2.4 km altitude, and generally drifted in westerly directions. A plume during 6-7 December 2008 was visible in satellite imagery for a length of ~ 55 km. Additional ash plumes were noted during 6-7 January and 9-10 March 2009.
Table 2. Summary of Volcanic Ash Advisories for Batu Tara issued by the Darwin VAAC describing ash plumes during 2 September 2008-10 March 2009. Courtesy of the Darwin VAAC.
| Date | Plume top altitude (km) | Drift direction(s) | Remarks |
| 02 Sep 2008 | Low-level | W | Ash |
| 03-04 Oct 2008 | Low-level | W, NW | Ash |
| 16-20 Oct 2008 | 1.5-2.4 | W | Ash |
| 09-10 Nov 2008 | 1.5 | NW | Ash |
| 06-07 Dec 2008 | 1.5 | NW, SW | Plume ~ 55 km |
| 06-07 Jan 2009 | 2.4 | NE, ENE | Ash |
| 09-10 Mar 2009 | 2.1 | NE, N, NW | Plume ~ 37 km |
Information Contacts: Darwin Volcanic Ash Advisory Centre (VAAC), Bureau of Meteorology, Northern Territory Regional Office, PO Box 40050, Casuarina, NT 0811, Australia (URL: http://www.bom.gov.au/info/vaac/).
Frequent ash plumes through October 2009
Batu Tara has been active since January 2007, with thermal anomalies and occasional low-level ash plumes at least through 24 November 2009. This report discusses activity since our previous report (BGVN 34:01), which covered activity through 10 March 2009.
Since 10 March 2009, the eruption of low-level ash plumes has continued at least through 24 November 2009. Many reports of Batu Tara plumes came from the Darwin Volcanic Ash Advisory Centre (table 3).
Table 3. Summary of Volcanic Ash Advisories for Batu Tara reported by the Darwin Volcanic Ash Advisory Centre (VAAC) during 11 March 2009-24 November 2009. Many of these plumes were described as ash plumes. This table continues the table in BGVN 34:01. Courtesy of the Darwin VAAC.
| Date | Plume top altitude (km) | Drift direction(s) and extent |
| 11 Mar 2009 | 2.1 | N, NW |
| 20 Mar 2009 | 2.4 | NW |
| 25-27 Mar 2009 | 2.1 | ~30-110 km NW |
| 05-06 Apr 2009 | 2.4 | 40-210 km W |
| 11-12, 14 Apr 2009 | 1.8-2.4 | 35-90 km W, NW |
| 15-16 Apr 2009 | 1.8-2.4 | 35-75 km W, NW |
| 24-25, 28 Apr 2009 | 3.0 | Up to 110 km in variable directions |
| 29-30 Apr, 03-04 May 2009 | 2.4-3.0 | 45-185 km W, NW |
| 05 May 2009 | 2.4 | 55 km W |
| 14-19 May 2009 | 3.0 | 35-75 km W, NW, N |
| 20 May 2009 | 3.0 | 65 km NW |
| 26 May 2009 | 2.4 | 55 km NW |
| 27 May-02 Jun 2009 | 2.4 | 25-75 km NW, W, SW |
| 03-08 Jun 2009 | 2.4 | 40-75 km NW, W, SW |
| 09 Jun 2009 | -- | 140 km W |
| 10-16 Jun 2009 | 1.5-2.4 | 25-185 km SW, NW, N, NE |
| 25-30 Jun 2009 | 1.5 | 35-130 km SW, W, NW |
| 01-07 Jul 2009 | 1.5-2.4 | 35-110 km W, NW, N |
| 08 Jul 2009 | 2.4 | 55 km W, NW |
| 12-14 Jul 2009 | 1.5 | 25-55 km W, NW, N |
| 15-18 Jul 2009 | 1.5 | 20-55 km in multiple directions |
| 23 Jul 2009 | 2.4 | 55 km W |
| 27-28 Jul 2009 | 1.5 | Up to 150 km NW |
| 29-31 Jul 2009 | 1.5 | Up to 37 km NW, N |
| 04-07 Aug 2009 | 1.5-2.1 | 45-90 km W, NW, N |
| 12-13, 15-17 Aug 2009 | 1.5-3.0 | 5-110 km W, NW, N |
| 19, 21-25 Aug 2009 | 1.5 | 35-150 km W, WNW, NW |
| 26 Aug-01 Sep 2009 | 1.5-2.4 | 15-55 km W, NW, N |
| 02-08 Sep 2009 | 1.5 | 10-55 km W, NW |
| 09-11, 14-15 Sep 2009 | 1.5 | 25-45 km W, NW |
| 16-19, 21-22 Sep 2009 | 1.5 | 20-65 km W, NW, N, NE |
| 23-29 Sep 2009 | 1.5-2.4 | 15-75 km W, NW |
| 30 Sep-03, 05-06 Oct 2009 | 2.4 | 25-75 km W, NW, N |
| 06 Oct 2009 | 2.4 | 65 km W |
| 14-16 Oct 2009 | 1.8 | 25-185 km W, N |
| 27 Oct 2009 | 2.1 | 65 km W, NW |
| 24 Nov 2009 | 2.4 | 90 km NW |
NASA's Earth Observatory described the scene from an image taken on 30 April 2009 (figure 5). "In this true-color picture, Batu Tara looks like a small, smoking speck in the Flores Sea. Initially blowing toward the NW, the volcanic plume changes direction multiple times, forming a large question-mark shape, mingling with clouds in the N. When volcanic gases mingle with oxygen and moisture in the presence of sunlight, vog, or volcanic smog, often results. The off-white color and diffuse shape of the volcanic plume in the N are suggestive of vog." MODVOLC recorded thermal alerts at Batu Tara on 26 and 29 May, and 3 July 2009.
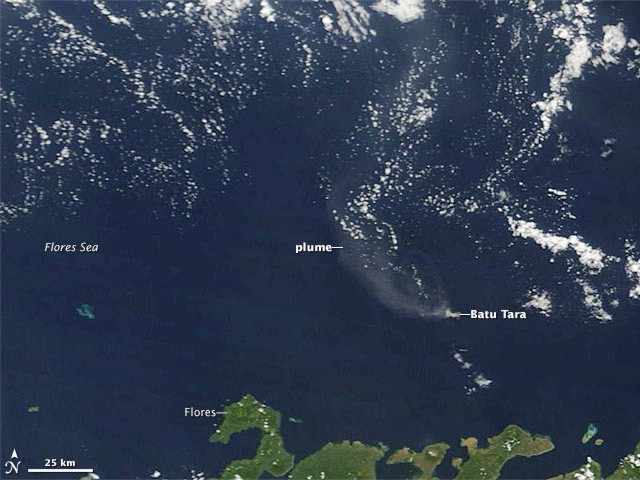 |
Figure 5. Image of plume from Batu Tara taken on 30 April 2009 by the Moderate Resolution Imaging Spectroradiometer (MODIS) on NASA's Terra satellite. Plume extends W and NW. Courtesy NASA Earth Observatory. |
Information Contacts: Darwin Volcanic Ash Advisory Centre (VAAC), Bureau of Meteorology, Northern Territory Regional Office, PO Box 40050, Casuarina, NT 0811, Australia (URL: http://www.bom.gov.au/info/vaac/); NASA Earth Observatory (URL: http://earthobservatory.nasa.gov/); Hawai'i Institute of Geophysics and Planetology (HIGP) Thermal Alerts System, School of Ocean and Earth Science and Technology (SOEST), University of Hawai'i, 2525 Correa Road, Honolulu, HI 96822, USA (URL: http://modis.higp.hawaii.edu/).
During recent months quiet, except for small ash plume on 23 January 2010
Batu Tara has been active since January 2007, with thermal anomalies and frequent low-level ash plumes at least through 24 November 2009 (BGVN 34:10). Between 24 November 2009 and 23 February 2010, the volcano was quiet, with the exception of an ash plume on 23 January. According to the Darwin Volcanic Ash Advisory Centre, the ash plume rose to an altitude of 1.5 km and drifted 25 km E.
Information Contacts: Darwin Volcanic Ash Advisory Centre (VAAC), Bureau of Meteorology, Northern Territory Regional Office, PO Box 40050, Casuarina, NT 0811, Australia (URL: http://www.bom.gov.au/info/vaac/).
Advisories and images in 2010-2011; airline routes; 2011 eruption
This report examines the tectonic setting of Batu Tara, Indonesia, and volcanic activity between February 2010 and October 2011. A map details the tectonics of portions of the Indonesian and Australian plates in the region (Elburg, 2005). Batu Tara lies along some critical air routes that link Asia to Australia. Sonnabend (2007) discussed alternate routes to avoid plumes from Batu Tara at a conference on volcanic ash in 2007. Satellite imagery from the NASA Earth Observing System (EOS) in 201 showed the islands volcanic features and complex plume dispersion.
The Darwin Volcano Ash Advisory Centre (VAAC) produced more than 40 ash plume advisories. The majority of the Darwin VAAC advisories stemmed from plume detection by the Japan Meteorological Agency's MTSAT-1 and two satellites. Lastly, during 17-19 August 2011, Thorsten Boeckel and others witnessed Batu Tara in eruption; they collected photos, videos and recorded the event.
Batu Tara (figure 6) lies 55 km from Timor, the nearest large island. Maumere, the largest town in the region (pop. 70,000; United Nations Department of Humanitarian Affairs, 1992), resides on the N coast of Flores Island, Indonesia, 175 km WSW from Batu Tara. Batu Tara sits 947 km NE of Darwin, Australia, 1,860 km W of Jakarta and 2,410 km SW of the Republic of Singapore.
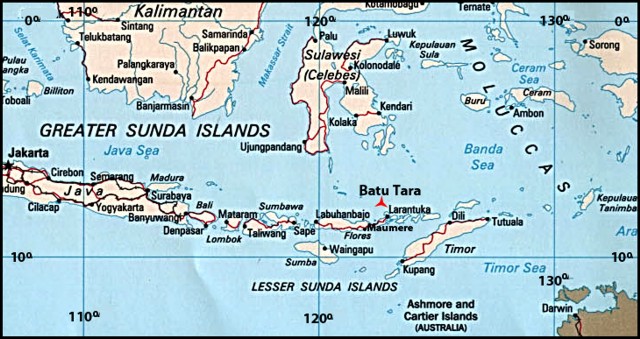 |
Figure 6. Batu Tara volcano (red triangle) in the Indonesian Archipelago. Revised from Google and Tele Atlas. |
Geologic setting and plate tectonics. Volcanism in Indonesia, as shown in figure 7, is characterized by the northward subduction of the Australian plate beneath the Indonesian plate. According to Elburg (2011), volcanoes in the area to the S of the Weber thrust (consisting of the islands Alor, Atauro, Wetar, and Romang) became extinct 3.5-1.8 million years ago. This tectonic region delineates a complex of thrusting, trough, trench, basin, ridge, crust, plateau and continental plate features forming a constellation of volcanoes. The principal geologic features relevant to Batu Tara are its proximity to the subduction zone and the local distribution of active volcanism. It has erupted potassic leucite-bearing basanitic and tephritic rocks intermittently since 1 July 2006, following a dormancy dating back to 1847-1852. Starting in January 2007, observers issued reports of ash plumes from explosive activity. Darwin VAAC recorded 7 to 10 months of plume descriptions per year during 2008 through October 2011.
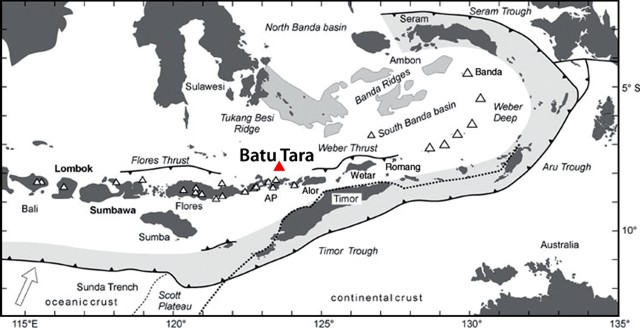 |
Figure 7. Map delineating inferred regional-scale tectonics surrounding Batu Tara. Revised from Elburg (2011). |
Darwin VAAC Advisories. The Darwin VAAC advisories for this reporting period began on 8 March 2010 (table 4). From 8 March 2010 through 30 Oct 2011, 41 advisories were released. The reports specified ash plume altitude and dispersal direction. No reports were filed for February, November and December of 2010. After a pause in late October 2010, advisories began again in March 2011and continued through 30 October, the end of the reporting period. The most frequent and highest plumes occurred during approximately the same times of both years.
Table 4. Representative Darwin VAAC Advisories listing Batu Tara ash plumes during 2010-2011. Many plumes drifted N to SW, corresponding to the trade winds.
| Date | Plume top altitude (km) | Drift direction(s) and extent |
| 08-09 Mar 2010 | 1.5-2.4 | 45-120 km W and NW |
| 10-16 Mar 2010 | 2.1-2.4 | 20-150 km N, NW, W, SW, and SSE |
| 17-18, 22-23 Mar 2010 | 2.4 | 30-95 km NW |
| 24-26 Mar 2010 | 2.4 | 10-120 km W, NW, and NE |
| 05 Apr 2010 | 2.1 | More than 35 km N |
| 06-11 Apr 2010 | 2.1 | 25-75 km NW, NE, E, and SE |
| 25-27 Apr 2010 | 2.1 | 45-85 km W and N |
| 28, 30 Apr 2010 | 2.1-2.4 | 35-95 km SW, W, and NW |
| 20 May 2010 | 2.4 | 65 km W |
| 02-07 Jun 2010 | 2.4 | 20-65 km W, NW, and N |
| 09, 11-15 Jun 2010 | 2.4 | 35-65 km W and NW |
| 19-20 Jun 2010 | 3.0 | More than 35 km NW |
| 18-20 Jul 2010 | 1.5 | More than 35 km NW |
| 21 Jul 2010 | 1.5 | 55 km NW |
| 30-31 Jul 2010 | 1.5 | 65 km NW |
| 09-10 Aug 2010 | 1.5 | NW and SW |
| 13-17 Aug 2010 | 1.5-3 | 35-95 km NW and W |
| 20-23 Aug 2010 | 1.5 | 25-65 km NW and W |
| 26-28 Aug 2010 | 1.5 | 55-75 km W and 27-28 NW |
| 01-03 Sep 2010 | 1.5 | 45-65 km W and NW |
| 08 Sep 2010 | 2.4 | 55 km NW |
| 18-20 Sep 2010 | 1.5 | 35-95 km W and NW |
| 06 Oct 2010 | 1.5 | 55 km W |
| 20 Mar 2011 | 2.1 | Less than 30 km NE |
| 28 Apr-03 May 2011 | 3 | 10-130 km N, NW, W, and SW |
| 04-07 May 2011 | 0.9-2.1 | 18-75 km NW, W, and SW |
| 15-17 May 2011 | 1.8 | 75-130 km W and NW |
| 18-23 May 2011 | 1.8-2.4 | 75-110 km W, NW, and N |
| 24-27 May 2011 | 2.4 | 40 km W, NW, and N |
| 01-07 Jun 2011 | 1.8 | 40-130 km NW, W, and SW |
| 08-13 Jun 2011 | 2.4 | 55-75 km NW, N, and E |
| 16-20 Jun 2011 | 2.4 | 55-75 km W, NW, and N |
| 22-25 Jun 2011 | 2.4 | 35-75 km W and NW |
| 01-03 Jul 2011 | 2.4 | 75 km NW |
| 09-11 Jul 2011 | 1.5-3.0 | 75 km W and NW |
| 23-30 Aug 2011 | 2.1 | 20-90 km N, NW, and W |
| 08-13 Sep 2011 | 2.1 | 37-65 km NW and W |
| 13-20 Sep 2011 | 2.1 | 25-75 km W,WNW and NW |
| 21-24 Sep 2011 | 2.1 | 37-65 km W, WNW, and NW |
| 27 Oct 2011 | 2.1 | 45 km W |
Batu Tara plume heights ranged from ~ 1 to 3 km altitude, the majority of which were near 2 km in height. Plumes dispersed mostly in westerly directions.
Commercial airline routes. Sonnabend (2007) discussed avoiding ash plumes from Batu Tara on the airline routes between Jakarta and Sidney. He reported "When the pilot smells the sulfur it is too late to escape. Therefore it is essential that, with respect to a safe flight, the information about a volcanic eruption will be passed immediately to the airlines and pilots in flight. Standardized products of describing volcanic ash events in text or graphical form are used by flight crews, dispatchers and also automated systems in order to support the decision making process in view of a safe and economic flight operation."
An example (figure 8) shows the normal route (blue, in the middle) and two alternate ones (black to the E, red to the W).
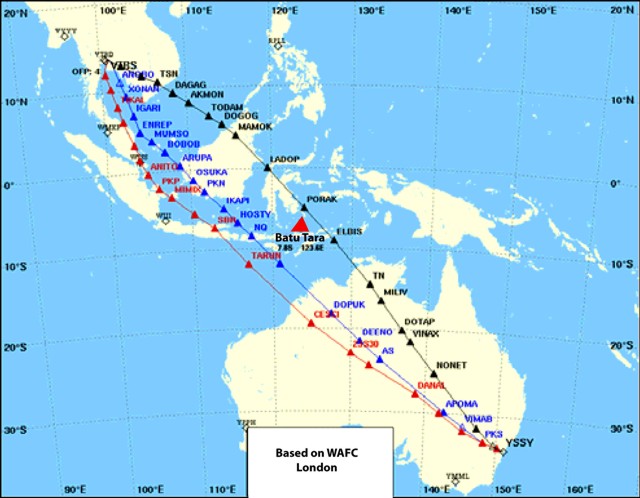 |
Figure 8. Alternate flight advisory routes due to Batu Tara plumes (red and black) between Sidney and Jakarta. The central route (blue) is the normal route. Revised from Sonnabend (2007). |
Table 5 compares time, fuel, and cost resources of the nominal route with the two alternates. The alternate routes cost 3-5 minutes of additional flight time, 1353-1690 kg of fuel, and up to ~ $60 USD per minute. When confronted with the immediacies of ash advisories, this example typifies the decision-making process by a commercial airline confronted with eruptive plumes where changing the flight path adds costs. This is especially true when there are many flights per day or when other routes overlap the same region. The consequences of even minor route deviations could improve safety but add cost and flight time weighed against the possibility of damage from ash.
Table 5. Comparisons of the normal Jakarta-Sidney air route compared to nearby alternate routes that avoid passing over Batu Tara (see figure 8). From Sonnabend, 2007.
| Flight route, color | Time | Trip fuel | Costs, USD |
| Black | 8h 54m | 87402 kg | $59,427 |
| Red | 8h 56m | 87065 kg | $58,679 |
| Blue (normal) | 8h 51m | 85712 kg | $58,391 |
NASA EOS Images. The Moderate Resolution Imaging Spectroradiometer (MODIS) sensor aboard the AQUA satellite acquired an image (figure 9) on 15 March 2010. The plume dispersed S, then immediately split, drifting SE and SW. Other areas to the E and W appear to be residual plumes, but their origin was not mentioned in the EOS report. Notice the bottom of the E plume reversed direction, arcing W. An earlier plume near the crater in the NE sector of the image moved NE along an arc.
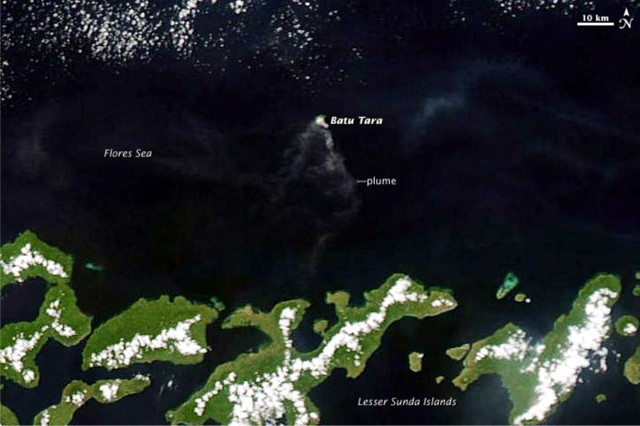 |
Figure 9. Wind driven ash plumes from a Batu Tara eruption on 15 March 2010. Courtesy of Jeff Schmaltz, NASA Earth Observatory. |
Another NASA EOS image (figure 10), acquired on 6 August 2010, showed material extending from the E shore. The N-S diameter of the island is ~ 3 km; the E scarp of the crater extends ~ 700 m to the sea. A large-scale view from a different satellite instrument (MODIS) on the same day showed that the plume extended W from Batu Tara before it disappeared under a bank of weather clouds.
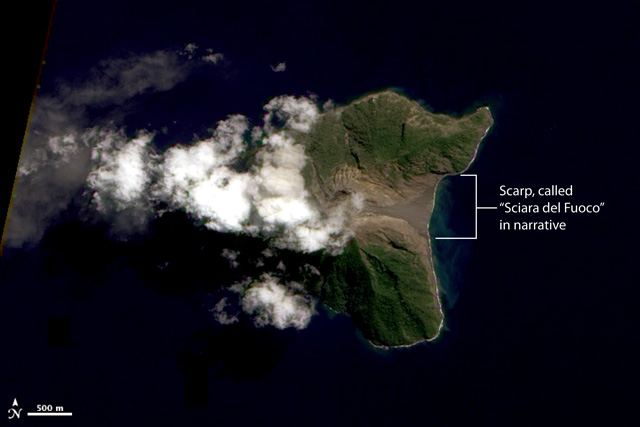 |
Figure 10. A NASA EO-1 ALI sensor image of Batu Tara erupting on 6 August 2010. The scarp on the E side of the island is referred to as the "Sciara del Fuoco" in Thorsten Boeckel's narrative. Revised from NASA Earth Observatory, Robert Simmon. |
Summer trade winds. Winds aloft play a significant role in three sections of this report: advisories, air routes, and plume-satellite images (e.g. figure 9). The winds at Batu Tara area are often described as trade winds (figure 11). The trades, the most consistent of the Earth's wind systems, with an average altitude of ~ 0.9-1.5 km, are characterized by direction and, to a lesser degree, speed (Glickman, 2000).
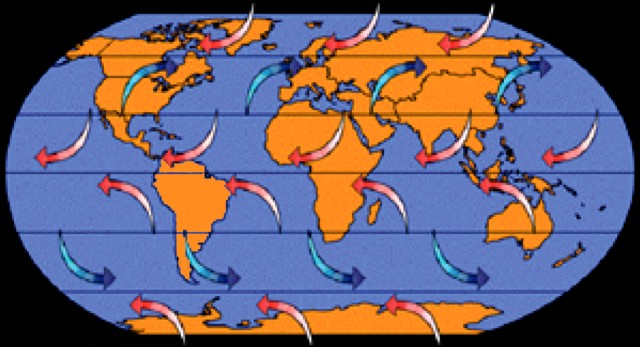 |
Figure 11. A highly simplified depiction of the Earth's wind system showing the trade winds near the equator in light red. At Batu Tara they would be expected to blow to the W and many of the plume dispersal noted in table 4 have a westerly component. From NOAA National Ocean Service Education. |
The trades (figure 11) vary seasonally and have other complexities. They meet at the Intertropical Convergence Zone (ITCZ), which norminally lies near the equator. However, the ITCZ shifts to the N and S of the equatorial median, typically ranging from ~ 1,500 km S in January to ~ 3,300 km N above the Indonesian Archipelago in July (figure 12; Lutgens and Tarbuck, 2001).
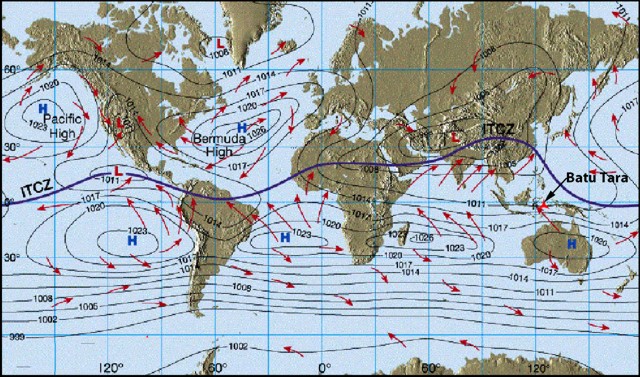 |
Figure 12. Northern shift of the ITCZ in July above Indonesia; Batu Tara in red. From Lutgens and Tarbuck (2001). |
In July, just N of the equator, below the displaced ITCZ, the winds move counter to those below the equator, pushing E instead of W. These two sources, the nominal trade wind and the NW wind located S of the shifted July ITCZ near Batu Tara, disrupt the normal trade wind pattern. This system of multiple winds (more complex than the cartoon shown in figure 11), along with the shifts in winds with altitude, and other factors (such as sea surface conditions) play roles in dispersal of Batu Tara ash plumes.
Eye-witness observations. Thorsten Boeckel and others recorded videos and photos, and noted impressions of Batu Tara's eruptions during 17-19 August 2011. Boeckel's group landed on the island in the morning of 17 August and continuously documented during the day and night. More details of their adventure can be found on the internet (see Information Contacts); several of Boeckel's photos appear in figures 13 and 14.
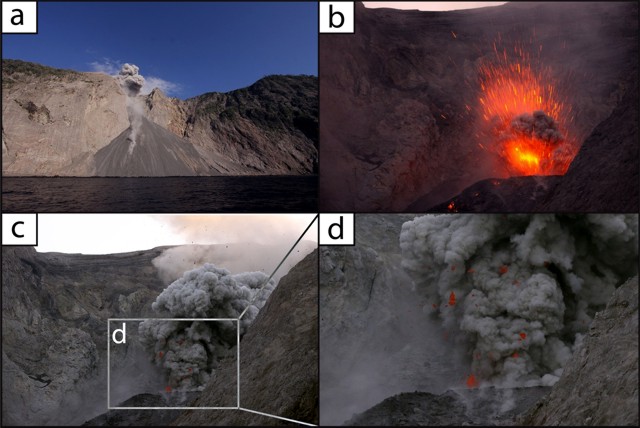 |
Figure 13. Four photos of Batu Tara taken during 17-19 August 2011. a) The scarp from offshore looking N. b) A daytime photograph of a Strombolian eruption, with top edge of the crater almost out of view (except for a trace of the sky at top center and left). c) Near the summit looking WNW, just left of the crater, with a plume rising on the right. d) An enlargement (~400%) of c) showing incandescent spatter ejected from the vent. Courtesy of Thorsten Boeckel. |
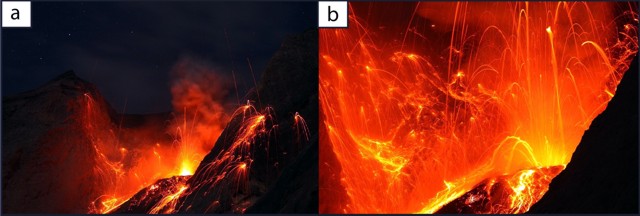 |
Figure 14. Photographs of night-time eruptions of Batu Tara during 17-19 August 2011. a) A view near the summit shows lava funneling down a chute just beyond the margin of the slope (out of view) with a secondary flow facing the viewer. b) Incandescent lava bombs ejected from the summit; lava to the left of the crater is traveling downslope in the scarp. Courtesy of Thorsten Boeckel. |
In Boeckel's words, "The local maps fail to locate Batu Tara. In Larantuka in East-Flores, where the adventurers sighted volcanic plumes on Batu Tara they booked passage on a tuna vessel for the 7 hour trip ignoring gossip from local fishermen that the island is enchanted. After about 5 hours we could recognize the Batu Tara Island. From a distance of 15 km we could see ash clouds over the island.
"During the approach we noticed increasingly that this volcano is a true stone block in the sea. Hence, would we be able to land? That evening, we reached the backside [ E side] of the island and saw the 'Sciara del Fuoco'. And really, this volcano must be the twin volcano of Stromboli. Even the summit, the Pizzo and the fire chute turned away from the mainland resemble Stromboli. The crater is approximately two-thirds the height, surrounded by a powerful steep crater funnel.
"The next morning a landing site was chosen. About 100 m beside the Sciara a narrow landing strip appeared. A skillful native fisherman whom we had onboard ferried our equipment onto the strip. [Ascending] the very steep area would take an immense expenditure of time. After landing, the equipment was set up near the summit recording the ongoing Strombolian eruption.
"The active Strombolian activity was most vigorous. At intervals of 15 minutes we noted many smaller eruptions. Larger outbreaks, 300-400 m high also occurred at 30-45 minute intervals. Those on the boat viewed lava ejecting far over crater edge. Often the forest was bombarded ~ 200 meters below the crater.
"The night began, and in addition to the fascinating lava show [figure 14], the eruption noise was a highlight. Even ~ 700 meters away, the ground tremored during stronger outbreaks.... The fire chute appears impressive, large plastic lava constantly flowed from the crater. At night bouncing rocks from the lava-flow entering the water created loud explosions."
The eruptions continued as the ship traveled E that night. A photograph, taken from the ship after a day spent on the island, shows the slope angle of the scarp (figure 15). The shot was taken too far away to show lava bombs hitting and skipping along the water's surface, however, such behavior was observed.
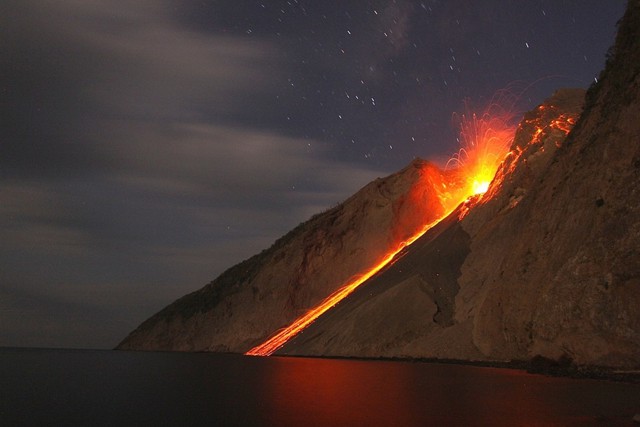 |
Figure 15. A long exposure, evening, shipboard photograph of lava blocks rolling down Batu Tara's scarp. Courtesy of Thorsten Boeckel. |
References. Boeckel T., Rietze, M., Szeglat M., and Weber, C., 2011, Indonesia 2011: Batu Tara, URL: http://www.tboeckel.de/EFSF/efsf_wv/indonesia_11/Batu Tara/Batu Tara 2011_e.hth; Posted 03 August 2011; accessed 23 November 2011.
Elburg, M., 2005, Indonesian Magmatism (URL: http://users.ugent.be/~melburg/Indonesia/IndonesiaElburg.html) Updated 10 August 2005; accessed 23 November 2011.
Glickman, T.S., 2000, Glossary of Meteorology, American Meteorology Society, 2nd ed., 850 p.
Lutgens, F.K. and Tarbuck, E.J., 2001, The Atmosphere, An Introduction to the Atmosphere, Prentice Hall, 8th Ed., 484 pp., Figure 7.9.
Sonnabend, H.R., 2007, Airlines, Aircrafts and Volcanic Ash, World Meterological Association (WMO) Fourth International Workshop on Volcanic Ash, Rotorua, New Zealand, 26-30 March 2007, report number VAWS/4 WP/07-04.
United Nations, Department of Humanitarian Affairs, 1992, Indonesia-Earthquake, DHA-UNDRO Information Report No. 2, 13 December, 1992; DHA-UNDRO 92/0817.
Information Contacts: Darwin Volcanic Ash Advisory Centre (VAAC), Bureau of Meteorology, Northern Territory Regional Office, PO Box 40050, Casuarina, NT 0811, Australia (URL: http://www.bom.gov.au/info/vaac/); NASA Earth Observatory, NASA Goddard Space Flight Center (URL: http://earthobservatory.nasa.gov/); Thorsten Boeckel (URL: http://www.tboeckel.de).
Strombolian and vulcanian eruptions frequent during 2011-May 2014
We previously reported Batu Tara activity through October 2011 (BGVN 36:10). This report describes events from November 2011 to May 2014. If not specifically referenced, the material here was compiled from events reported by the Darwin Volcano Air Advisory Center (VAAC). The Darwin VAAC compiled satellite information, ground reports from volcanological agencies, pilot reports, meteorological data and numerical models to track and forecast ash movements. Their product is called a Volcanic Ash Advisory (VAA). Batu Tara lies along the flight path between Jakarta, Indonesia and Sydney, Australia (Sonnabend, 2007). The other reference, Volcano Discovery, provided informative narratives and photos.
October 2011-December 2013 eruptions. There were ~90 ashfall VAA's reported by Darwin VAAC during the October 2011-December 2013 period. The 2011-2013 monthly ash fall summaries are listed in table 6.
Gaps in the Darwin VAAC Batu Tara archive existed, most notable for the month of December 2013, a month without archived VAA's. Volcano Discovery, however, compiled several comments on ash falls during the reporting interval, augmenting available information with in situ observations. Ash plumes were detected frequently during 2012 and 2013 (table 6). Plume altitudes during 2011-2013 were typically to ~2 km and occasionally to ~3 km.
Table 6. Batu Tara ash fall monthly summaries for October 2011-December 2013. Courtesy of the Darwin VAAC.
| Month | 2011 Eruptions | 2012 Eruptions | 2013 Eruptions |
| Jan | -- | -- | Stronger than normal eruption |
| Feb | -- | Ash plume eruption | Becoming more active |
| Mar | -- | Stronger than normal eruption | Elevated near-continuous strombolian explosions |
| Apr | -- | Occasional ash eruptions | Continuing, often strong strombolian activity |
| May | -- | Occasional ash eruptions | Ash plumes |
| Jun | -- | Occasional ash eruptions | Continuing, often strong strombolian activity |
| July | -- | Almost daily, to several times a day | Ash plumes |
| Aug | -- | Almost daily ash explosions | Continuing, often strong strombolian activity |
| Sept | Ash plumes | Almost daily ash explosions | Frequent larger strombolian-vulcanian explosions |
| Oct | Ash plumes | Explosions during first week | Frequent larger strombolian-vulcanian explosions |
| Nov | -- | Strombolian and effusive activity | Frequent larger strombolian-vulcanian explosions |
| Dec | -- | Strombolian and effusive activity | -- |
On 15 August 2012, a Batu Tara plume was captured by the Advanced Land Imager (ALI) aboard the Earth Observing-1 (EO-1) satellite (figure 16). The puff of ash above Batu Tara was an example of the frequent, mild eruptions that have occurred since mid-2006. The breach on the E side of the summit (labeled "scarp") provides the dominant path for material exiting the summit crater. The scarp drops steeply from the summit and the crater area to the ocean. The scarp is kept clear of vegetation by frequent passage of rock and ash that repeatedly scours the steep slope. The ALI panchromatic (Pan) band image shows the scarp as dark brown, with exposed volcanic rock as lighter brown and vegetation as green.
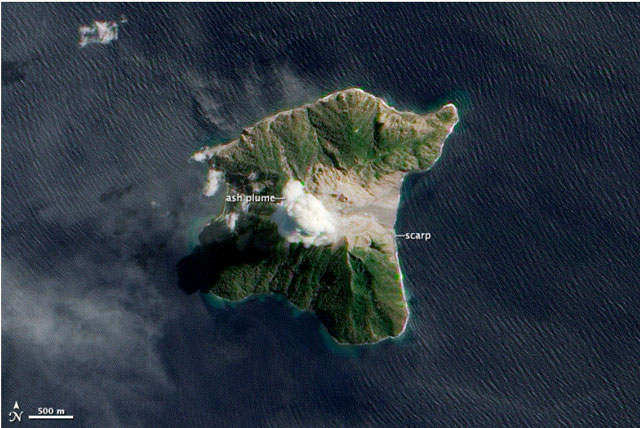 |
Figure 16. Batu Tara ash plume captured by the EO-1 satellite's ALI multispectral imager on 15 August 2012. A prominent scarp occurs on the E side of the ~2 km diameter island. Courtesy of NASA Earth Observatory. Image labeling and parts of the caption by Jesse Allen and Robert Simmon. |
During 24-29 November 2012, Volcano Discovery observers visited Batu Tara. They noted several strong episodic strombolian and a few vulcanian eruptions. On 25 November, effusive lava and bomb activity was observed ~500 m up the large E scarp of the stratovolcano (figure 17). Explosive eruptions occurred at irregular intervals ranging from 5-30 minutes. The Volcano Discovery observers noted frequent ash venting with minor amounts of incandescent material. At times, classic strombolian explosions ejected lava bombs to 100-300 m above the crater. Significantly more powerful blasts emitted liquid spatter several hundreds of meters in all directions. The latter eruptions created shock waves and loud detonation sounds. Ash plumes rose typically about 200-500 m, resulting in light ash fall on the W side of the island.
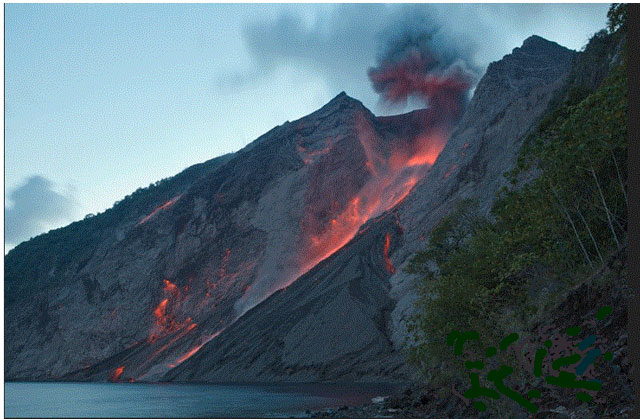 |
Figure 17. Strong strombolian explosion from the active crater of Batu Tara. Photo was taken ~1.2 km E of the crater on 25 Nov 2012. During phases of increased activity, more lava effused from the vent on the crater rim. Incandescent blocks rolled down the slope, looking similar to a lava flow. Courtesy of Volcano Discovery. Photo by Mark Szeglat. |
January-April 2014 ash plumes. The Darwin VAAC described ash emissions during the last week of March, late April, and mid-May 2014. Some plumes as high as ~ 3 km a.s.l. and one, during May, was visible for up to 75 laterally.
References. Sonnabend, H.R., 2007, Airlines, Aircrafts and Volcanic Ash, World Meterological Association (WMO) Fourth International Workshop on Volcanic Ash, Rotorua, New Zealand, 26-30 March 2007, report number VAWS/4 WP/07-04.
United Nations, Department of Humanitarian Affairs, 1992, Indonesia-Earthquake, DHA-UNDRO Information Report No. 2, 13 December, 1992; DHA-UNDRO 92/0817.
Information Contacts: Darwin Volcanic Ash Advisory Centre (VAAC), Bureau of Meteorology, Northern Territory Regional Office, PO Box 40050, Casuarina, NT 0811, Australia (URL: http://www.bom.gov.au/info/vaac/); Volcano Discovery (URL: http://www.volcanodiscovery.com/home.html); and NASA Earth Observatory, NASA Goddard Space Flight Center (URL: http://earthobservatory.nasa.gov/).
Ash plumes frequent during June 2014-October 2015; explosions observed in November 2015
The long-lasting eruption at Batu Tara exhibited frequent eruptive activity, both Strombolian and Vulcanian styles, previously reported through May 2014 (BGVN 39:01). This report describes events from May 2014 to June 2016. The material here was compiled largely from events reported by the Darwin Volcano Ash Advisory Center (VAAC) and expeditions by Volcano Discovery. The activity observed by visitors on 26 November 2015 corresponds to the end of frequent thermal anomalies. There were no further reports of ash plumes or regular thermal anomalies through October 2016.
Nearly daily to weekly thermal alerts were measured by MODIS thermal sensors from Aqua and Terra satellites during January 2007 to 27 October 2013. The nearly daily to weekly alerts began again on 11 January 2014 and continued until 25 November 2015; no thermal alerts were observed afterward through mid-June 2016. MIROVA noted low-to-moderate radiative power from MODIS sensors from mid-May to late November 2015 (figure 18), then infrequent low to moderate thermal anomalies (1-2 per month) through approximately 25 May 2016; no alerts after that were detected, at least through 21 June 2016.
|
Figure 18. Graph of the log radiative power of thermal anomalies at Batu Tara identified in MODIS data by MIROVA during September 2015-August 2016. Courtesy of MIROVA. |
Ash plumes were frequently reported by the Darwin VAAC from 22 March 2014 to mid-June 2016 (table 7). The shortest air route between Jakarta, Indonesia, and Sydney, Australia, is directly over Batu Tara, whose frequent ash plumes are to be avoided. Ash plumes were reported by the VAAC at least once a month during March-June 2014, with several reports in June. Only one ash emission was reported four months later, on 1 November. Ash plumes were identified in satellite data during April and May 2015, and again during September and October.
Table 7. Ash plumes from Batu Tara reported from March 2014 to October 2015. Courtesy of Darwin VAAC.
| Date(s) | Ash plume altitude (km) | Ash plume drift |
| 22 Mar 2014 | -- | 20 km W |
| 26 Mar 2014 | -- | 10 km W |
| 27-28 Apr 2014 | 3 | 35-55 N, NE |
| 16-18 May 2014 | 2.4 | 55-75 km NW, W |
| 26-27 May 2014 | 1.2-2.1 | 25-95 km NW, W |
| 06 Jun 2014 | 2.1 | 150 NW |
| 07-09 Jun 2014 | 2.1 | 35 km W, NW |
| 13 June 2014 | 2.1 | 55 km SW |
| 16 Jun 2014 | 1.5 | 37 km NW |
| 26 Jun 2014 | -- | 35-55 km NW, W |
| 01 Nov 2014 | 1.2-1.5 | 95 km NE |
| 07 Apr 2015 | 3 | NW |
| 06-09 May 2015 | 2.1 | 55-85 km W, WNW |
| 16-19 May 2015 | 2.6 | 35-95 km W, NW |
| 21-22 May 2015 | 2.5 | 80 km W |
| 15 Sep 2015 | 1.5 | 185 km NW |
| 07-08, 13 Oct 2015 | 1.5-2.1 | 90-100 km NW, W |
| 14-19 Oct 2015 | 1.8-2.1 | 45-130 km WSW, W |
| 21-27 Oct 2015 | 1.5 | 35-65 km SW, W |
Visitor observations, July and November 2015. Volcano Discovery made a video during an expedition on 3 July 2015 that showed a pyroclastic flow generated by an explosion travelling down a scarp and out over the ocean for ~150 m (figure 18). The report stated that a "strong Strombolian explosion from Batu Tara volcano occurred on the evening of 2 July 2015. The eruption is preceded by a gradual build-up with increasing degassing and rockfalls as a result of inflation of the crater. Immediately before the explosion, glow becomes visible as the magma is about to break through the crust sealing the vent." Photos by Tom Pfeifer on 3 July showed an explosion followed by a pyroclastic flow that traveled down a scarp towards the ocean.
Volcano Discovery further reported that during another visit over 23-26 November 2015 the activity "was characterized by mild, ash-rich Strombolian eruptions at intervals between 10-30 minutes alternated/interrupted by much more powerful Vulcanian-type explosions that produced shock waves and ejected dense columns of tephra (ash, blocks and incandescent lava bombs) in a single, cannon-shot like explosion." The explosions "sent ballistics to several hundred meters of height all over the upper half of the volcano. During the first two observation days, these explosions occurred at intervals between 3-10 hours, but became the dominant type of activity during the last 24 hours of our stay, when they occurred at shorter intervals of 1-2 hours typically. Ash plumes from some of these explosions rose more than 1 km from the crater." They noted that the activity was at similar levels as during previous visits between 2012 and June 2015.
Information Contacts: Darwin Volcanic Ash Advisory Centre (VAAC), Bureau of Meteorology, Northern Territory Regional Office, PO Box 40050, Casuarina, NT 0811, Australia (URL: http://www.bom.gov.au/info/vaac/); MIROVA, a collaborative project between the Universities of Turin and Florence (Italy) supported by the Centre for Volcanic Risk of the Italian Civil Protection Department (URL: http://www.mirovaweb.it/); Hawai'i Institute of Geophysics and Planetology (HIGP), MODVOLC Thermal Alerts System, School of Ocean and Earth Science and Technology (SOEST), Univ. of Hawai'i, 2525 Correa Road, Honolulu, HI 96822, USA (URL: http://modis.higp.hawaii.edu/, http://modis.higp.hawaii.edu/); Tom Pfeiffer, Volcano Discovery (URL: https://www.volcanodiscovery.com/photos/batu-tara/nov2015expedition.html, https://www.volcanodiscovery.com/batu-tara-videos.html).
|
|
||||||||||||||||||||||||||
There is data available for 2 confirmed eruptive periods.
[ 2022 Jan 31 - 2022 Jan 31 ] Uncertain Eruption
| Episode 1 | Uncertain | |||||||||||||||||||
|---|---|---|---|---|---|---|---|---|---|---|---|---|---|---|---|---|---|---|---|
| 2022 Jan 31 - 2022 Jan 31 | Evidence from Observations: Reported | ||||||||||||||||||
|
List of 2 Events for Episode 1
|
|||||||||||||||||||
2007 Jan 17 (?) - 2015 Nov 26 Confirmed Eruption (Explosive / Effusive) VEI: 2
| Episode 1 | Eruption (Explosive / Effusive) | ||||||||||||||||||||||||||||||||||
|---|---|---|---|---|---|---|---|---|---|---|---|---|---|---|---|---|---|---|---|---|---|---|---|---|---|---|---|---|---|---|---|---|---|---|
| 2007 Jan 17 (?) - 2015 Nov 26 | Evidence from Observations: Reported | |||||||||||||||||||||||||||||||||
|
List of 5 Events for Episode 1
|
||||||||||||||||||||||||||||||||||
[ 2006 Jul 1 - 2006 Jul 1 ] Uncertain Eruption
| Episode 1 | Eruption (Explosive / Effusive) | ||||||||||||||||||||||||
|---|---|---|---|---|---|---|---|---|---|---|---|---|---|---|---|---|---|---|---|---|---|---|---|---|
| 2006 Jul 1 - 2006 Jul 1 | Evidence from Unknown | |||||||||||||||||||||||
|
List of 3 Events for Episode 1
|
||||||||||||||||||||||||
1847 - 1852 Aug 31 (on or after) Confirmed Eruption (Explosive / Effusive) VEI: 2
| Episode 1 | Eruption (Explosive / Effusive) | ||||||||||||||||||||||||
|---|---|---|---|---|---|---|---|---|---|---|---|---|---|---|---|---|---|---|---|---|---|---|---|---|
| 1847 - 1852 Aug 31 (on or after) | Evidence from Observations: Reported | |||||||||||||||||||||||
|
List of 3 Events for Episode 1
|
||||||||||||||||||||||||
This compilation of synonyms and subsidiary features may not be comprehensive. Features are organized into four major categories: Cones, Craters, Domes, and Thermal Features. Synonyms of features appear indented below the primary name. In some cases additional feature type, elevation, or location details are provided.
Synonyms |
| Tara, Batoe | Pulu Kambing II | Pulu Betah | Pulu Komba |
There are no samples for Batu Tara in the Smithsonian's NMNH Department of Mineral Sciences Rock and Ore collection.
| Copernicus Browser | The Copernicus Browser replaced the Sentinel Hub Playground browser in 2023, to provide access to Earth observation archives from the Copernicus Data Space Ecosystem, the main distribution platform for data from the EU Copernicus missions. |
| MIROVA | Middle InfraRed Observation of Volcanic Activity (MIROVA) is a near real time volcanic hot-spot detection system based on the analysis of MODIS (Moderate Resolution Imaging Spectroradiometer) data. In particular, MIROVA uses the Middle InfraRed Radiation (MIR), measured over target volcanoes, in order to detect, locate and measure the heat radiation sourced from volcanic activity. |
| MODVOLC Thermal Alerts | Using infrared satellite Moderate Resolution Imaging Spectroradiometer (MODIS) data, scientists at the Hawai'i Institute of Geophysics and Planetology, University of Hawai'i, developed an automated system called MODVOLC to map thermal hot-spots in near real time. For each MODIS image, the algorithm automatically scans each 1 km pixel within it to check for high-temperature hot-spots. When one is found the date, time, location, and intensity are recorded. MODIS looks at every square km of the Earth every 48 hours, once during the day and once during the night, and the presence of two MODIS sensors in space allows at least four hot-spot observations every two days. Each day updated global maps are compiled to display the locations of all hot spots detected in the previous 24 hours. There is a drop-down list with volcano names which allow users to 'zoom-in' and examine the distribution of hot-spots at a variety of spatial scales. |
|
WOVOdat
Single Volcano View Temporal Evolution of Unrest Side by Side Volcanoes |
WOVOdat is a database of volcanic unrest; instrumentally and visually recorded changes in seismicity, ground deformation, gas emission, and other parameters from their normal baselines. It is sponsored by the World Organization of Volcano Observatories (WOVO) and presently hosted at the Earth Observatory of Singapore.
GVMID Data on Volcano Monitoring Infrastructure The Global Volcano Monitoring Infrastructure Database GVMID, is aimed at documenting and improving capabilities of volcano monitoring from the ground and space. GVMID should provide a snapshot and baseline view of the techniques and instrumentation that are in place at various volcanoes, which can be use by volcano observatories as reference to setup new monitoring system or improving networks at a specific volcano. These data will allow identification of what monitoring gaps exist, which can be then targeted by remote sensing infrastructure and future instrument deployments. |
| Volcanic Hazard Maps | The IAVCEI Commission on Volcanic Hazards and Risk has a Volcanic Hazard Maps database designed to serve as a resource for hazard mappers (or other interested parties) to explore how common issues in hazard map development have been addressed at different volcanoes, in different countries, for different hazards, and for different intended audiences. In addition to the comprehensive, searchable Volcanic Hazard Maps Database, this website contains information about diversity of volcanic hazard maps, illustrated using examples from the database. This site is for educational purposes related to volcanic hazard maps. Hazard maps found on this website should not be used for emergency purposes. For the most recent, official hazard map for a particular volcano, please seek out the proper institutional authorities on the matter. |
| IRIS seismic stations/networks | Incorporated Research Institutions for Seismology (IRIS) Data Services map showing the location of seismic stations from all available networks (permanent or temporary) within a radius of 0.18° (about 20 km at mid-latitudes) from the given location of Batu Tara. Users can customize a variety of filters and options in the left panel. Note that if there are no stations are known the map will default to show the entire world with a "No data matched request" error notice. |
| UNAVCO GPS/GNSS stations | Geodetic Data Services map from UNAVCO showing the location of GPS/GNSS stations from all available networks (permanent or temporary) within a radius of 20 km from the given location of Batu Tara. Users can customize the data search based on station or network names, location, and time window. Requires Adobe Flash Player. |
| DECADE Data | The DECADE portal, still in the developmental stage, serves as an example of the proposed interoperability between The Smithsonian Institution's Global Volcanism Program, the Mapping Gas Emissions (MaGa) Database, and the EarthChem Geochemical Portal. The Deep Earth Carbon Degassing (DECADE) initiative seeks to use new and established technologies to determine accurate global fluxes of volcanic CO2 to the atmosphere, but installing CO2 monitoring networks on 20 of the world's 150 most actively degassing volcanoes. The group uses related laboratory-based studies (direct gas sampling and analysis, melt inclusions) to provide new data for direct degassing of deep earth carbon to the atmosphere. |
| Large Eruptions of Batu Tara | Information about large Quaternary eruptions (VEI >= 4) is cataloged in the Large Magnitude Explosive Volcanic Eruptions (LaMEVE) database of the Volcano Global Risk Identification and Analysis Project (VOGRIPA). |
| EarthChem | EarthChem develops and maintains databases, software, and services that support the preservation, discovery, access and analysis of geochemical data, and facilitate their integration with the broad array of other available earth science parameters. EarthChem is operated by a joint team of disciplinary scientists, data scientists, data managers and information technology developers who are part of the NSF-funded data facility Integrated Earth Data Applications (IEDA). IEDA is a collaborative effort of EarthChem and the Marine Geoscience Data System (MGDS). |


 Batu Tara, seen here from the SE, is a small 3-km-wide island that is the summit of a large stratovolcano that rises from the Flores Sea about 50 km north of Lembata (formerly Lomblen) Island. The summit of the volcano is cut by a scarp on the eastern side (right) that is similar to the Sciara del Fuoco on Italy's Stromboli Island. Only a single historical eruption, during the mid-19th century, is known from Batu Tara.