IG-EPN reported that monitoring instruments began recording signals at 1510 on 23 May indicating that a moderately-sized secondary lahar was descending Cotopaxi’s NW flank. The public was advised to stay away from stream and river drainages within the vicinity of Parque Nacional Cotopaxi (Cotopaxi National Park).
Source: Instituto Geofísico-Escuela Politécnica Nacional (IG-EPN)
Ash emissions, ashfall, and occasional lahars during February-July 2023
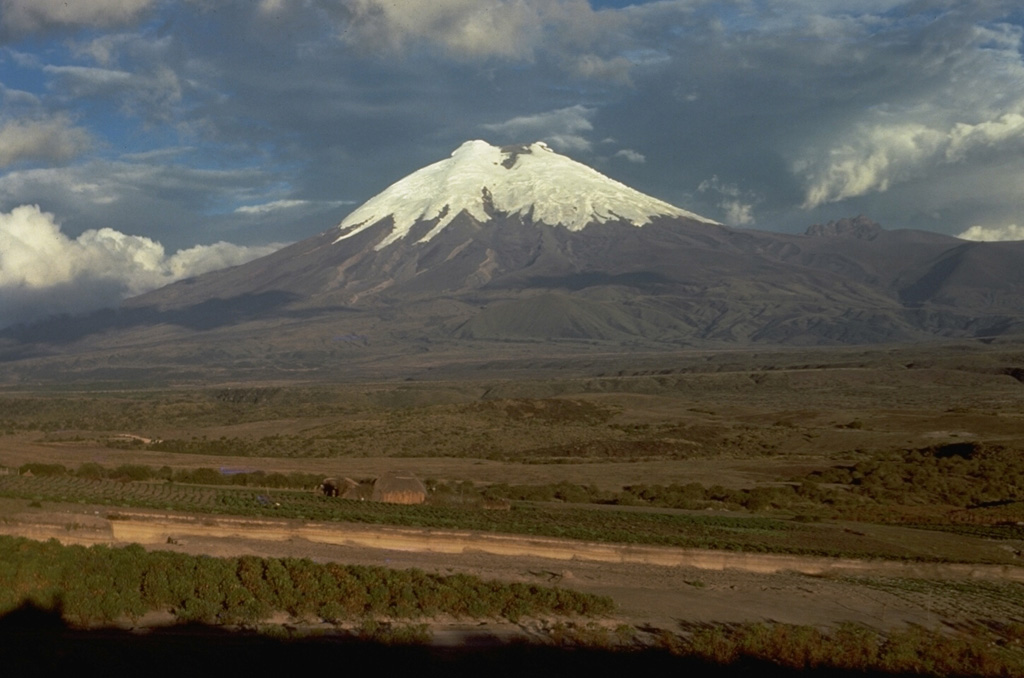
Cotopaxi is a steep-sided cone capped by nested summit craters, located in Ecuador. The largest cone is about 550 x 800 m. Explosive eruptions have been accompanied by pyroclastic flows and lahars, the latter of which frequently affect adjacent valleys. The most recent eruption began in October 2022 and consisted of ash plumes and ashfall (BGVN 48:02). This report covers activity during February through July 2023, which was characterized by similar activity. Information comes from Ecuador's Instituto Geofísico, Escuela Politécnica Nacional (IG-EPN) and the Washington Volcanic Ash Advisory Center (VAAC).
Activity during February consisted of constant gas-and-steam emissions that rose 200-2,500 m above the crater and drifted in multiple directions, and seismicity that was characterized by daily tremor events associated with emissions (TR) and long-period events (LP), and less frequent volcano-tectonic events (VT) and very long-period events (VLP). The Washington VAAC reported during 31 January to 4 February that gas-and-ash emissions rose 1.1-2.5 km above the summit and drifted in multiple directions. Beginning at 0100 on 2 February IG reported an increase in seismic signals associated with ash emissions that rose 1.3 km above the summit and drifted NW (figure 25). There were reports of ashfall in the N part of the Cotopaxi National Park in Quito and Mejía, particularly in Amaguaña (35 km NNW), La Armenia, Quitumbe (41 km NNW), Conocoto (41 km N), Guamaní (42 km NNW), La Ecuatoriana (44 km NNW), Turubamba (43 km NNW), Chillogallo (47 km NNW), La Magdalena (48 km NNW), Machachi, Tambillo (32 km NNW), Alóag (28 km NW), Cutuglahua (35 km NNW), Uyumbicho (30 km NNW), Aloasí (24 km NW), and El Chaupi (24 km WNW) during 2-4 February. On the morning of 3 February continuous gas-and-ash emissions were reported, resulting in slight ashfall in Tambillo, Chillogallo, and La Armenia 2 and later that same day in Guamaní, Turubamba, Chillogallo, La Ecuatoriana, Quitumbe, Tambillo, Machachi, Aloasí, Aloag (28 km NW), and Conocoto.
 |
Figure 25. Webcam image of a gray ash plume rising above Cotopaxi on 2 February 2023. Courtesy of IG-EPN (IG Al Instante Informativo VOLCÁN COTOPAXI No 2023-023). |
During 9-10, 12-19, and 26-27 February the Washington VAAC reported that gas-and-ash emissions rose 200-1,400 m above the crater and drifted W, NW, S, and SE. At 1800 on 9 February an ash plume rose 2 km above the summit and drifted W according to IG-EPN. Slight ashfall was reported in Tambillo. During the night and early morning of 11-12 February gas-and-ash emissions rose less than 500 m above the crater and drifted SW; there were some reports of light ashfall in El Chasqui (17 km W), Mulaló (19 km SW) and San Juan de Pastocalle (20 km WSW). Around 0810 the BREF seismic station recorded an increase in tremor energy, which is associated with ash emissions. During 13-14 February several gas-and-ash emissions rose as high as 1 km and drifted W and SW, resulting in minor ashfall in Mulaló, San Agustín (11 km W), Ticatilín (15 km WSW), San Ramón (17 km SW), Control Caspi (20 km WSW), and Pastocalle (22 km W). Starting around 0630 on 15 February ashfall was observed in Mulaló 2, San Ramón (17 km SW), Ticatilín (15 km SW), and San Agustín del Callo (18 km WSW). According to the Network of Volcanic Observers (ROVE), ashfall was reported in Latacunga canton (18 km WSW) during the night of 15 February. On 16 February at 0600 ash emissions rose 1 km above the summit and drifted E, based on surveillance cameras (figure 26). Starting at 0230 on 18 February IG reported an increase in seismic signals that were associated with ash emissions; by 0650 satellite images showed an ash plume that rose 800 m above the summit and drifted SE. Around 0030 on 19 February an ash plume rose 1.1 km above the crater and drifted S. During the morning of 27 February gas-and-ash emissions rose 1 km above the summit and drifted SE; light ashfall was reported in Pichincha en Rumiñahui (61 km N), Rumipamba Vallecito (55 km N), Conocoto, Pedregal (60 km N), Guamaní, Quitumbe, La Ecuatoriana, Chillogallo, Urubamba (Santo Tomas, 40 km NNW), La Magdalena (Barrio Nuevo, Villaflora), and San Bartolo. On 28 February at 1430 surveillance cameras showed an ash plume that rose 500 m above the summit and drifted SW.
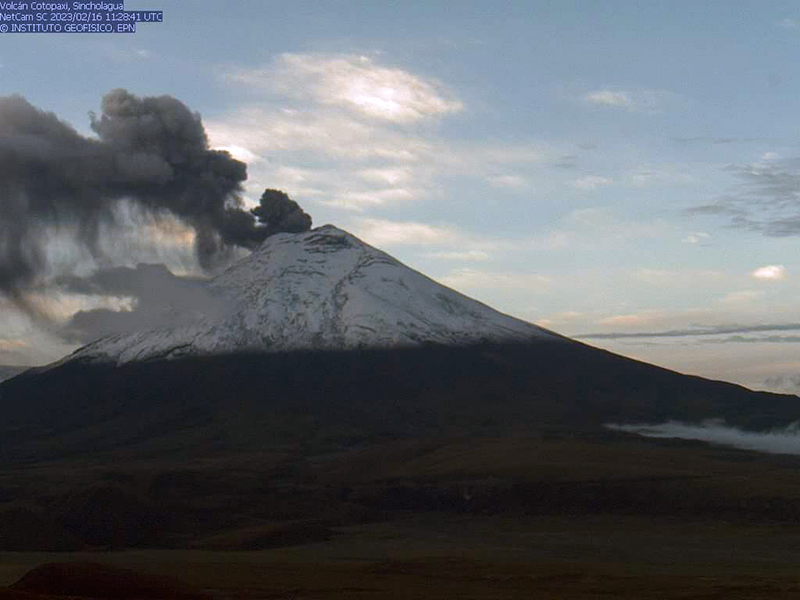 |
Figure 26. Webcam image of an ash emission rising 1 km above the summit of Cotopaxi and drifting E on 16 February 2023. Photo has been color corrected. Courtesy of IG-EPN (IG Al Instante Informativo VOLCÁN COTOPAXI No 2023-031). |
Ash emissions continued during March, rising 1-1.5 km above the summit, and drifting in different directions. Seismicity consisted of daily LP and near-daily TR events and less frequent VT and VLP events. Intermittent gas-and-steam emissions rose 100-1,500 m and drifted in different directions. According to the Washington VAAC ash emissions rose 500-2,000 m above the summit and drifted in multiple directions during 28 February to 3 March, 4-5, 18-19, and 24-29 March. Light ashfall was reported in Mulaló during 28 February to 1 March and 5-6 March. On 19 March at 0900 surveillance cameras captured an ash emission that rose 1 km above the summit and drifted E (figure 27). A thin ash cloud was observed in GOES-16 satellite images rising 500 m above the summit and drifted SW on 25 March. Around 0310 on 28 March a GOES-16 satellite image showed an ash cloud rising 1 km above the summit and drifted N. As a result, light ashfall was observed in Machachi and on the N flank of the volcano and in El Chasqui, Latacunga, and the S flank of the volcano during 28-29 March.
 |
Figure 27. Webcam image of an ash emission rising 1 km above the summit of Cotopaxi and drifting E on 19 March 2023. Photo has been color corrected. Courtesy of IG-EPN (IG Al Instante Informativo VOLCÁN COTOPAXI No 2023-036). |
Gas-and-steam emissions continued during April, rising 200-1,500 m above the crater, and drifting in different directions. Seismicity consisted of daily LP and near-daily TR events and less frequent VT events. Gas-and-ash emissions rose 200-1,500 m above the crater and drifted W, SW, E, and SE. During 4-6 and 9-10 April the Washington VAAC reported that ash emissions rose 200-1,100 m above the crater and drifted SW, SE, and E. A lahar occurred on the upper W flank on 5 April due to moderate rainfall. Light ashfall was reported in Mulaló and San Agustín during 5-6 April. On 8 April at 0900 a surveillance camera showed an ash plume that rose 500 m above the summit and drifted E and on 10 April at 0500 an ash plume rose 1.1 km above the summit and drifted W. During the night of 11 April, a small, secondary lahar was descended the Agualongo drainage. Another lahar was recorded during 12-13 April, though it was not observed due to cloud cover. On 15 April a small lahar was observed on the NW flank. The BNAS seismic station recorded an increase in seismic signal at 1600 on 22 April that corresponded to a small lahar, which descended the Cutzulao/Agualongo drainages. During 23-24 April the Washington VAAC reported ash emissions that rose as high as 2,028 m above the summit and drifted NE. According to IG-EPN surveillance camera showed an ash plume rising 3 km above the summit and drifted NE at 0953 (figure 28). During 24-25 and 28-30 April ash emissions rose 200-2,000 m above the crater and drifted NE and W. According to ROVE, ashfall was reported in the S area of the national park around 1805.
 |
Figure 28. Webcam image of an ash emission rising 3 km above the summit of Cotopaxi and drifting NE on 24 April 2023. Photo has been color corrected. Courtesy of IG-EPN (INFORME DIARIO DEL VOLCAN COTOPAXI No. 2023-114). |
Similar activity continued during May. Seismicity was characterized by daily LP and near-daily TR events and occasional VT events. Gas-and-steam emissions rose 200-1,500 m above the summit and drifted in different directions. Gas-and-ash emissions rose 200-1,400 m above the crater and drifted W, SW, NW, and SE. On 1 May at 0130 and on 8 May the BNAS seismic station recorded high-frequency seismic signals that corresponded to small lahars that remained within the Cotopaxi National Park. An ash plume was observed in a GOES-16 satellite image around 1100 that rose 1.5 km above the summit and drifted WNW, reaching Manabí on 4 May. Light ashfall was reported in Mulaló during 6-7 May. At 0600 on 7 May an ash plume rose 500-1,100 m above the summit and drifted W and SW. Ashfall was reported in Mulaló. The Washington VAAC reported that ash emissions rose 800 m above the summit and drifted NW during 7-8 May. During 9-10 May a moderate ash plume rose 2-3 km above the summit and drifted SW, N, and NE. Ashfall was reported in San Joaquín (SW) and San Agustín de Callo (SW). Another ash plume rose 2 km above the summit and drifted SE at 0749 on 12 May (figure 29). Intermittent ash plumes rose 1-3 km above the summit starting at 0510 on 18 May and drifted NE. As a result, light ashfall was reported in Machachi. Continuous ash emissions were recorded during the morning of 26 May, rising 1.5-2 km above the crater and drifting W and NW. Ash emissions rose as high as 1.1 km above the summit and drifted W and SW during 29-30 May according to the Washington VAAC. At 0600 surveillance cameras and satellite images showed an ash plume rising 1.1 km above the crater and drifted as far as 40 km W. Ashfall was reported in Pastocalle. During 30-31 May an ash emission rose 500 m above the summit and drifted W, based on a Washington VAAC report.
 |
Figure 29. Webcam image showing an ash plume rising as high as 2 km above the summit of Cotopaxi on 12 May 2023. Courtesy of IG-EPN (IG Al Instante Informativo VOLCÁN COTOPAXI No 2023-048). |
During June, gas-and-steam emissions rose 100-500 m above the summit and seismicity continued with daily LP and near-daily TR events and less frequent VT events. Gas-and-ash emissions rose 100-1,000 m above the summit and drifted in several directions. Light ashfall was reported in San Agustín de Callo and San Ramón during 1-2 June. Ash emissions rose 1 km above the summit and drifted SW during 1746-2000 on 3 June. According to the Washington VAAC, ash emissions rose 800 m above the summit and drifted SW during 4-5 June. A seismic signal was recorded on the NW flank on 8 June that IG reported was possibly associated with a small lahar. Around 0900 on 21 June an ash cloud rose less than 500 m above the summit and drifted over the W and SW flanks due to strong winds; light ashfall was reported in the Cotopaxi National Park. Starting around 1400 on 27 June through 28 June a high-frequency tremor signal was recorded at the BREF and BNAS seismic stations associated with small lahar signals moving through the Agualongo Creek; the flows were limited to the Cotopaxi National Park. Around 1300 on 29 June two seismic signals relating to small lahars were recorded on the W flank of the volcano moving down the Agualongo Creek.
Activity during July was relatively low and was mainly characterized by gas-and-steam emissions rising 100-1,800 m above the summit and seismicity consisting of daily LP and near-daily TR events and less frequent VT events. During the afternoon of 1 July, a high-frequency seismic signal was recorded on the NW flank relating to a small lahar. Gas-and-ash emissions rose 100-1,100 m above the summit and drifted SW and W. The Washington VAAC reported an ash emission that rose 500 m above the summit and drifted SW during 2-3 July. Light ashfall was reported in Mulaló, including Rosal, Ticatilín, San Agustín del Callo, San Ramón, and Rumipamba de Villacis. On 5 July around 0700 an ash plume rose 600 m above the summit and drifted SW, based on a GOES-16 satellite images. According to IG-EPN cameras and ROVE reports, remobilized ash was observed on the W flank resulting from strong winds during 18-19 July.
Information Contacts: Instituto Geofísico, Escuela Politécnica Nacional (IG-EPN), Casilla 17-01-2759, Quito, Ecuador (URL: http://www.igepn.edu.ec/); Washington Volcanic Ash Advisory Center (VAAC), Satellite Analysis Branch (SAB), NOAA/NESDIS OSPO, NOAA Science Center Room 401, 5200 Auth Rd, Camp Springs, MD 20746, USA (URL: www.ospo.noaa.gov/Products/atmosphere/vaac, archive at: http://www.ssd.noaa.gov/VAAC/archive.html).
2024: February
| May
2023: January
| February
| March
| April
| May
| June
2022: October
| November
| December
2016: January
| May
| August
2015: June
| August
| September
| October
| November
| December
2005: August
| September
2004: January
2003: November
| December
IG-EPN reported that monitoring instruments began recording signals at 1510 on 23 May indicating that a moderately-sized secondary lahar was descending Cotopaxi’s NW flank. The public was advised to stay away from stream and river drainages within the vicinity of Parque Nacional Cotopaxi (Cotopaxi National Park).
Source: Instituto Geofísico-Escuela Politécnica Nacional (IG-EPN)
IG-EPN reported that a seismic station located on the W flank recorded high-frequency seismic signals associated with the descent of small to moderate-sized lahars at 1442 and 1430 on 8 and 10 February, respectively. The public was advised to stay away from areas near the Agualongo drainage and to not approach any channels, streams, or rivers within the vicinity of Parque Nacional Cotopaxi (Cotopaxi National Park). The Secretaría de Gestión de Riesgos (SGR) maintained the Alert Level at White (the lowest level on a four-color scale).
Sources: Instituto Geofísico-Escuela Politécnica Nacional (IG-EPN); Secretaría de Gestión de Riesgos (SGR)
IG reported that moderate eruptive activity continued at Cotopaxi during 27 June-4 July. Seismic stations recorded long-period earthquakes (LPs) and eruption tremors daily; volcano-tectonic earthquakes (VTs) were detected during 27-28 and 30 June and 3-4 July. Snow and ice melted from the summit and triggered small lahars that descended the Agualongo drainage during the afternoons of 27 and 29 June and the NW flank during the afternoon of 1 July. Frequent degassing episodes were observed during 27 June-1 July; weather clouds sometimes obscured views of the summit. Ash plumes were observed in webcam and satellite images and described in aviation notices issued by the Washington VAAC during 2-3 July. The plumes rose 500-1,000 m above the crater and drifted W; ashfall was reported in El Rosal (34 km SW), Ticatilín (15 km WSW), San Agustín del Callo (16 km WSW), San Ramón (16 km WSW), and Rumipamba de Villacís (19 km WSW), all within the parish of Mulaló. The Secretaría de Gestión de Riesgos maintained the Alert Level at Yellow (the second highest level on a four-color scale).
Sources: Instituto Geofísico-Escuela Politécnica Nacional (IG-EPN); Secretaría de Gestión de Riesgos (SGR); Washington Volcanic Ash Advisory Center (VAAC)
IG reported that moderate eruptive activity continued at Cotopaxi during 20-27 June. Several gas-and-ash emissions rose as high as 900 m above the summit and drifted S, SW, and W during 21-22 June. During 22-23 June gas plumes with low amounts of ash rose less than 200 m above the summit and drifted SW. Additional gas-and-steam emissions during 23-26 June rose as high as 500 m above the summit and drifted to the S and SW. Weather clouds often prevented direct observations. Servicio Nacional de Gestión de Riesgos y Emergencias (SNGRE) maintained the Alert Level at Yellow (the second lowest level on a four-color scale).
Sources: Instituto Geofísico-Escuela Politécnica Nacional (IG-EPN); Servicio Nacional de Gestión de Riesgos y Emergencias (SNGRE)
IG reported that moderate eruptive activity continued at Cotopaxi during 13-20 June. Small gas-and-steam emissions rose as high as 200 m above the crater rim and drifted W and SW during 13-14 and 17 June. Several gas emissions with minor ash content rose 100 m on 15 June, and several seismic signals possibly indicating similar emissions were detected on 16 June. Gas-and-ash plumes rose 500-700 m on 18 June. Gas-and-steam plumes with minor ash content rose 100-700 m and drifted W and SW during 19-20 June. Servicio Nacional de Gestión de Riesgos y Emergencias (SNGRE) maintained the Alert Level at Yellow (the second lowest level on a four-color scale).
Sources: Instituto Geofísico-Escuela Politécnica Nacional (IG-EPN); Servicio Nacional de Gestión de Riesgos y Emergencias (SNGRE)
IG reported that moderate eruptive activity continued at Cotopaxi during 6-13 June. Seismic activity was mainly characterized by long-period earthquakes and tremors associated with daily emissions; one volcano-tectonic event was recorded during 6-7 June. Small gas-and-steam emissions rose as high as 300 m above the crater rim during 6-9 June. A small lahar was detected by the seismic network on 8 June and descended the NW flank. Several daily ash-and-gas emissions were visible during 10-13 June and were continuous during part of 12 June. The plumes rose 200-600 m above the crater rim and drifted NW, W, and SW. Servicio Nacional de Gestión de Riesgos y Emergencias (SNGRE) maintained the Alert Level at Yellow (the second lowest level on a four-color scale).
Sources: Instituto Geofísico-Escuela Politécnica Nacional (IG-EPN); Servicio Nacional de Gestión de Riesgos y Emergencias (SNGRE)
IG reported that moderate eruptive activity continued at Cotopaxi during 30 May-6 June. Seismic activity was mainly characterized by long-period earthquakes and tremors associated with daily emissions. Although weather clouds often obscured views, emissions were visible almost daily. During 30-31 May ash-and-gas emissions rose as high as 500 m above the summit and drifted W and NW. A tremor signal associated with an ash emission was detected on 1 June, though weather clouds prevented visual confirmation; ashfall was reported in San Ramón (108 km N) and San Agustín de Callo (16 km WSW). Multiple ash emissions were reported on 3 June; ash plumes rose as high as around 1 km above the summit and drifted SW, W, and NW. During 4-5 June several gas-and-ash emissions rose 400-800 m and drifted W and SW. Servicio Nacional de Gestión de Riesgos y Emergencias (SNGRE) maintained the Alert Level at Yellow (the second lowest level on a four-color scale).
Sources: Instituto Geofísico-Escuela Politécnica Nacional (IG-EPN); Servicio Nacional de Gestión de Riesgos y Emergencias (SNGRE)
IG reported that moderate eruptive activity continued at Cotopaxi during 23-30 May. Seismic activity was mainly characterized by long-period earthquakes and tremors associated with emissions that occurred almost daily; a total of three volcanic-tectonic earthquakes were recorded during the week. Weather clouds often hindered views, though gas-and-steam emissions were visible daily. During 23-24 May ash-and-gas emissions rose as high as 1 km above the summit and drifted W. On 26 May a period of continuous ash emissions was recorded with the plumes rising as high as 2 km above the summit and drifting NW and W. On 30 May ash plumes rose 1.2 km and drifted W; ashfall was reported in the Pastocalle parish of Latacunga canton (Cotopaxi Province). Servicio Nacional de Gestión de Riesgos y Emergencias (SNGRE) maintained the Alert Level at Yellow (the second lowest level on a four-color scale).
Sources: Instituto Geofísico-Escuela Politécnica Nacional (IG-EPN); Servicio Nacional de Gestión de Riesgos y Emergencias (SNGRE)
IG reported that moderate eruptive activity continued at Cotopaxi during 17-23 May. Seismic activity was mainly characterized by long-period earthquakes and tremors associated with emissions that occurred almost daily; a total of six volcanic-tectonic earthquakes were recorded during the week. Emissions of steam, gas, and variable amounts of ash were observed on most days; clouds obscured views on 19 May. Weak steam-and-gas emissions that barely rose above the crater level were recorded during 17 and 20-22 May; the emissions drifted W on 22 May. Starting at 0510 on 18 May emissions of steam-and-ash rose 1-3 km above the crater and drifted N and NE; ashfall was reported in Machachi (23 km NW). During the morning of 23 May several steam-and-gas emissions with possible minor ash content were observed rising 1 km above the crater and drifting S. Servicio Nacional de Gestión de Riesgos y Emergencias (SNGRE) maintained the Alert Level at Yellow (the second lowest level on a four-color scale).
Sources: Instituto Geofísico-Escuela Politécnica Nacional (IG-EPN); Servicio Nacional de Gestión de Riesgos y Emergencias (SNGRE)
IG reported that moderate eruptive activity continued at Cotopaxi during 9-16 May. Daily seismic activity was characterized by long-period earthquakes and tremors indicating emissions; a few volcano-tectonic earthquakes were recorded during the week. Emissions of steam, gas, and variable amounts of ash were observed on most days. During 9-10 May plumes with moderate amounts of ash rose 2-3 km above the crater rim and drifted SW, N, and NE. Ashfall was reported in areas to the SW, including San Joaquín and San Agustín de Callo. On 11 May gas-and-steam plumes rose 700 m above the summit and drifted to the E and SE. Emissions with moderate ash content on 12 May rose 1-2 km above the crater rim and drifted to the SE; later that day ash plumes rose 700 m. On 13 May steam-and-gas emissions with low or no ash content rose 900 m above the summit and drifted S, and gas-and-ash plumes rose 800 m and drifted SE. On 15 May steam-and-ash plumes rose 400 m and drifted W and SW. Weather clouds often prevented views during 14-16 May. Servicio Nacional de Gestión de Riesgos y Emergencias (SNGRE) maintained the Alert Level at Yellow (the second lowest level on a four-color scale).
Sources: Instituto Geofísico-Escuela Politécnica Nacional (IG-EPN); Servicio Nacional de Gestión de Riesgos y Emergencias (SNGRE)
IG reported that moderate eruptive activity continued at Cotopaxi during 2-9 May. Seismic activity was largely dominated by long-period earthquakes, tremors indicating emissions, and a few volcano-tectonic earthquakes. Emissions of steam, gas, and variable amounts of ash were observed daily. During 2-3 May minor ash plumes rose less than 200 m above the crater rim and drifted W. On 4 May ash plumes rose as high as 1.5 km above the crater rim and drifted SW and NW, drifting as far as the province of Manabí. On 5 May several emissions with low ash content rose as high as 300 m and drifted SW. On 7 May ash plumes rose as high as 1.1 km above the crater rim and drifted W and SW, causing minor ashfall in areas downwind including Mulaló. On 8 May a seismic station recorded a small secondary lahar. Several steam-and-gas emissions were visible during 8-9 May. Servicio Nacional de Gestión de Riesgos y Emergencias (SNGRE) maintained the Alert Level at Yellow (the second lowest level on a four-color scale).
Sources: Instituto Geofísico-Escuela Politécnica Nacional (IG-EPN); Servicio Nacional de Gestión de Riesgos y Emergencias (SNGRE)
IG reported ongoing moderate eruptive activity at Cotopaxi during 26 April-2 May. Cloudy weather sometimes prevented webcam and satellite views, but emissions of steam-and-ash were visible on most days. On 26 April a gas plume with minor amounts of ash rose 500 m above the crater rim and drifted E. On 28 April an ash plume rose 800 m and drifted SE and W; ashfall was reported in the S part of Parque Nacional Cotopaxi. Gas-and-ash plumes rose 800 m and drifted W on 29 April, and two ash emissions rose 200-800 m and drifted SW and W on 30 April. At 0130 on 1 May the seismic network began recording a high-frequency signal that corresponded to the descent of a very small secondary lahar that remained within the bounds of Parque Nacional Cotopaxi. Gas-and-ash emissions rose 300 m and drifted W during 1-2 May. Servicio Nacional de Gestión de Riesgos y Emergencias (SNGRE) maintained the Alert Level at Yellow (the second lowest level on a four-color scale).
Sources: Instituto Geofísico-Escuela Politécnica Nacional (IG-EPN); Servicio Nacional de Gestión de Riesgos y Emergencias (SNGRE)
IG reported ongoing moderate eruptive activity at Cotopaxi during 18-25 April. Cloudy weather sometimes prevented webcam and satellite views, but daily emissions of steam-and-gas rising as high as 1.5 km were seen in webcam images. Small ash-and-gas emissions were visible during 21-22 April. An ash plume first seen at 0953 on 24 April rose up to 3 km above the summit and drifted NE. Later that afternoon and evening ash-and-gas emissions rose 350 m and drifted N. At 1600 the seismic station recorded a small secondary lahar that descended the Cutzalao/Agualongo drainage on the SW flank. Servicio Nacional de Gestión de Riesgos y Emergencias (SNGRE) maintained the Alert Level at Yellow (the second lowest level on a four-color scale).
Sources: Instituto Geofísico-Escuela Politécnica Nacional (IG-EPN); Servicio Nacional de Gestión de Riesgos y Emergencias (SNGRE)
IG reported that eruptive activity at Cotopaxi was ongoing during 11-18 April, though cloudy weather often prevented webcam and satellite views. A small secondary lahar descended the Agualongo drainage on the SW flank on 11 April. Ash-and-gas plumes on 12 April rose as high as 1.5 km above the crater rim and drifted W and SW. Muddy water in a drainage on the NW flank was visible on 15 April. Daily gas-and-steam emissions were visible during 13-18 April, rising as high as 300 m and drifted W. Servicio Nacional de Gestión de Riesgos y Emergencias (SNGRE) maintained the Alert Level at Yellow (the second lowest level on a four-color scale).
Sources: Instituto Geofísico-Escuela Politécnica Nacional (IG-EPN); Servicio Nacional de Gestión de Riesgos y Emergencias (SNGRE)
IG reported that eruptive activity at Cotopaxi was ongoing during 4-11 April. Gas, steam, and ash plumes visible in webcam images and reported by the Washington VAAC during 4-6 and 8 April rose 200-800 m above the summit and drifted E, SE, S, and SW. Minor ashfall was reported in Mulaló (9.5 km WSW) and San Agustín (10 km W). Gas-and-steam plumes rose 300 m and drifted S and SE on 7 April. On 10 April ash plumes rose 1-1.5 km and drifted W, SW, and SE. Weather clouds prevented visual observations on the other days. Servicio Nacional de Gestión de Riesgos y Emergencias (SNGRE) maintained the Alert Level at Yellow (the second lowest level on a four-color scale).
Sources: Instituto Geofísico-Escuela Politécnica Nacional (IG-EPN); Servicio Nacional de Gestión de Riesgos y Emergencias (SNGRE)
IG reported that eruptive activity at Cotopaxi was ongoing during 29 March-4 April. Gas-and-ash plumes visible in webcam images and reported by the Washington VAAC during 28-29 March rose as high as 2 km above the summit and drifted SE and N. Minor ashfall was reported in Machachi (23 km NW), El Chasqui (17 km W), and Latacunga (34 km SW). Gas-and-steam plumes were seen rising 100-300 m during 30-31 March. Ash-and-gas plumes rose as high as 1 km and drifted W during 1-2 April. Gas-and-steam plumes rose 1 km and drifted W on 3 April. Servicio Nacional de Gestión de Riesgos y Emergencias (SNGRE) maintained the Alert Level at Yellow (the second lowest level on a four-color scale).
Sources: Instituto Geofísico-Escuela Politécnica Nacional (IG-EPN); Servicio Nacional de Gestión de Riesgos y Emergencias (SNGRE)
IG reported that eruptive activity at Cotopaxi was ongoing during 22-28 March. Gas-and-steam emissions were visible during 21-24 March rising as high as 1 km above the crater rim and drifting E; weather clouds prevented views of the volcano on 23 March. Ash emissions rose 500-800 m above the crater rim and drifted SW and SE during 25-26 March. Ash plumes rose 1.1 km above the crater rim and rifted SE, NE, and NW on 27 March. Ash plumes rose as high as 2 km above the crater rim on 28 March and drifted NW, causing minor ashfall in the Machachi parish on the N flank, in Parque Nacional Cotopaxi. Servicio Nacional de Gestión de Riesgos y Emergencias (SNGRE) maintained the Alert Level at Yellow (the second lowest level on a four-color scale).
Sources: Instituto Geofísico-Escuela Politécnica Nacional (IG-EPN); Servicio Nacional de Gestión de Riesgos y Emergencias (SNGRE); Washington Volcanic Ash Advisory Center (VAAC)
IG reported that eruptive activity at Cotopaxi was ongoing during 15-21 March. Gas-and-steam emissions were visible on most days rising as high as 1 km above the crater rim and drifting in multiple directions. On 16 March several gas emissions containing minor amounts of ash rose as high as 1.5 km and drifted SE. During 19-20 March ash-and-gas plumes rose 1-1.5 km and drifted E and SE. Servicio Nacional de Gestión de Riesgos y Emergencias (SNGRE) maintained the Alert Level at Yellow (the second lowest level on a four-color scale).
Sources: Instituto Geofísico-Escuela Politécnica Nacional (IG-EPN); Servicio Nacional de Gestión de Riesgos y Emergencias (SNGRE)
IG reported that the eruption at Cotopaxi continued during 8-14 March. Gas-and-steam emissions were visible on most days rising as high as 1.5 km above the crater rim and drifting in multiple directions. On 10 March a gas-and-steam plume with low ash content rose as high as 1 km and drifted S. Weather clouds sometimes prevented observations, especially on 11 March. Servicio Nacional de Gestión de Riesgos y Emergencias (SNGRE) maintained the Alert Level at Yellow (the second lowest level on a four-color scale).
Sources: Instituto Geofísico-Escuela Politécnica Nacional (IG-EPN); Servicio Nacional de Gestión de Riesgos y Emergencias (SNGRE)
IG reported that the eruption at Cotopaxi continued during 28 February-7 March. Several daily ash, gas, and steam plumes rose as high as 1.5 km above the summit during 28 February-2 March and drifted W and SW. Minor ashfall was reported in Mulaló parish (Colcas-Ticatilín) of the Latacunga canton during the afternoon of 28 February. Steam-and-gas emissions were visible rising as high as 700 m and drifting SW and W during 3-7 March. Minor ashfall was reported in Mulaló parish on 5 March. Servicio Nacional de Gestión de Riesgos y Emergencias (SNGRE) maintained the Alert Level at Yellow (the second lowest level on a four-color scale).
Sources: Instituto Geofísico-Escuela Politécnica Nacional (IG-EPN); Servicio Nacional de Gestión de Riesgos y Emergencias (SNGRE)
IG reported that the eruption at Cotopaxi continued during 22-28 February, characterized by almost daily emissions of gas, steam, and ash; inclement weather conditions occasionally prevented views. Gas-and-steam emissions rose 500 m above the crater rim and drifted W during 21-22 February. Weather clouds prevented visual observations of the volcano during most of 23 February, though by the late afternoon and into the next morning steam emissions with low ash content were seen rising 500 m and drifted SW. Gas-and-steam plumes rose 500 m and drifted W on 25 February. Several emissions of gas, steam, and ash rose as high as 2.4 km and drifted SE on 26 February. During periodic breaks in weather clouds, continuous emissions of gas, steam, and ash sere seen rising as high as 1.5 km and drifting E and SE. Minor amounts of ash fell in the province of Pichincha in Rumiñahui (61 km N), Rumipamba Vallecito, Conocoto (41 km N), El Pedregal (60 km N), Guamaní (42 km NNW), Quitumbe (41 km NNW), La Ecuatoriana (44 km NNW), Chillogallo (47 km NNW), Urubamba (Santo Tomas, 40 km NNW), La Magdalena (Barrio Nuevo, Villaflora, 48 km NNW) and San Bartolo. At 1430 on 28 February an ash plume rose 500 m and drifted SW. Servicio Nacional de Gestión de Riesgos y Emergencias (SNGRE) maintained the Alert Level at Yellow (the second lowest level on a four-color scale).
Sources: Servicio Nacional de Gestión de Riesgos y Emergencias (SNGRE); Instituto Geofísico-Escuela Politécnica Nacional (IG-EPN)
IG reported that the eruption at Cotopaxi continued during 14-21 February, characterized by almost daily emissions of gas, steam, and ash; inclement weather conditions occasionally prevented views. Gas emissions with some ash rose as high as 600 m above the crater rim and drifted E, SE, and SW during 14-15 February. Minor ashfall was noted in San Ramón (17 km SW), Ticatilín (15 km WSW), San Agustín del Callo (18 km WSW), Mulaló (19 km SW), and Lasso (20 km WSW). Daily ash-and-gas plumes rose as high as 1.1 km during 16-19 February and drifted mainly E, SE, S, and SW. Minor amounts of ash occasionally fell on the downwind flanks. During 20-21 February steam-and-gas plumes rose as high as 1.3 km and drifted E and SW. Servicio Nacional de Gestión de Riesgos y Emergencias (SNGRE) maintained the Alert Level at Yellow (the second lowest level on a four-color scale).
Sources: Instituto Geofísico-Escuela Politécnica Nacional (IG-EPN); Servicio Nacional de Gestión de Riesgos y Emergencias (SNGRE)
IG reported that the eruption at Cotopaxi continued during 7-14 February, characterized by daily or almost daily emissions of gas, steam, and ash; inclement weather conditions occasionally prevented views. Gas-and-ash emissions rose as high as 2 km above the crater rim and drifted NW, W, and E during 7-10 February. Minor ashfall was reported in the parish of Tambillo (32 km NNW), Mejia region, on 10 February. Steam-and-gas emissions rose to 1 km and drifted W and SW on 11 February. Gas-and-ash plumes rose around 500 m on 12 February and drifted SW. Minor amounts of ash fell in El Chasqui (17 km W), Mulaló (19 km SW), and San Juan de Pastocalle (20 km WSW). During 13-14 February several steam-and-ash emissions rose as high as 1 km and drifted W and SW. Minor ashfall was reported in Mulaló, San Agustín (11 km W), Ticatilín (15 km WSW), San Ramón (17 km SW), Control Caspi (20 km WSW), and in Pastocalle (22 km W). Servicio Nacional de Gestión de Riesgos y Emergencias (SNGRE) maintained the Alert Level at Yellow (the second lowest level on a four-color scale).
Sources: Instituto Geofísico-Escuela Politécnica Nacional (IG-EPN); Servicio Nacional de Gestión de Riesgos y Emergencias (SNGRE)
IG reported that the eruption at Cotopaxi continued during 1-7 February, characterized by daily emissions of gas, steam, and ash emissions; inclement weather conditions occasionally prevented views. Gas-and-steam emissions were visible rising from the crater on 1 February. Seismicity increased at 0100 on 2 February and was associated with an ash plume that rose 1.3 km above the summit and drifted NW. Later that day emissions containing ash rose as high as 2.5 km and drifted N, NE, and SE. Ashfall was reported in the N part of Parque Nacional Cotopaxi, and in the area of the Tesalia (47 km NNW) and Güitig factories. Ashfall was also reported in the Quito and Mejía regions including in Amaguaña (35 km NNW), Quitumbe (43 km NNW), Conocoto (41 km N), Guamaní, La Ecuatoriana (44 km NNW), Turubamba (43 km NNW), Chillogallo (47 km NNW), La Magdalena, Machachi (24 km NW), Tambillo (32 km NNW), Alóag (28 km NW), and Cutuglahua (35 km NNW). On 3 February ash plumes rose as high as 2.5 km and drifted in multiple directions, and ash fell in Amaguaña, La Armenia, Quitumbe, Conocoto, Guamaní, La Ecuatoriana, Turubamba, Chillogallo, La Magdalena, Machachi, Tambillo, Alóag, Cutuglahua, Uyumbicho (30 km NNW), Aloasí (24 km NW), and El Chaupi (24 km WNW). On 4 February ash plumes rose 1.5 km and drifted NNE and SE. Ashfall was noted in Guamaní, Turubamba, Chillogallo, La Ecuatoriana, Quitumbe, Tambillo, Machachi, Aloasí, Aloag, and Conocoto. On 5 February steam-and-gas emissions with low ash content drifted NW. In the afternoon ash emissions rose 200 m and drifted S. Minor gas emissions were visible during 6-7 February. Servicio Nacional de Gestión de Riesgos y Emergencias (SNGRE) maintained the Alert Level at Yellow (the second lowest level on a four-color scale).
Source: Instituto Geofísico-Escuela Politécnica Nacional (IG-EPN)
IG reported that the eruption at Cotopaxi continued during 24-31 January, characterized by almost daily gas-and-steam and ash emissions; inclement weather conditions prevented views of the volcano on 29 January. During 24-25 January steam-and-gas plumes rose to the crater level and drifted W. During 26-27 January gas-and-ash plumes rose less than 1 km above the crater rim and drifted SW and W. Minor ashfall was reported in San Agustín de Callo (18 km WSW), Lima Villacís, Mulaló, Barrancas, Ticatilín and Caspi (20 km WSW), and San Ramon (127 km W). Steam-and-gas emissions rose 600 m and drifted S on 28 January. A significant increase in the size and density of ash emissions was evident in satellite images at 0820 on 30 January. The plumes rose as high as 2.5 km above the crater rim and drifted SW, S, and SE. Minor amounts of ash fell in Mulaló and Latacunga (18 km WSW). Ash plumes rose as high as 1.7 km and drifted S and SE on 31 January. Servicio Nacional de Gestión de Riesgos y Emergencias (SNGRE) maintained the Alert Level at Yellow (the second lowest level on a four-color scale).
Source: Instituto Geofísico-Escuela Politécnica Nacional (IG-EPN)
IG reported that the eruption at Cotopaxi continued during 18-24 January, characterized by daily emissions of steam, gas, and ash. The plumes were visible in webcam images and reported by the Washington VAAC, though sometimes weather conditions prevented observations. They rose as high as 2 km and drifted in various directions and caused ashfall in Chillos (33 km SW), Langualó, San Isidro Alto (20 km SW), and San Agustín del Callo (18 km WSW) during 17-18 January and in San Isidro Alto, Chillos and Langualó Chico during 18-19 January. Servicio Nacional de Gestión de Riesgos y Emergencias (SNGRE) maintained the Alert Level at Yellow (the second lowest level on a four-color scale).
Source: Instituto Geofísico-Escuela Politécnica Nacional (IG-EPN)
IG reported that the eruption at Cotopaxi continued during 11-17 January, characterized by daily steam-and-gas emissions often with variable ash content. On 11 January ash plumes rose as high as 200 m above the crater rim and drifted W and SW. Minor ashfall was noted in areas of Mulaló, Macaló Grande, San Antonio, San Ramón (127 km W), Ticatilín (15 km SW), and MAE Norte (18 km N), and a sulfur odor was noted in Ticatilín and Control Caspi (20 km WSW) of the Parque Nacional Cotopaxi. On 12 January steam, gas, and ash plumes rose as high as 1 km and drifted SE, SW, and W. On 13 January a dense ash plume rose 2 km and drifted NE, causing ashfall in Ticatilín; other ash plumes rose 1 km and drifted W and N that same day. Steam-and-gas emissions rose 300-700 m during 14-17 January and drifted E, SE, and SW. Ash-and-gas plumes rose 1 km on 17 January and drifted W and SW; minor ashfall was reported in Mulaló and San Juan de Pastocalle (20 km WSW). Servicio Nacional de Gestión de Riesgos y Emergencias (SNGRE) maintained the Alert Level at Yellow (the second lowest level on a four-color scale).
Sources: Instituto Geofísico-Escuela Politécnica Nacional (IG-EPN); Servicio Nacional de Gestión de Riesgos y Emergencias (SNGRE)
IG reported that the low-level eruption at Cotopaxi continued during 3-11 January, characterized by daily steam-and-gas emissions often with low ash content. Plumes of gas, steam, and minor ash content rose as high as 1.7 km above the crater rim and drifted NW, W, SW, and E, based on webcam views, satellite images, and information from the Guayaquil Meteorological Office. Minor ashfall was reported in the sectors of Colcas, San Ramon, and San Agustin de Callo (18 km WSW). Servicio Nacional de Gestión de Riesgos y Emergencias (SNGRE) maintained the Alert Level at Yellow (the second lowest level on a four-color scale).
Sources: Instituto Geofísico-Escuela Politécnica Nacional (IG-EPN); Servicio Nacional de Gestión de Riesgos y Emergencias (SNGRE)
IG reported that the low-level eruption at Cotopaxi continued during 28 December 2022-3 January 2023, characterized by daily steam-and-gas emissions with occasional low ash content. Several gas-and-steam emissions with low ash content were visible on 28 December rising 600-900 m above the summit and drifting W. Sulfur dioxide emissions were 1,314-2,550 tons per day during 27-28 December based on satellite data. Only gas emissions were visible during 29 December-2 January, though weather clouds often prevented webcam and satellite observations. At 1740 on 3 January a diffuse ash plume rose 1 km above the summit and drifted W, based on a satellite image. Minor ashfall was possible in areas to the W. Servicio Nacional de Gestión de Riesgos y Emergencias (SNGRE) maintained the Alert Level at Yellow (the second lowest level on a four-color scale).
Sources: Instituto Geofísico-Escuela Politécnica Nacional (IG-EPN); Servicio Nacional de Gestión de Riesgos y Emergencias (SNGRE)
On 23 December IG issued a special report about increased activity at Cotopaxi. A total of 27 ash emissions had been recorded since the eruption began on 21 October; one ash emission was recorded in October, four were recorded in November, and 22 were recorded by 23 December. Based on Washington VAAC notices, ash clouds drifted the farthest, 60 km NNW, on 26 November and 20 December after rising 2.2 km (the maximum recorded height) and 1.5 km above the crater rim, respectively. Ashfall on those two days was reported in the Mejía, Rumiñahui, and Quito regions. Ash samples from 21 October and 26 November revealed a slight increase in the total percentage of juvenile material; an analysis of 20 December ash was in progress. Increases in sulfur dioxide emissions were measured both by satellite and ground-based Differential Optical Absorption Spectroscopy (DOAS) instruments. Gas measurements taken during periodic overflights showed increases in the ratio of sulfur dioxide to hydrogen sulfide. Based on these and other monitoring data, IG reiterated that the activity was caused by magma in the volcano’s conduit, though not from new magma entering the system after the 2015 eruption.
Daily emissions with ash continued to be observed in webcam images and reported by the Washington VAAC during 23-27 December; weather clouds obscured views on 26 December. Gas-and-steam plumes with low ash content rose as high as 1.5 km above the crater rim and drifted in various directions. Servicio Nacional de Gestión de Riesgos y Emergencias (SNGRE) maintained the Alert Level at Yellow (the second lowest level on a four-color scale).
Sources: Instituto Geofísico-Escuela Politécnica Nacional (IG-EPN); Servicio Nacional de Gestión de Riesgos y Emergencias (SNGRE)
IG reported that the low-level eruption at Cotopaxi continued during 14-20 December, characterized by daily steam-and-gas emissions with low ash content. At 0626 on 14 December an ash emission rose 500 m above the crater rim and drifted W, causing ashfall within Parque Nacional Cotopaxi. Weather clouds sometimes obscured views of the volcano; between weather clouds during 14-16 December steam-and gas plumes with low ash content were seen rising as high as 500 m above the crater rim and drifting W. Several emissions with low or very low ash content rose as high as 800 m above the crater rim and drifted W and SW during 16-17 December; similar emissions rose as high as 1.1 km above the crater rim and drifted W and SW during 18-20 December based on webcam views and Washington VAAC notices. Ashfall was reported in San Pedro de Taboada (40 km N), Uyumbicho (30 km NNW), Güitig Alta, Güitig Baja, Conocoto (42 km N), Sur de Quito, Chimbacalle (48 km NNW), La Magdalena (48 km NNW), Barrio Nuevo, Villaflora (48 km NNW), Miraflores, and La Floresta (50 km N) during 19-20 December. Servicio Nacional de Gestión de Riesgos y Emergencias (SNGRE) maintained the Alert Level at Yellow (the second lowest level on a four-color scale).
Sources: Instituto Geofísico-Escuela Politécnica Nacional (IG-EPN); Servicio Nacional de Gestión de Riesgos y Emergencias (SNGRE)
IG reported that the low-level eruption at Cotopaxi continued during 7-13 December characterized by steam-and-gas emissions and occasional ash emissions. Sulfur dioxide emissions measured by satellite almost daily averaged 665-2,745 tons per day. Steam-and-gas emissions observed during 7-10 December rose as high as 2 km above the crater rim and drifted SW, W, and NW. Ash emissions during 0758-0816 on 8 December rose 1 km and drifted WNW. The Washington VAAC issued three advisories noting that ash rose 800-1,100 m and drifted W. A tremor signal that started at 0832 on 9 December was probably related to gas-and-ash emissions, though cloudy weather conditions prevented visual confirmation. During the night of 9-10 December several steam-and-ash emissions were identified in satellite images rising as high as 1.1 km and drifting NW. Minor ashfall was reported in Conocoto-Pichincha in the morning of 10 December. At 0930 on 11 December the seismic stations recorded a signal related to gas-and-ash emissions that rose 2 km and drifted W. Ash fell in Control Caspi, located at the S entrance to Parque Nacional Cotopaxi. Several gas-and-steam emissions with low ash content were visible that afternoon and during the morning of 12 December rising as high as 500 m and drifting W. Servicio Nacional de Gestión de Riesgos y Emergencias (SNGRE) maintained the Alert Level at Yellow (the second lowest level on a four-color scale).
Sources: Instituto Geofísico-Escuela Politécnica Nacional (IG-EPN); Servicio Nacional de Gestión de Riesgos y Emergencias (SNGRE)
IG reported that the low-level eruption at Cotopaxi continued during 30 November-6 December. At 0841 on 30 November the seismic network recorded a signal associated with an emission. A gas plume with low ash content was visible in webcam images rising 600 m above the summit and drifting E. Earlier in the morning minor ashfall was reported in Latacunga, though the ashfall may have been the result of remobilized material previously deposited. Daily steam-and-gas emissions during 1-6 December rose as high as 1.5 km above the summit and drifted E, SE, S, and W. Daily sulfur dioxide emissions measured by satellite during 1-4 December averaged 119-4,000 tons per day. On 2 December IG noted that the heights of gas-and-steam emissions had increased in the past few weeks, corresponding to greater gas output. Thermal anomalies in the crater were visible in recent days; one was visible on 1 November, and two were visible on each of the days of 28 and 29 November. Servicio Nacional de Gestión de Riesgos y Emergencias (SNGRE) maintained the Alert Level at Yellow (the second lowest level on a four-color scale).
Sources: Instituto Geofísico-Escuela Politécnica Nacional (IG-EPN); Servicio Nacional de Gestión de Riesgos y Emergencias (SNGRE)
On 22 November IG concluded that the minor ash emissions recorded at Cotopaxi on 21 October were due to magma in the volcano’s conduit, though not from new magma entering the system after the 2015 eruption. An average of one seismic event per day was recorded based on long-term seismic rates. In the months prior to the 21 October event, the rate had gradually increased to 1.5 events per day, though after the ash emission the rate fell back to one event per day. Most of the seismicity was located beneath the summit. Minor deformation was recorded during August-November, but it could not be conclusively linked to the eruptive activity. Sulfur dioxide emissions increased in October and gas-emission analysis indicated a magmatic origin. Nearly continuous emissions of gas-and-steam had been rising from the main crater since 21 October, as high as 2 km above the rim. The heights of emissions averaged 200 m and were as high as 800 m in 2021.
At 1848 on 25 November the seismic network recorded a tremor signal associated with a gas emission that drifted NNW. At approximately 0310 on 26 November a new episode of tremor was associated with a gas-and-ash emissions that lasted for several hours. The plume drifted 85 km NNW, passing over Quito (55 km N), and caused ashfall in El Pedregal (60 km N), Tambillo (32 km NNW), Guamaní (42 km NNW), Amaguaña (33 km NNW), Chillogallo (44 km NNW), Quitumbe (41 km NNW), Solanda (46 km NNW), Lloa (48 km NNW), Conocoto (41 km N), Mercado Mayorista (45 km NNW), Villaflora (47 km NNW), and Rumipamba (55 km N). Moderate levels of seismic tremor were recorded until about 1050. Servicio Nacional de Gestión de Riesgos y Emergencias (SNGRE) maintained the Alert Level at Yellow (the second lowest level on a four-color scale).
Sources: Instituto Geofísico-Escuela Politécnica Nacional (IG-EPN); Servicio Nacional de Gestión de Riesgos y Emergencias (SNGRE)
IG issued a report that included data analysis and additional information about the minor eruptive activity at Cotopaxi recorded during 21-22 October. The eruption began with a high-frequency earthquake recorded at 1944 on 21 October and was followed by an episode of volcanic tremor from 1950 on 21 October to 0040 on 22 October. A diffuse gas-and-ash cloud rose 1.7-2.3 km above the summit and drifted NE. Ashfall was reported in the José Rivas Refuge for climbers on the N flank. Parque Nacional Cotopaxi closed to visitors due to the emissions. A small thermal anomaly in the summit crater was identified in satellite images on 23 October; a small anomaly had been repeatedly visible since the previous eruption during August-November 2015, though it had been absent since 12 November 2020.
On 22 October scientists measured sulfur dioxide emissions using a mobile Differential Optical Absorption Spectroscopy (DOAS) instrument in an area spanning near the W entrance to Parque Nacional Cotopaxi to areas in the park. They measured higher values, 1,580 tons per day, nearer to the volcano. Analysis of ash samples collected by IG scientists at the José Rivas Refuge revealed that about 22 percent was juvenile material, indicating a magmatic component to the eruption.
Parque Nacional Cotopaxi reopened on 26 October. Seismicity was at moderate levels that same day with the number of events per day progressively decreasing according to a news report. During an overflight of the summit crater on 27 October, scientists observed gas-and-steam emissions rising 500 m above the carter rim, obscuring views into the crater.
The amplitude of the tremor signal on 21 October was about half of that recorded during the 2015 eruption and the tremor signal only lasted about four hours whereas in 2015 some periods lasted several days. There was no notable precursory activity including anomalous seismic activity and deformation detected in satellite or GPS data. The Washington VAAC had previously reported ash emissions on 4 July 2016, 23 January 2017, 15 July 2018, and 10 January 2020, though none were associated with increased seismicity or ashfall. Climbers had previously reported ashfall on occasion, with the last report on 27 November 2021. Servicio Nacional de Gestión de Riesgos y Emergencias (SNGRE) maintained the Alert Level at Yellow (the second lowest level on a four-color scale).
Sources: Instituto Geofísico-Escuela Politécnica Nacional (IG-EPN); Servicio Nacional de Gestión de Riesgos y Emergencias (SNGRE); El Comercio
IG reported minor eruptive activity at Cotopaxi. A low-amplitude tremor signal recorded by the seismic network from 1950 on 21 October to 0040 on 22 October was associated with gas-and-ash emissions. The emissions were not visible due to darkness and weather conditions, but minor ashfall and a sulfur odor was reported by mountaineers in the Refugio José Rivas, 2 km N of the summit crater; the mountaineers evacuated. The Washington VAAC reported that during 2150-2200 on 21 October ash plumes rose to 7.6-8.5 (25,000-28,000 ft) a.s.l. and drifted NE based on information from IG and the Guayaquil MWO, satellite images, and webcam views. The ash had dissipated by 0410 on 22 October. A second ash plume was identified in webcam and satellite images rising to 7 km (23,000 ft) a.s.l. and drifting W at 0700 on 22 October. Ash was no longer visible by 1250. IG noted that following the end of the tremor signal seismicity declined and plumes of gas-and-steam rose as high as 1 km above the summit and drifted W. Based on the reports from IG the Servicio Nacional de Gestión de Riesgos y Emergencias (SNGRE) raised the Alert Level to Yellow (the second lowest level on a four-color scale) on 22 October.
Weather conditions at the volcano improved on 23 October and a layer of dark gray ash on the volcano, deposited the previous two days, became visible. Based on seismic data and media reports, small secondary lahars generated from the melted glacier beneath the ash deposit, were recorded during 1115-1300 and traveled short distances down the flanks. Weather clouds frequently prevented views of the volcano during 24-25 October, though steam emissions rising 200 m above the summit and drifting W were visible during a break in the cloud cover the morning of 25 October.
Sources: Instituto Geofísico-Escuela Politécnica Nacional (IG-EPN); Servicio Nacional de Gestión de Riesgos y Emergencias (SNGRE)
IG reported that during 1 January-24 August seismicity at Cotopaxi remained low. Small, intermittent gas emissions mostly stayed near the crater rim and on rare occasions rose no higher than 500 m above the rim. Emissions drifted down the W flank and remobilized ash deposits which were sometimes reported by Parque Nacional Cotopaxi visitors.
Source: Instituto Geofísico-Escuela Politécnica Nacional (IG-EPN)
During an overflight of Cotopaxi on 10 May, scientists observed minor gas emissions rising 600 m above the crater and drifting N and NW. Glaciers remained cracked, though glacial melting observed in recent months had decreased considerably. The temperature of flank fumaroles had decreased slightly.
Source: Instituto Geofísico-Escuela Politécnica Nacional (IG-EPN)
On 29 January IG reported that in recent weeks surficial activity at Cotopaxi was characterized by minor steam emissions from the crater and sporadic gas emissions with minor amounts of ash. Sulfur dioxide emissions were less than 1,000 tons per day (pre-eruptive levels) and seismicity had almost returned to baseline levels. At 1843 on 24 January a plume with low-to-moderate levels of ash rose 700 m above the crater and drifted W. The emission coincided with a hybrid earthquake.
Source: Instituto Geofísico-Escuela Politécnica Nacional (IG-EPN)
IG reported that at 1336 on 13 January a seismic station on Cotopaxi's W flank recorded an hour-long signal caused by a lahar. Preliminary results indicated that the peak flow rate was around 40 m3/s with a volume of about 50,000 m3; the lahar was the largest recorded at the volcano since the current eruption began. Lahars also descended the Agualongo River, leaving deposits on the bridge that crosses the river.
Source: Instituto Geofísico-Escuela Politécnica Nacional (IG-EPN)
IG reported that after 119 days of closure due to volcanic activity at Cotopaxi, the Cotopaxi National Park reopened to visitors. Both seismic and surficial activity have declined in recent weeks.
Source: Instituto Geofísico-Escuela Politécnica Nacional (IG-EPN)
IG reported that during 2-8 December seismic activity at Cotopaxi was characterized by volcano-tectonic, hybrid, and long-period events. Signals indicating emissions and explosions were also detected. Although cloud cover often prevented observations, gas-and-steam emissions were visible daily. A plume containing ash rose as high as 1 km and drifted NW on 7 December.
Source: Instituto Geofísico-Escuela Politécnica Nacional (IG-EPN)
IG reported that during 25 November-1 December seismic activity at Cotopaxi was characterized by volcano-tectonic, hybrid, and long-period events. Seismic signals indicating emissions and explosions were also detected. Although cloud cover often prevented observations, gas-and-steam emissions were visible daily. The plumes contained ash on most days and rose as high as 1 km, drifting W and SW. Lahar descended the Agualongo river during 28-29 November and the Mariscal Sucre river on 29 November.
Source: Instituto Geofísico-Escuela Politécnica Nacional (IG-EPN)
IG reported that during 18-24 November gas, steam, and ash plumes rose almost daily from Cotopaxi, as high as 1.5 km above the crater, and drifted W, and SW. Ashfall was reported in Machachi and Aloasí on 18 November.
Source: Instituto Geofísico-Escuela Politécnica Nacional (IG-EPN)
IG reported that during 11-17 November gas, steam, and ash plumes rose from Cotopaxi as high as 2 km above the crater and drifted NW, W, and SW.
Source: Instituto Geofísico-Escuela Politécnica Nacional (IG-EPN)
IG reported that during 4-10 November gas, steam, and ash plumes rose almost daily from Cotopaxi as high as 1.5 km above the crater. Minor ashfall was reported S of the volcano on 6 November, and small lahars descended the W flank during 6 and 8-9 November.
Source: Instituto Geofísico-Escuela Politécnica Nacional (IG-EPN)
IG reported that although cloud cover often obscured views of Cotopaxi during 28 October-3 November emissions were observed daily; gas, steam, and ash plumes rose as high as 1.5 km and drifted W, SW, S, and E. A small lahar descended the W flank on 31 October.
Source: Instituto Geofísico-Escuela Politécnica Nacional (IG-EPN)
IG reported that during 21-27 October gas, steam, and ash plumes rose from Cotopaxi almost daily as high as 2 km above the crater and drifted NW, W, and SW. A small lahar detected on 24 October descended the NW flank but stayed with Cotopaxi National Park boundaries. A small lahar descended the W flank the next day.
Source: Instituto Geofísico-Escuela Politécnica Nacional (IG-EPN)
IG reported that during 14-20 October cloud cover sometimes obscured views of Cotopaxi although emissions were observed daily. Gas, steam, and ash plumes rose as high as 2 km above the crater and drifted W, NW, N, and E. Small lahars descended the NW flank during 14-15 October, and a small lahar traveled down the Agualongo gorge on 16 October. Ashfall was reported during 16-17 and 19-20 October in Ticatilín, Lasso (60 km N), Chasqui (48 km NNW), Agualongo, Mariscal Sucre (50 km NNW), Rumipamba, San Fernando (58 km NNW), Selva Alegre (54 km NNW), Rumiñahui (61 km N), Vallecito, Aloasí (23 km NW), Aloag (28 km NW), Jambelí, El Chaupi (24 km WNW), Tanicuchi (25 km SW), and Maldonado.
Source: Instituto Geofísico-Escuela Politécnica Nacional (IG-EPN)
IG reported that during 7-13 October gas, steam, and ash plumes rose from Cotopaxi as high as 2.5 km above the crater and drifted NW, W, and SW. Ash fell on the N flank on 7 October. Ashfall was also reported in El Chasqui Chaupi, Machachi (24 km NW), Aloag (28 km NW), and Obelisco on 8 October, and in San Ramón, San Agustín, San Isidro (58 km N), Rumipamba de Espinosas (53 km NNW), Callo Mancheno, Santa Catalina (52 km N), and San Francisco on 13 October.
Source: Instituto Geofísico-Escuela Politécnica Nacional (IG-EPN)
During an overflight of Cotopaxi on 29 September, IG scientists observed low-energy pulsating emissions with low or no ash content that rose 1 km above the crater and drifted W. Fracturing continued on both the upper and lower parts of the glacier, at the toes. Rapid melting had occurred from the glacier on the upper E flank which resulted in material falling onto the lower part of the glacier. New thermal anomalies on the upper parts of the outer crater were identified, likely from newly deposited material. During 30 September-6 October gas-and-water vapor plumes sometimes with low ash content rose as high as 2 km and drifted in multiple directions. Ashfall was reported in Tanicuchí (25 km SW) on 1 October.
Source: Instituto Geofísico-Escuela Politécnica Nacional (IG-EPN)
During an overflight of Cotopaxi on 22 September, IG scientists observed low-energy emissions with low or no ash content that rose 500 m above the crater and drifted W. Fracturing continued on both the upper parts of the glacier and the glacial toes on the N, NW, and SW flanks. The glacier inside the crater had almost disappeared. Several areas of landslide deposits inside and outside of the crater were noted. Yellowish-green deposits from increased fumarolic activity were most apparent on the S, SE, and E flanks. Thermal images revealed temperature decreases since the previous overflight at the new vents inside the crater and at areas on the S flank. During 23-29 September gas-and-water vapor plumes, often with low ash content, rose as high as 2 km and drifted mainly W and SW.
Source: Instituto Geofísico-Escuela Politécnica Nacional (IG-EPN)
On 17 September IG reported that during the previous two weeks activity at Cotopaxi had declined, characterized by a decrease in tremor and less intense gas-and-ash emissions. On 10 September, however, the number of volcano-tectonic events increased. They were mostly located 9-12 km below the summit, although some were as shallow as 4 km. During 19-22 September gas emissions with low ash content rose as high as 1.5 km above the crater and drifted W.
Source: Instituto Geofísico-Escuela Politécnica Nacional (IG-EPN)
During 1-8 September IG reported that a large number of seismic events were located between 2 and 11 km below Cotopaxi's summit; seismicity consisted of long-period events, very-long-period events, tremor, and volcano-tectonic events. During 5-10 September seismic energy decreased along with the size and ash content of emissions. Analysis of ash samples showed an increase in the proportion of juvenile fragments. During an overflight on 9 September, IG scientists observed an ash plume rising 200-300 m above the crater and drifting W. Infrared measurements revealed that temperatures were well below those measured on 3 September. Glacial melting on the upper flanks continued to produce streams of meltwater on the N flank. Several new cracks in the glaciers were noted. On 11 September tremor was low; gas-and-ash emissions rose 500 m and drifted W. On 12 September gas-and-ash plumes rose 1.5 km and drifted W to NW, causing ashfall in Machachi and El Chaupi. During 14-15 September ash emissions rose 1 km. A news article from 14 September noted that area flights had been re-routed around Cotopaxi to avoid ash plumes; the most affected route was between Quito and Guayaquil.
Sources: Instituto Geofísico-Escuela Politécnica Nacional (IG-EPN); El Comercio
IG reported that during the morning on 2 September gas-and-steam plumes from Cotopaxi contained minor amounts of ash, rose 100 m above the crater, and drifted W and NW. At about 1318, plumes with moderate amounts of ash rose 4 km and drifted W. Ashfall was reported in Machachi, Aloasí, and Chaupi. Analysis of ash collected on 2 September showed that the greatest contribution of material was pre-existing and altered rock. On 3 September ash-and-water-vapor plumes rose 2.2 km and drifted N and NW. During an overflight scientists observed ash emissions that rose 1 km and drifted W then N; the plume continued to rise to 8.5 km as it drifted N. Several new cracks in the glaciers were noted, especially on the E and NE flanks. Blocks had been deposited on the N and S parts of the crater. The circular glacier at the top of the inside part of the crater had significantly decreased in size and had large fractures. Glacial melting on the upper flanks had also accelerated. Streams of meltwater were present on the N flank. Thermal images revealed temperature increases in the S and E parts of the crater and a significant increase in temperatures of emissions (200 degrees Celsius). Seismic amplitudes did not increase but signals 3-11 km deep aligned with the conduit suggested rising magma. Bright areas at the summit were observed at night, possibly from hot block deposits. During 4-8 September gas-and-ash plumes rose 1 km at most and drifted N and NW.
Source: Instituto Geofísico-Escuela Politécnica Nacional (IG-EPN)
According to IG, fieldwork revealed that the volume of material ejected since the onset of the eruption at Cotopaxi was an estimated 56,000 cubic meters on 14 August and 19,500 cubic meters during 15-21 August. Thermal images obtained during overflights on 18 and 26 August revealed a significant increase in the temperatures of emissions (150 degrees Celsius on 26 August) and at different areas in the crater.
Since the onset of continuous tremor on the evening of 22 August there had been very few breaks in ash-and-gas emissions. During 25-31 August ash-and-steam emissions were observed rising at most 2 km above the crater and drifting NW, W, and SW. Based on Washington VAAC reports, IG noted on 26 August that the plume rose as high as 9 km (29,500 ft) a.s.l. Ashfall was reported in a wide area to the WSW, millimeters thick in some areas. During 25-26, 28, and 30-31 August areas reporting ashfall included Manabi (El Carmen, 165 km W), Santo Domingo de los Tsáchilas (95 km NW), Pastocalle, Santa Ana, Cerro Azul, Azachul, Leonidas Plaza (40 km N), Bahia de Caraquez (220 WNW), Charapotó (230 W), Pichincha, Rocafuerte (225 WSW), Machachi (25 km NW), Tambillo (33 km NNW), Aloag (28 km NNW), and Chaupi. The mayor of Sigchos, in the Province of Cotopaxi, noted impacts on livestock, crops, and greenhouses. A small lahar descended the W flank on 28 August. Emissions later in the day on 31 August were mostly water vapor and gas, with low amounts of ash.
Source: Instituto Geofísico-Escuela Politécnica Nacional (IG-EPN)
IG reported that during an overflight of Cotopaxi on 18 August scientists observed continuous but variable amounts of ash and steam rising more than 100 m above the crater before descending the W flank. Significant amounts of ash were deposited on the flanks in an area from the N to the SW flanks. Several new cracks on the top of some glaciers were noted, especially on the E and NE flanks, and possible new tephra deposits on the N flank were observed. Thermal images revealed no hot material on the flanks; emissions prevented measurements of the inside of the crater. During 18-19 August emissions of steam and gas from Cotopaxi were occasionally observed during periods of clear weather. During the morning of 20 August gas plumes rose just above the crater and drifted W. The next day gas-and-steam plumes rose less than 2 km above the crater and drifted NW; cloud cover continued to sometimes prevent visual observations. On 22 August at 0426 the network detected an increase in the seismic amplitude. Steam-and-ash plumes rising 2 km from the crater were more sustained and higher compared to previous days; plumes drifted NW and WSW. Tremor began at 2141, and was accompanied by the onset of continuous ash emissions. Rangers confirmed ashfall at the entrance of Cotopaxi National Park. Throughout 23 August continuous ash emissions occurred with few breaks, rising no more than 1 km above the crater, and drifting SW. IGEPN staff found 2-mm-thick ash deposits that had accumulated during an 18-hour period. On 24 August ash deposits were noted in most of the N parts of Latacunga valley and reached the S moors of Romerillos. On 25 August ash plumes drifted WNW, causing ashfall in Machachi, Chaupi, and Tambillo.
Source: Instituto Geofísico-Escuela Politécnica Nacional (IG-EPN)
On 14 August IG reported an earthquake swarm at Cotopaxi that began at 1721 and ended at 1806; the largest event, detected at 1723, was a M 2.7. A series of phreatic explosions on 15 August started with two small ones detected at 0402 and 0407. According to the Washington VAAC, ash plumes rose to altitudes of 12.2-13.7 km (40,000-45,000 ft) a.s.l.; lower parts of the plume drifted E and higher parts drifted SE. Ashfall occurred in areas to the N. IG noted that an explosion at 1027 generated an ash plumes that rose to an altitude of 17.9 km (58,700 ft) a.s.l. and drifted NW and E. A pyroclastic flow descended the W flank. The VAAC initially reported that ash from that event drifted 17 km W, 20 km NNW, and 8 km SE, and that plumes may have risen as high as 15.2 km (50,000 ft) a.s.l. and possibly higher. According to news articles, ashfall was reported in El Chasqui (48 km N), Machachi (22 km NW), Tambillo (32 km NNW), and in areas in S Quito (~45 km N) including Cutuglagua, Guamaní, Chillogallo, Santa Barbara, and Solanda. Parts of the Cotopaxi National Park was closed to visitors.
During 15-16 August sulfur dioxide emissions were high, and remobilized ash from the W flank rose up to 3.3 km; no ashfall was reported and only minor amounts of a sulfur odor were noted by residents. Ash plumes rose 300 m on 17 August and drifted W; at 1824 an ash emission rose 700 m and drifted W. During times of clear views observers noted that winds pushed ash plumes down the W flank.
Sources: Instituto Geofísico-Escuela Politécnica Nacional (IG-EPN); Washington Volcanic Ash Advisory Center (VAAC); El Comercio
On 11 June IG reported that seismicity at Cotopaxi continued to increase. Tremor began to be detected on 4 June, with periods ranging from 10 to 15 minutes. Amplitudes were highest during 5-6 June. Sulfur dioxide emissions continued to be elevated over baseline levels (which were less than 500 tons/day), detected at values greater than 2,500 tons/day. Low-energy, pulsating gas emissions began on 10 June, and Cotopaxi National Park staff reported an increase of water flow in some streams on the NE flank.
Source: Instituto Geofísico-Escuela Politécnica Nacional (IG-EPN)
IG reported that the seismic network at Cotopaxi had detected increases since mid-April; 628 local earthquakes were detected in April and 3,000 events were detected in May. Very-long-period earthquakes were recorded in May, especially during the last week, located in the N and NE parts of the cone at depths of 3 and 14 km. Sulfur dioxide emissions increased on 20 May, possibly from sporadic emissions becoming more continuous, and were 2,500-3,000 tons/day by the end of May. Baseline values were 500 tons/day. Slight inflation was detected by N and NE inclinometers. Crater fumarolic activity increased, with plumes sometimes visible from Quito (55 km N). Climbers indicated a very intense sulfur dioxide odor on the N part of the cone during 22-23 May.
Source: Instituto Geofísico-Escuela Politécnica Nacional (IG-EPN)
During 29 August to 4 September, the number of long-period and hybrid earthquakes at Cotopaxi decreased slightly, and the number of volcano-tectonic earthquakes increased, in comparison to the previous week. No changes in deformation were recorded, and no surficial changes were seen at the volcano.
Source: Instituto Geofísico-Escuela Politécnica Nacional (IG-EPN)
During 22-28 August, a large number of long-period (LP) and hybrid earthquakes continued to be recorded at Cotopaxi. Increased seismicity was first recorded in late July. Most of the events recorded during the report period were small, and were recorded mainly at stations nearest to the crater. Also, several LP earthquakes correlated with increased activity at fumaroles in the crater. No deformation or surficial changes were observed at the volcano.
Source: Instituto Geofísico-Escuela Politécnica Nacional (IG-EPN)
A seismic anomaly that began at Cotopaxi in late July continued through 14 August. During this period, there was an increase in the number of long-period earthquakes in comparison to previous months. The earthquakes were less than M 3 and occurred at depths between 1 and 2 km below the volcano. Several of the earthquakes correlated with increases in the volume of fumarole emissions in the crater. No carbon dioxide was detected when measurements were made during 8-14 August.
Source: Instituto Geofísico-Escuela Politécnica Nacional (IG-EPN)
During 29 December to 4 January, the number of earthquakes at Cotopaxi slightly increased in comparison to the previous week. On 2 January a strong smell of sulfur was reported in the Yanasacha area.
Source: Instituto Geofísico-Escuela Politécnica Nacional (IG-EPN)
During 15-21 December, there was a slight reduction in the level of seismicity at Cotopaxi in comparison to the previous week. The number of long-period earthquakes increased around 20 December. No volcano-tectonic earthquakes were recorded. Only fumarolic activity was observed at the volcano.
Source: Instituto Geofísico-Escuela Politécnica Nacional (IG-EPN)
Seismicity at Cotopaxi during 8-14 December was above background levels, much like the previous week. During the report period, there was an increase in high-frequency tremor, but it remained within "normal" limits. A weak scent of sulfur was reported and steam columns rose to low levels.
Source: Instituto Geofísico-Escuela Politécnica Nacional (IG-EPN)
During 10-16 November, seismicity at Cotopaxi was at moderate levels, although it had increased in comparison to previous weeks. During the report period, seismicity was dominated by long-period earthquakes. Since late October volcano-tectonic earthquakes occurred beneath the zone of Pita and beneath the volcano's edifice. These events were less than M 3 and were not felt by the local population.
Source: Instituto Geofísico-Escuela Politécnica Nacional (IG-EPN)
Reports are organized chronologically and indexed below by Month/Year (Publication Volume:Number), and include a one-line summary. Click on the index link or scroll down to read the reports.
Vapor plumes rising above the crater in September and October
On 23 July 1975 small grayish puffs of smoke were observed emanating from the crater. In mid-September a 300-m vapor plume rose above the crater, and a small earthquake shook the volcano on 24 September. In mid-October vapor plumes were reported to be increasing in volume and frequency. Cotopaxi last erupted in 1944.
Information Contacts: M. Hall, Escuela Politécnica, Quito.
Continued vapor emanations in November
The activity continued during November. The amount of vapor was about the same as in October, but daily cloud activity was observed. There was increased fumarolic activity on the W side, just below the crater. Earthquakes were felt in the town of Mulaló around 0000, 11 November, and at 0431, 12 November, and again on 14 November. Three portable seismographs were placed around the volcano, and were gathering valuable seismic data by the end of the month.
Information Contacts: M. Hall, Escuela Politécnica, Quito.
Activity declines
Activity declined during December. The crater steam clouds of previous months were observed only once, on 12 December, since 28 November. Seismic activity was not strong and focal depths were at least 20 km below the volcano. Relevelling of dry tilt stations installed 7 November showed no inflation of the volcano. However, a USGS team including Donal Mullineaux and C. Dan Miller reached Ecuador in late December to assess volcanic hazards and assist the local authorities in contingency planning.
Information Contacts: M. Hall, Escuela Politécnica, Quito.
First anomalous seismicity since 1975 begins in October 2001
The last Cotopaxi report (SEAN 01:03) described a decline in activity during December 1975. Beginning in October 2001, anomalous seismic activity was registered. Seismicity increased further during November 2001-January 2002, and at times was up to seven times the normal level (tables 1 and 2). During this period, other seismic signals were registered that were distinct from those during the 13 previous years of monitoring, including: tornillos, explosion events, bands of harmonic tremor sometimes lasting a few minutes, and deep, high-energy long-period (LP) events registered away from the volcano (at the Antisana and Guagua Pichincha stations). Seismic observations and statistics were compiled using station "VCl," located ~4 km NE of the volcano. Earthquake locations were determined using records from the seven seismic stations on different flanks of Cotopaxi, and for higher-energy events with stations of the National network.
Table 1. Monthly seismicity at Cotopaxi during 2001-2002. Data includes Total and Daily averages for long-period (LP) events, hybrid events, volcano-tectonic (VT) events, tornillo events, and all earthquakes. Courtesy IG.
| Date | LP Total | LP Daily Avg | Hybrid Total | Hybrid Daily Avg | VT Total | VT Daily Avg | Tornillo Total | Tornillo Daily Avg | All Earthquakes Total | All Earthquakes Daily Avg |
| Jan 2001 | 336 | 10.8 | 0 | 0.0 | 18 | 0.6 | 0 | 0.0 | 354 | 11.4 |
| Feb 2001 | 185 | 6.6 | 0 | 0.0 | 4 | 0.1 | 0 | 0.0 | 189 | 6.8 |
| Mar 2001 | 319 | 10.3 | 1 | 0.0 | 10 | 0.3 | 0 | 0.0 | 320 | 10.3 |
| Apr 2001 | 280 | 9.3 | 0 | 0.0 | 26 | 0.9 | 0 | 0.0 | 306 | 10.2 |
| May 2001 | 241 | 7.8 | 7 | 0.2 | 10 | 0.3 | 0 | 0.0 | 248 | 8.0 |
| Jun 2001 | 243 | 8.1 | 11 | 0.4 | 53 | 1.8 | 0 | 0.0 | 307 | 10.2 |
| Jul 2001 | 262 | 8.5 | 2 | 0.1 | 9 | 0.3 | 0 | 0.0 | 273 | 8.8 |
| Aug 2001 | 241 | 7.8 | 0 | 0.0 | 9 | 0.3 | 0 | 0.0 | 250 | 8.1 |
| Sep 2001 | 394 | 13.1 | 9 | 0.3 | 9 | 0.3 | 0 | 0.0 | 412 | 13.7 |
| Oct 2001 | 555 | 17.9 | 0 | 0.0 | 7 | 0.2 | 0 | 0.0 | 562 | 18.1 |
| Nov 2001 | 432 | 14.4 | 57 | 1.9 | 400 | 13.3 | 4 | 0.1 | 893 | 29.8 |
| Dec 2001 | 516 | 16.6 | 169 | 5.5 | 729 | 23.5 | 0 | 0.0 | 1423 | 45.9 |
| Jan 2002 | 595 | 19.2 | 5 | 0.2 | 363 | 11.7 | 3 | 0.1 | 966 | 31.2 |
| Feb 2002 | 532 | 19.0 | 4 | 0.1 | 157 | 5.6 | 0 | 0.0 | 693 | 24.8 |
| Mar 2002 | 504 | 16.3 | 1 | 0.0 | 191 | 6.2 | 0 | 0.0 | 696 | 22.5 |
| Apr 2002 | 310 | 10.3 | 7 | 0.2 | 63 | 2.1 | 0 | 0.0 | 380 | 12.7 |
| May 2002 | 431 | 13.9 | 8 | 0.3 | 53 | 1.7 | 0 | 0.0 | 453 | 14.6 |
| Jun 2002 | 429 | 14.3 | 41 | 1.4 | 45 | 1.5 | 3 | 0.1 | 474 | 15.8 |
| Jul 2002 | 445 | 14.4 | 181 | 5.8 | 92 | 3.0 | 2 | 0.1 | 720 | 23.2 |
| Aug 2002 | 455 | 14.7 | 91 | 2.9 | 32 | 1.0 | 12 | 0.4 | 590 | 19.0 |
| Sep 2002 | 509 | 17.0 | 184 | 6.1 | 140 | 4.7 | 19 | 0.6 | 852 | 28.4 |
| Oct 2002 | 322 | 10.4 | 219 | 7.1 | 62 | 2.0 | 13 | 0.4 | 616 | 19.9 |
| Nov 2002 | 295 | 9.8 | 142 | 4.7 | 64 | 2.1 | 2 | 0.1 | 503 | 16.8 |
| Dec 2002 | 233 | 9.0 | 120 | 4.6 | 48 | 1.5 | 1 | 0.0 | 402 | 16.1 |
Table 2. Comparison of average seismicity at Cotopaxi during 2001 and 2002. Courtesy IG.
| Year | Daily average | Monthly average | Total |
| 2001 | 15.4 | 461.4 | 5537 |
| 2002 | 20.4 | 612.1 | 7345 |
On 5 and 29 January 2002, two seismic clusters lasted an average of 2 hours and were composed mainly of LP and VT earthquakes. Most of the earthquakes were located at depths of 1-10 km beneath the summit. On 5 and 13 January small fumaroles were reported in the crater, and visible defrosting occurred on the upper E flank. A visit to the summit on 13 January revealed increased fumarolic activity compared to previous months. On 19 and 20 January observers reported gray plumes rising as high as 1,000 m.
During February and March activity diminished, and no seismic clusters were registered. Most of the earthquakes were located 1-10 km beneath the volcano. On 5 February roaring noises were heard from Mulaló and the refuges located on the flanks of the volcano. Strong fumarolic activity was also reported. On 6 February steam plumes rose ~300 m above the summit. On 27 February a small steam plume was reported exiting from the NW side of the crater. On 7 and 10 March small steam plumes originated from the W side of the crater. On 28 March harmonic tremor lasted for ~10 minutes.
Activity remained low during April-June. On 17 April a band of harmonic tremor lasted ~6 minutes with a maximum frequency of 4.3 Hz. During the first days of April small steam plumes were reported. During May LP earthquakes lasted up to a minute and saturated the seismometer for several seconds. On 20 May a seismic cluster of LP earthquakes lasted ~2 hours. On 8 and 14 May a white steam plume from the NE side of the volcano reached up to 200 m high. During June VT events mostly occurred ~10 km N of the crater. On 30 June a band of harmonic tremor lasted ~7 minutes with a maximum frequency of 1.7-5.2 Hz. Visits to the summit on 1 and 2 June revealed that fumarolic activity had diminished ~40% since January.
During July seismicity was at a moderate level with respect to the rest of 2002. During the first days of the month a series of LP events were registered that were large enough to be detected at distant stations, such as Antisana and Guagua Pichincha. The earthquakes had maximum frequencies of ~2.1 Hz and were generally 1-2 km beneath the summit. However, some events were located at depths of ~10 km. On 18 July at 2000 a band of low-frequency tremor lasted ~4 minutes. About 5 hours later a seismic cluster began that lasted for ~8 hours. The cluster consisted of ~110 total events, mostly hybrid (HB) and volcano-tectonic (VT). The earthquakes were located 1-4 km beneath the summit, and 2 LP events were located ~10 km deep.
Visitors to the summit on 6 July reported fumarolic activity in the zone of Yanasacha, a slight sulfur smell on the NE side, and noise generated by an avalanche on the E side. At the end of July reports indicated defrosting in the W zone. During August moderate seismicity was dominated by LP events at a depth of ~10 km.
Seismicity was again high in September 2002. A small cluster of VT earthquakes on 15 September lasted ~7 hours. During the first days of the month a visit to the crater revealed new fumaroles in the E and S zones. Defrosting continued in the W zone and left 40% of the W wall open.
During October seismic activity was low but the number of hybrid events increased compared to the previous months. Tectonic events were registered in the S and N zones up to ~7 km from the summit. Deep LP events decreased by ~50% compared to previous months.
Seismicity remained low during November and December. Less than 10% of VT events were registered in the N sector. No fumarolic or other surface activity was observed. During December seismic events were located 1-7 km beneath the summit. On 7 December people in Yanahurco reported dark brown plumes rising from the crater.
Seismicity since 1989 clearly shows an increase in recent months (figure 1). The 2001 seismic events were registered at 1-10 km beneath the volcano, but ~90% occurred at 2-4 km and showed little migration. The 2002 activity was variable, from a high of 966 events in January to a low of 420 events in April. Mostly LP events occurred with some VT events during the first half of the year, and later mostly LP events with hybrids during the second half of the year. On the basis of 2002 seismic activity, a new injection of magma did not occur, and the anomalies in July and September were the result of the movement of gas from magma intrusion that occurred during the last months of 2001.
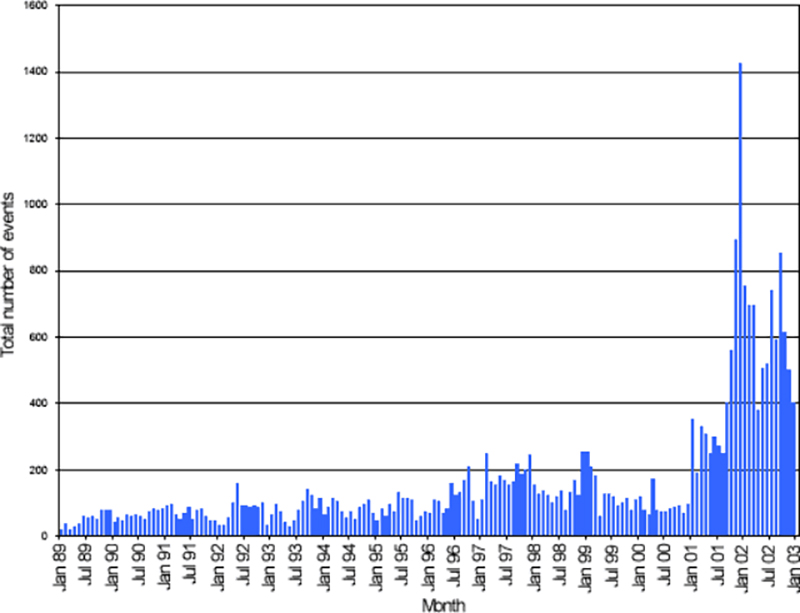 |
Figure 1. Graph of the total registered monthly events at Cotopaxi during 1989-2002. The activity increased beginning in November 2001 and has since remained above background levels. Courtesy of IG. |
Information Contacts: Geophysical Institute (IG), Escuela Politécnica Nacional, Apartado 17-01-2759, Quito, Ecuador.
Low seismicity and emission signals January-May 2003; March earthquake clusters
This report contains details of seismicity at Cotopaxi during January through 2 May 2003. The seismicity was generally low (averaging ~20 earthquakes per day), as it has been since 24 November 2001. Despite the low seismicity, during January seismic signals suggestive of emissions registered, although these lacked visual confirmations at the volcano. Moreover, a cluster composed of a variety of kinds of shallow earthquakes took place in mid-March. This was the first such cluster since 19 July 2002.
Activity during January-February 2003. Seismicity was generally low in January 2003 and located earthquakes commonly had focal depths down to 5 km below the summit. During the first week of January one volcano-tectonic (VT) event occurred N of the volcano. Around this time the rate of energy release was very low and no unusual observations were reported. Seismicity decreased after the first week of January, although some long-period (LP) events occurred, including one of high frequency (10 Hz) on 9 January that was followed immediately by another with a slowly decaying coda or tail (a so-called "tornillo" event, with a dominant frequency of 2.7 Hz). Two LP events were located at depths of 1 km. The rate of energy release remained very low, with some peaks on 8 January. Seismicity stayed low through the next week; some hybrid and LP events did occur. Some signals characteristic of emissions were received, although these were not visually confirmed.
During 20-26 January the number of hybrid events increased slightly, to above average. Emission signals were again received, similar to the previous week. No LP earthquakes were recorded this week, but a small group of earthquakes were located at the headwaters of the Pita river. Events such as these were also noted in November 2001. During the last week of January, seismicity remained low, on a par with activity seen since 24 November 2001. However, the low number of events registered or located was partly because arrivals were not clear at many stations.
Seismicity remained low in February, particularly for the first week. During 10-16 February it rose slightly due to larger numbers of hybrid events. No other changes in the volcano were noted. Although the third week of February brought no important variations in seismicity, beginning in late February LP events dominated the record. Still, the number of LP event stayed below the 2002 average.
Activity during March-April 2003. Although low seismicity generally prevailed throughout this interval, there was some variations in the abundance of earthquake types and a mid-March cluster of earthquakes occurred. During early March hybrid earthquakes increased to slightly higher than the 2002 average; in addition another LP-type tornillo was recorded on 6 March. On 7 March LP earthquakes were common.
On 16 March a cluster of hybrid, VT, and LP earthquakes was located 1-3 km below the volcano. Following eight months of low seismicity (averaging ~20 events per day), this was the first seismic swarm registered at Cotopaxi since 19 July 2002. However, the energy released per number of events was similar to earlier activity.
Seismicity increased after 16 March. Clusters similar to that of the 16th continued, but with lower magnitudes. By the beginning of April seismicity decreased to within the base level, although on 4, 7, and 8 April VT events were recorded to the S and SE, approximately 3 km below the summit. No significant changes were noted at the volcano, although the usual smell of sulfur was noted on a visit to the summit. During 14-20 April, the number of LP events decreased from the previous week, but VT events of M 2.5-M 3.4 continued to the N. VT events persisted through the rest of April, particularly in late April, which on 23 April included an M 3.6 event. VT events occurred on the N, NE, and S sides of the volcano up to 15 km from the summit at depths between 3 and 15 km. The VT events were interpreted as related to rock fracturing.
On the morning of 2 May a VT event registered on the S flank, located ~3 km deep. It was M 3.2, moderate for Cotopaxi. Later that day an event registered at the seismic stations at Cotopaxi, Antisana, and Guagua Pichincha. This event had a duration of 180 seconds and was made up of an LP earthquake followed by a tremor-like signal with a duration of 150 seconds that was of low frequency (1.6 Hz).
Information Contacts: Geophysical Institute (IG), Escuela Politécnica Nacional, Apartado 17-01-2759, Quito, Ecuador (URL: http://www.igepn.edu.ec/).
During May-December 2003 seismicity moderate, degassing and inflation variable
This report contains details of seismicity at Cotopaxi during May through December 2003. In general, seismicity was low and within normal levels, occasionally punctuated by increased activity. Fumarolic and inflationary activity varied throughout the period.
Seismicity during the first week of May was characterized by a high number of fracture-related volcano-tectonic events in the N, NE, and S zones, up to 15 km from the summit. These events were located at depths between 3 and 15 km below the summit. On 2 May at 0949 a volcano-tectonic event on the S flank occurred at ~ 3 km depth. Based on the coda, the event was calculated as M 3.2, a value considered moderate at this volcano. At 1918 on 2 May a long-period event was recorded at the Cotopaxi, Antisana, and Guagua Pichincha seismic stations. It lasted about 180 seconds. The earthquake was followed by a low-frequency (1.6 Hz) tremor signal lasting about 150 seconds.
Between 2 and 4 May deflation was recorded, with slight variations. On 2 May staff at the Refuge felt earthquakes. On 3 May the staff saw steam plumes at heights of 400-800 m above the crater, which blew W. On 3 and 4 May observations were made at the Refuge and the summit. Staff smelled sulfur halfway to the summit; and found new fumaroles in the Yanasacha area. On 4 May these fumaroles generated white steam plumes up to 50 m above the summit. Fumarole temperatures were 29-31°C.
A tectonic earthquake was recorded on 8 May, but although tremor episodes increased, volcano-tectonic earthquakes were fewer during 5-11 May than the previous week. Seismicity continued to drop during the week of 12-18 May. Although some low-amplitude tremor occurred during that interval, activity was dominated by long-period earthquakes. Earthquakes increased slightly the following week, but seismicity remained lower than average for the year. Low-frequency tremor lasting under 10 minutes was recorded on 23 May; tectonic activity on 24 May occurred in the zone of Saquisili and was determined to be unrelated to Cotopaxi. During the final week of May, long-period events and tremor signals increased slightly but seismicity continued to remain within the normal parameters established as of November 2001, when Cotopaxi entered a period of unusual seismic and fumarolic activity.
Activity remained generally constant through June, with episodes of harmonic tremor increasing slightly between 9 and 15 June and again on 23 June. White steam plumes reached 300 m high on 4 June, but later they were under 100 m high. At the end of June there was a slight tendency toward deflation; tremor events increased slightly and usually had fundamental frequencies of ~ 1.7 Hz.
Between 7 and 13 July the number of long-period events increased, as did the number of hybrid events. However, tremor decreased, and the average number of earthquakes per day (8) was lower than in recent periods of increased activity. The average number of earthquakes per day decreased again the following week. Notable tremor occurred on 20 July, with episodes lasting between 80 and 125 seconds and reduced displacement varying from 0.5 to 11 cm2. During the week of 21-27 July activity increased slightly, from 6.6 to 8.3 events per day, but in general seismic data indicated a state of low activity during July.
In early August seismicity rose to an average of 20 events per day, and tremor signals increased, especially on 8-10 August. However, the released energy remained low throughout August. Earthquakes registered that month were generally small, and tremor signals were constant except for two periods of harmonic tremor on 28 August.
Although seismicity remained low in early September, on 6 September instruments registered a low-frequency (0.9 Hz), low-amplitude tremor lasting more than 3 hours. On 18 September a cluster of earthquakes (characterized by long-period events and hybrid events) began around 1300 and lasted ~ 4 hours. A second cluster occurred the next day, lasting ~ 6 hours. The earthquakes associated with these clusters were located between 1 and 4 km below the summit. Fumarolic activity was normal for most of September, although a gas discharge was reported on 21 September. After 21 September seismicity returned to normal levels, and continued to decrease through the following week.
Seismicity generally remained low for the next few months. Volcano-tectonic earthquakes and tremor increased slightly during 13-19 October. Three distinct episodes of tremor on 15, 17, and 18 October consisted of similar events with dominant frequencies of 0.8-0.9 Hz. Seismicity into November remained low, with no significant episodes of tremor and only small events.
By mid-December seismicity increased and although activity remained within normal levels, the occurrence of high-frequency tremor was noteworthy. Also through mid-December, a slight odor of sulfur was reported, as well as occasional columns of steam no higher than 300 m.
Correction: A brown plume mentioned on 7 December 2002 (BGVN 27:12) might be misinterpreted as evidence of an ash-bearing emission. Gorki Ruiz, a colleague of Pete and Patty Hall, clarified events and interpretations from that date. He interviewed guards at the Cotopaxi refugio, who stated that neither they nor others at the refugio that day had observed emissions. They discounted observations of ash emissions and noted that although fumarolic plumes frequently reach 300 m above the summit, no phreatic explosions had occurred. That time interval was also one of low seismicity.
Information Contacts: Geophysical Institute (IG), Escuela Politécnica Nacional, Apartado 17-01-2759, Quito, Ecuador (URL: http://www.igepn.edu.ec/).
Seismically quiet in January-April 2004; planning for emergency water supplies
Seismicity at Cotopaxi during December 2003 through December 2004 yielded averages that generally remained within normal levels (table 3). Steam emissions continued, and sulfurous odors were occasionally reported. A plot of total seismicity each week during 2001-July 2004 portrayed numerous peaks and valleys in the range 50-200 events per week. Occasional excursions took the weekly totals to several hundred events in late 2001 and early 2002 (peaking at over 700 events per week during mid-October 2001). The 2004 data lacked such dramatic excursions.
Table 3. Annual summaries showing typical daily averages of various kinds of seismicity at Cotopaxi during 2001-2004. Courtesy of IG (shown on their website in the January 2005 report).
| Year | Volcano-tectonic | Hybrid | Long-period | Tornillo | Tremor | Total |
| 2001 | 3.1 | 1.0 | 10.2 | 0.1 | 0.2 | 11.3 |
| 2002 | 2.9 | 3.0 | 14.6 | 0.1 | 0.4 | 18.2 |
| 2003 | 1.2 | 3.7 | 9.3 | 0.0 | 1.4 | 14.2 |
| 2004 | 0.41 | 3.59 | 11.10 | 0.0 | 1.56 | 15.11 |
Planning for emergency water supplies. Although seismicity and other monitored parameters were moderate to low during most of 2003 (BGVN28:11 and 28:12), local authorities worked on a contingency plan for emergency drinking water in the event of a crisis at Cotopaxi.
The Quito metropolitan sanitation and drinking water company (EMAAP-Q) prepared a contingency plan for residents around Cotopaxi. The challenge was to provide for sufficient amounts of potable and sanitation water for some half a million people in the event of an eruption that contaminates their normal water supplies. This contingency plan was drawn up using experience gained from the operational emergency plan used to recover from the eruption in 1998-99 and the Reventador eruption in 2002.
During the Guagua Pichincha eruption, pyroclastic material impacted Quito, and ash fell into the water treatment plants and threatened the water supply systems. EMAAP-Q developed an operational and emergency plan. The plan was tested in 1999 when the volcano had two major eruptions that heat dropped ash on Quito and its infrastructure.
Information Contacts: Geophysical Institute (IG), Escuela Politécnica Nacional, Apartado 17-01-2759, Quito, Ecuador (URL: http://www.igepn.edu.ec/).
First eruption since the 1940's begins 14 August 2015
Historically, Cotopaxi has been an active, dangerous volcano, although it had been mostly quiet for the previous 70 years before beginning a new eruptive period during August-November 2015 (figure 2). Increased seismic activity, deformation, ash plumes and ashfall, SO2 emissions, fumarolic activity, and lahars were all observed by geoscientists from the Geophysical Institute of Ecuador (IG) during the 2015 eruptive phase; information in this report comes from IG unless otherwise noted.
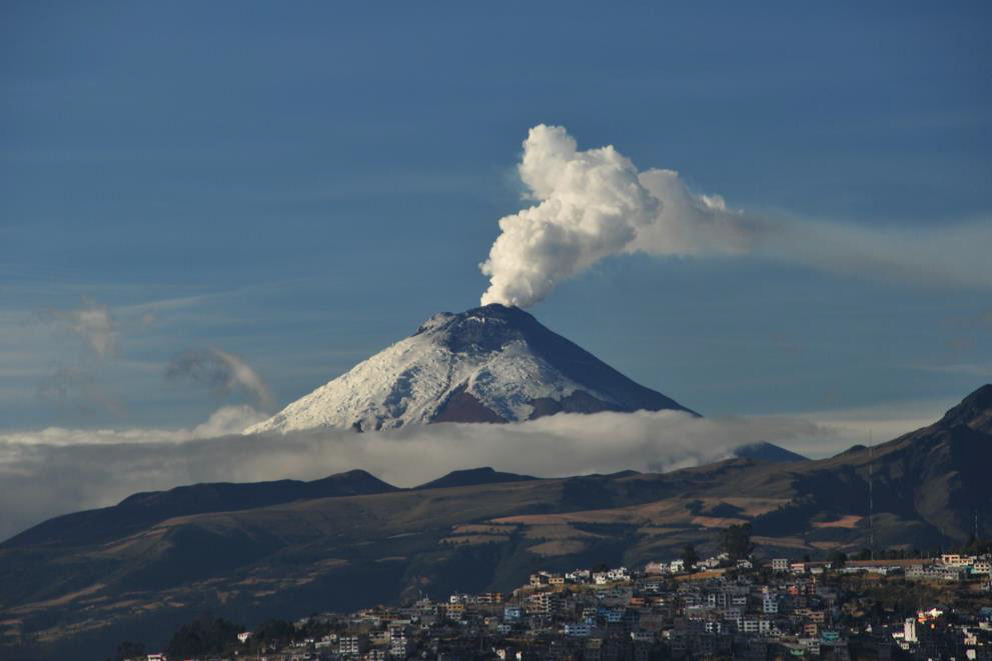 |
Figure 2. Cotopaxi volcano, 21 September 2015. View is towards the south; the plume is rising 1.5 km above the summit and drifting WSW. Photo by B. Bernard, courtesy of IG. |
The first phreatic explosions took place on 14 August 2015 and spread ash across the region up to 48 km NW, followed by a pyroclastic flow on the W flank the next morning. The first eruptive phase with numerous explosions and high seismicity continued through mid-September. A shorter explosive episode occurred in October, and the last significant ashfall was in late November. The Cotopaxi National Park was reopened to visitors in late December, as both seismic and surficial activity had declined significantly. The last ash emission was reported on 24 January 2016. The first rain-induced lahar occurred in late August, and numerous others were recorded in November 2015 and February 2016.
Pre-eruption activity. During 2002 and 2003, observations of increased seismicity included a large number of fracture-related volcano-tectonic (VT) events located between 1 and 15 km below the summit accompanied by fumarolic activity and occasional steam plumes (BGVN 28:12). In spite of this heightened activity, no ash-bearing emissions were detected. From July through early September 2005, the number of VT earthquakes within a 15-km radius of the summit again increased from background levels, but none were large enough to be felt nearby. These earthquakes had a maximum magnitude of M 4.4, and ranged from 3 to 10 km below the summit. IG scientists interpreted this increased seismic activity, characterized by long-period (LP) and hybrid (HB) earthquakes, to be related to fluid mobilization. The level and magnitude of activity was similar to that which occurred during the November 2001-January 2002 period. This increase in seismicity was also shown to correlate with elevated fumarolic activity as witnessed from a video camera installed on the NW edge of the crater. Again, no ash-bearing emissions were detected.
From late 2005 through early 2015 Cotopaxi was closely monitored for seismic, thermal, fumarolic, and lahar activities. These activities remained within normal background levels until April 2015 (figure 3). Background levels of total seismic events had been in the range of 10-25 per day since 1996. They began to increase noticeably at the end of April, and reached a monthly total of 3,000 in May. The activity was located in the N and NE parts of the cone, at two different depths, 3 and 14 km below the summit.
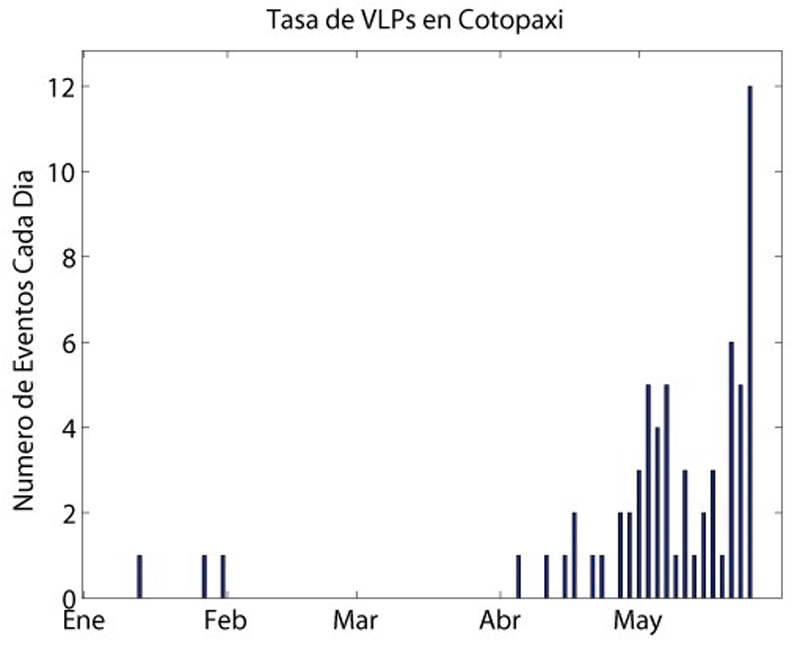 |
Figure 3. Rate of very long period (VLP) seismic events, associated with the movement of magma inside Cotopaxi, between January and the end of May 2015, showing an increase in the daily number of events beginning in late April. Courtesy of IG. |
Sulfur dioxide (SO2) emissions also increased from background levels of ~ 500 tons/day to 2,500-3,000 tons/day in late May and early June; climbers indicated intense sulfur dioxide odor on the N part of the cone during 22-23 May. Crater fumarolic activity also increased, with plumes sometimes visible from Quito (55 km N). Low-energy, pulsating gas emissions began on 10 June, and Cotopaxi National Park staff reported an increase of water flow in streams on the NE flank, suggesting increased heat flow around the volcano.
New eruption begins on 14 August 2015. An earthquake swarm beginning in the late afternoon of 13 August 2015 was followed in the early morning of 14 August by two phreatic explosions (at 0402 and 0407). A third explosion occurred at 1027, and two additional smaller explosions were recorded later in the day at 1345 and 1429 (figure 4).
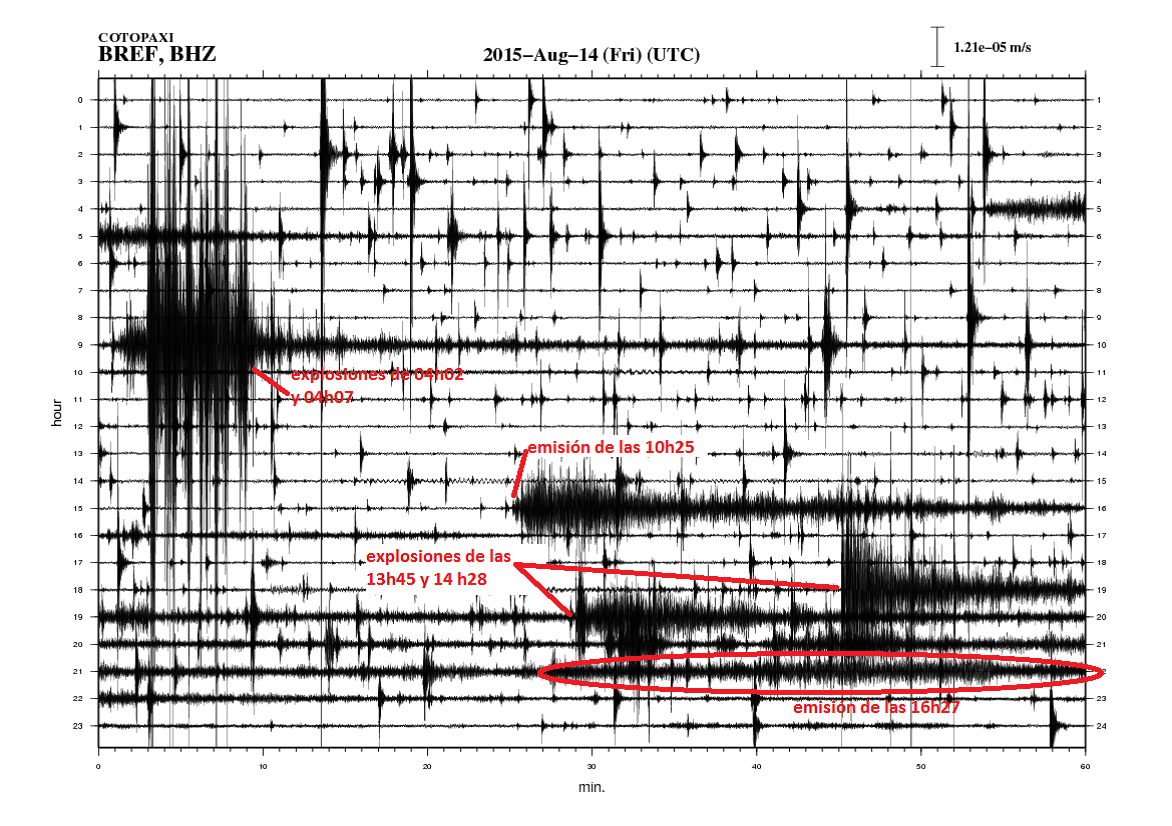 |
Figure 4. Seismograph from 14 August 2015, station BREF Courtesy of IG (Cotopaxi 2015 Special Report No. 7). |
These eruptions were witnessed by many residents in the surrounding towns and from the Metropolitan District of Quito. The Washington Volcanic Ash Advisory Center (VAAC) reported plumes from the first two explosions rising to altitudes of 12.2-13.7 km, and IG reported that the plume from the 1027 eruption rose to an altitude of 17.9 km (58,700 ft). At 0715 on 15 August a pyroclastic flow descended the W flank, sending another ash plume to at least 15.2 km, according to Washington VAAC. The lower portions of the first two plumes drifted E and the higher parts drifted SE. The plume from the third explosion drifted NW and E. Ash from the pyroclastic event drifted 17 km W, 20 km NNW, and 8 km SE as reported by Washington VAAC. According to IG special reports, ashfall was reported in areas N and NW of the volcano (figure 5) as far as 48 km away in the Machachi region, Amaguaña, Bowling, Tambillo, and S of Quito. Parts of the Cotopaxi National Park were closed to visitors. During 16-18 August, ash emissions of variable height up to 1 km continued, drifting W.
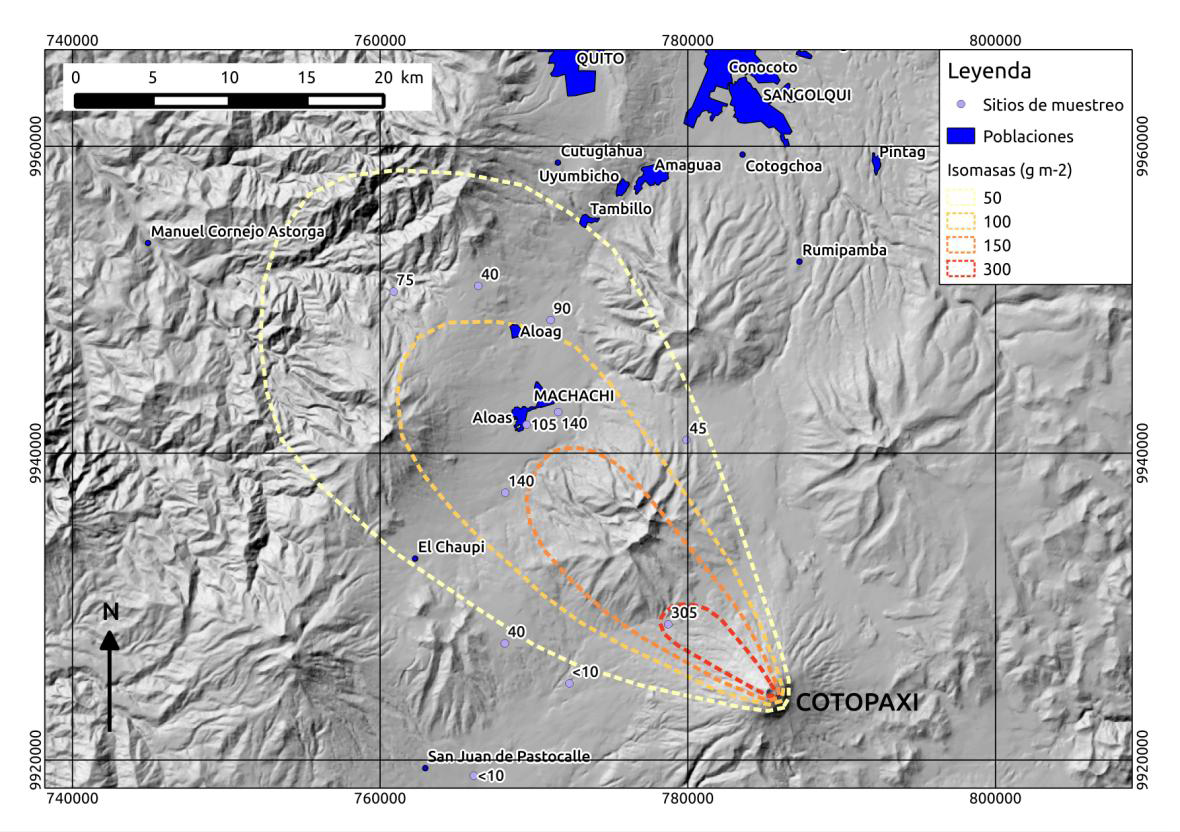 |
Figure 5. Preliminary map of the ashfall deposits associated with the eruption of Cotopaxi on 14 August 2015. Courtesy of IG (Cotopaxi 2015 Special Report No. 9). |
The ashfall grainsize was sub-millimeter, consisting of granules, rock fragments, and mineral crystals typical of the andesitic rock of Cotopaxi. All fragments from the first eruptions appeared to be pre-existing rock, some altered, with no juvenile particles from new magma observed.
During the post-eruption overflight on 18 August, IG scientists observed variable amounts of ash and steam rising more than 100 m above the crater before descending the W flank. Significant amounts of ash were deposited on the flanks in an area from the N to the SW. New cracks on the top of some glaciers were noted, especially on the E and NE flanks, and possible new tephra deposits on the N flank were observed. Thermal images did not reveal hot material on the flank and emissions prevented measurements inside the crater. For the next week after the initial explosions, steam-and-gas emissions were occasionally observed (figure 6), with plumes rising less than 2 km above the crater.
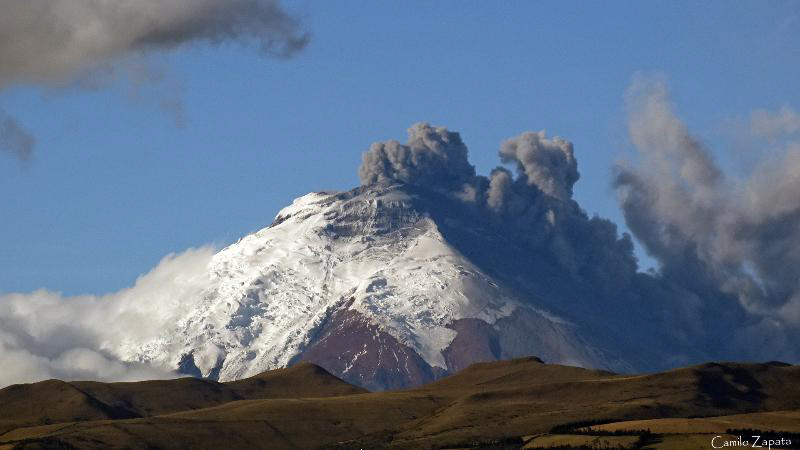 |
Figure 6. Photo of Cotopaxi taken on 20 August 2015 showing a small explosion at 0740 as viewed from the Sector 2 Bridge along the General Rumiñahui Highway, 47 km N. Note the recent ash deposits covering the glacier near the top of the mountain. Photo by Camilo Zapata , courtesy of IG (Cotopaxi 2015 Special Report No. 9). |
On 22 August at 0426 the network detected an increase in the seismic amplitude, and steam-and-ash plume emissions rose to more than 3 km above the summit. More tremors at 2141 were accompanied by the onset of continuous ash emissions which rose less than 1 km above the crater, drifting SW. Rangers confirmed ashfall at the entrance of Cotopaxi National Park. The following morning IG staff found 2-mm-thick ash deposits that had accumulated during an 18-hour period. Ash deposits were also noted on 24 and 25 August in most of the N parts of Latacunga valley located about 18 km WSW of the mountain, as well as the S hills of Romerillos 15 km NW, Machachi (24 km NW), El Chaupi (24 km WNW), and Tambillo (32 km NNW).
Regular overflights were conducted by IG after the initial eruption. In September 2015 several new cracks in the glaciers were noted, and volcanic blocks had been deposited on the N and S flanks of the crater. The circular glacier at the top of the crater had significantly decreased in size and developed large fractures. Glacial melting on the upper flanks had also accelerated; streams of meltwater were present on the N flank.
By late September, the glacier inside the crater had almost disappeared. Several areas of landslide deposits inside and outside the crater were also noted. Yellowish-green deposits from increased fumarolic activity were most apparent on the S, SE, and E flanks. Rapid melting from the glacier was evident on the upper E flank which resulted in material falling onto the lower part of the glacier. Seismicity, deformation, fumaroles, ash plumes and ash fall, SO2 emissions, and lahar activity all continued for several months as discussed below, gradually tapering off toward the end of 2015.
Seismic activity. Seismic data during the August through December 2015 period correlated closely with the rise and fall of eruptive activity. The measurements of the average seismic amplitudes (RSAM) for the volcano (figure 7) reveal the dramatic increase in total seismic energy during the main eruptive phase between mid-August and early September.
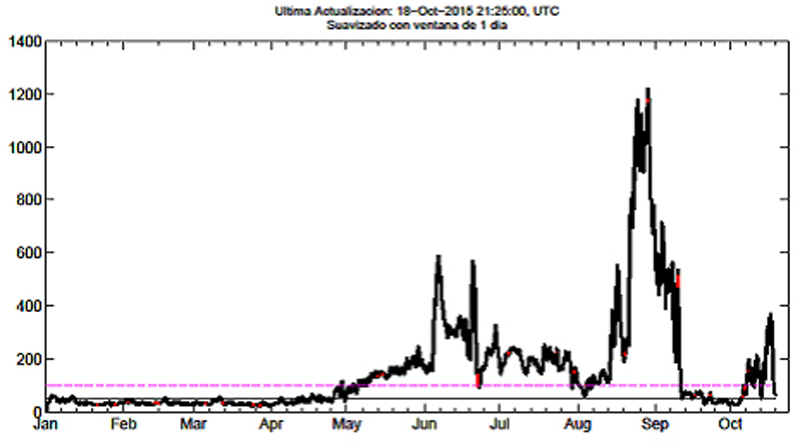 |
Figure 7. Measurement of daily average seismic amplitude (RSAM) for Cotopaxi from 1 January 2015 through 10 October 2015. The solid and pink-dashed lines represent previous background averages for RSAM. Courtesy of IG (Cotopaxi 2015 Special Report No. 20). |
Numbers of tremor signals indicating emissions (figure 8) showed a dramatic increase beginning on 14 August, and remained elevated through the initial eruptive cycle ending in early September. A second episode of emission activity in mid-October had fewer events, but the number was still higher than background levels. Seismic activity from emissions tapered off substantially after mid-October.
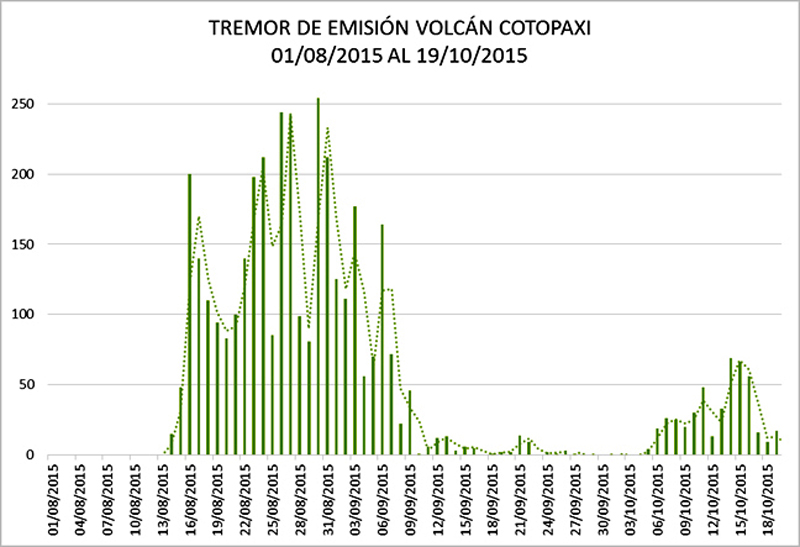 |
Figure 8. Plot of number of daily seismic tremor events indicating emissions at Cotopaxi, 1 August through 19 October 2015. Courtesy of IG (Cotopaxi 2015 Special Report No. 20). |
The number of daily volcano-tectonic (VT), or fracture-related earthquakes, located immediately beneath the crater to a depth of 12 km, increased starting in mid-August, to a maximum of over 200 events on 20 September before declining below 100 in early October. In September, the higher daily number of VT signals 3-12 km deep aligned with the conduit were interpreted by IG scientists as movement in a magma reservoir. Elevated numbers of VT events continued into February 2016, when they dropped back close to background levels (figure 9).
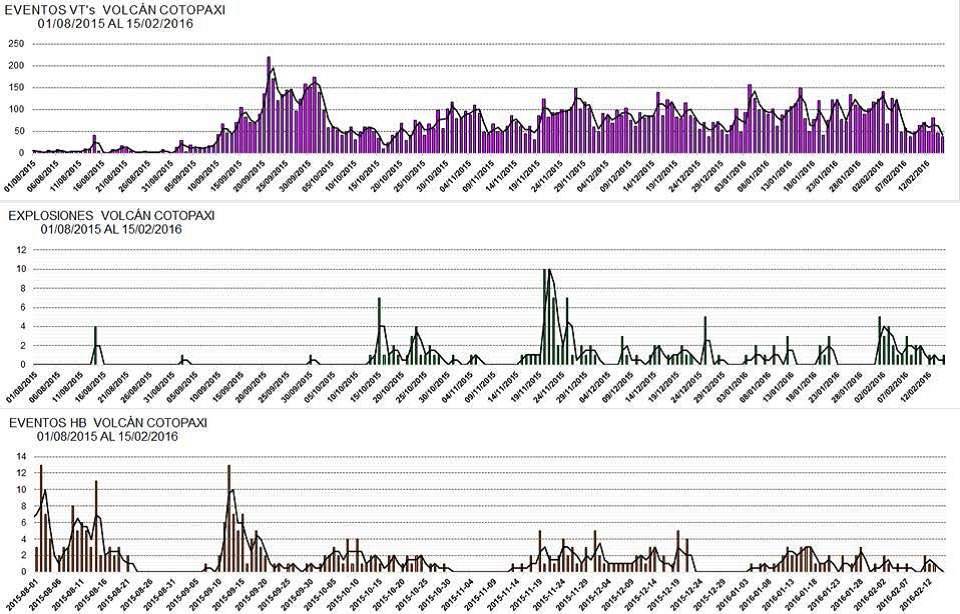 |
Figure 9. Plot showing number of daily volcano-tectonic (VT) (top), explosive (middle), and hybrid-type (HB) (bottom) seismic events at Cotopaxi between 1 January 2015 and 15 February 2016 (G. Viracucha). Courtesy of IG (Cotopaxi 2016 Special Report No. 4). |
Deformation. As part of the activities conducted jointly by the French IRD (Institut de Recherché pour le Developpement) and IG, Jean Mathieu Nocquet analyzed the deformation data from the volcano (figure 10). The accumulated movement of the GPS points between 1 January and 1 October 2015 is shown with values corrected for drift due to tectonic movement and seasonal effects based on data from 2010-2015. The strain level was low but significant compared to other deformation events prior to eruptions. The rate of deformation began accelerating in April 2015. The maximum total movement during this time was 1 cm at sites on the W flank. The average rate of deformation observed during this period was 3 mm per month.
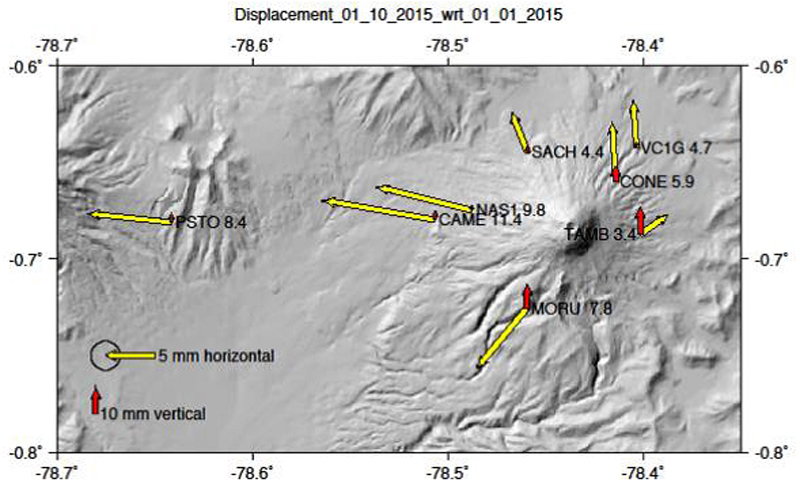 |
Figure 10. Deformation observed between 1 January and 1 October 2015 at GPS stations after correcting values for tectonic movement and seasonal changes. The yellow arrows show horizontal movement of the terrain and red show vertical changes. Scales are shown in the lower left corner. Produced by Dr. Jean Mathieu Nocquet. Courtesy of IG (Cotopaxi 2015 Special Report No. 20). |
Ash and steam emissions. Ashfall calculations reported by IG for 14 August through 25 September were 771,000 m3 and 9.46 × 10⁸ kg. IG scientists estimated that the volume of the initial plume material ejected on 14 August was 56,000 m3. The largest volume of tephra was erupted during 22-28 August. The area most affected that week was west of the volcano between San Juan de Pastocalle (20 km WSW) and El Chaupi (24 km WNW). Based on Washington VAAC reports, IG noted on 26 August that the plume rose as high as 9 km. As a result of this, during the last week in August, areas over 200 km to the W, WSW and SW, and up to 95 km NW reported ashfall, millimeters thick in some areas. The mayor of Sigchos, in the Province of Cotopaxi, noted impacts on livestock, crops, and greenhouses (figure 11).
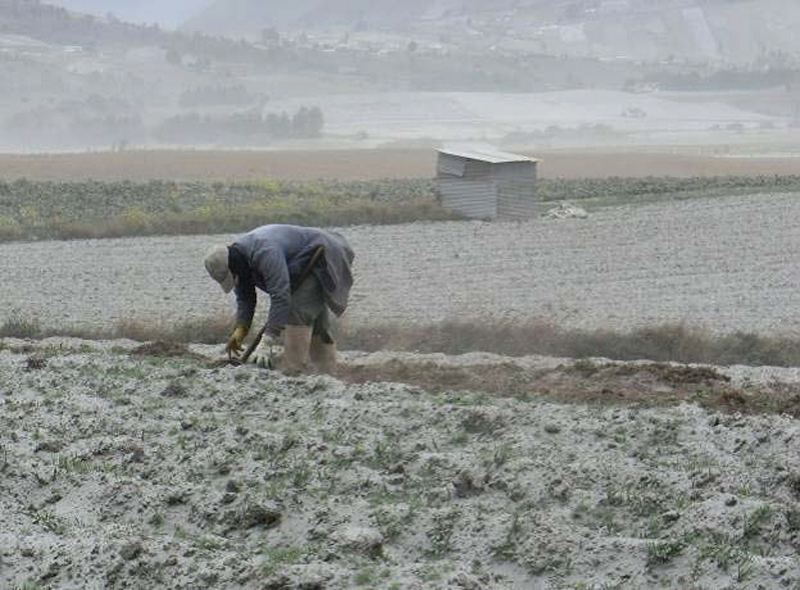 |
Figure 11. Farmland covered by a blanket of ash in Romerillos, 15 km NW of Cotopaxi, on 28 August 2015. Photo by P. Mothes. Courtesy of IG (Cotopaxi 2015 Special Report 13). |
A news article from 14 September noted that area flights had been re-routed around Cotopaxi to avoid ash plumes; the most affected route was between Quito and Guayaquil. Based on information from Washington VAAC, during 4-11 September the ash clouds associated with activity at Cotopaxi affected a large area of Ecuador (figure 12).
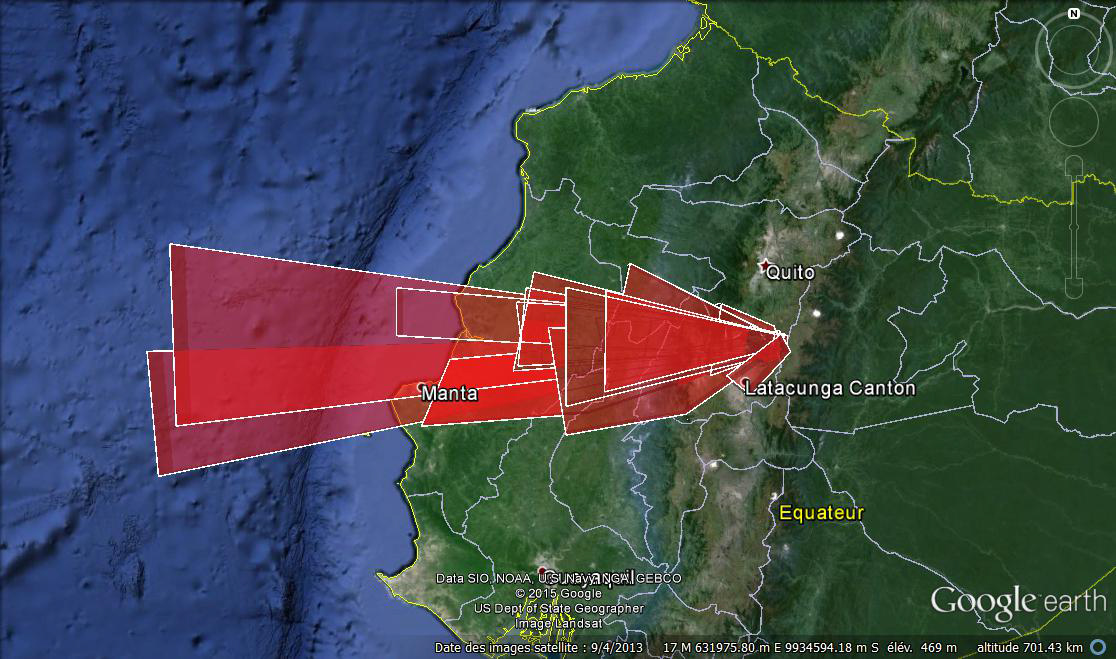 |
Figure 12. Zones with potential ash cloud hazards associated with the activity of Cotopaxi during 4-11 September 2015. Courtesy of IG (Cotopaxi 2015 Special Report 16, using data from the Washington VAAC on a Google Earth base map). |
The height of the ash clouds during 4-11 September decreased from over 6 km above the crater the previous week to less than 3 km, along with a decrease in the intensity of seismic activity. The speed of the ash clouds during this week varied between 3.9 and 14.1 meters per second (m/s) with the prevailing wind direction towards the west (between SW and W). Clouds of ash reached the W coast, drifting as far as 465 km on 9 September. There were at least two VAAC reports issued in October, but the volumes and masses of these eruptions were not calculated.
Significant ash-and-steam emissions continued from Cotopaxi until 23 November 2015 . The plumes generally rose no more than 2 or 2.5 km above the crater and usually drifted N or NW, and occasionally W or SW. Intermittent ashfall was reported from numerous towns through 18 November, generally from areas W and N of the volcano at distances up to 60 km. A summary of towns that reported ash and their distance and direction from Cotopaxi is shown in Table 4. The last significant ashfall reported by IG was on 23 November 2015. By December, the height of the steam plumes had decreased to consistently 1 km or less above the crater. No ashfall was reported in December inside the park or surrounding area, but traces of ash were observed covering parts of the glacier on the flanks of the volcano. At 1843 on 24 January a plume with low-to-moderate levels of ash rose 700 m above the crater and drifted W. The emission coincided with a hybrid earthquake. This was the last reported ash through March 2016.
Ash characteristics. Analysis of ash collected on 2 September showed that the greatest contribution of material was from pre-existing and altered rock. A week later, analysis of ash samples showed an increase in the proportion of juvenile fragments. A grain size analysis of ash samples indicated a very high proportion of extremely fine ash (30 to 75% less than 63 microns). Other than the ash recovered on the first day of the eruption (14 August ) which had a slightly larger size distribution, subsequent samples were consistently very fine to extremely fine in size. Component analysis performed with binocular and scanning electron microscopes clearly showed an evolution of the ash toward a decreased contribution of preexisting rock (lithic fragments with pyrite, grey scoria with vesicles filled with hydrothermal material, hydrothermal quartz) and an increased proportion of fresh magmatic material (free crystals, glass particles with few vesicles and a high percentage of microlites), especially after 28 August (figure 13).
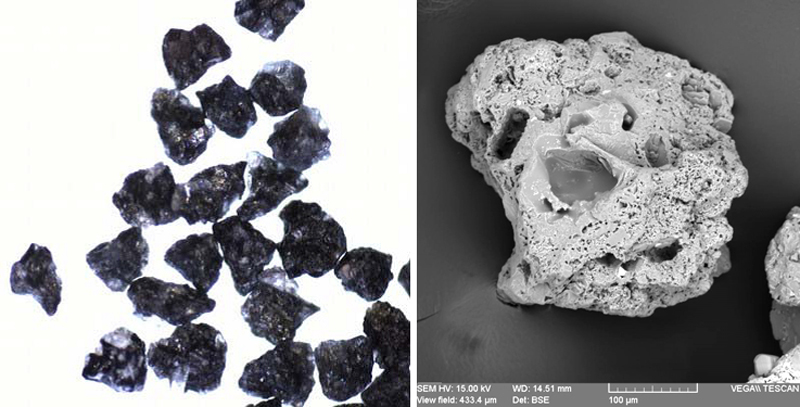 |
Figure 13. Left: Binocular microscope photograph of low-vesicularity glass particles from 28 August, 2015 (photo: A. Proano); Right: SEM image of a semi-vesicular particle with abundant microlites (crystals |
SO2 emissions. SO2 emissions at Cotopaxi began to rise above typical background levels of ~ 500 t/day in late April 2015, and were consistently above 2,500 t/d by late May (figure 14). Values measured by IG scientists peaked on 15 August, the day after the initial explosion, at 16,700 t/d, and declined to 5,490 by 20 August. Emissions on 14 August were also detected by the Ozone Monitoring Instrument (OMI) (figure 15). A total of 350,000 tons of SO2 emissions was recorded in August 2015. Values spiked between 5,000 and 10,000 t/d numerous times between 14 August and late November 2015 before slowly decreasing to levels below 1000 t/d by January 2016, somewhat above background averages.
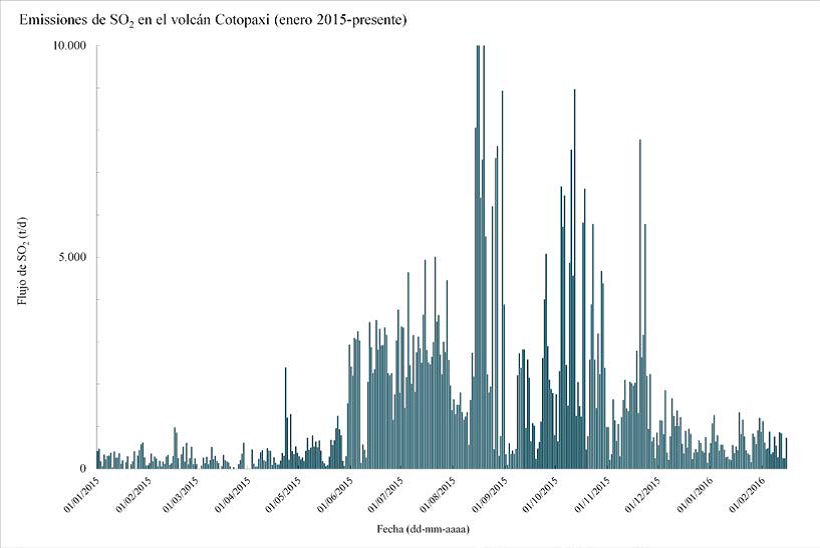 |
Figure 14. Plot of SO2 emissions (tons/day) at Cotopaxi from 1 January 2015 through 15 February 2016. Courtesy of IG (Cotopaxi 2016 Special Report 4, graph created by D. Sierra, IGEPN). |
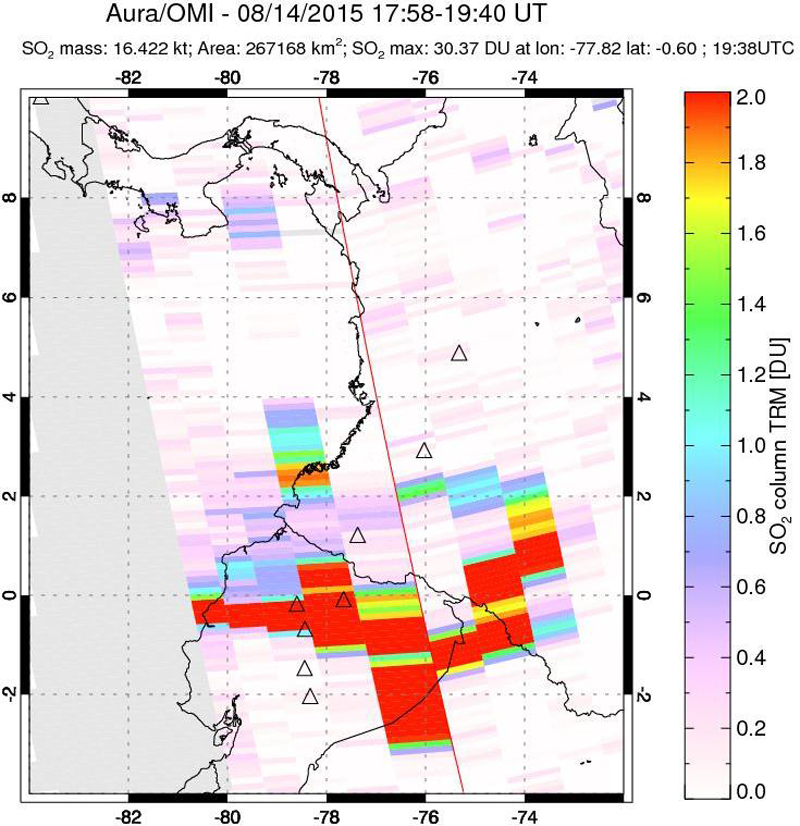 |
Area where SO2 gas emissions from Cotopaxi were detected by the OMI instrument on 14 August 2015. Red indicates higher concentrations. Courtesy NASA Goddard Space Flight Center (GSFC). |
Thermal Monitoring. The first thermal images obtained after the explosions in August occurred during overflights on 18 and 26 August, and revealed a significant increase in the temperatures of emissions. The Maximum Apparent Temperature (MAT) was 150° C on 26 August at several different areas within the crater. By 3 September, thermal images revealed temperature increases in the S and E parts of the crater to 200° C. Bright areas at the summit were observed at night, possibly from hot block deposits. During the 9 September overflight infrared measurements indicated that temperatures had begun to decrease. This decrease continued until 29 September when new thermal anomalies on the upper parts of the outer crater were identified, likely from newly deposited material.
On a clear 2 October, IG geoscientists were able to measure and photograph the thermal anomalies identified and analyzed in previous flights (figure 16). The Maximum Apparent Temperature for the entire inner crater was 104.3° C. The MAT measured on the E flank of the volcano was 57.9° C, up from 51° C measured in the previous flight on 29 September. By 26 January, the thermal image data revealed a significant decline of the MAT to 51.9° C at the bottom of the inner crater.
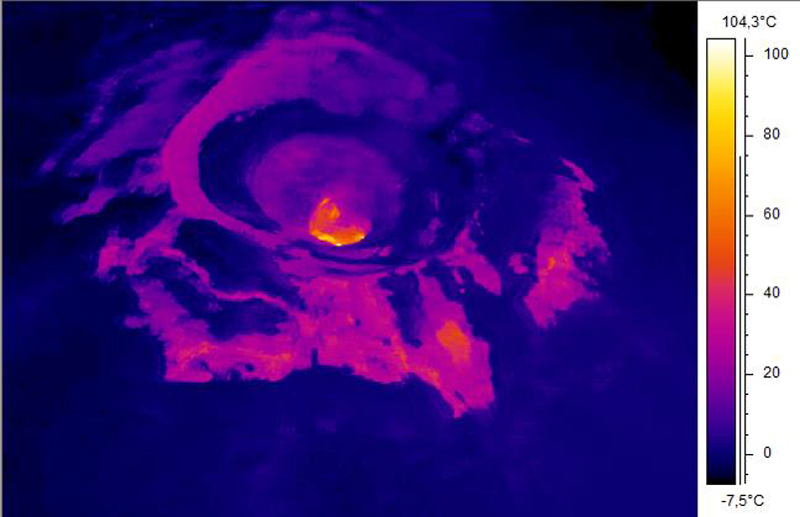 |
Figure 16. Thermal image showing the highest value of MAT corresponding to the inner crater at 104.3° C. The MAT flank temperature is 57.9° C. Courtesy of IG (Cotopaxi 2015 Special Report 19; image by M. Almeida and S Vallejo, IG-EPN). |
Lahars. The first lahar generated by the eruptions descended the W flank of Cotopaxi on 28 August, detected as a high-frequency seismic signal from two stations on the W flank (figure 17). It was a small flow remobilized by a light rain. IG technicians located the flow and determined that the flow rate did not exceed 10 m3/s, and that it remained near the top of the volcano.
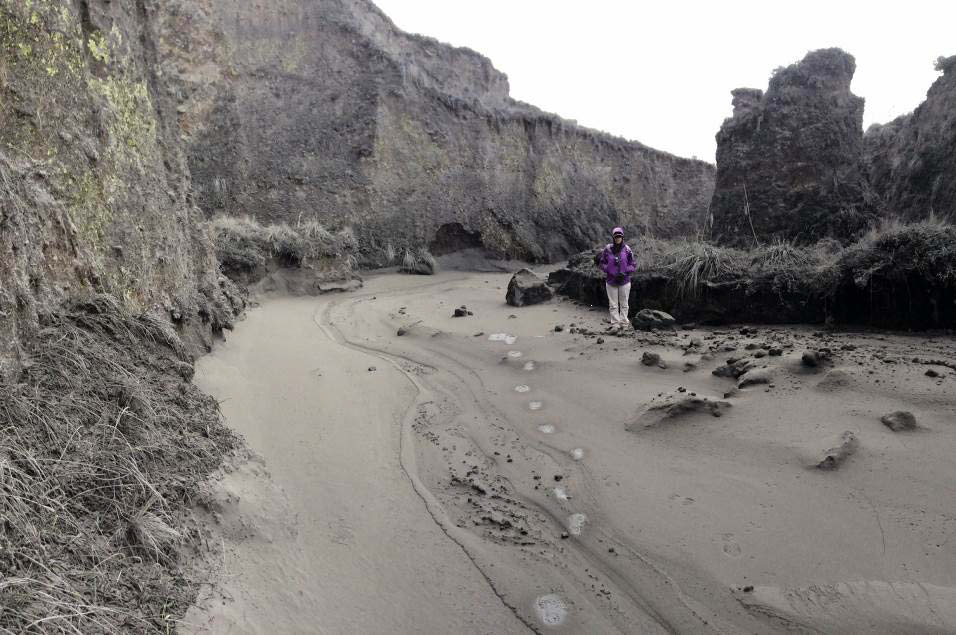 |
Figure 17. A small lahar generated by minor rainfall descended the W flank of Cotopaxi on the afternoon of 28 August 2015. It was located far from any road or infrastructure. Courtesy of IG (Cotopaxi 2015 Special Report 13; photo by D. Andrade). |
There were 58 total rainfall-induced lahars detected through March 2016, with the largest numbers occurring in November and February. They primarily descended the NW and W flanks of the volcano. Four small lahars from the melting glacier were reported in December. The largest lahar occurred at 1336 on 13 January in the Agualongo gorge (approximately 15 km. SW of the summit); a seismic station on Cotopaxi's W flank recorded an hour-long signal caused by the lahar. Preliminary results indicated that the peak flow rate was around 40 m3/s with a volume of about 50,000 m3. The lahar left deposits on the bridge that crosses the river (figure 18).
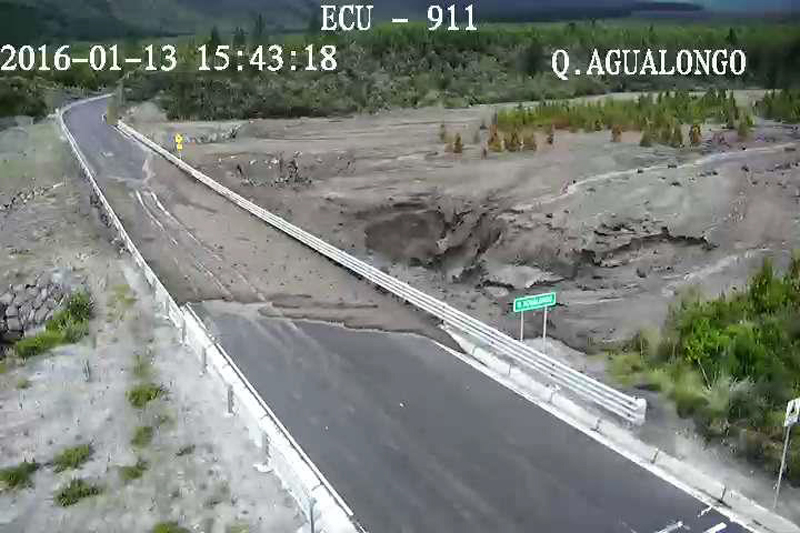 |
Figure 18. The System ECU-911 camera photographed the evidence left after the passage of a lahar across a bridge over the Agualongo gorge (approx. 15 km SW of the summit) on 13 January 2016. Courtesy of IG (Cotopaxi 2016 Special Report 2). |
Post-eruption activity. In late December, after 119 days of closure due to volcanic activity, the Cotopaxi National Park reopened to visitors, as both seismic and surficial activity had declined significantly. By 29 January IG reported that surficial activity was characterized by minor steam emissions from the crater and sporadic gas emissions with minor amounts of ash (the last ash emission was reported on 24 January). Sulfur dioxide (SO2) emissions were less than 1,000 tons per day (near pre-eruptive levels) by the end of January and seismicity had almost returned to baseline levels. Observations in late January 2016 indicated that the glaciers were continuing to move downslope with fractures and cracking, and continued glacial melting was observed as well.
Cotopaxi remained quiet through March 2016 with minor gas emissions rising 600 m above the crater and drifting N and NW. The glacier remained cracked, and glacial melting had decreased considerably.
Table 4. Towns and villages reporting ashfall from Cotopaxi, August-November 2014.
| Town | Distance (km) | Direction |
| Aloag | 28 km | NNW |
| Aloasí | 23 km | NW |
| Bahia de Caraquez | 220 km | WNW |
| Cerro Azul | 47 km | WNW |
| Charapotó | 230 km | W |
| El Chasqui | 48 km | NNW |
| El Chaupi | 24 km | WNW |
| Jambelí | 50 km | NNW |
| Lasso | 60 km | N |
| Latacunga Valley, N part | 18 km | WSW |
| Leonidas Plaza | 40 km | N |
| Los Tsáchilas | 95 km | NW |
| Machachi | 24 km | NW |
| Manabi (El Carmen) | 165 km | W |
| Mariscal Sucre | 50 km | NNW |
| Pastocalle | 20 km | WSW |
| Pichincha | 58 km | N |
| Quito, south | 45 km | N |
| Rocafuerte | 225 km | WSW |
| Romerillos, S hills | 15 km | NW |
| Rumiñahui | 61 km | N |
| Rumipamba de Espinosas | 53 km | NNW |
| San Agustín | 35 km | SW |
| San Fernando | 58 km | NNW |
| San Isidro | 58 km | N |
| San Ramón | 127 km | W |
| Santa Catalina | 52 km | N |
| Selva Alegre | 54 km | NNW |
| Sigchos | 51 km | W |
| Tambillo | 32 km | NNW |
| Tanicuchí | 25 km | SW |
Information Contacts: Instituto Geofísico, Escuela Politécnica Nacional, Casilla 17-01-2759, Quito, Ecuador (URL: http://www.igepn.edu.ec/); Washington Volcanic Ash Advisory Center (VAAC), Satellite Analysis Branch (SAB), NOAA/NESDIS E/SP23, NOAA Science Center Room 401, 5200 Auth Rd, Camp Springs, MD 20746, USA (URL: http://www.ospo.noaa.gov/Products/atmosphere/vaac/); OMI (Ozone Monitoring Instrument), Global Sulfur Dioxide Monitoring, Atmospheric Chemistry & Dynamics, NASA Goddard Space Flight Center, Goddard, Maryland, USA (URL: https://so2.gsfc.nasa.gov/); El Comercio (URL: http://www.elcomercio.com/actualidad/aerovia-actividad-cotopaxi-ecuador-negocios.html).
New eruption in October 2022; frequent ash emissions continuing through January 2023
Cotopaxi, located in Ecuador, is a steep-sided cone capped by nested summit craters, the largest of which is about 550 x 800 m. Pyroclastic flows have accompanied many explosive eruptions and lahars have frequently affected adjacent valleys. Strong eruptions took place in 1744, 1768, and 1877. The most recent eruption took place during August 2015 through January 2016 that was characterized by phreatic explosions, ash plumes, pyroclastic flows, lahars, and ash fall (BGVN 41:05). A new eruption began in October 2022; this report describes activity from October 2022 through January 2023, which included frequent ash plumes, ashfall, and rare lahars. Information comes from Ecuador's Instituto Geofísico, Escuela Politécnica Nacional (IG-EPN), Servicio Nacional de Gestión de Riesgos y Emergencias (SNGRE), the Washington Volcanic Ash Advisory Center (VAAC), and various satellite data.
Activity has been relatively quiet since the last eruption in January 2016. According to the Washington VAAC, four ash clouds were detected on 4 July 2016, 23 January 2017, 15 July 2018, and 10 January 2020. However, no seismicity or ash deposits were associated with these events, so their cause is unknown and has not been attributed to eruptive activity.
During 21-31 October gas-and-steam emissions rose 200-1,000 m above the crater and seismicity was mainly characterized by daily small, long-period (LP) type earthquakes, volcano-tectonic (VT) events, and volcanic tremor (TR). On 21 October at 1944 seismic stations on the flanks began to record a volcanic tremor event. This earthquake signal lasted until 0040 on 22 October and was accompanied by gas-and-ash emissions that drifted NE; a moderate amount of ashfall was visible in the Refugio José Rivas, 2 km N of the summit crater, in addition to a sulfur odor (figure 19). The Washington VAAC reported a diffuse ash cloud seen in GOES-16 satellite imagery at 2200 on 21 October that rose to 1.7-2.3 km above the crater and drifted NE and W. A Sentinel-2 satellite image showed ash deposits on the N flank on 23 October (figure 20). Seismic stations on the N flank detected a signal related to small lahars during 1115-1300 on 23 October, which were generated due to a melted glacier underlying the ash deposit. An analysis of ash samples collected by IG scientists at the Refugio José Rivas showed that about 22% was juvenile material.
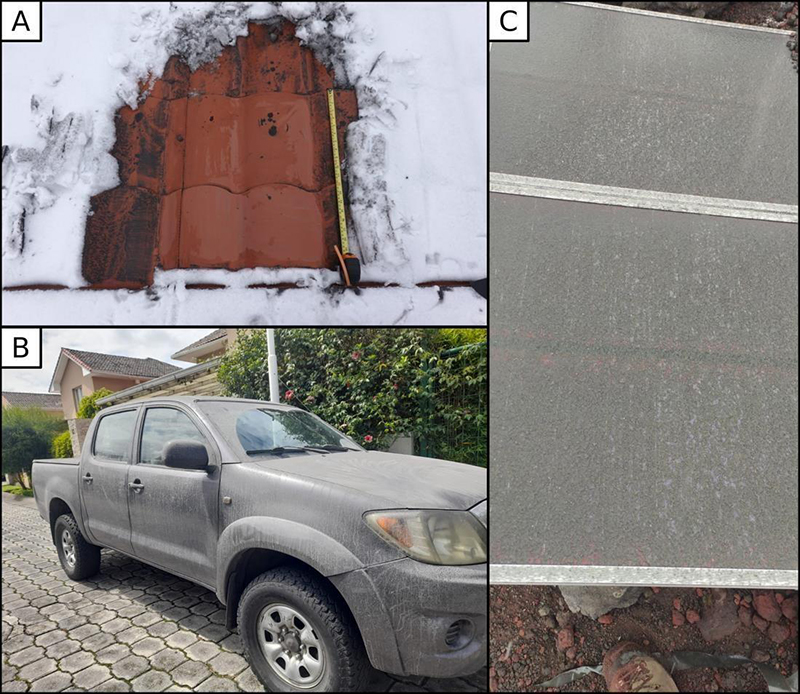 |
Figure 19. Photos of ash deposits from the eruption at Cotopaxi on 21 October 2022. Photos by Benjamin Bernard, IG-EPN (A), Cristian Rivera, ASEGUIM (B), and Marco Solís, IG-EPN (C). Courtesy of IG-EPN. |
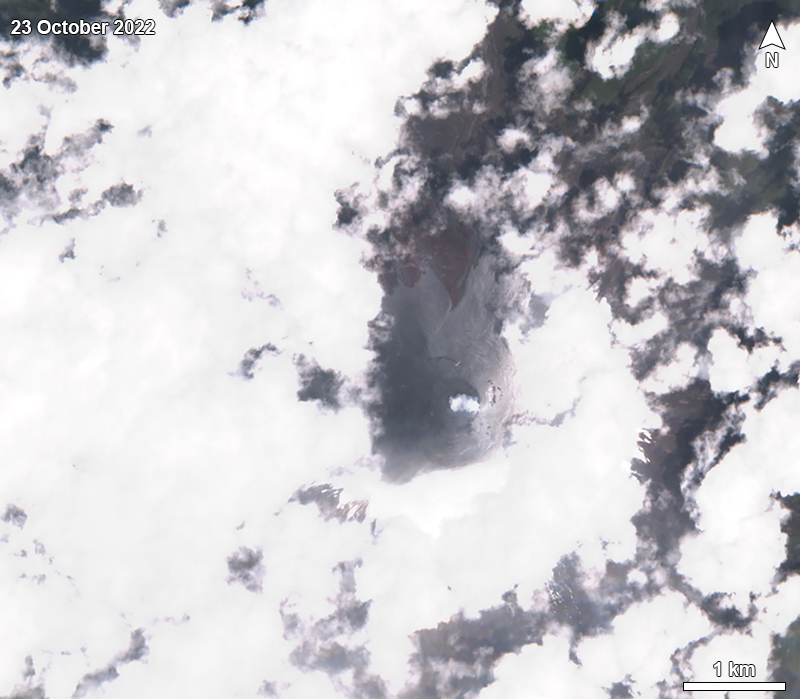 |
Figure 20. Sentinel-2 satellite image showing ashfall deposits on the N flank of Cotopaxi on 23 October 2022. Image uses “Natural color” rendering (bands 4, 3, 2). Courtesy of Sentinel Hub Playground. |
During November, frequent gas-and-steam emissions rose 200-2,800 above the crater and seismicity mostly consisted of daily small LP events and occasional TR and VT events. During 23-24 November ash emissions rose 200-1,000 m above the crater and drifted E, causing visible ash deposits on the NE flank. A new episode of tremor associated with gas-and-ash emissions was detected at approximately 0310 on 26 November that lasted for several hours (figure 21). An ash plume rose 2.2 km above the crater on 26 November and extended 60-85 km NNW. Ashfall was visible in various sectors in the Mejía, Rumiñahui, and Quito areas, including El Pedregal (60 km N), Tambillo (32 km NNW), Guamaní (42 km NNW), Amaguaña (33 km NNW), Chillogallo (44 km NNW), Quitumbe (41 km NNW), Solanda (46 km NNW), Lloa (48 km NNW), Conocoto (41 km N), Mercado Mayorista (45 km NNW), Villaflora (47 km NNW), and Rumipamba (55 km N); an estimated 7-20 x 106 kg of ash were measured. On 27 November gas-and-steam emissions rose 2.8 km above the summit. The Washington VAAC reported during 26-27 November gas-and-ash emissions rose 1.7 km above the summit and drifted NW. Ash emissions rose 600 m above the crater and drifted E on 30 November. IG noted that light ashfall in Latacunga and on the S flank may have been due to remobilization of previously erupted ash.
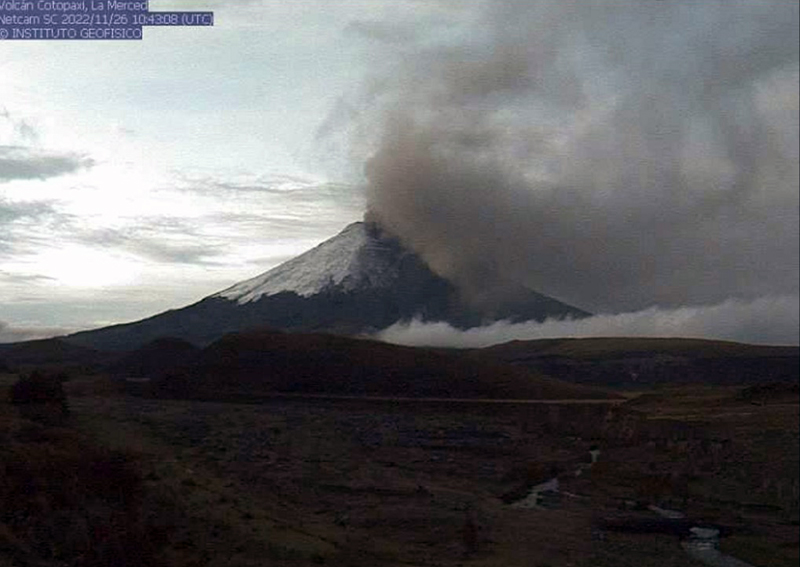 |
Figure 21. Webcam image of a gas-and-ash plume rising above Cotopaxi on 26 November 2022. Photo has been color corrected. Courtesy of IG (INFORME DIARIO DEL VOLCAN COTOPAXI No. 2022-036). |
Seismicity consisting of frequent LP, VT, and TR events continued to be detected during December, occasionally accompanied by gas-and-steam emissions that rose 200-2,000 above the crater. Between 0758 and 0816 on 8 December ash plumes rose approximately 1 km above the summit and drifted WNW; there were no reports of ashfall. During 9-10 December gas-and-ash emissions rose 1.1 km above the crater and drifted NW, causing minor ashfall in Conocoto-Pichincha. A gas-and-ash plume during 10-11 December rose 2 km above the crater and drifted W and NW; there were reports of ashfall at the S area of the Cotopaxi National Park. During 14-15 December gas-and-ash plumes rose 500 m above the crater and drifted W, causing moderate ashfall in the Cotopaxi National Park. During 19-20 December the Washington VAAC reported ash emissions to 1.1 km above the crater that drifted N and NW (figure 22), which caused ashfall in San Pedro de Taboada (40 km N), Uyumbicho (30 km NNW), Guitig Alta, Guitig Baja, Conocoto, Sur de Quito, Chimbacalle (48 km NNW), La Magdalena (48 km NNW), Barrio Nuevo, Villaflora, Miraflores, and La Floresta (50 km N). IG also reported an ash plume to 1.5 km above the crater that drifted 60 km NNW, resulting in ashfall in the Mejía, Rumiñahui, and Quito areas on 20 December. During 21-22 December gas-and-ash emissions rose 500 m above the crater and drifted SE, E, and W; ashfall was reported at Caspi, the S entrance to the national park.
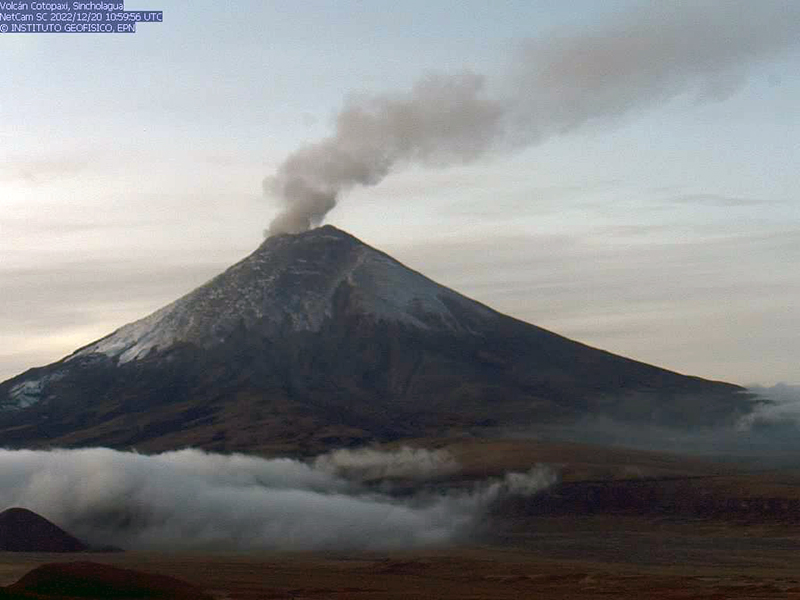 |
Figure 22. Webcam image showing a gas-and-ash plume rising above Cotopaxi on 20 December 2022. Photo has been color corrected. Courtesy of IG (INFORME DIARIO DEL VOLCAN COTOPAXI No. 2022-060). |
Near daily gas-and-steam emissions continued to be reported during January 2023, rising 500-1,000 m above the crater. Seismicity continued with frequent LP and TR events and occasional VT events. The Washington VAAC reported ash emissions that rose 200-2,000 m above the crater and drifted in multiple directions. During 5-6 January a GOES 16 satellite image acquired at 0500 showed a diffuse ash cloud 1 km above the crater that drifted NW; minor ashfall was observed over national park. During 9-13 January the Washington VAAC reported ash emissions rising as high as 2 km above the crater and drifting NW, SW, and W; reports of ashfall came from Colcas, San Ramón, San Agustín de Callo, Mulaló, Mulaló Grande, San Antonio, San Ramón (127 km W), Ticatilin (15 km SW), and MAE Norte, 18 km N of the volcano. Additionally, a sulfur odor was reported during 11-12 December in the towns of Ticatilín and Control Caspi (20 km WSW). During 16-19, 25-27, and 29-30 January light ashfall was reported in Mulaló, San Juan de Pastocalle (20 km WSW), Aláquez, San Agustín de Callo (18 km WSW), Villacís, Ticatilín, Caspi, San Ramon, Chillos (33 km SW), Langualó, San Isidro Alto (20 km SW), and on the N side of the national park. A significant increase in size and density of ash emissions was visible in satellite images at 0820 on 30 January; the plumes rose as high as 2.5 km above the crater rim and drifted SW, S, and SE (figure 23).
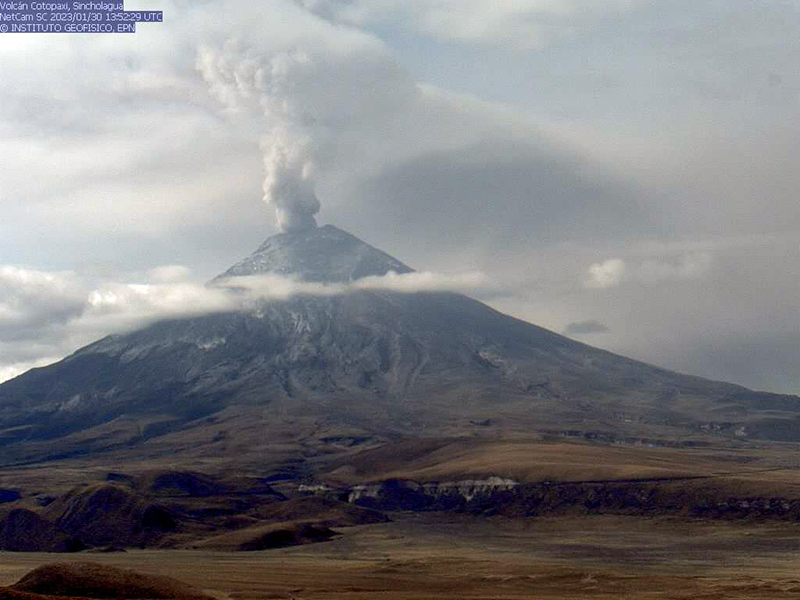 |
Figure 23. Webcam image showing a strong ash plume that rose above Cotopaxi on 30 January 2023 and drifted SE. Courtesy of IG (INFORME DIARIO DEL VOLCAN COTOPAXI No. 2023-030). |
Additional satellite data. Scientists measured sulfur dioxide emissions using a mobile Differential Optical Absorption Spectroscopy (DOAS) instrument on 22 October; emissions were 1,580 tons/day (t/d). Using Sentinel-5P TROPOMI data process by the MOUNTS system, and the DOAS network, IG noted increased degassing beginning on 5 November with sulfur dioxide emissions ranging from 94 tons to 3,493 tons, the latter of which was measured on 26 November. During December levels of sulfur dioxide fluctuated between 119 and 5,753 tons, the latter of which was measured on 25 December. Similar variation was seen in January, with SO2 values measured between 2 tons and 4,718 tons, with the maximum on 8 January. Sentinel-2 infrared satellite images showed a small thermal anomaly at the summit crater on four clear days on 23 October and 2, 17, and 22 December (figure 24).
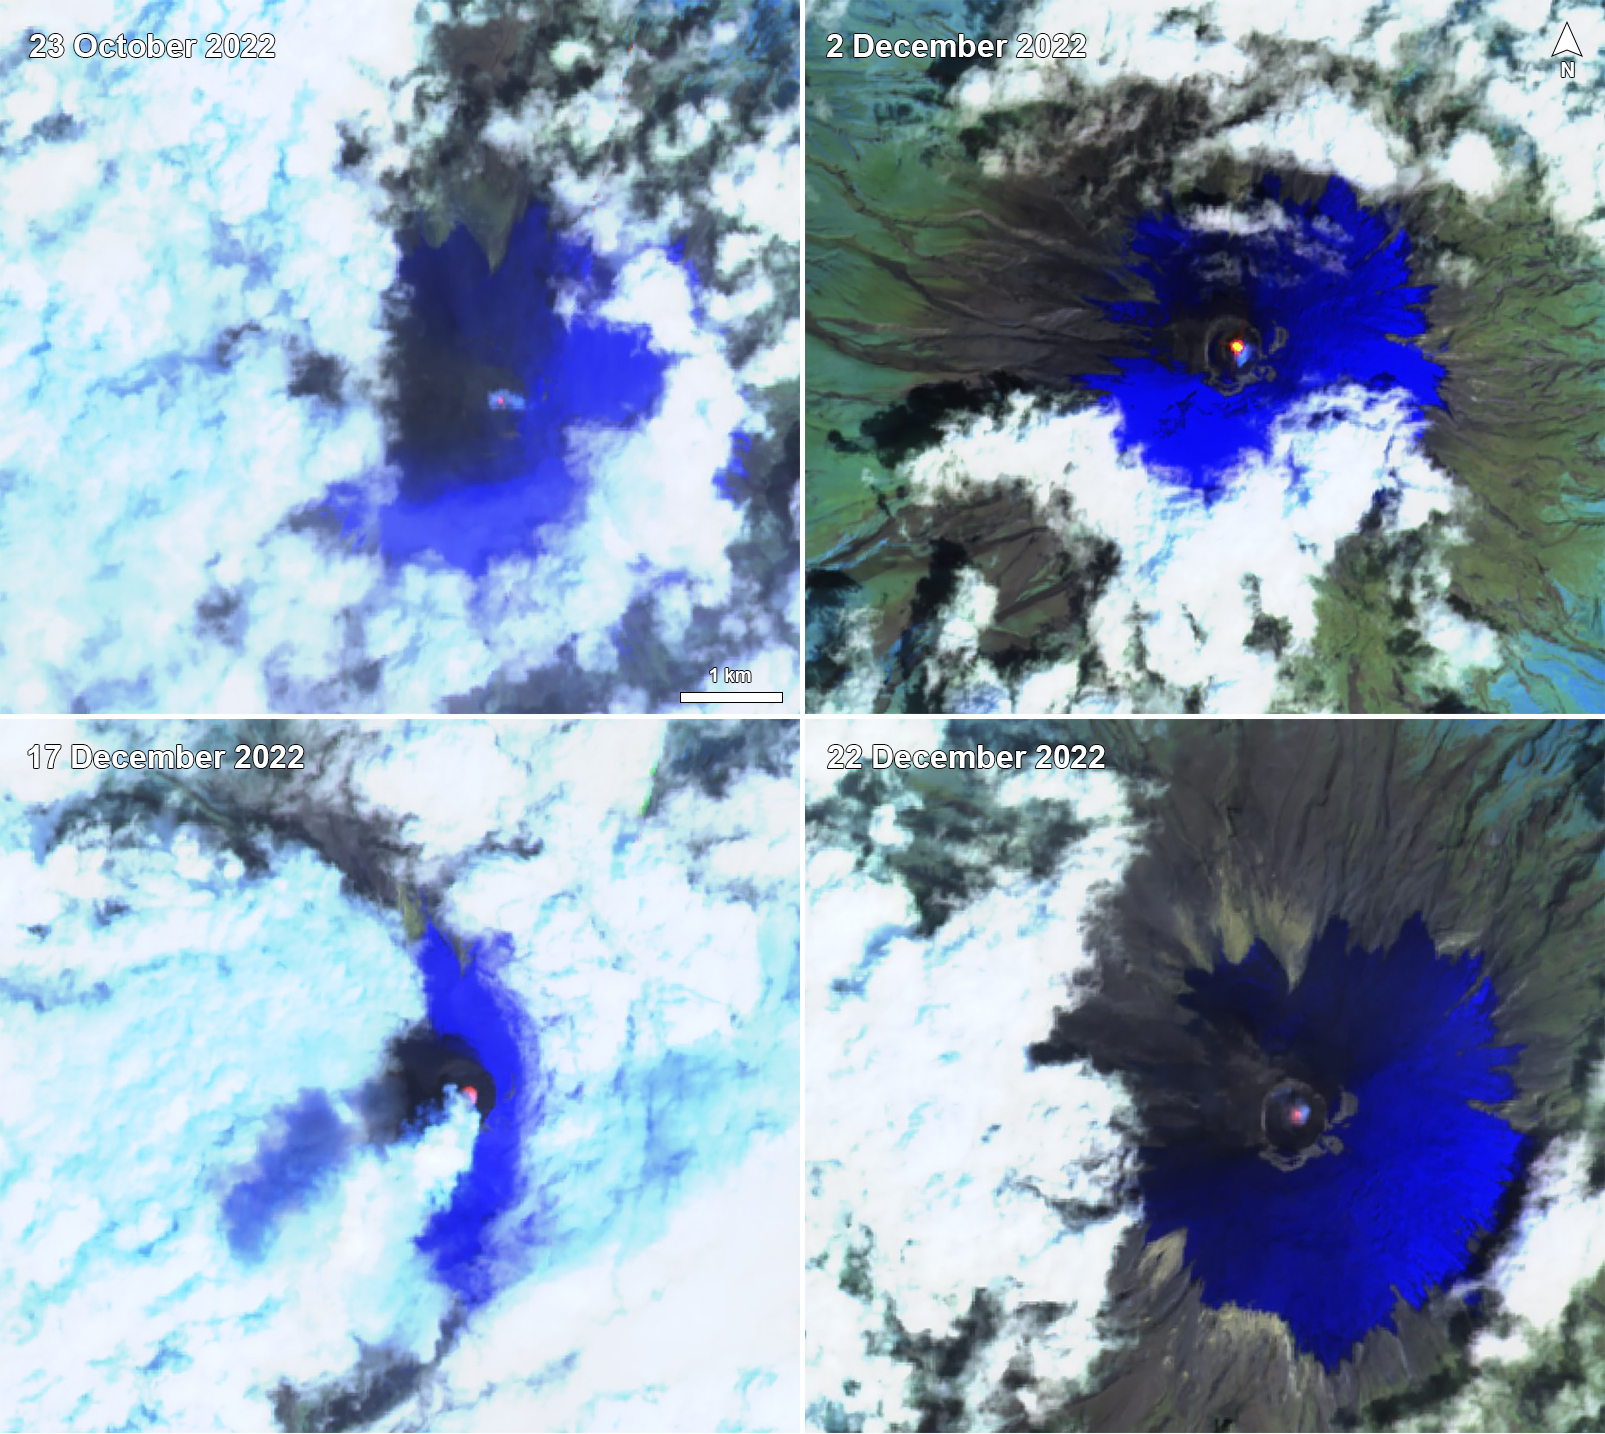 |
Figure 24. Sentinel-2 infrared satellite imagery showing a small thermal anomaly at the summit crater of Cotopaxi on 23 October 2022 (top left), 2 December 2022 (top right), 17 December 2022 (bottom left), and 22 December 2022 (bottom right). Images using “Atmospheric penetration” (bands 12, 11, 8A) rendering. Courtesy of Sentinel Hub Playground. |
Information Contacts: Instituto Geofísico, Escuela Politécnica Nacional (IG-EPN), Casilla 17-01-2759, Quito, Ecuador (URL: http://www.igepn.edu.ec/); Servicio Nacional de Gestion de Riesgos y Emergencias (SNGRE), Samborondón, Ecuador (URL: https://www.gestionderiesgos.gob.ec/); Washington Volcanic Ash Advisory Center (VAAC), Satellite Analysis Branch (SAB), NOAA/NESDIS OSPO, NOAA Science Center Room 401, 5200 Auth Rd, Camp Springs, MD 20746, USA (URL: www.ospo.noaa.gov/Products/atmosphere/vaac, archive at: http://www.ssd.noaa.gov/VAAC/archive.html); MOUNTS Project (Monitoring Unrest From Space), an operational monitoring system for volcanoes using Sentinel satellite data from ESA's Copernicus, Open Access Hub, hosted at UNAM and CT TU-Berlin (URL: http://www.mounts-project.com/home); Sentinel Hub Playground (URL: https://www.sentinel-hub.com/explore/sentinel-playground).
Ash emissions, ashfall, and occasional lahars during February-July 2023
Cotopaxi is a steep-sided cone capped by nested summit craters, located in Ecuador. The largest cone is about 550 x 800 m. Explosive eruptions have been accompanied by pyroclastic flows and lahars, the latter of which frequently affect adjacent valleys. The most recent eruption began in October 2022 and consisted of ash plumes and ashfall (BGVN 48:02). This report covers activity during February through July 2023, which was characterized by similar activity. Information comes from Ecuador's Instituto Geofísico, Escuela Politécnica Nacional (IG-EPN) and the Washington Volcanic Ash Advisory Center (VAAC).
Activity during February consisted of constant gas-and-steam emissions that rose 200-2,500 m above the crater and drifted in multiple directions, and seismicity that was characterized by daily tremor events associated with emissions (TR) and long-period events (LP), and less frequent volcano-tectonic events (VT) and very long-period events (VLP). The Washington VAAC reported during 31 January to 4 February that gas-and-ash emissions rose 1.1-2.5 km above the summit and drifted in multiple directions. Beginning at 0100 on 2 February IG reported an increase in seismic signals associated with ash emissions that rose 1.3 km above the summit and drifted NW (figure 25). There were reports of ashfall in the N part of the Cotopaxi National Park in Quito and Mejía, particularly in Amaguaña (35 km NNW), La Armenia, Quitumbe (41 km NNW), Conocoto (41 km N), Guamaní (42 km NNW), La Ecuatoriana (44 km NNW), Turubamba (43 km NNW), Chillogallo (47 km NNW), La Magdalena (48 km NNW), Machachi, Tambillo (32 km NNW), Alóag (28 km NW), Cutuglahua (35 km NNW), Uyumbicho (30 km NNW), Aloasí (24 km NW), and El Chaupi (24 km WNW) during 2-4 February. On the morning of 3 February continuous gas-and-ash emissions were reported, resulting in slight ashfall in Tambillo, Chillogallo, and La Armenia 2 and later that same day in Guamaní, Turubamba, Chillogallo, La Ecuatoriana, Quitumbe, Tambillo, Machachi, Aloasí, Aloag (28 km NW), and Conocoto.
|
Figure 25. Webcam image of a gray ash plume rising above Cotopaxi on 2 February 2023. Courtesy of IG-EPN (IG Al Instante Informativo VOLCÁN COTOPAXI No 2023-023). |
During 9-10, 12-19, and 26-27 February the Washington VAAC reported that gas-and-ash emissions rose 200-1,400 m above the crater and drifted W, NW, S, and SE. At 1800 on 9 February an ash plume rose 2 km above the summit and drifted W according to IG-EPN. Slight ashfall was reported in Tambillo. During the night and early morning of 11-12 February gas-and-ash emissions rose less than 500 m above the crater and drifted SW; there were some reports of light ashfall in El Chasqui (17 km W), Mulaló (19 km SW) and San Juan de Pastocalle (20 km WSW). Around 0810 the BREF seismic station recorded an increase in tremor energy, which is associated with ash emissions. During 13-14 February several gas-and-ash emissions rose as high as 1 km and drifted W and SW, resulting in minor ashfall in Mulaló, San Agustín (11 km W), Ticatilín (15 km WSW), San Ramón (17 km SW), Control Caspi (20 km WSW), and Pastocalle (22 km W). Starting around 0630 on 15 February ashfall was observed in Mulaló 2, San Ramón (17 km SW), Ticatilín (15 km SW), and San Agustín del Callo (18 km WSW). According to the Network of Volcanic Observers (ROVE), ashfall was reported in Latacunga canton (18 km WSW) during the night of 15 February. On 16 February at 0600 ash emissions rose 1 km above the summit and drifted E, based on surveillance cameras (figure 26). Starting at 0230 on 18 February IG reported an increase in seismic signals that were associated with ash emissions; by 0650 satellite images showed an ash plume that rose 800 m above the summit and drifted SE. Around 0030 on 19 February an ash plume rose 1.1 km above the crater and drifted S. During the morning of 27 February gas-and-ash emissions rose 1 km above the summit and drifted SE; light ashfall was reported in Pichincha en Rumiñahui (61 km N), Rumipamba Vallecito (55 km N), Conocoto, Pedregal (60 km N), Guamaní, Quitumbe, La Ecuatoriana, Chillogallo, Urubamba (Santo Tomas, 40 km NNW), La Magdalena (Barrio Nuevo, Villaflora), and San Bartolo. On 28 February at 1430 surveillance cameras showed an ash plume that rose 500 m above the summit and drifted SW.
|
Figure 26. Webcam image of an ash emission rising 1 km above the summit of Cotopaxi and drifting E on 16 February 2023. Photo has been color corrected. Courtesy of IG-EPN (IG Al Instante Informativo VOLCÁN COTOPAXI No 2023-031). |
Ash emissions continued during March, rising 1-1.5 km above the summit, and drifting in different directions. Seismicity consisted of daily LP and near-daily TR events and less frequent VT and VLP events. Intermittent gas-and-steam emissions rose 100-1,500 m and drifted in different directions. According to the Washington VAAC ash emissions rose 500-2,000 m above the summit and drifted in multiple directions during 28 February to 3 March, 4-5, 18-19, and 24-29 March. Light ashfall was reported in Mulaló during 28 February to 1 March and 5-6 March. On 19 March at 0900 surveillance cameras captured an ash emission that rose 1 km above the summit and drifted E (figure 27). A thin ash cloud was observed in GOES-16 satellite images rising 500 m above the summit and drifted SW on 25 March. Around 0310 on 28 March a GOES-16 satellite image showed an ash cloud rising 1 km above the summit and drifted N. As a result, light ashfall was observed in Machachi and on the N flank of the volcano and in El Chasqui, Latacunga, and the S flank of the volcano during 28-29 March.
|
Figure 27. Webcam image of an ash emission rising 1 km above the summit of Cotopaxi and drifting E on 19 March 2023. Photo has been color corrected. Courtesy of IG-EPN (IG Al Instante Informativo VOLCÁN COTOPAXI No 2023-036). |
Gas-and-steam emissions continued during April, rising 200-1,500 m above the crater, and drifting in different directions. Seismicity consisted of daily LP and near-daily TR events and less frequent VT events. Gas-and-ash emissions rose 200-1,500 m above the crater and drifted W, SW, E, and SE. During 4-6 and 9-10 April the Washington VAAC reported that ash emissions rose 200-1,100 m above the crater and drifted SW, SE, and E. A lahar occurred on the upper W flank on 5 April due to moderate rainfall. Light ashfall was reported in Mulaló and San Agustín during 5-6 April. On 8 April at 0900 a surveillance camera showed an ash plume that rose 500 m above the summit and drifted E and on 10 April at 0500 an ash plume rose 1.1 km above the summit and drifted W. During the night of 11 April, a small, secondary lahar was descended the Agualongo drainage. Another lahar was recorded during 12-13 April, though it was not observed due to cloud cover. On 15 April a small lahar was observed on the NW flank. The BNAS seismic station recorded an increase in seismic signal at 1600 on 22 April that corresponded to a small lahar, which descended the Cutzulao/Agualongo drainages. During 23-24 April the Washington VAAC reported ash emissions that rose as high as 2,028 m above the summit and drifted NE. According to IG-EPN surveillance camera showed an ash plume rising 3 km above the summit and drifted NE at 0953 (figure 28). During 24-25 and 28-30 April ash emissions rose 200-2,000 m above the crater and drifted NE and W. According to ROVE, ashfall was reported in the S area of the national park around 1805.
|
Figure 28. Webcam image of an ash emission rising 3 km above the summit of Cotopaxi and drifting NE on 24 April 2023. Photo has been color corrected. Courtesy of IG-EPN (INFORME DIARIO DEL VOLCAN COTOPAXI No. 2023-114). |
Similar activity continued during May. Seismicity was characterized by daily LP and near-daily TR events and occasional VT events. Gas-and-steam emissions rose 200-1,500 m above the summit and drifted in different directions. Gas-and-ash emissions rose 200-1,400 m above the crater and drifted W, SW, NW, and SE. On 1 May at 0130 and on 8 May the BNAS seismic station recorded high-frequency seismic signals that corresponded to small lahars that remained within the Cotopaxi National Park. An ash plume was observed in a GOES-16 satellite image around 1100 that rose 1.5 km above the summit and drifted WNW, reaching Manabí on 4 May. Light ashfall was reported in Mulaló during 6-7 May. At 0600 on 7 May an ash plume rose 500-1,100 m above the summit and drifted W and SW. Ashfall was reported in Mulaló. The Washington VAAC reported that ash emissions rose 800 m above the summit and drifted NW during 7-8 May. During 9-10 May a moderate ash plume rose 2-3 km above the summit and drifted SW, N, and NE. Ashfall was reported in San Joaquín (SW) and San Agustín de Callo (SW). Another ash plume rose 2 km above the summit and drifted SE at 0749 on 12 May (figure 29). Intermittent ash plumes rose 1-3 km above the summit starting at 0510 on 18 May and drifted NE. As a result, light ashfall was reported in Machachi. Continuous ash emissions were recorded during the morning of 26 May, rising 1.5-2 km above the crater and drifting W and NW. Ash emissions rose as high as 1.1 km above the summit and drifted W and SW during 29-30 May according to the Washington VAAC. At 0600 surveillance cameras and satellite images showed an ash plume rising 1.1 km above the crater and drifted as far as 40 km W. Ashfall was reported in Pastocalle. During 30-31 May an ash emission rose 500 m above the summit and drifted W, based on a Washington VAAC report.
|
Figure 29. Webcam image showing an ash plume rising as high as 2 km above the summit of Cotopaxi on 12 May 2023. Courtesy of IG-EPN (IG Al Instante Informativo VOLCÁN COTOPAXI No 2023-048). |
During June, gas-and-steam emissions rose 100-500 m above the summit and seismicity continued with daily LP and near-daily TR events and less frequent VT events. Gas-and-ash emissions rose 100-1,000 m above the summit and drifted in several directions. Light ashfall was reported in San Agustín de Callo and San Ramón during 1-2 June. Ash emissions rose 1 km above the summit and drifted SW during 1746-2000 on 3 June. According to the Washington VAAC, ash emissions rose 800 m above the summit and drifted SW during 4-5 June. A seismic signal was recorded on the NW flank on 8 June that IG reported was possibly associated with a small lahar. Around 0900 on 21 June an ash cloud rose less than 500 m above the summit and drifted over the W and SW flanks due to strong winds; light ashfall was reported in the Cotopaxi National Park. Starting around 1400 on 27 June through 28 June a high-frequency tremor signal was recorded at the BREF and BNAS seismic stations associated with small lahar signals moving through the Agualongo Creek; the flows were limited to the Cotopaxi National Park. Around 1300 on 29 June two seismic signals relating to small lahars were recorded on the W flank of the volcano moving down the Agualongo Creek.
Activity during July was relatively low and was mainly characterized by gas-and-steam emissions rising 100-1,800 m above the summit and seismicity consisting of daily LP and near-daily TR events and less frequent VT events. During the afternoon of 1 July, a high-frequency seismic signal was recorded on the NW flank relating to a small lahar. Gas-and-ash emissions rose 100-1,100 m above the summit and drifted SW and W. The Washington VAAC reported an ash emission that rose 500 m above the summit and drifted SW during 2-3 July. Light ashfall was reported in Mulaló, including Rosal, Ticatilín, San Agustín del Callo, San Ramón, and Rumipamba de Villacis. On 5 July around 0700 an ash plume rose 600 m above the summit and drifted SW, based on a GOES-16 satellite images. According to IG-EPN cameras and ROVE reports, remobilized ash was observed on the W flank resulting from strong winds during 18-19 July.
Information Contacts: Instituto Geofísico, Escuela Politécnica Nacional (IG-EPN), Casilla 17-01-2759, Quito, Ecuador (URL: http://www.igepn.edu.ec/); Washington Volcanic Ash Advisory Center (VAAC), Satellite Analysis Branch (SAB), NOAA/NESDIS OSPO, NOAA Science Center Room 401, 5200 Auth Rd, Camp Springs, MD 20746, USA (URL: www.ospo.noaa.gov/Products/atmosphere/vaac, archive at: http://www.ssd.noaa.gov/VAAC/archive.html).
|
|
||||||||||||||||||||||||||
There is data available for 85 confirmed eruptive periods.
2022 Oct 21 - 2023 Jul 6 Confirmed Eruption (Explosive / Effusive) VEI: 2
| Episode 1 | Eruption (Explosive / Effusive) | Summit crater | ||||||||||||||||||||||||||||||||||||||
|---|---|---|---|---|---|---|---|---|---|---|---|---|---|---|---|---|---|---|---|---|---|---|---|---|---|---|---|---|---|---|---|---|---|---|---|---|---|---|---|
| 2022 Oct 21 - 2023 Jul 6 | Evidence from Observations: Reported | ||||||||||||||||||||||||||||||||||||||
|
List of 6 Events for Episode 1 at Summit crater
|
|||||||||||||||||||||||||||||||||||||||
2015 Aug 14 - 2016 Jan 24 Confirmed Eruption (Explosive / Effusive) VEI: 3
| Episode 1 | Non-eruptive (Precursory) | Summit crater | ||||||||||||||||||||||||||||
|---|---|---|---|---|---|---|---|---|---|---|---|---|---|---|---|---|---|---|---|---|---|---|---|---|---|---|---|---|---|
| 2015 Apr 15 - 2015 Aug 13 | Evidence from Observations: Seismicity | ||||||||||||||||||||||||||||
|
List of 4 Events for Episode 1 at Summit crater
|
|||||||||||||||||||||||||||||
| Episode 2 | Eruption (Explosive / Effusive) | Summit crater | |||||||||||||||||||||||||||||||||||||||||||||||||||||||||||||||||||||||||||||||||||||||||||||||||||||||||||||||||||||||||||||||||||||||||||||||||||||||||||||||||||||||||||||||||||||||||||||||||||||||||||||||||||||||||||||||||||||||||||||||||||||||||||||||||||||||||||||||||||||||||||||||||||||||||||||||||||||||||||||||||||||||||||||||||||||||||||||||||||||||||||
|---|---|---|---|---|---|---|---|---|---|---|---|---|---|---|---|---|---|---|---|---|---|---|---|---|---|---|---|---|---|---|---|---|---|---|---|---|---|---|---|---|---|---|---|---|---|---|---|---|---|---|---|---|---|---|---|---|---|---|---|---|---|---|---|---|---|---|---|---|---|---|---|---|---|---|---|---|---|---|---|---|---|---|---|---|---|---|---|---|---|---|---|---|---|---|---|---|---|---|---|---|---|---|---|---|---|---|---|---|---|---|---|---|---|---|---|---|---|---|---|---|---|---|---|---|---|---|---|---|---|---|---|---|---|---|---|---|---|---|---|---|---|---|---|---|---|---|---|---|---|---|---|---|---|---|---|---|---|---|---|---|---|---|---|---|---|---|---|---|---|---|---|---|---|---|---|---|---|---|---|---|---|---|---|---|---|---|---|---|---|---|---|---|---|---|---|---|---|---|---|---|---|---|---|---|---|---|---|---|---|---|---|---|---|---|---|---|---|---|---|---|---|---|---|---|---|---|---|---|---|---|---|---|---|---|---|---|---|---|---|---|---|---|---|---|---|---|---|---|---|---|---|---|---|---|---|---|---|---|---|---|---|---|---|---|---|---|---|---|---|---|---|---|---|---|---|---|---|---|---|---|---|---|---|---|---|---|---|---|---|---|---|---|---|---|---|---|---|---|---|---|---|---|---|---|---|---|---|---|---|---|---|---|---|---|---|---|---|---|---|---|---|---|---|---|---|---|---|---|---|---|---|---|---|---|---|---|---|---|---|---|---|---|---|---|---|---|---|---|---|---|---|---|---|---|---|---|---|---|---|---|---|---|---|---|
| 2015 Aug 14 - 2016 Jan 24 | Evidence from Observations: Reported | |||||||||||||||||||||||||||||||||||||||||||||||||||||||||||||||||||||||||||||||||||||||||||||||||||||||||||||||||||||||||||||||||||||||||||||||||||||||||||||||||||||||||||||||||||||||||||||||||||||||||||||||||||||||||||||||||||||||||||||||||||||||||||||||||||||||||||||||||||||||||||||||||||||||||||||||||||||||||||||||||||||||||||||||||||||||||||||||||||||||||||
|
List of 71 Events for Episode 2 at Summit crater
|
||||||||||||||||||||||||||||||||||||||||||||||||||||||||||||||||||||||||||||||||||||||||||||||||||||||||||||||||||||||||||||||||||||||||||||||||||||||||||||||||||||||||||||||||||||||||||||||||||||||||||||||||||||||||||||||||||||||||||||||||||||||||||||||||||||||||||||||||||||||||||||||||||||||||||||||||||||||||||||||||||||||||||||||||||||||||||||||||||||||||||||
[ 1942 Feb 17 - 1942 Feb 19 ] Uncertain Eruption
| Episode 1 | Eruption (Explosive / Effusive) | |||||||||||||||||||||||||||||||||||||||
|---|---|---|---|---|---|---|---|---|---|---|---|---|---|---|---|---|---|---|---|---|---|---|---|---|---|---|---|---|---|---|---|---|---|---|---|---|---|---|---|
| 1942 Feb 17 - 1942 Feb 19 | Evidence from Unknown | ||||||||||||||||||||||||||||||||||||||
|
List of 6 Events for Episode 1
|
|||||||||||||||||||||||||||||||||||||||
1940 Confirmed Eruption (Explosive / Effusive) VEI: 2
| Episode 1 | Eruption (Explosive / Effusive) | |||||||||||||||||||
|---|---|---|---|---|---|---|---|---|---|---|---|---|---|---|---|---|---|---|---|
| 1940 - Unknown | Evidence from Observations: Reported | ||||||||||||||||||
|
List of 2 Events for Episode 1
|
|||||||||||||||||||
1939 Feb 2 Confirmed Eruption (Explosive / Effusive) VEI: 2
| Episode 1 | Eruption (Explosive / Effusive) | |||||||||||||||||||
|---|---|---|---|---|---|---|---|---|---|---|---|---|---|---|---|---|---|---|---|
| 1939 Feb 2 - Unknown | Evidence from Observations: Reported | ||||||||||||||||||
|
List of 2 Events for Episode 1
|
|||||||||||||||||||
1931 Confirmed Eruption (Explosive / Effusive) VEI: 2
| Episode 1 | Eruption (Explosive / Effusive) | |||||||||||||||||||
|---|---|---|---|---|---|---|---|---|---|---|---|---|---|---|---|---|---|---|---|
| 1931 - Unknown | Evidence from Observations: Reported | ||||||||||||||||||
|
List of 2 Events for Episode 1
|
|||||||||||||||||||
1926 Confirmed Eruption (Explosive / Effusive) VEI: 2
| Episode 1 | Eruption (Explosive / Effusive) | |||||||||||||||||||
|---|---|---|---|---|---|---|---|---|---|---|---|---|---|---|---|---|---|---|---|
| 1926 - Unknown | Evidence from Observations: Reported | ||||||||||||||||||
|
List of 2 Events for Episode 1
|
|||||||||||||||||||
1922 Confirmed Eruption (Explosive / Effusive) VEI: 2
| Episode 1 | Eruption (Explosive / Effusive) | |||||||||||||||||||
|---|---|---|---|---|---|---|---|---|---|---|---|---|---|---|---|---|---|---|---|
| 1922 - Unknown | Evidence from Observations: Reported | ||||||||||||||||||
|
List of 2 Events for Episode 1
|
|||||||||||||||||||
1908 - 1914 Confirmed Eruption (Explosive / Effusive) VEI: 1
| Episode 1 | Eruption (Explosive / Effusive) | |||||||||||||||||||
|---|---|---|---|---|---|---|---|---|---|---|---|---|---|---|---|---|---|---|---|
| 1908 - 1914 | Evidence from Observations: Reported | ||||||||||||||||||
|
List of 2 Events for Episode 1
|
|||||||||||||||||||
1907 Jun Confirmed Eruption (Explosive / Effusive) VEI: 2
| Episode 1 | Eruption (Explosive / Effusive) | |||||||||||||||||||
|---|---|---|---|---|---|---|---|---|---|---|---|---|---|---|---|---|---|---|---|
| 1907 Jun - Unknown | Evidence from Observations: Reported | ||||||||||||||||||
|
List of 2 Events for Episode 1
|
|||||||||||||||||||
1906 Aug 21 - 1906 Sep 19 Confirmed Eruption (Explosive / Effusive) VEI: 2
| Episode 1 | Eruption (Explosive / Effusive) | |||||||||||||||||||
|---|---|---|---|---|---|---|---|---|---|---|---|---|---|---|---|---|---|---|---|
| 1906 Aug 21 - 1906 Sep 19 | Evidence from Observations: Reported | ||||||||||||||||||
|
List of 2 Events for Episode 1
|
|||||||||||||||||||
1905 Confirmed Eruption (Explosive / Effusive) VEI: 2
| Episode 1 | Eruption (Explosive / Effusive) | |||||||||||||||||||
|---|---|---|---|---|---|---|---|---|---|---|---|---|---|---|---|---|---|---|---|
| 1905 - Unknown | Evidence from Observations: Reported | ||||||||||||||||||
|
List of 2 Events for Episode 1
|
|||||||||||||||||||
1903 Sep 26 - 1904 Dec Confirmed Eruption (Explosive / Effusive) VEI: 3
| Episode 1 | Eruption (Explosive / Effusive) | ||||||||||||||||||||||||||||||||||
|---|---|---|---|---|---|---|---|---|---|---|---|---|---|---|---|---|---|---|---|---|---|---|---|---|---|---|---|---|---|---|---|---|---|---|
| 1903 Sep 26 - 1904 Dec | Evidence from Observations: Reported | |||||||||||||||||||||||||||||||||
|
List of 5 Events for Episode 1
|
||||||||||||||||||||||||||||||||||
1895 Confirmed Eruption (Explosive / Effusive) VEI: 2
| Episode 1 | Eruption (Explosive / Effusive) | |||||||||||||||||||
|---|---|---|---|---|---|---|---|---|---|---|---|---|---|---|---|---|---|---|---|
| 1895 - Unknown | Evidence from Observations: Reported | ||||||||||||||||||
|
List of 2 Events for Episode 1
|
|||||||||||||||||||
1886 Jan Confirmed Eruption (Explosive / Effusive) VEI: 2
| Episode 1 | Eruption (Explosive / Effusive) | |||||||||||||||||||
|---|---|---|---|---|---|---|---|---|---|---|---|---|---|---|---|---|---|---|---|
| 1886 Jan - Unknown | Evidence from Observations: Reported | ||||||||||||||||||
|
List of 2 Events for Episode 1
|
|||||||||||||||||||
1885 Jul 23 Confirmed Eruption (Explosive / Effusive) VEI: 2
| Episode 1 | Eruption (Explosive / Effusive) | |||||||||||||||||||||||||||||
|---|---|---|---|---|---|---|---|---|---|---|---|---|---|---|---|---|---|---|---|---|---|---|---|---|---|---|---|---|---|
| 1885 Jul 23 - Unknown | Evidence from Observations: Reported | ||||||||||||||||||||||||||||
|
List of 4 Events for Episode 1
|
|||||||||||||||||||||||||||||
1883 Dec Confirmed Eruption (Explosive / Effusive) VEI: 2
| Episode 1 | Eruption (Explosive / Effusive) | |||||||||||||||||||||||||||||
|---|---|---|---|---|---|---|---|---|---|---|---|---|---|---|---|---|---|---|---|---|---|---|---|---|---|---|---|---|---|
| 1883 Dec - Unknown | Evidence from Observations: Reported | ||||||||||||||||||||||||||||
|
List of 4 Events for Episode 1
|
|||||||||||||||||||||||||||||
1883 Aug Confirmed Eruption (Explosive / Effusive) VEI: 2
| Episode 1 | Eruption (Explosive / Effusive) | |||||||||||||||||||||||||||||
|---|---|---|---|---|---|---|---|---|---|---|---|---|---|---|---|---|---|---|---|---|---|---|---|---|---|---|---|---|---|
| 1883 Aug - Unknown | Evidence from Observations: Reported | ||||||||||||||||||||||||||||
|
List of 4 Events for Episode 1
|
|||||||||||||||||||||||||||||
1882 Jan - 1882 Mar Confirmed Eruption (Explosive / Effusive) VEI: 2
| Episode 1 | Eruption (Explosive / Effusive) | ||||||||||||||||||||||||
|---|---|---|---|---|---|---|---|---|---|---|---|---|---|---|---|---|---|---|---|---|---|---|---|---|
| 1882 Jan - 1882 Mar | Evidence from Observations: Reported | |||||||||||||||||||||||
|
List of 3 Events for Episode 1
|
||||||||||||||||||||||||
1880 Feb - 1880 Jul Confirmed Eruption (Explosive / Effusive) VEI: 3
| Episode 1 | Eruption (Explosive / Effusive) | ||||||||||||||||||||||||||||||||||
|---|---|---|---|---|---|---|---|---|---|---|---|---|---|---|---|---|---|---|---|---|---|---|---|---|---|---|---|---|---|---|---|---|---|---|
| 1880 Feb - 1880 Jul | Evidence from Observations: Reported | |||||||||||||||||||||||||||||||||
|
List of 5 Events for Episode 1
|
||||||||||||||||||||||||||||||||||
1879 Feb 26 - 1879 Jun 19 Confirmed Eruption (Explosive / Effusive) VEI: 2
| Episode 1 | Eruption (Explosive / Effusive) | ||||||||||||||||||||||||
|---|---|---|---|---|---|---|---|---|---|---|---|---|---|---|---|---|---|---|---|---|---|---|---|---|
| 1879 Feb 26 - 1879 Jun 19 | Evidence from Observations: Reported | |||||||||||||||||||||||
|
List of 3 Events for Episode 1
|
||||||||||||||||||||||||
1878 Aug 23 - 1878 Aug 24 Confirmed Eruption (Explosive / Effusive) VEI: 2
| Episode 1 | Eruption (Explosive / Effusive) | ||||||||||||||||||||||||
|---|---|---|---|---|---|---|---|---|---|---|---|---|---|---|---|---|---|---|---|---|---|---|---|---|
| 1878 Aug 23 - 1878 Aug 24 | Evidence from Observations: Reported | |||||||||||||||||||||||
|
List of 3 Events for Episode 1
|
||||||||||||||||||||||||
1877 Jan - 1877 Sep 2 Confirmed Eruption (Explosive / Effusive) VEI: 4
| Episode 1 | Eruption (Explosive / Effusive) | ||||||||||||||||||||||||||||||||||||||||||||||||||||||||||||||||||||||||||||||||||||
|---|---|---|---|---|---|---|---|---|---|---|---|---|---|---|---|---|---|---|---|---|---|---|---|---|---|---|---|---|---|---|---|---|---|---|---|---|---|---|---|---|---|---|---|---|---|---|---|---|---|---|---|---|---|---|---|---|---|---|---|---|---|---|---|---|---|---|---|---|---|---|---|---|---|---|---|---|---|---|---|---|---|---|---|---|
| 1877 Jan - 1877 Sep 2 | Evidence from Observations: Reported | |||||||||||||||||||||||||||||||||||||||||||||||||||||||||||||||||||||||||||||||||||
|
List of 15 Events for Episode 1
|
||||||||||||||||||||||||||||||||||||||||||||||||||||||||||||||||||||||||||||||||||||
1870 - 1876 Confirmed Eruption (Explosive / Effusive) VEI: 2
| Episode 1 | Eruption (Explosive / Effusive) | |||||||||||||||||||
|---|---|---|---|---|---|---|---|---|---|---|---|---|---|---|---|---|---|---|---|
| 1870 - 1876 | Evidence from Observations: Reported | ||||||||||||||||||
|
List of 2 Events for Episode 1
|
|||||||||||||||||||
1869 Jul - 1869 Aug Confirmed Eruption (Explosive / Effusive) VEI: 3
| Episode 1 | Eruption (Explosive / Effusive) | |||||||||||||||||||
|---|---|---|---|---|---|---|---|---|---|---|---|---|---|---|---|---|---|---|---|
| 1869 Jul - 1869 Aug | Evidence from Observations: Reported | ||||||||||||||||||
|
List of 2 Events for Episode 1
|
|||||||||||||||||||
1868 Aug 15 - 1868 Aug 16 Confirmed Eruption (Explosive / Effusive) VEI: 2
| Episode 1 | Eruption (Explosive / Effusive) | |||||||||||||||||||
|---|---|---|---|---|---|---|---|---|---|---|---|---|---|---|---|---|---|---|---|
| 1868 Aug 15 - 1868 Aug 16 | Evidence from Observations: Reported | ||||||||||||||||||
|
List of 2 Events for Episode 1
|
|||||||||||||||||||
1867 Confirmed Eruption (Explosive / Effusive) VEI: 2
| Episode 1 | Eruption (Explosive / Effusive) | |||||||||||||||||||
|---|---|---|---|---|---|---|---|---|---|---|---|---|---|---|---|---|---|---|---|
| 1867 - Unknown | Evidence from Observations: Reported | ||||||||||||||||||
|
List of 2 Events for Episode 1
|
|||||||||||||||||||
1866 Sep 21 - 1866 Sep 26 Confirmed Eruption (Explosive / Effusive) VEI: 2
| Episode 1 | Eruption (Explosive / Effusive) | |||||||||||||||||||
|---|---|---|---|---|---|---|---|---|---|---|---|---|---|---|---|---|---|---|---|
| 1866 Sep 21 - 1866 Sep 26 | Evidence from Observations: Reported | ||||||||||||||||||
|
List of 2 Events for Episode 1
|
|||||||||||||||||||
1863 Confirmed Eruption (Explosive / Effusive) VEI: 2
| Episode 1 | Eruption (Explosive / Effusive) | |||||||||||||||||||||||||||||
|---|---|---|---|---|---|---|---|---|---|---|---|---|---|---|---|---|---|---|---|---|---|---|---|---|---|---|---|---|---|
| 1863 - Unknown | Evidence from Observations: Reported | ||||||||||||||||||||||||||||
|
List of 4 Events for Episode 1
|
|||||||||||||||||||||||||||||
1860 - 1862 Confirmed Eruption (Explosive / Effusive) VEI: 2
| Episode 1 | Eruption (Explosive / Effusive) | |||||||||||||||||||
|---|---|---|---|---|---|---|---|---|---|---|---|---|---|---|---|---|---|---|---|
| 1860 - 1862 | Evidence from Observations: Reported | ||||||||||||||||||
|
List of 2 Events for Episode 1
|
|||||||||||||||||||
1859 Confirmed Eruption (Explosive / Effusive) VEI: 2
| Episode 1 | Eruption (Explosive / Effusive) | |||||||||||||||||||
|---|---|---|---|---|---|---|---|---|---|---|---|---|---|---|---|---|---|---|---|
| 1859 - Unknown | Evidence from Observations: Reported | ||||||||||||||||||
|
List of 2 Events for Episode 1
|
|||||||||||||||||||
1858 Nov - 1858 Dec Confirmed Eruption (Explosive / Effusive) VEI: 2
| Episode 1 | Eruption (Explosive / Effusive) | |||||||||||||||||||||||||||||
|---|---|---|---|---|---|---|---|---|---|---|---|---|---|---|---|---|---|---|---|---|---|---|---|---|---|---|---|---|---|
| 1858 Nov - 1858 Dec | Evidence from Observations: Reported | ||||||||||||||||||||||||||||
|
List of 4 Events for Episode 1
|
|||||||||||||||||||||||||||||
1857 Confirmed Eruption (Explosive / Effusive) VEI: 2
| Episode 1 | Eruption (Explosive / Effusive) | |||||||||||||||||||
|---|---|---|---|---|---|---|---|---|---|---|---|---|---|---|---|---|---|---|---|
| 1857 - Unknown | Evidence from Observations: Reported | ||||||||||||||||||
|
List of 2 Events for Episode 1
|
|||||||||||||||||||
1856 Oct - 1856 Dec Confirmed Eruption (Explosive / Effusive) VEI: 2
| Episode 1 | Eruption (Explosive / Effusive) | |||||||||||||||||||||||||||||
|---|---|---|---|---|---|---|---|---|---|---|---|---|---|---|---|---|---|---|---|---|---|---|---|---|---|---|---|---|---|
| 1856 Oct - 1856 Dec | Evidence from Observations: Reported | ||||||||||||||||||||||||||||
|
List of 4 Events for Episode 1
|
|||||||||||||||||||||||||||||
1856 May Confirmed Eruption (Explosive / Effusive) VEI: 2
| Episode 1 | Eruption (Explosive / Effusive) | |||||||||||||||||||||||||||||
|---|---|---|---|---|---|---|---|---|---|---|---|---|---|---|---|---|---|---|---|---|---|---|---|---|---|---|---|---|---|
| 1856 May - Unknown | Evidence from Observations: Reported | ||||||||||||||||||||||||||||
|
List of 4 Events for Episode 1
|
|||||||||||||||||||||||||||||
1855 Nov Confirmed Eruption (Explosive / Effusive) VEI: 2
| Episode 1 | Eruption (Explosive / Effusive) | ||||||||||||||||||||||||||||||||||
|---|---|---|---|---|---|---|---|---|---|---|---|---|---|---|---|---|---|---|---|---|---|---|---|---|---|---|---|---|---|---|---|---|---|---|
| 1855 Nov - Unknown | Evidence from Observations: Reported | |||||||||||||||||||||||||||||||||
|
List of 5 Events for Episode 1
|
||||||||||||||||||||||||||||||||||
1854 Sep 14 Confirmed Eruption (Explosive / Effusive) VEI: 2
| Episode 1 | Eruption (Explosive / Effusive) | |||||||||||||||||||||||||||||
|---|---|---|---|---|---|---|---|---|---|---|---|---|---|---|---|---|---|---|---|---|---|---|---|---|---|---|---|---|---|
| 1854 Sep 14 - Unknown | Evidence from Observations: Reported | ||||||||||||||||||||||||||||
|
List of 4 Events for Episode 1
|
|||||||||||||||||||||||||||||
1854 Apr 3 Confirmed Eruption (Explosive / Effusive) VEI: 2
| Episode 1 | Eruption (Explosive / Effusive) | |||||||||||||||||||||||||||||
|---|---|---|---|---|---|---|---|---|---|---|---|---|---|---|---|---|---|---|---|---|---|---|---|---|---|---|---|---|---|
| 1854 Apr 3 - Unknown | Evidence from Observations: Reported | ||||||||||||||||||||||||||||
|
List of 4 Events for Episode 1
|
|||||||||||||||||||||||||||||
1853 Sep 13 - 1853 Sep 15 Confirmed Eruption (Explosive / Effusive) VEI: 3
| Episode 1 | Eruption (Explosive / Effusive) | ||||||||||||||||||||||||||||||||||
|---|---|---|---|---|---|---|---|---|---|---|---|---|---|---|---|---|---|---|---|---|---|---|---|---|---|---|---|---|---|---|---|---|---|---|
| 1853 Sep 13 - 1853 Sep 15 | Evidence from Observations: Reported | |||||||||||||||||||||||||||||||||
|
List of 5 Events for Episode 1
|
||||||||||||||||||||||||||||||||||
1852 Confirmed Eruption (Explosive / Effusive) VEI: 2
| Episode 1 | Eruption (Explosive / Effusive) | |||||||||||||||||||
|---|---|---|---|---|---|---|---|---|---|---|---|---|---|---|---|---|---|---|---|
| 1852 - Unknown | Evidence from Observations: Reported | ||||||||||||||||||
|
List of 2 Events for Episode 1
|
|||||||||||||||||||
1851 Jun Confirmed Eruption (Explosive / Effusive) VEI: 2
| Episode 1 | Eruption (Explosive / Effusive) | |||||||||||||||||||
|---|---|---|---|---|---|---|---|---|---|---|---|---|---|---|---|---|---|---|---|
| 1851 Jun - Unknown | Evidence from Observations: Reported | ||||||||||||||||||
|
List of 2 Events for Episode 1
|
|||||||||||||||||||
1850 Confirmed Eruption (Explosive / Effusive) VEI: 2
| Episode 1 | Eruption (Explosive / Effusive) | |||||||||||||||||||||||||||||
|---|---|---|---|---|---|---|---|---|---|---|---|---|---|---|---|---|---|---|---|---|---|---|---|---|---|---|---|---|---|
| 1850 - Unknown | Evidence from Observations: Reported | ||||||||||||||||||||||||||||
|
List of 4 Events for Episode 1
|
|||||||||||||||||||||||||||||
1845 Apr Confirmed Eruption (Explosive / Effusive) VEI: 2
| Episode 1 | Eruption (Explosive / Effusive) | |||||||||||||||||||
|---|---|---|---|---|---|---|---|---|---|---|---|---|---|---|---|---|---|---|---|
| 1845 Apr - Unknown | Evidence from Observations: Reported | ||||||||||||||||||
|
List of 2 Events for Episode 1
|
|||||||||||||||||||
1844 Confirmed Eruption (Explosive / Effusive) VEI: 2
| Episode 1 | Eruption (Explosive / Effusive) | |||||||||||||||||||
|---|---|---|---|---|---|---|---|---|---|---|---|---|---|---|---|---|---|---|---|
| 1844 - Unknown | Evidence from Observations: Reported | ||||||||||||||||||
|
List of 2 Events for Episode 1
|
|||||||||||||||||||
1803 Jan 4 - 1803 Jan 5 Confirmed Eruption (Explosive / Effusive) VEI: 3
| Episode 1 | Eruption (Explosive / Effusive) | ||||||||||||||||||||||||||||||||||
|---|---|---|---|---|---|---|---|---|---|---|---|---|---|---|---|---|---|---|---|---|---|---|---|---|---|---|---|---|---|---|---|---|---|---|
| 1803 Jan 4 - 1803 Jan 5 | Evidence from Observations: Reported | |||||||||||||||||||||||||||||||||
|
List of 5 Events for Episode 1
|
||||||||||||||||||||||||||||||||||
1768 Apr 4 Confirmed Eruption (Explosive / Effusive) VEI: 4
| Episode 1 | Eruption (Explosive / Effusive) | |||||||||||||||||||||||||||||||||||||||||||||||||||||||||||
|---|---|---|---|---|---|---|---|---|---|---|---|---|---|---|---|---|---|---|---|---|---|---|---|---|---|---|---|---|---|---|---|---|---|---|---|---|---|---|---|---|---|---|---|---|---|---|---|---|---|---|---|---|---|---|---|---|---|---|---|
| 1768 Apr 4 - Unknown | Evidence from Observations: Reported | ||||||||||||||||||||||||||||||||||||||||||||||||||||||||||
|
List of 10 Events for Episode 1
|
|||||||||||||||||||||||||||||||||||||||||||||||||||||||||||
1766 Feb 10 - 1766 Dec Confirmed Eruption (Explosive / Effusive) VEI: 3
| Episode 1 | Eruption (Explosive / Effusive) | ||||||||||||||||||||||||||||||||||
|---|---|---|---|---|---|---|---|---|---|---|---|---|---|---|---|---|---|---|---|---|---|---|---|---|---|---|---|---|---|---|---|---|---|---|
| 1766 Feb 10 - 1766 Dec | Evidence from Observations: Reported | |||||||||||||||||||||||||||||||||
|
List of 5 Events for Episode 1
|
||||||||||||||||||||||||||||||||||
1750 Sep 2 ± 1 days - 1750 Sep 4 ± 1 days Confirmed Eruption (Explosive / Effusive) VEI: 2
| Episode 1 | Eruption (Explosive / Effusive) | |||||||||||||||||||
|---|---|---|---|---|---|---|---|---|---|---|---|---|---|---|---|---|---|---|---|
| 1750 Sep 2 ± 1 days - 1750 Sep 4 ± 1 days | Evidence from Observations: Reported | ||||||||||||||||||
|
List of 2 Events for Episode 1
|
|||||||||||||||||||
1747 - 1749 Confirmed Eruption (Explosive / Effusive) VEI: 2
| Episode 1 | Eruption (Explosive / Effusive) | |||||||||||||||||||
|---|---|---|---|---|---|---|---|---|---|---|---|---|---|---|---|---|---|---|---|
| 1747 - 1749 | Evidence from Observations: Reported | ||||||||||||||||||
|
List of 2 Events for Episode 1
|
|||||||||||||||||||
1746 Feb Confirmed Eruption (Explosive / Effusive) VEI: 2
| Episode 1 | Eruption (Explosive / Effusive) | |||||||||||||||||||
|---|---|---|---|---|---|---|---|---|---|---|---|---|---|---|---|---|---|---|---|
| 1746 Feb - Unknown | Evidence from Observations: Reported | ||||||||||||||||||
|
List of 2 Events for Episode 1
|
|||||||||||||||||||
1744 May - 1744 Dec Confirmed Eruption (Explosive / Effusive) VEI: 4
| Episode 1 | Eruption (Explosive / Effusive) | |||||||||||||||||||||||||||||||||||||||||||||||||
|---|---|---|---|---|---|---|---|---|---|---|---|---|---|---|---|---|---|---|---|---|---|---|---|---|---|---|---|---|---|---|---|---|---|---|---|---|---|---|---|---|---|---|---|---|---|---|---|---|---|
| 1744 May - 1744 Dec | Evidence from Observations: Reported | ||||||||||||||||||||||||||||||||||||||||||||||||
|
List of 8 Events for Episode 1
|
|||||||||||||||||||||||||||||||||||||||||||||||||
1743 Sep 27 - 1743 Oct 4 Confirmed Eruption (Explosive / Effusive) VEI: 2
| Episode 1 | Eruption (Explosive / Effusive) | |||||||||||||||||||||||||||||
|---|---|---|---|---|---|---|---|---|---|---|---|---|---|---|---|---|---|---|---|---|---|---|---|---|---|---|---|---|---|
| 1743 Sep 27 - 1743 Oct 4 | Evidence from Observations: Reported | ||||||||||||||||||||||||||||
|
List of 4 Events for Episode 1
|
|||||||||||||||||||||||||||||
1743 Apr Confirmed Eruption (Explosive / Effusive) VEI: 3 (?)
| Episode 1 | Eruption (Explosive / Effusive) | ||||||||||||||||||||||||||||||||||
|---|---|---|---|---|---|---|---|---|---|---|---|---|---|---|---|---|---|---|---|---|---|---|---|---|---|---|---|---|---|---|---|---|---|---|
| 1743 Apr - Unknown | Evidence from Observations: Reported | |||||||||||||||||||||||||||||||||
|
List of 5 Events for Episode 1
|
||||||||||||||||||||||||||||||||||
1742 Dec 9 Confirmed Eruption (Explosive / Effusive) VEI: 3 (?)
| Episode 1 | Eruption (Explosive / Effusive) | |||||||||||||||||||||||||||||||||||||||
|---|---|---|---|---|---|---|---|---|---|---|---|---|---|---|---|---|---|---|---|---|---|---|---|---|---|---|---|---|---|---|---|---|---|---|---|---|---|---|---|
| 1742 Dec 9 - Unknown | Evidence from Observations: Reported | ||||||||||||||||||||||||||||||||||||||
|
List of 6 Events for Episode 1
|
|||||||||||||||||||||||||||||||||||||||
1742 Jun 15 - 1742 Jul Confirmed Eruption (Explosive / Effusive) VEI: 3 (?)
| Episode 1 | Eruption (Explosive / Effusive) | |||||||||||||||||||||||||||||||||||||||
|---|---|---|---|---|---|---|---|---|---|---|---|---|---|---|---|---|---|---|---|---|---|---|---|---|---|---|---|---|---|---|---|---|---|---|---|---|---|---|---|
| 1742 Jun 15 - 1742 Jul | Evidence from Observations: Reported | ||||||||||||||||||||||||||||||||||||||
|
List of 6 Events for Episode 1
|
|||||||||||||||||||||||||||||||||||||||
1740 - 1741 Confirmed Eruption (Explosive / Effusive) VEI: 2
| Episode 1 | Eruption (Explosive / Effusive) | |||||||||||||||||||
|---|---|---|---|---|---|---|---|---|---|---|---|---|---|---|---|---|---|---|---|
| 1740 - 1741 | Evidence from Observations: Reported | ||||||||||||||||||
|
List of 2 Events for Episode 1
|
|||||||||||||||||||
1738 Confirmed Eruption (Explosive / Effusive) VEI: 2
| Episode 1 | Eruption (Explosive / Effusive) | |||||||||||||||||||||||||||||
|---|---|---|---|---|---|---|---|---|---|---|---|---|---|---|---|---|---|---|---|---|---|---|---|---|---|---|---|---|---|
| 1738 - Unknown | Evidence from Observations: Reported | ||||||||||||||||||||||||||||
|
List of 4 Events for Episode 1
|
|||||||||||||||||||||||||||||
1698 Confirmed Eruption (Explosive / Effusive) VEI: 3 (?)
| Episode 1 | Eruption (Explosive / Effusive) | |||||||||||||||||||||||||||||||||||||||
|---|---|---|---|---|---|---|---|---|---|---|---|---|---|---|---|---|---|---|---|---|---|---|---|---|---|---|---|---|---|---|---|---|---|---|---|---|---|---|---|
| 1698 - Unknown | Evidence from Observations: Reported | ||||||||||||||||||||||||||||||||||||||
|
List of 6 Events for Episode 1
|
|||||||||||||||||||||||||||||||||||||||
1534 Jun - 1534 Jul Confirmed Eruption (Explosive / Effusive) VEI: 4
| Episode 1 | Eruption (Explosive / Effusive) | Tephra set MZ | |||||||||||||||||||||||||||||||||
|---|---|---|---|---|---|---|---|---|---|---|---|---|---|---|---|---|---|---|---|---|---|---|---|---|---|---|---|---|---|---|---|---|---|---|
| 1534 Jun - 1534 Jul | Evidence from Observations: Reported | |||||||||||||||||||||||||||||||||
|
List of 5 Events for Episode 1 at Tephra set MZ
|
||||||||||||||||||||||||||||||||||
1533 Oct - 1533 Nov Confirmed Eruption (Explosive / Effusive) VEI: 2
| Episode 1 | Eruption (Explosive / Effusive) | |||||||||||||||||||||||||||||
|---|---|---|---|---|---|---|---|---|---|---|---|---|---|---|---|---|---|---|---|---|---|---|---|---|---|---|---|---|---|
| 1533 Oct - 1533 Nov | Evidence from Observations: Reported | ||||||||||||||||||||||||||||
|
List of 4 Events for Episode 1
|
|||||||||||||||||||||||||||||
1532 Nov 15 Confirmed Eruption (Explosive / Effusive) VEI: 4
| Episode 1 | Eruption (Explosive / Effusive) | ||||||||||||||||||||||||||||||||||||||||||||
|---|---|---|---|---|---|---|---|---|---|---|---|---|---|---|---|---|---|---|---|---|---|---|---|---|---|---|---|---|---|---|---|---|---|---|---|---|---|---|---|---|---|---|---|---|
| 1532 Nov 15 - Unknown | Evidence from Observations: Reported | |||||||||||||||||||||||||||||||||||||||||||
|
List of 7 Events for Episode 1
|
||||||||||||||||||||||||||||||||||||||||||||
1350 (?) Confirmed Eruption (Explosive / Effusive) VEI: 4
| Episode 1 | Eruption (Explosive / Effusive) | Tephra layer Y4 | ||||||||||||||||||||||||||||
|---|---|---|---|---|---|---|---|---|---|---|---|---|---|---|---|---|---|---|---|---|---|---|---|---|---|---|---|---|---|
| 1350 (?) - Unknown | Evidence from Correlation: Tephrochronology | ||||||||||||||||||||||||||||
|
List of 4 Events for Episode 1 at Tephra layer Y4
|
|||||||||||||||||||||||||||||
1260 ± 150 years Confirmed Eruption (Explosive / Effusive)
| Episode 1 | Eruption (Explosive / Effusive) | ||||||||||||||||||||||||
|---|---|---|---|---|---|---|---|---|---|---|---|---|---|---|---|---|---|---|---|---|---|---|---|---|
| 1260 ± 150 years - Unknown | Evidence from Correlation: Tephrochronology | |||||||||||||||||||||||
|
List of 3 Events for Episode 1
|
||||||||||||||||||||||||
1130 ± 75 years Confirmed Eruption (Explosive / Effusive) VEI: 5
| Episode 1 | Eruption (Explosive / Effusive) | Tephra layer X | ||||||||||||||||||||||||||||
|---|---|---|---|---|---|---|---|---|---|---|---|---|---|---|---|---|---|---|---|---|---|---|---|---|---|---|---|---|---|
| 1130 ± 75 years - Unknown | Evidence from Isotopic: 14C (uncalibrated) | ||||||||||||||||||||||||||||
|
List of 4 Events for Episode 1 at Tephra layer X
|
|||||||||||||||||||||||||||||
0950 (?) Confirmed Eruption (Explosive / Effusive) VEI: 3
| Episode 1 | Eruption (Explosive / Effusive) | Tephra layer L2 | ||||||||||||||||||||||||||||
|---|---|---|---|---|---|---|---|---|---|---|---|---|---|---|---|---|---|---|---|---|---|---|---|---|---|---|---|---|---|
| 0950 (?) - Unknown | Evidence from Correlation: Tephrochronology | ||||||||||||||||||||||||||||
|
List of 4 Events for Episode 1 at Tephra layer L2
|
|||||||||||||||||||||||||||||
0770 ± 75 years Confirmed Eruption (Explosive / Effusive) VEI: 4
| Episode 1 | Eruption (Explosive / Effusive) | Tephra layer L1 | ||||||||||||||||||||||||||||||||||||||
|---|---|---|---|---|---|---|---|---|---|---|---|---|---|---|---|---|---|---|---|---|---|---|---|---|---|---|---|---|---|---|---|---|---|---|---|---|---|---|---|
| 0770 ± 75 years - Unknown | Evidence from Isotopic: 14C (uncalibrated) | ||||||||||||||||||||||||||||||||||||||
|
List of 6 Events for Episode 1 at Tephra layer L1
|
|||||||||||||||||||||||||||||||||||||||
0740 ± 75 years Confirmed Eruption (Explosive / Effusive) VEI: 4
| Episode 1 | Eruption (Explosive / Effusive) | Tephra layer Kb2 | ||||||||||||||||||||||||||||||||||||||
|---|---|---|---|---|---|---|---|---|---|---|---|---|---|---|---|---|---|---|---|---|---|---|---|---|---|---|---|---|---|---|---|---|---|---|---|---|---|---|---|
| 0740 ± 75 years - Unknown | Evidence from Isotopic: 14C (uncalibrated) | ||||||||||||||||||||||||||||||||||||||
|
List of 6 Events for Episode 1 at Tephra layer Kb2
|
|||||||||||||||||||||||||||||||||||||||
0550 ± 200 years Confirmed Eruption (Explosive / Effusive)
| Episode 1 | Eruption (Explosive / Effusive) | Tephra layer 10 | |||||||||||||||||||||||
|---|---|---|---|---|---|---|---|---|---|---|---|---|---|---|---|---|---|---|---|---|---|---|---|---|
| 0550 ± 200 years - Unknown | Evidence from Correlation: Tephrochronology | |||||||||||||||||||||||
|
List of 3 Events for Episode 1 at Tephra layer 10
|
||||||||||||||||||||||||
0370 ± 200 years Confirmed Eruption (Explosive / Effusive)
| Episode 1 | Eruption (Explosive / Effusive) | Tephra layer 11 | ||||||||||||||||||
|---|---|---|---|---|---|---|---|---|---|---|---|---|---|---|---|---|---|---|---|
| 0370 ± 200 years - Unknown | Evidence from Correlation: Tephrochronology | ||||||||||||||||||
|
List of 2 Events for Episode 1 at Tephra layer 11
|
|||||||||||||||||||
0180 ± 100 years Confirmed Eruption (Explosive / Effusive) VEI: 4
| Episode 1 | Eruption (Explosive / Effusive) | Tephra layer Kb2 | |||||||||||||||||||||||||||||||||
|---|---|---|---|---|---|---|---|---|---|---|---|---|---|---|---|---|---|---|---|---|---|---|---|---|---|---|---|---|---|---|---|---|---|---|
| 0180 ± 100 years - Unknown | Evidence from Isotopic: 14C (uncalibrated) | |||||||||||||||||||||||||||||||||
|
List of 5 Events for Episode 1 at Tephra layer Kb2
|
||||||||||||||||||||||||||||||||||
0150 (?) Confirmed Eruption (Explosive / Effusive) VEI: 4
| Episode 1 | Eruption (Explosive / Effusive) | Tephra layer Ka2 | |||||||||||||||||||||||
|---|---|---|---|---|---|---|---|---|---|---|---|---|---|---|---|---|---|---|---|---|---|---|---|---|
| 0150 (?) - Unknown | Evidence from Correlation: Tephrochronology | |||||||||||||||||||||||
|
List of 3 Events for Episode 1 at Tephra layer Ka2
|
||||||||||||||||||||||||
0070 ± 150 years Confirmed Eruption (Explosive / Effusive) VEI: 4
| Episode 1 | Eruption (Explosive / Effusive) | Tephra layer Ka1 | ||||||||||||||||||||||||||||||||||||||
|---|---|---|---|---|---|---|---|---|---|---|---|---|---|---|---|---|---|---|---|---|---|---|---|---|---|---|---|---|---|---|---|---|---|---|---|---|---|---|---|
| 0070 ± 150 years - Unknown | Evidence from Isotopic: 14C (uncalibrated) | ||||||||||||||||||||||||||||||||||||||
|
List of 6 Events for Episode 1 at Tephra layer Ka1
|
|||||||||||||||||||||||||||||||||||||||
0050 BCE (?) Confirmed Eruption (Explosive / Effusive) VEI: 3
| Episode 1 | Eruption (Explosive / Effusive) | Tephra layer JK | ||||||||||||||||||||||||||||
|---|---|---|---|---|---|---|---|---|---|---|---|---|---|---|---|---|---|---|---|---|---|---|---|---|---|---|---|---|---|
| 0050 BCE (?) - Unknown | Evidence from Correlation: Tephrochronology | ||||||||||||||||||||||||||||
|
List of 4 Events for Episode 1 at Tephra layer JK
|
|||||||||||||||||||||||||||||
0230 BCE ± 200 years Confirmed Eruption (Explosive / Effusive) VEI: 4
| Episode 1 | Eruption (Explosive / Effusive) | Tephra layer JJ | ||||||||||||||||||||||||||||
|---|---|---|---|---|---|---|---|---|---|---|---|---|---|---|---|---|---|---|---|---|---|---|---|---|---|---|---|---|---|
| 0230 BCE ± 200 years - Unknown | Evidence from Isotopic: 14C (uncalibrated) | ||||||||||||||||||||||||||||
|
List of 4 Events for Episode 1 at Tephra layer JJ
|
|||||||||||||||||||||||||||||
0400 BCE (?) Confirmed Eruption (Explosive / Effusive) VEI: 4
| Episode 1 | Eruption (Explosive / Effusive) | Tephra layer J | |||||||||||||||||||||||
|---|---|---|---|---|---|---|---|---|---|---|---|---|---|---|---|---|---|---|---|---|---|---|---|---|
| 0400 BCE (?) - Unknown | Evidence from Correlation: Tephrochronology | |||||||||||||||||||||||
|
List of 3 Events for Episode 1 at Tephra layer J
|
||||||||||||||||||||||||
1050 BCE (?) Confirmed Eruption (Explosive / Effusive) VEI: 4
| Episode 1 | Eruption (Explosive / Effusive) | Tephra layer I2 | |||||||||||||||||||||||||||||||||
|---|---|---|---|---|---|---|---|---|---|---|---|---|---|---|---|---|---|---|---|---|---|---|---|---|---|---|---|---|---|---|---|---|---|---|
| 1050 BCE (?) - Unknown | Evidence from Correlation: Tephrochronology | |||||||||||||||||||||||||||||||||
|
List of 5 Events for Episode 1 at Tephra layer I2
|
||||||||||||||||||||||||||||||||||
1510 BCE ± 150 years Confirmed Eruption (Explosive / Effusive)
| Episode 1 | Eruption (Explosive / Effusive) | ||||||||||||||||||||||||
|---|---|---|---|---|---|---|---|---|---|---|---|---|---|---|---|---|---|---|---|---|---|---|---|---|
| 1510 BCE ± 150 years - Unknown | Evidence from Isotopic: 14C (uncalibrated) | |||||||||||||||||||||||
|
List of 3 Events for Episode 1
|
||||||||||||||||||||||||
2050 BCE (?) Confirmed Eruption (Explosive / Effusive) VEI: 5
| Episode 1 | Eruption (Explosive / Effusive) | Tephra layers I1 | ||||||||||||||||||||||||||||
|---|---|---|---|---|---|---|---|---|---|---|---|---|---|---|---|---|---|---|---|---|---|---|---|---|---|---|---|---|---|
| 2050 BCE (?) - Unknown | Evidence from Correlation: Tephrochronology | ||||||||||||||||||||||||||||
|
List of 4 Events for Episode 1 at Tephra layers I1
|
|||||||||||||||||||||||||||||
2220 BCE ± 100 years Confirmed Eruption (Explosive / Effusive)
| Episode 1 | Eruption (Explosive / Effusive) | Tephra set H | |||||||||||||||||||||||||||||||||
|---|---|---|---|---|---|---|---|---|---|---|---|---|---|---|---|---|---|---|---|---|---|---|---|---|---|---|---|---|---|---|---|---|---|---|
| 2220 BCE ± 100 years - Unknown | Evidence from Isotopic: 14C (uncalibrated) | |||||||||||||||||||||||||||||||||
|
List of 5 Events for Episode 1 at Tephra set H
|
||||||||||||||||||||||||||||||||||
2250 BCE Confirmed Eruption (Explosive / Effusive)
| Episode 1 | Eruption (Explosive / Effusive) | ||||||||||||||
|---|---|---|---|---|---|---|---|---|---|---|---|---|---|---|
| 2250 BCE - Unknown | Evidence from Correlation: Tephrochronology | |||||||||||||
|
List of 1 Events for Episode 1
|
||||||||||||||
2640 BCE ± 200 years Confirmed Eruption (Explosive / Effusive) VEI: 5
| Episode 1 | Eruption (Explosive / Effusive) | Colorado Canyon tephra set | ||||||||||||||||||||||||||||||||||||||||||||||||
|---|---|---|---|---|---|---|---|---|---|---|---|---|---|---|---|---|---|---|---|---|---|---|---|---|---|---|---|---|---|---|---|---|---|---|---|---|---|---|---|---|---|---|---|---|---|---|---|---|---|
| 2640 BCE ± 200 years - Unknown | Evidence from Isotopic: 14C (uncalibrated) | ||||||||||||||||||||||||||||||||||||||||||||||||
|
List of 8 Events for Episode 1 at Colorado Canyon tephra set
|
|||||||||||||||||||||||||||||||||||||||||||||||||
3280 BCE ± 500 years Confirmed Eruption (Explosive / Effusive) VEI: 5
| Episode 1 | Eruption (Explosive / Effusive) | Tephra set F-5 | |||||||||||||||||||||||||||||||||||||||||||||||||||||
|---|---|---|---|---|---|---|---|---|---|---|---|---|---|---|---|---|---|---|---|---|---|---|---|---|---|---|---|---|---|---|---|---|---|---|---|---|---|---|---|---|---|---|---|---|---|---|---|---|---|---|---|---|---|---|
| 3280 BCE ± 500 years - Unknown | Evidence from Correlation: Tephrochronology | |||||||||||||||||||||||||||||||||||||||||||||||||||||
|
List of 9 Events for Episode 1 at Tephra set F-5
|
||||||||||||||||||||||||||||||||||||||||||||||||||||||
3880 BCE ± 75 years Confirmed Eruption (Explosive / Effusive) VEI: 5
| Episode 1 | Eruption (Explosive / Effusive) | Tephra set F-4 | ||||||||||||||||||||||||||||||||||||||||||||||||
|---|---|---|---|---|---|---|---|---|---|---|---|---|---|---|---|---|---|---|---|---|---|---|---|---|---|---|---|---|---|---|---|---|---|---|---|---|---|---|---|---|---|---|---|---|---|---|---|---|---|
| 3880 BCE ± 75 years - Unknown | Evidence from Isotopic: 14C (uncalibrated) | ||||||||||||||||||||||||||||||||||||||||||||||||
|
List of 8 Events for Episode 1 at Tephra set F-4
|
|||||||||||||||||||||||||||||||||||||||||||||||||
4350 BCE ± 75 years Confirmed Eruption (Explosive / Effusive) VEI: 5
| Episode 1 | Eruption (Explosive / Effusive) | Tephra set F-3 | ||||||||||||||||||||||||||||||||||||||
|---|---|---|---|---|---|---|---|---|---|---|---|---|---|---|---|---|---|---|---|---|---|---|---|---|---|---|---|---|---|---|---|---|---|---|---|---|---|---|---|
| 4350 BCE ± 75 years - Unknown | Evidence from Isotopic: 14C (uncalibrated) | ||||||||||||||||||||||||||||||||||||||
|
List of 6 Events for Episode 1 at Tephra set F-3
|
|||||||||||||||||||||||||||||||||||||||
5820 BCE ± 75 years Confirmed Eruption (Explosive / Effusive) VEI: 5
| Episode 1 | Eruption (Explosive / Effusive) | Tephra set F-2 | ||||||||||||||||||||||||||||||||||||||
|---|---|---|---|---|---|---|---|---|---|---|---|---|---|---|---|---|---|---|---|---|---|---|---|---|---|---|---|---|---|---|---|---|---|---|---|---|---|---|---|
| 5820 BCE ± 75 years - Unknown | Evidence from Isotopic: 14C (uncalibrated) | ||||||||||||||||||||||||||||||||||||||
|
List of 6 Events for Episode 1 at Tephra set F-2
|
|||||||||||||||||||||||||||||||||||||||
7690 BCE ± 75 years Confirmed Eruption (Explosive / Effusive) VEI: 2
| Episode 1 | Eruption (Explosive / Effusive) | Tephra set F-1 | ||||||||||||||||||||||||||||||||||||||
|---|---|---|---|---|---|---|---|---|---|---|---|---|---|---|---|---|---|---|---|---|---|---|---|---|---|---|---|---|---|---|---|---|---|---|---|---|---|---|---|
| 7690 BCE ± 75 years - Unknown | Evidence from Isotopic: 14C (uncalibrated) | ||||||||||||||||||||||||||||||||||||||
|
List of 6 Events for Episode 1 at Tephra set F-1
|
|||||||||||||||||||||||||||||||||||||||
This compilation of synonyms and subsidiary features may not be comprehensive. Features are organized into four major categories: Cones, Craters, Domes, and Thermal Features. Synonyms of features appear indented below the primary name. In some cases additional feature type, elevation, or location details are provided.
Cones |
||||
| Feature Name | Feature Type | Elevation | Latitude | Longitude |
| Callo, Cerrito del | Cone | 3183 m | 0° 43' 0.00" S | 78° 35' 0.00" W |
Domes |
||||
| Feature Name | Feature Type | Elevation | Latitude | Longitude |
| Morucu | Dome | |||
| Santa Barbara | Dome | |||
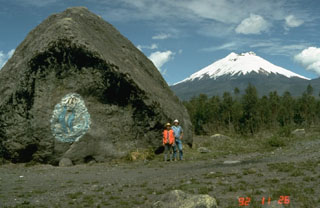 This massive boulder on the SW side of Cotopaxi was carried in a lahar, possibly during a major eruption in 1877. Scale is provided by volcanologists Minard Hall and Patty Mothes. More than 130,000 people live in areas subject to lahar risk from Cotopaxi. The 1877 eruption produced lahars that covered this valley, swept into eastern river drainages, and reached the Pacific Ocean along valleys to the NW.
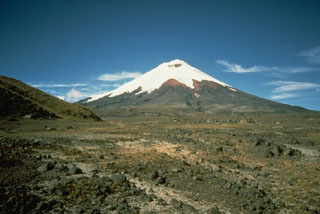 The foreground of this flat valley north of Cotopaxi volcano is the top of the deposit produced by a massive lahar from the volcano in 1877. During this eruption, one of the largest from Cotopaxi during historical time, pyroclastic flows descended all sides of the volcano, creating devastating lahars. The lahar that produced this deposit eventually traveled north down the Guayllabamba River past Quito to reach the Pacific Ocean at Esmeraldas, 225 km NW of Cotopaxi. Mudflows also swept down valleys south and east into the western Amazon basin.
 Symmetrical Cotopaxi is one of the most prominent volcanoes that line both sides of the Interandean valley along Ecuador's "Avenue of Volcanoes." Cotopaxi, one of Ecuador's most active volcanoes, has produced more than 50 eruptions since the 16th century. Glaciers cover the upper part of the cone from 4700 m altitude on the west flank, seen here, to the 5911-m-high summit. Devastating lahars in historical time swept this valley before turning south and then east into the Amazon basin. Lahars to the NW reached the Pacific Ocean.
 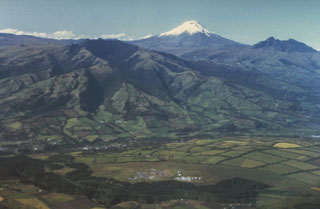 Snow-capped Cotopaxi volcano towers above the Interandean valley, forming one of Ecuador's most familiar landmarks. The older Pleistocene volcanoes of Pasochoa (left center) and Rumiñahui (extreme right) appear in the foreground of this aerial view from the NW. Cotopaxi is one of Ecuador's most active volcanoes, having erupted more than 50 times since the 16th century.
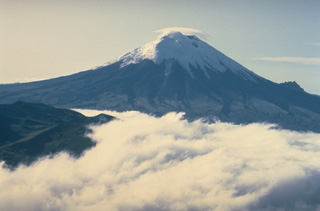 A combination of frequent eruptions, a high water budget locked up in its summit icecap, and its location atop the topographic axis of the Ecuadorian Andes make Cotopaxi a prime source of lahars (volcanic mudflows). During historical time, lahars have swept drainages to the north along the Río Pita and Río Guayllabamba all the way to the Pacific Ocean and into the western Amazon basin down the Río Cutuchi to the SW and the Río Napo to the east. More than 130,000 people occupy areas subject to lahar risk from Cotopaxi.
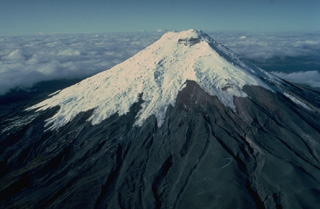 The symmetrical, glacier-clad Cotopaxi stratovolcano is Ecuador's best known volcano and one of its most active. The steep-sided cone, seen here in an aerial view from the north, is capped by nested summit craters 650 x 800 m in diameter. Lahars accompanying explosive eruptions of Cotopaxi have frequently devastated adjacent valleys. In 1877, during one of the largest historical eruptions, pyroclastic flows descended all sides of the volcano and lahars traveled more than 200 km into the Pacific Ocean and the western Amazon basin.
 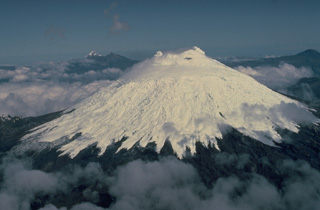 Glacier-clad Cotopaxi volcano is seen here from the SE, with twin-peaked Illiniza volcano in the distance left of the summit. Cotopaxi is one of Ecuador's most active volcanoes and has erupted more than 50 times since its first historical eruption in the 16th century. The upper 1400 m of the volcano is ice covered, which has contributed to the production of lahars that have devastated valleys far beyond the volcano.
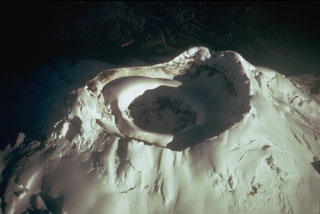 The glacier-capped summit of Ecuador's Cotopaxi volcano has two nested summit craters. The outer crater, seen here from the SE, is 550 x 800 m wide. A cone that grew inside this crater contains a smaller crater that is 250 m wide and 120 m deep. Frequent explosive eruptions during historical time have modified the shape of the summit crater. In 1903 the outer crater was 450 m deep.
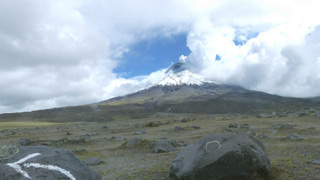 An eruption at Volcán Cotopaxi began on 14 August 2015 with a series of phreatic explosions in the crater, seen here from the N in December 2015 with ash deposits across the summit area. Explosive activity continued throughout August with continuous ash-and-gas emissions that declined towards the end of September 2015. Degassing at the summit produces the plume rises towards the towards the NW.
There are no samples for Cotopaxi in the Smithsonian's NMNH Department of Mineral Sciences Rock and Ore collection.
| Copernicus Browser | The Copernicus Browser replaced the Sentinel Hub Playground browser in 2023, to provide access to Earth observation archives from the Copernicus Data Space Ecosystem, the main distribution platform for data from the EU Copernicus missions. |
| MIROVA | Middle InfraRed Observation of Volcanic Activity (MIROVA) is a near real time volcanic hot-spot detection system based on the analysis of MODIS (Moderate Resolution Imaging Spectroradiometer) data. In particular, MIROVA uses the Middle InfraRed Radiation (MIR), measured over target volcanoes, in order to detect, locate and measure the heat radiation sourced from volcanic activity. |
| MODVOLC Thermal Alerts | Using infrared satellite Moderate Resolution Imaging Spectroradiometer (MODIS) data, scientists at the Hawai'i Institute of Geophysics and Planetology, University of Hawai'i, developed an automated system called MODVOLC to map thermal hot-spots in near real time. For each MODIS image, the algorithm automatically scans each 1 km pixel within it to check for high-temperature hot-spots. When one is found the date, time, location, and intensity are recorded. MODIS looks at every square km of the Earth every 48 hours, once during the day and once during the night, and the presence of two MODIS sensors in space allows at least four hot-spot observations every two days. Each day updated global maps are compiled to display the locations of all hot spots detected in the previous 24 hours. There is a drop-down list with volcano names which allow users to 'zoom-in' and examine the distribution of hot-spots at a variety of spatial scales. |
|
WOVOdat
Single Volcano View Temporal Evolution of Unrest Side by Side Volcanoes |
WOVOdat is a database of volcanic unrest; instrumentally and visually recorded changes in seismicity, ground deformation, gas emission, and other parameters from their normal baselines. It is sponsored by the World Organization of Volcano Observatories (WOVO) and presently hosted at the Earth Observatory of Singapore.
GVMID Data on Volcano Monitoring Infrastructure The Global Volcano Monitoring Infrastructure Database GVMID, is aimed at documenting and improving capabilities of volcano monitoring from the ground and space. GVMID should provide a snapshot and baseline view of the techniques and instrumentation that are in place at various volcanoes, which can be use by volcano observatories as reference to setup new monitoring system or improving networks at a specific volcano. These data will allow identification of what monitoring gaps exist, which can be then targeted by remote sensing infrastructure and future instrument deployments. |
| Volcanic Hazard Maps | The IAVCEI Commission on Volcanic Hazards and Risk has a Volcanic Hazard Maps database designed to serve as a resource for hazard mappers (or other interested parties) to explore how common issues in hazard map development have been addressed at different volcanoes, in different countries, for different hazards, and for different intended audiences. In addition to the comprehensive, searchable Volcanic Hazard Maps Database, this website contains information about diversity of volcanic hazard maps, illustrated using examples from the database. This site is for educational purposes related to volcanic hazard maps. Hazard maps found on this website should not be used for emergency purposes. For the most recent, official hazard map for a particular volcano, please seek out the proper institutional authorities on the matter. |
| IRIS seismic stations/networks | Incorporated Research Institutions for Seismology (IRIS) Data Services map showing the location of seismic stations from all available networks (permanent or temporary) within a radius of 0.18° (about 20 km at mid-latitudes) from the given location of Cotopaxi. Users can customize a variety of filters and options in the left panel. Note that if there are no stations are known the map will default to show the entire world with a "No data matched request" error notice. |
| UNAVCO GPS/GNSS stations | Geodetic Data Services map from UNAVCO showing the location of GPS/GNSS stations from all available networks (permanent or temporary) within a radius of 20 km from the given location of Cotopaxi. Users can customize the data search based on station or network names, location, and time window. Requires Adobe Flash Player. |
| DECADE Data | The DECADE portal, still in the developmental stage, serves as an example of the proposed interoperability between The Smithsonian Institution's Global Volcanism Program, the Mapping Gas Emissions (MaGa) Database, and the EarthChem Geochemical Portal. The Deep Earth Carbon Degassing (DECADE) initiative seeks to use new and established technologies to determine accurate global fluxes of volcanic CO2 to the atmosphere, but installing CO2 monitoring networks on 20 of the world's 150 most actively degassing volcanoes. The group uses related laboratory-based studies (direct gas sampling and analysis, melt inclusions) to provide new data for direct degassing of deep earth carbon to the atmosphere. |
| Large Eruptions of Cotopaxi | Information about large Quaternary eruptions (VEI >= 4) is cataloged in the Large Magnitude Explosive Volcanic Eruptions (LaMEVE) database of the Volcano Global Risk Identification and Analysis Project (VOGRIPA). |
| EarthChem | EarthChem develops and maintains databases, software, and services that support the preservation, discovery, access and analysis of geochemical data, and facilitate their integration with the broad array of other available earth science parameters. EarthChem is operated by a joint team of disciplinary scientists, data scientists, data managers and information technology developers who are part of the NSF-funded data facility Integrated Earth Data Applications (IEDA). IEDA is a collaborative effort of EarthChem and the Marine Geoscience Data System (MGDS). |

