Observations at La Palma on 15 December showed no lava flowing from vents at the W base of the main cone, from tubes, or at the lava delta in the Las Hoyas area. During 15-20 December tremor levels were at background levels and seismicity was very low at all depths. Sporadic gas emissions rose from the vents and from cooling lava flows. Small collapses from the walls of the main and secondary cone craters were visible through the week. Sulfur dioxide levels varied between extremely low and medium values (less than 5 to 999 tons per day) consistent with a cooling and degassing lava flow field. Even though air quality levels had improved overall, a few measurements of diffuse carbon dioxide emissions showed levels around 9 times average background. Authorities warned the public to exercise caution in areas surrounding the flow field due to volcanic gases in the area and noted that lava flows, although cooling, remained at high temperatures.
Sources: Instituto Volcanológico de Canarias (INVOLCAN), Gobierno de Canaries, Instituto Geográfico Nacional (IGN)
Phreatomagmatic and Strombolian activity, lava effusion, and ash plumes through mid-December 2021
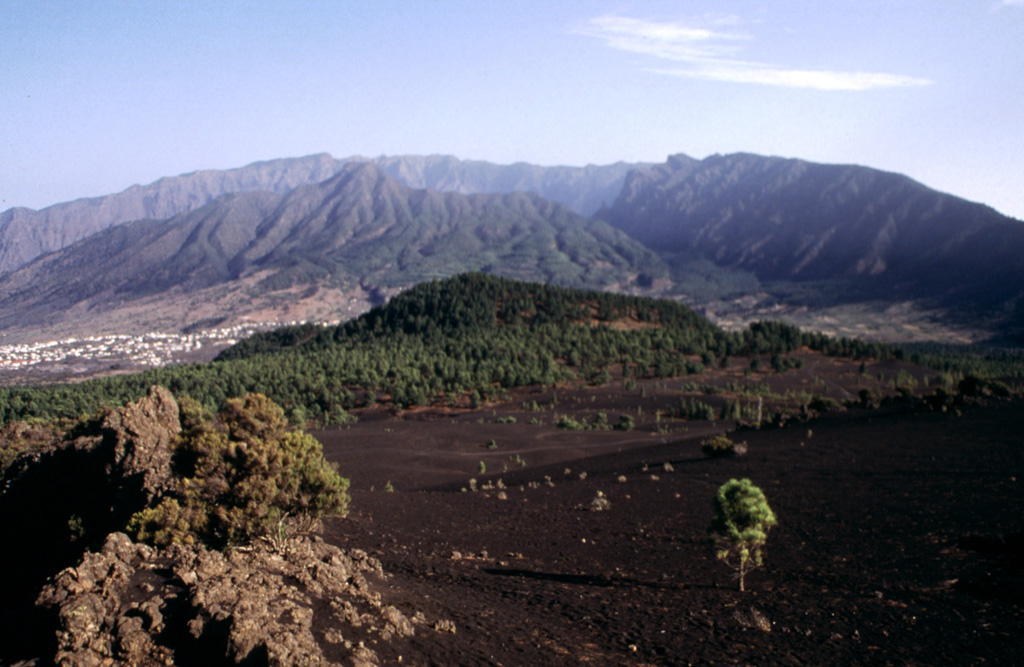
La Palma is a 47-km-long island at the northwestern end of the Canary Islands. It is composed of two large volcanic centers, with the younger Cumbre Vieja to the south dating back 125,000 years. Multiple eruptions during the last 7,000 years have produced mild explosive activity and lava flows which have damaged populated areas and reached the sea in 1585, 1646, 1712, 1949, and 1971. A new eruption from the SW flank began on 19 September 2021, roughly 20 km NW of the site of the 1971 eruption. Two fissures opened and multiple vents produced lava fountains, flows, and ash plumes; the flows traveled over 5 km to the W toward the coastline, eventually extending further into the ocean, damaging buildings and crops (BGVN 46:10). Information in this report describing lava fountains, flows, and ash plumes through the end of the eruption comes from Spain’s Instituto Geographico Nacional (IGN), the Instituto Volcanologico de Canarias (INVOLCAN), the Steering Committee of the Special Plan for Civil Protection and Attention to Emergencies due to Volcanic Risk (PEVOLCA), maps from Copernicus EMS, satellite data, and news and social media reports covering October through December 2021.
Summary of activity during October-December 2021. Strong eruptive activity that began on 19 September continued throughout most of this reporting period. During October, more than 3,000 earthquakes were detected in the southern part of the island and ash plumes rose as high as 5.5 km altitude, according to the Toulouse VAAC. Lava flows emerged from two new vents and moved W toward the coastline, affecting 3,063 buildings, of which 2,896 were destroyed. (figure 31). The lava flow field continued to expand through the eruption (table 2). There were a total of 11 flows numbered during this reporting period. Flow 2, located between the main flow (Flow 1), had reached the sea on 21 September. Lava, including bombs, were ejected as far as 800 m from the vent. Lava fountains rose hundreds of meters high and collapses of the crater walls were common. Similar activity was reported in November, with frequent earthquakes, ash plumes that rose to 4.6 km altitude, ejecta, and multiple lava effusions, some of which reached the coastline and formed a lava delta. Several thousand people were evacuated. During December, the number of earthquakes detected, and ash plumes was notably lower. An ash plume on 13 December rose as high as 7.5 km altitude, but overall, they were lower compared to the previous months. Strong lava effusion persisted during the first half of the month, some of which continued to feed the lava deltas on the coast. By mid-December, activity had mostly subsided, with only some incandescence, weak lava flows, and low gas-and-ash plumes. Sulfur dioxide emissions were consistently detected until mid-December.
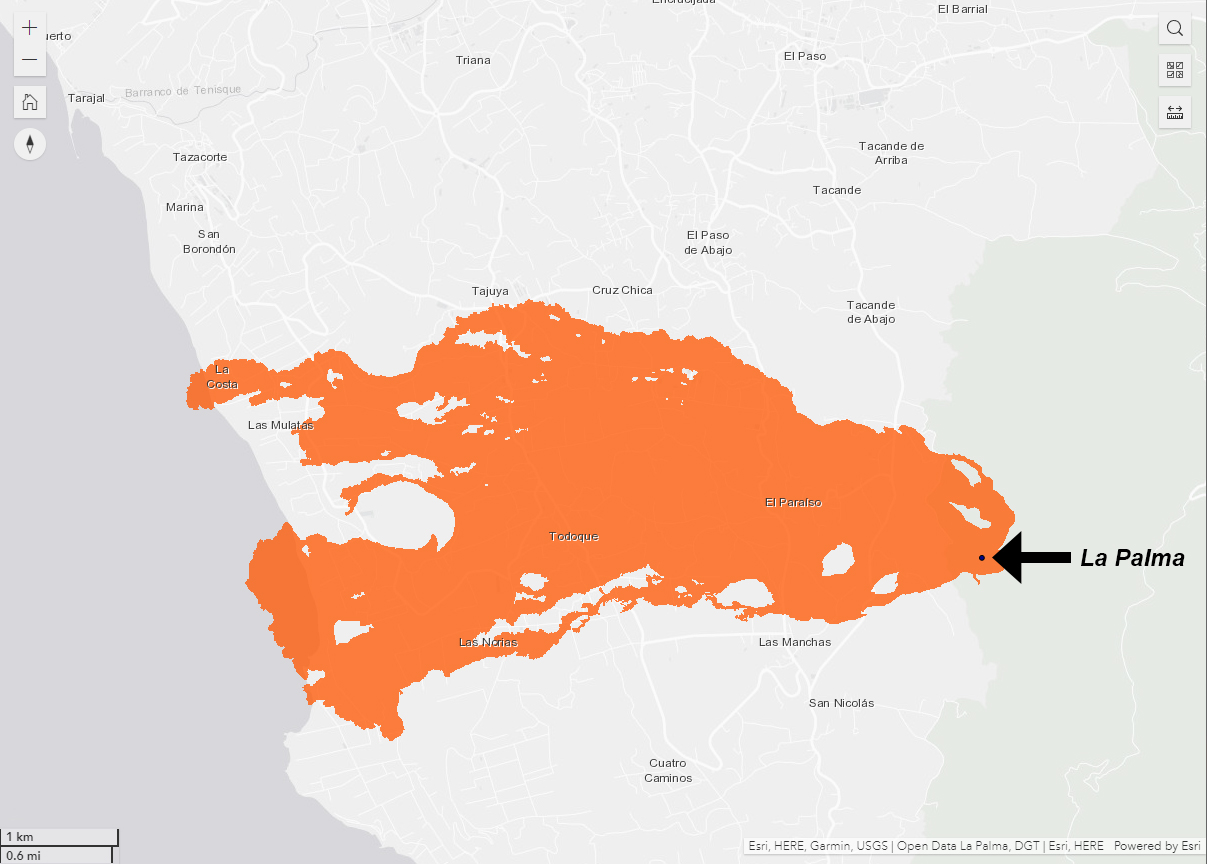 |
Figure 31. Simplified location map showing the lava flows generated from the La Palma eruption taken from drone data on 15 December 2021. The black dot represents the vent, and the orange area is the lava coverage that moved generally W. The names of the affected nearby towns are also included. Courtesy of Dirección General de Tráfico. |
Table 2. Summary of the growth of the lava flow field at La Palma between October and December 2021, listing the width of the field (m) and the covered area (km2). Area values were rounded up to the nearest tenth. Data courtesy of PEVOLCA.
| Date | Width (m) | Area (km2) |
| 04 Oct 2021 | 1,250 | 4.1 |
| 08 Oct 2021 | 1,250 | 4.7 |
| 10 Oct 2021 | 1,520 | 5.3 |
| 11 Oct 2021 | 1,520 | 5.9 |
| 12 Oct 2021 | -- | 6.1 |
| 13 Oct 2021 | 1,770 | 6.4 |
| 16 Oct 2021 | 2,350 | 7.2 |
| 17 Oct 2021 | 2,350 | 7.4 |
| 19 Oct 2021 | 2,900 | 7.8 |
| 20 Oct 2021 | 2,900 | 8.0 |
| 22 Oct 2021 | 2,900 | 8.5 |
| 26 Oct 2021 | -- | 8.8 |
| 03 Nov 2021 | 3,100 | 9.8 |
| 09 Nov 2021 | 3,100 | 9.9 |
| 11 Nov 2021 | 3,100 | 10.1 |
| 13 Nov 2021 | 3,100 | 10.2 |
| 16 Nov 2021 | 3,200 | 10.3 |
| 23 Nov 2021 | 3,300 | 10.7 |
| 24 Nov 2021 | 3,300 | 10.9 |
| 25 Nov 2021 | 3,350 | 11.0 |
| 27 Nov 2021 | -- | 11.5 |
| 30 Nov 2021 | 3,350 | 11.3 |
| 02 Dec 2021 | 3,350 | 11.4 |
| 05 Dec 2021 | 3,350 | 11.6 |
| 07 Dec 2021 | 3,350 | 11.8 |
| 14 Dec 2021 | 3,350 | 12.0 |
| 25 Dec 2021 | -- | 12.2 |
Activity during October 2021. Frequent earthquakes were detected during October (a total of 3,416 on the island of La Palma), 635 of which were felt by the nearby communities; most were located 10-15 km deep in the SE area of the island where the swarm had initiated in early September, though some were recorded at depths greater than 30 km (figure 32). The strongest events, magnitude 5.0, occurred on 30 and 31 October at depths of 35 and 38 km, respectively.
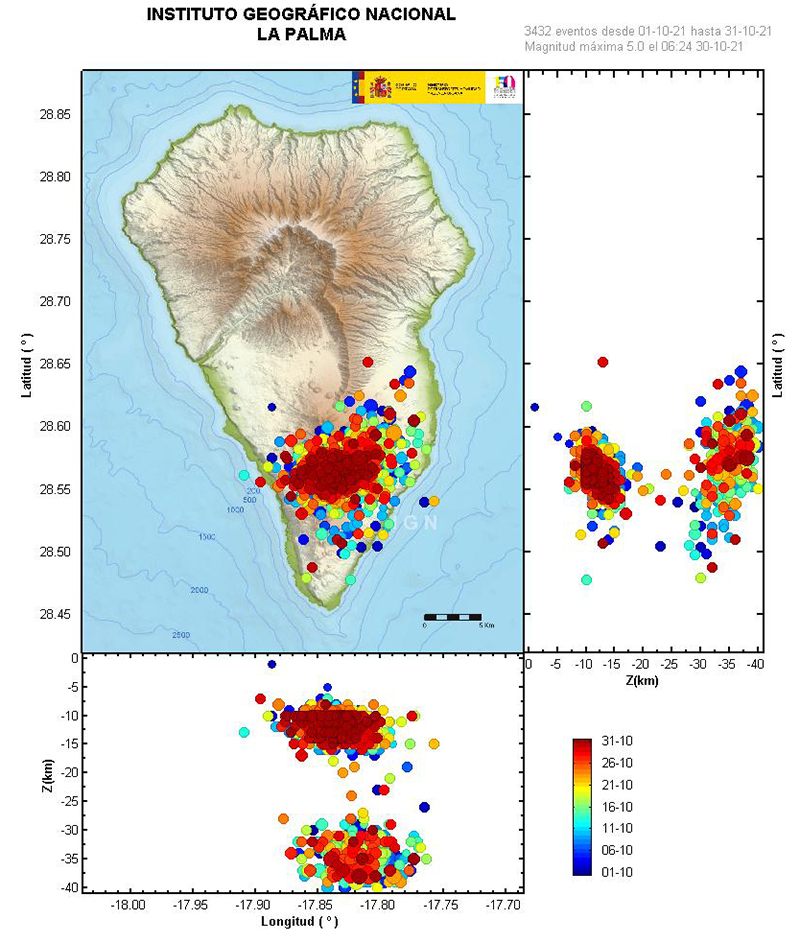 |
Figure 32. Map of seismic events at La Palma showing the location of earthquakes on the SE part of the island during 1-31 October 2021, which remained in the same location as those detected on 11 September 2021. The depths of these events range up to 40 km. The color bar on the right represents the dates of the seismic events beginning on 1 October. Courtesy of IGN (Actualización de la información sobre la actividad volcánica en el sur de la isla de La Palma). |
The Toulouse VAAC issued 320 volcanic ash advisories (VAA) for aviation during the reporting period, based on data from satellite imagery and webcams. During October, 132 VAAs described ongoing ash emissions that reached 1.8-5.5 km altitude and drifted up to 185 km in different directions. Some ashfall deposits were reported near the volcano.
By 1 October, roughly 80 million cubic meters of lava had been erupted. Two vents opened about 600 m NW from the main cone on 1 October, forming small cones within two days. Lava from these vents traveled W, then connected with the main flow field downslope. Explosions ejected centimeter-sized material as far as 3.3 km from the cone, and ash and lapilli deposits were reported in areas downwind. The lava flow had extended 540 m beyond the original coastline. Based on satellite images from Copernicus, more than 1,000 buildings had been destroyed in El Pason, Los Llanos de Aridane, and Tazacorte. Ash plumes rose to 3-5 km altitude and drifted S on 2 October.
By 3 October the width of the lava flow field was a maximum of 1,250 m and lava tubes were identified in satellite images. The lava flow had developed four lobes that were fed by multiple lava flows and had an estimated area of 4.1 km2. In the afternoon, the frequency and intensity of the explosions ejected bombs as far as 800 m. Lava fountains rose hundreds of meters high. During 1900-1945 one of the new cones collapsed and spilled into the inner lava lake; lava flows traveled downslope carrying blocks from the destroyed parts of the cone. By 5 October the volume of erupted lava was estimated to be 35 million cubic meters, according to INVOLCAN.
On 6 October a breakout lava flow from the W end of the main flow field traveled S between Los Guirres and El Charcó, destroying crops and buildings (figure 33). On 8 October a new vent had formed on the main cone as ash plumes rose as high as 3.5 km altitude and lightning was occasionally visible; ash deposits at the La Palma and Tenerife North (on Tenerife Island) airports caused a temporary shutdown. The N part of the cone collapsed on 9 October, generating a wide, multi-lobed flow carrying larger blocks NW over older flows (figure 34), based on a news article from Europe Press. The flow quickly advanced to the W along the N margins of the flow field, causing more damage in Todoque and an industrial area.
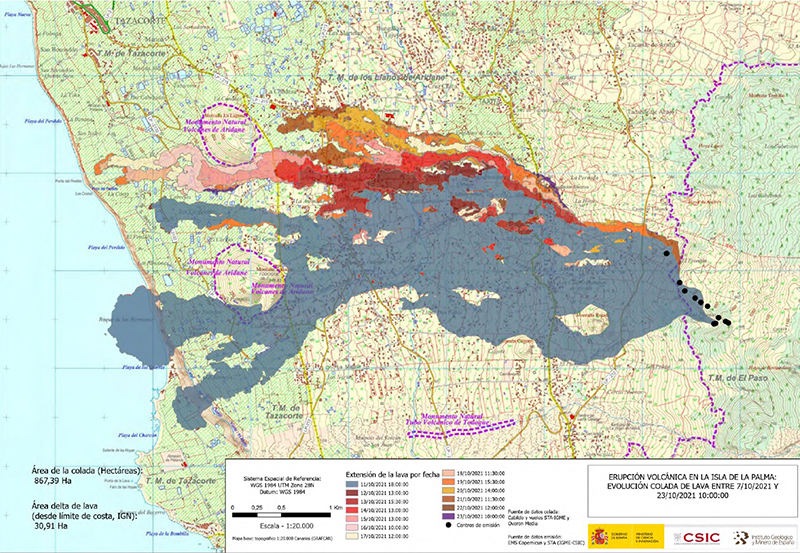 |
Figure 33. The map of the active lava flows at La Palma between 7 October and 1000 on 23 October 2021. The total area covered by the flows is 8.7 km2 while the lava delta on the W coast is 0.3 km2. The black dots (right) represent the emission vents. The color scale dates the occurrence of the flow. The gray main part of the flow was updated on 11 October 2021 at 1800. Other flow dates ranged from 12-23 October 2021. A partial collapse of the NW flank on the main cone sent large blocks downslope, causing lava to spill out into numerous flows on 23 October. Generally, the direction of travel is to the W toward the coastline. Courtesy of Copernicus EMS, PEVOLCA, CSIC, and IGME. |
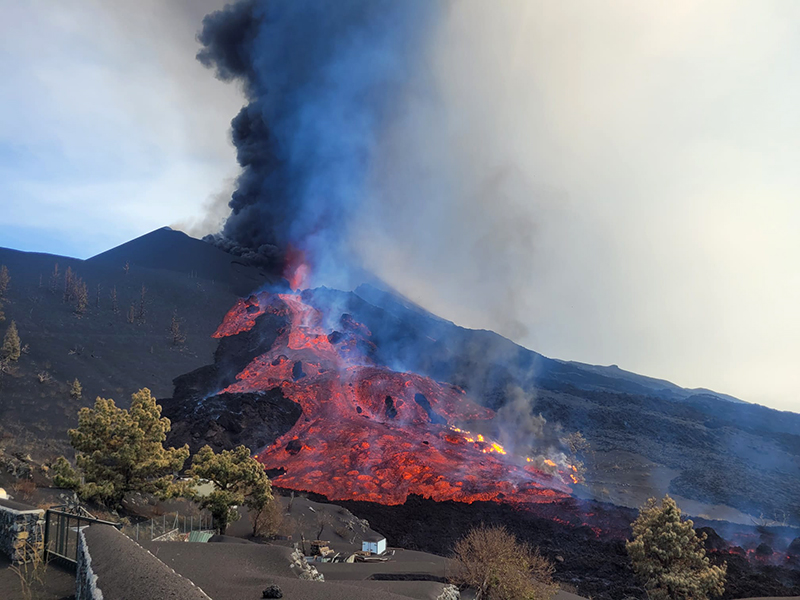 |
Figure 34. Photo of a lava flow originating from the N base of the main cone at La Palma on 9 October 2021. Courtesy of Raúl Pérez, IGME. |
By 10 October there had been about 6,000 people evacuated, between 726 and 1,323 buildings damaged by lava, and more than 1.3 km2 of crops destroyed. The inner crater lava lake spilled out after part of the cone had collapsed, which fed more flows and floated large, cooled blocks downslope. According to PEVOLCA, the main flow runs W and NW toward the ocean to as far as 300 m (figure 35). Ash plumes rose to 3.5-4 km altitude and caused ashfall to the S. Video showed lava fountains rising 500 m above the vent late that night.
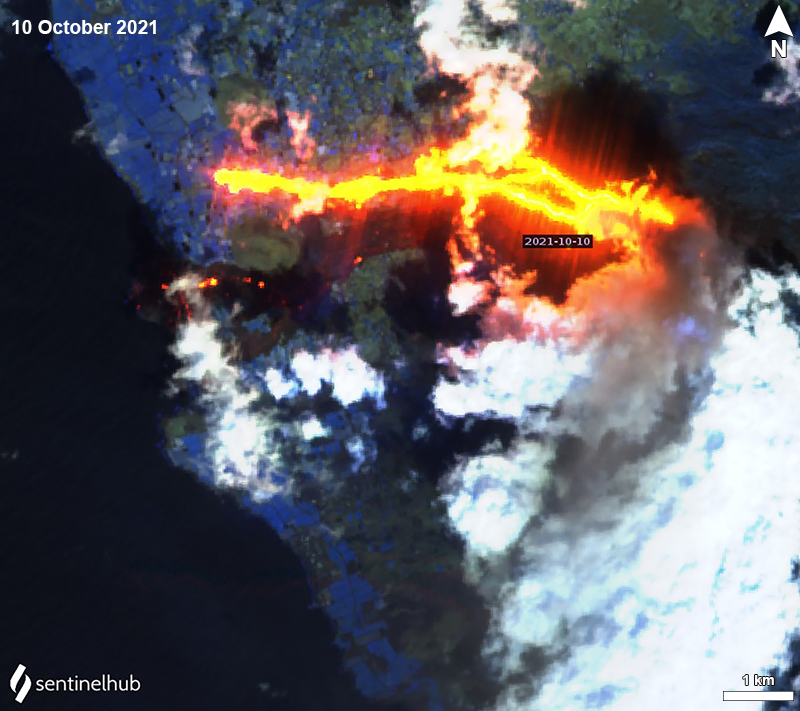 |
Figure 35. Sentinel-2 infrared satellite images showing the main lava flow moving W and NW toward the coastline from La Palma on 10 October 2021. A gray ash plume is drifting SW. Image with “Atmospheric penetration” rendering (bands 12, 11, 8a). Courtesy of Sentinel Hub Playground. |
The lava field grew to the N and S on 11 October and was an estimated 5.91 km2 with a width of 1,520 m, though the flows that had fed it slowed. The northernmost flow advanced another 50 m toward the coast. On 12 October this N lava flow prompted an evacuation of roughly 700-800 people from the La Laguna area; it continued to move over crops and was 200 m from the coast.
The main cone had at least three effusive vents and another vent to the N was also active. Multiple collapses of parts of the cone sometimes sent large blocks of cooler lava rafting down the flows and the lava field was fed by numerous streams of lava. The lava flow field included three areas: the initial main flow that traveled W around the S part of Mantaña de Todoque toward the ocean; a flow that had branched off of the main flow to the S; and flows that traveled W along the N margins of the main flow. The main and S lava flows were being only minimally fed.
As intermittent ash plumes continued, INVOLCAN reported that ash and tephra deposits (figure 36) had grown to a volume of 8-9 million cubic meters since the start of the eruption through 13 October. On the night of 13 October and the morning of 14 October, 400 people were evacuated from La Laguna in Los Llanos de Aridane as the N flow advanced NW. More than 100 million cubic meters of lava had been erupted since the beginning of the eruption, according to PEVOLCA. During 13-19 October the lava flows along the N margins (the N flow) were the most active and were comprised of two main branches.
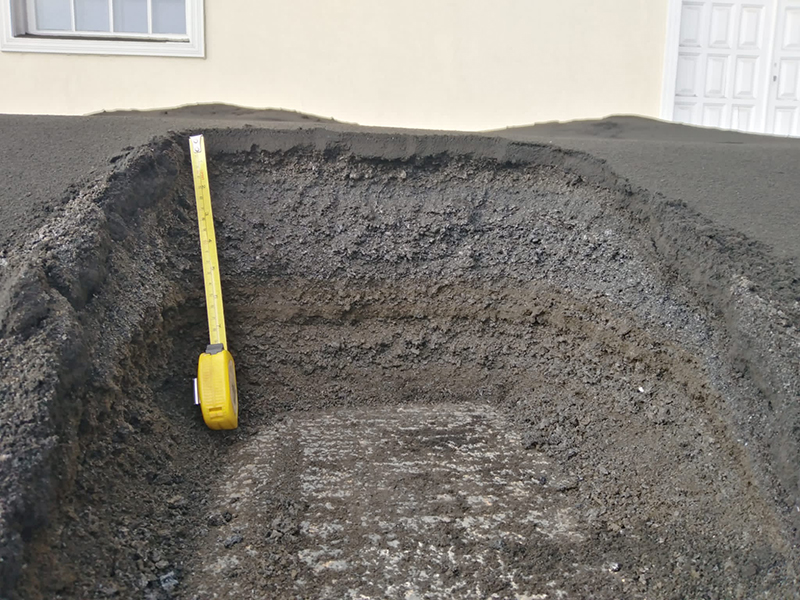 |
Figure 36. Photo of tephra deposits from La Palma taken on 13 October. The volume of tephra is estimated to be 8-9 million cubic meters since the start of the eruption. Courtesy of INVOLCAN. |
A vent located 300 m from the SE base of the main cone reactivated during 15-16 October, which generated some phreatomagmatic activity and gas-and-ash emissions. At the same time, increased phreatomagmatic activity was detected in the main vent. Ongoing lava fountains during 16-17 October were reported by the Toulouse VAAC, based on webcam images (figure 37). Large blocks were carried downslope by the advancing N flows, which would occasionally overflow their channels and spread laterally for short distances. The flow reached Montaña de La Laguna, traveled around the S part, and continued to the W toward the ocean; by 19 October the end of the lava flow was 100-110 m from the coastline. Small avalanches in areas with thick ash deposits descended slopes near the Tamanca ravine, producing small ash plumes.
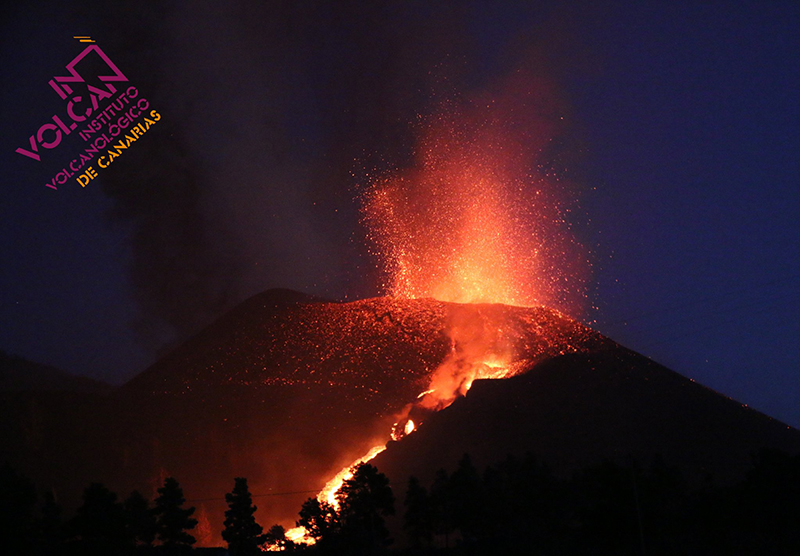 |
Figure 37. Photo of Strombolian activity at La Palma taken at 2000 on 17 October 2021. Courtesy of INVOLCAN. |
On 19 October around 0900 an ash plume reported by IGN rose to 5 km altitude. The lava flow that moved through the N of Mantaña Todoque had stopped that day, while the one advancing through the S of La Laguna was 130 m from the coastline. By this time, about 6,400 people had been evacuated. A new vent that opened in the area between the main cone and the 16 October vent (300 m from the SE base of the main cone) exhibited explosive phreatomagmatic activity followed by Strombolian activity.
On 20 October an ash plume rose to 3.5 km altitude. The main cone varied in shape as partial crater rim and wall collapses occurred and the eruption progressed. The main cone generated explosions and a lava overflow, which was visible at 2000 on 22 October. During 22-23 October there was a decrease in the rate of advancement. A partial collapse of the NW flank on the main cone intensified ash emissions and sent large blocks downslope on 23 October; these blocks fell onto another vent which caused lava to spill out into numerous flows (figure 33). Strong explosions heard at 1230 ejected material out of the vent, and lava overflowed a vent on the flanks of the main cone at 1415. Ash emissions rose to 3 km altitude.
Tall lava fountains rose from at least two vents on 24 October. A new vent opened on the NW flank in the afternoon and effused lava at a high rate. As a result, the vent increased in height and width during 24-25 October. The vent located at the SE end of the fissure produced slow-moving lava flows that traveled to the SW. By this time, a total of nine emission points had emerged since the start of the eruption, though only four remained active: the main flow runs along the N margins, covering previous flows; one flow originated from the SE end of a fissure, moving SW; and one flow emerged on the NW slope of the main cone. This NW flow generated large blocks that fell on a lower lava emission point that resulted in multiple lava spills. Ash plumes rose to 3.8 km altitude. More than 50 km of roads had been damaged, along with roughly 2,270 buildings (2,143 destroyed) and 2.6 km2 of crops affected, according to a Copernicus EMS map.
On 25 October strong explosive activity was visible; a small collapse of the cone was observed at 1700. Between 2000-2100 a lava lake in the main cone increased in volume, resulting in a partial collapse of the upper part of the cone and producing large, detached blocks that rafted downslope on several lava flows. Lava advanced over some areas that were previously unaffected, particularly in Alcalá, covering 8.79 km2 by 26 October. Flows on the N end of the field were less than 100 m from the coastline. Lava fountains rose as high as 600 m from the vent located at the SE end of the fissure.
When the flow reached the coastline, a delta formed, reaching 120 m water depth while rock fragments from the end of the flow were observed at depths of 360 m. Lava filled the upper and middle areas of underwater ravines, covering an area of about 0.11 km2 and with a depth of 10-30 m.
Around noon on 29 October, a series of intense and audible explosions occurred for several hours, generating a large amount of ash that affected the entire W and NW parts of the island. Multiple air quality alerts were issued by authorities as they warned residents of some affected areas (Los Llanos de Aridane in particular) to stay indoors and, if going outside, to wear a filtering mask. On 31 October some larger explosions were accompanied by shock waves, while the effusion rate at the NW flank vent notably increased. An ash plume that day rose at least 4.5 km altitude (figure 38).
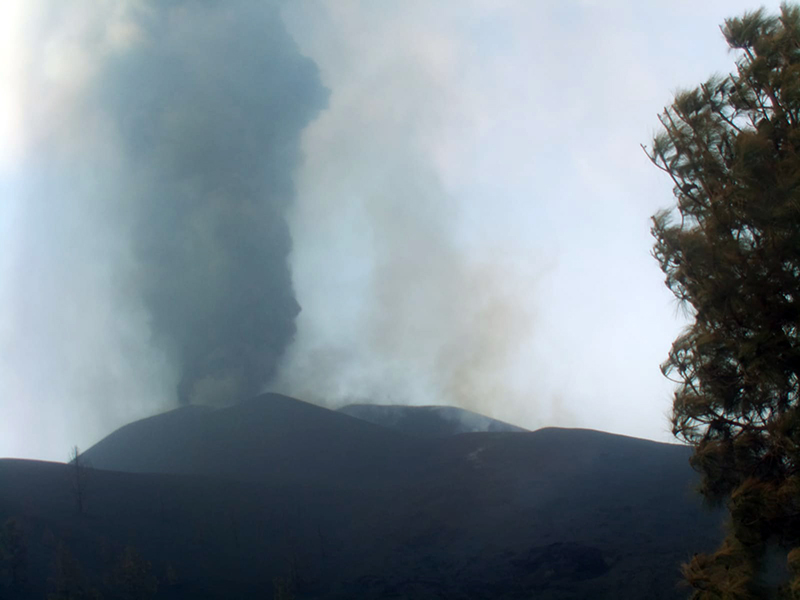 |
Figure 38. Webcam image of an ash plume rising from the main cone at La Palma on 31 October 2021 taken from the Cabeza de Vaca runway. Courtesy of IGN (Actualización de la información sobre la actividad volcánica en el sur de la isla de La Palma). |
Frequent sulfur dioxide plumes with fluxes between 2,882 and 53,600 tons/day were also identified in satellite images drifting as far as 240 km S, as well as in multiple directions (figure 39). The higher value was recorded on 24 October. On 8 October these plumes reached the Caribbean and on 12 October they were over northern Africa, Spain, and Portugal. By 19 October the plumes had extended to the NW over Spain, France, and Germany.
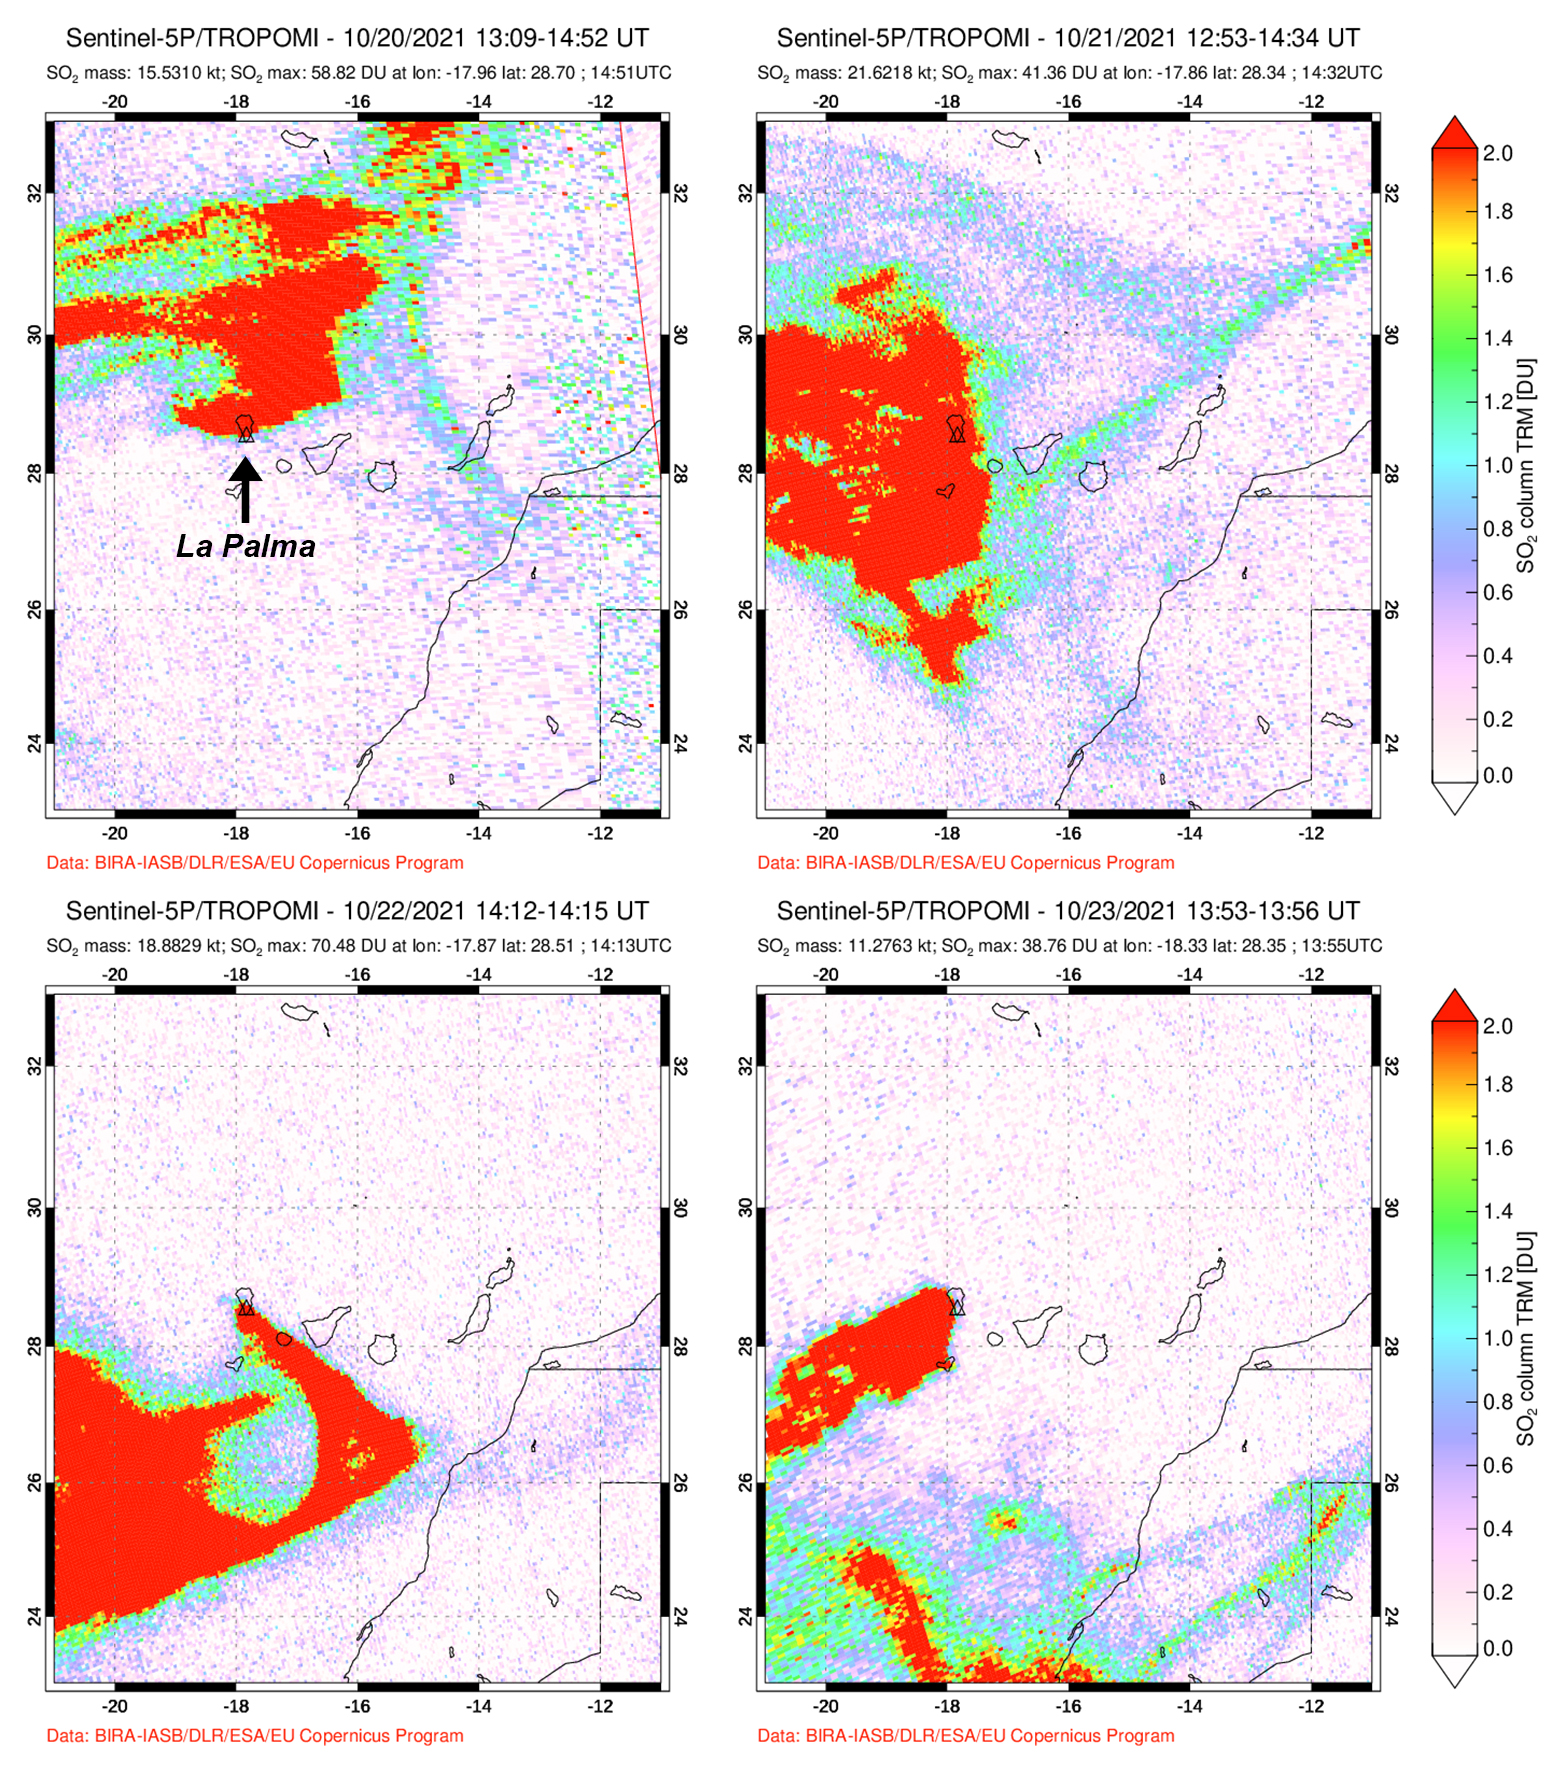 |
Figure 39. Significant sulfur dioxide emissions from the Cumbre Vieja eruption at La Palma were measured by the TROPOMI instrument on the Sentinel-5P satellite. These plumes drifted in multiple directions, reaching as far as the Caribbean on 8 October, northern Africa, Spain, and Portugal on 12 October, and France and Germany by 19 October. The dates shown were taken consecutively during 20-23 October 2021. Courtesy of NASA Global Sulfur Dioxide Monitoring Page. |
Activity during November 2021. During November, frequent earthquakes continued (a total of 2,871 on the island of La Palma), 235 of which were felt by the nearby populations. The maximum magnitude reached 5.1 on 19 November at a depth of 36 km. Seismicity was distributed in two groups: earthquakes that occurred at 10-15 km deep and those at depths greater than 30 km. Volcanic tremor levels decreased around noon on 2 November and again during 4-5 November and remained at low levels through 9 November.
Ash emissions rose to 2.1-4.6 altitude and drifted 55 km N, E, SE, S, SW, and NW. On 3 November explosive activity increased around 1300, producing a dark ash plume that rose to 4.5 km altitude. Intermittent sulfur dioxide emissions continued to be visible in satellite images.
The vents in the main cone continued to effuse lava, eject tephra, and intermittently produce dense and billowing ash-and-gas plumes. Audible explosions and significant ash emissions continued intermittently through 2 November, with ashfall affecting the entire W and NW parts of the island. Lava continued to effuse to the NW from a vent on the NW flank, overflowing and occasionally breaking out and forming new flows. A flow at the end of October originated along the upper central part of the S margin of the flow field, N of Montaña Cogote and on 6 November the rate of advancement increased.
On 5 November the ash plume rose to 3.5 km altitude at 0845 (figure 40). Based on data from the FLIR (Forward Looking InfraRed Infrared) thermal instrument, the temperature of the plume was 178 °C. On 7 November a dense, gray ash plume was reported to 2.7 km altitude that drifted WSW, accompanied by lava fountaining (figure 41).
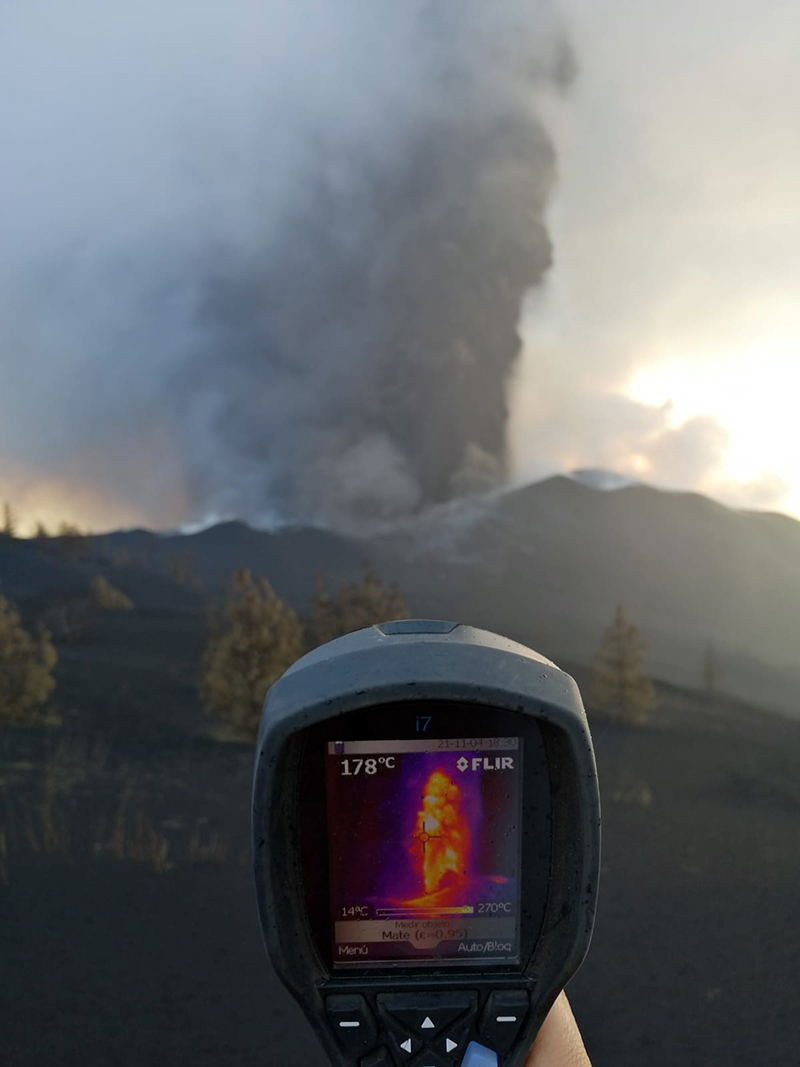 |
Figure 40. Photo of an ash plume rising 3.2 km altitude above La Palma on 4 November 2021, accompanied by a thermal image. The temperature of the plume is 178°C according to the display shown on the FLIR (Forward Looking InfraRed Infrared) instrument being held by a volcanologist. Courtesy of IGN (Actualización de la información sobre la actividad volcánica en el sur de la isla de La Palma). |
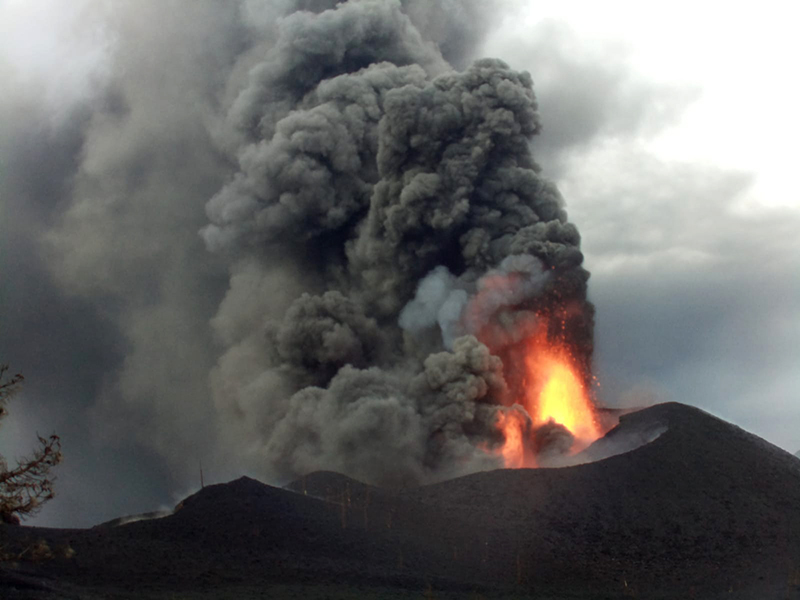 |
Figure 41. Photo of a dense gray ash plume rising above La Palma on 7 November that drifted WSW, accompanied by lava fountaining. Courtesy of IGN (Actualización de la información sobre la actividad volcánica en el sur de la isla de La Palma). |
Flow 2 reached the sea cliff at Los Guirres Beach and entered the sea at 0245 on 9 November (figure 42). A new branch to the N was reported during the morning of 9 November, which was located a few meters from the coastline. On that same day, there was a decrease in seismicity, tremor, and deformation levels, in addition to sulfur dioxide emissions, though scientists were unable to confirm this decline. By 10 November the highest point of the main cone was 1,130 m altitude. Lava continued to flow W through pre-existing lava channels and tubes, over older flows, and occasionally formed new branches. Occasional short-lived lava ponds occurred at the main crater vents. Flow 2 had reached the sea around 0144 on 10 October, starting a new lava delta, which overlapped the previous one to the N. Flows 1-9 continued to advance, while the others remained relatively stationary. Lava filled in some gaps between the N flows (Flows 4 and 7), though flow advancement was mainly focused at and near the ocean entries, feeding flows 1, 2, and 9.
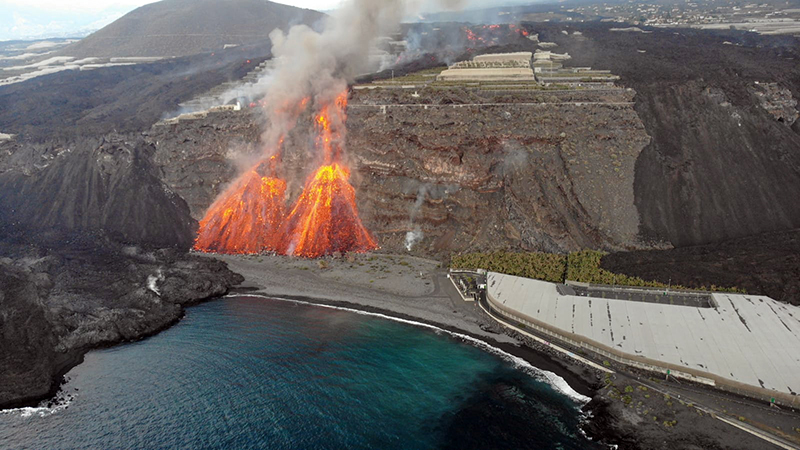 |
Figure 42. Photo of the lava flow from La Palma reaching the sea cliff at Los Guirres Beach and entering the sea at 0245 on 9 November 2021. Courtesy of PEVOLCA. |
A lava lake overflow occurred at the top of the W part of the main cone and lasted for a few hours; the lava flow field covered 10.1 km2. On 13 November, three lava flows continued to feed Flow 1, and to a lesser extent Flows 2 and 9, which in turn fed the lava deltas along the Los Guirres Beach (figure 43). An ash plume at 0845 rose to 3.1 km altitude and drifted SW. Ash emissions intensified on 14 November.
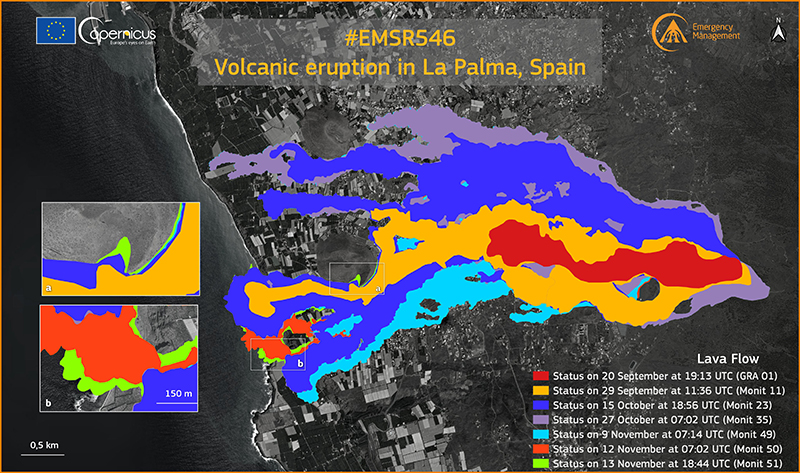 |
Figure 43. The growth of the lava flow field at La Palma during 20 September through 13 November 2021 shown in different colors. The extent of the field on 20 September is shown in red, and on 29 September is shown in orange. In October, the extent on the 15th is shown in blue, with flow coverage on the 27th in purple (on the N side). By 9 November flows shown in light blue had expanded on the S side of the field. Flows moving W towards the coast flows are shown in dark orange on 12 November and in light green on the 13th, where two lava deltas had formed. Courtesy of Copernicus EMS. |
According to IGME, by 15 November the two S lava deltas have merged, covering an area of 0.4 km2 beyond the previous coastline. Flow 9 had reached the sea, feeding the lava deltas along with Flows 1 and 2. Another lava delta grew along Charcón Beach, but its flow was not strongly fed and reached 30 m thick in some areas. The lava flows that had advanced W along the S side of Montaña de La Laguna were 86 m from the coast of Tazacorte, near the beach of El Perdido. On 16 November ash drifted W and SW and caused some flight disruptions at the La Palma airport. Volcanic tremor levels increased during 16-17 November then returned to low levels.
PEVOLCA reported that though Strombolian activity and phreatomagmatic pulses continued, there was an overall decline in activity beginning in mid-November. During 17-18 November Flow 5 advanced along the N base of Montaña de Todoque and along the S edge of Flow 4, which had also advanced and widened (figure 44). After a lull in activity on 17 November, Strombolian activity and ash emissions resumed later in the day, ejecting larger pyroclasts from the vents in the upper part of the cone. On 18 November an ash plume rose to 3.5 km altitude and drifted SW (figure 45). Video data that was posted at 1615 on 18 November showed jetting lava and billowing ash plumes containing some lightning flashes. A PEVOLCA report from 20 November reported that the total volume of emitted tephra during the eruption was more than 10 million cubic meters.
 |
Figure 44. Photo of lava flows from La Palma covering new areas between the Montaña de Todoque and La Laguna during 17-18 November 2021. Courtesy of PEVOLCA. |
 |
Figure 45. Photo of an ash plume rising to 3.5 km altitude and drifting SW from La Palma on 18 November 2021. Courtesy of IGN (Actualización de la información sobre la actividad volcánica en el sur de la isla de La Palma). |
Around 2000 on 19 November increase in the effusion rate caused the lava lake to overflow. Three flows were active: Flow 11 ran from Montaña Rajada to the N of Montaña Cogote, one fed the lava deltas off the coast, and the third was located to the NW between Flows 4 and 7 (figure 46). During the evening, lava overflowed one of the craters in the main cone; crater overflows were again visible on 21 November. Lava continued to fill in gaps between Flows 4 and 7 and by 21 November, the two had merged. Flow 7 advanced W and by 1303 on 22 November, reaching the sea at La Viña Beach (figure 47). The lava delta had an area of approximately 0.43 km2.
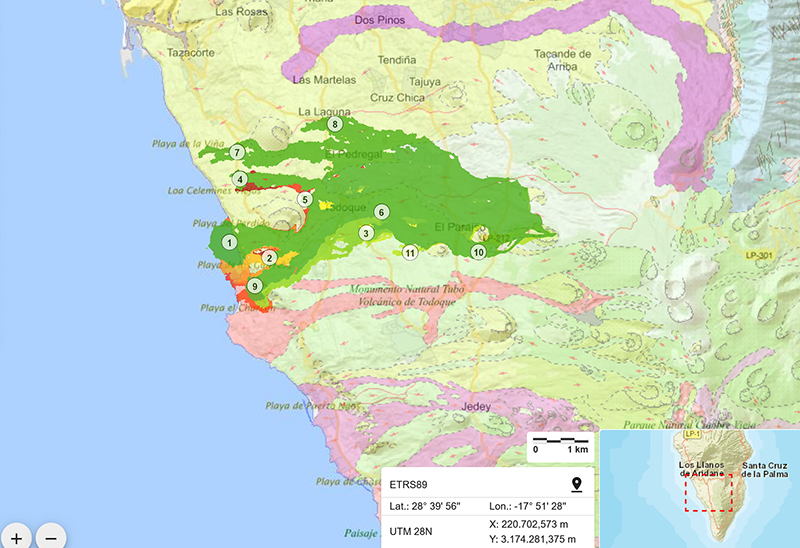 |
Figure 46. Map of lava flows 1-11 effusing from La Palma moving generally W toward the coastline on 19 November 2021. Flows 1, 2, and 9 supplied the lava delta S of Flows 4 and 7. Green represents older flows while red represents younger flows. The pink and purple regions denote part of IGME’s Continuous digital geological mapping. Courtesy of IGME. |
 |
Figure 47. Map of Flow 7 from La Palma arriving at the sea at La Viña Beach on 22 November 2021. Flows 4 and 5 are located to the S of Flow 7 and the front of Flow 8 is to the E of it. Courtesy of PEVOLCA. |
By 23 November, Flows 1, 2, and 9 had merged and fed the main S delta, which extended 0.41 km2 from the coastline. Roughly 7,500 people had been affected by evacuations across El Paso, Fuencaliente, Los Llanos de Aridane, Tazacorte, and Villa de Mazo. During 23-25 November, Flows 4, 5, and 7 at the N end of the flow field continued to widen and advance, filling in gaps between previous flows and feeding the N lava delta. Flows 1, 2, and 9 fed the S delta at a lower rate. The N lava delta, fed by Flow 7, was estimated to be 0.05 km2 while the S lava delta was 0.43 km2 by 24 November. An ash plume rose to 4.3 km altitude on 24 November.
The number of active flows on the flow field increased as lava overflowed their channel margins or broke out of the lava tubes. The easternmost vent produced a fast-moving flow that traveled along the S margin of Flow 10 and around the S side of Montaña Cogote on 24 November. The flow advanced through the Las Manchas cemetery and inundated parts of a solar power plant; the newly covered areas were within the exclusion zone, which had already been evacuated. During 24-26 November ash plumes rose as high as 4.8 km altitude and drifted E, which resulted in ashfall at the La Palma airport. The lava effusion rate increased at the main crater vents at 0900 on 25 November, and around 1100 two small E-W fissures opened less than 1 km S of the main cone. The amplitude of the volcanic tremor signal fluctuated at low-medium levels that coincided with the effusive episodes that occurred on 25 November. The flow rate slowed to about 25 m/hour and merged with Flow 11 by 26 November. A lava overflow SW of Flow 3 produced a small branch oriented laterally to the flow margin. Flow 7 widened during 26-27 November as it continued to be fed.
On 28 November new vents opened on the NE flank of the main cone around 0300, accompanied by an ash plume that rose to 1.6 km altitude from the main crater and drifted SW (figure 48). The new vents produced fluid lava flows that traveled N and NW through the Tacande area and were followed by landslides on the NW flank of the cone. According to a video taken at 1145 lava fountains rose from one of the vents, while another ejected tephra. Video footage taken at 1050 on 29 November showed lava flows transporting large blocks downslope while another one showed lava flowing at a rate of about 1 m/s. By noon, the vents in the main cone became noticeably less active and were more intermittent through 30 November. Several lava streams from the new vents continued to advance NW and then W along older flows which had split into two branches on 26 November. One branch traveled through tubes and fed Flows 4, 5, and 7 between Montaña de Todoque and Montaña de La Laguna while the other descended toward Flow 8 (the northernmost flow). According to PEVOLCA, the S lava delta was estimated to be 0.43 km2 while the N lava delta was about 0.06 km2. Roughly 2,860 buildings had been affected by 30 November (2,748 destroyed) and about 3.5 km2 of crops were covered by lava.
 |
Figure 48. Photo of the new vent that opened on the E of the main cone of La Palma on 28 November 2021 (left), accompanied by lava fountaining, a flow, and an ash plume that rose to 1.6 km altitude and drifted SW (right). Courtesy of IGN (Actualización de la información sobre la actividad volcánica en el sur de la isla de La Palma). |
Strong sulfur dioxide plumes fluctuated at a rate of 7,000-43,000 tons/day, but was as low as 900-4,000 tons per day, showing an overall decrease compared to the amount emitted during October. On 5 November photos showed sulfur deposits on the E flank on the main cone and in other areas near vents emitting volcanic gases (figure 49). During 27-28 November there was a brief surge in sulfur dioxide emissions with values of 30,000-49,999 tons/day (figure 50) and remained relatively high during 29-30 November with values between 1,000 and 29,999 tons/day.
 |
Figure 49. Photo showing sulfur deposits (light yellow) on the E flank of the upper part of the cone at La Palma (center background) on 5 November 2021. A gray ash plume is also visible rising above the cone. Courtesy of IGN (Actualización de la información sobre la actividad volcánica en el sur de la isla de La Palma). |
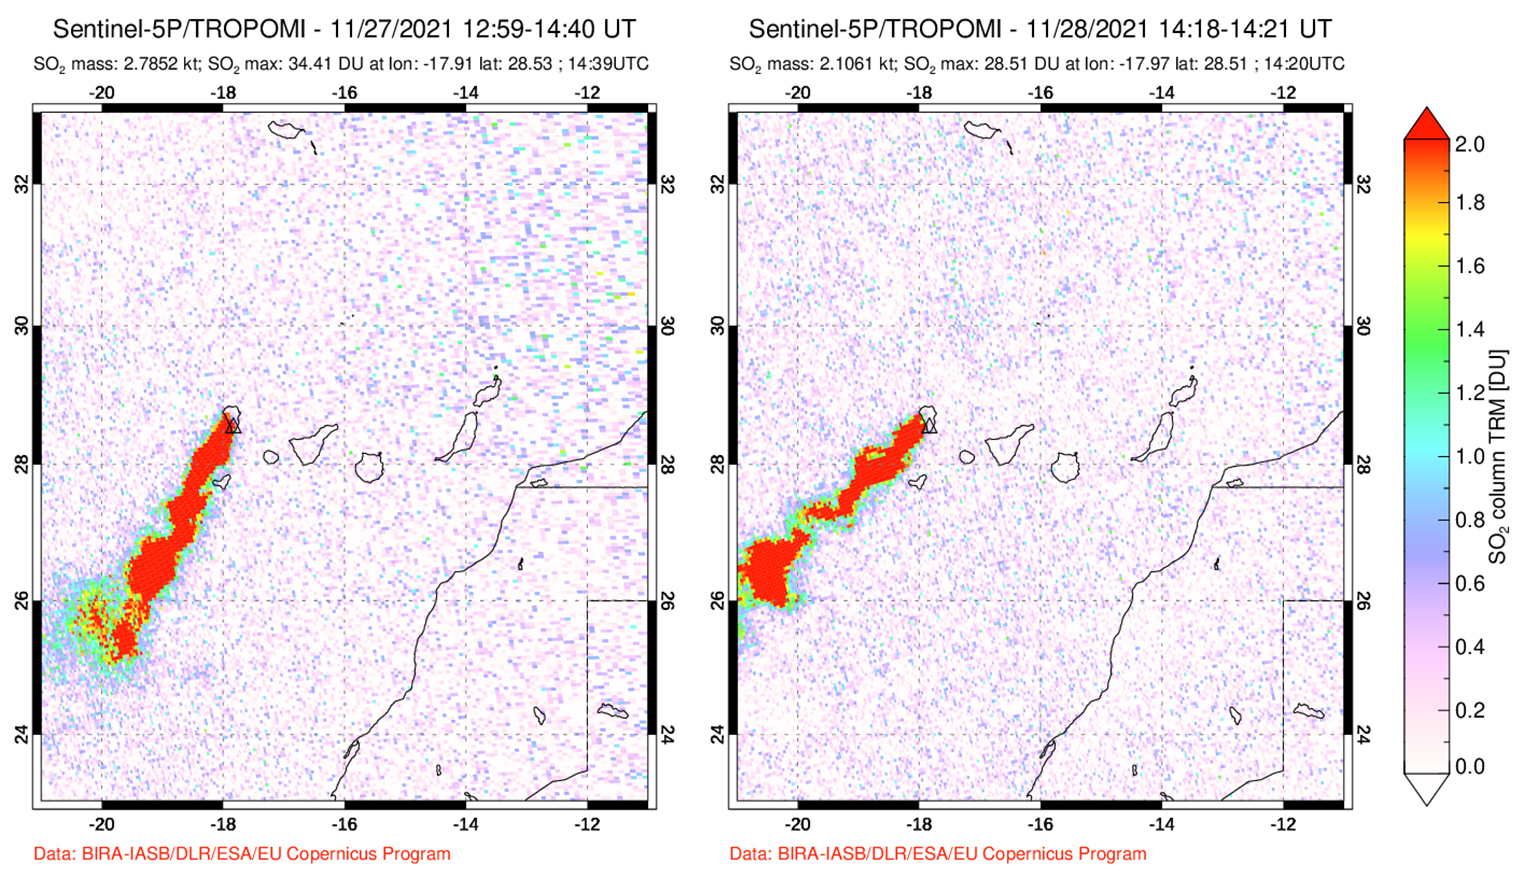 |
Figure 50. Sulfur dioxide emissions from the Cumbre Vieja eruption at La Palma measured by the TROPOMI Instrument on the Sentinel-5P satellite persisted, drifting in different directions. During 27 and 28 November 2021 strong plumes were detected drifting SW. Courtesy of NASA Global Sulfur Dioxide Monitoring Page. |
Activity during December 2021. A total of 1,357 earthquakes were detected during December on the island of La Palma, with a maximum magnitude of 4.2 on 19 December. The nearby population felt 44 of these earthquakes during this month. On 1 December a gas-and-steam plume rose as high as 5.2 km altitude while an ash plume rose to 3.5 km altitude and drifted SSW at 0945.
During December, about 60 VAAC notices were issued, noting that low-to-moderate ash emissions rose to 1.9-3.9 km altitude and drifted SW and S; low sulfur dioxide emissions were also detected in satellite images. On 13 December a strong explosion generated an ash plume that rose as high as 7.5 km altitude. By the next day, ash emissions resumed to low levels of 2.4 km altitude that drifted E and S.
Persistent Strombolian activity was sometimes intense on the NE flank during 1-3 December as lava continued to feed Flow 8 and the N lava delta. Lava fountains rose 400-500 m above the vent on 2 December (figure 51). A new pyroclastic cone had formed around the vent on the NE flank, though it was unstable and blocks from partial collapses descended via lava flows. According to PEVOLCA, a new Flow 12 was the northernmost flow after it split from Flow 8 and traveled over the Fronton area but then later rejoined Flow 8 downslope; Flow 8 was located about 800 m from La Laguna. The flows reached part of the Tacande highway on 3 December. Flow 7 continued to feed the N lava delta. The vents in the main cone were quieter and periodically emitted ash and gas. A N-S oriented crack opened in an area 100 m S of the main vent, which was likely due to subsidence. On 3 December a new fissure opened on the SE flank of the main cone that produced Strombolian activity and fast-moving lava flows that traveled SW along Flow 10. An ash plume rose to 1.9 km altitude and drifted SSW, accompanied by continued lava fountains (figure 52).
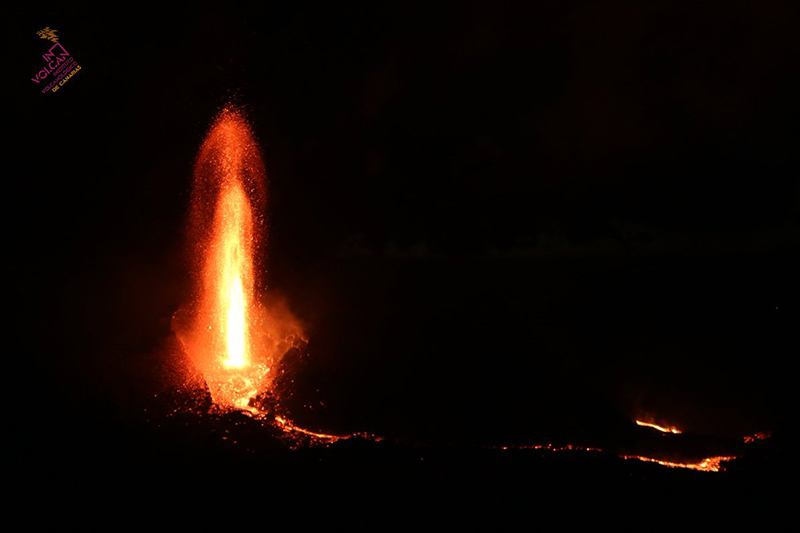 |
Figure 51. Photo of a lava fountain rising 400-500 m above La Palma on the NE flank on 2 December 2021. Courtesy of INVOLCAN. |
 |
Figure 52. Photo of an ash plume rising to 1.9 km altitude and drifted SSW from La Palma on 3 December 2021. Lava fountains were also visible in the photo to the left. Courtesy of IGN (Actualización de la información sobre la actividad volcánica en el sur de la isla de La Palma). |
A flow continued to advance W on 4 December, though at a slower rate as it filled in gaps between Flows 3 and 11. By 4 December the NE vent was quiet. Flows 7, 8, and 10 were fed via lava tubes, though also at a lower rate. Several new vents along an E-W fissure located W of Montaña del Cogote opened around noon on 4 December, producing multiple fast-moving lava flows. The flows descended SW over new land, crossing into Tazacorte and Los Llanos de Aridane, destroying 60 homes. It merged with Flow 9, reaching the sea cliff in the Las Hoyas area by 5 December, descending the cliff the next day. During 6-7 December lava advanced W through multiple tubes and fed Flows 1 and 2, as well as the S delta. A new bathymetry between Flows 1 and 4 showed they occurred at shallow depths of up to 4.5 m. The NE vent resumed with sporadic Strombolian activity and ash emissions. Several vents in the central and SE parts of the main cone also produced sporadic Strombolian activity and ash emissions as well.
During 8-12 December activity at several vents in the central and SE part of the main cone was low, with only sporadic pulses of Strombolian activity and ash emissions. Intense gas emissions were recorded during 9-11 December. Small landslides from fractured areas in the upper part of the secondary cone (on the E flank) descended the interior part of the crater as well as the flanks. Lava from the vents moved through tubes toward the W part of the flow field, though two main breakout flows traveled W over older flows. The most active area was along the S margin of Flow 9, where 9 and 11 had merged, as lava continued to descend the sea cliff and widen the field by Las Hoyas. During 11-12 December lobes from the S margins of the flow traveled S in the Las Norias area (figure 53).
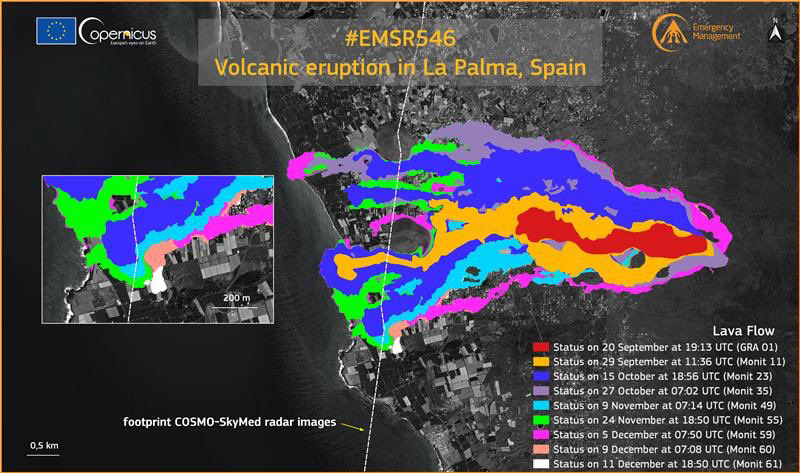 |
Figure 53.The growth of the lava flows at La Palma during 20 September through 11 December 2021 shown in different colors. The extent of the flow on 20 September is shown in red. The extent of the flow on 29 September is shown in yellow. The extent of the flow on 15 October is shown in blue. The extent of the flow on 27 October is shown in purple. The extent of the flow on 9 November is shown in light blue. The extent of the flow on 24 November is shown in light green. The extent of the flow on 5 December is shown in bright pink. The extent of the flow on 9 December is shown in pale pink. The extent of the flow on 11 December is shown in white. Each of these flows are moving W toward the coastline where two lava deltas had formed (N and S). Courtesy of Copernicus EMS. |
On 12 December several strong pulses of tremor were accompanied by intense Strombolian activity. A small lava overflow from one of the vents traveled N over older flows. One of the stronger periods produced dense, dark ash plumes that rose to 6 km altitude and ejected bombs (some of which were several meters in diameter) as far as 500 m from the vent. Collapses enlarged the main crater and the secondary cone on the E flank. During 12-13 December lava continued to travel W through tubes in the central part of the flow field. At the S margins, lava filled in the uncovered areas between Flows 9 and 11. On 13 December tremor levels fluctuated with pulses of intense signals. Strong explosive activity during 1745-1900 ejected bombs toward the N flank and produced gas-and-ash plumes (figure 54). At 1820 video showed lava jetting above the vent and incandescent material falling onto the flanks; activity at the vents decreased after that. Tremor also decreased at 2000 and by 2200 had reached background levels. Gas emissions from the vents were at high levels through 14 December and lava continued to move from the W base of the main cone on 14 December, though at a much lower rate compared to the previous day. Small breakouts were visible near Montaña Cogote and Las Norias. Daily measurements indicated that sulfur dioxide emissions persisted at relatively high levels with values of 1,000-29,999 tons/day (figure 55). According to the Copernicus EMS map, approximately 3,063 buildings had been affected (at least 2,896 destroyed).
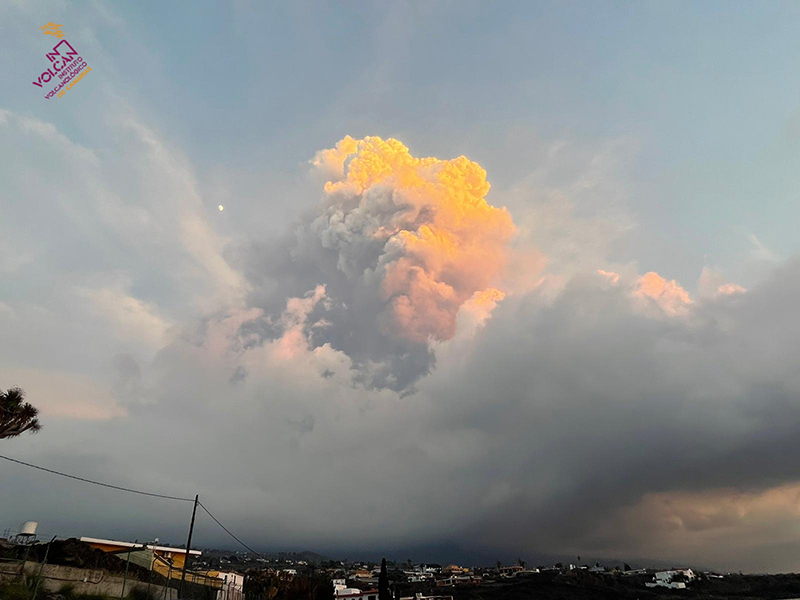 |
Figure 54. Photo of a large gas-and-ash plume rising above La Palma at 1815 on 13 December 2021. Courtesy of INVOLCAN. |
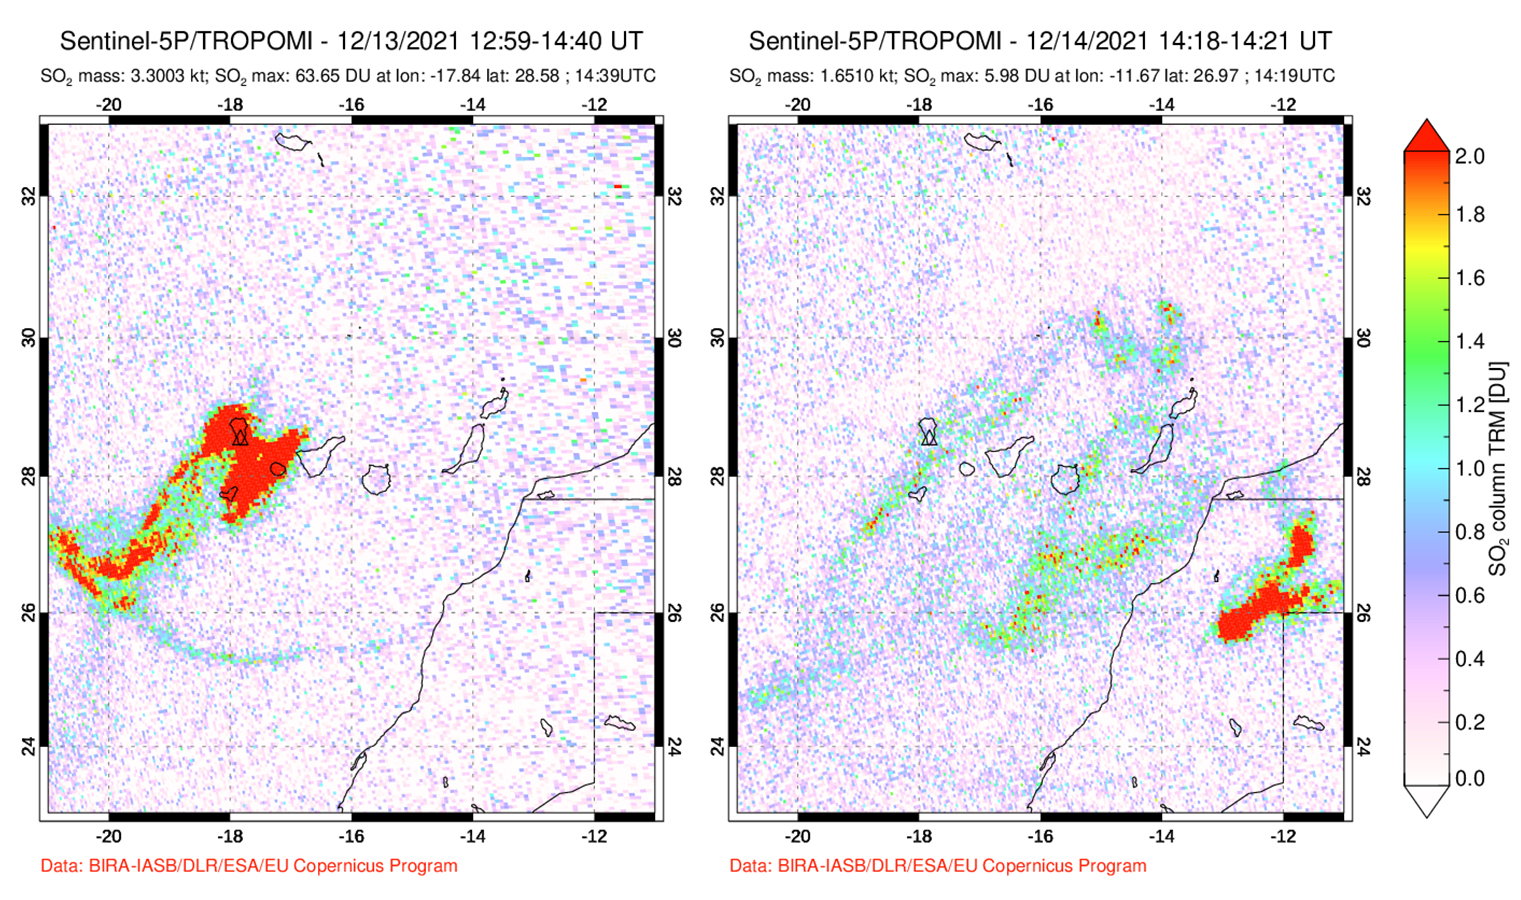 |
Figure 55. Sulfur dioxide emissions from the Cumbre Vieja eruption at La Palma measured by the TROPOMI Instrument on the Sentinel-5P satellite persisted through 13 December 2021. By 14 December the volume of sulfur dioxide emissions notably decreased compared to the continuous emissions from the previous days. Courtesy of NASA Global Sulfur Dioxide Monitoring Page. |
Observations made on 15 December showed no signs of lava flowing from the vents at the W base of the main cone, from tubes, or at the lava delta in the Las Hoyas area. During 15-20 December the tremor was at background levels, and seismicity was very low at all depths. Sporadic gas emissions rose from the vents and from cooling lava flows. Small collapses from the walls of the main and secondary cone craters were visible due to existing faults and fissures. Sulfur dioxide emissions varied from less than 5 to 999 tons/day, which was consistent with a cooling and degassing lava flow field. By the end of December, the number of earthquakes had decreased and were located in the S and E area of the island at shallow depths of 11-16 km and less than 5 km (figure 56). According to PEVOLCA, on 17 December a small lava flow remained active in a lava tube, which was part of Flow 11, running over older flows. Incandescence was observed in the Las Hoyas area.
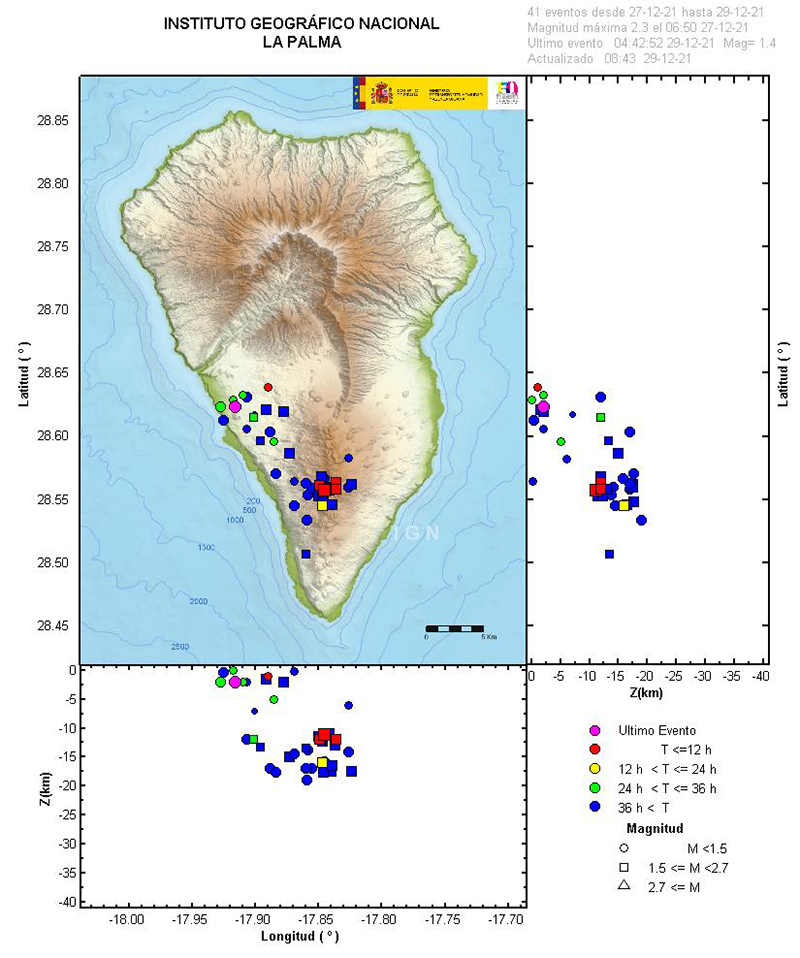 |
Figure 56. Map of the seismic events at La Palma showing the location of earthquakes on the SE part of the island during 27-29 December 2021. The depths of these events were no greater than 16 km. The color bar on the right represents the length each event lasted, while the shape denotes its magnitude. Courtesy of IGN (Actualización de la información sobre la actividad volcánica en el sur de la isla de La Palma). |
On 25 December PEVOLCA announced that the eruption that began at 1511 on 19 September had ended at 2221 on 13 December 2021. During the course of the eruption, six craters were formed and the average length of the cone was 700 m; the largest crater was 172 m by 106 m. The total volume of lava erupted was 200 million cubic meters. Material was ejected as far as 1.5 km over the course of the eruption and lava covered 12.19 km2. The maximum temperature of the lava was 1,140°C. The lava deltas spread 0.48 km2 above the water, while 0.21 km2 was covered underwater.
Information Contacts: Instituto Geographico Nacional (IGN), C/ General Ibáñez de Íbero 3, 28003 Madrid – España, (URL: https://www.ign.es/web/ign/portal, https://www.ign.es/web/resources/volcanologia/html/CA_noticias.html); Instituto Volcanologico de Canarias (INVOLCAN), (URL: https://www.involcan.org/, https://www.facebook.com/INVOLCAN, Twitter: INVOLCAN, @involcan); Toulouse Volcanic Ash Advisory Center (VAAC), Météo-France, 42 Avenue Gaspard Coriolis, F-31057 Toulouse cedex, France (URL: http://www.meteo.fr/aeroweb/info/vaac/); Gobierno de Canarias, (URL: https://www.gobiernodecanarias.org/principal/); Consejo Superior de Investigaciones Científicas (CSIC), Serrano, 117. 28006 Madrid, Spain, (URL: https://www.csic.es/es); El País, SL Miguel Yuste, 40 – 28037 Madrid, (URL: https://elpais.com/sociedad/2021-10-04/fue-como-una-presa-que-se-rompe-la-lava-cubre-ya-413-hectareas-de-la-palma-y-alcanza-un-perimetro-de-36-kilometros.html); Europe Press, Canary Islands, Paseo de la Castellana, 210 28046 Madrid, (URL: https://www.europapress.es/islas-canarias/noticia-registra-nuevo-derrumbe-flanco-norte-volcan-palma-20211009204021.html); El Diario, Gran Vía Street, 46, First Floor 28013 Madrid, (URL: https://www.eldiario.es/canariasahora/lapalmaahora/nuevo-volcan-palma-arrojado-80-millones-metros-cubicos-lava-f_1_8357503.html?fbclid=IwAR3yqzPSVvlIv0ZDol4bRgod3dc31qbn8-SJPQS3MgKvh9MS0pTMj7Yh6B4); Instituto Geológico y Minero de España, Pink Rivers, 23 28003 Madrid, (URL: https://www.igme.es/, https://twitter.com/IGME1849); Dirección General de Tráfico (DGT), Cabildo Insular de la Palma Av. Maritima 3 Santa Cruz de La Palma (URL: https://volcan.lapalma.es/pages/visor); NASA Global Sulfur Dioxide Monitoring Page, Atmospheric Chemistry and Dynamics Laboratory, NASA Goddard Space Flight Center (NASA/GSFC), 8800 Greenbelt Road, Goddard, Maryland, USA (URL: https://so2.gsfc.nasa.gov/); Copernicus EMS (URL: https://emergency.copernicus.eu/, https://twitter.com/CopernicusEMS); Sentinel Hub Playground (URL: https://www.sentinel-hub.com/explore/sentinel-playground).
2021: September
| October
| November
| December
Observations at La Palma on 15 December showed no lava flowing from vents at the W base of the main cone, from tubes, or at the lava delta in the Las Hoyas area. During 15-20 December tremor levels were at background levels and seismicity was very low at all depths. Sporadic gas emissions rose from the vents and from cooling lava flows. Small collapses from the walls of the main and secondary cone craters were visible through the week. Sulfur dioxide levels varied between extremely low and medium values (less than 5 to 999 tons per day) consistent with a cooling and degassing lava flow field. Even though air quality levels had improved overall, a few measurements of diffuse carbon dioxide emissions showed levels around 9 times average background. Authorities warned the public to exercise caution in areas surrounding the flow field due to volcanic gases in the area and noted that lava flows, although cooling, remained at high temperatures.
Sources: Instituto Volcanológico de Canarias (INVOLCAN); Gobierno de Canaries; Instituto Geográfico Nacional (IGN)
The eruption at La Palma continued during 8-13 December, characterized by sporadic Strombolian activity, occasional lava jetting, advancing and sometimes branching lava flows, and daily ash-and-gas emissions. Seismicity was low at depths of 10-15 km and very low at depths of 30-40 km. Volcanic tremor levels were also generally low, though they fluctuated near the end of the week concurrent with explosive activity.
During 8-12 December activity at several vents in the central and SE part of the main cone was low, with only sporadic pulses of Strombolian activity and ash emissions. Ash-and-gas plumes rose as high as 3.7 km a.s.l. and drifted SSE, SSW, SW, and W. Very intense gas emissions were recorded during 9-11 December. Small landslides from fractured areas in the upper part of the secondary cone (on the E flank) descended the interior part of the crater as well as the flanks. Lava from the vents moved through tubes towards the western part of the flow field, though two main breakout flows traveled W over older flows. The most active area was along the S margin of flow 9, where 9 and 11 had joined, as lava continued to descend the sea cliff and widen in the area of Las Hoyas. During 11-12 December lobes from the S margins of the flow traveled S over new ground in the Las Norias area.
On 12 December several strong pulses of tremor were accompanied by intense Strombolian activity, with the most intense events at 1200 and 1730 and decreased activity during 1300-1700. A small overflow of lava from one of the vents traveled N over older flows. One of the more intense periods produced dense dark ash plumes that rose 6 km a.s.l. and ejected bombs (some several meters in diameter) as far as 500 m away from the vent. New collapses were visible in the main cone, enlarging the crater, and at the secondary cone. During 12-13 December lava continued to travel W through tubes in the central part of the flow field. At the S margins lava filled in uncovered areas between flows 9 and 11. On 13 December tremor levels fluctuated with pulses of intense signals. A period of major explosive activity during 1745-1900 ejected bombs towards the N flank and produced ash-and-gas plumes. At 1820 video showed lava jetting above the vent and incandescent material falling onto the flanks. Activity at the vents quieted afterwards; tremor decreased at 2000 and by 2200 had reached background levels. Gas emissions from the vents were at high levels through 14 December. Lava continued to advance from the W base of the main cone on 14 December, though at a much lower rate compared to the day before. Small breakouts were visible near Montaña Cogote and Las Norias.
Gas and ash emissions continued to impact island residents. Daily measurements indicated that sulfur dioxide emissions persisted at “high” levels (between 1,000 and 29,999 tons per day). Suspended ash and high concentrations of volcanic gases, specifically sulfur dioxide, triggered periodic air-quality alerts mostly affecting the W part of the island including Los Llanos de Aridane, El Paso, and Tazacorte; authorities warned residents of affected areas to stay indoors. Residents and essential personnel were often barred from entering the exclusion zones to irrigate crops, gather belongings, and remove ash from streets and buildings, especially in Las Manchas, Las Norias, and La Bombilla. During 12-13 December diffuse carbon dioxide emissions were 6.9-7.2 times average background levels, specifically impacting the La Bombilla area where dead birds were observed.
Sources: Instituto Volcanológico de Canarias (INVOLCAN); Instituto Geográfico Nacional (IGN); Gobierno de Canaries
The eruption at La Palma continued during 1-7 December, characterized by Strombolian explosions and lava fountaining/jetting from multiple existing and new vents, advancing and sometimes branching lava flows, and almost daily ash emissions. Seismicity persisted at variable but elevated levels, with earthquake locations distributed at depths of 10-15 km and 30-40 km. Seismicity was intense at both levels during 30 November-2 December, though the intensity at deeper levels began to wane; in general, earthquake activity was low by the end of the week. Volcanic tremor levels fluctuated at medium to intense levels early in the week but by 3 December were also at low levels.
Several vents in the main cone continued to effuse lava, eject tephra, and emit ash-and-gas plumes. Lava moved W through pre-existing lava channels, lava tubes, over older flows, and over new ground, increasing the flow field that consists of overlapping flows (numbered 1-12) and two lava deltas. Persistent Strombolian activity was sometimes intense at the NE-flank vent during 1-3 December, and lava continued to feed flow 8 and the N delta. Lava fountains rose 400-500 m above the vent on 2 December. A new pyroclastic cone had formed around the vent, though it was unstable, and blocks from collapses of parts of it were transported downslope by lava flows. The northernmost flow, flow 12, traveled over new ground in the Fronton area and then rejoined flow 8 downslope. The flows reached part of the Tacande highway on 3 December. The vents in the main cone were quieter, periodically emitting ash and gasses. A N-S-oriented crack opened in an area 100 m S of the main vent, likely from subsidence, because it was not hot or emitting gas. The NE vent was quiet by 4 December.
On 3 December a new fissure opened on the SE of the main cone and produced Strombolian activity and fast-moving lava flows that traveled SW, along flow 10. The flow continued to advance W on 4 December, though at a slower rate as it moved over new ground in gaps between flows 3 and 11. Several new vents along an E-W fissure located W of Montaña del Cogote opened at noon on 4 December and produced multiple fast-moving lava flows. The flows descended SW over new ground, crossing into the municipalities of Tazacorte and Los Llanos de Aridane, destroying 60 homes. The flow joined flow 9, reached the sea cliff in the Las Hoyas area by 5 December, and descended the cliff the next day. During 6-7 December lava advanced W through multiple tubes and fed flows 1 and 2, and the S delta. The NE vent was quiet for a few days, but sporadic Strombolian activity and ash emissions had returned. Cracks and fractures in the upper part of the cone were visible. Several vents in the central and SE parts of the main cone also produced sporadic Strombolian activity and ash emissions. By 7 December lava had covered an estimated 11.82 square kilometers. The number of people that had evacuated and were staying in hotels had increased to 537.
Gas and ash emissions periodically impacted island residents. Suspended ash and high concentrations of volcanic gases triggered a few air-quality alerts mostly affecting the W part of the island; authorities warned residents in some areas to stay indoors. Residents and essential personnel were occasionally barred from entering the exclusion zones to irrigate crops and remove ash from streets and buildings. Ash-and-gas plumes visible during 1-3 and 6-7 December rose as high as 3.5 km a.s.l.; volcanic plumes drifted W, SW, and SSW all week, away from the airport. Daily measurements indicated that sulfur dioxide emissions persisted at “high” levels, indicating values of 1,000 to 29,999 tons per day.
Sources: Instituto Volcanológico de Canarias (INVOLCAN); Instituto Geográfico Nacional (IGN); Gobierno de Canaries
The eruption at La Palma continued during 24-30 November, characterized by Strombolian explosions and lava fountaining/jetting from multiple existing and new vents, advancing and sometimes branching lava flows, and daily ash emissions. The eruption began on 19 September and had been active for 70 days by 28 November. Volcanic tremor levels were low, though during 28-29 November levels fluctuated and were sometimes intense. Seismicity persisted at variable but elevated levels, with earthquake locations distributed at depths of 10-15 km and 30-40 km. Deeper seismicity decreased to low levels by 27 November while mid-level seismicity intensified through the week. The largest earthquake was a M 5 recorded at 0935 on 29 November at a depth of 36 km. A M 4.2 earthquake at a depth of 13 km was the largest event at mid-levels since the eruption began.
Several vents in the main cone continued to effuse lava, eject tephra, and emit ash-and-gas plumes. Lava moved W through pre-existing lava channels, lava tubes, over older flows, and over new ground, increasing the flow field that consists of overlapping flows (numbered 1-11) and two lava deltas. During 23-25 November flows 4, 5, and 7 at the N end of the flow field continued to widen and advance, filling in gaps between the flows, and fed the N delta. Flows 1, 2, and 9 minimally fed the S delta. There was also an increasing number of active flows on the flow field as lava overflowed some channel margins or broke out of tubes. At around 0900 on 25 November the lava effusion rate increased at main crater vents, and around 1100 two small E-W fissures opened less than 1 km S of the main cone. The easternmost vent produced a fast-moving lava flow that traveled along the S margin of flow 10 and around the S side of Montaña Cogote. The flow advanced through the Las Manchas cemetery and inundated parts of a solar power plant; the newly covered areas were part of the exclusion zone and had already been evacuated. The flow rate slowed to about 25 m per hour and joined flow 11 by 26 November. An overflow of lava SW of flow 3 produced a small branch oriented laterally the flow margin. Flow 7 widened during 26-27 November as it continued to be fed.
New vents opened on the NE flank of the main cone at around 0300 on 28 November, producing fluid lava flows that traveled N and NW through the Tacande area and crossed the LP-212 road. The opening of the new vents was followed by landslides on the NW flank of the cone. In a video taken at 1145 lava fountains rose from one of the vents while another ejected tephra. Dense billowing ash plumes rose from the main crater. Video taken at 1050 on 29 November showed lava flows transporting large blocks downslope. Another video showed lava flowing at a rate of about 1 m per second. By noon the vents in the main cone became notably less active and remained only intermittently active through 30 November. Several streams of lava from the new vents continued to advance NW and then W along older flows and split into two branches. One branch traveled through tubes and fed flows 4, 5, and 7 between Montaña de Todoque and Montaña de La Laguna and the other descended towards flow 8 (the most northern flow). Flows inundated previously untouched forest and agricultural land. By 30 November the width of the flow field had grown to 3.35 km and lava covered an estimated 11.34 square kilometers. The number of people that had evacuated and were staying in hotels had increased to 537.
Gas and ash emissions again impacted island residents. Suspended ash and high concentrations of volcanic gases triggered a few air-quality alerts mostly affecting the W part of the island; authorities warned residents of some affected areas to stay indoors. Essential personnel were occasionally barred from entering the exclusion zones to irrigate crops and remove ash from streets and buildings. Heavy rains during 25-26 November triggered warnings from authorities to stay away from steep slopes and drainages due to the possibility of lahars. Ash plumes rose as high as 4.8 km and drifted E during 24-26 November, and continued to deposit ash at La Palma airport. By 27 November winds had shifted and the ash at the airport had been removed, allowing it to open for the first time since 20 November. Ash plumes rose 1.4-3.5 km and drifted SW and SSW during the rest of the week. Sulfur dioxide emissions continued an overall downward trend during 23-26 November, though heavy rain sometimes prevented ground-based measurements. The trend was broken on 27 and 28 November with values of 30,000-49,999 tons per day, characterized as “very high.” During 29-30 November emission values were “high” or between values of 1,000 and 29,999 tons per day.
Sources: Instituto Volcanológico de Canarias (INVOLCAN); Instituto Geográfico Nacional (IGN); Gobierno de Canaries
The eruption at La Palma continued during 17-23 November, characterized by Strombolian explosions and lava fountaining/jetting from multiple vents, advancing and sometimes branching lava flows, and daily ash emissions. Eruption details are based on official sources including daily PEVOLCA (Plan de Emergencias Volcánicas de Canarias) steering committee summaries. Volcanic tremor levels increased during 16-17 November then returned to low levels. Seismicity persisted at variable but elevated levels, with earthquake locations distributed at depths of 10-15 km and 30-40 km. The number of located earthquakes peaked at 230 during 17-18 November, which was the highest daily total recorded since the beginning of the eruption. Additionally, a M 5.1 earthquake was detected at 0208 on 19 November at a depth of 36 km; this event was the largest earthquake recorded since the swarm heralding the magmatic intrusion began on 11 September. Dozens of events were felt by residents during the week.
Several vents in the main cone continued to effuse lava, eject tephra, and emit ash-and-gas plumes at varying intensities. Lava was transported W through pre-existing lava channels and tubes or descended over older flows and over new ground, increasing the area of the flow field, which was made up of overlapping flows numbered 1-11. Flows 1, 2, and 9 had merged and contributed lava to the main delta, which had grown more than 0.43 square kilometers by 23 November.
In the evening of 18 November lava overflowed one of the craters in the main cone and increased the lava-flow rate; crater overflows were again visible on 21 November. Lava filled in some gaps between the N flows, numbers 4 and 7. During 17-18 November flow 5 advanced along the N base of Montaña de Todoque and along the S edge of flow 4 which had also advanced and widened. By 21 November flow 4 had merged with flow 7, the branch to the N. Flow 7 advanced W and by 1303 on 22 November lava reached the sea at La Viña Beach. Plumes ranging from white to dark gray rising from the new ocean entry prompted an air quality warning to be issued for about 3,000 people living in areas of San Borondón, Tazacorte, El Cardón, and Camino Los Palomares, all within about a 2 km radius to the N and NE. A ban on maritime activities near the entry also went into effect, though it was lifted the next morning. By 23 November the width of the flow field had grown to 3.3 km and lava covered an estimated 10.73 square kilometers.
Sulfur dioxide emissions fluctuated at high levels between 900 and 32,000 tons per day, remaining at levels lower than the peak values of 50,000 tons per day recorded on 23 September. Suspended ash and high concentrations of volcanic gases triggered a few air-quality alerts mostly affecting the W part of the island; authorities warned residents of some affected areas (Los Llanos de Aridane, Tazacorte, El Paso, Puntagorda, and Tijarafe in particular) to stay indoors. High values of volcanic gases led to the evacuation of essential personnel working in plants in the exclusion zone during 16-17 November. After a lull in activity for a period of time on 17 November, Strombolian activity and ash emissions resumed later in the day and prompted a VONA the next day. Video posted at 1615 on 18 November showed jetting lava and billowing ash plumes containing some lightning flashes. Sometimes dense and billowing ash-and-gas plumes rose 2-3.7 km (6,600-12,100 ft) a.s.l. and drifted NE, E, ESE, and SW during the rest of the week. The 20 November PEVOLCA reported that the total volume of emitted tephra during the eruption had surpassed 10 million cubic meters. Ash deposits on runways and unfavorable flying conditions disrupted flights at La Palma airport during 21-23 November.
Sources: Instituto Volcanológico de Canarias (INVOLCAN); Instituto Geográfico Nacional (IGN); Gobierno de Canaries; Aena
The eruption at La Palma continued during 10-16 November, characterized by Strombolian explosions and lava fountaining from multiple vents, advancing and sometimes branching lava flows, and daily ash emissions. Eruption details are based on official sources including daily PEVOLCA (Plan de Emergencias Volcánicas de Canarias) steering committee summaries. Volcanic tremor levels continued to be low. Seismicity at intermediate depths of 10-15 km remained low compared to previous weeks. The number and magnitude of deeper events, 20-38 km deep, increased during 9-11 with the highest number of deeper events recorded since the beginning of the eruption; the rate of deeper events decreased during 11-12 November. Two M 5 earthquakes were the largest events recorded during the week, occurring at 0447 on 11 November at a depth of 30 km and at 0756 on 13 November at a depth of 38 km.
Several vents in the main cone continued to effuse lava, eject tephra, and emit ash-and-gas plumes. The activity levels varied in intensity, though decreased overall during the week. By 10 November the highest point of the main cone was 1,130 m a.s.l. Lava continued to flow west through pre-existing lava channels and tubes, over older flows, and occasionally formed new branches. Occasional short-lived overflows of lava ponds occurred at the main crater vents. The flow field was made up of overlapping flows numbered 1-11. Lava filled in some gaps between the N flows, numbers 4 and 7, though lava-flow advancement was mainly focused at and near the ocean entries, with lava feeding flows 1, 2, and 9. The first flow, number 1, had previously reached the sea, and flow 9 had stalled before reaching the coast. Flow number 2 (in between 1 and 9) had reached the sea at Los Guirres Beach on 9 November, and sent a new branch N that entered the ocean at 0144 on 10 November. Flow 2 continued to advance during the week, filling in gaps between flows 1 and 9, and adding to the new lava delta laterally. Areas of high turbidity in the water column as far as 1 km from the lava front were caused by underwater lava advancement. By 16 November the width of the flow field had grown to 3.2 km.
Sulfur dioxide emissions fluctuated at high levels between 7,000 and 43,000 tons per day on most days, but was as low as 2,000-4,000 tons per day on 13 and 15 November. Sometimes dense and billowing ash-and-gas plumes rose 1.8-3.1 km (5,900-10,200 ft) a.s.l. and drifted in multiple directions. Ash emissions intensified on 14 November. Clean-up of ash from streets and homes was conducted by both authorities and residents. According to a news report a resident that was granted permission to enter the exclusion zone to clean ash off of his roof died in the neighborhood of Corazoncillo of unknown causes. Fresh ash emissions from the volcano, and ash resuspended by people and vehicle movements, triggered a few air-quality alerts issued during 14-16 November; authorities warned residents of some affected areas (Los Llanos de Aridane, Tazacorte, El Paso, Puntagorda, and Tijarafe) to stay indoors. On 16 November ash drifted W and SW and caused some flight disruptions at the La Palma airport.
Sources: Instituto Volcanológico de Canarias (INVOLCAN); Instituto Geográfico Nacional (IGN); Gobierno de Canaries; EL PAÍS
The eruption at La Palma continued during 2-9 November, characterized by Strombolian explosions and lava fountaining from multiple vents, advancing and branching lava flows, and daily ash emissions. Eruption details are based on official sources including PEVOLCA (Plan de Emergencias Volcánicas de Canarias) steering committee daily summaries. Volcanic tremor levels decreased around noon on 2 November and again during 4-5 November, and remained at low levels through 9 November. Most earthquakes were located 10-15 km deep (though some were as deep as 38 km); dozens of events were felt by local residents and some were felt across the entire island. At 0824 on 3 November a M 4.8 located 36 km deep was followed three seconds later by a M 5 at 35 km depth; they were perceived by residents as one long event; the M 5 was the largest earthquake of the week. Two other notable earthquakes occurred consecutively; a M 4.6 at a depth of 37 km at 1807 on 7 November was followed eight seconds later by a M 4.5 at 38 km depth. Some of the larger earthquakes were felt across La Palma Island, as well as in some areas of La Gomera and Tenerife islands. In general, decreases were observed in the levels of seismicity, tremor, deformation, and sulfur dioxide emissions, though by 9 November the data continued to fluctuate with no consistent trends.
The vents in the main cone continued to effuse lava, eject tephra, sometimes producing dense billowing ash-and-gas plumes that rose 2.5-3.5 km (8,200-11,500 ft) a.s.l. and drifted WSW, SW, and SSE. Several vents in the main cone were active, though the activity levels varied in intensity throughout the week. Weather conditions and large amounts of emitted ash resulted in air quality alerts issued daily by authorities as they warned residents of some affected areas (Los Llanos de Aridane, Tazacorte, El Paso, Puntagorda, and Tijarafe) to stay indoors; air quality was “extremely unfavorable” on most days then upgraded to “unfavorable” on 9 November. Sulfur dioxide emissions fluctuated at high levels between 9,000 and 31,300 tons per day and showed an overall decrease. On 5 November photos showed sulfur deposits on the E flank on the main cone and in other areas near vents emitting volcanic gases.
Lava continued to flow west through pre-existing lava channels and tubes, over older flows, and occasionally formed new branches. The flows were numbered 1-11. Flow 11 originated at the end of October along the upper central part of the S margin of the flow field, N of Montaña Cogote; by 3 November it was 100 m from the LP-211 road and on 6 November the advancement rate increased. Lava number 2, located between the main flow, number 1, that had reached the ocean on 21 September and flow number 9 which had previously branched off of the main flow to the S, advanced during 8-9 November. The flow reached the sea cliff at Los Guirres Beach and then entered the ocean at 0245 on 9 November. Overall, the flow field covered an estimated 9.84 square kilometers by 8 November.
Sources: Instituto Volcanológico de Canarias (INVOLCAN); Instituto Geográfico Nacional (IGN); Gobierno de Canaries
The eruption at La Palma continued during 26 October-2 November, characterized by Strombolian explosions, lava fountaining from multiple vents, advancing and branching lava flows, and daily ash emissions. Eruption details are based on official sources including PEVOLCA (Plan de Emergencias Volcánicas de Canarias) steering committee summaries issued daily. Seismicity remained elevated, with most earthquakes located 10-15 km deep (though some were as deep as 38 km); dozens of events were felt by local residents and some were felt across the entire island. A M 5 earthquake was recorded at 0724 on 30 October at a depth of 35 km and was the largest earthquake recorded since the beginning of the eruption. A second M 5 earthquake was recorded at 1852 on 1 November and had a depth of 38 km. Both of these events, as well as some of the other notable earthquakes, were felt across La Palma Island and in some areas of La Gomera and Tenerife islands.
The vents in the main cone continued to effuse lava, eject tephra, and produce sometimes dense and billowing ash-and-gas plumes that rose 2.2-5 km (7,200-16,400 ft) a.s.l. Several vents in the main cone were active, though the activity levels varied in intensity throughout the week. A small collapse of the upper part of the main cone on 26 October caused lava to flow W over previous flows that filled in some small gaps where they had not previously covered. Beginning around noon on 29 October a series of intense and audible explosions occurred for several hours, generating a large amount of ash that was distributed across the valley. The tallest ash plumes were observed during 30-31 October. Audible explosions and significant ash emissions continued intermittently through 2 November, with ashfall affecting the entire W and NW parts of the island. Authorities issued multiple air quality alerts warning residents of some affected areas (Los Llanos de Aridane in particular), to stay indoors and, if going outside, to wear a filtering mask. For a period of time on 31 October the larger explosions were accompanied by shock waves and concurrently, the effusion rate at the NW flank vent notably increased. Sulfur dioxide emissions fluctuated at high levels between 4,990 and 22,000 tons per day during 27 October-2 November and showed an overall downward trend during the last week in October; no estimates were made on 29 October due to technical difficulties.
Lava effused at a high rate from a vent on the NW flank of the main cone, flowing through pre-existing lava channels and tubes, and occasionally breaking out and forming new flows. The lava-flow field was characterized by three main areas: the initial main flow that traveled W, flowing around the S part of Montaña de Todoque, toward the sea and creating a lava delta, a flow that had branched off of the main flow to the S, and the flows that traveled W along the N margins of the main flow. Lava flows sometimes overflowed their channels, forming ephemeral flows that spread laterally, descended short distances, and were also transported downslope in lava tubes. The initial flow that reached the sea and formed the delta was not notably fed and was 30 m thick in some areas. The lava flows that had advanced W along the S side of Montaña de La Laguna was 86 m from the coast of Tazacorte, near the beach of El Perdido. The southern flow had advanced at a low rate and by 28 October was 400 m from the sea by 27 October. Lava that travelled SW over older flows emplaced along the S margins of the flow field overflowed the channel, bifurcated, and quickly advanced 1.5 km W and SW over new ground during 28-30 October. This lava flow continued to advance and by 2 November it was 150 m from the LP-211 road, though the advancement rate had slowed considerably to 1 meter per hour. Overall, the flow field widened to 3.1 km, with most of the expansion occurring along the S margins, and covered an estimated 9.77 square kilometers by 2 November.
Sources: Instituto Volcanológico de Canarias (INVOLCAN); Instituto Geográfico Nacional (IGN); Gobierno de Canaries
The eruption at La Palma continued during 20-26 October, characterized by Strombolian explosions, lava fountaining from multiple vents, advancing and branching lava flows, and daily ash emissions. Eruption details are based on official sources including PEVOLCA (Plan de Emergencias Volcánicas de Canarias) steering committee summaries issued daily. Seismicity remained elevated, with most earthquakes located 10-15 km deep (though some were as deep as 39 km); dozens of events were felt by local residents and some were felt across the entire island. A M 4.8 earthquake was recorded at 2248 on 19 October at a depth of 39 km, and the largest earthquake recorded since the beginning of the eruption, a M 4.9 at 38 km deep, was recorded at 1634 on 23 October; both of these events were felt across La Palma Island, as well as in some areas of Gomera and Tenerife islands.
The vents in the main cone continued to effuse lava, eject tephra, and produce sometimes dense and billowing ash-and-gas plumes that rose 2.8-4 km (9,200-13,100 ft) a.s.l. Sulfur dioxide emissions fluctuated at high levels between 3,200 and 53,600 tons per day. Four vents in the main cone were active, though the activity levels varied in intensity throughout the week. A new vent opened on 19 October, in an area between the 16 October vent (located 300 m from the SE base of the main cone) and the main cone. The new vent began with explosive phreatomagmatic activity before Strombolian activity commenced. The main cone changed shape, with cycles of partial crater rim and wall collapses and growth as the eruption continued. Explosions and a lava overflow from the main cone were visible at 2000 on 22 October. A partial collapse of the NW flank of the main cone on 23 October intensified ash emissions and sent large blocks downslope; the blocks fell onto another vent, causing lava to spill out into numerous lava flows. Strong explosions were heard at 1230 and lava overflowed a vent on the flanks of the main cone at 1415. On 24 October tall lava fountains rose from at least two vents. During the afternoon, a new vent opened on the W flank and effused lava at a high rate. The vent grew taller and widened during 24-25 October. The vent located at the SE end of the fissure produced slow-moving lava flows that traveled SW. Very intense explosive activity was visible on 25 October. A small collapse of the cone was observed at 1700. At around 2100 a lava lake in the main cone increased in volume, causing a partial collapse of the upper part of the cone, and producing large, detached blocks that were carried downslope by several lava flows. Lava fountains rose about 600 m above the vent.
The lava-flow field was characterized by three main areas: the initial main flow that traveled W, flowing around the S part of Montaña de Todoque, toward the sea and created a lava delta, a flow that had branched off of the main flow to the S, and the flows that traveled W along the N margins of the main flow. Lava flows sometimes overflowed their channels, forming ephemeral flows that spread laterally, descended short distances, and were also transported downslope in lava tubes. The lava flows along the northern margins (the N flow) were the most active; the flow that traveled N of Montaña Todoque had stopped, while the flow to the S of Montaña de La Laguna continued to advance and spread laterally. A lull in lava advancement during 22-23 October allowed for some homeowners to retrieve items from their residences. Lava advanced over some areas in the flow field that were previously unaffected, particularly in Alcalá, and covered an estimated 8.79 square kilometers by 26 October. The farthest end of N flows was less than 100 m from the coastline.
Lava at the delta had reached 120 m water depth and rock fragments from the end of the flow were observed at depths of 360 m. The thickness of the flow at the delta was 10-30 m; lava had filled the upper and middle parts of underwater ravines and covered an area of about 0.11 square kilometers. Scientists observed an absence of marine life around the lava flows.
Sources: Instituto Volcanológico de Canarias (INVOLCAN); Instituto Geográfico Nacional (IGN); Gobierno de Canaries
The eruption at La Palma continued during 13-19 October, characterized by Strombolian explosions, lava fountaining from multiple vents, advancing and branching lava flows, and daily ash emissions. Eruption details are based on official sources, including PEVOLCA (Plan de Emergencias Volcánicas de Canarias) steering committee summaries. Seismicity continued to be elevated, with most earthquakes located 10-15 km deep (though some were deeper than 35 km); dozens of events were felt by local residents, and some were felt across the entire island. The earthquakes were located generally in the same area where the swarm first began on 11 September, though hypocenters slightly shifted S and E. A M 4.5 earthquake was recorded each day during 14-16 October at depths of 36-37 km, though the largest event recorded on 18 October was a M 4.6 that originated at a depth of 36 km.
The vents in the main cone continued to effuse lava and produced ash plumes that rose as high as 5 km (16,400 ft) a.s.l. A vent located 300 m from the SE base of the main cone was again active by 15 October and produced ash-and-gas emissions at least through 19 October; the vent reactivated simultaneously with a period of increased phreatomagmatic activity at the main vent. Sulfur dioxide emissions fluctuated at high levels between 2,882 tons per day and at least 20,000 tons per day. Sulfur dioxide plumes spread out in multiple directions, drifting NW through Spain, France, and Germany on 19 October.
The lava-flow field was characterized by three main areas: the initial main flow that traveled W, flowing around the S part of Montaña de Todoque toward the sea and creating a lava delta; a flow that had branched off of the main flow to the S; and flows that traveled W along the N margins of the main flow. During 13-19 October the lava flows along the northern margins (the N flow) were most active and were comprised of two main branches. On 13 October a preemptive evacuation of about 400 people from La Laguna in Los Llanos de Aridane was initiated as part of the N flow advanced NW. During 15-19 October large blocks were carried downslope by the advancing N flows, and on occasion, the flows would overflow their channels, forming ephemeral flows that spread laterally and descended short distances. The lava flow reached Montaña de La Laguna, traveled around the S part, and continued W toward the sea. By 19 October the end of the flow was 100-110 m from the coastline. The main and S lava flows were being only minimally fed. Small avalanches in areas with thick ash deposits descended slopes near the Tamanca ravine, generating small ash plumes.
By 19 October the flow field was 2.9 km wide and covered almost 7.8 square kilometers. More than 50 kilometers of roads had been damaged. Lava had engulfed 1,956 buildings, 60 of which were partially damaged, and almost 2.3 square kilometers of crops were lost. About 6,400 people had been evacuated. The Alert Level remained at Red (the highest level on a four-color scale) for affected communities.
Sources: Instituto Geográfico Nacional (IGN); Instituto Volcanológico de Canarias (INVOLCAN); Gobierno de Canaries
The eruption at La Palma continued during 6-12 October, characterized by Strombolian explosions, lava fountaining from multiple vents, advancing and branching lava flows, and daily ash emissions. Eruption details are based on official sources including PEVOLCA (Plan de Emergencias Volcánicas de Canarias) steering committee summaries. Seismicity continued to be elevated with most earthquakes located 10-15 km deep (though some deeper than 35 km) in the same area where the swarm first began on 11 September; dozens of events were felt by local residents and some were felt across the entire island.
The largest earthquake, at 0816 on 12 October, was a M 4.1 at a depth of 37 km. Sulfur dioxide emissions fluctuated at high levels between 4,522 and 21,868 tons per day. Sulfur dioxide plumes drifted in multiple directions; on 8 October they reached the Caribbean and on 12 October plumes were over northern Africa, Spain, and Portugal. The main cone had at least three effusive vents and another vent to the N was also active. Multiple collapses of parts of the cone sometimes sent large blocks of cooler lava rafting down the flows. The lava delta was fed by numerous streams of lava during most of the week. Plumes of steam containing hydrochloric acid rose from the edge of the lava delta and were quickly dissipated by the wind; local resident were not affected.
On 6 October a breakout lava flow from the W end of the main flow field traveled S between Los Guirres and El Charcó (previously evacuated), destroying crops and buildings. The flow covered about 0.4 square kilometers and was about 350 m from the coast. Ash plumes rose 3-3.2 km (10,000-10,500 ft) a.s.l. during 6-7 October. On 8 October a new vent formed on the main cone and ash plumes rose as high as 3.5 km (11,500 ft) a.s.l. Ash accumulation at the La Palma and Tenerife North (on Tenerife Island) airports caused a temporary shutdown of operations until the ash was removed. On 9 October a collapse of the N part of the cone sent a wide, multi-lobed flow carrying larger blocks NW over older flows that quickly advanced W along the N margins of the flow field, covering crops and destroying buildings in both Todoque and an industrial area. Ash plumes continued to rise from the vents; lightning was visible in the plume at times.
By 10 October the flow field was 1,520 m wide, and covered 4.9-5.7 square kilometers, depending on the source of the estimates. Between 726 and 1,323 buildings had been engulfed by lava and more than 1.3 square kilometers of crops were lost. About 6,000 people had been evacuated. A partial collapse of the cone allowed the inner lava lake to spill out, sending flows and very large cooled blocks downslope. Ash plumes rose 3.5 km a.s.l. and caused ashfall to the S. Video showed lava fountains rising 500 m above the vent late that night. By 11 October the lava delta had grown mainly to the N and S, and was an estimated 0.34 square kilometers in size, though flows feeding it had slowed. Dense dark ash plumes were seen rising from the main vents. The most northern flow had continued to advance and was 300 m from the coast. The flows overtook a concrete plant, prompting authorities to instruct residents in El Paso and Los Llanos de Aridane to remain indoors and take measures to reduce exposure to toxic fumes. On 12 October the advancing northern flow caused the pre-emptive evacuation of the La Laguna area, totaling 700-800 people. The flow continued to cover crops and was 200 m from the coast, but had slowed. The lockdown for El Paso and Los Llanos de Aridane was lifted after air quality improved. Ash plumes from the main vent rose 3.5 km a.s.l. The Alert Level remained at Red (the highest level on a four-color scale) for affected communities.
Sources: Instituto Volcanológico de Canarias (INVOLCAN); Instituto Geográfico Nacional (IGN); Gobierno de Canaries; Advanced geospatial Data Management Platform (ADAM); Asociación Volcanes de Canarias; Instituto Geológico y Minero de España (IGME); Aena; 1-1-2 Canarias
The eruption at La Palma continued during 29 September-5 October, characterized by Strombolian explosions, lava fountaining from multiple vents, lava flows, and daily ash emissions. Seismicity continued to be elevated with earthquakes located mainly 10-15 km deep (though some were 25-40 km deep) in the same area where the swarm first began on 11 September; dozens of events were felt by residents.
Within the first eight days of the eruption, 21-27 September, an estimated 50 million cubic meters of material had been erupted. Just before midnight on 28 September the lava reached the ocean, producing a steam-and-gas plume; within 45 minutes the lava created a 50-m-high delta. The sulfur dioxide flux was as high as 16,760 tons per day. On 29 September the PEVOLCA (Plan de Emergencias Volcánicas de Canarias) steering committee restated that the 2.5 km and maritime exclusion zones around the vents and ocean entry, respectively, remained in effect; residents were periodically allowed to collect belongings and care for animals and crops. The lava covered almost 4.8 square kilometers, burying or damaging 744 buildings. There were 185 evacuees in a local hotel. Ash plumes continued to rise from the active vents, and IGN noted a decrease in plume altitude to 3.5 km (11,500 ft) a.s.l. on 29 September and then a rise to 5 km (16,400 ft) a.s.l. the next day.
Lava continued flowing to the sea along the same path. The lava delta had grown three times in size by 30 September to an estimated 0.17 square kilometers; the furthest edge of the delta was 450 m from the coast, it had spread laterally 600-800 m, and was as thick as 24 m. PEVOLCA lifted access restrictions for residents of Tazacorte, San Borondón, Marina Alta, Marina Baja, and La Condesa (nearly 4,000 people); they had previously been warned to stay indoors to minimize coming into contact with potentially toxic gas plumes generated from the ocean entry. Restrictions for other residents living near the margins of the flows were also lifted.
Two vents opened about 600 m NW of the main cone on 1 October and within two days had formed small cones. Lava from the vents traveled W and joined the main flow field downslope. The lava delta had extended 540 m from the coastline. Ash plumes rose to 3-5 km a.s.l. and drifted S on 2 October, and sulfur dioxide emissions were 3,401 tons per day.
By 3 October an estimated 946 houses had been completely demolished and 128 had been partially damaged. The width of the flow field was a maximum of 1,250 m and lava tubes were identified in satellite images. The lava delta had developed four lobes being fed by multiple flows and had an estimated area of 0.32 square kilometers. In the afternoon the frequency and intensity of explosive activity increased and bombs were ejected as far as 800 m. Lava fountains rose hundreds of meters and ash plumes rose as high as 4.5 km (14,800 ft) a.s.l. The sulfur dioxide emission rate reached 16,000 tons per day. During 1900-1945 one of the new cones collapsed, which allowed the inner lava lake to spill out, sending flows downslope carrying blocks from the destroyed portion of the cone. Ash plumes rose as high as 4.5 km a.s.l. and explosions ejected bombs on 5 October according to a news report. Some explosions produced dense black plumes that billowed as they rose above the vent. The Alert Level remained at Red (the highest level on a four-color scale) for affected communities.
Sources: Instituto Volcanológico de Canarias (INVOLCAN); Instituto Geográfico Nacional (IGN); EL PAÍS; EL PAÍS; EL PAÍS; EL PAÍS; EL PAÍS; Jorge Eduardo Romero Moyano (University of Manchester); Gobierno de Canaries; 1-1-2 Canarias
The eruption at La Palma continued during 21-28 September, characterized by Strombolian explosions, lava fountaining from multiple vents, advancing lava flows, and sometimes dense, daily ash emissions. A strong increase in tremor amplitude during the afternoon of 21 September was coincident with intensifying Strombolian activity. Explosive activity again increased on 22 September and dense plumes with abundant amounts of ash rose 3-4.6 km (10,000-15,000 ft) a.s.l. and caused ashfall in areas downwind; ash deposits were 3 cm thick in an unspecified area 1 km from the vents. The main lava flow advanced W towards the coast. Ash emissions significantly increased on 23 September with plumes rising as high as 5 km (16,400 ft) a.s.l. A series of powerful explosions began at 1720 and shock waves could be seen propagating through the emission plumes. Vigorous lava fountaining was continuous. Volcanic tremor amplitude was high and variable, peaking at 1500 on 24 September with the highest values since the eruption started. The peak occurred just before two new vents opened on the flank of the main cone, and then notably decreased afterwards, but remained at high levels. Lava from the new vents rapidly traveled more than 1 km downslope, covering older flows, before slowing to 60-80 meters per hour. According to a news report, the explosions ejected tephra outside of the exclusion zone. An evacuation order was issued in the early afternoon for Tajuya, Tacande de Abajo, and part of Tacande de Arriba, affecting 300-400 people. Three airlines suspended flights to La Palma. The lava flow field had expanded to 1.9 square kilometers, destroyed more than 420 buildings, and covered 15.2 km of roads.
Tremor amplitude decreased around noon on 25 September, along with the intensity of the Strombolian explosions. During 25-26 September ash fell in nearby municipalities and as far as the E coast of the island. On 26 September the PEVOLCA steering committee recommended that residents who had evacuated two days earlier could return. The report described two main lava flows, with a highly fluid northern flow and a southern flow that was 2.5 km long. Sulfur dioxide emissions remained significant with an average rate of 25,000 tons per day, and ash plumes rose as high as 3 km above the vents. Lava continued to advance and flowed through Todoque, crossing the LP-213 road, just W of the main part of the town, at around 1900. The flow was 600 m across at the widest part and the leading edge was 4-6 m tall. Lava fountaining and low-intensity Strombolian explosions persisted. Copernicus EMS estimated that the lava covered 2.37 square kilometers, had destroyed 513 houses, and covered 18.9 km of roads. Multiple lava fountains feeding flows were visible on 27 September though the activity waned for a period of about eight hours. By the evening activity had resumed and low-intensity Strombolian explosions were visible.
Beginning at 0245 on 28 September lava fountains fed a new high-temperature, fast-moving flow that descended on top of older flank flows. The leading edge of the main flow continued to advance W and covered banana greenhouses, burning the plastic and igniting a storage of fertilizer resulting in small explosions and a brown odorous plume. About 140 more structures were covered by flows. In preparation for a possible ocean entry, authorities recommended that residents within a 5 km radius of the coastline keep their doors and windows closed, to stay away from windows in case they break, and to cover faces and skin in case of ashfall. Dense ash-and-gas plumes continued to rise from the main vents, as high as 5 km; the rising plume created gravity waves that looked like ripples moving away from the top of the plume. Late in the day lava reached the coastal area, descended a 100-m-high sea cliff, and by 2302 reached the ocean at Playa de los Guirres. Black-and-white plumes rose from where the lava contacted the water.
Sources: Instituto Geográfico Nacional (IGN); Instituto Volcanológico de Canarias (INVOLCAN); Gobierno de Canaries; EL PAÍS; CNN; EL PAÍS; Toulouse Volcanic Ash Advisory Centre (VAAC); Copernicus Emergency Management Service
An eruption began at La Palma after about a week of intensifying seismicity that showed hypocenters becoming shallower and moving NW, and significant related inflation. During 17-18 September the PEVOLCA (Plan de Emergencias Volcánicas de Canarias) steering committee (comprised of representatives from multiple agencies, local authorities, and institutions) reviewed mitigation, evacuation, and emergency plans. Helicopter and drone overflights were conducted in areas thought to be at risk from an eruption. IGN reported that during 17-18 September seismicity decreased, though an M 2 felt by local residents was located at 100 m depth, and vertical deformation occurred near the earthquake epicenters.
IGN noted that seismicity intensified during the morning of 19 September, with earthquakes located at 0-6 km depth; a M 4.2 event was recorded at 1116 and vertical deformation increased. Authorities evacuated about 50 residents with reduced mobility and their companions from Las Manchas de Abajo, Jedey, San Nicolás and El Paraíso (El Paso and Los Llanos de Aridane), El Charco (Fuencaliente), La Bombilla (Los Llanos de Aridane and Tazacorte), and El Remo and Puerto Naos (Los Llanos de Aridane). Residents in an area prone to landslides were also evacuated. Other preparations continued at the hospital, in neighborhoods, and at evacuation centers.
At 1510 on 19 September an eruption began in the area of Cabeza de Vaca, in the municipality of El Paso. Observers near the eruption site observed a large explosion that ejected material and produced a gas-and-ash plume; volcanic tremor was recorded by the seismic network. Two 200-m-long fissures aligned N-S opened about 200 m apart. INVOLCAN scientists observed seven vents along the fissures during the initial stage of the eruption. Multiple tall lava fountains fed flows downslope to the W, igniting forest fires. Photos and video posted by IGN showed multiple pulsating fountains fanning out from parts of the fissure. Ash plumes rose about 1.5 km and gas plumes rose 3 km and drifted ESE. The PEVOLCA steering committee briefly raised the Alert Level to Orange, and then to Red (the highest level on a four-color scale) by 1700 for high-risk municipalities directly affected by the eruption. About 5,500 people evacuated with no injuries reported, and authorities recommended that residents stay at least 2 km from the vents. The La Palma airport briefly closed, livestock were evacuated, and education centers were closed along with sections of multiple highways. Later that day INVOLCAN scientists who measured an area of the flows determined an average flow rate of 700 m per hour and temperatures around 1,075 degrees Celsius. By the next day a main cone had formed.
The sulfur dioxide gas emission rate was 6,000-11,500 tons per day during 19-20 September. Satellite data showed a plume of sulfur dioxide drifting 475 km SE and reaching the coastline of Africa by 20 September. A map produced on 20 September by IGN in partnership with Copernicus Emergency Management Service (EMS) showed that the main part of the lava flow had traveled more than 3 km W and another branch extended about 1.5 km WSW. The flows had covered about 1 square kilometer and destroyed an estimated 166 buildings. A news article noted that activity was concentrated at four main vents, the last (and ninth) of which opened at 1956 on 20 September about 900 m from the main vents. Strong lava fountaining continued during 20-21 September and ash fell in the vicinity of the vents. Ash plumes rose 2.4-4.6 km (8,000-15,000 ft) a.s.l. and drifted as far as 55 km SW and S according to the Toulouse VAAC. Sulfur dioxide gas plumes drifted W and E at an altitude of 3 km (10,000 ft) a.s.l. By 0814 on 21 September an updated Copernicus EMS map showed that 350 homes had been covered by lava and the flow field had expanded to 1.54 square kilometers. According to a news report lava up to 12 m thick was advancing at a rate of 200 m per hour. A few hundred more residents evacuated as lava advanced towards Tacande; bringing the number of evacuees to about 5,700. The S lava branch was advancing slowly, at a rate of 2 m per hour. Later that day INVOLCAN stated that increased volcanic tremor amplitude reflected greater intensity of Strombolian explosions at the vents.
Sources: Instituto Geográfico Nacional (IGN); Instituto Volcanológico de Canarias (INVOLCAN); Toulouse Volcanic Ash Advisory Centre (VAAC); Gobierno de Canaries; Gobierno de Canarias; Gobierno de Canarias; Advanced geospatial Data Management Platform (ADAM); Cabildo de La Palma; Cartografía Digital; 1-1-2 Canarias; Aviation24.be; El Periódico; rtvc Ente Público Radio Televisión Canaria; NOTICIAS 8 ISLAS
Instituto Geográfico Nacional (IGN) and Instituto Volcanológico de Canarias (INVOLCAN) reported that a seismic swarm beneath Cumbre Vieja at the S part of La Palma began at 1618 on 11 September and was likely associated with a magmatic intrusion. The swarm intensified in number of events and magnitude, and by 1600 on 12 September a total of 315 earthquakes had been recorded and ranged 8-13 km in depth. The largest event was a M 2.8 (on the Mb_lg scale). On 13 September a scientific committee comprised of representatives from multiple agencies and institutions raised the Alert Level to Yellow (the second lowest level on a four-color scale) for the municipalities of El Paso, Los Llanos de Aridane, Mazo, and Fuencaliente de la Palma. By 0800 on 14 September 2,935 earthquakes had been detected. Larger events were felt by residents during 13-14 September; the largest earthquake was a M 3.9, recorded at 0600 on 14 September. Overall, the events were becoming shallower (8-10 km) and hypocenters migrated slightly to the W. GPS and tiltmeter networks showed deformation totaling 1.5 cm centered over the clusters of epicenters.
A total of 10 seismic swarms have been detected at La Palma since 2017; one in 2017, one in 2018, five in 2020, and three in 2021. The earthquakes in the previous swarms were deeper, between 20 and 30 km, and were less intense than the current swarm.
Sources: Instituto Volcanológico de Canarias (INVOLCAN); Gobierno de Canarias; Instituto Geográfico Nacional (IGN)
Reports are organized chronologically and indexed below by Month/Year (Publication Volume:Number), and include a one-line summary. Click on the index link or scroll down to read the reports.
Eruption produces lava fountains from three vents
Card 1305 (27 October 1971) Gas and tephra emission after several days of seismicity
The following cable was received from E.M. Fournier d'Albe on 27 October. "On 26 October after several days microseismic activity fissures opened in southern extremity Isla de La Palma Canaries with emission of gases and ejection rock fragments. No lava emission yet observed. Spanish Institute Geological Research sending team to observe eruption."
Card 1307 (28 October 1971) Three vents generated lava fountains and flows that reached the sea
The following cable was received from E.M. Fournier d'Albe on 28 October. "On 26 October 1640 GMT through the opened fissure mentioned in the previous report emission of gases and tephra started. Three main vents are working simultaneously. The vents evolved to lava fountains and formed two main lava flows which reached the sea at the southern tip of the island. Prof. Fuster and teams from Research Council of spain and University of Madrid and La Languna will arrive at La Palma 27 and 28 October."
Information Contacts:
Card 1305 (27 October 1971) Jose M. Fuster-Casas, University of Madrid, Spain; E.M. Fournier d'Albe, UNESCO, Paris, France.
Card 1307 (28 October 1971) Jose M. Fuster-Casas, University of Madrid, Spain; E.M. Fournier d'Albe, UNESCO, Paris, France.
Activity from six different vents through 18 November builds Teneguia cone
Card 1309 (02 November 1971) Northern vent builds spatter cone 180 m high
"...during 28 through 30 October only three vents were active. The fracture is 300 m long, its strike being 345 degrees. The northern vent throws lapilli and large bombs to a height of 500-700 m. It has a rhythm of 45 pulses per minute. This vent has built a spatter cone 180 m high and has spread a thin cover of lapilli over the area SE of the cone. The southern vent only throws bombs and scoriae. Lava is emitted through the upper vent and through a point in the middle of the fracture of the southern end of the island 2,500 m away from the vent. The flows from the central vent reached the sea forming a new platform. The lavas are alkaline basalts with hornblende phenocrysts. Casualties have happened but there is very little damage reported by Fuster."
Card 1310 (04 November 1971) Description of lava composition
The following cable from Professor Fuster was received on 4 November. "Teneguia volcano mineralogical lava composition 10 per cent of phenocrysts, including 5 DF augite 3 of basaltic hornblende of ore. Ninety per cent matrix containing mainly ore and augite and less abundant plagioclase microlites. Some samples have the same phenocrysts in a glassy matrix with plagioclase microlites."
Card 1311-1311a (04 November 1971) Eruptions and lava flows during 31 October-4 November
The following report was received through the courtesy of the Office of Naval Research, Washington, D.C., via Carl Hartdegen, Associate Director, Palisades Geophysical Institute, Sofar Station, Bermuda Island, who telephoned the Center and gave the following report radioed from the Hydrophone Station, La Palma, Canary Islands.
31 October. The activity of the fissure is located in two vents; the northern one, Teneguia One, is the most active erupting thick blocky lava flows which reached the sea to the E of the lighthouse of Fuencaliente. The emission of scoria bombs and lapillus is practically continous. The cinder and spatter cone that has been formed reaches 150 m and changes its form very quickly. The southern vent, Teneguia Two, emits only blocky lava flows which fall from the sea cliff to the sea. An exogenous dome is forming in this area, south of Teneguia One.
1 November. The activity of hot vents increases. Teneguia One emits a less viscous lava and the dome in the area of Teneguia Two also grows. At noon a new vent, Teneguia Three, opened 300 m to the north of Teneguia One. This vent erupts intermittently bombs and scoria bombs but no lava flow. During the afternoon in the Teneguia Two dome, multiple fissures began to appear and it started to collapse, fracture, and slumping slowly to the SE.
2 November. The activity of Teneguia One is similar to the previous days. Teneguia Three increases its activity during the morning, decreases the frequency and magnitude of the explosion in the afternoon. During the night it emits only gases. The dome of Teneguia Two has changed to a huge heap of lava block with secondary lava flows.
3 November. Teneguia Two emits very viscous lava flow and continues to emit bombs and lapillus relatively slowly 1-3 m/hour in the frontal part. Teneguia Three emits only some gases. Teneguia One also less active than yesterday. " The lava of the eruption is always anchibrolic trachy basalt and changes with time to a more vesicular type reported by Fuster-Casas."
The following report from Dr. Fuster-Casas was relayed to the Center by Leslie Schofield, Palisades Geophysical Institute, on 5 November.
4 November. The most important vent, Teneguia One, has emitted abundant lava flows that are always of block type. The flows have reached the seas to the E of the lighthouse. Aerial projections are less abundant than previous days. The other vents, Teneguia II and Teneguia III have been inactive and emitted only gases."
Card 1314-1314a (08 November 1971) Activity continues during 5-7 November; lava flows reach the sea
The following report was received through the courtesy of the Office of Naval Research, Washington, D.C.
5 November. Teneguia No. 1 has continued its activity of aerial projection and lava emission. A vertical crack has grown from the rim to the base of its cone. The cone has reached at this moment about 100 m from the surrounding plain. Teneguia No. 2 has had intermittent outbursts of aerial projection and during the night of 5-6 Nov. had enormous quantity of lava running in four lava flows from the western sea-cliff to the sea. Teneguia No. 3 has emitted only a little smoke and in an intermittent way.
6 November. During the early hours of this morning all the southern wall of the cone of the main vent, Teneguia No. 1, collapsed, and now the direction of the lava flows from this vent runs to the south towards Teneguia No. 2. At 1245 GMT all the materials of the former cones between Teneguia No. 1 and Teneguia No. 2 collapsed and a new cloud of pyrotechnic dust and gases at high temperatures ascended from this place falling over SW seaslope. This cloud ran also in NW direction along the western coast of island. During the afternoon and evening continous lava flows from Teneguia No. 1 and Teneguia No. 2 reached the sea on the SW coast.
7 November. The only change in the activity of Teneguia Volcano, that continues its aerial projections and outbursts of lava, is the apparition of fumaroles at crack in the western slopes of Teneguia No. 1 vent.
Card 1315 (10 November 1971) New vent opens on 9 November with strong bomb ejections
The following report was transmitted from Dr. Fuster-Casas.
8 November. The activity of Teneguia Volcano remains as during 7 November. Teneguia One vent emits abundant blocky lava which reaches the sea W of Fuencaliente lighthouse and projects continously lapilli and lava bombs. Teneguia Two and Three remain inactive. The fissures between Teneguia One and Three are growing steadily and new ones began to appear on the SW slope of the cone of Teneguia Three. The fissures emitt abundant white gases, rich in SO2.
9 November. At 2200 last night a new vent, Teneguia Four, was opened in the N-S fissure located in the place where the fumaroles were stronger. The new vent consists of three openings that emit gases at great pressures and project lava bombs 100 to 150 m high. During the night the three openings have built a spatter cone 20 m high and changed into a double jet that ejects two columns of incandescent gases and pulverized lava at a great pressure. The double jet sounds like the engine of a jet plane taking off. The activity of fumarolic area is growing and Teneguia One remains as in former days. Teneguia Two and Three remain inactive."
Card 1316 (12 November 1971) Increased activity at all active centers
The following report from Dr. Fuster-Casas was telephoned to the Center by Kevin Laudadio.
10 November. Teneguia One emits more lapilli than preceding days. The lava flowing from its center is more viscous and flows very slowly, forming blocks 5 to 25 m long. The lapilli shower is more abundant in the north SW zone of the volcano.
Teneguia Four continues acting as a powerful jet engine expelling a moderate amount of lava lumps and lapilli; the spatter cone formed around the double vent coalesces with the N slope of Teneguia One cone.
At 0345Z a little vent was opened 75 m ENE of Teneguia IV vent in the fumarolic area located between Teneguia One and Teneguia Three cones. The white gases of the fumarole formed white sulfur deposits in the surrounding field.
The activity of fumarole increased until 2200 Z but afterwards production of gases was smaller.
In the last hours of the day activity of all active centers inreased: Teneguia One emits abundant fluid lava through five or more points in the N-S fissure. In the Teneguia Four NE zone, five little vents are acting in the same forrm and rhythm as Teneguia Four.
Card 1317-1317a (15 November 1971) Continued activity from six centers during 11-14 November
The following report from Dr. Fuster-Casas was received on 15 November.
11 November. Teneguia One was very active during all the day. The effusion of the fluid lava started last night changed to a more viscous lava early this morning. During all the day projected continously lava fragments up to 400 m high. Teneguia Four acted exactly like the previous day increasing its activity from 2240 Z on. The new vents opened have formed two small spatter cones in the N slope of Teneguia Five, which started with two openings ended with one. The other one, Teneguia Six, had a single opening. Both centers were very active, expelling a powerful jet of gas and fragments of lava and emitting two small lava flows in a northeasterly direction at 0700 Z. The fumarole field has the same intensity as the last hours of yesterday.
12 November. Teneguia One, Four, and Five are sending lava lumps, scoria and lapilli continously. Teneguia One produces pyroclastic material with about 20 pulses per minute. Teneguia Four and Five alternate in periods with pulsating emissions and periods of continuous jet emission, and periods of continous jet emission, jointed by big noise. The spatter cone of Teneguia Four and Five are growing continuously reaching 50 and 25 m respectively; they coalesce with Teneguia One cone which reaches about 110 m.
Teneguia Six spatter cone is being buried by Teneguia Five. The lapilli and scoria from the vents have changed to a more vitreous black and vesiculated-type which floats on the sea; there are some fragments of white pumice, perhaps formed by fussion of phonolitic rock of the substrata.
Teneguia One keeps the emission of viscous lava which reaches the sea on the W coast. Teneguia Five has produced some short flows.
13 November. In the morning Teneguia Four emitted abundant lava which reached the W coast in the afternoon. Meanwhile, Teneguia One increases its activity emitting more lava than usual; this lava flows to the W coast by four branches. The lava is more fluid and has some olivine phenyl crystals. The aerial projections are abundant in all active vents, Teneguia Four, Five, and Six. After 2000 Z the emission of lava is less abundant.
14 November. The intensity of the eruption was less strong than yesterday. Teneguia One emits lava, lapilli and bombs. Teneguia Four, Five and Six emit only lapilli and some bombs and scoria."
Card 1318-1318a (19 November 1971) Complex cone growth and collapses during intense activity
The following report from Dr. Fuster-Casas was received on 19 November.
15 November. The activity of the volcano increased during the morning but maintained the same characteristics as the previous day. Teneguia One vents were pouring lava flows in an intermittent way. Teneguia Four and Five alternate the projection of jets of gases with the emission of clouds of lapilli. After a period of being practically inactive, at 1245 Z that lasted about half an hour, the Teneguia Five erupted a big lava flow that nearly reached the road to the lighthouse of Fuencaliente in a southeasterly direction. During the afternoon Teneguia One and Teneguia Four were increasing their activity with continuous projection of scoria and bombs that continued until midnight. The scoria and cinder cones of Teneguia One, Four, Five, and Six coalesced. The height is 125 m on the previous ground.
16 November. The activity of the several craters was intense. Teneguia One continues pouring blocky lava in six flows which increase in velocity in the scarp, adjoining the W coast where the lava is forming six blocky deposits. Teneguia Four is as active as Teneguia One, forming an elongated crater with at least four projection points--a line in a NW direction. Teneguia Six is acting in the same way with three or four projection points--a line in a NNE trend--and was pouring lava from their bases.
Teneguia Five was less active. Between Teneguia Four and Teneguia Five there are two little openings which emit continous bright flames and a few lava blocks. Teneguia One and Four send intermittently big columns of scoria and lapilli which cover the previous lava flows and the surroundings especially in the SE direction. Teneguia Six projects mainly scoria and lava lumps. The lava is changing to a more olivine type.
17 November. During the night of the 16th to the 17th the cone of Teneguia Four has grown steadily and buried the vents of Teneguia Five and Teneguia Six. A new opening was formed just under the NE rim of this crater. The whole day both Teneguia One and Four have continued emission of aerial projections with enormous amounts of lapilli and lava flows, the former one in a more intermittent and less powerful way. The lava from Teneguia Four is forming an intense platform at the foot of the W sea cliff that penetrates into the sea. During the afternoon a part of the N rim of the Teneguia Four vent collapsed under its own weight and its incandescent materials originated a big secondary flow of semi-fluid scoria and lava that filled the area between the main volcano and the little cone of Teneguia Three.
18 November. At 0130 Z Teneguia six started to produce fluid lava flows from an opening at the cone base. Teneguia Four decreased its lava emission. Teneguia One, Four and Six project simultaneously scoria, lapilli, and lava lumps; Teneguia One and Six with pulses, Teneguia Four continuously. Until noon Teneguia Six had periods of fast production of lava flows and periods of attenuated activity; until midnight only activity was emission of moderate amounts of gas from the vents. Seismic agitation stopped at the same time as the volcanic activity.
Information Contacts:
Card 1309 (02 November 1971) Jose M. Fuster-Casas, Instituto Lucas Mallada, Madrid, Spain; Sr. Firmado, special delegate of the government of the Canary Islands.
Card 1310 (04 November 1971) Jose M. Fuster-Casas, Instituto Lucas Mallada, Madrid, Spain.
Card 1311-1311a (04 November 1971) Jose M. Fuster-Casas, Instituto Lucas Mallada, Madrid, Spain; Palisades Hydrophone Station, La Palma Island, Canary Islands, Spain; Carl Hartdegen, Palisades Geophysical Institute Sofar Station, Bermuda.
Card 1314-1314a (08 November 1971) Jose M. Fuster-Casas, Instituto Lucas Mallada, Madrid, Spain; Palisades Hydrophone Station, La Palma Island, Canary Islands, Spain; Kevin Laudadio, Palisades Geophysical Institute Sofar Station, Bermuda.
Card 1315 (10 November 1971) Jose M. Fuster-Casas, Instituto Lucas Mallada, Madrid, Spain; Palisades Hydrophone Station, La Palma Island, Canary Islands, Spain; Kevin Laudadio, Palisades Geophysical Institute Sofar Station, Bermuda.
Card 1316 (12 November 1971) Jose M. Fuster-Casas, Instituto Lucas Mallada, Madrid, Spain; Palisades Hydrophone Station, La Palma Island, Canary Islands, Spain; Kevin Laudadio, Palisades Geophysical Institute Sofar Station, Bermuda.
Card 1317-1317a (15 November 1971) Jose M. Fuster-Casas, Instituto Lucas Mallada, Madrid, Spain; Palisades Hydrophone Station, La Palma Island, Canary Islands, Spain; Kevin Laudadio, Palisades Geophysical Institute Sofar Station, Bermuda.
Card 1318-1318a (19 November 1971) Jose M. Fuster-Casas, Instituto Lucas Mallada, Madrid, Spain; Palisades Hydrophone Station, La Palma Island, Canary Islands, Spain; Kevin Laudadio, Palisades Geophysical Institute Sofar Station, Bermuda.
No surface deformation detected
A March 1996 EDM survey of the active Cumbre Vieja rift volcano indicated no significant surface deformation since installation of the network in October 1994. The network contains 11 benchmarks (incorporating two Spanish survey triangulation pillars) and was measured using the infrared EDM method. Together with one 3-component seismic station NE of the main rift, the network provides the only current means of monitoring activity on the island.
The deformation network covers the area affected by faulting associated with the July 1949 eruption (figure 1), a zone where W-facing normal faults showed a maximum vertical displacement of ~4 m. The Cumbre Vieja ridge lies between the two 1949 eruptive centers (Duraznero and San Juan). Eyewitness accounts (Bonnelli, 1950) and detailed mapping of the eruptive products showed that during the 1949 eruption, fault displacements also had westward components with downslope movement on the volcano's flanks. La Palma is comparable in form and structure to other Canary Islands that have undergone large-scale slope failure. Steep topography, together with the prospect of a future magma intrusion, cause concern for the long-term stability of the Cumbre Vieja ridge.
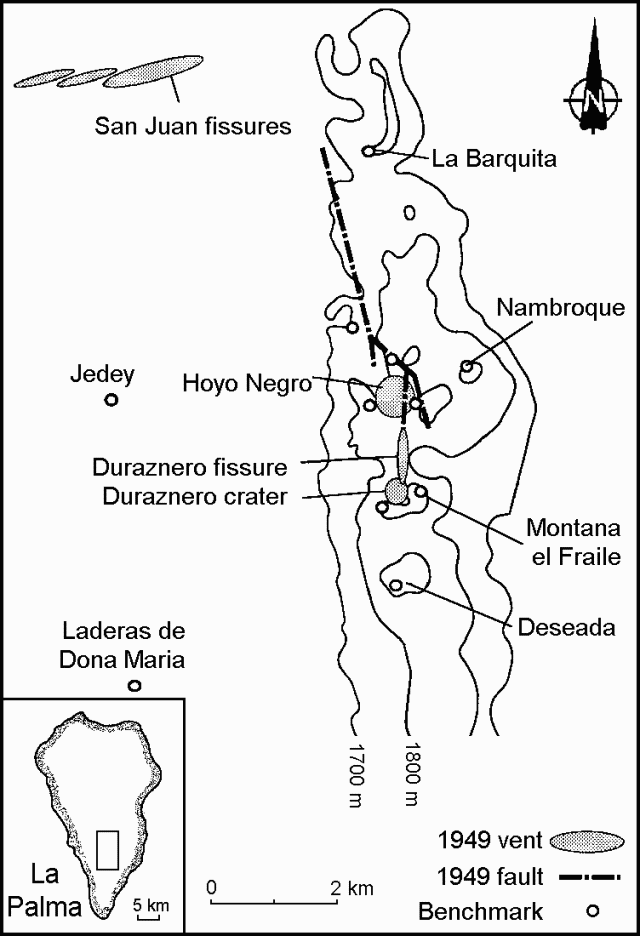 |
Figure 1. Sketch map of the Cumbre Vieja rift volcano showing the distribution of benchmarks, vents, and faults associated with the July 1949 eruption at La Palma. Courtesy of J.L. Moss and W.J. McGuire. |
The wedge-shaped island of La Palma contains two large volcanic centers. The northern one is cut by the massive Caldera Taburiente. The southern Cumbre Vieja rift volcano, oriented N-S, has been the site of historical eruptions recorded since the 15th century. An eruption from the S tip of La Palma in 1971 produced the Teneguia cinder cone. Fissure-fed eruptions from vents ~1 km S of the 1677 San Antonio cone produced lava flows that reached the SW coast.
Reference. Bonnelli, R., 1950, Contribucion al estudio de la erupcion del volcan del Nambroque o San Juan (Isla de la Palma), 24 de Junio - Agosto de 1949: Instituto Geografico y Catastral, Madrid, Spain.
Information Contacts: J.L. Moss, W.J. McGuire, and S.J. Day, Center for Volcanic Research, Cheltenham & Gloucester College, Francis Close Hall, Swindon Road, Cheltenham GL50 4AZ, United Kingdom; S.J. Saunders, Brunel University, Department of Geography & Earth Science, Borough Road, Isleworth, Middlesex TW7 5DU, United Kingdom; J-C. Carracedo, Estacion Volcanologica de las Canarias, Tigua Carretera de la Esperanza 3, Apartado de Correos 195, 38206 La Laguna, Tenerife, Canary Islands, Spain.
First eruption since 1971 starts on 19 September; lava fountains, ash plumes, and lava flows
Multiple eruptions have occurred during the last 7,000 years at the Cumbre Vieja volcanic center on La Palma, the NW-most of the Canary Islands. The eruptions have created cinder cones and craters, and produced fissure-fed lava flows that reached the sea a number of times. Eruptions recorded since the 15th century have produced mild explosive activity and lava flows that damaged populated areas, most recently at the southern tip of the island in 1971. During the three-week eruption in October-November 1971, eruptive activity created a new cone, Teneguia, that had as many as six active vents (CSLP 90-71), and blocky lava flows that reached the sea on the SW flank.
A new eruption began at La Palma on 19 September 2021 in an area on the SW flank of the island about 20 km NW of the 1971 eruption, after a multi-year period of elevated seismicity. Two fissures opened and multiple vents produced lava fountains, ash plumes, and flows that traveled over 5 km W to the sea, destroying hundreds of properties in their path (figure 2). Activity through the end of September is covered in this report with information provided by Spain’s Instituto Geographico Nacional (IGN), the Instituto Volcanologico de Canarias (INVOLCAN), the Steering Committee of the Special Plan for Civil Protection and Attention to Emergencies due to Volcanic Risk (PEVOLCA), maps from Copernicus EMS, satellite data, and news and social media reports.
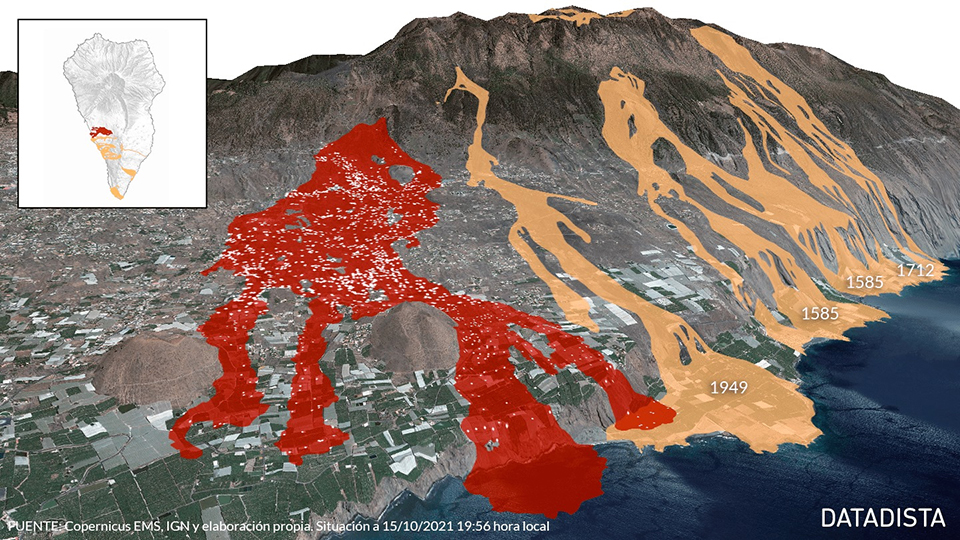 |
Figure 2. A 3D-rendering of the extent of lava flows from the Cumbre Vieja eruption on La Palma as of 15 October 2021 is shown in red with flows from earlier eruptions shown in tan. Data provided by Copernicus EMS and IGN, courtesy of INVOLCAN. |
Precursor seismicity. In early July 2017 IGN enhanced their Volcanic Surveillance Network at La Palma to include four GPS antennas, five seismic stations, and four hydrochemical groundwater control points. A seismic swarm of 68 events located on the southern third of the island was recorded during 7-9 October 2017. It was the first of a series of seismic swarms recorded during 2017-2021 (table 1) located in the same general area. This first swarm was followed by a similar set of events a few days later during 13-14 October. The magnitudes of the events during October 2017 (given as MbLg, or the magnitude from the amplitude of the Lg phase, similar to the local Richter magnitude) ranged from less than 1.5 to 2.7, and they occurred over a depth range of 12-35 km. The next seismic swarm of similar characteristics occurred during February 2018, followed by a smaller swarm of seven microseismic events recorded in the same area one year later, on 12 February 2019.
Table 1. Precursor seismicity episodes at La Palma between October 2017 and late June 2021 were all located in the southern third of the island. Magnitude is reported by IGN as MbLg, or the magnitude from the amplitude of the Lg phase, similar to the local Richter magnitude. Data courtesy of IGN Noticias.
| Date | Detected Events | Located Events | Magnitude Range (mbLg) | Depth Range (km) |
| 07-09 Oct 2017 | -- | 68 | Less than 1.5-2.7 | 12-35 |
| 13-14 Oct 2017 | 352 | 44 | Less than 1.5-2.1 | 15-22 |
| 10-14 Feb 2018 | -- | 85 | 1.8-2.6 | 25-30 |
| 12 Feb 2019 | -- | 7 | 0.7-1.1 | 15 |
| 24 Jul-02 Aug 2020 | 682 | 160 | 1.2-2.5 | 16-39 |
| 23-26 Dec 2020 | 602 | 126 | 1.3-2.3 | 30 |
| 31 Jan 2021 | -- | 27 | 1.2-2.5 | 10-29 |
| 25 Jun 2021 | 80 | 12 | Less than 2.2 | 18-34 |
By the time the next seismic swarm began in July 2020, IGN had a network of 13 seismic stations installed around the island. There were 160 located events that occurred during 24 July-2 August 2020 with magnitudes of 1.2-2.5 and depths of 16-39 km. Reprocessing of the previous data indicated a distribution of seismicity for the three series (October 2017, February 2018, and July 2020) in a wide strip in an east-west direction, although the October 2017 series occurred at a shallower depth and with the epicenters more concentrated. IGN noted similarities between the February 2018 and July-August 2020 events in terms of location and magnitude (figure 3). Another very similar swarm of 602 detected events was recorded during 23-26 December 2020, with most events located on the western slope of Cumbre Vieja. Two swarms on 21 January and 25 June 2021 had fewer events but similar depths and magnitudes to the earlier events.
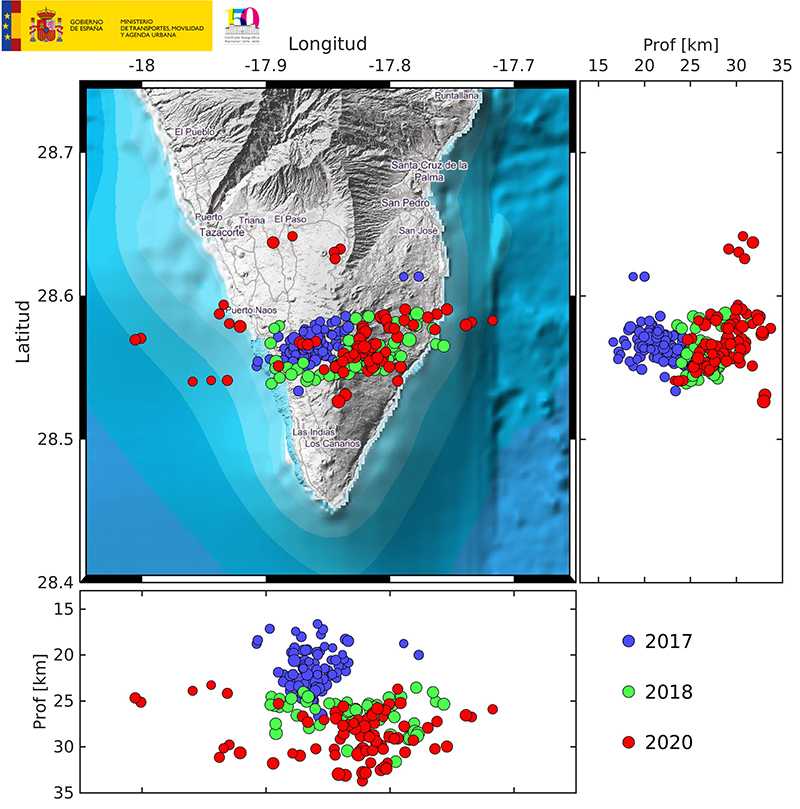 |
Figure 3. Comparison of seismic event depth and locations at La Palma from swarms during 2017, 2018, and 24 July-2 August 2020. Courtesy of IGN (06-08-2020 16:45 UTC, Final de la actividad en La Palma). |
Renewed seismicity began on 11 September 2021. The number, frequency, and magnitude of the events all increased over the next several days, while the depth of the events grew shallower. On 13 September a multi-agency scientific committee raised the Alert Level to Yellow (the second lowest level on a four-color scale) for the municipalities of El Paso, Los Llanos de Aridane, Mazo, and Fuencaliente de la Palma. IGN noted a migration of the seismicity toward the W side of the island on 14 September (figure 4). The accumulated surface deformation between 12 and 14 September measured 1.5 cm from the island GNSS network. Seismic activity on 15 September continued to migrate slightly NW at depths of around 7-9 km; in addition, 20 shallow earthquakes of 1-3 km depth were recorded. The accumulated deformation had reached 6 cm by 15 September. As of 0930 on 16 September 50 shallow earthquakes between 1-5 km depth had been located and the maximum vertical deformation was around 10 cm in the area of the seismicity. During 16-18 September seismic activity decreased, but a 3.2 magnitude earthquake located at 100 m depth was felt by the local population. Intense surface seismicity (between 0-6 km) increased in the early hours of 19 September and numerous earthquakes were felt by the local population (figure 4). The maximum accumulated deformation increased to 15 cm in the area close to the seismicity by 1100 on 19 September, and the eruption began about five hours later.
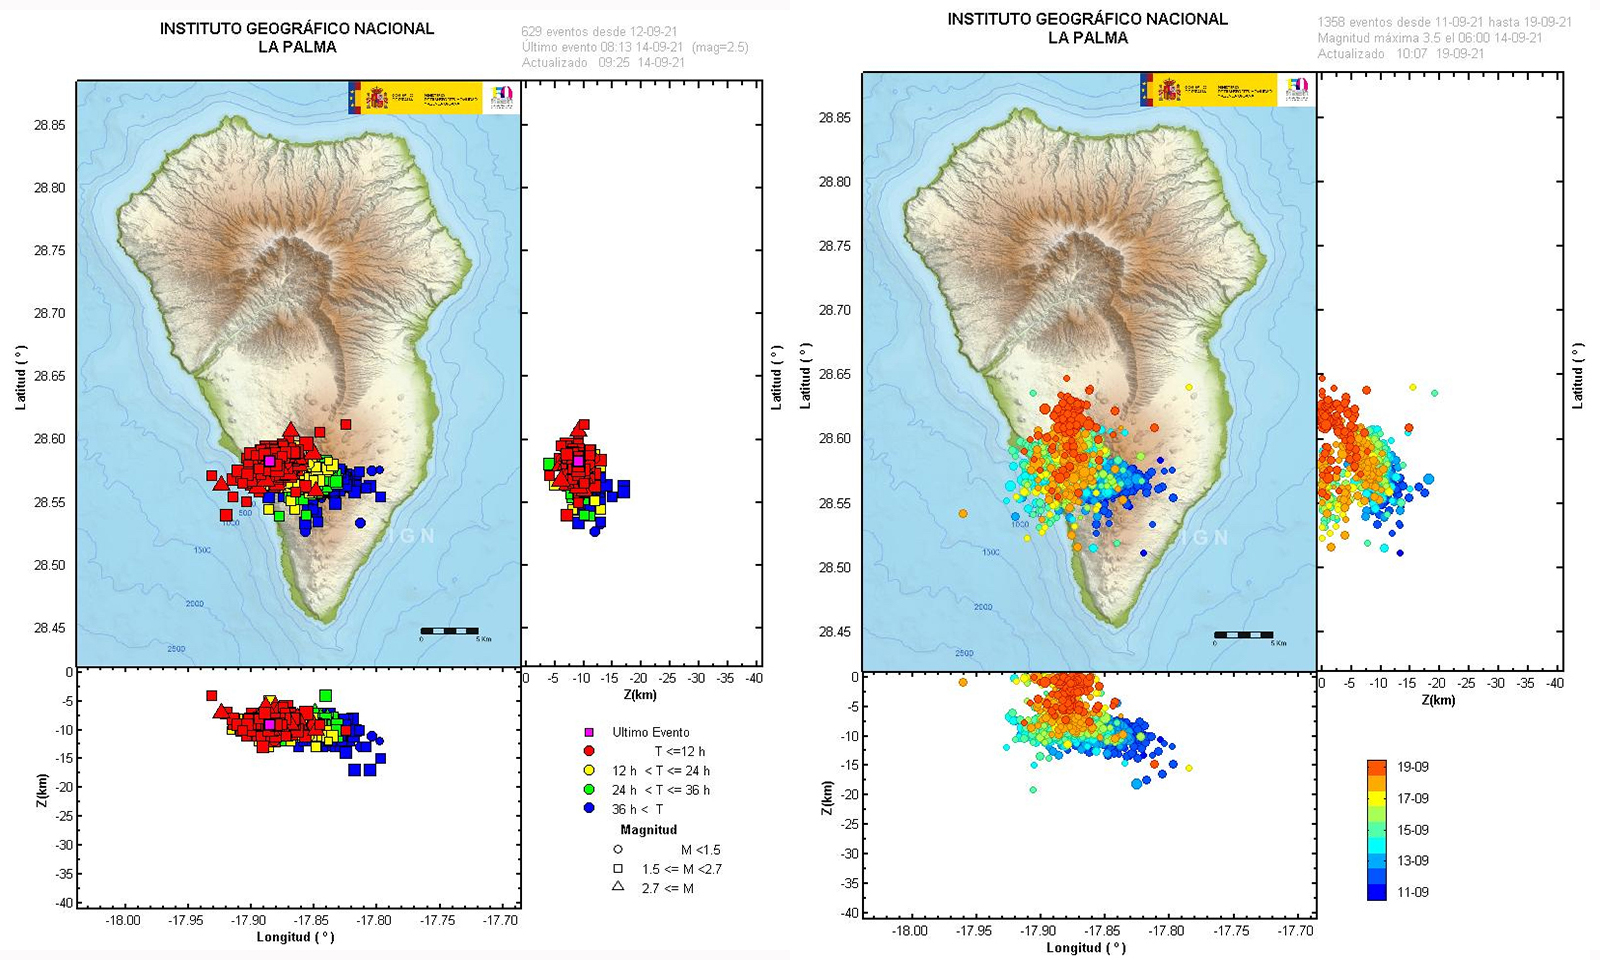 |
Figure 4. Seismic events at La Palma during 12-19 September 2021 showed distinct changes during those days. During 12-14 September (left) the seismicity migrated westward and was located at depths of about 7-13 km. The color scale on the left indicates the time of the events in hours before 0925 on 14 September, with red as the most recent. An abrupt increase in shallow seismicity on 19 September 2021 occurred a few hours before the eruption began, as shown by the bright orange dots in the right image. The color bar on the right represents the dates of the seismic events beginning on 11 September. Courtesy of IGN (left: 14-09-2021 09:30 UTC, right: 19-09-2021 11:00 UTC, Actualización de la información sobre la actividad volcánica en el sur de la isla de La Palma). |
Eruption begins 19 September 2021. A fissure eruption began at 1510 local time (1410 UTC) on 19 September after the intense seismic and deformation activity that began on 11 September. Observers near the eruption site in the area of Cabeza de Vaca, in the municipality of El Paso, witnessed a large explosion with ejecta that produced a gas-and-ash plume. Strombolian activity was accompanied by phreatomagmatic pulses along two 100-m-long N-S fissures about 200 m apart. INVOLCAN scientists observed seven vents along the fissures during the initial stage of the eruption (figure 5). Multiple tall lava fountains fed flows downslope to the W, igniting fires. The PEVOLCA steering committee briefly raised the Alert Level to Orange, and then to Red by 1700 for high-risk municipalities directly affected by the eruption. About 5,500 people evacuated with no injuries reported, and authorities recommended that residents stay at least 2 km from the vents. INVOLCAN scientists determined an average flow rate of 700 m/hour and lava temperatures of around 1,075°C at the start of the eruption (figure 6).
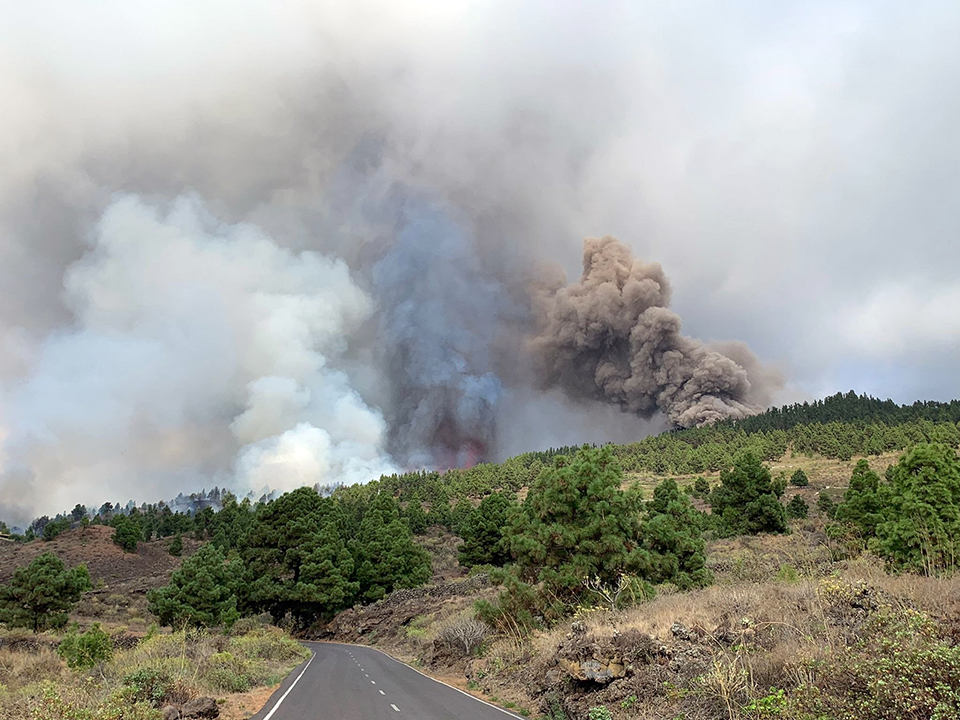 |
Figure 5. INVOLCAN scientists observed seven active vents along the fissure at the start of the La Palma eruption at Cumbre Vieja on 19 September 2021. Photo by Alba, courtesy of INVOLCAN. |
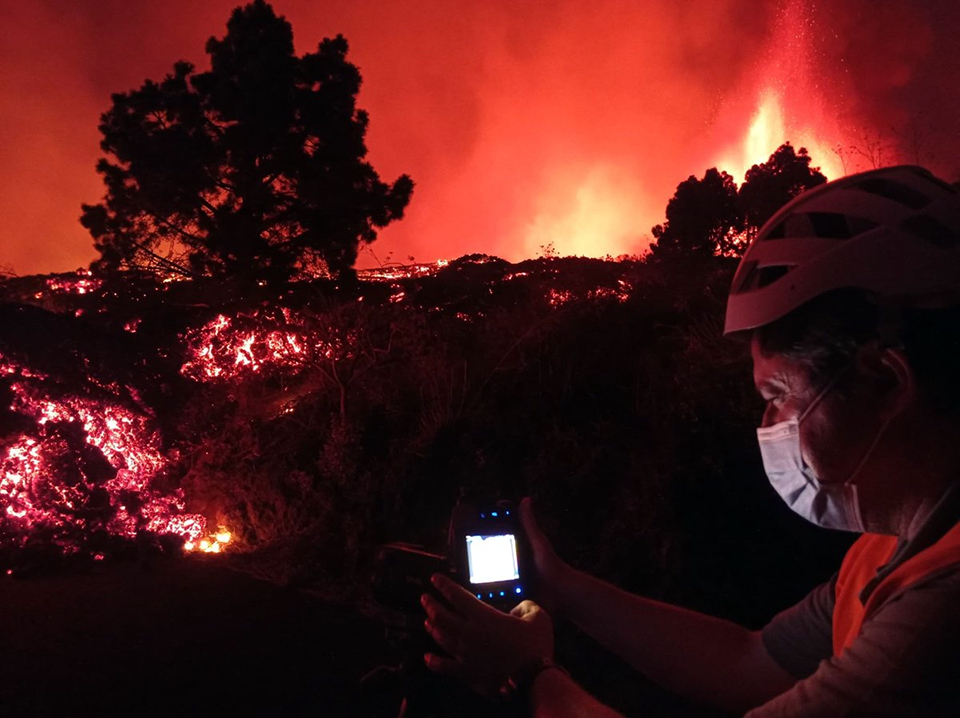 |
Figure 6. INVOLCAN scientists determined a flow rate for the new lava flows at La Palma on 19 September 2021 of 700 m/hour and a temperature of 1,075°C. Courtesy of INVOLCAN. |
The Toulouse VAAC issued the first ash advisory for the La Palma eruption about 90 minutes after it began. They reported ongoing lava fountains and an ash plume to about 1 km altitude. The plume drifted SW at less than 1.5 km altitude, while SO2 emissions were reported drifting ESE at 3 km altitude. Later that day, they noted continuing intense lava fountains and ashfall in the vicinity of the volcano. The next day ash emissions drifted S at 2.4 km altitude. Sulfur dioxide emissions were measured by satellite instruments beginning on 19 September; they increased dramatically and drifted hundreds of kilometers E and SE toward the NE coast of Africa over the next few days (figure 7). Ongoing ash emissions rose to 4.6 km altitude later on 20 September. The first Sentinel-2 satellite images of the eruption appeared on 20 September showing a strong point source thermal anomaly partly covered by meteoric clouds (figure 8).
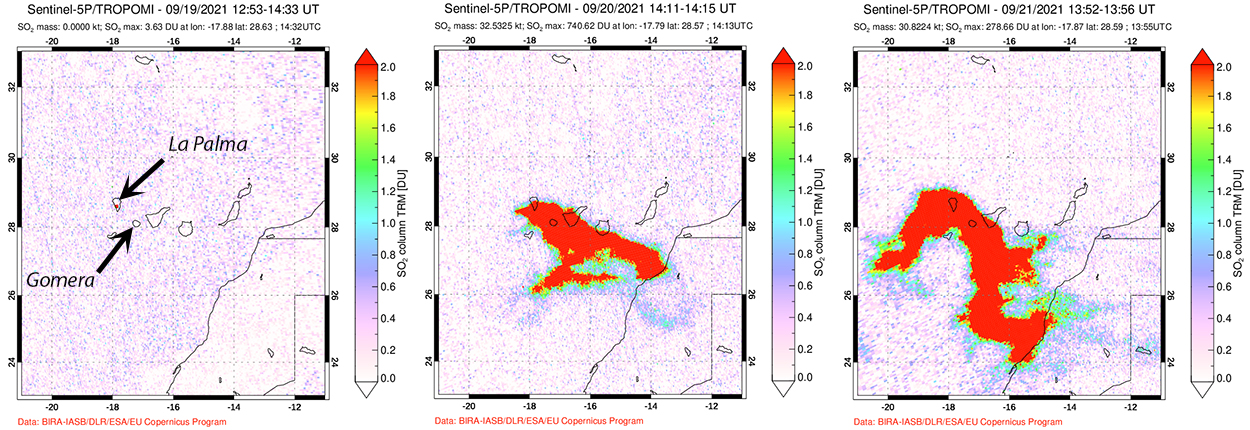 |
Figure 7. Sulfur dioxide emissions from the Cumbre Vieja eruption at La Palma were measured by the TROPOMI Instrument on the Sentinel-5P satellite beginning on 19 September 2021 (left); they increased dramatically over the next several days. The plume was detected by satellite over 400 km SE over the western Sahara on the NW coast of Africa by 20 September. The plume was reported as visible at Gomera Island (80 km SE) on 21 September, having increased significantly in area and mass from the previous day. Courtesy of NASA Global Sulfur Dioxide Monitoring Page. |
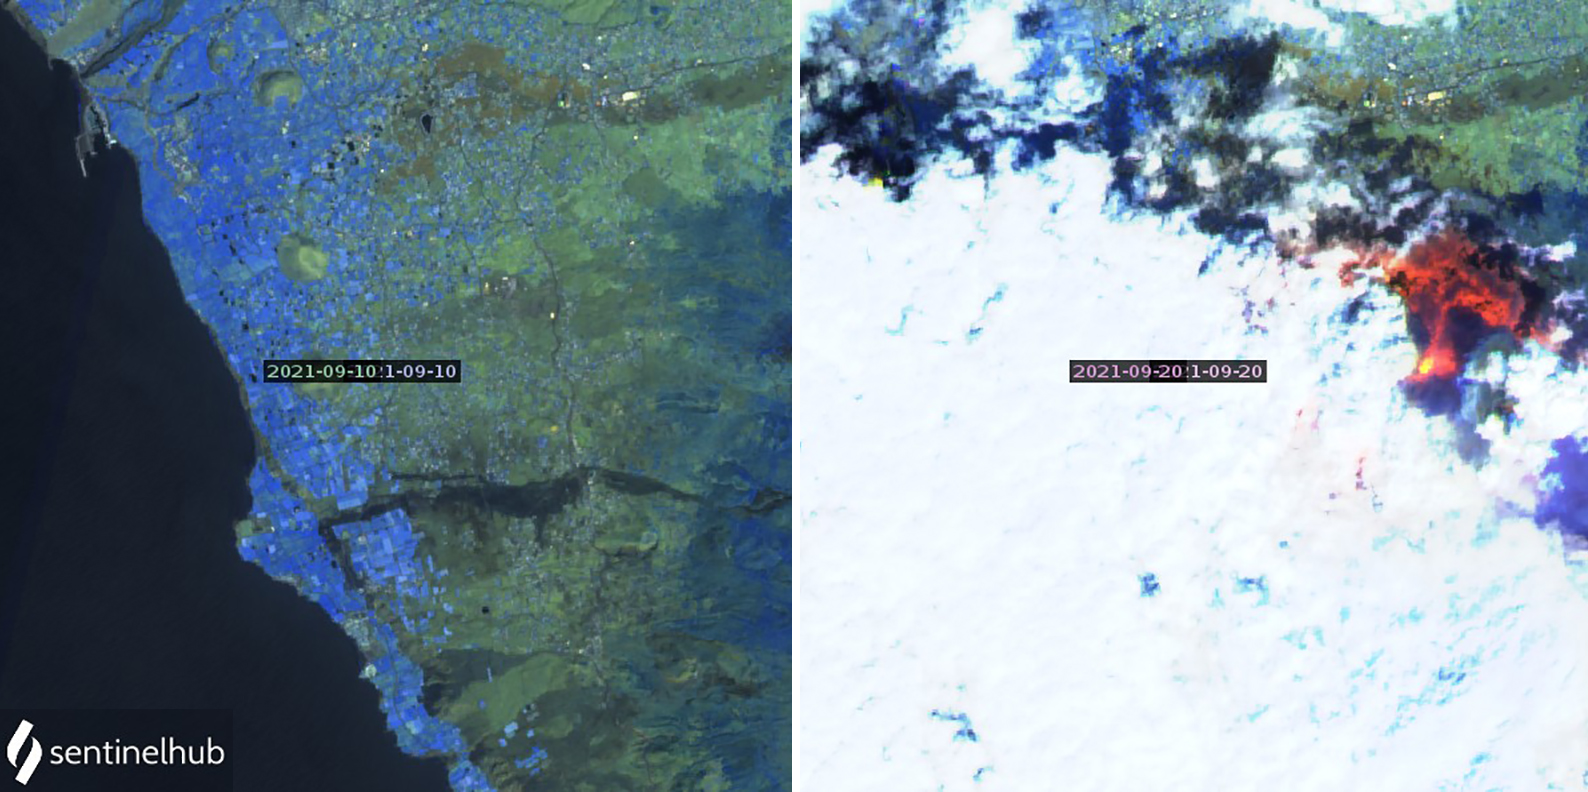 |
Figure 8. Sentinel-2 satellite images of La Palma show a sharp contrast from a cloudless sky before any signs of surface activity on 10 September 2021 (left) to dense cloud cover on the lower slopes of La Palma with a strong thermal anomaly from the new fissure vent and flows with rising steam plumes drifting NE on 20 September (right). Images use Atmospheric penetration rendering (bands 12, 11, 8a). Courtesy of Sentinel Hub Playground. |
The first map of the new flow on 20 September produced by IGN in partnership with Copernicus Emergency Management Service (EMS) showed that the main channel of the lava flow had traveled more than 3 km W. The flows had covered about 1 km2 and destroyed an estimated 166 buildings (figure 9). A report of the PEVOLCA Scientific Committee indicated that activity on 20 and 21 September was concentrated at four main vents that produced parallel flows with an average flow rate of 200 m/hour; the maximum flow thickness was 10-12 m (figure 10). Strong lava fountaining continued both days and ash fell in the vicinity of the vents. By 0814 on 21 September an updated Copernicus EMS map showed that 350 homes had been covered by lava and the flow field had expanded to 1.54 km2. A few hundred more residents evacuated as lava advanced towards Tacande; bringing the number of evacuees to about 5,700. One lava flow branch was advancing slowly S at a rate of 2 m/hour. An ash cloud was observed later that day on the W flank of the volcano slowly drifting SW at 2.4 km altitude. Sulfur dioxide emissions were present over the SE part of the island and were visible at Gomera Island, 80 km SE. Late in the day, ash was observed in satellite imagery about 50 km W of the volcano, while intense lava fountaining continued at the source vent (figure 11).
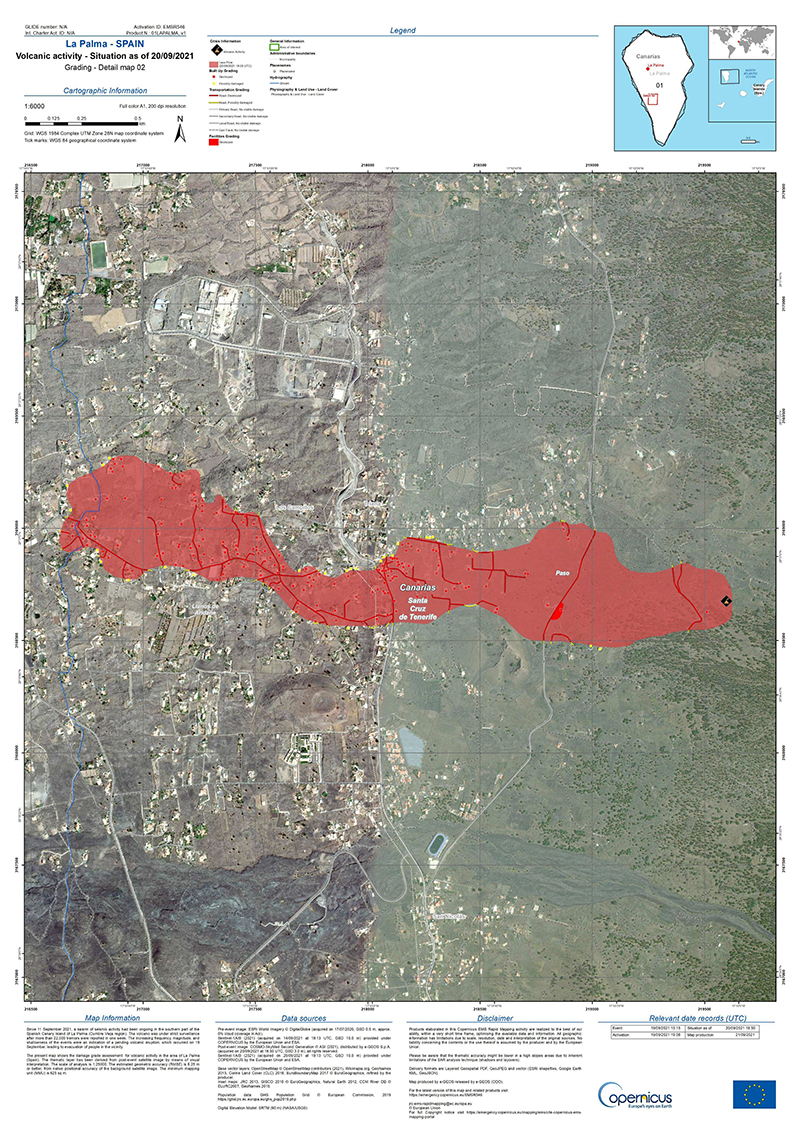 |
Figure 9. The first map of the new lava flow at La Palma on 20 September 2021 was produced by the Copernicus Emergency Management Service (EMS) in partnership with IGN. It showed that the main channel of the lava flow shown in red had traveled more than 3 km W covering about 1 km2 and had destroyed an estimated 166 buildings. Courtesy of Copernicus EMS. |
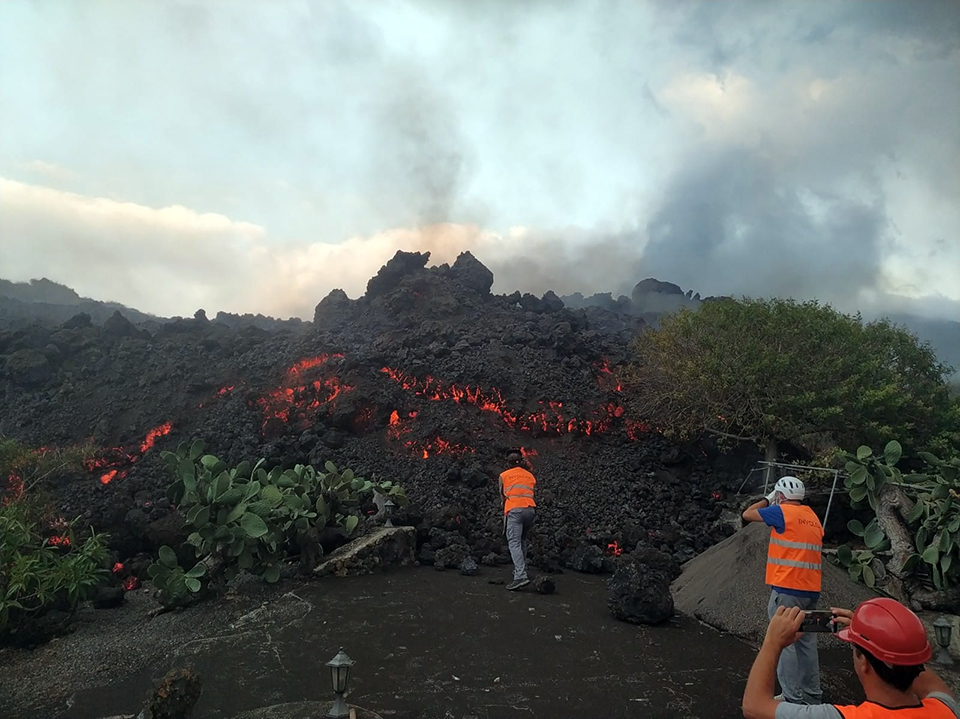 |
Figure 10. INVOLCAN scientists collected lava fragments from the Cumbre Vieja flow front at La Palma on 21 September 2021. The average flow thickness was 10-12 m. Courtesy of INVOLCAN. |
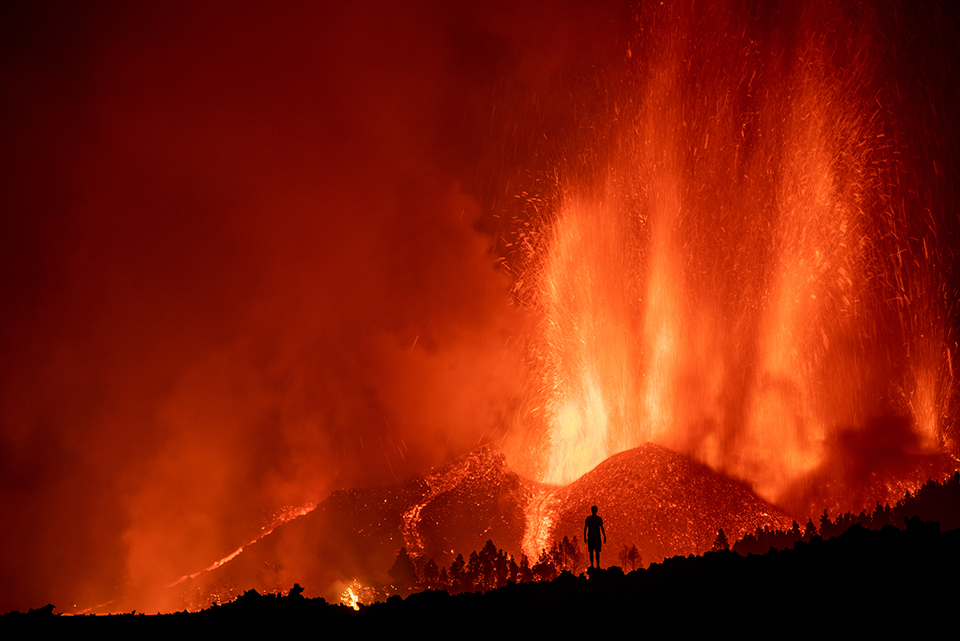 |
Figure 11. Intense fountaining continued at the vent of the Cumbre Vieja eruption on La Palma during the night of 21 September 2021; multiple small flows descended the flanks of the growing pyroclastic cone. Courtesy of Cabildo La Palma. |
Activity during 22-25 September 2021. Ash emissions during 22 and 23 September drifted SW and S from 0-3 km altitude, and NE and E from 3-5 km altitude (figure 12); ashfall up to 3 cm thick was reported downwind. An SO2 plume was also noted drifting NE in satellite imagery. PEVOLCA reported on 23 September that two relatively slow-moving lava flows continued to advance downslope from the vent (figure 13). The northernmost flow was moving at 1 m/hour and was 12 m high and 500 m wide in some places. The southern flow, which surrounded Montaña Rajada, was moving at 4-5 m/hour and about 10 m high. The overall flow was 3.8 km long and 2.1 km from the coast (figure 14). By late on 23 September reports indicated 420 structures had been destroyed and the flow covered just under 2 km2.
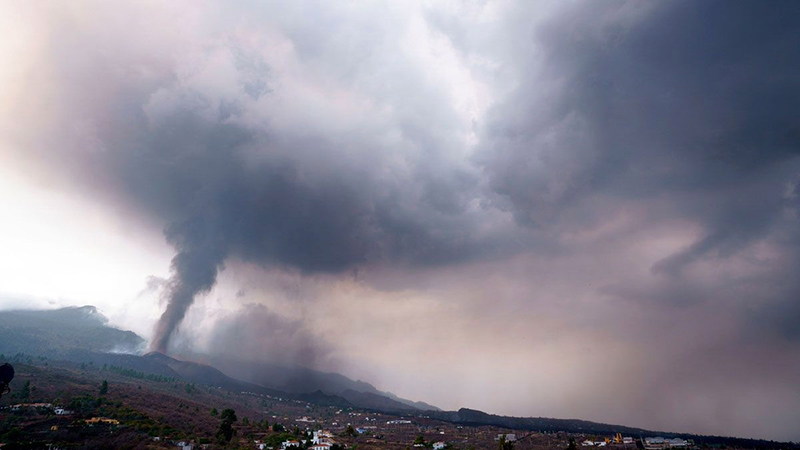 |
Figure 12. Ash emissions rose as high as 4.6 km altitude on 22 September 2021 at La Palma. Up to 3 cm of ashfall was reported downwind. Courtesy of El Periodico de Cataluny, S.L.U. |
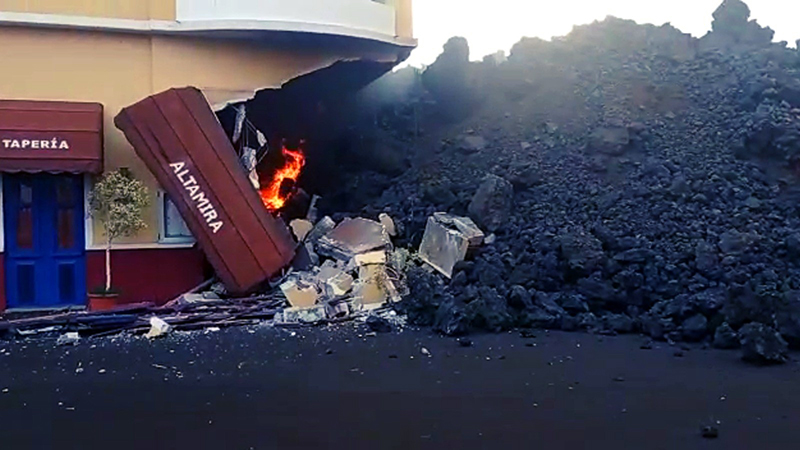 |
Figure 13. Slow moving lava flows at La Palma continued downslope from the vents on 22 and 23 September 2021. Many businesses and homes in the community of Todoque, shown here, were destroyed by the lava flows on 22 September. Photo by Bomberos de Canarias, courtesy of RTVE. |
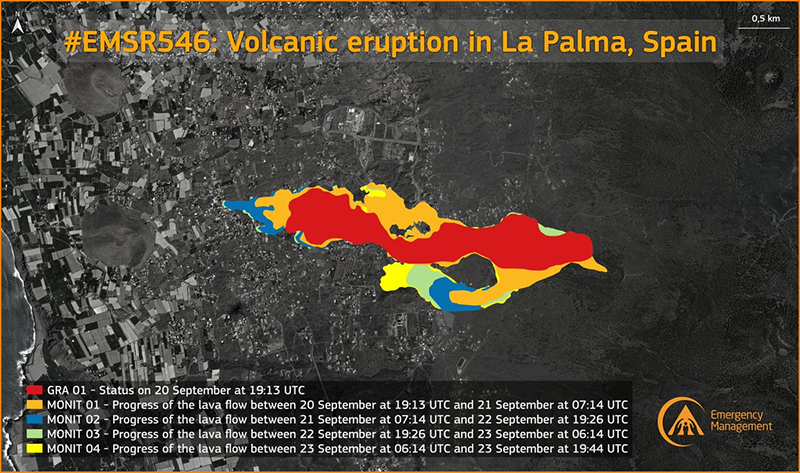 |
Figure 14 The original flow at La Palma as of 1913 on 20 September is shown in red. The progression of the lava flows each day from 20-23 September 2021 is shown in different colors. Lava flows covered almost 2 km2 of La Palma by the end of the day on 23 September 2021, and reports indicated 420 structures and 15.2 km of roads had been destroyed. The flow was about 3.8 km long and still 2.1 km from the coast. Courtesy of Copernicus EMS. |
Lava fountains rose hundreds of meters above the summit crater of the new cone early on 24 September 2021 (figure 15). IGN reported an increase in explosive activity on 24 September that was accompanied by a sharp increase in tremor amplitude. This was followed a short while later by the opening of two new vents on the NW flank of the cone; the fast-moving flows merged into one and produced a new flow over top of the earlier flows. Part of the upper section of the S flank of the cone collapsed on 24 September and briefly caused flow speeds to increase to 250-300 m/hour overnight before slowing to an average speed of 40 m/hour. Due to the fast-moving flow, an evacuation order was issued in the early afternoon for Tajuya, Tacande de Abajo, and part of Tacande de Arriba, affecting 300-400 people. Three airlines also suspended flights to La Palma. The Toulouse VAAC reported ash plumes throughout the day. Ash plumes drifted SW below 3 km altitude and E and SE at 3-5.2 km altitude and resulted in significant ashfall in numerous locations by the next morning (figure 16). Pilots also reported ash near Tenerife and over La Gomera.
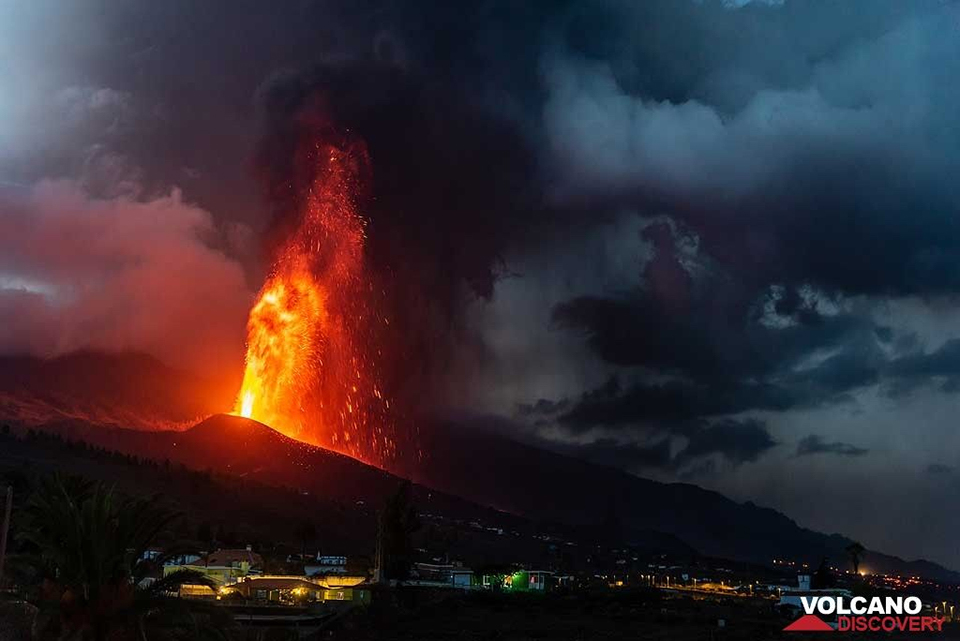 |
Figure 15. Lava fountains several hundred meters high rose from the growing pyroclastic cone at La Palma in the early hours of 24 September 2021, seen from Tajuya. Dense ash emissions continued throughout the day. Photo by Tom Pfeiffer, courtesy of Volcano Discovery. |
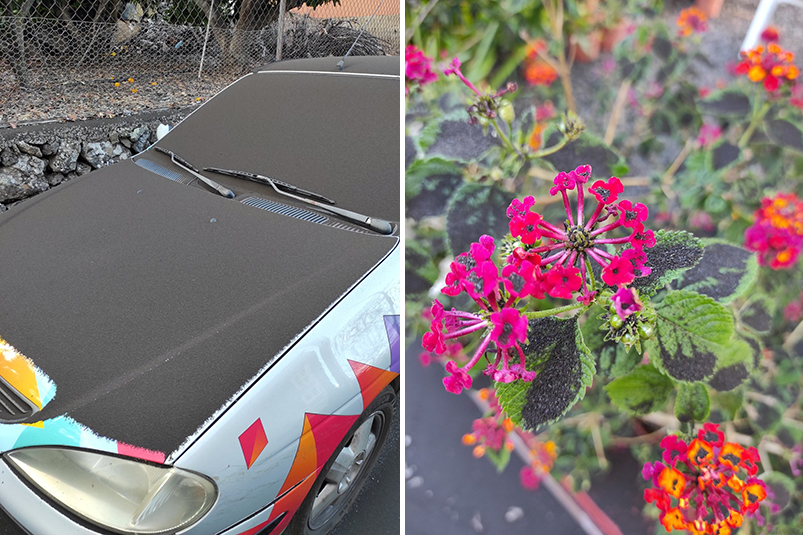 |
Figure 16. Ashfall in El Paso on La Palma covered cars and flowers on the morning of 25 September 2021. Ash emissions produced ashfall in numerous places around the island over the next several days. Courtesy of Volcanes de Canarias. |
By 25 September there were three active vents in the crater and one on the flank of the cone (figure 17), and two active lava flows. On 25 and 26 September dense ash emissions (figure 18) closed the airport and produced ashfall not only in the municipalities near the eruption, but also on the eastern slope of the island; it was reported in Villa de Mazo, Breña Alta and Breña Baja, and Santa Cruz de La Palma or Puntallana. Plumes were drifting SW at altitudes below 1.5 km and NE between 1.5 and 3.9 km altitude over a large area. Mapping by Copernicus EMS indicated that the ashfall covered an area of 13 km2 (figure 19).
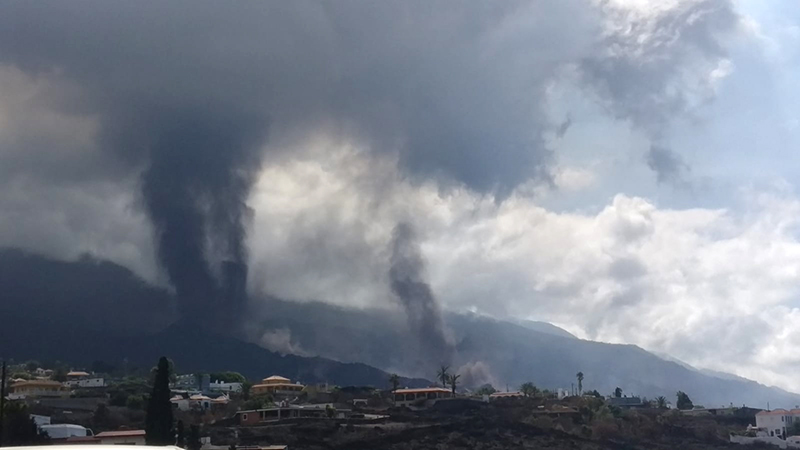 |
Figure 17. A new vent opened on the lower W flank of the pyroclastic cone at La Palma on 25 September 2021. Courtesy of INVOLCAN. |
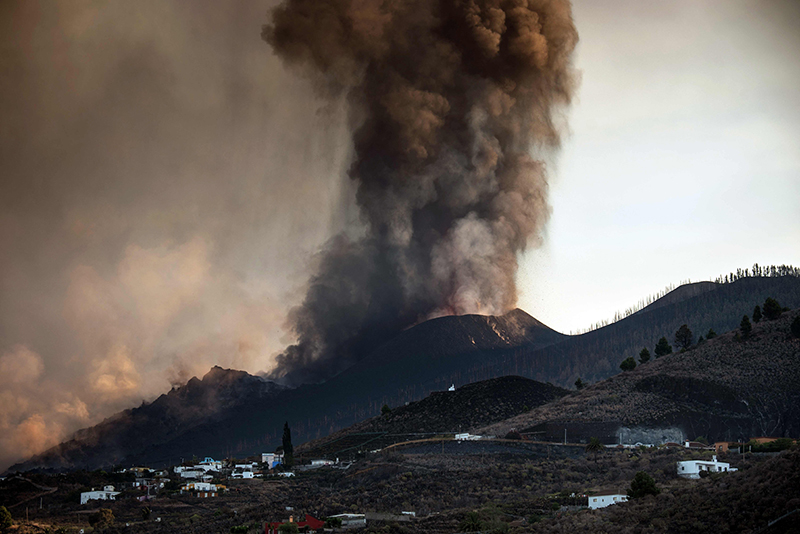 |
Figure 18. Dense ash emissions on 25 September 2021 at La Palma forced closure of the island’s airport. Photo by Desiree Martin, AFT, courtesy of Corporación de Radio y Televisión Española (RTVE). |
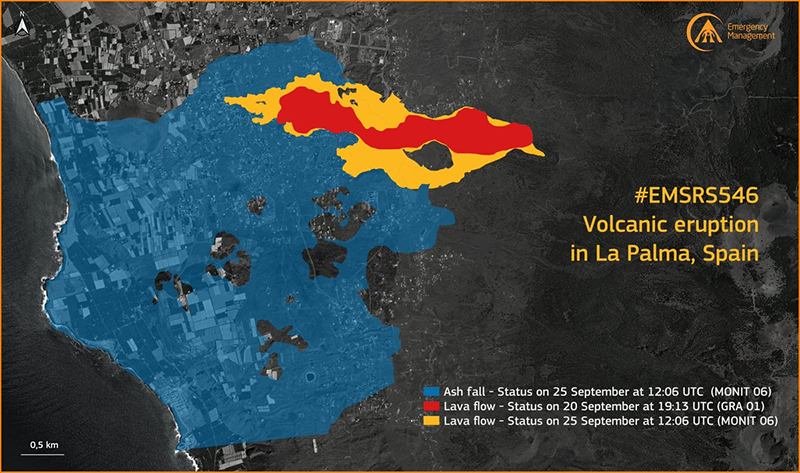 |
Figure 19. A large area of La Palma, shown in blue, was affected by ashfall to the W and SW of the erupting vent on 25 September 2021. The extent of the lava flow as of 1913 UTC on 20 September is shown in red, and the extent of the flow by 1206 on 25 September is shown in orange. Courtesy of Copernicus EMS. |
Activity during 26-28 September 2021. During the evening of 26 September jets of lava up to 1 km high were visible from La Laguna and some explosions were strong enough to be felt within 5 km of the vent (figure 20). The main, more northerly lava flow overtook the center of Todoque, in the municipality of Los llanos de Aridane, which had been evacuated several days earlier. It crossed the highway (LP-213) in the center of town and continued 150 m W. It was initially moving at about 100 m/hour, was 4-6 m high, and the front was about 600 m wide, but it slowed significantly after crossing through Todoque, and the height grew to 15 m; it was located about 1,600 m from the coast. The more southerly flow continued moving at about 30 m/hour and was about 2.5 km long.
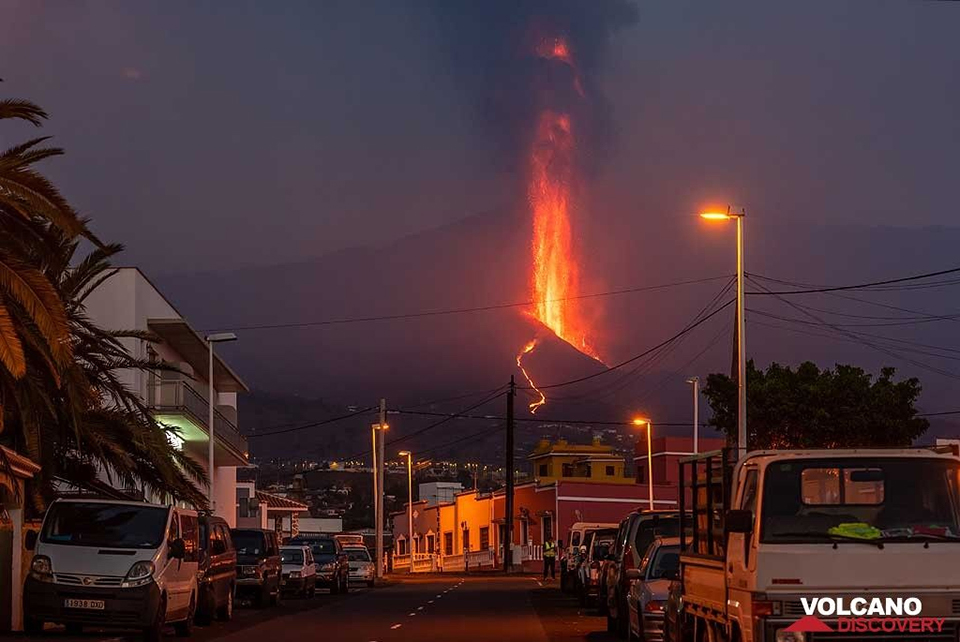 |
Figure 20. Jets of lava rose to nearly 1,000 m high at La Palma as seen from La Laguna on the evening of 26 September 2021. The lava flow remained active on the NW flank of the cone. Photo by Tom Pfeiffer, courtesy of Volcano Discovery. |
The PEVOLCA Scientific Committee determined that the volume of erupted material from the beginning of the eruption on 19 September until 27 September was about 46.3 m3. By early on 27 September the front of the flow was close to the W side of Todoque Mountain (figure 21), and reports indicated that 589 buildings and 21 km of roads had been destroyed by the 2.5 km2 of lava. A seismic swarm on the morning of 27 September was located at about 10 km depth in the same area of the previous seismicity below the vent. In addition, pulses of tremor coincided with pulses of ash emissions. A new flow appeared on the N flank of the cone during the afternoon and partly covered previous flows through the center of Todoque, reaching about 2 km from the coast (figure 22). Ash emissions were more intermittent on 27 and 28 September, drifting SW to 1.5 km altitude and NE to 4.3 km altitude in sporadic pulses associated with lava fountains.
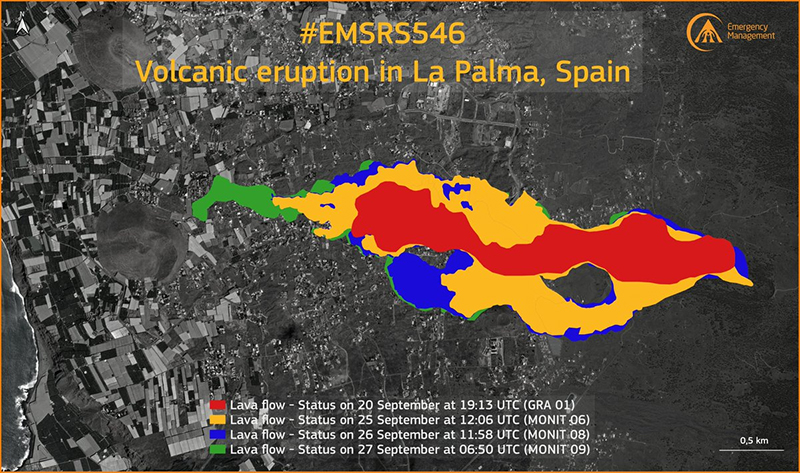 |
Figure 21. The growth of the lava flow at La Palma during 20-27 September 2021 is shown in different colors. The flow as of 1913 on 20 September is shown in red. The extent of the flow as of 1206 on 25 September is shown in orange. The extent of the flow as of 1158 on 26 September is shown in blue, and the extent of the flow as of 0650 on 27 September is shown in green, nearly reaching Todoque Mountain by early on 27 September 2021. Reports indicated that 589 buildings and 21 km of roads had been destroyed from the 2.5 km2 of lava. Courtesy of Copernicus EMS. |
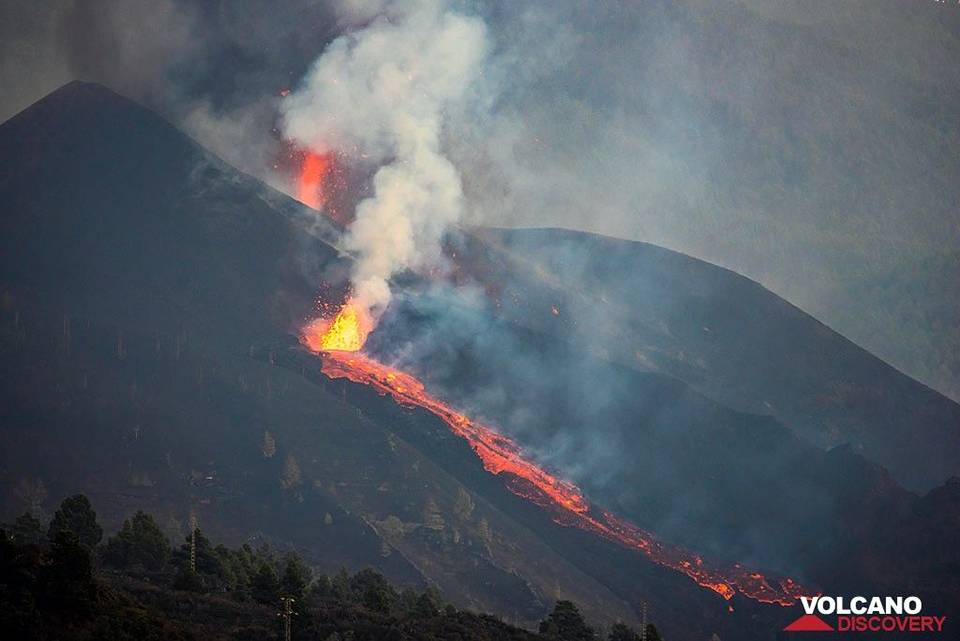 |
Figure 22. A new flow appeared on the N flank of the cone at La Palma during the afternoon of 27 September 2021 from a reactivated vent; it traveled rapidly downslope reaching the center of Todoque. Photo by Tom Pfeiffer, courtesy of Volcano Discovery. |
The new flow moved through the upper outskirts of Todoque and had reached the road to El Pampillo on the border of the municipalities of Los Llanos and Tazacorte, about 1 km from the coast, early on 28 September (figure 23). A plume with moderate to high ash concentration rose to 5.2 km altitude and extended up to 25 km W. The altitude of the plume increased to 6.1 km drifting E later in the day. A significant SO2 cloud was clearly identifiable in satellite imagery in a 75 km radius around the island. In addition, satellite instruments measured very large plumes of SO2 drifting hundreds of kilometers E, S, and N over the next several days (figure 24).
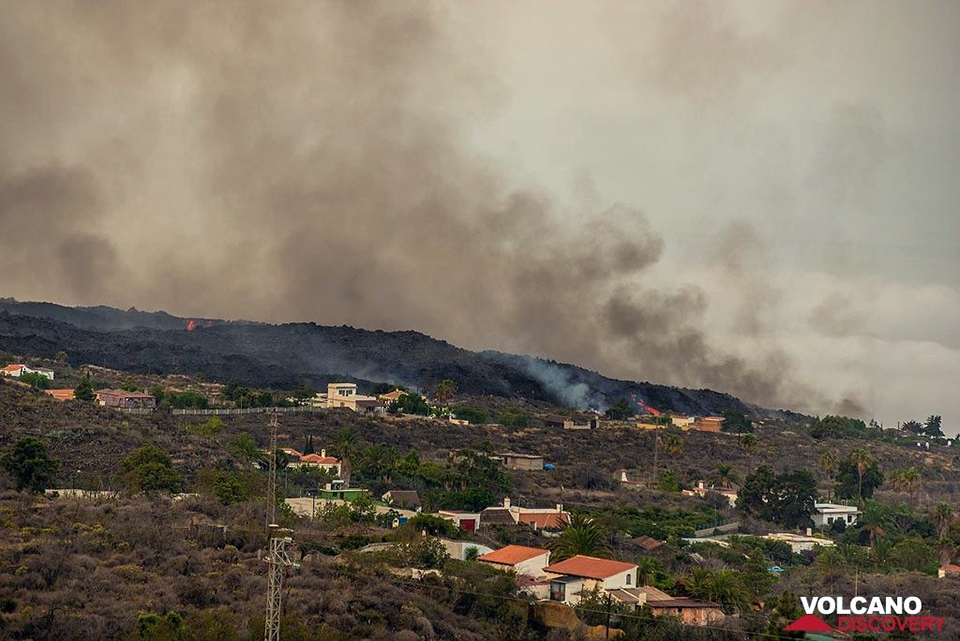 |
Figure 23. The new flow at La Palma moved through the upper outskirts of Todoque on 28 September 2021. Photo by Tom Pfeiffer, courtesy of Volcano Discovery. |
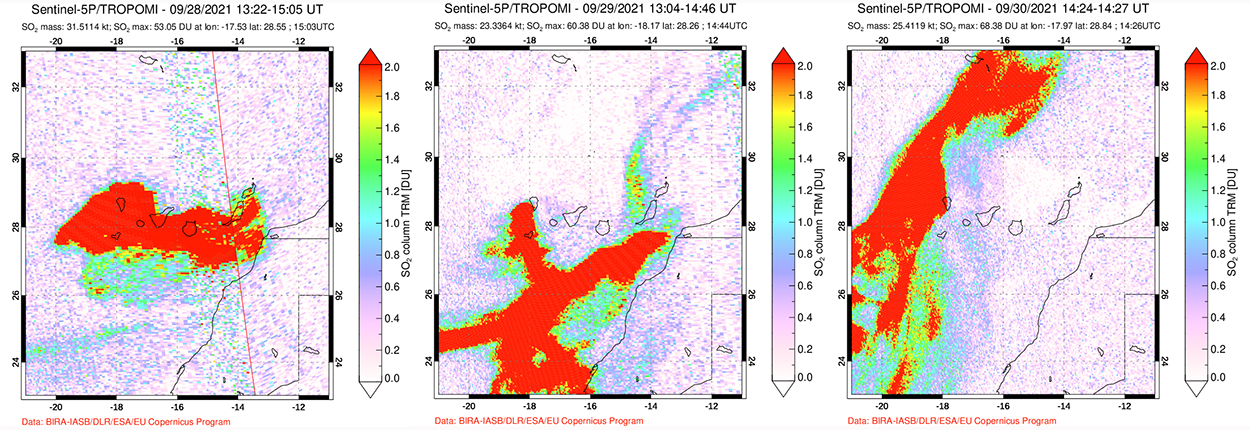 |
Figure 24. The TROPOMI instrument on the Sentinel-5P satellite measured very large plumes of SO2 hundreds of kilometers E, S, and N of La Palma during 28, 29, and 30 September 2021. In addition, plumes of SO2 were visible in satellite imagery in a 75 km radius around the island. Courtesy of NASA Global Sulfur Dioxide Monitoring Page. |
Activity during 28-30 September 2021. Effusive activity continued with a sharp decrease in tremor during the day on 28 September. By evening, sustained fountaining was continuing at the N flank vent, while pulsating jets from three vents within the main crater produced strong effusion into both lava flows. The volume of the cone that had formed at the vent was estimated by PEVOLCA to be 10 million m3. Around 2300 local time on 28 September the main lava flow passed on the S side of Todoque Mountain and entered the sea in the area of Playa de Los Guirres in Tazacorte. A continuous cascading flow of lava fell over the cliff (figure 25) and began to form a lava delta. By dawn on 29 September the delta was growing out from the cliff, producing dense steam explosions where the lava entered the sea (figure 26).
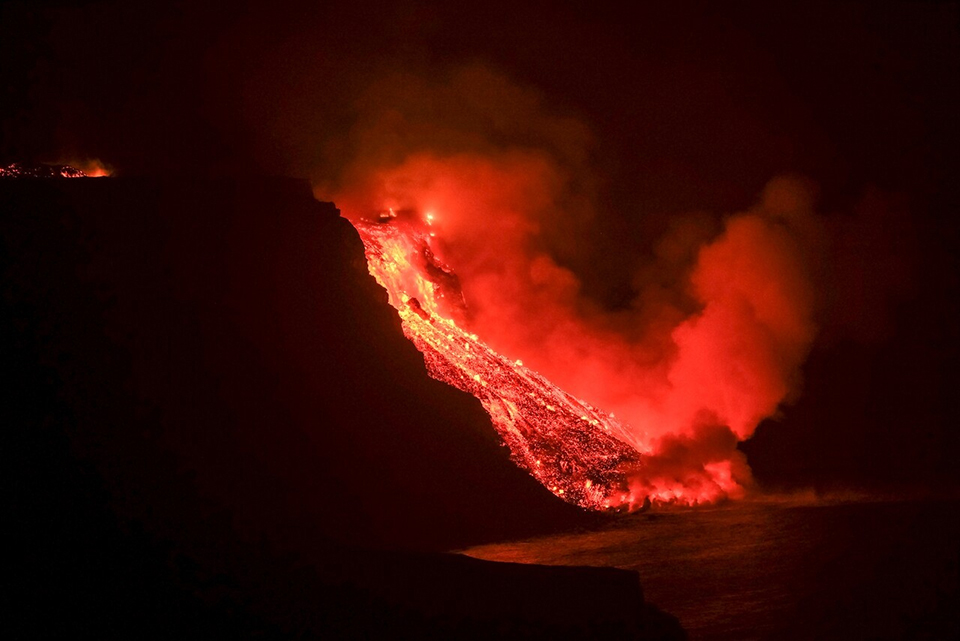 |
Figure 25. A continuous cascade of lava fell over the cliff near El Guirre beach in Tazacorte at La Palma around midnight on 28-29 September 2021. Photo by Angel Medina/EFE, courtesy of RTVE. |
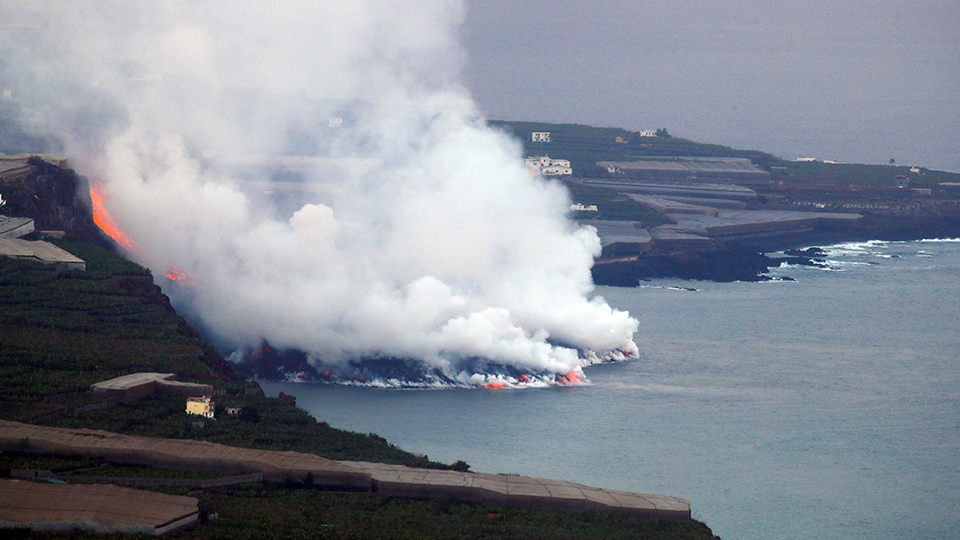 |
Figure 26. By dawn on 29 September 2021 the delta was growing out from the cliff producing dense steam explosions where the lava entered the sea in Tazacorte, La Palma. Image taken from Tijarafe. Photo by Borja Suarez/Reuters, courtesy of RTVE. |
By nightfall on 29 September vigorous Strombolian activity was continuing at the pyroclastic cone, and the main lava flow was active all the way to the sea, with a growing delta into the ocean. Ash emissions continued on 29 and 30 September, rising in pulses to 5.2 km altitude and drifting SE, changing to S, SW, and finally NW. Sentinel-2 satellite imagery comparing 25 and 30 September showed the growth of the lava flow during that interval (figure 27). Strombolian and flow activity continued at the fissure vent on 30 September with new surges of activity sending fresh pulses of lava over existing flows (figure 28). The ocean delta continued to grow and reached a thickness of 24 m by the end of 30 September. Mapping of the flow indicated that 870 buildings had been destroyed and the flow covered 3.5 km2 by midday on 30 September (figure 29).
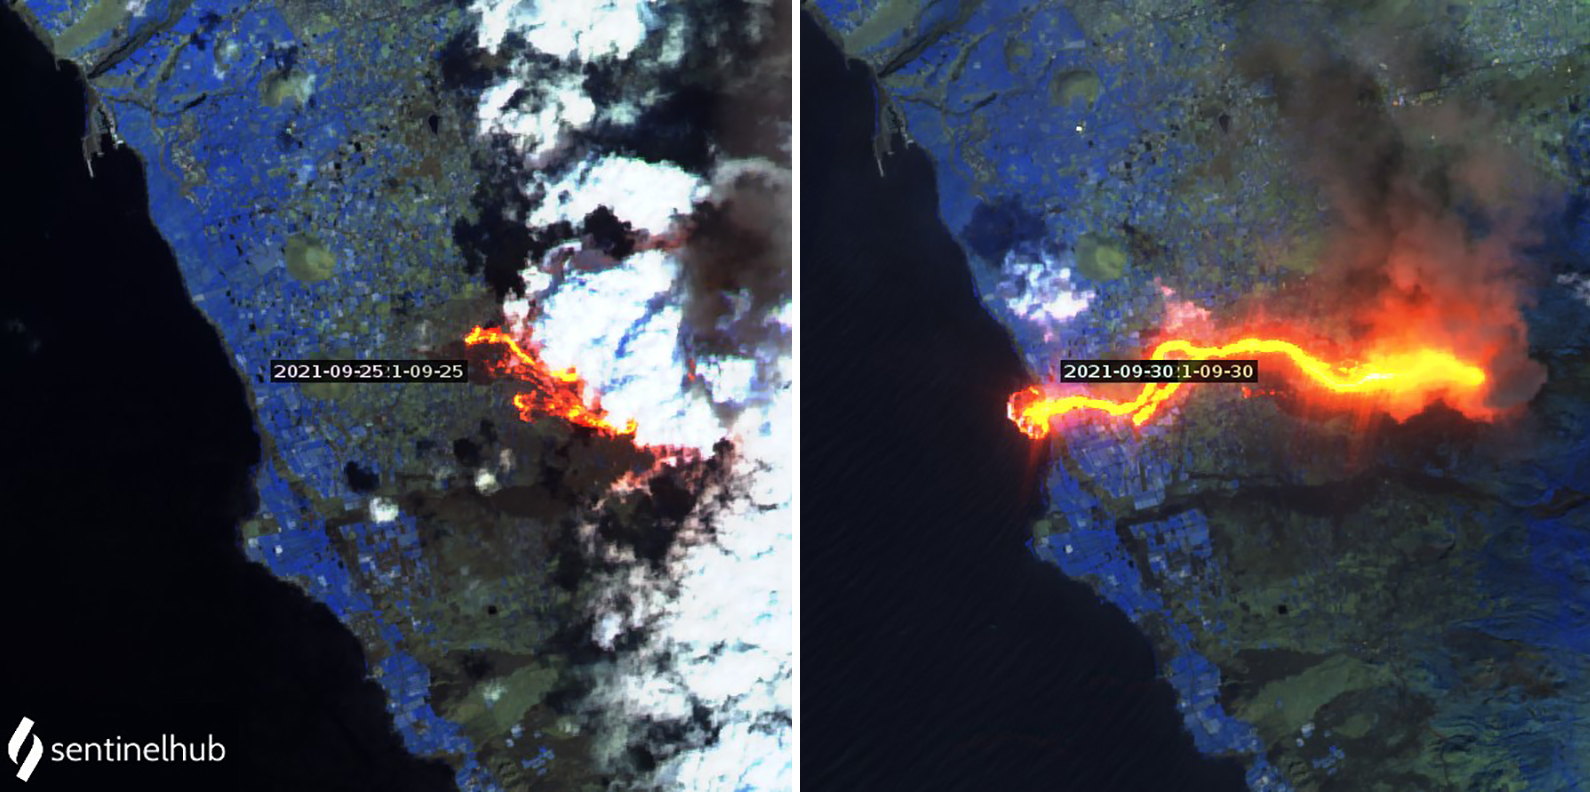 |
Figure 27. The lava flow at the La Palma eruption traveled downslope to the W between 25 (left) and 30 (right) September 2021. It reached the ocean and began building a delta into the sea late on 28 September. Image uses Atmospheric penetration rendering with bands 12, 11, and 8a. Courtesy of Sentinel Hub Playground. |
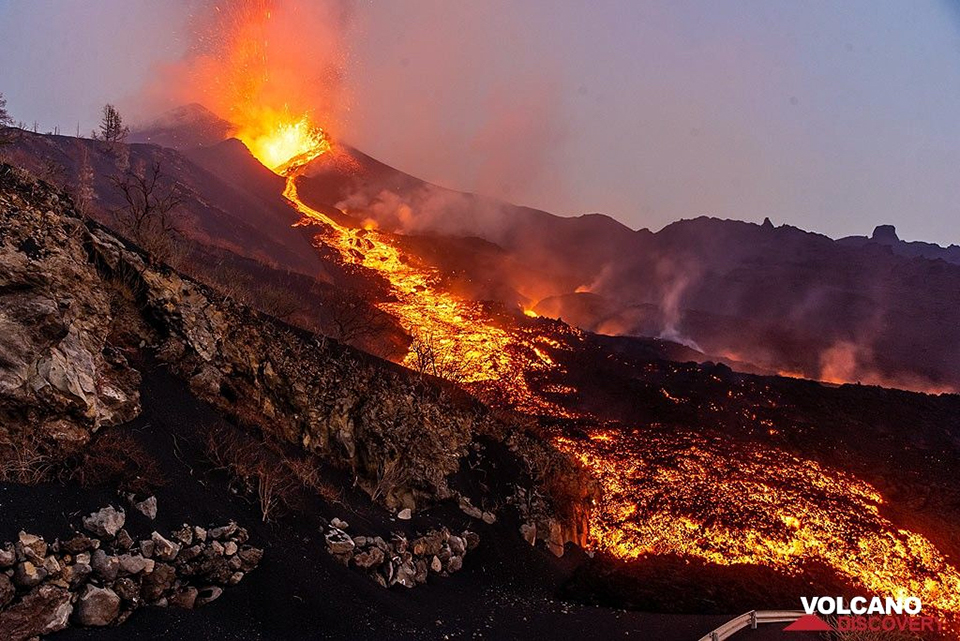 |
Figure 28. Fresh pulses of lava flowed over earlier flows at La Palma on 30 September 2021. Photo by Tom Pfeiffer, courtesy of Volcano Discovery. |
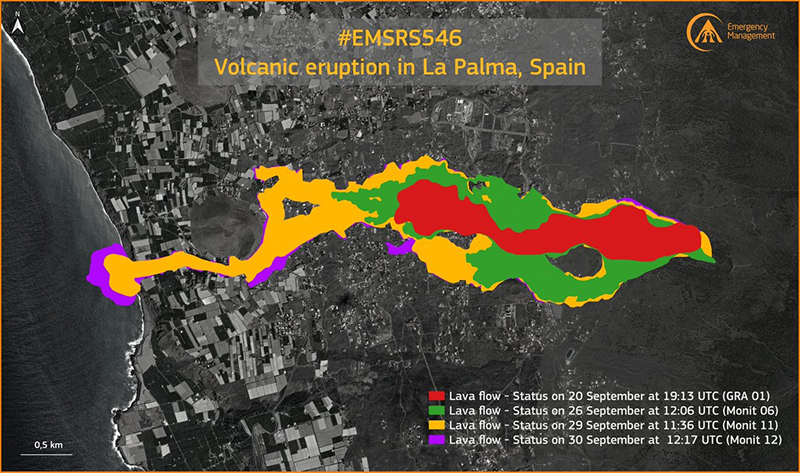 |
Figure 29. Continued mapping of the lava flow at La Palma indicated that by midday on 30 September 2021 it covered about 3.5 km2 and 870 buildings had been damaged or destroyed. The progress of the flow at different dates is shown in different colors. The status of the flow as of 1913 on 20 September is shown in red. The status as of 1206 on 26 September is shown in green. The status as of 1136 on 29 September is shown in orange, and the status as of 1217 on 30 September is shown in purple. Courtesy of Copernicus EMS. |
Late on 30 September 2021 two new vents emerged about 600 m NW of the base of the main cone. They created a new flow about 450 m away from, and parallel to, the main flow that crossed a local highway by the next morning and continued moving W (figure 30). Multiple vents also remained active within and on the flank of the main cone. As of 1 October, the front of the delta was 475 m out from the coastline and 30 m deep. IGN concluded that the volume of material erupted through the end of September was approximately 80 million m3.
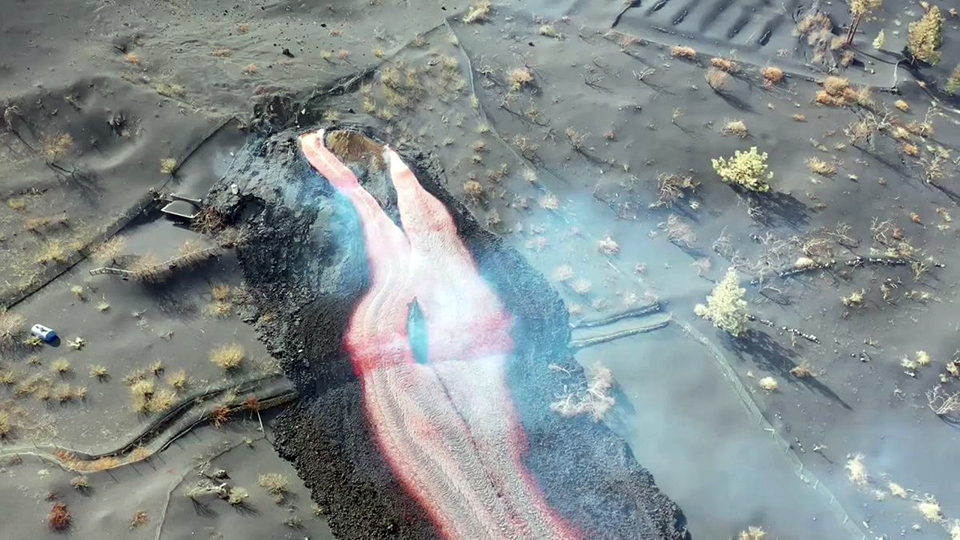 |
Figure 30. Two new vents opened about 600 m NW of the base of the cone late on 30 September 2021. The new flows joined and headed W parallel to the main flow. Drone footage of the new vent was taken on 1 October by the Bristol Flight Lab, courtesy of INVOLCAN. |
Information Contacts: Instituto Geographico Nacional (IGN), C/ General Ibáñez de Íbero 3, 28003 Madrid – España, (URL: https://www.ign.es/web/ign/portal, https://www.ign.es/web/resources/volcanologia/html/CA_noticias.html); Instituto Volcanologico de Canarias (INVOLCAN) (URL: https://www.involcan.org/, https://www.facebook.com/INVOLCAN, Twitter: INVOLCAN, @involcan); Steering Committee of the Special Plan for Civil Protection and Attention to Emergencies due to Volcanic Risk (PEVOLCA), (URL: https://www3.gobiernodecanarias.org/noticias/los-planes-de-evacuacion-del-pevolca-evitan-danos-personales-en-la-erupcion-volcanica-de-la-palma/); NASA Global Sulfur Dioxide Monitoring Page, Atmospheric Chemistry and Dynamics Laboratory, NASA Goddard Space Flight Center (NASA/GSFC), 8800 Greenbelt Road, Goddard, Maryland, USA (URL: https://so2.gsfc.nasa.gov/); Copernicus EMS (URL: https://emergency.copernicus.eu/, https://twitter.com/CopernicusEMS ); Sentinel Hub Playground (URL: https://www.sentinel-hub.com/explore/sentinel-playground); Cabildo La Palma (URL: https://www.cabildodelapalma.es/es/algunas-de-las-imagenes-de-la-erupcion-volcanica-en-la-palma); El Periodico de Cataluny, S.L.U. (URL: https://www.elperiodico.com/es/fotos/sociedad/erupcion-palma-imagenes-12093812/12103264).Corporación de Radio y Televisión Española (RTVE) (URL: https://rtve.es, https://img2.rtve.es/imagenes/casas-todoque-alcanzadas-lava-este-miercoles-22-septiembre/1632308929494.jpg); Tom Pfeiffer, Volcano Discovery (URL: http://www.volcanodiscovery.com/); Volcanes de Canarias (URL:https://twitter.com/VolcansCanarias/status/1441711738983002114); Agence France-Presse (AFP) (URL: http://www.afp.com/ ); Bristol Flight Lab, University of Bristol, England (URL: www.https://flight-lab.bristol.ac.uk, https://twitter.com/UOBFlightLab).
Phreatomagmatic and Strombolian activity, lava effusion, and ash plumes through mid-December 2021
La Palma is a 47-km-long island at the northwestern end of the Canary Islands. It is composed of two large volcanic centers, with the younger Cumbre Vieja to the south dating back 125,000 years. Multiple eruptions during the last 7,000 years have produced mild explosive activity and lava flows which have damaged populated areas and reached the sea in 1585, 1646, 1712, 1949, and 1971. A new eruption from the SW flank began on 19 September 2021, roughly 20 km NW of the site of the 1971 eruption. Two fissures opened and multiple vents produced lava fountains, flows, and ash plumes; the flows traveled over 5 km to the W toward the coastline, eventually extending further into the ocean, damaging buildings and crops (BGVN 46:10). Information in this report describing lava fountains, flows, and ash plumes through the end of the eruption comes from Spain’s Instituto Geographico Nacional (IGN), the Instituto Volcanologico de Canarias (INVOLCAN), the Steering Committee of the Special Plan for Civil Protection and Attention to Emergencies due to Volcanic Risk (PEVOLCA), maps from Copernicus EMS, satellite data, and news and social media reports covering October through December 2021.
Summary of activity during October-December 2021. Strong eruptive activity that began on 19 September continued throughout most of this reporting period. During October, more than 3,000 earthquakes were detected in the southern part of the island and ash plumes rose as high as 5.5 km altitude, according to the Toulouse VAAC. Lava flows emerged from two new vents and moved W toward the coastline, affecting 3,063 buildings, of which 2,896 were destroyed. (figure 31). The lava flow field continued to expand through the eruption (table 2). There were a total of 11 flows numbered during this reporting period. Flow 2, located between the main flow (Flow 1), had reached the sea on 21 September. Lava, including bombs, were ejected as far as 800 m from the vent. Lava fountains rose hundreds of meters high and collapses of the crater walls were common. Similar activity was reported in November, with frequent earthquakes, ash plumes that rose to 4.6 km altitude, ejecta, and multiple lava effusions, some of which reached the coastline and formed a lava delta. Several thousand people were evacuated. During December, the number of earthquakes detected, and ash plumes was notably lower. An ash plume on 13 December rose as high as 7.5 km altitude, but overall, they were lower compared to the previous months. Strong lava effusion persisted during the first half of the month, some of which continued to feed the lava deltas on the coast. By mid-December, activity had mostly subsided, with only some incandescence, weak lava flows, and low gas-and-ash plumes. Sulfur dioxide emissions were consistently detected until mid-December.
|
Figure 31. Simplified location map showing the lava flows generated from the La Palma eruption taken from drone data on 15 December 2021. The black dot represents the vent, and the orange area is the lava coverage that moved generally W. The names of the affected nearby towns are also included. Courtesy of Dirección General de Tráfico. |
Table 2. Summary of the growth of the lava flow field at La Palma between October and December 2021, listing the width of the field (m) and the covered area (km2). Area values were rounded up to the nearest tenth. Data courtesy of PEVOLCA.
| Date | Width (m) | Area (km2) |
| 04 Oct 2021 | 1,250 | 4.1 |
| 08 Oct 2021 | 1,250 | 4.7 |
| 10 Oct 2021 | 1,520 | 5.3 |
| 11 Oct 2021 | 1,520 | 5.9 |
| 12 Oct 2021 | -- | 6.1 |
| 13 Oct 2021 | 1,770 | 6.4 |
| 16 Oct 2021 | 2,350 | 7.2 |
| 17 Oct 2021 | 2,350 | 7.4 |
| 19 Oct 2021 | 2,900 | 7.8 |
| 20 Oct 2021 | 2,900 | 8.0 |
| 22 Oct 2021 | 2,900 | 8.5 |
| 26 Oct 2021 | -- | 8.8 |
| 03 Nov 2021 | 3,100 | 9.8 |
| 09 Nov 2021 | 3,100 | 9.9 |
| 11 Nov 2021 | 3,100 | 10.1 |
| 13 Nov 2021 | 3,100 | 10.2 |
| 16 Nov 2021 | 3,200 | 10.3 |
| 23 Nov 2021 | 3,300 | 10.7 |
| 24 Nov 2021 | 3,300 | 10.9 |
| 25 Nov 2021 | 3,350 | 11.0 |
| 27 Nov 2021 | -- | 11.5 |
| 30 Nov 2021 | 3,350 | 11.3 |
| 02 Dec 2021 | 3,350 | 11.4 |
| 05 Dec 2021 | 3,350 | 11.6 |
| 07 Dec 2021 | 3,350 | 11.8 |
| 14 Dec 2021 | 3,350 | 12.0 |
| 25 Dec 2021 | -- | 12.2 |
Activity during October 2021. Frequent earthquakes were detected during October (a total of 3,416 on the island of La Palma), 635 of which were felt by the nearby communities; most were located 10-15 km deep in the SE area of the island where the swarm had initiated in early September, though some were recorded at depths greater than 30 km (figure 32). The strongest events, magnitude 5.0, occurred on 30 and 31 October at depths of 35 and 38 km, respectively.
|
Figure 32. Map of seismic events at La Palma showing the location of earthquakes on the SE part of the island during 1-31 October 2021, which remained in the same location as those detected on 11 September 2021. The depths of these events range up to 40 km. The color bar on the right represents the dates of the seismic events beginning on 1 October. Courtesy of IGN (Actualización de la información sobre la actividad volcánica en el sur de la isla de La Palma). |
The Toulouse VAAC issued 320 volcanic ash advisories (VAA) for aviation during the reporting period, based on data from satellite imagery and webcams. During October, 132 VAAs described ongoing ash emissions that reached 1.8-5.5 km altitude and drifted up to 185 km in different directions. Some ashfall deposits were reported near the volcano.
By 1 October, roughly 80 million cubic meters of lava had been erupted. Two vents opened about 600 m NW from the main cone on 1 October, forming small cones within two days. Lava from these vents traveled W, then connected with the main flow field downslope. Explosions ejected centimeter-sized material as far as 3.3 km from the cone, and ash and lapilli deposits were reported in areas downwind. The lava flow had extended 540 m beyond the original coastline. Based on satellite images from Copernicus, more than 1,000 buildings had been destroyed in El Pason, Los Llanos de Aridane, and Tazacorte. Ash plumes rose to 3-5 km altitude and drifted S on 2 October.
By 3 October the width of the lava flow field was a maximum of 1,250 m and lava tubes were identified in satellite images. The lava flow had developed four lobes that were fed by multiple lava flows and had an estimated area of 4.1 km2. In the afternoon, the frequency and intensity of the explosions ejected bombs as far as 800 m. Lava fountains rose hundreds of meters high. During 1900-1945 one of the new cones collapsed and spilled into the inner lava lake; lava flows traveled downslope carrying blocks from the destroyed parts of the cone. By 5 October the volume of erupted lava was estimated to be 35 million cubic meters, according to INVOLCAN.
On 6 October a breakout lava flow from the W end of the main flow field traveled S between Los Guirres and El Charcó, destroying crops and buildings (figure 33). On 8 October a new vent had formed on the main cone as ash plumes rose as high as 3.5 km altitude and lightning was occasionally visible; ash deposits at the La Palma and Tenerife North (on Tenerife Island) airports caused a temporary shutdown. The N part of the cone collapsed on 9 October, generating a wide, multi-lobed flow carrying larger blocks NW over older flows (figure 34), based on a news article from Europe Press. The flow quickly advanced to the W along the N margins of the flow field, causing more damage in Todoque and an industrial area.
|
Figure 33. The map of the active lava flows at La Palma between 7 October and 1000 on 23 October 2021. The total area covered by the flows is 8.7 km2 while the lava delta on the W coast is 0.3 km2. The black dots (right) represent the emission vents. The color scale dates the occurrence of the flow. The gray main part of the flow was updated on 11 October 2021 at 1800. Other flow dates ranged from 12-23 October 2021. A partial collapse of the NW flank on the main cone sent large blocks downslope, causing lava to spill out into numerous flows on 23 October. Generally, the direction of travel is to the W toward the coastline. Courtesy of Copernicus EMS, PEVOLCA, CSIC, and IGME. |
|
Figure 34. Photo of a lava flow originating from the N base of the main cone at La Palma on 9 October 2021. Courtesy of Raúl Pérez, IGME. |
By 10 October there had been about 6,000 people evacuated, between 726 and 1,323 buildings damaged by lava, and more than 1.3 km2 of crops destroyed. The inner crater lava lake spilled out after part of the cone had collapsed, which fed more flows and floated large, cooled blocks downslope. According to PEVOLCA, the main flow runs W and NW toward the ocean to as far as 300 m (figure 35). Ash plumes rose to 3.5-4 km altitude and caused ashfall to the S. Video showed lava fountains rising 500 m above the vent late that night.
|
Figure 35. Sentinel-2 infrared satellite images showing the main lava flow moving W and NW toward the coastline from La Palma on 10 October 2021. A gray ash plume is drifting SW. Image with “Atmospheric penetration” rendering (bands 12, 11, 8a). Courtesy of Sentinel Hub Playground. |
The lava field grew to the N and S on 11 October and was an estimated 5.91 km2 with a width of 1,520 m, though the flows that had fed it slowed. The northernmost flow advanced another 50 m toward the coast. On 12 October this N lava flow prompted an evacuation of roughly 700-800 people from the La Laguna area; it continued to move over crops and was 200 m from the coast.
The main cone had at least three effusive vents and another vent to the N was also active. Multiple collapses of parts of the cone sometimes sent large blocks of cooler lava rafting down the flows and the lava field was fed by numerous streams of lava. The lava flow field included three areas: the initial main flow that traveled W around the S part of Mantaña de Todoque toward the ocean; a flow that had branched off of the main flow to the S; and flows that traveled W along the N margins of the main flow. The main and S lava flows were being only minimally fed.
As intermittent ash plumes continued, INVOLCAN reported that ash and tephra deposits (figure 36) had grown to a volume of 8-9 million cubic meters since the start of the eruption through 13 October. On the night of 13 October and the morning of 14 October, 400 people were evacuated from La Laguna in Los Llanos de Aridane as the N flow advanced NW. More than 100 million cubic meters of lava had been erupted since the beginning of the eruption, according to PEVOLCA. During 13-19 October the lava flows along the N margins (the N flow) were the most active and were comprised of two main branches.
|
Figure 36. Photo of tephra deposits from La Palma taken on 13 October. The volume of tephra is estimated to be 8-9 million cubic meters since the start of the eruption. Courtesy of INVOLCAN. |
A vent located 300 m from the SE base of the main cone reactivated during 15-16 October, which generated some phreatomagmatic activity and gas-and-ash emissions. At the same time, increased phreatomagmatic activity was detected in the main vent. Ongoing lava fountains during 16-17 October were reported by the Toulouse VAAC, based on webcam images (figure 37). Large blocks were carried downslope by the advancing N flows, which would occasionally overflow their channels and spread laterally for short distances. The flow reached Montaña de La Laguna, traveled around the S part, and continued to the W toward the ocean; by 19 October the end of the lava flow was 100-110 m from the coastline. Small avalanches in areas with thick ash deposits descended slopes near the Tamanca ravine, producing small ash plumes.
|
Figure 37. Photo of Strombolian activity at La Palma taken at 2000 on 17 October 2021. Courtesy of INVOLCAN. |
On 19 October around 0900 an ash plume reported by IGN rose to 5 km altitude. The lava flow that moved through the N of Mantaña Todoque had stopped that day, while the one advancing through the S of La Laguna was 130 m from the coastline. By this time, about 6,400 people had been evacuated. A new vent that opened in the area between the main cone and the 16 October vent (300 m from the SE base of the main cone) exhibited explosive phreatomagmatic activity followed by Strombolian activity.
On 20 October an ash plume rose to 3.5 km altitude. The main cone varied in shape as partial crater rim and wall collapses occurred and the eruption progressed. The main cone generated explosions and a lava overflow, which was visible at 2000 on 22 October. During 22-23 October there was a decrease in the rate of advancement. A partial collapse of the NW flank on the main cone intensified ash emissions and sent large blocks downslope on 23 October; these blocks fell onto another vent which caused lava to spill out into numerous flows (figure 33). Strong explosions heard at 1230 ejected material out of the vent, and lava overflowed a vent on the flanks of the main cone at 1415. Ash emissions rose to 3 km altitude.
Tall lava fountains rose from at least two vents on 24 October. A new vent opened on the NW flank in the afternoon and effused lava at a high rate. As a result, the vent increased in height and width during 24-25 October. The vent located at the SE end of the fissure produced slow-moving lava flows that traveled to the SW. By this time, a total of nine emission points had emerged since the start of the eruption, though only four remained active: the main flow runs along the N margins, covering previous flows; one flow originated from the SE end of a fissure, moving SW; and one flow emerged on the NW slope of the main cone. This NW flow generated large blocks that fell on a lower lava emission point that resulted in multiple lava spills. Ash plumes rose to 3.8 km altitude. More than 50 km of roads had been damaged, along with roughly 2,270 buildings (2,143 destroyed) and 2.6 km2 of crops affected, according to a Copernicus EMS map.
On 25 October strong explosive activity was visible; a small collapse of the cone was observed at 1700. Between 2000-2100 a lava lake in the main cone increased in volume, resulting in a partial collapse of the upper part of the cone and producing large, detached blocks that rafted downslope on several lava flows. Lava advanced over some areas that were previously unaffected, particularly in Alcalá, covering 8.79 km2 by 26 October. Flows on the N end of the field were less than 100 m from the coastline. Lava fountains rose as high as 600 m from the vent located at the SE end of the fissure.
When the flow reached the coastline, a delta formed, reaching 120 m water depth while rock fragments from the end of the flow were observed at depths of 360 m. Lava filled the upper and middle areas of underwater ravines, covering an area of about 0.11 km2 and with a depth of 10-30 m.
Around noon on 29 October, a series of intense and audible explosions occurred for several hours, generating a large amount of ash that affected the entire W and NW parts of the island. Multiple air quality alerts were issued by authorities as they warned residents of some affected areas (Los Llanos de Aridane in particular) to stay indoors and, if going outside, to wear a filtering mask. On 31 October some larger explosions were accompanied by shock waves, while the effusion rate at the NW flank vent notably increased. An ash plume that day rose at least 4.5 km altitude (figure 38).
|
Figure 38. Webcam image of an ash plume rising from the main cone at La Palma on 31 October 2021 taken from the Cabeza de Vaca runway. Courtesy of IGN (Actualización de la información sobre la actividad volcánica en el sur de la isla de La Palma). |
Frequent sulfur dioxide plumes with fluxes between 2,882 and 53,600 tons/day were also identified in satellite images drifting as far as 240 km S, as well as in multiple directions (figure 39). The higher value was recorded on 24 October. On 8 October these plumes reached the Caribbean and on 12 October they were over northern Africa, Spain, and Portugal. By 19 October the plumes had extended to the NW over Spain, France, and Germany.
|
Figure 39. Significant sulfur dioxide emissions from the Cumbre Vieja eruption at La Palma were measured by the TROPOMI instrument on the Sentinel-5P satellite. These plumes drifted in multiple directions, reaching as far as the Caribbean on 8 October, northern Africa, Spain, and Portugal on 12 October, and France and Germany by 19 October. The dates shown were taken consecutively during 20-23 October 2021. Courtesy of NASA Global Sulfur Dioxide Monitoring Page. |
Activity during November 2021. During November, frequent earthquakes continued (a total of 2,871 on the island of La Palma), 235 of which were felt by the nearby populations. The maximum magnitude reached 5.1 on 19 November at a depth of 36 km. Seismicity was distributed in two groups: earthquakes that occurred at 10-15 km deep and those at depths greater than 30 km. Volcanic tremor levels decreased around noon on 2 November and again during 4-5 November and remained at low levels through 9 November.
Ash emissions rose to 2.1-4.6 altitude and drifted 55 km N, E, SE, S, SW, and NW. On 3 November explosive activity increased around 1300, producing a dark ash plume that rose to 4.5 km altitude. Intermittent sulfur dioxide emissions continued to be visible in satellite images.
The vents in the main cone continued to effuse lava, eject tephra, and intermittently produce dense and billowing ash-and-gas plumes. Audible explosions and significant ash emissions continued intermittently through 2 November, with ashfall affecting the entire W and NW parts of the island. Lava continued to effuse to the NW from a vent on the NW flank, overflowing and occasionally breaking out and forming new flows. A flow at the end of October originated along the upper central part of the S margin of the flow field, N of Montaña Cogote and on 6 November the rate of advancement increased.
On 5 November the ash plume rose to 3.5 km altitude at 0845 (figure 40). Based on data from the FLIR (Forward Looking InfraRed Infrared) thermal instrument, the temperature of the plume was 178 °C. On 7 November a dense, gray ash plume was reported to 2.7 km altitude that drifted WSW, accompanied by lava fountaining (figure 41).
|
Figure 40. Photo of an ash plume rising 3.2 km altitude above La Palma on 4 November 2021, accompanied by a thermal image. The temperature of the plume is 178°C according to the display shown on the FLIR (Forward Looking InfraRed Infrared) instrument being held by a volcanologist. Courtesy of IGN (Actualización de la información sobre la actividad volcánica en el sur de la isla de La Palma). |
|
Figure 41. Photo of a dense gray ash plume rising above La Palma on 7 November that drifted WSW, accompanied by lava fountaining. Courtesy of IGN (Actualización de la información sobre la actividad volcánica en el sur de la isla de La Palma). |
Flow 2 reached the sea cliff at Los Guirres Beach and entered the sea at 0245 on 9 November (figure 42). A new branch to the N was reported during the morning of 9 November, which was located a few meters from the coastline. On that same day, there was a decrease in seismicity, tremor, and deformation levels, in addition to sulfur dioxide emissions, though scientists were unable to confirm this decline. By 10 November the highest point of the main cone was 1,130 m altitude. Lava continued to flow W through pre-existing lava channels and tubes, over older flows, and occasionally formed new branches. Occasional short-lived lava ponds occurred at the main crater vents. Flow 2 had reached the sea around 0144 on 10 October, starting a new lava delta, which overlapped the previous one to the N. Flows 1-9 continued to advance, while the others remained relatively stationary. Lava filled in some gaps between the N flows (Flows 4 and 7), though flow advancement was mainly focused at and near the ocean entries, feeding flows 1, 2, and 9.
|
Figure 42. Photo of the lava flow from La Palma reaching the sea cliff at Los Guirres Beach and entering the sea at 0245 on 9 November 2021. Courtesy of PEVOLCA. |
A lava lake overflow occurred at the top of the W part of the main cone and lasted for a few hours; the lava flow field covered 10.1 km2. On 13 November, three lava flows continued to feed Flow 1, and to a lesser extent Flows 2 and 9, which in turn fed the lava deltas along the Los Guirres Beach (figure 43). An ash plume at 0845 rose to 3.1 km altitude and drifted SW. Ash emissions intensified on 14 November.
|
Figure 43. The growth of the lava flow field at La Palma during 20 September through 13 November 2021 shown in different colors. The extent of the field on 20 September is shown in red, and on 29 September is shown in orange. In October, the extent on the 15th is shown in blue, with flow coverage on the 27th in purple (on the N side). By 9 November flows shown in light blue had expanded on the S side of the field. Flows moving W towards the coast flows are shown in dark orange on 12 November and in light green on the 13th, where two lava deltas had formed. Courtesy of Copernicus EMS. |
According to IGME, by 15 November the two S lava deltas have merged, covering an area of 0.4 km2 beyond the previous coastline. Flow 9 had reached the sea, feeding the lava deltas along with Flows 1 and 2. Another lava delta grew along Charcón Beach, but its flow was not strongly fed and reached 30 m thick in some areas. The lava flows that had advanced W along the S side of Montaña de La Laguna were 86 m from the coast of Tazacorte, near the beach of El Perdido. On 16 November ash drifted W and SW and caused some flight disruptions at the La Palma airport. Volcanic tremor levels increased during 16-17 November then returned to low levels.
PEVOLCA reported that though Strombolian activity and phreatomagmatic pulses continued, there was an overall decline in activity beginning in mid-November. During 17-18 November Flow 5 advanced along the N base of Montaña de Todoque and along the S edge of Flow 4, which had also advanced and widened (figure 44). After a lull in activity on 17 November, Strombolian activity and ash emissions resumed later in the day, ejecting larger pyroclasts from the vents in the upper part of the cone. On 18 November an ash plume rose to 3.5 km altitude and drifted SW (figure 45). Video data that was posted at 1615 on 18 November showed jetting lava and billowing ash plumes containing some lightning flashes. A PEVOLCA report from 20 November reported that the total volume of emitted tephra during the eruption was more than 10 million cubic meters.
|
Figure 44. Photo of lava flows from La Palma covering new areas between the Montaña de Todoque and La Laguna during 17-18 November 2021. Courtesy of PEVOLCA. |
|
Figure 45. Photo of an ash plume rising to 3.5 km altitude and drifting SW from La Palma on 18 November 2021. Courtesy of IGN (Actualización de la información sobre la actividad volcánica en el sur de la isla de La Palma). |
Around 2000 on 19 November increase in the effusion rate caused the lava lake to overflow. Three flows were active: Flow 11 ran from Montaña Rajada to the N of Montaña Cogote, one fed the lava deltas off the coast, and the third was located to the NW between Flows 4 and 7 (figure 46). During the evening, lava overflowed one of the craters in the main cone; crater overflows were again visible on 21 November. Lava continued to fill in gaps between Flows 4 and 7 and by 21 November, the two had merged. Flow 7 advanced W and by 1303 on 22 November, reaching the sea at La Viña Beach (figure 47). The lava delta had an area of approximately 0.43 km2.
|
Figure 46. Map of lava flows 1-11 effusing from La Palma moving generally W toward the coastline on 19 November 2021. Flows 1, 2, and 9 supplied the lava delta S of Flows 4 and 7. Green represents older flows while red represents younger flows. The pink and purple regions denote part of IGME’s Continuous digital geological mapping. Courtesy of IGME. |
|
Figure 47. Map of Flow 7 from La Palma arriving at the sea at La Viña Beach on 22 November 2021. Flows 4 and 5 are located to the S of Flow 7 and the front of Flow 8 is to the E of it. Courtesy of PEVOLCA. |
By 23 November, Flows 1, 2, and 9 had merged and fed the main S delta, which extended 0.41 km2 from the coastline. Roughly 7,500 people had been affected by evacuations across El Paso, Fuencaliente, Los Llanos de Aridane, Tazacorte, and Villa de Mazo. During 23-25 November, Flows 4, 5, and 7 at the N end of the flow field continued to widen and advance, filling in gaps between previous flows and feeding the N lava delta. Flows 1, 2, and 9 fed the S delta at a lower rate. The N lava delta, fed by Flow 7, was estimated to be 0.05 km2 while the S lava delta was 0.43 km2 by 24 November. An ash plume rose to 4.3 km altitude on 24 November.
The number of active flows on the flow field increased as lava overflowed their channel margins or broke out of the lava tubes. The easternmost vent produced a fast-moving flow that traveled along the S margin of Flow 10 and around the S side of Montaña Cogote on 24 November. The flow advanced through the Las Manchas cemetery and inundated parts of a solar power plant; the newly covered areas were within the exclusion zone, which had already been evacuated. During 24-26 November ash plumes rose as high as 4.8 km altitude and drifted E, which resulted in ashfall at the La Palma airport. The lava effusion rate increased at the main crater vents at 0900 on 25 November, and around 1100 two small E-W fissures opened less than 1 km S of the main cone. The amplitude of the volcanic tremor signal fluctuated at low-medium levels that coincided with the effusive episodes that occurred on 25 November. The flow rate slowed to about 25 m/hour and merged with Flow 11 by 26 November. A lava overflow SW of Flow 3 produced a small branch oriented laterally to the flow margin. Flow 7 widened during 26-27 November as it continued to be fed.
On 28 November new vents opened on the NE flank of the main cone around 0300, accompanied by an ash plume that rose to 1.6 km altitude from the main crater and drifted SW (figure 48). The new vents produced fluid lava flows that traveled N and NW through the Tacande area and were followed by landslides on the NW flank of the cone. According to a video taken at 1145 lava fountains rose from one of the vents, while another ejected tephra. Video footage taken at 1050 on 29 November showed lava flows transporting large blocks downslope while another one showed lava flowing at a rate of about 1 m/s. By noon, the vents in the main cone became noticeably less active and were more intermittent through 30 November. Several lava streams from the new vents continued to advance NW and then W along older flows which had split into two branches on 26 November. One branch traveled through tubes and fed Flows 4, 5, and 7 between Montaña de Todoque and Montaña de La Laguna while the other descended toward Flow 8 (the northernmost flow). According to PEVOLCA, the S lava delta was estimated to be 0.43 km2 while the N lava delta was about 0.06 km2. Roughly 2,860 buildings had been affected by 30 November (2,748 destroyed) and about 3.5 km2 of crops were covered by lava.
|
Figure 48. Photo of the new vent that opened on the E of the main cone of La Palma on 28 November 2021 (left), accompanied by lava fountaining, a flow, and an ash plume that rose to 1.6 km altitude and drifted SW (right). Courtesy of IGN (Actualización de la información sobre la actividad volcánica en el sur de la isla de La Palma). |
Strong sulfur dioxide plumes fluctuated at a rate of 7,000-43,000 tons/day, but was as low as 900-4,000 tons per day, showing an overall decrease compared to the amount emitted during October. On 5 November photos showed sulfur deposits on the E flank on the main cone and in other areas near vents emitting volcanic gases (figure 49). During 27-28 November there was a brief surge in sulfur dioxide emissions with values of 30,000-49,999 tons/day (figure 50) and remained relatively high during 29-30 November with values between 1,000 and 29,999 tons/day.
|
Figure 49. Photo showing sulfur deposits (light yellow) on the E flank of the upper part of the cone at La Palma (center background) on 5 November 2021. A gray ash plume is also visible rising above the cone. Courtesy of IGN (Actualización de la información sobre la actividad volcánica en el sur de la isla de La Palma). |
|
Figure 50. Sulfur dioxide emissions from the Cumbre Vieja eruption at La Palma measured by the TROPOMI Instrument on the Sentinel-5P satellite persisted, drifting in different directions. During 27 and 28 November 2021 strong plumes were detected drifting SW. Courtesy of NASA Global Sulfur Dioxide Monitoring Page. |
Activity during December 2021. A total of 1,357 earthquakes were detected during December on the island of La Palma, with a maximum magnitude of 4.2 on 19 December. The nearby population felt 44 of these earthquakes during this month. On 1 December a gas-and-steam plume rose as high as 5.2 km altitude while an ash plume rose to 3.5 km altitude and drifted SSW at 0945.
During December, about 60 VAAC notices were issued, noting that low-to-moderate ash emissions rose to 1.9-3.9 km altitude and drifted SW and S; low sulfur dioxide emissions were also detected in satellite images. On 13 December a strong explosion generated an ash plume that rose as high as 7.5 km altitude. By the next day, ash emissions resumed to low levels of 2.4 km altitude that drifted E and S.
Persistent Strombolian activity was sometimes intense on the NE flank during 1-3 December as lava continued to feed Flow 8 and the N lava delta. Lava fountains rose 400-500 m above the vent on 2 December (figure 51). A new pyroclastic cone had formed around the vent on the NE flank, though it was unstable and blocks from partial collapses descended via lava flows. According to PEVOLCA, a new Flow 12 was the northernmost flow after it split from Flow 8 and traveled over the Fronton area but then later rejoined Flow 8 downslope; Flow 8 was located about 800 m from La Laguna. The flows reached part of the Tacande highway on 3 December. Flow 7 continued to feed the N lava delta. The vents in the main cone were quieter and periodically emitted ash and gas. A N-S oriented crack opened in an area 100 m S of the main vent, which was likely due to subsidence. On 3 December a new fissure opened on the SE flank of the main cone that produced Strombolian activity and fast-moving lava flows that traveled SW along Flow 10. An ash plume rose to 1.9 km altitude and drifted SSW, accompanied by continued lava fountains (figure 52).
|
Figure 51. Photo of a lava fountain rising 400-500 m above La Palma on the NE flank on 2 December 2021. Courtesy of INVOLCAN. |
|
Figure 52. Photo of an ash plume rising to 1.9 km altitude and drifted SSW from La Palma on 3 December 2021. Lava fountains were also visible in the photo to the left. Courtesy of IGN (Actualización de la información sobre la actividad volcánica en el sur de la isla de La Palma). |
A flow continued to advance W on 4 December, though at a slower rate as it filled in gaps between Flows 3 and 11. By 4 December the NE vent was quiet. Flows 7, 8, and 10 were fed via lava tubes, though also at a lower rate. Several new vents along an E-W fissure located W of Montaña del Cogote opened around noon on 4 December, producing multiple fast-moving lava flows. The flows descended SW over new land, crossing into Tazacorte and Los Llanos de Aridane, destroying 60 homes. It merged with Flow 9, reaching the sea cliff in the Las Hoyas area by 5 December, descending the cliff the next day. During 6-7 December lava advanced W through multiple tubes and fed Flows 1 and 2, as well as the S delta. A new bathymetry between Flows 1 and 4 showed they occurred at shallow depths of up to 4.5 m. The NE vent resumed with sporadic Strombolian activity and ash emissions. Several vents in the central and SE parts of the main cone also produced sporadic Strombolian activity and ash emissions as well.
During 8-12 December activity at several vents in the central and SE part of the main cone was low, with only sporadic pulses of Strombolian activity and ash emissions. Intense gas emissions were recorded during 9-11 December. Small landslides from fractured areas in the upper part of the secondary cone (on the E flank) descended the interior part of the crater as well as the flanks. Lava from the vents moved through tubes toward the W part of the flow field, though two main breakout flows traveled W over older flows. The most active area was along the S margin of Flow 9, where 9 and 11 had merged, as lava continued to descend the sea cliff and widen the field by Las Hoyas. During 11-12 December lobes from the S margins of the flow traveled S in the Las Norias area (figure 53).
|
Figure 53.The growth of the lava flows at La Palma during 20 September through 11 December 2021 shown in different colors. The extent of the flow on 20 September is shown in red. The extent of the flow on 29 September is shown in yellow. The extent of the flow on 15 October is shown in blue. The extent of the flow on 27 October is shown in purple. The extent of the flow on 9 November is shown in light blue. The extent of the flow on 24 November is shown in light green. The extent of the flow on 5 December is shown in bright pink. The extent of the flow on 9 December is shown in pale pink. The extent of the flow on 11 December is shown in white. Each of these flows are moving W toward the coastline where two lava deltas had formed (N and S). Courtesy of Copernicus EMS. |
On 12 December several strong pulses of tremor were accompanied by intense Strombolian activity. A small lava overflow from one of the vents traveled N over older flows. One of the stronger periods produced dense, dark ash plumes that rose to 6 km altitude and ejected bombs (some of which were several meters in diameter) as far as 500 m from the vent. Collapses enlarged the main crater and the secondary cone on the E flank. During 12-13 December lava continued to travel W through tubes in the central part of the flow field. At the S margins, lava filled in the uncovered areas between Flows 9 and 11. On 13 December tremor levels fluctuated with pulses of intense signals. Strong explosive activity during 1745-1900 ejected bombs toward the N flank and produced gas-and-ash plumes (figure 54). At 1820 video showed lava jetting above the vent and incandescent material falling onto the flanks; activity at the vents decreased after that. Tremor also decreased at 2000 and by 2200 had reached background levels. Gas emissions from the vents were at high levels through 14 December and lava continued to move from the W base of the main cone on 14 December, though at a much lower rate compared to the previous day. Small breakouts were visible near Montaña Cogote and Las Norias. Daily measurements indicated that sulfur dioxide emissions persisted at relatively high levels with values of 1,000-29,999 tons/day (figure 55). According to the Copernicus EMS map, approximately 3,063 buildings had been affected (at least 2,896 destroyed).
|
Figure 54. Photo of a large gas-and-ash plume rising above La Palma at 1815 on 13 December 2021. Courtesy of INVOLCAN. |
|
Figure 55. Sulfur dioxide emissions from the Cumbre Vieja eruption at La Palma measured by the TROPOMI Instrument on the Sentinel-5P satellite persisted through 13 December 2021. By 14 December the volume of sulfur dioxide emissions notably decreased compared to the continuous emissions from the previous days. Courtesy of NASA Global Sulfur Dioxide Monitoring Page. |
Observations made on 15 December showed no signs of lava flowing from the vents at the W base of the main cone, from tubes, or at the lava delta in the Las Hoyas area. During 15-20 December the tremor was at background levels, and seismicity was very low at all depths. Sporadic gas emissions rose from the vents and from cooling lava flows. Small collapses from the walls of the main and secondary cone craters were visible due to existing faults and fissures. Sulfur dioxide emissions varied from less than 5 to 999 tons/day, which was consistent with a cooling and degassing lava flow field. By the end of December, the number of earthquakes had decreased and were located in the S and E area of the island at shallow depths of 11-16 km and less than 5 km (figure 56). According to PEVOLCA, on 17 December a small lava flow remained active in a lava tube, which was part of Flow 11, running over older flows. Incandescence was observed in the Las Hoyas area.
|
Figure 56. Map of the seismic events at La Palma showing the location of earthquakes on the SE part of the island during 27-29 December 2021. The depths of these events were no greater than 16 km. The color bar on the right represents the length each event lasted, while the shape denotes its magnitude. Courtesy of IGN (Actualización de la información sobre la actividad volcánica en el sur de la isla de La Palma). |
On 25 December PEVOLCA announced that the eruption that began at 1511 on 19 September had ended at 2221 on 13 December 2021. During the course of the eruption, six craters were formed and the average length of the cone was 700 m; the largest crater was 172 m by 106 m. The total volume of lava erupted was 200 million cubic meters. Material was ejected as far as 1.5 km over the course of the eruption and lava covered 12.19 km2. The maximum temperature of the lava was 1,140°C. The lava deltas spread 0.48 km2 above the water, while 0.21 km2 was covered underwater.
Information Contacts: Instituto Geographico Nacional (IGN), C/ General Ibáñez de Íbero 3, 28003 Madrid – España, (URL: https://www.ign.es/web/ign/portal, https://www.ign.es/web/resources/volcanologia/html/CA_noticias.html); Instituto Volcanologico de Canarias (INVOLCAN), (URL: https://www.involcan.org/, https://www.facebook.com/INVOLCAN, Twitter: INVOLCAN, @involcan); Toulouse Volcanic Ash Advisory Center (VAAC), Météo-France, 42 Avenue Gaspard Coriolis, F-31057 Toulouse cedex, France (URL: http://www.meteo.fr/aeroweb/info/vaac/); Gobierno de Canarias, (URL: https://www.gobiernodecanarias.org/principal/); Consejo Superior de Investigaciones Científicas (CSIC), Serrano, 117. 28006 Madrid, Spain, (URL: https://www.csic.es/es); El País, SL Miguel Yuste, 40 – 28037 Madrid, (URL: https://elpais.com/sociedad/2021-10-04/fue-como-una-presa-que-se-rompe-la-lava-cubre-ya-413-hectareas-de-la-palma-y-alcanza-un-perimetro-de-36-kilometros.html); Europe Press, Canary Islands, Paseo de la Castellana, 210 28046 Madrid, (URL: https://www.europapress.es/islas-canarias/noticia-registra-nuevo-derrumbe-flanco-norte-volcan-palma-20211009204021.html); El Diario, Gran Vía Street, 46, First Floor 28013 Madrid, (URL: https://www.eldiario.es/canariasahora/lapalmaahora/nuevo-volcan-palma-arrojado-80-millones-metros-cubicos-lava-f_1_8357503.html?fbclid=IwAR3yqzPSVvlIv0ZDol4bRgod3dc31qbn8-SJPQS3MgKvh9MS0pTMj7Yh6B4); Instituto Geológico y Minero de España, Pink Rivers, 23 28003 Madrid, (URL: https://www.igme.es/, https://twitter.com/IGME1849); Dirección General de Tráfico (DGT), Cabildo Insular de la Palma Av. Maritima 3 Santa Cruz de La Palma (URL: https://volcan.lapalma.es/pages/visor); NASA Global Sulfur Dioxide Monitoring Page, Atmospheric Chemistry and Dynamics Laboratory, NASA Goddard Space Flight Center (NASA/GSFC), 8800 Greenbelt Road, Goddard, Maryland, USA (URL: https://so2.gsfc.nasa.gov/); Copernicus EMS (URL: https://emergency.copernicus.eu/, https://twitter.com/CopernicusEMS); Sentinel Hub Playground (URL: https://www.sentinel-hub.com/explore/sentinel-playground).
|
|
||||||||||||||||||||||||||
There is data available for 14 confirmed Holocene eruptive periods.
2021 Sep 19 - 2021 Dec 13 Confirmed Eruption (Explosive / Effusive) VEI: 3
| Episode 1 | Eruption (Explosive / Effusive) | Tajogaite eruption | |||||||||||||||||||||||||||||||||||||||
|---|---|---|---|---|---|---|---|---|---|---|---|---|---|---|---|---|---|---|---|---|---|---|---|---|---|---|---|---|---|---|---|---|---|---|---|---|---|---|---|---|
| 2021 Sep 19 - 2021 Dec 13 | Evidence from Observations: Reported | |||||||||||||||||||||||||||||||||||||||
|
List of 6 Events for Episode 1 at Tajogaite eruption
|
||||||||||||||||||||||||||||||||||||||||
1971 Oct 26 - 1971 Nov 18 Confirmed Eruption (Explosive / Effusive) VEI: 2
| Episode 1 | Eruption (Explosive / Effusive) | Teneguia | |||||||||||||||||||||||||||||||||||||||||||||||||||||||||||||||||||||||||||||||
|---|---|---|---|---|---|---|---|---|---|---|---|---|---|---|---|---|---|---|---|---|---|---|---|---|---|---|---|---|---|---|---|---|---|---|---|---|---|---|---|---|---|---|---|---|---|---|---|---|---|---|---|---|---|---|---|---|---|---|---|---|---|---|---|---|---|---|---|---|---|---|---|---|---|---|---|---|---|---|---|---|
| 1971 Oct 26 - 1971 Nov 18 | Evidence from Observations: Reported | |||||||||||||||||||||||||||||||||||||||||||||||||||||||||||||||||||||||||||||||
|
List of 14 Events for Episode 1 at Teneguia
|
||||||||||||||||||||||||||||||||||||||||||||||||||||||||||||||||||||||||||||||||
1949 Jun 24 - 1949 Jul 30 Confirmed Eruption (Explosive / Effusive) VEI: 2 (?)
| Episode 1 | Eruption (Explosive / Effusive) | San Juan, Llano del Banco, Hoyo Negro | ||||||||||||||||||||||||||||||||||||||||||||||||||||||||||||||||||||||||||
|---|---|---|---|---|---|---|---|---|---|---|---|---|---|---|---|---|---|---|---|---|---|---|---|---|---|---|---|---|---|---|---|---|---|---|---|---|---|---|---|---|---|---|---|---|---|---|---|---|---|---|---|---|---|---|---|---|---|---|---|---|---|---|---|---|---|---|---|---|---|---|---|---|---|---|---|
| 1949 Jun 24 - 1949 Jul 30 | Evidence from Observations: Reported | ||||||||||||||||||||||||||||||||||||||||||||||||||||||||||||||||||||||||||
|
List of 13 Events for Episode 1 at San Juan, Llano del Banco, Hoyo Negro
|
|||||||||||||||||||||||||||||||||||||||||||||||||||||||||||||||||||||||||||
1712 Oct 9 - 1712 Dec 3 Confirmed Eruption (Explosive / Effusive) VEI: 2
| Episode 1 | Eruption (Explosive / Effusive) | El Charco | ||||||||||||||||||||||||||||||||||||||||||||||||||||||
|---|---|---|---|---|---|---|---|---|---|---|---|---|---|---|---|---|---|---|---|---|---|---|---|---|---|---|---|---|---|---|---|---|---|---|---|---|---|---|---|---|---|---|---|---|---|---|---|---|---|---|---|---|---|---|---|
| 1712 Oct 9 - 1712 Dec 3 | Evidence from Observations: Reported | ||||||||||||||||||||||||||||||||||||||||||||||||||||||
|
List of 9 Events for Episode 1 at El Charco
|
|||||||||||||||||||||||||||||||||||||||||||||||||||||||
1677 Nov 17 - 1678 Jan 21 Confirmed Eruption (Explosive / Effusive) VEI: 2
| Episode 1 | Eruption (Explosive / Effusive) | N & S flanks of San Antonio (Fuentecaliente) | ||||||||||||||||||||||||||||||||||||||||||||||||||||||
|---|---|---|---|---|---|---|---|---|---|---|---|---|---|---|---|---|---|---|---|---|---|---|---|---|---|---|---|---|---|---|---|---|---|---|---|---|---|---|---|---|---|---|---|---|---|---|---|---|---|---|---|---|---|---|---|
| 1677 Nov 17 - 1678 Jan 21 | Evidence from Observations: Reported | ||||||||||||||||||||||||||||||||||||||||||||||||||||||
|
List of 9 Events for Episode 1 at N & S flanks of San Antonio (Fuentecaliente)
|
|||||||||||||||||||||||||||||||||||||||||||||||||||||||
1646 Oct 2 - 1646 Dec 21 Confirmed Eruption (Explosive / Effusive) VEI: 2
| Episode 1 | Eruption (Explosive / Effusive) | South flank of San Martín (Tigalate) | ||||||||||||||||||||||||||||||||||||||||||||
|---|---|---|---|---|---|---|---|---|---|---|---|---|---|---|---|---|---|---|---|---|---|---|---|---|---|---|---|---|---|---|---|---|---|---|---|---|---|---|---|---|---|---|---|---|---|
| 1646 Oct 2 - 1646 Dec 21 | Evidence from Observations: Reported | ||||||||||||||||||||||||||||||||||||||||||||
| An eruption in 1646 produced the San Martín (Tigalate) cone and lava flows that reached the E coast. CAVW lists an 18 December stop date, but Mitchell-Thome (1982) and Afonso (1974) both list 21 December 1646 as the end of the eruption. The eruption did not take place from San Martín volcano itself, but a fissure on the S flank of San Martín (Carracedo et al., 2001). A second vent near the east coast produced a short lava flow that entered the sea. | |||||||||||||||||||||||||||||||||||||||||||||
|
List of 7 Events for Episode 1 at South flank of San Martín (Tigalate)
|
|||||||||||||||||||||||||||||||||||||||||||||
1585 May 19 - 1585 Aug 10 Confirmed Eruption (Explosive / Effusive) VEI: 2
| Episode 1 | Eruption (Explosive / Effusive) | Tahuya | ||||||||||||||||||||||||||||||||||||||||||||
|---|---|---|---|---|---|---|---|---|---|---|---|---|---|---|---|---|---|---|---|---|---|---|---|---|---|---|---|---|---|---|---|---|---|---|---|---|---|---|---|---|---|---|---|---|---|
| 1585 May 19 - 1585 Aug 10 | Evidence from Observations: Reported | ||||||||||||||||||||||||||||||||||||||||||||
| An eruption in 1585 produced lava flows that reached the W coast south of lava flows from the 1949 eruption. Neumann van Padang et al. (CAVW, 1967) and Mitchell-Thome (1976) lists dates of 15 April-10 August; Hernandez-Pachecho and Valls (1982) have 20 May to sometime in July. Romero (1991) cites historical evidence for a 19 May start time for an eruption that lasted until about 10 August. Other studies have shown the Tahuya eruption to be from the Roques de Jedey area on the upper W flank near the summit of Montana Nambroque, rather than at Montana Quemada (as stated in CAVW). | |||||||||||||||||||||||||||||||||||||||||||||
|
List of 7 Events for Episode 1 at Tahuya
|
|||||||||||||||||||||||||||||||||||||||||||||
1481 ± 11 years Confirmed Eruption (Explosive / Effusive) VEI: 2
| Episode 1 | Eruption (Explosive / Effusive) | Tacande (Montaña Quemada) | ||||||||||||||||||||||||||||||||||
|---|---|---|---|---|---|---|---|---|---|---|---|---|---|---|---|---|---|---|---|---|---|---|---|---|---|---|---|---|---|---|---|---|---|---|---|
| 1481 ± 11 years - Unknown | Evidence from Observations: Reported | ||||||||||||||||||||||||||||||||||
| The Tacande (Montaña Quemada) eruption produced a lava flow that nearly reached the W coast, and was considered by Hernandez-Pacheco and Valls (1982) to have occurred between 1470 and 1492 based on a Guanche tradition and a 14C date of 1530 ± 60 CE. This was originally thought to have occurred in 1585, so the lava and tephra volumes of Machado (1963) for the "1585" event thus apply to this eruption. Romero (1991) cited historical evidence that places the eruption between 1430 and 1440. Carracedo et al. (2001) support the 1470-1492 date. | |||||||||||||||||||||||||||||||||||
|
List of 5 Events for Episode 1 at Tacande (Montaña Quemada)
|
|||||||||||||||||||||||||||||||||||
0900 ± 100 years Confirmed Eruption (Explosive / Effusive)
| Episode 1 | Eruption (Explosive / Effusive) | Nambroque II-Malforada | |||||||||||||||||||
|---|---|---|---|---|---|---|---|---|---|---|---|---|---|---|---|---|---|---|---|---|
| 0900 ± 100 years - Unknown | Evidence from Isotopic: 14C (uncalibrated) | |||||||||||||||||||
| An eruption from Nambroque II-Malforada was 14C dated at 1,050 ± 95 yrs BP (Day et al., 1999). Carracedo et al. (2001) obtained a date of 1,045 ± 95 BP, and noted lava flows. A date of 1,090 ± 50 BP was obtained from bones in a burial site covered by spatter. The date pertains to the burial site bones covered by spatter from an eruption, which may have occurred from nearby Montaña Goteras (Carracedo et al., 2001). | ||||||||||||||||||||
|
List of 2 Events for Episode 1 at Nambroque II-Malforada
|
||||||||||||||||||||
0360 BCE ± 50 years Confirmed Eruption (Explosive / Effusive)
| Episode 1 | Eruption (Explosive / Effusive) | El Fraile | |||||||||||||||||||
|---|---|---|---|---|---|---|---|---|---|---|---|---|---|---|---|---|---|---|---|---|
| 0360 BCE ± 50 years - Unknown | Evidence from Isotopic: 14C (uncalibrated) | |||||||||||||||||||
| An eruption from El Fraile cone was 14C dated at 2,310 ± 50 yrs BP (Carracedo et al., 2001). | ||||||||||||||||||||
|
List of 2 Events for Episode 1 at El Fraile
|
||||||||||||||||||||
1320 BCE ± 100 years Confirmed Eruption (Explosive / Effusive)
| Episode 1 | Eruption (Explosive / Effusive) | La Fajana (Volcán Fuego) | ||||||||||||||
|---|---|---|---|---|---|---|---|---|---|---|---|---|---|---|---|
| 1320 BCE ± 100 years - Unknown | Evidence from Isotopic: 14C (uncalibrated) | ||||||||||||||
| A lava flow from Volcán Fuego on the southern side of La Palma was 14C dated at about 3,200 ± 100 yrs BP (Guillou et al., 1998). The same flow was dated by the unspiked K-Ar technique at 4,000 ± 2,000 yrs BP, and the underlying Las Indias lava flow at 3,000 ± 2,000 yrs BP. An eruption from Montaña del Fuego was 14C dated at 3,255 ± 140 and 3,350 ± 50 (Day et al., 1999). | |||||||||||||||
|
List of 1 Events for Episode 1 at La Fajana (Volcán Fuego)
|
|||||||||||||||
4050 BCE ± 3000 years Confirmed Eruption (Explosive / Effusive)
| Episode 1 | Eruption (Explosive / Effusive) | L'Amendrita, Birigoyo | |||||||||||||||||||
|---|---|---|---|---|---|---|---|---|---|---|---|---|---|---|---|---|---|---|---|---|
| 4050 BCE ± 3000 years - Unknown | Evidence from Isotopic: K/Ar | |||||||||||||||||||
| A lava flow from L'Almendrita was dated by Guillou et al. (1998) using the unspiked K-Ar technique at 6,000 ± 2,000 yrs BP (average of two dates). An eruption from Birigoyo was also K-Ar dated at 6,000 ± 3,000 yrs BP (Day et al., 1999). | ||||||||||||||||||||
|
List of 2 Events for Episode 1 at L'Amendrita, Birigoyo
|
||||||||||||||||||||
4900 BCE ± 50 years Confirmed Eruption (Explosive / Effusive)
| Episode 1 | Eruption (Explosive / Effusive) | |||||||||||||||
|---|---|---|---|---|---|---|---|---|---|---|---|---|---|---|---|
| 4900 BCE ± 50 years - Unknown | Evidence from Isotopic: 14C (uncalibrated) | ||||||||||||||
| Charcoal from deposits in the Barranca Los Llanos del Agua was radiocarbon dated at 6,850 ± 60 yrs BP by Carracedo et al. (2001); the deposit type is not stated, but a 7,990 BP sample in the same barranca was in phreatomagmatic ash. | |||||||||||||||
|
List of 1 Events for Episode 1
|
|||||||||||||||
6050 BCE ± 1500 years Confirmed Eruption (Explosive / Effusive)
| Episode 1 | Eruption (Explosive / Effusive) | |||||||||||||||||||||||||||||||||||
|---|---|---|---|---|---|---|---|---|---|---|---|---|---|---|---|---|---|---|---|---|---|---|---|---|---|---|---|---|---|---|---|---|---|---|---|
| 6050 BCE ± 1500 years - Unknown | Evidence from Isotopic: K/Ar | ||||||||||||||||||||||||||||||||||
| Lava flows along the eastern and western coasts were dated by Guillou et al. (1998) using the unspiked K-Ar technique at 8,000 ± 1,000 and 8,000 ± 2,000 yrs BP, respectively. A 14C date of 7,990 ± 80 yrs BP was obtained from phreatomagmatic ash in the Barranco Llanos del Agua (Carracedo et al., 2001). | |||||||||||||||||||||||||||||||||||
|
List of 5 Events for Episode 1
|
|||||||||||||||||||||||||||||||||||
This compilation of synonyms and subsidiary features may not be comprehensive. Features are organized into four major categories: Cones, Craters, Domes, and Thermal Features. Synonyms of features appear indented below the primary name. In some cases additional feature type, elevation, or location details are provided.
Synonyms |
||||
| Nambroque, Pico del | ||||
Cones |
||||
| Feature Name | Feature Type | Elevation | Latitude | Longitude |
| Bejenado | Stratovolcano | 1854 m | 28° 41' 0.00" N | 17° 52' 0.00" W |
| Charco, El | Pyroclastic cone | 1862 m | 28° 33' 0.00" N | 17° 50' 0.00" W |
| Cumbre Vieja | Stratovolcano | 1949 m | 28° 34' 0.00" N | 17° 50' 0.00" W |
| Garafía | Shield volcano | |||
| San Antonio
Fuencalietne Cabras, Montana de las |
Pyroclastic cone | 657 m | 28° 29' 0.00" N | 17° 51' 0.00" W |
| San Martín
Tigalate Martin |
Pyroclastic cone | 1598 m | 28° 32' 0.00" N | 17° 50' 0.00" W |
| Taburiente, Caldera de | Stratovolcano | 2426 m | 28° 45' 0.00" N | 17° 52' 0.00" W |
| Tacande
Llanos, Los Quemada, Montana |
Pyroclastic cone | 1368 m | 28° 37' 0.00" N | 17° 50' 0.00" W |
| Tahuya
Tihuya |
Pyroclastic cone | 1871 m | 28° 35' 0.00" N | 17° 50' 0.00" W |
| Teneguia | Pyroclastic cone | 439 m | 28° 28' 0.00" N | 17° 51' 0.00" W |
Craters |
||||
| Feature Name | Feature Type | Elevation | Latitude | Longitude |
| Hoyo Negro | Crater | 1871 m | 28° 35' 0.00" N | 17° 50' 0.00" W |
| Llano Del Banco
Manchas, Las |
Fissure vent | 1293 m | 28° 36' 0.00" N | 17° 49' 34.00" W |
| San Juan
Nambroque Duraznero |
Fissure vent | 1913 m | 28° 34' 0.00" N | 17° 50' 0.00" W |
 The steep-walled Caldera de Taburiente is the most prominent feature of La Palma island. The caldera extends 10 km in a NE-SW direction and is breached to the sea on the SW side through a narrow notch at the left. Historical eruptions on La Palma have been restricted to a series of fissures and cones along a N-S-trending dorsal ridge extending to the southern tip of the island.
 Cumbre Vieja, the southernmost of two large volcanoes forming the wedge-shaped island of La Palma, is one of the most active in the Canaries. The elongated volcano is oriented N-S and has been the site of numerous historical eruptions, many of which produced lava flows that descended steeply to the sea. Abundant cinder cones and craters line the crest of the volcano and dots its flanks. Historical eruptions, recorded since the 15th century, have produced mild explosive activity and lava flows that damaged populated areas.
  The dorsal spine of La Palma island is sprinkled with cinder cones, craters, and fissure vents formed during historical eruptions dating back to the 16th century. Many of these produced lava flows that reached the sea. The entire southern tip of the island was covered by lava flows during eruptions from the San Antonio (Fuencaliente) vent in 1678 and Teneguía cinder cone in 1971.
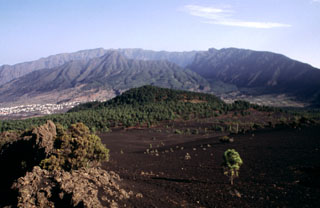 The caldera rim of the Taburiente volcano, which makes up the northern section of the island of La Palma, is seen here from a lava flow field on the southern volcano, Cumbre Vieja. Bejenado volcano (left center) is located on the southern edge of the breached Taburiente caldera. Cumbre Nueva Ridge (right) was formed by a large-scale collapse. Cumbre Vieja is the most recently active volcanic center on the island, with numerous cones and lava flows.
There are no samples for La Palma in the Smithsonian's NMNH Department of Mineral Sciences Rock and Ore collection.
| Copernicus Browser | The Copernicus Browser replaced the Sentinel Hub Playground browser in 2023, to provide access to Earth observation archives from the Copernicus Data Space Ecosystem, the main distribution platform for data from the EU Copernicus missions. |
| MIROVA | Middle InfraRed Observation of Volcanic Activity (MIROVA) is a near real time volcanic hot-spot detection system based on the analysis of MODIS (Moderate Resolution Imaging Spectroradiometer) data. In particular, MIROVA uses the Middle InfraRed Radiation (MIR), measured over target volcanoes, in order to detect, locate and measure the heat radiation sourced from volcanic activity. |
| MODVOLC Thermal Alerts | Using infrared satellite Moderate Resolution Imaging Spectroradiometer (MODIS) data, scientists at the Hawai'i Institute of Geophysics and Planetology, University of Hawai'i, developed an automated system called MODVOLC to map thermal hot-spots in near real time. For each MODIS image, the algorithm automatically scans each 1 km pixel within it to check for high-temperature hot-spots. When one is found the date, time, location, and intensity are recorded. MODIS looks at every square km of the Earth every 48 hours, once during the day and once during the night, and the presence of two MODIS sensors in space allows at least four hot-spot observations every two days. Each day updated global maps are compiled to display the locations of all hot spots detected in the previous 24 hours. There is a drop-down list with volcano names which allow users to 'zoom-in' and examine the distribution of hot-spots at a variety of spatial scales. |
|
WOVOdat
Single Volcano View Temporal Evolution of Unrest Side by Side Volcanoes |
WOVOdat is a database of volcanic unrest; instrumentally and visually recorded changes in seismicity, ground deformation, gas emission, and other parameters from their normal baselines. It is sponsored by the World Organization of Volcano Observatories (WOVO) and presently hosted at the Earth Observatory of Singapore.
GVMID Data on Volcano Monitoring Infrastructure The Global Volcano Monitoring Infrastructure Database GVMID, is aimed at documenting and improving capabilities of volcano monitoring from the ground and space. GVMID should provide a snapshot and baseline view of the techniques and instrumentation that are in place at various volcanoes, which can be use by volcano observatories as reference to setup new monitoring system or improving networks at a specific volcano. These data will allow identification of what monitoring gaps exist, which can be then targeted by remote sensing infrastructure and future instrument deployments. |
| Volcanic Hazard Maps | The IAVCEI Commission on Volcanic Hazards and Risk has a Volcanic Hazard Maps database designed to serve as a resource for hazard mappers (or other interested parties) to explore how common issues in hazard map development have been addressed at different volcanoes, in different countries, for different hazards, and for different intended audiences. In addition to the comprehensive, searchable Volcanic Hazard Maps Database, this website contains information about diversity of volcanic hazard maps, illustrated using examples from the database. This site is for educational purposes related to volcanic hazard maps. Hazard maps found on this website should not be used for emergency purposes. For the most recent, official hazard map for a particular volcano, please seek out the proper institutional authorities on the matter. |
| IRIS seismic stations/networks | Incorporated Research Institutions for Seismology (IRIS) Data Services map showing the location of seismic stations from all available networks (permanent or temporary) within a radius of 0.18° (about 20 km at mid-latitudes) from the given location of La Palma. Users can customize a variety of filters and options in the left panel. Note that if there are no stations are known the map will default to show the entire world with a "No data matched request" error notice. |
| UNAVCO GPS/GNSS stations | Geodetic Data Services map from UNAVCO showing the location of GPS/GNSS stations from all available networks (permanent or temporary) within a radius of 20 km from the given location of La Palma. Users can customize the data search based on station or network names, location, and time window. Requires Adobe Flash Player. |
| DECADE Data | The DECADE portal, still in the developmental stage, serves as an example of the proposed interoperability between The Smithsonian Institution's Global Volcanism Program, the Mapping Gas Emissions (MaGa) Database, and the EarthChem Geochemical Portal. The Deep Earth Carbon Degassing (DECADE) initiative seeks to use new and established technologies to determine accurate global fluxes of volcanic CO2 to the atmosphere, but installing CO2 monitoring networks on 20 of the world's 150 most actively degassing volcanoes. The group uses related laboratory-based studies (direct gas sampling and analysis, melt inclusions) to provide new data for direct degassing of deep earth carbon to the atmosphere. |
| Large Eruptions of La Palma | Information about large Quaternary eruptions (VEI >= 4) is cataloged in the Large Magnitude Explosive Volcanic Eruptions (LaMEVE) database of the Volcano Global Risk Identification and Analysis Project (VOGRIPA). |
| EarthChem | EarthChem develops and maintains databases, software, and services that support the preservation, discovery, access and analysis of geochemical data, and facilitate their integration with the broad array of other available earth science parameters. EarthChem is operated by a joint team of disciplinary scientists, data scientists, data managers and information technology developers who are part of the NSF-funded data facility Integrated Earth Data Applications (IEDA). IEDA is a collaborative effort of EarthChem and the Marine Geoscience Data System (MGDS). |

