Recently Published Bulletin Reports
Agung (Indonesia) Three eruptive events reported in April, May, and December 2022
Tengger Caldera (Indonesia) Minor ash emission in December 2023; persistent weak thermal anomaly in the Bromo crater
Saunders (United Kingdom) Persistent thermal anomalies from the summit crater lava lake during February 2023-January 2024
Shishaldin (United States) New eruption with significant Strombolian explosions, ash plumes, and ashfall
Ioto (Japan) New eruption with discolored water, ejecta, and floating pumice during October-December 2023
Purace (Colombia) Gas-and-ash emission on 16 November 2023
Etna (Italy) Strombolian explosions, lava fountains, and lava flows during July-August 2023
Suwanosejima (Japan) Eruption plumes, crater incandescence, and occasional explosions during July-October 2023
Aira (Japan) Explosions, ash plumes, ash fall, and crater incandescence during July-October 2023
Nishinoshima (Japan) Gray emissions during October 2023
Kilauea (United States) Strong lava fountains, lava flows, and spatter at Halema’uma’u during January-September 2023
Tinakula (Solomon Islands) Continued lava flows and thermal activity during June through November 2023
Agung (Indonesia) — January 2024  Cite this Report
Agung
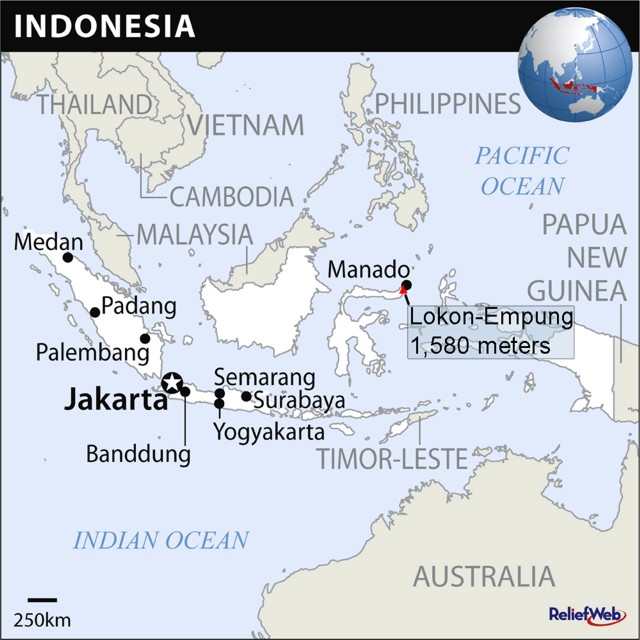
Indonesia
8.343°S, 115.508°E; summit elev. 2997 m
All times are local (unless otherwise noted)
Three eruptive events reported in April, May, and December 2022
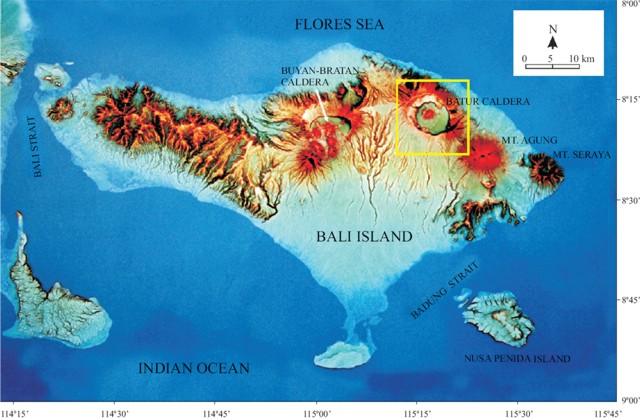
Mount Agung, located on the E end of the island of Bali, Indonesia, rises above the SE rim of the Batur caldera. The summit area extends 1.5 km E-W, with the highest point on the W and a steep-walled 800-m-wide crater on the E. Recorded eruptions date back to the early 19th century. A large and deadly explosive and effusive eruption occurred during 1963-64, which was characterized by voluminous ashfall, pyroclastic flows, and lahars that caused extensive damage and many fatalities. More recent activity was documented during November 2017-June 2019 that consisted of multiple explosions, significant ash plumes, lava flows at the summit crater, and incandescent ejecta. This report covers activity reported during April-May 2022 and December 2022 based on data from the Darwin Volcanic Ash Advisory Center (VAAC).
Activity during 2022 was relatively low and mainly consisted of a few ash plumes during April-May and December. An ash plume on 3 April rising to 3.7 km altitude (700 m above the summit) and drifting N was reported in a Darwin VAAC notice based on a ground report, with ash seen in HIMAWARI-8 visible imagery. Another ash plume was reported at 1120 on 27 May that rose to 5.5 km altitude (2.5 m above the summit); the plume was not visible in satellite or webcam images due to weather clouds. An eruption was reported based on seismic data at 0840 on 13 December, with an estimated plume altitude of 3.7 km; however, no ash was seen using satellite imagery in clear conditions before weather clouds obscured the summit.
Geologic Background. Symmetrical Agung stratovolcano, Bali's highest and most sacred mountain, towers over the eastern end of the island. The volcano, whose name means "Paramount," rises above the SE rim of the Batur caldera, and the northern and southern flanks extend to the coast. The summit area extends 1.5 km E-W, with the high point on the W and a steep-walled 800-m-wide crater on the E. The Pawon cone is located low on the SE flank. Only a few eruptions dating back to the early 19th century have been recorded in historical time. The 1963-64 eruption, one of the largest in the 20th century, produced voluminous ashfall along with devastating pyroclastic flows and lahars that caused extensive damage and many fatalities.
Information Contacts: Darwin Volcanic Ash Advisory Centre (VAAC), Bureau of Meteorology, Northern Territory Regional Office, PO Box 40050, Casuarina, NT 0811, Australia (URL: http://www.bom.gov.au/info/vaac/).
Tengger Caldera (Indonesia) — February 2024 Cite this Report
Tengger Caldera
Indonesia
7.942°S, 112.95°E; summit elev. 2329 m
All times are local (unless otherwise noted)
Minor ash emission in December 2023; persistent weak thermal anomaly in the Bromo crater
Tengger Caldera, located at the N end of a volcanic massif in Indonesia’s East Java, consists of five overlapping stratovolcanoes. The youngest and only active cone in the 16-km-wide caldera is Bromo, which typically produces gas-and-steam plumes, occasional ash plumes and explosions, and weak thermal signals (BGVN 44:05, 47:01). This report covers activity during January 2022-December 2023, consisting of mostly white gas-and-steam emissions and persistent weak thermal anomalies. Information was provided by the Pusat Vulkanologi dan Mitigasi Bencana Geologi (PVMBG, also known as Indonesian Center for Volcanology and Geological Hazard Mitigation, CVGHM) and satellite imagery. The Alert Level remained at 2 (on a scale of 1-4), and visitors were warned to stay at least 1 km from the crater.
Activity was generally low during the reporting period, similar to that in 2021. According to almost daily images from MAGMA Indonesia (a platform developed by PVMBG), white emissions and plumes rose from 50 to 900 m above the main crater during this period (figure 24). During several days in March and June 2022, white plumes reached heights of 1-1.2 km above the crater.
After an increase in activity at 2114 on 3 February 2023, a PVMBG team that was sent to observe white emissions rising as high as 300 m during 9-12 February and heard rumbling noises. A sulfur dioxide odor was also strong near the crater and measurements indicated that levels were above the healthy (non-hazardous) threshold of 5 parts per million; differential optical absorption spectroscopy (DOAS) measurements indicated an average flux of 190 metric tons per day on 11 February. Incandescence originating from a large fumarole in the NNW part of the crater was visible at night. The team observed that vegetation on the E caldera wall was yellow and withered. The seismic network recorded continuous tremor and deep and shallow volcanic earthquakes.
According to a PVMBG press release, activity increased on 13 December 2023 with white, gray, and brown emissions rising as high as 900 m above Bromo’s crater rim and drifting in multiple directions (figure 25). The report noted that tremor was continuous and was accompanied in December by three volcanic earthquakes. Deformation data indicated inflation in December. There was no observable difference in the persistent thermal anomaly in the crater between 11 and 16 December 2023.
All clear views of the Bromo crater throughout this time, using Sentinel-2 infrared satellite images, showed a weak persistent thermal anomaly; none of the anomalies were strong enough to cause MODVOLC Thermal Alerts. A fire in the SE part of the caldera in early September 2023 resulted in a brief period of strong thermal anomalies.
Geologic Background. The 16-km-wide Tengger caldera is located at the northern end of a volcanic massif extending from Semeru volcano. The massive volcanic complex dates back to about 820,000 years ago and consists of five overlapping stratovolcanoes, each truncated by a caldera. Lava domes, pyroclastic cones, and a maar occupy the flanks of the massif. The Ngadisari caldera at the NE end of the complex formed about 150,000 years ago and is now drained through the Sapikerep valley. The most recent of the calderas is the 9 x 10 km wide Sandsea caldera at the SW end of the complex, which formed incrementally during the late Pleistocene and early Holocene. An overlapping cluster of post-caldera cones was constructed on the floor of the Sandsea caldera within the past several thousand years. The youngest of these is Bromo, one of Java's most active and most frequently visited volcanoes.
Information Contacts: Pusat Vulkanologi dan Mitigasi Bencana Geologi (PVMBG, also known as Indonesian Center for Volcanology and Geological Hazard Mitigation, CVGHM), Jalan Diponegoro 57, Bandung 40122, Indonesia (URL: http://www.vsi.esdm.go.id/); MAGMA Indonesia, Kementerian Energi dan Sumber Daya Mineral (URL: https://magma.esdm.go.id/v1); Copernicus Browser, Copernicus Data Space Ecosystem, European Space Agency (URL: https://dataspace.copernicus.eu/browser/); Hawai'i Institute of Geophysics and Planetology (HIGP) - MODVOLC Thermal Alerts System, School of Ocean and Earth Science and Technology (SOEST), Univ. of Hawai'i, 2525 Correa Road, Honolulu, HI 96822, USA (URL: http://modis.higp.hawaii.edu/).
Saunders (United Kingdom) — February 2024 Cite this Report
Saunders
United Kingdom
57.8°S, 26.483°W; summit elev. 843 m
All times are local (unless otherwise noted)
Persistent thermal anomalies from the summit crater lava lake during February 2023-January 2024
Saunders is one of eleven islands that comprise the South Sandwich Islands in the South Atlantic. The active Mount Michael volcano has been in almost continuous eruption since November 2014 (BGVN 48:02). Recent activity has resulted in intermittent thermal anomalies and gas-and-steam emissions (BGVN 47:03, 48:02). Visits are infrequent due to its remote location, and cloud cover often prevents satellite observations. Satellite thermal imagery and visual observation of incandescence during a research expedition in 2019 (BGVN 28:02 and 44:08) and a finding confirmed by a National Geographic Society research team that summited Michael in November 2022 reported the presence of a lava lake.
Although nearly constant cloud cover during February 2023 through January 2024 greatly limited satellite observations, thermal anomalies from the lava lake in the summit crater were detected on clear days, especially around 20-23 August 2023. Anomalies similar to previous years (eg. BGVN 48:02) were seen in both MIROVA (Middle InfraRed Observation of Volcanic Activity) data from MODIS instruments and in Sentinel 2 infrared imagery. The only notable sulfur dioxide plume detected near Saunders was on 25 September 2023, with the TROPOMI instrument aboard the Sentinel-5P satellite.
Geologic Background. Saunders Island consists of a large central volcanic edifice intersected by two seamount chains, as shown by bathymetric mapping (Leat et al., 2013). The young Mount Michael stratovolcano dominates the glacier-covered island, while two submarine plateaus, Harpers Bank and Saunders Bank, extend north. The symmetrical Michael has a 500-m-wide summit crater and a remnant of a somma rim to the SE. Tephra layers visible in ice cliffs surrounding the island are evidence of recent eruptions. Ash clouds were reported from the summit crater in 1819, and an effusive eruption was inferred to have occurred from a N-flank fissure around the end of the 19th century and beginning of the 20th century. A low ice-free lava platform, Blackstone Plain, is located on the north coast, surrounding a group of former sea stacks. A cluster of cones on the SE flank, the Ashen Hills, appear to have been modified since 1820 (LeMasurier and Thomson, 1990). Analysis of satellite imagery available since 1989 (Gray et al., 2019; MODVOLC) suggests frequent eruptive activity (when weather conditions allow), volcanic clouds, steam plumes, and thermal anomalies indicative of a persistent, or at least frequently active, lava lake in the summit crater. Due to this observational bias, there has been a presumption when defining eruptive periods that activity has been ongoing unless there is no evidence for at least 10 months.
Information Contacts: MIROVA (Middle InfraRed Observation of Volcanic Activity), a collaborative project between the Universities of Turin and Florence (Italy) supported by the Centre for Volcanic Risk of the Italian Civil Protection Department (URL: http://www.mirovaweb.it/); NASA Global Sulfur Dioxide Monitoring Page, Atmospheric Chemistry and Dynamics Laboratory, NASA Goddard Space Flight Center (NASA/GSFC), 8800 Greenbelt Road, Goddard MD 20771, USA (URL: https://so2.gsfc.nasa.gov/); Copernicus Browser (URL: https://dataspace.copernicus.eu/browser).
Shishaldin (United States) — December 2023 Cite this Report
Shishaldin
United States
54.756°N, 163.97°W; summit elev. 2857 m
All times are local (unless otherwise noted)
New eruption with significant Strombolian explosions, ash plumes, and ashfall
Shishaldin is located on the eastern half of Unimak Island, one of the Aleutian Islands. Frequent explosive activity, primarily consisting of Strombolian ash eruptions from the small summit crater, but sometimes producing lava flows, has been recorded since the 18th century. The previous eruption ended in May 2020 and was characterized by intermittent thermal activity, increased seismicity and surface temperatures, ash plumes, and ash deposits (BGVN 45:06). This report covers a new eruption during July through November 2023, which consisted of significant explosions, ash plumes, ashfall, and lava fountaining. Information comes from daily, weekly, and special reports from the Alaska Volcano Observatory (AVO) and various satellite data. AVO monitors the volcano using local seismic and infrasound sensors, satellite data, web cameras, and remote infrasound and lightning networks.
AVO reported that intermittent tremor and low-frequency earthquakes had gradually become more regular and consistent during 10-13 July. Strongly elevated surface temperatures at the summit were identified in satellite images during 10-13 July. On 11 July AVO raised the Aviation Color Code (ACC) to Yellow (the second color on a four-color scale) and Volcano Alert Level (VAL) to Advisory (the second level on a four-level scale) at 1439. Later in the day on 11 July summit crater incandescence was observed in webcam images. Observations of the summit suggested that lava was likely present at the crater, which prompted AVO to raise the ACC to Orange (the second highest color on a four-color scale) and the VAL to Watch (the second highest level on a four-level scale). The US Coast Guard conducted an overflight on 12 July and confirmed that lava was erupting from the summit. That same day, sulfur dioxide emissions were detected in satellite images.
A significant explosion began at 0109 on 14 July that produced an ash plume that rose to 9-12 km altitude and drifted S over the Pacific Ocean (figure 43). Webcam images and photos taken around 0700 from a ship SW off Unimak Island showed small lahar deposits, which were the result of the interaction of hot pyroclastic material and snow and ice on the flanks. There was also ashfall on the SW and N flanks. A smaller explosion at 0710 generated an ash plume that rose to 4.5 km altitude. Webcam images and pilot reports showed continued low-level ash emissions during the morning, rising to less than 4.6 km altitude; those emissions included a small ash plume near the summit around 1030 resulting from a small explosion.
Seismic tremor amplitude began increasing at around 1700 on 15 July; strongly elevated surface temperatures were also reported. An ash plume rose to 4.6 km altitude and drifted SSE at 2100, based on a satellite image. A continuous ash plume during 2150 through 2330 rose to 5 km altitude and extended 125 km S. At 2357 AVO raised the ACC to Red (the highest color on a four-color scale) and the VAL to Warning (the highest level on a four-level scale), noting that seismicity remained elevated for more than six hours and explosion signals were frequently detected by regional infrasound (pressure sensor) networks. Explosions generated an ash plume that rose to 4.9 km altitude and drifted as far as 500 km SE. Activity throughout the night declined and by 0735 the ACC was lowered to Orange and the VAL to Watch. High-resolution satellite images taken on 16 July showed pyroclastic deposits extending as far as 3 km from the vent; these deposits generated lahars that extended further down the drainages on the flanks. Ash deposits were mainly observed on the SSE flank and extended to the shore of Unimak Island. During 16-17 July lava continued to erupt at the summit, which caused strongly elevated surface temperatures that were visible in satellite imagery.
Lava effusion increased at 0100 on 18 July, as noted in elevated surface temperatures identified in satellite data, increasing seismic tremor, and activity detected on regional infrasound arrays. A significant ash plume at 0700 rose to 7 km altitude and continued until 0830, eventually reaching 9.1 km altitude and drifting SSE (figure 44). As a result, the ACC was raised to Red and the VAL to Warning. By 0930 the main plume detached, but residual low-level ash emissions continued for several hours, remaining below 3 km altitude and drifting S. The eruption gradually declined and by 1208 the ACC was lowered to Orange and the VAL was lowered to Watch. High-resolution satellite images showed ash deposits on the SW flank and pyroclastic deposits on the N, E, and S flanks, extending as far as 3 km from the vent; lahars triggered by the eruption extended farther down the flanks (figure 45). Lava continued to erupt from the summit crater on 19 July.
Elevated surface temperatures were detected in satellite images during 19-25 July, despite occasional weather cloud cover, which was consistent with increased lava effusion. During 22-23 July satellite observations acquired after the eruption from 18 July showed pyroclastic flow and lahar deposits extending as far as 3 km down the N, NW, and NE flanks and as far as 1.5 km down the S and SE flanks. Ash deposits covered the SW and NE flanks. No lava flows were observed outside the crater. On 22 July a sulfur dioxide plume was detected in satellite data midday that had an estimated mass of 10 kt. In a special notice issued at 1653 on 22 July AVO noted that eruptive activity had intensified over the previous six hours, which was characterized by an hours-long steady increase in seismic tremor, intermittent infrasound signals consistent with small explosions, and an increase in surface temperatures that were visible in satellite data. Pilots first reported low-level ash plumes at around 1900. At 2320 an ash plume had risen to 9 km altitude based on additional pilot reports and satellite images. The ACC was increased to Red and the VAL to Warning at 2343. Satellite images indicated growth of a significantly higher ash plume that rose to 11 km altitude continued until 0030 and drifted NE. During the early morning hours of 23 July ash plumes had declined to 4.6 k altitude. Seismic tremor peaked at 0030 on 23 July and began to rapidly decline at 0109; active ash emissions were no longer visible in satellite data by 0130. The ACC was lowered to Orange and the VAL to Watch at 0418; bursts of increased seismicity were recorded throughout the morning, but seismicity generally remained at low levels. Elevated surface temperatures were visible in satellite data until about 0600. On 24 July pilots reported seeing vigorous gas-and-steam plumes rising to about 3 km altitude; the plumes may have contained minor amounts of ash.
During 24-25 July low level seismicity and volcanic tremor were detected at low levels following the previous explosion on 23 July. Strongly elevated surface temperatures were observed at the summit crater in satellite data. Around 2200 on 25 July seismicity began to increase, followed by infrasound signals of explosions after 0200 on 26 July. An ash plume rose to 3 km altitude at 0500 and drifted ENE, along with an associated sulfur dioxide plume that drifted NE and had an estimated mass of 22 kt. Diffuse ash emissions were visible in satellite data and rose to 6.1-7.6 km altitude and extended 125 km from the volcano starting around 1130. These ash events were preceded by about seven hours of seismic tremor, infrasound detections of explosions, and five hours of increased surface temperatures visible in satellite data. Activity began to decline around 1327, which included low-frequency earthquakes and decreased volcanic tremor, and infrasound data no longer detected significant explosions. Surface temperatures remained elevated through the end of the month.
Seismicity, volcanic tremor, and ash emissions remained at low levels during early August. Satellite images on 1 August showed that some slumping had occurred on the E crater wall due to the recent explosive activity. Elevated surface temperatures continued, which was consistent with cooling lava. On 2 August small explosive events were detected, consistent with low-level Strombolian activity. Some episodes of volcanic tremor were reported, which reflected low-level ash emissions. Those ash emissions rose to less than 3 km altitude and drifted as far as 92.6 km N. Pilots that were located N of the volcano observed an ash plume that rose to 2.7 km altitude. Seismicity began to increase in intensity around 0900 on 3 August. Seismicity continued to increase throughout the day and through the night with strongly elevated surface temperatures, which suggested that lava was active at the surface.
An ash cloud that rose to 7.6-7.9 km altitude and drifted 60-75 km NE was visible in a satellite image at 0520 on 4 August. Pilots saw and reported the plume at 0836 (figure 46). By 0900 the plume had risen to 9.1 km altitude and extended over 100 km NE. AVO raised the ACC to Red and the VAL to Warning as a result. Seismic tremor levels peaked at 1400 and then sharply declined at 1500 to slightly elevated levels; the plume was sustained during the period of high tremor and drifted N and NE. The ACC was lowered to Orange and the VAL to Watch at 2055. During 5-14 August seismicity remained low and surface temperatures were elevated based on satellite data due to cooling lava. On 9 August a small lava flow was observed that extended from the crater rim to the upper NE flank. It had advanced to 55 m in length and appeared in satellite imagery on 11 August. Occasional gas-and-steam plumes were noted in webcam images. At 1827 AVO noted that seismic tremor had steadily increased during the afternoon and erupting lava was visible at the summit in satellite images.
Strong explosion signals were detected at 0200 on 15 August. An ash cloud that was visible in satellite data extended 100 km NE and may have risen as high as 11 km altitude around 0240. By 0335 satellite images showed the ash cloud rising to 7.6 km altitude and drifting NE. Significant seismicity and explosions were detected by the local AVO seismic and infrasound networks, and volcanic lightning was detected by the World Wide Lightning Location Network (WWLLN). A sulfur dioxide plume associated with the eruption drifted over the S Bering Sea and parts of Alaska and western Canada. Seismicity was significantly elevated during the eruption but had declined by 1322. A pilot reported that ash emissions continued, rising as high as 4.9 km altitude. Elevated surface temperatures detected in satellite data were caused by hot, eruptive material (pyroclastic debris and lava) that accumulated around the summit. Eruptive activity declined by 16 August and the associated sulfur dioxide plume had mostly dissipated; remnants continued to be identified in satellite images at least through 18 August. Surface temperatures remained elevated based on satellite images, indicating hot material on the upper parts of the volcano. Small explosions were detected in infrasound data on the morning of 19 August and were consistent with pilot reports of small, short-lived ash plumes that rose to about 4.3 km altitude. Low-level explosive activity was reported during 20-24 August, according to seismic and infrasound data, and weather clouds sometimes prevented views. Elevated surface temperatures were observed in satellite images, which indicated continued hot material on the upper parts of the volcano.
Seismic tremor began to increase at around 0300 on 25 August and was followed by elevated surface temperatures identified in satellite images, consistent with erupting lava. Small explosions were recorded in infrasound data. The ACC was raised to Red and the VAL to Warning at 1204 after a pilot reported an ash plume that rose to 9.1 km altitude. Seismicity peaked at 1630 and began to rapidly decline at around 1730. Ash plumes rose as high as 10 km altitude and drifted as far as 400 km NE. By 2020 the ash plumes had declined to 6.4 km altitude and continued to drift NE. Ash emissions were visible in satellite data until 0000 on 26 August and seismicity was at low levels. AVO lowered the ACC to Orange and the VAL to Watch at 0030. Minor explosive activity within the summit crater was detected during 26-28 August and strongly elevated surface temperatures were still visible in satellite imagery through the rest of the month. An AVO field crew working on Unimak Island observed a mass flow that descended the upper flanks beginning around 1720 on 27 August. The flow produced a short-lived ash cloud that rose to 4.5 km altitude and rapidly dissipated. The mass flow was likely caused by the collapse of spatter that accumulated on the summit crater rim.
Similar variable explosive activity was reported in September, although weather observations sometimes prevented observations. A moderate resolution satellite image from the afternoon of 1 September showed gas-and-steam emissions filling the summit crater and obscuring views of the vent. In addition, hot deposits from the previous 25-26 August explosive event were visible on the NE flank near the summit, based on a 1 September satellite image. On 2 and 4 September seismic and infrasound data showed signals of small, repetitive explosions. Variable gas-and-steam emissions from the summit were visible but there was no evidence of ash. Possible summit crater incandescence was visible in nighttime webcam images during 3-4 September.
Seismicity began to gradually increase at around 0300 on 5 September and activity escalated at around 0830. A pilot reported an ash plume that rose to 7.6 km altitude at 0842 and continued to rise as high as possibly 9.7 km altitude and drifted SSE based on satellite images (figure 47). The ACC was raised to Red and the VAL to Warning at 0900. In addition to strong tremor and sustained explosions, the eruption produced volcanic lightning that was detected by the WWLLN. Around 1100 seismicity decreased and satellite data confirmed that the altitude of the ash emissions had declined to 7.6 km altitude. By 1200 the lower-altitude portion of the ash plume had drifted 125 km E. Significant ash emissions ended by 1330 based on webcam images. The ACC was lowered to Orange and the VAL to Watch at 1440. Satellite images showed extensive pyroclastic debris flows on most of the flanks that extended 1.2-3.3 km from the crater rim.
During 6-13 September elevated surface temperatures continued to be observed in satellite data, seismicity remained elevated with weak but steady tremor, and small, low-frequency earthquakes and small explosions were reported, except on 12 September. On 6 September a low-level ash plume rose to 1.5-1.8 km altitude and drifted SSE. Occasional small and diffuse gas-and-steam emissions at the summit were visible in webcam images. Around 1800 on 13 September seismic tremor amplitudes began to increase, and small explosions were detected in seismic and infrasound data. Incandescent lava at the summit was seen in a webcam image taken at 0134 on 14 September during a period of elevated tremor. No ash emissions were reported during the period of elevated seismicity. Lava fountaining began around 0200, based on webcam images. Satellite-based radar observations showed that the lava fountaining activity led to the growth of a cone in the summit crater, which refilled most of the crater. By 0730 seismicity significantly declined and remained at low levels.
Seismic tremor began to increase around 0900 on 15 September and rapidly intensified. An explosive eruption began at around 1710, which prompted AVO to raise the ACC to Red and the VAL to Warning. Within about 30 minutes ash plumes drifted E below a weather cloud at 8.2 km altitude. The National Weather Service estimated that an ash-rich plume rose as high as 12.8 km altitude and produced volcanic lightning. The upper part of the ash plume detached from the vent around 1830 and drifted E, and was observed over the Gulf of Alaska. Around the same time, seismicity dramatically decreased. Trace ashfall was reported in the community of False Pass (38 km ENE) between 1800-2030 and also in King Cove and nearby marine waters. Activity declined at around 1830 although seismicity remained elevated, ash emissions, and ashfall continued until 2100. Lightning was again detected beginning around 1930, which suggested that ash emissions continued. Ongoing explosions were detected in infrasound data, at a lower level than during the most energetic phase of this event. Lightning was last detected at 2048. By 2124 the intensity of the eruption had decreased, and ash emissions were likely rising to less than 6.7 km altitude. Seismicity returned to pre-eruption levels. On 16 September the ACC was lowered to Orange and the VAL to Watch at 1244; the sulfur dioxide plume that was emitted from the previous eruption event was still visible over the northern Pacific Ocean. Elevated surface temperatures, gas-and-steam emissions from the vent, and new, small lahars were reported on the upper flanks based on satellite and webcam images. Minor deposits were reported on the flanks which were likely the result of collapse of previously accumulated lava near the summit crater.
Elevated seismicity with tremor, small earthquakes, and elevated surface temperatures were detected during 17-23 September. Minor gas-and-steam emissions were visible in webcam images. On 20 September small volcanic debris flows were reported on the upper flanks. On 21 September a small ash deposit was observed on the upper flanks extending to the NE based on webcam images. Seismic tremor increased significantly during 22-23 September. Regional infrasound sensors suggested that low-level eruptive activity was occurring within the summit crater by around 1800 on 23 September. Even though seismicity was at high levels, strongly elevated surface temperatures indicating lava at the surface were absent and no ash emissions were detected; weather clouds at 0.6-4.6 km altitude obscured views. At 0025 on 24 September AVO noted that seismicity continued at high levels and nearly continuous small infrasound signals began, likely from low-level eruptive activity. Strongly elevated surface temperatures were identified in satellite images by 0900 and persisted throughout the day; the higher temperatures along with infrasound and seismic data were consistent with lava erupting at the summit. Around 1700 similarly elevated surface temperatures were detected from the summit in satellite data, which suggested that more vigorous lava fountaining had started. Starting around 1800 low-level ash emissions rose to altitudes less than 4.6 km altitude and quickly dissipated.
Beginning at midnight on 25 September, a series of seismic signals consistent with volcanic flows were recorded on the N side of the volcano. A change in seismicity and infrasound signals occurred around 0535 and at 0540 a significant ash cloud formed and quickly reached 14 km altitude and drifted E along the Alaska Peninsula. The cloud generated at least 150 lightning strokes with thunder that could be heard by people in False Pass. Seismicity rapidly declined to near background levels around 0600. AVO increased the ACC to Red and the VAL to Warning at 0602. The ash cloud detached from the volcano at around 0700, rose to 11.6 km altitude, and drifted ESE. Trace to minor amounts of ashfall were reported by the communities of False Pass, King Cove, Cold Bay, and Sand Point around 0700. Ash emissions continued at lower altitudes of 6-7.6 km altitude at 0820. Small explosions at the vent area continued to be detected in infrasound data and likely represented low-level eruptive activity near the vent. Due to the significant decrease in seismicity and ash emissions the ACC was lowered to Orange and the VAL to Watch at 1234. Radar data showed significant collapses of the crater that occurred on 25 September. Satellite data also showed significant hot, degassing pyroclastic and lahar deposits on all flanks, including more extensive flows on the ENE and WSW sections below two new collapse scarps. Following the significant activity during 24-25 September, only low-level activity was observed. Seismicity decreased notably near the end of the strong activity on 25 September and continued to decrease through the end of the month, though tremor and small earthquakes were still reported. No explosive activity was detected in infrasound data through 2 October. Gas-and-steam emissions rose to 3.7 km altitude, as reported by pilots and seen in satellite images. Satellite data from 26 September showed that significant collapses had occurred at the summit crater and hot, steaming deposits from pyroclastic flows and lahars were present on all the flanks, particularly to the ENE and WSW. A small ash cloud was visible in webcam images on 27 September, likely from a collapse at the summit cone. High elevated surface temperatures were observed in satellite imagery during 27-28 September, which were likely the result of hot deposits on the flanks erupted on 25 September. Minor steaming at the summit crater and from an area on the upper flanks was visible in webcam images on 28 September.
During October, explosion events continued between periods of low activity. Seismicity significantly increased starting at around 2100 on 2 October; around the same time satellite images showed an increase in surface temperatures consistent with lava fountaining. Small, hot avalanches of rock and lava descended an unspecified flank. In addition, a distinct increase in infrasound, seismicity, and lightning detections was followed by an ash plume that rose to 12.2 km altitude and drifted S and E at 0520 on 3 October, based on satellite images. Nighttime webcam images showed incandescence due to lava fountaining at the summit and pyroclastic flows descending the NE flank. AVO reported that a notable explosive eruption started at 0547 and lasted until 0900 on 3 October, which prompted a rise in the ACC to Red and the VAL to Warning. Subsequent ash plumes rose to 6-7.6 km altitude by 0931. At 1036 the ACC was lowered back to Orange and the VAL to Watch since both seismic and infrasound data quieted substantially and were slightly above background levels. Gas-and-steam emissions were observed at the summit, based on webcam images. Trace amounts of ashfall were observed in Cold Bay. Resuspended ash was present at several kilometers altitude near the volcano. During the afternoon, low-level ash plumes were visible at the flanks, which appeared to be largely generated by rock avalanches off the summit crater following the explosive activity. These ash plumes rose to 3 km altitude and drifted W. Trace amounts of ashfall were reported by observers in Cold Bay and Unalaska and flights to these communities were disrupted by the ash cloud. Satellite images taken after the eruption showed evidence of pyroclastic flows and lahar deposits in drainages 2 km down the SW flank and about 3.2 km down the NE flank, and continued erosion of the crater rim. Small explosion craters at the end of the pyroclastic flows on the NE flank were noted for the first time, which may have resulted from gas-and-steam explosions when hot deposits interact with underlying ice.
During 4 October seismicity, including frequent small earthquakes, remained elevated, but was gradually declining. Ash plumes were produced for over eight hours until around 1400 that rose to below 3.7 km altitude. These ash plumes were primarily generated off the sides of the volcano where hot rock avalanches from the crater rim had entered drainages to the SW and NE. Two explosion craters were observed at the base of the NE deposits about 3.2 km from the crater rim. Webcam images showed the explosion craters were a source of persistent ash emissions; occasional collapse events also generated ash. Seismicity remained elevated with sulfur dioxide emissions that had a daily average of more than 1,000 tons per day, and frequent small earthquakes through the end of the month. Frequent elevated surface temperatures were identified in satellite images and gas-and-steam plumes were observed in webcam images, although weather conditions occasionally prevented clear views of the summit. Emissions were robust during 14-16 October and were likely generated by the interaction of hot material and snow and ice. During the afternoon of 21 October a strong gas-and-steam plume rose to 3-4.6 km altitude and extended 40 km WSW, based on satellite images and reports from pilots. On 31 October the ACC was lowered to Yellow and the VAL was lowered to Advisory.
Activity in November was characterized by elevated seismicity with ongoing seismic tremor and small, low-frequency earthquakes, elevated surface temperatures, and gas-and-steam emissions. There was an increase in seismic and infrasound tremor amplitudes starting at 1940 on 2 November. As a result, the ACC was again raised to Orange and the VAL was increased to Watch, although ash was not identified in satellite data. An ash cloud rose to 6.1 km altitude and drifted W according to satellite data at 2000. By 0831 on 3 November ash emissions were no longer visible in satellite images. On 6 and 9 November air pressure sensors detected signals consistent with small explosions. Small explosions were detected in infrasound data consistent with weak Strombolian activity on 19 and 21 November. Seismicity started to decrease on 21 November. On 25 November gas-and-steam emissions were emitted from the vent as well as from a scarp on the NE side of the volcano near the summit. A gas-and-steam plume extended about 50 km SSE and was observed in satellite and webcam images on 26 November. On 28 November small explosions were observed in seismic and local infrasound data and gas-and-steam emissions were visible from the summit and from the upper NE collapse scarp based on webcam images. Possible small explosions were observed in infrasound data on 30 November. Weakly elevated surface temperatures and a persistent gas-and-steam plume from the summit and collapse scarps on the upper flanks. A passing aircraft reported the gas-and-steam plume rose to 3-3.4 km altitude on 30 November, but no significant ash emissions were detected.
Satellite data. MODIS thermal anomaly data provided through MIROVA (Middle InfraRed Observation of Volcanic Activity) showed a strong pulse of thermal activity beginning in July 2023 that continued through November 2023 (figure 48). This strong activity was due to Strombolian explosions and lava fountaining events at the summit crater. According to data from MODVOLC thermal alerts, a total of 101 hotspots were detected near the summit crater in July (11-14, 16-19, 23-24 and 26), August (4, 25-26, and 29), September (5, 12, and 17), and October (3, 4, and 8). Infrared satellite data showed large lava flows descending primarily the northern and SE flanks during the reporting period (figure 49). Sulfur dioxide plumes often exceeded two Dobson Units (DUs) and drifted in different directions throughout the reporting period, based on satellite data from the TROPOMI instrument on the Sentinel-5P satellite (figure 50).
Geologic Background. The symmetrical glacier-covered Shishaldin in the Aleutian Islands is the westernmost of three large stratovolcanoes in the eastern half of Unimak Island. The Aleuts named the volcano Sisquk, meaning "mountain which points the way when I am lost." Constructed atop an older glacially dissected edifice, it is largely basaltic in composition. Remnants of an older edifice are exposed on the W and NE sides at 1,500-1,800 m elevation. There are over two dozen pyroclastic cones on its NW flank, which is covered by massive aa lava flows. Frequent explosive activity, primarily consisting of Strombolian ash eruptions from the small summit crater, but sometimes producing lava flows, has been recorded since the 18th century. A steam plume often rises from the summit crater.
Information Contacts: Alaska Volcano Observatory (AVO), a cooperative program of a) U.S. Geological Survey, 4200 University Drive, Anchorage, AK 99508-4667 USA (URL: https://avo.alaska.edu/), b) Geophysical Institute, University of Alaska, PO Box 757320, Fairbanks, AK 99775-7320, USA, and c) Alaska Division of Geological & Geophysical Surveys, 794 University Ave., Suite 200, Fairbanks, AK 99709, USA (URL: http://dggs.alaska.gov/); MIROVA (Middle InfraRed Observation of Volcanic Activity), a collaborative project between the Universities of Turin and Florence (Italy) supported by the Centre for Volcanic Risk of the Italian Civil Protection Department (URL: http://www.mirovaweb.it/); Hawai'i Institute of Geophysics and Planetology (HIGP) - MODVOLC Thermal Alerts System, School of Ocean and Earth Science and Technology (SOEST), Univ. of Hawai'i, 2525 Correa Road, Honolulu, HI 96822, USA (URL: http://modis.higp.hawaii.edu/); NASA Global Sulfur Dioxide Monitoring Page, Atmospheric Chemistry and Dynamics Laboratory, NASA Goddard Space Flight Center (NASA/GSFC), 8800 Greenbelt Road, Goddard, Maryland, USA (URL: https://so2.gsfc.nasa.gov/); Copernicus Browser, Copernicus Data Space Ecosystem, European Space Agency (URL: https://dataspace.copernicus.eu/browser/).
Ioto
Japan
24.751°N, 141.289°E; summit elev. 169 m
All times are local (unless otherwise noted)
New eruption with discolored water, ejecta, and floating pumice during October-December 2023
Ioto (Iwo-jima), located about 1,200 km S of Tokyo, lies within a 9-km-wide submarine caldera along the Izu-Bonin-Mariana volcanic arc. Previous eruptions date back to 1889 and have consisted of dominantly phreatic explosions, pumice deposits during 2001, and discolored water. A submarine eruption during July through December 2022 was characterized by discolored water, pumice deposits, and gas emissions (BGVN 48:01). This report covers a new eruption during October through December 2023, which consisted of explosions, black ejecta, discolored water, and floating pumice, based on information from the Japan Meteorological Association (JMA), the Japan Coast Guard (JCG), and satellite data.
JMA reported that an eruption had been occurring offshore of Okinahama on the SE side of the island since 21 October, which was characterized by volcanic tremor, according to the Japan Maritime Self-Defense Force (JMSDF) Iwo Jima Air Base (figure 22). According to an 18 October satellite image a plume of discolored water at the site of this new eruption extended NE (figure 23). During an overflight conducted on 30 October, a vent was identified about 1 km off the coast of Okinahama. Observers recorded explosions every few minutes that ejected dark material about 20 m above the ocean and as high as 150 m. Ejecta from the vent formed a black-colored island about 100 m in diameter, according to observations conducted from the air by the Earthquake Research Institute of the University of Tokyo in cooperation with the Mainichi newspaper (figure 24). Occasionally, large boulders measuring more than several meters in size were also ejected. Observations from the Advanced Land Observing Satellite Daichi-2 and Sentinel-2 satellite images also confirmed the formation of this island (figure 23). Brown discolored water and floating pumice were present surrounding the island.
The eruption continued during November. During an overflight on 3 November observers photographed the island and noted that material was ejected 169 m high, according to a news source. Explosions gradually became shorter, and, by the 3rd, they occurred every few seconds; dark and incandescent material were ejected about 800 m above the vent. On 4 November eruptions were accompanied by explosive sounds. Floating, brown-colored pumice was present in the water surrounding the island. There was a brief increase in the number of volcanic earthquakes during 8-14 November and 24-25 November. The eruption temporarily paused during 9-11 November and by 12 November eruptions resumed to the W of the island. On 10 November dark brown-to-dark yellow-green discolored water and a small amount of black floating material was observed (figure 25). A small eruption was reported on 18 November off the NE coast of the island, accompanied by white gas-and-steam plumes (figure 23). Another pause was recorded during 17-19 November, which then resumed on 20 November and continued erupting intermittently. According to a field survey conducted by the National Institute for Disaster Prevention Science and Technology on 19 November, a 30-m diameter crater was visible on the NE coast where landslides, hot water, and gray volcanic ash containing clay have occurred and been distributed previously. Erupted blocks about 10 cm in diameter were distributed about 90-120 m from the crater. JCG made observations during an overflight on 23 November and reported a phreatomagmatic eruption. Explosions at the main vent generated dark gas-and-ash plumes that rose to 200 m altitude and ejected large blocks that landed on the island and in the ocean (figure 26). Discolored water also surrounded the island. The size of the new island had grown to 450 m N-S x 200 m E-W by 23 November, according to JCG.
The eruption continued through 11 December, followed by a brief pause in activity, which then resumed on 31 December, according to JMA. Intermittent explosions produced 100-m-high black plumes at intervals of several minutes to 30 minutes during 1-10 December. Overflights were conducted on 4 and 15 December and reported that the water surrounding the new island was discolored to dark brown-to-dark yellow-green (figure 27). No floating material was reported during this time. In comparison to the observations made on 23 November, the new land had extended N and part of it had eroded away. In addition, analysis by the Geospatial Information Authority of Japan using SAR data from Daichi-2 also confirmed that the area of the new island continued to decrease between 4 and 15 December. Ejected material combined with wave erosion transformed the island into a “J” shape, 500-m-long and with the curved part about 200 m offshore of Ioto. The island was covered with brown ash and blocks, and the surrounding water was discolored to greenish-brown and contained an area of floating pumice. JCG reported from an overflight on 4 December that volcanic ash-like material found around the S vent on the NE part of the island was newly deposited since 10 November (figure 28). By 15 December the N part of the “J” shaped island had separated and migrated N, connecting to the Okinahama coast and the curved part of the “J” had eroded into two smaller islands (figure 27).
References. Ukawa, M., Fujita, E., Kobayashi, T., 2002, Recent volcanic activity of Iwo Jima and the 2001 eruption, Monthly Chikyu, Extra No. 39, 157-164.
Geologic Background. Ioto, in the Volcano Islands of Japan, lies within a 9-km-wide submarine caldera. The volcano is also known as Ogasawara-Iojima to distinguish it from several other "Sulfur Island" volcanoes in Japan. The triangular, low-elevation, 8-km-long island narrows toward its SW tip and has produced trachyandesitic and trachytic rocks that are more alkalic than those of other volcanoes in this arc. The island has undergone uplift for at least the past 700 years, accompanying resurgent doming of the caldera; a shoreline landed upon by Captain Cook's surveying crew in 1779 is now 40 m above sea level. The Motoyama plateau on the NE half of the island consists of submarine tuffs overlain by coral deposits and forms the island's high point. Many fumaroles are oriented along a NE-SW zone cutting through Motoyama. Numerous recorded phreatic eruptions, many from vents on the W and NW sides of the island, have accompanied the uplift.
Information Contacts: Japan Meteorological Agency (JMA), 1-3-4 Otemachi, Chiyoda-ku, Tokyo 100-8122, Japan (URL: http://www.jma.go.jp/jma/indexe.html); Japan Coast Guard (JCG) Volcano Database, Hydrographic and Oceanographic Department, 3-1-1, Kasumigaseki, Chiyoda-ku, Tokyo 100-8932, Japan (URL: https://www1.kaiho.mlit.go.jp/GIJUTSUKOKUSAI/kaiikiDB/kaiyo22-2.htm); Copernicus Browser, Copernicus Data Space Ecosystem, European Space Agency (URL: https://dataspace.copernicus.eu/browser/); Asahi, 5-3-2, Tsukiji, Chuo Ward, Tokyo, 104-8011, Japan (URL: https://www.asahi.com/ajw/articles/15048458).
Purace (Colombia) — December 2023 Cite this Report
Purace
Colombia
2.3095°N, 76.3948°W; summit elev. 4650 m
All times are local (unless otherwise noted)
Gas-and-ash emission on 16 November 2023
Puracé, located in Colombia, is a stratovolcano that contains a 500-m-wide summit crater. It is part of the Los Coconucos volcanic chain that is a NW-SE trending group of seven cones and craters. The most recent eruption occurred during March 2022 that was characterized by frequent seismicity and gas-and-steam emissions (BGVN 47:06). This report covers a brief eruption during November 2023 based on monthly reports from the Popayán Observatory, part of the Servicio Geologico Colombiano (SGC).
Activity during November 2022 through November 2023 primarily consisted of seismicity: VT-type events, LP-type events, HB-type events, and TR-type events (table 4). Maximum sulfur dioxide values were measured weekly and ranged from 259-5,854 tons per day (t/d) during November 2022 through April 2023. White gas-and-steam emissions were also occasionally reported.
SGC issued a report on 25 October that noted a significant increase in the number of earthquakes associated with rock fracturing. These earthquakes were located SE of the crater between Puracé and Piocollo at depths of 1-4 km. There were no reported variations in sulfur dioxide values, but SGC noted high carbon dioxide values, compared to those recorded in the first half of 2023.
SGC reported that at 1929 on 16 November the seismic network detected a signal that was possibly associated with a gas-and-ash emission, though it was not confirmed in webcam images due to limited visibility. On 17 November an observer confirmed ash deposits on the N flank. Webcam images showed an increase in degassing both inside the crater and from the NW flank, rising 700 m above the crater.
Table 4. Seismicity at Puracé during November 2022-November 2023. Volcano-tectonic (VT), long-period (LP), hybrid (HB), and tremor (TR) events are reported each month. Courtesy of SGC.
| Month |
Volcano-tectonic |
Long-period |
Hybrid |
Tremor |
| Nov 2022 |
429 |
2,023 |
5 |
831 |
| Dec 2022 |
423 |
1,390 |
9 |
834 |
| Jan 2023 |
719 |
1,622 |
0 |
957 |
| Feb 2023 |
598 |
1,701 |
2 |
1,124 |
| Mar 2023 |
331 |
2,408 |
147 |
607 |
| Apr 2023 |
614 |
4,427 |
33 |
148 |
| May 2023 |
620 |
3,717 |
170 |
109 |
| Jun 2023 |
467 |
3,293 |
86 |
148 |
| Jul 2023 |
1,116 |
5,809 |
183 |
542 |
| Aug 2023 |
692 |
2,927 |
94 |
321 |
| Sep 2023 |
887 |
1,505 |
82 |
848 |
| Oct 2023 |
2,373 |
2,949 |
135 |
692 |
| Nov 2023 |
1,212 |
2,302 |
69 |
293 |
Geologic Background. Puracé is an active andesitic volcano with a 600-m-diameter summit crater at the NW end of the Los Coconucos Volcanic Chain. This volcanic complex includes nine composite and five monogenetic volcanoes, extending from the Puracé crater more than 6 km SE to the summit of Pan de Azúcar stratovolcano. The dacitic massif which the complex is built on extends about 13 km NW-SE and 10 km NE-SW. Frequent small to moderate explosive eruptions reported since 1816 CE have modified the morphology of the summit crater, with the largest eruptions in 1849, 1869, and 1885.
Information Contacts: Servicio Geologico Colombiano (SGC), Diagonal 53 No. 34-53 - Bogotá D.C., Colombia (URL: https://www.sgc.gov.co/volcanes).
Etna
Italy
37.748°N, 14.999°E; summit elev. 3357 m
All times are local (unless otherwise noted)
Strombolian explosions, lava fountains, and lava flows during July-August 2023
Etna, located on the Italian island of Sicily, has had documented eruptions dating back to 1500 BCE. Activity typically originates from multiple cones at the summit, where several craters have formed and evolved. The currently active craters are Northeast Crater (NEC), Voragine (VOR), and Bocca Nuova (BN), and the Southeast Crater (SEC); VOR and BN were previously referred to as the “Central Crater”. The original Southeast crater formed in 1978, and a second eruptive site that opened on its SE flank in 2011 was named the New Southeast Crater (NSEC). Another eruptive site between the SEC and NSEC developed during early 2017 and was referred to as the "cono della sella" (saddle cone). The current eruption period began in November 2022 and has been characterized by intermittent Strombolian activity, lava flows, and ash plumes (BGVN 48:08). This report updates activity during July through October 2023, which includes primarily gas-and-steam emissions; during July and August Strombolian explosions, lava fountains, and lava flows were reported, based on weekly and special reports by the Osservatorio Etneo (OE), part of the Catania Branch of Italy's Istituo Nazionale di Geofisica e Vulcanologica (INGV) and satellite data.
Variable fumarolic degassing was reported at all summit craters (BN, VOR, NEC, and SEC) throughout the entire reporting period (table 15). The MIROVA (Middle InfraRed Observation of Volcanic Activity) volcano hotspot detection system based on the analysis of MODIS data showed frequent low-to-moderate power thermal anomalies during the reporting period (figure 399). During mid-August there was a pulse in activity that showed an increase in the power of the anomalies due to Strombolian activity, lava fountains, and lava flows. Infrared satellite imagery captured strong thermal anomalies at the central and southeast summit crater areas (figure 400). Accompanying thermal activity were occasional sulfur dioxide plumes that exceeded 2 Dobson Units (DUs) recorded by the TROPOMI instrument on the Sentinel-5P satellite (figure 401).
Table 15. Summary of activity at the four primary crater areas at the summit of Etna during July-October 2023. Information is from INGV weekly reports.
| Month |
Bocca Nuova (BN) |
Voragine (VOR) |
Northeast Crater (NEC) |
Southeast Crater (SEC) |
| Jul 2023 |
Continuous degassing. |
No observations. |
Weak gas emissions. |
Continuous degassing. Sporadic and weak-to-moderate ash emissions. Strombolian explosions. |
| Aug 2023 |
Continuous degassing. |
No observations. |
No observations. |
Continuous degassing. Occasional ash emissions. Strombolian activity, lava fountaining, and lava flows. |
| Sep 2023 |
Variable degassing. Crater incandescence. |
Weak fumarolic activity. |
Weak fumarolic activity. |
Variable degassing. |
| Oct 2023 |
Continuous degassing. |
Weak fumarolic activity. |
Weak fumarolic activity. |
Continuous degassing. |
Activity during July and August was relatively low and mainly consisted of degassing at the summit craters, particularly at SEC and BN. Cloudy weather prevented clear views of the summit during early July. During the night of 2 July some crater incandescence was visible at SEC. Explosive activity resumed at SEC during 9-10 July, which was characterized by sporadic and weak ash emissions that rapidly dispersed in the summit area (figure 402). INGV reported moderate Strombolian activity began at 2034 on 14 July and was confined to the inside of the crater and fed by a vent located in the E part of SEC. An ash emission was detected at 2037. A new vent opened on 15 July in the SE part of BN and began to produce continuous gas-and-steam emissions. During an inspection carried out on 28 July pulsating degassing, along with audible booms, were reported at two active vents in BN. Vigorous gas-and-steam emissions intermittently generated rings. On rare occasions, fine, reddish ash was emitted from BN1 and resuspended by the gas-and-steam emissions.
Around 2000 on 13 August INGV reported a sudden increase in volcanic tremor amplitude. Significant infrasonic activity coincided with the tremor increase. Incandescent flashes were visible through the cloud cover in webcam images of SEC (figure 403). Strombolian activity at SEC began to gradually intensify starting at 2040 as seismicity continued to increase. The Aviation Color Code (ACC) was raised to Yellow (the second lowest-level on a four-color scale) at 2126 and then to Orange (the second highest-level on a four-color scale) at 2129 due to above-background activity. The activity rapidly transitioned from Strombolian activity to lava fountains around 2333 that rose 300-400 m above the crater (figure 403). Activity was initially focused on the E vent of the crater, but then the vent located above the S flank of the cone also became active. A lava flow from this vent traveled SW into the drainage created on 10 February 2022, overlapping with previous flows from 10 and 21 February 2022 and 21 May 2023, moving between Monte Barbagallo and Monte Frumento Supino (figure 404). The lava flow was 350 m long, oriented NNE-SSW, and descended to an elevation of 2.8 km. Flows covered an area of 300,000 m2 and had an estimated volume of 900,000 m3. The ACC was raised to Red at 2241 based on strong explosive activity and ashfall in Rifugio Sapienza-Piano Vetore at 1.7 km elevation on the S flank. INGV reported that pyroclastic flows accompanied this activity.
Activity peaked between 0240 and 0330 on 14 August, when roughly 5-6 vents erupted lava fountains from the E to SW flank of SEC. The easternmost vents produced lava fountains that ejected material strongly to the E, which caused heavy fallout of incandescent pyroclastic material on the underlying flank, triggering small pyroclastic flows. This event was also accompanied by lightning both in the ash column and in the ash clouds that were generated by the pyroclastic flows. A fracture characterized by a series of collapse craters (pit craters) opened on the upper SW flank of SEC. An ash cloud rose a few kilometers above the crater and drifted S, causing ash and lapilli falls in Rifugio Sapienza and expanding toward Nicolosi, Mascalucia, Catania, and up to Syracuse. Ashfall resulted in operational problems at the Catania airport (50 km S), which lasted from 0238 until 2000. By 0420 the volcanic tremor amplitude values declined to background levels. After 0500 activity sharply decreased, although the ash cloud remained for several hours and drifted S. By late morning, activity had completely stopped. The ACC was lowered to Orange as volcanic ash was confined to the summit area. Sporadic, minor ash emissions continued throughout the day. At 1415 the ACC was lowered to Yellow and then to Green at 1417.
During the night of 14-15 August only occasional flashes were observed, which were more intense during avalanches of material inside the eruptive vents. Small explosions were detected at SEC at 2346 on 14 August and at 0900 on 26 August that each produced ash clouds which rapidly dispersed into the atmosphere (figure 405). According to a webcam image, an explosive event detected at 2344 at SEC generated a modest ash cloud that was rapidly dispersed by winds. The ACC was raised to Yellow at 2355 on 14 August due to increasing unrest and was lowered to Green at 0954 on 15 August.
Activity during September and October was relatively low and mainly characterized by variable degassing from BN and SEC. Intense, continuous, and pulsating degassing was accompanied by roaring sounds and flashes of incandescence at BN both from BN1 and the new pit crater that formed during late July (figure 406). The degassing from the new pit crater sometimes emitted vapor rings. Cloudy weather during 6-8 September prevented observations of the summit craters .
Geologic Background. Mount Etna, towering above Catania on the island of Sicily, has one of the world's longest documented records of volcanism, dating back to 1500 BCE. Historical lava flows of basaltic composition cover much of the surface of this massive volcano, whose edifice is the highest and most voluminous in Italy. The Mongibello stratovolcano, truncated by several small calderas, was constructed during the late Pleistocene and Holocene over an older shield volcano. The most prominent morphological feature of Etna is the Valle del Bove, a 5 x 10 km caldera open to the east. Two styles of eruptive activity typically occur, sometimes simultaneously. Persistent explosive eruptions, sometimes with minor lava emissions, take place from one or more summit craters. Flank vents, typically with higher effusion rates, are less frequently active and originate from fissures that open progressively downward from near the summit (usually accompanied by Strombolian eruptions at the upper end). Cinder cones are commonly constructed over the vents of lower-flank lava flows. Lava flows extend to the foot of the volcano on all sides and have reached the sea over a broad area on the SE flank.
Information Contacts: Sezione di Catania - Osservatorio Etneo, Istituto Nazionale di Geofisica e Vulcanologia (INGV), Sezione di Catania, Piazza Roma 2, 95123 Catania, Italy (URL: http://www.ct.ingv.it/it/); MIROVA (Middle InfraRed Observation of Volcanic Activity), a collaborative project between the Universities of Turin and Florence (Italy) supported by the Centre for Volcanic Risk of the Italian Civil Protection Department (URL: http://www.mirovaweb.it/); NASA Global Sulfur Dioxide Monitoring Page, Atmospheric Chemistry and Dynamics Laboratory, NASA Goddard Space Flight Center (NASA/GSFC), 8800 Greenbelt Road, Goddard MD 20771, USA (URL: https://so2.gsfc.nasa.gov/); Copernicus Browser, Copernicus Data Space Ecosystem, European Space Agency (URL: https://dataspace.copernicus.eu/browser/).
Suwanosejima (Japan) — December 2023 Cite this Report
Suwanosejima
Japan
29.638°N, 129.714°E; summit elev. 796 m
All times are local (unless otherwise noted)
Eruption plumes, crater incandescence, and occasional explosions during July-October 2023
Suwanosejima is an 8-km-long island that consists of a stratovolcano and two active summit craters, located in the northern Ryukyu Islands, Japan. Volcanism over the past century has been characterized by Strombolian explosions, ash plumes, and ashfall. The current eruption began in October 2004 and has more recently consisted of frequent eruption plumes, explosions, and incandescent ejecta (BGVN 48:07). This report covers similar activity of ash plumes, explosions, and crater incandescence during July through October 2023 using monthly reports from the Japan Meteorological Agency (JMA) and satellite data.
Thermal activity during the reporting period was relatively low; only one low-power thermal anomaly was detected during mid-July and one during early August, based on a MIROVA (Middle InfraRed Observation of Volcanic Activity) Log Radiative Power graph of the MODIS thermal anomaly data. On two clear weather days, a thermal anomaly was visible in infrared satellite images (figure 81).
Low-level activity was reported at the Otake crater during July and no explosions were detected. Eruption plumes rose as high as 1.8 km above the crater. On 13 July an ash plume rose 1.7 km above the crater rim, based on a webcam image. During the night of the 28th crater incandescence was visible in a webcam image. An eruptive event reported on 31 July produced an eruption plume that rose 2.1 km above the crater. Seismicity consisted of 11 volcanic earthquakes on the W flank, the number of which had decreased compared to June (28) and 68 volcanic earthquakes near the Otake crater, which had decreased from 722 in the previous month. According to observations conducted by the University of Tokyo Graduate School of Science, Kyoto University Disaster Prevention Research Institute, Toshima Village, and JMA, the amount of sulfur dioxide emissions released during the month was 400-800 tons per day (t/d).
Eruptive activity in the Otake crater continued during August and no explosions were reported. An eruptive event produced a plume that rose 1 km above the crater at 1447 on 12 August. Subsequent eruptive events were recorded at 0911 on 16 August, at 1303 on 20 August, and at 0317 on 21 August, which produced ash plumes that rose 1-1.1 km above the crater and drifted SE, SW, and W. On 22 August an ash plume was captured in a webcam image rising 1.4 km above the crater (figure 82). Multiple eruptive events were detected on 25 August at 0544, 0742, 0824, 1424, and 1704, which generated ash plumes that rose 1.1-1.2 km above the crater and drifted NE, W, and SW. On 28 August a small amount of ashfall was observed as far as 1.5 km from the crater. There were 17 volcanic earthquakes recorded on the W flank of the volcano and 79 recorded at the Otake crater during the month. The amount of sulfur dioxide emissions released during the month was 400-800 t/d.
Activity continued at the Otake crater during September. Occasionally, nighttime crater incandescence was observed in webcam images and ashfall was reported. An eruptive event at 1949 on 4 September produced an ash plume that rose 1 km above the crater and drifted SW. On 9 September several eruption events were detected at 0221, 0301, and 0333, which produced ash plumes that rose 1.1-1.4 km above the crater rim and drifted W; continuous ash emissions during 0404-0740 rose to a maximum height of 2 km above the crater rim (figure 83). More eruptive events were reported at 1437 on 10 September, at 0319 on 11 September, and at 0511 and 1228 on 15 September, which generated ash plumes that rose 1-1.8 km above the crater. During 25, 27, and 30 September, ash plumes rose as high as 1.3 km above the crater rim. JMA reported that large blocks were ejected as far as 300 m from the center of the crater. There were 18 volcanic earthquakes detected beneath the W flank and 82 volcanic earthquakes detected near the Otake crater. The amount of sulfur dioxide released during the month ranged from 600 to 1,600 t/d.
Activity during early-to-mid-October consisted of occasional explosions, a total number of 13, and ash plumes that rose as high as 1.9 km above the Otake crater rim on 29 October (figure 84). These explosions are the first to have occurred since June 2023. Continuous ash emissions were reported during 0510-0555 on 1 October. Explosions were recorded at 0304, 2141, and 2359 on 2 October, at 0112 on 3 October, and at 1326 on 6 October, which produced ash plumes that rose as high as 1 km above the crater rim and drifted SW and W. An explosion was noted at 0428 on 3 October, but emission details were unknown. A total of eight explosions were recorded by the seismic network at 1522 on 14 October, at 0337, 0433, 0555, 1008, and 1539 on 15 October, and at 0454 and 0517 on 16 October. Ash plumes from these explosions rose as high as 900 m above the crater and drifted SE. Eruptive events during 25-27 and 29-30 October generated plumes that rose as high as 1.9 km above the crater and drifted SE, S, and SW. Ash was deposited in Toshima village (3.5 km SSW). Eruptive activity occasionally ejected large volcanic blocks as far as 600 m from the crater. Nighttime crater incandescence was visible in webcams. Intermittent ashfall was reported as far as 1.5 km from the crater. There were 43 volcanic earthquakes detected on the W flank during the month, and 184 volcanic earthquakes detected near the Otake crater. The amount of sulfur dioxide emitted ranged between 400 and 900 t/d.
Geologic Background. The 8-km-long island of Suwanosejima in the northern Ryukyu Islands consists of an andesitic stratovolcano with two active summit craters. The summit is truncated by a large breached crater extending to the sea on the E flank that was formed by edifice collapse. One of Japan's most frequently active volcanoes, it was in a state of intermittent Strombolian activity from Otake, the NE summit crater, between 1949 and 1996, after which periods of inactivity lengthened. The largest recorded eruption took place in 1813-14, when thick scoria deposits covered residential areas, and the SW crater produced two lava flows that reached the western coast. At the end of the eruption the summit of Otake collapsed, forming a large debris avalanche and creating an open collapse scarp extending to the eastern coast. The island remained uninhabited for about 70 years after the 1813-1814 eruption. Lava flows reached the eastern coast of the island in 1884. Only about 50 people live on the island.
Information Contacts: Japan Meteorological Agency (JMA), 1-3-4 Otemachi, Chiyoda-ku, Tokyo 100-8122, Japan (URL: http://www.jma.go.jp/jma/indexe.html); MIROVA (Middle InfraRed Observation of Volcanic Activity), a collaborative project between the Universities of Turin and Florence (Italy) supported by the Centre for Volcanic Risk of the Italian Civil Protection Department (URL: http://www.mirovaweb.it/); Hawai'i Institute of Geophysics and Planetology (HIGP) - MODVOLC Thermal Alerts System, School of Ocean and Earth Science and Technology (SOEST), Univ. of Hawai'i, 2525 Correa Road, Honolulu, HI 96822, USA (URL: http://modis.higp.hawaii.edu/); Copernicus Browser, Copernicus Data Space Ecosystem, European Space Agency (URL: https://dataspace.copernicus.eu/browser/).
Aira
Japan
31.5772°N, 130.6589°E; summit elev. 1117 m
All times are local (unless otherwise noted)
Explosions, ash plumes, ash fall, and crater incandescence during July-October 2023
Aira caldera, located in the northern half of Kagoshima Bay, Japan, contains the post-caldera Sakurajima volcano. Eruptions typically originate from the Minamidake crater, and since the 8th century, ash deposits have been recorded in the city of Kagoshima (10 km W), one of Kyushu’s largest cities. The Minamidake summit cone and crater has had persistent activity since 1955; the Showa crater on the E flank has also been intermittently active since 2006. The current eruption period began during March 2017 and has recently been characterized by intermittent explosions, eruption plumes, and ashfall (BGVN 48:07). This report updates activity during July through October 2023 and describes explosive events, ash plumes, nighttime crater incandescence, and ashfall, according to monthly activity reports from the Japan Meteorological Agency (JMA) and satellite data.
Thermal activity remained at low levels during this reporting period, according to the MIROVA (Middle InfraRed Observation of Volcanic Activity) system (figure 149). There was a slight increase in the number of anomalies during September through October. Occasional thermal anomalies were visible in infrared satellite images mainly at the Minamidake crater (Vent A is located to the left and Vent B is located to the right) (figure 150).
Table 30. Number of monthly explosive events, days of ashfall, area of ash covered, and sulfur dioxide emissions from Sakurajima’s Minamidake crater at Aira during July-October 2023. Note that smaller ash events are not listed. Ashfall days were measured at Kagoshima Local Meteorological Observatory and ashfall amounts represent material covering all the Kagoshima Prefecture. Data courtesy of JMA monthly reports.
| Month |
Explosive events |
Days of ashfall |
Ashfall amount (g/m2) |
SO2 emissions (tons/day) |
| Jul 2023 |
3 |
0 |
0 |
1,600-3,200 |
| Aug 2023 |
3 |
10 |
7 |
1,800-3,300 |
| Sep 2023 |
3 |
7 |
3 |
1,600-2,300 |
| Oct 2023 |
33 |
8 |
61 |
2,200-4,200 |
JMA reported that during July, there were eight eruptions, three of which were explosion events in the Showa crater. Large blocks were ejected as far as 600 m from the Showa crater. Very small eruptions were occasionally reported at the Minamidake crater. Nighttime incandescence was observed in both the Showa and Minamidake crater. Explosions were reported on 16 July at 2314 and on 17 July at 1224 and at 1232 (figure 151). Resulting eruption plumes rose 700-2,500 m above the crater and drifted N. On 23 July the number of volcanic earthquakes on the SW flank of the volcano increased. A strong Mw 3.1 volcanic earthquake was detected at 1054 on 26 July. The number of earthquakes recorded throughout the month was 545, which markedly increased from 73 in June. No ashfall was observed at the Kagoshima Regional Meteorological Observatory during July. According to a field survey conducted during the month, the daily amount of sulfur dioxide emissions was 1,600-3,200 tons per day (t/d).
There were three eruptions reported at the Minamidake crater during August, each of which were explosive. The explosions occurred on 9 August at 0345, on 13 August at 2205, and on 31 August at 0640, which generated ash plumes that rose 800-2,000 m above the crater and drifted W. There were two eruptions detected at Showa crater; on 4 August at 2150 ejecta traveled 800 m from the Showa crater and associated eruption plumes rose 2.3 km above the crater. The explosion at 2205 on 13 August generated an ash plume that rose 2 km above the crater and was accompanied by large blocks that were ejected 600 m from the Minamidake crater (figure 152). Nighttime crater incandescence was visible in a high-sensitivity surveillance camera at both craters. Seismicity consisted of 163 volcanic earthquakes, 84 of which were detected on the SW flank. According to the Kagoshima Regional Meteorological Observatory there was a total of 7 g/m2 of ashfall over the course of 10 days during the month. According to a field survey, the daily amount of sulfur dioxide emitted was 1,800-3,300 t/d.
During September, four eruptions were reported, three of which were explosion events. These events occurred at 1512 on 9 September, at 0018 on 11 September, and at 2211 on 13 September. Resulting ash plumes generally rose 800-1,100 m above the crater. An explosion produced an ash plume at 2211 on 13 September that rose as high as 1.7 km above the crater. Large volcanic blocks were ejected 600 m from the Minamidake crater. Smaller eruptions were occasionally observed at the Showa crater. Nighttime crater incandescence was visible at the Minamidake crater. Seismicity was characterized by 68 volcanic earthquakes, 28 of which were detected beneath the SW flank. According to the Kagoshima Regional Meteorological Observatory there was a total of 3 g/m2 of ashfall over the course of seven days during the month. A field survey reported that the daily amount of sulfur dioxide emitted was 1,600-2,300 t/d.
Eruptive activity during October consisted of 69 eruptions, 33 of which were described as explosive. These explosions occurred during 4 and 11-21 October and generated ash plumes that rose 500-3,600 m above the crater and drifted S, E, SE, and N. On 19 October at 1648 an explosion generated an ash plume that rose 3.6 km above the crater (figure 153). No eruptions were reported in the Showa crater; white gas-and-steam emissions rose 100 m above the crater from a vent on the N flank. Nighttime incandescence was observed at the Minamidake crater. On 24 October an eruption was reported from 0346 through 0430, which included an ash plume that rose 3.4 km above the crater. Ejected blocks traveled 1.2 km from the Minamidake crater. Following this eruption, small amounts of ashfall were observed from Arimura (4.5 km SE) and a varying amount in Kurokami (4 km E) (figure 154). The number of recorded volcanic earthquakes during the month was 190, of which 14 were located beneath the SW flank. Approximately 61 g/m2 of ashfall was reported over eight days of the month. According to a field survey, the daily amount of sulfur dioxide emitted was 2,200-4,200 t/d.
Geologic Background. The Aira caldera in the northern half of Kagoshima Bay contains the post-caldera Sakurajima volcano, one of Japan's most active. Eruption of the voluminous Ito pyroclastic flow accompanied formation of the 17 x 23 km caldera about 22,000 years ago. The smaller Wakamiko caldera was formed during the early Holocene in the NE corner of the caldera, along with several post-caldera cones. The construction of Sakurajima began about 13,000 years ago on the southern rim and built an island that was joined to the Osumi Peninsula during the major explosive and effusive eruption of 1914. Activity at the Kitadake summit cone ended about 4,850 years ago, after which eruptions took place at Minamidake. Frequent eruptions since the 8th century have deposited ash on the city of Kagoshima, located across Kagoshima Bay only 8 km from the summit. The largest recorded eruption took place during 1471-76.
Information Contacts: Japan Meteorological Agency (JMA), 1-3-4 Otemachi, Chiyoda-ku, Tokyo 100-8122, Japan (URL: http://www.jma.go.jp/jma/indexe.html); MIROVA (Middle InfraRed Observation of Volcanic Activity), a collaborative project between the Universities of Turin and Florence (Italy) supported by the Centre for Volcanic Risk of the Italian Civil Protection Department (URL: http://www.mirovaweb.it/); Copernicus Browser, Copernicus Data Space Ecosystem, European Space Agency (URL: https://dataspace.copernicus.eu/browser/).
Nishinoshima (Japan) — November 2023 Cite this Report
Nishinoshima
Japan
27.247°N, 140.874°E; summit elev. 100 m
All times are local (unless otherwise noted)
Gray emissions during October 2023
Nishinoshima is a small island in the Ogasawara Arc, about 1,000 km S of Tokyo, Japan. It contains prominent submarine peaks to the S, W, and NE. Recorded eruptions date back to 1973, with the current eruption period beginning in October 2022. Eruption plumes and fumarolic activity characterize recent activity (BGVN 48:10). This report covers the end of the eruption for September through October 2023, based on information from monthly reports of the Japan Meteorological Agency (JMA) monthly reports, and satellite data.
No eruptive activity was reported during September 2023, although JMA noted that the surface temperature was slightly elevated compared to the surrounding area since early March 2023. The Japan Coast Guard (JCG) conducted an overflight on 20 September and reported white gas-and-steam plumes rising 3 km above the central crater of the pyroclastic cone, as well as multiple white gas-and-steam emissions emanating from the N, E, and S flanks of the crater to the coastline. In addition, dark reddish brown-to-green discolored water was distributed around almost the entire circumference of the island.
Similar low-level activity was reported during October. Multiple white gas-and-steam emissions rose from the N, E, and S flanks of the central crater of the pyroclastic cone and along the coastline; these emissions were more intense compared to the previous overflight observations. Dark reddish brown-to-green discolored water remained visible around the circumference of the island. On 4 October aerial observations by JCG showed a small eruption consisting of continuous gas-and-steam emissions emanating from the central crater, with gray emissions rising to 1.5 km altitude (figure 129). According to observations from the marine weather observation vessel Keifu Maru on 26 October, white gas-and-steam emissions persisted from the center of the pyroclastic cone, as well as from the NW, SW, and SE coasts of the island for about five minutes. Slightly discolored water was visible up to about 1 km.
Frequent low-to-moderate power thermal anomalies were recorded in the MIROVA graph (Middle InfraRed Observation of Volcanic Activity) during September (figure 130). Occasional anomalies were detected during October, and fewer during November through December. A thermal anomaly was visible in the crater using infrared satellite imagery on 6, 8, 11, 16, 18, 21, and 23 September and 8, 13, 21, 26, and 28 October (figure 131).
Geologic Background. The small island of Nishinoshima was enlarged when several new islands coalesced during an eruption in 1973-74. Multiple eruptions that began in 2013 completely covered the previous exposed surface and continued to enlarge the island. The island is the summit of a massive submarine volcano that has prominent peaks to the S, W, and NE. The summit of the southern cone rises to within 214 m of the ocean surface 9 km SSE.
Information Contacts: Japan Meteorological Agency (JMA), 1-3-4 Otemachi, Chiyoda-ku, Tokyo 100-8122, Japan (URL: http://www.jma.go.jp/jma/indexe.html); MIROVA (Middle InfraRed Observation of Volcanic Activity), a collaborative project between the Universities of Turin and Florence (Italy) supported by the Centre for Volcanic Risk of the Italian Civil Protection Department (URL: http://www.mirovaweb.it/); Copernicus Browser, Copernicus Data Space Ecosystem, European Space Agency (URL: https://dataspace.copernicus.eu/browser/).
Kilauea (United States) — October 2023 Cite this Report
Kilauea
United States
19.421°N, 155.287°W; summit elev. 1222 m
All times are local (unless otherwise noted)
Strong lava fountains, lava flows, and spatter at Halema’uma’u during January-September 2023
Kīlauea is on the island of Hawai’i and overlaps the E flank of the Mauna Loa volcano. Its East Rift Zone (ERZ) has been intermittently active for at least 2,000 years. An extended eruption period began in January 1983 and was characterized by open lava lakes and lava flows from the summit caldera and the East Rift Zone. During May 2018 magma migrated into the Lower East Rift Zone (LERZ) and opened 24 fissures along a 6-km-long NE-trending fracture zone that produced lava flows traveling in multiple directions. As lava emerged from the fissures, the lava lake at Halema'uma'u drained and explosions sent ash plumes to several kilometers altitude (BGVN 43:10).
The current eruption period started during September 2021 and has been characterized by low-level lava effusions in the active Halema’uma’u lava lake (BGVN 48:01). This report covers three notable eruption periods during February, June, and September 2023 consisting of lava fountaining, lava flows, and spatter during January through September 2023 using information from daily reports, volcanic activity notices, and abundant photo, map, and video data from the US Geological Survey's (USGS) Hawaiian Volcano Observatory (HVO).
Activity during January 2023. Small earthquake swarms were recorded on 2 January 2023; increased seismicity and changes in the pattern of deformation were noted on the morning of 5 January. At around 1500 both the rate of deformation and seismicity drastically increased, which suggested magma movement toward the surface. HVO raised the Volcano Alert Level (VAL) to Watch (the second highest level on a four-level scale) and the Aviation Color Code (ACC) to Orange (the second highest color on a four-color scale) at 1520.
Multiple lava fountains and lava effusions from vents in the central eastern portion of the Halema’uma’u crater began on 5 January around 0434; activity was confined to the eastern half of the crater and within the basin of the western half of the crater, which was the focus of the eruption in 2021-2022 (figure 525). Incandescence was visible in webcam images at 1634 on 5 January, prompting HVO to raise the VAL to Warning (the highest level on a four-level scale) and the ACC to Red (the highest color on a four-color scale). Lava fountains initially rose as high as 50 m above the vent at the onset of the eruption (figure 526) but then declined to a more consistent 5-6 m height in the proceeding days. By 1930 that same day, lava had covered most of the crater floor (an area of about 1,200,000 m2) and the lava lake had a depth of 10 m. A higher-elevation island that formed during the initial phase of the December 2020 eruption remained exposed, appearing darker in images, along with a ring of older lava around the lava lake that was active prior to December 2022. Overnight during 5-6 January the lava fountains continued to rise 5 m high, and the lava effusion rate had slowed.
On 6 January at 0815 HVO lowered the VAL to Watch and the ACC to Orange due to the declining effusion rates. Sulfur dioxide emission rates ranged from 3,000-12,500 tonnes per day (t/d), the highest value of which was recorded on 6 January. Lava continued to erupt from the vents during 6-8 January, although the footprint of the active area had shrunk; a similar progression has been commonly observed during the early stages of recent eruptions at Halema’uma’u. On 9 January HVO reported one dominant lava fountain rising 6-7 m high in the E half of the crater. Lava flows built up the margins of the lake, causing the lake to be perched. On 10 January the eastern lava lake had an area of approximately 120,000 m2 that increased to 250,000 m2 by 17 January. During 13-31 January several small overflows occurred along the margins of the E lake. A smaller area of lava was active within the basin in the W half of the crater that had been the focus of activity during 2021-2022. On 19 January just after 0200 a small ooze-out was observed on the crater’s W edge.
Activity during February 2023. Activity continued in the E part of Halema’uma’u crater, as well as in a smaller basin in the W part of the 2021-2022 lava lake (figure 527). The E lava lake contained a single lava fountain and frequent overflows. HVO reported that during the morning of 1 February the large E lava lake began to cool and crust over in the center of the lake; two smaller areas of lava were observed on the N and S sides by the afternoon. The dominant lava fountain located in the S part of the lava lake paused for roughly 45 minutes at 2315 and resumed by midnight, rising 1-2 m. At 0100 on 2 February lava from the S part was effusing across the entire E lava lake area, covering the crusted over portion in the center of the lake and continuing across the majority of the previously measured 250,000 m2 by 0400. A small lava pond near the E lake produced an overflow around 0716 on 2 February. On 3 February some lava crust began to form against the N and E levees, which defined the 250,000 m2 eastern lava lake. The small S lava fountain remained active, rising 1-6 m high during 3-9 February; around 0400 on 5 February occasional bursts doubled the height of the lava fountain.
A large breakout occurred overnight during 2100 on 4 February to 0900 on 5 February on the N part of the crater floor, equal to or slightly larger in size than the E lava lake. A second, smaller lava fountain appeared in the same area of the E lava lake between 0300 and 0700 on 5 February and was temporarily active. This large breakout continued until 7 February. A small, brief breakout was reported in the S of the E lava lake around midnight on 7 February. In the W lake, as well as the smaller lava pond in the central portion of the crater floor, contained several overflows during 7-10 February and intermittent fountaining. Activity at the S small lava pond and the small S lava fountain within the E lake declined during 9-10 February. The lava pond in the central portion of the crater floor had nearly continuous, expansive flows during 10-13 February; channels from the small central lava pond seemed to flow into the larger E lake. During 13-18 February a small lava fountain was observed in the small lava pond in the central portion of the crater floor. Continuous overflows persisted during this time.
Activity in the eastern and central lakes began to decline in the late afternoon of 17 February. By 18 February HVO reported that the lava effusions had significantly declined, and that the eastern and central lakes were no longer erupting. The W lake in the basin remained active but at a greatly reduced level that continued to decline. HVO reported that this decrease in activity is attributed to notable deflationary tilt that began early on the morning of 17 February and lasted until early 19 February. By 19 February the W lake was mostly crusted over although some weak lava flows remained, which continued through 28 February. The sulfur dioxide emission rates ranged 250-2,800 t/d, the highest value of which was recorded on 6 February.
Activity during March 2023. The summit eruption at Halema’uma’u crater continued at greatly reduced levels compared to the previous two months. The E and central vents stopped effusing lava, and the W lava lake remained active with weak lava flows; the lake was mostly crusted over, although slowly circulating lava intermittently overturned the crust. By 6 March the lava lake in the W basin had stopped because the entire surface was crusted over. The only apparent surface eruptive activity during 5-6 March was minor ooze-outs of lava onto the crater floor, which had stopped by 7 March. Several hornitos on the crater floor still glowed through 12 March according to overnight webcam images, but they did not erupt any lava. A small ooze-out of lava was observed just after 1830 in the W lava lake on 8 March, which diminished overnight. The sulfur dioxide emission rate ranged from 155-321 t/d on 21 March. The VAL was lowered to Advisory, and the ACC was lowered to Yellow (the second lowest on a four-color scale) on 23 March due to a pause in the eruption since 7 March.
Activity during April-May 2023. The eruption at Halema’uma’u crater was paused; no lava effusions were visible on the crater floor. Sulfur dioxide emission rates ranged from 75-185 t/d, the highest of which was measured on 22 April. During May and June summit seismicity was elevated compared to seismicity that preceded the activity during January.
Activity during June 2023. Earthquake activity and changes in the patterns of ground deformation beneath the summit began during the evening of 6 June. The data indicated magma movement toward the surface, prompting HVO to raise the VAL to Watch and the ACC to Orange. At about 0444 on 7 June incandescence in Halema’uma’u crater was visible in webcam images, indicating that a new eruption had begun. HVO raised the VAL to Warning and the ACC to Red (the highest color on a four-color scale). Lava flowed from fissures that had opened on the crater floor. Multiple minor lava fountains were active in the central E portion of the Halema’uma’u crater, and one vent opened on the W wall of the caldera (figure 528). The eruptive vent on the SW wall of the crater continued to effuse into the lava lake in the far SW part of the crater (figure 529). The largest lava fountain consistently rose 15 m high; during the early phase of the eruption, fountain bursts rose as high as 60 m. Lava flows inundated much of the crater floor and added about 6 m depth of new lava within a few hours, covering approximately 10,000 m2. By 0800 on 7 June lava filled the crater floor to a depth of about 10 m. During 0800-0900 the sulfur dioxide emission rate was about 65,000 t/d. Residents of Pahala (30 km downwind of the summit) reported minor deposits of fine, gritty ash and Pele’s hair. A small spatter cone had formed at the vent on the SW wall by midday, and lava from the cone was flowing into the active lava lake. Fountain heights had decreased from the onset of the eruption and were 4-9 m high by 1600, with occasional higher bursts. Inflation switched to deflation and summit earthquake activity greatly diminished shortly after the eruption onset.
At 0837 on 8 June HVO lowered the VAL to Watch and the ACC to Orange because the initial high effusion rates had declined, and no infrastructure was threatened. The surface of the lava lake had dropped by about 2 m, likely due to gas loss by the morning of 8 June. The drop left a wall of cooled lava around the margins of the crater floor. Lava fountain heights decreased during 8-9 June but continued to rise to 10 m high. Active lava and vents covered much of the W half of Halema’uma’u crater in a broad, horseshoe-shape around a central, uplifted area (figure 530). The preliminary average effusion rate for the first 24 hours of the eruption was about 150 cubic meters per second, though the estimate did not account for vesiculated lava and variations in crater floor topography. The effusion rate during the very earliest phases of the eruption appeared significantly higher than the previous three summit eruptions based on the rapid coverage of the entire crater floor. An active lava lake, also referred to as the “western lava lake” was centered within the uplifted area and was fed by a vent in the NE corner. Two small active lava lakes were located just SE from the W lava lake and in the E portion of the crater floor.
During 8-9 June the lava in the central lava lake had a thickness of approximately 1.5 m, based on measurements from a laser rangefinder. During 9-12 June the height of the lava fountains decreased to 9 m high. HVO reported that the previously active lava lake in the E part of the crater appeared stagnant during 10-11 June. The surface of the W lake rose approximately 1 m overnight during 11-12 June, likely due to the construction of a levee around it. Only a few small fountains were active during 12-13 June; the extent of the active lava had retreated so that all activity was concentrated in the SW and central parts of Halema’uma’u crater. Intermittent spattering from the vent on the SW wall was visible in overnight webcam images during 13-18 June. On the morning of 14 June a weak lava effusion originated from near the western eruptive vent, but by 15 June there were no signs of continued activity. HVO reported that other eruptive vents in the SW lava lake had stopped during this time, following several days of waning activity; lava filled the lake by about 0.5 m. Lava circulation continued in the central lake and no active lava was reported in the northern or eastern parts of the crater. Around 0800 on 15 June the top of the SW wall spatter cone collapsed, which was followed by renewed and constant spattering from the top vent and a change in activity from the base vent; several new lava flows effused from the top of the cone, as well as from the pre-existing tube-fed flow from its base. Accumulation of lava on the floor resulted in a drop of the central basin relative to the crater floor, allowing several overflows from the SW lava lake to cascade into the basin during the night of 15 June into the morning of 16 June.
Renewed lava fountaining was reported at the eruptive vent on the SW side of the crater during 16-19 June, which effused lava into the far SW part of the crater. This activity was described as vigorous during midday on 16 June; a group of observatory geologists estimated that the lava was consistently ejected at least 10 m high, with some spatter ejected even higher and farther. Deposits from the fountain further heightened and widened the spatter cone built around the original eruptive vent in the lower section of the crater wall. Multiple lava flows from the base of the cone were fed into the SW lava lake and onto the southwestern-most block from the 2018 collapse within Halema’uma’u on 17 June (figure 531); by 18 June they focused into a single flow feeding into the SW lava lake. On the morning of 19 June a second lava flow from the base of the eruptive cone advanced into the SW lava lake.
Around 1600 on 19 June there was a rapid decline in lava fountaining and effusion at the eruptive vent on the SW side of the crater; vent activity had been vigorous up to that point (figure 532). Circulation in the lava lake also slowed, and the lava lake surface dropped by several meters. Overnight webcam images showed some previously eruptive lava still flowing onto the crater floor, which continued until those flows began to cool. By 21 June no lava was erupting in Halema’uma’u crater. Overnight webcam images during 29-30 June showed some incandescence from previously erupted lava flows as they continued to cool. Seismicity in the crater declined to low levels. Sulfur dioxide emission rates ranged 160-21,000 t/d throughout the month, the highest measurement of which was recorded on 8 June. On 30 June the VAL was lowered to Advisory (the second level on a four-level scale) and the ACC was lowered to Yellow. Gradual inflation was detected at summit tiltmeters during 19-30 June.
Activity during July-August 2023. During July, the eruption paused; no lava was erupting in Halema’uma’u crater. Nighttime webcam images showed some incandescence from previously erupted lava as it continued to cool on the crater floor. During the week of 14 August HVO reported that the rate in seismicity increased, with 467 earthquakes of Mw 3.2 and smaller occurring. Sulfur dioxide emission rates remained low, ranging from 75-86 t/d, the highest of which was recorded on 10 and 15 August. On 15 August beginning at 0730 and lasting for several hours, a swarm of approximately 50 earthquakes were detected at a depth of 2-3 km below the surface and about 2 km long directly S of Halema’uma’u crater. HVO reported that this was likely due to magma movement in the S caldera region. During 0130-0500 and 1700-2100 on 21 August two small earthquake swarms of approximately 20 and 25 earthquakes, respectively, occurred at the same location and at similar depths. Another swarm of 50 earthquakes were recorded during 0430-0830 on 23 August. Elevated seismicity continued in the S area through the end of the month.
Activity during September 2023. Elevated seismicity persisted in the S summit with occasional small, brief seismic swarms. Sulfur dioxide measurements were relatively low and were 70 t/d on 8 September. About 150 earthquakes occurred during 9-10 September, and tiltmeter and Global Positioning System (GPS) data showed inflation in the S portion of the crater.
At 0252 on 10 September HVO raised the VAL to Watch and the ACC to Orange due to increased earthquake activity and changes in ground deformation that indicated magma moving toward the surface. At 1515 the summit eruption resumed in the E part of the caldera based on field reports and webcam images. Fissures opened on the crater floor and produced multiple minor lava fountains and flows (figure 533). The VAL and ACC were raised to Warning and Red, respectively. Gas-and-steam plumes rose from the fissures and drifted downwind. A line of eruptive vents stretched approximately 1.4 km from the E part of the crater into the E wall of the down dropped block by 1900. The lava fountains at the onset of the eruption had an estimated 50 m height, which later rose 20-25 m high. Lava erupted from fissures on the down dropped block and expanded W toward Halema’uma’u crater. Data from a laser rangefinder recorded about 2.5 m thick of new lava added to the W part of the crater. Sulfur dioxide emissions were elevated in the eruptive area during 1600-1500 on 10 September, measuring at least 100,000 t/d.
At 0810 on 11 September HVO lowered the VAL and ACC back to Watch and Orange due to the style of eruption and the fissure location had stabilized. The initial extremely high effusion rates had declined (but remained at high levels) and no infrastructure was threatened. An eruption plume, mainly comprised of sulfur dioxide and particulates, rose as high as 3 km altitude. Several lava fountains were active on the W side of the down dropped block during 11-15 September, while the easternmost vents on the down dropped block and the westernmost vents in the crater became inactive on 11 September (figure 534). The remaining vents spanned approximately 750 m and trended roughly E-W. The fed channelized lava effusions flowed N and W into Halema’uma’u. The E rim of the crater was buried by new lava flows; pahoehoe lava flows covered most of the crater floor except areas of higher elevation in the SW part of the crater. The W part of the crater filled about 5 m since the start of the eruption, according to data from a laser rangefinder during 11-12 September. Lava fountaining continued, rising as high as 15 m by the morning of 12 September. During the morning of 13 September active lava flows were moving on the N and E parts of the crater. The area N of the eruptive vents that had active lava on its surface became perched and was about 3 m higher than the surrounding ground surface. By the morning of 14 September active lava was flowing on the W part of the down dropped block and the NE parts of the crater. The distances of the active flows progressively decreased. Spatter had accumulated on the S (downwind) side of the vents, forming ramparts about 20 m high.
Vigorous spattering was restricted to the westernmost large spatter cone with fountains rising 10-15 m high. Minor spattering occurred within the cone to the E of the main cone, but HVO noted that the fountains remained mostly below the rim of the cone. Lava continued to effuse from these cones and likely from several others as well, traveled N and W, confined to the W part of the down-dropped block and the NE parts of Halema’uma’u. Numerous ooze-outs of lava were visible over other parts of the crater floor at night. Laser range-finder measurements taken of the W part of the crater during 14-15 September showed that lava filled the crater by 10 m since the start of the eruption. Sulfur dioxide emissions remained elevated after the onset of the eruption, ranging 20,000-190,000 t/d during the eruption activity, the highest of which occurred on 10 September.
Field crews observed the eruptive activity on 15 September; they reported a notable decrease or stop in activity at several vents. Webcam images showed little to no fountaining since 0700 on 16 September, though intermittent spattering continued from the westernmost large cone throughout the night of 15-16 September. Thermal images showed that lava continued to flow onto the crater floor. On 16 September HVO reported that the eruption stopped around 1200 and that there was no observable activity anywhere overnight or on the morning of 17 September. HVO field crews reported that active lava was no longer flowing onto Halema’uma’u crater floor and was restricted to a ponded area N of the vents on the down dropped block. They reported that spattering stopped around 1115 on 16 September. Nighttime webcam images showed some incandescence on the crater floor as lava continued to cool. Field observations supported by geophysical data showed that eruptive tremor in the summit region decreased over 15-16 September and returned to pre-eruption levels by 1700 on 16 September. Sulfur dioxide emissions were measured at a rate of 800 t/d on 16 September while the eruption was waning, and 200 t/d on 17 September, which were markedly lower compared to measurements taken the previous week of 20,000-190,000 t/d.
Geologic Background. Kilauea overlaps the E flank of the massive Mauna Loa shield volcano in the island of Hawaii. Eruptions are prominent in Polynesian legends; written documentation since 1820 records frequent summit and flank lava flow eruptions interspersed with periods of long-term lava lake activity at Halemaumau crater in the summit caldera until 1924. The 3 x 5 km caldera was formed in several stages about 1,500 years ago and during the 18th century; eruptions have also originated from the lengthy East and Southwest rift zones, which extend to the ocean in both directions. About 90% of the surface of the basaltic shield volcano is formed of lava flows less than about 1,100 years old; 70% of the surface is younger than 600 years. The long-term eruption from the East rift zone between 1983 and 2018 produced lava flows covering more than 100 km2, destroyed hundreds of houses, and added new coastline.
Information Contacts: Hawaiian Volcano Observatory (HVO), U.S. Geological Survey, PO Box 51, Hawai'i National Park, HI 96718, USA (URL: http://hvo.wr.usgs.gov/).
Tinakula (Solomon Islands) — December 2023 Cite this Report
Tinakula
Solomon Islands
10.386°S, 165.804°E; summit elev. 796 m
All times are local (unless otherwise noted)
Continued lava flows and thermal activity during June through November 2023
Tinakula is a remote 3.5 km-wide island in the Solomon Islands, located 640 km ESE of the capital, Honiara. The current eruption period began in December 2018 and has more recently been characterized by intermittent lava flows and thermal activity (BGVN 48:06). This report covers similar activity during June through November 2023 using satellite data.
During clear weather days (20 July, 23 September, 23 October, and 12 November), infrared satellite imagery showed lava flows that mainly affected the W side of the island and were sometimes accompanied by gas-and-steam emissions (figure 54). The flow appeared more intense during July and September compared to October and November. According to the MODVOLC thermal alerts, there were a total of eight anomalies detected on 19 and 21 July, 28 and 30 October, and 16 November. Infrared MODIS satellite data processed by MIROVA (Middle InfraRed Observation of Volcanic Activity) detected a small cluster of thermal activity occurring during late July, followed by two anomalies during August, two during September, five during October, and five during November (figure 55).
Geologic Background. The small 3.5-km-wide island of Tinakula is the exposed summit of a massive stratovolcano at the NW end of the Santa Cruz islands. It has a breached summit crater that extends from the summit to below sea level. Landslides enlarged this scarp in 1965, creating an embayment on the NW coast. The Mendana cone is located on the SE side. The dominantly andesitic volcano has frequently been observed in eruption since the era of Spanish exploration began in 1595. In about 1840, an explosive eruption apparently produced pyroclastic flows that swept all sides of the island, killing its inhabitants. Recorded eruptions have frequently originated from a cone constructed within the large breached crater. These have left the upper flanks and the steep apron of lava flows and volcaniclastic debris within the breach unvegetated.
Information Contacts: MIROVA (Middle InfraRed Observation of Volcanic Activity), a collaborative project between the Universities of Turin and Florence (Italy) supported by the Centre for Volcanic Risk of the Italian Civil Protection Department (URL: http://www.mirovaweb.it/); Hawai'i Institute of Geophysics and Planetology (HIGP) - MODVOLC Thermal Alerts System, School of Ocean and Earth Science and Technology (SOEST), Univ. of Hawai'i, 2525 Correa Road, Honolulu, HI 96822, USA (URL: http://modis.higp.hawaii.edu/); Copernicus Browser, Copernicus Data Space Ecosystem, European Space Agency (URL: https://dataspace.copernicus.eu/browser/).
Search Bulletin Archive by Publication Date
Select a month and year from the drop-downs and click "Show Issue" to have that issue displayed in this tab.
The default month and year is the latest issue available.
Bulletin of the Global Volcanism Network - Volume 36, Number 06 (June 2011)
Barren Island (India)
Evolving eruption emits tephra and continues in January 2011
Batur (Indonesia)
Thousands of dead fish floating in caldera lake during June 2011
Dieng Volcanic Complex (Indonesia)
Seismicity and dangerous gas emissions; 1,200 evacuate in May-June 2011
Erta Ale (Ethiopia)
Observers watch dynamic lava lake during November 2010
Fuego (Guatemala)
Frequent plumes and avalanches; occasional incandescence and lahars
Grimsvotn (Iceland)
Eruption of 21-28 May 2011; ash plumes affect parts of Europe's air space
Lokon-Empung (Indonesia)
July 2011 ash plumes spur 4,000 to 6,000 to evacuate
Manam (Papua New Guinea)
Eruptions ongoing from August 2010 to January 2011
Barren Island (India) — June 2011 Cite this Report
Barren Island
India
12.278°N, 93.858°E; summit elev. 354 m
All times are local (unless otherwise noted)
Evolving eruption emits tephra and continues in January 2011
Barren Island, a young and growing mafic island-arc volcano in the Andaman Sea (figure 16), produced its first historically recorded eruption in 1787; a series of eruptions followed in later years. Evidence of eruptions again became clear in May 2005 as a result observations by the Indian Coast Guard.
A recent report on Barren Island (BGVN 35:01) reported occasional ash plumes and decreasing thermal alerts through January 2010. In our last report on Barren Island (BGVN 36:03) we described some new details about this volcano, particularly during the years 2005-2009, as reported by Sheth and others (2009) and the Geological Survey of India (GSI, 2009). The current report discusses activity at the volcano during January 2010-April 2011, including observations made by GSI (2011) during a January 2011 field trip and thermal anomalies detected by satellite.
Ash plumes. During 2010 and through mid-2011, the Darwin Volcanic Ash Advisory Centre reported ash plumes from Barren Island. Figure 17 shows a plume rising from the volcano in a 25 September 2010 satellite image.
The Darwin VAAC documented other plumes, for example, on 3 January 2010 a pilot reported that a plume rose to an altitude of 1.5 km. On 11 January 2010 an ash plume visible through satellite imagery rose to an altitude of 1.5 km and drifted 45 km S. On 23 January 2010 a pilot observed an ash plume that rose to a reported altitude of 3 km, but it was not identified on satellite imagery.
New insights from GSI. GSI (2011) discussed a scientific expedition to Barren Island made during 2-8 January 2011. The eruption still continued, but with lesser intensity as compared to the violent eruption observed during 2005 to 2009. The eruption was of a pulsative and explosive character (Strombolian type) where dark columns of a dense ash-laden steam with coarser pyroclasts (cinders, juvenile lava blocks) were ejected at 2- to 8-minute intervals.
The eruption discharged from two vents on the parasitic crater. That crater had developed over a subsidiary cinder cone (~ 500 m high) on the S wall of the main cinder cone of the 1991-95 eruption. Coarser incandescent pyroclasts rose sub-vertically to 100-150 m in height and tumbled down the volcanic cone. A thick column of ash-laden gray vapor was ejected to heights of ~ 150-200 m and typically rose in a mushroom shaped ash cloud.
Figure 18 shows the lower portion of an ash plume.
Significant changes were observed in the shape and height of the cinder cone in the 2-km-diameter caldera. The height of the cinder cone increased from ~ 350 m in 2005 to ~ 500 m in 2011. The main approach to the center of the island follows a valley leads to the breached NW side of the caldera wall. The valley was covered totally by a thick pile of repetitive sequences of assorted pyroclasts and lava from recent eruptions. Near the base of the cinder cone, in the NW part of the island, the accumulated thickness of the products from recent eruptions was ~ 100 m. Besides the main pyroclast deposits from lava in the W part of the valley, considerable deposits had filled up the valley in the NNW part of the island, overflowing the caldera wall and covering the pre-historic lava. The recent lava flows reached the sea front attaining a width of ~ 250 m at the coast (figure 19).
This is the first report of the lava and pyroclasts of recent eruptions in the NNW part of the island. The main lava flow and pyroclastic deposits discharged from the NW part of the crater,carried towards the W and NNW part of the valley, giving rise to new land forms.
The lava and associated eruptive products of the 1991 and 1994-95 explosions, which were exposed earlier near the mouth of the valley and on the S side of the valley, were covered by the recent tephra The coarser pyroclasts are highly vesiculated basaltic rocks where plagioclase occurs as the dominant phenocryst set in a glassy matrix. The pile of pyroclasts formed very uneven. Maximum height of the accumulated material was ~20 m. Fusion of individual cinders, spatter, and blocks produced bigger blocks.
MODVOLC Thermal Alerts. MODVOLC satellite thermal measurement showed frequent alerts for the following periods: 17 September through 5 November 2010 (nearly daily alerts), 14 December 2010 through 10 January 2011, and 29 March through 11 April 2011 (daily alerts). Alerts were absent during 13 February through 17 September 2010.
Recent history of major ash eruptions. Awasthi and others (2010) measured 14C dates of inorganic carbon in sediment beds, and Sr and Nd isotopic ratios of seven discrete ash layers, in a marine sediment core collected from 32 km SE of the Barren volcano. The study revealed that the volcano had seven major ash eruptions, at ~70, 69, 61, 24, 19, 15, and 10 kiloyears (ka) before present. The ash layers erupted from 70 ka through 19 ka have highly uniform Nd isotopic composition; eruptions since ~15 ka have highly variable isotopic compositions. The authors found that during 10-24 ka, the volcano had large ash eruptions spaced at ~4.5 ka intervals (~10, ~15, 19, and 24 ka). Isotopically correlating the precaldera lavas and ash exposed on the volcano to the uppermost ash layer in the core, the authors inferred that the caldera was younger than the last ~10 ka ash layer found in the core. This represents the hypothesis that the caldera formed as a result of a single, simple, symmetric collapse after Barren Islands major ash eruptions.
References. Awasthi, N., Ray, J.S., Laskar, A.H., Kumar, A., Sudhakar, M., Bhutani, R., Sheth, H.C., and Yadava, M.G., 2010, Major ash eruptions of Barren Island volcano (Andaman Sea) during the past 72 kyr: clues from a sediment core record, Bulletin of Volcanology, v. 72, pp. 1131-1136.
Geological Survey of India, 2009, The Barren Island Volcano, Explosive Strombolian type eruption observed during January 2009, Jan 2009 URL: http://www.portal.gsi.gov.in/ gsiImages/information/ N_BarrenJan09Note.pdf)
Geological Survey of India, 2011, Barren Volcano in January 2011: An explosive pulsative eruption (Strombolian) still continues, Eastern Region Geological Survey of India URL: http://www.portal.gsi.gov.in/gsiDoc/pub/cs_barren-eruption.pdf)
Sheth, H.C. , Ray, J.S., Bhutani, R., Kumar, A., and Smitha, R. S., 2009, Volcanology and eruptive styles of Barren Island: an active mafic stratovolcano in the Andaman Sea, NE Indian Ocean, Bulletin of Volcanology, v. 71, pp. 1021-1039 (DOI: 10.1007/s00445-009-0280-z).
Siebert, L., Simkin, T., and Kimberly, P, 2010, Volcanoes of the World: Third Edition, University of California Press, Berkeley, 551 p.
Geologic Background. Barren Island, a possession of India in the Andaman Sea about 135 km NE of Port Blair in the Andaman Islands, is the only historically active volcano along the N-S volcanic arc extending between Sumatra and Burma (Myanmar). It is the emergent summit of a volcano that rises from a depth of about 2250 m. The small, uninhabited 3-km-wide island contains a roughly 2-km-wide caldera with walls 250-350 m high. The caldera, which is open to the sea on the west, was created during a major explosive eruption in the late Pleistocene that produced pyroclastic-flow and -surge deposits. Historical eruptions have changed the morphology of the pyroclastic cone in the center of the caldera, and lava flows that fill much of the caldera floor have reached the sea along the western coast.
Information Contacts: Geological Survey of India (GSI), GSI Complex, Bhu Bijnan Bhavan, Block: DK-6, Sector-II, Salt LakeKolkata-700091 West Bengal, India (URL: http://www.portal.gsi.gov.in/); Darwin Volcanic Ash Advisory Centre (VAAC), Bureau of Meteorology, Northern Territory Regional Office, PO Box 40050, Casuarina, NT 0811, Australia (URL: http://www.bom.gov.au/info/vaac/).
Batur
Indonesia
8.2403°S, 115.3775°E; summit elev. 1711 m
All times are local (unless otherwise noted)
Thousands of dead fish floating in caldera lake during June 2011
Batur stratovolcano sits at the E end of the island of Bali amid nested calderas (figure 4) and rises 686 m above the surface of an intra-caldera lake of the same name (Sutawidjaja, 2009). The entire complex remained non-eruptive through at least mid-2011 as it has for at least a decade (since a moderate eruption in 1974 and a series of smaller eruptions in the 1990s ceasing in about 2000). Local authorities reported that, following some variable seismicity during 2009-2010, starting 19 June 2011 residents smelled sulfurous gas and saw many dead fish floating on the lake's surface. The kill took place in the volcano's caldera lake but in the absence of visible eruptive activity and without anomalous geophysical perturbations.
Our previous report on Batur (BGVN 34:11) had noted increased seismicity from September to 7 November 2009. Since that report, the Center of Volcanology and Geological Hazard Mitigation (CVGHM) has reported that seismicity from Batur decreased from 1 June to 17 November 2010 and fumarolic plumes rose from the crater. On 19 November the Alert level was lowered to Normal, or 1.
Investigation of thousands of dead fish. CVGHM scientists visited Lake Batur (figure 5) to learn more about the incident. They learned that residents of lakeside villages first observed lake water discoloration and acrid (like sulfur) odors on the morning of 19 June 2011. A greenish-white discoloration first emerged in spots, but these spots soon connected and spread. The residents had seen a slick on the water surface spread from the E-central lake shore towards the S (from Toya Bungkah to Buahan, figure 6). In conjunction with these changes in color, thousands of dead fish were found at the surface of the lake (figure 7).
The translated report contained this important passage. "According to information from a resident (Made Yuni, age 59), the change in color of the lake water, consisting of patches of whitish green, is a yearly event, although [typically] small in scale and not causing the death of fish. The change in color of the lake water occurs during the change of seasons (i.e. the transition), between the wet and dry parts of the year when there is a stiff wind from the S. The incident of the lake water changing color and the death of the fish on 19 June 2011 occurred about two weeks into the dry season. The death of fish in Batur on the present scale happened before, in 1995."
Scientists conducted an examination during 21-22 June 2011. They also had pre-event temperature and pH for multiple sites on the lake going back at least several months. At the time of the visit, all residual odors had dispersed. Results of ambient gas measurements showed no traces of anomalous carbon monoxide, carbon dioxide, methane, or hydrogen sulfide. The lake temperature was found to be 15°C, which is considered normal. pH levels in the lake were found to be constant with other measurements taken in normal times as well. No increase in volcanic earthquakes were reported before or after the fish kill (the pattern of earthquakes was constant at typical background, 1 event/day). The colors seen were attributed to both warm water welling up (springs at Toya Bungkah) but also at places where such springs are absent.
On 20 June the water by the village of Seked returned to its normal color. Late in 21 June the water by the other villages involved returned to its normal color. Scientists found neither dead weeds or algae nor gas bubbles associated with the fish kill.
Scientists from CVGHM found no evidence to conclude the fish kill was volcanically triggered nor did they mention it portending eruptive activity. Rather, the scientists noted the comparatively high diurnal-temperature difference during the onset of the dry season. As a result of these temperature differences, the lake water developed currents, which carried mud from the lake bottom to the surface. This was thought to correspond to the observed odors ('muddy smells') and color changes on the lake surface. In a broad sense, the currents and mud were thought to upset the lake's ecological balance in a manner toxic to the fish.
Residents were advised to not consume dead fish from the incident, but fish that had survived were still considered fit for human consumption. Many inhabitants around Lake Batur are fisherman by trade and it is estimated that the fish kill resulted in losses up to billions of Rupiah (1 billion Rupiah currently equivalent to ~120,000 US Dollars). The water of Lake Batur is also irrigated into surrounding farms. There is no official documentation on whether or not the recent events at Lake Batur have affected the neighboring agriculture.
Reference. Sutawidjaja, I.S., 2009, Ignimbrite Analyses of Batur Caldera, Bali, based on 14C dating, Jurnal Geologi Indonesia, Vol. 4 No. 3, September 2009: 189-202 [http://www.bgl.esdm.go.id/dmdocuments/jurnal20090304.pdf].
Geologic Background. The historically active Batur is located at the center of two concentric calderas NW of Agung volcano. The outer 10 x 13.5 km caldera was formed during eruption of the Bali (or Ubud) Ignimbrite about 29,300 years ago and now contains a caldera lake on its SE side, opposite the Gunung Abang cone, the topographic high of the complex. The inner 6.4 x 9.4 km caldera was formed about 20,150 years ago during eruption of the Gunungkawi Ignimbrite. The SE wall of the inner caldera lies beneath Lake Batur; Batur cone has been constructed within the inner caldera to a height above the outer caldera rim. The Batur stratovolcano has produced vents over much of the inner caldera, but a NE-SW fissure system has localized the Batur I, II, and III craters along the summit ridge. Recorded eruptions have been characterized by mild-to-moderate explosive activity sometimes accompanied by lava emission. Basaltic lava flows from both summit and flank vents have reached the caldera floor and the shores of Lake Batur in historical time.
Information Contacts: Center of Volcanology and Geological Hazard Mitigation (CVGHM), Jalan Diponegoro 57, Bandung 40122, Indonesia (URL: http://www.vsi.esdm.go.id/); Bali Discovery Tours, Komplek Pertokoan Sanur Raya No. 27 Jl. By Pass Ngurah Rai,Sanur, Bali, Indonesia (URL: http://www.balidiscovery.com)
Dieng Volcanic Complex (Indonesia) — June 2011 Cite this Report
Dieng Volcanic Complex
Indonesia
7.2°S, 109.879°E; summit elev. 2565 m
All times are local (unless otherwise noted)
Seismicity and dangerous gas emissions; 1,200 evacuate in May-June 2011
This report on Dieng volcanic complex (figure 2) notes both toxic gas emissions and episodes of high seismicity during 1 October 2009-July 2011. A late May 2011 visit, after increased gas emissions were noted the previous week, revealed dead birds and damaged vegetation at Timbang crater. Gas measurements at several sites confirmed the presence of hazardous gases; however, there were no human fatalities or injuries noted. According to news reports, 1,200 people were evacuated. Our previous report on Dieng discussed a phreatic eruption on 26 September 2009, preceded by a series of volcanic earthquakes (BGVN 34:08).
During January 2010, landslides took place near Dieng, followed by others at distance. One landslide crossed the highway between Dieng and Wonosobo (the regional capital, 18 km S of Dieng). The second landslide struck a village called Wonoaji, and according to a Jakarta Post article (by Suherdjoko, 21 January 2010), "Two people [there] have died and three are still missing, while five others were injured. . . ."
Although little was reported regarding Dieng during October 2009-2010, Relief Web posted a graphic describing heavy rains and regional flooding during February 2010 in the portion of Central Java hundreds of kilometers E of Dieng near Bandung. This episode triggered a landslide in Ciwidey village taking 17 lives.
The latest reported activity at Dieng began in mid-2011. According to the Center of Volcanology and Geological Hazard Mitigation (CVGHM), seismicity at Dieng increased during 18-22 May 2011. On 22 May, diffuse white plumes rose from the Timbang cone; plumes from the cone had not been previously observed. The next day carbon dioxide (CO2) emissions increased. On 23 May, CVGHM raised the Alert Level to 2 (on a scale of 1-4).
CVGHM reported that on 29 May 2011, gas plumes rose 50 m above Timbang cone. The gas plumes drifted S through the valley. Observers who visited the cone noted the previously mentioned damaged vegetation and dead birds. Seismicity and CO2 emissions remained elevated, thus prompting CVGHM to raise the Alert Level to 3.
During 4-5 June white plumes from Sileri crater rose 20-60 m and white plumes from Timbang rose only 2 m and drifted 300 m S. Seismicity and carbon dioxide remained high through 5 June
According to CVGHM, carbon-dioxide emissions from Timbang declined during 31 May-10 June, while seismicity decreased during 5-7 June and was not detected during 8-10 June. White plumes were not observed. On 10 June the Alert Level was lowered to 2.
Stated gas concentrations. In early June, low levels of hydrogen sulfide (H2S, 0.002-0.05% by volume) were recorded at Sikendang, Sikidang, Sibanteng, and Sileri craters. Carbon monoxide gas (CO) was only detected along the steam vents of Sikendang crater, at a concentration of 0.004% by volume. CO2 was measured at a concentration of 5.0% by volume. On 5 June, the CO2 from Timbang was at its highest level at, 1.54% by volume. The scientists added that weather patterns had brought low atmospheric pressure, which had enhanced gas escape at the vent.
John Seach presents modest-resolution photos from 2010 showing the Sikidang vent mentioned above, and Telega Warna crater lake (see Information Contacts).
Figure 3 shows one approach to communicating gas-hazards warnings.
Dieng plateau. In the modern record, Dieng has a history of lethal gas emissions, phreatic explosions, and other hazards. The complex contains rocks ranging from andesite to rhyodacite, extrusives filling and sitting upon a large older (Pleistocene) caldera. It contains several stratovolcanoes, and many cones, craters, domes, and thermal features (see subsections below).
Van Bergen and others (2000) described the plateau and associated volcanic complex, portions of which follow.
"The Dieng Volcanic Complex in Central Java is situated on a highland plateau at about 2000 m above sea level, approximately 25 km N of the city of Wonosobo. It belongs to a series of Quaternary volcanoes, which includes the historically active Sumbing and Sundoro volcanoes. The plateau is a rich agricultural area for potatoes, cabbages, tomatoes and other vegetables. There are numerous surface manifestations of hydrothermal activity, including lakes, fumaroles/solfatara and hotsprings. The area is also known for the development of geothermal resources and lethal outbursts of gas. Scattered temples are the witnesses of the ancient Hindu culture that once reigned.
"In terms of chemical composition, Telaga Warna is the most interesting crater lake in the Dieng area. The original shape of the crater has been modified by a lava flow. The water occupies less than 1 km2. Gas bubbles can be seen rising to the lake surface, and the air has a sulfurous odor. Its colorful appearance (warna stands for color(s) in Indonesian) makes the lake an interesting tourist attraction. The water has a pH of about 3, which may fluctuate depending on seasonal variations. Sulfate and chloride contents are moderately high. . . . Strong emissions of CO2-rich gas on-shore have occasionally killed animals, so that a path on the N side used to be closed to avoid risks for local villagers."
The same report presents some composition data from 1994. Some of the 'dry' gas from several vents in the complex were up to 90% CO2.
Geothermal energy. According to Geo Dip Energi, the Dieng #1 project is currently in operation and producing 60 MegaWatts (MW) of energy. Two more projects, each of 60 MW are underway. The Dieng area is thought to have more potential and could produce 300 MW.
Reference. Van Bergen, M., Bernard, A., Sumarti, S., Sriwana, T., and Sitorus, K., 2000. Crater Lakes of Java: Dieng, Kelud, and Ijen. Excursion Guidebook, IAVCEI General Assembly, Bali 2000, 9 pp. URL: http://www.ulb.ac.be/sciences/cvl/DKIPART1.pdf).
Geologic Background. The Dieng plateau in the highlands of central Java is renowned both for the variety of its volcanic scenery and as a sacred area housing Java's oldest Hindu temples, dating back to the 9th century CE. The Dieng Volcanic Complex consists of multiple stratovolcanoes and more than 20 small Pleistocene-to-Holocene craters and cones over a 6 x 14 km area. Prahu stratovolcano was truncated by a large Pleistocene caldera, which was subsequently filled by a series of cones, lava domes, and craters, many containing lakes. Lava flows cover much of the plateau, but observed activity has been restricted to minor phreatic eruptions. Gas emissions are a hazard at several craters and have caused fatalities. There are abundant thermal features and high heat flow across the area.
Information Contacts: Center of Volcanology and Geological Hazard Mitigation (CVGHM), Jalan Diponegoro 57, Bandung 40122, Indonesia (URL: http://vsi.esdm.go.id/); Geo Dipa Energi, Recapital Building 8th Floor, Jl. Aditiawarman Kav. 55 Jakarta Selatan 12160 Indonesia (URL: http://www.geodipa.co.id); John Seach, Volcano Live (URL: http://volcanolive.com); Xinhua News (URL: http://www.xinhuanet.com/english2010/); Jakarta Globe (URL: http://www.thejakartaglobe.com/home/).
Erta Ale
Ethiopia
13.601°N, 40.666°E; summit elev. 585 m
All times are local (unless otherwise noted)
Observers watch dynamic lava lake during November 2010
Erta Ale contains two lava lakes within its caldera. During the last three years, several expeditions have visited the volcano to examine changes (BGVN 33:06, 34:07, and 35:01). This report synthesizes the reports of two teams that visited Erta Ale during November 2010. Both teams noted that the lava lake within the southern crater has risen, nearly filling the entire crater and overflowing onto the caldera floor.
Southern Crater activity. Afar Rift Consortium (ARC) scientists visited Erta Ale during 21-23 November 2010 (figures 28 and 29). Tom Pfeiffer (Volcano Discovery) and Micheal Dalton-Smith visited Erta Ale during 25-28 November 2010. The lava lake had risen above previously formed terraces (see BGVN 35:01 for information on terraces). Both teams noted that the lava lake had risen ~40 m, nearly filling the S crater and breaching its W rim, spilling lava flows onto the larger caldera floor. The still-hot overflows traveled distances of 50-100 m on the caldera floor, and one recent long flow (estimated to be from November 24th given its temperature) had almost reached the W caldera walls.
The ARC team noted Strombolian activity from the lava lake in the southern pit crater (figure 30).Throughout their visit, the ARC team saw extensive amounts of Pele's Hair and clouds rich in hydrogen-sulfide gas. Fountaining was reported by Pfeiffer to reach heights of 30-70 m. Degassing fountains kept the whole lava-lake surface violently boiling for a large portion of the latter team's visit.
The still-active lake was circular, ~40 m in diameter (about half to two-thirds its size in 2008 and 2009). The lava lake was reported to be encompassed by a bounding ring of chilled material that was ~ 4 m high on the S side. The morphology of the ring wall constantly changed as more lava overflowed, with parts collapsing and rebuilding.
From the night of the 22 November 2010 until the ARC team left on 23 November, the team observed a periodic rise and decline of the lava lake level.
According to Pfeiffer the lava level rose and fell by about 2-4 m about every 30 minutes. During the 25-28 November observations intense eruptive phases were observed. Lava overflowed about 12 times and fed new flows that topped older flows. During 25-28 November, the overall average level of the lake's surface rose an estimated 3-5 m.
Northern Crater activity. The ARC noted that during 21-23 November the northern crater pit was relatively quiet. They observed a small amount of incandescence during the night of 21 November (figure 31). During the day, they noted a new cone about 1 m high and lava flows of limited extent.
According to the Volcano Discovery team, the deeper N crater had not changed much since their previous visit in February 2008 (BGVN 33:06). During their 2010 visit they saw a 7-10 m high hornito, in the N crater's center, with a glowing vent that sometimes spattered lava. According to Dalton-Smith, flaming gas was seen during the day and on 25 November, an extremely bright glow was seen at night. Upon the team's arrival at the volcano, a large fresh flow had recently surged from the hornito and covered most of the N crater floor.
Location and tectonics. Erta Ale is located in the Afar rift, a region that shows signs of undergoing a continent to ocean transition. The Afar rift is located between the Nubian and the Somalian plates. There is reason to believe that the mantle below the Afar rift region has an above average temperature (Bastow and Keir, 2011). The Afar Rift Consortium also noted that recent fissure eruptions occurred on Erta Ale's N flank.
References. Field, L, and Keir, D. 2010, Observations from the Erta Ale eruption 21st Nov-23rd Nov 2010. Afar Rift Consortium (ARC) (URL: http://www.see.leeds.ac.uk/afar/new-afar/home-page-assets/Observations_from_Erta_Ale.pdf). Additional information about the work of the ARC can be found at URL: http://www.see.leeds.ac.uk/afar/.
Fulle, M, 2011, Stromboli Online (URL: http://www.swisseduc.ch/stromboli/perm/erta/lake-2011-en.html).
Bastow, ID, and Keir, D, 2011, The protracted development of the continent-ocean transition in Afar, Letters, Nature Geoscience, DOI: 10.1038/NGEO1095 published online on March 11, 2011.
Keir, D, Pagli, C, Bastow, ID, Ayele, A., 2011, The magma-assisted removal of Arabia in Afar: Evidence from dike injection in the Ethiopian rift captured using InSAR and seismicity, Tectonics, v. 30, TC2008, DOI: 10.1029/2010TC002785, published 22 March 2011.
Geologic Background. The Erta Ale basaltic shield volcano in Ethiopia has a 50-km-wide edifice that rises more than 600 m from below sea level in the Danakil depression. The volcano includes a 0.7 x 1.6 km summit crater hosting steep-sided pit craters. Another larger 1.8 x 3.1 km wide depression elongated parallel to the trend of the Erta Ale range is located SE of the summit and is bounded by curvilinear fault scarps on the SE side. Basaltic lava flows from these fissures have poured into the caldera and locally overflowed its rim. The summit caldera usually also holds at least one long-term lava lake that has been active since at least 1967, and possibly since 1906. Recent fissure eruptions have occurred on the N flank.
Information Contacts: Afar Rift Consortium (URL: http://www.see.leeds.ac.uk/afar/); Tom Pfeiffer, Volcano Discovery (URL: http://www.VolcanoDiscovery.com/); Michael-Dalton-Smith, Digital Crossing Productions (URL: http://www.digitalcrossing.ca/); Marco Fulle, Osservatorio Astronomico, Trieste, Italy (URL: http://www.ts.astro.it/) and atStromboli Online (URL: http://www.swisseduc.ch/stromboli/perm/erta/lake-2011-en.html).
Fuego
Guatemala
14.4748°N, 90.8806°W; summit elev. 3799 m
All times are local (unless otherwise noted)
Frequent plumes and avalanches; occasional incandescence and lahars
As previously noted, minor plumes, occasional avalanches, and lahars were reported at Fuego during January 2008-January 2010 (BGVN 34:12). Explosive activity occurred with a similar style from 2002 through December 2010, although the report heights of ash plumes was seldom over 1 km during February to December 2010. As is typical, the bulk of the reporting on Fuego comes from INSIVUMEH (the Instituto Nacional de Sismologia, Vulcanología, Meteorología e Hidrologia) and collaborating agencies. The tallest plumes of this interval reached 1.2 km (on 23 December 2010).
This report first presents the February to December 2010 summary, followed by a May 2011 photo. In the next subsection we skip back in time to discuss observations from a visit to Fuego in February 2009. In the final subsection, we note some 2010-2011 studies made at Fuego.
The February to December 2010 information in this report was initially synthesized and edited by Dan Eungard, as part of a graduate student writing assignment in a volcanology class at Oregon State University under the guidance of professor Shan de Silva.
February through December 2010 activity. According to INSIVUMEH, typical activity during February through December 2010 included degassing plumes that rose above the crater punctuated by occasional Strombolian and Vulcanian explosions that produced small ash plumes. These plumes would occasionally rise to 1.2 km above the summit and become large enough for ash to reach local communities, including Alotenángo (8 km ENE), Ciudad Vieja (13.5 km NE), San Miguel Dueñas (10 km NE), Antigua Guatemala (18 km NE), Sangre de Cristo (9.5 km WSW), Yepocapa (9 km WNW), Morelia (11.5 km SW), and Panimache (9 km SW). Major ashfall events occurred on 2-4 March, 10 June, 19 July, 27 August, 13 and 21 September, 28 October, and 22 November 2010 (table 7). Explosions would occasionally generate shockwaves that rattled windows of structures within 15 km of the summit.
Table 7. Summary of activity reported at Fuego during February to December 2010. "--" indicates no reported data. Terms for explosion frequency: Few signifies undisclosed or under 5; Multiple, 5-20; Many, over 20. Information courtesy of INSIVUMEH and Washington Volcanic Ash Advisory Center (VAAC).
| Date |
Explosions |
Ash plume height (m) |
Drift |
Incandescence (m) |
Avalanches |
| 08 Oct 2010 |
Multiple |
600-800 |
S |
100 |
-- |
| 11 Oct 2010 |
Many |
500-800 |
S-SW |
-- |
-- |
| 14 Oct 2010 |
Many |
1000 |
SW |
125 |
x |
| 18 Oct 2010 |
Multiple |
800 |
12 km W-S |
100 |
x |
| 22 Oct 2010 |
Multiple |
500-700 |
SW |
weak |
x |
| 26 Oct 2010 |
Many |
500 |
N-NW |
75 |
x |
| 28 Oct 2010 |
Multiple |
400-600 |
W-NE |
75 |
x |
| 29 Oct 2010 |
Multiple |
300-500 |
W-SW |
75 |
x |
| 31 Oct 2010 |
Few |
-- |
20 km W |
-- |
-- |
| 05 Nov 2010 |
Few |
900 |
E |
-- |
-- |
| 08 Nov 2010 |
Few |
900 |
12 km E |
100 |
x |
| 12 Nov 2010 |
Few |
800 |
S-SW |
weak |
x |
| 13 Nov 2010 |
Few |
-- |
37 km SW |
-- |
-- |
| 19 Nov 2010 |
Few |
1000 |
10 km W |
100 |
x |
| 22 Nov 2010 |
Many |
900-1000 |
15 km SW |
-- |
-- |
| 25 Nov 2010 |
Few |
300 |
W-NW |
-- |
-- |
| 04 Dec 2010 |
Few |
-- |
SW |
-- |
-- |
| 06 Dec 2010 |
Few |
900 |
6 km SW |
-- |
-- |
| 08 Dec 2010 |
Few |
500 |
S-SW |
-- |
x |
| 10 Dec 2010 |
Few |
-- |
SW |
-- |
-- |
| 17 Dec 2010 |
Few |
300-800 |
E-SE |
-- |
-- |
| 20 Dec 2010 |
Few |
500 |
W-NW |
-- |
-- |
| 22 Dec 2010 |
Few |
-- |
28 km NW |
-- |
-- |
| 23 Dec 2010 |
Many |
600-1200 |
10-15 km SE |
-- |
-- |
| 24 Dec 2010 |
Multiple |
400 |
N |
-- |
-- |
| 28 Dec 2010 |
Few |
500 |
5 km S-SW |
weak |
x |
| 30 Dec 2010 |
Many |
600-800 |
8 km W-SW |
-- |
x |
Antigua Guatemala, a major tourist location with a local population of ~40,000, has occasionally experienced ashfall from Fuego and Pacaya volcanoes (Pacaya is ~30 km ESE of Fuego). Ashfall was heavy enough to damage infrastructure and collapse roofs in the town of Yepocapa during the 1971 and 1974 eruptions of Fuego. Tephra thicknesses of 300 mm with 50 mm bombs were recorded in the area of Yepocapa during the 1971 eruption, causing 20% of the roofs to collapse "including those of many public buildings" (Bonis and Salazar, 1973). From several case studies, including Fuego, Stromboli, and Deception Island, R.J. Blong (1984) suggests a 100 mm threshold for tephra thickness on roofs. Greater thickness may mean serious structural damage, especially if rainfall accompanies or follows the tephra load.
INSIVUMEH issued civil-aviation alerts several times throughout 2010 due to large ash outputs from Fuego. Washington VAAC released advisories for ash plumes including those that occurred on 31 October; 12-13 November; and 4, 10, and 22 December. Over the course of the year, plume height averaged 530 m above the summit. The plumes drifted laterally up to 37 km from the summit and frequently drifted W, SW, S, and NW.
During the year, local reports and INSIVUMEH observations noted block avalanches within the crater and on the slopes; occasionally they were large enough to reach vegetation. Incandescent pulses were fairly common during Strombolian eruptions and juvenile material reached heights up to 125 m.
Lahars were reported on 20 and 30 April, 29 May, 16 June, 21 September, and 2 October 2010. Flooding from tropical storm Agatha triggered destructive landslides and lahars on 29 May 2010. Rivers affected included the Seca (SW), Taniluya (SW), Pantaleon (W), Ceniza (SW), Las Lajitas (SE), and El Jute (SE, see figure 14) BBC News reported that in Guatemala alone, at least 83 fatalities occurred during the storm and ~112,000 people were displaced countrywide. The lahar on 16 June reportedly caused minor road damage.
February 2009 photos of a minor eruption. During a field campaign, R. Escobar-Wolf visited Fuego and witnessed explosions that emitted a large number of ballistic blocks (not discussed on table 7). On 6 February he photographed the development of a small ash plume as well as a cloud of remobilized ash that rose from the summit area. Figure 15A was taken seconds after the central plume erupted from the summit. Figure 15B shows continued rise of the plume as well as the onset of remobilized ash from the flanks. Figure 15C is a close-up of the central ravine where, after the impact of the ballistic blocks, trails of material fell from the summit.
Escobar-Wolf described this sequence of events as a Vulcanian eruption. The eruption was impulsive and released a central plume that reached ~ 1.5 km above the crater (figure 15B). Around the time of this photo, ballistics appeared to impact the summit and thousands of pale ash clouds rose from the summit's surface. These clouds appeared to spread widely down and along the slope, whereas rising portions dispersed (figure 15C).
Recent publications. Characterization of Fuego's activity and the development of new monitoring techniques have been ongoing for several decades. Three manuscripts were recently published focusing on seismic and gas studies.
Erdem (2010) conducted a geophysical study at Fuego from March to July 2008 using a three-component broadband seismometer and two infrasonic microphones. In order to model temporal changes in eruption dynamics, coda wave interferometry methods were used to analyze a set of highly repetitive seismic events associated with regular discrete degassing explosions. The author found rapid temporal variation in the velocity structure, which may indicate minor fluctuations in volatile content or exsolution at various depths between individual explosions. Variations in seismic and acoustic wave arrival times were used to investigate changes in explosion source depth and wind speed.
Lyons and others (2010) found a cyclic pattern in open-vent eruptive behavior at Fuego based on two years of continuous observations from the Fuego Volcano Observatory made possible by a collaboration between the Peace Corps, Guatemalan scientists, and Michigan Technological University. They found that daily observations of lava flow length and explosion characteristics have a strong correlation with satellite-based remote sensing data and tremor amplitude. The pattern of behavior is interpreted to reflect the slow accumulation and periodic gas release in a foam layer trapped in a relatively deep magma chamber or geometric trap in the conduit. This study highlights the importance of detailed geophysical and field observations as a low-cost option in developing countries, as well as in volcanological training.
Nadeau and others (2011) discuss remote sensing of SO2 emissions using a UV camera. Their analysis of 2009 Fuego data sets assessed SO2 emissions from two closely-spaced vents, compared with both visual observations and seismicity. They concluded that tremor and degassing share a common source process, and they developed a model for small, ash-rich explosions based on evidence for rheological stiffening of magma in the upper conduit. Progressive stiffening may explain why, in time-series data, there is a general increase in time lag between tremor and SO2 escape. This lag may be attributed to a deepening or a reduction in velocity of the gas rise from depth if crystallization and cooling propagates downward through time from the top of the magma column. Different degrees of stiffening and the associated range of confining pressures may cause variability in both degrees of explosivity and durations of inter-explosion quiescent periods.
References. Blong, R. J. 1984. Volcanic hazards: a sourcebook on the effects of eruptions. Sydney; Orlando, Fla., Academic Press.
Bonis, S. and Salazar, O. 1973, The 1971 and 1973 eruptions of volcano Fuego, Guatemala, and some socio-economic considerations for the volcanologist, Bulletin Volcanologique, 31 (1), 394-400.
Erdem, J. 2010, Modeling temporal changes in eruptive behavior using coda wave interferometry and seismo-acoustic observations at Fuego Volcano, Guatemala. Michigan Technological University, United States: 2010. GeoRef, EBSCOhost (accessed 19 April 2011).
Lyons, J. J., Waite, G.P., Rose, W., and Chigna, G., 2010. Patterns in open vent, strombolian behavior at Fuego volcano, Guatemala, 2005-2007. Bulletin of Volcanology 72(1): 1-15.
Nadeau, P.A., Palma, J.L., and Waite, G.P., 2011. Linking volcanic tremor, degassing, and eruption dynamics via SO2 imaging. Geophys. Res. Lett., 38: 1-5.
Geologic Background. Volcán Fuego, one of Central America's most active volcanoes, is also one of three large stratovolcanoes overlooking Guatemala's former capital, Antigua. The scarp of an older edifice, Meseta, lies between Fuego and Acatenango to the north. Construction of Meseta dates back to about 230,000 years and continued until the late Pleistocene or early Holocene. Collapse of Meseta may have produced the massive Escuintla debris-avalanche deposit, which extends about 50 km onto the Pacific coastal plain. Growth of the modern Fuego volcano followed, continuing the southward migration of volcanism that began at the mostly andesitic Acatenango. Eruptions at Fuego have become more mafic with time, and most historical activity has produced basaltic rocks. Frequent vigorous eruptions have been recorded since the onset of the Spanish era in 1524, and have produced major ashfalls, along with occasional pyroclastic flows and lava flows.
Information Contacts: Instituto Nacional de Sismologia, Vulcanología, Meteorología e Hidrologia (INSIVUMEH, Ministero de Communicaciones, Transporto, Obras Públicas y Vivienda, 7a. Av. 14-57, zona 13, Guatemala City 01013, Guatemala (URL: http://www.insivumeh.gob.gt/inicio.html); Washington Volcanic Ash Advisory Center (VAAC), NOAA Science Center Room 401, 5200 Auth road, Camp Springs, MD 20746, USA (URL: http://www.ospo.noaa.gov/Products/atmosphere/vaac/); Jemile Erdem, Rüdiger Escobar-Wolf, John Lyons, and Patricia Nadeau, Michigan Technological University, Department of Geological and Mining Engineering and Science, Houghton, MI, USA (URL: http://www.geo.mtu.edu/rs4hazards/index.htm); BBC News (URL: http://www.bbc.co.uk/); Wolfram Alfa Web Resource (URL: http://www.wolframalpha.com/).
Grimsvotn
Iceland
64.416°N, 17.316°W; summit elev. 1719 m
All times are local (unless otherwise noted)
Eruption of 21-28 May 2011; ash plumes affect parts of Europe's air space
Grímsvötn, a subglacial volcano, is located 140 km NE of Eyjafjallajökull volcano (figure 11), within the western region of Vatnajökull glacier, Europe's largest glacier. On 21 May 2011, Grímsvötn erupted and produced ash plumes that drifted toward western Norway, Denmark, and other parts of northern Europe and disrupted flights. This was Grímsvötn's first eruption since 2004, when it sent ash as far as Finland (BGVN 29:10). The eruption continued during 21-28 May 2011.
According to scientists from the Institute of Earth Sciences at the University of Iceland (IES) and the Icelandic Meteorological Office (IMO), a GPS-station on the rim of the Grímsvötn caldera recorded continuous inflation of several centimeters per year since the 2004 eruption, interpreted as inflow of magma to a shallow chamber. Other precursors over the previous few months included increased seismicity, bursts of tremor, and increased geothermal activity. The eruption was preceded by about an hour of tremor.
The eruption began during the late afternoon of 21 May 2011. According to IMO, the plume was monitored by two weather radars, one located at Keflavík International Airport more than 220 km from the volcano, and a mobile radar ~80 km from the volcano. B early evening on the 21st, the eruption plume rose to over 20 km in altitude. The plume altitude fell to 15 km during the night, although several times it reached 20 km. Ash from the lower part of the eruption plume drifted S and, at higher altitudes, drifted E. A few hours after the eruption began, ashfall covered an area S of the Vatnajökull ice cap, more than 50 km from the eruption site.
According to the Iceland Review, the State Road Authority closed the ring road in the area of the Skeidarársandur flood plain (located S of Grímsvötn) on 21 May. The road remained closed through 24 May due to the threat of eruption-triggered outwash along Iceland's SE coast. The ring road (Iceland Highway 1) follows the Iceland coastline, providing a connection for major towns.
During the morning of 22 May, the plume rose to an altitude of 10-15 km. The plume was brown-to-grayish, changing at times to black near the source. Most of the ash drifted S, but lower parts traveled SW affecting nearby farmers and their livestock (figure 12). Tephra fall was concentrated to the S and to a lesser extent N and E. Earthquake data as well as limited observations recorded during an initial overflight placed the vent location in the SW part Grímsvötn's caldera, the same site as the 2004 eruption (BGVN 29:10).
A set of photographs taken in the morning on 22 May by Ragnar Th. Sigurdsson shows the plume's N side with a well-defined E boundary and diffusion beginning high up on the W (figure 13). In an interview for Time: LightBox Sigurdsson explained: "When you have an eruption so big, you [get] a mushroom cloud like a nuclear bomb. The photos I shot are at the bottom of the mushroom—30 km wide and 15 km high. It was huge." Sigurdsson used wide-angle and telephoto lenses for this aerial photography and had to perch in the doorway of the plane to take these photos (Wallace, 2011).
On 22 May 2011, in the afternoon, lightning strikes ranged from 60-70 per hour (up to 300 during one hour) and were most frequent in portions of the ash plume dispersed S of the vent (figure 14). News sources noted that the Keflavík airport closed. Ash fell to the vent's SW, including the Reykjavík area and to the vent's N on the Tröllaskagi Peninsula.
During 22-23 May, the ash plume rose to an altitude of 5-10 km and drifted S at lower altitudes, and W at altitudes 8 km and higher. Ashfall was detected in several areas throughout Iceland, except in some areas to the NW. On 24 May the ash plume was estimated to be mostly below 5 km because meteorological clouds over the glacier were at 5-7 km altitude and the plume only briefly rose above the cloud deck. Satellite images showed the plume extending more than 800 km from the eruption site towards the S and SE.
Sigurdur Stefnisson, traveling by road on 23 May, took a picture of his car's air filter which had clogged with dark ash after only six hours of use (figure 15). He noted that "A stock of new air filters is a must during an eruption. You can always shake them out every few miles."
According to the IES and IMO, during the evening of 24 May, explosive activity occurred in Grímsvötn's main crater. (Eruptions along fissures outside of the main crater occurred during the last 200 years in ~7 out of the 20 recorded eruptions (Óladóttir and others, 2011).) Venting came from four tephra cones surrounded by meltwater. Regular bursts of ash plumes rose a few kilometers above the cones, producing only local fallout. Seismic tremor decreased.
Aviation issues. The London Volcanic Ash Advisory Centre (VAAC; also known as the Met Office) issued an ash plume advisory on 24 May, updated 26 May, that identified the location of heavy atmospheric ash and warned pilots to plan accordingly.
The graphic associated with that advisory appears as figure 16, presented here as a representative sample of the modeled ash plume at that time. According an Associated Press on 26 May, the European air traffic agency Eurocontrol, about 900 flights out of a total of 90,000 planned flights in Europe were cancelled between 23-25 May. The Associated Press also reported on 23 May that the extensive ash hazard forced U.S. President Barack Obama to shorten a visit to Ireland. The eruption forced cancellations of flights in Scotland, northern England, Germany and parts of Scandinavia. Iceland's main international airport at Keflavík closed for 36 hours.
Since the costly disruptions in air traffic during the 2010 eruption at Eyjafjallajökull, aviation regulatory authorities took steps to assess current methods of volcanic ash detection, dispersion models, and air traffic management. According to the Executive Summary of Zehner (2010), the impact of the new guidelines for aviation introduced in Europe shifted from "zero tolerance to new ash threshold values [2 mg/m3 concentrations]"; this shift was the center of previous discussions in numerous scientific conferences and workshops worldwide. A sampling of those meetings was summarized in the BGVN 36:04 Eyjafjallajökull report.
During the 2011 Grímsvötn eruption, the London VAAC presented graphics with ash concentrations. (Prior to 21 April 2010, VAACs were not required to report this information (Zehner, 2010)). Within the London VAAC region, no-fly-zones were determined by atmospheric ash concentrations of 2 mg/m3 or greater. The International Volcanic Ash Task Force (IVATF), convened by the International Civil Aviation Organization (ICAO) in 2010, held a workshop in July 2011 to discuss the regulations regarding ash concentrations, but application of a single threshold value for all nine VAAC jurisdictions remained in review.
"The imposition of a limit implies that the dispersion model is capable of providing a contour showing ash concentrations and in particular that a level of 2 mg/m3 can be delineated. In order to be able to do this, accurate information on the volcanic source (e.g. the mass flux, vertical distribution of mass, the column height and the particle size distribution) is needed. Generally this kind of information is not readily available even at the most advanced and well-instrumented volcano observatories (Zehner, 2010)."
Later observations (25-30 May 2011). On 25 May IMO field investigators visited Grímsvötn and found ash plumes had ceased although steam bursts continued from the crater (figure 17). In addition, tremor was greatly reduced, and ground deformation was minor. Observers noted ash thicknesses varying from 10 to 130 cm in the vicinity of the eruption site (figure 18). Pilots reported widespread airborne ash 5-7 km W of the volcano and also some ash haze below 3 km altitude to the SW.
On 26 May minor steam explosions continued from the crater. According to news articles, air traffic disruption decreased in parts of Norway and Sweden. In the IESIMO 26 May collective status report, IMO reported that long-term conductivity measurements of the Gígjukvísl river suggested that meltwater was draining freely from Grímsvötn. Monitoring had been continuous since a jökulhlaup (a catastrophic glacier-outburst flood) occurred 31 October 2010. Located 50 km upstream from the glacial edge, Grímsvötn's subglacial lake has overflowed periodically over the past 100 years.
On 28 May tremor rapidly decreased then disappeared, and on 30 May participants on the Iceland Glaciological Society's spring expedition confirmed that the eruption had ended. Satellite imagery and visual observations showed that only small amounts of ice melted during the eruption; no signs of flooding were detected.
References. International Federation of Air Line Pilots' Associations (IFALPA), 2011, Disruption from the eruption of the Grímsvötn volcano: IFALPA Safety Bulletin 12SAB03, 24 May 2011.
Lockwood, J.P., and Hazlett, R.W., 2010, Volcanoes : Global Perspectives: Hoboken, NJ, Wiley-Blackwell, ix, p.539.
Maria, A., Carey, S., Sigurdsson, H., Kincaid, C., and Helgadóttir, G., 2000, Source and dispersal of jökulhlaup sediments discharged to the sea following the 1996 Vatnajökull eruption, GSA Bulletin; v. 112; no. 10; p. 1507–1521.
Óladóttir, B.A., Larsen, G., and Sigmarsson, O., 2011, Holocene volcanic activity at Grímsvötn, Bárdarbunga and Kverkfjöll subglacial centres beneath Vatnajökull, Iceland, Bulletin of Volcanology, 73, 1-22. DOI: 10.1007/s00445-011-0461-4
Wallace, V., 2011, High Above the Glacier, TIME: LightBox, 26 May 2011 (URL: http://lightbox.time.com/2011/05/26/high-above-the-glacier/#6 ).
Zehner, C., Ed. 2010. Monitoring Volcanic Ash from Space. Proceedings of the ESA-EUMETSAT workshop on the 14 April to 23 May 2010 eruption at the Eyjafjoll volcano, South Iceland. Frascati, Italy, 26-27 May 2010. ESA-Publication STM-280. DOI:10.5270/atmch-10-01
Geologic Background. Grímsvötn, Iceland's most frequently active volcano in recent history, lies largely beneath the vast Vatnajökull icecap. The caldera lake is covered by a 200-m-thick ice shelf, and only the southern rim of the 6 x 8 km caldera is exposed. The geothermal area in the caldera causes frequent jökulhlaups (glacier outburst floods) when melting raises the water level high enough to lift its ice dam. Long NE-SW-trending fissure systems extend from the central volcano. The most prominent of these is the noted Laki (Skaftar) fissure, which extends to the SW and produced the world's largest known historical lava flow in 1783. The 15 km3 basaltic Laki lavas were erupted over 7 months from a 27-km-long fissure system. Extensive crop damage and livestock losses caused a severe famine that resulted in the loss of one-fifth of the population of Iceland.
Information Contacts: Icelandic Meteorological Office (URL: http://en.vedur.is/); Institute of Earth Sciences (URL: http://earthice.hi.is/); International Federation of Air Line Pilot's Associations (IFALPA) (URL: http://www.ifalpa.org/); International Civil Aviation Organization (ICAO) (URL: http://www.icao.int/); London Volcanic Ash Advisory Centre (VAAC), Met Office, FitzRoy RoadExeter, Devon, EX1 3PB, UK; Agence France-Presse (AFP) (URL: http://www.afp.com/afpcom/en/); Associated Press (AP) (URL: http://www.ap.org/); Eurocontrol (URL: http://www.eurocontrol.in); Iceland Review (URL: http://icelandreview.com/); National Geographic News (URL: http://news.nationalgeographic.com/); Sigurdur Stefnisson (URL: http://www.flickr.com/photos/); Ragnar Th. Sigurdsson, Arctic-Images.com. (URL: http://www.arctic-images.com/); The Big Picture (URL: http://www.boston.com); The Local (URL: http://www.thelocal.se/33970/20110524).
Lokon-Empung (Indonesia) — June 2011 Cite this Report
Lokon-Empung
Indonesia
1.3644°N, 124.7992°E; summit elev. 1580 m
All times are local (unless otherwise noted)
July 2011 ash plumes spur 4,000 to 6,000 to evacuate
This report discusses Lokon-Empung during February to mid-July 2011. There were occasional modest ash-bearing eruptions and elevated seismicity through June. Stronger ash plumes during July spurred evacuations. Our previous report noted unrest during 2007 through March 2008 (BGVN 33:02). According to the Center of Volcanology and Geological Hazard Mitigation (CVGHM), since February 2008 through the reporting period, seismic activity was characterized by daily volcanic earthquakes and occasional phreatic eruptions when rainfall was high.
According to CVGHM and news articles, on 22 February 2011, a phreatic eruption discharged from Tompaluan crater (figures 4 and 5). The eruption was possibly triggered by high rainfall. It produced an ash plume that rose 400 m above the crater rim and drifted SE.
CVGHM reported that, during 1-25 June 2011, white plumes rose 50-200 m above Tompaluan crater. On 26 June, a phreatic eruption ejected material that both fell around the crater and produced a gray plume that rose 400 m above the crater rim and drifted N. Seismicity increased the next day and white plumes rose 50-200 m above the crater. The Alert Level was raised to 3; prohibiting visitors and residents entering within a 3-km radius of the crater.
According to CVGHM, during 28 June-9 July 2011 white plumes rose 50-400 m above Tompaluan crater and gray ash plumes rose 100-500 m above the crater. An ash eruption on 10 July 2011 produced white-to-gray plumes that rose 200-400 m above the crater. Fluctuations in the sulfur dioxide gas emission rate were noted during 30 June-10 July. Based on gas flux, seismicity, visual observations, and hazard assessment, CVGHM raised the Alert Level to 4. On 11 July, the Darwin Volcanic Ash Advisory Centre (VAAC) reported that ash plumes detected in satellite imagery rose to an altitude of 1.5 km and drifted NW. According to news articles, close to 1,000 residents were evacuated from the area during 11-12 July 2011.
HOPE Worldwide, a non-profit non-governmental organization, issued a report on 15 July 2011 stating that at 2331 on the 14 July Lokon erupted and sent lava, ash, and gases 1.5 km over the summit. "No death is yet to be reported due to the eruption, but there are 4,412 persons displaced in the Tomohon city, just south of Manado city, the capital of North Sulawesi Province." Displaced residents went to schools and a city park.
Figures 6-8 show photos of molten material and eruptions taken from various perspectives on 14 and 17 July. The photo shown as figure 8 accompanied another panoramic shot with the eruption.
A video posted on The Guardian website (on 15 July) shows people dispensing face masks to residents as ash from Lokon falls. The original video apparently came from Associated Press (2011; see Reference list).
According to the news agency AFP, a small eruption—the largest since late June—lit up the night sky on 17 July, sending a large ash plume '3.5 km up into the sky.' A nearby airport was placed on alert, but as of 18 July flights were not affected. The article said that, since this latest (17 July) eruption, more than 5,200 residents had been evacuated. Other reports noted the number of displaced residents in the range 4,000-6,000.
Reference. Associated Press, 2011, Indonesian volcano erupts, Thousands of residents evacuated from slopes of Mount Lokon in Sulawesi province (AP photo used in 15 July 2011 article on The Guardian.co.uk website) (URL: http://www.guardian.co.uk/world/2011/jul/15/indonesian-volcano-erupts).
Geologic Background. The Lokong-Empung volcanic complex, rising above the plain of Tondano in North Sulawesi, includes four peaks and an active crater. Lokon, the highest peak, has a flat craterless top. The morphologically younger Empung cone 2 km NE has a 400-m-wide, 150-m-deep crater that erupted last in the 18th century. A ridge extending 3 km WNW from Lokon includes the Tatawiran and Tetempangan peaks. All eruptions since 1829 have originated from Tompaluan, a 150 x 250 m crater in the saddle between Lokon and Empung. These eruptions have primarily produced small-to-moderate ash plumes that sometimes damaged croplands and houses, but lava-dome growth and pyroclastic flows have also occurred.
Information Contacts: Center of Volcanology and Geological Hazard Mitigation (CVGHM), Jalan Diponegoro 57, Bandung 40122, Indonesia (URL: http://www.vsi.esdm.go.id/); Darwin Volcanic Ash Advisory Centre (VAAC), Bureau of Meteorology, Northern Territory Regional Office, PO Box 40050, Casuarina, NT 0811, Australia (URL: http://www.bom.gov.au/info/vaac/); HOPE Worldwide, 353 W. Lancaster Avenue, Suite 200, Wayne, PA, 19087 USA URL: http://www.hopeww.org); Associated Press at CBS news (URL: http://www.cbsnews.com); Tempo (URL: http://www.tempointeraktif.com/); Media Indonesia.com (URL: http://www.mediaindonesia.com/); Agence France Press (AFP) (URL: http://www.afp.com/afpcom/en/); Blogspot.com (URL: http://11reviews.blogspot.com)
Manam (Papua New Guinea) — June 2011 Cite this Report
Manam
Papua New Guinea
4.08°S, 145.037°E; summit elev. 1807 m
All times are local (unless otherwise noted)
Eruptions ongoing from August 2010 to January 2011
Manam eruptions continued, and from 13 November 2010 to 3 January 2011, the MODVOLC satellite-based system registered almost daily alerts. Fewer alerts continued into at least July 2011. This report also describes activity as provided by the Rabaul Volcanological Observatory (RVO) during 31 December 2010 to 11 January 2011, augmenting and extending our previous Bulletin reports (BGVN 35:02, 35:09, and 36:01-02). A map illustrating the edifice's remarkably symmetric form appears below (figure 28).
As a review, in BGVN 36:01-02 we noted a new episode of eruptive activity that began on 25 December 2010 and escalated on 30 December, culminating with several destructive pyroclastic flows.
On 31 December 2010, white vapor rose from the crater. Later that day, activity increased again. Gray ash plumes rose 200-300 m above the South Crater and also above the Main Crater. Low booming sounds were noted and incandescence from the crater was observed at night. During 1-4 January eruptive activity continued from South Crater and gray-to-black ash plumes rose above the summit crater. Incandescence emanated from the crater. During 3-4 January incandescent fragments were ejected onto the flanks and rolled down the SE valley. White vapor rose from the Main Crater.
On the website Malum Nalu viewed on 2 January 2011 Sir Peter Leslie Charles Barter (former Minister for Health, Papua New Guinean (PNG) government) reported that as the results of a series of eruptions on 25-30 December 2010, followed by larger eruptions, some panic occurred by people that had returned to Manam Island. At Dugalava, a spokesman for the people told the provincial disaster office that more than 1,000 people needed to be evacuated. Barter flew with former Madang Province Governor and current PNG Attorney General Sir Arnold Amet to Manam on 1 January 2011 for an aerial inspection. At that time there was evidence of lava flows in two valleys, but most of the villages were intact and the eruption had subsided.
RVO reported that during 5-6 January low roaring from Manam's South Crater was heard and weak but steady crater incandescence was observed at night. Diffuse blue vapor was emitted from South Crater on 6 January. During 6-8 January white vapor rose from Main Crater and incandescence from both craters was observed at night. Diffuse brown ash plumes occasionally rose from South Crater on 7 January. On 8 January the volcano Alert status was lowered from Level 3 to Level 2. During 8-9 January Main Crater emitted white vapor and South Crater produced occasional gray ash plumes that drifted to the SE part of the island. Emissions from Main Crater turned to gray on 10 January. White-to-blue vapor plumes rose from South Crater. Both craters were incandescent at night during 8-10 January.
On 11 January 2011, RVO reported that Southern Crater released weak volumes of white vapor, and a steady weak glow was visible at night. Main Crater had similar activity.
Satellite measurements. MODVOLC satellite thermal alerts vary significantly during July 2008-June 2011, with periods of up to months of quiet, and seven weeks of daily to near-daily interval of alerts near the end of 2010. During late July 2008 through mid-November 2010, the MODVOLC satellite thermal alerts system measured very infrequent thermal alerts of 1, 2, and, once, 3 pixels. During the periods of 29 July 2008-19 January 2009 and 4 October 2009-9 August 2010, no alerts were measured. However, during a period of ~7 weeks, 13 November 2010-3 January 2011, almost daily alerts were measured. Subsequently, only two additional, 1-pixel Terra satellite thermal alerts were measured through mid-June 2011; one on 10 January 2011 at 1255 UDT and one on 6 March 2011 at 1300 UDT. Thus, the period of nearly daily measured thermal alerts during the end of 2010 appears to be rather anomalous. Several periods of thermal alerts were measured 28-30 June and 14-19 July 2011, but not accompanied with field observations.
Reference. Palfreyman, W.D., and Cooke, R.J.S., 1976, Eruptive history of Manam volcano, Papua New Guinea in Johnson R.W. (ed.), Volcanism in Australasia, Elsevier, Amsterdam, p. 117-131.
Geologic Background. The 10-km-wide island of Manam, lying 13 km off the northern coast of mainland Papua New Guinea, is one of the country's most active volcanoes. Four large radial valleys extend from the unvegetated summit of the conical basaltic-andesitic stratovolcano to its lower flanks. These valleys channel lava flows and pyroclastic avalanches that have sometimes reached the coast. Five small satellitic centers are located near the island's shoreline on the northern, southern, and western sides. Two summit craters are present; both are active, although most observed eruptions have originated from the southern crater, concentrating eruptive products during much of the past century into the SE valley. Frequent eruptions, typically of mild-to-moderate scale, have been recorded since 1616. Occasional larger eruptions have produced pyroclastic flows and lava flows that reached flat-lying coastal areas and entered the sea, sometimes impacting populated areas.
Information Contacts: Rabaul Volcano Observatory (RVO), PO Box 386, Rabaul, Papua New Guinea; Malum Nalu (URL: http://malumnalu.blogspot.com/2011/01/volcano-erupts-on-manam-island.html); Hawai'i Institute of Geophysics and Planetology (HIGP) MODVOLC Thermal Alerts System, School of Ocean and Earth Science and Technology (SOEST), Univ. of Hawai'i, 2525 Correa Road, Honolulu, HI 96822, USA (URL: http://modis.higp.hawaii.edu/); Darwin Volcanic Ash Advisory Centre (VAAC) (URL: http://www.bom.gov.au/info/vaac/).