Recently Published Bulletin Reports
Ambrym (Vanuatu) New effusive eruption during January 2024
Popocatepetl (Mexico) Daily gas-and-ash emissions, ashfall, and occasional explosions during August-November 2023
Reventador (Ecuador) Daily explosions, gas-and-ash emissions, and incandescent avalanches during August-November 2023
Erta Ale (Ethiopia) Strong lava lake activity and lava overflows during June-November 2023
Ubinas (Peru) New eruption with explosions and ash plumes during June-December 2023
Kanaga (United States) Small explosion on 18 December 2023
Klyuchevskoy (Russia) New eruption consisting of Strombolian activity, lava flows and fountains, and ash plumes during June-December 2023
Agung (Indonesia) Three eruptive events reported in April, May, and December 2022
Saunders (United Kingdom) Persistent thermal anomalies from the summit crater lava lake during February 2023-January 2024
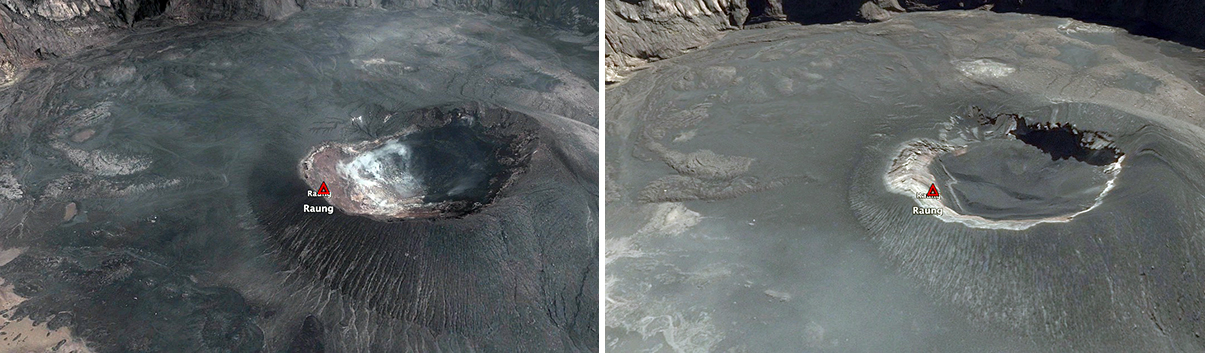
Tengger Caldera (Indonesia) Minor ash emission in December 2023; persistent weak thermal anomaly in the Bromo crater
Shishaldin (United States) New eruption with significant Strombolian explosions, ash plumes, and ashfall
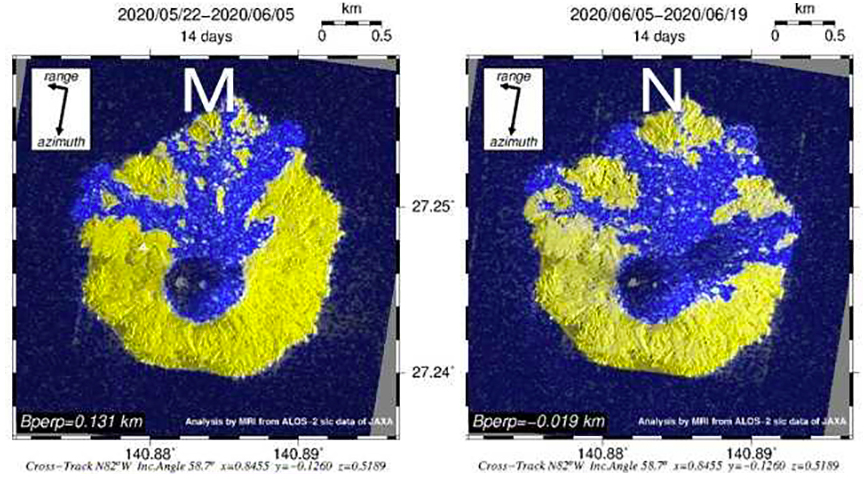
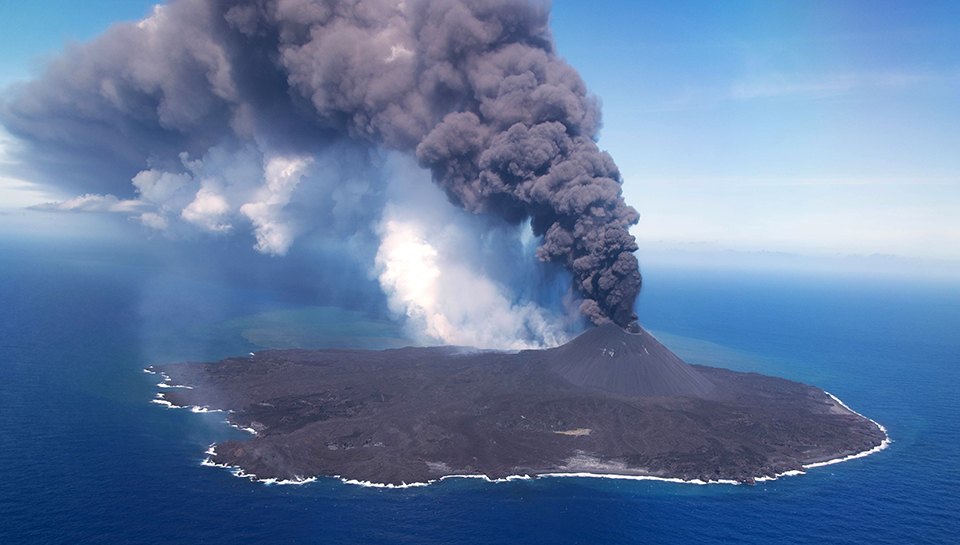
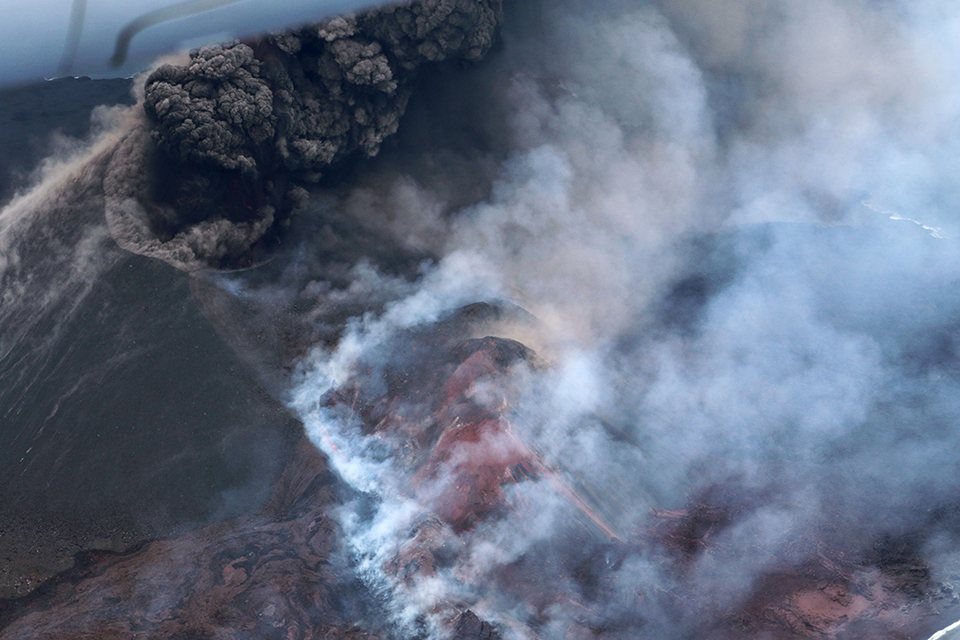
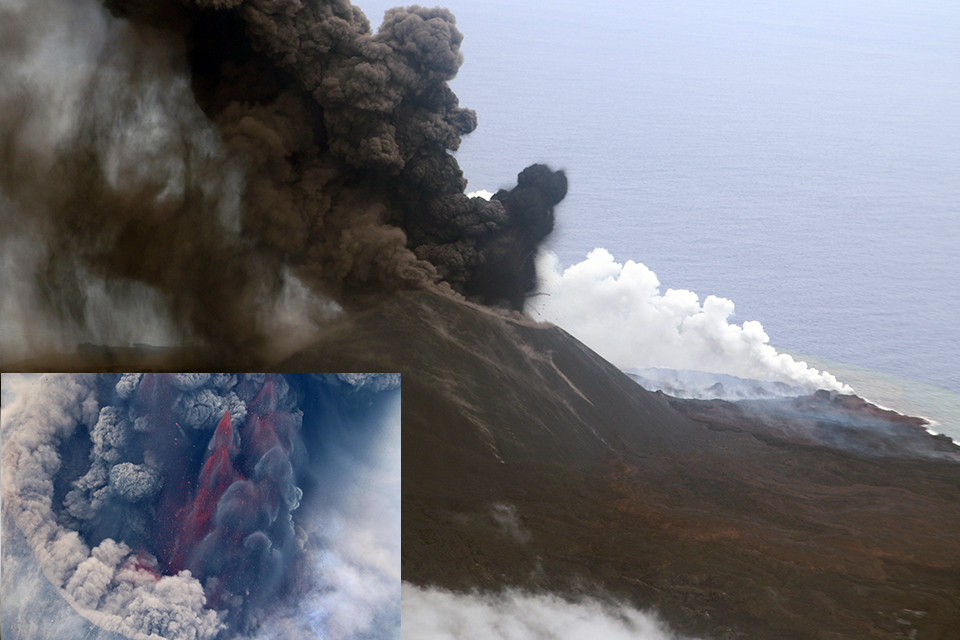
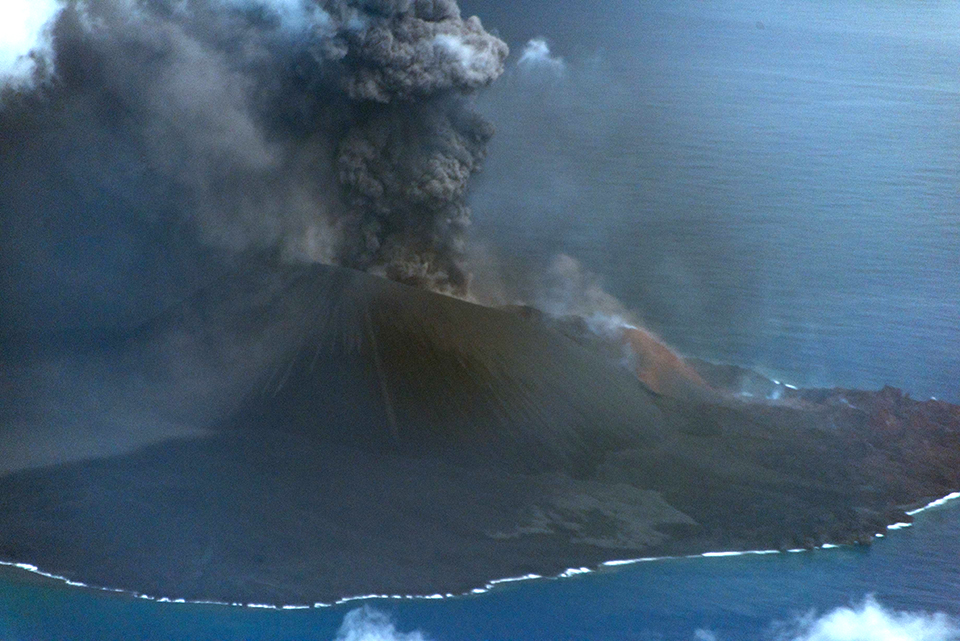
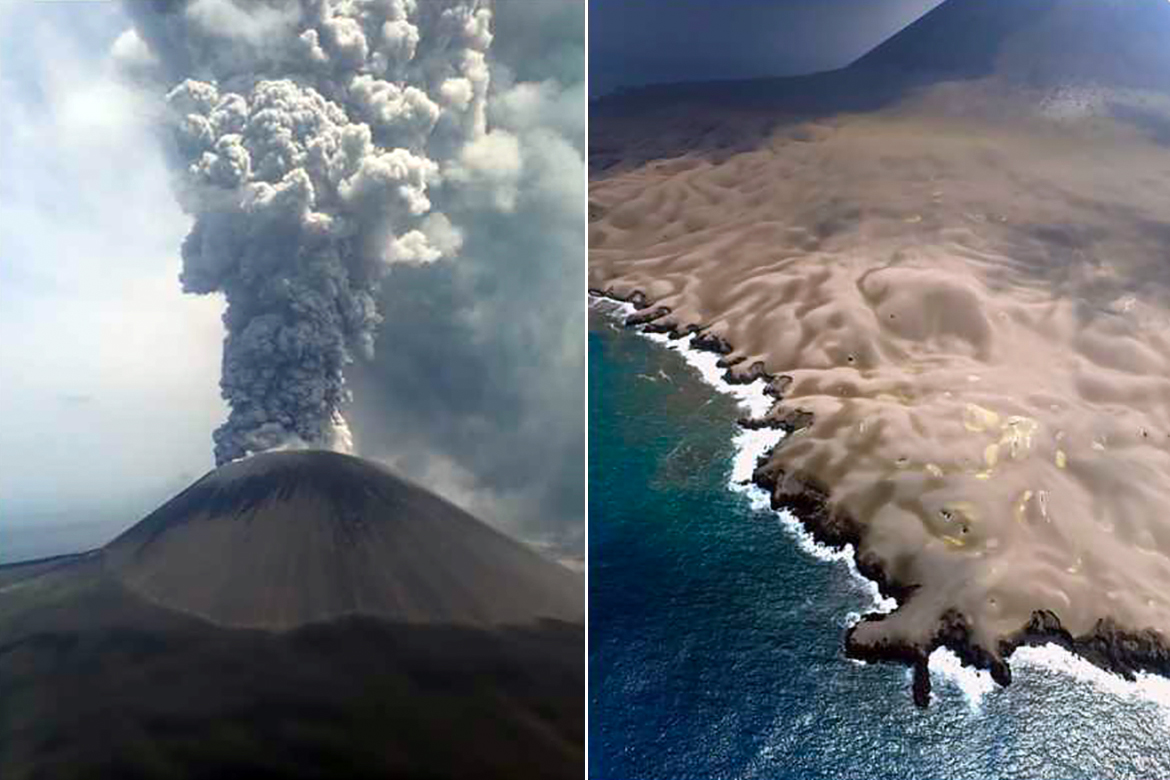
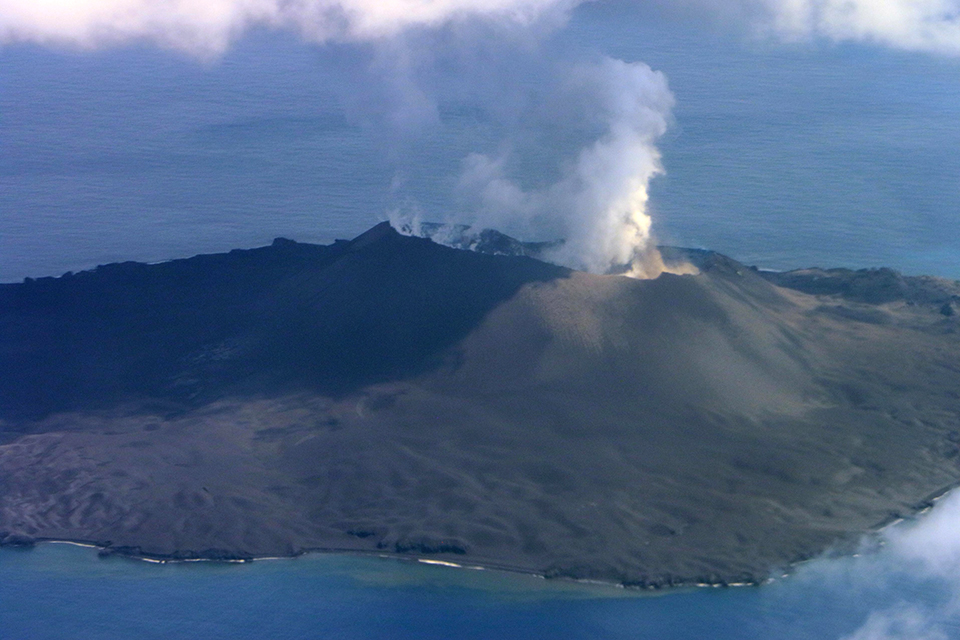
Ioto (Japan) New eruption with discolored water, ejecta, and floating pumice during October-December 2023
Ambrym (Vanuatu) — February 2024  Cite this Report
Ambrym
Vanuatu
16.25°S, 168.12°E; summit elev. 1334 m
All times are local (unless otherwise noted)
New effusive eruption during January 2024
Ambrym contains a 12-km-wide caldera and is part of the New Hebrides Arc, located in the Vanuatu archipelago. The two currently active craters within the caldera are Benbow and Marum, both of which have produced lava lakes, explosions, lava flows, and gas-and-ash emissions. The previous eruption occurred during late January 2022 and was characterized by ash plumes, sulfur dioxide plumes, and crater incandescence (BGVN 47:05). This report covers a new, short eruption during January 2024, which consisted of a lava effusion and an explosion. Information comes from the Vanuatu Meteorology and Geohazards Department (VMGD) and satellite data.
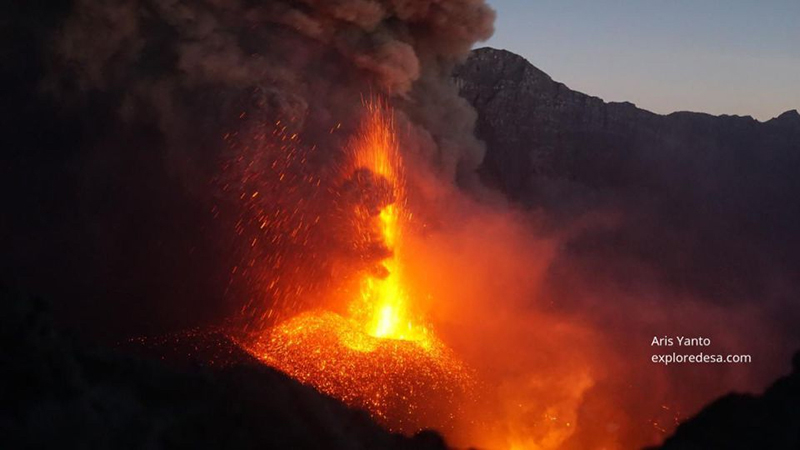
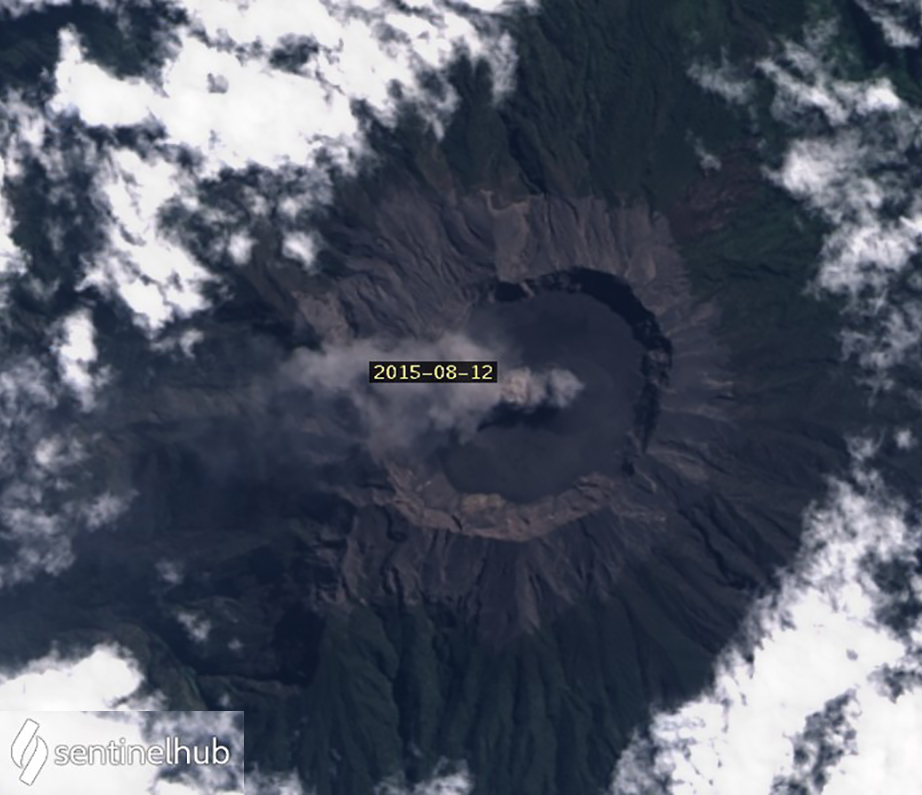
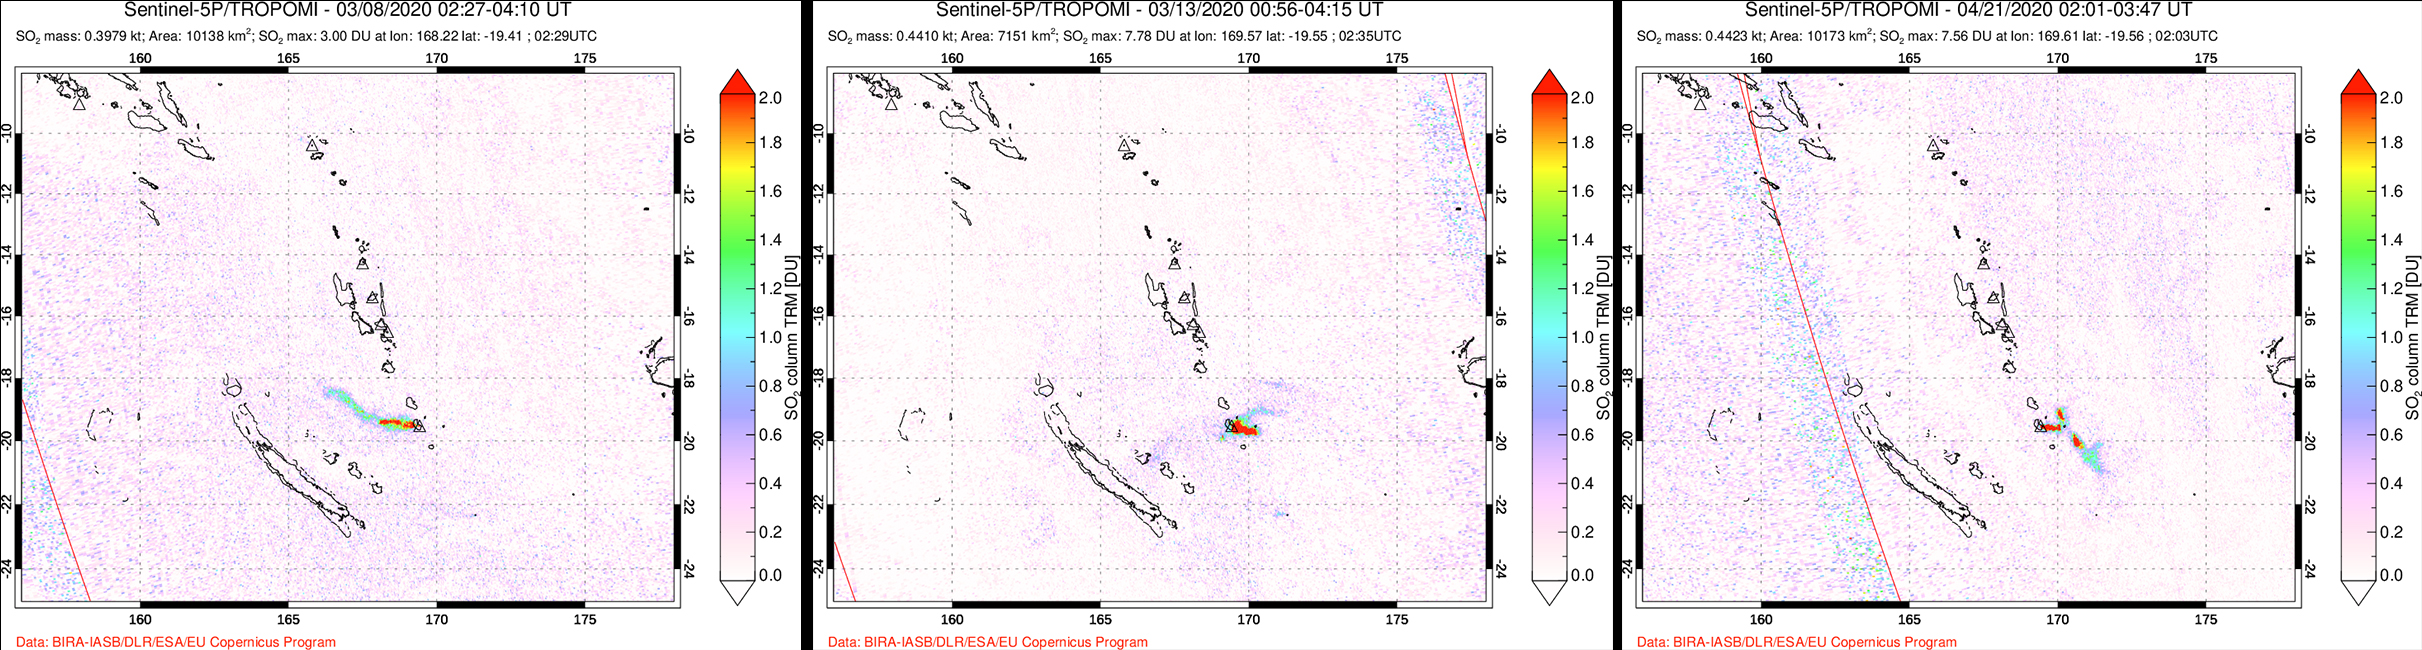
VMGD reported that at 2217 on 13 January an eruption began at Benbow Crater, based on webcam and seismic data. The eruption was characterized by a loud explosion, intense crater incandescence (figure 55), and gas-and-steam emissions. As a result, the Volcano Alert Level (VAL) was raised from 1 to 3 (on a scale of 0-5). A lava flow was reported in Benbow Crater, which lasted for four days. Satellite data showed that 1,116 tons of sulfur dioxide per day (t/d) were emitted on 14 January (figure 56). During the morning of 15 January, ground reports noted loud explosions and minor earthquakes. The sulfur dioxide flux on 15 January was 764 t/d. During 15-17 January activity decreased according to webcam images, seismic data, and field observations. No sulfur dioxide emissions were reported after 15 January. Gas-and-ash emissions also decreased, although they continued to be observed through 31 January, and crater incandescence was less intense (figure 57). The VAL was lowered to 2 on 17 January.
Geologic Background. Ambrym is a large basaltic volcano with a 12-km-wide caldera formed during a major Plinian eruption with dacitic pyroclastic flows about 1,900 years ago. A thick, almost exclusively pyroclastic sequence, initially dacitic then basaltic, overlies lava flows of a pre-caldera shield volcano. Post-caldera eruptions, primarily from Marum and Benbow cones, have partially filled the caldera floor and produced lava flows that ponded on the floor or overflowed through gaps in the caldera rim. Post-caldera eruptions have also formed a series of scoria cones and maars along a fissure system oriented ENE-WSW. Eruptions have been frequently reported since 1774, though mostly limited to extra-caldera eruptions that would have affected local populations. Since 1950 observations of eruptive activity from cones within the caldera or from flank vents have occurred almost yearly.
Information Contacts: Geo-Hazards Division, Vanuatu Meteorology and Geo-Hazards Department (VMGD), Ministry of Climate Change Adaptation, Meteorology, Geo-Hazards, Energy, Environment and Disaster Management, Private Mail Bag 9054, Lini Highway, Port Vila, Vanuatu (URL: http://www.vmgd.gov.vu/, https://www.facebook.com/VanuatuGeohazardsObservatory/); Copernicus Browser, Copernicus Data Space Ecosystem, European Space Agency (URL: https://dataspace.copernicus.eu/browser/).
Popocatepetl (Mexico) — January 2024 Cite this Report
Popocatepetl
Mexico
19.023°N, 98.622°W; summit elev. 5393 m
All times are local (unless otherwise noted)
Daily gas-and-ash emissions, ashfall, and occasional explosions during August-November 2023
Popocatépetl, located 70 km SE of Mexica City, Mexico, contains a 400 x 600 m-wide summit crater. Records of activity date back to the 14th century; three Plinian eruptions, the most recent of which took place about 800 CE, have occurred since the mid-Holocene, accompanied by pyroclastic flows and voluminous lahars that swept basins below the volcano. The current eruption period began in January 2005, characterized by numerous episodes of lava dome growth and destruction within the summit crater. Recent activity has been characterized by daily gas-and-ash emissions, ashfall, and explosions (BGVN 48:09). This report covers similar activity during August through November 2023, according to daily reports from Mexico's Centro Nacional de Prevención de Desastres (CENAPRED) and various satellite data.
Daily gas-and-steam emissions, containing some amount of ash, continued during August through November 2023. CENAPRED reported the number of low-intensity gas-and-ash emissions or “exhalations” and the minutes of tremor, which sometimes included harmonic tremor in their daily reports (figure 220). A total of 21 volcano-tectonic (VT) tremors were detected throughout the reporting period. The average number of exhalations was 117 per day, with a maximum number of 640 on 25 September. Frequent sulfur dioxide plumes that exceeded two Dobson Units (DU) and drifted in multiple directions were visible in satellite data from the TROPOMI instrument on the Sentinel-5P satellite (figure 221).
Activity during August was relatively low and mainly consisted of occasional explosions, ash emissions, and light ashfall. There were 30 explosions (25 minor explosions and four moderate explosions), and nine VT-type events detected. An average number of 60 exhalations occurred each day, which mostly consisted of water vapor, volcanic gases, and a small amount of ash. On 2 August the National Center for Communications and Civil Protection Operations (CENACOM) reported light ashfall in Ocuituco (22 km SW), Yecapixtla (31 km SW), Cuautla (43 km SW), and Villa de Ayala (47 km SW). On 7 August light ashfall was observed in Atlautla (16 km W). A minor explosion at 0305 on 11 August was accompanied by crater incandescence. Explosions at 0618 on 13 August produced a gas-and-ash plume that rose above the summit, and at 0736 another explosion produced a puff of gas-and-ash (figure 222). Two minor explosions were detected at 0223 and 0230 on 16 August that generated eruptive columns with low ash content rising 800 m and 700 m above the crater, respectively. On 24 August an eruptive event lasted 185 minutes and consisted of light ash emissions that did not exceed 300 m above the crater. According to the Washington VAAC, ash plumes identified in daily satellite images rose to 4.6-7.6 km altitude and drifted in multiple directions, the highest of which occurred on 29 August.
There was an average of 156 exhalations each day during September, a monthly total of seven VT-type events, and 29 explosions, 14 of which were minor and nine of which were moderate. A gas-and-ash plume rose to 2 km above the summit and drifted WSW at 1216 on 1 September. CENACOM reported at 1510 observations of ashfall in Ozumba (18 km W), Atlautla, Tepetlixpa (20 km W), and Ecatzingo (15 km SW), as well as in Morelos in Cuernavaca (65 km WSW), Temixco (67 km WSW), Huitzilac (67 km W), Tepoztlán (49 km W), and Jiutepec (59 km SW). The next day, gas-and-ash plumes rose to 2 km above the summit (figure 223). At 1100 ashfall was reported in Amecameca (15 km NW), Ayapango (24 km WNW), Ozumba, Juchitepec, Tenango del Aire (29 km WNW), Atlautla, and Tlalmanalco (27 km NW). A gas-and-ash plume rose to 1 km above the summit and drifted WNW at 1810. During 5-6, 8-9, 12, 14, 19, and 24-25 September ashfall was reported in Amecameca, Atlautla, Ozumba, Tenango del Aire, Tepetlixpa, Juchitepec, Cuernavaca, Ayala, Valle de Chalco (44 km NW), Ixtapaluca (42 km NW), La Paz (50 km NW), Chimalhuacán, Ecatepec, Nezahualcóyotl (60 km NW), Xochimilco (53 km SE), Huayapan, Tetela del Volcano (20 km SW), Yautepec (50 km WSW), Cuautla (43 km SW), Yecapixtla (30 km SW) and possibly Tlaltizapán (65 km SW), Tlaquiltenango, and Tepalcingo. According to the Washington VAAC, ash plumes identified in daily satellite images rose to 5.8-9.1 km altitude and drifted in multiple directions, the highest of which was identified during 1-2 August.
Activity during October and November was relatively low. An average of 179 exhalations consisting of gas-and-steam and ash emissions were reported during October and 73 during November. Only one VT-type event and two explosions were detected during October and four VT-type events and one explosion during November. A satellite image from 0101 on 14 October showed ash fanning out to the NW at 6.7 km altitude and an image from 0717 showed a continuously emitted ash plume drifting WNW and NW at the same altitude. Ash emissions at 1831 on 14 October were ongoing and visible in webcam images slowly drifting W at an altitude of 6.4 km altitude (figure 224). On 24 October a tremor sequence began at 0310 that generated a gas-and-ash plume that rose 800 m above the summit and drifted W. Another tremor sequence occurred during 1305-1900 on 25 October that consisted of continuous ash emissions. Ash plumes identified in daily satellite images rose to 5.5-8.5 km altitude and drifted in different directions during October, according to the Washington VAAC. The highest ash plume was detected on 23 October. During 10-13 November ash plumes rose to 6.7 km altitude and drifted N, NNW, NE, and NW. On 13 November a M 1.5 VT-type event was detected at 0339 and light ashfall was reported in Amecameca, Cocotitlán (34 km NW), and Tenango del Aire, and Ocuituco. On 14 November ash plumes rose to 6 km altitude and drifted N, NE, and SE and light ashfall was reported in Cuernavaca (64 km W). The Washington VAAC reported frequent ash plumes that rose to 5.8-7.9 km altitude and drifted in several directions; the highest ash plume was recorded on 28 November.
Satellite data. MODIS thermal anomaly data provided through MIROVA (Middle InfraRed Observation of Volcanic Activity) showed frequent low-to-moderate thermal anomalies during the reporting period (figure 225). The intensity of the anomalies was lower compared to previous months. According to data from MODVOLC thermal alerts, a total of ten hotspots were detected at the summit crater on 2 August and 2, 4, 9, 19, and 26 September. Thermal activity in the summit crater was visible in infrared satellite data and was sometimes accompanied by ash plumes, as shown on 17 November (figure 226).
Geologic Background. Volcán Popocatépetl, whose name is the Aztec word for smoking mountain, rises 70 km SE of Mexico City to form North America's 2nd-highest volcano. The glacier-clad stratovolcano contains a steep-walled, 400 x 600 m wide crater. The generally symmetrical volcano is modified by the sharp-peaked Ventorrillo on the NW, a remnant of an earlier volcano. At least three previous major cones were destroyed by gravitational failure during the Pleistocene, producing massive debris-avalanche deposits covering broad areas to the south. The modern volcano was constructed south of the late-Pleistocene to Holocene El Fraile cone. Three major Plinian eruptions, the most recent of which took place about 800 CE, have occurred since the mid-Holocene, accompanied by pyroclastic flows and voluminous lahars that swept basins below the volcano. Frequent historical eruptions, first recorded in Aztec codices, have occurred since Pre-Columbian time.
Information Contacts: Centro Nacional de Prevención de Desastres (CENAPRED), Av. Delfín Madrigal No.665. Coyoacan, México D.F. 04360, México (URL: http://www.cenapred.unam.mx/, Daily Report Archive https://www.gob.mx/cenapred/archivo/articulos); Washington Volcanic Ash Advisory Center (VAAC), Satellite Analysis Branch (SAB), NOAA/NESDIS OSPO, NOAA Science Center Room 401, 5200 Auth Rd, Camp Springs, MD 20746, USA (URL: www.ospo.noaa.gov/Products/atmosphere/vaac, archive at: http://www.ssd.noaa.gov/VAAC/archive.html); MIROVA (Middle InfraRed Observation of Volcanic Activity), a collaborative project between the Universities of Turin and Florence (Italy) supported by the Centre for Volcanic Risk of the Italian Civil Protection Department (URL: http://www.mirovaweb.it/); Hawai'i Institute of Geophysics and Planetology (HIGP) - MODVOLC Thermal Alerts System, School of Ocean and Earth Science and Technology (SOEST), Univ. of Hawai'i, 2525 Correa Road, Honolulu, HI 96822, USA (URL: http://modis.higp.hawaii.edu/); NASA Global Sulfur Dioxide Monitoring Page, Atmospheric Chemistry and Dynamics Laboratory, NASA Goddard Space Flight Center (NASA/GSFC), 8800 Greenbelt Road, Goddard, Maryland, USA (URL: https://so2.gsfc.nasa.gov/); Copernicus Browser, Copernicus Data Space Ecosystem, European Space Agency (URL: https://dataspace.copernicus.eu/browser/).
Reventador (Ecuador) — January 2024 Cite this Report
Reventador
Ecuador
0.077°S, 77.656°W; summit elev. 3562 m
All times are local (unless otherwise noted)
Daily explosions, gas-and-ash emissions, and incandescent avalanches during August-November 2023
Volcán El Reventador, located in Ecuador, is a stratovolcano with a 4-km-wide avalanche scarp open to the E that was formed by edifice collapse. The largest recorded eruption took place in 2002 producing a 17-km-high eruption column, pyroclastic flows that traveled as far as 8 km, and lava flows from summit and flank vents. Recorded eruptions date back to the 16th century and have been characterized by explosive events, lava flows, ash plumes, and lahars. Frequent lahars have built deposits on the scarp slope. The current eruption period began in July 2008 and has recently been characterized daily explosions, gas-and-ash emissions, and block avalanches (BGVN 48:08). This report covers similar activity during August through November 2023 using daily reports from Ecuador's Instituto Geofisico (IG-EPN) and satellite data.
During August through November 2023, IG-EPN reported daily explosions, gas-and-ash plumes that rose as high as 1.3 km above the crater, and frequent crater incandescence, often accompanied by incandescent block avalanches that affected one or multiple flanks. More daily explosions were detected during November, with an average total of 46 per day.
Table 19. Monthly summary of explosions and plume heights recorded at Reventador from August through November 2023. Data could not be collected for 29-30 September 2023 and 6-23 October 2023. Data courtesy of IG-EPN (August-November 2023 daily reports).
| Month |
Average number of explosions per day |
Max plume height above the crater rim (km) |
| Aug 2023 |
32 |
1.3 |
| Sep 2023 |
30 |
1 |
| Oct 2023 |
31 |
1.3 |
| Nov 2023 |
46 |
1.2 |
Activity during August consisted of 6-75 daily explosions, nighttime crater incandescence, and incandescent avalanches of material. Frequent seismicity was mainly characterized by long-period (LP) events, harmonic tremor (TRARM), tremor-type (TRE), and volcano tectonic (VT)-type events. Daily gas-and-ash emissions rose 200-1,300 m above the summit and drifted W, SW, NW, NE, N, and E, based on webcam and satellite images. The Washington VAAC also reported occasional ash plumes that rose 400-1,600 m above the crater and drifted NW. Avalanches of incandescent material were reported during 1-2, 6-7, 9-14, 16-17, 18-21, and 26-29 August, which traveled 500-900 m below the crater and affected multiple flanks (figure 180). During 24-25 August incandescent material was ejected 300 m above the crater.
Gas-and-ash emissions and seismicity characterized by LP, VT, TRARM, and TRE-type events continued during September; data were not available for 29-30 September. Daily gas-and-ash emissions rose 200-1,000 m above the crater and generally drifted W, NW, and SW (figure 181). Near-daily explosions ranged from 16-53 per day, often accompanied by incandescent avalanches, which affected one or multiple flanks and traveled 100-800 m below the crater. During 2-3 September incandescent material was ejected 200 m above the crater and was accompanied by blocks rolling down the flanks. During 16-17 September incandescent material was ejected 100-200 m above the crater and avalanches descended 600 m below the crater. During 21-22 and 24-26 September incandescent material was ejected 100-300 m above the crater. According to the Washington VAAC, ash plumes rose 700 m above the crater and drifted SW, W, and NW on 3, 16, and 20 September, respectfully.
During October, daily explosions, gas-and-ash plumes, and crater incandescence continued, with 16-40 explosions recorded each day (figure 182); data was not available for 6-23 October. Seismicity consisted of LP, TRE, and TRARM-type events. Gas-and-ash emissions rose 200-1,000 m above the crater and drifted W, SW, NW, SSW, NNW, and NE. The Washington VAAC reported that ash plumes rose 1-1.3 km above the crater and drifted W, SW, and NW during 1-5 October. During 30 September-1 October incandescent avalanches descended 700 m below the crater. Ejected material rose 200 m above the crater during 2-5 October and was accompanied by avalanches of material that traveled 250-600 m below the crater rim; incandescent avalanches were also reported during 23-29 October.
Daily explosions, LP, TRARM, VT, and TRE-type events, crater incandescence, and avalanches of material continued during November. There were 26-62 daily explosions detected throughout the month. Gas-and-ash emissions rose 300-1,200 m above the crater and drifted in different directions (figure 183). The Washington VAAC reported that ash plumes rose 700-1,620 m above the crater and drifted NW, W, WNW, SW, E, SE, and ESE. Frequent incandescent avalanches descended 500-1,000 m below the crater. Explosions ejected material 100-300 m above the crater during 4-7, 11-12, and 19-23 November.
Satellite data. MIROVA (Middle InfraRed Observation of Volcanic Activity) analysis of MODIS satellite data showed intermittent thermal anomalies of low-to-moderate power (figure 184). Thermal activity mainly consisted of incandescent avalanches descending the flanks due to the frequently detected explosions. The MODVOLC hotspot system identified a total of ten hotspots on 3 August, 7, 18, 12, 22, and 28 September, and 7, 9, and 19 November.
Geologic Background. Volcán El Reventador is the most frequently active of a chain of Ecuadorian volcanoes in the Cordillera Real, well east of the principal volcanic axis. The forested, dominantly andesitic stratovolcano has 4-km-wide avalanche scarp open to the E formed by edifice collapse. A young, unvegetated, cone rises from the amphitheater floor to a height comparable to the rim. It has been the source of numerous lava flows as well as explosive eruptions visible from Quito, about 90 km ESE. Frequent lahars in this region of heavy rainfall have left extensive deposits on the scarp slope. The largest recorded eruption took place in 2002, producing a 17-km-high eruption column, pyroclastic flows that traveled up to 8 km, and lava flows from summit and flank vents.
Information Contacts: Instituto Geofísico, Escuela Politécnica Nacional (IG-EPN), Casilla 17-01-2759, Quito, Ecuador (URL: http://www.igepn.edu.ec/); MIROVA (Middle InfraRed Observation of Volcanic Activity), a collaborative project between the Universities of Turin and Florence (Italy) supported by the Centre for Volcanic Risk of the Italian Civil Protection Department (URL: http://www.mirovaweb.it/); Hawai'i Institute of Geophysics and Planetology (HIGP) - MODVOLC Thermal Alerts System, School of Ocean and Earth Science and Technology (SOEST), Univ. of Hawai'i, 2525 Correa Road, Honolulu, HI 96822, USA (URL: http://modis.higp.hawaii.edu/).
Erta Ale (Ethiopia) — January 2024 Cite this Report
Erta Ale
Ethiopia
13.601°N, 40.666°E; summit elev. 585 m
All times are local (unless otherwise noted)
Strong lava lake activity and lava overflows during June-November 2023
Erta Ale in Ethiopia has a 50-km-wide edifice that rises more than 600 m from below sea level in the Danakil depression. The summit caldera is 0.7 x 1.6 km and contains at least two pit craters (North and South). Another larger 1.8 x 3.1-km-wide depression is located SE of the summit and is bounded by curvilinear fault scarps on the SE side. Lava flows from fissures have traveled into the caldera and locally overflowed the crater rim. The current eruption has been ongoing since 1967, with at least one long-term active lava lake present in the summit caldera. Recent fissure eruptions from 2017 have occurred on the SE flank (BGVN 42:07). Recent activity has been characterized by minor thermal activity at the S crater and an active lava lake at the N crater (BGVN 48:06). This report covers strong lava lake activity primarily at the N pit crater during June through November 2023 using information from satellite infrared data.
Infrared satellite images generally showed an active lava lake as the N pit crater and variable thermal activity at the S pit crater during the reporting period. On 7 June two strong thermal anomalies were detected at the S pit crater and two weaker anomalies were visible at the N pit crater. Those anomalies persisted throughout the month, although the intensity at each declined. On 2 July a possible lava lake was identified at the S pit crater, filling much of the crater. On 7 July both pit craters contained active lava lakes (figure 120). By 12 July the thermal activity decreased; two smaller anomalies were visible through the rest of the month at the S pit crater while the N pit crater showed evidence of cooling.
Renewed lava lake activity was identified at the N pit crater, based on a satellite image from 11 August, with two smaller anomalies visible at the S pit crater. By 16 August the lava lake in the N pit had begun to cool and only a small thermal anomaly was identified. Activity restarted on 21 August, filling much of the E and SE part of the N pit crater. The thermal activity at the N pit crater intensified on 31 August, particularly in the NW part of the crater. On 5 September lava filled much of the N pit crater, overflowing to the W and SW. During at least 10-20 September thermal activity at both craters were relatively low.
According to a satellite image on 25 September, strong thermal activity resumed when lava overflowed the N pit crater to the S, SW, and NE (figure 120). A satellite image taken on 5 October showed lava flows from the N had spilled into the S and begun to cool, accompanied by two weak thermal anomalies at the S pit crater. On 15 October lava flows again traveled SE and appeared to originate from the S pit crater (figure 120). Following these events, smaller thermal anomalies were visible on the SE rim of the N pit crater and within the S pit crater.
Lava was visible in the NW part of the N pit crater according to a satellite image taken on 4 November. By 9 November the intensity had decreased, and the lava appeared to cool through the rest of the month; young lava flows were visible along the W side of the S pit crater on 24 and 29 November. Lava flows occurred at the N pit crater trending NE-SW and along the E side on 29 November (figure 120).
During the reporting period, the MIROVA (Middle InfraRed Observation of Volcanic Activity) thermal detection system recorded consistent activity during the first half of 2023 (figure 121). Beginning in June 2023, thermal activity increased and remained variable in intensity through the end of the year indicating the presence of an active lava lake and lava flows. The MODVOLC thermal detection system registered a total of 63 anomalies during 7, 8, and 23 July, 10 and 18 August, 3, 5, 16, 23, 24, and 25 September, 15 and 20 October, and 21, 24, 26, 28, and 30 November. Some of these stronger thermal anomalies were also detected in Sentinel-2 infrared satellite images that showed an active lava lake at the N pit crater and subsequent lava overflows from both pit craters (figure 120).
Geologic Background. The Erta Ale basaltic shield volcano in Ethiopia has a 50-km-wide edifice that rises more than 600 m from below sea level in the Danakil depression. The volcano includes a 0.7 x 1.6 km summit crater hosting steep-sided pit craters. Another larger 1.8 x 3.1 km wide depression elongated parallel to the trend of the Erta Ale range is located SE of the summit and is bounded by curvilinear fault scarps on the SE side. Basaltic lava flows from these fissures have poured into the caldera and locally overflowed its rim. The summit caldera usually also holds at least one long-term lava lake that has been active since at least 1967, and possibly since 1906. Recent fissure eruptions have occurred on the N flank.
Information Contacts: MIROVA (Middle InfraRed Observation of Volcanic Activity), a collaborative project between the Universities of Turin and Florence (Italy) supported by the Centre for Volcanic Risk of the Italian Civil Protection Department (URL: http://www.mirovaweb.it/); Hawai'i Institute of Geophysics and Planetology (HIGP) - MODVOLC Thermal Alerts System, School of Ocean and Earth Science and Technology (SOEST), Univ. of Hawai'i, 2525 Correa Road, Honolulu, HI 96822, USA (URL: http://modis.higp.hawaii.edu/); Copernicus Browser, Copernicus Data Space Ecosystem, European Space Agency (URL: https://dataspace.copernicus.eu/browser/).
Ubinas
Peru
16.345°S, 70.8972°W; summit elev. 5608 m
All times are local (unless otherwise noted)
New eruption with explosions and ash plumes during June-December 2023
Ubinas, located in Peru, has had 24 eruptions since 1550, which more recently have been characterized by explosions, ash plumes, and lahars (BGVN 45:03). This report covers a new eruption during June through December 2023 based on reports from Instituto Geofisico del Peru (IGP), Instituto Geológico Minero y Metalúrgico (INGEMMET), and satellite data.
IGP reported that seismic unrest began on 17 May, followed by an increase in seismicity during the second half of the month. There were 168 volcano-tectonic (VT) earthquakes detected, which are associated with rock fracturing processes, and 171 long-period (LP) earthquakes recorded during 16-24 May, which are associated with the movement of volcanic fluid.
Seismicity and fumarolic activity at the crater level continued to increase during June. During 1-18 June there was an average of 631 VT-type earthquakes and 829 LP earthquakes recorded. Webcams showed gas-and-steam emissions rising 500 m above the summit and drifting SE. In addition, the maximum value of emitted sulfur dioxide during this period was 337 tons/day. During 19-22 June an average of 315 VT-type events and 281 LP-type events and tremor were reported. On 20 June the Gobierno Regional de Moquegua raised the Volcano Alert Level (VAL) to Yellow (the second level on a four-color scale), based on recommendations from IGP. Webcam images showed ash emissions rising 1 km above the summit and drifting E at 0011 on 22 June, which IGP reported marked the start of a new eruption. Sporadic and diffuse gas-and-ash emissions continued to rise 800-1,500 m above the summit through the rest of the month and drifted mainly E, N, NW, W, SW, and NE. During 23-25 June there was an average of 402 VT-type earthquakes and 865 LP-type events detected. During 26-28 June the earthquakes associated with ash emissions, which have been observed since 22 June, decreased, indicating the end of the phreatic phase of the eruption, according to IGP. A thermal anomaly was detected in the crater for the first time on 26 June and was periodically visible through 4 July (figure 61). During 29-30 June there was an average of 173 VT-type earthquakes and 351 LP-type events recorded, and sulfur dioxide values ranged between 600 t/d and 1,150 t/d. During this same time, seismicity significantly increased, with 173 VT-type earthquakes, 351 LP-type events, and harmonic tremor which signified rising magma. The Gobierno Regional de Moquegua raised the Alert Level to Orange (the third level on a four-color scale) on 30 June based on the recommendation from IGP and INGEMMET.
Activity during July consisted of continued seismicity and gas-and-ash emissions. Gas-and-ash emissions rose as high as 5 km above the summit and drifted as far as 40 km in different directions during 1, 4-6, 16, 20-23, 26, and 29 July, based on webcam and satellite images. During 1-2 July an average of 72 VT-type earthquakes and 114 LP-type events were detected. In addition, during that time, ashfall was reported in Ubinas (6.5 km SSE) and Querapi (4.5 km SE). During 2-3 July INGEMMET reported gas-and-ash plumes rose 400 m above the summit and drifted SW, causing ashfall in downwind areas as far as 5 km. During 3-4 July there was an average of 69 VT-type earthquakes and 96 LP-type events reported. On 4 July starting around 0316 there were 16 seismic signals associated with explosive activity and ash emissions detected (figure 62). According to INGEMMET an explosion ejected ballistics and generated a gas-and-ash plume that rose 5.5 km above the summit and drifted SW and S. Ashfall was recorded in Querapi, Ubinas, Sacohaya (7 km SSE), Anascapa (11 km SE), San Miguel (10 km SE), Tonohaya (7 km SSE), Huatahua, Huarina, Escacha (9 km SE), and Matalaque (17 km SSE), and was most significant within 5 km of the volcano. IGP noted that ash fell within a radius of 20 km and deposits were 1 mm thick in towns in the district of Ubinas.
During 5-9 July an average of 67 VT-type events and 47 LP-type events were reported. A period of continuous gas-and-ash emissions occurred on 5 July, with plumes drifting more than 10 km SE and E. A total of 11 seismic signals associated with explosions also detected on 6, 16, 17, and 22 July. On 6 July explosions recorded at 0747 and 2330 produced gas-and-ash plumes that rose as high as 3.5 km above the summit and drifted as far as 30 km NW, NE, SE, and S. According to the Washington VAAC the explosion at 0747 produced a gas-and-ash plume that rose to 9.1 km altitude and drifted SW, which gradually dissipated, while a lower-altitude plume rose to 7.6 km altitude and drifted NE. Gobierno Regional de Moquegua declared a state of emergency for districts in the Moquegua region, along with Coalaque Chojata, Icuña, Lloque, Matalaque, Ubinas, and Yunga of the General Sánchez Cerro province, to be in effect for 60 days. On 7 July an ash plume rose to 7.3 km altitude and drifted E at 0320. At 0900 and 1520 gas-and-steam plumes with diffuse ash rose to 6.7 km altitude and drifted SE. Small ash emissions were visible in satellite and webcam images at 0920 and 1520 on 8 July and rose as high as 6.4 km altitude and drifted SE. During 10-16 July there was an average of 80 VT-type earthquakes and 93 LP-type events reported. INGEMMET reported that during 9-11 July sulfur dioxide emissions were low and remained around 300 t/d.
During 17-23 July an average of 46 VT-type events and 122 LP-type events were detected. On 20 July at 0530 an explosion generated an ash plume that rose 3-4.5 km above the crater and drifted 65 km toward Arequipa. An explosion on 21 July at 0922 produced a gas-and-ash plume that rose 5 km above the summit (figure 63). Ashfall was reported in Querapi, Ubinas, Tonohaya, Anascapa, Sacohaya, San Miguel, Escacha, Huatagua (14 km SE), Huarina, Escacha (9 km SE), Matalaque, Logén, Santa Lucía de Salinas, and Salinas de Moche. An explosion on 22 July at 1323 generated an ash plume that rose 5.5 km above the summit and drifted NE, E, and SE. During 24-30 July there were five volcanic explosions detected and an average of 60 VT-type events and 117 LP-type events. An explosion on 29 July at 0957 produced an ash plume that rose 2.5 km above the summit and drifted as far as 40 km NE, E, and SE. As a result, significant ashfall was reported in Ubinas and Matalaque.
During August, explosions, gas-and-ash emissions, and seismic earthquakes persisted. During 31 July to 6 August there was an average of 115 VT-type events and 124 LP-type events reported. Gas-and-ash emissions were observed during 1, 6, 10, 13-14, 17-18, 21, and 23 August and they drifted as far as 20 km in different directions; on 14 and 18 August continuous ash emissions extended as far as 40 km S, SE, and NE. An explosion was detected at 2110 on 1 August, which generated a gas-and-ash plume that rose 5.4 km above the summit and drifted SE and E. The explosion ejected blocks and incandescent material as far as 3 km from the crater onto the SW, S, and SE flanks. Ashfall was reported in Ubinas and Chojata (19 km ESE). Gas-and-ash emissions rose as high as 2 km above the summit and drifted in different directions through 5 August, sometimes causing ashfall within a 15-km-radius. An explosion at 0009 on 6 August ejected blocks and produced a gas-and-ash plume that rose 1.4 km above the summit and drifted SE and E, which caused ashfall in Ubinas and Chojata and other areas within a 30-km radius. During 7-13 August there was an average of 102 VT-type events and 60 LP-type events detected. INGEMMET reported that sulfur dioxide emissions were low on 7 August and averaged 400 t/d.
One volcanic explosion that was recorded on 10 August, producing gas-and-ash emissions that rose 2.4 km above the summit and drifted as far as 25 km SE and E. Ashfall was observed in Ubinas, Matalaque, and Chojata. During 10-11 and 13-14 August sulfur dioxide values increased slightly to moderate levels of 2,400-3,700 t/d. The average number of VT-type events was 104 and the number of LP-type events was 71 during 14-21 August. Two explosions were detected at 0141 and 0918 on 21 August, which produced gas-and-ash emissions that rose 3.5 km above the summit and drifted 50 km N, NE, W, and NW (figure 64). The explosion at 0918 generated an ash plume that caused ashfall in different areas of San Juan de Tarucani. During 22-27 August the average number of VT-type events was 229 and the average number of LP-type events was 54. An explosion was reported at 1757 on 25 August, which generated a gas-and-ash plume that rose 4.2 km above the summit and drifted in multiple directions as far as 25 km. During 28 August through 3 September gas-and-ash emissions rose 600 m above the summit and drifted as far as 5 km E and SE. During this time, there was an average of 78 VT-type events and 42 LP-type events.
Gas-and-steam emissions rose 600-2,600 m above the summit and drifted as far as 15 km in multiple directions during September. During 4-10 and 11-17 September there was an average of 183 VT-type events and 27 LP-type events, and 114 VT-type events and 86 LP-type events occurred, respectively. On 14 September an explosion at 1049 generated a gas-and-ash plume that rose 2.6 km above the summit and drifted as far as 15 km E, NE, SE, and S (figure 65). During 14-16 September an average of three hours of seismic tremor related to ash emissions was recorded each day. During 18-24 September the average number of VT-type events was 187 and the average number of LP-type events was 45. During 25 September and 1 October, there was an average number of 129 VT-type events and 52 LP-type events detected.
Relatively low activity was reported during October; during 2-9 October there was an average number of 155 VT-type events and 27 LP-type events recorded. On 1 October at 1656 seismic signals associated with ash emissions were recorded for an hour and thirty minutes; the ash plumes rose as high as 1 km above the summit and drifted more than 10 km E, S, and SW. On 4 October IGP reported that an ash plume drifted more than 15 km SW and S. Sulfur dioxide emissions were 1,250 t/d on that day. On 7 October a gas-and-ash plume rose 1.9 km above the summit and drifted NE, E, and SE. On 4 October the amount of sulfur dioxide emissions was 1,250 t/d. During 10-15 October there was an average number of 225 VT-type events and 34 LP-type events recorded. On 11 October at 1555 a single seismic signal associated with an ash pulse was recorded; the gas-and-ash emissions rose 700 m above the summit and drifted SW and W. There was an average of 204 VT-type events and 25 LP-type events detected during 16-22 October and 175 VT-type events and 17 LP-type events during 23-29 October. On 27 October at 0043 a gas-and-ash emission rose 500 m above the summit and drifted SE and E. A minor thermal anomaly was visible on the crater floor. During 30 October to 5 November there was an average of 95 VT-type events and 24 LP-type events detected.
Activity remained relatively low during November and December and consisted mainly of gas-and-steam emissions and seismicity. Gas-and-steam emissions rose 900-1,100 m above the summit and drifted mainly E, SE, N, and NE. IGP detected an average of 166 VT-type events and 38 LP-type events during 6-15 November, 151 VT-type events and 17 LP-type events during 16-30 November, 143 VT-type events and 23 LP-type events during 1-15 December, and 129 VT-type events and 21 LP-type events during 16-31 December. No explosions or ash emissions were recorded during November. The VAL was lowered to Yellow (the second level on a four-color scale) during the first week of November. According to the Washington VAAC an ash emission was identified in a satellite image at 0040 on 11 December that rose to 5.5 km altitude and drifted NW. Webcam images at 0620 and 1220 showed continuous gas-and-steam emissions possibly containing some ash rising as high as 7 km altitude. Webcam images during 10-31 December showed continuous gas-and-ash emissions that rose as high as 2.5 km above the summit and drifted up to 5 km NW, W, and SW. On 12 December continuous ash emissions drifted more than 10 km N and NW.
Geologic Background. The truncated appearance of Ubinas, Perú's most active volcano, is a result of a 1.4-km-wide crater at the summit. It is the northernmost of three young volcanoes located along a regional structural lineament about 50 km behind the main volcanic front. The growth and destruction of Ubinas I was followed by construction of Ubinas II beginning in the mid-Pleistocene. The upper slopes of the andesitic-to-rhyolitic Ubinas II stratovolcano are composed primarily of andesitic and trachyandesitic lava flows and steepen to nearly 45°. The steep-walled, 150-m-deep summit crater contains an ash cone with a 500-m-wide funnel-shaped vent that is 200 m deep. Debris-avalanche deposits from the collapse of the SE flank about 3,700 years ago extend 10 km from the volcano. Widespread Plinian pumice-fall deposits include one from about 1,000 years ago. Holocene lava flows are visible on the flanks, but activity documented since the 16th century has consisted of intermittent minor-to-moderate explosive eruptions.
Information Contacts: Instituto Geofisico del Peru (IGP), Calle Badajoz N° 169 Urb. Mayorazgo IV Etapa, Ate, Lima 15012, Perú (URL: https://www.gob.pe/igp); Observatorio Volcanologico del INGEMMET (Instituto Geológical Minero y Metalúrgico), Barrio Magisterial Nro. 2 B-16 Umacollo - Yanahuara Arequipa, Peru (URL: http://ovi.ingemmet.gob.pe); Gobierno Regional Moquegua, Sede Principal De Moquegua, R377+5RR, Los Chirimoyos, Moquegua 18001, Peru (URL: https://www.gob.pe/regionmoquegua); Washington Volcanic Ash Advisory Center (VAAC), Satellite Analysis Branch (SAB), NOAA/NESDIS OSPO, NOAA Science Center Room 401, 5200 Auth Rd, Camp Springs, MD 20746, USA (URL: www.ospo.noaa.gov/Products/atmosphere/vaac, archive at: http://www.ssd.noaa.gov/VAAC/archive.html); MIROVA (Middle InfraRed Observation of Volcanic Activity), a collaborative project between the Universities of Turin and Florence (Italy) supported by the Centre for Volcanic Risk of the Italian Civil Protection Department (URL: http://www.mirovaweb.it/); Copernicus Browser, Copernicus Data Space Ecosystem, European Space Agency (URL: https://dataspace.copernicus.eu/browser/).
Kanaga (United States) — January 2024 Cite this Report
Kanaga
United States
51.923°N, 177.168°W; summit elev. 1307 m
All times are local (unless otherwise noted)
Small explosion on 18 December 2023
Kanaga lies within the Kanaton caldera at the northern tip of Kanaga Island. The caldera rim forms a 760-m-high arcuate ridge south and east of Kanaga; a lake occupies part of the SE caldera floor. Most of its previous recorded eruptions are poorly documented, although they date back to 1763. Fumarolic activity at Kanaga occurs in a circular, 200-m-wide, 60-m-deep summit crater and produces vapor plumes sometimes seen on clear days from Adak, 50 km to the east. Its most recent eruption occurred in February 2012, which consisted of numerous small earthquakes, a possible weak ash cloud, and gas-and-steam emissions (BGVN 38:03). This report covers a new eruption during December 2023, based on information from the Alaska Volcano Observatory (AVO).
A small explosion was detected in local infrasound and seismic data at 2231 on 18 December, followed by elevated seismicity. No ash emissions were visible in partly cloudy satellite images. On 19 December the Volcano Alert Level (VAL) was raised to Advisory (the second level on a four-level scale) and the Aviation Color Code (ACC) was raised to Yellow (the second color on a four-color scale). The rate of seismicity significantly declined after the 18th, although it remained elevated through 30 December. Small, daily earthquakes occurred during 19-28 December. Satellite observations following the event showed a debris flow extending 1.5 km down the NW flank. Possible minor gas-and-steam emissions were visible in a webcam image on 20 December. Weakly elevated surface temperatures were identified in satellite data during 23-26 December. A series of cracks extending from the inner crater to the upper SE flank and debris deposits on the upper flanks were observed in satellite images on 27 December. AVO reported that these were likely formed during the 18 December event. Local webcam and seismic data were temporarily offline due to a power failure during 4-28 January.
On 28 January connection to the seismic stations and webcams was restored and webcam images showed gas-and-steam emissions at the summit. Occasional earthquakes were also detected each day. A period of weak seismic tremor was observed on 31 January. During February, the number of earthquakes declined. On 27 February AVO lowered the VAL to Normal (the lowest level on a four-level scale) and the ACC to Green (the lowest color on a four-color scale) due to decreased levels of seismicity and no new surface changes or elevated temperatures based on satellite and webcam data.
Geologic Background. Symmetrical Kanaga stratovolcano is situated within the Kanaton caldera at the northern tip of Kanaga Island. The caldera rim forms a 760-m-high arcuate ridge south and east of Kanaga; a lake occupies part of the SE caldera floor. The volume of subaerial dacitic tuff is smaller than would typically be associated with caldera collapse, and deposits of a massive submarine debris avalanche associated with edifice collapse extend nearly 30 km to the NNW. Several fresh lava flows from historical or late prehistorical time descend the flanks of Kanaga, in some cases to the sea. Historical eruptions, most of which are poorly documented, have been recorded since 1763. Kanaga is also noted petrologically for ultramafic inclusions within an outcrop of alkaline basalt SW of the volcano. Fumarolic activity occurs in a circular, 200-m-wide, 60-m-deep summit crater and produces vapor plumes sometimes seen on clear days from Adak, 50 km to the east.
Information Contacts: Alaska Volcano Observatory (AVO), a cooperative program of a) U.S. Geological Survey, 4200 University Drive, Anchorage, AK 99508-4667 USA (URL: https://avo.alaska.edu/), b) Geophysical Institute, University of Alaska, PO Box 757320, Fairbanks, AK 99775-7320, USA, and c) Alaska Division of Geological & Geophysical Surveys, 794 University Ave., Suite 200, Fairbanks, AK 99709, USA (URL: http://dggs.alaska.gov/).
Klyuchevskoy (Russia) — January 2024 Cite this Report
Klyuchevskoy
Russia
56.056°N, 160.642°E; summit elev. 4754 m
All times are local (unless otherwise noted)
New eruption consisting of Strombolian activity, lava flows and fountains, and ash plumes during June-December 2023
Klyuchevskoy, located on the Kamchatka Peninsula, has produced frequent moderate-volume explosive and effusive eruptions and more than 100 flank eruptions have occurred during the past 3,000 years. Eruptions recorded since the late 17th century have resulted in frequent changes to the morphology of the 700-m-wide summit crater. Eruptions over the past 400 years have primarily originated from the summit crater, although numerous major explosive and effusive eruptions have also occurred from flank craters. The previous eruption ended in November 2022 and consisted of Strombolian activity (BGVN 47:12). This report covers a new eruption during June through December 2023, characterized by Strombolian explosions, lava flows, and ash plumes. Information primarily comes from weekly and daily reports from the Kamchatkan Volcanic Eruption Response Team (KVERT) and various satellite data.
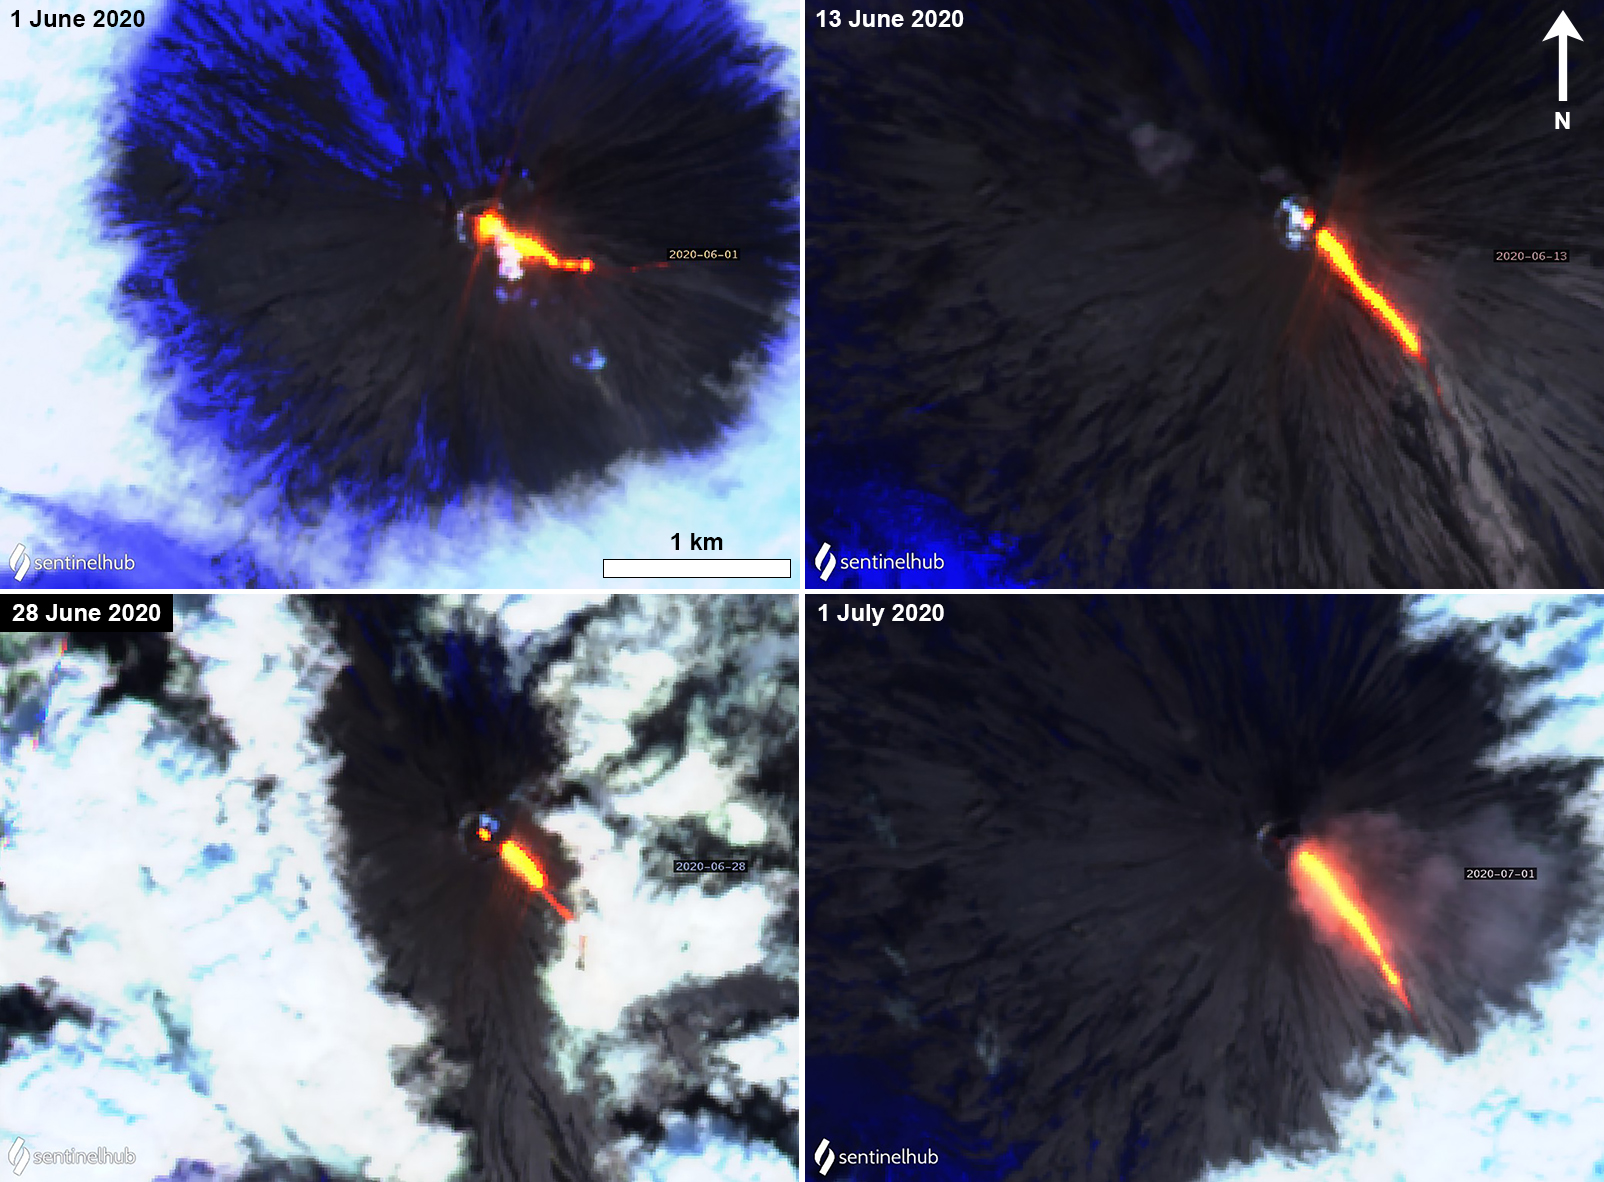
KVERT reported that a Strombolian eruption began at 2323 on 22 June. A thermal anomaly was visible in satellite data starting on 22 June (figure 75). As a result, the Aviation Color Code (ACC) was raised to Yellow (the second lowest level on a four-color scale). During 4-6 and 13 July small ash clouds were occasionally observed over the crater. On 19 July a new lava flow began to effuse along the Apakhonchich drainage on the SE flank, which continued through 19 August. Lava fountaining was reported on 21 July in addition to the active lava flow, which continued through 23 August and during 27-30 August. During 22-23 and 27-30 August the lava flow was active along the Apakhonchich drainage on the SE flank.
Similar activity was observed during September. Lava fountaining resumed on 2 September and continued through 31 October. In addition, on 2 September a lava flow began to effuse along the Kozyrevsky drainage on the SW flank. During 3-5 September resuspended ash plumes rose to 3-3.5 km altitude and extended as far as 170 km E by 1940 on 4 September. The ACC was raised to Orange (the third level on a four-color scale) at 1240 on 4 September. The ACC was briefly lowered back to Yellow at 1954 that same day before returning to Orange during 1532-1808 on 5 September due to resuspended ash plumes that rose to 3 km altitude and drifted 120 km E at 1500. KVERT reported that Strombolian activity continued, feeding the lava flows advancing down the Apakhonchichsky and Kozyrevsky drainages through most of the month. During 25 September through 16 October the lava flow was only active in the Apakhonchichisky drainage (figure 76). During 9-12 September resuspended ash plumes rose to 1.5-4 km altitude and extended 550 km E and SE. On 22 September resuspended ash plumes rose to 2-2.5 km altitude and drifted 50-90 km E, which prompted KVERT to raise the ACC to Orange; the ACC was lowered back to Yellow on 24 September. On 29 September phreatic explosions generated ash plumes that rose to 5.2-5.3 km altitude.
Activity during October continued with lava fountains, lava flows, and ash plumes. Strombolian activity with lava fountains continued at the crater and active lava flows alternately descended the Apakhonchichisky and Kozyrevsky drainages on the SE and S flanks (figure 77). During 11-12 October gas-and-steam plumes containing some ash rose to 5.5-6 km altitude and extended as far as 65 km NE and SE. The ACC was raised to Orange on 11 October. According to observers at the Kamchatka Volcanological Station, lava effusion was almost continuous, and incandescent material was ejected as high as 300 m above the crater rim. On 13 October at 1420 an ash plume rose to 5-5.5 km altitude and drifted 90-100 km SE. During 14-16 October gas-and-steam plumes containing some ash rose to 4-6 km altitude and drifted 40-145 km ESE and E. On 16 October lava on the SE flank melted the snow and ice, causing phreatic explosions and large collapses of material from the margins of the flow. At 1500 an ash plume rose to 6.5-7 km altitude and drifted 70 km ENE. On 17 October an ash plume was reported extending 360 km NE. Gray-red ashfall was observed in Klyuchi at 0700; this ash was resuspended from older material.
During 22-31 October phreatic explosions generated ash plumes mainly containing ash from collapses of previously deposited pyroclastic material that rose to 7 km altitude and extended as far as 280 km NE, E, SW, and S on 23 and 29 October the ash plumes rose to 8 km altitude. Ash plumes during 27-29 October rose to 8 km altitude and drifted as far as 300 km SE, ESE, and E. Lava fountains rose up to 500 m above the crater during 27-31 October. Scientists from the Kamchatka Volcanological Station visited the volcano on 28 October and reported that the cinder cone at the summit had grown. They also observed advancing lava on the E flank that extended about 2 km from the summit to 2,700 m elevation, incandescent ejecta 500 m above the crater, and avalanches in the Apakhonchichsky drainage. On 31 October activity intensified, and lava flows were reported moving in the Kretovsky, Kozyrevsky, and Apakhonchichisky drainages on the NW, SW, and SE flanks. At 0930 an ash plume rose to 7 km altitude and at first drifted 169 km SW and then 646 km SE. KVERT reported ash plumes rose to 14 km altitude and extended as far as 1,500 km SSE. The ACC was raised to Red (the highest level on a four-color scale). During 31 October to 1 November ash plumes rose as high as 14 km altitude and drifted as far as 2,255 km ESE.
Activity on 1 November intensified. The lava fountains rose as high as 1 km above the summit (figure 78) and fed the lava flows that were active on the Kretovsky, Kozyrevsky, and Apakhonchichsky drainages on the NW, SW, and SE flanks. Ash plumes rose to 10-14 km altitude and drifted as far as 1,500 km SSE (figure 79). According to the Kamchatka Volcanological Station, observers reported pyroclastic flows descending the flanks. Lahars descended the Studenoy River, blocking the Kozyrevsky-Petropavlovsk federal highway and descended the Krutenkaya River, blocking the road E of Klyuchi. According to news articles the ash plumes caused some flight cancellations and disruptions in the Aleutians, British Columbia (Canada), and along flight paths connecting the Unites States to Japan and South Korea. Ash plumes containing old ash from collapses in the Apakhonchichsky drainage due to phreatic explosions rose to 9.5-9.8 km altitude and drifted 192 km SW at 1400 and to 8.7 km altitude and drifted 192 km SW at 1710 on 1 November.
On 2 November ash plumes rose to 6-14 km altitude; the ash plume that rose to 14 km altitude decreased to 6.5 km altitude and drifted NNE by 2000 and continued to drift more than 3,000 km ESE and E. The ACC was lowered to Orange. On 3 November ash plumes rose to 5-8.2 km altitude and drifted 72-538 km ENE, NNE, and ESE; at 0850 an ash plume rose to 6-6.5 km altitude and drifted more than 3,000 km ESE throughout the day. During 4-6 and 8-10 November resuspended ash plumes associated with collapses of old pyroclastic material from the sides of the Apakhonchichsky drainage due to phreatic explosions rose to 4.5-5.5 km altitude and extended 114-258 km NE, ENE, and E. KVERT reported that the eruption stopped on 5 November and the lava flows had begun to cool. Resuspended ash plumes rose to 5-6 km altitude and drifted 60 km E at 0820 on 13 November and to 5 km and 4.5 km altitude at 1110 and 1430 and drifted 140 km E and 150 km ESE, respectively. On 15 November the ACC was lowered to Green.
Activity was relatively low during most of December. On 27 December Strombolian activity resumed based on a thermal anomaly visible in satellite data. On 30 December an ash plume rose to 6 km altitude and extended 195 km NW. The ACC was raised to Orange. On 31 December video and satellite data showed explosions that generated ash plumes that rose to 5-6.5 km altitude and drifted 50-230 km WNW and NW. Though a thermal anomaly persisted through 1 January 2024, no explosions were detected, so the ACC was lowered to Yellow.
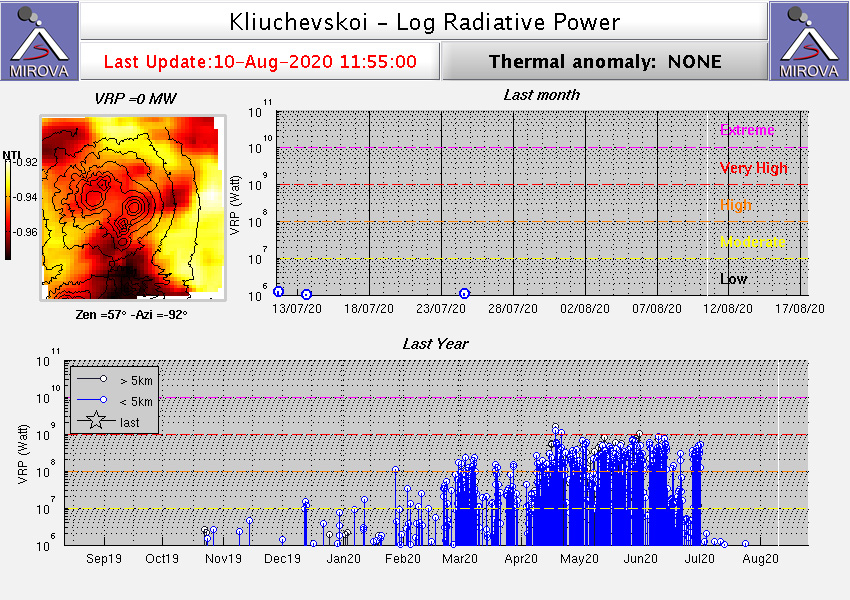
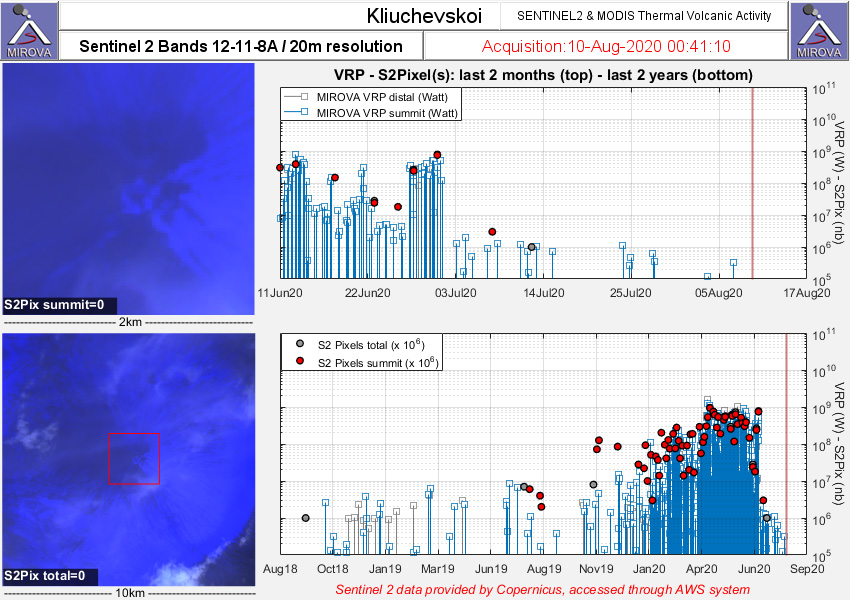
Satellite data. Thermal activity was strong throughout the reporting period due to frequent lava fountaining and lava flows. MODIS thermal anomaly data provided through MIROVA (Middle InfraRed Observation of Volcanic Activity) showed strong activity during the entire reporting period, resulting from lava fountaining and lava flows (figure 80). According to data from MODVOLC thermal alerts, a total of 336 hotspots were detected in June (3), July (30), August (11), September (52), October (217), and November (23). Thermal activity was also visible in infrared satellite images, often showing a strong thermal anomaly at the summit crater and a lava flow affecting primarily the SE and SW flanks (figure 81).
Geologic Background. Klyuchevskoy is the highest and most active volcano on the Kamchatka Peninsula. Since its origin about 6,000 years ago, this symmetrical, basaltic stratovolcano has produced frequent moderate-volume explosive and effusive eruptions without major periods of inactivity. It rises above a saddle NE of Kamen volcano and lies SE of the broad Ushkovsky massif. More than 100 flank eruptions have occurred during approximately the past 3,000 years, with most lateral craters and cones occurring along radial fissures between the unconfined NE-to-SE flanks of the conical volcano between 500 and 3,600 m elevation. Eruptions recorded since the late 17th century have resulted in frequent changes to the morphology of the 700-m-wide summit crater. These eruptions over the past 400 years have originated primarily from the summit crater, but have also included numerous major explosive and effusive eruptions from flank craters.
Information Contacts: Kamchatka Volcanic Eruptions Response Team (KVERT), Far Eastern Branch, Russian Academy of Sciences, 9 Piip Blvd., Petropavlovsk-Kamchatsky, 683006, Russia (URL: http://www.kscnet.ru/ivs/kvert/); Kamchatka Volcanological Station, Kamchatka Branch of Geophysical Survey, (KB GS RAS), Klyuchi, Kamchatka Krai, Russia (URL: http://volkstat.ru/); MIROVA (Middle InfraRed Observation of Volcanic Activity), a collaborative project between the Universities of Turin and Florence (Italy) supported by the Centre for Volcanic Risk of the Italian Civil Protection Department (URL: http://www.mirovaweb.it/); Hawai'i Institute of Geophysics and Planetology (HIGP) - MODVOLC Thermal Alerts System, School of Ocean and Earth Science and Technology (SOEST), Univ. of Hawai'i, 2525 Correa Road, Honolulu, HI 96822, USA (URL: http://modis.higp.hawaii.edu/); Copernicus Browser, Copernicus Data Space Ecosystem, European Space Agency (URL: https://dataspace.copernicus.eu/browser/).
Agung (Indonesia) — January 2024 Cite this Report
Agung
Indonesia
8.343°S, 115.508°E; summit elev. 2997 m
All times are local (unless otherwise noted)
Three eruptive events reported in April, May, and December 2022
Mount Agung, located on the E end of the island of Bali, Indonesia, rises above the SE rim of the Batur caldera. The summit area extends 1.5 km E-W, with the highest point on the W and a steep-walled 800-m-wide crater on the E. Recorded eruptions date back to the early 19th century. A large and deadly explosive and effusive eruption occurred during 1963-64, which was characterized by voluminous ashfall, pyroclastic flows, and lahars that caused extensive damage and many fatalities. More recent activity was documented during November 2017-June 2019 that consisted of multiple explosions, significant ash plumes, lava flows at the summit crater, and incandescent ejecta. This report covers activity reported during April-May 2022 and December 2022 based on data from the Darwin Volcanic Ash Advisory Center (VAAC).
Activity during 2022 was relatively low and mainly consisted of a few ash plumes during April-May and December. An ash plume on 3 April rising to 3.7 km altitude (700 m above the summit) and drifting N was reported in a Darwin VAAC notice based on a ground report, with ash seen in HIMAWARI-8 visible imagery. Another ash plume was reported at 1120 on 27 May that rose to 5.5 km altitude (2.5 m above the summit); the plume was not visible in satellite or webcam images due to weather clouds. An eruption was reported based on seismic data at 0840 on 13 December, with an estimated plume altitude of 3.7 km; however, no ash was seen using satellite imagery in clear conditions before weather clouds obscured the summit.
Geologic Background. Symmetrical Agung stratovolcano, Bali's highest and most sacred mountain, towers over the eastern end of the island. The volcano, whose name means "Paramount," rises above the SE rim of the Batur caldera, and the northern and southern flanks extend to the coast. The summit area extends 1.5 km E-W, with the high point on the W and a steep-walled 800-m-wide crater on the E. The Pawon cone is located low on the SE flank. Only a few eruptions dating back to the early 19th century have been recorded in historical time. The 1963-64 eruption, one of the largest in the 20th century, produced voluminous ashfall along with devastating pyroclastic flows and lahars that caused extensive damage and many fatalities.
Information Contacts: Darwin Volcanic Ash Advisory Centre (VAAC), Bureau of Meteorology, Northern Territory Regional Office, PO Box 40050, Casuarina, NT 0811, Australia (URL: http://www.bom.gov.au/info/vaac/).
Saunders (United Kingdom) — February 2024 Cite this Report
Saunders
United Kingdom
57.8°S, 26.483°W; summit elev. 843 m
All times are local (unless otherwise noted)
Persistent thermal anomalies from the summit crater lava lake during February 2023-January 2024
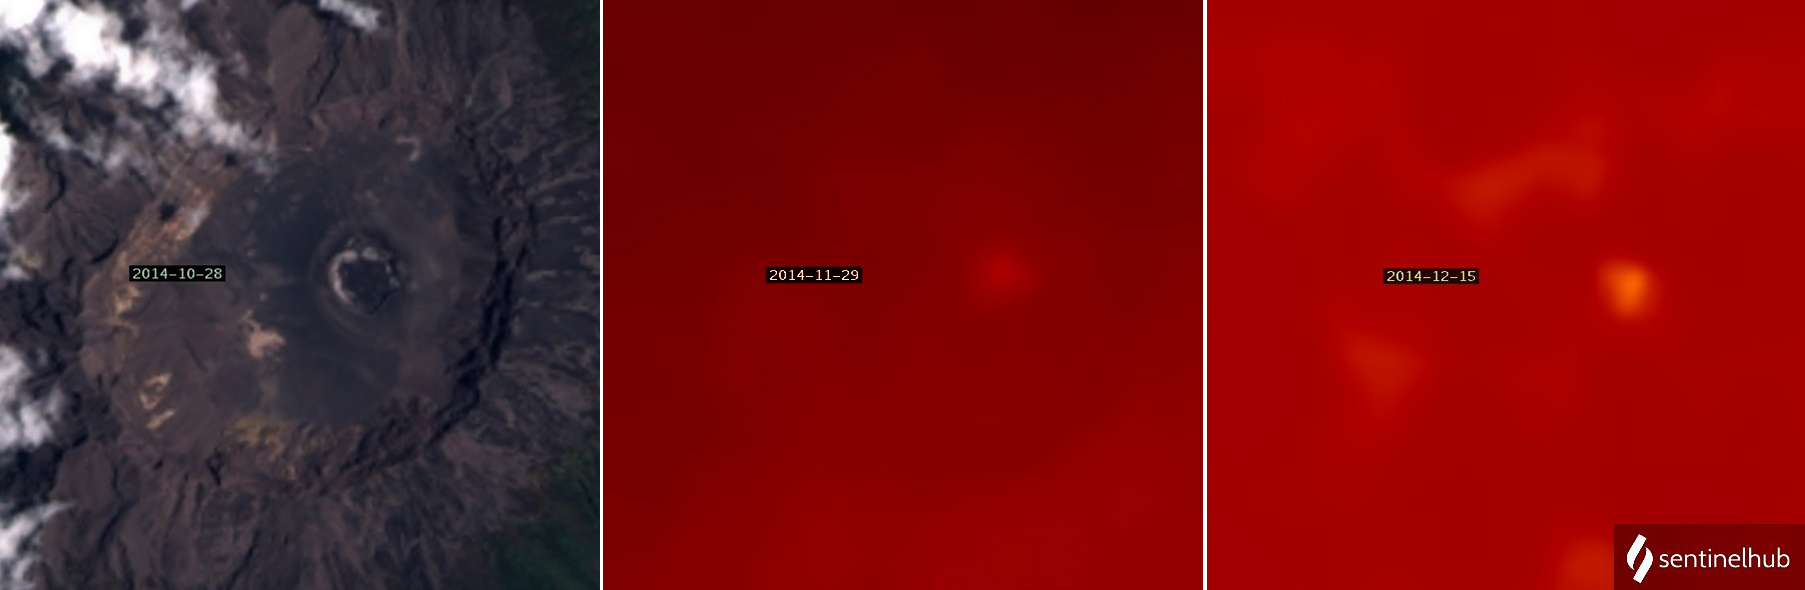
Saunders is one of eleven islands that comprise the South Sandwich Islands in the South Atlantic. The active Mount Michael volcano has been in almost continuous eruption since November 2014 (BGVN 48:02). Recent activity has resulted in intermittent thermal anomalies and gas-and-steam emissions (BGVN 47:03, 48:02). Visits are infrequent due to its remote location, and cloud cover often prevents satellite observations. Satellite thermal imagery and visual observation of incandescence during a research expedition in 2019 (BGVN 28:02 and 44:08) and a finding confirmed by a National Geographic Society research team that summited Michael in November 2022 reported the presence of a lava lake.
Although nearly constant cloud cover during February 2023 through January 2024 greatly limited satellite observations, thermal anomalies from the lava lake in the summit crater were detected on clear days, especially around 20-23 August 2023. Anomalies similar to previous years (eg. BGVN 48:02) were seen in both MIROVA (Middle InfraRed Observation of Volcanic Activity) data from MODIS instruments and in Sentinel 2 infrared imagery. The only notable sulfur dioxide plume detected near Saunders was on 25 September 2023, with the TROPOMI instrument aboard the Sentinel-5P satellite.
Geologic Background. Saunders Island consists of a large central volcanic edifice intersected by two seamount chains, as shown by bathymetric mapping (Leat et al., 2013). The young Mount Michael stratovolcano dominates the glacier-covered island, while two submarine plateaus, Harpers Bank and Saunders Bank, extend north. The symmetrical Michael has a 500-m-wide summit crater and a remnant of a somma rim to the SE. Tephra layers visible in ice cliffs surrounding the island are evidence of recent eruptions. Ash clouds were reported from the summit crater in 1819, and an effusive eruption was inferred to have occurred from a N-flank fissure around the end of the 19th century and beginning of the 20th century. A low ice-free lava platform, Blackstone Plain, is located on the north coast, surrounding a group of former sea stacks. A cluster of cones on the SE flank, the Ashen Hills, appear to have been modified since 1820 (LeMasurier and Thomson, 1990). Analysis of satellite imagery available since 1989 (Gray et al., 2019; MODVOLC) suggests frequent eruptive activity (when weather conditions allow), volcanic clouds, steam plumes, and thermal anomalies indicative of a persistent, or at least frequently active, lava lake in the summit crater. Due to this observational bias, there has been a presumption when defining eruptive periods that activity has been ongoing unless there is no evidence for at least 10 months.
Information Contacts: MIROVA (Middle InfraRed Observation of Volcanic Activity), a collaborative project between the Universities of Turin and Florence (Italy) supported by the Centre for Volcanic Risk of the Italian Civil Protection Department (URL: http://www.mirovaweb.it/); NASA Global Sulfur Dioxide Monitoring Page, Atmospheric Chemistry and Dynamics Laboratory, NASA Goddard Space Flight Center (NASA/GSFC), 8800 Greenbelt Road, Goddard MD 20771, USA (URL: https://so2.gsfc.nasa.gov/); Copernicus Browser (URL: https://dataspace.copernicus.eu/browser).
Tengger Caldera (Indonesia) — February 2024 Cite this Report
Tengger Caldera
Indonesia
7.942°S, 112.95°E; summit elev. 2329 m
All times are local (unless otherwise noted)
Minor ash emission in December 2023; persistent weak thermal anomaly in the Bromo crater
Tengger Caldera, located at the N end of a volcanic massif in Indonesia’s East Java, consists of five overlapping stratovolcanoes. The youngest and only active cone in the 16-km-wide caldera is Bromo, which typically produces gas-and-steam plumes, occasional ash plumes and explosions, and weak thermal signals (BGVN 44:05, 47:01). This report covers activity during January 2022-December 2023, consisting of mostly white gas-and-steam emissions and persistent weak thermal anomalies. Information was provided by the Pusat Vulkanologi dan Mitigasi Bencana Geologi (PVMBG, also known as Indonesian Center for Volcanology and Geological Hazard Mitigation, CVGHM) and satellite imagery. The Alert Level remained at 2 (on a scale of 1-4), and visitors were warned to stay at least 1 km from the crater.
Activity was generally low during the reporting period, similar to that in 2021. According to almost daily images from MAGMA Indonesia (a platform developed by PVMBG), white emissions and plumes rose from 50 to 900 m above the main crater during this period (figure 24). During several days in March and June 2022, white plumes reached heights of 1-1.2 km above the crater.
After an increase in activity at 2114 on 3 February 2023, a PVMBG team that was sent to observe white emissions rising as high as 300 m during 9-12 February and heard rumbling noises. A sulfur dioxide odor was also strong near the crater and measurements indicated that levels were above the healthy (non-hazardous) threshold of 5 parts per million; differential optical absorption spectroscopy (DOAS) measurements indicated an average flux of 190 metric tons per day on 11 February. Incandescence originating from a large fumarole in the NNW part of the crater was visible at night. The team observed that vegetation on the E caldera wall was yellow and withered. The seismic network recorded continuous tremor and deep and shallow volcanic earthquakes.
According to a PVMBG press release, activity increased on 13 December 2023 with white, gray, and brown emissions rising as high as 900 m above Bromo’s crater rim and drifting in multiple directions (figure 25). The report noted that tremor was continuous and was accompanied in December by three volcanic earthquakes. Deformation data indicated inflation in December. There was no observable difference in the persistent thermal anomaly in the crater between 11 and 16 December 2023.
All clear views of the Bromo crater throughout this time, using Sentinel-2 infrared satellite images, showed a weak persistent thermal anomaly; none of the anomalies were strong enough to cause MODVOLC Thermal Alerts. A fire in the SE part of the caldera in early September 2023 resulted in a brief period of strong thermal anomalies.
Geologic Background. The 16-km-wide Tengger caldera is located at the northern end of a volcanic massif extending from Semeru volcano. The massive volcanic complex dates back to about 820,000 years ago and consists of five overlapping stratovolcanoes, each truncated by a caldera. Lava domes, pyroclastic cones, and a maar occupy the flanks of the massif. The Ngadisari caldera at the NE end of the complex formed about 150,000 years ago and is now drained through the Sapikerep valley. The most recent of the calderas is the 9 x 10 km wide Sandsea caldera at the SW end of the complex, which formed incrementally during the late Pleistocene and early Holocene. An overlapping cluster of post-caldera cones was constructed on the floor of the Sandsea caldera within the past several thousand years. The youngest of these is Bromo, one of Java's most active and most frequently visited volcanoes.
Information Contacts: Pusat Vulkanologi dan Mitigasi Bencana Geologi (PVMBG, also known as Indonesian Center for Volcanology and Geological Hazard Mitigation, CVGHM), Jalan Diponegoro 57, Bandung 40122, Indonesia (URL: http://www.vsi.esdm.go.id/); MAGMA Indonesia, Kementerian Energi dan Sumber Daya Mineral (URL: https://magma.esdm.go.id/v1); Copernicus Browser, Copernicus Data Space Ecosystem, European Space Agency (URL: https://dataspace.copernicus.eu/browser/); Hawai'i Institute of Geophysics and Planetology (HIGP) - MODVOLC Thermal Alerts System, School of Ocean and Earth Science and Technology (SOEST), Univ. of Hawai'i, 2525 Correa Road, Honolulu, HI 96822, USA (URL: http://modis.higp.hawaii.edu/).
Shishaldin (United States) — December 2023 Cite this Report
Shishaldin
United States
54.756°N, 163.97°W; summit elev. 2857 m
All times are local (unless otherwise noted)
New eruption with significant Strombolian explosions, ash plumes, and ashfall
Shishaldin is located on the eastern half of Unimak Island, one of the Aleutian Islands. Frequent explosive activity, primarily consisting of Strombolian ash eruptions from the small summit crater, but sometimes producing lava flows, has been recorded since the 18th century. The previous eruption ended in May 2020 and was characterized by intermittent thermal activity, increased seismicity and surface temperatures, ash plumes, and ash deposits (BGVN 45:06). This report covers a new eruption during July through November 2023, which consisted of significant explosions, ash plumes, ashfall, and lava fountaining. Information comes from daily, weekly, and special reports from the Alaska Volcano Observatory (AVO) and various satellite data. AVO monitors the volcano using local seismic and infrasound sensors, satellite data, web cameras, and remote infrasound and lightning networks.
AVO reported that intermittent tremor and low-frequency earthquakes had gradually become more regular and consistent during 10-13 July. Strongly elevated surface temperatures at the summit were identified in satellite images during 10-13 July. On 11 July AVO raised the Aviation Color Code (ACC) to Yellow (the second color on a four-color scale) and Volcano Alert Level (VAL) to Advisory (the second level on a four-level scale) at 1439. Later in the day on 11 July summit crater incandescence was observed in webcam images. Observations of the summit suggested that lava was likely present at the crater, which prompted AVO to raise the ACC to Orange (the second highest color on a four-color scale) and the VAL to Watch (the second highest level on a four-level scale). The US Coast Guard conducted an overflight on 12 July and confirmed that lava was erupting from the summit. That same day, sulfur dioxide emissions were detected in satellite images.
A significant explosion began at 0109 on 14 July that produced an ash plume that rose to 9-12 km altitude and drifted S over the Pacific Ocean (figure 43). Webcam images and photos taken around 0700 from a ship SW off Unimak Island showed small lahar deposits, which were the result of the interaction of hot pyroclastic material and snow and ice on the flanks. There was also ashfall on the SW and N flanks. A smaller explosion at 0710 generated an ash plume that rose to 4.5 km altitude. Webcam images and pilot reports showed continued low-level ash emissions during the morning, rising to less than 4.6 km altitude; those emissions included a small ash plume near the summit around 1030 resulting from a small explosion.
Seismic tremor amplitude began increasing at around 1700 on 15 July; strongly elevated surface temperatures were also reported. An ash plume rose to 4.6 km altitude and drifted SSE at 2100, based on a satellite image. A continuous ash plume during 2150 through 2330 rose to 5 km altitude and extended 125 km S. At 2357 AVO raised the ACC to Red (the highest color on a four-color scale) and the VAL to Warning (the highest level on a four-level scale), noting that seismicity remained elevated for more than six hours and explosion signals were frequently detected by regional infrasound (pressure sensor) networks. Explosions generated an ash plume that rose to 4.9 km altitude and drifted as far as 500 km SE. Activity throughout the night declined and by 0735 the ACC was lowered to Orange and the VAL to Watch. High-resolution satellite images taken on 16 July showed pyroclastic deposits extending as far as 3 km from the vent; these deposits generated lahars that extended further down the drainages on the flanks. Ash deposits were mainly observed on the SSE flank and extended to the shore of Unimak Island. During 16-17 July lava continued to erupt at the summit, which caused strongly elevated surface temperatures that were visible in satellite imagery.
Lava effusion increased at 0100 on 18 July, as noted in elevated surface temperatures identified in satellite data, increasing seismic tremor, and activity detected on regional infrasound arrays. A significant ash plume at 0700 rose to 7 km altitude and continued until 0830, eventually reaching 9.1 km altitude and drifting SSE (figure 44). As a result, the ACC was raised to Red and the VAL to Warning. By 0930 the main plume detached, but residual low-level ash emissions continued for several hours, remaining below 3 km altitude and drifting S. The eruption gradually declined and by 1208 the ACC was lowered to Orange and the VAL was lowered to Watch. High-resolution satellite images showed ash deposits on the SW flank and pyroclastic deposits on the N, E, and S flanks, extending as far as 3 km from the vent; lahars triggered by the eruption extended farther down the flanks (figure 45). Lava continued to erupt from the summit crater on 19 July.
Elevated surface temperatures were detected in satellite images during 19-25 July, despite occasional weather cloud cover, which was consistent with increased lava effusion. During 22-23 July satellite observations acquired after the eruption from 18 July showed pyroclastic flow and lahar deposits extending as far as 3 km down the N, NW, and NE flanks and as far as 1.5 km down the S and SE flanks. Ash deposits covered the SW and NE flanks. No lava flows were observed outside the crater. On 22 July a sulfur dioxide plume was detected in satellite data midday that had an estimated mass of 10 kt. In a special notice issued at 1653 on 22 July AVO noted that eruptive activity had intensified over the previous six hours, which was characterized by an hours-long steady increase in seismic tremor, intermittent infrasound signals consistent with small explosions, and an increase in surface temperatures that were visible in satellite data. Pilots first reported low-level ash plumes at around 1900. At 2320 an ash plume had risen to 9 km altitude based on additional pilot reports and satellite images. The ACC was increased to Red and the VAL to Warning at 2343. Satellite images indicated growth of a significantly higher ash plume that rose to 11 km altitude continued until 0030 and drifted NE. During the early morning hours of 23 July ash plumes had declined to 4.6 k altitude. Seismic tremor peaked at 0030 on 23 July and began to rapidly decline at 0109; active ash emissions were no longer visible in satellite data by 0130. The ACC was lowered to Orange and the VAL to Watch at 0418; bursts of increased seismicity were recorded throughout the morning, but seismicity generally remained at low levels. Elevated surface temperatures were visible in satellite data until about 0600. On 24 July pilots reported seeing vigorous gas-and-steam plumes rising to about 3 km altitude; the plumes may have contained minor amounts of ash.
During 24-25 July low level seismicity and volcanic tremor were detected at low levels following the previous explosion on 23 July. Strongly elevated surface temperatures were observed at the summit crater in satellite data. Around 2200 on 25 July seismicity began to increase, followed by infrasound signals of explosions after 0200 on 26 July. An ash plume rose to 3 km altitude at 0500 and drifted ENE, along with an associated sulfur dioxide plume that drifted NE and had an estimated mass of 22 kt. Diffuse ash emissions were visible in satellite data and rose to 6.1-7.6 km altitude and extended 125 km from the volcano starting around 1130. These ash events were preceded by about seven hours of seismic tremor, infrasound detections of explosions, and five hours of increased surface temperatures visible in satellite data. Activity began to decline around 1327, which included low-frequency earthquakes and decreased volcanic tremor, and infrasound data no longer detected significant explosions. Surface temperatures remained elevated through the end of the month.
Seismicity, volcanic tremor, and ash emissions remained at low levels during early August. Satellite images on 1 August showed that some slumping had occurred on the E crater wall due to the recent explosive activity. Elevated surface temperatures continued, which was consistent with cooling lava. On 2 August small explosive events were detected, consistent with low-level Strombolian activity. Some episodes of volcanic tremor were reported, which reflected low-level ash emissions. Those ash emissions rose to less than 3 km altitude and drifted as far as 92.6 km N. Pilots that were located N of the volcano observed an ash plume that rose to 2.7 km altitude. Seismicity began to increase in intensity around 0900 on 3 August. Seismicity continued to increase throughout the day and through the night with strongly elevated surface temperatures, which suggested that lava was active at the surface.
An ash cloud that rose to 7.6-7.9 km altitude and drifted 60-75 km NE was visible in a satellite image at 0520 on 4 August. Pilots saw and reported the plume at 0836 (figure 46). By 0900 the plume had risen to 9.1 km altitude and extended over 100 km NE. AVO raised the ACC to Red and the VAL to Warning as a result. Seismic tremor levels peaked at 1400 and then sharply declined at 1500 to slightly elevated levels; the plume was sustained during the period of high tremor and drifted N and NE. The ACC was lowered to Orange and the VAL to Watch at 2055. During 5-14 August seismicity remained low and surface temperatures were elevated based on satellite data due to cooling lava. On 9 August a small lava flow was observed that extended from the crater rim to the upper NE flank. It had advanced to 55 m in length and appeared in satellite imagery on 11 August. Occasional gas-and-steam plumes were noted in webcam images. At 1827 AVO noted that seismic tremor had steadily increased during the afternoon and erupting lava was visible at the summit in satellite images.
Strong explosion signals were detected at 0200 on 15 August. An ash cloud that was visible in satellite data extended 100 km NE and may have risen as high as 11 km altitude around 0240. By 0335 satellite images showed the ash cloud rising to 7.6 km altitude and drifting NE. Significant seismicity and explosions were detected by the local AVO seismic and infrasound networks, and volcanic lightning was detected by the World Wide Lightning Location Network (WWLLN). A sulfur dioxide plume associated with the eruption drifted over the S Bering Sea and parts of Alaska and western Canada. Seismicity was significantly elevated during the eruption but had declined by 1322. A pilot reported that ash emissions continued, rising as high as 4.9 km altitude. Elevated surface temperatures detected in satellite data were caused by hot, eruptive material (pyroclastic debris and lava) that accumulated around the summit. Eruptive activity declined by 16 August and the associated sulfur dioxide plume had mostly dissipated; remnants continued to be identified in satellite images at least through 18 August. Surface temperatures remained elevated based on satellite images, indicating hot material on the upper parts of the volcano. Small explosions were detected in infrasound data on the morning of 19 August and were consistent with pilot reports of small, short-lived ash plumes that rose to about 4.3 km altitude. Low-level explosive activity was reported during 20-24 August, according to seismic and infrasound data, and weather clouds sometimes prevented views. Elevated surface temperatures were observed in satellite images, which indicated continued hot material on the upper parts of the volcano.
Seismic tremor began to increase at around 0300 on 25 August and was followed by elevated surface temperatures identified in satellite images, consistent with erupting lava. Small explosions were recorded in infrasound data. The ACC was raised to Red and the VAL to Warning at 1204 after a pilot reported an ash plume that rose to 9.1 km altitude. Seismicity peaked at 1630 and began to rapidly decline at around 1730. Ash plumes rose as high as 10 km altitude and drifted as far as 400 km NE. By 2020 the ash plumes had declined to 6.4 km altitude and continued to drift NE. Ash emissions were visible in satellite data until 0000 on 26 August and seismicity was at low levels. AVO lowered the ACC to Orange and the VAL to Watch at 0030. Minor explosive activity within the summit crater was detected during 26-28 August and strongly elevated surface temperatures were still visible in satellite imagery through the rest of the month. An AVO field crew working on Unimak Island observed a mass flow that descended the upper flanks beginning around 1720 on 27 August. The flow produced a short-lived ash cloud that rose to 4.5 km altitude and rapidly dissipated. The mass flow was likely caused by the collapse of spatter that accumulated on the summit crater rim.
Similar variable explosive activity was reported in September, although weather observations sometimes prevented observations. A moderate resolution satellite image from the afternoon of 1 September showed gas-and-steam emissions filling the summit crater and obscuring views of the vent. In addition, hot deposits from the previous 25-26 August explosive event were visible on the NE flank near the summit, based on a 1 September satellite image. On 2 and 4 September seismic and infrasound data showed signals of small, repetitive explosions. Variable gas-and-steam emissions from the summit were visible but there was no evidence of ash. Possible summit crater incandescence was visible in nighttime webcam images during 3-4 September.
Seismicity began to gradually increase at around 0300 on 5 September and activity escalated at around 0830. A pilot reported an ash plume that rose to 7.6 km altitude at 0842 and continued to rise as high as possibly 9.7 km altitude and drifted SSE based on satellite images (figure 47). The ACC was raised to Red and the VAL to Warning at 0900. In addition to strong tremor and sustained explosions, the eruption produced volcanic lightning that was detected by the WWLLN. Around 1100 seismicity decreased and satellite data confirmed that the altitude of the ash emissions had declined to 7.6 km altitude. By 1200 the lower-altitude portion of the ash plume had drifted 125 km E. Significant ash emissions ended by 1330 based on webcam images. The ACC was lowered to Orange and the VAL to Watch at 1440. Satellite images showed extensive pyroclastic debris flows on most of the flanks that extended 1.2-3.3 km from the crater rim.
During 6-13 September elevated surface temperatures continued to be observed in satellite data, seismicity remained elevated with weak but steady tremor, and small, low-frequency earthquakes and small explosions were reported, except on 12 September. On 6 September a low-level ash plume rose to 1.5-1.8 km altitude and drifted SSE. Occasional small and diffuse gas-and-steam emissions at the summit were visible in webcam images. Around 1800 on 13 September seismic tremor amplitudes began to increase, and small explosions were detected in seismic and infrasound data. Incandescent lava at the summit was seen in a webcam image taken at 0134 on 14 September during a period of elevated tremor. No ash emissions were reported during the period of elevated seismicity. Lava fountaining began around 0200, based on webcam images. Satellite-based radar observations showed that the lava fountaining activity led to the growth of a cone in the summit crater, which refilled most of the crater. By 0730 seismicity significantly declined and remained at low levels.
Seismic tremor began to increase around 0900 on 15 September and rapidly intensified. An explosive eruption began at around 1710, which prompted AVO to raise the ACC to Red and the VAL to Warning. Within about 30 minutes ash plumes drifted E below a weather cloud at 8.2 km altitude. The National Weather Service estimated that an ash-rich plume rose as high as 12.8 km altitude and produced volcanic lightning. The upper part of the ash plume detached from the vent around 1830 and drifted E, and was observed over the Gulf of Alaska. Around the same time, seismicity dramatically decreased. Trace ashfall was reported in the community of False Pass (38 km ENE) between 1800-2030 and also in King Cove and nearby marine waters. Activity declined at around 1830 although seismicity remained elevated, ash emissions, and ashfall continued until 2100. Lightning was again detected beginning around 1930, which suggested that ash emissions continued. Ongoing explosions were detected in infrasound data, at a lower level than during the most energetic phase of this event. Lightning was last detected at 2048. By 2124 the intensity of the eruption had decreased, and ash emissions were likely rising to less than 6.7 km altitude. Seismicity returned to pre-eruption levels. On 16 September the ACC was lowered to Orange and the VAL to Watch at 1244; the sulfur dioxide plume that was emitted from the previous eruption event was still visible over the northern Pacific Ocean. Elevated surface temperatures, gas-and-steam emissions from the vent, and new, small lahars were reported on the upper flanks based on satellite and webcam images. Minor deposits were reported on the flanks which were likely the result of collapse of previously accumulated lava near the summit crater.
Elevated seismicity with tremor, small earthquakes, and elevated surface temperatures were detected during 17-23 September. Minor gas-and-steam emissions were visible in webcam images. On 20 September small volcanic debris flows were reported on the upper flanks. On 21 September a small ash deposit was observed on the upper flanks extending to the NE based on webcam images. Seismic tremor increased significantly during 22-23 September. Regional infrasound sensors suggested that low-level eruptive activity was occurring within the summit crater by around 1800 on 23 September. Even though seismicity was at high levels, strongly elevated surface temperatures indicating lava at the surface were absent and no ash emissions were detected; weather clouds at 0.6-4.6 km altitude obscured views. At 0025 on 24 September AVO noted that seismicity continued at high levels and nearly continuous small infrasound signals began, likely from low-level eruptive activity. Strongly elevated surface temperatures were identified in satellite images by 0900 and persisted throughout the day; the higher temperatures along with infrasound and seismic data were consistent with lava erupting at the summit. Around 1700 similarly elevated surface temperatures were detected from the summit in satellite data, which suggested that more vigorous lava fountaining had started. Starting around 1800 low-level ash emissions rose to altitudes less than 4.6 km altitude and quickly dissipated.
Beginning at midnight on 25 September, a series of seismic signals consistent with volcanic flows were recorded on the N side of the volcano. A change in seismicity and infrasound signals occurred around 0535 and at 0540 a significant ash cloud formed and quickly reached 14 km altitude and drifted E along the Alaska Peninsula. The cloud generated at least 150 lightning strokes with thunder that could be heard by people in False Pass. Seismicity rapidly declined to near background levels around 0600. AVO increased the ACC to Red and the VAL to Warning at 0602. The ash cloud detached from the volcano at around 0700, rose to 11.6 km altitude, and drifted ESE. Trace to minor amounts of ashfall were reported by the communities of False Pass, King Cove, Cold Bay, and Sand Point around 0700. Ash emissions continued at lower altitudes of 6-7.6 km altitude at 0820. Small explosions at the vent area continued to be detected in infrasound data and likely represented low-level eruptive activity near the vent. Due to the significant decrease in seismicity and ash emissions the ACC was lowered to Orange and the VAL to Watch at 1234. Radar data showed significant collapses of the crater that occurred on 25 September. Satellite data also showed significant hot, degassing pyroclastic and lahar deposits on all flanks, including more extensive flows on the ENE and WSW sections below two new collapse scarps. Following the significant activity during 24-25 September, only low-level activity was observed. Seismicity decreased notably near the end of the strong activity on 25 September and continued to decrease through the end of the month, though tremor and small earthquakes were still reported. No explosive activity was detected in infrasound data through 2 October. Gas-and-steam emissions rose to 3.7 km altitude, as reported by pilots and seen in satellite images. Satellite data from 26 September showed that significant collapses had occurred at the summit crater and hot, steaming deposits from pyroclastic flows and lahars were present on all the flanks, particularly to the ENE and WSW. A small ash cloud was visible in webcam images on 27 September, likely from a collapse at the summit cone. High elevated surface temperatures were observed in satellite imagery during 27-28 September, which were likely the result of hot deposits on the flanks erupted on 25 September. Minor steaming at the summit crater and from an area on the upper flanks was visible in webcam images on 28 September.
During October, explosion events continued between periods of low activity. Seismicity significantly increased starting at around 2100 on 2 October; around the same time satellite images showed an increase in surface temperatures consistent with lava fountaining. Small, hot avalanches of rock and lava descended an unspecified flank. In addition, a distinct increase in infrasound, seismicity, and lightning detections was followed by an ash plume that rose to 12.2 km altitude and drifted S and E at 0520 on 3 October, based on satellite images. Nighttime webcam images showed incandescence due to lava fountaining at the summit and pyroclastic flows descending the NE flank. AVO reported that a notable explosive eruption started at 0547 and lasted until 0900 on 3 October, which prompted a rise in the ACC to Red and the VAL to Warning. Subsequent ash plumes rose to 6-7.6 km altitude by 0931. At 1036 the ACC was lowered back to Orange and the VAL to Watch since both seismic and infrasound data quieted substantially and were slightly above background levels. Gas-and-steam emissions were observed at the summit, based on webcam images. Trace amounts of ashfall were observed in Cold Bay. Resuspended ash was present at several kilometers altitude near the volcano. During the afternoon, low-level ash plumes were visible at the flanks, which appeared to be largely generated by rock avalanches off the summit crater following the explosive activity. These ash plumes rose to 3 km altitude and drifted W. Trace amounts of ashfall were reported by observers in Cold Bay and Unalaska and flights to these communities were disrupted by the ash cloud. Satellite images taken after the eruption showed evidence of pyroclastic flows and lahar deposits in drainages 2 km down the SW flank and about 3.2 km down the NE flank, and continued erosion of the crater rim. Small explosion craters at the end of the pyroclastic flows on the NE flank were noted for the first time, which may have resulted from gas-and-steam explosions when hot deposits interact with underlying ice.
During 4 October seismicity, including frequent small earthquakes, remained elevated, but was gradually declining. Ash plumes were produced for over eight hours until around 1400 that rose to below 3.7 km altitude. These ash plumes were primarily generated off the sides of the volcano where hot rock avalanches from the crater rim had entered drainages to the SW and NE. Two explosion craters were observed at the base of the NE deposits about 3.2 km from the crater rim. Webcam images showed the explosion craters were a source of persistent ash emissions; occasional collapse events also generated ash. Seismicity remained elevated with sulfur dioxide emissions that had a daily average of more than 1,000 tons per day, and frequent small earthquakes through the end of the month. Frequent elevated surface temperatures were identified in satellite images and gas-and-steam plumes were observed in webcam images, although weather conditions occasionally prevented clear views of the summit. Emissions were robust during 14-16 October and were likely generated by the interaction of hot material and snow and ice. During the afternoon of 21 October a strong gas-and-steam plume rose to 3-4.6 km altitude and extended 40 km WSW, based on satellite images and reports from pilots. On 31 October the ACC was lowered to Yellow and the VAL was lowered to Advisory.
Activity in November was characterized by elevated seismicity with ongoing seismic tremor and small, low-frequency earthquakes, elevated surface temperatures, and gas-and-steam emissions. There was an increase in seismic and infrasound tremor amplitudes starting at 1940 on 2 November. As a result, the ACC was again raised to Orange and the VAL was increased to Watch, although ash was not identified in satellite data. An ash cloud rose to 6.1 km altitude and drifted W according to satellite data at 2000. By 0831 on 3 November ash emissions were no longer visible in satellite images. On 6 and 9 November air pressure sensors detected signals consistent with small explosions. Small explosions were detected in infrasound data consistent with weak Strombolian activity on 19 and 21 November. Seismicity started to decrease on 21 November. On 25 November gas-and-steam emissions were emitted from the vent as well as from a scarp on the NE side of the volcano near the summit. A gas-and-steam plume extended about 50 km SSE and was observed in satellite and webcam images on 26 November. On 28 November small explosions were observed in seismic and local infrasound data and gas-and-steam emissions were visible from the summit and from the upper NE collapse scarp based on webcam images. Possible small explosions were observed in infrasound data on 30 November. Weakly elevated surface temperatures and a persistent gas-and-steam plume from the summit and collapse scarps on the upper flanks. A passing aircraft reported the gas-and-steam plume rose to 3-3.4 km altitude on 30 November, but no significant ash emissions were detected.
Satellite data. MODIS thermal anomaly data provided through MIROVA (Middle InfraRed Observation of Volcanic Activity) showed a strong pulse of thermal activity beginning in July 2023 that continued through November 2023 (figure 48). This strong activity was due to Strombolian explosions and lava fountaining events at the summit crater. According to data from MODVOLC thermal alerts, a total of 101 hotspots were detected near the summit crater in July (11-14, 16-19, 23-24 and 26), August (4, 25-26, and 29), September (5, 12, and 17), and October (3, 4, and 8). Infrared satellite data showed large lava flows descending primarily the northern and SE flanks during the reporting period (figure 49). Sulfur dioxide plumes often exceeded two Dobson Units (DUs) and drifted in different directions throughout the reporting period, based on satellite data from the TROPOMI instrument on the Sentinel-5P satellite (figure 50).
Geologic Background. The symmetrical glacier-covered Shishaldin in the Aleutian Islands is the westernmost of three large stratovolcanoes in the eastern half of Unimak Island. The Aleuts named the volcano Sisquk, meaning "mountain which points the way when I am lost." Constructed atop an older glacially dissected edifice, it is largely basaltic in composition. Remnants of an older edifice are exposed on the W and NE sides at 1,500-1,800 m elevation. There are over two dozen pyroclastic cones on its NW flank, which is covered by massive aa lava flows. Frequent explosive activity, primarily consisting of Strombolian ash eruptions from the small summit crater, but sometimes producing lava flows, has been recorded since the 18th century. A steam plume often rises from the summit crater.
Information Contacts: Alaska Volcano Observatory (AVO), a cooperative program of a) U.S. Geological Survey, 4200 University Drive, Anchorage, AK 99508-4667 USA (URL: https://avo.alaska.edu/), b) Geophysical Institute, University of Alaska, PO Box 757320, Fairbanks, AK 99775-7320, USA, and c) Alaska Division of Geological & Geophysical Surveys, 794 University Ave., Suite 200, Fairbanks, AK 99709, USA (URL: http://dggs.alaska.gov/); MIROVA (Middle InfraRed Observation of Volcanic Activity), a collaborative project between the Universities of Turin and Florence (Italy) supported by the Centre for Volcanic Risk of the Italian Civil Protection Department (URL: http://www.mirovaweb.it/); Hawai'i Institute of Geophysics and Planetology (HIGP) - MODVOLC Thermal Alerts System, School of Ocean and Earth Science and Technology (SOEST), Univ. of Hawai'i, 2525 Correa Road, Honolulu, HI 96822, USA (URL: http://modis.higp.hawaii.edu/); NASA Global Sulfur Dioxide Monitoring Page, Atmospheric Chemistry and Dynamics Laboratory, NASA Goddard Space Flight Center (NASA/GSFC), 8800 Greenbelt Road, Goddard, Maryland, USA (URL: https://so2.gsfc.nasa.gov/); Copernicus Browser, Copernicus Data Space Ecosystem, European Space Agency (URL: https://dataspace.copernicus.eu/browser/).
Ioto
Japan
24.751°N, 141.289°E; summit elev. 169 m
All times are local (unless otherwise noted)
New eruption with discolored water, ejecta, and floating pumice during October-December 2023
Ioto (Iwo-jima), located about 1,200 km S of Tokyo, lies within a 9-km-wide submarine caldera along the Izu-Bonin-Mariana volcanic arc. Previous eruptions date back to 1889 and have consisted of dominantly phreatic explosions, pumice deposits during 2001, and discolored water. A submarine eruption during July through December 2022 was characterized by discolored water, pumice deposits, and gas emissions (BGVN 48:01). This report covers a new eruption during October through December 2023, which consisted of explosions, black ejecta, discolored water, and floating pumice, based on information from the Japan Meteorological Association (JMA), the Japan Coast Guard (JCG), and satellite data.
JMA reported that an eruption had been occurring offshore of Okinahama on the SE side of the island since 21 October, which was characterized by volcanic tremor, according to the Japan Maritime Self-Defense Force (JMSDF) Iwo Jima Air Base (figure 22). According to an 18 October satellite image a plume of discolored water at the site of this new eruption extended NE (figure 23). During an overflight conducted on 30 October, a vent was identified about 1 km off the coast of Okinahama. Observers recorded explosions every few minutes that ejected dark material about 20 m above the ocean and as high as 150 m. Ejecta from the vent formed a black-colored island about 100 m in diameter, according to observations conducted from the air by the Earthquake Research Institute of the University of Tokyo in cooperation with the Mainichi newspaper (figure 24). Occasionally, large boulders measuring more than several meters in size were also ejected. Observations from the Advanced Land Observing Satellite Daichi-2 and Sentinel-2 satellite images also confirmed the formation of this island (figure 23). Brown discolored water and floating pumice were present surrounding the island.
The eruption continued during November. During an overflight on 3 November observers photographed the island and noted that material was ejected 169 m high, according to a news source. Explosions gradually became shorter, and, by the 3rd, they occurred every few seconds; dark and incandescent material were ejected about 800 m above the vent. On 4 November eruptions were accompanied by explosive sounds. Floating, brown-colored pumice was present in the water surrounding the island. There was a brief increase in the number of volcanic earthquakes during 8-14 November and 24-25 November. The eruption temporarily paused during 9-11 November and by 12 November eruptions resumed to the W of the island. On 10 November dark brown-to-dark yellow-green discolored water and a small amount of black floating material was observed (figure 25). A small eruption was reported on 18 November off the NE coast of the island, accompanied by white gas-and-steam plumes (figure 23). Another pause was recorded during 17-19 November, which then resumed on 20 November and continued erupting intermittently. According to a field survey conducted by the National Institute for Disaster Prevention Science and Technology on 19 November, a 30-m diameter crater was visible on the NE coast where landslides, hot water, and gray volcanic ash containing clay have occurred and been distributed previously. Erupted blocks about 10 cm in diameter were distributed about 90-120 m from the crater. JCG made observations during an overflight on 23 November and reported a phreatomagmatic eruption. Explosions at the main vent generated dark gas-and-ash plumes that rose to 200 m altitude and ejected large blocks that landed on the island and in the ocean (figure 26). Discolored water also surrounded the island. The size of the new island had grown to 450 m N-S x 200 m E-W by 23 November, according to JCG.
The eruption continued through 11 December, followed by a brief pause in activity, which then resumed on 31 December, according to JMA. Intermittent explosions produced 100-m-high black plumes at intervals of several minutes to 30 minutes during 1-10 December. Overflights were conducted on 4 and 15 December and reported that the water surrounding the new island was discolored to dark brown-to-dark yellow-green (figure 27). No floating material was reported during this time. In comparison to the observations made on 23 November, the new land had extended N and part of it had eroded away. In addition, analysis by the Geospatial Information Authority of Japan using SAR data from Daichi-2 also confirmed that the area of the new island continued to decrease between 4 and 15 December. Ejected material combined with wave erosion transformed the island into a “J” shape, 500-m-long and with the curved part about 200 m offshore of Ioto. The island was covered with brown ash and blocks, and the surrounding water was discolored to greenish-brown and contained an area of floating pumice. JCG reported from an overflight on 4 December that volcanic ash-like material found around the S vent on the NE part of the island was newly deposited since 10 November (figure 28). By 15 December the N part of the “J” shaped island had separated and migrated N, connecting to the Okinahama coast and the curved part of the “J” had eroded into two smaller islands (figure 27).
References. Ukawa, M., Fujita, E., Kobayashi, T., 2002, Recent volcanic activity of Iwo Jima and the 2001 eruption, Monthly Chikyu, Extra No. 39, 157-164.
Geologic Background. Ioto, in the Volcano Islands of Japan, lies within a 9-km-wide submarine caldera. The volcano is also known as Ogasawara-Iojima to distinguish it from several other "Sulfur Island" volcanoes in Japan. The triangular, low-elevation, 8-km-long island narrows toward its SW tip and has produced trachyandesitic and trachytic rocks that are more alkalic than those of other volcanoes in this arc. The island has undergone uplift for at least the past 700 years, accompanying resurgent doming of the caldera; a shoreline landed upon by Captain Cook's surveying crew in 1779 is now 40 m above sea level. The Motoyama plateau on the NE half of the island consists of submarine tuffs overlain by coral deposits and forms the island's high point. Many fumaroles are oriented along a NE-SW zone cutting through Motoyama. Numerous recorded phreatic eruptions, many from vents on the W and NW sides of the island, have accompanied the uplift.
Information Contacts: Japan Meteorological Agency (JMA), 1-3-4 Otemachi, Chiyoda-ku, Tokyo 100-8122, Japan (URL: http://www.jma.go.jp/jma/indexe.html); Japan Coast Guard (JCG) Volcano Database, Hydrographic and Oceanographic Department, 3-1-1, Kasumigaseki, Chiyoda-ku, Tokyo 100-8932, Japan (URL: https://www1.kaiho.mlit.go.jp/GIJUTSUKOKUSAI/kaiikiDB/kaiyo22-2.htm); Copernicus Browser, Copernicus Data Space Ecosystem, European Space Agency (URL: https://dataspace.copernicus.eu/browser/); Asahi, 5-3-2, Tsukiji, Chuo Ward, Tokyo, 104-8011, Japan (URL: https://www.asahi.com/ajw/articles/15048458).
Search Bulletin Archive by Publication Date
Select a month and year from the drop-downs and click "Show Issue" to have that issue displayed in this tab.
The default month and year is the latest issue available.
Bulletin of the Global Volcanism Network - Volume 45, Number 09 (September 2020)
Etna (Italy)
Effusive activity in early April; frequent Strombolian explosions and ash emissions during April-July 2020
Fuego (Guatemala)
Ongoing explosions, ash plumes, lava flows, and lahars during April-July 2020
Klyuchevskoy (Russia)
Strombolian activity, gas-and-steam and ash plumes, and a lava flow during June-early July 2020
Lengai, Ol Doinyo (Tanzania)
Multiple lava flows within the summit crater; September 2019-August 2020
Nishinoshima (Japan)
Major June-July eruption of lava, ash, and sulfur dioxide; activity declines in August 2020
Raung (Indonesia)
Eruptions confirmed during 2012- 2013; lava fills inner crater in November 2014-August 2015
Stromboli (Italy)
Strombolian activity continues at both summit craters during May-August 2020
Turrialba (Costa Rica)
New eruptive period on 18 June 2020 consisted of ash eruptions
Villarrica (Chile)
Continued summit incandescence February-August 2020 with larger explosions in July and August
Yasur (Vanuatu)
Ash and gas explosions continue through August 2020
Etna
Italy
37.748°N, 14.999°E; summit elev. 3357 m
All times are local (unless otherwise noted)
Effusive activity in early April; frequent Strombolian explosions and ash emissions during April-July 2020
Etna, located on the island of Sicily, Italy, is a stratovolcano that has had historical eruptions dating back 3,500 years. Its most recent eruptive period began in September 2013 and has continued through July 2020, characterized by Strombolian explosions, lava flows, and ash plumes. Activity has commonly originated from the summit areas, including the Northeast Crater (NEC), the Voragine-Bocca Nuova (or Central) complex (VOR-BN), the Southeast Crater (SEC, formed in 1978), and the New Southeast Crater (NSEC, formed in 2011). The newest crater, referred to as the "cono della sella" (saddle cone), emerged during early 2017 in the area between SEC and NSEC. Volcanism during this reporting period from April through July 2020 includes frequent Strombolian explosions primarily in the Voragine and NSEC craters, ash emissions, some lava effusions, and gas-and-steam emissions. Information primarily comes from weekly reports by the Osservatorio Etneo (OE), part of the Catania Branch of Italy's Istituo Nazionale di Geofisica e Vulcanologica (INGV).
Summary of activity during April-July 2020. Degassing of variable intensity is typical activity from all summit vents at Etna during the reporting period. Intra-crater Strombolian explosions and ash emissions that rose to a maximum altitude of 5 km on 19 April primarily originated from the Voragine (VOR) and New Southeast Crater (NSEC) craters. At night, summit crater incandescence was occasionally visible in conjunction with explosions and degassing. During 18-19 April small lava flows were observed in the VOR and NSEC craters that descended toward the BN from the VOR Crater and the upper E and S flanks of the NSEC. On 19 April a significant eruptive event began with Strombolian explosions that gradually evolved into lava fountaining activity, ejecting hot material and spatter from the NSEC. Ash plumes that were produced during this event resulted in ashfall to the E of Etna. The flows had stopped by the end of April; activity during May consisted of Strombolian explosions in both the VOR and NSEC craters and intermittent ash plumes rising 4.5 km altitude. On 22 May Strombolian explosions in the NSEC produced multiple ash plumes, which resulted in ashfall to the S. INGV reported that the pit crater at the bottom of BN had widened and was accompanied by degassing. Explosions with intermittent ash emissions continued during June and July and were primarily focused in the VOR and NSEC craters; mild Strombolian activity in the SEC was reported in mid-July.
MIROVA (Middle InfraRed Observation of Volcanic Activity) analysis of MODIS satellite data shows multiple episodes of thermal activity throughout the reporting period (figure 296). In early April, the frequency and power of the thermal anomalies began to decrease through mid-June; in July, they had increased in power again but remained less frequent compared to activity in January through March. According to the MODVOLC thermal algorithm, a total of seven alerts were detected in the summit craters during 10 April (1), 17 April (1), 24 April (2), 10 July (1), 13 July (1), and 29 July (1) 2020. These thermal hotspots were typically registered during or after a Strombolian event. Frequent Strombolian activity contributed to distinct SO2 plumes that drifted in different directions (figure 297).
Activity during April-May 2020. During April, INGV reported Strombolian explosions that produced some ash emissions and intra-crater effusive activity within the Voragine Crater (VOR) and abundant degassing from the New Southeast Crater (NSEC), Northeast Crater (NEC), and from two vents on the cono della sella (saddle cone) that were sometimes accompanied by a modest amount of ash (figure 298). At night, summit crater incandescence was observed in the cono della salla. The Strombolian activity in the VOR built intra-crater scoria cones while lava flows traveled down the S flank of the largest, main cone. On 18 April effusive activity from the main cone in the VOR Crater traveled 30 m toward the Bocca Nuova (BN) Crater; the pit crater at the bottom of the BN crater had widened compared to previous observations. A brief episode of Strombolian explosions that started around 0830 on 19 April in the NSEC gradually evolved into modest lava fountaining activity by 0915, rising to 3 km altitude and ejecting bombs up to 100 m (figure 299). A large spatter deposit was found 50 m from the vent and 3-4 small lava flows were descending the NSEC crater rim; two of these summit lava flows were observed at 1006, confined to the upper E and S flanks of the cone. Around 1030, one or two vents in the cono della sella produced a gas-and-steam and ash plume that rose 5 km altitude and drifted E, resulting in ashfall on the E flank of Etna in the Valle del Bove, as well as between the towns of Zafferana Etnea (10 km SE) and Linguaglossa (17 km NE). At night, flashes of incandescence were visible at the summit. By 1155, the lava fountaining had gradually slowed, stopping completely around 1300. The NEC continued to produce gas-and-steam emissions with some intra-crater explosive activity. During the week of 20-26 April, Strombolian activity in the VOR intra-crater scoria cone ejected pyroclastic material several hundred meters above the crater rim while the lava flows had significantly decreased, though continued to travel on the E flank of the main cone. Weak, intra-crater Strombolian activity with occasional ash emissions and nightly summit incandescence were observed in the NSEC (figure 300). By 30 April there were no longer any active lava flows; the entire flow field had begun cooling. The mass of the SO2 emissions varied in April from 5,000-15,000 tons per day.
Strombolian explosions produced periodic ash emissions and ejected mild, discontinuous incandescent material in the VOR Crater; the coarse material was deposited onto the S flank of BN (figure 301). Pulsating degassing continued from the summit craters, some of which were accompanied by incandescent flashes at night. The Strombolian activity in the cono della sella occasionally produced reddish ash during 3-4 May. During 5 and 8 May, there was an increase in ash emissions at the NSEC that drifted SSE. A strong explosive event in the VOR Crater located E of the main cone produced a significant amount of ash and ejected coarse material, which included blocks and bombs measuring 15-20 cm, that fell on the W edge of the crater, as well as on the S terrace of the BN Crater (figure 302).
On 10 May degassing continued in the NSEC while Strombolian activity fluctuated in both the VOR and NSEC Craters, ejecting ballistics beyond the crater rim; in the latter, some of the blocks fell back in, accumulated on the edge, and rolled down the slopes (figure 303). During the week of 11-17 May, eruptive activity at the VOR Crater was the lowest observed since early March; there were 4-5 weak, low intensity pulses not accompanied by bombs or ashfall in the VOR Crater. Degassing continued in the BN Crater. The crater of the cono della sella had widened further N following collapses due to the Strombolian activity, which exposed the internal wall.
On 18 May an ash plume from the NSEC rose 4.5 km altitude and drifted NE. Strombolian explosions on 22 May at the NSEC produced multiple ash plumes that rose 4.5 km altitude and drifted S and SW (figure 304), depositing a thin layer of ash on the S slope, and resulting in ashfall in Catania (27 km S). Explosions from the VOR Crater had ejected a deposit of large clasts (greater than 30 cm) on the NE flank, between the VOR Crater and NEC on 23 May. INGV reported that the pit crater in the BN continued to widen and degassing was observed in the NSEC, VOR Crater, and NEC. During the week of 25-31 May persistent visible flashes of incandescence at night were observed, which suggested there was intra-crater Strombolian activity in the SEC and NSEC. The mass of the SO2 plumes varied between 5,000-9,000 tons per day.
Activity during June-July 2020. During June, moderate intra-crater Strombolian activity with intermittent ash emissions continued in the NSEC and occurred more sporadically in the VOR Crater; at night, incandescence of variable intensity was observed at the summit. During the week of 8-14 June, Strombolian explosions in the cono della sella generated some incandescence and rare jets of incandescent material above the crater rim, though no ash emissions were reported. On the morning of 14 June a sequence of ten small explosions in the VOR Crater ejected incandescent material just above the crater rim and produced small ash emissions. On 25 June an overflight showed the developing pit crater in the center of the BN, accompanied by degassing along the S edge of the wall; degassing continued from the NEC, VOR Crater, SEC, and NSEC (figure 305). The mass of the SO2 plumes measured 5,000-7,000 tons per day, according to INGV.
Similar modest, intra-crater Strombolian explosions in the NSEC, sporadic explosions in the VOR Crater, and degassing in the BN, VOR Crater, and NEC persisted into July. On 2 July degassing in the NEC was accompanied by weak intra-crater Strombolian activity. Intermittent weak ash emissions and ejecta from the NSEC and VOR Crater were observed during the month. During the week of 6-12 July INGV reported gas-and-steam emissions continued to rise from the vent in the pit crater at the bottom of BN (figure 306). On 11 July mild Strombolian activity, nighttime incandescence, and degassing was visible in the SEC (figure 307). By 15 July there was a modest increase in activity in the NSEC and VOR Craters, generating ash emissions and ejecting material over the crater rims while the other summit craters were dominantly characterized by degassing. On 31 July an explosion in the NSEC produced an ash plume that rose 4.5 km altitude.
Geologic Background. Mount Etna, towering above Catania on the island of Sicily, has one of the world's longest documented records of volcanism, dating back to 1500 BCE. Historical lava flows of basaltic composition cover much of the surface of this massive volcano, whose edifice is the highest and most voluminous in Italy. The Mongibello stratovolcano, truncated by several small calderas, was constructed during the late Pleistocene and Holocene over an older shield volcano. The most prominent morphological feature of Etna is the Valle del Bove, a 5 x 10 km caldera open to the east. Two styles of eruptive activity typically occur, sometimes simultaneously. Persistent explosive eruptions, sometimes with minor lava emissions, take place from one or more summit craters. Flank vents, typically with higher effusion rates, are less frequently active and originate from fissures that open progressively downward from near the summit (usually accompanied by Strombolian eruptions at the upper end). Cinder cones are commonly constructed over the vents of lower-flank lava flows. Lava flows extend to the foot of the volcano on all sides and have reached the sea over a broad area on the SE flank.
Information Contacts: Sezione di Catania - Osservatorio Etneo, Istituto Nazionale di Geofisica e Vulcanologia (INGV), Sezione di Catania, Piazza Roma 2, 95123 Catania, Italy (URL: http://www.ct.ingv.it/it/); MIROVA (Middle InfraRed Observation of Volcanic Activity), a collaborative project between the Universities of Turin and Florence (Italy) supported by the Centre for Volcanic Risk of the Italian Civil Protection Department (URL: http://www.mirovaweb.it/); Hawai'i Institute of Geophysics and Planetology (HIGP) - MODVOLC Thermal Alerts System, School of Ocean and Earth Science and Technology (SOEST), Univ. of Hawai'i, 2525 Correa Road, Honolulu, HI 96822, USA (URL: http://modis.higp.hawaii.edu/); Global Sulfur Dioxide Monitoring Page, Atmospheric Chemistry and Dynamics Laboratory, NASA Goddard Space Flight Center (NASA/GSFC), 8800 Greenbelt Road, Goddard, Maryland, USA (URL: https://so2.gsfc.nasa.gov/); Boris Behncke, Istituto Nazionale di Geofisica e Vulcanologia (INGV), Sezione di Catania, Piazza Roma 2, 95123 Catania, Italy.
Fuego (Guatemala) — September 2020 Cite this Report
Fuego
Guatemala
14.4748°N, 90.8806°W; summit elev. 3799 m
All times are local (unless otherwise noted)
Ongoing explosions, ash plumes, lava flows, and lahars during April-July 2020
Fuego, located in Guatemala, is a stratovolcano that has been erupting since 2002 with historical eruptions dating back to 1531. Volcanism is characterized by major ashfalls, pyroclastic flows, lava flows, and lahars. The previous report (BGVN 45:04) described recent activity that included multiple ash explosions, block avalanches, and intermittent lava flows. This report updates activity from April through July 2020 that consisted of daily explosions, ash plumes, block avalanches ashfall, intermittent lava flows, and lahars. The primary source of information comes from the Instituto Nacional de Sismologia, Vulcanología, Meteorología e Hidrologia (INSIVUMEH), the Washington Volcanic Ash Advisory Center (VAAC), and various satellite data.
Summary of activity during April-July 2020. Daily activity throughout April-July 2020 was characterized by multiple hourly explosions, ash plumes that rose to a maximum of 4.9 km altitude, incandescent pulses that reached 600 m above the crater, block avalanches into multiple drainages, and ashfall affecting nearby communities (table 21). The highest rate of explosions occurred on 2 and 3 April and 2 May with up to 16 explosions per hour. White degassing occurred frequently during the reporting period, rising to a maximum altitude of 4.5 km and drifting in multiple directions. Intermittent lava flows were observed each month in the Seca (Santa Teresa) and Ceniza drainages (figure 132); the number of flows decreased in June through July, which is represented in the MIROVA analysis of MODIS satellite data, where the strength and frequency of thermal activity slightly decreased (figure 133). Occasional lahars were detected descending several drainages on the W and SE flanks, sometimes carrying tree branches and large blocks up to 1 m in diameter.
Table 21. Activity summary by month for Fuego with information compiled from INSIVUMEH daily reports.
| Month |
Number of explosions per hour |
Ash plume heights (km) |
Ash plume distance (km) and direction |
Drainages affected by block avalanches |
Villages reporting ashfall |
| Apr 2020 |
5-16 |
4.3-4.9 km |
8-20 km E, NE, SE, W, NW, SW, S, N |
Taniluyá, Ceniza, Las Lajas, Trinidad, Seca, Honda, and Santa Teresa |
Morelia, Panimaché I and II, Sangre de Cristo, Santa Sofía, Finca Palo Verde, San Pedro Yepocapa, Las Cruces Quisache, La Rochela, Ceylan, and Osuna |
| May 2020 |
4-16 |
4.3-4.9 km |
10-17 km S, SW, W, N, NE, E, SE |
Trinidad, Taniluyá, Ceniza, Las Lajas, Santa Teresa, Seca, and Honda |
Panimaché I, La Rochela, Ceilán, Morelia, San Andrés Osuna, Finca Palo Verde, Santa Sofía, Seilán, San Pedro Yepocapa, Alotenango, Ciudad Vieja, San Miguel Dueñas, and Antigua Guatemala |
| Jun 2020 |
3-15 |
4.2-4.9 km |
10-25.9 km E, SE, S, N, NE, W, SW, NW |
Seca, Taniluyá, Ceniza, Trinidad, Las Lajas, Santa Teresa and Honda |
San Pedro Yepocapa, Sangre de Cristo, Panimaché I and II, Morelia, Finca Palo Verde, El Porvenir, Yucales, Santa Emilia, Santa Sofía |
| Jul 2020 |
1-15 |
4-4.9 km |
10-24 km W, NW, SW, S, NE |
Trinidad, Taniluyá, Ceniza, Honda, Las Lajas, Seca, and Santa Teresa |
Panimaché I and II, Morelia, Santa Sofía, Finca Palo Verde, Sangre de Cristo, San Pedro Yepocapa, and El Porvenir |
Activity during April-May 2020. Activity in April 2020 consisted of 5-16 explosions per hour, generating ash plumes that rose 4.3-4.9 km altitude and drifted 8-20 km in multiple directions. Ashfall was reported in Morelia (9 km SW), Panimaché I and II (8 km SW), Sangre de Cristo (8 km WSW), Santa Sofía (12 km SW), Finca Palo Verde, San Pedro Yepocapa (8 km NW), Las Cruces Quisache (8 km NW), La Rochela, Ceylan, Osuna (12 km SW). The Washington VAAC issued multiple aviation advisories for a total of six days in April. Intermittent white gas-and-steam emissions reached 4.1-4.5 km altitude drifting in multiple directions. Incandescent ejecta was frequently observed rising 75-400 m above the crater; material ejected up to 600 m above the crater on 11 April. These constant explosions produced block avalanches that traveled down the Taniluyá (SW), Ceniza (SSW), Las Lajas (SE), Trinidad (S), Seca (W), Honda, and Santa Teresa (W) drainages. Effusive activity was reported on 6-13 and 15 April from the summit vent, traveling 150-800 m down the Ceniza drainage, accompanied by block avalanches in the front of the flow up to 1 km. Crater incandescence was also observed.
On 19-20 April a new lava flow descended the Ceniza drainage measuring 200-400 long, generating incandescent block avalanches at the front of the flow that moved up to 1 km. On 22 April lahars descended the Honda, Las Lajas, El Juté (SE), Trinidad, Ceniza, Taniluyá, Mineral, and Seca drainages and tributaries in Guacalate, Achiguate, and Pantaleón. During the evening of 23 April the rate of effusive activity increased; observatory staff observed a second lava flow in the Seca drainage was 170 m long and incandescent blocks from the flow traveled up to 600 m. Two lava flows in the Ceniza (130-400 m) and Seca (150-800 m) drainages continued from 23-28 April and had stopped by 30 April. On 30 April weak and moderate explosions produced ash plumes that rose 4.5-4.7 km altitude drifting S and SE, resulting in fine ashfall in Panimaché I, Morelia, Santa Sofía (figure 134).
During May 2020, the rate of explosion remained similar, with 4-16 explosions per hour, which generated gray ash plumes that rose 4.3-4.9 km altitude and drifted 10-17 km generally W and E. Ashfall was observed in Panimaché I, La Rochela, Ceilán, Morelia, San Andrés Osuna, Finca Palo Verde, Santa Sofía, Seilán, San Pedro Yepocapa, Alotenango (8 km ENE), Ciudad Vieja (13.5 km NE), San Miguel Dueñas (10 km NE), and Antigua Guatemala (18 km NE). The Washington VAAC issued volcanic ash advisory notices on six days in May. White gas-and-steam emissions continued, rising 4-4.5 km altitude drifting in multiple directions. Incandescent ejecta rose 100-400 m above the crater, accompanied by some crater incandescence and block avalanches in the Trinidad, Taniluyá, Ceniza, Las Lajas, Santa Teresa, Seca, and Honda drainages that moved up to 1 km and sometimes reached vegetated areas.
During 8-11 May a new 400 m long lava flow was detected in the Ceniza drainage, accompanied by constant crater incandescence and block avalanches traveling up to 1 km, according to INSIVUMEH. On 8 and 17 May moderate to strong lahars descended the Santa Teresa and Mineral drainages on the W flank and on 21 May they descended the Las Lajas drainage on the E flank and the Ceniza drainage on the SW flank. During 20-24 May a 100-400 m long lava flow was reported in the Ceniza drainage alongside degassing and avalanches moving up to 1 km and during 25-26 May a 150 m long lava flow was reported in the Seca drainage.
Activity during June-July 2020. The rate of explosions in June 2020 decreased slightly to 3-15 per hour, generating gray ash plumes that rose 4.2-4.9 km altitude and drifted 10-26 km in multiple directions (figure 135). As a result, intermittent ashfall was reported in San Pedro Yepocapa, Sangre de Cristo, Panimaché I and II, Morelia, Finca Palo Verde, El Porvenir (8 km ENE), Yucales (12 km SW), Santa Emilia, Santa Sofia, according to INSIVUMEH. VAAC advisories were published on eight days in June. Degassing persisted in the summit crater that rose 4.1-4.5 km altitude extending in different directions. Crater incandescence was observed occasionally, as well as incandescent pulses that rose 100-300 m above the crater. Block avalanches were observed descending the Seca, Taniluyá, Ceniza, Trinidad, Las Lajas, Santa Teresa, and Honda drainages, which could sometimes carry blocks up to 1 km in diameter.
On 2 June at 1050 a weak to moderate lahar was observed in the Las Lajas drainage on the SE flank. On 5 June, more lahars were detected in the Seca and Mineral drainages on the W flanks. A new lava flow was detected on 12 June, traveling 250 m down the Seca drainage on the NW flank, and accompanied by constant summit crater incandescence and gas emissions. The flow continued into 14 June, lengthening up to 300 m long. On 24 June weak and moderate explosions produced ash plumes that rose 4.3-4.7 km altitude drifting W and SW (figure 135). On 29 June at 1300 a weak lahar was reported in the Seca, Santa Teresa, and Mineral drainages on the W flank.
Daily explosions and ash plumes continued through July 2020, with 1-15 explosions per hour and producing consistent ash plumes 4-4.9 km altitude drifting generally W for 10-24 km. These explosions resulted in block avalanches that descended the Trinidad, Taniluyá, Ceniza, Honda, Las Lajas, Seca, and Santa Teresa drainages. The number of white gas emissions decrease slightly compared to previous months and 4-4.4 km altitude. VAAC advisories were distributed on twenty different days in July. Incandescent ejecta was observed rising 100-350 m above the crater. Occasional ashfall was observed in Panimaché I and II, Morelia, Santa Sofía, Finca Palo Verde, Sangre de Cristo, San Pedro Yepocapa, and El Porvenir, according to INSIVUMEH.
On 4 July in the early morning, a lava flow began in the Seca drainage, which also produced some fine ash particles that drifted W. The lava flow continued into 5 July, measuring 150 m long. On the same day, weak to moderate lahars traveled only 20 m, carrying tree branches and blocks measuring 30 cm to 1 m. On 14, 24, and 29 July more lahars were generated in the Las Lajas drainages on the former date and both the Las Lajas and El Jute drainages on the two latter dates.
Geologic Background. Volcán Fuego, one of Central America's most active volcanoes, is also one of three large stratovolcanoes overlooking Guatemala's former capital, Antigua. The scarp of an older edifice, Meseta, lies between Fuego and Acatenango to the north. Construction of Meseta dates back to about 230,000 years and continued until the late Pleistocene or early Holocene. Collapse of Meseta may have produced the massive Escuintla debris-avalanche deposit, which extends about 50 km onto the Pacific coastal plain. Growth of the modern Fuego volcano followed, continuing the southward migration of volcanism that began at the mostly andesitic Acatenango. Eruptions at Fuego have become more mafic with time, and most historical activity has produced basaltic rocks. Frequent vigorous eruptions have been recorded since the onset of the Spanish era in 1524, and have produced major ashfalls, along with occasional pyroclastic flows and lava flows.
Information Contacts: Instituto Nacional de Sismologia, Vulcanologia, Meteorologia e Hydrologia (INSIVUMEH), Unit of Volcanology, Geologic Department of Investigation and Services, 7a Av. 14-57, Zona 13, Guatemala City, Guatemala (URL: http://www.insivumeh.gob.gt/); Washington Volcanic Ash Advisory Center (VAAC), Satellite Analysis Branch (SAB), NOAA/NESDIS OSPO, NOAA Science Center Room 401, 5200 Auth Rd, Camp Springs, MD 20746, USA (URL: www.ospo.noaa.gov/Products/atmosphere/vaac, archive at: http://www.ssd.noaa.gov/VAAC/archive.html); MIROVA (Middle InfraRed Observation of Volcanic Activity), a collaborative project between the Universities of Turin and Florence (Italy) supported by the Centre for Volcanic Risk of the Italian Civil Protection Department (URL: http://www.mirovaweb.it/); Sentinel Hub Playground (URL: https://www.sentinel-hub.com/explore/sentinel-playground); William Chigna, CONRED (URL: https://twitter.com/william_chigna).
Klyuchevskoy (Russia) — September 2020 Cite this Report
Klyuchevskoy
Russia
56.056°N, 160.642°E; summit elev. 4754 m
All times are local (unless otherwise noted)
Strombolian activity, gas-and-steam and ash plumes, and a lava flow during June-early July 2020
Klyuchevskoy is a frequently active stratovolcano located in northern Kamchatka. Historical eruptions dating back 3,000 years have included more than 100 flank eruptions with most lateral craters and cones occurring along radial fissures between the unconfined NE-to-SE flanks. The previous report (BGVN 45:06) described ash plumes, nighttime incandescence, and Strombolian activity. Strombolian activity, ash plumes, and a strong lava flow continued. This report updates activity from June through August 2020 using weekly and daily reports from the Kamchatkan Volcanic Eruption Response Team (KVERT), the Tokyo Volcanic Ash Advisory (VAAC), and satellite data.
Moderate explosive-effusive activity continued in June 2020, with Strombolian explosions, frequent gas-and-steam emissions that contained some amount of ash, and an active lava flow. On 1 June a gas-and-steam plume containing some ash extended up to 465 km SE and E. The lava flow descended the SE flank down the Apakhonchich chute (figure 43). Occasionally, phreatic explosions accompanied the lava flow as it interacted with snow. Intermittent ash plumes, reported throughout the month by KVERT using video and satellite data and the Tokyo VAAC using HIMAWARI-8 imagery, rose to 5.5-6.7 km altitude and drifted in different directions up to 34 km from the volcano. On 12 and 30 June ash plumes rose to a maximum altitude of 6.7 km. On 19 June, 28-30 June, and 1-3 July some collapses were detected alongside the lava flow as it continued to advance down the SE flank.
During 1-3 July moderate Strombolian activity was observed, accompanied by gas-and-steam emissions containing ash and a continuous lava flow traveling down the Apakhonchich chute on the SE flank. On 1 July a Tokyo VAAC advisory reported an ash plume rising to 6 km altitude and extending SE. On 3 July the activity sharply decreased. KVERT reported there was some residual heat leftover from the lava flow and Strombolian activity that continued to cool through at least 13 July; KVERT also reported frequent gas-and-steam emissions, which contained a small amount of ash through 5 July, rising from the summit crater (figure 44). The weekly KVERT report on 16 July stated that the eruption had ended on 3 July 2020.
MIROVA (Middle InfraRed Observation of Volcanic Activity) analysis of MODIS satellite data shows frequent and strong thermal activity within 5 km of the summit crater from March through June followed by a sharp and sudden decline in early July (figures 45). A total of six weak thermal anomalies were detected between July and August. According to the MODVOLC thermal algorithm, a total of 111 thermal alerts were detected at or near the summit crater from 1 June to 1 July, a majority of which were due to the active lava flow on the SE flank and Strombolian explosions in the crater. Sentinel-2 thermal satellite imagery frequently showed the active lava flow descending the SE flank as a strong thermal anomaly, sometimes even through weather clouds (figure 46). These thermal anomalies were also recorded by the Sentinel-2 MODIS Thermal Volcanic Activity data on a MIROVA graph, showing a strong cluster during June to early July, followed by a sharp decrease and then a hiatus in activity (figure 47).
Geologic Background. Klyuchevskoy is the highest and most active volcano on the Kamchatka Peninsula. Since its origin about 6,000 years ago, this symmetrical, basaltic stratovolcano has produced frequent moderate-volume explosive and effusive eruptions without major periods of inactivity. It rises above a saddle NE of Kamen volcano and lies SE of the broad Ushkovsky massif. More than 100 flank eruptions have occurred during approximately the past 3,000 years, with most lateral craters and cones occurring along radial fissures between the unconfined NE-to-SE flanks of the conical volcano between 500 and 3,600 m elevation. Eruptions recorded since the late 17th century have resulted in frequent changes to the morphology of the 700-m-wide summit crater. These eruptions over the past 400 years have originated primarily from the summit crater, but have also included numerous major explosive and effusive eruptions from flank craters.
Information Contacts: Kamchatka Volcanic Eruptions Response Team (KVERT), Far Eastern Branch, Russian Academy of Sciences, 9 Piip Blvd., Petropavlovsk-Kamchatsky, 683006, Russia (URL: http://www.kscnet.ru/ivs/kvert/); Tokyo Volcanic Ash Advisory Center (VAAC), 1-3-4 Otemachi, Chiyoda-ku, Tokyo 100-8122, Japan (URL: http://ds.data.jma.go.jp/svd/vaac/data/); Hawai'i Institute of Geophysics and Planetology (HIGP) - MODVOLC Thermal Alerts System, School of Ocean and Earth Science and Technology (SOEST), Univ. of Hawai'i, 2525 Correa Road, Honolulu, HI 96822, USA (URL: http://modis.higp.hawaii.edu/); MIROVA (Middle InfraRed Observation of Volcanic Activity), a collaborative project between the Universities of Turin and Florence (Italy) supported by the Centre for Volcanic Risk of the Italian Civil Protection Department (URL: http://www.mirovaweb.it/); Sentinel Hub Playground (URL: https://www.sentinel-hub.com/explore/sentinel-playground).
Ol Doinyo Lengai (Tanzania) — September 2020 Cite this Report
Ol Doinyo Lengai
Tanzania
2.764°S, 35.914°E; summit elev. 2962 m
All times are local (unless otherwise noted)
Multiple lava flows within the summit crater; September 2019-August 2020
Ol Doinyo Lengai, located near the southern end of the East African Rift in Tanzania, is a stratovolcano known for its unique low-temperature carbonatitic lava. Frequent eruptions have been recorded since the late 19th century. Activity primarily occurs in the crater offset to the N about 100 m below the summit where hornitos (small cones) and pit craters produce lava flows and spattering. Lava began overflowing various flanks of the crater in 1993. The eruption transitioned to significant explosive activity in September 2007, which formed a new pyroclastic cone inside the crater. Repeated ash emissions reached altitudes greater than 10 km during March 2008. By mid-April 2008 explosive activity had decreased. In September new hornitos with small lava flows formed on the crater floor. The most recent eruptive period began in April 2017 and has been characterized by spattering confined to the crater, effusive activity in the summit crater, and multiple lava flows (BGVN 44:09). Effusive activity continued in the summit crater during this reporting period from September 2019 through August 2020, based on data and images from satellite information.
Throughout September 2019 to August 2020, evidence for repeated small lava flows was recorded in thermal data and satellite imagery. A total of seven low-level pulses of thermal activity were detected within 5 km from the summit in MIROVA data during September 2019 (1), February (2), March (2), and August (2) 2020 (figure 207). Sentinel-2 satellite imagery also provided evidence of multiple lava flows within the summit crater throughout the reporting period. On clear weather days, intermittent thermal anomalies were observed in thermal satellite imagery within the summit crater; new lava flows were detected due to the change in shape, volume, and location of the hotspot (figure 208). During a majority of the reporting period, the thermal anomaly dominantly appeared in the center of the crater, though occasionally it would also migrate to the SE wall, as seen on 3 February, the E wall on 12 July, or the NE wall on 31 August. In Natural Color rendering, fresh lava flows appear black within the crater that quickly cools to a white-brown color. These satellite images showed the migration of new lava flows between February, March, and June (figure 209). The flow on 8 February occurs in the center and along the W wall of the crater; the flow on 9 March is slightly thinner and is observed in the center and along the E wall of the crater; finally, the flow on 17 June is located in the center and along the N wall of the crater.
During August, multiple lava flows were detected in Sentinel-2 satellite imagery. On relatively clear days, lava flows were visible in the middle of the summit crater, occasionally branching out to one side of the crater (figure 210). On 6 August, a thin lava flow branched to the E flank, which became thicker by 11 August. On 16 and 21 August, the lava remained mostly in the center of the crater. A large pulse of fresh lava occurred on 31 August, extending to the NW and SE sides of the crater.
Geologic Background. The symmetrical Ol Doinyo Lengai is the only volcano known to have erupted carbonatite tephras and lavas in historical time. The prominent stratovolcano, known to the Maasai as "The Mountain of God," rises abruptly above the broad plain south of Lake Natron in the Gregory Rift Valley. The cone-building stage ended about 15,000 years ago and was followed by periodic ejection of natrocarbonatitic and nephelinite tephra during the Holocene. Historical eruptions have consisted of smaller tephra ejections and emission of numerous natrocarbonatitic lava flows on the floor of the summit crater and occasionally down the upper flanks. The depth and morphology of the northern crater have changed dramatically during the course of historical eruptions, ranging from steep crater walls about 200 m deep in the mid-20th century to shallow platforms mostly filling the crater. Long-term lava effusion in the summit crater beginning in 1983 had by the turn of the century mostly filled the northern crater; by late 1998 lava had begun overflowing the crater rim.
Information Contacts: MIROVA (Middle InfraRed Observation of Volcanic Activity), a collaborative project between the Universities of Turin and Florence (Italy) supported by the Centre for Volcanic Risk of the Italian Civil Protection Department (URL: http://www.mirovaweb.it/); Sentinel Hub Playground (URL: https://www.sentinel-hub.com/explore/sentinel-playground).
Nishinoshima (Japan) — September 2020 Cite this Report
Nishinoshima
Japan
27.247°N, 140.874°E; summit elev. 100 m
All times are local (unless otherwise noted)
Major June-July eruption of lava, ash, and sulfur dioxide; activity declines in August 2020
Japan’s Nishinoshima volcano, located about 1,000 km S of Tokyo in the Ogasawara Arc, erupted above sea level in November 2013 after 40 years of dormancy. Activity lasted through November 2015 and returned during mid-2017, continuing the growth of the island with ash plumes, ejecta, and lava flows. A short eruptive event in July 2018 produced a small lava flow and vent on the side of the pyroclastic cone. The next eruption of ash plumes, incandescent ejecta, and lava flows began in early December 2019, resulting in significant growth of the island. This report covers the ongoing activity from March-August 2020 when activity decreased. Information is provided primarily from Japan Meteorological Agency (JMA) monthly reports and the Japan Coast Guard (JCG), which makes regular overflights to make observations.
Renewed eruptive activity that began on 5 December 2019 continued during March-August 2020 but appeared to wane by the end of August. Major lava flows covered all sides of the island, with higher levels of activity during late June and early July. Ash emissions increased significantly during June and produced dense black ash plumes that rose up to 6 km altitude in early July. Explosive activity produced lightning and incandescent jets that rose 200 m and large bombs that fell to the base of the pyroclastic cone. Lava flow activity diminished at the end of July. Ash emissions decreased throughout August and appeared to cease after 27 August 2020. The MIROVA plot clearly reflects the high levels of thermal activity between December 2019 and August 2020 (figure 80); this event was reported by JMA as the largest eruption recorded to date. Sulfur dioxide emissions were very high during late June through early August, producing emissions that drifted across much of the western Pacific region.
The Japan Coast Guard (JCG) conducted overflights of Nishinoshima on 9 and 15 March 2020 (figure 81). During both visits they observed eruptive activity from the summit crater, including ash emissions that rose to an altitude of approximately 1,000 m and lava flowing down the N and SE flanks (figure 82). Large ejecta was scattered around the base of the pyroclastic cone. The lava flowing north had reached the coast and was producing vigorous steam as it entered the water on 9 March; whitish gas emissions were visible on the N flank of the cone at the source of the lava flow (figure 83). On 9 March yellow-green discolored water was noted off the NE shore. The lava flow on the SE coast produced a small amount of steam at the ocean entry point and a strong signal in thermal imagery on 15 March (figure 84). Multiple daily MODVOLC thermal alerts were issued during 1-10, 17-24, and 27-30 March. Landsat-8 visual and thermal imagery on 30 March 2020 confirmed that thermal anomalies on the N and SE flanks of the volcano continued.
Ash emissions were not observed at Nishinoshima during JCG overflights on 6, 16, and 19 April 2020, but gas-and-steam emissions were noted from the summit crater, and a yellow discoloration interpreted by JMA to be sulfur precipitation was observed near the top of the pyroclastic cone. The summit crater was larger than during previous visits. Steam plumes seen each of those days on the N and NE coasts suggested active ocean entry of lava flows (figure 85). A lava flow was observed emerging from the E flank of the cone and entering the ocean on the E coast on 19 and 29 April (figure 86). During the overflight on 29 April observers noted lava flowing southward from a vent on the E flank of the pyroclastic cone. A narrow, brown, ash plume was visible on 29 April at the summit crater rising to an altitude of about 1,500 m. Thermal observations indicated continued flow activity throughout the month. Multiple daily MODVOLC thermal alerts were recorded during 2-6, 10-11, 17-23, and 28-30 April. Significant growth of the pyroclastic cone occurred between early February and late April 2020 (figure 87).
Infrared satellite imagery from 17 May 2020 showed a strong thermal anomaly at the summit and hot spots on the NW flank indicative of flows. Visible imagery confirmed emissions at the summit and steam plumes on the NW flank (figure 88). Gray ash plumes rose to about 1,800 m altitude on 18 May during the only overflight of the month made by the Japan Coast Guard. In addition, white gas emissions rose from around the summit area and large blocks of ejecta were scattered around the base of the pyroclastic cone (figure 89). Steam from ocean-entry lava on the N flank was reduced from previous months, but a new flow moving NW into the ocean was generating a steam plume and a strong thermal signature. Multi-pixel thermal alerts were measured by the MODVOLC system on 1-3, 9-10, 13-15, 18, and 26-30 May. Sulfur dioxide emissions had been weak and intermittent from March through early May 2020 but became more persistent during the second half of May. Although modest in size, the plumes were detectible hundreds of kilometers away from the volcano (figure 90).
Activity increased significantly during June 2020. Satellite imagery from 2 June revealed two intense thermal anomalies at the summit indicating a new crater, and lava flows active on the NW and NE flanks, all showing gas or steam emissions (figure 91). Dense brown and gray ash emissions were observed rising from the summit crater during JCG overflights on 7 and 15 June (figure 92). Plumes reached at least 1,500 m altitude, and ejecta reached the base of the pyroclastic cone. Between 5 and 19 June the lava flow on the WNW coast slowed significantly, while the flows to the N and E became significantly more active (figure 93). The Tokyo VAAC reported the first ash plume since mid-February on 12 June rose to 2.1 km and drifted NE. On 14 June they reported an ash plume extending E at 2.7 km altitude. Dense emissions continued to drift N and E at 2.1-2.7 km altitude until the last week of the month. The JCG overflight on 19 June observed darker ash emissions than two weeks earlier that drifted at least 180 km NE (figure 94) and incandescent tephra that exploded from the enlarged summit area where three overlapping craters trending E-W had formed.
The Tokyo VAAC reported ash emissions that rose to 4.6 km altitude and drifted NE on 25 June. For the remainder of the month they rose to 2.7-3.9 km altitude and drifted N and NE. By the time of the JCG overflight on 29 June, the new crater that had opened on the SW flank had merged with the summit crater (figure 95). Dense black ash emissions rose to 3.4 km altitude and drifted NE, lava flowed down the SW flank into the ocean producing violent steam explosions, and incandescent tephra was scattered at least 200 m from the base of the pyroclastic cone from ongoing explosive activity (figure 96). Multiple layers of recent flow activity were visible along the SW coast (figure 97). Yellow-green discolored water encircled the entire island with a width of 1,000 m.
MODVOLC thermal alerts reached their highest levels of the period during June 2020 with multi-pixel alerts recorded on most days of the month. Sulfur dioxide emissions increased steadily throughout June to the highest levels recorded for Nishinoshima; by the end of the month plumes of SO2 were drifting thousands of kilometers across the Pacific Ocean and being captured in complex atmospheric circulation currents (figure 98).
By early July 2020, satellite data indicated that the NE quadrant of the island was covered with ash, and a large amount of new lava had flowed down the SW flank, creating fans extending into the ocean (figure 99). The Tokyo VAAC reported ash emissions that rose to 3.7-4.9 km altitude and drifted N during 1-6 July. The altitude increased to 6.1 km during 8 and 9 July, and ranged from 4.6-6.1 km during 10-14 July while the drift direction changed to NE. The marine meteorological observation ship "Ryofu Maru" reported on 11 July that dense black ash was continuously erupting from the summit crater and drifting W at 1,700 m altitude or higher. They observed large volcanic blocks scattered around the base of the pyroclastic cone, and ash falling from the drifting plume. During the night of 11 July incandescent lava and volcanic lightning rose to about 200 m above the crater rim (figure 100).
During 16-26 July 2020 the Tokyo VAAC reported ash emissions at 3.7-5.2 km altitude that drifted primarily N and NE. The vessel "Keifu Maru" passed Nishinoshima on 20 July and crewmembers observed continuing emissions from the summit of dense, black ash. JCG observed an ash plume rising to at least 2.7 km altitude during their overflight of 20 July. A large dome of fresh lava was visible on the SW flank of the island (figure 101). Lower ash emissions from 2.4-3.7 km altitude were reported by the Tokyo VAAC during 27-29 July, but the altitude increased to 5.5-5.8 km during the last two days of the month. During an overflight on 30 July by the National Research Institute for Earth Science and Disaster Prevention, dark and light gray ash emissions rose to 3.0 km altitude, but no flowing lava or large bombs were observed. They also noted thick deposits of brownish-gray ash on the N side of the island (figure 102).
JMA reported a sharp decrease in the lava eruption rate during July with thermal anomalies decreasing significantly mid-month. Multiple daily MODVOLC thermal alerts were recorded during the first half of the month but were reduced to two or three per day during the last third of July. Throughout July, SO2 emissions were the highest recorded in modern times for Nishinoshima. High levels of emissions were measured daily, producing streams with high concentrations of SO2 that were caught up in rotating wind currents and drifted thousands of kilometers across the Pacific Ocean (figure 103).
Thermal activity was greatly reduced during August 2020. Only one or two MODVOLC alerts were issued on 11, 18, 20, 21, 29, and 30 August, and no fresh lava flows were observed. The Tokyo VAAC reported ash emissions daily from 1-20 August. Plume heights were 4.9-5.8 km altitude during 1-4 August after which they dropped to 3.9 km altitude through 15 August. A brief pulse to 4.6 km altitude was recorded on 16 August, but then they dropped to 3.0 km or lower through the end of the month and became intermittent. The last ash emission was reported at 2.7 km altitude drifting W on 27 August.
No eruptive activity was observed during the Japan Coast Guard overflights on 19 and 23 August. High temperatures were measured on the inner wall of the summit crater on 19 August (figure 104). Steam plumes rose from the summit crater to about 2.5 km altitude during both visits (figure 105). Yellow-green discolored water was present on 23 August around the NW and SW coasts. No lava flows were observed, and infrared cameras did not measure any surface thermal anomalies outside of the crater. Very high levels of SO2 emissions were measured through 12 August when they began to noticeably decrease (figure 106). By the end of the month, only small amounts of SO2 were measured in satellite data.
Geologic Background. The small island of Nishinoshima was enlarged when several new islands coalesced during an eruption in 1973-74. Multiple eruptions that began in 2013 completely covered the previous exposed surface and continued to enlarge the island. The island is the summit of a massive submarine volcano that has prominent peaks to the S, W, and NE. The summit of the southern cone rises to within 214 m of the ocean surface 9 km SSE.
Information Contacts: Japan Meteorological Agency (JMA), 1-3-4 Otemachi, Chiyoda-ku, Tokyo 100-8122, Japan (URL: http://www.jma.go.jp/jma/indexe.html); Japan Coast Guard (JCG), Hydrographic and Oceanographic Department, 3-1-1, Kasumigaseki, Chiyoda-ku, Tokyo 100-8932, Japan (URL: https://www1.kaiho.mlit.go.jp/GIJUTSUKOKUSAI/kaiikiDB/kaiyo18-e1.htm); MIROVA (Middle InfraRed Observation of Volcanic Activity), a collaborative project between the Universities of Turin and Florence (Italy) supported by the Centre for Volcanic Risk of the Italian Civil Protection Department (URL: http://www.mirovaweb.it/); Hawai'i Institute of Geophysics and Planetology (HIGP) - MODVOLC Thermal Alerts System, School of Ocean and Earth Science and Technology (SOEST), Univ. of Hawai'i, 2525 Correa Road, Honolulu, HI 96822, USA (URL: http://modis.higp.hawaii.edu/); Tokyo Volcanic Ash Advisory Center (VAAC), 1-3-4 Otemachi, Chiyoda-ku, Tokyo 100-8122, Japan (URL: http://ds.data.jma.go.jp/svd/vaac/data/); Japan Aerospace Exploration Agency-Earth Observation Research Center (JAXA-EORC), 7-44-1 Jindaiji Higashi-machi, Chofu-shi, Tokyo 182-8522, Japan (URL: http://www.eorc.jaxa.jp/); Sentinel Hub Playground (URL: https://www.sentinel-hub.com/explore/sentinel-playground); Global Sulfur Dioxide Monitoring Page, Atmospheric Chemistry and Dynamics Laboratory, NASA Goddard Space Flight Center (NASA/GSFC), 8800 Greenbelt Road, Goddard, Maryland, USA (URL: https://so2.gsfc.nasa.gov/).
Raung (Indonesia) — September 2020 Cite this Report
Raung
Indonesia
8.119°S, 114.056°E; summit elev. 3260 m
All times are local (unless otherwise noted)
Eruptions confirmed during 2012- 2013; lava fills inner crater in November 2014-August 2015
A massive stratovolcano in easternmost Java, Raung has over sixty recorded eruptions dating back to the late 16th Century. Explosions with ash plumes, Strombolian activity, and lava flows from a cinder cone within the 2-km-wide summit crater have been the most common activity. Visual reports of activity have often come from commercial airline flights that pass near the summit; Pusat Vulkanologi dan Mitigasi Bencana Geologi (PVMBG, also known as Indonesian Center for Volcanology and Geological Hazard Mitigation, CVGHM) has installed webcams to monitor activity in recent years. An eruption in 2015 produced a large volume of lava within the summit crater and formed a new pyroclastic cone in the same location as the previous one. Confirmation and details of eruptions in 2012, 2013, and 2014-2015 are covered in this report with information provided by PVMBG, the Darwin Volcanic Ash Advisory Center (VAAC), several sources of satellite data, and visitors to the volcano.
Newly available visual and satellite information confirm eruptions at Raung during October 2012-January 2013, June-July 2013, and extend the beginning of the 2015 eruption back to November 2014. The 2015 eruption was the largest in several decades; Strombolian activity was reported for many months and fresh lava flows covered the crater floor. Raung was quiet after the 2015 eruption ended in August of that year until July 2020.
Eruption during October 2012-January 2013. A MODVOLC thermal alert appeared inside the summit crater of Raung on 14 October 2012, followed by another four alerts on 16 October. Multiple daily alerts were reported on many days through 8 November, most within the main crater. Single alerts appeared on 29 November and 1 December 2012 (figure 9). PVMBG raised the Alert Level on 17 October from 1 to 2 due to increased seismicity and raised it further to Level 3 on 22 October. A local news report by Aris Yanto indicted that a minor Strombolian eruption occurred inside the crater on 19 October. Strombolian activity was also observed inside the inner crater on 5 November 2012 by visitors (figure 10); they reported loud rumbling sounds that could be heard up to 15 km from the crater.
The Darwin VAAC issued an advisory of an eruption plume to 9.1 km altitude reported at 0237 UTC on 8 November 2012. In a second advisory about two hours later they noted that an ash plume was not visible in satellite imagery. A press article released by the Center for Volcanology and Geological Hazard Mitigation (PVMBG) indicated that gray ash plumes were observed on 6 January 2013 that rose 300 m above the summit crater rim. Incandescence was observed around the crater and thundering explosions were heard by nearby residents.
Eruption during June-July 2013. Two MODVOLC thermal alerts were measured inside the summit crater on 29 June 2013. A photo taken on 21 July showed minor Strombolian activity at the inner crater (figure 11). A weak SO2 anomaly was detected in the vicinity of Raung by the OMI instrument on the Aura satellite on 27 July. Thermal alerts were recorded on 29 and 31 July. When Google Earth imagery from 14 March 2011 created by Maxar Technologies is compared with imagery from 29 July 2013 captured by Landsat/Copernicus, dark tephra is filling the inner crater in the 2013 image; it was not present in 2011 (figure 12).
Eruption during November 2014-August 2015. Information about this eruption was previously reported (BGVN 41:12), but additional details are provided here. Landsat-8 imagery from 28 October 2014 indicated clear skies and little activity within the summit crater. Local observers reported steam plumes beginning in mid-November (figure 13). MODVOLC thermal alerts within the summit crater were issued on 28 and 30 November, and then 15 alerts were issued on seven days in December. Thermal Landsat-8 imagery from cloudy days on 29 November and 15 December indicated an anomaly over the area of the pyroclastic cone inside the summit crater (figure 14).
In January 2015 the MODVOLC system identified 25 thermal anomalies in MODIS data, with a peak of eight alerts on 8 January. Visitors to the summit crater on 6 January witnessed explosions from the inner crater approximately every 40 minutes that produced gas and small amounts of ash and tephra. They reported lava flowing continuously from the inner crater onto the larger crater floor, and incandescent activity was seen at night (figure 15). Landsat-8 images from 16 January showed a strong thermal anomaly covering an area of fresh lava (figure 16).
Satellite images were obscured by meteoric clouds during February 2015, but PVMBG reported gray and brown plumes rising 300 m multiple times and incandescence and rumbling on 14 February. Visitors to the summit crater during the second half of February reported Strombolian activity with lava fountains from the inner crater, at times as frequently as every 15 minutes (figure 17). Loud explosions and rumbling were heard 10-15 km away. MODVOLC thermal alerts stopped on 25 February and did not reappear until late June.
PVMBG raised the Alert Level to 2 in mid-March 2015. Weak thermal anomalies located inside and NW of the pyroclastic cone were present in satellite imagery on 21 March. PVMBG reported gray and brown emissions during March, April, and May rising as high as 300 m above the crater. Landsat imagery from 22 April showed a small emission inside the pyroclastic cone, and on 8 May showed a clearer view of the fresh black lava NW and SW of the pyroclastic cone (figure 18).
Nine MODVOLC thermal alerts appeared inside the summit crater on 21 June 2015 after no alerts since late February, suggesting an increase in activity. The Darwin VAAC issued the first ash advisory for 2015 on 24 June noting an aviation report of recent ash. The following day the Ujung Pandang Meteorological Weather Office (MWO) reported an ash emission drifting W at 3.7 km altitude. The same day, 25 June, Landsat-8 imagery clearly showed a new lava flow on the W side of the crater and a strong thermal anomaly. The thermal data showed a point source of heat widening SW from the center of the crater and a second point source of heat that appeared to be inside the pyroclastic cone. A small ash plume was visible over the cone (figure 19). Strombolian activity and ash plumes were reported by BNPB and PVMBG in the following days. On 26 June the Darwin VAAC noted the hotspot had remained visible in infrared imagery for several days. PVMBG reported an ash emission to 3 km altitude on 29 June.
Activity increased significantly during July 2015 (BGVN 41:12). Ash plumes rose as high as 6.7 km altitude and drifted hundreds of kilometers in multiple directions, forcing multiple shutdowns at airports on Bali and Lombok, as well as Banyuwangi and Jember in East Java. The Darwin VAAC issued 152 ash advisories during the month. Ashfall was reported up to 20 km W during July and 20-40 km SE during early August. Visitors to the summit in early July observed a new pyroclastic cone growing inside the inner crater from incandescent ejecta and dense ash emissions (figure 20). Landsat-8 imagery from 11 July showed a dense ash plume drifting SE, fresh black lava covering the 2-km-wide summit caldera floor, and a very strong thermal anomaly most intense at the center near the pyroclastic cone and cooler around the inner edges of the crater (figure 21). On 12 July, the Moderate Resolution Imaging Spectroradiometer (MODIS) on NASA’s Aqua satellite captured a view of an ash-and-gas plume drifting hundreds of kilometers SE from Raung (figure 22).
A satellite image on 20 July showed fresh incandescent lava covering the floor of the summit crater and a dense ash plume drifting N from the summit (figure 23). Incandescent ejecta emerged from two vents on the new pyroclastic cone inside the inner crater on 26 July (figure 24). On 27 July a dense ash plume was visible again in satellite imagery drifting NW and the hottest part of the thermal anomaly was in the SE quadrant of the crater (figure 25). Substantial SO2 plumes were recorded by the OMI instrument on the Aura satellite during July and early August 2015 (figure 26).
Significant ash emissions continued into early August 2015 with numerous flight cancellations. The Darwin VAAC reported ash plumes rising to 5.2 km altitude and extending as far as 750 km SE during the first two weeks in August (figure 27). Satellite imagery indicated a small ash plume drifting W from the center of the crater on 12 August and weak thermal anomalies along the E and S rim of the floor of the crater (figure 28). The summit crater was covered with fresh lava on 14 August when viewed by visitors, and ash emissions rose a few hundred meters above the crater rim from a vent in the SW side of the pyroclastic cone (figure 29). The visitors observed pulsating ash emissions rising from the SW vent on the large double-crater new cinder cone. The larger vent to the NE was almost entirely inactive except for two small, weakly effusive vents on its inner walls.
The lengthy sequence of multiple daily VAAC reports that began in late June ended on 16 August 2015 with reports becoming more intermittent and ash plume heights rising to only 3.7-3.9 km altitude. Multiple discontinuous eruptions to 3.9 km altitude were reported on 18 August. The plumes extended about 100 km NW. The last report of an ash plume was from an airline on 22 August noting a low-level plume 50 km NW. Two MODVOLC alerts were issued that day. By 28 August only a very small steam plume was present at the center of the crater; the southern half of the edge of the crater floor still had small thermal anomalies (figure 30). The last single MODVOLC thermal alerts were on 29 August and 7 September. The Alert Level was lowered to 2 on 24 August 2015, and further lowered to 1 on 20 October 2016.
Geologic Background. Raung, one of Java's most active volcanoes, is a massive stratovolcano in easternmost Java that was constructed SW of the rim of Ijen caldera. The unvegetated summit is truncated by a dramatic steep-walled, 2-km-wide caldera that has been the site of frequent historical eruptions. A prehistoric collapse of Gunung Gadung on the W flank produced a large debris avalanche that traveled 79 km, reaching nearly to the Indian Ocean. Raung contains several centers constructed along a NE-SW line, with Gunung Suket and Gunung Gadung stratovolcanoes being located to the NE and W, respectively.
Information Contacts: Pusat Vulkanologi dan Mitigasi Bencana Geologi (PVMBG, also known as Indonesian Center for Volcanology and Geological Hazard Mitigation, CVGHM), Jalan Diponegoro 57, Bandung 40122, Indonesia (URL: http://www.vsi.esdm.go.id/); Badan Nasional Penanggulangan Bencana (BNPB), National Disaster Management Agency, Graha BNPB - Jl. Scout Kav.38, East Jakarta 13120, Indonesia (URL: http://www.bnpb.go.id/); Hawai'i Institute of Geophysics and Planetology (HIGP) - MODVOLC Thermal Alerts System, School of Ocean and Earth Science and Technology (SOEST), Univ. of Hawai'i, 2525 Correa Road, Honolulu, HI 96822, USA (URL: http://modis.higp.hawaii.edu/); Darwin Volcanic Ash Advisory Centre (VAAC), Bureau of Meteorology, Northern Territory Regional Office, PO Box 40050, Casuarina, NT 0811, Australia (URL: http://www.bom.gov.au/info/vaac/);Google Earth (URL: https://www.google.com/earth/); Sentinel Hub Playground (URL: https://www.sentinel-hub.com/explore/sentinel-playground); NASA Earth Observatory, EOS Project Science Office, NASA Goddard Space Flight Center, Goddard, Maryland, USA (URL: http://earthobservatory.nasa.gov/, https://earthobservatory.nasa.gov/images/86213/eruption-of-raung-volcano); Tom Pfeiffer, Volcano Discovery (URL: http://www.volcanodiscovery.com/); Aris Yanto (URL: https://www.exploredesa.com/2012/11/mount-raung-produce-of-vulcanic-ash-plume-and-continue-eruption/); DigitalGlobe (URL: https://www.maxar.com/, https://twitter.com/Maxar/status/875449111398547457); Øystein Lund Andersen (URL: https://twitter.com/OysteinVolcano/status/1194879946042142726, http://www.oysteinlundandersen.com).
Stromboli (Italy) — September 2020 Cite this Report
Stromboli
Italy
38.789°N, 15.213°E; summit elev. 924 m
All times are local (unless otherwise noted)
Strombolian activity continues at both summit craters during May-August 2020
Stromboli, located in northeastern-most part of the Aeolian Islands, is composed of two active summit vents: the Northern (N) Crater and the Central-South (CS) Crater that are situated at the head of the Sciara del Fuoco, a large scarp that runs from the summit down the NW side of the volcano. The current eruption period began in 1934, continuing to the present with volcanism characterized by consistent Strombolian explosions in both summit craters, ash plumes, pyroclastic flows, and occasional lava flows (BGVN 45:08). This report updates activity consisting of dominantly Strombolian explosions and ash plumes from May to August 2020 with information primarily from daily and weekly reports by Italy's Istituto Nazionale di Geofisica e Vulcanologia (INGV) and various satellite data.
Activity was consistent during this reporting period. Explosion rates ranged from 1-23 events per hour and were of variable intensity, producing material that typically rose from less than 80 to over 300 m above the crater. One ash plume on 19 July rose 1 km above the crater and high energy ballistics were ejected 500 m above the crater during the week of 20-26 July (table 9). Strombolian explosions were often accompanied by gas-and-steam emissions and spattering that has occasionally resulted in material deposited on the slopes of the Sciara del Fuoco. According to INGV, the average SO2 emissions measured 250-300 tons/day.
Table 9. Summary of activity at Stromboli during May-August 2020. Low-intensity activity indicates ejecta rising less than 80 m, medium-intensity is ejecta rising less than 150 m, and high-intensity is ejecta rising over 200 m above the vent. Data courtesy of INGV.
| Month |
Activity |
| May 2020 |
Strombolian activity and degassing continued with some spattering. Explosion rates varied from 1-17 per hour. Ejected material rose 80-150 m above the N crater and 150-250 m above the CS crater. The average SO2 emissions measured 300 tons/day. |
| Jun 2020 |
Strombolian activity and degassing continued with spattering. Explosion rates varied from 2-14 per hour. Ejected material rose 80-200 m above the N crater and 150 m above the CS crater. Spattering was primarily focused in the CS crater. The average SO2 emissions measured 300 tons/day. |
| Jul 2020 |
Strombolian activity and degassing continued with some spattering. Explosion rates varied from 1-12 per hour. Ejected material rose 80-1,000 m above the N crater. Spattering was primarily focused in the CS crater. The average SO2 emissions measured 300 tons/day. |
| Aug 2020 |
Strombolian activity continued with discontinuous spattering. Explosion rates varied from 1-23 per hour. Ejected material rose at least 200 m above the N crater and at least 250 m above the CS crater. |
Explosive activity was relatively consistent during May 2020 and was mainly produced in 3-4 eruptive vents in the N crater and at least two eruptive vents in the CS crater. As a result of some explosions fallout covered the slopes of the Sciara del Fuoco. Explosion rates varied from 1-17 per hour in the N crater and 1-8 per hour in the CS crater; ejected material rose 80-250 m above the craters.
During June, explosions originated from 2-3 eruptive vents in the N crater and at least 2-3 localized vents in the CS crater. The Strombolian explosions ejected material 80-200 m above the craters, some of which fell back onto the Sciara (figure 182). Explosion rates varied from 5-14 per hour in the N crater and 2-9 per hour in the CS crater. Spattering was typically observed in the CS crater.
Ongoing explosive activity continued into July, originating from 2-3 eruptive vents in the N crater and 3-4 eruptive vents in the CS crater. Explosions varied from 3-12 per hour in the N crater and 1-11 per hour in the CS crater; ejected lapilli and bombs rose 80-1,000 m above the craters (figure 183). On 19 July a high-energy explosion between 0500 and 0504 produced an ash plume containing ejecta more than 50 cm that rose to a maximum of 1 km above the crater, with fallout reaching the Pizzo sopra la Fossa and resulting in ashfall on the Sciara and the towns of Liscione and Roccette. During the week of 20-26 July explosions in the E portion of the volcano ejected ballistics 500 m above the crater; the size and shape of these varied between slag bombs to clasts greater than 50 cm.
Strombolian activity accompanied by discontinuous spattering continued during August. Total daily explosions varied from 3-23 per hour ejecting material that up to 200-250 m above the craters. During the first half of the month the explosions were low-intensity and consisted of fine material. On 13 August the intensity of the explosions increased, producing an ash plume that rose 300 m above the crater drifting SE and resulting in a significant amount of ashfall on the Sciara. During the week of 17-23, explosions in the N1 crater ejected material 200 m above the crater while explosions in the CS crater ejected material 250 m above the crater, predominantly during 22 August in the S2 crater (figure 184).
Moderate thermal activity was relatively consistent from October 2019 through mid-April 2020; during May-August thermal activity became less frequent and anomalies were lower in power based on the MIROVA Log Radiative Power graph using MODIS infrared satellite information (figure 185). Though there were no detected MODVOLC thermal alerts during this reporting period, many thermal hotspots were observed in Sentinel-2 thermal satellite imagery in both summit craters (figure 186).
Geologic Background. Spectacular incandescent nighttime explosions at Stromboli have long attracted visitors to the "Lighthouse of the Mediterranean" in the NE Aeolian Islands. This volcano has lent its name to the frequent mild explosive activity that has characterized its eruptions throughout much of historical time. The small island is the emergent summit of a volcano that grew in two main eruptive cycles, the last of which formed the western portion of the island. The Neostromboli eruptive period took place between about 13,000 and 5,000 years ago. The active summit vents are located at the head of the Sciara del Fuoco, a prominent scarp that formed about 5,000 years ago due to a series of slope failures which extends to below sea level. The modern volcano has been constructed within this scarp, which funnels pyroclastic ejecta and lava flows to the NW. Essentially continuous mild Strombolian explosions, sometimes accompanied by lava flows, have been recorded for more than a millennium.
Information Contacts: Istituto Nazionale di Geofisica e Vulcanologia (INGV), Sezione di Catania, Piazza Roma 2, 95123 Catania, Italy, (URL: http://www.ct.ingv.it/en/); MIROVA (Middle InfraRed Observation of Volcanic Activity), a collaborative project between the Universities of Turin and Florence (Italy) supported by the Centre for Volcanic Risk of the Italian Civil Protection Department (URL: http://www.mirovaweb.it/); Sentinel Hub Playground (URL: https://www.sentinel-hub.com/explore/sentinel-playground).
Turrialba (Costa Rica) — September 2020 Cite this Report
Turrialba
Costa Rica
10.025°N, 83.767°W; summit elev. 3340 m
All times are local (unless otherwise noted)
New eruptive period on 18 June 2020 consisted of ash eruptions
Turrialba is a stratovolcano located in Costa Rica that overlooks the city of Cartago. Three well-defined craters occur at the upper SW end of a broad 800 x 2,200 m summit depression that is breached to the NE. Activity described in the previous report primarily included weak ash explosions and minor ash emissions (BGVN 44:11). This reporting period updates information from November 2019-August 2020; volcanism dominantly consists of ash emissions during June-August, based on information from daily and weekly reports by the Observatorio Vulcanologico Sismologica de Costa Rica-Universidad Nacional (OVSICORI-UNA) and satellite data.
Volcanism during November 2019 through mid-June was relatively low, dominated by low SO2 emissions (100-300 tons/day) and typical low seismic tremors. A single explosion was recorded at 1850 on 7 December 2019, and two gas-and-steam plumes rose 800 m and 300 m above the crater on 25 and 27 December, respectively. An explosion was detected on 29 January 2020 but did not result in any ejecta. An overflight during the week of 10 February measured the depth of the crater (140 m); since the previous measurements made in February 2019 (220 m), the crater has filled with 80 m of debris due to frequent collapses of the NW and SE internal crater walls. Beginning around February and into at least early May 2020 the Sentinel-2 MODIS Thermal Volcanic Activity graph provided by the MIROVA system detected a small cluster of thermal anomalies (figure 52). Some of these anomalies were faintly registered in Sentinel-2 thermal satellite imagery during 10 and 25 April, with a more distinct anomaly occurring on 15 May (figure 53).
On 18 June activity increased, which marked the start of a new eruptive period that produced ash emissions rising 100 m above the crater rim at 1714, 1723, and 1818. The next morning, 19 June, two more events at 1023 and 1039 resulted in ash emissions rising 100 m above the crater. During 23-26 June small ash emissions continued to occur each day, rising no higher than 100 m above the crater. A series of small ash eruptions that rose 100 m above the crater occurred during 28 and 29 June; four events were recorded at 0821, 1348, 1739, and 2303 on 28 June and five more were recorded at 0107, 0232, 0306, 0412, and 0818 on 29 June. The two events at 0107 and 0412 were accompanied by ballistics ejected onto the N wall of the crater, according to OVSICORI-UNA.
Almost daily ash emissions continued during 1-7 July, rising less than 100 m above the crater; no ash emissions were observed on 3 July. On 6 July, gas-and-steam and ash emissions rose hundreds of meters above the crater at 0900, resulting in local ashfall. Passive gas-and-steam emissions with minor amounts of ash were occasionally visible during 9-10 July. On 14 July an eruptive pulse was observed, generating brief incandescence at 2328, which was likely associated with a small ash emission. Dilute ash emissions at 1028 on 16 July preceded an eruption at 1209 that resulted in an ash plume rising 200 m above the crater. Ash emissions of variable densities continued through 20 July rising as high as 200 m above the crater; on 20 July incandescence was observed on the W wall of the crater. An eruptive event at 0946 on 29 July produced an ash plume that rose 200-300 m above the crater rim. During 30-31 July a series of at least ten ash eruptions were detected, rising no higher than 200 m above the crater, each lasting less than ten minutes. Some incandescence was visible on the SW wall of the crater during this time.
On 1 August at 0746 an ash plume rose 500 m above the crater. During 4-5 August a total of 19 minor ash emissions occurred, accompanied by ash plumes that rose no higher than 200 m above the crater. OVSICORI-UNA reported on 21 August that the SW wall of the crater had fractured; some incandescence in the fracture zone had been observed the previous month. Two final eruptions were detected on 22 and 24 August at 1253 and 2023, respectively. The eruption on 24 August resulted in an ash plume that rose to a maximum height of 1 km above the crater.
Geologic Background. Turrialba, the easternmost of Costa Rica's Holocene volcanoes, is a large vegetated basaltic-to-dacitic stratovolcano located across a broad saddle NE of Irazú volcano overlooking the city of Cartago. The massive edifice covers an area of 500 km2. Three well-defined craters occur at the upper SW end of a broad 800 x 2200 m summit depression that is breached to the NE. Most activity originated from the summit vent complex, but two pyroclastic cones are located on the SW flank. Five major explosive eruptions have occurred during the past 3500 years. A series of explosive eruptions during the 19th century were sometimes accompanied by pyroclastic flows. Fumarolic activity continues at the central and SW summit craters.
Information Contacts: Observatorio Vulcanologico Sismologica de Costa Rica-Universidad Nacional (OVSICORI-UNA), Apartado 86-3000, Heredia, Costa Rica (URL: http://www.ovsicori.una.ac.cr/, https://www.facebook.com/OVSICORI/); MIROVA (Middle InfraRed Observation of Volcanic Activity), a collaborative project between the Universities of Turin and Florence (Italy) supported by the Centre for Volcanic Risk of the Italian Civil Protection Department (URL: http://www.mirovaweb.it/); Sentinel Hub Playground (URL: https://www.sentinel-hub.com/explore/sentinel-playground).
Villarrica (Chile) — September 2020 Cite this Report
Villarrica
Chile
39.42°S, 71.93°W; summit elev. 2847 m
All times are local (unless otherwise noted)
Continued summit incandescence February-August 2020 with larger explosions in July and August
Historical eruptions at Chile's Villarrica, documented since 1558, have consisted largely of mild-to-moderate explosive activity with occasional lava effusion. An intermittently active lava lake at the summit has been the source of Strombolian activity, incandescent ejecta, and thermal anomalies for several decades; the current eruption has been ongoing since December 2014. Continuing activity during February-August 2020 is covered in this report, with information provided by the Southern Andes Volcano Observatory (Observatorio Volcanológico de Los Andes del Sur, OVDAS), part of Chile's National Service of Geology and Mining (Servicio Nacional de Geología y Minería, SERNAGEOMIN), and Projecto Observación Villarrica Internet (POVI), part of the Fundacion Volcanes de Chile, a private research group that studies volcanoes across Chile. Sentinel satellite imagery also provided valuable data.
Intermittent incandescence was observed at the summit throughout February-August 2020, which was reflected in the MIROVA thermal anomaly data for the period (figure 92). Continuous steam and gas emissions with occasional ash plumes rose 100-520 m above the summit. Every clear satellite image of Villarrica from February -August 2020 showed either a strong thermal anomaly within the summit crater or a dense cloud within the crater that prevented the heat signal from being measured. Sentinel-2 captured on average twelve images of Villarrica each month (figure 93). Larger explosions on 25 July and 7 August produced ejecta and ash emissions.
Primarily white gas emissions rose up to 400 m above the summit during the first half of February 2020 and to 320 m during the second half. Incandescence was observed on clear nights. Incandescent ejecta was captured in the POVI webcam on 7 February (figure 94). Sentinel-2 satellite imagery showed bright thermal anomalies at the summit on 5, 8, 10, 13, 18, 20, 23, 25, and 28 February, nine of the eleven days that images were taken; the other days were cloudy.
Villarrica remained at Alert Level Yellow (on a four-level Green-Yellow-Orange-Red scale) in March 2020. Plumes of gas rose 350 m above the crater during the first half of March. The POVI webcam captured incandescent ejecta on 1 March (figure 95). SERNAGEOMIN reported continuous white emissions and incandescence at night when the weather permitted. During the second half of March emissions rose 300 m above the crater; they were mostly white but occasionally gray and drifted N, S, and SE. Nighttime incandescence could be observed from communities that were tens of kilometers away on multiple occasions (figure 96). Sentinel-2 satellite imagery showed bright thermal anomalies at the summit on 1, 3, 4, 6, 9, 11, 14, 16, 19, 26, 29, and 31 March, twelve of the fourteen days images were taken. The other days were cloudy.
During the first half of April 2020 plumes of gas rose 300 m above the crater, mostly as continuous degassing of steam. Incandescence continued to be seen on clear nights throughout the month. Steam plumes rose 150 m high during the second half of the month. A series of Strombolian explosions on 28-29 April ejected material up to 30 m above the crater rim (figure 97). Sentinel-2 satellite imagery showed bright thermal anomalies at the summit on 3, 8, 10, 13, 20, and 30 April, six of the twelve days images were taken; other days were cloudy.
Daily plumes of steam rose 160 m above the summit crater during the first half of May 2020; incandescence was visible on clear nights throughout the month. During 5-7 May webcams captured episodes of dark gray emissions with minor ash that, according to SERNAGEOMIN, was related to collapses of the interior crater walls. Plumes rose as high as 360 m above the crater during the second half of May. The continuous degassing was gray and white with periodic ash emissions. Pyroclastic deposits were noted in a radius of 50 m around the crater rim associated with minor explosive activity from the lava lake. The POVI infrared camera captured a strong thermal signal rising from the summit on 29 May (figure 98), although no visual incandescence was reported. Residents of Coñaripe (17 km SSW) could see steam plumes at the snow-covered summit on 31 May (figure 99). Sentinel-2 satellite imagery showed bright thermal anomalies at the summit on 5, 13, 20, 23, 25 and 30 May, six of the twelve days images were taken. The other days were cloudy.
For most of the first half of June, white steam emissions rose as high as 480 m above the crater rim. A few times, emissions were gray, attributed to ash emissions from collapses of the inner wall of the crater by SERNAGEOMIN. Incandescence was visible on clear nights throughout the month. Vertical inflation of 1.5 cm was noted during the first half of June. Skies were cloudy for much of the second half of June; webcams only captured images of the summit on 21 and 27 June with 100-m-high steam plumes. Sentinel-2 satellite imagery showed bright thermal anomalies at the summit on 4, 7, and 14 June, three of the twelve days images were taken. The other days were cloudy.
Atmospheric clouds prevented most observations of the summit during the first half of July (figure 100); during brief periods it was possible to detect incandescence and emissions rising to 320 m above the crater. Continuous degassing was observed during the second half of July; the highest plume rose to 360 m above the crater on 23 July. On 25 July, monitoring stations in the vicinity of Villarrica registered a large-period (LP) seismic event associated with a moderate explosion at the crater. It was accompanied by a 14.7 Pa infrasound signal measured 1 km away. Meteorological conditions did not permit views of any surface activity that day, but a clear view of the summit on 28 July showed dark tephra on the snow around the summit crater (figure 101). Sentinel-2 satellite imagery showed bright thermal anomalies at the summit on 2 and 29 July, two of the twelve days images were taken. The other days were either cloudy or had steam obscuring the summit crater.
An explosion on 7 August at 1522 local time (1922 UTC) produced an LP seismic signal and a 10 Pa infrasound signal. Webcams were able to capture an image of the explosion which produced a dense plume of steam and ash that rose 370 m above the summit and drifted SE (figure 102). The highest plumes in the first half of August reached 520 m above the summit on 7 August. Sporadic emissions near the summit level were reported by the Buenos Aires VAAC the following day but were not observed in satellite imagery. When weather permitted during the second half of the month, continuous degassing to 200 m above the crater was visible on the webcams. SERNAGEOMIN participated in a webinar on 20 August 2020 discussing safety at Villarrica and showed an image of the summit crater taken during an overflight on 19 August (figure 103). Sentinel-2 satellite imagery showed bright thermal anomalies at the summit on 6, 21, and 31 August, three of the thirteen days images were taken. The other days were cloudy.
Geologic Background. The glacier-covered Villarrica stratovolcano, in the northern Lakes District of central Chile, is ~15 km south of the city of Pucon. A 2-km-wide caldera that formed about 3,500 years ago is located at the base of the presently active, dominantly basaltic to basaltic andesite cone at the NW margin of a 6-km-wide Pleistocene caldera. More than 30 scoria cones and fissure vents are present on the flanks. Plinian eruptions and pyroclastic flows that have extended up to 20 km from the volcano were produced during the Holocene. Lava flows up to 18 km long have issued from summit and flank vents. Eruptions documented since 1558 CE have consisted largely of mild-to-moderate explosive activity with occasional lava effusion. Glaciers cover 40 km2 of the volcano, and lahars have damaged towns on its flanks.
Information Contacts: Servicio Nacional de Geología y Minería (SERNAGEOMIN), Observatorio Volcanológico de Los Andes del Sur (OVDAS), Avda Sta María No. 0104, Santiago, Chile (URL: http://www.sernageomin.cl/); MIROVA (Middle InfraRed Observation of Volcanic Activity), a collaborative project between the Universities of Turin and Florence (Italy) supported by the Centre for Volcanic Risk of the Italian Civil Protection Department (URL: http://www.mirovaweb.it/); Sentinel Hub Playground (URL: https://www.sentinel-hub.com/explore/sentinel-playground); Proyecto Observación Villarrica Internet (POVI), (URL: http://www.povi.cl/, https://twitter.com/povi_cl/status/1237541250825248768); Luis Orlando (URL: https://twitter.com/valepizzas/status/1242657625495539712); Laura Angarita (URL: https://twitter.com/AngaritaV/status/1267275374947377152, https://twitter.com/AngaritaV/status/1288086614422573057); Geography Fans (URL: https://twitter.com/Geografia_Afic/status/1284520850499092480); Turismo Integral (URL: https://turismointegral.net/expertos-entregan-recomendaciones-por-actividad-registrada-en-volcan-villarrica/).
Yasur (Vanuatu) — September 2020 Cite this Report
Yasur
Vanuatu
19.532°S, 169.447°E; summit elev. 361 m
All times are local (unless otherwise noted)
Ash and gas explosions continue through August 2020
Recent activity at Yasur, which has been erupting since July 1774, includes frequent Strombolian explosions, along with ash and gas plumes from several vents in the summit crater (BGVN 44:02, 45:03). This report summarizes activity during March through August 2020, using information from monthly bulletins of the Vanuatu Meteorology and Geo-Hazards Department (VMGD) and various satellite data. The volcano has remained on Alert Level 2 (major unrest state, on a scale of 0-5), where it has been since 18 October 2016, according to VMGD.
During the current reporting period, VMGD reported that explosive activity continued at an elevated level, with ongoing ash and gas emissions (figure 71). Some of the more intense explosions ejected bombs outside the summit crater. During 2-3, 13, and 17 March, 2-3 April, and 19 July, the Wellington Volcanic Ash Advisory Center (VAAC) identified low-level ash plumes that reached an altitude of 1.5 km and drifted in multiple directions; the ash plume during 2-3 April resulted in ashfall on the SSW part of the island. On 19 May an ash plume rose to a maximum altitude of 2.1 km and drifted SE.
During the reporting period, the MODVOLC thermal algorithm using MODIS satellite data detected a total of 55 thermal hotspots during three days in April, nine days in May, six days in June and August, and four days in July. A maximum of four pixels were recorded on a single day during 26 May, 6 June, and 20 July. The MIROVA (Middle InfraRed Observation of Volcanic Activity) analysis of MODIS satellite data detected numerous hotspots from 16 September 2019 through August 2020, with a slight increase in power and frequency during May (figure 72). Satellite images from Sentinel-2 detected a strong thermal anomaly within the summit crater on 10 May, accompanied by ash and gas emissions (figure 73).
High-resolution satellite sensors commonly recorded moderate sulfur dioxide levels drifting in multiple directions from the volcano. High sulfur dioxide levels were also occasionally observed, especially during March (figure 74).
Geologic Background. Yasur has exhibited essentially continuous Strombolian and Vulcanian activity at least since Captain Cook observed ash eruptions in 1774. This style of activity may have continued for the past 800 years. Located at the SE tip of Tanna Island in Vanuatu, this pyroclastic cone has a nearly circular, 400-m-wide summit crater. The active cone is largely contained within the small Yenkahe caldera, and is the youngest of a group of Holocene volcanic centers constructed over the down-dropped NE flank of the Pleistocene Tukosmeru volcano. The Yenkahe horst is located within the Siwi ring fracture, a 4-km-wide open feature associated with eruption of the andesitic Siwi pyroclastic sequence. Active tectonism along the Yenkahe horst accompanying eruptions has raised Port Resolution harbor more than 20 m during the past century.
Information Contacts: Geo-Hazards Division, Vanuatu Meteorology and Geo-Hazards Department (VMGD), Ministry of Climate Change Adaptation, Meteorology, Geo-Hazards, Energy, Environment and Disaster Management, Private Mail Bag 9054, Lini Highway, Port Vila, Vanuatu (URL: http://www.vmgd.gov.vu/, https://www.facebook.com/VanuatuGeohazardsObservatory/); Wellington Volcanic Ash Advisory Centre (VAAC), Meteorological Service of New Zealand Ltd (MetService), PO Box 722, Wellington, New Zealand (URL: http://vaac.metservice.com/index.html); Hawai'i Institute of Geophysics and Planetology (HIGP) MODVOLC Thermal Alerts System, School of Ocean and Earth Science and Technology (SOEST), Univ. of Hawai'i, 2525 Correa Road, Honolulu, HI 96822, USA (URL: http://modis.higp.hawaii.edu/); MIROVA (Middle InfraRed Observation of Volcanic Activity), a collaborative project between the Universities of Turin and Florence (Italy) supported by the Centre for Volcanic Risk of the Italian Civil Protection Department (URL: http://www.mirovaweb.it/); Sentinel Hub Playground (URL: https://www.sentinel-hub.com/explore/sentinel-playground); Global Sulfur Dioxide Monitoring Page, Atmospheric Chemistry and Dynamics Laboratory, NASA Goddard Space Flight Center (NASA/GSFC), 8800 Greenbelt Road, Goddard, Maryland, USA (URL: https://so2.gsfc.nasa.gov/).