Recently Published Bulletin Reports
Erebus (Antarctica) Lava lake remains active; most thermal alerts recorded since 2019
Rincon de la Vieja (Costa Rica) Frequent phreatic explosions during July-December 2023
Bezymianny (Russia) Explosion on 18 October 2023 sends ash plume 8 km high; lava flows and incandescent avalanches
Kilauea (United States) Low-level lava effusions in the lava lake at Halema’uma’u during July-December 2022
Nyamulagira (DR Congo) Lava flows and thermal activity during May-October 2023
Bagana (Papua New Guinea) Explosions, ash plumes, ashfall, and lava flows during April-September 2023
Mayon (Philippines) Lava flows, pyroclastic flows, ash emissions, and seismicity during April-September 2023
Nishinoshima (Japan) Eruption plumes and gas-and-steam plumes during May-August 2023
Krakatau (Indonesia) White gas-and-steam plumes and occasional ash plumes during May-August 2023
Villarrica (Chile) Strombolian activity, gas-and-ash emissions, and crater incandescence during April-September 2023
Merapi (Indonesia) Frequent incandescent avalanches during April-September 2023
Ebeko (Russia) Moderate explosive activity with ash plumes continued during June-November 2023
Erebus (Antarctica) — January 2024  Cite this Report
Erebus
Antarctica
77.53°S, 167.17°E; summit elev. 3794 m
All times are local (unless otherwise noted)
Lava lake remains active; most thermal alerts recorded since 2019
The lava lake in the summit crater of Erebus has been active since at least 1972. Located in Antarctica overlooking the McMurdo Station on Ross Island, it is the southernmost active volcano on the planet. Because of the remote location, activity is primarily monitored by satellites. This report covers activity during 2023.
The number of thermal alerts recorded by the Hawai'i Institute of Geophysics and Planetology’s MODVOLC Thermal Alerts System increased considerably in 2023 compared to the years 2020-2022 (table 9). In contrast to previous years, the MODIS instruments aboard the Aqua and Terra satellites captured data from Erebus every month during 2023. Consistent with previous years, the lowest number of anomalous pixels were recorded in January, November, and December.
Table 9. Number of monthly MODIS-MODVOLC thermal alert pixels recorded at Erebus during 2017-2023. See BGVN 42:06 for data from 2000 through 2016. The table was compiled using data provided by the HIGP – MODVOLC Thermal Alerts System.
| Year |
Jan |
Feb |
Mar |
Apr |
May |
Jun |
Jul |
Aug |
Sep |
Oct |
Nov |
Dec |
SUM |
| 2017 |
0 |
21 |
9 |
0 |
0 |
1 |
11 |
61 |
76 |
52 |
0 |
3 |
234 |
| 2018 |
0 |
21 |
58 |
182 |
55 |
17 |
137 |
172 |
103 |
29 |
0 |
0 |
774 |
| 2019 |
2 |
21 |
162 |
151 |
55 |
56 |
75 |
53 |
29 |
19 |
1 |
0 |
624 |
| 2020 |
0 |
2 |
16 |
18 |
4 |
4 |
1 |
3 |
18 |
3 |
1 |
6 |
76 |
| 2021 |
0 |
9 |
1 |
0 |
2 |
56 |
46 |
47 |
35 |
52 |
5 |
3 |
256 |
| 2022 |
1 |
13 |
55 |
22 |
15 |
32 |
39 |
19 |
31 |
11 |
0 |
0 |
238 |
| 2023 |
2 |
33 |
49 |
82 |
41 |
32 |
70 |
64 |
42 |
17 |
5 |
11 |
448 |
Sentinel-2 infrared images showed one or two prominent heat sources within the summit crater, accompanied by adjacent smaller sources, similar to recent years (see BGVN 46:01, 47:02, and 48:01). A unique image was obtained on 25 November 2023 by the OLI-2 (Operational Land Imager-2) on Landsat 9, showing the upper part of the volcano surrounded by clouds (figure 32).
Geologic Background. Mount Erebus, the world's southernmost historically active volcano, overlooks the McMurdo research station on Ross Island. It is the largest of three major volcanoes forming the crudely triangular Ross Island. The summit of the dominantly phonolitic volcano has been modified by one or two generations of caldera formation. A summit plateau at about 3,200 m elevation marks the rim of the youngest caldera, which formed during the late-Pleistocene and within which the modern cone was constructed. An elliptical 500 x 600 m wide, 110-m-deep crater truncates the summit and contains an active lava lake within a 250-m-wide, 100-m-deep inner crater; other lava lakes are sometimes present. The glacier-covered volcano was erupting when first sighted by Captain James Ross in 1841. Continuous lava-lake activity with minor explosions, punctuated by occasional larger Strombolian explosions that eject bombs onto the crater rim, has been documented since 1972, but has probably been occurring for much of the volcano's recent history.
Information Contacts: Hawai'i Institute of Geophysics and Planetology (HIGP) - MODVOLC Thermal Alerts System, School of Ocean and Earth Science and Technology (SOEST), Univ. of Hawai'i, 2525 Correa Road, Honolulu, HI 96822, USA (URL: http://modis.higp.hawaii.edu/); Copernicus Browser, Copernicus Data Space Ecosystem, European Space Agency (URL: https://dataspace.copernicus.eu/browser/); NASA Earth Observatory, EOS Project Science Office, NASA Goddard Space Flight Center, Goddard, Maryland, USA (URL: https://earthobservatory.nasa.gov/images/152134/erebus-breaks-through).
Rincon de la Vieja (Costa Rica) — January 2024 Cite this Report
Rincon de la Vieja
Costa Rica
10.83°N, 85.324°W; summit elev. 1916 m
All times are local (unless otherwise noted)
Frequent phreatic explosions during July-December 2023
Rincón de la Vieja is a volcanic complex in Costa Rica with a hot convecting acid lake that exhibits frequent weak phreatic explosions, gas-and-steam emissions, and occasional elevated sulfur dioxide levels (BGVN 45:10, 46:03, 46:11). The current eruption period began June 2021. This report covers activity during July-December 2023 and is based on weekly bulletins and occasional daily reports from the Observatorio Vulcanologico Sismologica de Costa Rica-Universidad Nacional (OVSICORI-UNA).
Numerous weak phreatic explosions continued during July-December 2023, along with gas-and-steam emissions and plumes that rose as high as 3 km above the crater rim. Many weekly OVSICORI-UNA bulletins included the previous week's number of explosions and emissions (table 9). For many explosions, the time of explosion was given (table 10). Frequent seismic activity (long-period earthquakes, volcano-tectonic earthquakes, and tremor) accompanied the phreatic activity.
Table 9. Number of reported weekly phreatic explosions and gas-and-steam emissions at Rincón de la Vieja, July-December 2023. Counts are reported for the week before the Weekly Bulletin date; not all reports included these data. Courtesy of OVSICORI-UNA.
| OVSICORI Weekly Bulletin |
Number of explosions |
Number of emissions |
| 28 Jul 2023 |
6 |
14 |
| 4 Aug 2023 |
10 |
12 |
| 1 Sep 2023 |
13 |
11 |
| 22 Sep 2023 |
12 |
13 |
| 29 Sep 2023 |
6 |
11 |
| 6 Oct 2023 |
12 |
5 |
| 13 Oct 2023 |
7 |
9 |
| 20 Oct 2023 |
1 |
15 |
| 27 Oct 2023 |
3 |
23 |
| 3 Nov 2023 |
3 |
10 |
| 17 Nov 2023 |
0 |
Some |
| 24 Nov 2023 |
0 |
14 |
| 8 Dec 2023 |
4 |
16 |
| 22 Dec 2023 |
8 |
18 |
Table 10. Summary of activity at Rincón de la Vieja during July-December 2023. Weak phreatic explosions and gas emissions are noted where the time of explosion was indicated in the weekly or daily bulletins. Height of plumes or emissions are distance above the crater rim. Courtesy of OVSICORI-UNA.
| Date |
Time |
Description of Activity |
| 1 Jul 2023 |
0156 |
Explosion. |
| 2 Jul 2023 |
0305 |
Explosion. |
| 4 Jul 2023 |
0229, 0635 |
Event at 0635 produced a gas-and-steam plume that rose 700 m and drifted W; seen by residents in Liberia (21 km SW). |
| 9 Jul 2023 |
1843 |
Explosion. |
| 21 Jul 2023 |
0705 |
Explosion. |
| 26 Jul 2023 |
1807 |
Explosion. |
| 28 Jul 2023 |
0802 |
Explosion generated a gas-and-steam plume that rose 500 m. |
| 30 Jul 2023 |
1250 |
Explosion. |
| 31 Jul 2023 |
2136 |
Explosion. |
| 11 Aug 2023 |
0828 |
Explosion. |
| 18 Aug 2023 |
1304 |
Explosion. |
| 21 Aug 2023 |
1224 |
Explosion generated gas-and-steam plumes rose 500-600 m. |
| 22 Aug 2023 |
0749 |
Explosion generated gas-and-steam plumes rose 500-600 m. |
| 24 Aug 2023 |
1900 |
Explosion. |
| 25 Aug 2023 |
0828 |
Event produced a steam-and-gas plume that rose 3 km and drifted NW. |
| 27-28 Aug 2023 |
0813 |
Four small events; the event at 0813 on 28 August lasted two minutes and generated a steam-and-gas plume that rose 2.5 km. |
| 1 Sep 2023 |
1526 |
Explosion generated plume that rose 2 km and ejected material onto the flanks. |
| 2-3 Sep 2023 |
- |
Small explosions detected in infrasound data. |
| 4 Sep 2023 |
1251 |
Gas-and-steam plume rose 1 km and drifted W. |
| 7 Nov 2023 |
1113 |
Explosion. |
| 8 Nov 2023 |
0722 |
Explosion. |
| 12 Nov 2023 |
0136 |
Small gas emissions. |
| 14 Nov 2023 |
0415 |
Small gas emissions. |
According to OVSICORI-UNA, during July-October the average weekly sulfur dioxide (SO2) flux ranged from 68 to 240 tonnes/day. However, in mid-November the flux increased to as high as 334 tonnes/day, the highest value measured in recent years. The high SO2 flux in mid-November was also detected by the TROPOMI instrument on the Sentinel-5P satellite (figure 43).
Geologic Background. Rincón de la Vieja, the largest volcano in NW Costa Rica, is a remote volcanic complex in the Guanacaste Range. The volcano consists of an elongated, arcuate NW-SE-trending ridge constructed within the 15-km-wide early Pleistocene Guachipelín caldera, whose rim is exposed on the south side. Sometimes known as the "Colossus of Guanacaste," it has an estimated volume of 130 km3 and contains at least nine major eruptive centers. Activity has migrated to the SE, where the youngest-looking craters are located. The twin cone of Santa María volcano, the highest peak of the complex, is located at the eastern end of a smaller, 5-km-wide caldera and has a 500-m-wide crater. A Plinian eruption producing the 0.25 km3 Río Blanca tephra about 3,500 years ago was the last major magmatic eruption. All subsequent eruptions, including numerous historical eruptions possibly dating back to the 16th century, have been from the prominent active crater containing a 500-m-wide acid lake located ENE of Von Seebach crater.
Information Contacts: Observatorio Vulcanológico Sismológica de Costa Rica-Universidad Nacional (OVSICORI-UNA), Apartado 86-3000, Heredia, Costa Rica (URL: http://www.ovsicori.una.ac.cr/); NASA Global Sulfur Dioxide Monitoring Page, Atmospheric Chemistry and Dynamics Laboratory, NASA Goddard Space Flight Center (NASA/GSFC), 8800 Greenbelt Road, Goddard MD 20771, USA (URL: https://so2.gsfc.nasa.gov/).
Bezymianny (Russia) — November 2023 Cite this Report
Bezymianny
Russia
55.972°N, 160.595°E; summit elev. 2882 m
All times are local (unless otherwise noted)
Explosion on 18 October 2023 sends ash plume 8 km high; lava flows and incandescent avalanches
Bezymianny, located on Russia’s Kamchatka Peninsula, has had eruptions since 1955 characterized by dome growth, explosions, pyroclastic flows, ash plumes, and ashfall. Activity during November 2022-April 2023 included gas-and-steam emissions, lava dome collapses generating avalanches, and persistent thermal activity. Similar eruptive activity continued from May through October 2023, described here based on information from weekly and daily reports of the Kamchatka Volcano Eruptions Response Team (KVERT), notices from Tokyo VAAC (Volcanic Ash Advisory Center), and from satellite data.
Overall activity decreased after the strong period of activity in late March through April 2023, which included ash explosions during 29 March and 7-8 April 2023 that sent plumes as high as 10-12 km altitude, along with dome growth and lava flows (BGVN 48:05). This reduced activity can be seen in the MIROVA thermal detection system graph (figure 56), which was consistent with data from the MODVOLC thermal detection system and with Sentinel-2 satellite images that showed persistent hotspots in the summit crater when conditions allowed observations. A renewed period of strong activity began in mid-October 2023.
Activity increased significantly on 17 October 2023 when large collapses began during 0700-0830 on the E flanks of the lava dome and continued to after 0930 the next day (figure 57). Ash plumes rose to an altitude of 4.5-5 km, extending 220 km NNE by 18 October. A large explosion at 1630 on 18 October produced an ash plume that rose to an altitude of 11 km (8 km above the summit) and drifted NNE and then NW, extending 900 km NW within two days at an altitude of 8 km. Minor ashfall was noted in Kozyrevsk (45 km WNW). At 0820 on 20 October an ash plume was identified in satellite images drifting 100 km ENE at altitudes of 4-4.5 km.
Lava flows and hot avalanches from the dome down the SE flank continued over the next few days, including 23 October when clear conditions allowed good observations (figures 58 and 59). A large thermal anomaly was observed over the volcano through 24 October, and in the summit crater on 30 October (figure 60). Strong fumarolic activity continued, with numerous avalanches and occasional incandescence. By the last week of October, volcanic activity had decreased to a level consistent with that earlier in the reporting period.
Aviation warnings were frequently updated during 17-20 October. KVERT issued a Volcano Observatory Notice for Aviation (VONA) on 17 October at 1419 and 1727 (0219 and 0527 UTC) raising the Aviation Color Code (ACC) from Yellow to Orange (second highest level). The next day, KVERT issued a VONA at 1705 (0505 UTC) raising the ACC to Red (highest level) but lowered it back to Orange at 2117 (0917 UTC). After another decrease to Yellow and back to Orange, the ACC was reduced to Yellow on 20 October at 1204 (0004 UTC). In addition, the Tokyo VAAC issued a series of Volcanic Ash Advisories beginning on 16 October and continuing through 30 October.
Geologic Background. The modern Bezymianny, much smaller than its massive neighbors Kamen and Kliuchevskoi on the Kamchatka Peninsula, was formed about 4,700 years ago over a late-Pleistocene lava-dome complex and an edifice built about 11,000-7,000 years ago. Three periods of intensified activity have occurred during the past 3,000 years. The latest period, which was preceded by a 1,000-year quiescence, began with the dramatic 1955-56 eruption. This eruption, similar to that of St. Helens in 1980, produced a large open crater that was formed by collapse of the summit and an associated lateral blast. Subsequent episodic but ongoing lava-dome growth, accompanied by intermittent explosive activity and pyroclastic flows, has largely filled the 1956 crater.
Information Contacts: Kamchatka Volcanic Eruptions Response Team (KVERT), Far Eastern Branch, Russian Academy of Sciences, 9 Piip Blvd., Petropavlovsk-Kamchatsky, 683006, Russia (URL: http://www.kscnet.ru/ivs/kvert/); Kamchatka Volcanological Station, Kamchatka Branch of Geophysical Survey, (KB GS RAS), Klyuchi, Kamchatka Krai, Russia (URL: http://volkstat.ru/); Tokyo Volcanic Ash Advisory Center (VAAC), 1-3-4 Otemachi, Chiyoda-ku, Tokyo 100-8122, Japan (URL: http://ds.data.jma.go.jp/svd/vaac/data/); Hawai'i Institute of Geophysics and Planetology (HIGP) - MODVOLC Thermal Alerts System, School of Ocean and Earth Science and Technology (SOEST), Univ. of Hawai'i, 2525 Correa Road, Honolulu, HI 96822, USA (URL: http://modis.higp.hawaii.edu/); MIROVA (Middle InfraRed Observation of Volcanic Activity), a collaborative project between the Universities of Turin and Florence (Italy) supported by the Centre for Volcanic Risk of the Italian Civil Protection Department (URL: http://www.mirovaweb.it/); Copernicus Browser, Copernicus Data Space Ecosystem, European Space Agency (URL: https://dataspace.copernicus.eu/browser/).chr
Kilauea (United States) — January 2023 Cite this Report
Kilauea
United States
19.421°N, 155.287°W; summit elev. 1222 m
All times are local (unless otherwise noted)
Low-level lava effusions in the lava lake at Halema’uma’u during July-December 2022
Kīlauea is the southeastern-most volcano in Hawaii and overlaps the E flank of the Mauna Loa volcano. Its East Rift Zone (ERZ) has been intermittently active for at least 2,000 years. An extended eruption period began in January 1983 and was characterized by open lava lakes and lava flows from the summit caldera and the East Rift Zone. During May 2018 magma migrated into the Lower East Rift Zone (LERZ) and opened 24 fissures along a 6-km-long NE-trending fracture zone that produced lava flows traveling in multiple directions. As lava emerged from the fissures, the lava lake at Halema'uma'u drained and explosions sent ash plumes to several kilometers altitude (BGVN 43:10).
The current eruption period started during September 2021 and has recently been characterized by lava effusions, spatter, and sulfur dioxide emissions in the active Halema’uma’u lava lake (BGVN 47:08). Lava effusions, some spatter, and sulfur dioxide emissions have continued during this reporting period of July through December 2022 using daily reports, volcanic activity notices, and abundant photo, map, and video data from the US Geological Survey's (USGS) Hawaiian Volcano Observatory (HVO).
Summary of activity during July-December 2022. Low-level effusions have continued at the western vent of the Halema’uma’u crater during July through early December 2022. Occasional weak ooze-outs (also called lava break outs) would occur along the margins of the crater floor. The overall level of the active lava lake throughout the reporting period gradually increased due to infilling, however it stagnated in mid-September (table 13). During September through November, activity began to decline, though lava effusions persisted at the western vent. By 9 December, the active part of the lava lake had completely crusted over, and incandescence was no longer visible.
Table 13. Summary of measurements taken during overflights at Kīlauea that show a gradual increase in the active lava lake level and the volume of lava effused since 29 September 2021. Lower activity was reported during September-October. Data collected during July-December 2022. Courtesy of HVO.
| Date: |
Level of the active lava lake (m): |
Cumulative volume of lava effused (million cubic meters): |
| 7 Jul 2022 |
130 |
95 |
| 19 Jul 2022 |
133 |
98 |
| 4 Aug 2022 |
136 |
102 |
| 16 Aug 2022 |
137 |
104 |
| 12 Sep 2022 |
143 |
111 |
| 5 Oct 2022 |
143 |
111 |
| 28 Oct 2022 |
143 |
111 |
Activity during July 2022. Lava effusions were reported from the western vent in the Halema’uma’u crater, along with occasional weak ooze-outs along the margins of the crater floor. The height of the lava lake was variable due to deflation-inflation tilt events; for example, the lake level dropped approximately 3-4 m during a summit deflation-inflation event reported on 1 July. Webcam images taken during the night of 6-12 July showed intermittent low-level spattering at the western vent that rose less than 10 m above the vent (figure 519). Measurements made during an overflight on 7 July indicated that the crater floor was infilled about 130 m and that 95 million cubic meters of lava had been effused since 29 September 2021. A single, relatively small lava ooze-out was active to the S of the lava lake. Around midnight on 8 July there were two brief periods of lava overflow onto the lake margins. On 9 July lava ooze-outs were reported near the SE and NE edges of the crater floor and during 10-11 July they occurred near the E, NE, and NW edges. On 16 July crater incandescence was reported, though the ooze-outs and spattering were not visible. On 18 July overnight webcam images showed incandescence in the western vent complex and two ooze-outs were reported around 0000 and 0200 on 19 July. By 0900 there were active ooze-outs along the SW edge of the crater floor. Measurements made from an overflight on 19 July indicated that the crater floor was infilled about 133 m and 98 million cubic meters of lava had erupted since 29 September 2021 (figure 520). On 20 July around 1600 active ooze-outs were visible along the N edge of the crater, which continued through the next day. Extensive ooze-outs occurred along the W margin during 24 July until 1900; on 26 July minor ooze-outs were noted along the N margin. Minor spattering was visible on 29 July along the E margin of the lake. The sulfur dioxide emission rates ranged 650-2,800 tons per day (t/d), the higher of which was measured on 8 July (figure 519).
Activity during August 2022. The eruption continued in the Halema’uma’u crater at the western vent. According to HVO the lava in the active lake remained at the level of the bounding levees. Occasional minor ooze-outs were observed along the margins of the crater floor. Strong nighttime crater incandescence was visible after midnight on 6 August over the western vent cone. During 6-7 August scattered small lava lobes were active along the crater floor and incandescence persisted above the western vent through 9 August. During 7-9 August HVO reported a single lava effusion source was active along the NW margin of the crater floor. Measurements from an overflight on 4 August indicated that the crater floor was infilled about 136 m total and that 102 million cubic meters of lava had been erupted since the start of the eruption. Lava breakouts were reported along the N, NE, E, S, and W margins of the crater during 10-16 August. Another overflight survey conducted on 16 August indicated that the crater floor infilled about 137 m and 104 million cubic meters of lava had been erupted since September 2021. Measured sulfur dioxide emissions rates ranged 1,150-2,450 t/d, the higher of which occurred on 8 August.
Activity during September 2022. During September, lava effusion continued from the western vent into the active lava lake and onto the crater floor. Intermittent minor ooze-outs were reported through the month. A small ooze-out was visible on the W crater floor margin at 0220 on 2 September, which showed decreasing surface activity throughout the day, but remained active through 3 September. On 3 September around 1900 a lava outbreak occurred along the NW margin of the crater floor but had stopped by the evening of 4 September. Field crews monitoring the summit lava lake on 9 September observed spattering on the NE margin of the lake that rose no higher than 10 m, before falling back onto the lava lake crust (figure 521). Overflight measurements on 12 September indicated that the crater floor was infilled a total of 143 m and 111 million cubic meters of lava had been erupted since September 2021. Extensive breakouts in the W and N part of the crater floor were reported at 1600 on 20 September and continued into 26 September. The active part of the lava lake dropped by 10 m while other parts of the crater floor dropped by several meters. Summit tiltmeters recorded a summit seismic swarm of more than 80 earthquakes during 1500-1800 on 21 September, which occurred about 1.5 km below Halema’uma’u; a majority of these were less than Mw 2. By 22 September the active part of the lava lake was infilled about 2 m. On 23 September the western vent areas exhibited several small spatter cones with incandescent openings, along with weak, sporadic spattering (figure 522). The sulfur dioxide emission rate ranged from 930 t/d to 2,000 t/d, the higher of which was measured on 6 September.
Activity during October 2022. Activity during October declined slightly compared to previous months, though lava effusions persisted from the western vent into the active lava lake and onto the crater floor during October (figure 523). Slight variations in the lava lake were noted throughout the month. HVO reported that around 0600 on 3 October the level of the lava lake has lowered slightly. Overflight measurements taken on 5 October indicated that the crater floor was infilled a total of about 143 m and that 111 million cubic meters of lava had been effused since September 2021. During 6-7 October the lake gradually rose 0.5 m. Sulfur dioxide measurements made on 22 October had an emission rate of 700 t/d. Another overflight taken on 28 October showed that there was little to no change in the elevation of the crater floor: the crater floor was infilled a total of 143 m and 111 million cubic meters of lava had erupted since the start of the eruption.
Activity during November 2022. Activity remained low during November, though HVO reported that lava from the western vent continued to effuse into the active lava lake and onto the crater floor throughout the month. The rate of sulfur dioxide emissions during November ranged from 300-600 t/d, the higher amount of which occurred on 9 November.
Activity during December 2022. Similar low activity was reported during December, with lava effusing from the western vent into the active lava lake and onto the crater floor. During 4-5 December the active part of the lava lake was slightly variable in elevation and fluctuated within 1 m. On 9 December HVO reported that lava was no longer erupting from the western vent in the Halema’uma’u crater and that sulfur dioxide emissions had returned to near pre-eruption background levels; during 10-11 December, the lava lake had completely crusted over, and no incandescence was visible (figure 524). Time lapse camera images covering the 4-10 December showed that the crater floor showed weak deflation and no inflation. Some passive events of crustal overturning were reported during 14-15 December, which brought fresh incandescent lava to the lake surface. The sulfur dioxide emission rate was approximately 200 t/d on 14 December. A smaller overturn event on 17 December and another that occurred around 0000 and into the morning of 20 December were also detected. A small seismic swarm was later detected on 30 December.
Geologic Background. Kilauea overlaps the E flank of the massive Mauna Loa shield volcano in the island of Hawaii. Eruptions are prominent in Polynesian legends; written documentation since 1820 records frequent summit and flank lava flow eruptions interspersed with periods of long-term lava lake activity at Halemaumau crater in the summit caldera until 1924. The 3 x 5 km caldera was formed in several stages about 1,500 years ago and during the 18th century; eruptions have also originated from the lengthy East and Southwest rift zones, which extend to the ocean in both directions. About 90% of the surface of the basaltic shield volcano is formed of lava flows less than about 1,100 years old; 70% of the surface is younger than 600 years. The long-term eruption from the East rift zone between 1983 and 2018 produced lava flows covering more than 100 km2, destroyed hundreds of houses, and added new coastline.
Information Contacts: Hawaiian Volcano Observatory (HVO), U.S. Geological Survey, PO Box 51, Hawai'i National Park, HI 96718, USA (URL: http://hvo.wr.usgs.gov/).
Nyamulagira (DR Congo) — November 2023 Cite this Report
Nyamulagira
DR Congo
1.408°S, 29.2°E; summit elev. 3058 m
All times are local (unless otherwise noted)
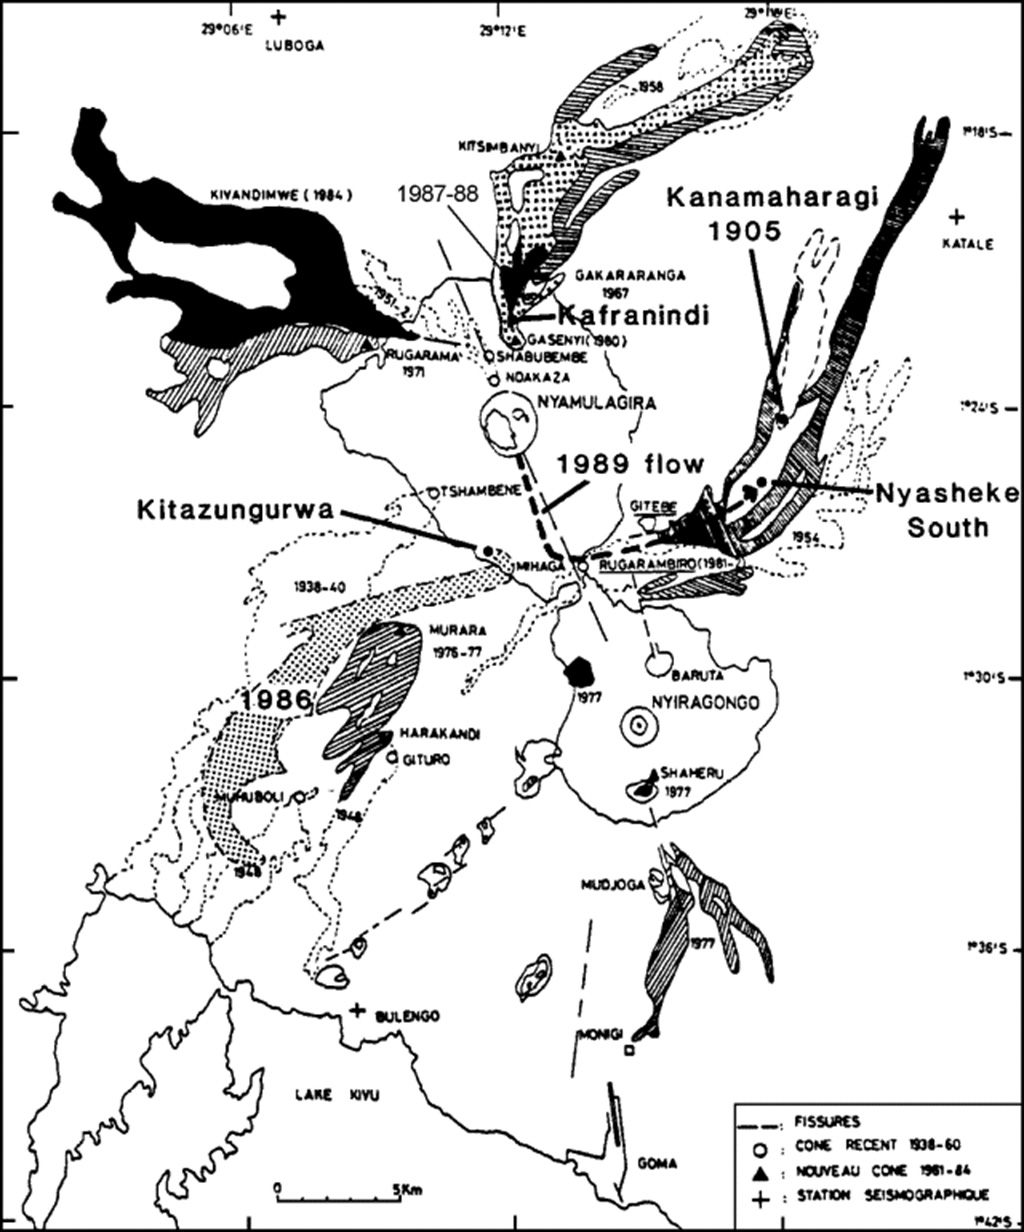
Lava flows and thermal activity during May-October 2023
Nyamulagira (also known as Nyamuragira) is a shield volcano in the Democratic Republic of Congo with the summit truncated by a small 2 x 2.3 km caldera with walls up to about 100 m high. Documented eruptions have occurred within the summit caldera, as well as from numerous flank fissures and cinder cones. The current eruption period began in April 2018 and has more recently been characterized by summit crater lava flows and thermal activity (BGVN 48:05). This report describes lava flows and variable thermal activity during May through October 2023, based on information from the Observatoire Volcanologique de Goma (OVG) and various satellite data.
Lava lake activity continued during May. The MIROVA (Middle InfraRed Observation of Volcanic Activity) system recorded moderate-to-strong thermal activity throughout the reporting period; activity was more intense during May and October and relatively weaker from June through September (figure 95). The MODVOLC thermal algorithm, detected a total of 209 thermal alerts. There were 143 hotspots detected during May, eight during June, nine during September, and 49 during October. This activity was also reflected in infrared satellite images, where a lava flow was visible in the NW part of the crater on 7 May and strong activity was seen in the center of the crater on 4 October (figure 96). Another infrared satellite image taken on 12 May showed still active lava flows along the NW margin of the crater. According to OVG lava effusions were active during 7-29 May and moved to the N and NW parts of the crater beginning on 9 May. Strong summit crater incandescence was visible from Goma (27 km S) during the nights of 17, 19, and 20 May (figure 97). On 17 May there was an increase in eruptive activity, which peaked at 0100 on 20 May. Notable sulfur dioxide plumes drifted NW and W during 19-20 May (figure 98). Drone footage acquired in partnership with the USGS (United States Geological Survey) on 20 May captured images of narrow lava flows that traveled about 100 m down the W flank (figure 99). Data from the Rumangabo seismic station indicated a decreasing trend in activity during 17-21 May. Although weather clouds prevented clear views of the summit, a strong thermal signature on the NW flank was visible in an infrared satellite image on 22 May, based on an infrared satellite image. On 28 May the lava flows on the upper W flank began to cool and solidify. By 29 May seismicity returned to levels similar to those recorded before the 17 May increase. Lava effusion continued but was confined to the summit crater; periodic crater incandescence was observed.
Low-level activity was noted during June through October. On 1 June OVG reported that seismicity remained at lower levels and that crater incandescence had been absent for three days, though infrared satellite imagery showed continued lava effusion in the summit crater. The lava flows on the flanks covered an estimated 0.6 km2. Satellite imagery continued to show thermal activity confined to the lava lake through October (figure 96), although no lava flows or significant sulfur dioxide emissions were reported.
Geologic Background. Africa's most active volcano, Nyamulagira (also known as Nyamuragira), is a massive high-potassium basaltic shield about 25 km N of Lake Kivu and 13 km NNW of the steep-sided Nyiragongo volcano. The summit is truncated by a small 2 x 2.3 km caldera that has walls up to about 100 m high. Documented eruptions have occurred within the summit caldera, as well as from the numerous flank fissures and cinder cones. A lava lake in the summit crater, active since at least 1921, drained in 1938, at the time of a major flank eruption. Recent lava flows extend down the flanks more than 30 km from the summit as far as Lake Kivu; extensive lava flows from this volcano have covered 1,500 km2 of the western branch of the East African Rift.
Information Contacts: Observatoire Volcanologique de Goma (OVG), Departement de Geophysique, Centre de Recherche en Sciences Naturelles, Lwiro, D.S. Bukavu, DR Congo; Hawai'i Institute of Geophysics and Planetology (HIGP) - MODVOLC Thermal Alerts System, School of Ocean and Earth Science and Technology (SOEST), Univ. of Hawai'i, 2525 Correa Road, Honolulu, HI 96822, USA (URL: http://modis.higp.hawaii.edu/); MIROVA (Middle InfraRed Observation of Volcanic Activity), a collaborative project between the Universities of Turin and Florence (Italy) supported by the Centre for Volcanic Risk of the Italian Civil Protection Department (URL: http://www.mirovaweb.it/); NASA Global Sulfur Dioxide Monitoring Page, Atmospheric Chemistry and Dynamics Laboratory, NASA Goddard Space Flight Center (NASA/GSFC), 8800 Greenbelt Road, Goddard, Maryland, USA (URL: https://so2.gsfc.nasa.gov/); Copernicus Browser, Copernicus Data Space Ecosystem, European Space Agency (URL: https://dataspace.copernicus.eu/browser/); Charles Balagizi, Goma Volcano Observatory, Departement de Geophysique, Centre de Recherche en Sciences Naturelles, Lwiro, D.S. Bukavu, DR Congo.
Bagana (Papua New Guinea) — October 2023 Cite this Report
Bagana
Papua New Guinea
6.137°S, 155.196°E; summit elev. 1855 m
All times are local (unless otherwise noted)
Explosions, ash plumes, ashfall, and lava flows during April-September 2023
The remote volcano of Bagana is located in central Bougainville Island, Papua New Guinea. Recorded eruptions date back to 1842 and activity has consisted of effusive activity that has built a small lava dome in the summit crater and occasional explosions that produced pyroclastic flows. The most recent eruption has been ongoing since February 2000 and has produced occasional explosions, ash plumes, and lava flows. More recently, activity has been characterized by ongoing effusive activity and ash emissions (BGVN 48:04). This report updates activity from April through September 2023 that has consisted of explosions, ash plumes, ashfall, and lava flows, using information from the Darwin Volcanic Ash Advisory Center (VAAC) and satellite data.
An explosive eruption was reported on 7 July that generated a large gas-and-ash plume to high altitudes and caused significant ashfall in local communities; the eruption plume had reached upper tropospheric (16-18 km altitude) altitudes by 2200, according to satellite images. Sulfur dioxide plumes were detected in satellite images on 8 July and indicated that the plume was likely a mixture of gas, ice, and ash. A report issued by the Autonomous Bougainville Government (ABG) (Torokina District, Education Section) on 10 July noted that significant ash began falling during 2000-2100 on 7 July and covered most areas in the Vuakovi, Gotana (9 km SW), Koromaketo, Laruma (25 km W) and Atsilima (27 km NW) villages. Pyroclastic flows also occurred, according to ground-based reports; small deposits confined to one drainage were inspected by RVO during an overflight on 17 July and were confirmed to be from the 7 July event. Ashfall continued until 10 July and covered vegetation, which destroyed bushes and gardens and contaminated rivers and streams.
RVO reported another eruption on 14 July. The Darwin VAAC stated that an explosive event started around 0830 on 15 July and produced an ash plume that rose to 16.5 km altitude by 1000 and drifted N, according to satellite images. The plume continued to drift N and remained visible through 1900, and by 2150 it had dissipated.
Ashfall likely from both the 7 and 15 July events impacted about 8,111 people in Torokina (20 km SW), including Tsito/Vuakovi, Gotana, Koromaketo, Kenaia, Longkogari, Kenbaki, Piva (13 km SW), and Atsinima, and in the Tsitovi district, according to ABG. Significant ashfall was also reported in Ruruvu (22 km N) in the Wakunai District of Central Bougainville, though the thickness of these deposits could not be confirmed. An evacuation was called for the villages in Wakunai, where heavy ashfall had contaminated water sources; the communities of Ruruvu, Togarau, Kakarapaia, Karauturi, Atao, and Kuritaturi were asked to evacuate to a disaster center at the Wakunai District Station, and communities in Torokina were asked to evacuate to the Piva District station. According to a news article, more than 7,000 people needed temporary accommodations, with about 1,000 people in evacuation shelters. Ashfall had deposited over a broad area, contaminating water supplies, affecting crops, and collapsing some roofs and houses in rural areas. Schools were temporarily shut down. Intermittent ash emissions continued through the end of July and drifted NNW, NW, and SW. Fine ashfall was reported on the coast of Torokina, and ash plumes also drifted toward Laruma and Atsilima.
A small explosive eruption occurred at 2130 on 28 July that ejected material from the crater vents, according to reports from Torokina, in addition to a lava flow that contained two lobes. A second explosion was detected at 2157. Incandescence from the lava flow was visible from Piva as it descended the W flank around 2000 on 29 July (figure 47). The Darwin VAAC reported that a strong thermal anomaly was visible in satellite images during 30-31 July and that ash emissions rose to 2.4 km altitude and drifted WSW on 30 July. A ground report from RVO described localized emissions at 0900 on 31 July.
The Darwin VAAC reported that ash plumes were identified in satellite imagery at 0800 and 1220 on 12 August and rose to 2.1 km and 3 km altitude and drifted NW and W, respectively. A news report stated that aid was sent to more than 6,300 people that were adversely affected by the eruption. Photos taken during 17-19 August showed ash emissions rising no higher than 1 km above the summit and drifting SE. A small explosion generated an ash plume during the morning of 19 August. Deposits from small pyroclastic flows were also captured in the photos. Satellite images captured lava flows and pyroclastic flow deposits. Two temporary seismic stations were installed near Bagana on 17 August at distances of 7 km WSW (Vakovi station) and 11 km SW (Kepox station). The Kepox station immediately started to record continuous, low-frequency background seismicity.
Satellite data. Little to no thermal activity was detected during April through mid-July 2023; only one anomaly was recorded during early April and one during early June, according to MIROVA (Middle InfraRed Observation of Volcanic Activity) data (figure 48). Thermal activity increased in both power and frequency during mid-July through September, although there were still some short gaps in detected activity. MODVOLC also detected increased thermal activity during August; thermal hotspots were detected a total of five times on 19, 20, and 27 August. Weak thermal anomalies were also captured in infrared satellite images on clear weather days throughout the reporting period on 7, 12, and 17 April, 27 May, 1, 6, 16, and 31 July, and 19 September (figure 48); a strong thermal anomaly was visible on 31 July. Distinct sulfur dioxide plumes that drifted generally NW were intermittently captured by the TROPOMI instrument on the Sentinel-5P satellite and sometimes exceeded two Dobson Units (DUs) (figure 49).
Geologic Background. Bagana volcano, in a remote portion of central Bougainville Island, is frequently active. This massive symmetrical cone was largely constructed by an accumulation of viscous andesitic lava flows. The entire edifice could have been constructed in about 300 years at its present rate of lava production. Eruptive activity is characterized by non-explosive effusion of viscous lava that maintains a small lava dome in the summit crater, although occasional explosive activity produces pyroclastic flows. Lava flows with tongue-shaped lobes up to 50 m thick and prominent levees descend the flanks on all sides.
Information Contacts: Rabaul Volcano Observatory (RVO), Geohazards Management Division, Department of Mineral Policy and Geohazards Management (DMPGM), PO Box 3386, Kokopo, East New Britain Province, Papua New Guinea; Darwin Volcanic Ash Advisory Centre (VAAC), Bureau of Meteorology, Northern Territory Regional Office, PO Box 40050, Casuarina, NT 0811, Australia (URL: http://www.bom.gov.au/info/vaac/); MIROVA (Middle InfraRed Observation of Volcanic Activity), a collaborative project between the Universities of Turin and Florence (Italy) supported by the Centre for Volcanic Risk of the Italian Civil Protection Department (URL: http://www.mirovaweb.it/); Hawai'i Institute of Geophysics and Planetology (HIGP) - MODVOLC Thermal Alerts System, School of Ocean and Earth Science and Technology (SOEST), Univ. of Hawai'i, 2525 Correa Road, Honolulu, HI 96822, USA (URL: http://modis.higp.hawaii.edu/); NASA Global Sulfur Dioxide Monitoring Page, Atmospheric Chemistry and Dynamics Laboratory, NASA Goddard Space Flight Center (NASA/GSFC), 8800 Greenbelt Road, Goddard, Maryland, USA (URL: https://so2.gsfc.nasa.gov/); Copernicus Browser, Copernicus Data Space Ecosystem, European Space Agency (URL: https://dataspace.copernicus.eu/browser/); Autonomous Bougainville Government, P.O Box 322, Buka, AROB, PNG (URL: https://abg.gov.pg/); Andrew Tupper (Twitter: @andrewcraigtupp); Simon Carn, Geological and Mining Engineering and Sciences, Michigan Technological University, 1400 Townsend Drive, Houghton, MI 49931, USA (URL: http://www.volcarno.com/, Twitter: @simoncarn); Radio NZ (URL: https://www.rnz.co.nz/news/pacific/494464/more-than-7-000-people-in-bougainville-need-temporary-accommodation-after-eruption); USAID, 1300 Pennsylvania Ave, NW, Washington DC 20004, USA (URL: https://www.usaid.gov/pacific-islands/press-releases/aug-08-2023-united-states-provides-immediate-emergency-assistance-support-communities-affected-mount-bagana-volcanic-eruptions).
Mayon (Philippines) — October 2023 Cite this Report
Mayon
Philippines
13.257°N, 123.685°E; summit elev. 2462 m
All times are local (unless otherwise noted)
Lava flows, pyroclastic flows, ash emissions, and seismicity during April-September 2023
Mayon is located in the Philippines and has steep upper slopes capped by a small summit crater. Historical eruptions date back to 1616 CE that have been characterized by Strombolian eruptions, lava flows, pyroclastic flows, and mudflows. Eruptions mostly originated from a central conduit. Pyroclastic flows and mudflows have commonly descended many of the approximately 40 drainages that surround the volcano. The most recent eruption occurred during June through October 2022 and consisted of lava dome growth and gas-and-steam emissions (BGVN 47:12). A new eruption was reported during late April 2023 and has included lava flows, pyroclastic density currents, ash emissions, and seismicity. This report covers activity during April through September 2023 based on daily bulletins from the Philippine Institute of Volcanology and Seismology (PHIVOLCS).
During April through September 2023, PHIVOLCS reported near-daily rockfall events, frequent volcanic earthquakes, and sulfur dioxide measurements. Gas-and-steam emissions rose 100-900 m above the crater and drifted in different directions. Nighttime crater incandescence was often visible during clear weather and was accompanied by incandescent avalanches of material. Activity notably increased during June when lava flows were reported on the S, SE, and E flanks (figure 52). The MIROVA graph (Middle InfraRed Observation of Volcanic Activity) showed strong thermal activity coincident with these lava flows, which remained active through September (figure 53). According to the MODVOLC thermal algorithm, a total of 110 thermal alerts were detected during the reporting period: 17 during June, 40 during July, 27 during August, and 26 during September. During early June, pyroclastic density currents (PDCs) started to occur more frequently.
Low activity was reported during much of April and May; gas-and-steam emissions rose 100-900 m above the crater and generally drifted in different directions. A total of 52 rockfall events and 18 volcanic earthquakes were detected during April and 147 rockfall events and 13 volcanic events during May. Sulfur dioxide flux measurements ranged between 400-576 tons per day (t/d) during April, the latter of which was measured on 29 April and between 162-343 t/d during May, the latter of which was measured on 13 May.
Activity during June increased, characterized by lava flows, pyroclastic density currents (PDCs), crater incandescence and incandescent rockfall events, gas-and-steam emissions, and continued seismicity. Weather clouds often prevented clear views of the summit, but during clear days, moderate gas-and-steam emissions rose 100-2,500 m above the crater and drifted in multiple directions. A total of 6,237 rockfall events and 288 volcanic earthquakes were detected. The rockfall events often deposited material on the S and SE flanks within 700-1,500 m of the summit crater and ash from the events drifted SW, S, SE, NE, and E. Sulfur dioxide emissions ranged between 149-1,205 t/d, the latter of which was measured on 10 June. Short-term observations from EDM and electronic tiltmeter monitoring indicated that the upper slopes were inflating since February 2023. Longer-term ground deformation parameters based on EDM, precise leveling, continuous GPS, and electronic tilt monitoring indicated that the volcano remained inflated, especially on the NW and SE flanks. At 1000 on 5 June the Volcano Alert Level (VAL) was raised to 2 (on a 0-5 scale). PHIVOLCS noted that although low-level volcanic earthquakes, ground deformation, and volcanic gas emissions indicated unrest, the steep increase in rockfall frequency may indicate increased dome activity.
A total of 151 dome-collapse PDCs occurred during 8-9 and 11-30 June, traveled 500-2,000 m, and deposited material on the S flank within 2 km of the summit crater. During 8-9 June the VAL was raised to 3. At approximately 1947 on 11 June lava flow activity was reported; two lobes traveled within 500 m from the crater and deposited material on the S (Mi-isi), SE (Bonga), and E (Basud) flanks. Weak seismicity accompanied the lava flow and slight inflation on the upper flanks. This lava flow remained active through 30 June, moving down the S and SE flank as far as 2.5 km and 1.8 km, respectively and depositing material up to 3.3 km from the crater. During 15-16 June traces of ashfall from the PDCs were reported in Sitio Buga, Nabonton, City of Ligao and Purok, and San Francisco, Municipality of Guinobatan. During 28-29 June there were two PDCs generated by the collapse of the lava flow front, which generated a light-brown ash plume 1 km high. Satellite monitors detected significant concentrations of sulfur dioxide beginning on 29 June. On 30 June PDCs primarily affected the Basud Gully on the E flank, the largest of which occurred at 1301 and lasted eight minutes, based on the seismic record. Four PDCs generated between 1800 and 2000 that lasted approximately four minutes each traveled 3-4 km on the E flank and generated an ash plume that rose 1 km above the crater and drifted N and NW. Ashfall was recorded in Tabaco City.
Similar strong activity continued during July; slow lava effusion remained active on the S and SE flanks and traveled as far as 2.8 km and 2.8 km, respectively and material was deposited as far as 4 km from the crater. There was a total of 6,983 rockfall events and 189 PDCs that affected the S, SE, and E flanks. The volcano network detected a total of 2,124 volcanic earthquakes. Continuous gas-and-steam emissions rose 200-2,000 m above the crater and drifted in multiple directions. Sulfur dioxide emissions averaged 792-4,113 t/d, the latter of which was measured on 28 July. During 2-4 July three PDCs were generated from the collapse of the lava flow and resulting light brown plumes rose 200-300 m above the crater. Continuous tremor pulses were reported beginning at 1547 on 3 July through 7 July at 1200, at 2300 on 8 July and going through 0300 on 10 July, and at 2300 on 16 July, as recorded by the seismic network. During 6-9 July there were 10 lava flow-collapse-related PDCs that generated light brown plumes 300-500 m above the crater. During 10-11 July light ashfall was reported in some areas of Mabinit, Legazpi City, Budiao and Salvacion, Daraga, and Camalig, Albay. By 18 July the lava flow advanced 600 m on the E flank as well.
During 1733 on 18 July and 0434 on 19 July PHIVOLCS reported 30 “ashing” events, which are degassing events accompanied by audible thunder-like sounds and entrained ash at the crater, which produced short, dark plumes that drifted SW. These events each lasted 20-40 seconds, and plume heights ranged from 150-300 m above the crater, as recorded by seismic, infrasound, visual, and thermal monitors. Three more ashing events occurred during 19-20 July. Short-term observations from electronic tilt and GPS monitoring indicate deflation on the E lower flanks in early July and inflation on the NW middle flanks during the third week of July. Longer-term ground deformation parameters from EDM, precise leveling, continuous GPS, and electronic tilt monitoring indicated that the volcano was still generally inflated relative to baseline levels. A short-lived lava pulse lasted 28 seconds at 1956 on 21 July, which was accompanied by seismic and infrasound signals. By 22 July, the only lava flow that remained active was on the SE flank, and continued to extend 3.4 km, while those on the S and E flanks weakened markedly. One ashing event was detected during 30-31 July, whereas there were 57 detected during 31 July-1 August; according to PHIVOLCS beginning at approximately 1800 on 31 July eruptive activity was dominated by phases of intermittent ashing, as well as increased in the apparent rates of lava effusion from the summit crater. The ashing phases consisted of discrete events recorded as low-frequency volcanic earthquakes (LFVQ) typically 30 seconds in duration, based on seismic and infrasound signals. Gray ash plume rose 100 m above the crater and generally drifted NE. Shortly after these ashing events began, new lava began to effuse rapidly from the crater, feeding the established flowed on the SE, E, and E flanks and generating frequent rockfall events.
Intensified unrest persisted during August. There was a total of 4,141 rockfall events, 2,881 volcanic earthquakes, which included volcanic tremor events, 32 ashing events, and 101 PDCs detected throughout the month. On clear weather days, gas-and-steam emissions rose 300-1,500 m above the crater and drifted in different directions (figure 54). Sulfur dioxide emissions averaged 735-4,756 t/d, the higher value of which was measured on 16 August. During 1-2 August the rate of lava effusion decreased, but continued to feed the flows on the SE, S, and E flanks, maintaining their advances to 3.4 km, 2.8 km, and 1.1 km from the crater, respectively (figure 55). Rockfall and PDCs generated by collapses at the lava flow margins and from the summit dome deposited material within 4 km of the crater. During 3-4 August there were 10 tremor events detected that lasted 1-4 minutes. Short-lived lava pulse lasted 35 seconds and was accompanied by seismic and infrasound signals at 0442 on 6 August. Seven collapses were recorded at the front of the lava flow during 12-14 August.
During September, similar activity of slow lava effusion, PDCs, gas-and-steam emissions, and seismicity continued. There was a total of 4,452 rockfall events, 329 volcanic earthquakes, which included volcanic tremor events, two ashing events, and 85 PDCs recorded throughout the month. On clear weather days, gas-and-steam emissions rose 100-1,500 m above the crater and drifted in multiple directions. Sulfur dioxide emissions averaged 609-2,252 t/d, the higher average of which was measured on 6 September. Slow lava effusion continued advancing on the SE, S, and E flanks, maintaining lengths of 3.4 km, 2.8 km, and 1.1 km, respectively. Rockfall and PDC events generated by collapses along the lava flow margins and at the summit dome deposited material within 4 km of the crater.
Geologic Background. Symmetrical Mayon, which rises above the Albay Gulf NW of Legazpi City, is the most active volcano of the Philippines. The steep upper slopes are capped by a small summit crater. Recorded eruptions since 1616 CE range from Strombolian to basaltic Plinian, with cyclical activity beginning with basaltic eruptions, followed by longer periods of andesitic lava flows. Eruptions occur predominately from the central conduit and have also produced lava flows that travel far down the flanks. Pyroclastic density currents and mudflows have commonly swept down many of the approximately 40 ravines that radiate from the summit and have often damaged populated lowland areas. A violent eruption in 1814 killed more than 1,200 people and devastated several towns.
Information Contacts: Philippine Institute of Volcanology and Seismology (PHIVOLCS), Department of Science and Technology, University of the Philippines Campus, Diliman, Quezon City, Philippines (URL: http://www.phivolcs.dost.gov.ph/); MIROVA (Middle InfraRed Observation of Volcanic Activity), a collaborative project between the Universities of Turin and Florence (Italy) supported by the Centre for Volcanic Risk of the Italian Civil Protection Department (URL: http://www.mirovaweb.it/); Hawai'i Institute of Geophysics and Planetology (HIGP) - MODVOLC Thermal Alerts System, School of Ocean and Earth Science and Technology (SOEST), Univ. of Hawai'i, 2525 Correa Road, Honolulu, HI 96822, USA (URL: http://modis.higp.hawaii.edu/); Copernicus Browser, Copernicus Data Space Ecosystem, European Space Agency (URL: https://dataspace.copernicus.eu/browser/); William Rogers, Legazpi City, Albay Province, Philippines.
Nishinoshima (Japan) — October 2023 Cite this Report
Nishinoshima
Japan
27.247°N, 140.874°E; summit elev. 100 m
All times are local (unless otherwise noted)
Eruption plumes and gas-and-steam plumes during May-August 2023
Nishinoshima, located about 1,000 km S of Tokyo, is a small island in the Ogasawara Arc in Japan. The island is the summit of a massive submarine volcano that has prominent submarine peaks to the S, W, and NE. Eruptions date back to 1973 and the current eruption period began in October 2022. Recent activity has consisted of small ash plumes and fumarolic activity (BGVN 48:07). This report covers activity during May through August 2023, using information from monthly reports of the Japan Meteorological Agency (JMA) monthly reports and satellite data.
Activity during May through June was relatively low. The Japan Coast Guard (JCG) did overflights on 14 and 22 June and reported white gas-and-steam emissions rising 600 m and 1,200 m from the central crater of the pyroclastic cone, respectively (figure 125). In addition, multiple white gas-and-steam emissions rose from the inner rim of the W side of the crater and from the SE flank of the pyroclastic cone. Discolored brown-to-green water was observed around almost the entire perimeter of the island; on 22 June light green discolored water was observed off the S coast of the island.
Observations from the Himawari meteorological satellite confirmed an eruption on 9 and 10 July. An eruption plume rose 1.6 km above the crater and drifted N around 1300 on 9 July. Satellite images acquired at 1420 and 2020 on 9 July and at 0220 on 10 July showed continuing emissions that rose 1.3-1.6 km above the crater and drifted NE and N. The Tokyo VAAC reported that an ash plume seen by a pilot and identified in a satellite image at 0630 on 21 July rose to 3 km altitude and drifted S.
Aerial observations conducted by JCG on 8 August showed a white-and-gray plume rising from the central crater of the pyroclastic cone, and multiple white gas-and-steam emissions were rising from the inner edge of the western crater and along the NW-SE flanks of the island (figure 126). Brown-to-green discolored water was also noted around the perimeter of the island.
Intermittent low-to-moderate power thermal anomalies were recorded in the MIROVA graph (Middle InfraRed Observation of Volcanic Activity), showing an increase in both frequency and power beginning in July (figure 127). This increase in activity coincides with eruptive activity on 9 and 10 July, characterized by eruption plumes. According to the MODVOLC thermal alert algorithm, one thermal hotspot was recorded on 20 July. Weak thermal anomalies were also detected in infrared satellite imagery, accompanied by strong gas-and-steam plumes (figure 128).
Geologic Background. The small island of Nishinoshima was enlarged when several new islands coalesced during an eruption in 1973-74. Multiple eruptions that began in 2013 completely covered the previous exposed surface and continued to enlarge the island. The island is the summit of a massive submarine volcano that has prominent peaks to the S, W, and NE. The summit of the southern cone rises to within 214 m of the ocean surface 9 km SSE.
Information Contacts: Japan Meteorological Agency (JMA), 1-3-4 Otemachi, Chiyoda-ku, Tokyo 100-8122, Japan (URL: http://www.jma.go.jp/jma/indexe.html); Tokyo Volcanic Ash Advisory Center (VAAC), 1-3-4 Otemachi, Chiyoda-ku, Tokyo 100-8122, Japan (URL: http://ds.data.jma.go.jp/svd/vaac/data/); MIROVA (Middle InfraRed Observation of Volcanic Activity), a collaborative project between the Universities of Turin and Florence (Italy) supported by the Centre for Volcanic Risk of the Italian Civil Protection Department (URL: http://www.mirovaweb.it/); Copernicus Browser, Copernicus Data Space Ecosystem, European Space Agency (URL: https://dataspace.copernicus.eu/browser/).
Krakatau (Indonesia) — October 2023 Cite this Report
Krakatau
Indonesia
6.1009°S, 105.4233°E; summit elev. 285 m
All times are local (unless otherwise noted)
White gas-and-steam plumes and occasional ash plumes during May-August 2023
Krakatau is located in the Sunda Strait between Java and Sumatra, Indonesia. Caldera collapse during the catastrophic 1883 eruption destroyed Danan and Perbuwatan cones and left only a remnant of Rakata. The post-collapse cone of Anak Krakatau (Child of Krakatau) was constructed within the 1883 caldera at a point between the former Danan and Perbuwatan cones; it has been the site of frequent eruptions since 1927. The current eruption period began in May 2021 and has recently consisted of Strombolian eruptions and ash plumes (BGVN 48:07). This report describes lower levels of activity consisting of ash and white gas-and-steam plumes during May through August 2023, based on information provided by the Indonesian Center for Volcanology and Geological Hazard Mitigation, referred to as Pusat Vulkanologi dan Mitigasi Bencana Geologi (PVMBG), MAGMA Indonesia, and satellite data.
Activity was relatively low during May and June. Daily white gas-and-steam emissions rose 25-200 m above the crater and drifted in different directions. Five ash plumes were detected at 0519 on 10 May, 1241 on 11 May, 0920 on 12 May, 2320 on 12 May, and at 0710 on 13 May, and rose 1-2.5 km above the crater and drifted SW. A webcam image taken on 12 May showed ejection of incandescent material above the vent. A total of nine ash plumes were detected during 6-11 June: at 1434 and 00220 on 6 and 7 June the ash plumes rose 500 m above the crater and drifted NW, at 1537 on 8 June the ash plume rose 1 km above the crater and drifted SW, at 0746 and at 0846 on 9 June the ash plumes rose 800 m and 3 km above the crater and drifted SW, respectively, at 0423, 1431, and 1750 on 10 June the ash plumes rose 2 km, 1.5 km, and 3.5 km above the crater and drifted NW, respectively, and at 0030 on 11 June an ash plume rose 2 km above the crater and drifted NW. Webcam images taken on 10 and 11 June at 0455 and 0102, respectively, showed incandescent material ejected above the vent. On 19 June an ash plume at 0822 rose 1.5 km above the crater and drifted SE.
Similar low activity of white gas-and-steam emissions and few ash plumes were reported during July and August. Daily white gas-and-steam emissions rose 25-300 m above the crater and drifted in multiple directions. Three ash plumes were reported at 0843, 0851, and 0852 on 20 July that rose 500-2,000 m above the crater and drifted NW.
The MIROVA (Middle InfraRed Observation of Volcanic Activity) graph of MODIS thermal anomaly data showed intermittent low-to-moderate power thermal anomalies during May through August 2023 (figure 140). Although activity was often obscured by weather clouds, a thermal anomaly was visible in an infrared satellite image of the crater on 12 May, accompanied by an eruption plume that drifted SW (figure 141).
Geologic Background. The renowned Krakatau (frequently mis-named as Krakatoa) volcano lies in the Sunda Strait between Java and Sumatra. Collapse of an older edifice, perhaps in 416 or 535 CE, formed a 7-km-wide caldera. Remnants of that volcano are preserved in Verlaten and Lang Islands; subsequently the Rakata, Danan, and Perbuwatan cones were formed, coalescing to create the pre-1883 Krakatau Island. Caldera collapse during the catastrophic 1883 eruption destroyed Danan and Perbuwatan, and left only a remnant of Rakata. This eruption caused more than 36,000 fatalities, most as a result of tsunamis that swept the adjacent coastlines of Sumatra and Java. Pyroclastic surges traveled 40 km across the Sunda Strait and reached the Sumatra coast. After a quiescence of less than a half century, the post-collapse cone of Anak Krakatau (Child of Krakatau) was constructed within the 1883 caldera at a point between the former Danan and Perbuwatan cones. Anak Krakatau has been the site of frequent eruptions since 1927.
Information Contacts: Pusat Vulkanologi dan Mitigasi Bencana Geologi (PVMBG, also known as Indonesian Center for Volcanology and Geological Hazard Mitigation, CVGHM), Jalan Diponegoro 57, Bandung 40122, Indonesia (URL: http://www.vsi.esdm.go.id/); MAGMA Indonesia, Kementerian Energi dan Sumber Daya Mineral (URL: https://magma.esdm.go.id/v1); MIROVA (Middle InfraRed Observation of Volcanic Activity), a collaborative project between the Universities of Turin and Florence (Italy) supported by the Centre for Volcanic Risk of the Italian Civil Protection Department (URL: http://www.mirovaweb.it/); Copernicus Browser, Copernicus Data Space Ecosystem, European Space Agency (URL: https://dataspace.copernicus.eu/browser/).
Villarrica (Chile) — October 2023 Cite this Report
Villarrica
Chile
39.42°S, 71.93°W; summit elev. 2847 m
All times are local (unless otherwise noted)
Strombolian activity, gas-and-ash emissions, and crater incandescence during April-September 2023
Villarrica, in central Chile, consists of a 2-km-wide caldera that formed about 3,500 years ago and is located at the base of the presently active cone at the NW margin of a 6-km-wide caldera. Historical eruptions eruptions date back to 1558 and have been characterized by mild-to-moderate explosive activity with occasional lava effusions. The current eruption period began in December 2014 and has recently consisted of nighttime crater incandescence, ash emissions, and seismicity (BGVN 48:04). This report covers activity during April through September 2023 and describes occasional Strombolian activity, gas-and-ash emissions, and nighttime crater incandescence. Information for this report primarily comes from the Southern Andes Volcano Observatory (Observatorio Volcanológico de Los Andes del Sur, OVDAS), part of Chile's National Service of Geology and Mining (Servicio Nacional de Geología y Minería, SERNAGEOMIN) and satellite data.
Seismicity during April consisted of long period (LP) events and tremor (TRE); a total of 9,413 LP-type events and 759 TR-type events were detected throughout the month. Nighttime crater incandescence persisted and was visible in the degassing column. Sulfur dioxide data was obtained using Differential Absorption Optical Spectroscopy Equipment (DOAS) that showed an average value of 1,450 ± 198 tons per day (t/d) during 1-15 April and 1,129 ± 201 t/d during 16-30 April, with a maximum daily value of 2,784 t/d on 9 April. Gas-and-steam emissions of variable intensities rose above the active crater as high as 1.3 km above the crater on 13 April. Strombolian explosions were not observed and there was a slight decrease in the lava lake level.
There were 14,123 LP-type events and 727 TR-type events detected during May. According to sulfur dioxide measurements taken with DOAS equipment, the active crater emitted an average value of 1,826 ± 482 t/d during 1-15 May and 912 ± 41 t/d during 16-30 May, with a daily maximum value of 5,155 t/d on 13 May. Surveillance cameras showed continuous white gas-and-steam emissions that rose as high as 430 m above the crater on 27 May. Nighttime incandescence illuminated the gas column less than 300 m above the crater rim was and no pyroclastic emissions were reported. A landslide was identified on 13 May on the E flank of the volcano 50 m from the crater rim and extending 300 m away; SERNAGEOMIN noted that this event may have occurred on 12 May. During the morning of 27 and 28 May minor Strombolian explosions characterized by incandescent ejecta were recorded at the crater rim; the last reported Strombolian explosions had occurred at the end of March.
Seismic activity during June consisted of five volcano-tectonic (VT)-type events, 21,606 LP-type events, and 2,085 TR-type events. The average value of sulfur dioxide flux obtained by DOAS equipment was 1,420 ± 217 t/d during 1-15 June and 2,562 ± 804 t/d, with a maximum daily value of 4,810 t/d on 17 June. White gas-and-steam emissions rose less than 480 m above the crater; frequent nighttime crater incandescence was reflected in the degassing plume. On 12 June an emission rose 100 m above the crater and drifted NNW. On 15 June one or several emissions resulted in ashfall to the NE as far as 5.5 km from the crater, based on a Skysat satellite image. Several Strombolian explosions occurred within the crater; activity on 15 June was higher energy and ejected blocks 200-300 m on the NE slope. Surveillance cameras showed white gas-and-steam emissions rising 480 m above the crater on 16 June. On 19 and 24 June low-intensity Strombolian activity was observed, ejecting material as far as 200 m from the center of the crater to the E.
During July, seismicity included 29,319 LP-type events, 3,736 TR-type events, and two VT-type events. DOAS equipment recorded two days of sulfur dioxide emissions of 4,220 t/d and 1,009 t/d on 1 and 13 July, respectively. Constant nighttime incandescence was also recorded and was particularly noticeable when accompanied by eruptive columns on 12 and 16 July. Minor explosive events were detected in the crater. According to Skysat satellite images taken on 12, 13, and 16 July, ashfall deposits were identified 155 m S of the crater. According to POVI, incandescence was visible from two vents on the crater floor around 0336 on 12 July. Gas-and-ash emissions rose as high as 1.2 km above the crater on 13 July and drifted E and NW. A series of gas-and-steam pulses containing some ash deposited material on the upper E flank around 1551 on 13 July. During 16-31 July, average sulfur dioxide emissions of 1,679 ± 406 t/d were recorded, with a maximum daily value of 2,343 t/d on 28 July. Fine ash emissions were also reported on 16, 17, and 23 July.
Seismicity persisted during August, characterized by 27,011 LP-type events, 3,323 TR-type events, and three VT-type events. The average value of sulfur dioxide measurements taken during 1-15 August was 1,642 ± 270 t/d and 2,207 ± 4,549 t/d during 16-31 August, with a maximum daily value of 3,294 t/d on 27 August. Nighttime crater incandescence remained visible in degassing columns. White gas-and-steam emissions rose 480 m above the crater on 6 August. According to a Skysat satellite image from 6 August, ash accumulation was observed proximal to the crater and was mainly distributed toward the E slope. White gas-and-steam emissions rose 320 m above the crater on 26 August. Nighttime incandescence and Strombolian activity that generated ash emissions were reported on 27 August.
Seismicity during September was characterized by five VT-type events, 12,057 LP-type events, and 2,058 TR-type events. Nighttime incandescence persisted. On 2 September an ash emission rose 180 m above the crater and drifted SE at 1643 (figure 125) and a white gas-and-steam plume rose 320 m above the crater. According to the Buenos Aires VAAC, periods of continuous gas-and-ash emissions were visible in webcam images from 1830 on 2 September to 0110 on 3 September. Strombolian activity was observed on 2 September and during the early morning of 3 September, the latter event of which generated an ash emission that rose 60 m above the crater and drifted 100 m from the center of the crater to the NE and SW. Ashfall was reported to the SE and S as far as 750 m from the crater. The lava lake was active during 3-4 September and lava fountaining was visible for the first time since 26 March 2023, according to POVI. Fountains captured in webcam images at 2133 on 3 September and at 0054 on 4 September rose as high as 60 m above the crater rim and ejected material onto the upper W flank. Sulfur dioxide flux of 1,730 t/d and 1,281 t/d was measured on 3 and 4 September, respectively, according to data obtained by DOAS equipment.
Strong Strombolian activity and larger gas-and-ash plumes were reported during 18-20 September. On 18 September activity was also associated with energetic LP-type events and notable sulfur dioxide fluxes (as high as 4,277 t/d). On 19 September Strombolian activity and incandescence were observed. On 20 September at 0914 ash emissions rose 50 m above the crater and drifted SSE, accompanied by Strombolian activity that ejected material less than 100 m SSE, causing fall deposits on that respective flank. SERNAGEOMIN reported that a Planet Scope satellite image taken on 20 September showed the lava lake in the crater, measuring 32 m x 35 m and an area of 0.001 km2. Several ash emissions were recorded at 0841, 0910, 1251, 1306, 1312, 1315, and 1324 on 23 September and rose less than 150 m above the crater. The sulfur dioxide flux value was 698 t/d on 23 September and 1,097 t/d on 24 September. On 24 September the Volcanic Alert Level (VAL) was raised to Orange (the third level on a four-color scale). SENAPRED maintained the Alert Level at Yellow (the middle level on a three-color scale) for the communities of Villarrica, Pucón (16 km N), Curarrehue, and Panguipulli.
During 24-25 September there was an increase in seismic energy (observed at TR-events) and acoustic signals, characterized by 1 VT-type event, 213 LP-type events, and 124 TR-type events. Mainly white gas-and-steam emissions, in addition to occasional fine ash emissions were recorded. During the early morning of 25 September Strombolian explosions were reported and ejected material 250 m in all directions, though dominantly toward the NW. On 25 September the average value of sulfur dioxide flux was 760 t/d. Seismicity during 25-30 September consisted of five VT-type events, 1,937 LP-type events, and 456 TR-type events.
During 25-29 September moderate Strombolian activity was observed and ejected material as far as the crater rim. In addition, ash pulses lasting roughly 50 minutes were observed around 0700 and dispersed ENE. During 26-27 September a TR episode lasted 6.5 hours and was accompanied by discrete acoustic signals. Satellite images from 26 September showed a spatter cone on the crater floor with one vent that measured 10 x 14 m and a smaller vent about 35 m NE of the cone. SERNAGEOMIN reported an abundant number of bomb-sized blocks up to 150 m from the crater, as well as impact marks on the snow, which indicated explosive activity. A low-altitude ash emission was observed drifting NW around 1140 on 28 September, based on webcam images. Between 0620 and 0850 on 29 September an ash emission rose 60 m above the crater and drifted NW. During an overflight taken around 1000 on 29 September scientists observed molten material in the vent, a large accumulation of pyroclasts inside the crater, and energetic degassing, some of which contained a small amount of ash. Block-sized pyroclasts were deposited on the internal walls and near the crater, and a distal ash deposit was also visible. The average sulfur dioxide flux measured on 28 September was 344 t/d. Satellite images taken on 29 September ashfall was deposited roughly 3 km WNW from the crater and nighttime crater incandescence remained visible. The average sulfur dioxide flux value from 29 September was 199 t/d. On 30 September at 0740 a pulsating ash emission rose 1.1 km above the crater and drifted NNW (figure 126). Deposits on the S flank extended as far as 4.5 km from the crater rim, based on satellite images from 30 September.
Infrared MODIS satellite data processed by MIROVA (Middle InfraRed Observation of Volcanic Activity) showed intermittent thermal activity during April through September, with slightly stronger activity detected during late September (figure 127). Small clusters of thermal activity were detected during mid-June, early July, early August, and late September. According to the MODVOLC thermal alert system, a total of four thermal hotspots were detected on 7 July and 3 and 23 September. This activity was also intermittently captured in infrared satellite imagery on clear weather days (figure 128).
Geologic Background. The glacier-covered Villarrica stratovolcano, in the northern Lakes District of central Chile, is ~15 km south of the city of Pucon. A 2-km-wide caldera that formed about 3,500 years ago is located at the base of the presently active, dominantly basaltic to basaltic andesite cone at the NW margin of a 6-km-wide Pleistocene caldera. More than 30 scoria cones and fissure vents are present on the flanks. Plinian eruptions and pyroclastic flows that have extended up to 20 km from the volcano were produced during the Holocene. Lava flows up to 18 km long have issued from summit and flank vents. Eruptions documented since 1558 CE have consisted largely of mild-to-moderate explosive activity with occasional lava effusion. Glaciers cover 40 km2 of the volcano, and lahars have damaged towns on its flanks.
Information Contacts: Servicio Nacional de Geología y Minería (SERNAGEOMIN), Observatorio Volcanológico de Los Andes del Sur (OVDAS), Avda Sta María No. 0104, Santiago, Chile (URL: http://www.sernageomin.cl/); Proyecto Observación Villarrica Internet (POVI) (URL: http://www.povi.cl/); Sistema y Servicio Nacional de Prevención y Repuesta Ante Desastres (SENAPRED), Av. Beauchef 1671, Santiago, Chile (URL: https://web.senapred.cl/); Buenos Aires Volcanic Ash Advisory Center (VAAC), Servicio Meteorológico Nacional-Fuerza Aérea Argentina, 25 de mayo 658, Buenos Aires, Argentina (URL: http://www.smn.gov.ar/vaac/buenosaires/inicio.php); MIROVA (Middle InfraRed Observation of Volcanic Activity), a collaborative project between the Universities of Turin and Florence (Italy) supported by the Centre for Volcanic Risk of the Italian Civil Protection Department (URL: http://www.mirovaweb.it/); Hawai'i Institute of Geophysics and Planetology (HIGP) - MODVOLC Thermal Alerts System, School of Ocean and Earth Science and Technology (SOEST), Univ. of Hawai'i, 2525 Correa Road, Honolulu, HI 96822, USA (URL: http://modis.higp.hawaii.edu/); Copernicus Browser, Copernicus Data Space Ecosystem, European Space Agency (URL: https://dataspace.copernicus.eu/browser/).
Merapi (Indonesia) — October 2023 Cite this Report
Merapi
Indonesia
7.54°S, 110.446°E; summit elev. 2910 m
All times are local (unless otherwise noted)
Frequent incandescent avalanches during April-September 2023
Merapi, located just north of the major city of Yogyakarta in central Java, Indonesia, has had activity within the last 20 years characterized by pyroclastic flows and lahars accompanying growth and collapse of the steep-sided active summit lava dome. The current eruption period began in late December 2020 and has more recently consisted of ash plumes, intermittent incandescent avalanches of material, and pyroclastic flows (BGVN 48:04). This report covers activity during April through September 2023, based on information from Balai Penyelidikan dan Pengembangan Teknologi Kebencanaan Geologi (BPPTKG), the Center for Research and Development of Geological Disaster Technology, a branch of PVMBG which specifically monitors Merapi. Additional information comes from the Pusat Vulkanologi dan Mitigasi Bencana Geologi (PVMBG, also known as Indonesian Center for Volcanology and Geological Hazard Mitigation, CVGHM), MAGMA Indonesia, the Darwin Volcanic Ash Advisory Centre (VAAC), and various satellite data.
Activity during April through September 2023 primarily consisted of incandescent avalanches of material that mainly affected the SW and W flanks and traveled as far as 2.3 km from the summit (table 25) and white gas-and-steam emissions that rose 10-1,000 m above the crater.
Table 25. Monthly summary of avalanches and avalanche distances recorded at Merapi during April through September 2023. The number of reported avalanches does not include instances where possible avalanches were heard but could not be visually confirmed as a result of inclement weather. Data courtesy of BPPTKG (April-September 2023 daily reports).
| Month |
Average number of avalanches per day |
Distance avalanches traveled (m) |
| Apr 2023 |
19 |
1,200-2,000 |
| May 2023 |
22 |
500-2,000 |
| Jun 2023 |
18 |
1,200-2,000 |
| Jul 2023 |
30 |
300-2,000 |
| Aug 2023 |
25 |
400-2,300 |
| Sep 2023 |
23 |
600-2,000 |
BPPTKG reported that during April and May white gas-and-steam emissions rose 10-750 m above the crater, incandescent avalanches descended 500-2,000 m on the SW and W flanks (figure 135). Cloudy weather often prevented clear views of the summit, and sometimes avalanches could not be confirmed. According to a webcam image, a pyroclastic flow was visible on 17 April at 0531. During the week of 28 April and 4 May a pyroclastic flow was reported on the SW flank, traveling up to 2.5 km. According to a drone overflight taken on 17 May the SW lava dome volume was an estimated 2,372,800 cubic meters and the dome in the main crater was an estimated 2,337,300 cubic meters.
During June and July similar activity persisted with white gas-and-steam emissions rising 10-350 m above the crater and frequent incandescent avalanches that traveled 300-2,000 m down the SW, W, and S flanks (figure 136). Based on an analysis of aerial photos taken on 24 June the volume of the SW lava dome was approximately 2.5 million cubic meters. A pyroclastic flow was observed on 5 July that traveled 2.7 km on the SW flank. According to the Darwin VAAC multiple minor ash plumes were identified in satellite images on 19 July that rose to 3.7 km altitude and drifted S and SW. During 22, 25, and 26 July a total of 17 avalanches descended as far as 1.8 km on the S flank.
Frequent white gas-and-steam emissions continued during August and September, rising 10-450 m above the crater. Incandescent avalanches mainly affected the SW and W flanks and traveled 400-2,300 m from the vent (figure 137). An aerial survey conducted on 10 August was analyzed and reported that estimates of the SW dome volume was 2,764,300 cubic meters and the dome in the main crater was 2,369,800 cubic meters.
Frequent and moderate-power thermal activity continued throughout the reporting period, according to a MIROVA (Middle InfraRed Observation of Volcanic Activity) analysis of MODIS satellite data (figure 138). There was an increase in the number of detected anomalies during mid-May. The MODVOLC thermal algorithm recorded a total of 47 thermal hotspots: six during April, nine during May, eight during June, 15 during July, four during August, and five during September. Some of this activity was captured in infrared satellite imagery on clear weather days, sometimes accompanied by incandescent material on the SW flank (figure 139).
Geologic Background. Merapi, one of Indonesia's most active volcanoes, lies in one of the world's most densely populated areas and dominates the landscape immediately north of the major city of Yogyakarta. It is the youngest and southernmost of a volcanic chain extending NNW to Ungaran volcano. Growth of Old Merapi during the Pleistocene ended with major edifice collapse perhaps about 2,000 years ago, leaving a large arcuate scarp cutting the eroded older Batulawang volcano. Subsequent growth of the steep-sided Young Merapi edifice, its upper part unvegetated due to frequent activity, began SW of the earlier collapse scarp. Pyroclastic flows and lahars accompanying growth and collapse of the steep-sided active summit lava dome have devastated cultivated lands on the western-to-southern flanks and caused many fatalities.
Information Contacts: Balai Penyelidikan dan Pengembangan Teknologi Kebencanaan Geologi (BPPTKG), Center for Research and Development of Geological Disaster Technology (URL: http://merapi.bgl.esdm.go.id/, Twitter: @BPPTKG); MAGMA Indonesia, Kementerian Energi dan Sumber Daya Mineral (URL: https://magma.esdm.go.id/v1); Pusat Vulkanologi dan Mitigasi Bencana Geologi (PVMBG, also known as Indonesian Center for Volcanology and Geological Hazard Mitigation, CVGHM), Jalan Diponegoro 57, Bandung 40122, Indonesia (URL: http://www.vsi.esdm.go.id/); Darwin Volcanic Ash Advisory Centre (VAAC), Bureau of Meteorology, Northern Territory Regional Office, PO Box 40050, Casuarina, NT 0811, Australia (URL: http://www.bom.gov.au/info/vaac/); MIROVA (Middle InfraRed Observation of Volcanic Activity), a collaborative project between the Universities of Turin and Florence (Italy) supported by the Centre for Volcanic Risk of the Italian Civil Protection Department (URL: http://www.mirovaweb.it/); Hawai'i Institute of Geophysics and Planetology (HIGP) - MODVOLC Thermal Alerts System, School of Ocean and Earth Science and Technology (SOEST), Univ. of Hawai'i, 2525 Correa Road, Honolulu, HI 96822, USA (URL: http://modis.higp.hawaii.edu/); Copernicus Browser, Copernicus Data Space Ecosystem, European Space Agency (URL: https://dataspace.copernicus.eu/browser/); Øystein Lund Andersen (URL: https://www.oysteinlundandersen.com/, https://twitter.com/oysteinvolcano).
Ebeko
Russia
50.686°N, 156.014°E; summit elev. 1103 m
All times are local (unless otherwise noted)
Moderate explosive activity with ash plumes continued during June-November 2023
Ebeko, located on the N end of Paramushir Island in Russia’s Kuril Islands just S of the Kamchatka Peninsula, consists of three summit craters along a SSW-NNE line at the northern end of a complex of five volcanic cones. Observed eruptions date back to the late 18th century and have been characterized as small-to-moderate explosions from the summit crater, accompanied by intense fumarolic activity. The current eruptive period began in June 2022, consisting of frequent explosions, ash plumes, and thermal activity (BGVN 47:10, 48:06). This report covers similar activity during June-November 2023, based on information from the Kamchatka Volcanic Eruptions Response Team (KVERT) and satellite data.
Moderate explosive activity continued during June-November 2023 (figures 50 and 51). According to visual data from Severo-Kurilsk, explosions sent ash 2-3.5 km above the summit (3-4.5 km altitude) during most days during June through mid-September. Activity after mid-September was slightly weaker, with ash usually reaching less than 2 km above the summit. According to KVERT the volcano in October and November was, with a few exceptions, either quiet or obscured by clouds that prevented satellite observations. KVERT issued Volcano Observatory Notices for Aviation (VONA) on 8 and 12 June, 13 and 22 July, 3 and 21 August, and 31 October warning of potential aviation hazards from ash plumes drifting 3-15 km from the volcano. Based on satellite data, KVERT reported a persistent thermal anomaly whenever weather clouds permitted viewing.
Geologic Background. The flat-topped summit of the central cone of Ebeko volcano, one of the most active in the Kuril Islands, occupies the northern end of Paramushir Island. Three summit craters located along a SSW-NNE line form Ebeko volcano proper, at the northern end of a complex of five volcanic cones. Blocky lava flows extend west from Ebeko and SE from the neighboring Nezametnyi cone. The eastern part of the southern crater contains strong solfataras and a large boiling spring. The central crater is filled by a lake about 20 m deep whose shores are lined with steaming solfataras; the northern crater lies across a narrow, low barrier from the central crater and contains a small, cold crescentic lake. Historical activity, recorded since the late-18th century, has been restricted to small-to-moderate explosive eruptions from the summit craters. Intense fumarolic activity occurs in the summit craters, on the outer flanks of the cone, and in lateral explosion craters.
Information Contacts: Kamchatka Volcanic Eruptions Response Team (KVERT), Far Eastern Branch, Russian Academy of Sciences, 9 Piip Blvd., Petropavlovsk-Kamchatsky, 683006, Russia (URL: http://www.kscnet.ru/ivs/kvert/).
Search Bulletin Archive by Publication Date
Select a month and year from the drop-downs and click "Show Issue" to have that issue displayed in this tab.
The default month and year is the latest issue available.
Scientific Event Alert Network Bulletin - Volume 12, Number 08 (August 1987)
Managing Editor: Lindsay McClelland
Aira (Japan)
Explosions continue
Amukta (United States)
Possible source of 10.6-km cloud
Arenal (Costa Rica)
Strombolian activity and lava flows; explosions decline
Atmospheric Effects (1980-1989) (Unknown)
Aerosols at 12 km mostly H2SO4 spheres; no new layers
Bagana (Papua New Guinea)
Ash plume; incandescent rockfalls
Banda Api (Indonesia)
Local seismicity but no change in volcanic activity
Cleveland (United States)
Possible source of 10.6-km cloud; lava flow
Colo (Indonesia)
Plume seen on satellite imagery
Deception Island (Antarctica)
Plume on satellite imagery; local seismicity
Esmeralda Bank (United States)
Bubbling and discolored water
Fournaise, Piton de la (France)
Lava flows from summit crater
Fuego (Guatemala)
Gas emission and microearthquakes
Fujisan (Japan)
Earthquake swarm below summit probably tectonic
Gareloi (United States)
Narrow steaming flow-like feature
Irazu (Costa Rica)
Flank fumarolic activity from two craters
Kilauea (United States)
Lava production continues; deep tremor
Lengai, Ol Doinyo (Tanzania)
Eruptive history January 1983-June 1987
Mahawu (Indonesia)
1977 lake data corrected
Manam (Papua New Guinea)
Maps of 30 June eruption products; low-level activity
Merapi (Indonesia)
Lava dome growth, but nuées ardentes de avalanche stop
Nyamulagira (DR Congo)
Correction to July 1986 eruption site
Pacaya (Guatemala)
Lava production resumes; Strombolian activity
Pagan (United States)
Small eruption cloud; 1981 scoria has flowed into village
Pavlof (United States)
Continued ash emission
Poas (Costa Rica)
Geyser-like eruptions; crater lake lowers; new fractures
Rabaul (Papua New Guinea)
Seismicity declines; deflation in caldera
Ruapehu (New Zealand)
Crater lake temperature increase; convecting lake water
Sangeang Api (Indonesia)
Small explosions continue
Santa Maria (Guatemala)
Lava flow from dome; many avalanches; explosions
Semeru (Indonesia)
Vulcanian activity continues; nuées ardentes de avalanche
Sheveluch (Russia)
Ash plumes and base surges from extrusive dome
Sorikmarapi (Indonesia)
Seismicity and fumarole temperatures increase
Tacana (Mexico-Guatemala)
Fewer microearthquakes
Turrialba (Costa Rica)
Fumarolic activity from two craters
Aira
Japan
31.5772°N, 130.6589°E; summit elev. 1117 m
All times are local (unless otherwise noted)
Explosions continue
Three explosions . . . were recorded in August, bringing the 1987 total of explosions to 25. The month's highest ash plume reached 1,700 m and accompanied quiet ash emission on 22 August. Ash accumulated 51 g/m2 during the month at [KLMO]. The eruptions did not cause any damage.
Geologic Background. The Aira caldera in the northern half of Kagoshima Bay contains the post-caldera Sakurajima volcano, one of Japan's most active. Eruption of the voluminous Ito pyroclastic flow accompanied formation of the 17 x 23 km caldera about 22,000 years ago. The smaller Wakamiko caldera was formed during the early Holocene in the NE corner of the caldera, along with several post-caldera cones. The construction of Sakurajima began about 13,000 years ago on the southern rim and built an island that was joined to the Osumi Peninsula during the major explosive and effusive eruption of 1914. Activity at the Kitadake summit cone ended about 4,850 years ago, after which eruptions took place at Minamidake. Frequent eruptions since the 8th century have deposited ash on the city of Kagoshima, located across Kagoshima Bay only 8 km from the summit. The largest recorded eruption took place during 1471-76.
Information Contacts: JMA.
Amukta (United States) — August 1987 Cite this Report
Amukta
United States
52.5°N, 171.252°W; summit elev. 1066 m
All times are local (unless otherwise noted)
Possible source of 10.6-km cloud
At about 1000 on 28 August pilots Charles Kozler, Wayne Russell, and George Wooliver (Reeve Aleutian Airways) reported an eruption plume reaching 10.5 km altitude in the vicinity of Amukta, drifting WNW. The FAA issued a NOTAM warning pilots to stay 25 miles [40 km] from Amukta Island. Heavy weather clouds covered Amukta Island so its activity could not be directly observed. Mt. Cleveland, 100 km ENE, was apparently active that same morning and winds were blowing in the direction of Amukta (see Mt. Cleveland 12:08). The origin of the large cloud remains both uncertain and controversial at the time of this report.
On 4 September Wooliver observed a small dark ash plume rising at least 300 m above the summit of Amukta then drifting as much as 1 km NW. Only the NW flank was visible because of cloud cover. His observations were made from 9,750 m altitude from nearly 120 km N. Wooliver has flown in the Aleutian Islands since the 1950's and is experienced at observing eruptions.
Amukta's last known eruptive activity was on 12 July 1984 (BVE, no. 24). Harold Wilson (Peninsula Airways) notes that normal activity . . . is continuous minor steam emission from several small vents just inside the summit crater rim.
Geologic Background. The symmetrical Amukta stratovolcano lies in the central Aleutians SW of Chagulak Island and is the westernmost of the Islands of the Four Mountains group. The stratovolcano was constructed at the northern side of an arcuate caldera-like feature that is open to the sea along the southern coast of the 8-km-wide Amukta Island. It overlies a broad shield volcano and is topped by a 400-m-wide crater, and a cinder cone is located near the NE coast. There have been several reported eruptions from both summit and flank vents.
Information Contacts: T. Miller, USGS Anchorage; J. Reeder, ADGGS.
Arenal (Costa Rica) — August 1987 Cite this Report
Arenal
Costa Rica
10.463°N, 84.703°W; summit elev. 1670 m
All times are local (unless otherwise noted)
Strombolian activity and lava flows; explosions decline
Strombolian activity persisted from Crater C with continuous emission of lava and gases, and sporadic ejection of pyroclastic material. The stronger June/July activity produced occasional nuées ardentes that extended ~500 m from the crater on ... 13 July at 1630 (burning 1/2 hectare of forest on the S flank) and 17 July at 1430. Ash emission also increased in June, with fine ash generally carried to ~4-5 km W and NW from the crater by the prevailing winds. Lava flows continued to descend the N and NE flanks. The incipient lava flow seen 23 May during a helicopter overflight continued to advance NW toward the Río Tabacón. At the end of July, its front was at ~1,000 m elevation, roughly 1 km from the summit.
Activity declined sharply in August. Only 21 explosion earthquakes were recorded compared to 248 in July, and tremor weakened considerably.
Geologic Background. Conical Volcán Arenal is the youngest stratovolcano in Costa Rica and one of its most active. The 1670-m-high andesitic volcano towers above the eastern shores of Lake Arenal, which has been enlarged by a hydroelectric project. Arenal lies along a volcanic chain that has migrated to the NW from the late-Pleistocene Los Perdidos lava domes through the Pleistocene-to-Holocene Chato volcano, which contains a 500-m-wide, lake-filled summit crater. The earliest known eruptions of Arenal took place about 7000 years ago, and it was active concurrently with Cerro Chato until the activity of Chato ended about 3500 years ago. Growth of Arenal has been characterized by periodic major explosive eruptions at several-hundred-year intervals and periods of lava effusion that armor the cone. An eruptive period that began with a major explosive eruption in 1968 ended in December 2010; continuous explosive activity accompanied by slow lava effusion and the occasional emission of pyroclastic flows characterized the eruption from vents at the summit and on the upper western flank.
Information Contacts: J. Barquero, OVSICORI; R. Barquero and Guillermo Alvarado, ICE; G. Soto and L. Morales, Univ de Costa Rica.
Atmospheric Effects (1980-1989) (Unknown) — August 1987 Cite this Report
Atmospheric Effects (1980-1989)
Unknown
Unknown, Unknown; summit elev. m
All times are local (unless otherwise noted)
Aerosols at 12 km mostly H2SO4 spheres; no new layers
The last two Bulletins reported lower stratospheric layers, perhaps from forest fires in China. Since June, however, no evidence of these layers has been detected by lidar at Hampton, VA or Mauna Loa, Hawaii (figure 46). August profiles at Hampton were smooth, without significant sublayering. Altitudes of peak backscattering at Mauna Loa dropped from 26-29 km in July to 22-25 km in August. There were no indications of recent aerosol injections.
Samples taken on 3 August near San Francisco (about 37.7°N, 122.5°W) by a NASA aircraft at about 12 km altitude did not show unusual concentrations of aerosols. Most particles were H2SO4 spheres, with a few chlorides and nitrates. The size distribution was generally unimodal, with a mean geometric radius of 0.06 µm, but there was a small bulge at about 0.3 µm radius.
Geologic Background. The enormous aerosol cloud from the March-April 1982 eruption of Mexico's El Chichón persisted for years in the stratosphere, and led to the Atmospheric Effects section becoming a regular feature of the Bulletin. Descriptions of the initial dispersal of major eruption clouds remain with the individual eruption reports, but observations of long-term stratospheric aerosol loading will be found here.
Information Contacts: Mary Osborn, NASA Langley Research Center, Hampton, VA 23665 USA; Thomas DeFoor, Mauna Loa Observatory, P. O. Box 275, Hilo, HI 23665 USA; Rudolf Pueschel, Mail Stop 245-5, NASA Ames Research Center, Moffett Field, California 94035 USA.
Bagana (Papua New Guinea) — August 1987 Cite this Report
Bagana
Papua New Guinea
6.137°S, 155.196°E; summit elev. 1855 m
All times are local (unless otherwise noted)
Ash plume; incandescent rockfalls
A moderately thick white to brown plume was continuously released from the summit crater. Plume emission intensified 14-15 August when incandescent rockfalls down the N and W flanks and strong night glow from the summit were reported. On 29 August the summit crater was reported to be completely filled with a smoking lava dome that continued to feed the long-active lava flow on the N flank. Seismicity remained at a low level throughout the month, with 10-20 rockfall events/day.
Geologic Background. Bagana volcano, in a remote portion of central Bougainville Island, is frequently active. This massive symmetrical cone was largely constructed by an accumulation of viscous andesitic lava flows. The entire edifice could have been constructed in about 300 years at its present rate of lava production. Eruptive activity is characterized by non-explosive effusion of viscous lava that maintains a small lava dome in the summit crater, although occasional explosive activity produces pyroclastic flows. Lava flows with tongue-shaped lobes up to 50 m thick and prominent levees descend the flanks on all sides.
Information Contacts: C. McKee, P. de Saint-Ours, and P. Lowenstein, RVO.
Banda Api (Indonesia) — August 1987 Cite this Report
Banda Api
Indonesia
4.523°S, 129.881°E; summit elev. 596 m
All times are local (unless otherwise noted)
Local seismicity but no change in volcanic activity
On 8 September, eight earthquakes were recorded at the Banda Api observatory post, the first seismic activity there since the 17 June regional earthquake. No change in the activity of the volcano was noted.
Geologic Background. The 3-km-wide island of Banda Api is the northern-most volcano in the Banda arc and has a long period of recorded observation because of its key location in the Portuguese and Dutch spice trade. The basaltic-to-rhyodacitic volcano is located in the SW corner of a mostly submerged 7 km caldera. At least two episodes of caldera formation are thought to have occurred, with the arcuate islands of Lonthor and Neira considered to be pre-caldera remnants. A conical peak rises to about 600 m at the center of the island. Eruptions have been recorded since 1586 CE, mostly consisting of Strombolian eruptions from the summit crater, but larger explosive eruptions have occurred and occasional lava flows have reached the coast.
Information Contacts: VSI.
Cleveland (United States) — August 1987 Cite this Report
Cleveland
United States
52.825°N, 169.944°W; summit elev. 1730 m
All times are local (unless otherwise noted)
Possible source of 10.6-km cloud; lava flow
During at least five overflights between 6 and 10 August, H. Wilson (Peninsula Airways) observed incandescent lava and summit glow, but did not recognize any lava fountains or moving flows. High-pressure steam emission was occurring and steam drifted as far as 3 km from the summit. At about 1500 on 26 August, pilot T. Madsen (Aleutian Air) observed a 600-m-high ash and steam plume. Two days later, on 28 August at about 0930, Scott Kerr and Pete Galaktionoff heard a distant rumbling sound lasting ~15 seconds while camping on Kagamil Island (25 km NE of Mt. Cleveland, 120 km NE of Amukta). Overcast skies prevented observations. At 0944 that day the National Warning Center of the North American Air Defense Command (NORAD) issued a warning of a large eruption of Mt. Cleveland, after detecting a hot spot that morning at 52.78°N, 169.93°W through remote sensing. Steve Shivers (USGS Anchorage) recognized a WNW-trending plume on a NOAA 10 satellite image returned at 1030. The ~15-km plume was elongated WNW from a point ~15 km W of Mt. Cleveland. From more than 100 km away at about 1100, pilot Charles Nickerson (Reeve Aleutian Airways) reported that the plume, which appeared to be drifting WNW, reached 9-10.6 km altitude with about a 25 km upper radius, but the plume was by then apparently detached from its origin and the volcano that fed it is not certain. He estimated that the plume was just ENE of Amukta and W of Cleveland. Mt. Cleveland's summit appeared to be emitting a 300 m-high steam plume. At about 1200, Larry Conner (MarkAir) also observed the eruption plume from a point ~30 km S of Amukta, which was completely covered by clouds and not emitting a plume. At about 1400, pilot William Redmond (Peninsula Airways) observed unusual, thin, brown-tinted, cirrus layers beginning 65 km WNW of Mt. Cleveland at 2,400 m altitude and higher. The wind was blowing from the E.
Geologic Background. The beautifully symmetrical Mount Cleveland stratovolcano is situated at the western end of the uninhabited Chuginadak Island. It lies SE across Carlisle Pass strait from Carlisle volcano and NE across Chuginadak Pass strait from Herbert volcano. Joined to the rest of Chuginadak Island by a low isthmus, Cleveland is the highest of the Islands of the Four Mountains group and is one of the most active of the Aleutian Islands. The native name, Chuginadak, refers to the Aleut goddess of fire, who was thought to reside on the volcano. Numerous large lava flows descend the steep-sided flanks. It is possible that some 18th-to-19th century eruptions attributed to Carlisle should be ascribed to Cleveland (Miller et al., 1998). In 1944 it produced the only known fatality from an Aleutian eruption. Recent eruptions have been characterized by short-lived explosive ash emissions, at times accompanied by lava fountaining and lava flows down the flanks.
Information Contacts: J. Reeder, ADGGS.
Colo
Indonesia
0.162°S, 121.601°E; summit elev. 404 m
All times are local (unless otherwise noted)
Plume seen on satellite imagery
Imagery from the NOAA 10 polar orbiting weather satellite showed a plume that extended S then W ~200 km from Una Una on 14 July at 0708. VSI could not confirm that an eruption had occurred.
Geologic Background. Colo volcano forms the isolated small island of Una Una in the middle of the Gulf of Tomini in northern Sulawesi. The broad, low volcano contains a 2-km-wide caldera with a small central cone. Three eruptions have been recorded since the late 1800's, but two of those caused widespread damage over the island. The last eruption, in 1983, produced pyroclastic flows that swept over most of the island shortly after all residents had been evacuated.
Information Contacts: W. Gould, NOAA/NESDIS; VSI.
Deception Island (Antarctica) — August 1987 Cite this Report
Deception Island
Antarctica
62.9567°S, 60.6367°W; summit elev. 602 m
All times are local (unless otherwise noted)
Plume on satellite imagery; local seismicity
Infrared imagery from the NOAA 10 polar orbiting weather satellite on 23 July at about 1300 GMT showed a plume that extended ~100 km SE from Deception Island. In early August, personnel on King George Island reported that seismic instruments at the Chinese "Great Wall" station, 110 km from Deception Island, had recently detected local seismicity, but gave no date or time. During an 11 August overflight, no volcanic activity was evident on Deception Island [see also 13:02].
Geologic Background. Ring-shaped Deception Island, at the SW end of the South Shetland Islands, NE of Graham Land Peninsula, was constructed along the axis of the Bransfield Rift spreading center. A narrow passageway named Neptunes Bellows provides an entrance to a natural harbor within the 8.5 x 10 km caldera that was utilized as an Antarctic whaling station. Numerous vents along ring fractures circling the low 14-km-wide island have been reported active for more than 200 years. Maars line the shores of 190-m-deep Port Foster caldera bay. Among the largest of these maars is 1-km-wide Whalers Bay, at the entrance to the harbor. Eruptions during the past 8,700 years have been dated from ash layers in lake sediments on the Antarctic Peninsula and neighboring islands.
Information Contacts: W. Gould, NOAA; G. Gutheridge, National Science Foundation.
Esmeralda Bank (United States) — August 1987 Cite this Report
Esmeralda Bank
United States
14.958°N, 145.249°E; summit elev. -74 m
All times are local (unless otherwise noted)
Bubbling and discolored water
On 26 May, the pilot of a charter aircraft observed a heavy "boil" on the ocean surface over Esmeralda, feeding an elongate zone of discolored water. The pilot reported that he had not seen activity at Esmeralda in many years. On 4 June, L.G. Eldredge and the same pilot flew over Esmeralda, but saw no water movement or discoloration.
Geologic Background. Esmeralda Bank is a massive submarine volcano with three cones oriented N-S over about 15 km. The high points on the crater rim of the large middle edifice, with a collapse scarp open to the W, are about 75 m below the ocean surface. Frequent sulfur-rich surface bubbling and water discoloration have been observed, which have variously been attributed to eruptive events or fumarolic activity.
Information Contacts: L. Eldredge, University of Guam.
Piton de la Fournaise (France) — August 1987 Cite this Report
Piton de la Fournaise
France
21.244°S, 55.708°E; summit elev. 2632 m
All times are local (unless otherwise noted)
Lava flows from summit crater
Seismicity beneath the summit continued after the 2 June intrusion. Minor inflation was recorded through 6 June. The volcano then remained stable until a new intrusion developed below the E summit zone at 0411 on 9 June. Seismicity ceased at 0500 but no eruption occurred. Hypocenters were concentrated along a N-S axis, 1-1.5 km under Dolomieu.
On 10 June, 50 µrads of inflation in the upper summit zone were recorded. At 1510 that day an eruption began in the S part of the crater along a 50-m N-S fissure. Lava broke out the next day in the E part of the crater (figure 18). About 106 m3 of aphyric basalt were extruded by 28 June. During this phase, two inflation pulses were recorded by the permanent tiltmeter network, on 18 and 22-26 June. After 28 June, moderate seismicity and slight deformation were recorded. Significant inflation was observed on 19 July from 0450 to 0630 during a new intrusion crisis, mainly in the NE part of Dolomieu. Seismicity shifted from N to S at about 0535. An eruption then occurred at two sites. The main eruption was 1 km S of the summit craters, close to Chateau-Fort (1948 eruption site), lasted ~32 hours, and produced slightly more than 106 m3 of aphyric basalt. Poor weather conditions prevented clear observation of the less-active site 1.5 km NNE of the summit. Deformation changes have not been significant since the eruptions, but weak summit-area seismicity began 15 August and was continuing in the first week of September.
Geologic Background. Piton de la Fournaise is a massive basaltic shield volcano on the French island of Réunion in the western Indian Ocean. Much of its more than 530,000-year history overlapped with eruptions of the deeply dissected Piton des Neiges shield volcano to the NW. Three scarps formed at about 250,000, 65,000, and less than 5,000 years ago by progressive eastward slumping, leaving caldera-sized embayments open to the E and SE. Numerous pyroclastic cones are present on the floor of the scarps and their outer flanks. Most recorded eruptions have originated from the summit and flanks of Dolomieu, a 400-m-high lava shield that has grown within the youngest scarp, which is about 9 km wide and about 13 km from the western wall to the ocean on the E side. More than 150 eruptions, most of which have produced fluid basaltic lava flows, have occurred since the 17th century. Only six eruptions, in 1708, 1774, 1776, 1800, 1977, and 1986, have originated from fissures outside the scarps.
Information Contacts: H. Delorme and B. Gillet, OVPDLF; P. Bachelery, Univ de la Réunion; J-L. Cheminee, A. Hirn, J. LePine, P. Blum, and J. Zlotnicki, IPGP.
Fuego
Guatemala
14.4748°N, 90.8806°W; summit elev. 3799 m
All times are local (unless otherwise noted)
Gas emission and microearthquakes
Gas emission from the crater and nearby microearthquakes continued through July. Seismic station FG3 registered 50 microearthquakes with S-P <= 2.0 seconds. The tiltmeter, at the same site, did not show abnormal variation. A small fumarole was also active about 100 m below the crater on the E flank.
Geologic Background. Volcán Fuego, one of Central America's most active volcanoes, is also one of three large stratovolcanoes overlooking Guatemala's former capital, Antigua. The scarp of an older edifice, Meseta, lies between Fuego and Acatenango to the north. Construction of Meseta dates back to about 230,000 years and continued until the late Pleistocene or early Holocene. Collapse of Meseta may have produced the massive Escuintla debris-avalanche deposit, which extends about 50 km onto the Pacific coastal plain. Growth of the modern Fuego volcano followed, continuing the southward migration of volcanism that began at the mostly andesitic Acatenango. Eruptions at Fuego have become more mafic with time, and most historical activity has produced basaltic rocks. Frequent vigorous eruptions have been recorded since the onset of the Spanish era in 1524, and have produced major ashfalls, along with occasional pyroclastic flows and lava flows.
Information Contacts: E. Sánchez, INSIVUMEH.
Fujisan
Japan
35.361°N, 138.728°E; summit elev. 3776 m
All times are local (unless otherwise noted)
Earthquake swarm below summit probably tectonic
About nine small earthquakes of M < 2 occurred beneath the summit 20 August-1 September. Four were felt at intensities of I-III (JMA scale) by personnel at the summit meteorological observatory, but were not felt at the weather station 19 km ESE of the summit. Seismographs confirmed that the earthquakes originated just underneath the summit. JMA installed a portable seismograph at the summit on 25 August. The strongest earthquake, on 20 August at 0556, had a magnitude of 1.8 (table 1). No signs of wall collapse or landslides were observed by a field survey group around the summit that day. Earthquakes on 20 and 24 August were recorded by the Univ of Tokyo's Earthquake Research Institute seismographs within 20 km of the summit.
Table 1. Earthquakes at Mt. Fuji, 20 August-1 September 1987.
| Date |
Time |
Magnitude |
Notes |
| 20 Aug 1987 |
0556 |
1.8 |
felt at summit |
| 23 Aug 1987 |
approx. 0100 |
not recorded |
felt at summit |
| 24 Aug 1987 |
0630 |
1.4 |
felt at summit |
| 27 Aug 1987 |
0624 |
less than 1 |
-- |
| 27 Aug 1987 |
0626 |
less than 1 |
felt at summit |
| 28 Aug 1987 |
1355 |
less than 1 |
-- |
| 29 Aug 1987 |
1951 |
less than 1 |
-- |
| 01 Sep 1987 |
2335 |
less than 1 |
-- |
Small earthquakes are not rare at Fuji, but because the earthquakes occurred in the summit region during the height of the climbing season, there was some concern among government officials. However, the relatively sharp P-wave arrivals suggest that the earthquakes were tectonic in origin.
Geologic Background. The conical form of Fujisan, Japan's highest and most noted volcano, belies its complex origin. The modern postglacial stratovolcano is constructed above a group of overlapping volcanoes, remnants of which form irregularities on Fuji's profile. Growth of the Younger Fuji volcano began with a period of voluminous lava flows from 11,000 to 8000 years before present (BP), accounting for four-fifths of the volume of the Younger Fuji volcano. Minor explosive eruptions dominated activity from 8000 to 4500 BP, with another period of major lava flows occurring from 4500 to 3000 BP. Subsequently, intermittent major explosive eruptions occurred, with subordinate lava flows and small pyroclastic flows. Summit eruptions dominated from 3000 to 2000 BP, after which flank vents were active. The extensive basaltic lava flows from the summit and some of the more than 100 flank cones and vents blocked drainages against the Tertiary Misaka Mountains on the north side of the volcano, forming the Fuji Five Lakes, popular resort destinations. The last confirmed eruption of this dominantly basaltic volcano in 1707 was Fuji's largest during historical time. It deposited ash on Edo (Tokyo) and formed a large new crater on the east flank.
Information Contacts: Yoshiaki Ida and Harry Glicken, Earthquake Research Institute, Univ of Tokyo; JMA.
Gareloi (United States) — August 1987 Cite this Report
Gareloi
United States
51.79°N, 178.794°W; summit elev. 1573 m
All times are local (unless otherwise noted)
Narrow steaming flow-like feature
On 4 September 1987 at 1500, flight engineer George Wooliver (Reeve Aleutian Airways) observed a narrow flow-like feature that had descended the E flank, from the N crater rim at 1,500 m elevation to at least 1,100 m. A thick cloud cover obscured it below that level. Steam was rising as much as 100 m above the flow feature along its entire visible length. Steaming from the crater appeared more vigorous than usual.
Geologic Background. The 8 x 10 km Gareloi Island, the northernmost volcano of the Delarof Group at the western end of the Andreanof Islands, consists of a stratovolcano with two summits and a prominent SE-trending fissure. The fissure was formed during an eruption in 1929 and extends from the southern summit to the sea. Steep sea cliffs that are cut into rocks of an older, eroded center are found on the SW coast, and submarine deposits of three debris avalanches produced by edifice collapse are found offshore. Young lava flows cover the older volcano from the summit to the coast along three broad axes trending NW, ENE, and S. The 1929 eruption originated from 13 craters along a 4-km-long fissure. Phreatic explosions were followed by the ejection of glassy pumice, lapilli, scoria, and older blocks, as well as by the emission of four short, steep lava flows, one of which reached the SE coast.
Information Contacts: J. Reeder, ADGGS.
Irazu (Costa Rica) — August 1987 Cite this Report
Irazu
Costa Rica
9.979°N, 83.852°W; summit elev. 3436 m
All times are local (unless otherwise noted)
Flank fumarolic activity from two craters
Fumarolic activity continued on the NW flank, with temperatures of 80°C. The crater lake that had formed in 1984 disappeared in June, probably by water drainage.
Geologic Background. The massive Irazú volcano in Costa Rica, immediately E of the capital city of San José, covers an area of 500 km2 and is vegetated to within a few hundred meters of its broad summit crater complex. At least 10 satellitic cones are located on its S flank. No lava effusion is known since the eruption of the Cervantes lava flows from S-flank vents about 14,000 years ago, and all known Holocene eruptions have been explosive. The focus of eruptions at the summit crater complex has migrated to the W towards the main crater, which contains a small lake. The first well-documented eruption occurred in 1723, and frequent explosive eruptions have occurred since. Ashfall from the last major eruption during 1963-65 caused significant disruption to San José and surrounding areas. Phreatic activity reported in 1994 may have been a landslide event from the fumarolic area on the NW summit (Fallas et al., 2018).
Information Contacts: J. Barquero, OVSICORI.
Kilauea (United States) — August 1987 Cite this Report
Kilauea
United States
19.421°N, 155.287°W; summit elev. 1222 m
All times are local (unless otherwise noted)
Lava production continues; deep tremor
The low-level eruptive activity . . . continued through August. Lava advanced SE from the vent area through well-developed tubes over the steep slope of a major fault scarp ("pali") threatening only the E end of Royal Gardens Subdivision and covering a small portion of an unused access road. At ~150 m elevation, lava moved slightly W of earlier flows, and by the end of the month the flow front had advanced to ~25 m elevation, 1 km from the ocean. During the first week of September, lava overrode earlier flows that covered Hwy 130, and the most active part of the 200-m-wide flow, along its W margin, had moved to within 100 m of the Chain of Craters Road inside the national park (figure 52). A small lobe was approaching the ocean E of the park, but advance was only sporadic. The level of the lava pond over the vent continued to vary, with a few small, brief overflows onto the shield during the month. Most of the lava emptied from the neck at the SE end of the pond into the tube system.
Harmonic tremor continued at a low level below the shield vent and Pu`u `O`o. Tremor occasionally varied at intervals of a few hours, but generally remained constant for periods of a few days. Bursts of 40-60-km-deep tremor SW of Kīlauea became increasingly frequent during the last half of the month after three weeks of relative quiet. By mid-August, the number of seismic events beneath Pu`u `O`o (structural adjustments after the 26 June conduit collapse event) had declined considerably, from ~200 shallow microshocks/day in July to ~50/day in late August. There were no unusually significant earthquakes in August; eight had magnitudes of 2.5-4.2. Most occurred in persistent seismic source areas 5-10 km deep in the S flanks of Kīlauea and Mauna Loa.
Geologic Background. Kilauea overlaps the E flank of the massive Mauna Loa shield volcano in the island of Hawaii. Eruptions are prominent in Polynesian legends; written documentation since 1820 records frequent summit and flank lava flow eruptions interspersed with periods of long-term lava lake activity at Halemaumau crater in the summit caldera until 1924. The 3 x 5 km caldera was formed in several stages about 1,500 years ago and during the 18th century; eruptions have also originated from the lengthy East and Southwest rift zones, which extend to the ocean in both directions. About 90% of the surface of the basaltic shield volcano is formed of lava flows less than about 1,100 years old; 70% of the surface is younger than 600 years. The long-term eruption from the East rift zone between 1983 and 2018 produced lava flows covering more than 100 km2, destroyed hundreds of houses, and added new coastline.
Information Contacts: C. Heliker and R. Koyanagi, HVO.
Ol Doinyo Lengai (Tanzania) — August 1987 Cite this Report
Ol Doinyo Lengai
Tanzania
2.764°S, 35.914°E; summit elev. 2962 m
All times are local (unless otherwise noted)
Eruptive history January 1983-June 1987
The following . . . is a compilation of reports from visitors to the volcano since 1983. Names of sources are in parentheses after their information. [See Nyamweru, 1988, for a more detailed version.]
Photographs taken on a flight over the crater in early April 1983 showed a narrow tongue of black lava stretching from the base of the N wall over more than half of the ~180-m-wide crater floor (figure 1) (Croze and Fanshawe). Three months later, in July, a group visited the crater rim and observed that on the upper 10% of the outer slopes vegetation had died and a thin layer of white ash had fallen. Many fissures along the rim of the N crater were issuing clouds of sulfurous steam and sulfur crystals were forming in cracks in the ground. The N crater appeared shallower than it had before the eruption of early 1983. Very liquid, dark colored "mud" was ejected at intervals to heights of ~2-3 m, from two or three small vents at the N end of the crater, with a noise similar to ocean surf (Peterson).
During a May 1984 visit, two vents on the N side of the crater floor (figure 2) contained a black bubbling liquid that was occasionally thrown an estimated 6 m into the air (Trott). Three months later, on 2 August 1984, dark gray to black, ropy, mud-like crust had formed over the inside surface of the inner crater (surface G in figure 2). On the N side of the crater floor, a small cluster of cones, ~3 m high, ejected small blobs of mud-like lava. A continuous deep rumbling occurred from within the crater (Skelton). By February 1985, a lake that was very black, quite liquid, and boiling vigorously, covered ~1/4 of the crater floor (Borner). In October 1985, the lake was covered with a solid crust, but three cones, ~3 m high, had formed. The largest one, on the W side, had bubbling black "mud" inside, that was being thrown violently towards the cone's rim (Borner).
A group spent two hours on the crater floor on 27 December 1985. The crater floor was generally flat with a 10-m rock "spine" (probably made of lava) near the N end. A number of deep holes in the crater floor led into tunnels that emitted steam with considerable force. The fissures described by Peterson in 1983 also continued to emit steam and sulfurous fumes. Noise and tremor seemed to originate from below the crater at 5- to 30-minute intervals (Waldron). Lava samples from the crater floor were analyzed and found to be natrocarbonatite, consisting almost entirely of nyerereite and gregoryite. A thin section showed clear tabular nyerereite and cloudy rounded gregoryite phenocrysts in a finely crystalline groundmass that was primarily carbonate minerals (Hay). The texture and composition of this lava was very similar to those formed in [1960 and 1966].
On 1 May 1986 the same group found that the tunnels beneath the crater had all been filled by more recent flows and there were three small peaks (instead of one), each ~8 m high. Eruption of clots of "brownish dark cement" was occurring every few seconds from a small vent near the top of one of the peaks. Very fresh-looking, dark brown, ropy lava had spread out around the base of the peaks and extended several tens of meters from the base of the cone (Waldron).
In November 1986 there was a considerably larger area of dark fresh-looking lava visible on the N side of the crater than there had been in May. Several small vents were concentrated towards the N side of the crater and at least three were throwing out clots of lava. Black lava had flowed into the crater from a small cone on the crater rim that formed between July 1984 and July 1985. The crater appeared shallower than it had been in 1983; the vertical cliff that had formed the lower segment of the slope (area B in figure 2) into the crater had completely disappeared, and at the S end of the crater the slope above it was also much shorter than it was in 1983. Very roughly, some 10-20 m of vertical slope could have been lost due to infilling by the volcanic material erupted since 1983 (Peterson).
In February 1987 an aerial view of the crater (figure 3) confirmed the crater's shallow appearance. The crater floor also looked much paler than in November 1986, suggesting that the lava surface had undergone characteristic alteration and little new material had been erupted in the previous few weeks. On 30 June 1987, a couple of small vents on the N side were still active. The vent on the N rim had grown some since last seen in November 1986 (Peterson).
Reference. Nyamweru, C., 1988, Activity of Ol Doinyo Lengai volcano, Tanzania, 1983-1987: Journal of African Earth Science, v. 7, p. 603-610.
Geologic Background. The symmetrical Ol Doinyo Lengai is the only volcano known to have erupted carbonatite tephras and lavas in historical time. The prominent stratovolcano, known to the Maasai as "The Mountain of God," rises abruptly above the broad plain south of Lake Natron in the Gregory Rift Valley. The cone-building stage ended about 15,000 years ago and was followed by periodic ejection of natrocarbonatitic and nephelinite tephra during the Holocene. Historical eruptions have consisted of smaller tephra ejections and emission of numerous natrocarbonatitic lava flows on the floor of the summit crater and occasionally down the upper flanks. The depth and morphology of the northern crater have changed dramatically during the course of historical eruptions, ranging from steep crater walls about 200 m deep in the mid-20th century to shallow platforms mostly filling the crater. Long-term lava effusion in the summit crater beginning in 1983 had by the turn of the century mostly filled the northern crater; by late 1998 lava had begun overflowing the crater rim.
Information Contacts: C. Nyamweru, Kenyatta Univ, Nairobi, Kenya.
Mahawu (Indonesia) — August 1987 Cite this Report
Mahawu
Indonesia
1.352°N, 124.865°E; summit elev. 1299 m
All times are local (unless otherwise noted)
1977 lake data corrected
During the November 1977 visit by Nairn and Bachri, the crater lake was 80 m in diameter and its temperature was 65.5°C (correcting the values reported in 12:07). Lake depth was estimated at 10 m by a guide, based on his earlier observation of the crater floor at a time when the lake was dry. The explosions from the lake were quite small.
Geologic Background. The elongated Mahawu volcano immediately east of Lokon-Empung volcano is the northernmost of a series of young volcanoes along a SSW-NNE line near the margin of the Quaternary Tondano caldera. Mahawu is capped by a 180-m-wide, 140-m-deep crater that sometimes contains a small crater lake, and has two pyroclastic cones on its N flank. Historical activity has been restricted to occasional small explosive eruptions recorded since 1789. In 1994 fumaroles, mudpots, and small geysers were observed along the shores of a greenish-colored crater lake.
Information Contacts: I. Nairn, NZGS Rotorua, New Zealand.
Manam (Papua New Guinea) — August 1987 Cite this Report
Manam
Papua New Guinea
4.08°S, 145.037°E; summit elev. 1807 m
All times are local (unless otherwise noted)
Maps of 30 June eruption products; low-level activity
A low level of activity prevailed through August. Southern Crater released only a thin white plume. Main Crater released white vapor at low rates, and displayed steady night glow from 18 August. A moderately low level of seismicity continued with 1,400-1,500 sub-continuous, small-amplitude, low-frequency events/day. No significant tilt change was recorded during the month. Figures 2 and 3 show the distribution of the products of the 30 June eruption. Pyroclastic flow volume was estimated at 5-10 x 106 m3. Estimated volume of airfall ash was 106 m3.
Geologic Background. The 10-km-wide island of Manam, lying 13 km off the northern coast of mainland Papua New Guinea, is one of the country's most active volcanoes. Four large radial valleys extend from the unvegetated summit of the conical basaltic-andesitic stratovolcano to its lower flanks. These valleys channel lava flows and pyroclastic avalanches that have sometimes reached the coast. Five small satellitic centers are located near the island's shoreline on the northern, southern, and western sides. Two summit craters are present; both are active, although most observed eruptions have originated from the southern crater, concentrating eruptive products during much of the past century into the SE valley. Frequent eruptions, typically of mild-to-moderate scale, have been recorded since 1616. Occasional larger eruptions have produced pyroclastic flows and lava flows that reached flat-lying coastal areas and entered the sea, sometimes impacting populated areas.
Information Contacts: C. McKee, P. de Saint-Ours and P. Lowenstein, RVO.
Merapi (Indonesia) — August 1987 Cite this Report
Merapi
Indonesia
7.54°S, 110.446°E; summit elev. 2910 m
All times are local (unless otherwise noted)
Lava dome growth, but nuées ardentes de avalanche stop
Comparison of photographs taken during visits to the summit in May, July, and on 8 August, showed that the lava dome continued to increase in volume. Most of the growth seems to have occurred by addition of material to the top of the dome and in its NE sector. No perceptible new growth has occurred on the SW part of the dome. . . .
Geologic Background. Merapi, one of Indonesia's most active volcanoes, lies in one of the world's most densely populated areas and dominates the landscape immediately north of the major city of Yogyakarta. It is the youngest and southernmost of a volcanic chain extending NNW to Ungaran volcano. Growth of Old Merapi during the Pleistocene ended with major edifice collapse perhaps about 2,000 years ago, leaving a large arcuate scarp cutting the eroded older Batulawang volcano. Subsequent growth of the steep-sided Young Merapi edifice, its upper part unvegetated due to frequent activity, began SW of the earlier collapse scarp. Pyroclastic flows and lahars accompanying growth and collapse of the steep-sided active summit lava dome have devastated cultivated lands on the western-to-southern flanks and caused many fatalities.
Information Contacts: VSI.
Nyamulagira (DR Congo) — August 1987 Cite this Report
Nyamulagira
DR Congo
1.408°S, 29.2°E; summit elev. 3058 m
All times are local (unless otherwise noted)
Correction to July 1986 eruption site
New observations show that the July 1986 eruption vent was located 4.5 km S of the caldera's edge at the S foot of Kitazungurwa in Mashiga (figure 6) rather than... 3.5 km SW of the caldera's edge.
Geologic Background. Africa's most active volcano, Nyamulagira (also known as Nyamuragira), is a massive high-potassium basaltic shield about 25 km N of Lake Kivu and 13 km NNW of the steep-sided Nyiragongo volcano. The summit is truncated by a small 2 x 2.3 km caldera that has walls up to about 100 m high. Documented eruptions have occurred within the summit caldera, as well as from the numerous flank fissures and cinder cones. A lava lake in the summit crater, active since at least 1921, drained in 1938, at the time of a major flank eruption. Recent lava flows extend down the flanks more than 30 km from the summit as far as Lake Kivu; extensive lava flows from this volcano have covered 1,500 km2 of the western branch of the East African Rift.
Information Contacts: B. Louant, GEOVAR, Kigali, Rwanda.
Pacaya (Guatemala) — August 1987 Cite this Report
Pacaya
Guatemala
14.382°N, 90.601°W; summit elev. 2569 m
All times are local (unless otherwise noted)
Lava production resumes; Strombolian activity
During the first 20 days of July, activity was weak, limited to sporadic explosions from MacKenney Crater. No lava flows had been observed since the strong 14 June explosive eruption. Activity increased on 23 July, to 5-10 explosions/15 minutes from MacKenney Crater as recorded by seismic instruments. About 26 July, a new lava flow was observed emerging from MacKenney Crater and advancing W. Two small vents were observed within MacKenney Crater, ejecting gas, dark gray ash and pyroclastics. Most fell back into the crater, but fresh bombs were found on the older summit cone about 100 m to the south.
Geologic Background. Eruptions from Pacaya are frequently visible from Guatemala City, the nation's capital. This complex basaltic volcano was constructed just outside the southern topographic rim of the 14 x 16 km Pleistocene Amatitlán caldera. A cluster of dacitic lava domes occupies the southern caldera floor. The post-caldera Pacaya massif includes the older Pacaya Viejo and Cerro Grande stratovolcanoes and the currently active Mackenney stratovolcano. Collapse of Pacaya Viejo between 600 and 1,500 years ago produced a debris-avalanche deposit that extends 25 km onto the Pacific coastal plain and left an arcuate scarp inside which the modern Pacaya volcano (Mackenney cone) grew. The NW-flank Cerro Chino crater was last active in the 19th century. During the past several decades, activity has consisted of frequent Strombolian eruptions with intermittent lava flow extrusion that has partially filled in the caldera moat and covered the flanks of Mackenney cone, punctuated by occasional larger explosive eruptions that partially destroy the summit.
Information Contacts: E. Sánchez, INSIVUMEH.
Pagan (United States) — August 1987 Cite this Report
Pagan
United States
18.13°N, 145.8°E; summit elev. 570 m
All times are local (unless otherwise noted)
Small eruption cloud; 1981 scoria has flowed into village
L.G. Eldredge visited Pagan for a few hours on 4 June. The only visible activity was steam emission from the crater. Scoria from the 1981 eruption appeared to have become a slurry-like material during the past 3 years, flowing into the village where it had filled rooms at the infirmary and reached almost to the roof of the school.
The 6 September edition of the Guam Sunday News included a photograph that showed a moderately dense cloud rising perhaps 1 km from the summit of Pagan during what was described as an eruption in the morning of 4 September.
Geologic Background. Pagan Island, the largest and one of the most active of the Mariana Islands volcanoes, consists of two stratovolcanoes connected by a narrow isthmus. Both North and South Pagan stratovolcanoes were constructed within calderas, 7 and 4 km in diameter, respectively. North Pagan at the NE end of the island rises above the flat floor of the northern caldera, which may have formed less than 1,000 years ago. South Pagan is a stratovolcano with an elongated summit containing four distinct craters. Almost all of the recorded eruptions, which date back to the 17th century, have originated from North Pagan. The largest eruption during historical time took place in 1981 and prompted the evacuation of the sparsely populated island.
Information Contacts: L. Eldredge, Univ of Guam.
Pavlof (United States) — August 1987 Cite this Report
Pavlof
United States
55.417°N, 161.894°W; summit elev. 2493 m
All times are local (unless otherwise noted)
Continued ash emission
Eruptive activity was continuing in late August. At about 1130 on 29 August, pilot Chuck Nickerson (Reeve Aleutian Airways) observed a thick dark ash horizon at 1200-1800 m altitude extending 50 km SSW from Pavlof. The ash appeared to originate from a SE flank vent. Below that vent, white steam was rising along a 100 m, narrow, flow-like, feature or crack. At 1550 pilots Andy Livingston and James Fredenhagen (Reeve Aleutian Airways) observed from Sand Point (88 km E), a diffuse ash layer at 1200-1800 m altitude that extended at least 15 km SW. Ben and Lorie Kirker reported that no ash reached King Cove, about 40 km SW. On 30 August at 1400 Theresa Dubber (FAA) saw no ash being emitted during a clear view of the volcano from Cold Bay.
Geologic Background. The most active volcano of the Aleutian arc, Pavlof is a Holocene stratovolcano that was constructed along a line of vents extending NE from the Emmons Lake caldera. Pavlof and Pavlof Sister to the NE form a dramatic pair of symmetrical, glacier-covered stratovolcanoes that overlook Pavlof and Volcano bays. Little Pavlof is a smaller cone on the SW flank of Pavlof volcano, near the rim of Emmons Lake caldera. Unlike Pavlof Sister, eruptions have frequently been reported from Pavlof, typically Strombolian to Vulcanian explosive eruptions from the summit vents and occasional lava flows. The active vents lie near the summit on the north and east sides. The largest recorded eruption took place in 1911, at the end of a 5-year-long eruptive episode, when a fissure opened on the N flank, ejecting large blocks and issuing lava flows.
Information Contacts: J. Reeder, ADGGS.
Poas
Costa Rica
10.2°N, 84.233°W; summit elev. 2697 m
All times are local (unless otherwise noted)
Geyser-like eruptions; crater lake lowers; new fractures
Geyser-like phreatic eruptions, the first since September 1980, resumed in June. The crater lake had been relatively quiet and the eroded 1953-55 [dome] in the lake had been gradually cooling for the past several years. The eruptions, from the W part of the crater lake, ejected columns of water and sediments that typically rose to about 30 m height, then fell back into the lake, generating a wave surge. The eruptions were followed by vapor column emission. Sporadic activity continued in July and August. On 1 July, three phreatic eruptions were observed, with ejecta from the last, at 1130, reaching 75 m above the lake. Three more phreatic episodes were seen on 14 August (at 0845, 1120, and 1225), with the second only producing a small bubble. On 19 August, three explosions and another small bubble were observed (at 0958, 1133, 1210, and 1358). Witnesses of the second and third explosions reported that a mud and vapor column rose suddenly from the center of the lake without any apparent premonitory activity. The column ejection was accompanied by a loud noise that increased as the ejecta fell back, causing 1-m waves that eroded sediments at the shore.
During the first 8 months of 1987, fumarole temperatures averaged 540°C at the top of the 1953-55 [dome] and 800°C on its W flank. Temperatures had dropped from more than 800°C in late 1983 to around 300°C in mid-1985. Fumaroles were less vigorous than last year. Crater lake temperature varied, but increased from 58°C in January to 70°C in June; pH was 0-0.5. The lake level has continued to fall, exposing three terraces of gray, water-saturated sediment since January, and dropping about 2 m in the past 6 months. Concentric fractures have developed along the shore, particularly on the E and NE sides (striking N-S and NW-SE respectively). Landslides have occurred on the E wall of the crater and on the 1953-55 [dome].
Geologic Background. The broad vegetated edifice of Poás, one of the most active volcanoes of Costa Rica, contains three craters along a N-S line. The frequently visited multi-hued summit crater lakes of the basaltic-to-dacitic volcano are easily accessible by vehicle from the nearby capital city of San José. A N-S-trending fissure cutting the complex stratovolcano extends to the lower N flank, where it has produced the Congo stratovolcano and several lake-filled maars. The southernmost of the two summit crater lakes, Botos, last erupted about 7,500 years ago. The more prominent geothermally heated northern lake, Laguna Caliente, is one of the world's most acidic natural lakes, with a pH of near zero. It has been the site of frequent phreatic and phreatomagmatic eruptions since an eruption was reported in 1828. Eruptions often include geyser-like ejections of crater-lake water.
Information Contacts: J. Barquero, OVSICORI; R. Barquero and Guillermo Alvarado, ICE; G. Soto and Luis D. Morales, Sección de Sismología, Vulcanología, y Exploración Geofísica, Escuela Centroamericana de Geología, Univ de Costa Rica, San José, Costa Rica.
Rabaul (Papua New Guinea) — August 1987 Cite this Report
Rabaul
Papua New Guinea
4.2459°S, 152.1937°E; summit elev. 688 m
All times are local (unless otherwise noted)
Seismicity declines; deflation in caldera
Seismicity declined to its lowest level since the 1983-85 unrest; only 34 caldera earthquakes were recorded in August, compared to 80-150/month in the last seven months. There were periods of several consecutive days with no events and only three small events were recorded 13-20 August. The six located earthquakes were in the Greet Harbour and Karavia Bay areas (NE and E parts of the caldera).
Dry tilt readings on Vulcan Headland . . . showed a steady deflation of 20 µrad since May. In Greet Harbour, usually the most active area, tilt readings remained virtually unchanged although levelling revealed a slight subsidence of 10 mm at Matupit Island since the end of June. This slight deflationary trend was consistent with EDM results.
Geologic Background. The low-lying Rabaul caldera on the tip of the Gazelle Peninsula at the NE end of New Britain forms a broad sheltered harbor utilized by what was the island's largest city prior to a major eruption in 1994. The outer flanks of the asymmetrical shield volcano are formed by thick pyroclastic-flow deposits. The 8 x 14 km caldera is widely breached on the east, where its floor is flooded by Blanche Bay and was formed about 1,400 years ago. An earlier caldera-forming eruption about 7,100 years ago is thought to have originated from Tavui caldera, offshore to the north. Three small stratovolcanoes lie outside the N and NE caldera rims. Post-caldera eruptions built basaltic-to-dacitic pyroclastic cones on the caldera floor near the NE and W caldera walls. Several of these, including Vulcan cone, which was formed during a large eruption in 1878, have produced major explosive activity during historical time. A powerful explosive eruption in 1994 occurred simultaneously from Vulcan and Tavurvur volcanoes and forced the temporary abandonment of Rabaul city.
Information Contacts: C. McKee, P. de Saint-Ours and P. Lowenstein, RVO.
Ruapehu (New Zealand) — August 1987 Cite this Report
Ruapehu
New Zealand
39.28°S, 175.57°E; summit elev. 2797 m
All times are local (unless otherwise noted)
Crater lake temperature increase; convecting lake water
Crater Lake temperature had increased from 11.5 to 24.5°C between visits by geologists on 3 July and 17 August. Convection of lake water was occurring at both the central and N vents on 17 August. Outflow had increased from 30 l/s to >200 l/s, and total heat flow from the lake had increased by a factor of 4 since the July visit, reaching ~180 MW.
No recent eruptions appear to have occurred and no significant deformation or seismicity has accompanied the lake heating. Lake temperature had been relatively stable after dropping rapidly between November and December 1986, but reached a low in July (figure 7).
Geologic Background. Ruapehu, one of New Zealand's most active volcanoes, is a complex stratovolcano constructed during at least four cone-building episodes dating back to about 200,000 years ago. The dominantly andesitic 110 km3 volcanic massif is elongated in a NNE-SSW direction and surrounded by another 100 km3 ring plain of volcaniclastic debris, including the NW-flank Murimoto debris-avalanche deposit. A series of subplinian eruptions took place between about 22,600 and 10,000 years ago, but pyroclastic flows have been infrequent. The broad summait area and flank contain at least six vents active during the Holocene. Frequent mild-to-moderate explosive eruptions have been recorded from the Te Wai a-Moe (Crater Lake) vent, and tephra characteristics suggest that the crater lake may have formed as recently as 3,000 years ago. Lahars resulting from phreatic eruptions at the summit crater lake are a hazard to a ski area on the upper flanks and lower river valleys.
Information Contacts: I. Nairn, NZGS Rotorua; P. Otway, NZGS Wairakei.
Sangeang Api (Indonesia) — August 1987 Cite this Report
Sangeang Api
Indonesia
8.2°S, 119.07°E; summit elev. 1912 m
All times are local (unless otherwise noted)
Small explosions continue
The eruption . . . continued in August, with ~25 explosions/day ejecting plumes to ~600 m above the crater rim. A seismometer 5 km from the summit recorded no earthquakes accompanying the explosions.
Geologic Background. Sangeang Api volcano, one of the most active in the Lesser Sunda Islands, forms a small 13-km-wide island off the NE coast of Sumbawa Island. Two large trachybasaltic-to-tranchyandesitic volcanic cones, Doro Api and Doro Mantoi, were constructed in the center and on the eastern rim, respectively, of an older, largely obscured caldera. Flank vents occur on the south side of Doro Mantoi and near the northern coast. Intermittent eruptions have been recorded since 1512, most of them during in the 20th century.
Information Contacts: VSI.
Santa Maria (Guatemala) — August 1987 Cite this Report
Santa Maria
Guatemala
14.757°N, 91.552°W; summit elev. 3745 m
All times are local (unless otherwise noted)
Lava flow from dome; many avalanches; explosions
An incandescent block lava flow continued to emerge from Cono Caliente (the active crater on the E side of the dome), advancing down the S flank. By the end of July its front was between 1,200 and 1,300 m elevation in a canyon 80 m wide and 30 m deep, about 1.5 km from the Nimá II river. Numerous avalanches occurred from the flow front and along its channel. There were some reports of explosions from the flow front; fumaroles and a gaseous odor were noted there by geologists. Sporadic explosions from Cono Caliente ejected light-colored ash, and gas emission was continuous.
Geologic Background. Symmetrical, forest-covered Santa María volcano is part of a chain of large stratovolcanoes that rise above the Pacific coastal plain of Guatemala. The sharp-topped, conical profile is cut on the SW flank by a 1.5-km-wide crater. The oval-shaped crater extends from just below the summit to the lower flank, and was formed during a catastrophic eruption in 1902. The renowned Plinian eruption of 1902 that devastated much of SW Guatemala followed a long repose period after construction of the large basaltic andesite stratovolcano. The massive dacitic Santiaguito lava-dome complex has been growing at the base of the 1902 crater since 1922. Compound dome growth at Santiaguito has occurred episodically from four vents, with activity progressing E towards the most recent, Caliente. Dome growth has been accompanied by almost continuous minor explosions, with periodic lava extrusion, larger explosions, pyroclastic flows, and lahars.
Information Contacts: E. Sánchez, INSIVUMEH.
Semeru (Indonesia) — August 1987 Cite this Report
Semeru
Indonesia
8.108°S, 112.922°E; summit elev. 3657 m
All times are local (unless otherwise noted)
Vulcanian activity continues; nuées ardentes de avalanche
. . . Vulcanian activity continued through August. Field geologists observed several [glowing avalanches] that traveled down the SE flank . . . .
Geologic Background. Semeru, the highest volcano on Java, and one of its most active, lies at the southern end of a volcanic massif extending north to the Tengger caldera. The steep-sided volcano, also referred to as Mahameru (Great Mountain), rises above coastal plains to the south. Gunung Semeru was constructed south of the overlapping Ajek-ajek and Jambangan calderas. A line of lake-filled maars was constructed along a N-S trend cutting through the summit, and cinder cones and lava domes occupy the eastern and NE flanks. Summit topography is complicated by the shifting of craters from NW to SE. Frequent 19th and 20th century eruptions were dominated by small-to-moderate explosions from the summit crater, with occasional lava flows and larger explosive eruptions accompanied by pyroclastic flows that have reached the lower flanks of the volcano.
Information Contacts: VSI.
Sheveluch (Russia) — August 1987 Cite this Report
Sheveluch
Russia
56.653°N, 161.36°E; summit elev. 3283 m
All times are local (unless otherwise noted)
Ash plumes and base surges from extrusive dome
Gas and ash plumes from the extrusive dome were sighted more frequently in 1987. Four or five plumes were seen each month March-June and 6 in July. Seismic activity also intensified and each explosion was accompanied by volcanic tremor. Vertical columnar ash plumes with a maximum height of 5 km were often accompanied by base surges that extended 300 m. Explosion products included ash and andesitic sand-sized tephra with rare blocks as large as 1 m.
Geologic Background. The high, isolated massif of Sheveluch volcano (also spelled Shiveluch) rises above the lowlands NNE of the Kliuchevskaya volcano group. The 1,300 km3 andesitic volcano is one of Kamchatka's largest and most active volcanic structures, with at least 60 large eruptions during the Holocene. The summit of roughly 65,000-year-old Stary Shiveluch is truncated by a broad 9-km-wide late-Pleistocene caldera breached to the south. Many lava domes occur on its outer flanks. The Molodoy Shiveluch lava dome complex was constructed during the Holocene within the large open caldera; Holocene lava dome extrusion also took place on the flanks of Stary Shiveluch. Widespread tephra layers from these eruptions have provided valuable time markers for dating volcanic events in Kamchatka. Frequent collapses of dome complexes, most recently in 1964, have produced debris avalanches whose deposits cover much of the floor of the breached caldera.
Information Contacts: G. Bogoyavlenskaya and V. Beloussov, IV.
Sorikmarapi (Indonesia) — August 1987 Cite this Report
Sorikmarapi
Indonesia
0.686°N, 99.539°E; summit elev. 2145 m
All times are local (unless otherwise noted)
Seismicity and fumarole temperatures increase
Temperatures increased at two fumaroles during August: from 104 to 197°C at the N crater, and from 95 to 108°C at Sibangor Julu. White fume was almost continuously present, rising to ~100 m above the crater. In late August, seismic activity began to increase. By early September, near-surface earthquakes averaged ~7/day and deeper, tectonic earthquakes averaged ~40/day.
Geologic Background. Sorikmarapi is a forested stratovolcano with a 600-m-wide summit crater containing a lake and substantial sulfur deposits. A smaller upper SE flank crater (Danau Merah) also contains a crater lake; these two craters and a series of smaller explosion pits occur along a NW-SE line. Several solfatara fields are located on the E flank. Phreatic eruptions have occurred from summit and flank vents during the 19th and 20th centuries.
Information Contacts: VSI.
Tacana (Mexico-Guatemala) — August 1987 Cite this Report
Tacana
Mexico-Guatemala
15.132°N, 92.109°W; summit elev. 4064 m
All times are local (unless otherwise noted)
Fewer microearthquakes
During July, the SBG seismic station registered 20 microearthquakes with S-P <= 2.0 seconds. There have been no recent reports about the state of the vent formed by the 8 May 1986 phreatic eruption.
Geologic Background. Tacaná is a 4064-m-high composite stratovolcano that straddles the México/Guatemala border at the NW end of the Central American volcanic belt. The volcano rises 1800 m above deeply dissected plutonic and metamorphic terrain. Three large calderas breached to the south, and the elongated summit region is dominated by a series of lava domes intruded along a NE-SW trend. Volcanism has migrated to the SW, and a small adventive lava dome is located in the crater of the youngest volcano, San Antonio, on the upper SW flank. Viscous lava flow complexes are found on the north and south flanks, and lobate lahar deposits fill many valleys. Radial drainages on the Guatemalan side are deflected by surrounding mountains into the Pacific coastal plain on the SW side of the volcano. Historical activity has been restricted to mild phreatic eruptions, but more powerful explosive activity, including the production of pyroclastic flows, has occurred as recently as about 1950 years ago.
Information Contacts: E. Sánchez, INSIVUMEH.
Turrialba (Costa Rica) — August 1987 Cite this Report
Turrialba
Costa Rica
10.025°N, 83.767°W; summit elev. 3340 m
All times are local (unless otherwise noted)
Fumarolic activity from two craters
Fumarolic activity continued, with temperatures of 91°C in the W crater and 85° in the central crater, similar to those measured in mid-1985 (10:07).
Geologic Background. Turrialba, the easternmost of Costa Rica's Holocene volcanoes, is a large vegetated basaltic-to-dacitic stratovolcano located across a broad saddle NE of Irazú volcano overlooking the city of Cartago. The massive edifice covers an area of 500 km2. Three well-defined craters occur at the upper SW end of a broad 800 x 2200 m summit depression that is breached to the NE. Most activity originated from the summit vent complex, but two pyroclastic cones are located on the SW flank. Five major explosive eruptions have occurred during the past 3500 years. A series of explosive eruptions during the 19th century were sometimes accompanied by pyroclastic flows. Fumarolic activity continues at the central and SW summit craters.
Information Contacts: J. Barquero, OVSICORI.