Recently Published Bulletin Reports
Erebus (Antarctica) Lava lake remains active; most thermal alerts recorded since 2019
Rincon de la Vieja (Costa Rica) Frequent phreatic explosions during July-December 2023
Bezymianny (Russia) Explosion on 18 October 2023 sends ash plume 8 km high; lava flows and incandescent avalanches
Kilauea (United States) Low-level lava effusions in the lava lake at Halema’uma’u during July-December 2022
Nyamulagira (DR Congo) Lava flows and thermal activity during May-October 2023
Bagana (Papua New Guinea) Explosions, ash plumes, ashfall, and lava flows during April-September 2023
Mayon (Philippines) Lava flows, pyroclastic flows, ash emissions, and seismicity during April-September 2023
Nishinoshima (Japan) Eruption plumes and gas-and-steam plumes during May-August 2023
Krakatau (Indonesia) White gas-and-steam plumes and occasional ash plumes during May-August 2023
Villarrica (Chile) Strombolian activity, gas-and-ash emissions, and crater incandescence during April-September 2023
Merapi (Indonesia) Frequent incandescent avalanches during April-September 2023
Ebeko (Russia) Moderate explosive activity with ash plumes continued during June-November 2023
Erebus (Antarctica) — January 2024  Cite this Report
Erebus
Antarctica
77.53°S, 167.17°E; summit elev. 3794 m
All times are local (unless otherwise noted)
Lava lake remains active; most thermal alerts recorded since 2019
The lava lake in the summit crater of Erebus has been active since at least 1972. Located in Antarctica overlooking the McMurdo Station on Ross Island, it is the southernmost active volcano on the planet. Because of the remote location, activity is primarily monitored by satellites. This report covers activity during 2023.
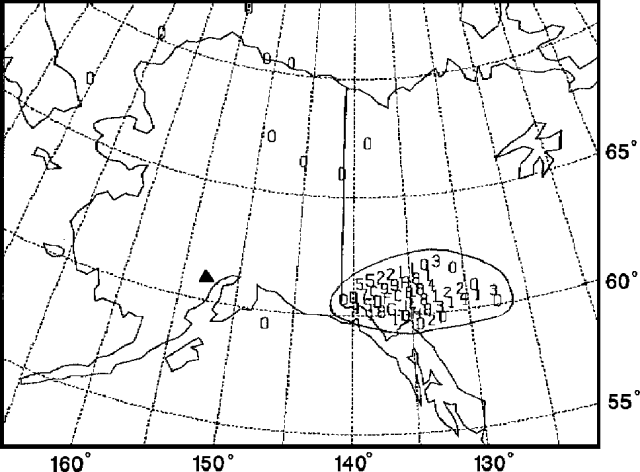
The number of thermal alerts recorded by the Hawai'i Institute of Geophysics and Planetology’s MODVOLC Thermal Alerts System increased considerably in 2023 compared to the years 2020-2022 (table 9). In contrast to previous years, the MODIS instruments aboard the Aqua and Terra satellites captured data from Erebus every month during 2023. Consistent with previous years, the lowest number of anomalous pixels were recorded in January, November, and December.
Table 9. Number of monthly MODIS-MODVOLC thermal alert pixels recorded at Erebus during 2017-2023. See BGVN 42:06 for data from 2000 through 2016. The table was compiled using data provided by the HIGP – MODVOLC Thermal Alerts System.
| Year |
Jan |
Feb |
Mar |
Apr |
May |
Jun |
Jul |
Aug |
Sep |
Oct |
Nov |
Dec |
SUM |
| 2017 |
0 |
21 |
9 |
0 |
0 |
1 |
11 |
61 |
76 |
52 |
0 |
3 |
234 |
| 2018 |
0 |
21 |
58 |
182 |
55 |
17 |
137 |
172 |
103 |
29 |
0 |
0 |
774 |
| 2019 |
2 |
21 |
162 |
151 |
55 |
56 |
75 |
53 |
29 |
19 |
1 |
0 |
624 |
| 2020 |
0 |
2 |
16 |
18 |
4 |
4 |
1 |
3 |
18 |
3 |
1 |
6 |
76 |
| 2021 |
0 |
9 |
1 |
0 |
2 |
56 |
46 |
47 |
35 |
52 |
5 |
3 |
256 |
| 2022 |
1 |
13 |
55 |
22 |
15 |
32 |
39 |
19 |
31 |
11 |
0 |
0 |
238 |
| 2023 |
2 |
33 |
49 |
82 |
41 |
32 |
70 |
64 |
42 |
17 |
5 |
11 |
448 |
Sentinel-2 infrared images showed one or two prominent heat sources within the summit crater, accompanied by adjacent smaller sources, similar to recent years (see BGVN 46:01, 47:02, and 48:01). A unique image was obtained on 25 November 2023 by the OLI-2 (Operational Land Imager-2) on Landsat 9, showing the upper part of the volcano surrounded by clouds (figure 32).
Geologic Background. Mount Erebus, the world's southernmost historically active volcano, overlooks the McMurdo research station on Ross Island. It is the largest of three major volcanoes forming the crudely triangular Ross Island. The summit of the dominantly phonolitic volcano has been modified by one or two generations of caldera formation. A summit plateau at about 3,200 m elevation marks the rim of the youngest caldera, which formed during the late-Pleistocene and within which the modern cone was constructed. An elliptical 500 x 600 m wide, 110-m-deep crater truncates the summit and contains an active lava lake within a 250-m-wide, 100-m-deep inner crater; other lava lakes are sometimes present. The glacier-covered volcano was erupting when first sighted by Captain James Ross in 1841. Continuous lava-lake activity with minor explosions, punctuated by occasional larger Strombolian explosions that eject bombs onto the crater rim, has been documented since 1972, but has probably been occurring for much of the volcano's recent history.
Information Contacts: Hawai'i Institute of Geophysics and Planetology (HIGP) - MODVOLC Thermal Alerts System, School of Ocean and Earth Science and Technology (SOEST), Univ. of Hawai'i, 2525 Correa Road, Honolulu, HI 96822, USA (URL: http://modis.higp.hawaii.edu/); Copernicus Browser, Copernicus Data Space Ecosystem, European Space Agency (URL: https://dataspace.copernicus.eu/browser/); NASA Earth Observatory, EOS Project Science Office, NASA Goddard Space Flight Center, Goddard, Maryland, USA (URL: https://earthobservatory.nasa.gov/images/152134/erebus-breaks-through).
Rincon de la Vieja (Costa Rica) — January 2024 Cite this Report
Rincon de la Vieja
Costa Rica
10.83°N, 85.324°W; summit elev. 1916 m
All times are local (unless otherwise noted)
Frequent phreatic explosions during July-December 2023
Rincón de la Vieja is a volcanic complex in Costa Rica with a hot convecting acid lake that exhibits frequent weak phreatic explosions, gas-and-steam emissions, and occasional elevated sulfur dioxide levels (BGVN 45:10, 46:03, 46:11). The current eruption period began June 2021. This report covers activity during July-December 2023 and is based on weekly bulletins and occasional daily reports from the Observatorio Vulcanologico Sismologica de Costa Rica-Universidad Nacional (OVSICORI-UNA).
Numerous weak phreatic explosions continued during July-December 2023, along with gas-and-steam emissions and plumes that rose as high as 3 km above the crater rim. Many weekly OVSICORI-UNA bulletins included the previous week's number of explosions and emissions (table 9). For many explosions, the time of explosion was given (table 10). Frequent seismic activity (long-period earthquakes, volcano-tectonic earthquakes, and tremor) accompanied the phreatic activity.
Table 9. Number of reported weekly phreatic explosions and gas-and-steam emissions at Rincón de la Vieja, July-December 2023. Counts are reported for the week before the Weekly Bulletin date; not all reports included these data. Courtesy of OVSICORI-UNA.
| OVSICORI Weekly Bulletin |
Number of explosions |
Number of emissions |
| 28 Jul 2023 |
6 |
14 |
| 4 Aug 2023 |
10 |
12 |
| 1 Sep 2023 |
13 |
11 |
| 22 Sep 2023 |
12 |
13 |
| 29 Sep 2023 |
6 |
11 |
| 6 Oct 2023 |
12 |
5 |
| 13 Oct 2023 |
7 |
9 |
| 20 Oct 2023 |
1 |
15 |
| 27 Oct 2023 |
3 |
23 |
| 3 Nov 2023 |
3 |
10 |
| 17 Nov 2023 |
0 |
Some |
| 24 Nov 2023 |
0 |
14 |
| 8 Dec 2023 |
4 |
16 |
| 22 Dec 2023 |
8 |
18 |
Table 10. Summary of activity at Rincón de la Vieja during July-December 2023. Weak phreatic explosions and gas emissions are noted where the time of explosion was indicated in the weekly or daily bulletins. Height of plumes or emissions are distance above the crater rim. Courtesy of OVSICORI-UNA.
| Date |
Time |
Description of Activity |
| 1 Jul 2023 |
0156 |
Explosion. |
| 2 Jul 2023 |
0305 |
Explosion. |
| 4 Jul 2023 |
0229, 0635 |
Event at 0635 produced a gas-and-steam plume that rose 700 m and drifted W; seen by residents in Liberia (21 km SW). |
| 9 Jul 2023 |
1843 |
Explosion. |
| 21 Jul 2023 |
0705 |
Explosion. |
| 26 Jul 2023 |
1807 |
Explosion. |
| 28 Jul 2023 |
0802 |
Explosion generated a gas-and-steam plume that rose 500 m. |
| 30 Jul 2023 |
1250 |
Explosion. |
| 31 Jul 2023 |
2136 |
Explosion. |
| 11 Aug 2023 |
0828 |
Explosion. |
| 18 Aug 2023 |
1304 |
Explosion. |
| 21 Aug 2023 |
1224 |
Explosion generated gas-and-steam plumes rose 500-600 m. |
| 22 Aug 2023 |
0749 |
Explosion generated gas-and-steam plumes rose 500-600 m. |
| 24 Aug 2023 |
1900 |
Explosion. |
| 25 Aug 2023 |
0828 |
Event produced a steam-and-gas plume that rose 3 km and drifted NW. |
| 27-28 Aug 2023 |
0813 |
Four small events; the event at 0813 on 28 August lasted two minutes and generated a steam-and-gas plume that rose 2.5 km. |
| 1 Sep 2023 |
1526 |
Explosion generated plume that rose 2 km and ejected material onto the flanks. |
| 2-3 Sep 2023 |
- |
Small explosions detected in infrasound data. |
| 4 Sep 2023 |
1251 |
Gas-and-steam plume rose 1 km and drifted W. |
| 7 Nov 2023 |
1113 |
Explosion. |
| 8 Nov 2023 |
0722 |
Explosion. |
| 12 Nov 2023 |
0136 |
Small gas emissions. |
| 14 Nov 2023 |
0415 |
Small gas emissions. |
According to OVSICORI-UNA, during July-October the average weekly sulfur dioxide (SO2) flux ranged from 68 to 240 tonnes/day. However, in mid-November the flux increased to as high as 334 tonnes/day, the highest value measured in recent years. The high SO2 flux in mid-November was also detected by the TROPOMI instrument on the Sentinel-5P satellite (figure 43).
Geologic Background. Rincón de la Vieja, the largest volcano in NW Costa Rica, is a remote volcanic complex in the Guanacaste Range. The volcano consists of an elongated, arcuate NW-SE-trending ridge constructed within the 15-km-wide early Pleistocene Guachipelín caldera, whose rim is exposed on the south side. Sometimes known as the "Colossus of Guanacaste," it has an estimated volume of 130 km3 and contains at least nine major eruptive centers. Activity has migrated to the SE, where the youngest-looking craters are located. The twin cone of Santa María volcano, the highest peak of the complex, is located at the eastern end of a smaller, 5-km-wide caldera and has a 500-m-wide crater. A Plinian eruption producing the 0.25 km3 Río Blanca tephra about 3,500 years ago was the last major magmatic eruption. All subsequent eruptions, including numerous historical eruptions possibly dating back to the 16th century, have been from the prominent active crater containing a 500-m-wide acid lake located ENE of Von Seebach crater.
Information Contacts: Observatorio Vulcanológico Sismológica de Costa Rica-Universidad Nacional (OVSICORI-UNA), Apartado 86-3000, Heredia, Costa Rica (URL: http://www.ovsicori.una.ac.cr/); NASA Global Sulfur Dioxide Monitoring Page, Atmospheric Chemistry and Dynamics Laboratory, NASA Goddard Space Flight Center (NASA/GSFC), 8800 Greenbelt Road, Goddard MD 20771, USA (URL: https://so2.gsfc.nasa.gov/).
Bezymianny (Russia) — November 2023 Cite this Report
Bezymianny
Russia
55.972°N, 160.595°E; summit elev. 2882 m
All times are local (unless otherwise noted)
Explosion on 18 October 2023 sends ash plume 8 km high; lava flows and incandescent avalanches
Bezymianny, located on Russia’s Kamchatka Peninsula, has had eruptions since 1955 characterized by dome growth, explosions, pyroclastic flows, ash plumes, and ashfall. Activity during November 2022-April 2023 included gas-and-steam emissions, lava dome collapses generating avalanches, and persistent thermal activity. Similar eruptive activity continued from May through October 2023, described here based on information from weekly and daily reports of the Kamchatka Volcano Eruptions Response Team (KVERT), notices from Tokyo VAAC (Volcanic Ash Advisory Center), and from satellite data.
Overall activity decreased after the strong period of activity in late March through April 2023, which included ash explosions during 29 March and 7-8 April 2023 that sent plumes as high as 10-12 km altitude, along with dome growth and lava flows (BGVN 48:05). This reduced activity can be seen in the MIROVA thermal detection system graph (figure 56), which was consistent with data from the MODVOLC thermal detection system and with Sentinel-2 satellite images that showed persistent hotspots in the summit crater when conditions allowed observations. A renewed period of strong activity began in mid-October 2023.
Activity increased significantly on 17 October 2023 when large collapses began during 0700-0830 on the E flanks of the lava dome and continued to after 0930 the next day (figure 57). Ash plumes rose to an altitude of 4.5-5 km, extending 220 km NNE by 18 October. A large explosion at 1630 on 18 October produced an ash plume that rose to an altitude of 11 km (8 km above the summit) and drifted NNE and then NW, extending 900 km NW within two days at an altitude of 8 km. Minor ashfall was noted in Kozyrevsk (45 km WNW). At 0820 on 20 October an ash plume was identified in satellite images drifting 100 km ENE at altitudes of 4-4.5 km.
Lava flows and hot avalanches from the dome down the SE flank continued over the next few days, including 23 October when clear conditions allowed good observations (figures 58 and 59). A large thermal anomaly was observed over the volcano through 24 October, and in the summit crater on 30 October (figure 60). Strong fumarolic activity continued, with numerous avalanches and occasional incandescence. By the last week of October, volcanic activity had decreased to a level consistent with that earlier in the reporting period.
Aviation warnings were frequently updated during 17-20 October. KVERT issued a Volcano Observatory Notice for Aviation (VONA) on 17 October at 1419 and 1727 (0219 and 0527 UTC) raising the Aviation Color Code (ACC) from Yellow to Orange (second highest level). The next day, KVERT issued a VONA at 1705 (0505 UTC) raising the ACC to Red (highest level) but lowered it back to Orange at 2117 (0917 UTC). After another decrease to Yellow and back to Orange, the ACC was reduced to Yellow on 20 October at 1204 (0004 UTC). In addition, the Tokyo VAAC issued a series of Volcanic Ash Advisories beginning on 16 October and continuing through 30 October.
Geologic Background. The modern Bezymianny, much smaller than its massive neighbors Kamen and Kliuchevskoi on the Kamchatka Peninsula, was formed about 4,700 years ago over a late-Pleistocene lava-dome complex and an edifice built about 11,000-7,000 years ago. Three periods of intensified activity have occurred during the past 3,000 years. The latest period, which was preceded by a 1,000-year quiescence, began with the dramatic 1955-56 eruption. This eruption, similar to that of St. Helens in 1980, produced a large open crater that was formed by collapse of the summit and an associated lateral blast. Subsequent episodic but ongoing lava-dome growth, accompanied by intermittent explosive activity and pyroclastic flows, has largely filled the 1956 crater.
Information Contacts: Kamchatka Volcanic Eruptions Response Team (KVERT), Far Eastern Branch, Russian Academy of Sciences, 9 Piip Blvd., Petropavlovsk-Kamchatsky, 683006, Russia (URL: http://www.kscnet.ru/ivs/kvert/); Kamchatka Volcanological Station, Kamchatka Branch of Geophysical Survey, (KB GS RAS), Klyuchi, Kamchatka Krai, Russia (URL: http://volkstat.ru/); Tokyo Volcanic Ash Advisory Center (VAAC), 1-3-4 Otemachi, Chiyoda-ku, Tokyo 100-8122, Japan (URL: http://ds.data.jma.go.jp/svd/vaac/data/); Hawai'i Institute of Geophysics and Planetology (HIGP) - MODVOLC Thermal Alerts System, School of Ocean and Earth Science and Technology (SOEST), Univ. of Hawai'i, 2525 Correa Road, Honolulu, HI 96822, USA (URL: http://modis.higp.hawaii.edu/); MIROVA (Middle InfraRed Observation of Volcanic Activity), a collaborative project between the Universities of Turin and Florence (Italy) supported by the Centre for Volcanic Risk of the Italian Civil Protection Department (URL: http://www.mirovaweb.it/); Copernicus Browser, Copernicus Data Space Ecosystem, European Space Agency (URL: https://dataspace.copernicus.eu/browser/).chr
Kilauea (United States) — January 2023 Cite this Report
Kilauea
United States
19.421°N, 155.287°W; summit elev. 1222 m
All times are local (unless otherwise noted)
Low-level lava effusions in the lava lake at Halema’uma’u during July-December 2022
Kīlauea is the southeastern-most volcano in Hawaii and overlaps the E flank of the Mauna Loa volcano. Its East Rift Zone (ERZ) has been intermittently active for at least 2,000 years. An extended eruption period began in January 1983 and was characterized by open lava lakes and lava flows from the summit caldera and the East Rift Zone. During May 2018 magma migrated into the Lower East Rift Zone (LERZ) and opened 24 fissures along a 6-km-long NE-trending fracture zone that produced lava flows traveling in multiple directions. As lava emerged from the fissures, the lava lake at Halema'uma'u drained and explosions sent ash plumes to several kilometers altitude (BGVN 43:10).
The current eruption period started during September 2021 and has recently been characterized by lava effusions, spatter, and sulfur dioxide emissions in the active Halema’uma’u lava lake (BGVN 47:08). Lava effusions, some spatter, and sulfur dioxide emissions have continued during this reporting period of July through December 2022 using daily reports, volcanic activity notices, and abundant photo, map, and video data from the US Geological Survey's (USGS) Hawaiian Volcano Observatory (HVO).
Summary of activity during July-December 2022. Low-level effusions have continued at the western vent of the Halema’uma’u crater during July through early December 2022. Occasional weak ooze-outs (also called lava break outs) would occur along the margins of the crater floor. The overall level of the active lava lake throughout the reporting period gradually increased due to infilling, however it stagnated in mid-September (table 13). During September through November, activity began to decline, though lava effusions persisted at the western vent. By 9 December, the active part of the lava lake had completely crusted over, and incandescence was no longer visible.
Table 13. Summary of measurements taken during overflights at Kīlauea that show a gradual increase in the active lava lake level and the volume of lava effused since 29 September 2021. Lower activity was reported during September-October. Data collected during July-December 2022. Courtesy of HVO.
| Date: |
Level of the active lava lake (m): |
Cumulative volume of lava effused (million cubic meters): |
| 7 Jul 2022 |
130 |
95 |
| 19 Jul 2022 |
133 |
98 |
| 4 Aug 2022 |
136 |
102 |
| 16 Aug 2022 |
137 |
104 |
| 12 Sep 2022 |
143 |
111 |
| 5 Oct 2022 |
143 |
111 |
| 28 Oct 2022 |
143 |
111 |
Activity during July 2022. Lava effusions were reported from the western vent in the Halema’uma’u crater, along with occasional weak ooze-outs along the margins of the crater floor. The height of the lava lake was variable due to deflation-inflation tilt events; for example, the lake level dropped approximately 3-4 m during a summit deflation-inflation event reported on 1 July. Webcam images taken during the night of 6-12 July showed intermittent low-level spattering at the western vent that rose less than 10 m above the vent (figure 519). Measurements made during an overflight on 7 July indicated that the crater floor was infilled about 130 m and that 95 million cubic meters of lava had been effused since 29 September 2021. A single, relatively small lava ooze-out was active to the S of the lava lake. Around midnight on 8 July there were two brief periods of lava overflow onto the lake margins. On 9 July lava ooze-outs were reported near the SE and NE edges of the crater floor and during 10-11 July they occurred near the E, NE, and NW edges. On 16 July crater incandescence was reported, though the ooze-outs and spattering were not visible. On 18 July overnight webcam images showed incandescence in the western vent complex and two ooze-outs were reported around 0000 and 0200 on 19 July. By 0900 there were active ooze-outs along the SW edge of the crater floor. Measurements made from an overflight on 19 July indicated that the crater floor was infilled about 133 m and 98 million cubic meters of lava had erupted since 29 September 2021 (figure 520). On 20 July around 1600 active ooze-outs were visible along the N edge of the crater, which continued through the next day. Extensive ooze-outs occurred along the W margin during 24 July until 1900; on 26 July minor ooze-outs were noted along the N margin. Minor spattering was visible on 29 July along the E margin of the lake. The sulfur dioxide emission rates ranged 650-2,800 tons per day (t/d), the higher of which was measured on 8 July (figure 519).
Activity during August 2022. The eruption continued in the Halema’uma’u crater at the western vent. According to HVO the lava in the active lake remained at the level of the bounding levees. Occasional minor ooze-outs were observed along the margins of the crater floor. Strong nighttime crater incandescence was visible after midnight on 6 August over the western vent cone. During 6-7 August scattered small lava lobes were active along the crater floor and incandescence persisted above the western vent through 9 August. During 7-9 August HVO reported a single lava effusion source was active along the NW margin of the crater floor. Measurements from an overflight on 4 August indicated that the crater floor was infilled about 136 m total and that 102 million cubic meters of lava had been erupted since the start of the eruption. Lava breakouts were reported along the N, NE, E, S, and W margins of the crater during 10-16 August. Another overflight survey conducted on 16 August indicated that the crater floor infilled about 137 m and 104 million cubic meters of lava had been erupted since September 2021. Measured sulfur dioxide emissions rates ranged 1,150-2,450 t/d, the higher of which occurred on 8 August.
Activity during September 2022. During September, lava effusion continued from the western vent into the active lava lake and onto the crater floor. Intermittent minor ooze-outs were reported through the month. A small ooze-out was visible on the W crater floor margin at 0220 on 2 September, which showed decreasing surface activity throughout the day, but remained active through 3 September. On 3 September around 1900 a lava outbreak occurred along the NW margin of the crater floor but had stopped by the evening of 4 September. Field crews monitoring the summit lava lake on 9 September observed spattering on the NE margin of the lake that rose no higher than 10 m, before falling back onto the lava lake crust (figure 521). Overflight measurements on 12 September indicated that the crater floor was infilled a total of 143 m and 111 million cubic meters of lava had been erupted since September 2021. Extensive breakouts in the W and N part of the crater floor were reported at 1600 on 20 September and continued into 26 September. The active part of the lava lake dropped by 10 m while other parts of the crater floor dropped by several meters. Summit tiltmeters recorded a summit seismic swarm of more than 80 earthquakes during 1500-1800 on 21 September, which occurred about 1.5 km below Halema’uma’u; a majority of these were less than Mw 2. By 22 September the active part of the lava lake was infilled about 2 m. On 23 September the western vent areas exhibited several small spatter cones with incandescent openings, along with weak, sporadic spattering (figure 522). The sulfur dioxide emission rate ranged from 930 t/d to 2,000 t/d, the higher of which was measured on 6 September.
Activity during October 2022. Activity during October declined slightly compared to previous months, though lava effusions persisted from the western vent into the active lava lake and onto the crater floor during October (figure 523). Slight variations in the lava lake were noted throughout the month. HVO reported that around 0600 on 3 October the level of the lava lake has lowered slightly. Overflight measurements taken on 5 October indicated that the crater floor was infilled a total of about 143 m and that 111 million cubic meters of lava had been effused since September 2021. During 6-7 October the lake gradually rose 0.5 m. Sulfur dioxide measurements made on 22 October had an emission rate of 700 t/d. Another overflight taken on 28 October showed that there was little to no change in the elevation of the crater floor: the crater floor was infilled a total of 143 m and 111 million cubic meters of lava had erupted since the start of the eruption.
Activity during November 2022. Activity remained low during November, though HVO reported that lava from the western vent continued to effuse into the active lava lake and onto the crater floor throughout the month. The rate of sulfur dioxide emissions during November ranged from 300-600 t/d, the higher amount of which occurred on 9 November.
Activity during December 2022. Similar low activity was reported during December, with lava effusing from the western vent into the active lava lake and onto the crater floor. During 4-5 December the active part of the lava lake was slightly variable in elevation and fluctuated within 1 m. On 9 December HVO reported that lava was no longer erupting from the western vent in the Halema’uma’u crater and that sulfur dioxide emissions had returned to near pre-eruption background levels; during 10-11 December, the lava lake had completely crusted over, and no incandescence was visible (figure 524). Time lapse camera images covering the 4-10 December showed that the crater floor showed weak deflation and no inflation. Some passive events of crustal overturning were reported during 14-15 December, which brought fresh incandescent lava to the lake surface. The sulfur dioxide emission rate was approximately 200 t/d on 14 December. A smaller overturn event on 17 December and another that occurred around 0000 and into the morning of 20 December were also detected. A small seismic swarm was later detected on 30 December.
Geologic Background. Kilauea overlaps the E flank of the massive Mauna Loa shield volcano in the island of Hawaii. Eruptions are prominent in Polynesian legends; written documentation since 1820 records frequent summit and flank lava flow eruptions interspersed with periods of long-term lava lake activity at Halemaumau crater in the summit caldera until 1924. The 3 x 5 km caldera was formed in several stages about 1,500 years ago and during the 18th century; eruptions have also originated from the lengthy East and Southwest rift zones, which extend to the ocean in both directions. About 90% of the surface of the basaltic shield volcano is formed of lava flows less than about 1,100 years old; 70% of the surface is younger than 600 years. The long-term eruption from the East rift zone between 1983 and 2018 produced lava flows covering more than 100 km2, destroyed hundreds of houses, and added new coastline.
Information Contacts: Hawaiian Volcano Observatory (HVO), U.S. Geological Survey, PO Box 51, Hawai'i National Park, HI 96718, USA (URL: http://hvo.wr.usgs.gov/).
Nyamulagira (DR Congo) — November 2023 Cite this Report
Nyamulagira
DR Congo
1.408°S, 29.2°E; summit elev. 3058 m
All times are local (unless otherwise noted)
Lava flows and thermal activity during May-October 2023
Nyamulagira (also known as Nyamuragira) is a shield volcano in the Democratic Republic of Congo with the summit truncated by a small 2 x 2.3 km caldera with walls up to about 100 m high. Documented eruptions have occurred within the summit caldera, as well as from numerous flank fissures and cinder cones. The current eruption period began in April 2018 and has more recently been characterized by summit crater lava flows and thermal activity (BGVN 48:05). This report describes lava flows and variable thermal activity during May through October 2023, based on information from the Observatoire Volcanologique de Goma (OVG) and various satellite data.
Lava lake activity continued during May. The MIROVA (Middle InfraRed Observation of Volcanic Activity) system recorded moderate-to-strong thermal activity throughout the reporting period; activity was more intense during May and October and relatively weaker from June through September (figure 95). The MODVOLC thermal algorithm, detected a total of 209 thermal alerts. There were 143 hotspots detected during May, eight during June, nine during September, and 49 during October. This activity was also reflected in infrared satellite images, where a lava flow was visible in the NW part of the crater on 7 May and strong activity was seen in the center of the crater on 4 October (figure 96). Another infrared satellite image taken on 12 May showed still active lava flows along the NW margin of the crater. According to OVG lava effusions were active during 7-29 May and moved to the N and NW parts of the crater beginning on 9 May. Strong summit crater incandescence was visible from Goma (27 km S) during the nights of 17, 19, and 20 May (figure 97). On 17 May there was an increase in eruptive activity, which peaked at 0100 on 20 May. Notable sulfur dioxide plumes drifted NW and W during 19-20 May (figure 98). Drone footage acquired in partnership with the USGS (United States Geological Survey) on 20 May captured images of narrow lava flows that traveled about 100 m down the W flank (figure 99). Data from the Rumangabo seismic station indicated a decreasing trend in activity during 17-21 May. Although weather clouds prevented clear views of the summit, a strong thermal signature on the NW flank was visible in an infrared satellite image on 22 May, based on an infrared satellite image. On 28 May the lava flows on the upper W flank began to cool and solidify. By 29 May seismicity returned to levels similar to those recorded before the 17 May increase. Lava effusion continued but was confined to the summit crater; periodic crater incandescence was observed.
Low-level activity was noted during June through October. On 1 June OVG reported that seismicity remained at lower levels and that crater incandescence had been absent for three days, though infrared satellite imagery showed continued lava effusion in the summit crater. The lava flows on the flanks covered an estimated 0.6 km2. Satellite imagery continued to show thermal activity confined to the lava lake through October (figure 96), although no lava flows or significant sulfur dioxide emissions were reported.
Geologic Background. Africa's most active volcano, Nyamulagira (also known as Nyamuragira), is a massive high-potassium basaltic shield about 25 km N of Lake Kivu and 13 km NNW of the steep-sided Nyiragongo volcano. The summit is truncated by a small 2 x 2.3 km caldera that has walls up to about 100 m high. Documented eruptions have occurred within the summit caldera, as well as from the numerous flank fissures and cinder cones. A lava lake in the summit crater, active since at least 1921, drained in 1938, at the time of a major flank eruption. Recent lava flows extend down the flanks more than 30 km from the summit as far as Lake Kivu; extensive lava flows from this volcano have covered 1,500 km2 of the western branch of the East African Rift.
Information Contacts: Observatoire Volcanologique de Goma (OVG), Departement de Geophysique, Centre de Recherche en Sciences Naturelles, Lwiro, D.S. Bukavu, DR Congo; Hawai'i Institute of Geophysics and Planetology (HIGP) - MODVOLC Thermal Alerts System, School of Ocean and Earth Science and Technology (SOEST), Univ. of Hawai'i, 2525 Correa Road, Honolulu, HI 96822, USA (URL: http://modis.higp.hawaii.edu/); MIROVA (Middle InfraRed Observation of Volcanic Activity), a collaborative project between the Universities of Turin and Florence (Italy) supported by the Centre for Volcanic Risk of the Italian Civil Protection Department (URL: http://www.mirovaweb.it/); NASA Global Sulfur Dioxide Monitoring Page, Atmospheric Chemistry and Dynamics Laboratory, NASA Goddard Space Flight Center (NASA/GSFC), 8800 Greenbelt Road, Goddard, Maryland, USA (URL: https://so2.gsfc.nasa.gov/); Copernicus Browser, Copernicus Data Space Ecosystem, European Space Agency (URL: https://dataspace.copernicus.eu/browser/); Charles Balagizi, Goma Volcano Observatory, Departement de Geophysique, Centre de Recherche en Sciences Naturelles, Lwiro, D.S. Bukavu, DR Congo.
Bagana (Papua New Guinea) — October 2023 Cite this Report
Bagana
Papua New Guinea
6.137°S, 155.196°E; summit elev. 1855 m
All times are local (unless otherwise noted)
Explosions, ash plumes, ashfall, and lava flows during April-September 2023
The remote volcano of Bagana is located in central Bougainville Island, Papua New Guinea. Recorded eruptions date back to 1842 and activity has consisted of effusive activity that has built a small lava dome in the summit crater and occasional explosions that produced pyroclastic flows. The most recent eruption has been ongoing since February 2000 and has produced occasional explosions, ash plumes, and lava flows. More recently, activity has been characterized by ongoing effusive activity and ash emissions (BGVN 48:04). This report updates activity from April through September 2023 that has consisted of explosions, ash plumes, ashfall, and lava flows, using information from the Darwin Volcanic Ash Advisory Center (VAAC) and satellite data.
An explosive eruption was reported on 7 July that generated a large gas-and-ash plume to high altitudes and caused significant ashfall in local communities; the eruption plume had reached upper tropospheric (16-18 km altitude) altitudes by 2200, according to satellite images. Sulfur dioxide plumes were detected in satellite images on 8 July and indicated that the plume was likely a mixture of gas, ice, and ash. A report issued by the Autonomous Bougainville Government (ABG) (Torokina District, Education Section) on 10 July noted that significant ash began falling during 2000-2100 on 7 July and covered most areas in the Vuakovi, Gotana (9 km SW), Koromaketo, Laruma (25 km W) and Atsilima (27 km NW) villages. Pyroclastic flows also occurred, according to ground-based reports; small deposits confined to one drainage were inspected by RVO during an overflight on 17 July and were confirmed to be from the 7 July event. Ashfall continued until 10 July and covered vegetation, which destroyed bushes and gardens and contaminated rivers and streams.
RVO reported another eruption on 14 July. The Darwin VAAC stated that an explosive event started around 0830 on 15 July and produced an ash plume that rose to 16.5 km altitude by 1000 and drifted N, according to satellite images. The plume continued to drift N and remained visible through 1900, and by 2150 it had dissipated.
Ashfall likely from both the 7 and 15 July events impacted about 8,111 people in Torokina (20 km SW), including Tsito/Vuakovi, Gotana, Koromaketo, Kenaia, Longkogari, Kenbaki, Piva (13 km SW), and Atsinima, and in the Tsitovi district, according to ABG. Significant ashfall was also reported in Ruruvu (22 km N) in the Wakunai District of Central Bougainville, though the thickness of these deposits could not be confirmed. An evacuation was called for the villages in Wakunai, where heavy ashfall had contaminated water sources; the communities of Ruruvu, Togarau, Kakarapaia, Karauturi, Atao, and Kuritaturi were asked to evacuate to a disaster center at the Wakunai District Station, and communities in Torokina were asked to evacuate to the Piva District station. According to a news article, more than 7,000 people needed temporary accommodations, with about 1,000 people in evacuation shelters. Ashfall had deposited over a broad area, contaminating water supplies, affecting crops, and collapsing some roofs and houses in rural areas. Schools were temporarily shut down. Intermittent ash emissions continued through the end of July and drifted NNW, NW, and SW. Fine ashfall was reported on the coast of Torokina, and ash plumes also drifted toward Laruma and Atsilima.
A small explosive eruption occurred at 2130 on 28 July that ejected material from the crater vents, according to reports from Torokina, in addition to a lava flow that contained two lobes. A second explosion was detected at 2157. Incandescence from the lava flow was visible from Piva as it descended the W flank around 2000 on 29 July (figure 47). The Darwin VAAC reported that a strong thermal anomaly was visible in satellite images during 30-31 July and that ash emissions rose to 2.4 km altitude and drifted WSW on 30 July. A ground report from RVO described localized emissions at 0900 on 31 July.
The Darwin VAAC reported that ash plumes were identified in satellite imagery at 0800 and 1220 on 12 August and rose to 2.1 km and 3 km altitude and drifted NW and W, respectively. A news report stated that aid was sent to more than 6,300 people that were adversely affected by the eruption. Photos taken during 17-19 August showed ash emissions rising no higher than 1 km above the summit and drifting SE. A small explosion generated an ash plume during the morning of 19 August. Deposits from small pyroclastic flows were also captured in the photos. Satellite images captured lava flows and pyroclastic flow deposits. Two temporary seismic stations were installed near Bagana on 17 August at distances of 7 km WSW (Vakovi station) and 11 km SW (Kepox station). The Kepox station immediately started to record continuous, low-frequency background seismicity.
Satellite data. Little to no thermal activity was detected during April through mid-July 2023; only one anomaly was recorded during early April and one during early June, according to MIROVA (Middle InfraRed Observation of Volcanic Activity) data (figure 48). Thermal activity increased in both power and frequency during mid-July through September, although there were still some short gaps in detected activity. MODVOLC also detected increased thermal activity during August; thermal hotspots were detected a total of five times on 19, 20, and 27 August. Weak thermal anomalies were also captured in infrared satellite images on clear weather days throughout the reporting period on 7, 12, and 17 April, 27 May, 1, 6, 16, and 31 July, and 19 September (figure 48); a strong thermal anomaly was visible on 31 July. Distinct sulfur dioxide plumes that drifted generally NW were intermittently captured by the TROPOMI instrument on the Sentinel-5P satellite and sometimes exceeded two Dobson Units (DUs) (figure 49).
Geologic Background. Bagana volcano, in a remote portion of central Bougainville Island, is frequently active. This massive symmetrical cone was largely constructed by an accumulation of viscous andesitic lava flows. The entire edifice could have been constructed in about 300 years at its present rate of lava production. Eruptive activity is characterized by non-explosive effusion of viscous lava that maintains a small lava dome in the summit crater, although occasional explosive activity produces pyroclastic flows. Lava flows with tongue-shaped lobes up to 50 m thick and prominent levees descend the flanks on all sides.
Information Contacts: Rabaul Volcano Observatory (RVO), Geohazards Management Division, Department of Mineral Policy and Geohazards Management (DMPGM), PO Box 3386, Kokopo, East New Britain Province, Papua New Guinea; Darwin Volcanic Ash Advisory Centre (VAAC), Bureau of Meteorology, Northern Territory Regional Office, PO Box 40050, Casuarina, NT 0811, Australia (URL: http://www.bom.gov.au/info/vaac/); MIROVA (Middle InfraRed Observation of Volcanic Activity), a collaborative project between the Universities of Turin and Florence (Italy) supported by the Centre for Volcanic Risk of the Italian Civil Protection Department (URL: http://www.mirovaweb.it/); Hawai'i Institute of Geophysics and Planetology (HIGP) - MODVOLC Thermal Alerts System, School of Ocean and Earth Science and Technology (SOEST), Univ. of Hawai'i, 2525 Correa Road, Honolulu, HI 96822, USA (URL: http://modis.higp.hawaii.edu/); NASA Global Sulfur Dioxide Monitoring Page, Atmospheric Chemistry and Dynamics Laboratory, NASA Goddard Space Flight Center (NASA/GSFC), 8800 Greenbelt Road, Goddard, Maryland, USA (URL: https://so2.gsfc.nasa.gov/); Copernicus Browser, Copernicus Data Space Ecosystem, European Space Agency (URL: https://dataspace.copernicus.eu/browser/); Autonomous Bougainville Government, P.O Box 322, Buka, AROB, PNG (URL: https://abg.gov.pg/); Andrew Tupper (Twitter: @andrewcraigtupp); Simon Carn, Geological and Mining Engineering and Sciences, Michigan Technological University, 1400 Townsend Drive, Houghton, MI 49931, USA (URL: http://www.volcarno.com/, Twitter: @simoncarn); Radio NZ (URL: https://www.rnz.co.nz/news/pacific/494464/more-than-7-000-people-in-bougainville-need-temporary-accommodation-after-eruption); USAID, 1300 Pennsylvania Ave, NW, Washington DC 20004, USA (URL: https://www.usaid.gov/pacific-islands/press-releases/aug-08-2023-united-states-provides-immediate-emergency-assistance-support-communities-affected-mount-bagana-volcanic-eruptions).
Mayon (Philippines) — October 2023 Cite this Report
Mayon
Philippines
13.257°N, 123.685°E; summit elev. 2462 m
All times are local (unless otherwise noted)
Lava flows, pyroclastic flows, ash emissions, and seismicity during April-September 2023
Mayon is located in the Philippines and has steep upper slopes capped by a small summit crater. Historical eruptions date back to 1616 CE that have been characterized by Strombolian eruptions, lava flows, pyroclastic flows, and mudflows. Eruptions mostly originated from a central conduit. Pyroclastic flows and mudflows have commonly descended many of the approximately 40 drainages that surround the volcano. The most recent eruption occurred during June through October 2022 and consisted of lava dome growth and gas-and-steam emissions (BGVN 47:12). A new eruption was reported during late April 2023 and has included lava flows, pyroclastic density currents, ash emissions, and seismicity. This report covers activity during April through September 2023 based on daily bulletins from the Philippine Institute of Volcanology and Seismology (PHIVOLCS).
During April through September 2023, PHIVOLCS reported near-daily rockfall events, frequent volcanic earthquakes, and sulfur dioxide measurements. Gas-and-steam emissions rose 100-900 m above the crater and drifted in different directions. Nighttime crater incandescence was often visible during clear weather and was accompanied by incandescent avalanches of material. Activity notably increased during June when lava flows were reported on the S, SE, and E flanks (figure 52). The MIROVA graph (Middle InfraRed Observation of Volcanic Activity) showed strong thermal activity coincident with these lava flows, which remained active through September (figure 53). According to the MODVOLC thermal algorithm, a total of 110 thermal alerts were detected during the reporting period: 17 during June, 40 during July, 27 during August, and 26 during September. During early June, pyroclastic density currents (PDCs) started to occur more frequently.
Low activity was reported during much of April and May; gas-and-steam emissions rose 100-900 m above the crater and generally drifted in different directions. A total of 52 rockfall events and 18 volcanic earthquakes were detected during April and 147 rockfall events and 13 volcanic events during May. Sulfur dioxide flux measurements ranged between 400-576 tons per day (t/d) during April, the latter of which was measured on 29 April and between 162-343 t/d during May, the latter of which was measured on 13 May.
Activity during June increased, characterized by lava flows, pyroclastic density currents (PDCs), crater incandescence and incandescent rockfall events, gas-and-steam emissions, and continued seismicity. Weather clouds often prevented clear views of the summit, but during clear days, moderate gas-and-steam emissions rose 100-2,500 m above the crater and drifted in multiple directions. A total of 6,237 rockfall events and 288 volcanic earthquakes were detected. The rockfall events often deposited material on the S and SE flanks within 700-1,500 m of the summit crater and ash from the events drifted SW, S, SE, NE, and E. Sulfur dioxide emissions ranged between 149-1,205 t/d, the latter of which was measured on 10 June. Short-term observations from EDM and electronic tiltmeter monitoring indicated that the upper slopes were inflating since February 2023. Longer-term ground deformation parameters based on EDM, precise leveling, continuous GPS, and electronic tilt monitoring indicated that the volcano remained inflated, especially on the NW and SE flanks. At 1000 on 5 June the Volcano Alert Level (VAL) was raised to 2 (on a 0-5 scale). PHIVOLCS noted that although low-level volcanic earthquakes, ground deformation, and volcanic gas emissions indicated unrest, the steep increase in rockfall frequency may indicate increased dome activity.
A total of 151 dome-collapse PDCs occurred during 8-9 and 11-30 June, traveled 500-2,000 m, and deposited material on the S flank within 2 km of the summit crater. During 8-9 June the VAL was raised to 3. At approximately 1947 on 11 June lava flow activity was reported; two lobes traveled within 500 m from the crater and deposited material on the S (Mi-isi), SE (Bonga), and E (Basud) flanks. Weak seismicity accompanied the lava flow and slight inflation on the upper flanks. This lava flow remained active through 30 June, moving down the S and SE flank as far as 2.5 km and 1.8 km, respectively and depositing material up to 3.3 km from the crater. During 15-16 June traces of ashfall from the PDCs were reported in Sitio Buga, Nabonton, City of Ligao and Purok, and San Francisco, Municipality of Guinobatan. During 28-29 June there were two PDCs generated by the collapse of the lava flow front, which generated a light-brown ash plume 1 km high. Satellite monitors detected significant concentrations of sulfur dioxide beginning on 29 June. On 30 June PDCs primarily affected the Basud Gully on the E flank, the largest of which occurred at 1301 and lasted eight minutes, based on the seismic record. Four PDCs generated between 1800 and 2000 that lasted approximately four minutes each traveled 3-4 km on the E flank and generated an ash plume that rose 1 km above the crater and drifted N and NW. Ashfall was recorded in Tabaco City.
Similar strong activity continued during July; slow lava effusion remained active on the S and SE flanks and traveled as far as 2.8 km and 2.8 km, respectively and material was deposited as far as 4 km from the crater. There was a total of 6,983 rockfall events and 189 PDCs that affected the S, SE, and E flanks. The volcano network detected a total of 2,124 volcanic earthquakes. Continuous gas-and-steam emissions rose 200-2,000 m above the crater and drifted in multiple directions. Sulfur dioxide emissions averaged 792-4,113 t/d, the latter of which was measured on 28 July. During 2-4 July three PDCs were generated from the collapse of the lava flow and resulting light brown plumes rose 200-300 m above the crater. Continuous tremor pulses were reported beginning at 1547 on 3 July through 7 July at 1200, at 2300 on 8 July and going through 0300 on 10 July, and at 2300 on 16 July, as recorded by the seismic network. During 6-9 July there were 10 lava flow-collapse-related PDCs that generated light brown plumes 300-500 m above the crater. During 10-11 July light ashfall was reported in some areas of Mabinit, Legazpi City, Budiao and Salvacion, Daraga, and Camalig, Albay. By 18 July the lava flow advanced 600 m on the E flank as well.
During 1733 on 18 July and 0434 on 19 July PHIVOLCS reported 30 “ashing” events, which are degassing events accompanied by audible thunder-like sounds and entrained ash at the crater, which produced short, dark plumes that drifted SW. These events each lasted 20-40 seconds, and plume heights ranged from 150-300 m above the crater, as recorded by seismic, infrasound, visual, and thermal monitors. Three more ashing events occurred during 19-20 July. Short-term observations from electronic tilt and GPS monitoring indicate deflation on the E lower flanks in early July and inflation on the NW middle flanks during the third week of July. Longer-term ground deformation parameters from EDM, precise leveling, continuous GPS, and electronic tilt monitoring indicated that the volcano was still generally inflated relative to baseline levels. A short-lived lava pulse lasted 28 seconds at 1956 on 21 July, which was accompanied by seismic and infrasound signals. By 22 July, the only lava flow that remained active was on the SE flank, and continued to extend 3.4 km, while those on the S and E flanks weakened markedly. One ashing event was detected during 30-31 July, whereas there were 57 detected during 31 July-1 August; according to PHIVOLCS beginning at approximately 1800 on 31 July eruptive activity was dominated by phases of intermittent ashing, as well as increased in the apparent rates of lava effusion from the summit crater. The ashing phases consisted of discrete events recorded as low-frequency volcanic earthquakes (LFVQ) typically 30 seconds in duration, based on seismic and infrasound signals. Gray ash plume rose 100 m above the crater and generally drifted NE. Shortly after these ashing events began, new lava began to effuse rapidly from the crater, feeding the established flowed on the SE, E, and E flanks and generating frequent rockfall events.
Intensified unrest persisted during August. There was a total of 4,141 rockfall events, 2,881 volcanic earthquakes, which included volcanic tremor events, 32 ashing events, and 101 PDCs detected throughout the month. On clear weather days, gas-and-steam emissions rose 300-1,500 m above the crater and drifted in different directions (figure 54). Sulfur dioxide emissions averaged 735-4,756 t/d, the higher value of which was measured on 16 August. During 1-2 August the rate of lava effusion decreased, but continued to feed the flows on the SE, S, and E flanks, maintaining their advances to 3.4 km, 2.8 km, and 1.1 km from the crater, respectively (figure 55). Rockfall and PDCs generated by collapses at the lava flow margins and from the summit dome deposited material within 4 km of the crater. During 3-4 August there were 10 tremor events detected that lasted 1-4 minutes. Short-lived lava pulse lasted 35 seconds and was accompanied by seismic and infrasound signals at 0442 on 6 August. Seven collapses were recorded at the front of the lava flow during 12-14 August.
During September, similar activity of slow lava effusion, PDCs, gas-and-steam emissions, and seismicity continued. There was a total of 4,452 rockfall events, 329 volcanic earthquakes, which included volcanic tremor events, two ashing events, and 85 PDCs recorded throughout the month. On clear weather days, gas-and-steam emissions rose 100-1,500 m above the crater and drifted in multiple directions. Sulfur dioxide emissions averaged 609-2,252 t/d, the higher average of which was measured on 6 September. Slow lava effusion continued advancing on the SE, S, and E flanks, maintaining lengths of 3.4 km, 2.8 km, and 1.1 km, respectively. Rockfall and PDC events generated by collapses along the lava flow margins and at the summit dome deposited material within 4 km of the crater.
Geologic Background. Symmetrical Mayon, which rises above the Albay Gulf NW of Legazpi City, is the most active volcano of the Philippines. The steep upper slopes are capped by a small summit crater. Recorded eruptions since 1616 CE range from Strombolian to basaltic Plinian, with cyclical activity beginning with basaltic eruptions, followed by longer periods of andesitic lava flows. Eruptions occur predominately from the central conduit and have also produced lava flows that travel far down the flanks. Pyroclastic density currents and mudflows have commonly swept down many of the approximately 40 ravines that radiate from the summit and have often damaged populated lowland areas. A violent eruption in 1814 killed more than 1,200 people and devastated several towns.
Information Contacts: Philippine Institute of Volcanology and Seismology (PHIVOLCS), Department of Science and Technology, University of the Philippines Campus, Diliman, Quezon City, Philippines (URL: http://www.phivolcs.dost.gov.ph/); MIROVA (Middle InfraRed Observation of Volcanic Activity), a collaborative project between the Universities of Turin and Florence (Italy) supported by the Centre for Volcanic Risk of the Italian Civil Protection Department (URL: http://www.mirovaweb.it/); Hawai'i Institute of Geophysics and Planetology (HIGP) - MODVOLC Thermal Alerts System, School of Ocean and Earth Science and Technology (SOEST), Univ. of Hawai'i, 2525 Correa Road, Honolulu, HI 96822, USA (URL: http://modis.higp.hawaii.edu/); Copernicus Browser, Copernicus Data Space Ecosystem, European Space Agency (URL: https://dataspace.copernicus.eu/browser/); William Rogers, Legazpi City, Albay Province, Philippines.
Nishinoshima (Japan) — October 2023 Cite this Report
Nishinoshima
Japan
27.247°N, 140.874°E; summit elev. 100 m
All times are local (unless otherwise noted)
Eruption plumes and gas-and-steam plumes during May-August 2023
Nishinoshima, located about 1,000 km S of Tokyo, is a small island in the Ogasawara Arc in Japan. The island is the summit of a massive submarine volcano that has prominent submarine peaks to the S, W, and NE. Eruptions date back to 1973 and the current eruption period began in October 2022. Recent activity has consisted of small ash plumes and fumarolic activity (BGVN 48:07). This report covers activity during May through August 2023, using information from monthly reports of the Japan Meteorological Agency (JMA) monthly reports and satellite data.
Activity during May through June was relatively low. The Japan Coast Guard (JCG) did overflights on 14 and 22 June and reported white gas-and-steam emissions rising 600 m and 1,200 m from the central crater of the pyroclastic cone, respectively (figure 125). In addition, multiple white gas-and-steam emissions rose from the inner rim of the W side of the crater and from the SE flank of the pyroclastic cone. Discolored brown-to-green water was observed around almost the entire perimeter of the island; on 22 June light green discolored water was observed off the S coast of the island.
Observations from the Himawari meteorological satellite confirmed an eruption on 9 and 10 July. An eruption plume rose 1.6 km above the crater and drifted N around 1300 on 9 July. Satellite images acquired at 1420 and 2020 on 9 July and at 0220 on 10 July showed continuing emissions that rose 1.3-1.6 km above the crater and drifted NE and N. The Tokyo VAAC reported that an ash plume seen by a pilot and identified in a satellite image at 0630 on 21 July rose to 3 km altitude and drifted S.
Aerial observations conducted by JCG on 8 August showed a white-and-gray plume rising from the central crater of the pyroclastic cone, and multiple white gas-and-steam emissions were rising from the inner edge of the western crater and along the NW-SE flanks of the island (figure 126). Brown-to-green discolored water was also noted around the perimeter of the island.
Intermittent low-to-moderate power thermal anomalies were recorded in the MIROVA graph (Middle InfraRed Observation of Volcanic Activity), showing an increase in both frequency and power beginning in July (figure 127). This increase in activity coincides with eruptive activity on 9 and 10 July, characterized by eruption plumes. According to the MODVOLC thermal alert algorithm, one thermal hotspot was recorded on 20 July. Weak thermal anomalies were also detected in infrared satellite imagery, accompanied by strong gas-and-steam plumes (figure 128).
Geologic Background. The small island of Nishinoshima was enlarged when several new islands coalesced during an eruption in 1973-74. Multiple eruptions that began in 2013 completely covered the previous exposed surface and continued to enlarge the island. The island is the summit of a massive submarine volcano that has prominent peaks to the S, W, and NE. The summit of the southern cone rises to within 214 m of the ocean surface 9 km SSE.
Information Contacts: Japan Meteorological Agency (JMA), 1-3-4 Otemachi, Chiyoda-ku, Tokyo 100-8122, Japan (URL: http://www.jma.go.jp/jma/indexe.html); Tokyo Volcanic Ash Advisory Center (VAAC), 1-3-4 Otemachi, Chiyoda-ku, Tokyo 100-8122, Japan (URL: http://ds.data.jma.go.jp/svd/vaac/data/); MIROVA (Middle InfraRed Observation of Volcanic Activity), a collaborative project between the Universities of Turin and Florence (Italy) supported by the Centre for Volcanic Risk of the Italian Civil Protection Department (URL: http://www.mirovaweb.it/); Copernicus Browser, Copernicus Data Space Ecosystem, European Space Agency (URL: https://dataspace.copernicus.eu/browser/).
Krakatau (Indonesia) — October 2023 Cite this Report
Krakatau
Indonesia
6.1009°S, 105.4233°E; summit elev. 285 m
All times are local (unless otherwise noted)
White gas-and-steam plumes and occasional ash plumes during May-August 2023
Krakatau is located in the Sunda Strait between Java and Sumatra, Indonesia. Caldera collapse during the catastrophic 1883 eruption destroyed Danan and Perbuwatan cones and left only a remnant of Rakata. The post-collapse cone of Anak Krakatau (Child of Krakatau) was constructed within the 1883 caldera at a point between the former Danan and Perbuwatan cones; it has been the site of frequent eruptions since 1927. The current eruption period began in May 2021 and has recently consisted of Strombolian eruptions and ash plumes (BGVN 48:07). This report describes lower levels of activity consisting of ash and white gas-and-steam plumes during May through August 2023, based on information provided by the Indonesian Center for Volcanology and Geological Hazard Mitigation, referred to as Pusat Vulkanologi dan Mitigasi Bencana Geologi (PVMBG), MAGMA Indonesia, and satellite data.
Activity was relatively low during May and June. Daily white gas-and-steam emissions rose 25-200 m above the crater and drifted in different directions. Five ash plumes were detected at 0519 on 10 May, 1241 on 11 May, 0920 on 12 May, 2320 on 12 May, and at 0710 on 13 May, and rose 1-2.5 km above the crater and drifted SW. A webcam image taken on 12 May showed ejection of incandescent material above the vent. A total of nine ash plumes were detected during 6-11 June: at 1434 and 00220 on 6 and 7 June the ash plumes rose 500 m above the crater and drifted NW, at 1537 on 8 June the ash plume rose 1 km above the crater and drifted SW, at 0746 and at 0846 on 9 June the ash plumes rose 800 m and 3 km above the crater and drifted SW, respectively, at 0423, 1431, and 1750 on 10 June the ash plumes rose 2 km, 1.5 km, and 3.5 km above the crater and drifted NW, respectively, and at 0030 on 11 June an ash plume rose 2 km above the crater and drifted NW. Webcam images taken on 10 and 11 June at 0455 and 0102, respectively, showed incandescent material ejected above the vent. On 19 June an ash plume at 0822 rose 1.5 km above the crater and drifted SE.
Similar low activity of white gas-and-steam emissions and few ash plumes were reported during July and August. Daily white gas-and-steam emissions rose 25-300 m above the crater and drifted in multiple directions. Three ash plumes were reported at 0843, 0851, and 0852 on 20 July that rose 500-2,000 m above the crater and drifted NW.
The MIROVA (Middle InfraRed Observation of Volcanic Activity) graph of MODIS thermal anomaly data showed intermittent low-to-moderate power thermal anomalies during May through August 2023 (figure 140). Although activity was often obscured by weather clouds, a thermal anomaly was visible in an infrared satellite image of the crater on 12 May, accompanied by an eruption plume that drifted SW (figure 141).
Geologic Background. The renowned Krakatau (frequently mis-named as Krakatoa) volcano lies in the Sunda Strait between Java and Sumatra. Collapse of an older edifice, perhaps in 416 or 535 CE, formed a 7-km-wide caldera. Remnants of that volcano are preserved in Verlaten and Lang Islands; subsequently the Rakata, Danan, and Perbuwatan cones were formed, coalescing to create the pre-1883 Krakatau Island. Caldera collapse during the catastrophic 1883 eruption destroyed Danan and Perbuwatan, and left only a remnant of Rakata. This eruption caused more than 36,000 fatalities, most as a result of tsunamis that swept the adjacent coastlines of Sumatra and Java. Pyroclastic surges traveled 40 km across the Sunda Strait and reached the Sumatra coast. After a quiescence of less than a half century, the post-collapse cone of Anak Krakatau (Child of Krakatau) was constructed within the 1883 caldera at a point between the former Danan and Perbuwatan cones. Anak Krakatau has been the site of frequent eruptions since 1927.
Information Contacts: Pusat Vulkanologi dan Mitigasi Bencana Geologi (PVMBG, also known as Indonesian Center for Volcanology and Geological Hazard Mitigation, CVGHM), Jalan Diponegoro 57, Bandung 40122, Indonesia (URL: http://www.vsi.esdm.go.id/); MAGMA Indonesia, Kementerian Energi dan Sumber Daya Mineral (URL: https://magma.esdm.go.id/v1); MIROVA (Middle InfraRed Observation of Volcanic Activity), a collaborative project between the Universities of Turin and Florence (Italy) supported by the Centre for Volcanic Risk of the Italian Civil Protection Department (URL: http://www.mirovaweb.it/); Copernicus Browser, Copernicus Data Space Ecosystem, European Space Agency (URL: https://dataspace.copernicus.eu/browser/).
Villarrica (Chile) — October 2023 Cite this Report
Villarrica
Chile
39.42°S, 71.93°W; summit elev. 2847 m
All times are local (unless otherwise noted)
Strombolian activity, gas-and-ash emissions, and crater incandescence during April-September 2023
Villarrica, in central Chile, consists of a 2-km-wide caldera that formed about 3,500 years ago and is located at the base of the presently active cone at the NW margin of a 6-km-wide caldera. Historical eruptions eruptions date back to 1558 and have been characterized by mild-to-moderate explosive activity with occasional lava effusions. The current eruption period began in December 2014 and has recently consisted of nighttime crater incandescence, ash emissions, and seismicity (BGVN 48:04). This report covers activity during April through September 2023 and describes occasional Strombolian activity, gas-and-ash emissions, and nighttime crater incandescence. Information for this report primarily comes from the Southern Andes Volcano Observatory (Observatorio Volcanológico de Los Andes del Sur, OVDAS), part of Chile's National Service of Geology and Mining (Servicio Nacional de Geología y Minería, SERNAGEOMIN) and satellite data.
Seismicity during April consisted of long period (LP) events and tremor (TRE); a total of 9,413 LP-type events and 759 TR-type events were detected throughout the month. Nighttime crater incandescence persisted and was visible in the degassing column. Sulfur dioxide data was obtained using Differential Absorption Optical Spectroscopy Equipment (DOAS) that showed an average value of 1,450 ± 198 tons per day (t/d) during 1-15 April and 1,129 ± 201 t/d during 16-30 April, with a maximum daily value of 2,784 t/d on 9 April. Gas-and-steam emissions of variable intensities rose above the active crater as high as 1.3 km above the crater on 13 April. Strombolian explosions were not observed and there was a slight decrease in the lava lake level.
There were 14,123 LP-type events and 727 TR-type events detected during May. According to sulfur dioxide measurements taken with DOAS equipment, the active crater emitted an average value of 1,826 ± 482 t/d during 1-15 May and 912 ± 41 t/d during 16-30 May, with a daily maximum value of 5,155 t/d on 13 May. Surveillance cameras showed continuous white gas-and-steam emissions that rose as high as 430 m above the crater on 27 May. Nighttime incandescence illuminated the gas column less than 300 m above the crater rim was and no pyroclastic emissions were reported. A landslide was identified on 13 May on the E flank of the volcano 50 m from the crater rim and extending 300 m away; SERNAGEOMIN noted that this event may have occurred on 12 May. During the morning of 27 and 28 May minor Strombolian explosions characterized by incandescent ejecta were recorded at the crater rim; the last reported Strombolian explosions had occurred at the end of March.
Seismic activity during June consisted of five volcano-tectonic (VT)-type events, 21,606 LP-type events, and 2,085 TR-type events. The average value of sulfur dioxide flux obtained by DOAS equipment was 1,420 ± 217 t/d during 1-15 June and 2,562 ± 804 t/d, with a maximum daily value of 4,810 t/d on 17 June. White gas-and-steam emissions rose less than 480 m above the crater; frequent nighttime crater incandescence was reflected in the degassing plume. On 12 June an emission rose 100 m above the crater and drifted NNW. On 15 June one or several emissions resulted in ashfall to the NE as far as 5.5 km from the crater, based on a Skysat satellite image. Several Strombolian explosions occurred within the crater; activity on 15 June was higher energy and ejected blocks 200-300 m on the NE slope. Surveillance cameras showed white gas-and-steam emissions rising 480 m above the crater on 16 June. On 19 and 24 June low-intensity Strombolian activity was observed, ejecting material as far as 200 m from the center of the crater to the E.
During July, seismicity included 29,319 LP-type events, 3,736 TR-type events, and two VT-type events. DOAS equipment recorded two days of sulfur dioxide emissions of 4,220 t/d and 1,009 t/d on 1 and 13 July, respectively. Constant nighttime incandescence was also recorded and was particularly noticeable when accompanied by eruptive columns on 12 and 16 July. Minor explosive events were detected in the crater. According to Skysat satellite images taken on 12, 13, and 16 July, ashfall deposits were identified 155 m S of the crater. According to POVI, incandescence was visible from two vents on the crater floor around 0336 on 12 July. Gas-and-ash emissions rose as high as 1.2 km above the crater on 13 July and drifted E and NW. A series of gas-and-steam pulses containing some ash deposited material on the upper E flank around 1551 on 13 July. During 16-31 July, average sulfur dioxide emissions of 1,679 ± 406 t/d were recorded, with a maximum daily value of 2,343 t/d on 28 July. Fine ash emissions were also reported on 16, 17, and 23 July.
Seismicity persisted during August, characterized by 27,011 LP-type events, 3,323 TR-type events, and three VT-type events. The average value of sulfur dioxide measurements taken during 1-15 August was 1,642 ± 270 t/d and 2,207 ± 4,549 t/d during 16-31 August, with a maximum daily value of 3,294 t/d on 27 August. Nighttime crater incandescence remained visible in degassing columns. White gas-and-steam emissions rose 480 m above the crater on 6 August. According to a Skysat satellite image from 6 August, ash accumulation was observed proximal to the crater and was mainly distributed toward the E slope. White gas-and-steam emissions rose 320 m above the crater on 26 August. Nighttime incandescence and Strombolian activity that generated ash emissions were reported on 27 August.
Seismicity during September was characterized by five VT-type events, 12,057 LP-type events, and 2,058 TR-type events. Nighttime incandescence persisted. On 2 September an ash emission rose 180 m above the crater and drifted SE at 1643 (figure 125) and a white gas-and-steam plume rose 320 m above the crater. According to the Buenos Aires VAAC, periods of continuous gas-and-ash emissions were visible in webcam images from 1830 on 2 September to 0110 on 3 September. Strombolian activity was observed on 2 September and during the early morning of 3 September, the latter event of which generated an ash emission that rose 60 m above the crater and drifted 100 m from the center of the crater to the NE and SW. Ashfall was reported to the SE and S as far as 750 m from the crater. The lava lake was active during 3-4 September and lava fountaining was visible for the first time since 26 March 2023, according to POVI. Fountains captured in webcam images at 2133 on 3 September and at 0054 on 4 September rose as high as 60 m above the crater rim and ejected material onto the upper W flank. Sulfur dioxide flux of 1,730 t/d and 1,281 t/d was measured on 3 and 4 September, respectively, according to data obtained by DOAS equipment.
Strong Strombolian activity and larger gas-and-ash plumes were reported during 18-20 September. On 18 September activity was also associated with energetic LP-type events and notable sulfur dioxide fluxes (as high as 4,277 t/d). On 19 September Strombolian activity and incandescence were observed. On 20 September at 0914 ash emissions rose 50 m above the crater and drifted SSE, accompanied by Strombolian activity that ejected material less than 100 m SSE, causing fall deposits on that respective flank. SERNAGEOMIN reported that a Planet Scope satellite image taken on 20 September showed the lava lake in the crater, measuring 32 m x 35 m and an area of 0.001 km2. Several ash emissions were recorded at 0841, 0910, 1251, 1306, 1312, 1315, and 1324 on 23 September and rose less than 150 m above the crater. The sulfur dioxide flux value was 698 t/d on 23 September and 1,097 t/d on 24 September. On 24 September the Volcanic Alert Level (VAL) was raised to Orange (the third level on a four-color scale). SENAPRED maintained the Alert Level at Yellow (the middle level on a three-color scale) for the communities of Villarrica, Pucón (16 km N), Curarrehue, and Panguipulli.
During 24-25 September there was an increase in seismic energy (observed at TR-events) and acoustic signals, characterized by 1 VT-type event, 213 LP-type events, and 124 TR-type events. Mainly white gas-and-steam emissions, in addition to occasional fine ash emissions were recorded. During the early morning of 25 September Strombolian explosions were reported and ejected material 250 m in all directions, though dominantly toward the NW. On 25 September the average value of sulfur dioxide flux was 760 t/d. Seismicity during 25-30 September consisted of five VT-type events, 1,937 LP-type events, and 456 TR-type events.
During 25-29 September moderate Strombolian activity was observed and ejected material as far as the crater rim. In addition, ash pulses lasting roughly 50 minutes were observed around 0700 and dispersed ENE. During 26-27 September a TR episode lasted 6.5 hours and was accompanied by discrete acoustic signals. Satellite images from 26 September showed a spatter cone on the crater floor with one vent that measured 10 x 14 m and a smaller vent about 35 m NE of the cone. SERNAGEOMIN reported an abundant number of bomb-sized blocks up to 150 m from the crater, as well as impact marks on the snow, which indicated explosive activity. A low-altitude ash emission was observed drifting NW around 1140 on 28 September, based on webcam images. Between 0620 and 0850 on 29 September an ash emission rose 60 m above the crater and drifted NW. During an overflight taken around 1000 on 29 September scientists observed molten material in the vent, a large accumulation of pyroclasts inside the crater, and energetic degassing, some of which contained a small amount of ash. Block-sized pyroclasts were deposited on the internal walls and near the crater, and a distal ash deposit was also visible. The average sulfur dioxide flux measured on 28 September was 344 t/d. Satellite images taken on 29 September ashfall was deposited roughly 3 km WNW from the crater and nighttime crater incandescence remained visible. The average sulfur dioxide flux value from 29 September was 199 t/d. On 30 September at 0740 a pulsating ash emission rose 1.1 km above the crater and drifted NNW (figure 126). Deposits on the S flank extended as far as 4.5 km from the crater rim, based on satellite images from 30 September.
Infrared MODIS satellite data processed by MIROVA (Middle InfraRed Observation of Volcanic Activity) showed intermittent thermal activity during April through September, with slightly stronger activity detected during late September (figure 127). Small clusters of thermal activity were detected during mid-June, early July, early August, and late September. According to the MODVOLC thermal alert system, a total of four thermal hotspots were detected on 7 July and 3 and 23 September. This activity was also intermittently captured in infrared satellite imagery on clear weather days (figure 128).
Geologic Background. The glacier-covered Villarrica stratovolcano, in the northern Lakes District of central Chile, is ~15 km south of the city of Pucon. A 2-km-wide caldera that formed about 3,500 years ago is located at the base of the presently active, dominantly basaltic to basaltic andesite cone at the NW margin of a 6-km-wide Pleistocene caldera. More than 30 scoria cones and fissure vents are present on the flanks. Plinian eruptions and pyroclastic flows that have extended up to 20 km from the volcano were produced during the Holocene. Lava flows up to 18 km long have issued from summit and flank vents. Eruptions documented since 1558 CE have consisted largely of mild-to-moderate explosive activity with occasional lava effusion. Glaciers cover 40 km2 of the volcano, and lahars have damaged towns on its flanks.
Information Contacts: Servicio Nacional de Geología y Minería (SERNAGEOMIN), Observatorio Volcanológico de Los Andes del Sur (OVDAS), Avda Sta María No. 0104, Santiago, Chile (URL: http://www.sernageomin.cl/); Proyecto Observación Villarrica Internet (POVI) (URL: http://www.povi.cl/); Sistema y Servicio Nacional de Prevención y Repuesta Ante Desastres (SENAPRED), Av. Beauchef 1671, Santiago, Chile (URL: https://web.senapred.cl/); Buenos Aires Volcanic Ash Advisory Center (VAAC), Servicio Meteorológico Nacional-Fuerza Aérea Argentina, 25 de mayo 658, Buenos Aires, Argentina (URL: http://www.smn.gov.ar/vaac/buenosaires/inicio.php); MIROVA (Middle InfraRed Observation of Volcanic Activity), a collaborative project between the Universities of Turin and Florence (Italy) supported by the Centre for Volcanic Risk of the Italian Civil Protection Department (URL: http://www.mirovaweb.it/); Hawai'i Institute of Geophysics and Planetology (HIGP) - MODVOLC Thermal Alerts System, School of Ocean and Earth Science and Technology (SOEST), Univ. of Hawai'i, 2525 Correa Road, Honolulu, HI 96822, USA (URL: http://modis.higp.hawaii.edu/); Copernicus Browser, Copernicus Data Space Ecosystem, European Space Agency (URL: https://dataspace.copernicus.eu/browser/).
Merapi (Indonesia) — October 2023 Cite this Report
Merapi
Indonesia
7.54°S, 110.446°E; summit elev. 2910 m
All times are local (unless otherwise noted)
Frequent incandescent avalanches during April-September 2023
Merapi, located just north of the major city of Yogyakarta in central Java, Indonesia, has had activity within the last 20 years characterized by pyroclastic flows and lahars accompanying growth and collapse of the steep-sided active summit lava dome. The current eruption period began in late December 2020 and has more recently consisted of ash plumes, intermittent incandescent avalanches of material, and pyroclastic flows (BGVN 48:04). This report covers activity during April through September 2023, based on information from Balai Penyelidikan dan Pengembangan Teknologi Kebencanaan Geologi (BPPTKG), the Center for Research and Development of Geological Disaster Technology, a branch of PVMBG which specifically monitors Merapi. Additional information comes from the Pusat Vulkanologi dan Mitigasi Bencana Geologi (PVMBG, also known as Indonesian Center for Volcanology and Geological Hazard Mitigation, CVGHM), MAGMA Indonesia, the Darwin Volcanic Ash Advisory Centre (VAAC), and various satellite data.
Activity during April through September 2023 primarily consisted of incandescent avalanches of material that mainly affected the SW and W flanks and traveled as far as 2.3 km from the summit (table 25) and white gas-and-steam emissions that rose 10-1,000 m above the crater.
Table 25. Monthly summary of avalanches and avalanche distances recorded at Merapi during April through September 2023. The number of reported avalanches does not include instances where possible avalanches were heard but could not be visually confirmed as a result of inclement weather. Data courtesy of BPPTKG (April-September 2023 daily reports).
| Month |
Average number of avalanches per day |
Distance avalanches traveled (m) |
| Apr 2023 |
19 |
1,200-2,000 |
| May 2023 |
22 |
500-2,000 |
| Jun 2023 |
18 |
1,200-2,000 |
| Jul 2023 |
30 |
300-2,000 |
| Aug 2023 |
25 |
400-2,300 |
| Sep 2023 |
23 |
600-2,000 |
BPPTKG reported that during April and May white gas-and-steam emissions rose 10-750 m above the crater, incandescent avalanches descended 500-2,000 m on the SW and W flanks (figure 135). Cloudy weather often prevented clear views of the summit, and sometimes avalanches could not be confirmed. According to a webcam image, a pyroclastic flow was visible on 17 April at 0531. During the week of 28 April and 4 May a pyroclastic flow was reported on the SW flank, traveling up to 2.5 km. According to a drone overflight taken on 17 May the SW lava dome volume was an estimated 2,372,800 cubic meters and the dome in the main crater was an estimated 2,337,300 cubic meters.
During June and July similar activity persisted with white gas-and-steam emissions rising 10-350 m above the crater and frequent incandescent avalanches that traveled 300-2,000 m down the SW, W, and S flanks (figure 136). Based on an analysis of aerial photos taken on 24 June the volume of the SW lava dome was approximately 2.5 million cubic meters. A pyroclastic flow was observed on 5 July that traveled 2.7 km on the SW flank. According to the Darwin VAAC multiple minor ash plumes were identified in satellite images on 19 July that rose to 3.7 km altitude and drifted S and SW. During 22, 25, and 26 July a total of 17 avalanches descended as far as 1.8 km on the S flank.
Frequent white gas-and-steam emissions continued during August and September, rising 10-450 m above the crater. Incandescent avalanches mainly affected the SW and W flanks and traveled 400-2,300 m from the vent (figure 137). An aerial survey conducted on 10 August was analyzed and reported that estimates of the SW dome volume was 2,764,300 cubic meters and the dome in the main crater was 2,369,800 cubic meters.
Frequent and moderate-power thermal activity continued throughout the reporting period, according to a MIROVA (Middle InfraRed Observation of Volcanic Activity) analysis of MODIS satellite data (figure 138). There was an increase in the number of detected anomalies during mid-May. The MODVOLC thermal algorithm recorded a total of 47 thermal hotspots: six during April, nine during May, eight during June, 15 during July, four during August, and five during September. Some of this activity was captured in infrared satellite imagery on clear weather days, sometimes accompanied by incandescent material on the SW flank (figure 139).
Geologic Background. Merapi, one of Indonesia's most active volcanoes, lies in one of the world's most densely populated areas and dominates the landscape immediately north of the major city of Yogyakarta. It is the youngest and southernmost of a volcanic chain extending NNW to Ungaran volcano. Growth of Old Merapi during the Pleistocene ended with major edifice collapse perhaps about 2,000 years ago, leaving a large arcuate scarp cutting the eroded older Batulawang volcano. Subsequent growth of the steep-sided Young Merapi edifice, its upper part unvegetated due to frequent activity, began SW of the earlier collapse scarp. Pyroclastic flows and lahars accompanying growth and collapse of the steep-sided active summit lava dome have devastated cultivated lands on the western-to-southern flanks and caused many fatalities.
Information Contacts: Balai Penyelidikan dan Pengembangan Teknologi Kebencanaan Geologi (BPPTKG), Center for Research and Development of Geological Disaster Technology (URL: http://merapi.bgl.esdm.go.id/, Twitter: @BPPTKG); MAGMA Indonesia, Kementerian Energi dan Sumber Daya Mineral (URL: https://magma.esdm.go.id/v1); Pusat Vulkanologi dan Mitigasi Bencana Geologi (PVMBG, also known as Indonesian Center for Volcanology and Geological Hazard Mitigation, CVGHM), Jalan Diponegoro 57, Bandung 40122, Indonesia (URL: http://www.vsi.esdm.go.id/); Darwin Volcanic Ash Advisory Centre (VAAC), Bureau of Meteorology, Northern Territory Regional Office, PO Box 40050, Casuarina, NT 0811, Australia (URL: http://www.bom.gov.au/info/vaac/); MIROVA (Middle InfraRed Observation of Volcanic Activity), a collaborative project between the Universities of Turin and Florence (Italy) supported by the Centre for Volcanic Risk of the Italian Civil Protection Department (URL: http://www.mirovaweb.it/); Hawai'i Institute of Geophysics and Planetology (HIGP) - MODVOLC Thermal Alerts System, School of Ocean and Earth Science and Technology (SOEST), Univ. of Hawai'i, 2525 Correa Road, Honolulu, HI 96822, USA (URL: http://modis.higp.hawaii.edu/); Copernicus Browser, Copernicus Data Space Ecosystem, European Space Agency (URL: https://dataspace.copernicus.eu/browser/); Øystein Lund Andersen (URL: https://www.oysteinlundandersen.com/, https://twitter.com/oysteinvolcano).
Ebeko
Russia
50.686°N, 156.014°E; summit elev. 1103 m
All times are local (unless otherwise noted)
Moderate explosive activity with ash plumes continued during June-November 2023
Ebeko, located on the N end of Paramushir Island in Russia’s Kuril Islands just S of the Kamchatka Peninsula, consists of three summit craters along a SSW-NNE line at the northern end of a complex of five volcanic cones. Observed eruptions date back to the late 18th century and have been characterized as small-to-moderate explosions from the summit crater, accompanied by intense fumarolic activity. The current eruptive period began in June 2022, consisting of frequent explosions, ash plumes, and thermal activity (BGVN 47:10, 48:06). This report covers similar activity during June-November 2023, based on information from the Kamchatka Volcanic Eruptions Response Team (KVERT) and satellite data.
Moderate explosive activity continued during June-November 2023 (figures 50 and 51). According to visual data from Severo-Kurilsk, explosions sent ash 2-3.5 km above the summit (3-4.5 km altitude) during most days during June through mid-September. Activity after mid-September was slightly weaker, with ash usually reaching less than 2 km above the summit. According to KVERT the volcano in October and November was, with a few exceptions, either quiet or obscured by clouds that prevented satellite observations. KVERT issued Volcano Observatory Notices for Aviation (VONA) on 8 and 12 June, 13 and 22 July, 3 and 21 August, and 31 October warning of potential aviation hazards from ash plumes drifting 3-15 km from the volcano. Based on satellite data, KVERT reported a persistent thermal anomaly whenever weather clouds permitted viewing.
Geologic Background. The flat-topped summit of the central cone of Ebeko volcano, one of the most active in the Kuril Islands, occupies the northern end of Paramushir Island. Three summit craters located along a SSW-NNE line form Ebeko volcano proper, at the northern end of a complex of five volcanic cones. Blocky lava flows extend west from Ebeko and SE from the neighboring Nezametnyi cone. The eastern part of the southern crater contains strong solfataras and a large boiling spring. The central crater is filled by a lake about 20 m deep whose shores are lined with steaming solfataras; the northern crater lies across a narrow, low barrier from the central crater and contains a small, cold crescentic lake. Historical activity, recorded since the late-18th century, has been restricted to small-to-moderate explosive eruptions from the summit craters. Intense fumarolic activity occurs in the summit craters, on the outer flanks of the cone, and in lateral explosion craters.
Information Contacts: Kamchatka Volcanic Eruptions Response Team (KVERT), Far Eastern Branch, Russian Academy of Sciences, 9 Piip Blvd., Petropavlovsk-Kamchatsky, 683006, Russia (URL: http://www.kscnet.ru/ivs/kvert/).
Search Bulletin Archive by Publication Date
Select a month and year from the drop-downs and click "Show Issue" to have that issue displayed in this tab.
The default month and year is the latest issue available.
Bulletin of the Global Volcanism Network - Volume 17, Number 08 (August 1992)
Managing Editor: Lindsay McClelland
Aira (Japan)
Seismically recorded explosions halt briefly, but quiet ash emission continues
Arenal (Costa Rica)
Lava extrusion and explosive activity; small pyroclastic flows
Asosan (Japan)
Explosion ejects blocks
Eldey (Iceland)
Young lava flow identified from submersible
Erta Ale (Ethiopia)
Small lava fountains observed during overflight
Etna (Italy)
Increased lava emission from break in main tube
Galeras (Colombia)
Ash ejection; seismicity and SO2 emission decline
Irazu (Costa Rica)
Seismicity decreases; gas emission continues
Kilauea (United States)
Continued East-rift lava extrusion interrupted by brief pauses
Kozushima (Japan)
Weak seismic swarm; surface activity unchanged
Langila (Papua New Guinea)
Explosions and glow
Lengai, Ol Doinyo (Tanzania)
Carbonatite lava extrusion onto crater floor
Llaima (Chile)
Three summit-crater explosions; frequent seismicity
Manam (Papua New Guinea)
Strong explosions; lava flow; pyroclastic flow reaches the sea
Niijima (Japan)
Weak earthquake swarm
Nyamulagira (DR Congo)
Intermittent lava extrusion and ash emission from several vents
Pacaya (Guatemala)
Stronger explosive activity; lava flows
Pinatubo (Philippines)
Lahars kill more than 60 people; large secondary explosions; continued lava-dome growth
Poas (Costa Rica)
Vigorous thermal activity; crater lake rises
Rabaul (Papua New Guinea)
Seismicity decreases; slight subsidence follows inflation
Rincon de la Vieja (Costa Rica)
Strong degassing; explosion seismicity
Spurr (United States)
Third brief explosive episode ejects large cloud
Stromboli (Italy)
Frequent weak explosions; tremor
Turrialba (Costa Rica)
Continued seismicity and fumarolic activity
Unzendake (Japan)
Continued dome growth; dome 8 extruded; pyroclastic and debris flows damage many buildings
Villarrica (Chile)
Phreatomagmatic explosions and intense fumarolic activity
Aira
Japan
31.5772°N, 130.6589°E; summit elev. 1117 m
All times are local (unless otherwise noted)
Seismically recorded explosions halt briefly, but quiet ash emission continues
No explosions were recorded in August, the first explosion-free month since September 1990. However, ash eruptions without explosion shocks were seen nine times in August. Ash plumes rose 3.5 km . . . on 15 August and 3.2 km on 21 August. The KLMO . . . counts explosions detected by seismometer, microbarometer, felt air-shocks, and sounds. Quiet ash eruptions are detected visually. No swarms of volcanic earthquakes were reported during August.
Similar activity continued through 15 September, with three recorded explosions and seven quiet eruptions. On 7 September at 0552, the first explosion since 29 July ejected a 3-km ash plume with electrical discharges. Ash rose 3.5 km in a quiet eruption on 4 September.
Geologic Background. The Aira caldera in the northern half of Kagoshima Bay contains the post-caldera Sakurajima volcano, one of Japan's most active. Eruption of the voluminous Ito pyroclastic flow accompanied formation of the 17 x 23 km caldera about 22,000 years ago. The smaller Wakamiko caldera was formed during the early Holocene in the NE corner of the caldera, along with several post-caldera cones. The construction of Sakurajima began about 13,000 years ago on the southern rim and built an island that was joined to the Osumi Peninsula during the major explosive and effusive eruption of 1914. Activity at the Kitadake summit cone ended about 4,850 years ago, after which eruptions took place at Minamidake. Frequent eruptions since the 8th century have deposited ash on the city of Kagoshima, located across Kagoshima Bay only 8 km from the summit. The largest recorded eruption took place during 1471-76.
Information Contacts: JMA.
Arenal (Costa Rica) — August 1992 Cite this Report
Arenal
Costa Rica
10.463°N, 84.703°W; summit elev. 1670 m
All times are local (unless otherwise noted)
Lava extrusion and explosive activity; small pyroclastic flows
Lava extrusion, explosive activity, and gas emission were continuing in early September. The block-lava flow that has been descending the WSW flank reached 615 m elevation, entering an area of forest and grassland along a front 6-15 m high and 100 m wide. A small area of vegetation was burned. The active lobe was subdivided into two tongues; the southern tongue was advancing at the end of August. By early September, however, its rate of advance was very slow, and a new flow had begun to descend toward the SW, with an active front at 850 m elevation.
Strombolian explosions were infrequent in August; gradual to sudden degassing events were more common. Characteristics of ash collected on the W flank are shown in table 5. Small pyroclastic flows were occasionally generated. Fumarolic activity continued from the old summit crater (D). Acid rain with a mean pH of 4.3 was still affecting vegetation on the W and SW flanks.
Volcanic seismicity generally remained similar to June and July, with an average of 25 events/day and maxima of 30-40 daily (figure 50). Periods of intermittent tremor occurred mainly on 5-7, 11, 14, 17, and 21-22 August.
Geologic Background. Conical Volcán Arenal is the youngest stratovolcano in Costa Rica and one of its most active. The 1670-m-high andesitic volcano towers above the eastern shores of Lake Arenal, which has been enlarged by a hydroelectric project. Arenal lies along a volcanic chain that has migrated to the NW from the late-Pleistocene Los Perdidos lava domes through the Pleistocene-to-Holocene Chato volcano, which contains a 500-m-wide, lake-filled summit crater. The earliest known eruptions of Arenal took place about 7000 years ago, and it was active concurrently with Cerro Chato until the activity of Chato ended about 3500 years ago. Growth of Arenal has been characterized by periodic major explosive eruptions at several-hundred-year intervals and periods of lava effusion that armor the cone. An eruptive period that began with a major explosive eruption in 1968 ended in December 2010; continuous explosive activity accompanied by slow lava effusion and the occasional emission of pyroclastic flows characterized the eruption from vents at the summit and on the upper western flank.
Information Contacts: G. Soto and R. Barquero, ICE; E. Fernández, J. Barquero, and V. Barboza, OVSICORI.
Asosan
Japan
32.8849°N, 131.085°E; summit elev. 1592 m
All times are local (unless otherwise noted)
Explosion ejects blocks
Heavy rains expanded the crater lake in early August but it shrank to cover only 20% of the crater floor later in the month as a result of daily ejections of mud, blocks, and water. Steam emissions were continuous, rising to 1 km on 10 and 24 August.
A strong eruption of water, blocks, and mud from Crater 1 at 1223 on 8 September ejected blocks to 200 m above the crater rim and a 2-km steam plume. Blocks up to 70 cm across were scattered to 300 m W of the crater rim. The eruption was similar in size to the previous eruption on 30 June-1 July, but eruption tremor of 30 µm amplitude was detected by a seismometer 800 m W of the crater, compared to the 9-µm amplitude recorded by the same instrument on 1 July. No changes in tremor activity were recorded before the eruption, although there was an increase in the amplitude of continuous tremor for two days after the eruption (figure 22). There were only 55 isolated tremor episodes in August compared to 1520 in July, with another 35 events recorded in September through the 15th.
Geologic Background. The 24-km-wide Asosan caldera was formed during four major explosive eruptions from 300,000 to 90,000 years ago. These produced voluminous pyroclastic flows that covered much of Kyushu. The last of these, the Aso-4 eruption, produced more than 600 km3 of airfall tephra and pyroclastic-flow deposits. A group of 17 central cones was constructed in the middle of the caldera, one of which, Nakadake, is one of Japan's most active volcanoes. It was the location of Japan's first documented historical eruption in 553 CE. The Nakadake complex has remained active throughout the Holocene. Several other cones have been active during the Holocene, including the Kometsuka scoria cone as recently as about 210 CE. Historical eruptions have largely consisted of basaltic to basaltic andesite ash emission with periodic strombolian and phreatomagmatic activity. The summit crater of Nakadake is accessible by toll road and cable car, and is one of Kyushu's most popular tourist destinations.
Information Contacts: JMA.
Eldey
Iceland
63.733°N, 23°W; summit elev. 70 m
All times are local (unless otherwise noted)
Young lava flow identified from submersible
The following is from a report by Lynn Johnson. "A young lava flow has been identified from deep-diving submersible observations on the northern Reykjanes Ridge at 59.87°N, 29.65°W. A complete lack of sediment cover or biological colonization, minimal alteration, and a distinct boundary between this flow and underlying sediments suggest that this flow is less than 10-20 years old. However, exceptional bottom conditions including unusually strong currents might act to prevent sediment accumulation and biological colonization, allowing this flow to be significantly older (a few hundred to a few thousand years).
"In June, 1992 a 5-member team from the United States joined 10 Russian scientists on Russian Mir deep-diving submersibles to study a possible young lava flow on the Reykjanes Ridge at 59.78°N 29.72°W. The cruise was a cooperative project organized by Kathy Crane (Lamont-Doherty Geological Observatory), Peter Vogt (Naval Research Lab), and Anatoly Sagalavitch (Laboratory of Deep Manned Submersibles, Shirshov Institute of Oceanology, Moscow). The site was chosen because of a microseismic swarm located there by the Worldwide Standardized Seismic Net and an airborne sonobuoy survey in 1989 (Nishimura and others, 1989, and 14:5). In 1990 a SeaMARC II sidescan sonar study showed a highly reflective patch of seafloor within the error radius of the sonobuoy-based epicentral region of the seismic swarm (Shor and others, 1990, and 15:8).
"Our Mir submersible observations reveal that the high backscatter region at 59.78°N is not a young flow, but a flat featureless plain covered with 20-40 cm of sediment. Subsequent dives identified a young flow farther north, but outside of the epicentral region calculated for the 1989 seismic swarm. Four dives in the region between 59.75°N and 59.85°N traversed the ridge axis and several of the ubiquitous small seamounts along the ridge crest (figure 5). Two of these dives also investigated the bounding scarps of the large double ridge segment at that location. Two dives traversed over the northern end of this large segment and the southern end of a smaller segment to the north (59.90°N). With the exception of the one young flow, all of the seafloor observed during over 50 hours of bottom time is comprised of relatively old, sediment-covered and biologically colonized pillow lavas. The young flow was observed and sampled on the flanks of a small seamount at the southern end of the smaller northern axial-ridge segment. Abundant fresh glass is preserved in rocks recovered from this location, and palagonite development is essentially non-existent. The flow lacks sediment cover and biological colonization, and appears to have advanced over an older, sedimented area. Although, except in a few special cases, radiometric dating of mid-ocean ridge basalts (MORB) younger than a few thousand years is not possible, we will try to have the sample dated by recent experimental methods to obtain a more accurate age for recent volcanism at this site.
"In addition to video and photographic observations we collected conductivity, temperature, and depth information from one of the submersibles and from the R/V Keldysh, the support ship. No temperature or salinity anomalies indicating hydrothermal activity were recorded. We also collected samples of volcanic rock, water, and sediment using both the submersibles and the surface ship, and conducted a magnetic survey over a 100 km2 area."
References. Nishimura, C.E., Vogt, P.R., Smith, L., and Boyd, J.D., 1989, Investigations of a possible underwater volcanic eruption on the Reykjanes Ridge by airborne sonobuoys and AXBT's: EOS, v. 70, p. 1301.
Shor, A.N., Nishimura, C.E., Czarnecki, M., and Vogt, P.R., 1990, Lava extrusion from the 1989 Reykjanes Ridge seismic swarm? Probably yes (SeaMARC II): EOS, v. 71, p. 1602.
Geologic Background. The Eldey volcanic system is located on the northernmost part of the Reykjanes Ridge and is submarine with the exception of Eldey Island and the skerries (small rocky islands) Eldeyjardrangur, Geirfugladrangur, and Geirfuglasker. Maximum water depth within the system is about 250 m. Characteristic activity consists of explosive submarine basaltic eruptions. Six small eruptions have been located within this system during the last 1,100 years, the last occurring in 1926 CE. Bulletin reports that are included here cover a larger area of the Reykjanes Ridge south of Iceland without a clear source or enough evidence for a separate volcano entry.
Information Contacts: L. Johnson, Naval Research Lab.
Erta Ale (Ethiopia) — August 1992 Cite this Report
Erta Ale
Ethiopia
13.601°N, 40.666°E; summit elev. 585 m
All times are local (unless otherwise noted)
Small lava fountains observed during overflight
A lava fountain estimated at 1-2 m high was observed in one vent during a 45-minute overflight on 21 September by the Geophysical Observatory's director, a volcanologist, and a geologist. Gas emission was seen at a second vent.
Geologic Background. The Erta Ale basaltic shield volcano in Ethiopia has a 50-km-wide edifice that rises more than 600 m from below sea level in the Danakil depression. The volcano includes a 0.7 x 1.6 km summit crater hosting steep-sided pit craters. Another larger 1.8 x 3.1 km wide depression elongated parallel to the trend of the Erta Ale range is located SE of the summit and is bounded by curvilinear fault scarps on the SE side. Basaltic lava flows from these fissures have poured into the caldera and locally overflowed its rim. The summit caldera usually also holds at least one long-term lava lake that has been active since at least 1967, and possibly since 1906. Recent fissure eruptions have occurred on the N flank.
Information Contacts: L. Asfaw, Addis Abeba Univ, Ethiopia.
Etna
Italy
37.748°N, 14.999°E; summit elev. 3357 m
All times are local (unless otherwise noted)
Increased lava emission from break in main tube
The eruption ... appears to have become more vigorous in early September. Until 2 September, activity was similar to previous months, with lava flowing through a complex system of tubes and resurfacing from ephemeral vents of varying number (recently about 4) and location. Lava flows from the ephemeral vents were generally of modest size, advancing only a few hundred meters and remaining within the pre-existing 1991-92 lava field. Gas emission from the upper part of the fissure has remained similar to past months, with modest variations linked to weather conditions.
The roof of the main lava tube broke open late in the evening of 2 September, near a former skylight at ~2,150 m altitude and above the site of artificial lava diversion in May (at ~2,000 m elevation; 17:07). The flow from the broken tube first moved ENE above the lava field, then along its S side over terrain not previously covered by lava from this eruption. Lava advanced ~ 1 km to 1,700 m altitude by the next morning, then slowed to a stop during the succeeding days, reaching ~1,650 m elevation. The main lava tube, with two fuming skylights, remained active on 4 September below 2,000 m altitude. The only large ephemeral vent was at around 1,700 m asl, in the central part of the lava field. Another overflow occurred during the morning of 9 September at around 1,980 m altitude, below the lava diversion area. The flow advanced across the central part of the lava field, quickly reaching 1,650 m elevation. The total volume of lava produced by 272 days of activity was estimated at 190 x 106 m3.
Activity from the central crater's two vents remained similar to previous months, with continuing gas emission, strongest from the W vent (Bocca Nuova). Gas, sometimes voluminous, also continued to emerge from two small vents in Southeast Crater. Northeast Crater remained obstructed by debris. Landsliding persisted from the walls, particularly in the N and S parts of the crater. Very weak fumarolic activity occurred from Northeast Crater's inner walls. SO2 flux from the summit craters, measured by COSPEC, remained at relatively low levels (~ 2,000 t/d) during August, but measurements in early September yielded higher values, ~ 5,000 t/d.
From 15 August through 11 September, 176 seismic events were recorded, characterized by low energy release. The most significant activity was a sequence of 43 summit-area events 6-7 September, with a maximum magnitude of 3.2. Harmonic tremor has been nearly absent.
Geologic Background. Mount Etna, towering above Catania on the island of Sicily, has one of the world's longest documented records of volcanism, dating back to 1500 BCE. Historical lava flows of basaltic composition cover much of the surface of this massive volcano, whose edifice is the highest and most voluminous in Italy. The Mongibello stratovolcano, truncated by several small calderas, was constructed during the late Pleistocene and Holocene over an older shield volcano. The most prominent morphological feature of Etna is the Valle del Bove, a 5 x 10 km caldera open to the east. Two styles of eruptive activity typically occur, sometimes simultaneously. Persistent explosive eruptions, sometimes with minor lava emissions, take place from one or more summit craters. Flank vents, typically with higher effusion rates, are less frequently active and originate from fissures that open progressively downward from near the summit (usually accompanied by Strombolian eruptions at the upper end). Cinder cones are commonly constructed over the vents of lower-flank lava flows. Lava flows extend to the foot of the volcano on all sides and have reached the sea over a broad area on the SE flank.
Information Contacts: R. Romano and T. Caltabiano, IIV; P. Carveni, M. Grasso, and C. Monaco, Univ di Catania; G. Luongo, OV.
Galeras (Colombia) — August 1992 Cite this Report
Galeras
Colombia
1.22°N, 77.37°W; summit elev. 4276 m
All times are local (unless otherwise noted)
Ash ejection; seismicity and SO2 emission decline
Seismicity in August was at the lowest levels since monitoring began, but there was an increase in high-frequency events. On 1 August, a high-frequency earthquake centered 7 km W of the active cone was felt in the city of Pasto. During August, four swarms were detected, similar to those recorded a few hours before the 16 July eruption. The swarms were centered NW of the crater at depths of 2.5-5.0 km (figure 59); magnitudes were generally ~0.4, with the strongest shocks reaching M 2.3. The number and energy release of long-period earthquakes were the lowest since February 1989.
Deformation measured by two electronic tiltmeters near the summit (Crater and Peladitos), and the short leveling-line vector (Las Piedras), was low compared to that of September and October 1991, associated with dome emplacement. A strong offset at Peladitos on 9 August coincided with one of the swarms of high-frequency events. Deformation remained relatively stable at Crater until a sharp change occurred on 24 August (figure 60).
COSPEC data showed SO2 emissions of ~35 t/d, the lowest values since monitoring began in early 1989. Ash emission associated with a long-period seismic event was observed at 1535 on 11 August. Geologists noted that pulses of great activity, as from 1924-36, alternate with periods of minimum activity, and that the present decline in activity is consistent with the historical behavior of Galeras.
Geologic Background. Galeras, a stratovolcano with a large breached caldera located immediately west of the city of Pasto, is one of Colombia's most frequently active volcanoes. The dominantly andesitic complex has been active for more than 1 million years, and two major caldera collapse eruptions took place during the late Pleistocene. Long-term extensive hydrothermal alteration has contributed to large-scale edifice collapse on at least three occasions, producing debris avalanches that swept to the west and left a large open caldera inside which the modern cone has been constructed. Major explosive eruptions since the mid-Holocene have produced widespread tephra deposits and pyroclastic flows that swept all but the southern flanks. A central cone slightly lower than the caldera rim has been the site of numerous small-to-moderate eruptions since the time of the Spanish conquistadors.
Information Contacts: J. Romero, INGEOMINAS - Observatorio Vulcanólogico del Sur.
Irazu (Costa Rica) — August 1992 Cite this Report
Irazu
Costa Rica
9.979°N, 83.852°W; summit elev. 3436 m
All times are local (unless otherwise noted)
Seismicity decreases; gas emission continues
Activity in the main crater remained stable in August, with weak vapor emission from sediment fans on the N side of the crater lake and active fumaroles in the NE part of the lake. The lake remained green, and its level has varied by only a few centimeters in recent months. Erosion of the crater walls carried sediment to fans on its N, W, and E sides. Temperature and pH of springs monitored around the volcano had not changed from previous months. The number and energy release of local seismic events have decreased considerably in the past 3 months. A UNA seismic station (IRZ2) 5 km WSW of the main crater registered 27 small events in August, down from 33 in July.
Geologic Background. The massive Irazú volcano in Costa Rica, immediately E of the capital city of San José, covers an area of 500 km2 and is vegetated to within a few hundred meters of its broad summit crater complex. At least 10 satellitic cones are located on its S flank. No lava effusion is known since the eruption of the Cervantes lava flows from S-flank vents about 14,000 years ago, and all known Holocene eruptions have been explosive. The focus of eruptions at the summit crater complex has migrated to the W towards the main crater, which contains a small lake. The first well-documented eruption occurred in 1723, and frequent explosive eruptions have occurred since. Ashfall from the last major eruption during 1963-65 caused significant disruption to San José and surrounding areas. Phreatic activity reported in 1994 may have been a landslide event from the fumarolic area on the NW summit (Fallas et al., 2018).
Information Contacts: G. Soto and R. Barquero, ICE; E. Fernández, J. Barquero, and V. Barboza, OVSICORI.
Kilauea (United States) — August 1992 Cite this Report
Kilauea
United States
19.421°N, 155.287°W; summit elev. 1222 m
All times are local (unless otherwise noted)
Continued East-rift lava extrusion interrupted by brief pauses
Lava production . . . continued in August with one 4-day pause around mid-month and another that began 29 August. The surface of the active lava lake in Pu`u `O`o Crater fluctuated between 36 and 75 m below the crater rim. During eruptive pauses at the E-51 vent on the outer W flank of Pu`u `O`o, the lake slowly dropped to more than 60 m below the rim, but overflowed onto the floor of the crater (36 m below the rim) at the onset of renewed activity.
Flows began to emerge from the tube system after activity resumed in late July, advancing S to the edge of the flow field and starting forest fires on 4 August. There the flows split, with one lobe staying on top of the 1986 aa flow and two others advancing downslope W of the 1986 flow (figure 85), reaching 658 m (2,160 ft) elevation before the eruption paused on 11 August. Tremor levels began to gradually decline, from 2x background at about 1600 on 11 August to background level by 13 August. Shallow, long-period (LPC-B, 1-3 Hz) counts were high 4-12 August, with a maximum of 345 events per day.
The level of the Pu`u `O`o lava lake began rising the morning of 15 August, stabilizing ~2 hours before the eruption resumed. At about 1300, slow-moving pahoehoe flows broke out ~1 km S of the episode-51 shield and headed S. Tremor levels began increasing again at about 1800, reaching 2x background. Lava advanced to ~664 m (2,180 ft) elevation by 27 August, reaching the edge of the flow field and burning trees SE of the vent. The eruption paused on 29 August as tremor amplitude again decreased to background levels between 0600 and 1100.
There have been only one or two August observations of lava on the floor of the E-51 pond, active from March until it drained in July. The pond is apparently being completely bypassed, with lava now directly feeding tubes in the S flank of the E-51 shield. Occasional glimpses of vent activity have been possible through skylights that opened at the base of some of the spatter cones.
Lava in the Pu`u `O`o lake was 51 m below the crater rim on 1 September. Eruption tremor began to build gradually at 2100 that day, reaching a steady 2x background by 0100 the next morning. Shallow, long-period (LPC-A, 3-5 Hz) and upper East rift microshock counts were high 1-2 September. The eruption resumed on 2 September with lava reoccupying the tubes to the S and breaking out S of the E-51 shield. Flows headed S and E, reaching the treeline on 6 September and 661 m (2170 feet) elevation on 8 September. The seismic station (STC) nearest Pu`u `O`o detected an increase in tremor amplitude to 3x background 3-6 September. Shallow, long-period (LPC-B, 1-3 Hz) events seismicity 7 September at > 140 events, then began gradually decreasing, dropping to just above background by 0400 on 9 September. Flows stagnated when the eruption paused 9-12 September. Shallow, long-period events and upper East rift microshocks were again frequent 11-12 September. Tremor increased to 3x background, starting at 0400 on 12 September, when lava broke out of the tube ~1 km from the vent and formed sluggish, channelized pahoehoe flows.
Geologic Background. Kilauea overlaps the E flank of the massive Mauna Loa shield volcano in the island of Hawaii. Eruptions are prominent in Polynesian legends; written documentation since 1820 records frequent summit and flank lava flow eruptions interspersed with periods of long-term lava lake activity at Halemaumau crater in the summit caldera until 1924. The 3 x 5 km caldera was formed in several stages about 1,500 years ago and during the 18th century; eruptions have also originated from the lengthy East and Southwest rift zones, which extend to the ocean in both directions. About 90% of the surface of the basaltic shield volcano is formed of lava flows less than about 1,100 years old; 70% of the surface is younger than 600 years. The long-term eruption from the East rift zone between 1983 and 2018 produced lava flows covering more than 100 km2, destroyed hundreds of houses, and added new coastline.
Information Contacts: T. Mattox and P. Okubo, HVO.
Kozushima
Japan
34.219°N, 139.153°E; summit elev. 572 m
All times are local (unless otherwise noted)
Weak seismic swarm; surface activity unchanged
A weak earthquake swarm was detected 5 km NE of the volcano island on 18 August. Maximum magnitude was 3.0. No surface activity was evident on the island or in the sea.
Geologic Background. A cluster of rhyolitic lava domes and associated pyroclastic deposits form the 4 x 6 km island of Kozushima in the northern Izu Islands. The island is the exposed summit of a larger submarine edifice more than 20 km long that lies along the Zenisu Ridge, one of several en-echelon ridges oriented NE-SW, transverse to the trend of the northern Izu arc. The youngest and largest of the 18 lava domes, Tenjosan, occupies the central portion of the island. Most of the older domes, some of which are Holocene in age, flank Tenjosan to the north, although late-Pleistocene domes are also found at the southern end of the island. A lava flow may have reached the sea during an eruption in 832 CE. The Tenjosan dome was formed during a major eruption in 838 CE that also produced pyroclastic flows and surges. Earthquake swarms took place during the 20th century.
Information Contacts: JMA.
Langila (Papua New Guinea) — August 1992 Cite this Report
Langila
Papua New Guinea
5.525°S, 148.42°E; summit elev. 1330 m
All times are local (unless otherwise noted)
Explosions and glow
"Moderate activity prevailed . . . throughout August. Activity at Crater 2 consisted of weak emissions of white and blue vapour with occasional rumbling sounds. From the 19th onward, the volume of gas and vapour emission increased, explosion sounds were heard intermittently, and a night glow was seen above the crater. Activity at Crater 3 was limited to occasional emission of white to grey vapour clouds. Seismicity remained low throughout the month, with only a few explosion shocks recorded daily."
Geologic Background. Langila, one of the most active volcanoes of New Britain, consists of a group of four small overlapping composite basaltic-andesitic cones on the lower E flank of the extinct Talawe volcano in the Cape Gloucester area of NW New Britain. A rectangular, 2.5-km-long crater is breached widely to the SE; Langila was constructed NE of the breached crater of Talawe. An extensive lava field reaches the coast on the N and NE sides of Langila. Frequent mild-to-moderate explosive eruptions, sometimes accompanied by lava flows, have been recorded since the 19th century from three active craters at the summit. The youngest and smallest crater (no. 3 crater) was formed in 1960 and has a diameter of 150 m.
Information Contacts: P. de Saint-Ours and C. McKee, RVO.
Ol Doinyo Lengai (Tanzania) — August 1992 Cite this Report
Ol Doinyo Lengai
Tanzania
2.764°S, 35.914°E; summit elev. 2962 m
All times are local (unless otherwise noted)
Carbonatite lava extrusion onto crater floor
Aerial photographs taken by Benoit Wangermez on 8 April indicated that a considerable amount of lava had accumulated . . . since February, concentrated on the W side and in the S depression. The darkest (most recently extruded) flow from T20 skirted the W side of T16, and a narrow lobe separated vents T14 and T16. Lava from T20 had also flowed around the N slope of T14, reaching the base of the N and W crater walls. David and Trude Peterson reported that the outlines of flows around T14 and T16 were still clear on 15 April; flow surfaces were pale-gray with some darker patches. Bubbling lava noises from below T20 were heard on 15 April, but there was no molten lava visible. Steam was rising from several other vents. Crater observations by C. Nyamweru, Chris Arnold, Wolfram Vent-Schmidt, and David Peterson on 14 July describe the central cone of T20 rising from a pediment of radiating lava flows. Its height was estimated at ~15 m, and it had a small open summit vent with a narrow light-gray turret of spatter that probably formed a few days earlier. Lava was seen in the bottom of T20 . . . later in July (17:07).
Most of the other vents have generally remained unchanged since February. Vent T11, not observed since 8 April, has probably been covered by a number of flows from T20. Vent T5/T9, ~25 m tall on 14 July, is medium-brown with light-brown lower slopes and some dark fume stains on the upper slopes. Vent T15 remains dark and jagged, ~7.5 m tall, with black fume-staining on the upper slopes and light-brown lower slopes. A flow that extended 20 m from the summit of T15 on 15 April was not evident on 8 April. Vent T19, a pale-gray, low, circular vent with an open crater and no sign of activity, is surrounded by younger flows from other vents. T19 appeared dark-gray on 8 April photographs, and may have been the source for some of the flows S of the former saddle. Most of that area was dark-brown on 8 April, with the outlines and source of the flows not clearly visible. "New lava" was reported on the crater floor on 9 July by Michael Peterson and a party of British school children under the leadership of Bob Gill.
The overall appearance of the crater floor during fieldwork by Nyamweru and others on 14 July was medium-brown to white with no dark fresh flows. However, many clearly defined fresh aa and pahoehoe structures were seen on white and pale-brown lava that was probably only a few days old. One perfectly preserved small hornito (~30 cm high) observed 14 July (near T19) at the base of the SE wall was cool and white, possibly forming 2-3 days earlier. Many thick flows had crossed the former saddle and raised the surface of the S depression. Steam from several vents had been observed on 15 April, with large quantities emerging on 14 July from vents T5/T9, T8, T15, T14, T20, and rim cone C1, as well as from cracks on the crater rim and walls. The smell of sulfur was strong on 14 July, and bright-yellow sulfur patches were visible on the E rim and E wall. Pacing by C. Nyamweru and D. Peterson yielded an average E-W crater diameter of 336 m.
Geologic Background. The symmetrical Ol Doinyo Lengai is the only volcano known to have erupted carbonatite tephras and lavas in historical time. The prominent stratovolcano, known to the Maasai as "The Mountain of God," rises abruptly above the broad plain south of Lake Natron in the Gregory Rift Valley. The cone-building stage ended about 15,000 years ago and was followed by periodic ejection of natrocarbonatitic and nephelinite tephra during the Holocene. Historical eruptions have consisted of smaller tephra ejections and emission of numerous natrocarbonatitic lava flows on the floor of the summit crater and occasionally down the upper flanks. The depth and morphology of the northern crater have changed dramatically during the course of historical eruptions, ranging from steep crater walls about 200 m deep in the mid-20th century to shallow platforms mostly filling the crater. Long-term lava effusion in the summit crater beginning in 1983 had by the turn of the century mostly filled the northern crater; by late 1998 lava had begun overflowing the crater rim.
Information Contacts: C. Nyamweru, St. Lawrence Univ; D. Peterson, Tr. Peterson, and M. Peterson, Arusha; H. Brown, Nairobi, Kenya; B. Wangermez, Nairobi, Kenya; C. Arnold, Denver, CO; W. Vent-Schmidt, Germany; B. Gill, Hampton School, UK.
Llaima
Chile
38.692°S, 71.729°W; summit elev. 3125 m
All times are local (unless otherwise noted)
Three summit-crater explosions; frequent seismicity
Three explosions from the summit crater were observed between 23 August and 2 September. Intense fumarolic and solfataric activity has continued since 23 August, with gas emissions and phreatic explosions in early September that rose 400 m and fed a plume 45 km long. About 2500 seismic events were recorded 4-6 September by two portable MEQ-800 seismographs 5 km from the crater; tremor frequency was 1.2-1.4 Hz. Seismicity was concentrated on the N flank where the 1956-57 eruptions occurred. Seismicity during fieldwork in January 1991 and January 1992 averaged a few hundred events per day (17:2). Winter snow still covers the volcano, creating the potential for lahars.
Geologic Background. Llaima, one of Chile's largest and most active volcanoes, contains two main historically active craters, one at the summit and the other, Pichillaima, to the SE. The massive, dominantly basaltic-to-andesitic, stratovolcano has a volume of 400 km3. A Holocene edifice built primarily of accumulated lava flows was constructed over an 8-km-wide caldera that formed about 13,200 years ago, following the eruption of the 24 km3 Curacautín Ignimbrite. More than 40 scoria cones dot the volcano's flanks. Following the end of an explosive stage about 7200 years ago, construction of the present edifice began, characterized by Strombolian, Hawaiian, and infrequent subplinian eruptions. Frequent moderate explosive eruptions with occasional lava flows have been recorded since the 17th century.
Information Contacts: G. Fuentealba, M. Petit-Breuilh, and P. Peña,Univ de la Frontera; U.S. Embassy, Santiago, Chile.
Manam (Papua New Guinea) — August 1992 Cite this Report
Manam
Papua New Guinea
4.08°S, 145.037°E; summit elev. 1807 m
All times are local (unless otherwise noted)
Strong explosions; lava flow; pyroclastic flow reaches the sea
"Strong eruptive activity resumed at Manam after a 2-month quiet period. Following the March-June eruption, activity in both craters was very subdued, consisting only of weak fumaroles, a faint night glow, and low-level seismicity.
"From 10 August, however, mild, deep-seated eruptive activity resumed in Southern Crater, with weak white and blue vapour emissions, weak roaring sounds, and a fluctuating night glow. Seismicity remained at a moderately low level, but a definite inflation trend was recorded by the water-tube tiltmeter . . . (+2 µrad in three weeks).
"On 21 August, activity increased with forceful degassing and incandescent Strombolian projections over Southern Crater. By 29-30 August, dark ash-laden vapour emissions were released intermittently and nighttime incandescent projections were reaching 700 m above the crater.
"This activity culminated in a paroxysmal phase on 31 August. The microseismicity increased in intensity from mid-morning. Unfortunately, cloudy weather hampered observations, but starting from 1650, forceful continuous eruption of incandescent material took place and lasted for ~6 hours. A dark column of basaltic pumice and ash rose to ~5,000 m above the summit of the volcano, and produced heavy lapilli/scoriae and ashfall over the WNW side of the island until about 1930. Concurrently, lava emitted by Southern Crater started to flow into the SW valley, cascading down the headwall. At about 1700 a large pyroclastic flow ran down the same valley. At ~600 m asl it overflowed the narrow valley-channel and progressed down to the sea with a width of ~120 m. Another pyroclastic flow ran down the SE valley, along the southern bank, but stopped at ~500 m asl.
"The high level of eruptive activity (with strong red glow observed through the cloud cover) lasted until 2300. The next day, the mountain was still cloud-covered. The level of seismicity and noise had decreased but the lava flow was still active.
"Field inspection on 4-6 September revealed that the pyroclastic-flow deposits in the SW valley were still hot, consisted of scoriae, boulders, and tree trunks, and were 6 m thick at the coast. The flow had devastated vegetation and gardens along the way, but fortunately had not hit two neighbouring coastal villages. The coastal road was cut off. The lava flow had overridden the pyroclastic flow deposits but had stopped at ~700 m asl. The flow front was ~70 m wide and 5 m high. The pyroclastic-flow deposit in the SE valley consisted mainly of scoriae. Southern Crater was breached to the south. Lapilli and ashfall on the W and NW flanks of the volcano had severely damaged subsistence gardens. The largest scoria at Tabele Observatory was 12 cm.
"Interestingly, this paroxysmal phase occurred a couple of days after the radial tilt had reversed, from a rising to a rapidly deflating trend. The tilt has now (early September) lost all the inflation accumulated earlier; seismicity has dropped to a relatively low level, and visible activity in Southern Crater is limited to weak white-grey emissions, intermittent deep explosion sounds and a weak night glow. Main Crater has remained inactive since mid-June."
Geologic Background. The 10-km-wide island of Manam, lying 13 km off the northern coast of mainland Papua New Guinea, is one of the country's most active volcanoes. Four large radial valleys extend from the unvegetated summit of the conical basaltic-andesitic stratovolcano to its lower flanks. These valleys channel lava flows and pyroclastic avalanches that have sometimes reached the coast. Five small satellitic centers are located near the island's shoreline on the northern, southern, and western sides. Two summit craters are present; both are active, although most observed eruptions have originated from the southern crater, concentrating eruptive products during much of the past century into the SE valley. Frequent eruptions, typically of mild-to-moderate scale, have been recorded since 1616. Occasional larger eruptions have produced pyroclastic flows and lava flows that reached flat-lying coastal areas and entered the sea, sometimes impacting populated areas.
Information Contacts: P. de Saint-Ours and C. McKee, RVO.
Niijima
Japan
34.397°N, 139.27°E; summit elev. 432 m
All times are local (unless otherwise noted)
Weak earthquake swarm
A weak earthquake swarm was detected in the sea a few kilometers E and W of the island on 28-29 August. The strongest event was M 2.3.
Geologic Background. The elongated island of Niijima, SSW of Oshima, is 11 km long and only 2.5 km wide. Eight low rhyolitic lava domes are clustered in two groups at the northern and southern ends of the island, separated by an area of flat-topped domes and a low isthmus of pyroclastic deposits. The Mukaiyama complex on the south and the Atchiyama lava dome on the north were formed during eruptions in the 9th century CE, the last known activity. Shikineyama and Zinaito domes form small islands immediately to the SW and W, respectively, during earlier stages of volcanism. Earthquake swarms occurred during the 20th century.
Information Contacts: JMA.
Nyamulagira (DR Congo) — August 1992 Cite this Report
Nyamulagira
DR Congo
1.408°S, 29.2°E; summit elev. 3058 m
All times are local (unless otherwise noted)
Intermittent lava extrusion and ash emission from several vents
Lava extrusion and ash emissions have continued intermittently during August at vents 19, 20, and 21 that opened in July. Microtremor amplitude has generally been decreasing since early August after remaining high through July.
Geologic Background. Africa's most active volcano, Nyamulagira (also known as Nyamuragira), is a massive high-potassium basaltic shield about 25 km N of Lake Kivu and 13 km NNW of the steep-sided Nyiragongo volcano. The summit is truncated by a small 2 x 2.3 km caldera that has walls up to about 100 m high. Documented eruptions have occurred within the summit caldera, as well as from the numerous flank fissures and cinder cones. A lava lake in the summit crater, active since at least 1921, drained in 1938, at the time of a major flank eruption. Recent lava flows extend down the flanks more than 30 km from the summit as far as Lake Kivu; extensive lava flows from this volcano have covered 1,500 km2 of the western branch of the East African Rift.
Information Contacts: N. Zana, CRSN, Bukavu.
Pacaya (Guatemala) — August 1992 Cite this Report
Pacaya
Guatemala
14.382°N, 90.601°W; summit elev. 2569 m
All times are local (unless otherwise noted)
Stronger explosive activity; lava flows
A new cycle of activity has begun since June, with increased energy released by explosions. Continuous degassing from the active (MacKenney) crater produced sustained whitish columns that rose 200-300 m. In July, explosion seismicity increased, with explosions occurring at intervals of 5-30 seconds (figure 11). The strongest were quite energetic, ejecting abundant pyroclastic material that rose 300-400 m above the crater, and generating acoustic waves that were heard and felt in nearby towns. A moderate amount of ash was carried about 5 km W and NW by winds (toward El Patrocinio and El Cedro).
Activity continued through August. Increased lava extrusion 22-23 August fed a flow that advanced 750 m down the W flank. Two others traveled 75 and 250 m to the SW. Explosions, generally moderate to strong, continued at a rate of 2-5/minute, generating sound waves. The Comité Nacional de Emergencia (CONE) was alerted to the possibility of a stronger eruption.
Activity intensified on 6 September between about 0900 and 1700. Vigorous lava extrusion produced two flows that descended 300 and 1,150 m down the W and SW flanks, respectively, accompanied by moderate Strombolian activity. Explosions from MacKenney Crater ejected abundant ash and fine sand within clouds of white fume that reached about 500 m height. Ash fell on towns about 3.5 km W to SW of the volcano (El Patrocinio, El Rodeo, and El Caracol). Activity then returned to normal levels, about 200-300 explosions per day.
INSIVUMEH officials warned that this pattern of activity could last several weeks and could precede a much stronger eruption. The authorities and people living around the volcano were advised to remain alert to emergency pronouncements issued by CONE. Powerful pyroclastic episodes had forced temporary evacuations of villages near the foot of the volcano in early May (17:05).
Geologic Background. Eruptions from Pacaya are frequently visible from Guatemala City, the nation's capital. This complex basaltic volcano was constructed just outside the southern topographic rim of the 14 x 16 km Pleistocene Amatitlán caldera. A cluster of dacitic lava domes occupies the southern caldera floor. The post-caldera Pacaya massif includes the older Pacaya Viejo and Cerro Grande stratovolcanoes and the currently active Mackenney stratovolcano. Collapse of Pacaya Viejo between 600 and 1,500 years ago produced a debris-avalanche deposit that extends 25 km onto the Pacific coastal plain and left an arcuate scarp inside which the modern Pacaya volcano (Mackenney cone) grew. The NW-flank Cerro Chino crater was last active in the 19th century. During the past several decades, activity has consisted of frequent Strombolian eruptions with intermittent lava flow extrusion that has partially filled in the caldera moat and covered the flanks of Mackenney cone, punctuated by occasional larger explosive eruptions that partially destroy the summit.
Information Contacts: Rodolfo Morales, Gustavo Chigna, and E. Sánchez, INSIVUMEH, Guatemala City.
Pinatubo (Philippines) — August 1992 Cite this Report
Pinatubo
Philippines
15.13°N, 120.35°E; summit elev. 1486 m
All times are local (unless otherwise noted)
Lahars kill more than 60 people; large secondary explosions; continued lava-dome growth
Growth of the lava dome in the summit caldera continued. Poor weather limited observations, but the dome's dimensions were estimated at 300-320 m in diameter and 100 m high during an early-September overflight. Heavy rains continued to trigger large secondary explosions and numerous lahars from the 1991 pyroclastic-flow deposits. Despite construction of sabo dams and levees, lahars had filled the channels of most flank drainages, endangering the remaining residents of river valleys around the volcano; almost 400 villages were identified by PHIVOLCS to be at high risk from lahars. Lahars reportedly killed more than 60 people in late August, and forced several hundred thousand to evacuate.
Observations by a geologic team on the W flank revealed continued development of large lahar fans that included numerous partially buried carbonized trees. The lahars repeatedly damaged or destroyed containment dikes, and progressively buried a village near the observation site. Hyperconcentrated flows, composed of 50-75% volcanic debris, were dominant at the site (along the Bucao River) because of dilution by streams not carrying large sediment loads. Less common were laharic debris flows with water contents of 25% to as little as 15%. Along one zone where the channel was only 30-100 m wide, hyperconcentrated flows typically advanced at 10-15 km/hour, marked by antidune standing waves 5-12 m long and 1-2 m high. Debris flows were laminar, moving at up to 30 km/hour.
Several large secondary explosions were documented between mid-August and mid-September. Explosions on 20 August at 0940 and 21 August at 0740 produced plumes that were tracked to 9 km altitude by radar (at Cubi Point). The top of each plume moved NNW and mid-level material (near 5.5 km) was carried NE. A large secondary explosion from pyroclastic-flow deposits in the SW flank's Marella valley occurred at 1650 on 15 September. The cloud reached 18 km altitude and drifted SW, depositing 3 mm of ash about 30 km SW of the summit (at San Marcelino) and 2 mm about 35 km SSW of the summit (at Subic Bay). Additional large secondary explosions took place on 21 September at 0957 and 1758. The first plume rose to more than 12 km altitude, appearing initially on satellite imagery as a circular cloud about 100 km in diameter above heavy weather clouds. The second plume reached 9 km altitude and moved rapidly WSW, causing heavy ashfall and muddy rain.
Geologic Background. Prior to 1991 Pinatubo volcano was a relatively unknown, heavily forested lava dome complex located 100 km NW of Manila with no records of historical eruptions. The 1991 eruption, one of the world's largest of the 20th century, ejected massive amounts of tephra and produced voluminous pyroclastic flows, forming a small, 2.5-km-wide summit caldera whose floor is now covered by a lake. Caldera formation lowered the height of the summit by more than 300 m. Although the eruption caused hundreds of fatalities and major damage with severe social and economic impact, successful monitoring efforts greatly reduced the number of fatalities. Widespread lahars that redistributed products of the 1991 eruption have continued to cause severe disruption. Previous major eruptive periods, interrupted by lengthy quiescent periods, have produced pyroclastic flows and lahars that were even more extensive than in 1991.
Information Contacts: PHIVOLCS; SAB; Kelvin Rodolfo, Univ of Illinois.
Poas
Costa Rica
10.2°N, 84.233°W; summit elev. 2697 m
All times are local (unless otherwise noted)
Vigorous thermal activity; crater lake rises
The level of the crater lake continued to rise, and was 1-2 m higher during 11 August fieldwork by Instituto Costarricense de Electricidad (ICE) geologists than it had been in June. Its color ranged from lime green to turquoise to sky-blue. Bubbling was observed in the central, N, and NE parts of the lake on 11 August, feeding columns <1 m high and generating waves. Boiling mud/sulfur springs on the SE side of the lake had temperatures of 95.3°C. The maximum measured lake temperature in August was 75°C; pH was 1.3. Fumaroles in the N part of the lake had temperatures of 95°C and a condensate pH of 1.8. Temperatures of fumaroles on the 1953-55 dome varied between 62 and 81°C.
UNA recorded an average of 163 low-frequency events/day, with a maximum of 289 on 31 August. At 1,242 that day, a M 2.2 earthquake occurred 8 km NE of the active crater at 16 km depth. Tremor at frequencies of 1-2.5 Hz occurred sporadically, for periods of 1-2 minutes.
Geologic Background. The broad vegetated edifice of Poás, one of the most active volcanoes of Costa Rica, contains three craters along a N-S line. The frequently visited multi-hued summit crater lakes of the basaltic-to-dacitic volcano are easily accessible by vehicle from the nearby capital city of San José. A N-S-trending fissure cutting the complex stratovolcano extends to the lower N flank, where it has produced the Congo stratovolcano and several lake-filled maars. The southernmost of the two summit crater lakes, Botos, last erupted about 7,500 years ago. The more prominent geothermally heated northern lake, Laguna Caliente, is one of the world's most acidic natural lakes, with a pH of near zero. It has been the site of frequent phreatic and phreatomagmatic eruptions since an eruption was reported in 1828. Eruptions often include geyser-like ejections of crater-lake water.
Information Contacts: G. Soto and R. Barquero, ICE; E. Fernández, J. Barquero, and V. Barboza, OVSICORI.
Rabaul (Papua New Guinea) — August 1992 Cite this Report
Rabaul
Papua New Guinea
4.2459°S, 152.1937°E; summit elev. 688 m
All times are local (unless otherwise noted)
Seismicity decreases; slight subsidence follows inflation
"A moderate rise in seismicity accompanied by uplift of the central part of the caldera took place over the last four months. After an increase to 1,089 events in July, the level of seismicity remained moderate throughout August, with 514 recorded events. The located earthquakes originated, as usual, from the annular seismic zone. Levelling measurements showed a steady uplift of the central part of the caldera from mid-May to mid-July (+30 mm), followed by a slight subsidence (-8 mm) since. Tilt and EDM measurements around the caldera . . . showed no significant changes."
Geologic Background. The low-lying Rabaul caldera on the tip of the Gazelle Peninsula at the NE end of New Britain forms a broad sheltered harbor utilized by what was the island's largest city prior to a major eruption in 1994. The outer flanks of the asymmetrical shield volcano are formed by thick pyroclastic-flow deposits. The 8 x 14 km caldera is widely breached on the east, where its floor is flooded by Blanche Bay and was formed about 1,400 years ago. An earlier caldera-forming eruption about 7,100 years ago is thought to have originated from Tavui caldera, offshore to the north. Three small stratovolcanoes lie outside the N and NE caldera rims. Post-caldera eruptions built basaltic-to-dacitic pyroclastic cones on the caldera floor near the NE and W caldera walls. Several of these, including Vulcan cone, which was formed during a large eruption in 1878, have produced major explosive activity during historical time. A powerful explosive eruption in 1994 occurred simultaneously from Vulcan and Tavurvur volcanoes and forced the temporary abandonment of Rabaul city.
Information Contacts: P. de Saint-Ours and C. McKee, RVO.
Rincon de la Vieja (Costa Rica) — August 1992 Cite this Report
Rincon de la Vieja
Costa Rica
10.83°N, 85.324°W; summit elev. 1916 m
All times are local (unless otherwise noted)
Strong degassing; explosion seismicity
Strong degassing occurred in the active crater. Some seismic signals with durations of up to 3 minutes were recorded during August, interpreted by ICE geologists as probably associated with small or moderate eruptions from the hot crater lake. However, no deposits of mud were found on the crater rim during fieldwork on 28 August, so any deposition must have been confined to the interior of the crater. Parts of the rim rise >150 m above the lake. A UNA seismic station (RIN3) 5 km SW of the main crater recorded 11 low-frequency events in August, with brief (1-6 minute) periods of tremor at frequencies of <2.5 Hz.
Geologic Background. Rincón de la Vieja, the largest volcano in NW Costa Rica, is a remote volcanic complex in the Guanacaste Range. The volcano consists of an elongated, arcuate NW-SE-trending ridge constructed within the 15-km-wide early Pleistocene Guachipelín caldera, whose rim is exposed on the south side. Sometimes known as the "Colossus of Guanacaste," it has an estimated volume of 130 km3 and contains at least nine major eruptive centers. Activity has migrated to the SE, where the youngest-looking craters are located. The twin cone of Santa María volcano, the highest peak of the complex, is located at the eastern end of a smaller, 5-km-wide caldera and has a 500-m-wide crater. A Plinian eruption producing the 0.25 km3 Río Blanca tephra about 3,500 years ago was the last major magmatic eruption. All subsequent eruptions, including numerous historical eruptions possibly dating back to the 16th century, have been from the prominent active crater containing a 500-m-wide acid lake located ENE of Von Seebach crater.
Information Contacts: G. Soto and R. Barquero, ICE; E. Fernández, J. Barquero, and V. Barboza, OVSICORI.
Spurr (United States) — August 1992 Cite this Report
Spurr
United States
61.299°N, 152.251°W; summit elev. 3374 m
All times are local (unless otherwise noted)
Third brief explosive episode ejects large cloud
An explosive eruption from the S flank's Crater Peak occurred during the night of 16-17 September. Significant deep seismicity followed by episodes of shallow tremor had prompted AVO to warn of renewed activity a week earlier. Little or no apparent precursory seismicity was associated with the most recent explosive episode on 18 August, but seismic activity began to increase 10 months before the initial explosion on 27 June.
AVO personnel visited Crater Peak vent on 16 September and detected no obvious increase in thermal activity or seismicity by late afternoon. Seismic activity began to build on stations near Spurr at about 1930, and another significant increase occurred at 2226. The eruption's first phase began at 2236, and one minute later, ash was seen at 4.5 km altitude from an aircraft. The initial activity lasted until 2252, when strong volcanic tremor declined. An hour of relative quiescence followed, although a pilot reported glow over the Crater Peak area and a dark plume moving NE at 2311. Another pilot report at 2345 indicated that the cloud had reached 10.5-12 km altitude, but it was not evident on National Weather Service (NWS) radar.
The second, more vigorous phase began suddenly at 0003. Seismicity continued to increase steadily, and between 0008 and 0018 the seismic station on the rim of Crater Peak was destroyed. NWS radar first detected the ash cloud at 0017, indicating a maximum altitude of 12 km by 0048 and 13.5-15 km by 0115 (figure 8). Eruption seismicity reached its maximum intensity at 0130, remaining constant until sporadic changes in amplitude began about 0215. At 0308, a M 2.0 earthquake occurred at 11 km depth and was followed by an abrupt decrease in tremor.
The plume moved ENE to NE of Spurr (figure 9) where ashfall was reported from communities out as far as Beaver Creek near the Canadian border, almost 600 km away. The ash was 3 mm thick in Willow (130 km NE) and formed two distinctly colored layers like those of the 18 August deposit. Effects in Anchorage were limited to a very fine dusting of ash and hazy conditions in parts of the city. Anchorage International Airport was not closed, but some flights were rerouted or cancelled during the night.
An AVO helicopter overflight the next morning revealed that multiple, dark, lithic-rich mudflows had moved down the S flank of Crater Peak. The largest had reached the Chakachatna River 5 km from the vent. A temporary dam formed on the river, but was breached by 1000. Hot pyroclastic avalanches had traveled down the E side of the cone across the W arm of the Kidzageni Glacier, causing significant melting and erosion of the ice.
Vigorous steaming continued after the eruptive episode, producing a plume that reached 6 km altitude on the morning of 18 September. Volcanic tremor of variable amplitude persisted, declining more gradually than after the 27 June and 18 August episodes. Two earthquakes occurred at about 30 km depth during the night of 18-19 September. AVO noted that magma may remain at shallow depth, and a minor eruption could occur with little warning.
The TOMS on the Nimbus-7 satellite detected 190 kilotons of SO2 in a plume of about 290 km2 over the SW Yukon Territory, Canada, roughly 10.5 hours after the onset of strong activity (figure 10). Similar SO2 amounts were measured following the 27 June eruption. Revised maximum values for the 18 August cloud were about 50% larger, at roughly 300 kilotons. The leading edge of the S02 plume was about 1,400 km from the volcano on the initial TOMS image. A day later, the SO2 plume remained relatively compact and was centered over the Dakotas, roughly 3,500 km from Spurr. A more elongate plume was visible on satellite imagery. Airplane pilots reported ash NW of Regina, Saskatchewan (one layer about 600 m thick, centered at 9 km altitude, and a more intense layer to 11.5 km), near Calgary, Alberta (6.5-7.5 km), near Pierre, South Dakota (10-12.5 km), and later in the day near Mason City, Iowa (13 km), Chicago, and from Milwaukee to Windsor, Ontario (8 km). On 19 September, a 1500-km crescent-shaped zone of enhanced SO2 extended across eastern Canada from Lake Ontario to E of Hudson Bay, 4500-5000 km from Spurr. This zone corresponded very closely with the densest portion of the cloud on weather satellite imagery, which also showed a zone of more diffuse ash extending a few hundred kilometers beyond the densest material. Pilot reports indicated that the base of the cloud was at about 6 km altitude, and most aircraft were flying below that level to avoid it. Maximum reported elevations were about 10 km. The leading edge of the SO2 plume reached the W coast of Greenland 20 September, and a little SO2 was still evident over E Greenland on 21 September.
Geologic Background. Mount Spurr is the closest volcano to Anchorage, Alaska (130 km W) and just NE of Chakachamna Lake. The summit is a large lava dome at the center of a roughly 5-km-wide amphitheater open to the south formed by a late-Pleistocene or early Holocene debris avalanche and associated pyroclastic flows that destroyed an older edifice. The debris avalanche traveled more than 25 km SE, and the resulting deposit contains blocks as large as 100 m in diameter. Several ice-carved post-collapse cones or lava domes are present. The youngest vent, Crater Peak, formed at the southern end of the amphitheater and has been the source of about 40 identified Holocene tephra layers. Eruptions from Crater Peak in 1953 and 1992 deposited ash in Anchorage.
Information Contacts: AVO; SAB, NOAA/NESDIS; G. Bluth, NASA GSFC; Richard Hutcheon and D. Eubanks, NWS, Anchorage.
Stromboli
Italy
38.789°N, 15.213°E; summit elev. 924 m
All times are local (unless otherwise noted)
Frequent weak explosions; tremor
Daily summit observations revealed frequent weak explosions and vigorous fumarolic activity in July and August. Tremor amplitude was constant, and seismic activity was slightly above average. Tremor amplitude, measured with hourly 60-second samples, generally averaged 0.4-0.6 v, with one day >0.7 v (3 July). There were >100 recorded seismic events per day throughout the period; 16 days had >200 events (4 August and 15-29 August); 16 and 26 August had >250. The last two weeks in August also had more strong shocks (ground velocities >100 mm/s), but no more than 50/day.
Geologic Background. Spectacular incandescent nighttime explosions at Stromboli have long attracted visitors to the "Lighthouse of the Mediterranean" in the NE Aeolian Islands. This volcano has lent its name to the frequent mild explosive activity that has characterized its eruptions throughout much of historical time. The small island is the emergent summit of a volcano that grew in two main eruptive cycles, the last of which formed the western portion of the island. The Neostromboli eruptive period took place between about 13,000 and 5,000 years ago. The active summit vents are located at the head of the Sciara del Fuoco, a prominent scarp that formed about 5,000 years ago due to a series of slope failures which extends to below sea level. The modern volcano has been constructed within this scarp, which funnels pyroclastic ejecta and lava flows to the NW. Essentially continuous mild Strombolian explosions, sometimes accompanied by lava flows, have been recorded for more than a millennium.
Information Contacts: M. Riuscetti, Univ di Udine.
Turrialba (Costa Rica) — August 1992 Cite this Report
Turrialba
Costa Rica
10.025°N, 83.767°W; summit elev. 3340 m
All times are local (unless otherwise noted)
Continued seismicity and fumarolic activity
Fumarole temperatures in the central crater were <=93.6°C during fieldwork by ICE geologists on 13 August, similar to observations in previous years. No changes in surface activity were evident. The UNA seismograph (VTU) 0.5 km E of the main crater recorded 14 low-frequency events in August.
Geologic Background. Turrialba, the easternmost of Costa Rica's Holocene volcanoes, is a large vegetated basaltic-to-dacitic stratovolcano located across a broad saddle NE of Irazú volcano overlooking the city of Cartago. The massive edifice covers an area of 500 km2. Three well-defined craters occur at the upper SW end of a broad 800 x 2200 m summit depression that is breached to the NE. Most activity originated from the summit vent complex, but two pyroclastic cones are located on the SW flank. Five major explosive eruptions have occurred during the past 3500 years. A series of explosive eruptions during the 19th century were sometimes accompanied by pyroclastic flows. Fumarolic activity continues at the central and SW summit craters.
Information Contacts: G. Soto and R. Barquero, ICE; E. Fernández, J. Barquero, and V. Barboza, OVSICORI.
Unzendake
Japan
32.761°N, 130.299°E; summit elev. 1483 m
All times are local (unless otherwise noted)
Continued dome growth; dome 8 extruded; pyroclastic and debris flows damage many buildings
Endogenous (cryptodome) and exogenous growth in August produced a new dome (8), which began to emerge 11 August at the upper part of dome 7. Collapses reduced the size of the dome complex until mid-August, then volume increased again, mainly from endogenous growth. Based on digital mapping by the Geographical Survey Institute, the volume of the dome complex is estimated at 5 x 10⁷ m3, with the total amount of magma erupted since 20 May 1991 estimated at 11 x 107 m3. Although the magma-supply rate has not been constant, the average from late April to early August is ~ 1.4 x 10⁵ m3/day.
Dome 7 resumed growth in mid-August as new lava extruded from the magma-supply vent joined lava emerging from the circular fault that appeared on the east-central part of the cryptodome in early August. Dome 8, created from this fresh lava along the circular fault, grew to ~ 300 m long, 150 m wide, and 100 m high. A NW-SE-trending graben up to 50 m wide formed on dome 8 in late August along part of the former circular fault. Upward growth of dome 8 in early September increased the width of the graben until the graben wall collapsed. The growth of dome 8 caused the W half of dome 7 to collapse as a series of rockfalls on 14-15 August. The E half of dome 7 was pushed E until it hung over dome 6.
Partial collapses of the dome complex often generated pyroclastic flows. One SE-flank pyroclastic flow burned 17 houses from 0830 to 1030 on 8 August. Heavy rains triggered debris flows along the Mizunashi River . . . 8-15 August, damaging 240 houses (table 10; note change in the number of damaged houses from previous report). No additional damage had been caused by pyroclastic flows as of mid-September. Pyroclastic flows from Jigokuato crater in late August traveled almost 4 km along the Mizunashi River, longer than the fatal 3 June 1991 flow and the longest since 15 September 1991. The rockfalls of 14-15 August generated pyroclastic flows along the Akamatsu Valley (S and SE of the volcano). The flows frequently struck the N cliff of Mt. Iwatoko (on the S side of the Akamatsu valley), just reaching the top of its lowest saddle, and ash clouds entered a small valley extending 300 m from the saddle. Since mid-August, pyroclastic flows moving NE from the cryptodome overflowed from the Oshiga Valley (extending NE from the summit) into another small valley (north of Taruki Height). The Height is a barrier between the Oshiga Valley and Shimabara city, and the small valley is the headwater of a river flowing into the city. The upper portion of the Oshiga Valley near the head of Taruki Height had been completely filled with pyroclastic-flow deposits until small debris flows eroded them. Cut off by debris flows in early August, the Shimabara railway resumed operation on 1 September.
Table 10. Summary of damage from volcanic activity at Unzen, 1991-92, showing inhabited houses totally and partially destroyed or inundated, uninhabited houses damaged, deaths, and injuries. Data from the Fire Defence Agency; courtesy of JMA.
| Date |
Activity Type |
Houses Totally Destroyed |
Houses Partially Destroyed |
Houses Inundated |
Uninhabited Houses Damaged |
Deaths |
Injuries |
| 15 May 1991 |
Debris flow |
0 |
0 |
0 |
1 |
0 |
0 |
| 26 May 1991 |
Pyroclastic flow |
0 |
0 |
-- |
0 |
0 |
1 |
| 03 Jun 1991 |
Pyroclastic flow |
49 |
0 |
-- |
130 |
43 |
9 |
| 08 Jun 1991 |
Pyroclastic flow |
70 |
2 |
-- |
135 |
0 |
0 |
| 11 Jun 1991 |
Falling ejecta |
11 houses damaged, along with 53 cars and 2 helicopters (on land) |
| 30 Jun 1991 |
Debris flow |
49 |
28 |
21 |
104 |
0 |
1 |
| 15 Sep 1991 |
Pyroclastic flow |
53 |
0 |
-- |
165 |
0 |
0 |
| 08 Aug 1992 |
Pyroclastic flow |
5 |
0 |
-- |
12 |
0 |
0 |
| 08-15 Aug 1992 |
Debris flow |
28 |
31 |
104 |
77 |
0 |
0 |
| |
| Total |
Pyroclastic flow |
177 |
2 |
-- |
442 |
43 |
10 |
| Total |
Debris flow |
77 |
59 |
125 |
182 |
0 |
1 |
Seismically detected pyroclastic flows varied from 4 to 26/day in August, for a total of 357 during the month, similar to previous months. Ash clouds from these flows usually rose ~ 1 km; maximum heights were 1.2 km on 8 and 13 August. Ash fell to the E on Shimabara city, Fukae town, and Unzen spa. The number of evacuees was halved to 3,017 on 9 September. Volcanic gas was emitted from dome 3 and a graben area. Gas from a vent in Jigokuato crater was at ~ 800°C, constant since May 1992, according to a direct temperature-probe measurement by Kyushu University's Shimabara Earthquake and Volcano Observatory.
A total of 3,125 earthquakes was recorded in August, at rates of 20-200 per day. The 632 events recorded on 11 September were a new high for the current activity. Earthquake swarms were detected on 13-14, 17, and 31 August. These were located 20 km W of the summit at ~ 15 km depth in Tachibana Bay, in the westernmost area of previous seismicity there. Seismic activity in Tachibana Bay had been low since August 1991. Five shocks from the swarms were felt at UWS . . ., the first felt there since 1 April. The largest shock was M 4.5 at 0912 on 13 August.
Geologic Background. The massive Unzendake volcanic complex comprises much of the Shimabara Peninsula east of the city of Nagasaki. An E-W graben, 30-40 km long, extends across the peninsula. Three large stratovolcanoes with complex structures, Kinugasa on the north, Fugen-dake at the east-center, and Kusenbu on the south, form topographic highs on the broad peninsula. Fugendake and Mayuyama volcanoes in the east-central portion of the andesitic-to-dacitic volcanic complex have been active during the Holocene. The Mayuyama lava dome complex, located along the eastern coast west of Shimabara City, formed about 4000 years ago and was the source of a devastating 1792 CE debris avalanche and tsunami. Historical eruptive activity has been restricted to the summit and flanks of Fugendake. The latest activity during 1990-95 formed a lava dome at the summit, accompanied by pyroclastic flows that caused fatalities and damaged populated areas near Shimabara City.
Information Contacts: S. Nakada, Kyushu Univ; JMA.
Villarrica (Chile) — August 1992 Cite this Report
Villarrica
Chile
39.42°S, 71.93°W; summit elev. 2847 m
All times are local (unless otherwise noted)
Phreatomagmatic explosions and intense fumarolic activity
Phreatic explosions 300-400 m high were observed from a town 15 km from the volcano every two minutes beginning at 1350 on 11 September. Fumarolic activity was intense. Activity decreased on 14 September. Seismicity was recorded earlier this year during March-May.
Geologic Background. The glacier-covered Villarrica stratovolcano, in the northern Lakes District of central Chile, is ~15 km south of the city of Pucon. A 2-km-wide caldera that formed about 3,500 years ago is located at the base of the presently active, dominantly basaltic to basaltic andesite cone at the NW margin of a 6-km-wide Pleistocene caldera. More than 30 scoria cones and fissure vents are present on the flanks. Plinian eruptions and pyroclastic flows that have extended up to 20 km from the volcano were produced during the Holocene. Lava flows up to 18 km long have issued from summit and flank vents. Eruptions documented since 1558 CE have consisted largely of mild-to-moderate explosive activity with occasional lava effusion. Glaciers cover 40 km2 of the volcano, and lahars have damaged towns on its flanks.
Information Contacts: G. Fuentealba and M. Murillo, Univ de la Frontera.