Recently Published Bulletin Reports
Erebus (Antarctica) Lava lake remains active; most thermal alerts recorded since 2019
Rincon de la Vieja (Costa Rica) Frequent phreatic explosions during July-December 2023
Bezymianny (Russia) Explosion on 18 October 2023 sends ash plume 8 km high; lava flows and incandescent avalanches
Kilauea (United States) Low-level lava effusions in the lava lake at Halema’uma’u during July-December 2022
Nyamulagira (DR Congo) Lava flows and thermal activity during May-October 2023
Bagana (Papua New Guinea) Explosions, ash plumes, ashfall, and lava flows during April-September 2023
Mayon (Philippines) Lava flows, pyroclastic flows, ash emissions, and seismicity during April-September 2023
Nishinoshima (Japan) Eruption plumes and gas-and-steam plumes during May-August 2023
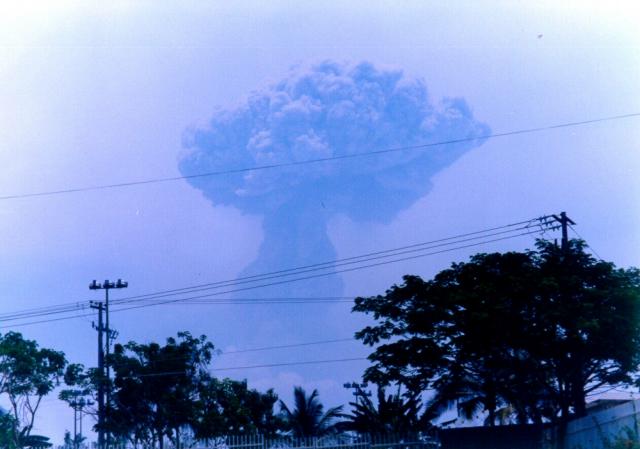
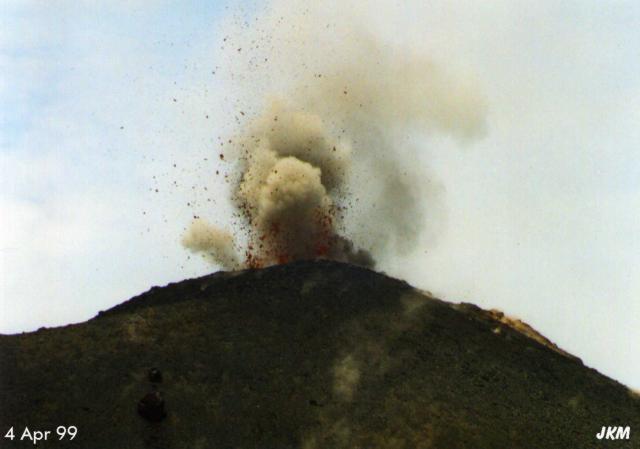
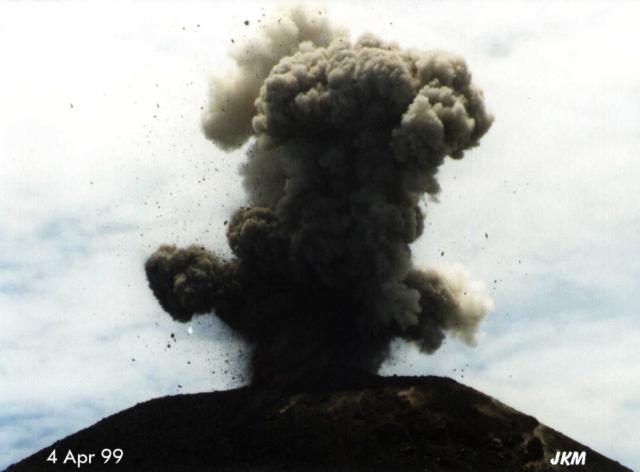
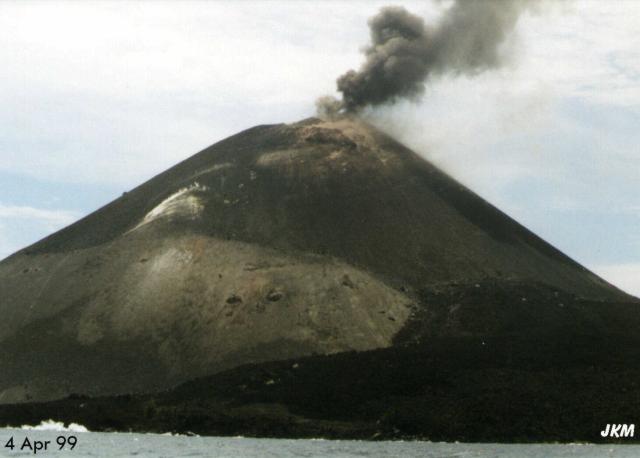
Krakatau (Indonesia) White gas-and-steam plumes and occasional ash plumes during May-August 2023
Villarrica (Chile) Strombolian activity, gas-and-ash emissions, and crater incandescence during April-September 2023
Merapi (Indonesia) Frequent incandescent avalanches during April-September 2023
Ebeko (Russia) Moderate explosive activity with ash plumes continued during June-November 2023
Erebus (Antarctica) — January 2024  Cite this Report
Erebus
Antarctica
77.53°S, 167.17°E; summit elev. 3794 m
All times are local (unless otherwise noted)
Lava lake remains active; most thermal alerts recorded since 2019
The lava lake in the summit crater of Erebus has been active since at least 1972. Located in Antarctica overlooking the McMurdo Station on Ross Island, it is the southernmost active volcano on the planet. Because of the remote location, activity is primarily monitored by satellites. This report covers activity during 2023.
The number of thermal alerts recorded by the Hawai'i Institute of Geophysics and Planetology’s MODVOLC Thermal Alerts System increased considerably in 2023 compared to the years 2020-2022 (table 9). In contrast to previous years, the MODIS instruments aboard the Aqua and Terra satellites captured data from Erebus every month during 2023. Consistent with previous years, the lowest number of anomalous pixels were recorded in January, November, and December.
Table 9. Number of monthly MODIS-MODVOLC thermal alert pixels recorded at Erebus during 2017-2023. See BGVN 42:06 for data from 2000 through 2016. The table was compiled using data provided by the HIGP – MODVOLC Thermal Alerts System.
| Year |
Jan |
Feb |
Mar |
Apr |
May |
Jun |
Jul |
Aug |
Sep |
Oct |
Nov |
Dec |
SUM |
| 2017 |
0 |
21 |
9 |
0 |
0 |
1 |
11 |
61 |
76 |
52 |
0 |
3 |
234 |
| 2018 |
0 |
21 |
58 |
182 |
55 |
17 |
137 |
172 |
103 |
29 |
0 |
0 |
774 |
| 2019 |
2 |
21 |
162 |
151 |
55 |
56 |
75 |
53 |
29 |
19 |
1 |
0 |
624 |
| 2020 |
0 |
2 |
16 |
18 |
4 |
4 |
1 |
3 |
18 |
3 |
1 |
6 |
76 |
| 2021 |
0 |
9 |
1 |
0 |
2 |
56 |
46 |
47 |
35 |
52 |
5 |
3 |
256 |
| 2022 |
1 |
13 |
55 |
22 |
15 |
32 |
39 |
19 |
31 |
11 |
0 |
0 |
238 |
| 2023 |
2 |
33 |
49 |
82 |
41 |
32 |
70 |
64 |
42 |
17 |
5 |
11 |
448 |
Sentinel-2 infrared images showed one or two prominent heat sources within the summit crater, accompanied by adjacent smaller sources, similar to recent years (see BGVN 46:01, 47:02, and 48:01). A unique image was obtained on 25 November 2023 by the OLI-2 (Operational Land Imager-2) on Landsat 9, showing the upper part of the volcano surrounded by clouds (figure 32).
Geologic Background. Mount Erebus, the world's southernmost historically active volcano, overlooks the McMurdo research station on Ross Island. It is the largest of three major volcanoes forming the crudely triangular Ross Island. The summit of the dominantly phonolitic volcano has been modified by one or two generations of caldera formation. A summit plateau at about 3,200 m elevation marks the rim of the youngest caldera, which formed during the late-Pleistocene and within which the modern cone was constructed. An elliptical 500 x 600 m wide, 110-m-deep crater truncates the summit and contains an active lava lake within a 250-m-wide, 100-m-deep inner crater; other lava lakes are sometimes present. The glacier-covered volcano was erupting when first sighted by Captain James Ross in 1841. Continuous lava-lake activity with minor explosions, punctuated by occasional larger Strombolian explosions that eject bombs onto the crater rim, has been documented since 1972, but has probably been occurring for much of the volcano's recent history.
Information Contacts: Hawai'i Institute of Geophysics and Planetology (HIGP) - MODVOLC Thermal Alerts System, School of Ocean and Earth Science and Technology (SOEST), Univ. of Hawai'i, 2525 Correa Road, Honolulu, HI 96822, USA (URL: http://modis.higp.hawaii.edu/); Copernicus Browser, Copernicus Data Space Ecosystem, European Space Agency (URL: https://dataspace.copernicus.eu/browser/); NASA Earth Observatory, EOS Project Science Office, NASA Goddard Space Flight Center, Goddard, Maryland, USA (URL: https://earthobservatory.nasa.gov/images/152134/erebus-breaks-through).
Rincon de la Vieja (Costa Rica) — January 2024 Cite this Report
Rincon de la Vieja
Costa Rica
10.83°N, 85.324°W; summit elev. 1916 m
All times are local (unless otherwise noted)
Frequent phreatic explosions during July-December 2023
Rincón de la Vieja is a volcanic complex in Costa Rica with a hot convecting acid lake that exhibits frequent weak phreatic explosions, gas-and-steam emissions, and occasional elevated sulfur dioxide levels (BGVN 45:10, 46:03, 46:11). The current eruption period began June 2021. This report covers activity during July-December 2023 and is based on weekly bulletins and occasional daily reports from the Observatorio Vulcanologico Sismologica de Costa Rica-Universidad Nacional (OVSICORI-UNA).
Numerous weak phreatic explosions continued during July-December 2023, along with gas-and-steam emissions and plumes that rose as high as 3 km above the crater rim. Many weekly OVSICORI-UNA bulletins included the previous week's number of explosions and emissions (table 9). For many explosions, the time of explosion was given (table 10). Frequent seismic activity (long-period earthquakes, volcano-tectonic earthquakes, and tremor) accompanied the phreatic activity.
Table 9. Number of reported weekly phreatic explosions and gas-and-steam emissions at Rincón de la Vieja, July-December 2023. Counts are reported for the week before the Weekly Bulletin date; not all reports included these data. Courtesy of OVSICORI-UNA.
| OVSICORI Weekly Bulletin |
Number of explosions |
Number of emissions |
| 28 Jul 2023 |
6 |
14 |
| 4 Aug 2023 |
10 |
12 |
| 1 Sep 2023 |
13 |
11 |
| 22 Sep 2023 |
12 |
13 |
| 29 Sep 2023 |
6 |
11 |
| 6 Oct 2023 |
12 |
5 |
| 13 Oct 2023 |
7 |
9 |
| 20 Oct 2023 |
1 |
15 |
| 27 Oct 2023 |
3 |
23 |
| 3 Nov 2023 |
3 |
10 |
| 17 Nov 2023 |
0 |
Some |
| 24 Nov 2023 |
0 |
14 |
| 8 Dec 2023 |
4 |
16 |
| 22 Dec 2023 |
8 |
18 |
Table 10. Summary of activity at Rincón de la Vieja during July-December 2023. Weak phreatic explosions and gas emissions are noted where the time of explosion was indicated in the weekly or daily bulletins. Height of plumes or emissions are distance above the crater rim. Courtesy of OVSICORI-UNA.
| Date |
Time |
Description of Activity |
| 1 Jul 2023 |
0156 |
Explosion. |
| 2 Jul 2023 |
0305 |
Explosion. |
| 4 Jul 2023 |
0229, 0635 |
Event at 0635 produced a gas-and-steam plume that rose 700 m and drifted W; seen by residents in Liberia (21 km SW). |
| 9 Jul 2023 |
1843 |
Explosion. |
| 21 Jul 2023 |
0705 |
Explosion. |
| 26 Jul 2023 |
1807 |
Explosion. |
| 28 Jul 2023 |
0802 |
Explosion generated a gas-and-steam plume that rose 500 m. |
| 30 Jul 2023 |
1250 |
Explosion. |
| 31 Jul 2023 |
2136 |
Explosion. |
| 11 Aug 2023 |
0828 |
Explosion. |
| 18 Aug 2023 |
1304 |
Explosion. |
| 21 Aug 2023 |
1224 |
Explosion generated gas-and-steam plumes rose 500-600 m. |
| 22 Aug 2023 |
0749 |
Explosion generated gas-and-steam plumes rose 500-600 m. |
| 24 Aug 2023 |
1900 |
Explosion. |
| 25 Aug 2023 |
0828 |
Event produced a steam-and-gas plume that rose 3 km and drifted NW. |
| 27-28 Aug 2023 |
0813 |
Four small events; the event at 0813 on 28 August lasted two minutes and generated a steam-and-gas plume that rose 2.5 km. |
| 1 Sep 2023 |
1526 |
Explosion generated plume that rose 2 km and ejected material onto the flanks. |
| 2-3 Sep 2023 |
- |
Small explosions detected in infrasound data. |
| 4 Sep 2023 |
1251 |
Gas-and-steam plume rose 1 km and drifted W. |
| 7 Nov 2023 |
1113 |
Explosion. |
| 8 Nov 2023 |
0722 |
Explosion. |
| 12 Nov 2023 |
0136 |
Small gas emissions. |
| 14 Nov 2023 |
0415 |
Small gas emissions. |
According to OVSICORI-UNA, during July-October the average weekly sulfur dioxide (SO2) flux ranged from 68 to 240 tonnes/day. However, in mid-November the flux increased to as high as 334 tonnes/day, the highest value measured in recent years. The high SO2 flux in mid-November was also detected by the TROPOMI instrument on the Sentinel-5P satellite (figure 43).
Geologic Background. Rincón de la Vieja, the largest volcano in NW Costa Rica, is a remote volcanic complex in the Guanacaste Range. The volcano consists of an elongated, arcuate NW-SE-trending ridge constructed within the 15-km-wide early Pleistocene Guachipelín caldera, whose rim is exposed on the south side. Sometimes known as the "Colossus of Guanacaste," it has an estimated volume of 130 km3 and contains at least nine major eruptive centers. Activity has migrated to the SE, where the youngest-looking craters are located. The twin cone of Santa María volcano, the highest peak of the complex, is located at the eastern end of a smaller, 5-km-wide caldera and has a 500-m-wide crater. A Plinian eruption producing the 0.25 km3 Río Blanca tephra about 3,500 years ago was the last major magmatic eruption. All subsequent eruptions, including numerous historical eruptions possibly dating back to the 16th century, have been from the prominent active crater containing a 500-m-wide acid lake located ENE of Von Seebach crater.
Information Contacts: Observatorio Vulcanológico Sismológica de Costa Rica-Universidad Nacional (OVSICORI-UNA), Apartado 86-3000, Heredia, Costa Rica (URL: http://www.ovsicori.una.ac.cr/); NASA Global Sulfur Dioxide Monitoring Page, Atmospheric Chemistry and Dynamics Laboratory, NASA Goddard Space Flight Center (NASA/GSFC), 8800 Greenbelt Road, Goddard MD 20771, USA (URL: https://so2.gsfc.nasa.gov/).
Bezymianny (Russia) — November 2023 Cite this Report
Bezymianny
Russia
55.972°N, 160.595°E; summit elev. 2882 m
All times are local (unless otherwise noted)
Explosion on 18 October 2023 sends ash plume 8 km high; lava flows and incandescent avalanches
Bezymianny, located on Russia’s Kamchatka Peninsula, has had eruptions since 1955 characterized by dome growth, explosions, pyroclastic flows, ash plumes, and ashfall. Activity during November 2022-April 2023 included gas-and-steam emissions, lava dome collapses generating avalanches, and persistent thermal activity. Similar eruptive activity continued from May through October 2023, described here based on information from weekly and daily reports of the Kamchatka Volcano Eruptions Response Team (KVERT), notices from Tokyo VAAC (Volcanic Ash Advisory Center), and from satellite data.
Overall activity decreased after the strong period of activity in late March through April 2023, which included ash explosions during 29 March and 7-8 April 2023 that sent plumes as high as 10-12 km altitude, along with dome growth and lava flows (BGVN 48:05). This reduced activity can be seen in the MIROVA thermal detection system graph (figure 56), which was consistent with data from the MODVOLC thermal detection system and with Sentinel-2 satellite images that showed persistent hotspots in the summit crater when conditions allowed observations. A renewed period of strong activity began in mid-October 2023.
Activity increased significantly on 17 October 2023 when large collapses began during 0700-0830 on the E flanks of the lava dome and continued to after 0930 the next day (figure 57). Ash plumes rose to an altitude of 4.5-5 km, extending 220 km NNE by 18 October. A large explosion at 1630 on 18 October produced an ash plume that rose to an altitude of 11 km (8 km above the summit) and drifted NNE and then NW, extending 900 km NW within two days at an altitude of 8 km. Minor ashfall was noted in Kozyrevsk (45 km WNW). At 0820 on 20 October an ash plume was identified in satellite images drifting 100 km ENE at altitudes of 4-4.5 km.
Lava flows and hot avalanches from the dome down the SE flank continued over the next few days, including 23 October when clear conditions allowed good observations (figures 58 and 59). A large thermal anomaly was observed over the volcano through 24 October, and in the summit crater on 30 October (figure 60). Strong fumarolic activity continued, with numerous avalanches and occasional incandescence. By the last week of October, volcanic activity had decreased to a level consistent with that earlier in the reporting period.
Aviation warnings were frequently updated during 17-20 October. KVERT issued a Volcano Observatory Notice for Aviation (VONA) on 17 October at 1419 and 1727 (0219 and 0527 UTC) raising the Aviation Color Code (ACC) from Yellow to Orange (second highest level). The next day, KVERT issued a VONA at 1705 (0505 UTC) raising the ACC to Red (highest level) but lowered it back to Orange at 2117 (0917 UTC). After another decrease to Yellow and back to Orange, the ACC was reduced to Yellow on 20 October at 1204 (0004 UTC). In addition, the Tokyo VAAC issued a series of Volcanic Ash Advisories beginning on 16 October and continuing through 30 October.
Geologic Background. The modern Bezymianny, much smaller than its massive neighbors Kamen and Kliuchevskoi on the Kamchatka Peninsula, was formed about 4,700 years ago over a late-Pleistocene lava-dome complex and an edifice built about 11,000-7,000 years ago. Three periods of intensified activity have occurred during the past 3,000 years. The latest period, which was preceded by a 1,000-year quiescence, began with the dramatic 1955-56 eruption. This eruption, similar to that of St. Helens in 1980, produced a large open crater that was formed by collapse of the summit and an associated lateral blast. Subsequent episodic but ongoing lava-dome growth, accompanied by intermittent explosive activity and pyroclastic flows, has largely filled the 1956 crater.
Information Contacts: Kamchatka Volcanic Eruptions Response Team (KVERT), Far Eastern Branch, Russian Academy of Sciences, 9 Piip Blvd., Petropavlovsk-Kamchatsky, 683006, Russia (URL: http://www.kscnet.ru/ivs/kvert/); Kamchatka Volcanological Station, Kamchatka Branch of Geophysical Survey, (KB GS RAS), Klyuchi, Kamchatka Krai, Russia (URL: http://volkstat.ru/); Tokyo Volcanic Ash Advisory Center (VAAC), 1-3-4 Otemachi, Chiyoda-ku, Tokyo 100-8122, Japan (URL: http://ds.data.jma.go.jp/svd/vaac/data/); Hawai'i Institute of Geophysics and Planetology (HIGP) - MODVOLC Thermal Alerts System, School of Ocean and Earth Science and Technology (SOEST), Univ. of Hawai'i, 2525 Correa Road, Honolulu, HI 96822, USA (URL: http://modis.higp.hawaii.edu/); MIROVA (Middle InfraRed Observation of Volcanic Activity), a collaborative project between the Universities of Turin and Florence (Italy) supported by the Centre for Volcanic Risk of the Italian Civil Protection Department (URL: http://www.mirovaweb.it/); Copernicus Browser, Copernicus Data Space Ecosystem, European Space Agency (URL: https://dataspace.copernicus.eu/browser/).chr
Kilauea (United States) — January 2023 Cite this Report
Kilauea
United States
19.421°N, 155.287°W; summit elev. 1222 m
All times are local (unless otherwise noted)
Low-level lava effusions in the lava lake at Halema’uma’u during July-December 2022
Kīlauea is the southeastern-most volcano in Hawaii and overlaps the E flank of the Mauna Loa volcano. Its East Rift Zone (ERZ) has been intermittently active for at least 2,000 years. An extended eruption period began in January 1983 and was characterized by open lava lakes and lava flows from the summit caldera and the East Rift Zone. During May 2018 magma migrated into the Lower East Rift Zone (LERZ) and opened 24 fissures along a 6-km-long NE-trending fracture zone that produced lava flows traveling in multiple directions. As lava emerged from the fissures, the lava lake at Halema'uma'u drained and explosions sent ash plumes to several kilometers altitude (BGVN 43:10).
The current eruption period started during September 2021 and has recently been characterized by lava effusions, spatter, and sulfur dioxide emissions in the active Halema’uma’u lava lake (BGVN 47:08). Lava effusions, some spatter, and sulfur dioxide emissions have continued during this reporting period of July through December 2022 using daily reports, volcanic activity notices, and abundant photo, map, and video data from the US Geological Survey's (USGS) Hawaiian Volcano Observatory (HVO).
Summary of activity during July-December 2022. Low-level effusions have continued at the western vent of the Halema’uma’u crater during July through early December 2022. Occasional weak ooze-outs (also called lava break outs) would occur along the margins of the crater floor. The overall level of the active lava lake throughout the reporting period gradually increased due to infilling, however it stagnated in mid-September (table 13). During September through November, activity began to decline, though lava effusions persisted at the western vent. By 9 December, the active part of the lava lake had completely crusted over, and incandescence was no longer visible.
Table 13. Summary of measurements taken during overflights at Kīlauea that show a gradual increase in the active lava lake level and the volume of lava effused since 29 September 2021. Lower activity was reported during September-October. Data collected during July-December 2022. Courtesy of HVO.
| Date: |
Level of the active lava lake (m): |
Cumulative volume of lava effused (million cubic meters): |
| 7 Jul 2022 |
130 |
95 |
| 19 Jul 2022 |
133 |
98 |
| 4 Aug 2022 |
136 |
102 |
| 16 Aug 2022 |
137 |
104 |
| 12 Sep 2022 |
143 |
111 |
| 5 Oct 2022 |
143 |
111 |
| 28 Oct 2022 |
143 |
111 |
Activity during July 2022. Lava effusions were reported from the western vent in the Halema’uma’u crater, along with occasional weak ooze-outs along the margins of the crater floor. The height of the lava lake was variable due to deflation-inflation tilt events; for example, the lake level dropped approximately 3-4 m during a summit deflation-inflation event reported on 1 July. Webcam images taken during the night of 6-12 July showed intermittent low-level spattering at the western vent that rose less than 10 m above the vent (figure 519). Measurements made during an overflight on 7 July indicated that the crater floor was infilled about 130 m and that 95 million cubic meters of lava had been effused since 29 September 2021. A single, relatively small lava ooze-out was active to the S of the lava lake. Around midnight on 8 July there were two brief periods of lava overflow onto the lake margins. On 9 July lava ooze-outs were reported near the SE and NE edges of the crater floor and during 10-11 July they occurred near the E, NE, and NW edges. On 16 July crater incandescence was reported, though the ooze-outs and spattering were not visible. On 18 July overnight webcam images showed incandescence in the western vent complex and two ooze-outs were reported around 0000 and 0200 on 19 July. By 0900 there were active ooze-outs along the SW edge of the crater floor. Measurements made from an overflight on 19 July indicated that the crater floor was infilled about 133 m and 98 million cubic meters of lava had erupted since 29 September 2021 (figure 520). On 20 July around 1600 active ooze-outs were visible along the N edge of the crater, which continued through the next day. Extensive ooze-outs occurred along the W margin during 24 July until 1900; on 26 July minor ooze-outs were noted along the N margin. Minor spattering was visible on 29 July along the E margin of the lake. The sulfur dioxide emission rates ranged 650-2,800 tons per day (t/d), the higher of which was measured on 8 July (figure 519).
Activity during August 2022. The eruption continued in the Halema’uma’u crater at the western vent. According to HVO the lava in the active lake remained at the level of the bounding levees. Occasional minor ooze-outs were observed along the margins of the crater floor. Strong nighttime crater incandescence was visible after midnight on 6 August over the western vent cone. During 6-7 August scattered small lava lobes were active along the crater floor and incandescence persisted above the western vent through 9 August. During 7-9 August HVO reported a single lava effusion source was active along the NW margin of the crater floor. Measurements from an overflight on 4 August indicated that the crater floor was infilled about 136 m total and that 102 million cubic meters of lava had been erupted since the start of the eruption. Lava breakouts were reported along the N, NE, E, S, and W margins of the crater during 10-16 August. Another overflight survey conducted on 16 August indicated that the crater floor infilled about 137 m and 104 million cubic meters of lava had been erupted since September 2021. Measured sulfur dioxide emissions rates ranged 1,150-2,450 t/d, the higher of which occurred on 8 August.
Activity during September 2022. During September, lava effusion continued from the western vent into the active lava lake and onto the crater floor. Intermittent minor ooze-outs were reported through the month. A small ooze-out was visible on the W crater floor margin at 0220 on 2 September, which showed decreasing surface activity throughout the day, but remained active through 3 September. On 3 September around 1900 a lava outbreak occurred along the NW margin of the crater floor but had stopped by the evening of 4 September. Field crews monitoring the summit lava lake on 9 September observed spattering on the NE margin of the lake that rose no higher than 10 m, before falling back onto the lava lake crust (figure 521). Overflight measurements on 12 September indicated that the crater floor was infilled a total of 143 m and 111 million cubic meters of lava had been erupted since September 2021. Extensive breakouts in the W and N part of the crater floor were reported at 1600 on 20 September and continued into 26 September. The active part of the lava lake dropped by 10 m while other parts of the crater floor dropped by several meters. Summit tiltmeters recorded a summit seismic swarm of more than 80 earthquakes during 1500-1800 on 21 September, which occurred about 1.5 km below Halema’uma’u; a majority of these were less than Mw 2. By 22 September the active part of the lava lake was infilled about 2 m. On 23 September the western vent areas exhibited several small spatter cones with incandescent openings, along with weak, sporadic spattering (figure 522). The sulfur dioxide emission rate ranged from 930 t/d to 2,000 t/d, the higher of which was measured on 6 September.
Activity during October 2022. Activity during October declined slightly compared to previous months, though lava effusions persisted from the western vent into the active lava lake and onto the crater floor during October (figure 523). Slight variations in the lava lake were noted throughout the month. HVO reported that around 0600 on 3 October the level of the lava lake has lowered slightly. Overflight measurements taken on 5 October indicated that the crater floor was infilled a total of about 143 m and that 111 million cubic meters of lava had been effused since September 2021. During 6-7 October the lake gradually rose 0.5 m. Sulfur dioxide measurements made on 22 October had an emission rate of 700 t/d. Another overflight taken on 28 October showed that there was little to no change in the elevation of the crater floor: the crater floor was infilled a total of 143 m and 111 million cubic meters of lava had erupted since the start of the eruption.
Activity during November 2022. Activity remained low during November, though HVO reported that lava from the western vent continued to effuse into the active lava lake and onto the crater floor throughout the month. The rate of sulfur dioxide emissions during November ranged from 300-600 t/d, the higher amount of which occurred on 9 November.
Activity during December 2022. Similar low activity was reported during December, with lava effusing from the western vent into the active lava lake and onto the crater floor. During 4-5 December the active part of the lava lake was slightly variable in elevation and fluctuated within 1 m. On 9 December HVO reported that lava was no longer erupting from the western vent in the Halema’uma’u crater and that sulfur dioxide emissions had returned to near pre-eruption background levels; during 10-11 December, the lava lake had completely crusted over, and no incandescence was visible (figure 524). Time lapse camera images covering the 4-10 December showed that the crater floor showed weak deflation and no inflation. Some passive events of crustal overturning were reported during 14-15 December, which brought fresh incandescent lava to the lake surface. The sulfur dioxide emission rate was approximately 200 t/d on 14 December. A smaller overturn event on 17 December and another that occurred around 0000 and into the morning of 20 December were also detected. A small seismic swarm was later detected on 30 December.
Geologic Background. Kilauea overlaps the E flank of the massive Mauna Loa shield volcano in the island of Hawaii. Eruptions are prominent in Polynesian legends; written documentation since 1820 records frequent summit and flank lava flow eruptions interspersed with periods of long-term lava lake activity at Halemaumau crater in the summit caldera until 1924. The 3 x 5 km caldera was formed in several stages about 1,500 years ago and during the 18th century; eruptions have also originated from the lengthy East and Southwest rift zones, which extend to the ocean in both directions. About 90% of the surface of the basaltic shield volcano is formed of lava flows less than about 1,100 years old; 70% of the surface is younger than 600 years. The long-term eruption from the East rift zone between 1983 and 2018 produced lava flows covering more than 100 km2, destroyed hundreds of houses, and added new coastline.
Information Contacts: Hawaiian Volcano Observatory (HVO), U.S. Geological Survey, PO Box 51, Hawai'i National Park, HI 96718, USA (URL: http://hvo.wr.usgs.gov/).
Nyamulagira (DR Congo) — November 2023 Cite this Report
Nyamulagira
DR Congo
1.408°S, 29.2°E; summit elev. 3058 m
All times are local (unless otherwise noted)
Lava flows and thermal activity during May-October 2023
Nyamulagira (also known as Nyamuragira) is a shield volcano in the Democratic Republic of Congo with the summit truncated by a small 2 x 2.3 km caldera with walls up to about 100 m high. Documented eruptions have occurred within the summit caldera, as well as from numerous flank fissures and cinder cones. The current eruption period began in April 2018 and has more recently been characterized by summit crater lava flows and thermal activity (BGVN 48:05). This report describes lava flows and variable thermal activity during May through October 2023, based on information from the Observatoire Volcanologique de Goma (OVG) and various satellite data.
Lava lake activity continued during May. The MIROVA (Middle InfraRed Observation of Volcanic Activity) system recorded moderate-to-strong thermal activity throughout the reporting period; activity was more intense during May and October and relatively weaker from June through September (figure 95). The MODVOLC thermal algorithm, detected a total of 209 thermal alerts. There were 143 hotspots detected during May, eight during June, nine during September, and 49 during October. This activity was also reflected in infrared satellite images, where a lava flow was visible in the NW part of the crater on 7 May and strong activity was seen in the center of the crater on 4 October (figure 96). Another infrared satellite image taken on 12 May showed still active lava flows along the NW margin of the crater. According to OVG lava effusions were active during 7-29 May and moved to the N and NW parts of the crater beginning on 9 May. Strong summit crater incandescence was visible from Goma (27 km S) during the nights of 17, 19, and 20 May (figure 97). On 17 May there was an increase in eruptive activity, which peaked at 0100 on 20 May. Notable sulfur dioxide plumes drifted NW and W during 19-20 May (figure 98). Drone footage acquired in partnership with the USGS (United States Geological Survey) on 20 May captured images of narrow lava flows that traveled about 100 m down the W flank (figure 99). Data from the Rumangabo seismic station indicated a decreasing trend in activity during 17-21 May. Although weather clouds prevented clear views of the summit, a strong thermal signature on the NW flank was visible in an infrared satellite image on 22 May, based on an infrared satellite image. On 28 May the lava flows on the upper W flank began to cool and solidify. By 29 May seismicity returned to levels similar to those recorded before the 17 May increase. Lava effusion continued but was confined to the summit crater; periodic crater incandescence was observed.
Low-level activity was noted during June through October. On 1 June OVG reported that seismicity remained at lower levels and that crater incandescence had been absent for three days, though infrared satellite imagery showed continued lava effusion in the summit crater. The lava flows on the flanks covered an estimated 0.6 km2. Satellite imagery continued to show thermal activity confined to the lava lake through October (figure 96), although no lava flows or significant sulfur dioxide emissions were reported.
Geologic Background. Africa's most active volcano, Nyamulagira (also known as Nyamuragira), is a massive high-potassium basaltic shield about 25 km N of Lake Kivu and 13 km NNW of the steep-sided Nyiragongo volcano. The summit is truncated by a small 2 x 2.3 km caldera that has walls up to about 100 m high. Documented eruptions have occurred within the summit caldera, as well as from the numerous flank fissures and cinder cones. A lava lake in the summit crater, active since at least 1921, drained in 1938, at the time of a major flank eruption. Recent lava flows extend down the flanks more than 30 km from the summit as far as Lake Kivu; extensive lava flows from this volcano have covered 1,500 km2 of the western branch of the East African Rift.
Information Contacts: Observatoire Volcanologique de Goma (OVG), Departement de Geophysique, Centre de Recherche en Sciences Naturelles, Lwiro, D.S. Bukavu, DR Congo; Hawai'i Institute of Geophysics and Planetology (HIGP) - MODVOLC Thermal Alerts System, School of Ocean and Earth Science and Technology (SOEST), Univ. of Hawai'i, 2525 Correa Road, Honolulu, HI 96822, USA (URL: http://modis.higp.hawaii.edu/); MIROVA (Middle InfraRed Observation of Volcanic Activity), a collaborative project between the Universities of Turin and Florence (Italy) supported by the Centre for Volcanic Risk of the Italian Civil Protection Department (URL: http://www.mirovaweb.it/); NASA Global Sulfur Dioxide Monitoring Page, Atmospheric Chemistry and Dynamics Laboratory, NASA Goddard Space Flight Center (NASA/GSFC), 8800 Greenbelt Road, Goddard, Maryland, USA (URL: https://so2.gsfc.nasa.gov/); Copernicus Browser, Copernicus Data Space Ecosystem, European Space Agency (URL: https://dataspace.copernicus.eu/browser/); Charles Balagizi, Goma Volcano Observatory, Departement de Geophysique, Centre de Recherche en Sciences Naturelles, Lwiro, D.S. Bukavu, DR Congo.
Bagana (Papua New Guinea) — October 2023 Cite this Report
Bagana
Papua New Guinea
6.137°S, 155.196°E; summit elev. 1855 m
All times are local (unless otherwise noted)
Explosions, ash plumes, ashfall, and lava flows during April-September 2023
The remote volcano of Bagana is located in central Bougainville Island, Papua New Guinea. Recorded eruptions date back to 1842 and activity has consisted of effusive activity that has built a small lava dome in the summit crater and occasional explosions that produced pyroclastic flows. The most recent eruption has been ongoing since February 2000 and has produced occasional explosions, ash plumes, and lava flows. More recently, activity has been characterized by ongoing effusive activity and ash emissions (BGVN 48:04). This report updates activity from April through September 2023 that has consisted of explosions, ash plumes, ashfall, and lava flows, using information from the Darwin Volcanic Ash Advisory Center (VAAC) and satellite data.
An explosive eruption was reported on 7 July that generated a large gas-and-ash plume to high altitudes and caused significant ashfall in local communities; the eruption plume had reached upper tropospheric (16-18 km altitude) altitudes by 2200, according to satellite images. Sulfur dioxide plumes were detected in satellite images on 8 July and indicated that the plume was likely a mixture of gas, ice, and ash. A report issued by the Autonomous Bougainville Government (ABG) (Torokina District, Education Section) on 10 July noted that significant ash began falling during 2000-2100 on 7 July and covered most areas in the Vuakovi, Gotana (9 km SW), Koromaketo, Laruma (25 km W) and Atsilima (27 km NW) villages. Pyroclastic flows also occurred, according to ground-based reports; small deposits confined to one drainage were inspected by RVO during an overflight on 17 July and were confirmed to be from the 7 July event. Ashfall continued until 10 July and covered vegetation, which destroyed bushes and gardens and contaminated rivers and streams.
RVO reported another eruption on 14 July. The Darwin VAAC stated that an explosive event started around 0830 on 15 July and produced an ash plume that rose to 16.5 km altitude by 1000 and drifted N, according to satellite images. The plume continued to drift N and remained visible through 1900, and by 2150 it had dissipated.
Ashfall likely from both the 7 and 15 July events impacted about 8,111 people in Torokina (20 km SW), including Tsito/Vuakovi, Gotana, Koromaketo, Kenaia, Longkogari, Kenbaki, Piva (13 km SW), and Atsinima, and in the Tsitovi district, according to ABG. Significant ashfall was also reported in Ruruvu (22 km N) in the Wakunai District of Central Bougainville, though the thickness of these deposits could not be confirmed. An evacuation was called for the villages in Wakunai, where heavy ashfall had contaminated water sources; the communities of Ruruvu, Togarau, Kakarapaia, Karauturi, Atao, and Kuritaturi were asked to evacuate to a disaster center at the Wakunai District Station, and communities in Torokina were asked to evacuate to the Piva District station. According to a news article, more than 7,000 people needed temporary accommodations, with about 1,000 people in evacuation shelters. Ashfall had deposited over a broad area, contaminating water supplies, affecting crops, and collapsing some roofs and houses in rural areas. Schools were temporarily shut down. Intermittent ash emissions continued through the end of July and drifted NNW, NW, and SW. Fine ashfall was reported on the coast of Torokina, and ash plumes also drifted toward Laruma and Atsilima.
A small explosive eruption occurred at 2130 on 28 July that ejected material from the crater vents, according to reports from Torokina, in addition to a lava flow that contained two lobes. A second explosion was detected at 2157. Incandescence from the lava flow was visible from Piva as it descended the W flank around 2000 on 29 July (figure 47). The Darwin VAAC reported that a strong thermal anomaly was visible in satellite images during 30-31 July and that ash emissions rose to 2.4 km altitude and drifted WSW on 30 July. A ground report from RVO described localized emissions at 0900 on 31 July.
The Darwin VAAC reported that ash plumes were identified in satellite imagery at 0800 and 1220 on 12 August and rose to 2.1 km and 3 km altitude and drifted NW and W, respectively. A news report stated that aid was sent to more than 6,300 people that were adversely affected by the eruption. Photos taken during 17-19 August showed ash emissions rising no higher than 1 km above the summit and drifting SE. A small explosion generated an ash plume during the morning of 19 August. Deposits from small pyroclastic flows were also captured in the photos. Satellite images captured lava flows and pyroclastic flow deposits. Two temporary seismic stations were installed near Bagana on 17 August at distances of 7 km WSW (Vakovi station) and 11 km SW (Kepox station). The Kepox station immediately started to record continuous, low-frequency background seismicity.
Satellite data. Little to no thermal activity was detected during April through mid-July 2023; only one anomaly was recorded during early April and one during early June, according to MIROVA (Middle InfraRed Observation of Volcanic Activity) data (figure 48). Thermal activity increased in both power and frequency during mid-July through September, although there were still some short gaps in detected activity. MODVOLC also detected increased thermal activity during August; thermal hotspots were detected a total of five times on 19, 20, and 27 August. Weak thermal anomalies were also captured in infrared satellite images on clear weather days throughout the reporting period on 7, 12, and 17 April, 27 May, 1, 6, 16, and 31 July, and 19 September (figure 48); a strong thermal anomaly was visible on 31 July. Distinct sulfur dioxide plumes that drifted generally NW were intermittently captured by the TROPOMI instrument on the Sentinel-5P satellite and sometimes exceeded two Dobson Units (DUs) (figure 49).
Geologic Background. Bagana volcano, in a remote portion of central Bougainville Island, is frequently active. This massive symmetrical cone was largely constructed by an accumulation of viscous andesitic lava flows. The entire edifice could have been constructed in about 300 years at its present rate of lava production. Eruptive activity is characterized by non-explosive effusion of viscous lava that maintains a small lava dome in the summit crater, although occasional explosive activity produces pyroclastic flows. Lava flows with tongue-shaped lobes up to 50 m thick and prominent levees descend the flanks on all sides.
Information Contacts: Rabaul Volcano Observatory (RVO), Geohazards Management Division, Department of Mineral Policy and Geohazards Management (DMPGM), PO Box 3386, Kokopo, East New Britain Province, Papua New Guinea; Darwin Volcanic Ash Advisory Centre (VAAC), Bureau of Meteorology, Northern Territory Regional Office, PO Box 40050, Casuarina, NT 0811, Australia (URL: http://www.bom.gov.au/info/vaac/); MIROVA (Middle InfraRed Observation of Volcanic Activity), a collaborative project between the Universities of Turin and Florence (Italy) supported by the Centre for Volcanic Risk of the Italian Civil Protection Department (URL: http://www.mirovaweb.it/); Hawai'i Institute of Geophysics and Planetology (HIGP) - MODVOLC Thermal Alerts System, School of Ocean and Earth Science and Technology (SOEST), Univ. of Hawai'i, 2525 Correa Road, Honolulu, HI 96822, USA (URL: http://modis.higp.hawaii.edu/); NASA Global Sulfur Dioxide Monitoring Page, Atmospheric Chemistry and Dynamics Laboratory, NASA Goddard Space Flight Center (NASA/GSFC), 8800 Greenbelt Road, Goddard, Maryland, USA (URL: https://so2.gsfc.nasa.gov/); Copernicus Browser, Copernicus Data Space Ecosystem, European Space Agency (URL: https://dataspace.copernicus.eu/browser/); Autonomous Bougainville Government, P.O Box 322, Buka, AROB, PNG (URL: https://abg.gov.pg/); Andrew Tupper (Twitter: @andrewcraigtupp); Simon Carn, Geological and Mining Engineering and Sciences, Michigan Technological University, 1400 Townsend Drive, Houghton, MI 49931, USA (URL: http://www.volcarno.com/, Twitter: @simoncarn); Radio NZ (URL: https://www.rnz.co.nz/news/pacific/494464/more-than-7-000-people-in-bougainville-need-temporary-accommodation-after-eruption); USAID, 1300 Pennsylvania Ave, NW, Washington DC 20004, USA (URL: https://www.usaid.gov/pacific-islands/press-releases/aug-08-2023-united-states-provides-immediate-emergency-assistance-support-communities-affected-mount-bagana-volcanic-eruptions).
Mayon (Philippines) — October 2023 Cite this Report
Mayon
Philippines
13.257°N, 123.685°E; summit elev. 2462 m
All times are local (unless otherwise noted)
Lava flows, pyroclastic flows, ash emissions, and seismicity during April-September 2023
Mayon is located in the Philippines and has steep upper slopes capped by a small summit crater. Historical eruptions date back to 1616 CE that have been characterized by Strombolian eruptions, lava flows, pyroclastic flows, and mudflows. Eruptions mostly originated from a central conduit. Pyroclastic flows and mudflows have commonly descended many of the approximately 40 drainages that surround the volcano. The most recent eruption occurred during June through October 2022 and consisted of lava dome growth and gas-and-steam emissions (BGVN 47:12). A new eruption was reported during late April 2023 and has included lava flows, pyroclastic density currents, ash emissions, and seismicity. This report covers activity during April through September 2023 based on daily bulletins from the Philippine Institute of Volcanology and Seismology (PHIVOLCS).
During April through September 2023, PHIVOLCS reported near-daily rockfall events, frequent volcanic earthquakes, and sulfur dioxide measurements. Gas-and-steam emissions rose 100-900 m above the crater and drifted in different directions. Nighttime crater incandescence was often visible during clear weather and was accompanied by incandescent avalanches of material. Activity notably increased during June when lava flows were reported on the S, SE, and E flanks (figure 52). The MIROVA graph (Middle InfraRed Observation of Volcanic Activity) showed strong thermal activity coincident with these lava flows, which remained active through September (figure 53). According to the MODVOLC thermal algorithm, a total of 110 thermal alerts were detected during the reporting period: 17 during June, 40 during July, 27 during August, and 26 during September. During early June, pyroclastic density currents (PDCs) started to occur more frequently.
Low activity was reported during much of April and May; gas-and-steam emissions rose 100-900 m above the crater and generally drifted in different directions. A total of 52 rockfall events and 18 volcanic earthquakes were detected during April and 147 rockfall events and 13 volcanic events during May. Sulfur dioxide flux measurements ranged between 400-576 tons per day (t/d) during April, the latter of which was measured on 29 April and between 162-343 t/d during May, the latter of which was measured on 13 May.
Activity during June increased, characterized by lava flows, pyroclastic density currents (PDCs), crater incandescence and incandescent rockfall events, gas-and-steam emissions, and continued seismicity. Weather clouds often prevented clear views of the summit, but during clear days, moderate gas-and-steam emissions rose 100-2,500 m above the crater and drifted in multiple directions. A total of 6,237 rockfall events and 288 volcanic earthquakes were detected. The rockfall events often deposited material on the S and SE flanks within 700-1,500 m of the summit crater and ash from the events drifted SW, S, SE, NE, and E. Sulfur dioxide emissions ranged between 149-1,205 t/d, the latter of which was measured on 10 June. Short-term observations from EDM and electronic tiltmeter monitoring indicated that the upper slopes were inflating since February 2023. Longer-term ground deformation parameters based on EDM, precise leveling, continuous GPS, and electronic tilt monitoring indicated that the volcano remained inflated, especially on the NW and SE flanks. At 1000 on 5 June the Volcano Alert Level (VAL) was raised to 2 (on a 0-5 scale). PHIVOLCS noted that although low-level volcanic earthquakes, ground deformation, and volcanic gas emissions indicated unrest, the steep increase in rockfall frequency may indicate increased dome activity.
A total of 151 dome-collapse PDCs occurred during 8-9 and 11-30 June, traveled 500-2,000 m, and deposited material on the S flank within 2 km of the summit crater. During 8-9 June the VAL was raised to 3. At approximately 1947 on 11 June lava flow activity was reported; two lobes traveled within 500 m from the crater and deposited material on the S (Mi-isi), SE (Bonga), and E (Basud) flanks. Weak seismicity accompanied the lava flow and slight inflation on the upper flanks. This lava flow remained active through 30 June, moving down the S and SE flank as far as 2.5 km and 1.8 km, respectively and depositing material up to 3.3 km from the crater. During 15-16 June traces of ashfall from the PDCs were reported in Sitio Buga, Nabonton, City of Ligao and Purok, and San Francisco, Municipality of Guinobatan. During 28-29 June there were two PDCs generated by the collapse of the lava flow front, which generated a light-brown ash plume 1 km high. Satellite monitors detected significant concentrations of sulfur dioxide beginning on 29 June. On 30 June PDCs primarily affected the Basud Gully on the E flank, the largest of which occurred at 1301 and lasted eight minutes, based on the seismic record. Four PDCs generated between 1800 and 2000 that lasted approximately four minutes each traveled 3-4 km on the E flank and generated an ash plume that rose 1 km above the crater and drifted N and NW. Ashfall was recorded in Tabaco City.
Similar strong activity continued during July; slow lava effusion remained active on the S and SE flanks and traveled as far as 2.8 km and 2.8 km, respectively and material was deposited as far as 4 km from the crater. There was a total of 6,983 rockfall events and 189 PDCs that affected the S, SE, and E flanks. The volcano network detected a total of 2,124 volcanic earthquakes. Continuous gas-and-steam emissions rose 200-2,000 m above the crater and drifted in multiple directions. Sulfur dioxide emissions averaged 792-4,113 t/d, the latter of which was measured on 28 July. During 2-4 July three PDCs were generated from the collapse of the lava flow and resulting light brown plumes rose 200-300 m above the crater. Continuous tremor pulses were reported beginning at 1547 on 3 July through 7 July at 1200, at 2300 on 8 July and going through 0300 on 10 July, and at 2300 on 16 July, as recorded by the seismic network. During 6-9 July there were 10 lava flow-collapse-related PDCs that generated light brown plumes 300-500 m above the crater. During 10-11 July light ashfall was reported in some areas of Mabinit, Legazpi City, Budiao and Salvacion, Daraga, and Camalig, Albay. By 18 July the lava flow advanced 600 m on the E flank as well.
During 1733 on 18 July and 0434 on 19 July PHIVOLCS reported 30 “ashing” events, which are degassing events accompanied by audible thunder-like sounds and entrained ash at the crater, which produced short, dark plumes that drifted SW. These events each lasted 20-40 seconds, and plume heights ranged from 150-300 m above the crater, as recorded by seismic, infrasound, visual, and thermal monitors. Three more ashing events occurred during 19-20 July. Short-term observations from electronic tilt and GPS monitoring indicate deflation on the E lower flanks in early July and inflation on the NW middle flanks during the third week of July. Longer-term ground deformation parameters from EDM, precise leveling, continuous GPS, and electronic tilt monitoring indicated that the volcano was still generally inflated relative to baseline levels. A short-lived lava pulse lasted 28 seconds at 1956 on 21 July, which was accompanied by seismic and infrasound signals. By 22 July, the only lava flow that remained active was on the SE flank, and continued to extend 3.4 km, while those on the S and E flanks weakened markedly. One ashing event was detected during 30-31 July, whereas there were 57 detected during 31 July-1 August; according to PHIVOLCS beginning at approximately 1800 on 31 July eruptive activity was dominated by phases of intermittent ashing, as well as increased in the apparent rates of lava effusion from the summit crater. The ashing phases consisted of discrete events recorded as low-frequency volcanic earthquakes (LFVQ) typically 30 seconds in duration, based on seismic and infrasound signals. Gray ash plume rose 100 m above the crater and generally drifted NE. Shortly after these ashing events began, new lava began to effuse rapidly from the crater, feeding the established flowed on the SE, E, and E flanks and generating frequent rockfall events.
Intensified unrest persisted during August. There was a total of 4,141 rockfall events, 2,881 volcanic earthquakes, which included volcanic tremor events, 32 ashing events, and 101 PDCs detected throughout the month. On clear weather days, gas-and-steam emissions rose 300-1,500 m above the crater and drifted in different directions (figure 54). Sulfur dioxide emissions averaged 735-4,756 t/d, the higher value of which was measured on 16 August. During 1-2 August the rate of lava effusion decreased, but continued to feed the flows on the SE, S, and E flanks, maintaining their advances to 3.4 km, 2.8 km, and 1.1 km from the crater, respectively (figure 55). Rockfall and PDCs generated by collapses at the lava flow margins and from the summit dome deposited material within 4 km of the crater. During 3-4 August there were 10 tremor events detected that lasted 1-4 minutes. Short-lived lava pulse lasted 35 seconds and was accompanied by seismic and infrasound signals at 0442 on 6 August. Seven collapses were recorded at the front of the lava flow during 12-14 August.
During September, similar activity of slow lava effusion, PDCs, gas-and-steam emissions, and seismicity continued. There was a total of 4,452 rockfall events, 329 volcanic earthquakes, which included volcanic tremor events, two ashing events, and 85 PDCs recorded throughout the month. On clear weather days, gas-and-steam emissions rose 100-1,500 m above the crater and drifted in multiple directions. Sulfur dioxide emissions averaged 609-2,252 t/d, the higher average of which was measured on 6 September. Slow lava effusion continued advancing on the SE, S, and E flanks, maintaining lengths of 3.4 km, 2.8 km, and 1.1 km, respectively. Rockfall and PDC events generated by collapses along the lava flow margins and at the summit dome deposited material within 4 km of the crater.
Geologic Background. Symmetrical Mayon, which rises above the Albay Gulf NW of Legazpi City, is the most active volcano of the Philippines. The steep upper slopes are capped by a small summit crater. Recorded eruptions since 1616 CE range from Strombolian to basaltic Plinian, with cyclical activity beginning with basaltic eruptions, followed by longer periods of andesitic lava flows. Eruptions occur predominately from the central conduit and have also produced lava flows that travel far down the flanks. Pyroclastic density currents and mudflows have commonly swept down many of the approximately 40 ravines that radiate from the summit and have often damaged populated lowland areas. A violent eruption in 1814 killed more than 1,200 people and devastated several towns.
Information Contacts: Philippine Institute of Volcanology and Seismology (PHIVOLCS), Department of Science and Technology, University of the Philippines Campus, Diliman, Quezon City, Philippines (URL: http://www.phivolcs.dost.gov.ph/); MIROVA (Middle InfraRed Observation of Volcanic Activity), a collaborative project between the Universities of Turin and Florence (Italy) supported by the Centre for Volcanic Risk of the Italian Civil Protection Department (URL: http://www.mirovaweb.it/); Hawai'i Institute of Geophysics and Planetology (HIGP) - MODVOLC Thermal Alerts System, School of Ocean and Earth Science and Technology (SOEST), Univ. of Hawai'i, 2525 Correa Road, Honolulu, HI 96822, USA (URL: http://modis.higp.hawaii.edu/); Copernicus Browser, Copernicus Data Space Ecosystem, European Space Agency (URL: https://dataspace.copernicus.eu/browser/); William Rogers, Legazpi City, Albay Province, Philippines.
Nishinoshima (Japan) — October 2023 Cite this Report
Nishinoshima
Japan
27.247°N, 140.874°E; summit elev. 100 m
All times are local (unless otherwise noted)
Eruption plumes and gas-and-steam plumes during May-August 2023
Nishinoshima, located about 1,000 km S of Tokyo, is a small island in the Ogasawara Arc in Japan. The island is the summit of a massive submarine volcano that has prominent submarine peaks to the S, W, and NE. Eruptions date back to 1973 and the current eruption period began in October 2022. Recent activity has consisted of small ash plumes and fumarolic activity (BGVN 48:07). This report covers activity during May through August 2023, using information from monthly reports of the Japan Meteorological Agency (JMA) monthly reports and satellite data.
Activity during May through June was relatively low. The Japan Coast Guard (JCG) did overflights on 14 and 22 June and reported white gas-and-steam emissions rising 600 m and 1,200 m from the central crater of the pyroclastic cone, respectively (figure 125). In addition, multiple white gas-and-steam emissions rose from the inner rim of the W side of the crater and from the SE flank of the pyroclastic cone. Discolored brown-to-green water was observed around almost the entire perimeter of the island; on 22 June light green discolored water was observed off the S coast of the island.
Observations from the Himawari meteorological satellite confirmed an eruption on 9 and 10 July. An eruption plume rose 1.6 km above the crater and drifted N around 1300 on 9 July. Satellite images acquired at 1420 and 2020 on 9 July and at 0220 on 10 July showed continuing emissions that rose 1.3-1.6 km above the crater and drifted NE and N. The Tokyo VAAC reported that an ash plume seen by a pilot and identified in a satellite image at 0630 on 21 July rose to 3 km altitude and drifted S.
Aerial observations conducted by JCG on 8 August showed a white-and-gray plume rising from the central crater of the pyroclastic cone, and multiple white gas-and-steam emissions were rising from the inner edge of the western crater and along the NW-SE flanks of the island (figure 126). Brown-to-green discolored water was also noted around the perimeter of the island.
Intermittent low-to-moderate power thermal anomalies were recorded in the MIROVA graph (Middle InfraRed Observation of Volcanic Activity), showing an increase in both frequency and power beginning in July (figure 127). This increase in activity coincides with eruptive activity on 9 and 10 July, characterized by eruption plumes. According to the MODVOLC thermal alert algorithm, one thermal hotspot was recorded on 20 July. Weak thermal anomalies were also detected in infrared satellite imagery, accompanied by strong gas-and-steam plumes (figure 128).
Geologic Background. The small island of Nishinoshima was enlarged when several new islands coalesced during an eruption in 1973-74. Multiple eruptions that began in 2013 completely covered the previous exposed surface and continued to enlarge the island. The island is the summit of a massive submarine volcano that has prominent peaks to the S, W, and NE. The summit of the southern cone rises to within 214 m of the ocean surface 9 km SSE.
Information Contacts: Japan Meteorological Agency (JMA), 1-3-4 Otemachi, Chiyoda-ku, Tokyo 100-8122, Japan (URL: http://www.jma.go.jp/jma/indexe.html); Tokyo Volcanic Ash Advisory Center (VAAC), 1-3-4 Otemachi, Chiyoda-ku, Tokyo 100-8122, Japan (URL: http://ds.data.jma.go.jp/svd/vaac/data/); MIROVA (Middle InfraRed Observation of Volcanic Activity), a collaborative project between the Universities of Turin and Florence (Italy) supported by the Centre for Volcanic Risk of the Italian Civil Protection Department (URL: http://www.mirovaweb.it/); Copernicus Browser, Copernicus Data Space Ecosystem, European Space Agency (URL: https://dataspace.copernicus.eu/browser/).
Krakatau (Indonesia) — October 2023 Cite this Report
Krakatau
Indonesia
6.1009°S, 105.4233°E; summit elev. 285 m
All times are local (unless otherwise noted)
White gas-and-steam plumes and occasional ash plumes during May-August 2023
Krakatau is located in the Sunda Strait between Java and Sumatra, Indonesia. Caldera collapse during the catastrophic 1883 eruption destroyed Danan and Perbuwatan cones and left only a remnant of Rakata. The post-collapse cone of Anak Krakatau (Child of Krakatau) was constructed within the 1883 caldera at a point between the former Danan and Perbuwatan cones; it has been the site of frequent eruptions since 1927. The current eruption period began in May 2021 and has recently consisted of Strombolian eruptions and ash plumes (BGVN 48:07). This report describes lower levels of activity consisting of ash and white gas-and-steam plumes during May through August 2023, based on information provided by the Indonesian Center for Volcanology and Geological Hazard Mitigation, referred to as Pusat Vulkanologi dan Mitigasi Bencana Geologi (PVMBG), MAGMA Indonesia, and satellite data.
Activity was relatively low during May and June. Daily white gas-and-steam emissions rose 25-200 m above the crater and drifted in different directions. Five ash plumes were detected at 0519 on 10 May, 1241 on 11 May, 0920 on 12 May, 2320 on 12 May, and at 0710 on 13 May, and rose 1-2.5 km above the crater and drifted SW. A webcam image taken on 12 May showed ejection of incandescent material above the vent. A total of nine ash plumes were detected during 6-11 June: at 1434 and 00220 on 6 and 7 June the ash plumes rose 500 m above the crater and drifted NW, at 1537 on 8 June the ash plume rose 1 km above the crater and drifted SW, at 0746 and at 0846 on 9 June the ash plumes rose 800 m and 3 km above the crater and drifted SW, respectively, at 0423, 1431, and 1750 on 10 June the ash plumes rose 2 km, 1.5 km, and 3.5 km above the crater and drifted NW, respectively, and at 0030 on 11 June an ash plume rose 2 km above the crater and drifted NW. Webcam images taken on 10 and 11 June at 0455 and 0102, respectively, showed incandescent material ejected above the vent. On 19 June an ash plume at 0822 rose 1.5 km above the crater and drifted SE.
Similar low activity of white gas-and-steam emissions and few ash plumes were reported during July and August. Daily white gas-and-steam emissions rose 25-300 m above the crater and drifted in multiple directions. Three ash plumes were reported at 0843, 0851, and 0852 on 20 July that rose 500-2,000 m above the crater and drifted NW.
The MIROVA (Middle InfraRed Observation of Volcanic Activity) graph of MODIS thermal anomaly data showed intermittent low-to-moderate power thermal anomalies during May through August 2023 (figure 140). Although activity was often obscured by weather clouds, a thermal anomaly was visible in an infrared satellite image of the crater on 12 May, accompanied by an eruption plume that drifted SW (figure 141).
Geologic Background. The renowned Krakatau (frequently mis-named as Krakatoa) volcano lies in the Sunda Strait between Java and Sumatra. Collapse of an older edifice, perhaps in 416 or 535 CE, formed a 7-km-wide caldera. Remnants of that volcano are preserved in Verlaten and Lang Islands; subsequently the Rakata, Danan, and Perbuwatan cones were formed, coalescing to create the pre-1883 Krakatau Island. Caldera collapse during the catastrophic 1883 eruption destroyed Danan and Perbuwatan, and left only a remnant of Rakata. This eruption caused more than 36,000 fatalities, most as a result of tsunamis that swept the adjacent coastlines of Sumatra and Java. Pyroclastic surges traveled 40 km across the Sunda Strait and reached the Sumatra coast. After a quiescence of less than a half century, the post-collapse cone of Anak Krakatau (Child of Krakatau) was constructed within the 1883 caldera at a point between the former Danan and Perbuwatan cones. Anak Krakatau has been the site of frequent eruptions since 1927.
Information Contacts: Pusat Vulkanologi dan Mitigasi Bencana Geologi (PVMBG, also known as Indonesian Center for Volcanology and Geological Hazard Mitigation, CVGHM), Jalan Diponegoro 57, Bandung 40122, Indonesia (URL: http://www.vsi.esdm.go.id/); MAGMA Indonesia, Kementerian Energi dan Sumber Daya Mineral (URL: https://magma.esdm.go.id/v1); MIROVA (Middle InfraRed Observation of Volcanic Activity), a collaborative project between the Universities of Turin and Florence (Italy) supported by the Centre for Volcanic Risk of the Italian Civil Protection Department (URL: http://www.mirovaweb.it/); Copernicus Browser, Copernicus Data Space Ecosystem, European Space Agency (URL: https://dataspace.copernicus.eu/browser/).
Villarrica (Chile) — October 2023 Cite this Report
Villarrica
Chile
39.42°S, 71.93°W; summit elev. 2847 m
All times are local (unless otherwise noted)
Strombolian activity, gas-and-ash emissions, and crater incandescence during April-September 2023
Villarrica, in central Chile, consists of a 2-km-wide caldera that formed about 3,500 years ago and is located at the base of the presently active cone at the NW margin of a 6-km-wide caldera. Historical eruptions eruptions date back to 1558 and have been characterized by mild-to-moderate explosive activity with occasional lava effusions. The current eruption period began in December 2014 and has recently consisted of nighttime crater incandescence, ash emissions, and seismicity (BGVN 48:04). This report covers activity during April through September 2023 and describes occasional Strombolian activity, gas-and-ash emissions, and nighttime crater incandescence. Information for this report primarily comes from the Southern Andes Volcano Observatory (Observatorio Volcanológico de Los Andes del Sur, OVDAS), part of Chile's National Service of Geology and Mining (Servicio Nacional de Geología y Minería, SERNAGEOMIN) and satellite data.
Seismicity during April consisted of long period (LP) events and tremor (TRE); a total of 9,413 LP-type events and 759 TR-type events were detected throughout the month. Nighttime crater incandescence persisted and was visible in the degassing column. Sulfur dioxide data was obtained using Differential Absorption Optical Spectroscopy Equipment (DOAS) that showed an average value of 1,450 ± 198 tons per day (t/d) during 1-15 April and 1,129 ± 201 t/d during 16-30 April, with a maximum daily value of 2,784 t/d on 9 April. Gas-and-steam emissions of variable intensities rose above the active crater as high as 1.3 km above the crater on 13 April. Strombolian explosions were not observed and there was a slight decrease in the lava lake level.
There were 14,123 LP-type events and 727 TR-type events detected during May. According to sulfur dioxide measurements taken with DOAS equipment, the active crater emitted an average value of 1,826 ± 482 t/d during 1-15 May and 912 ± 41 t/d during 16-30 May, with a daily maximum value of 5,155 t/d on 13 May. Surveillance cameras showed continuous white gas-and-steam emissions that rose as high as 430 m above the crater on 27 May. Nighttime incandescence illuminated the gas column less than 300 m above the crater rim was and no pyroclastic emissions were reported. A landslide was identified on 13 May on the E flank of the volcano 50 m from the crater rim and extending 300 m away; SERNAGEOMIN noted that this event may have occurred on 12 May. During the morning of 27 and 28 May minor Strombolian explosions characterized by incandescent ejecta were recorded at the crater rim; the last reported Strombolian explosions had occurred at the end of March.
Seismic activity during June consisted of five volcano-tectonic (VT)-type events, 21,606 LP-type events, and 2,085 TR-type events. The average value of sulfur dioxide flux obtained by DOAS equipment was 1,420 ± 217 t/d during 1-15 June and 2,562 ± 804 t/d, with a maximum daily value of 4,810 t/d on 17 June. White gas-and-steam emissions rose less than 480 m above the crater; frequent nighttime crater incandescence was reflected in the degassing plume. On 12 June an emission rose 100 m above the crater and drifted NNW. On 15 June one or several emissions resulted in ashfall to the NE as far as 5.5 km from the crater, based on a Skysat satellite image. Several Strombolian explosions occurred within the crater; activity on 15 June was higher energy and ejected blocks 200-300 m on the NE slope. Surveillance cameras showed white gas-and-steam emissions rising 480 m above the crater on 16 June. On 19 and 24 June low-intensity Strombolian activity was observed, ejecting material as far as 200 m from the center of the crater to the E.
During July, seismicity included 29,319 LP-type events, 3,736 TR-type events, and two VT-type events. DOAS equipment recorded two days of sulfur dioxide emissions of 4,220 t/d and 1,009 t/d on 1 and 13 July, respectively. Constant nighttime incandescence was also recorded and was particularly noticeable when accompanied by eruptive columns on 12 and 16 July. Minor explosive events were detected in the crater. According to Skysat satellite images taken on 12, 13, and 16 July, ashfall deposits were identified 155 m S of the crater. According to POVI, incandescence was visible from two vents on the crater floor around 0336 on 12 July. Gas-and-ash emissions rose as high as 1.2 km above the crater on 13 July and drifted E and NW. A series of gas-and-steam pulses containing some ash deposited material on the upper E flank around 1551 on 13 July. During 16-31 July, average sulfur dioxide emissions of 1,679 ± 406 t/d were recorded, with a maximum daily value of 2,343 t/d on 28 July. Fine ash emissions were also reported on 16, 17, and 23 July.
Seismicity persisted during August, characterized by 27,011 LP-type events, 3,323 TR-type events, and three VT-type events. The average value of sulfur dioxide measurements taken during 1-15 August was 1,642 ± 270 t/d and 2,207 ± 4,549 t/d during 16-31 August, with a maximum daily value of 3,294 t/d on 27 August. Nighttime crater incandescence remained visible in degassing columns. White gas-and-steam emissions rose 480 m above the crater on 6 August. According to a Skysat satellite image from 6 August, ash accumulation was observed proximal to the crater and was mainly distributed toward the E slope. White gas-and-steam emissions rose 320 m above the crater on 26 August. Nighttime incandescence and Strombolian activity that generated ash emissions were reported on 27 August.
Seismicity during September was characterized by five VT-type events, 12,057 LP-type events, and 2,058 TR-type events. Nighttime incandescence persisted. On 2 September an ash emission rose 180 m above the crater and drifted SE at 1643 (figure 125) and a white gas-and-steam plume rose 320 m above the crater. According to the Buenos Aires VAAC, periods of continuous gas-and-ash emissions were visible in webcam images from 1830 on 2 September to 0110 on 3 September. Strombolian activity was observed on 2 September and during the early morning of 3 September, the latter event of which generated an ash emission that rose 60 m above the crater and drifted 100 m from the center of the crater to the NE and SW. Ashfall was reported to the SE and S as far as 750 m from the crater. The lava lake was active during 3-4 September and lava fountaining was visible for the first time since 26 March 2023, according to POVI. Fountains captured in webcam images at 2133 on 3 September and at 0054 on 4 September rose as high as 60 m above the crater rim and ejected material onto the upper W flank. Sulfur dioxide flux of 1,730 t/d and 1,281 t/d was measured on 3 and 4 September, respectively, according to data obtained by DOAS equipment.
Strong Strombolian activity and larger gas-and-ash plumes were reported during 18-20 September. On 18 September activity was also associated with energetic LP-type events and notable sulfur dioxide fluxes (as high as 4,277 t/d). On 19 September Strombolian activity and incandescence were observed. On 20 September at 0914 ash emissions rose 50 m above the crater and drifted SSE, accompanied by Strombolian activity that ejected material less than 100 m SSE, causing fall deposits on that respective flank. SERNAGEOMIN reported that a Planet Scope satellite image taken on 20 September showed the lava lake in the crater, measuring 32 m x 35 m and an area of 0.001 km2. Several ash emissions were recorded at 0841, 0910, 1251, 1306, 1312, 1315, and 1324 on 23 September and rose less than 150 m above the crater. The sulfur dioxide flux value was 698 t/d on 23 September and 1,097 t/d on 24 September. On 24 September the Volcanic Alert Level (VAL) was raised to Orange (the third level on a four-color scale). SENAPRED maintained the Alert Level at Yellow (the middle level on a three-color scale) for the communities of Villarrica, Pucón (16 km N), Curarrehue, and Panguipulli.
During 24-25 September there was an increase in seismic energy (observed at TR-events) and acoustic signals, characterized by 1 VT-type event, 213 LP-type events, and 124 TR-type events. Mainly white gas-and-steam emissions, in addition to occasional fine ash emissions were recorded. During the early morning of 25 September Strombolian explosions were reported and ejected material 250 m in all directions, though dominantly toward the NW. On 25 September the average value of sulfur dioxide flux was 760 t/d. Seismicity during 25-30 September consisted of five VT-type events, 1,937 LP-type events, and 456 TR-type events.
During 25-29 September moderate Strombolian activity was observed and ejected material as far as the crater rim. In addition, ash pulses lasting roughly 50 minutes were observed around 0700 and dispersed ENE. During 26-27 September a TR episode lasted 6.5 hours and was accompanied by discrete acoustic signals. Satellite images from 26 September showed a spatter cone on the crater floor with one vent that measured 10 x 14 m and a smaller vent about 35 m NE of the cone. SERNAGEOMIN reported an abundant number of bomb-sized blocks up to 150 m from the crater, as well as impact marks on the snow, which indicated explosive activity. A low-altitude ash emission was observed drifting NW around 1140 on 28 September, based on webcam images. Between 0620 and 0850 on 29 September an ash emission rose 60 m above the crater and drifted NW. During an overflight taken around 1000 on 29 September scientists observed molten material in the vent, a large accumulation of pyroclasts inside the crater, and energetic degassing, some of which contained a small amount of ash. Block-sized pyroclasts were deposited on the internal walls and near the crater, and a distal ash deposit was also visible. The average sulfur dioxide flux measured on 28 September was 344 t/d. Satellite images taken on 29 September ashfall was deposited roughly 3 km WNW from the crater and nighttime crater incandescence remained visible. The average sulfur dioxide flux value from 29 September was 199 t/d. On 30 September at 0740 a pulsating ash emission rose 1.1 km above the crater and drifted NNW (figure 126). Deposits on the S flank extended as far as 4.5 km from the crater rim, based on satellite images from 30 September.
Infrared MODIS satellite data processed by MIROVA (Middle InfraRed Observation of Volcanic Activity) showed intermittent thermal activity during April through September, with slightly stronger activity detected during late September (figure 127). Small clusters of thermal activity were detected during mid-June, early July, early August, and late September. According to the MODVOLC thermal alert system, a total of four thermal hotspots were detected on 7 July and 3 and 23 September. This activity was also intermittently captured in infrared satellite imagery on clear weather days (figure 128).
Geologic Background. The glacier-covered Villarrica stratovolcano, in the northern Lakes District of central Chile, is ~15 km south of the city of Pucon. A 2-km-wide caldera that formed about 3,500 years ago is located at the base of the presently active, dominantly basaltic to basaltic andesite cone at the NW margin of a 6-km-wide Pleistocene caldera. More than 30 scoria cones and fissure vents are present on the flanks. Plinian eruptions and pyroclastic flows that have extended up to 20 km from the volcano were produced during the Holocene. Lava flows up to 18 km long have issued from summit and flank vents. Eruptions documented since 1558 CE have consisted largely of mild-to-moderate explosive activity with occasional lava effusion. Glaciers cover 40 km2 of the volcano, and lahars have damaged towns on its flanks.
Information Contacts: Servicio Nacional de Geología y Minería (SERNAGEOMIN), Observatorio Volcanológico de Los Andes del Sur (OVDAS), Avda Sta María No. 0104, Santiago, Chile (URL: http://www.sernageomin.cl/); Proyecto Observación Villarrica Internet (POVI) (URL: http://www.povi.cl/); Sistema y Servicio Nacional de Prevención y Repuesta Ante Desastres (SENAPRED), Av. Beauchef 1671, Santiago, Chile (URL: https://web.senapred.cl/); Buenos Aires Volcanic Ash Advisory Center (VAAC), Servicio Meteorológico Nacional-Fuerza Aérea Argentina, 25 de mayo 658, Buenos Aires, Argentina (URL: http://www.smn.gov.ar/vaac/buenosaires/inicio.php); MIROVA (Middle InfraRed Observation of Volcanic Activity), a collaborative project between the Universities of Turin and Florence (Italy) supported by the Centre for Volcanic Risk of the Italian Civil Protection Department (URL: http://www.mirovaweb.it/); Hawai'i Institute of Geophysics and Planetology (HIGP) - MODVOLC Thermal Alerts System, School of Ocean and Earth Science and Technology (SOEST), Univ. of Hawai'i, 2525 Correa Road, Honolulu, HI 96822, USA (URL: http://modis.higp.hawaii.edu/); Copernicus Browser, Copernicus Data Space Ecosystem, European Space Agency (URL: https://dataspace.copernicus.eu/browser/).
Merapi (Indonesia) — October 2023 Cite this Report
Merapi
Indonesia
7.54°S, 110.446°E; summit elev. 2910 m
All times are local (unless otherwise noted)
Frequent incandescent avalanches during April-September 2023
Merapi, located just north of the major city of Yogyakarta in central Java, Indonesia, has had activity within the last 20 years characterized by pyroclastic flows and lahars accompanying growth and collapse of the steep-sided active summit lava dome. The current eruption period began in late December 2020 and has more recently consisted of ash plumes, intermittent incandescent avalanches of material, and pyroclastic flows (BGVN 48:04). This report covers activity during April through September 2023, based on information from Balai Penyelidikan dan Pengembangan Teknologi Kebencanaan Geologi (BPPTKG), the Center for Research and Development of Geological Disaster Technology, a branch of PVMBG which specifically monitors Merapi. Additional information comes from the Pusat Vulkanologi dan Mitigasi Bencana Geologi (PVMBG, also known as Indonesian Center for Volcanology and Geological Hazard Mitigation, CVGHM), MAGMA Indonesia, the Darwin Volcanic Ash Advisory Centre (VAAC), and various satellite data.
Activity during April through September 2023 primarily consisted of incandescent avalanches of material that mainly affected the SW and W flanks and traveled as far as 2.3 km from the summit (table 25) and white gas-and-steam emissions that rose 10-1,000 m above the crater.
Table 25. Monthly summary of avalanches and avalanche distances recorded at Merapi during April through September 2023. The number of reported avalanches does not include instances where possible avalanches were heard but could not be visually confirmed as a result of inclement weather. Data courtesy of BPPTKG (April-September 2023 daily reports).
| Month |
Average number of avalanches per day |
Distance avalanches traveled (m) |
| Apr 2023 |
19 |
1,200-2,000 |
| May 2023 |
22 |
500-2,000 |
| Jun 2023 |
18 |
1,200-2,000 |
| Jul 2023 |
30 |
300-2,000 |
| Aug 2023 |
25 |
400-2,300 |
| Sep 2023 |
23 |
600-2,000 |
BPPTKG reported that during April and May white gas-and-steam emissions rose 10-750 m above the crater, incandescent avalanches descended 500-2,000 m on the SW and W flanks (figure 135). Cloudy weather often prevented clear views of the summit, and sometimes avalanches could not be confirmed. According to a webcam image, a pyroclastic flow was visible on 17 April at 0531. During the week of 28 April and 4 May a pyroclastic flow was reported on the SW flank, traveling up to 2.5 km. According to a drone overflight taken on 17 May the SW lava dome volume was an estimated 2,372,800 cubic meters and the dome in the main crater was an estimated 2,337,300 cubic meters.
During June and July similar activity persisted with white gas-and-steam emissions rising 10-350 m above the crater and frequent incandescent avalanches that traveled 300-2,000 m down the SW, W, and S flanks (figure 136). Based on an analysis of aerial photos taken on 24 June the volume of the SW lava dome was approximately 2.5 million cubic meters. A pyroclastic flow was observed on 5 July that traveled 2.7 km on the SW flank. According to the Darwin VAAC multiple minor ash plumes were identified in satellite images on 19 July that rose to 3.7 km altitude and drifted S and SW. During 22, 25, and 26 July a total of 17 avalanches descended as far as 1.8 km on the S flank.
Frequent white gas-and-steam emissions continued during August and September, rising 10-450 m above the crater. Incandescent avalanches mainly affected the SW and W flanks and traveled 400-2,300 m from the vent (figure 137). An aerial survey conducted on 10 August was analyzed and reported that estimates of the SW dome volume was 2,764,300 cubic meters and the dome in the main crater was 2,369,800 cubic meters.
Frequent and moderate-power thermal activity continued throughout the reporting period, according to a MIROVA (Middle InfraRed Observation of Volcanic Activity) analysis of MODIS satellite data (figure 138). There was an increase in the number of detected anomalies during mid-May. The MODVOLC thermal algorithm recorded a total of 47 thermal hotspots: six during April, nine during May, eight during June, 15 during July, four during August, and five during September. Some of this activity was captured in infrared satellite imagery on clear weather days, sometimes accompanied by incandescent material on the SW flank (figure 139).
Geologic Background. Merapi, one of Indonesia's most active volcanoes, lies in one of the world's most densely populated areas and dominates the landscape immediately north of the major city of Yogyakarta. It is the youngest and southernmost of a volcanic chain extending NNW to Ungaran volcano. Growth of Old Merapi during the Pleistocene ended with major edifice collapse perhaps about 2,000 years ago, leaving a large arcuate scarp cutting the eroded older Batulawang volcano. Subsequent growth of the steep-sided Young Merapi edifice, its upper part unvegetated due to frequent activity, began SW of the earlier collapse scarp. Pyroclastic flows and lahars accompanying growth and collapse of the steep-sided active summit lava dome have devastated cultivated lands on the western-to-southern flanks and caused many fatalities.
Information Contacts: Balai Penyelidikan dan Pengembangan Teknologi Kebencanaan Geologi (BPPTKG), Center for Research and Development of Geological Disaster Technology (URL: http://merapi.bgl.esdm.go.id/, Twitter: @BPPTKG); MAGMA Indonesia, Kementerian Energi dan Sumber Daya Mineral (URL: https://magma.esdm.go.id/v1); Pusat Vulkanologi dan Mitigasi Bencana Geologi (PVMBG, also known as Indonesian Center for Volcanology and Geological Hazard Mitigation, CVGHM), Jalan Diponegoro 57, Bandung 40122, Indonesia (URL: http://www.vsi.esdm.go.id/); Darwin Volcanic Ash Advisory Centre (VAAC), Bureau of Meteorology, Northern Territory Regional Office, PO Box 40050, Casuarina, NT 0811, Australia (URL: http://www.bom.gov.au/info/vaac/); MIROVA (Middle InfraRed Observation of Volcanic Activity), a collaborative project between the Universities of Turin and Florence (Italy) supported by the Centre for Volcanic Risk of the Italian Civil Protection Department (URL: http://www.mirovaweb.it/); Hawai'i Institute of Geophysics and Planetology (HIGP) - MODVOLC Thermal Alerts System, School of Ocean and Earth Science and Technology (SOEST), Univ. of Hawai'i, 2525 Correa Road, Honolulu, HI 96822, USA (URL: http://modis.higp.hawaii.edu/); Copernicus Browser, Copernicus Data Space Ecosystem, European Space Agency (URL: https://dataspace.copernicus.eu/browser/); Øystein Lund Andersen (URL: https://www.oysteinlundandersen.com/, https://twitter.com/oysteinvolcano).
Ebeko
Russia
50.686°N, 156.014°E; summit elev. 1103 m
All times are local (unless otherwise noted)
Moderate explosive activity with ash plumes continued during June-November 2023
Ebeko, located on the N end of Paramushir Island in Russia’s Kuril Islands just S of the Kamchatka Peninsula, consists of three summit craters along a SSW-NNE line at the northern end of a complex of five volcanic cones. Observed eruptions date back to the late 18th century and have been characterized as small-to-moderate explosions from the summit crater, accompanied by intense fumarolic activity. The current eruptive period began in June 2022, consisting of frequent explosions, ash plumes, and thermal activity (BGVN 47:10, 48:06). This report covers similar activity during June-November 2023, based on information from the Kamchatka Volcanic Eruptions Response Team (KVERT) and satellite data.
Moderate explosive activity continued during June-November 2023 (figures 50 and 51). According to visual data from Severo-Kurilsk, explosions sent ash 2-3.5 km above the summit (3-4.5 km altitude) during most days during June through mid-September. Activity after mid-September was slightly weaker, with ash usually reaching less than 2 km above the summit. According to KVERT the volcano in October and November was, with a few exceptions, either quiet or obscured by clouds that prevented satellite observations. KVERT issued Volcano Observatory Notices for Aviation (VONA) on 8 and 12 June, 13 and 22 July, 3 and 21 August, and 31 October warning of potential aviation hazards from ash plumes drifting 3-15 km from the volcano. Based on satellite data, KVERT reported a persistent thermal anomaly whenever weather clouds permitted viewing.
Geologic Background. The flat-topped summit of the central cone of Ebeko volcano, one of the most active in the Kuril Islands, occupies the northern end of Paramushir Island. Three summit craters located along a SSW-NNE line form Ebeko volcano proper, at the northern end of a complex of five volcanic cones. Blocky lava flows extend west from Ebeko and SE from the neighboring Nezametnyi cone. The eastern part of the southern crater contains strong solfataras and a large boiling spring. The central crater is filled by a lake about 20 m deep whose shores are lined with steaming solfataras; the northern crater lies across a narrow, low barrier from the central crater and contains a small, cold crescentic lake. Historical activity, recorded since the late-18th century, has been restricted to small-to-moderate explosive eruptions from the summit craters. Intense fumarolic activity occurs in the summit craters, on the outer flanks of the cone, and in lateral explosion craters.
Information Contacts: Kamchatka Volcanic Eruptions Response Team (KVERT), Far Eastern Branch, Russian Academy of Sciences, 9 Piip Blvd., Petropavlovsk-Kamchatsky, 683006, Russia (URL: http://www.kscnet.ru/ivs/kvert/).
Search Bulletin Archive by Publication Date
Select a month and year from the drop-downs and click "Show Issue" to have that issue displayed in this tab.
The default month and year is the latest issue available.
Bulletin of the Global Volcanism Network - Volume 24, Number 04 (April 1999)
Managing Editor: Richard Wunderman
Atmospheric Effects (1995-2001) (Unknown)
Tracing recent ash by satellite-borne sensors and ground-based lidar
Cameroon (Cameroon)
Eruption ends before lava reaches the sea
Colima (Mexico)
Variable SO2 fluxes; 10 May explosion ascends to about 10 km altitude
Cosiguina (Nicaragua)
Temperature and pH measurements of the fresh crater lake
Fuego (Guatemala)
Eruption on 21 May dropped up to 40 cm of ash on local population; small lava flow
Guagua Pichincha (Ecuador)
Summary of activity in April; tremor for extended durations; phreatic explosions
Krakatau (Indonesia)
Explosive eruptions continue in April
Langila (Papua New Guinea)
Continued Vulcanian activity at Crater 2; Crater 3 is quiet
Manam (Papua New Guinea)
Mild eruptive activity at Main Crater; Southern Crater is quiet
Masaya (Nicaragua)
Continued degassing and marked gravity decreases; previously unreported small explosions
Popocatepetl (Mexico)
Continued sporadic eruptions visible on Doppler radar
Rabaul (Papua New Guinea)
Continued ash emission at Tavurvur; low seismicity
Ruiz, Nevado del (Colombia)
Moderate earthquake swarm
Sheveluch (Russia)
Large ash explosions on 3 and 12 April
Shishaldin (United States)
Steam-and-ash plume on 19 April rose to 15-20 km and was carried to great distances
Telica (Nicaragua)
Phreatic eruptions in May and June cause local ashfall
Whakaari/White Island (New Zealand)
Metra Crater excavated by 17 April explosions
Yasur (Vanuatu)
Cyclical eruptive activity documented during 1994-98
Atmospheric Effects (1995-2001) (Unknown) — April 1999 Cite this Report
Atmospheric Effects (1995-2001)
Unknown
Unknown, Unknown; summit elev. m
All times are local (unless otherwise noted)
Tracing recent ash by satellite-borne sensors and ground-based lidar
Observers at the Alaska Volcano Observatory initially inferred that the 19 April Shishaldin plume reached ~13-14 km altitude based on what appeared to be as the most reliable pilot reports (see above and Bulletin v. 24, no. 3). Yet, one pilot reported the plume to 18.3 km altitude and satellite data suggested similar altitudes. Through at least late May, scientists continued to detect and track stratospheric aerosols. At the time of this writing we have learned of successful satellite detection by GOES 10, the Total Ozone Mapping Spectrometer (TOMS), Stratospheric Aerosol and Gas Experiment (SAGE II), and the Polar Ozone and Aerosol Measurement (POAM). Ground-based lidar also detected presumed Shishaldin aerosol layers far from the source.
GOES observations. GOES 10 data portrayed early images of the plume (figure 6). According to Dave Schneider, thermal split-window imagery showed curiously little evidence of the plume in the stratosphere. Detection conditions were non-ideal: a warmer stratospheric cloud (the plume) overlying a colder tropospheric cloud deck. He also commented on a lack of evidence for ash at lower levels and wondered what role sulfate may have played.
TOMS observations. The TOMS instrument rides aboard NASA's Earth Probe satellite and collects information about airborne gases and particles, including ozone, SO2, and volcanic ash. TOMS passed over Shishaldin at 2142 GMT on 19 April, two hours after the eruption began as a small white plume in the GOES images. Thus, TOMS captured an early stage of the event while the eruption column was actively growing. This early post-eruption data reflected very high concentrations of SO2 and ash in a pixel over the volcano and smaller amounts in two adjacent pixels (unshaded boxes, figure 7). The TOMS images can now retrieve ash as well as SO2 concentrations; the dense 19 April plume, however, was not conducive to realistic SO2 measurement.
On 20 April the Shishaldin cloud was still found close to the volcano as an arc-shaped plume of SO2 (figure 7) to the N of and disconnected from the volcano. However, no detectable ash remained in the plume. This dispersed cloud was used to determine that the mass of SO2 in the eruption was 20 ktons. Traces of this SO2 cloud still remained on 21 April after drifting slightly to the N, but were gone on 22 April.
POAM III and SAGE II satellite observations. As discussed on their web site (NRL, 1999) the POAM instrument was developed by the U.S. Naval Research Laboratory (NRL) to measure the vertical distribution of atmospheric ozone, water vapor, nitrogen dioxide, aerosol extinction, and temperature. Solar extinction by the atmosphere is measured using the solar occultation technique; the sun is observed through the Earth's atmosphere as it rises and sets as viewed from the satellite. POAM data on stratospheric aerosols provide information on how the aerosol burden varied with altitude, latitude, season, and annually in a record going back over 3 years. The data have good vertical resolution (1 km), wide geographic coverage, and dense sampling in the polar regions over the latitude range 55°N-71°N. The following discusses data collected by the instrument's latest version (POAM III). SAGE II, another very similar satellite-based, limb-profiling technique has also contributed data.
As shown on figures 8 and 9, trajectory modeling and observational data from POAM III and SAGE II indicated that air parcels moving away from the eruption column at different altitudes took very different paths during the days following the eruption. The forward trajectory model (figure 8) shows strong correspondance with those run independantly by Barbara Stunder at the same altitudes. The modeling indicated that the part of the plume at ~12 km altitude first moved slightly SW, then E, then NE, and finally ESE. Modeling also indicated that the part of the plume at ~18-19 km altitude moved N and varying amounts to the E. In accord with this, high altitude volcanic aerosol material was detected N of 70°N latitude on 23 April by SAGE II. Finally, the modeling indicated that the part of the plume at ~14-16 km altitude branched away from the higher altitude material and began heading E. On 23 April the plume was observed on a POAM III profile (figures 8 and 9).
Figure 9 illustrates aerosol extinction ratios for the aerosol layers seen on 23, 25, and 27 April (circles, figure 8). The peak values shown in figure 9 lie 3-4 standard deviations above the normal background. Anomalously high extinction ratios in the lower stratosphere such as these continued well into May. The plot indicates the plume's height progressively decreased during the course of the three observations, descending from altitudes of ~15 to ~13 km, implying that the volcanic particulate settled out at roughly 0.5 km per day.
Figure 10 illustrates the POAM III results for several weeks following the 19 May Shishaldin eruption. It maps the location of all available POAM profiles (+ symbols) and 14 profiles with varying loads of enhanced stratospheric aerosols (circles). Larger circles indicate larger aerosol loads; more specifically, the circle sizes vary in proportion to the peak aerosol enhancement, determined in relation to the standard deviation of the aerosol extinction ratio in relevant background conditions. The altitudes of peak extinctions varied from 12-15 km.
Looked at on the scale of weeks after the eruption, the atmospheric circulation carried 19 April eruptive products towards the W. For the starred profiles on figure 10, isentropic (constant entropy, which assumes conservation of potential temperature) modeling of back trajectories strongly suggested Shishaldin as the source. POAM III continued to detect enhancements of aerosols in the lowest stratosphere at least until 23 May. The latitudes of the profile's center points moved gradually from about 62°N in late April to 57°N in late May.
Attempts to link additional POAM III observations (those that lack stars) with Shishaldin through isentropic trajectory analysis is in progress, but thus far some of them have failed to lead either back to Shishaldin or to another clear source. Around 5-6 May, for example, two stratospheric aerosol layers resided over or near Hudson Bay, Canada and were also not traceable to Shishaldin in trajectory models. As for another layer at that time, S of Iceland, the models indicate a likely source at the eruption.
Ground-based lidar observations. Lidars (light radars), which measure the amount of backscattered laser energy due to plume and atmospheric conditions (Jørgensen and others, 1997), detected aerosol layers over Germany, Virginia, and Greece. Beginning on the evening of 6 May, Horst Jäger detected a stratospheric layer while profiling with a 532-nm wavelength lidar operated in Garmisch-Partenkirchen, Germany (47.5°N, 11.0°E). His 6 May data showed a small but pronounced peak in the scattering ratio (figure 11). The source of the anomaly was between 15.1 and 15.4 km altitude, well above the estimated maximum altitude of the local troposphere (11.4 km, as determined by a midnight radiosonde from Munich). A maximum scatter ratio of 1.35 occurred at 15.2 km.
On 9 May the atmosphere lacked detectible layers in the expected altitude region. On 16 May the lidar achieved maximum scatter ratios of 1.1-1.2 at 14.3, 15.6, 16.3, and 17.3 km. Thus, over Germany, the layers did not form a major perturbation to the stratosphere; these faint backscatters became prominent only because of the low aerosol background during the times of measurement.
The altitude and timing of the peak in German lidar suggested a link to the 19 April Shishaldin eruption plume. The last eruption to produce similar results at the Garmisch-Partenkirchen site was the October 1994 eruption of Kliuchevskoi (Bulletin v. 19, no. 10). That plume reached heights of 25 km.
At Hampton, Virginia, ground-based 694-nm lidar also showed high-altitude peaks (table 17). Measurements there on 11 May detected a diffuse layer (with a peak ratio of 1.17) that was narrow (~1 km thick) and located at 16.9 km altitude, well above the tropopause height. Measurements on 21 May also disclosed two narrow layers. One had a peak ratio of 1.10 at 17.5 km; the other, a peak ratio of 1.19 at 14.5 km. The presence of particles at this height are generally considered to be associated with an eruption; the timing of these observations suggested the layers were due to the 19 April Shishaldin eruption. This may imply that the erupted aerosols had reached mid-latitudes during the month following the eruption.
Table 17. Lidar data from Virginia, USA, for February-May 1999 showing altitudes of aerosol layers. Backscattering ratios are for the ruby wavelength of 0.69 µm. The integrated values show total backscatter, expressed in steradians-1, integrated over 300-m intervals from the tropopause to 30 km. Courtesy of Mary Osborne.
| DATE |
LAYER ALTITUDE (km) (peak) |
BACKSCATTERING RATIO |
BACKSCATTERING INTEGRATED |
| Hampton, Virginia (37.1°N, 76.3°W) |
| 11 Feb 1999 |
11-27 (23.5) |
1.10 |
5.03 x 10⁻⁵ |
| 23 Feb 1999 |
10-27 (24.1) |
1.09 |
5.93 x 10⁻⁵ |
| 05 Mar 1999 |
09-25 (10.7) |
1.11 |
6.61 x 10⁻⁵ |
| 14 Apr 1999 |
15-27 (22.1) |
1.09 |
2.49 x 10⁻⁵ |
| 11 May 1999 |
12-26 (16.9) |
1.17 |
4.72 x 10⁻⁵ |
| 21 May 1999 |
13-27 (14.5) |
1.19 |
4.48 x 10⁻⁵ |
Commenting on research conducted on the Mediterranean island of Crete (35°30'N, 23°43'E), Christos S. Zerefos reported that the portable VELIS lidar instrument of Gian P. Gobbi also detected an aerosol layer during 10-13 May. Profiles disclosed increased aerosols at 15-16 km altitudes. Aerosols were seen again on 14 May, but they were not detected on 15 May. The optical depth at 532 nm was at most 0.02.
Conclusions. The 19 April Shishaldin eruption provided a modest injection to ~17-19 km altitude and a TOMS estimate the next day found ~20 kt of SO2 . In trajectory models, components of the plume at various altitudes moved away from the source in 3 branches; POAM III profiles on the ENE-directed path showed the plumes there decreased in altitude with time. Trajectory models have yet to confirm that several POAM III profiles came from the Shishaldin eruption and at this point their source remains ambiguous. The exact trajectories that presumably carried the Shishaldin aerosols over the German, Crete, and Virginia lidar systems have yet to be either consistently traced or modeled.
References. Hans, E., Jørgensen, H.E., Mikkelsen, T., Streicher, J., Herrmann, H., Werner, C., and Lyck, E., 1997, Lidar calibration experiments, Applied Physics B, Lasers and optics, v. 64, no. 3, Springer-Verlag, p. 355-61.
F. Congeduti, F. Marenco, E. Vincenti, P. Baldetti, and G.P. Gobbi, 1998, The new transportable lidar facilities at IFA: 9-eyes and VELIS, in Proceedings of the Workshop onSynergy of Active Instruments in the Earth Radiation Mission,M. Quante and others (eds.), http://aragorn.gkss. de/deutsch/Radar/workshop_papers.html
Naval Research Lab, 1999, Remote Sensing Division, Remote Sensing Physics Branch, Middle Atmospheric Physics Section, POAM Home page, http://wvms.nrl. navy.mil/POAM/poam.html.
Lidar Researchers Directory (including a bibliography produced by NASA) URL: http://arbs8.larc.nasa.gov/lidar/directory.html.
Sparks, R.S.J., Bursik, M.I., Carey, S.N., Gilbert, J.S., Glaze, L.S., Sigurdsson, H., and Woods, A.W., 1997, Volcanic plumes: John Wiley and Sons, Ltd., ISBN-0-471-93901-3, 574 p.
Geologic Background. The enormous aerosol cloud from the March-April 1982 eruption of Mexico''s El Chichón persisted for years in the stratosphere, and led to the Atmospheric Effects section becoming a regular feature of the Bulletin thorugh 1989. Lidar data and other atmospheric observations were again published intermittently between 1995 and 2001; those reports are included here.
Information Contacts: Horst Jäger, Fraunhofer - Institut für Atmosphärische Umweltforshung (IFU), Kreuzeckbahnstrasse 19, D-82467 Garmisch-Partenkirchen, Germany; Mike Fromm, Computational Physics, Inc., 2750 Prosperity Avenue, Fairfax, Virginia, 22031 USA; Naval Research Laboratory, 4555 Overlook Ave. SW, Washington, DC 20375 (URL: http://www.nrl. navy.mil); Barbara Stunder, U.S. National Oceanic and Atmospheric Administration (NOAA), Air Resources Laboratory, SSMC3, Rm. 3151 (R/E/AR), 1315 East-West Highway, Silver Spring, MD 20910, USA; Mary Osborn, NASA Langley Research Center (LaRC), Hampton, VA 23681 USA; Christos S. Zerefos, Aristotle University of Thessaloniki, Physics Department, Laboratory of Atmospheric Physics, Campus Box 149, 540 06 Thessaloniki, Greece; Arlin J. Krueger and Steve Schaefer; TOMS Instrument Scientists, Code 916, Building 33, Room E413, Goddard Space Flight Center, Greenbelt, MD 20771, USA, Dave Schneider, Alaska Volcano Observatory (see Shishaldin).
Cameroon (Cameroon) — April 1999 Cite this Report
Cameroon
Cameroon
4.203°N, 9.17°E; summit elev. 4095 m
All times are local (unless otherwise noted)
Eruption ends before lava reaches the sea
Following two days of increasing seismicity, on 28 March a volcanic eruption began on the S flank at about 2,650 m elevation (BGVN 24:03). A second set of fissure vents opened on 30 March at ~1,400 m elevation, and sent a voluminous aa flow SSW through dense equatorial forest toward the coastal village of Bakingili. Twelve vents were located during an observation trip by a National Scientific Committee team on 3 April. The upper vents were aligned along a pre-existing fracture zone bearing N40°E. Ten vents exhibited strong explosive activity, emitting gases, lapilli, ash, and incandescent lava blocks.
A French group, led by Jacques-Marie Bardintzeff, observed eight small cones (5-60 m high) aligned along the upper fissure during 13-14 April. On the evening of 13 April (1730-1930) four cones were active, three of them emitting white vapor. The NE-most cone was degassing strongly from two vents. At the beginning of the night red glow was visible above this cone, and some incandescent bombs were ejected 200 m high every few minutes. Activity was similar during 0900-1200 on 14 April, except for the NE-most cone, which produced two gray turbulent columns until 1000. Abundant sublimates were seen around each vent, and on a cone towards the SW end of the fissure.
Between 9 and 17 April the lava flow from the lower fissure was regularly observed by the French group. The flow, several hundred meters wide and ~10 m thick, was progressing at several meters per hour as blocks collapsed from the front. On the morning of 10 April the front was at 120 m elevation, 600 m from the Limbe-Idenau road near the Atlantic coast, between Batoke and Bakingili. By the evening of 11 April the front, now 150-200 m wide and 30 m thick, had progressed another 30 m with 3-4 m blocks collapsing from it. The flow had slowed on the coastal plain where, according to news reports, considerable damage was done to palm, rubber, and banana plantations.
There were conflicting reports on the exact location of the front during 12-13 April, although Isaha'a Boh reported that at mid-day on 12 April lava was still flowing from a crater at ~1,400 m elevation. The French group noted that on the evening of 14 April the 20-m-thick incandescent front was progressing at 7-15 m/hour, and was only 100 m from the road. By the next morning the flow was 5 m from the road. Throughout most of 15 April the front did not progress significantly, but three other lateral lava lobes developed. By 1900 the first incandescent block had fallen on the road, which was completely closed by 2300 that night. During a helicopter flight with the Cameroon volcanological team on 16 April, 100 m of the road was seen by the French group to be covered by a 10-m-thick lava flow.
Jack Lockwood and colleagues noted that the last glow from the 1,400-m vent was seen on 14 April, and lava production probably ended about this time. The alkalic basalt lava flow eventually extended 6-7 km from its source and cut the Limbe-Idenau road on 15 April. By then the 10-12-m-thick aa flow was very sluggish; it had ceased all forward movement by 17 April, about 200 m from the coast.
Occasional small earthquakes and possible minor volcanic tremor persisted until 22 April. News reports indicated that by 22 April the temperature of the lava flow across the highway had decreased enough that people were climbing over it. The head of the Cameroon scientific team monitoring the eruption, Samuel Ayonge, stated in the press on 20 May that there were still some sporadic earthquakes, and minor fumarolic emissions were still coming from the last two of the 13 craters formed during the eruption, but that eruptive activity had stopped on 17 April.
Inhabitants of the W-flank villages of Batoke and Bakingili had been evacuated on 11 April. According to news reports, the villages were not directly threatened by the lava flow, but there was concern over the health risks to residents if the flow entered the sea. The 600 evacuees all returned to their homes during 25-27 May.
Geologic Background. Mount Cameroon, one of Africa's largest volcanoes, rises above the coast of west Cameroon. The massive steep-sided volcano of dominantly basaltic-to-trachybasaltic composition forms a volcanic horst constructed above a basement of Precambrian metamorphic rocks covered with Cretaceous to Quaternary sediments. More than 100 small cinder cones, often fissure-controlled parallel to the long axis of the 1400 km3 edifice, occur on the flanks and surrounding lowlands. A large satellitic peak, Etinde (also known as Little Cameroon), is located on the S flank near the coast. Historical activity was first observed in the 5th century BCE by the Carthaginian navigator Hannon. During historical time, moderate explosive and effusive eruptions have occurred from both summit and flank vents. A 1922 SW-flank eruption produced a lava flow that reached the Atlantic coast, and a lava flow from a 1999 south-flank eruption stopped only 200 m from the sea. Explosive activity from two vents on the upper SE flank was reported in May 2000.
Information Contacts: J. Nni, Ekona Unit for Geophysical and Volcanological Research (ARGV), Institute for Mining and Geological Research (IRGM), P.O. Box 370, Buea, Cameroon; J. P. Lockwood and Jean-Baptiste Katabarwa, Geohazards Consultants International, Inc., PO Box 479, Volcano, HI 96785, USA (URL: http://www.geohazardsconsultants.com/), and Office of Foreign Disaster Assistance, U.S. Agency for International Development, 1300 Pennsylvania Avenue NW, Washington, DC 20523 USA (URL: https://www.usaid.gov/who-we-are/organization/bureaus/bureau-democracy-conflict-and-humanitarian-assistance/office-us); Jacques-Marie Bardintzeff, Laboratoire de Petrographie-Volcanologie, bat. 504, Universite Paris-Sud, 91405 Orsay, France; Henry Gaudru, Patrick Barois, and Marc Sagot, European Volcanological Society, CP 1, 1211 Geneve 17, Suisse; Isaha'a Boh Cameroon, Media Research and Strengthening Institute, P.O. Box 731, Yaounde, Cameroon.
Colima
Mexico
19.514°N, 103.62°W; summit elev. 3850 m
All times are local (unless otherwise noted)
Variable SO2 fluxes; 10 May explosion ascends to about 10 km altitude
A large explosion on 10 May was followed by intermittent explosions during 14-26 May. Variations in SO2 flux and morphological changes to the summit crater preceded the explosions.
SO2 flux data collected during 3 December 1998-15 May 1999 (table 10) showed that daily SO2-flux averages ranged between ~1,300 and 4,900 metric tons per day (t/d). In contrast, six days before the 10 May explosion researchers measured an anomalously low SO2 flux averaging ~350 t/d. Five days after the explosion a similarly low SO2 flux prevailed.
Table 10. Colima volcano's SO2 flux (in metric tons per day) from COSPEC measurements, 3 December 1998-15 May 1999. Data obtained by Colima Volcano Observatory staff members including J.C. Gavilanes and A. Cortés, with the collaboration of UNAM staff member Yuri Taran. In addition, on 3 and 22 February, the data were obtained by UNAM staff member Hugo Delgado. Courtesy of Juan Carlos Gavilanes, Colima Volcano Observatory.
| Date |
Avg. |
Max |
Min |
Uncert. (±) |
Avg. wind velocity (m/s) |
Traverse method |
| 03 Dec 1998 |
1,890 |
2,500 |
1,510 |
489 |
3.73 |
Airborne |
| 07 Dec 1998 |
3,390 |
4,540 |
2,950 |
798 |
10.8 |
Airborne |
| 09 Dec 1998 |
5,360 |
6,710 |
4,350 |
1,180 |
7.81 |
Airborne |
| 11 Dec 1998 |
2,280 |
3,670 |
2,210 |
728 |
8.00 |
Airborne |
| 31 Dec 1998 |
4,930 |
5,780 |
3,690 |
1,043 |
4.73 |
Airborne |
| 03 Feb 1999 |
4,530 |
5,290 |
3,206 |
1,043 |
7.71 |
Airborne |
| 14 Feb 1999 |
2,377 |
2,610 |
2,030 |
293 |
10.3 |
Airborne |
| 17 Feb 1999 |
1,256 |
1,657 |
853 |
402 |
8.50 |
Airborne |
| 20 Feb 1999 |
1,710 |
2,410 |
948 |
732 |
5.01 |
Airborne |
| 22 Feb 1999 |
2,319 |
-- |
-- |
350 |
-- |
Airborne |
| 04 Mar 1999 |
4,764 |
5,408 |
4,087 |
661 |
15.1 |
Airborne |
| 11 Mar 1999 |
2,760 |
3,642 |
2,184 |
729 |
15.2 |
Airborne |
| 26 Mar 1999 |
1,432 |
2,030 |
943 |
543 |
8.6 |
Ground |
| 31 Mar 1999 |
1,214 |
1,520 |
917 |
301 |
10.0 |
Ground |
| 14 Apr 1999 |
1,044 |
1,406 |
674 |
366 |
7.7 |
Ground |
| 04 May 1999 |
352 |
377 |
326 |
25 |
10.2 |
Ground |
| 15 May 1999 |
406 |
483 |
361 |
61 |
5.1 |
Airborne |
Shortly after the 10 February outburst (BGVN 24:02), views into the established summit crater disclosed that it held a small, centrally located inner crater, as well as some other small craters on its W side. All these small craters were attributed to explosions, such as those on 10 February, some others on 18 February, or other intense degassing events around that time. In the weeks after 10 February observers also saw concentric cracks becoming conspicuous in the summit area. Between 14 February and 11 March the summit crater became increasingly deep and fractured; however, despite these changes, the 1987 explosion crater still remained relatively intact on the dome's E side. Subsequent activity then declined until 10 May.
10 May explosion. At 1353 on 10 May an explosion was felt and heard in the city of Colima, 32 km SSE of the summit. At least 2 hours before the explosion, seismologist Gabriel Reyes (Red Sismológica Telemétrica del Edo. de Colima (RESCO), University of Colima) informed civil protection authorities about the increasing possibility of an explosive event within hours based on local seismicity. As a result, the civil protection officials provided warnings via telephone and radio to village leaders in La Yerbabuena and Juan Barragan. In the latter village, Jalisco civil protection officials initiated an evacuation of ~90 inhabitants. Meanwhile, at Yerbabuena (~192 inhabitants), the political representative of the village, Mr. Jesus Mendez, told residents to stay alert. Civil protection authorities of Colima recommended maximum alert without evacuation.
At the time of the eruption Observatory and RESCO staff were in their city of Colima offices. The accompanying photo (figure 37) was made ~45 seconds after they heard their windows rattle. Later, when the mushroom cloud appeared to cease rising, Carlos Navarro used a clinometer to estimate that its top reached ~6.5 km above the summit, an altitude of over 10 km.
Eyewitnesses in La Yerbabuena (8 km SW of the summit) and Civil Protection authorities reported that the explosion was accompanied by small pyroclastic flows. The two largest pyroclastic flow mainly descended the SW flank where they entered into the Barrancas La Lumbre and Cordoban drainages. In a manner and scope very similar to the 10 February explosion, ballistic ejecta landed up to 4.5 km from the summit dome and caused local forest fires. Between 1930 and 2210 that day observers saw at least two much smaller exhalations of steam and ash without audible explosion noises. Authorities evacuated several villages.
14-26 May explosions. Two ash-bearing explosions took place on 14 May: one rose ~2.2 km above the summit; the other, ~1 km above the crater. In a 24-hour period around 17 May, there were about 20 explosive or degassing events, with ash falling on the edifice and incandescence coming from the summit dome. According to the Washington Volcanic Ash Advisory Center, by about 0800 that day the plume had reached 5 km altitude. Moreover, they described the plume as ~6 km wide, extending laterally for ~10 km, and traveling SW at 28 km/hour.
An Observatory press release on 19 May 1999 noted a 24-hour decrease in both the strength and the frequency of outbursts; however, at 0846 that morning an explosive eruption took place. On 24-25 May a large relative increase in seismicity occurred, including signals suggestive of degassing and explosions, but these decreased by 26 May.
Geologic Background. The Colima complex is the most prominent volcanic center of the western Mexican Volcanic Belt. It consists of two southward-younging volcanoes, Nevado de Colima (the high point of the complex) on the north and the historically active Volcán de Colima at the south. A group of late-Pleistocene cinder cones is located on the floor of the Colima graben west and east of the complex. Volcán de Colima (also known as Volcán Fuego) is a youthful stratovolcano constructed within a 5-km-wide scarp, breached to the south, that has been the source of large debris avalanches. Major slope failures have occurred repeatedly from both the Nevado and Colima cones, producing thick debris-avalanche deposits on three sides of the complex. Frequent recorded eruptions date back to the 16th century. Occasional major explosive eruptions have destroyed the summit (most recently in 1913) and left a deep, steep-sided crater that was slowly refilled and then overtopped by lava dome growth.
Information Contacts: Colima Volcano Observatory, University of Colima, Ave. 25 de Julio 965, Colima 28045 México (URL: https://portal.ucol.mx/cueiv/); Washington Volcanic Ash Advisory Center (VAAC), NOAA/NESDIS Satellite Analysis Branch, Room 401, 5200 Auth Road, Camp Springs, MD 20746, USA (URL: http://www.ospo.noaa.gov/Products/atmosphere/vaac/); Gabriel Reyes, Red Sismológica Telemétrica del Edo. de Colima (RESCO), Centro Univ. de Inv. En Ciencias Básicas, Universidad de Colima, Ave. 25 de Julio, 965 Villa San Sebastián, Apdo. Postal 2-1694, Colima, México.
Cosiguina (Nicaragua) — April 1999 Cite this Report
Cosiguina
Nicaragua
12.98°N, 87.57°W; summit elev. 872 m
All times are local (unless otherwise noted)
Temperature and pH measurements of the fresh crater lake
A team from the Université de Montréal, Open University, and INETER visited Cosigüina volcano on 25 February 1999. The summit crater contains a roughly circular lake with a dark green color. The lake has a maximum diameter of ~1.5 km and occupies about 90% of the crater bottom, the remaining area being covered with dense vegetation. The surface temperature of the lake measured from the NW shore with a thermocouple was ~27°C, slightly lower than the ambient air temperature (~31°C) measured at noon. The pH of the lake surface water measured directly with a glass electrode was slightly alkaline (pH ~7.5). Feeble, diffuse gas was bubbling at the surface of the lake along the NW shore. Temperature of the ground in these areas reached a maximum of ~80°C. There was no sign of recent hot spring or fumarolic activity in the crater. One spring located on the E flank of the volcano near the village of Potosi had a temperature of ~42°C, a flow rate of ~2 l/s and a total dissolved solids content 100 mg/kg. Apparently, it is the only permanent, visible hydrothermal manifestation near the volcano.
Geologic Background. Cosigüina (also spelled Cosegüina) is a low basaltic-to-andesitic composite volcano that is isolated from other eruptive centers in the Nicaraguan volcanic chain. The stratovolcano forms a large peninsula extending into the Gulf of Fonseca at the western tip of the country. It has a pronounced somma rim on the northern side; a young summit cone rises 300 m above the northern somma rim and buries the rim on other sides. The younger cone is truncated by a large elliptical prehistorical summit caldera, 2 x 2.4 km in diameter and 500 m deep, with a lake at its bottom. Lava flows predominate in the caldera walls, although lahar and pyroclastic-flow deposits surround the volcano. A brief but powerful explosive eruption in 1835 is Nicaragua's largest during historical time. Ash fell as far away as México, Costa Rica, and Jamaica, and pyroclastic flows reached the Gulf of Fonseca.
Information Contacts: Pierre Delmelle, Département de Géologie, Université de Montréal, Montréal, Québec H3C 3J7, Canada; Glyn Williams-Jones, Department of Earth Sciences, The Open University, Milton Keynes MK7 6AA, England, United Kingdom; José Garcia Alavarez, Martha Navarro, and Wilfried Strauch, INETER, Apartado Postal 2110, Managua, Nicaragua.
Fuego
Guatemala
14.4748°N, 90.8806°W; summit elev. 3799 m
All times are local (unless otherwise noted)
Eruption on 21 May dropped up to 40 cm of ash on local population; small lava flow
Reports from INSIVUMEH described an eruption during late May 1999, the first from Fuego since 1987. At 1000 on 21 May observers noted that small quantities of ash fell on the cities of Villa Nueva, Barbarena, Cuilapa, Jutiapa, and Chiquimula. At 1800 on 21 May an eruption sent ash to the S, SE, and SW. The regional ashfall affected areas including the peak ~4 km N (Yepocapa), the cities of Alotenango, Escuintla, Santa Lucia, Cotzumalguapa, Palin, Amatitlán, and the slopes of Pacaya volcano. Ash thicknesses at proximal sites were 10-40 cm. At 2100 the activity diminished, but continued with moderate 3-minute explosions. The Aeronautica Civil recommended that planes should not go any closer than 40 km from the volcano. At 2200 a lava flow ~200 m long was seen on the W side of the Barranca Honda drainage. By this time, the atmospheric ash had settled, and the Aeronautica Civil recommended not flying closer than 15 km from the volcano.
INSIVUMEH reported that NOAA detected ash over much of Guatemala to 14-15 km altitudes. It was not possible to see the activity in the crater, and the meteorological conditions for the next 24 hours consisted of electrical thunderstorms with rain in the afternoon and evening. At 0530 the seismic station "FG" located in the FICA La Reunion, 3.5 km E of the crater, registered movement beneath the volcano. Every hour for three hours, explosions sent gases and moderate ash to heights of 600-800 m.
Geologic Background. Volcán Fuego, one of Central America's most active volcanoes, is also one of three large stratovolcanoes overlooking Guatemala's former capital, Antigua. The scarp of an older edifice, Meseta, lies between Fuego and Acatenango to the north. Construction of Meseta dates back to about 230,000 years and continued until the late Pleistocene or early Holocene. Collapse of Meseta may have produced the massive Escuintla debris-avalanche deposit, which extends about 50 km onto the Pacific coastal plain. Growth of the modern Fuego volcano followed, continuing the southward migration of volcanism that began at the mostly andesitic Acatenango. Eruptions at Fuego have become more mafic with time, and most historical activity has produced basaltic rocks. Frequent vigorous eruptions have been recorded since the onset of the Spanish era in 1524, and have produced major ashfalls, along with occasional pyroclastic flows and lava flows.
Information Contacts: Instituto Nacional de Sismologia, Vulcanologia, Meteorologia e Hidrologia (INSIVUMEH), Ministero de Communicaciones, Transporto, Obras Públicas y Vivienda, 7a. Av. 14-57 zona 13 ciudad de Guatemala 01013, Guatemala.
Guagua Pichincha (Ecuador) — April 1999 Cite this Report
Guagua Pichincha
Ecuador
0.171°S, 78.598°W; summit elev. 4784 m
All times are local (unless otherwise noted)
Summary of activity in April; tremor for extended durations; phreatic explosions
The Instituto Geofísico of Ecuador's Escuela Politécnica Nacional (IG-EPN) records visual observations and monitors seismic events, crustal deformation, and geochemistry at Guagua Pichincha. This volcano consists of a 2-km-wide caldera, breached to the west, on whose floor lies a dome complex and the present explosion craters. The following summarizes their daily observations for April 1999. During this period, a Yellow alert status persisted.
Bad weather often prevented or hindered visual observations. Guards at the refuge station and visiting scientists frequently reported noises and the strong smell of sulfur from the fumaroles. Ash-and-steam plumes from dome fumaroles, when visible, ranged from 100 to 800 m in height, while explosion plumes reached 1 km. On 21 April, a new crater with a diameter of ~8 m was reported east of the 1981 explosion crater.
A summary of monthly events since August 1998 is presented in table 3. Volcano-tectonic (VT), long-period (LP), and hybrid earthquakes, sometimes in multiples, occurred almost daily throughout April with the daily numbers increasing substantially during the latter third of the month. Similarly, two-thirds of the 18 phreatic explosions (PE) occurred during the last week of April. Reduced displacement measurements (RDs) of phreatic explosions ranged from those too small to measure to the largest of 11.7 cm2.
Table 3. Monthly summaries of phreatic explosions and seismic events (volcano-tectonic, long-period, and hybrid) at Guagua Pichincha, August 1998-April 1999. Courtesy IG-EPN.
| Month |
Phreatic Explosions |
Volcano-tectonic |
Long-period |
Hybrid |
| Aug 1998 |
8 |
23 |
18 |
29 |
| Sep 1998 |
24 |
73 |
165 |
1,626 |
| Oct 1998 |
25 |
49 |
191 |
1,448 |
| Nov 1998 |
18 |
52 |
234 |
419 |
| Dec 1998 |
7 |
59 |
94 |
166 |
| Jan 1999 |
18 |
41 |
218 |
1,163 |
| Feb 1999 |
28 |
60 |
190 |
2,099 |
| Mar 1999 |
21 |
115 |
73 |
940 |
| Apr 1999 |
17 |
45 |
51 |
369 |
Tremor of 17 hours duration occurred on the 3 April, and the subsequent tremor that started on the 9th continued to be active throughout the remainder of the month with varying amplitude and frequency. As the number of PE and HY events increased during the last week of April , the character of the tremor varied markedly having extended periods of quiescence and then periods of large amplitude at varying frequency. For example, on 26 April the amplitude of the tremor diminished until 1800 hours, but after an explosion that evening, the amplitude increased and tremor persisted for about 2 hours. Then on the 27th, the tremor changed character after a morning explosion and high amplitudes at nearby stations at frequencies between 2.8-3.3 Hz diminished over a period of 6 hours.
Geologic Background. Guagua Pichincha and the older Pleistocene Rucu Pichincha stratovolcanoes form a broad volcanic massif that rises immediately W of Ecuador's capital city, Quito. A lava dome grew at the head of a 6-km-wide scarp formed during a late-Pleistocene slope failure ~50,000 years ago. Subsequent late-Pleistocene and Holocene eruptions from the central vent consisted of explosive activity with pyroclastic flows accompanied by periodic growth and destruction of the lava dome. Many minor eruptions have been recorded since the mid-1500's; the largest took place in 1660, when ash fell over a 1,000 km radius and accumulated to 30 cm depth in Quito. Pyroclastic flows and surges also occurred, primarily to then W, and affected agricultural activity.
Information Contacts: Instituto Geofísico, Escuela Politécnica Nacional, Apartado 17-01-2759, Quito, Ecuador.
Krakatau (Indonesia) — April 1999 Cite this Report
Krakatau
Indonesia
6.1009°S, 105.4233°E; summit elev. 285 m
All times are local (unless otherwise noted)
Explosive eruptions continue in April
After a repose of twenty months Anak Krakatau erupted again at 1615 on 5 February (BGVN 24:02). Several scientists, including some from the Volcanological Survey of Indonesia (VSI) and from Unocal Geothermal of Indonesia, visited Krakatau from 28 March to 6 April. This report combines their observations.
Seismic activity preceding and coincident with the eruption went undetected because of ballistic bomb damage to seismometers. Until 3 April, activity typically involved 5-10 explosions per day. Beginning at about 1500 on 3 April ash explosions became almost continuous (figures 12 and 13). During the interval 0955-1230 on 4 April, the volcano erupted every 1-3 minutes from a new crater a few hundreds of meters S of the summit crater that formed during 1992-97. Accidental blocks, lava bombs, and ash reached heights of 250-300 m above the crater rim. About a third of the eruptions were Strombolian, with showers of lava and bombs (occasionally 1 m across) ejected 50-100 m above the vent and falling onto the upper flanks. Some ballistic fragments 20-30 cm in diameter rose above the associated ash cloud and landed 800 m from the vent on the upper flanks before rolling down to the shore. Eruptions were often accompanied by thunderous blasts and rumbling sounds heard several kilometers from the crater, including at Pasauran and Kalianda observatories 42 km from Krakatau.
A wedge-shaped deposit of fresh ash and bombs was visible on the crater rim (the rim is higher on the SE due to prevailing northwesterly winds that blow ash and other ejecta in that direction). Ash clouds were light gray. Observers noticed fine black ash that fell on their boat as they passed under the plumes ~500 m downwind from the crater. The ash was crystal-poor and frothy, suggesting that it was mostly juvenile material.
A solfataric plume originating at ~200 m elevation on the N flank discharged steam and bluish gas. Nearly a dozen other solfataras discharged steam and non-condensible gas and deposited bright yellow native sulfur around vents near the summit (figure 14). Another fumarolic area was centered at 140 m elevation on the W flank below the active crater.
Scientists observed several boatloads of tourists who had landed on the accessible SE beach. Officials had closed an area of 3 km radius around the vent, but many tourists defied the prohibition and climbed to the ridge 400 m from the summit vents. Escaping gases continued to pose a very serious hazard.
The renowned Krakatau volcano lies in the Sunda Strait between Java and Sumatra. Caldera collapse, perhaps in 416 AD, destroyed the ancestral Krakatau edifice, forming a 7-km-wide caldera. Remnants of this volcano formed Verlaten and Lang Islands; subsequently Rakata, Danan and Perbuwatan volcanoes were formed, coalescing to create the pre-1883 Krakatau Island. Caldera collapse during the catastrophic 1883 eruption destroyed Danan, and Perbuwatan volcanoes, and left only a remnant of Rakata volcano. The post-collapse cone of Anak Krakatau (Child of Krakatau), constructed within the 1883 caldera at a point between the former cones of Danan and Perbuwatan, has been the site of frequent eruptions since 1927.
During six lava-producing eruptions between 1958 and 1980, flows moved S and SW from the SW crater. Observations are frequently made from Carita Beach on the coast of Java, ~40 km E. The local VSI volcano observatory is at Pasuaran, ~42 km E.
Geologic Background. The renowned Krakatau (frequently mis-named as Krakatoa) volcano lies in the Sunda Strait between Java and Sumatra. Collapse of an older edifice, perhaps in 416 or 535 CE, formed a 7-km-wide caldera. Remnants of that volcano are preserved in Verlaten and Lang Islands; subsequently the Rakata, Danan, and Perbuwatan cones were formed, coalescing to create the pre-1883 Krakatau Island. Caldera collapse during the catastrophic 1883 eruption destroyed Danan and Perbuwatan, and left only a remnant of Rakata. This eruption caused more than 36,000 fatalities, most as a result of tsunamis that swept the adjacent coastlines of Sumatra and Java. Pyroclastic surges traveled 40 km across the Sunda Strait and reached the Sumatra coast. After a quiescence of less than a half century, the post-collapse cone of Anak Krakatau (Child of Krakatau) was constructed within the 1883 caldera at a point between the former Danan and Perbuwatan cones. Anak Krakatau has been the site of frequent eruptions since 1927.
Information Contacts: Igan S. Sutawidjaja, Volcanological Survey of Indonesia (VSI), Jalan Diponegoro No. 57, Bandung 40122, Indonesia (URL: http://www.vsi.esdm.go.id); David Sussman, Unocal Geothermal of Indonesia, Sentral Senayan-1 Office Tower, 11th Floor, Jalan Asia Afrika No. 8, Jakarta 10270, Indonesia; John Moran, c/o USAID, Jalan Medan Merdeka Selatan No. 5, Jakarta 10110, Indonesia; Rene Wassill, Wisma Met. I, 5th floor, Jalan Sudirman Kav 26, Jakarta, Indonesia.
Langila (Papua New Guinea) — April 1999 Cite this Report
Langila
Papua New Guinea
5.525°S, 148.42°E; summit elev. 1330 m
All times are local (unless otherwise noted)
Continued Vulcanian activity at Crater 2; Crater 3 is quiet
Crater 2 continued to display irregular Vulcanian eruptive activity and pale gray ash emissions. Crater 3 remained quiet. During March the ash plumes rose to 500-2,000 m above the summit before being blown NW. Variable winds in April caused the ash plumes to be blown to the NW, NE, and SE.
Geologic Background. Langila, one of the most active volcanoes of New Britain, consists of a group of four small overlapping composite basaltic-andesitic cones on the lower E flank of the extinct Talawe volcano in the Cape Gloucester area of NW New Britain. A rectangular, 2.5-km-long crater is breached widely to the SE; Langila was constructed NE of the breached crater of Talawe. An extensive lava field reaches the coast on the N and NE sides of Langila. Frequent mild-to-moderate explosive eruptions, sometimes accompanied by lava flows, have been recorded since the 19th century from three active craters at the summit. The youngest and smallest crater (no. 3 crater) was formed in 1960 and has a diameter of 150 m.
Information Contacts: Herman Patia, RVO.
Manam (Papua New Guinea) — April 1999 Cite this Report
Manam
Papua New Guinea
4.08°S, 145.037°E; summit elev. 1807 m
All times are local (unless otherwise noted)
Mild eruptive activity at Main Crater; Southern Crater is quiet
Mild, irregular, eruptive activity continued from Manam's Main Crater, while Southern Crater remained quiet. Main Crater continued to emit minor pale gray ash intermittently throughout March and April, with emissions rising to ~500 m above the summit before being blown to the NW with resulting fine ashfall. There were no reports of any noise or nighttime glow. Southern Crater was quiet, releasing white vapor only. However, a weak steady red glow was visible during 17-21 April. Seismic activity was low and there were no significant change in ground deformation.
Geologic Background. The 10-km-wide island of Manam, lying 13 km off the northern coast of mainland Papua New Guinea, is one of the country's most active volcanoes. Four large radial valleys extend from the unvegetated summit of the conical basaltic-andesitic stratovolcano to its lower flanks. These valleys channel lava flows and pyroclastic avalanches that have sometimes reached the coast. Five small satellitic centers are located near the island's shoreline on the northern, southern, and western sides. Two summit craters are present; both are active, although most observed eruptions have originated from the southern crater, concentrating eruptive products during much of the past century into the SE valley. Frequent eruptions, typically of mild-to-moderate scale, have been recorded since 1616. Occasional larger eruptions have produced pyroclastic flows and lava flows that reached flat-lying coastal areas and entered the sea, sometimes impacting populated areas.
Information Contacts: Herman Patia, Rabaul Volcano Observatory (RVO), P.O. Box 386, Rabaul, Papua New Guinea.
Masaya
Nicaragua
11.9844°N, 86.1688°W; summit elev. 594 m
All times are local (unless otherwise noted)
Continued degassing and marked gravity decreases; previously unreported small explosions
The present activity began in mid-1993 with the brief formation of a lava pond and gradual increase in degassing (BGVN 18:04 and 18:07). Small explosions in Santiago Crater on 17 November 1997 and 14 September 1998 ejected lava bombs up to 50 cm in diameter onto the western rim. Canadian, British and Nicaraguan scientists returned between February and March 1999 to continue the study of the degassing crisis (BGVN 23:09).
A gas plume was continuously emitted from a vent with a diameter of 15-20 m at the bottom of Santiago Crater. A characteristic sound, like the breaking of waves, was created by gas emission. Incandescence of the vent walls was visible only at night. Temperatures recorded at the vent with an infrared thermometer, 200-380°C, were highly dependent upon the opacity of the gas plume.
COSPEC measurements of SO2 revealed continued high flux, varying from 1,300 to 4,060 metric tons/day. Remote sensing of the gas plume composition using an open-path Fourier transform infrared spectrometer (OP-FTIR) in a variety of modes reveals a SO2/HCl volume ratio of about 2, comparable to that obtained in February-April 1998.
The OP-FTIR was also run simultaneously with direct plume sampling using a filter pack-collection technique at the summit and on the Llano Pacaya ridge, 15 km from Santiago Crater. Acid gases (CO2, SO2, H2S, HCl and HF) were passively collected from the crater rim using concentrated KOH solutions exposed to the atmosphere. These experiments should allow for a comparison between remote and direct sampling techniques and provide information on variations in plume composition as it disperses.
Fumigation of the land downwind from Santiago Crater continues to affect the local communities. SO2 plume dispersion and deposition was monitored with a large network of diffusion tubes and sulfation plates. Preliminary results indicate that dispersion of the plume is strongly influenced by local topography. Near-ground SO2 concentrations above 100 ppb were measured on the Llano Pacaya ridge in February-April 1999. These high values may indicate a serious local health hazard. Acid rain collected at the summit and about 7 km downwind on 15 March 1999 had pH values between 3.5 and 4.
Microgravity surveys between March 1997 and February 1999 appear to show a consistent decrease in gravity (up to 90 microgals) immediately beneath the Santiago pit crater. This decrease is of the same order as that measured between 1993 and 1994 at the start of the degassing crisis.
Geologic Background. Masaya volcano in Nicaragua has erupted frequently since the time of the Spanish Conquistadors, when an active lava lake prompted attempts to extract the volcano's molten "gold" until it was found to be basalt rock upon cooling. It lies within the massive Pleistocene Las Sierras caldera and is itself a broad, 6 x 11 km basaltic caldera with steep-sided walls up to 300 m high. The caldera is filled on its NW end by more than a dozen vents that erupted along a circular, 4-km-diameter fracture system. The Nindirí and Masaya cones, the source of observed eruptions, were constructed at the southern end of the fracture system and contain multiple summit craters, including the currently active Santiago crater. A major basaltic Plinian tephra erupted from Masaya about 6,500 years ago. Recent lava flows cover much of the caldera floor and there is a lake at the far eastern end. A lava flow from the 1670 eruption overtopped the north caldera rim. Periods of long-term vigorous gas emission at roughly quarter-century intervals have caused health hazards and crop damage.
Information Contacts: Pierre Delmelle and John Stix, Département de Géologie, Université de Montréal, Montréal, Québec H3C 3J7, Canada; Glyn Williams-Jones, Dave Rothery, Hazel Rymer, Lisa Horrocks and Mike Burton, Department of Earth Sciences, The Open University, Milton Keynes MK7 6AA, United Kingdom; Peter Baxter, Department of Community Medicine, University of Cambridge, Cambridge CH1 2H8, United Kingdom; José Garcia Alavarez, Martha Navarro, and Wilfried Strauch, INETER, Apartado Postal 2110, Managua, Nicaragua.
Popocatepetl (Mexico) — April 1999 Cite this Report
Popocatepetl
Mexico
19.023°N, 98.622°W; summit elev. 5393 m
All times are local (unless otherwise noted)
Continued sporadic eruptions visible on Doppler radar
During April 1999 the volcano returned to low levels of activity. Small sporadic exhalations occurred that occasionally carried sufficient ash to be visible on Doppler radar.
At 0031 on 2 April an A-type earthquake of M 2.1 occurred at a depth of 7.6 km centered 3 km NE of the crater. Small ash emissions were accompanied by gas and steam. On 3 April a fumarolic emission with some ash could be seen descending the NE slope.
A moderate explosion, lasting 40 seconds in its most intense phase, began at 0327 on 4 April. People in the town of San Andres Calpan, 20 km from the volcano, heard the explosion and observed incandescence over the crater. The incandescence was also recorded by CENAPRED video cameras, which showed that during the event incandescent material was ejected over the E flank. Doppler radar recorded an ash emission following the explosion. Activity soon returned to a more stable condition. At 1240 an A-type earthquake of M 2.4 occurred 8 km NE of the crater at 6.2 km depth, and at 0945 on 5 April an A-type earthquake with M 2.2 occurred 8.5 km NE of the summit at 6.6 km depth.
Monitors detected a moderate exhalation lasting 90 seconds beginning at 0031 on 11 April. This event was followed by six similar exhalations during the next 18 minutes. Doppler radar did not detect any significant ash emission, and no incandescence was observed in the crater. During 14-15 April small and medium exhalations with durations of 1-4 minutes were accompanied by vapor, gas, and some ash emissions. At 1056 a moderate explosion lasted ~4 minutes and produced a 3.5-km-high ash cloud that was transported NE.
Earthquakes were recorded near the volcano on 26 April. The first started at 0014 with M 2.2, located 9 km SE of the crater at a depth of 4.3 km. Another event occurred at 0954 with M 2.4 located 8 km SE of the crater at a depth of 3.4 km.
Geologic Background. Volcán Popocatépetl, whose name is the Aztec word for smoking mountain, rises 70 km SE of Mexico City to form North America's 2nd-highest volcano. The glacier-clad stratovolcano contains a steep-walled, 400 x 600 m wide crater. The generally symmetrical volcano is modified by the sharp-peaked Ventorrillo on the NW, a remnant of an earlier volcano. At least three previous major cones were destroyed by gravitational failure during the Pleistocene, producing massive debris-avalanche deposits covering broad areas to the south. The modern volcano was constructed south of the late-Pleistocene to Holocene El Fraile cone. Three major Plinian eruptions, the most recent of which took place about 800 CE, have occurred since the mid-Holocene, accompanied by pyroclastic flows and voluminous lahars that swept basins below the volcano. Frequent historical eruptions, first recorded in Aztec codices, have occurred since Pre-Columbian time.
Information Contacts: Servando De la Cruz-Reyna1,2, Roberto Quaas1,2; Carlos Valdés G.2, and Alicia Martinez Bringas1. 1 Centro Nacional de Prevencion de Desastres (CENAPRED), Delfin Madrigal 665, Col. Pedregal de Santo Domingo, Coyoacán, 04360, México D.F. (URL: https://www.gob.mx/cenapred/); 2Instituto de Geofisica, UNAM, Coyoacán 04510, México D.F., México.
Rabaul (Papua New Guinea) — April 1999 Cite this Report
Rabaul
Papua New Guinea
4.2459°S, 152.1937°E; summit elev. 688 m
All times are local (unless otherwise noted)
Continued ash emission at Tavurvur; low seismicity
Tavurvur crater activity continued small pale-gray ash emissions at long irregular intervals during March and April. No significant changes in ground deformation were measured during this period. There was a slight increase in the rate of ash emission during mid-March. The emissions contained moderate ash content and rose < 1 km above the summit before blowing to the S and SE with fine ashfall downwind. On 22 March a few moderate explosions were accompanied by loud roaring noises. A similar pattern occurred during April, i.e., a steady increase in the rate of ash emission until 22 April with moderate explosions being accompanied by loud roaring noises.
Seismic activity related to the continuing eruptive activity at Tavurvur was much lower; there were 120 low-frequency events in March and 142 in April, compared with 465 in February and 1,413 in January. A total of 15 explosions were recorded through March, whereas only three occurred in April. Five of the six high-frequency events in March were located; one occurred to the W and the rest NE of the caldera. Only three were recorded in April, one to the E and two NE of the caldera.
Geologic Background. The low-lying Rabaul caldera on the tip of the Gazelle Peninsula at the NE end of New Britain forms a broad sheltered harbor utilized by what was the island's largest city prior to a major eruption in 1994. The outer flanks of the asymmetrical shield volcano are formed by thick pyroclastic-flow deposits. The 8 x 14 km caldera is widely breached on the east, where its floor is flooded by Blanche Bay and was formed about 1,400 years ago. An earlier caldera-forming eruption about 7,100 years ago is thought to have originated from Tavui caldera, offshore to the north. Three small stratovolcanoes lie outside the N and NE caldera rims. Post-caldera eruptions built basaltic-to-dacitic pyroclastic cones on the caldera floor near the NE and W caldera walls. Several of these, including Vulcan cone, which was formed during a large eruption in 1878, have produced major explosive activity during historical time. A powerful explosive eruption in 1994 occurred simultaneously from Vulcan and Tavurvur volcanoes and forced the temporary abandonment of Rabaul city.
Information Contacts: Herman Patia, Rabaul Volcano Observatory (RVO), P.O. Box 386, Rabaul, Papua New Guinea.
Nevado del Ruiz (Colombia) — April 1999 Cite this Report
Nevado del Ruiz
Colombia
4.892°N, 75.324°W; summit elev. 5279 m
All times are local (unless otherwise noted)
Moderate earthquake swarm
A press release on 31 March noted that small long-period earthquakes had been detected at Ruiz throughout the month, although some may have been related to glacier movement; one long-period event on 24 March saturated the seismic stations near the crater. After several months of low seismicity, a moderate swarm of 80 volcanic-tectonic earthquakes within an hour was recorded on 15 April. The largest had a magnitude of 1.3. Small long-period earthquakes were present during the entire month of April, centered on the SW flank near the crater. Seismicity was still at low levels as of 25 May.
Geologic Background. Nevado del Ruiz is a broad, glacier-covered volcano in central Colombia that covers more than 200 km2. Three major edifices, composed of andesitic and dacitic lavas and andesitic pyroclastics, have been constructed since the beginning of the Pleistocene. The modern cone consists of a broad cluster of lava domes built within the caldera of an older edifice. The 1-km-wide, 240-m-deep Arenas crater occupies the summit. The prominent La Olleta pyroclastic cone located on the SW flank may also have been active in historical time. Steep headwalls of massive landslides cut the flanks. Melting of its summit icecap during historical eruptions, which date back to the 16th century, has resulted in devastating lahars, including one in 1985 that was South America's deadliest eruption.
Information Contacts: INGEOMINAS, Volcanological and Seismological Observatory of Manizales, Avenida 12 de Octubre No. 15 - 47, Manizales, Colombia (URL: http://www.umanizales.edu.co/~uom/).
Sheveluch
Russia
56.653°N, 161.36°E; summit elev. 3283 m
All times are local (unless otherwise noted)
Large ash explosions on 3 and 12 April
On 2 April a fumarolic plume rose 800-1,000 m above the crater and extended more than 10 km E. At 1100 on 3 April an ash explosion created a plume that rose 2,000 m above the dome. Coincident with this explosion, a shallow seismic event was registered under the volcano beginning at 1056. The ash cloud dissipated by 1130. That evening and the next day, a gas-and-steam plume rose 600 m above the dome. Fumarolic plumes were observed during most of the following week, including a gas-and-steam plume on 6 April that rose 1,000 m above the dome.
At 1900 on 12 April an ash explosion was observed and a plume rose 1,000 m above the dome. Shallow seismicity under the volcano had started at 1855. Explosions sent ash up to 200 m above the dome every 2-3 minutes during the hour following the initial blast. The ash plume extended 10 km to the E. Satellite imagery taken at 2052 on 12 April showed a 30-km-long, ash-poor, low-altitude plume extending SE. Another satellite image on 13 April, taken at 0750, indicated a possible thermal anomaly at the volcano. A series of shallow seismic events continued to be recorded during 14-15 April. Gas-and-steam plumes were seen on 13, 17-18, and 20 April.
Geologic Background. The high, isolated massif of Sheveluch volcano (also spelled Shiveluch) rises above the lowlands NNE of the Kliuchevskaya volcano group. The 1,300 km3 andesitic volcano is one of Kamchatka's largest and most active volcanic structures, with at least 60 large eruptions during the Holocene. The summit of roughly 65,000-year-old Stary Shiveluch is truncated by a broad 9-km-wide late-Pleistocene caldera breached to the south. Many lava domes occur on its outer flanks. The Molodoy Shiveluch lava dome complex was constructed during the Holocene within the large open caldera; Holocene lava dome extrusion also took place on the flanks of Stary Shiveluch. Widespread tephra layers from these eruptions have provided valuable time markers for dating volcanic events in Kamchatka. Frequent collapses of dome complexes, most recently in 1964, have produced debris avalanches whose deposits cover much of the floor of the breached caldera.
Information Contacts: Olga Chubarova, Kamchatka Volcanic Eruptions Response Team (KVERT), Institute of Volcanic Geology and Geochemistry, Piip Ave. 9, Petropavlovsk-Kamchatsky, 683006, Russia; Tom Miller, Alaska Volcano Observatory (AVO), a cooperative program of a) U.S. Geological Survey, 4200 University Drive, Anchorage, AK 99508-4667, USA (URL: http://www.avo.alaska.edu/), b) Geophysical Institute, University of Alaska, PO Box 757320, Fairbanks, AK 99775-7320, USA, and c) Alaska Division of Geological & Geophysical Surveys, 794 University Ave., Suite 200, Fairbanks, AK 99709, USA.
Shishaldin (United States) — April 1999 Cite this Report
Shishaldin
United States
54.756°N, 163.97°W; summit elev. 2857 m
All times are local (unless otherwise noted)
Steam-and-ash plume on 19 April rose to 15-20 km and was carried to great distances
Strombolian eruptions, including forceful steam-and-ash plumes, peaked at Shishaldin on 19 April (BGVN 24:03) and continued well into May. The 19 April plume rose to 15-20 km and various components were carried in different directions (figure 3). As discussed further in the Atmospheric Effects section below, scientists studying atmospheric aerosols with a variety of satellite-based instruments as well as ground-based lidar detected atmospheric anomalies through at least late May; some at great distances from the volcano. The initial anomalies seen by satellite were clearly linked to the 19 April eruption, but at longer time intervals after the eruption and at greater distances from the source, this became less certain.
Moderate Strombolian eruptions and elevated seismicity continued following the initial forceful eruption and through the night of 22 April, . Lava fountaining to about 150 m above the summit coincided with satellite images of occasional steam and sparse ash clouds. These clouds extended ~48 km at altitudes less than 4.6 km. Satellite data during the first week of May showed a few small ash-poor plumes, but no thermal anomalies or other indicators of significant eruptive activity were seen.
The next significant reported event, on 13 May, occurred after a night with a small thermal anomaly in satellite imagery and weak tremor. The crew of a National Weather Service boat at the N end of False Pass, 30 km NE from the volcano, saw three puffs at ~1025. A plume rose 300 m above the summit. A pilot's report at 1155 confirmed the activity. Poor weather conditions may have thwarted observers' ability to see eruptive activity the following week and none was reported. At 2311 on 24 May a pilot reported a plume that rose to 6.1 km. Ash-rich steam in a plume was visible in satellite imagery at 1459 on 25 May, extending 160 km S from Shishaldin at an estimated altitude of ~4.6 km.
One of the most active volcanoes of the Aleutian Islands, the glacier-covered Shishaldin lies at the westernmost end of three large stratovolcanoes on the eastern half of Unimak Island. The volcano's frequent explosive activity has primarily consisted of Strombolian ash eruptions vented from its small summit crater, and occasional lava flows. The historical record of such events goes back to the 18th century.
Geologic Background. The symmetrical glacier-covered Shishaldin in the Aleutian Islands is the westernmost of three large stratovolcanoes in the eastern half of Unimak Island. The Aleuts named the volcano Sisquk, meaning "mountain which points the way when I am lost." Constructed atop an older glacially dissected edifice, it is largely basaltic in composition. Remnants of an older edifice are exposed on the W and NE sides at 1,500-1,800 m elevation. There are over two dozen pyroclastic cones on its NW flank, which is covered by massive aa lava flows. Frequent explosive activity, primarily consisting of Strombolian ash eruptions from the small summit crater, but sometimes producing lava flows, has been recorded since the 18th century. A steam plume often rises from the summit crater.
Information Contacts: Alaska Volcano Observatory (AVO), a cooperative program of a) U.S. Geological Survey, 4200 University Drive, Anchorage, AK 99508-4667, USA (URL: http://www.avo.alaska.edu/), b) Geophysical Institute, University of Alaska, PO Box 757320, Fairbanks, AK 99775-7320, USA, and c) Alaska Division of Geological & Geophysical Surveys, 794 University Ave., Suite 200, Fairbanks, AK 99709, USA; NOAA/NESDIS Operational Significant Event Imagery Support Team, Interactive Processing Branch E/SP22, 5200 Auth Road, Camp Springs, MD 20746, USA (URL: https://www.nnvl.noaa.gov/).
Telica
Nicaragua
12.606°N, 86.84°W; summit elev. 1036 m
All times are local (unless otherwise noted)
Phreatic eruptions in May and June cause local ashfall
At about 0200 on 21 May a phreatic eruption marked by explosions began from the crater. At daybreak the gas plume extended to ~500 m in height. The following day observers on the crater rim noted a new 50-m-diameter vent on the crater floor. At the time of the observations, an intense gas stream was emanating from the new vent, accompanied by a jet engine-like sound. Fumarolic activity within Telica's crater was much stronger as well. Diminishing phreatic eruptions continued until 23 May. No ashfall was reported. INETER geologists who visited Telica on 18 May had not seen any evidence of increased activity; seismic monitoring did not show any precursors.
Wilfried Strauch reported that new phreatic eruptions took place on 5 June 1999, most notably between 1830 and 1900. These explosions were strong enough to register on nearby seismometers and resulted in minor ashfall in Chichigalpa, ~15 km WSW of Telica. Following the explosions, seismic activity rapidly declined. A 7 June article by La Prensa de Nicaragua stated that 6,000 people had to be evacuated in case of eruption. The article claimed that Telica discharged a cloud of ash to the SW that had bathed the bordering communities and part of Chichigalpa and scattered gas and ash caused adjacent inhabitants near the volcano to suffer irritation of eyes, throat, and nose. Observers noted a steaming area in the W sector of the volcano, 500 m from the crater border.
Crater observations March 1997-February 1998. During March 1997 (BGVN 22:03), INETER recorded high seismicity, ~150 events/day. During December 1996 there had been ~100 events/day. Visits to the summit crater revealed fresh ashfall, numerous small landslides inside the crater, and moderate fumarolic activity in the walls and floor of the crater. Fumaroles lying along a fracture trending NE-SW and located near the seismic station outside the active crater had maximum temperatures of 85°C. Infrared camera measurements on 20 March 1997 detected a zone of high temperatures near the base of the W crater wall.
Seismicity and the extent of fumaroles increased slightly in June 1997 (BGVN 22:06). Whereas in April and May the number of volcano-seismic events was near 160/day (BGVN 22:05), during June this rose to ~220/day. Still, crater degassing remained very small. INETER volcanologists observed that NW-flank fissures had grown in number, extent, and apparent depth. During a previously unreported crater visit by Alain Creusot on 29 September 1997, he observed both a small increase in the fumarolic activity and that an active collapse zone on the N crater rim had enlarged by ~15 m. A portable seismic station recorded both an absence of tremor and 10-15 microearthquakes every hour. A February 1998 visit to Telica's crater (BGVN 23:03) also revealed raised temperatures and an active collapse zone.
Geologic Background. Telica, one of Nicaragua's most active volcanoes, has erupted frequently since the beginning of the Spanish era. This volcano group consists of several interlocking cones and vents with a general NW alignment. Sixteenth-century eruptions were reported at symmetrical Santa Clara volcano at the SW end of the group. However, its eroded and breached crater has been covered by forests throughout historical time, and these eruptions may have originated from Telica, whose upper slopes in contrast are unvegetated. The steep-sided cone of Telica is truncated by a 700-m-wide double crater; the southern crater, the source of recent eruptions, is 120 m deep. El Liston, immediately E, has several nested craters. The fumaroles and boiling mudpots of Hervideros de San Jacinto, SE of Telica, form a prominent geothermal area frequented by tourists, and geothermal exploration has occurred nearby.
Information Contacts: Wilfried Strauch, Virginia Tenorio, and Julio Alvarez, Department of Geophysics, Instituto Nicaraguense de Estudios Territoriales (INETER), P.O. Box 1761, Managua, Nicaragua; La Prensa de Nicaragua, Managua, Nicaragua (URL: http://www.laprensa.com.ni); Alain Creusot, Instituto Nicaraguense de Energía, Managua, Nicaragua.
Whakaari/White Island (New Zealand) — April 1999 Cite this Report
Whakaari/White Island
New Zealand
37.52°S, 177.18°E; summit elev. 294 m
All times are local (unless otherwise noted)
Metra Crater excavated by 17 April explosions
Explosive eruptions on 17 April produced significant changes at Metra Crater. Institute of Geological & Nuclear Sciences (IGNS) scientists visited the volcano on 20 and 30 April to service the seismic installation and assess the effects of the explosive eruptions. These were the largest explosive eruptions since September 1992.
The whole island was blanketed with a thin layer of light-gray ash on 20 April. No single direction of dispersal was apparent, although ground thickness suggested that dispersal was toward the E. The lake in Metra Crater had disappeared and a steam plume traveled to the SE. During the 30 April visit a steam-and-gas plume, fed by emissions from PeeJay Vent and a new vent E of PeeJay, rose 750-900 m before traveling SW (figure 40).
Ballistic blocks and bombs had been ejected 450 m by the 17 April explosions; judging from changes in crater size and shape, they likely came from Metra Crater. The larger fragments fell mainly to the S and SW. Abundant centimeter-size fragments had impacted into new ash around the vents at distances of up to 600 m radius. At least 10 cm of fresh ash had fallen within a 200-m radius of the main crater by 20 April, but rain had caused some erosion and consolidation. The floor of 1978/90 Crater Complex was covered with ash and ballistic ejecta, and much of the original Metra Crater area had been excavated by the recent explosions. Metra was gently steaming and contained a few small puddles of yellow-green brine. Mud bubbling could be heard. No ash fell during the 20 April visit but PeeJay vent discharged white steam and gas. Collapse of the 1978/90 Crater Complex floor, especially between PeeJay and Donald Mound, left concentric cracks around the slumped margins of Metra Crater. A large fumarole had formed E of PeeJay vent. Output of the main fumaroles on the W and E walls did not appear to have changed. Noisy Nellie was producing almost colorless high-temperature steam and gas. Gas emissions around Donald Mound were weak.
Two features were formed by the 17 April explosive excavation of Metra Crater; the W embayment was the deeper and more active feature on 30 April. A small yellow-green lakelet had formed on its floor. The crater's western margins were still collapsing, and several large geothermal features were present, including geyser-like activity in some pools. The strongest fumaroles were on the NW side, emerging from the base of the crater wall, which was 8-10 m high. The E embayment was shallower and did not contain any active geothermal features. One small yellow-green lakelet was present at the W end of this feature. Several open concentric fractures extended around its margins, suggesting that further collapse may occur in this area.
Ballistic blocks reached a maximum of 2 x 2 m. Most of the larger ones were fresh, black, highly vesicular andesite, sometimes with internal plagioclase banding. No evidence of plastic deformation was seen and most blocks had an outer rim of red "baked" ash. The largest blocks had shattered on impact (figure 41). Dense (older, altered) lava was minor with blocks < 0.5 m in size. Lithified crater-fill sediment blocks were common and comprised either dark gray soft sandstone or harder red, yellow, or pale gray hydrothermally altered material. Ejection of the ballistics occurred largely after the main ashfalls, as evidenced by the thin layer of ash coating the blocks. Clear impact craters from small lapilli occurred at distances from the vents.
Approximately 12 cm of ash was present at Peg Z, but only 2 cm at Peg M on 20 April. A ground-deformation survey of the pegs that survived the April explosions was made on 30 April (figure 42). Seven pegs could not be found. The survey showed subsidence continuing around the ESE margin of 1978/90 Crater Complex, but at a lesser rate than in 1998. Over the remainder of the Main Crater floor weak inflation was apparent at many marks. Although deflationary trends have been observed at some marks since eruptions commenced in 1998, many remained elevated at this time (eg. Pegs C and J).
A white steam-and-gas plume rose 500-700 m above the 1978/90 Crater Complex during a visit by observers on 10 May. The plume was fed by emissions from PeeJay Vent and the new vent E of PeeJay. Emissions from the new vent were the stronger. The steam-and-gas plume formed acid rain, making conditions unpleasant under the plume and near the edge of the Crater Complex. Enlargement of the yellow-green lakelet within Metra Crater caused flooding into the crater's N embayment. There was no evidence of further explosive activity at Metra Crater.
Geologic Background. The uninhabited Whakaari/White Island is the 2 x 2.4 km emergent summit of a 16 x 18 km submarine volcano in the Bay of Plenty about 50 km offshore of North Island. The island consists of two overlapping andesitic-to-dacitic stratovolcanoes. The SE side of the crater is open at sea level, with the recent activity centered about 1 km from the shore close to the rear crater wall. Volckner Rocks, sea stacks that are remnants of a lava dome, lie 5 km NW. Descriptions of volcanism since 1826 have included intermittent moderate phreatic, phreatomagmatic, and Strombolian eruptions; activity there also forms a prominent part of Maori legends. The formation of many new vents during the 19th and 20th centuries caused rapid changes in crater floor topography. Collapse of the crater wall in 1914 produced a debris avalanche that buried buildings and workers at a sulfur-mining project. Explosive activity in December 2019 took place while tourists were present, resulting in many fatalities. The official government name Whakaari/White Island is a combination of the full Maori name of Te Puia o Whakaari ("The Dramatic Volcano") and White Island (referencing the constant steam plume) given by Captain James Cook in 1769.
Information Contacts: Brad Scott, Wairakei Research Centre, Institute of Geological and Nuclear Sciences (IGNS) Limited, Private Bag 2000, Wairakei, New Zealand (URL: https://www.gns.cri.nz/).
Yasur
Vanuatu
19.532°S, 169.447°E; summit elev. 361 m
All times are local (unless otherwise noted)
Cyclical eruptive activity documented during 1994-98
Five years of seismic monitoring at Yasur (figure 17) suggests cycles of several months duration. Long periods of vigorous Strombolian and associated seismic activity have been followed by shorter periods of lower activity. Specifically, as seen in the upper part of figure 17, more vigorous eruptions and seismic activity prevailed from January 1994 to February 1995; this was followed by a sustained period of lower intensity activity during April-August 1995. More vigorous Strombolian eruptions and seismicity returned during May 1996-June 1997; this was followed by a quieter period during July-December 1997 (middle part of figure 17). Next, intense eruptive and seismic activity again prevailed during January-May 1998 (bottom part of figure 17); limited explosive behavior occurred from June 1998 to May 1999. The latter interval included the explosions seen during 9-10 September 1998 (BGVN 23:09), events that in the broad overview of Yasur's behavior ranked as comparatively modest.
A large bomb ejected during January 1998 landed in a relatively flat spot more than 300 m from the crater's E rim (figure 18, bold star). Figure 19 shows a photo of the bomb and its impact crater taken after the bomb cooled. The bomb's size and the distance from the crater attests to the danger of approaching the vents and working on the volcano.
An artist's rendering (figure 20) depicts the crater configuration in March 1998; this morphology was established following the high-activity period of 1994. Only two crater-like vents remained, B and C ("A" was gone; BGVN 20:08, 21:08, 21:09, 22:08, and 22:11). Few if any subsequent changes occurred between March 1998 (when the sketch was made) and mid-May 1999; similarly, structural changes were also absent in this interval.
Geologic Background. Yasur has exhibited essentially continuous Strombolian and Vulcanian activity at least since Captain Cook observed ash eruptions in 1774. This style of activity may have continued for the past 800 years. Located at the SE tip of Tanna Island in Vanuatu, this pyroclastic cone has a nearly circular, 400-m-wide summit crater. The active cone is largely contained within the small Yenkahe caldera, and is the youngest of a group of Holocene volcanic centers constructed over the down-dropped NE flank of the Pleistocene Tukosmeru volcano. The Yenkahe horst is located within the Siwi ring fracture, a 4-km-wide open feature associated with eruption of the andesitic Siwi pyroclastic sequence. Active tectonism along the Yenkahe horst accompanying eruptions has raised Port Resolution harbor more than 20 m during the past century.
Information Contacts: Michel Lardy, Institut de recherche pour le développement (IRD), P.O. Box 76, Port Vila, Vanuatu; Jeannette Tabbagh, CRG-CNRS,58150 Garchy, France; Douglas Charley, Department of Geology, Mines and Water Resources, PMB 01, Port Vila, Vanuatu.