Recently Published Bulletin Reports
Erebus (Antarctica) Lava lake remains active; most thermal alerts recorded since 2019
Rincon de la Vieja (Costa Rica) Frequent phreatic explosions during July-December 2023
Bezymianny (Russia) Explosion on 18 October 2023 sends ash plume 8 km high; lava flows and incandescent avalanches
Kilauea (United States) Low-level lava effusions in the lava lake at Halema’uma’u during July-December 2022
Nyamulagira (DR Congo) Lava flows and thermal activity during May-October 2023
Bagana (Papua New Guinea) Explosions, ash plumes, ashfall, and lava flows during April-September 2023
Mayon (Philippines) Lava flows, pyroclastic flows, ash emissions, and seismicity during April-September 2023
Nishinoshima (Japan) Eruption plumes and gas-and-steam plumes during May-August 2023
Krakatau (Indonesia) White gas-and-steam plumes and occasional ash plumes during May-August 2023
Villarrica (Chile) Strombolian activity, gas-and-ash emissions, and crater incandescence during April-September 2023
Merapi (Indonesia) Frequent incandescent avalanches during April-September 2023
Ebeko (Russia) Moderate explosive activity with ash plumes continued during June-November 2023
Erebus (Antarctica) — January 2024  Cite this Report
Erebus
Antarctica
77.53°S, 167.17°E; summit elev. 3794 m
All times are local (unless otherwise noted)
Lava lake remains active; most thermal alerts recorded since 2019
The lava lake in the summit crater of Erebus has been active since at least 1972. Located in Antarctica overlooking the McMurdo Station on Ross Island, it is the southernmost active volcano on the planet. Because of the remote location, activity is primarily monitored by satellites. This report covers activity during 2023.
The number of thermal alerts recorded by the Hawai'i Institute of Geophysics and Planetology’s MODVOLC Thermal Alerts System increased considerably in 2023 compared to the years 2020-2022 (table 9). In contrast to previous years, the MODIS instruments aboard the Aqua and Terra satellites captured data from Erebus every month during 2023. Consistent with previous years, the lowest number of anomalous pixels were recorded in January, November, and December.
Table 9. Number of monthly MODIS-MODVOLC thermal alert pixels recorded at Erebus during 2017-2023. See BGVN 42:06 for data from 2000 through 2016. The table was compiled using data provided by the HIGP – MODVOLC Thermal Alerts System.
| Year |
Jan |
Feb |
Mar |
Apr |
May |
Jun |
Jul |
Aug |
Sep |
Oct |
Nov |
Dec |
SUM |
| 2017 |
0 |
21 |
9 |
0 |
0 |
1 |
11 |
61 |
76 |
52 |
0 |
3 |
234 |
| 2018 |
0 |
21 |
58 |
182 |
55 |
17 |
137 |
172 |
103 |
29 |
0 |
0 |
774 |
| 2019 |
2 |
21 |
162 |
151 |
55 |
56 |
75 |
53 |
29 |
19 |
1 |
0 |
624 |
| 2020 |
0 |
2 |
16 |
18 |
4 |
4 |
1 |
3 |
18 |
3 |
1 |
6 |
76 |
| 2021 |
0 |
9 |
1 |
0 |
2 |
56 |
46 |
47 |
35 |
52 |
5 |
3 |
256 |
| 2022 |
1 |
13 |
55 |
22 |
15 |
32 |
39 |
19 |
31 |
11 |
0 |
0 |
238 |
| 2023 |
2 |
33 |
49 |
82 |
41 |
32 |
70 |
64 |
42 |
17 |
5 |
11 |
448 |
Sentinel-2 infrared images showed one or two prominent heat sources within the summit crater, accompanied by adjacent smaller sources, similar to recent years (see BGVN 46:01, 47:02, and 48:01). A unique image was obtained on 25 November 2023 by the OLI-2 (Operational Land Imager-2) on Landsat 9, showing the upper part of the volcano surrounded by clouds (figure 32).
Geologic Background. Mount Erebus, the world's southernmost historically active volcano, overlooks the McMurdo research station on Ross Island. It is the largest of three major volcanoes forming the crudely triangular Ross Island. The summit of the dominantly phonolitic volcano has been modified by one or two generations of caldera formation. A summit plateau at about 3,200 m elevation marks the rim of the youngest caldera, which formed during the late-Pleistocene and within which the modern cone was constructed. An elliptical 500 x 600 m wide, 110-m-deep crater truncates the summit and contains an active lava lake within a 250-m-wide, 100-m-deep inner crater; other lava lakes are sometimes present. The glacier-covered volcano was erupting when first sighted by Captain James Ross in 1841. Continuous lava-lake activity with minor explosions, punctuated by occasional larger Strombolian explosions that eject bombs onto the crater rim, has been documented since 1972, but has probably been occurring for much of the volcano's recent history.
Information Contacts: Hawai'i Institute of Geophysics and Planetology (HIGP) - MODVOLC Thermal Alerts System, School of Ocean and Earth Science and Technology (SOEST), Univ. of Hawai'i, 2525 Correa Road, Honolulu, HI 96822, USA (URL: http://modis.higp.hawaii.edu/); Copernicus Browser, Copernicus Data Space Ecosystem, European Space Agency (URL: https://dataspace.copernicus.eu/browser/); NASA Earth Observatory, EOS Project Science Office, NASA Goddard Space Flight Center, Goddard, Maryland, USA (URL: https://earthobservatory.nasa.gov/images/152134/erebus-breaks-through).
Rincon de la Vieja (Costa Rica) — January 2024 Cite this Report
Rincon de la Vieja
Costa Rica
10.83°N, 85.324°W; summit elev. 1916 m
All times are local (unless otherwise noted)
Frequent phreatic explosions during July-December 2023
Rincón de la Vieja is a volcanic complex in Costa Rica with a hot convecting acid lake that exhibits frequent weak phreatic explosions, gas-and-steam emissions, and occasional elevated sulfur dioxide levels (BGVN 45:10, 46:03, 46:11). The current eruption period began June 2021. This report covers activity during July-December 2023 and is based on weekly bulletins and occasional daily reports from the Observatorio Vulcanologico Sismologica de Costa Rica-Universidad Nacional (OVSICORI-UNA).
Numerous weak phreatic explosions continued during July-December 2023, along with gas-and-steam emissions and plumes that rose as high as 3 km above the crater rim. Many weekly OVSICORI-UNA bulletins included the previous week's number of explosions and emissions (table 9). For many explosions, the time of explosion was given (table 10). Frequent seismic activity (long-period earthquakes, volcano-tectonic earthquakes, and tremor) accompanied the phreatic activity.
Table 9. Number of reported weekly phreatic explosions and gas-and-steam emissions at Rincón de la Vieja, July-December 2023. Counts are reported for the week before the Weekly Bulletin date; not all reports included these data. Courtesy of OVSICORI-UNA.
| OVSICORI Weekly Bulletin |
Number of explosions |
Number of emissions |
| 28 Jul 2023 |
6 |
14 |
| 4 Aug 2023 |
10 |
12 |
| 1 Sep 2023 |
13 |
11 |
| 22 Sep 2023 |
12 |
13 |
| 29 Sep 2023 |
6 |
11 |
| 6 Oct 2023 |
12 |
5 |
| 13 Oct 2023 |
7 |
9 |
| 20 Oct 2023 |
1 |
15 |
| 27 Oct 2023 |
3 |
23 |
| 3 Nov 2023 |
3 |
10 |
| 17 Nov 2023 |
0 |
Some |
| 24 Nov 2023 |
0 |
14 |
| 8 Dec 2023 |
4 |
16 |
| 22 Dec 2023 |
8 |
18 |
Table 10. Summary of activity at Rincón de la Vieja during July-December 2023. Weak phreatic explosions and gas emissions are noted where the time of explosion was indicated in the weekly or daily bulletins. Height of plumes or emissions are distance above the crater rim. Courtesy of OVSICORI-UNA.
| Date |
Time |
Description of Activity |
| 1 Jul 2023 |
0156 |
Explosion. |
| 2 Jul 2023 |
0305 |
Explosion. |
| 4 Jul 2023 |
0229, 0635 |
Event at 0635 produced a gas-and-steam plume that rose 700 m and drifted W; seen by residents in Liberia (21 km SW). |
| 9 Jul 2023 |
1843 |
Explosion. |
| 21 Jul 2023 |
0705 |
Explosion. |
| 26 Jul 2023 |
1807 |
Explosion. |
| 28 Jul 2023 |
0802 |
Explosion generated a gas-and-steam plume that rose 500 m. |
| 30 Jul 2023 |
1250 |
Explosion. |
| 31 Jul 2023 |
2136 |
Explosion. |
| 11 Aug 2023 |
0828 |
Explosion. |
| 18 Aug 2023 |
1304 |
Explosion. |
| 21 Aug 2023 |
1224 |
Explosion generated gas-and-steam plumes rose 500-600 m. |
| 22 Aug 2023 |
0749 |
Explosion generated gas-and-steam plumes rose 500-600 m. |
| 24 Aug 2023 |
1900 |
Explosion. |
| 25 Aug 2023 |
0828 |
Event produced a steam-and-gas plume that rose 3 km and drifted NW. |
| 27-28 Aug 2023 |
0813 |
Four small events; the event at 0813 on 28 August lasted two minutes and generated a steam-and-gas plume that rose 2.5 km. |
| 1 Sep 2023 |
1526 |
Explosion generated plume that rose 2 km and ejected material onto the flanks. |
| 2-3 Sep 2023 |
- |
Small explosions detected in infrasound data. |
| 4 Sep 2023 |
1251 |
Gas-and-steam plume rose 1 km and drifted W. |
| 7 Nov 2023 |
1113 |
Explosion. |
| 8 Nov 2023 |
0722 |
Explosion. |
| 12 Nov 2023 |
0136 |
Small gas emissions. |
| 14 Nov 2023 |
0415 |
Small gas emissions. |
According to OVSICORI-UNA, during July-October the average weekly sulfur dioxide (SO2) flux ranged from 68 to 240 tonnes/day. However, in mid-November the flux increased to as high as 334 tonnes/day, the highest value measured in recent years. The high SO2 flux in mid-November was also detected by the TROPOMI instrument on the Sentinel-5P satellite (figure 43).
Geologic Background. Rincón de la Vieja, the largest volcano in NW Costa Rica, is a remote volcanic complex in the Guanacaste Range. The volcano consists of an elongated, arcuate NW-SE-trending ridge constructed within the 15-km-wide early Pleistocene Guachipelín caldera, whose rim is exposed on the south side. Sometimes known as the "Colossus of Guanacaste," it has an estimated volume of 130 km3 and contains at least nine major eruptive centers. Activity has migrated to the SE, where the youngest-looking craters are located. The twin cone of Santa María volcano, the highest peak of the complex, is located at the eastern end of a smaller, 5-km-wide caldera and has a 500-m-wide crater. A Plinian eruption producing the 0.25 km3 Río Blanca tephra about 3,500 years ago was the last major magmatic eruption. All subsequent eruptions, including numerous historical eruptions possibly dating back to the 16th century, have been from the prominent active crater containing a 500-m-wide acid lake located ENE of Von Seebach crater.
Information Contacts: Observatorio Vulcanológico Sismológica de Costa Rica-Universidad Nacional (OVSICORI-UNA), Apartado 86-3000, Heredia, Costa Rica (URL: http://www.ovsicori.una.ac.cr/); NASA Global Sulfur Dioxide Monitoring Page, Atmospheric Chemistry and Dynamics Laboratory, NASA Goddard Space Flight Center (NASA/GSFC), 8800 Greenbelt Road, Goddard MD 20771, USA (URL: https://so2.gsfc.nasa.gov/).
Bezymianny (Russia) — November 2023 Cite this Report
Bezymianny
Russia
55.972°N, 160.595°E; summit elev. 2882 m
All times are local (unless otherwise noted)
Explosion on 18 October 2023 sends ash plume 8 km high; lava flows and incandescent avalanches
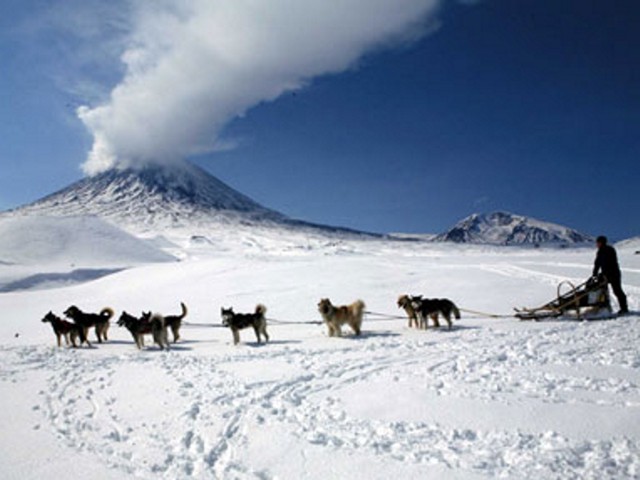
Bezymianny, located on Russia’s Kamchatka Peninsula, has had eruptions since 1955 characterized by dome growth, explosions, pyroclastic flows, ash plumes, and ashfall. Activity during November 2022-April 2023 included gas-and-steam emissions, lava dome collapses generating avalanches, and persistent thermal activity. Similar eruptive activity continued from May through October 2023, described here based on information from weekly and daily reports of the Kamchatka Volcano Eruptions Response Team (KVERT), notices from Tokyo VAAC (Volcanic Ash Advisory Center), and from satellite data.
Overall activity decreased after the strong period of activity in late March through April 2023, which included ash explosions during 29 March and 7-8 April 2023 that sent plumes as high as 10-12 km altitude, along with dome growth and lava flows (BGVN 48:05). This reduced activity can be seen in the MIROVA thermal detection system graph (figure 56), which was consistent with data from the MODVOLC thermal detection system and with Sentinel-2 satellite images that showed persistent hotspots in the summit crater when conditions allowed observations. A renewed period of strong activity began in mid-October 2023.
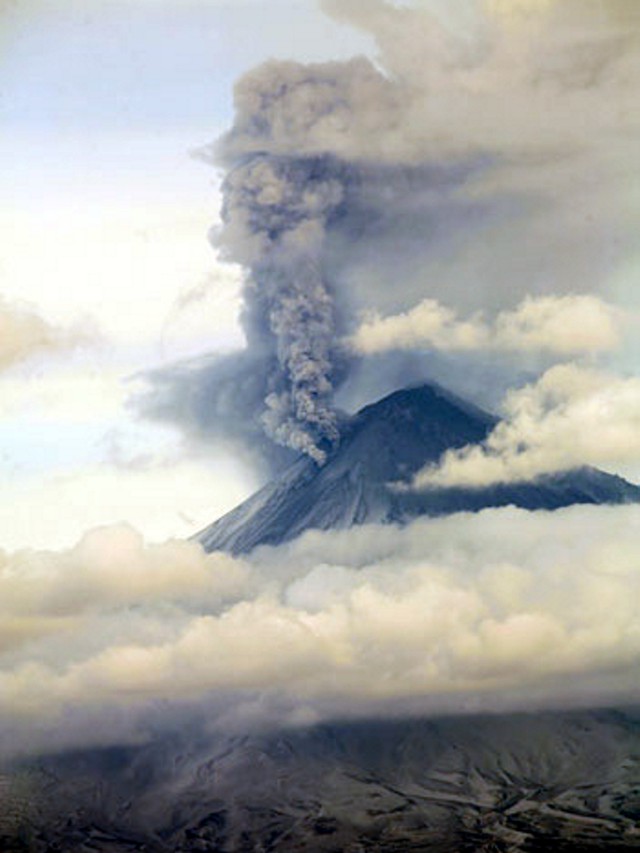
Activity increased significantly on 17 October 2023 when large collapses began during 0700-0830 on the E flanks of the lava dome and continued to after 0930 the next day (figure 57). Ash plumes rose to an altitude of 4.5-5 km, extending 220 km NNE by 18 October. A large explosion at 1630 on 18 October produced an ash plume that rose to an altitude of 11 km (8 km above the summit) and drifted NNE and then NW, extending 900 km NW within two days at an altitude of 8 km. Minor ashfall was noted in Kozyrevsk (45 km WNW). At 0820 on 20 October an ash plume was identified in satellite images drifting 100 km ENE at altitudes of 4-4.5 km.
Lava flows and hot avalanches from the dome down the SE flank continued over the next few days, including 23 October when clear conditions allowed good observations (figures 58 and 59). A large thermal anomaly was observed over the volcano through 24 October, and in the summit crater on 30 October (figure 60). Strong fumarolic activity continued, with numerous avalanches and occasional incandescence. By the last week of October, volcanic activity had decreased to a level consistent with that earlier in the reporting period.
Aviation warnings were frequently updated during 17-20 October. KVERT issued a Volcano Observatory Notice for Aviation (VONA) on 17 October at 1419 and 1727 (0219 and 0527 UTC) raising the Aviation Color Code (ACC) from Yellow to Orange (second highest level). The next day, KVERT issued a VONA at 1705 (0505 UTC) raising the ACC to Red (highest level) but lowered it back to Orange at 2117 (0917 UTC). After another decrease to Yellow and back to Orange, the ACC was reduced to Yellow on 20 October at 1204 (0004 UTC). In addition, the Tokyo VAAC issued a series of Volcanic Ash Advisories beginning on 16 October and continuing through 30 October.
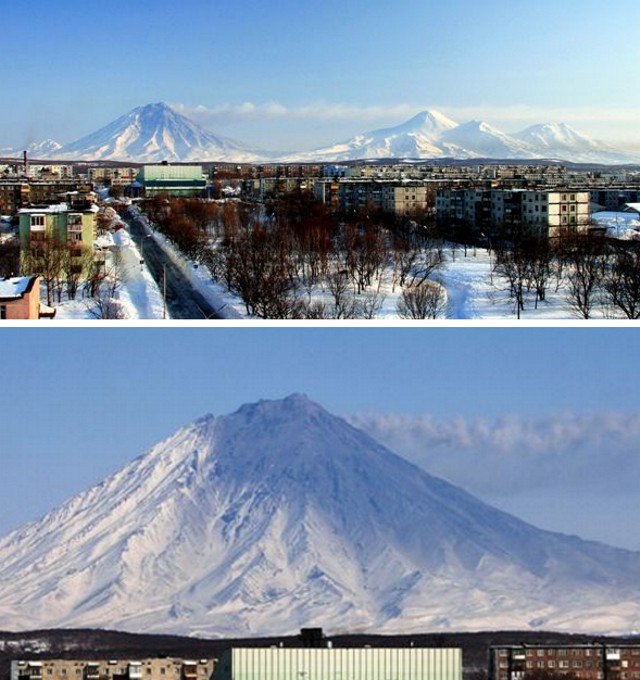
Geologic Background. The modern Bezymianny, much smaller than its massive neighbors Kamen and Kliuchevskoi on the Kamchatka Peninsula, was formed about 4,700 years ago over a late-Pleistocene lava-dome complex and an edifice built about 11,000-7,000 years ago. Three periods of intensified activity have occurred during the past 3,000 years. The latest period, which was preceded by a 1,000-year quiescence, began with the dramatic 1955-56 eruption. This eruption, similar to that of St. Helens in 1980, produced a large open crater that was formed by collapse of the summit and an associated lateral blast. Subsequent episodic but ongoing lava-dome growth, accompanied by intermittent explosive activity and pyroclastic flows, has largely filled the 1956 crater.
Information Contacts: Kamchatka Volcanic Eruptions Response Team (KVERT), Far Eastern Branch, Russian Academy of Sciences, 9 Piip Blvd., Petropavlovsk-Kamchatsky, 683006, Russia (URL: http://www.kscnet.ru/ivs/kvert/); Kamchatka Volcanological Station, Kamchatka Branch of Geophysical Survey, (KB GS RAS), Klyuchi, Kamchatka Krai, Russia (URL: http://volkstat.ru/); Tokyo Volcanic Ash Advisory Center (VAAC), 1-3-4 Otemachi, Chiyoda-ku, Tokyo 100-8122, Japan (URL: http://ds.data.jma.go.jp/svd/vaac/data/); Hawai'i Institute of Geophysics and Planetology (HIGP) - MODVOLC Thermal Alerts System, School of Ocean and Earth Science and Technology (SOEST), Univ. of Hawai'i, 2525 Correa Road, Honolulu, HI 96822, USA (URL: http://modis.higp.hawaii.edu/); MIROVA (Middle InfraRed Observation of Volcanic Activity), a collaborative project between the Universities of Turin and Florence (Italy) supported by the Centre for Volcanic Risk of the Italian Civil Protection Department (URL: http://www.mirovaweb.it/); Copernicus Browser, Copernicus Data Space Ecosystem, European Space Agency (URL: https://dataspace.copernicus.eu/browser/).chr
Kilauea (United States) — January 2023 Cite this Report
Kilauea
United States
19.421°N, 155.287°W; summit elev. 1222 m
All times are local (unless otherwise noted)
Low-level lava effusions in the lava lake at Halema’uma’u during July-December 2022
Kīlauea is the southeastern-most volcano in Hawaii and overlaps the E flank of the Mauna Loa volcano. Its East Rift Zone (ERZ) has been intermittently active for at least 2,000 years. An extended eruption period began in January 1983 and was characterized by open lava lakes and lava flows from the summit caldera and the East Rift Zone. During May 2018 magma migrated into the Lower East Rift Zone (LERZ) and opened 24 fissures along a 6-km-long NE-trending fracture zone that produced lava flows traveling in multiple directions. As lava emerged from the fissures, the lava lake at Halema'uma'u drained and explosions sent ash plumes to several kilometers altitude (BGVN 43:10).
The current eruption period started during September 2021 and has recently been characterized by lava effusions, spatter, and sulfur dioxide emissions in the active Halema’uma’u lava lake (BGVN 47:08). Lava effusions, some spatter, and sulfur dioxide emissions have continued during this reporting period of July through December 2022 using daily reports, volcanic activity notices, and abundant photo, map, and video data from the US Geological Survey's (USGS) Hawaiian Volcano Observatory (HVO).
Summary of activity during July-December 2022. Low-level effusions have continued at the western vent of the Halema’uma’u crater during July through early December 2022. Occasional weak ooze-outs (also called lava break outs) would occur along the margins of the crater floor. The overall level of the active lava lake throughout the reporting period gradually increased due to infilling, however it stagnated in mid-September (table 13). During September through November, activity began to decline, though lava effusions persisted at the western vent. By 9 December, the active part of the lava lake had completely crusted over, and incandescence was no longer visible.
Table 13. Summary of measurements taken during overflights at Kīlauea that show a gradual increase in the active lava lake level and the volume of lava effused since 29 September 2021. Lower activity was reported during September-October. Data collected during July-December 2022. Courtesy of HVO.
| Date: |
Level of the active lava lake (m): |
Cumulative volume of lava effused (million cubic meters): |
| 7 Jul 2022 |
130 |
95 |
| 19 Jul 2022 |
133 |
98 |
| 4 Aug 2022 |
136 |
102 |
| 16 Aug 2022 |
137 |
104 |
| 12 Sep 2022 |
143 |
111 |
| 5 Oct 2022 |
143 |
111 |
| 28 Oct 2022 |
143 |
111 |
Activity during July 2022. Lava effusions were reported from the western vent in the Halema’uma’u crater, along with occasional weak ooze-outs along the margins of the crater floor. The height of the lava lake was variable due to deflation-inflation tilt events; for example, the lake level dropped approximately 3-4 m during a summit deflation-inflation event reported on 1 July. Webcam images taken during the night of 6-12 July showed intermittent low-level spattering at the western vent that rose less than 10 m above the vent (figure 519). Measurements made during an overflight on 7 July indicated that the crater floor was infilled about 130 m and that 95 million cubic meters of lava had been effused since 29 September 2021. A single, relatively small lava ooze-out was active to the S of the lava lake. Around midnight on 8 July there were two brief periods of lava overflow onto the lake margins. On 9 July lava ooze-outs were reported near the SE and NE edges of the crater floor and during 10-11 July they occurred near the E, NE, and NW edges. On 16 July crater incandescence was reported, though the ooze-outs and spattering were not visible. On 18 July overnight webcam images showed incandescence in the western vent complex and two ooze-outs were reported around 0000 and 0200 on 19 July. By 0900 there were active ooze-outs along the SW edge of the crater floor. Measurements made from an overflight on 19 July indicated that the crater floor was infilled about 133 m and 98 million cubic meters of lava had erupted since 29 September 2021 (figure 520). On 20 July around 1600 active ooze-outs were visible along the N edge of the crater, which continued through the next day. Extensive ooze-outs occurred along the W margin during 24 July until 1900; on 26 July minor ooze-outs were noted along the N margin. Minor spattering was visible on 29 July along the E margin of the lake. The sulfur dioxide emission rates ranged 650-2,800 tons per day (t/d), the higher of which was measured on 8 July (figure 519).
Activity during August 2022. The eruption continued in the Halema’uma’u crater at the western vent. According to HVO the lava in the active lake remained at the level of the bounding levees. Occasional minor ooze-outs were observed along the margins of the crater floor. Strong nighttime crater incandescence was visible after midnight on 6 August over the western vent cone. During 6-7 August scattered small lava lobes were active along the crater floor and incandescence persisted above the western vent through 9 August. During 7-9 August HVO reported a single lava effusion source was active along the NW margin of the crater floor. Measurements from an overflight on 4 August indicated that the crater floor was infilled about 136 m total and that 102 million cubic meters of lava had been erupted since the start of the eruption. Lava breakouts were reported along the N, NE, E, S, and W margins of the crater during 10-16 August. Another overflight survey conducted on 16 August indicated that the crater floor infilled about 137 m and 104 million cubic meters of lava had been erupted since September 2021. Measured sulfur dioxide emissions rates ranged 1,150-2,450 t/d, the higher of which occurred on 8 August.
Activity during September 2022. During September, lava effusion continued from the western vent into the active lava lake and onto the crater floor. Intermittent minor ooze-outs were reported through the month. A small ooze-out was visible on the W crater floor margin at 0220 on 2 September, which showed decreasing surface activity throughout the day, but remained active through 3 September. On 3 September around 1900 a lava outbreak occurred along the NW margin of the crater floor but had stopped by the evening of 4 September. Field crews monitoring the summit lava lake on 9 September observed spattering on the NE margin of the lake that rose no higher than 10 m, before falling back onto the lava lake crust (figure 521). Overflight measurements on 12 September indicated that the crater floor was infilled a total of 143 m and 111 million cubic meters of lava had been erupted since September 2021. Extensive breakouts in the W and N part of the crater floor were reported at 1600 on 20 September and continued into 26 September. The active part of the lava lake dropped by 10 m while other parts of the crater floor dropped by several meters. Summit tiltmeters recorded a summit seismic swarm of more than 80 earthquakes during 1500-1800 on 21 September, which occurred about 1.5 km below Halema’uma’u; a majority of these were less than Mw 2. By 22 September the active part of the lava lake was infilled about 2 m. On 23 September the western vent areas exhibited several small spatter cones with incandescent openings, along with weak, sporadic spattering (figure 522). The sulfur dioxide emission rate ranged from 930 t/d to 2,000 t/d, the higher of which was measured on 6 September.
Activity during October 2022. Activity during October declined slightly compared to previous months, though lava effusions persisted from the western vent into the active lava lake and onto the crater floor during October (figure 523). Slight variations in the lava lake were noted throughout the month. HVO reported that around 0600 on 3 October the level of the lava lake has lowered slightly. Overflight measurements taken on 5 October indicated that the crater floor was infilled a total of about 143 m and that 111 million cubic meters of lava had been effused since September 2021. During 6-7 October the lake gradually rose 0.5 m. Sulfur dioxide measurements made on 22 October had an emission rate of 700 t/d. Another overflight taken on 28 October showed that there was little to no change in the elevation of the crater floor: the crater floor was infilled a total of 143 m and 111 million cubic meters of lava had erupted since the start of the eruption.
Activity during November 2022. Activity remained low during November, though HVO reported that lava from the western vent continued to effuse into the active lava lake and onto the crater floor throughout the month. The rate of sulfur dioxide emissions during November ranged from 300-600 t/d, the higher amount of which occurred on 9 November.
Activity during December 2022. Similar low activity was reported during December, with lava effusing from the western vent into the active lava lake and onto the crater floor. During 4-5 December the active part of the lava lake was slightly variable in elevation and fluctuated within 1 m. On 9 December HVO reported that lava was no longer erupting from the western vent in the Halema’uma’u crater and that sulfur dioxide emissions had returned to near pre-eruption background levels; during 10-11 December, the lava lake had completely crusted over, and no incandescence was visible (figure 524). Time lapse camera images covering the 4-10 December showed that the crater floor showed weak deflation and no inflation. Some passive events of crustal overturning were reported during 14-15 December, which brought fresh incandescent lava to the lake surface. The sulfur dioxide emission rate was approximately 200 t/d on 14 December. A smaller overturn event on 17 December and another that occurred around 0000 and into the morning of 20 December were also detected. A small seismic swarm was later detected on 30 December.
Geologic Background. Kilauea overlaps the E flank of the massive Mauna Loa shield volcano in the island of Hawaii. Eruptions are prominent in Polynesian legends; written documentation since 1820 records frequent summit and flank lava flow eruptions interspersed with periods of long-term lava lake activity at Halemaumau crater in the summit caldera until 1924. The 3 x 5 km caldera was formed in several stages about 1,500 years ago and during the 18th century; eruptions have also originated from the lengthy East and Southwest rift zones, which extend to the ocean in both directions. About 90% of the surface of the basaltic shield volcano is formed of lava flows less than about 1,100 years old; 70% of the surface is younger than 600 years. The long-term eruption from the East rift zone between 1983 and 2018 produced lava flows covering more than 100 km2, destroyed hundreds of houses, and added new coastline.
Information Contacts: Hawaiian Volcano Observatory (HVO), U.S. Geological Survey, PO Box 51, Hawai'i National Park, HI 96718, USA (URL: http://hvo.wr.usgs.gov/).
Nyamulagira (DR Congo) — November 2023 Cite this Report
Nyamulagira
DR Congo
1.408°S, 29.2°E; summit elev. 3058 m
All times are local (unless otherwise noted)
Lava flows and thermal activity during May-October 2023
Nyamulagira (also known as Nyamuragira) is a shield volcano in the Democratic Republic of Congo with the summit truncated by a small 2 x 2.3 km caldera with walls up to about 100 m high. Documented eruptions have occurred within the summit caldera, as well as from numerous flank fissures and cinder cones. The current eruption period began in April 2018 and has more recently been characterized by summit crater lava flows and thermal activity (BGVN 48:05). This report describes lava flows and variable thermal activity during May through October 2023, based on information from the Observatoire Volcanologique de Goma (OVG) and various satellite data.
Lava lake activity continued during May. The MIROVA (Middle InfraRed Observation of Volcanic Activity) system recorded moderate-to-strong thermal activity throughout the reporting period; activity was more intense during May and October and relatively weaker from June through September (figure 95). The MODVOLC thermal algorithm, detected a total of 209 thermal alerts. There were 143 hotspots detected during May, eight during June, nine during September, and 49 during October. This activity was also reflected in infrared satellite images, where a lava flow was visible in the NW part of the crater on 7 May and strong activity was seen in the center of the crater on 4 October (figure 96). Another infrared satellite image taken on 12 May showed still active lava flows along the NW margin of the crater. According to OVG lava effusions were active during 7-29 May and moved to the N and NW parts of the crater beginning on 9 May. Strong summit crater incandescence was visible from Goma (27 km S) during the nights of 17, 19, and 20 May (figure 97). On 17 May there was an increase in eruptive activity, which peaked at 0100 on 20 May. Notable sulfur dioxide plumes drifted NW and W during 19-20 May (figure 98). Drone footage acquired in partnership with the USGS (United States Geological Survey) on 20 May captured images of narrow lava flows that traveled about 100 m down the W flank (figure 99). Data from the Rumangabo seismic station indicated a decreasing trend in activity during 17-21 May. Although weather clouds prevented clear views of the summit, a strong thermal signature on the NW flank was visible in an infrared satellite image on 22 May, based on an infrared satellite image. On 28 May the lava flows on the upper W flank began to cool and solidify. By 29 May seismicity returned to levels similar to those recorded before the 17 May increase. Lava effusion continued but was confined to the summit crater; periodic crater incandescence was observed.
Low-level activity was noted during June through October. On 1 June OVG reported that seismicity remained at lower levels and that crater incandescence had been absent for three days, though infrared satellite imagery showed continued lava effusion in the summit crater. The lava flows on the flanks covered an estimated 0.6 km2. Satellite imagery continued to show thermal activity confined to the lava lake through October (figure 96), although no lava flows or significant sulfur dioxide emissions were reported.
Geologic Background. Africa's most active volcano, Nyamulagira (also known as Nyamuragira), is a massive high-potassium basaltic shield about 25 km N of Lake Kivu and 13 km NNW of the steep-sided Nyiragongo volcano. The summit is truncated by a small 2 x 2.3 km caldera that has walls up to about 100 m high. Documented eruptions have occurred within the summit caldera, as well as from the numerous flank fissures and cinder cones. A lava lake in the summit crater, active since at least 1921, drained in 1938, at the time of a major flank eruption. Recent lava flows extend down the flanks more than 30 km from the summit as far as Lake Kivu; extensive lava flows from this volcano have covered 1,500 km2 of the western branch of the East African Rift.
Information Contacts: Observatoire Volcanologique de Goma (OVG), Departement de Geophysique, Centre de Recherche en Sciences Naturelles, Lwiro, D.S. Bukavu, DR Congo; Hawai'i Institute of Geophysics and Planetology (HIGP) - MODVOLC Thermal Alerts System, School of Ocean and Earth Science and Technology (SOEST), Univ. of Hawai'i, 2525 Correa Road, Honolulu, HI 96822, USA (URL: http://modis.higp.hawaii.edu/); MIROVA (Middle InfraRed Observation of Volcanic Activity), a collaborative project between the Universities of Turin and Florence (Italy) supported by the Centre for Volcanic Risk of the Italian Civil Protection Department (URL: http://www.mirovaweb.it/); NASA Global Sulfur Dioxide Monitoring Page, Atmospheric Chemistry and Dynamics Laboratory, NASA Goddard Space Flight Center (NASA/GSFC), 8800 Greenbelt Road, Goddard, Maryland, USA (URL: https://so2.gsfc.nasa.gov/); Copernicus Browser, Copernicus Data Space Ecosystem, European Space Agency (URL: https://dataspace.copernicus.eu/browser/); Charles Balagizi, Goma Volcano Observatory, Departement de Geophysique, Centre de Recherche en Sciences Naturelles, Lwiro, D.S. Bukavu, DR Congo.
Bagana (Papua New Guinea) — October 2023 Cite this Report
Bagana
Papua New Guinea
6.137°S, 155.196°E; summit elev. 1855 m
All times are local (unless otherwise noted)
Explosions, ash plumes, ashfall, and lava flows during April-September 2023
The remote volcano of Bagana is located in central Bougainville Island, Papua New Guinea. Recorded eruptions date back to 1842 and activity has consisted of effusive activity that has built a small lava dome in the summit crater and occasional explosions that produced pyroclastic flows. The most recent eruption has been ongoing since February 2000 and has produced occasional explosions, ash plumes, and lava flows. More recently, activity has been characterized by ongoing effusive activity and ash emissions (BGVN 48:04). This report updates activity from April through September 2023 that has consisted of explosions, ash plumes, ashfall, and lava flows, using information from the Darwin Volcanic Ash Advisory Center (VAAC) and satellite data.
An explosive eruption was reported on 7 July that generated a large gas-and-ash plume to high altitudes and caused significant ashfall in local communities; the eruption plume had reached upper tropospheric (16-18 km altitude) altitudes by 2200, according to satellite images. Sulfur dioxide plumes were detected in satellite images on 8 July and indicated that the plume was likely a mixture of gas, ice, and ash. A report issued by the Autonomous Bougainville Government (ABG) (Torokina District, Education Section) on 10 July noted that significant ash began falling during 2000-2100 on 7 July and covered most areas in the Vuakovi, Gotana (9 km SW), Koromaketo, Laruma (25 km W) and Atsilima (27 km NW) villages. Pyroclastic flows also occurred, according to ground-based reports; small deposits confined to one drainage were inspected by RVO during an overflight on 17 July and were confirmed to be from the 7 July event. Ashfall continued until 10 July and covered vegetation, which destroyed bushes and gardens and contaminated rivers and streams.
RVO reported another eruption on 14 July. The Darwin VAAC stated that an explosive event started around 0830 on 15 July and produced an ash plume that rose to 16.5 km altitude by 1000 and drifted N, according to satellite images. The plume continued to drift N and remained visible through 1900, and by 2150 it had dissipated.
Ashfall likely from both the 7 and 15 July events impacted about 8,111 people in Torokina (20 km SW), including Tsito/Vuakovi, Gotana, Koromaketo, Kenaia, Longkogari, Kenbaki, Piva (13 km SW), and Atsinima, and in the Tsitovi district, according to ABG. Significant ashfall was also reported in Ruruvu (22 km N) in the Wakunai District of Central Bougainville, though the thickness of these deposits could not be confirmed. An evacuation was called for the villages in Wakunai, where heavy ashfall had contaminated water sources; the communities of Ruruvu, Togarau, Kakarapaia, Karauturi, Atao, and Kuritaturi were asked to evacuate to a disaster center at the Wakunai District Station, and communities in Torokina were asked to evacuate to the Piva District station. According to a news article, more than 7,000 people needed temporary accommodations, with about 1,000 people in evacuation shelters. Ashfall had deposited over a broad area, contaminating water supplies, affecting crops, and collapsing some roofs and houses in rural areas. Schools were temporarily shut down. Intermittent ash emissions continued through the end of July and drifted NNW, NW, and SW. Fine ashfall was reported on the coast of Torokina, and ash plumes also drifted toward Laruma and Atsilima.
A small explosive eruption occurred at 2130 on 28 July that ejected material from the crater vents, according to reports from Torokina, in addition to a lava flow that contained two lobes. A second explosion was detected at 2157. Incandescence from the lava flow was visible from Piva as it descended the W flank around 2000 on 29 July (figure 47). The Darwin VAAC reported that a strong thermal anomaly was visible in satellite images during 30-31 July and that ash emissions rose to 2.4 km altitude and drifted WSW on 30 July. A ground report from RVO described localized emissions at 0900 on 31 July.
The Darwin VAAC reported that ash plumes were identified in satellite imagery at 0800 and 1220 on 12 August and rose to 2.1 km and 3 km altitude and drifted NW and W, respectively. A news report stated that aid was sent to more than 6,300 people that were adversely affected by the eruption. Photos taken during 17-19 August showed ash emissions rising no higher than 1 km above the summit and drifting SE. A small explosion generated an ash plume during the morning of 19 August. Deposits from small pyroclastic flows were also captured in the photos. Satellite images captured lava flows and pyroclastic flow deposits. Two temporary seismic stations were installed near Bagana on 17 August at distances of 7 km WSW (Vakovi station) and 11 km SW (Kepox station). The Kepox station immediately started to record continuous, low-frequency background seismicity.
Satellite data. Little to no thermal activity was detected during April through mid-July 2023; only one anomaly was recorded during early April and one during early June, according to MIROVA (Middle InfraRed Observation of Volcanic Activity) data (figure 48). Thermal activity increased in both power and frequency during mid-July through September, although there were still some short gaps in detected activity. MODVOLC also detected increased thermal activity during August; thermal hotspots were detected a total of five times on 19, 20, and 27 August. Weak thermal anomalies were also captured in infrared satellite images on clear weather days throughout the reporting period on 7, 12, and 17 April, 27 May, 1, 6, 16, and 31 July, and 19 September (figure 48); a strong thermal anomaly was visible on 31 July. Distinct sulfur dioxide plumes that drifted generally NW were intermittently captured by the TROPOMI instrument on the Sentinel-5P satellite and sometimes exceeded two Dobson Units (DUs) (figure 49).
Geologic Background. Bagana volcano, in a remote portion of central Bougainville Island, is frequently active. This massive symmetrical cone was largely constructed by an accumulation of viscous andesitic lava flows. The entire edifice could have been constructed in about 300 years at its present rate of lava production. Eruptive activity is characterized by non-explosive effusion of viscous lava that maintains a small lava dome in the summit crater, although occasional explosive activity produces pyroclastic flows. Lava flows with tongue-shaped lobes up to 50 m thick and prominent levees descend the flanks on all sides.
Information Contacts: Rabaul Volcano Observatory (RVO), Geohazards Management Division, Department of Mineral Policy and Geohazards Management (DMPGM), PO Box 3386, Kokopo, East New Britain Province, Papua New Guinea; Darwin Volcanic Ash Advisory Centre (VAAC), Bureau of Meteorology, Northern Territory Regional Office, PO Box 40050, Casuarina, NT 0811, Australia (URL: http://www.bom.gov.au/info/vaac/); MIROVA (Middle InfraRed Observation of Volcanic Activity), a collaborative project between the Universities of Turin and Florence (Italy) supported by the Centre for Volcanic Risk of the Italian Civil Protection Department (URL: http://www.mirovaweb.it/); Hawai'i Institute of Geophysics and Planetology (HIGP) - MODVOLC Thermal Alerts System, School of Ocean and Earth Science and Technology (SOEST), Univ. of Hawai'i, 2525 Correa Road, Honolulu, HI 96822, USA (URL: http://modis.higp.hawaii.edu/); NASA Global Sulfur Dioxide Monitoring Page, Atmospheric Chemistry and Dynamics Laboratory, NASA Goddard Space Flight Center (NASA/GSFC), 8800 Greenbelt Road, Goddard, Maryland, USA (URL: https://so2.gsfc.nasa.gov/); Copernicus Browser, Copernicus Data Space Ecosystem, European Space Agency (URL: https://dataspace.copernicus.eu/browser/); Autonomous Bougainville Government, P.O Box 322, Buka, AROB, PNG (URL: https://abg.gov.pg/); Andrew Tupper (Twitter: @andrewcraigtupp); Simon Carn, Geological and Mining Engineering and Sciences, Michigan Technological University, 1400 Townsend Drive, Houghton, MI 49931, USA (URL: http://www.volcarno.com/, Twitter: @simoncarn); Radio NZ (URL: https://www.rnz.co.nz/news/pacific/494464/more-than-7-000-people-in-bougainville-need-temporary-accommodation-after-eruption); USAID, 1300 Pennsylvania Ave, NW, Washington DC 20004, USA (URL: https://www.usaid.gov/pacific-islands/press-releases/aug-08-2023-united-states-provides-immediate-emergency-assistance-support-communities-affected-mount-bagana-volcanic-eruptions).
Mayon (Philippines) — October 2023 Cite this Report
Mayon
Philippines
13.257°N, 123.685°E; summit elev. 2462 m
All times are local (unless otherwise noted)
Lava flows, pyroclastic flows, ash emissions, and seismicity during April-September 2023
Mayon is located in the Philippines and has steep upper slopes capped by a small summit crater. Historical eruptions date back to 1616 CE that have been characterized by Strombolian eruptions, lava flows, pyroclastic flows, and mudflows. Eruptions mostly originated from a central conduit. Pyroclastic flows and mudflows have commonly descended many of the approximately 40 drainages that surround the volcano. The most recent eruption occurred during June through October 2022 and consisted of lava dome growth and gas-and-steam emissions (BGVN 47:12). A new eruption was reported during late April 2023 and has included lava flows, pyroclastic density currents, ash emissions, and seismicity. This report covers activity during April through September 2023 based on daily bulletins from the Philippine Institute of Volcanology and Seismology (PHIVOLCS).
During April through September 2023, PHIVOLCS reported near-daily rockfall events, frequent volcanic earthquakes, and sulfur dioxide measurements. Gas-and-steam emissions rose 100-900 m above the crater and drifted in different directions. Nighttime crater incandescence was often visible during clear weather and was accompanied by incandescent avalanches of material. Activity notably increased during June when lava flows were reported on the S, SE, and E flanks (figure 52). The MIROVA graph (Middle InfraRed Observation of Volcanic Activity) showed strong thermal activity coincident with these lava flows, which remained active through September (figure 53). According to the MODVOLC thermal algorithm, a total of 110 thermal alerts were detected during the reporting period: 17 during June, 40 during July, 27 during August, and 26 during September. During early June, pyroclastic density currents (PDCs) started to occur more frequently.
Low activity was reported during much of April and May; gas-and-steam emissions rose 100-900 m above the crater and generally drifted in different directions. A total of 52 rockfall events and 18 volcanic earthquakes were detected during April and 147 rockfall events and 13 volcanic events during May. Sulfur dioxide flux measurements ranged between 400-576 tons per day (t/d) during April, the latter of which was measured on 29 April and between 162-343 t/d during May, the latter of which was measured on 13 May.
Activity during June increased, characterized by lava flows, pyroclastic density currents (PDCs), crater incandescence and incandescent rockfall events, gas-and-steam emissions, and continued seismicity. Weather clouds often prevented clear views of the summit, but during clear days, moderate gas-and-steam emissions rose 100-2,500 m above the crater and drifted in multiple directions. A total of 6,237 rockfall events and 288 volcanic earthquakes were detected. The rockfall events often deposited material on the S and SE flanks within 700-1,500 m of the summit crater and ash from the events drifted SW, S, SE, NE, and E. Sulfur dioxide emissions ranged between 149-1,205 t/d, the latter of which was measured on 10 June. Short-term observations from EDM and electronic tiltmeter monitoring indicated that the upper slopes were inflating since February 2023. Longer-term ground deformation parameters based on EDM, precise leveling, continuous GPS, and electronic tilt monitoring indicated that the volcano remained inflated, especially on the NW and SE flanks. At 1000 on 5 June the Volcano Alert Level (VAL) was raised to 2 (on a 0-5 scale). PHIVOLCS noted that although low-level volcanic earthquakes, ground deformation, and volcanic gas emissions indicated unrest, the steep increase in rockfall frequency may indicate increased dome activity.
A total of 151 dome-collapse PDCs occurred during 8-9 and 11-30 June, traveled 500-2,000 m, and deposited material on the S flank within 2 km of the summit crater. During 8-9 June the VAL was raised to 3. At approximately 1947 on 11 June lava flow activity was reported; two lobes traveled within 500 m from the crater and deposited material on the S (Mi-isi), SE (Bonga), and E (Basud) flanks. Weak seismicity accompanied the lava flow and slight inflation on the upper flanks. This lava flow remained active through 30 June, moving down the S and SE flank as far as 2.5 km and 1.8 km, respectively and depositing material up to 3.3 km from the crater. During 15-16 June traces of ashfall from the PDCs were reported in Sitio Buga, Nabonton, City of Ligao and Purok, and San Francisco, Municipality of Guinobatan. During 28-29 June there were two PDCs generated by the collapse of the lava flow front, which generated a light-brown ash plume 1 km high. Satellite monitors detected significant concentrations of sulfur dioxide beginning on 29 June. On 30 June PDCs primarily affected the Basud Gully on the E flank, the largest of which occurred at 1301 and lasted eight minutes, based on the seismic record. Four PDCs generated between 1800 and 2000 that lasted approximately four minutes each traveled 3-4 km on the E flank and generated an ash plume that rose 1 km above the crater and drifted N and NW. Ashfall was recorded in Tabaco City.
Similar strong activity continued during July; slow lava effusion remained active on the S and SE flanks and traveled as far as 2.8 km and 2.8 km, respectively and material was deposited as far as 4 km from the crater. There was a total of 6,983 rockfall events and 189 PDCs that affected the S, SE, and E flanks. The volcano network detected a total of 2,124 volcanic earthquakes. Continuous gas-and-steam emissions rose 200-2,000 m above the crater and drifted in multiple directions. Sulfur dioxide emissions averaged 792-4,113 t/d, the latter of which was measured on 28 July. During 2-4 July three PDCs were generated from the collapse of the lava flow and resulting light brown plumes rose 200-300 m above the crater. Continuous tremor pulses were reported beginning at 1547 on 3 July through 7 July at 1200, at 2300 on 8 July and going through 0300 on 10 July, and at 2300 on 16 July, as recorded by the seismic network. During 6-9 July there were 10 lava flow-collapse-related PDCs that generated light brown plumes 300-500 m above the crater. During 10-11 July light ashfall was reported in some areas of Mabinit, Legazpi City, Budiao and Salvacion, Daraga, and Camalig, Albay. By 18 July the lava flow advanced 600 m on the E flank as well.
During 1733 on 18 July and 0434 on 19 July PHIVOLCS reported 30 “ashing” events, which are degassing events accompanied by audible thunder-like sounds and entrained ash at the crater, which produced short, dark plumes that drifted SW. These events each lasted 20-40 seconds, and plume heights ranged from 150-300 m above the crater, as recorded by seismic, infrasound, visual, and thermal monitors. Three more ashing events occurred during 19-20 July. Short-term observations from electronic tilt and GPS monitoring indicate deflation on the E lower flanks in early July and inflation on the NW middle flanks during the third week of July. Longer-term ground deformation parameters from EDM, precise leveling, continuous GPS, and electronic tilt monitoring indicated that the volcano was still generally inflated relative to baseline levels. A short-lived lava pulse lasted 28 seconds at 1956 on 21 July, which was accompanied by seismic and infrasound signals. By 22 July, the only lava flow that remained active was on the SE flank, and continued to extend 3.4 km, while those on the S and E flanks weakened markedly. One ashing event was detected during 30-31 July, whereas there were 57 detected during 31 July-1 August; according to PHIVOLCS beginning at approximately 1800 on 31 July eruptive activity was dominated by phases of intermittent ashing, as well as increased in the apparent rates of lava effusion from the summit crater. The ashing phases consisted of discrete events recorded as low-frequency volcanic earthquakes (LFVQ) typically 30 seconds in duration, based on seismic and infrasound signals. Gray ash plume rose 100 m above the crater and generally drifted NE. Shortly after these ashing events began, new lava began to effuse rapidly from the crater, feeding the established flowed on the SE, E, and E flanks and generating frequent rockfall events.
Intensified unrest persisted during August. There was a total of 4,141 rockfall events, 2,881 volcanic earthquakes, which included volcanic tremor events, 32 ashing events, and 101 PDCs detected throughout the month. On clear weather days, gas-and-steam emissions rose 300-1,500 m above the crater and drifted in different directions (figure 54). Sulfur dioxide emissions averaged 735-4,756 t/d, the higher value of which was measured on 16 August. During 1-2 August the rate of lava effusion decreased, but continued to feed the flows on the SE, S, and E flanks, maintaining their advances to 3.4 km, 2.8 km, and 1.1 km from the crater, respectively (figure 55). Rockfall and PDCs generated by collapses at the lava flow margins and from the summit dome deposited material within 4 km of the crater. During 3-4 August there were 10 tremor events detected that lasted 1-4 minutes. Short-lived lava pulse lasted 35 seconds and was accompanied by seismic and infrasound signals at 0442 on 6 August. Seven collapses were recorded at the front of the lava flow during 12-14 August.
During September, similar activity of slow lava effusion, PDCs, gas-and-steam emissions, and seismicity continued. There was a total of 4,452 rockfall events, 329 volcanic earthquakes, which included volcanic tremor events, two ashing events, and 85 PDCs recorded throughout the month. On clear weather days, gas-and-steam emissions rose 100-1,500 m above the crater and drifted in multiple directions. Sulfur dioxide emissions averaged 609-2,252 t/d, the higher average of which was measured on 6 September. Slow lava effusion continued advancing on the SE, S, and E flanks, maintaining lengths of 3.4 km, 2.8 km, and 1.1 km, respectively. Rockfall and PDC events generated by collapses along the lava flow margins and at the summit dome deposited material within 4 km of the crater.
Geologic Background. Symmetrical Mayon, which rises above the Albay Gulf NW of Legazpi City, is the most active volcano of the Philippines. The steep upper slopes are capped by a small summit crater. Recorded eruptions since 1616 CE range from Strombolian to basaltic Plinian, with cyclical activity beginning with basaltic eruptions, followed by longer periods of andesitic lava flows. Eruptions occur predominately from the central conduit and have also produced lava flows that travel far down the flanks. Pyroclastic density currents and mudflows have commonly swept down many of the approximately 40 ravines that radiate from the summit and have often damaged populated lowland areas. A violent eruption in 1814 killed more than 1,200 people and devastated several towns.
Information Contacts: Philippine Institute of Volcanology and Seismology (PHIVOLCS), Department of Science and Technology, University of the Philippines Campus, Diliman, Quezon City, Philippines (URL: http://www.phivolcs.dost.gov.ph/); MIROVA (Middle InfraRed Observation of Volcanic Activity), a collaborative project between the Universities of Turin and Florence (Italy) supported by the Centre for Volcanic Risk of the Italian Civil Protection Department (URL: http://www.mirovaweb.it/); Hawai'i Institute of Geophysics and Planetology (HIGP) - MODVOLC Thermal Alerts System, School of Ocean and Earth Science and Technology (SOEST), Univ. of Hawai'i, 2525 Correa Road, Honolulu, HI 96822, USA (URL: http://modis.higp.hawaii.edu/); Copernicus Browser, Copernicus Data Space Ecosystem, European Space Agency (URL: https://dataspace.copernicus.eu/browser/); William Rogers, Legazpi City, Albay Province, Philippines.
Nishinoshima (Japan) — October 2023 Cite this Report
Nishinoshima
Japan
27.247°N, 140.874°E; summit elev. 100 m
All times are local (unless otherwise noted)
Eruption plumes and gas-and-steam plumes during May-August 2023
Nishinoshima, located about 1,000 km S of Tokyo, is a small island in the Ogasawara Arc in Japan. The island is the summit of a massive submarine volcano that has prominent submarine peaks to the S, W, and NE. Eruptions date back to 1973 and the current eruption period began in October 2022. Recent activity has consisted of small ash plumes and fumarolic activity (BGVN 48:07). This report covers activity during May through August 2023, using information from monthly reports of the Japan Meteorological Agency (JMA) monthly reports and satellite data.
Activity during May through June was relatively low. The Japan Coast Guard (JCG) did overflights on 14 and 22 June and reported white gas-and-steam emissions rising 600 m and 1,200 m from the central crater of the pyroclastic cone, respectively (figure 125). In addition, multiple white gas-and-steam emissions rose from the inner rim of the W side of the crater and from the SE flank of the pyroclastic cone. Discolored brown-to-green water was observed around almost the entire perimeter of the island; on 22 June light green discolored water was observed off the S coast of the island.
Observations from the Himawari meteorological satellite confirmed an eruption on 9 and 10 July. An eruption plume rose 1.6 km above the crater and drifted N around 1300 on 9 July. Satellite images acquired at 1420 and 2020 on 9 July and at 0220 on 10 July showed continuing emissions that rose 1.3-1.6 km above the crater and drifted NE and N. The Tokyo VAAC reported that an ash plume seen by a pilot and identified in a satellite image at 0630 on 21 July rose to 3 km altitude and drifted S.
Aerial observations conducted by JCG on 8 August showed a white-and-gray plume rising from the central crater of the pyroclastic cone, and multiple white gas-and-steam emissions were rising from the inner edge of the western crater and along the NW-SE flanks of the island (figure 126). Brown-to-green discolored water was also noted around the perimeter of the island.
Intermittent low-to-moderate power thermal anomalies were recorded in the MIROVA graph (Middle InfraRed Observation of Volcanic Activity), showing an increase in both frequency and power beginning in July (figure 127). This increase in activity coincides with eruptive activity on 9 and 10 July, characterized by eruption plumes. According to the MODVOLC thermal alert algorithm, one thermal hotspot was recorded on 20 July. Weak thermal anomalies were also detected in infrared satellite imagery, accompanied by strong gas-and-steam plumes (figure 128).
Geologic Background. The small island of Nishinoshima was enlarged when several new islands coalesced during an eruption in 1973-74. Multiple eruptions that began in 2013 completely covered the previous exposed surface and continued to enlarge the island. The island is the summit of a massive submarine volcano that has prominent peaks to the S, W, and NE. The summit of the southern cone rises to within 214 m of the ocean surface 9 km SSE.
Information Contacts: Japan Meteorological Agency (JMA), 1-3-4 Otemachi, Chiyoda-ku, Tokyo 100-8122, Japan (URL: http://www.jma.go.jp/jma/indexe.html); Tokyo Volcanic Ash Advisory Center (VAAC), 1-3-4 Otemachi, Chiyoda-ku, Tokyo 100-8122, Japan (URL: http://ds.data.jma.go.jp/svd/vaac/data/); MIROVA (Middle InfraRed Observation of Volcanic Activity), a collaborative project between the Universities of Turin and Florence (Italy) supported by the Centre for Volcanic Risk of the Italian Civil Protection Department (URL: http://www.mirovaweb.it/); Copernicus Browser, Copernicus Data Space Ecosystem, European Space Agency (URL: https://dataspace.copernicus.eu/browser/).
Krakatau (Indonesia) — October 2023 Cite this Report
Krakatau
Indonesia
6.1009°S, 105.4233°E; summit elev. 285 m
All times are local (unless otherwise noted)
White gas-and-steam plumes and occasional ash plumes during May-August 2023
Krakatau is located in the Sunda Strait between Java and Sumatra, Indonesia. Caldera collapse during the catastrophic 1883 eruption destroyed Danan and Perbuwatan cones and left only a remnant of Rakata. The post-collapse cone of Anak Krakatau (Child of Krakatau) was constructed within the 1883 caldera at a point between the former Danan and Perbuwatan cones; it has been the site of frequent eruptions since 1927. The current eruption period began in May 2021 and has recently consisted of Strombolian eruptions and ash plumes (BGVN 48:07). This report describes lower levels of activity consisting of ash and white gas-and-steam plumes during May through August 2023, based on information provided by the Indonesian Center for Volcanology and Geological Hazard Mitigation, referred to as Pusat Vulkanologi dan Mitigasi Bencana Geologi (PVMBG), MAGMA Indonesia, and satellite data.
Activity was relatively low during May and June. Daily white gas-and-steam emissions rose 25-200 m above the crater and drifted in different directions. Five ash plumes were detected at 0519 on 10 May, 1241 on 11 May, 0920 on 12 May, 2320 on 12 May, and at 0710 on 13 May, and rose 1-2.5 km above the crater and drifted SW. A webcam image taken on 12 May showed ejection of incandescent material above the vent. A total of nine ash plumes were detected during 6-11 June: at 1434 and 00220 on 6 and 7 June the ash plumes rose 500 m above the crater and drifted NW, at 1537 on 8 June the ash plume rose 1 km above the crater and drifted SW, at 0746 and at 0846 on 9 June the ash plumes rose 800 m and 3 km above the crater and drifted SW, respectively, at 0423, 1431, and 1750 on 10 June the ash plumes rose 2 km, 1.5 km, and 3.5 km above the crater and drifted NW, respectively, and at 0030 on 11 June an ash plume rose 2 km above the crater and drifted NW. Webcam images taken on 10 and 11 June at 0455 and 0102, respectively, showed incandescent material ejected above the vent. On 19 June an ash plume at 0822 rose 1.5 km above the crater and drifted SE.
Similar low activity of white gas-and-steam emissions and few ash plumes were reported during July and August. Daily white gas-and-steam emissions rose 25-300 m above the crater and drifted in multiple directions. Three ash plumes were reported at 0843, 0851, and 0852 on 20 July that rose 500-2,000 m above the crater and drifted NW.
The MIROVA (Middle InfraRed Observation of Volcanic Activity) graph of MODIS thermal anomaly data showed intermittent low-to-moderate power thermal anomalies during May through August 2023 (figure 140). Although activity was often obscured by weather clouds, a thermal anomaly was visible in an infrared satellite image of the crater on 12 May, accompanied by an eruption plume that drifted SW (figure 141).
Geologic Background. The renowned Krakatau (frequently mis-named as Krakatoa) volcano lies in the Sunda Strait between Java and Sumatra. Collapse of an older edifice, perhaps in 416 or 535 CE, formed a 7-km-wide caldera. Remnants of that volcano are preserved in Verlaten and Lang Islands; subsequently the Rakata, Danan, and Perbuwatan cones were formed, coalescing to create the pre-1883 Krakatau Island. Caldera collapse during the catastrophic 1883 eruption destroyed Danan and Perbuwatan, and left only a remnant of Rakata. This eruption caused more than 36,000 fatalities, most as a result of tsunamis that swept the adjacent coastlines of Sumatra and Java. Pyroclastic surges traveled 40 km across the Sunda Strait and reached the Sumatra coast. After a quiescence of less than a half century, the post-collapse cone of Anak Krakatau (Child of Krakatau) was constructed within the 1883 caldera at a point between the former Danan and Perbuwatan cones. Anak Krakatau has been the site of frequent eruptions since 1927.
Information Contacts: Pusat Vulkanologi dan Mitigasi Bencana Geologi (PVMBG, also known as Indonesian Center for Volcanology and Geological Hazard Mitigation, CVGHM), Jalan Diponegoro 57, Bandung 40122, Indonesia (URL: http://www.vsi.esdm.go.id/); MAGMA Indonesia, Kementerian Energi dan Sumber Daya Mineral (URL: https://magma.esdm.go.id/v1); MIROVA (Middle InfraRed Observation of Volcanic Activity), a collaborative project between the Universities of Turin and Florence (Italy) supported by the Centre for Volcanic Risk of the Italian Civil Protection Department (URL: http://www.mirovaweb.it/); Copernicus Browser, Copernicus Data Space Ecosystem, European Space Agency (URL: https://dataspace.copernicus.eu/browser/).
Villarrica (Chile) — October 2023 Cite this Report
Villarrica
Chile
39.42°S, 71.93°W; summit elev. 2847 m
All times are local (unless otherwise noted)
Strombolian activity, gas-and-ash emissions, and crater incandescence during April-September 2023
Villarrica, in central Chile, consists of a 2-km-wide caldera that formed about 3,500 years ago and is located at the base of the presently active cone at the NW margin of a 6-km-wide caldera. Historical eruptions eruptions date back to 1558 and have been characterized by mild-to-moderate explosive activity with occasional lava effusions. The current eruption period began in December 2014 and has recently consisted of nighttime crater incandescence, ash emissions, and seismicity (BGVN 48:04). This report covers activity during April through September 2023 and describes occasional Strombolian activity, gas-and-ash emissions, and nighttime crater incandescence. Information for this report primarily comes from the Southern Andes Volcano Observatory (Observatorio Volcanológico de Los Andes del Sur, OVDAS), part of Chile's National Service of Geology and Mining (Servicio Nacional de Geología y Minería, SERNAGEOMIN) and satellite data.
Seismicity during April consisted of long period (LP) events and tremor (TRE); a total of 9,413 LP-type events and 759 TR-type events were detected throughout the month. Nighttime crater incandescence persisted and was visible in the degassing column. Sulfur dioxide data was obtained using Differential Absorption Optical Spectroscopy Equipment (DOAS) that showed an average value of 1,450 ± 198 tons per day (t/d) during 1-15 April and 1,129 ± 201 t/d during 16-30 April, with a maximum daily value of 2,784 t/d on 9 April. Gas-and-steam emissions of variable intensities rose above the active crater as high as 1.3 km above the crater on 13 April. Strombolian explosions were not observed and there was a slight decrease in the lava lake level.
There were 14,123 LP-type events and 727 TR-type events detected during May. According to sulfur dioxide measurements taken with DOAS equipment, the active crater emitted an average value of 1,826 ± 482 t/d during 1-15 May and 912 ± 41 t/d during 16-30 May, with a daily maximum value of 5,155 t/d on 13 May. Surveillance cameras showed continuous white gas-and-steam emissions that rose as high as 430 m above the crater on 27 May. Nighttime incandescence illuminated the gas column less than 300 m above the crater rim was and no pyroclastic emissions were reported. A landslide was identified on 13 May on the E flank of the volcano 50 m from the crater rim and extending 300 m away; SERNAGEOMIN noted that this event may have occurred on 12 May. During the morning of 27 and 28 May minor Strombolian explosions characterized by incandescent ejecta were recorded at the crater rim; the last reported Strombolian explosions had occurred at the end of March.
Seismic activity during June consisted of five volcano-tectonic (VT)-type events, 21,606 LP-type events, and 2,085 TR-type events. The average value of sulfur dioxide flux obtained by DOAS equipment was 1,420 ± 217 t/d during 1-15 June and 2,562 ± 804 t/d, with a maximum daily value of 4,810 t/d on 17 June. White gas-and-steam emissions rose less than 480 m above the crater; frequent nighttime crater incandescence was reflected in the degassing plume. On 12 June an emission rose 100 m above the crater and drifted NNW. On 15 June one or several emissions resulted in ashfall to the NE as far as 5.5 km from the crater, based on a Skysat satellite image. Several Strombolian explosions occurred within the crater; activity on 15 June was higher energy and ejected blocks 200-300 m on the NE slope. Surveillance cameras showed white gas-and-steam emissions rising 480 m above the crater on 16 June. On 19 and 24 June low-intensity Strombolian activity was observed, ejecting material as far as 200 m from the center of the crater to the E.
During July, seismicity included 29,319 LP-type events, 3,736 TR-type events, and two VT-type events. DOAS equipment recorded two days of sulfur dioxide emissions of 4,220 t/d and 1,009 t/d on 1 and 13 July, respectively. Constant nighttime incandescence was also recorded and was particularly noticeable when accompanied by eruptive columns on 12 and 16 July. Minor explosive events were detected in the crater. According to Skysat satellite images taken on 12, 13, and 16 July, ashfall deposits were identified 155 m S of the crater. According to POVI, incandescence was visible from two vents on the crater floor around 0336 on 12 July. Gas-and-ash emissions rose as high as 1.2 km above the crater on 13 July and drifted E and NW. A series of gas-and-steam pulses containing some ash deposited material on the upper E flank around 1551 on 13 July. During 16-31 July, average sulfur dioxide emissions of 1,679 ± 406 t/d were recorded, with a maximum daily value of 2,343 t/d on 28 July. Fine ash emissions were also reported on 16, 17, and 23 July.
Seismicity persisted during August, characterized by 27,011 LP-type events, 3,323 TR-type events, and three VT-type events. The average value of sulfur dioxide measurements taken during 1-15 August was 1,642 ± 270 t/d and 2,207 ± 4,549 t/d during 16-31 August, with a maximum daily value of 3,294 t/d on 27 August. Nighttime crater incandescence remained visible in degassing columns. White gas-and-steam emissions rose 480 m above the crater on 6 August. According to a Skysat satellite image from 6 August, ash accumulation was observed proximal to the crater and was mainly distributed toward the E slope. White gas-and-steam emissions rose 320 m above the crater on 26 August. Nighttime incandescence and Strombolian activity that generated ash emissions were reported on 27 August.
Seismicity during September was characterized by five VT-type events, 12,057 LP-type events, and 2,058 TR-type events. Nighttime incandescence persisted. On 2 September an ash emission rose 180 m above the crater and drifted SE at 1643 (figure 125) and a white gas-and-steam plume rose 320 m above the crater. According to the Buenos Aires VAAC, periods of continuous gas-and-ash emissions were visible in webcam images from 1830 on 2 September to 0110 on 3 September. Strombolian activity was observed on 2 September and during the early morning of 3 September, the latter event of which generated an ash emission that rose 60 m above the crater and drifted 100 m from the center of the crater to the NE and SW. Ashfall was reported to the SE and S as far as 750 m from the crater. The lava lake was active during 3-4 September and lava fountaining was visible for the first time since 26 March 2023, according to POVI. Fountains captured in webcam images at 2133 on 3 September and at 0054 on 4 September rose as high as 60 m above the crater rim and ejected material onto the upper W flank. Sulfur dioxide flux of 1,730 t/d and 1,281 t/d was measured on 3 and 4 September, respectively, according to data obtained by DOAS equipment.
Strong Strombolian activity and larger gas-and-ash plumes were reported during 18-20 September. On 18 September activity was also associated with energetic LP-type events and notable sulfur dioxide fluxes (as high as 4,277 t/d). On 19 September Strombolian activity and incandescence were observed. On 20 September at 0914 ash emissions rose 50 m above the crater and drifted SSE, accompanied by Strombolian activity that ejected material less than 100 m SSE, causing fall deposits on that respective flank. SERNAGEOMIN reported that a Planet Scope satellite image taken on 20 September showed the lava lake in the crater, measuring 32 m x 35 m and an area of 0.001 km2. Several ash emissions were recorded at 0841, 0910, 1251, 1306, 1312, 1315, and 1324 on 23 September and rose less than 150 m above the crater. The sulfur dioxide flux value was 698 t/d on 23 September and 1,097 t/d on 24 September. On 24 September the Volcanic Alert Level (VAL) was raised to Orange (the third level on a four-color scale). SENAPRED maintained the Alert Level at Yellow (the middle level on a three-color scale) for the communities of Villarrica, Pucón (16 km N), Curarrehue, and Panguipulli.
During 24-25 September there was an increase in seismic energy (observed at TR-events) and acoustic signals, characterized by 1 VT-type event, 213 LP-type events, and 124 TR-type events. Mainly white gas-and-steam emissions, in addition to occasional fine ash emissions were recorded. During the early morning of 25 September Strombolian explosions were reported and ejected material 250 m in all directions, though dominantly toward the NW. On 25 September the average value of sulfur dioxide flux was 760 t/d. Seismicity during 25-30 September consisted of five VT-type events, 1,937 LP-type events, and 456 TR-type events.
During 25-29 September moderate Strombolian activity was observed and ejected material as far as the crater rim. In addition, ash pulses lasting roughly 50 minutes were observed around 0700 and dispersed ENE. During 26-27 September a TR episode lasted 6.5 hours and was accompanied by discrete acoustic signals. Satellite images from 26 September showed a spatter cone on the crater floor with one vent that measured 10 x 14 m and a smaller vent about 35 m NE of the cone. SERNAGEOMIN reported an abundant number of bomb-sized blocks up to 150 m from the crater, as well as impact marks on the snow, which indicated explosive activity. A low-altitude ash emission was observed drifting NW around 1140 on 28 September, based on webcam images. Between 0620 and 0850 on 29 September an ash emission rose 60 m above the crater and drifted NW. During an overflight taken around 1000 on 29 September scientists observed molten material in the vent, a large accumulation of pyroclasts inside the crater, and energetic degassing, some of which contained a small amount of ash. Block-sized pyroclasts were deposited on the internal walls and near the crater, and a distal ash deposit was also visible. The average sulfur dioxide flux measured on 28 September was 344 t/d. Satellite images taken on 29 September ashfall was deposited roughly 3 km WNW from the crater and nighttime crater incandescence remained visible. The average sulfur dioxide flux value from 29 September was 199 t/d. On 30 September at 0740 a pulsating ash emission rose 1.1 km above the crater and drifted NNW (figure 126). Deposits on the S flank extended as far as 4.5 km from the crater rim, based on satellite images from 30 September.
Infrared MODIS satellite data processed by MIROVA (Middle InfraRed Observation of Volcanic Activity) showed intermittent thermal activity during April through September, with slightly stronger activity detected during late September (figure 127). Small clusters of thermal activity were detected during mid-June, early July, early August, and late September. According to the MODVOLC thermal alert system, a total of four thermal hotspots were detected on 7 July and 3 and 23 September. This activity was also intermittently captured in infrared satellite imagery on clear weather days (figure 128).
Geologic Background. The glacier-covered Villarrica stratovolcano, in the northern Lakes District of central Chile, is ~15 km south of the city of Pucon. A 2-km-wide caldera that formed about 3,500 years ago is located at the base of the presently active, dominantly basaltic to basaltic andesite cone at the NW margin of a 6-km-wide Pleistocene caldera. More than 30 scoria cones and fissure vents are present on the flanks. Plinian eruptions and pyroclastic flows that have extended up to 20 km from the volcano were produced during the Holocene. Lava flows up to 18 km long have issued from summit and flank vents. Eruptions documented since 1558 CE have consisted largely of mild-to-moderate explosive activity with occasional lava effusion. Glaciers cover 40 km2 of the volcano, and lahars have damaged towns on its flanks.
Information Contacts: Servicio Nacional de Geología y Minería (SERNAGEOMIN), Observatorio Volcanológico de Los Andes del Sur (OVDAS), Avda Sta María No. 0104, Santiago, Chile (URL: http://www.sernageomin.cl/); Proyecto Observación Villarrica Internet (POVI) (URL: http://www.povi.cl/); Sistema y Servicio Nacional de Prevención y Repuesta Ante Desastres (SENAPRED), Av. Beauchef 1671, Santiago, Chile (URL: https://web.senapred.cl/); Buenos Aires Volcanic Ash Advisory Center (VAAC), Servicio Meteorológico Nacional-Fuerza Aérea Argentina, 25 de mayo 658, Buenos Aires, Argentina (URL: http://www.smn.gov.ar/vaac/buenosaires/inicio.php); MIROVA (Middle InfraRed Observation of Volcanic Activity), a collaborative project between the Universities of Turin and Florence (Italy) supported by the Centre for Volcanic Risk of the Italian Civil Protection Department (URL: http://www.mirovaweb.it/); Hawai'i Institute of Geophysics and Planetology (HIGP) - MODVOLC Thermal Alerts System, School of Ocean and Earth Science and Technology (SOEST), Univ. of Hawai'i, 2525 Correa Road, Honolulu, HI 96822, USA (URL: http://modis.higp.hawaii.edu/); Copernicus Browser, Copernicus Data Space Ecosystem, European Space Agency (URL: https://dataspace.copernicus.eu/browser/).
Merapi (Indonesia) — October 2023 Cite this Report
Merapi
Indonesia
7.54°S, 110.446°E; summit elev. 2910 m
All times are local (unless otherwise noted)
Frequent incandescent avalanches during April-September 2023
Merapi, located just north of the major city of Yogyakarta in central Java, Indonesia, has had activity within the last 20 years characterized by pyroclastic flows and lahars accompanying growth and collapse of the steep-sided active summit lava dome. The current eruption period began in late December 2020 and has more recently consisted of ash plumes, intermittent incandescent avalanches of material, and pyroclastic flows (BGVN 48:04). This report covers activity during April through September 2023, based on information from Balai Penyelidikan dan Pengembangan Teknologi Kebencanaan Geologi (BPPTKG), the Center for Research and Development of Geological Disaster Technology, a branch of PVMBG which specifically monitors Merapi. Additional information comes from the Pusat Vulkanologi dan Mitigasi Bencana Geologi (PVMBG, also known as Indonesian Center for Volcanology and Geological Hazard Mitigation, CVGHM), MAGMA Indonesia, the Darwin Volcanic Ash Advisory Centre (VAAC), and various satellite data.
Activity during April through September 2023 primarily consisted of incandescent avalanches of material that mainly affected the SW and W flanks and traveled as far as 2.3 km from the summit (table 25) and white gas-and-steam emissions that rose 10-1,000 m above the crater.
Table 25. Monthly summary of avalanches and avalanche distances recorded at Merapi during April through September 2023. The number of reported avalanches does not include instances where possible avalanches were heard but could not be visually confirmed as a result of inclement weather. Data courtesy of BPPTKG (April-September 2023 daily reports).
| Month |
Average number of avalanches per day |
Distance avalanches traveled (m) |
| Apr 2023 |
19 |
1,200-2,000 |
| May 2023 |
22 |
500-2,000 |
| Jun 2023 |
18 |
1,200-2,000 |
| Jul 2023 |
30 |
300-2,000 |
| Aug 2023 |
25 |
400-2,300 |
| Sep 2023 |
23 |
600-2,000 |
BPPTKG reported that during April and May white gas-and-steam emissions rose 10-750 m above the crater, incandescent avalanches descended 500-2,000 m on the SW and W flanks (figure 135). Cloudy weather often prevented clear views of the summit, and sometimes avalanches could not be confirmed. According to a webcam image, a pyroclastic flow was visible on 17 April at 0531. During the week of 28 April and 4 May a pyroclastic flow was reported on the SW flank, traveling up to 2.5 km. According to a drone overflight taken on 17 May the SW lava dome volume was an estimated 2,372,800 cubic meters and the dome in the main crater was an estimated 2,337,300 cubic meters.
During June and July similar activity persisted with white gas-and-steam emissions rising 10-350 m above the crater and frequent incandescent avalanches that traveled 300-2,000 m down the SW, W, and S flanks (figure 136). Based on an analysis of aerial photos taken on 24 June the volume of the SW lava dome was approximately 2.5 million cubic meters. A pyroclastic flow was observed on 5 July that traveled 2.7 km on the SW flank. According to the Darwin VAAC multiple minor ash plumes were identified in satellite images on 19 July that rose to 3.7 km altitude and drifted S and SW. During 22, 25, and 26 July a total of 17 avalanches descended as far as 1.8 km on the S flank.
Frequent white gas-and-steam emissions continued during August and September, rising 10-450 m above the crater. Incandescent avalanches mainly affected the SW and W flanks and traveled 400-2,300 m from the vent (figure 137). An aerial survey conducted on 10 August was analyzed and reported that estimates of the SW dome volume was 2,764,300 cubic meters and the dome in the main crater was 2,369,800 cubic meters.
Frequent and moderate-power thermal activity continued throughout the reporting period, according to a MIROVA (Middle InfraRed Observation of Volcanic Activity) analysis of MODIS satellite data (figure 138). There was an increase in the number of detected anomalies during mid-May. The MODVOLC thermal algorithm recorded a total of 47 thermal hotspots: six during April, nine during May, eight during June, 15 during July, four during August, and five during September. Some of this activity was captured in infrared satellite imagery on clear weather days, sometimes accompanied by incandescent material on the SW flank (figure 139).
Geologic Background. Merapi, one of Indonesia's most active volcanoes, lies in one of the world's most densely populated areas and dominates the landscape immediately north of the major city of Yogyakarta. It is the youngest and southernmost of a volcanic chain extending NNW to Ungaran volcano. Growth of Old Merapi during the Pleistocene ended with major edifice collapse perhaps about 2,000 years ago, leaving a large arcuate scarp cutting the eroded older Batulawang volcano. Subsequent growth of the steep-sided Young Merapi edifice, its upper part unvegetated due to frequent activity, began SW of the earlier collapse scarp. Pyroclastic flows and lahars accompanying growth and collapse of the steep-sided active summit lava dome have devastated cultivated lands on the western-to-southern flanks and caused many fatalities.
Information Contacts: Balai Penyelidikan dan Pengembangan Teknologi Kebencanaan Geologi (BPPTKG), Center for Research and Development of Geological Disaster Technology (URL: http://merapi.bgl.esdm.go.id/, Twitter: @BPPTKG); MAGMA Indonesia, Kementerian Energi dan Sumber Daya Mineral (URL: https://magma.esdm.go.id/v1); Pusat Vulkanologi dan Mitigasi Bencana Geologi (PVMBG, also known as Indonesian Center for Volcanology and Geological Hazard Mitigation, CVGHM), Jalan Diponegoro 57, Bandung 40122, Indonesia (URL: http://www.vsi.esdm.go.id/); Darwin Volcanic Ash Advisory Centre (VAAC), Bureau of Meteorology, Northern Territory Regional Office, PO Box 40050, Casuarina, NT 0811, Australia (URL: http://www.bom.gov.au/info/vaac/); MIROVA (Middle InfraRed Observation of Volcanic Activity), a collaborative project between the Universities of Turin and Florence (Italy) supported by the Centre for Volcanic Risk of the Italian Civil Protection Department (URL: http://www.mirovaweb.it/); Hawai'i Institute of Geophysics and Planetology (HIGP) - MODVOLC Thermal Alerts System, School of Ocean and Earth Science and Technology (SOEST), Univ. of Hawai'i, 2525 Correa Road, Honolulu, HI 96822, USA (URL: http://modis.higp.hawaii.edu/); Copernicus Browser, Copernicus Data Space Ecosystem, European Space Agency (URL: https://dataspace.copernicus.eu/browser/); Øystein Lund Andersen (URL: https://www.oysteinlundandersen.com/, https://twitter.com/oysteinvolcano).
Ebeko
Russia
50.686°N, 156.014°E; summit elev. 1103 m
All times are local (unless otherwise noted)
Moderate explosive activity with ash plumes continued during June-November 2023
Ebeko, located on the N end of Paramushir Island in Russia’s Kuril Islands just S of the Kamchatka Peninsula, consists of three summit craters along a SSW-NNE line at the northern end of a complex of five volcanic cones. Observed eruptions date back to the late 18th century and have been characterized as small-to-moderate explosions from the summit crater, accompanied by intense fumarolic activity. The current eruptive period began in June 2022, consisting of frequent explosions, ash plumes, and thermal activity (BGVN 47:10, 48:06). This report covers similar activity during June-November 2023, based on information from the Kamchatka Volcanic Eruptions Response Team (KVERT) and satellite data.
Moderate explosive activity continued during June-November 2023 (figures 50 and 51). According to visual data from Severo-Kurilsk, explosions sent ash 2-3.5 km above the summit (3-4.5 km altitude) during most days during June through mid-September. Activity after mid-September was slightly weaker, with ash usually reaching less than 2 km above the summit. According to KVERT the volcano in October and November was, with a few exceptions, either quiet or obscured by clouds that prevented satellite observations. KVERT issued Volcano Observatory Notices for Aviation (VONA) on 8 and 12 June, 13 and 22 July, 3 and 21 August, and 31 October warning of potential aviation hazards from ash plumes drifting 3-15 km from the volcano. Based on satellite data, KVERT reported a persistent thermal anomaly whenever weather clouds permitted viewing.
Geologic Background. The flat-topped summit of the central cone of Ebeko volcano, one of the most active in the Kuril Islands, occupies the northern end of Paramushir Island. Three summit craters located along a SSW-NNE line form Ebeko volcano proper, at the northern end of a complex of five volcanic cones. Blocky lava flows extend west from Ebeko and SE from the neighboring Nezametnyi cone. The eastern part of the southern crater contains strong solfataras and a large boiling spring. The central crater is filled by a lake about 20 m deep whose shores are lined with steaming solfataras; the northern crater lies across a narrow, low barrier from the central crater and contains a small, cold crescentic lake. Historical activity, recorded since the late-18th century, has been restricted to small-to-moderate explosive eruptions from the summit craters. Intense fumarolic activity occurs in the summit craters, on the outer flanks of the cone, and in lateral explosion craters.
Information Contacts: Kamchatka Volcanic Eruptions Response Team (KVERT), Far Eastern Branch, Russian Academy of Sciences, 9 Piip Blvd., Petropavlovsk-Kamchatsky, 683006, Russia (URL: http://www.kscnet.ru/ivs/kvert/).
Search Bulletin Archive by Publication Date
Select a month and year from the drop-downs and click "Show Issue" to have that issue displayed in this tab.
The default month and year is the latest issue available.
Bulletin of the Global Volcanism Network - Volume 34, Number 03 (March 2009)
Managing Editor: Richard Wunderman
Aira (Japan)
Recent (2007-2009) explosive eruptions and intermittent plumes
Deception Island (Antarctica)
Absence of seismicity, deformation, and soil temp flux during late 2008-early 2009
Dempo (Indonesia)
Phreatic eruption in September 2006 sent mud 300 m
Hunga Tonga-Hunga Ha'apai (Tonga)
Eruption ends on 21 March, leaving new land and steaming lakes
Kilauea (United States)
June to December 2007 activity; multiple fissure eruptions
Klyuchevskoy (Russia)
Eruption in 2007 changed summit crater; ongoing 2008-2009 lava flows
Koryaksky (Russia)
Increased ash emissions during March and April 2009
Masaya (Nicaragua)
Phreatomagmatic explosions in August 2006; intermittent plumes through 2008
Popocatepetl (Mexico)
Tremor, numerous earthquakes, and small ash plumes
Reventador (Ecuador)
Lava extrudes down two flanks during November 2008-April 2009
Aira
Japan
31.5772°N, 130.6589°E; summit elev. 1117 m
All times are local (unless otherwise noted)
Recent (2007-2009) explosive eruptions and intermittent plumes
Our last reports on Sakura-jima (BGVN 31:06 and 32:04) discussed an eruption from Showa crater on 4 June 2006, the first eruption outside the summit crater since 1946. It also provided a chronology of plume observations between 7 June 2006 and 20 March 2007.
The current report continues the chronology of plume observations from 20 March 2007 to 24 April 2009 (table 15). Most of the plumes described since 20 March 2007 did not exceed 3 km altitude (figure 29). The tallest plume recorded on the table, an ash plume on 9 April 2009, rose to about 5 km altitude.
Table 15. Heights and drift of plumes and their character at Sakura-jima from 20 March 2007 to 24 April 2009. Courtesy of Tokyo Volcanic Ash Advisory Center, pilot reports, and the Japan Meteorological Agency (JMA). Times and dates are local.
| Date |
Plume altitude/drift |
Observations |
| 16 May 2007 |
1.2-2.7 km/ NW |
-- |
| 20-22 May 2007 |
1.2-2.7 km/ up |
-- |
| 23-24, 26-28 May 2007 |
1.8-2.1 km/ E, SE, up |
-- |
| 31 May-01 Jun 2007 |
2.1-2.4 km/ up |
-- |
| 04 Jun-05 Jun 2007 |
2.1-2.4 km/ W, NW, E |
Ash not detected by satellite imagery. |
| 08, 10, 11 Jun 2007 |
2.1 km/ S |
Ash not detected by satellite imagery. |
| 16 Jun 2007 |
-- |
Explosion. Ash not detected by satellite imagery. |
| 20-21 Jun 2007 |
2.4 km/N |
Ash not detected by satellite imagery. |
| 04 Aug 2007 |
-- |
Explosion. Ash not detected by satellite imagery. |
| 29 Oct 2007 |
3.7 km/E |
-- |
| 23-24 Dec 2007 |
2.7 km/S |
-- |
| 02, 07 Jan 2008 |
-- |
Explosions reported. |
| 03 Feb 2008 |
1.5-2.7 km/ SE |
Ash not detected by satellite imagery. |
| 05-06 Feb 2008 |
1.2-2.1 km/ SE |
Ash not detected by satellite imagery. |
| 11-15 Apr 2008 |
2.1-3.4 km/ various |
-- |
| 19 Apr 2008 |
4.6 km/E |
Plume contained ash. |
| 20, 23-30 Apr 2008 |
2.4 km/various |
-- |
| 06-07 May 2008 |
2.4-3.4 km/S |
-- |
| 08 May 2008 |
4 km/E |
-- |
| 15-22 May 2008 |
1.8-3.4 km/various |
-- |
| 24 May 2008 |
-- |
Explosion reported. |
| 30 May-01 Jun 2008 |
2.1-3 km/various |
-- |
| 09 Jun 2008 |
2.1 km/S |
-- |
| 10-11 Jun 2008 |
-- |
Explosions reported. |
| 12-13 Jun 2008 |
3.4 km/various |
Plumes contained ash. |
| 28 Jun 2008 |
-- |
Explosion reported. |
| 05 Jul 2008 |
2.7 km/E |
-- |
| 10, 13 Jul 2008 |
2.7 km |
Plumes contained ash. |
| 25-28 Jul 2008 |
2.4-4.3 km/various |
Plumes contained ash. |
| 10 Aug 2008 |
>2.7 km/NW |
-- |
| 23 Aug 2008 |
-- |
Explosion reported. |
| 07 Sep 2008 |
2.1 km/straight up |
-- |
| 03 Oct 2008 |
2.7 km |
-- |
| 09, 15 Jan 2009 |
2.4, 1.8 km/SE |
-- |
| 28 Jan -03 Feb 2009 |
1.8-3.4 km/various |
-- |
| 01-02 Feb 2009 |
-- |
Eight eruptions; bombs up to 800 m from Showa crater. On 2 Feb, JMA Alert level to 3. |
| 04-05 Feb 2009 |
2.1-2.4 km/SE |
Explosions and eruptions. |
| 09-12 Feb 2009 |
0.6-2.4 km/SE |
Ash plumes. |
| 19 Feb 2009 |
-- |
JMA lowered Alert Level to 2. |
| 22 Feb 2009 |
2.7 km/N |
Explosion. |
| 28 Feb-04 Mar 2009 |
1.8-3 km/S |
Eruptions or explosions, three Vulcanian explosions from Showa crater ejected bombs up to 1.3 km. Deformation; expansion of edifice (tiltmeter). On 2 Mar, JMA Alert Level to 3. |
| 07-10 Mar 2009 |
1.8-2.9 km/N, S |
Twelve Vulcanian explosions from Showa crater. Ejected bombs up to 1.8 km. |
| 14 Mar 2009 |
1.5-2.1 km/SE, E |
Two Vulcanian explosions ejected bombs up to 800 m. |
| 17 Mar 2009 |
2.1 km/E |
Eruption. |
| 20, 23 Mar 2009 |
-- |
Explosions; weak incandescence on 23rd. |
| 26 Mar 2009 |
-- |
Eruption. |
| 27-30 Mar 2009 |
2.1 km/SE |
Weak eruptions, strong steam emissions. |
| 05-07 Apr 2009 |
2.1-3 km/SE, S |
Explosions and eruptions. |
| 08 Apr 2009 |
2.7 km |
Eruption. |
| 09 Apr 2009 |
~5 km/SW |
Vulcanian explosion, pyroclastic flow to 1 km E, bombs to 1.3 km, heavy ashfall at Kagoshima City. |
| 10 Apr 2009 |
2.1-2.7 km/W, S |
-- |
| 24 Apr 2009 |
-- |
JMA lowered alert level to 2. |
On 19 February 2009 JMA lowered the Alert Level from 3 to 2, because after the 1-5 February explosions, no eruptions had occurred either from Showa crater or Minamidake summit crater, seismicity was low, and no crustal deformation was observed (figure 30). As a result of heightened activity, the Alert Level was raised to 3 on 2 March, but dropped to 2 on 24 April 2009 due to low seismicity, lack of deformation, and absence of large eruptions. According to JMA, the shape of Showa crater has not changed recently, but the depth of the crater had increased. Photographs taken during an overflight on 10 March 2009 (figures 31 and 32) showed changes in morphology and temperature.
An article in Asahi newspaper contained several photos of the 9 April 2009 ashfall in Kagoshima City, about 10 W of Sakura-jima. This was the heaviest ashfall since October 2002.
During the last two years, the only thermal anomaly recorded by MODIS-MODVOLC for Sakura-jima was on 17 December 2008 (1 pixel).
Two recently published articles (citations below) describe the mechanism of explosive eruptions at Sakura-jima and two other Japanese volcanoes, and color measurements of Sakura-jima's ash deposits.
References. Iguchi, M., Yakiwara, H., Tameguri, T., Hendrasto, M. and Hirabayashi, J., 2008. Mechanism of explosive eruption revealed by geophysical observations at the Sakurajima, Suwanosejima and Semeru volcanoes: Journal of Volcanology and Geothermal Research, v. 178, no. 1, p. 1-9.
Yamanoi, Y.,Takeuchi Y., Okumura S., Nakashima S., and Yokoyama, T., 2008. Color measurements of volcanic ash deposits from three different styles of summit activity at Sakurajima volcano, Japan: Conduit processes recorded in color of volcanic ash: Journal of Volcanology and Geothermal Research, v. 178, no. 1, p. 81-93.
Geologic Background. The Aira caldera in the northern half of Kagoshima Bay contains the post-caldera Sakurajima volcano, one of Japan's most active. Eruption of the voluminous Ito pyroclastic flow accompanied formation of the 17 x 23 km caldera about 22,000 years ago. The smaller Wakamiko caldera was formed during the early Holocene in the NE corner of the caldera, along with several post-caldera cones. The construction of Sakurajima began about 13,000 years ago on the southern rim and built an island that was joined to the Osumi Peninsula during the major explosive and effusive eruption of 1914. Activity at the Kitadake summit cone ended about 4,850 years ago, after which eruptions took place at Minamidake. Frequent eruptions since the 8th century have deposited ash on the city of Kagoshima, located across Kagoshima Bay only 8 km from the summit. The largest recorded eruption took place during 1471-76.
Information Contacts: Japan Meteorological Agency (JMA), Otemachi, 1-3-4, Chiyoda-ku Tokyo 100-8122, Japan (URL: http://www.jma.go.jp/); Tokyo Volcanic Ash Advisory Center (VAAC), Tokyo, Japan (URL: http://ds.data.jma.go.jp/svd/vaac/data/); Hawai'i Institute of Geophysics and Planetology (HIGP) Thermal Alerts System, School of Ocean and Earth Science and Technology (SOEST), Univ. of Hawai'i, 2525 Correa Road, Honolulu, HI 96822, USA (URL: http://modis.higp.hawaii.edu/); Yukio Hayakawa, Gunma University, Faculty of Education, Aramaki 4-2, Maebashi 371-8510, Japan; Asahi newspaper (URL: https://www.asahi.com/).
Deception Island (Antarctica) — March 2009 Cite this Report
Deception Island
Antarctica
62.9567°S, 60.6367°W; summit elev. 602 m
All times are local (unless otherwise noted)
Absence of seismicity, deformation, and soil temp flux during late 2008-early 2009
Alicia Garcia forwarded to us a report of the geophysical monitoring conducted during December 2008 to February 2009 (the 2008-2009 austral summer). This field work included measurements of seismicity, deformation, and soil temperature. Little if any unrest was detected.
The volcanic alert remained Green during the 2008-2009 campaign. The volcano last erupted in 1970 (and several uncertain eruptions were indicated since then). Seven seismic stations, and a seismic array determined that seismicity was low. During January and February 2009 instruments detected some earthquakes attributed to hydrothermal processes and ice melting. Geodetic leveling surveys were carried out over benchmarks along six lines of an existing network (known as RENID). Only superficial deformation was detected.
The Thermometric Monitoring Network (THONET) was initiated in 2006. It consists of a set of stations monitoring micro-meteorological variables including wind velocity, air temperature and humidity, upward and downward solar and terrestrial radiation, diffuse solar radiation, soil heat flow, soil temperature at several depths and snow depth cover. Not all variables are recorded at all stations or constantly. Measurements indicated that soil thermal behavior was the result of solar and atmospheric forcing.
Ibanez and others (2003) noted both long-period (LP) and volcano-tectonic (VT) earthquakes since 1986, with greatest intensity during 1992 and 1999. This means that in ~ 15 years of seismic monitoring, two intense volcanic crises have been observed. No permanent monitoring stations exist on the island, and seismic measurements are conducted only during 3 months/year (from December to February); thus, similar periods of elevated volcanic seismicity might have occurred more often than detected.
Benitez and others (2007) described a seismic-event classification and monitoring system for Deception. The system, based on hidden Markov modeling (HMM) techniques, enabled monitoring by careful discriminating among different signal types.
As late as 30 April 2009, MODIS/MODVOLC thermal alert satellite measurements showed no anomalies over the island since at least 2000.
References. Benítez, M.C., Ramírez, J., Segura, J.C., Ibáñez, J.M., Almendros, J., García-Yeguas, A., and Cortés, G., 2007, Continuous HMM-Based Seismic-Event Classification at Deception Island, Antarctica, IEEE Transactions on Geoscience and Remote Sensing, v. 45, no. 1, p. 138-146.
Ibáñez, J.M, Almendros, J., Carmona, E., Martínez-Arévalo, C., and Abril, M., 2003, The recent seismo-volcanic activity at Deception Island volcano, Deep Sea Research Part II: Topical Studies in Oceanography, v. 50, no. 10-11, p. 1611-1629.
Geologic Background. Ring-shaped Deception Island, at the SW end of the South Shetland Islands, NE of Graham Land Peninsula, was constructed along the axis of the Bransfield Rift spreading center. A narrow passageway named Neptunes Bellows provides an entrance to a natural harbor within the 8.5 x 10 km caldera that was utilized as an Antarctic whaling station. Numerous vents along ring fractures circling the low 14-km-wide island have been reported active for more than 200 years. Maars line the shores of 190-m-deep Port Foster caldera bay. Among the largest of these maars is 1-km-wide Whalers Bay, at the entrance to the harbor. Eruptions during the past 8,700 years have been dated from ash layers in lake sediments on the Antarctic Peninsula and neighboring islands.
Information Contacts: A. Garcia, Dept. of Volcanology (MNCN-CSIC), Madrid, Spain; M. Berrocoso, Cadiz Univ., Spain; M. Rodríguez-Arias, Extremadura Univ., Spain; I. Serrano, Granada Univ., Spain; MODIS/MODVOLC. Hawai'i Institute of Geophysics and Planetology (HIGP) Thermal Alerts System, School of Ocean and Earth Science and Technology (SOEST), Univ. of Hawai'i, 2525 Correa Road, Honolulu, HI 96822, USA (URL: http://modis.higp.hawaii.edu/).
Dempo
Indonesia
4.016°S, 103.121°E; summit elev. 3142 m
All times are local (unless otherwise noted)
Phreatic eruption in September 2006 sent mud 300 m
Our most recent report on Dempo (BGVN 34:01) discussed a phreatic eruption on 1 January 2009. This eruption prompted Indonesia's Center of Volcanology and Geological Hazard Mitigation (CVGHM) to raise the alert level from 1 (normal) to 2 (alert) on a scale of 1-4. A few months later, on 23 March 2009, the CVGHM lowered Dempo's Alert Level to 1, based on visual observations of the crater lake during 5-6 January and 2-4 March, and decreased seismicity since the 1 January phreatic eruption.
The name Dempo applies to both the larger complex and to a peak that sits adjacent to a neighboring peak called Marapi. The latter volcano name applies to several different volcanoes in Indonesia and is easily confused with the very prominent volcano Merapi (central Java). The Marapi cone in the Dempo complex contains a ~ 400 m diameter crater lake, the source of both the 2006 and 2009 eruptions.
The remainder of this report discusses the phreatic eruption that occurred in September 2006. This eruption had not been previously discussed in the Bulletin, and CVGHM reporting on the subject has recently come to our attention.
In the month before this eruption, teams from the CVGHM had visited several times. On 13 August 2006, a team prepared a map of Dempo and reported that the condition of the water in Marapi's crater lake was normal and clear or slightly blue in color, with no bubbling. On 4 September 2006, a team climbed to the peak of Dempo and reported that activity was normal other than some bubbling at the E edge of the crater lake.
2006 phreatic eruption. On 25 September 2006, a phreatic eruption occurred that expelled water from Marapi's crater lake and propelled mud onto the area around the peak up to a radius of 300 m.
On the next day, the inspector for Dempo, Mr. Mulyadi, accompanied by six friends, inspected the volcano and its lake. According to Mulyadi's team, the lake water was bubbling and had changed to a grayish color. Acrid sulfurous emissions were accompanied by a hissing sound. The NW crater wall was covered by mud from the eruption. Many of the phreatic deposits around the crater lake were only about 0.5 cm thick, although in several other places they were thicker (figures 1-4). A visit on 4 October 2006 found the deposits not yet eroded, owing to a lack of rain since the eruption.
Geologic Background. Dempo is a stratovolcano that rises above the Pasumah Plain of SE Sumatra. The andesitic complex has two main peaks, Gunung Dempo and Gunung Marapi, constructed near the SE rim of a 3-km-wide amphitheater open to the north. The high point of the older Gunung Dempo crater rim is slightly lower, and lies at the SE end of the summit complex. The taller Marapi cone was constructed within the older crater. Remnants of seven craters are found at or near the summit, with volcanism migrating WNW over time. The active 750 x 1,100 m active crater cuts the NW side of the Marapi cone and contains a 400-m-wide lake at the far NW end. Eruptions recorded since 1817 have been small-to-moderate explosions that produced local ashfall.
Information Contacts: Center of Volcanology and Geological Hazard Mitigation (CVGHM), Jalan Diponegoro 57, Bandung 40122, Indonesia (URL: http://vsi.esdm.go.id/).
Hunga Tonga-Hunga Ha'apai (Tonga) — March 2009 Cite this Report
Hunga Tonga-Hunga Ha'apai
Tonga
20.5532°S, 175.3841°W; summit elev. 114 m
All times are local (unless otherwise noted)
Eruption ends on 21 March, leaving new land and steaming lakes
The eruption from Hunga Tonga-Hunga Ha'apai (figure 6) that began from multiple vents at Hunga Ha'apai island on 17 March 2009 ended after five days of activity on 21 March. The eruption destroyed all vegetation on the island, one of two high points on a submarine caldera rim (figure 7). Strong Surtseyan activity was witnessed by passengers on a fishing boat on 18 March (BGVN 34:02). Satellite imagery acquired that day (figure 8) revealed a bright eruption plume, an extensive 10-km-radius zone of discolored water around the islands, and pumice rafts that had already drifted 20-25 km towards the NW. By the next day, scientists on the scene observed that the submarine vent offshore to the S (figure 9) had built new land that was connected to Hunga Ha'apai (BGVN 34:02).
Based on inspection of an aerial photograph taken on 21 March (figure 10), the island had lengthened by ~ 1 km and the S crater was approximately 350 m in diameter on 21 March, assuming the island was 2 km long as previously described. Calculations using ASTER satellite imagery from 26 March result in similar dimensions for the island and S crater, and showed that the new extension was also about 1 km wide at that time.
Aerial photographs from 21 March showed no activity at the NW vent and a steam plume rising from the S vent. However, airport observers on Tongatapu saw new eruptive activity with ash plumes on the afternoon of 21 March (BGVN 34:02). A Matangi Tonga news article on 1 April reported the eruption as being on 17-21 March. Although Radio New Zealand International reported that residents of Nuku'alofa saw "glow on the horizon" on 22 March and stated that ash eruptions continued on the 23rd, those observations were not confirmed.
On 27 March a group of four people, organized by Gian Piero Orbassano of the Waterfront Lodge, landed on Hunga Ha'apai using an inflatable dinghy launched from a charter fishing boat. They landed on the newly built southern part of the island and walked to the rim of the crater which they described as filled with orange steaming water. They noted that landing on the "rocky black pumice" shore was difficult in rough seas. Large boulders (sizes not given) on the surface crumbled when touched. The ground was firm to walk on, but the crater rim was "fragile and cracked" (figure 11). Orbassano, in a 5 April news report, stated that people were visiting the island by boat but not landing, viewing the "smoking" vents and yellowish water around the island.
Geologic Background. The small andesitic islands of Hunga Tonga and Hunga Ha'apai are part of the western and northern remnants of the rim (~6 km diameter) of a largely submarine caldera located about 30 km SSE of Falcon Island. The topmost sequence of welded and unwelded ignimbrite units from a caldera-forming eruption was 14C dated to 1040-1180 CE (Cronin et al., 2017; Brenna et al. 2022). At least two additional welded pumice-rich ignimbrite units and nonwelded pyroclastic flow deposits, below paleosols and other volcaniclastic deposits, indicated more very large previous eruptions (Cronin et al., 2017; Brenna et al. 2022). Several submarine eruptions have occurred at this caldera system since the first recorded eruption in 1912, including 1937 and S of the islands in 1988. A short eruption in 2009 added land to to Hunga Ha'apai. At that time the two islands were each about 2 km long, displaying inward-facing sea cliffs with lava and tephra layers dipping gently away from the caldera. An eruption during December 2014-January 2015 was centered between the islands, and combined them into one larger structure. Major explosive eruptions in late 2021 initially reshaped the central part of the combined island before stronger activity in mid-January 2022 removed most of the 2014-15 material; an even larger eruption the next day sent an eruption plume high into the stratosphere, triggered shock waves through the atmosphere and tsunami across the Pacific Ocean, and left only small remnants of the islands above the ocean surface.
Information Contacts: Brad Scott, GNS Science, Wairakei Research Centre, Private Bag 2000, Taupo 3352, New Zealand (URL: http://www.gns.cri.nz/); NASA Earth Observatory (URL: http://earthobservatory.nasa.gov/); GP Orbassano, Waterfront Lodge, Vuna Road, Ma'ufanga, PO Box 1001, Nuku'alofa, Tonga (URL: http://www.waterfront-lodge.com/); Radio New Zealand International, PO Box 123, Wellington, New Zealand (URL: http://www.rnzi.com/); Matongi Tonga Online, PO Box 958, Nuku'alofa, Tonga (URL: http://www.matangitonga.to/); Perry-Castañeda Library Map Collection, University of Texas Libraries, The University of Texas at Austin (URL: http://www.lib.utexas.edu/).
Kilauea (United States) — March 2009 Cite this Report
Kilauea
United States
19.421°N, 155.287°W; summit elev. 1222 m
All times are local (unless otherwise noted)
June to December 2007 activity; multiple fissure eruptions
The long-term eruption of Kīlauea, continuing since January 1983, is well documented in reports issued by the Hawaiian Volcano Observatory (HVO) and in the literature (eg., Poland and others, 2008), and is thus only episodically covered in our Bulletin. This report begins bringing coverage up to date by summarizing activity during the last half of 2007. Events included lava returning to Pu`u `O`o on 2 July, a fissure eruption on 21 July, and the Thanksgiving Eve Breakout (TEB) on 21 November. This report starts with a discussion of the Father's Day Intrusion, or Episode 56, an event heralded by increased summit activity on 17 June 2007 (BGVN 32:06).
Father's Day Intrusion (Episode 56) and Pu`u `O`o activity. According to HVO, on Father's Day, 17 June 2007, a swarm of earthquakes and rapid deflation began at 0215 in the upper E rift zone. The earthquakes were centered under Pauahi Crater ~ 1 km SW of the Mauna Ulu shield volcano, and ~ 1.5-3 km deep. Rapid ground tilting was detected at Mauna Ulu. About 70 earthquakes were recorded in the first 2 hours; at least ten of those were M 3 or greater. National Park Service (NPS) crews evacuated visitors and closed the Chain of Craters road and part of the Crater Rim drive.
Fresh cracks about 2 cm wide opened in the Chain of Craters road near the turnoff to Mauna Ulu. Within a few hours, GPS receivers in the area of most intense seismic activity documented an approximate 10 cm of widening across the rift zone, near Makaopuhi crater. The deformation and earthquakes were inferred as associated with magma intrusion that started in the Mauna Ulu area early on 17 June and subsequently moved slowly 6 km E along the East rift zone. HVO observers noted rockfalls from the S wall of Pu`u `O`o cone and collapse of the crater floor around the vents. Some parts of the crater floor subsided up to 80 m within a few days.
On 18 June, the earthquake swarm slowed to ~ 10-15 small earthquakes per hour. Strong tremor beneath the summit was recorded and deflation continued. GPS receivers continued to show extension across the East rift zone, to ~ 100 cm in some areas. Between 18 and 19 June, a new 50-m-long lava flow emerged from a 200-m-long fissure in the forest NE of Kane Nui o Hamo, about 6 km W of Pu`u `O`o. Steam plumes were spotted on the N flank of Kane Nui o Hamo (figure 190).
On 20 June, seismicity and extension decreased on the East rift zone. HVO scientists measured highly elevated sulfur dioxide gas concentrations, greater than 10 parts per million (ppm), in a broad area adjacent to Halema'uma'u crater. Elsewhere typical concentrations were generally negligible except for areas downwind of Halema'uma'u crater, where they reached up to 2.5 ppm in narrow zones.
During 21 June-1 July 2007, no fresh lava was visible on the flow field or at the site of the 18-19 June eruption. The summit area continued to inflate very slowly and seismic tremor values at Pu`u `O`o were below pre-June 17 levels. Ground-based mapping of the new lava flow indicated the eruption occurred from two places along the fissure, separated by ~ 40 m. The intrusion and extension processes had drained a substantial amount of magma from the summit reservoir; Pu`u `O`o's crater collapsed to a level 100 m deeper and the lava tubes drained.
Lava in Pu`u `O`o Crater (Episode 57). On 2 July, HVO scientists saw new lava flows at the bottom of the collapsing Pu`u `O`o crater; incandescence had last been seen there on 18 June. Two vents feeding the lake were identified: the W vent, initially the most active, and the E vent (figure 191). During 3-13 July, a lava lake grew and filled the crater to within 30 m of the rim. On the S wall of West Gap pit, intermittent incandescence and fuming from new vents that opened were observed during 13-14 July. In addition, the level of the lava lake dropped but lava continued to emit from the E vent. On 15 July, the E and W vents erupted small lava flows that drained onto the solidifying lava lake bed. Low lava fountains extruded from West Gap pit. Within a few days, lava filled the pit and overflowed into the main crater.
During 18-21 July, the E vent and dominant W vent in Kīlauea's Pu`u `O`o produced lava flows. New vents opened in the Puka Nui pit, in the SSW area of Pu`u `O`o crater, and produced lava flows that ponded there. A low lava fountain occasionally fed the lake from the vicinity of a spatter cone; an unseen source also fed the lake from the NW edge. A vent high on the S crater wall, adjacent to the Puka Nui Gap pit, produced spatter and propelled lava bombs 10 m into the air. Meanwhile, the lava lake in the West Gap pit continued to fill, overturn, and occasionally overflow. The spatter cone that built up around the S wall vent in West Gap pit was submerged beneath the lava lake surface on 20 July. Uplift of the crater interior continued. Earthquakes occurred beneath the upper E rift zone, S flank, and Halema'umau crater.
Fissures A-D. Late on 20 July, a tiltmeter recorded a nearly 300 microradian of change as Pu`u `O`o's crater floor started to subside. Early on 21 July, the West Gap lava lake and Puka Nui pit drained. A new eruption initiated along a set of fissures (figure 192) that extended 1.7 km E from a point about 150 m E of the E rim of Pu`u `O`o crater.
Preliminary reports described two 600-800 m long, left-stepping, ENE-trending fissures between Pu`u `O`o and Kupaianaha. The easternmost fissure fed two lava flows, the longer of which reached ~ 2 km SE from the fissure. The lower fissure consisted of three segments, making a total of four. The four fissure segments, A, B, C, and D, defined an approximately 2 km-long line (figure 193).
The westernmost fissure (segment A) was inactive by 21 July and the uppermost segment of the active lower fissure (segment B) was completely sealed by mid-morning on 22 July. The rest of the fissure erupted lava fountains 6-8 m high, constructing several small perched ponds that occasionally overflowed to feed a few longer lava flows. These formed as the edges of pools of lava hardened to create confining walls. These walls enabled the pond's surface to be much higher, in some cases as much as 18 m or higher than the surrounding land. The ponds were as large as 200 m in diameter.
During 23 July to mid-August, fissure segments C and D fed perched lava ponds created by the NE-advancing `a`a flow. The ponds both grew in thickness and spilled lava over the levees along their edges, or at breaches. By 31 July, segment B had become inactive. By about 12 August, lava ceased extruding at segment C.
During the rest of August through most of November, fissure segment D continued to feed advancing `a`a lava flows that frequently escaped the confines of the levees. Lava flows that branched from the main channel continued to advance, widening and lengthening the flow field. Lava occasionally escaped from lava tubes.
Fissure D and TEB. On 21 November, lava escaped from a perched channel near fissure D. This lava flow became known as the TEB (Thanksgiving Eve Breakout). The bypass of lava from the channel to the surface resulted in an estimated 10 m drop in channel levels. The redirected lava quickly formed two channelized pahoehoe flows; one advanced 300 m N and the second flow advanced 1 km SE.
During 23-27 November, lava built a low shield over the TEB and fed one flow that advanced 2 km. A small lava pond at the top of the TEB shield overflowed and fed lava flows in multiple directions. Clear web-camera views on 9 and 10 December revealed that the TEB shield continued to build vertically and was then an estimated 15 m high. On 16 December, a 4-5-m-high hornito at the summit of the TEB shield was active. On 17 December, fume puffed from the top of the shield about every 15-20 minutes when visible.
An overflight on 20 December revealed that lava from fissure D built up two more shields SE of the TEB shield. These shields were considered "rootless shields." That term is described by HVO scientists as "...smaller, shield-shaped mounds that form on active lava flows [and] are fed by shallow lava tubes that flow just below the surface."
During 25 December-1 January lava escaped at both the TEB shield and two satellitic shields. Short lava flows traveled SE and N.
Reference. Poland, M., Miklius, A., Orr, T., Sutton, J., Thornber, C., and Wilson, D., 2008, New episodes of volcanism at Kīlauea volcano, Hawaii: EOS, Transactions of the Am. Geophys. Union, v. 89, no 5, p. 37-38, 29 January 2008.
Geologic Background. Kilauea overlaps the E flank of the massive Mauna Loa shield volcano in the island of Hawaii. Eruptions are prominent in Polynesian legends; written documentation since 1820 records frequent summit and flank lava flow eruptions interspersed with periods of long-term lava lake activity at Halemaumau crater in the summit caldera until 1924. The 3 x 5 km caldera was formed in several stages about 1,500 years ago and during the 18th century; eruptions have also originated from the lengthy East and Southwest rift zones, which extend to the ocean in both directions. About 90% of the surface of the basaltic shield volcano is formed of lava flows less than about 1,100 years old; 70% of the surface is younger than 600 years. The long-term eruption from the East rift zone between 1983 and 2018 produced lava flows covering more than 100 km2, destroyed hundreds of houses, and added new coastline.
Information Contacts: Hawaiian Volcano Observatory (HVO), U.S. Geological Survey, PO Box 51, Hawai'i National Park, HI 96718, USA (URL: https://volcanoes.usgs.gov/observatories/hvo/).
Klyuchevskoy (Russia) — March 2009 Cite this Report
Klyuchevskoy
Russia
56.056°N, 160.642°E; summit elev. 4754 m
All times are local (unless otherwise noted)
Eruption in 2007 changed summit crater; ongoing 2008-2009 lava flows
Significant eruptions resumed in mid-February 2007. Our last report on Kliuchevskoi (BGVN 32:06) chronicled activity during April 2005-July 2007. This report covers the period from August 2007 to April 2009.
An eruptive period from February to July 2007 reached peak intensity on 29 June 2007 (BGVN 32:06). The ash column was sustained and reached an estimated 8 km high during an 8 hour interval. Plumes reached 2,000 km long. This energetic eruption produced substantial changes to the summit morphology, including removal of the cinder cone on the floor of the summit crater, leaving a deeper crater there. This followed a pattern of earlier substantial morphological change in the summit region during the interval 1968-2007.
Figure 8 shows the pattern of changes during 1968 to mid-2007, but does not show events beyond the time of the 29 June 2007 eruption. Alexey Ozerov (Institute of Volcanology and Seismology, IVS) flew over the volcano during August 2007 and was the first to observe that, following the large eruption, the cinder cone was gone and the crater floor had dropped to an extent that the crater had developed an open capacity of 0.5 km3. The earlier events shown on figure 8 documents over 600 m of vertical change in the position of the crater floor or the tops of cinder cones on the floor.
Activity during 2008. Preceding the next eruption, increasing seismic activity and thermal alerts were seen during June to October 2008. On 7 August the color code was raised from Green to Yellow due to increased earthquakes and intermittent tremor. A thermal anomaly was registered over the volcano.
Beginning on 8 October observers noted an explosive-effusive summit eruption that included mainly Strombolian activity. On that day the color code was raised to Orange.
During October-November 2008 analysis of satellite imagery revealed a thermal anomaly in the crater. Lava began filling the crater. Nighttime observers saw the crater rim glowing and lava fountains at least 300 m tall. Extensive lava flows developed by late October (figure 9). From 28 October to 4 November bursting sounds from the volcano were heard in Klyuchi, about 30 km to the NE.
On 21 November 2008, lava flows advanced on the NW slope. They descended to 3 km elevation. Gas-and-steam plumes drifted 80 km NW on 24 November and 20-40 km SE during 25-26 November.
The mostly active period continued from late November 2008 to early January 2009. During 28 November-10 December, Strombolian activity ejected bombs 500 m above the crater and lava effusion on the NW flank continued. Analysis of satellite imagery revealed large daily thermal anomalies in the crater. On 8 December the front of the lava flow made contact with the thick portion of the Erman Glacier, causing phreatic bursts and mudflows (figure 10). A very similar process occurred during the 2007 eruption (BGVN 32:06), and the December line of descent was also the same as in 2007. During 8-10 December, ash plumes rose to altitudes of 7.5-8 km, and drifted about 700 km E.
During the final phase of the eruption (16 January-16 April 2009) the magnitude of volcanic tremor rapidly decreased. The volcano generated ash plumes extending 80-90 km to the NE. Fumarolic activity was seen during last days of April (figure 11).
As noted by Zharinov and Demyanchuk (2008), Shirokov (1985) studied the timing of Kliuchevskoi's volcanic eruptions with respect to lunar cycles. He found that eruptions were associated with a Moon-Earth rotational cycle of 18.6 years duration. According the Zharinov and Demyanchuk (2008), Shirokov (1985) forecast an eruptive interval during May 2006-May 2009.
References. Shirokov, V.A., 1985, Some questions method forecast flank eruption at Kliuchevskoi (Kamchatka): Volcanology and Seismology, no. 6, p. 48-58 (in Russian).
Zharinov, N.A., and Demyanchuk, Yu.V., 2008, The summit eruption of Kliuchevskoi volcano in 2007 (Kamchatka): Conference proceedings, dedicated to the day of volcanologists, on 27-29 March, 2008, Petropavlovsk-Kamchatsky: Insitute of Volcanology and Seismology, Far East Division, Russian Academy of Sciences, p. 81-89 (in Russian).
Geologic Background. Klyuchevskoy is the highest and most active volcano on the Kamchatka Peninsula. Since its origin about 6,000 years ago, this symmetrical, basaltic stratovolcano has produced frequent moderate-volume explosive and effusive eruptions without major periods of inactivity. It rises above a saddle NE of Kamen volcano and lies SE of the broad Ushkovsky massif. More than 100 flank eruptions have occurred during approximately the past 3,000 years, with most lateral craters and cones occurring along radial fissures between the unconfined NE-to-SE flanks of the conical volcano between 500 and 3,600 m elevation. Eruptions recorded since the late 17th century have resulted in frequent changes to the morphology of the 700-m-wide summit crater. These eruptions over the past 400 years have originated primarily from the summit crater, but have also included numerous major explosive and effusive eruptions from flank craters.
Information Contacts: Kamchatka Volcanic Eruptions Response Team (KVERT), Institute of Volcanology and Seismology (IVS), Kamchatka Branch of the Geophysical Service of the Russian Academy of Sciences (KB GS RAS), Far East Division, Russian Academy of Sciences, Piip Ave. 9, Petropavlovsk-Kamchatsky, 683006, Russia (URL: http://www.kscnet.ru/ivs/kvert/); Olga Girina and Yuri Demyanchuk, KVERT, Institute of Volcanology and Seismology (IVS); Alexei Ozerov, Active Volcanism Laboratory, Institute of Volcanology and Seismology (IVS).
Koryaksky
Russia
53.321°N, 158.712°E; summit elev. 3430 m
All times are local (unless otherwise noted)
Increased ash emissions during March and April 2009
Koryaksky ended ~ 51 years without fumarolic activity with an eruption late in 2008. Activity that began on about 24 December 2008 continued through 5 March 2009 (BGVN 34:01). Fresh ash deposits in early March could be seen on both the summit, E, and SSW slopes of Koryaksky, and on the NNW slope of Avachinsky (figure 4). Between the two volcanoes, the early March ash deposits reached 1-2 mm thick.
Numerous plumes were observed during this reporting interval, 6 March to mid-April 2009 (table 1). A report from 8-14 April noted the presence of two vents on the NW flank. A small SO2 plume was noted on 20 April. Seismicity often fluctuated, with considerable intervals at background level punctuated by intervals where it was elevated. Occasional tremor was recorded, but it was often weak (low amplitude).
Table 1. A compilation of eruptive plume behavior from Koryaksky based on information from the Yelizovo Airport, KVERT, and KEMSD (the Kamchatkan Experimental and Methodical Seismological Department). The data were initially compiled by the Tokyo VAAC in reports for aviators in an effort to avoid aircraft encounters with volcanic ash. Few of the plumes were considered ash rich, most were considered as gas plumes containing small amounts of ash. Courtesy of the Tokyo VAAC.
| Date |
Plume drift direction(s) |
Observations |
| 08 Mar 2009 |
-- |
Ash reported |
| 10 Mar 2009 |
SE |
Ash plume rose to 3.7 km |
| 11-12 and 15 Mar 2009 |
S, SE, E, and N |
Ash plumes rose to 3-5.2 km |
| 18 Mar-24 Mar 2009 |
E, S, SE, W, and NW |
Gas plumes containing a small amount of ash rose to 4 km. On satellite imagery plumes drifting up to 140 km away from the volcano. Ash was emitted from the upper fumarolic vent and covered the flanks. |
| 25 Mar-31 Mar 2009 |
-- |
Gas plumes containing a small amount of ash to 3-4 km. (On 25th and 26th, gas-and-ash plumes seen on satellite imagery drifting to 225 km SE.) |
| 01 Apr-07 Apr 2009 |
E, SE, S, and W |
Gas plumes containing a small amount of ash rose to 4 km. (During 27-28 and 31 March, and 1-2 April, gas-and-ash plumes were also seen on satellite imagery and drifted 313 km E, in southerly directions.) |
| 08 Apr-14 Apr 2009 |
NE, NW, SE, and SW |
Gas plumes containing a small amount of ash originating from two vents on the NW flank rose to an altitude of 5.4 km. Plumes were also seen on satellite imagery and drifted 290 km in multiple directions. On 11 April, KVERT staff reported ashfall in Petropavlovsk-Kamchatsky (30 km S). Ash accumulated to 0.1-2.5 cm thickness near the Institute of Volcanology and Seismology (IVS). |
| 15 Apr-21 Apr 2009 |
Multiple directions, including S, SW, W, NE |
Gas-and-ash plumes to 3.7-4.6 km altitude; on satellite imagery (drifting 30-680 km). |
| 17 Apr-18 Apr 2009 |
-- |
Gas plumes containing a small amount of ash drifted in multiple directions. Gas-and-ash plumes seen on satellite imagery drifted 100 km NE. (On 20 April a sulfur dioxide plume extended about 15 km.) |
KVERT reported that seismic activity at Koryaksky was elevated on 6 and 8 March and at background levels during 7 and 9-13 March. Observers reported that gas plumes containing a small amount of ash rose to an altitude of 4 km and drifted in multiple directions during the week of 11-17 March. The plumes were also seen on satellite imagery.
An eruption on 9 April 2009 followed an increase in the number of local earthquakes and tremor during the previous month (figure 5). The total number of earthquakes during February 2008-December 2008 was 717. That was less than the total of 766 for the first four months in 2009, which were as follows: January, 58; February, 195; March, 239; and April, 274. High level gas-steam and ash emissions occurred during March-April. Some plumes extended more than 200 km (table 1).
On 9 April a photo was taken showing a strong ash plume emerging from fissures in the glacier on Koryaksky's NW flank. On 13 April a flight over the area enabled scientists to measure temperature around two vents (figures 6 and 7). Temperatures of the vent areas reached 400°C. This situation was attributed to glacial instability owing to melting parts of the glacier near the vents.
Geologic Background. The large symmetrical Koryaksky stratovolcano is the most prominent landmark of the NW-trending Avachinskaya volcano group, which towers above Kamchatka's largest city, Petropavlovsk. Erosion has produced a ribbed surface on the eastern flanks of the 3430-m-high volcano; the youngest lava flows are found on the upper W flank and below SE-flank cinder cones. Extensive Holocene lava fields on the western flank were primarily fed by summit vents; those on the SW flank originated from flank vents. Lahars associated with a period of lava effusion from south- and SW-flank fissure vents about 3900-3500 years ago reached Avacha Bay. Only a few moderate explosive eruptions have occurred during historical time, but no strong explosive eruptions have been documented during the Holocene. Koryaksky's first historical eruption, in 1895, also produced a lava flow.
Information Contacts: Kamchatka Volcanic Eruptions Response Team (KVERT), Institute of Volcanology and Seismology (IV&S), Far East Division, Russian Academy of Sciences (FED RAS), Piip Ave. 9, Petropavlovsk-Kamchatsky, 683006, Russia (URL: http://www.kscnet.ru/ivs/); Kamchatka Branch of the Geophysical Service, Russian Academy of Sciences (KB GS RAS), Piip Ave. 9, Petropavlovsk-Kamchatsky, 683006, Russia (URL: http://www.emsd.ru/~ssl/monitoring/main.htm); Alexander Sokorenko and Sergey Ushakov, IV&S; Kamchatkan Experimental and Methodical Seismological Department (KEMSD), GS RAS, Russia; Tokyo Volcanic Ash Advisory Center (VAAC), Tokyo, Japan (URL: http://ds.data.jma.go.jp/svd/vaac/data/).
Masaya
Nicaragua
11.9844°N, 86.1688°W; summit elev. 594 m
All times are local (unless otherwise noted)
Phreatomagmatic explosions in August 2006; intermittent plumes through 2008
Our previous report on Masaya, in April 2006 (BGVN 31:04), summarized intermittent ash eruptions and continuing incandescence through March 2005. At that time, the visible SO2 gas emissions were the lowest seen, a condition attributed to the landslide of 2-3 March 2005 blocking the degassing vent. MODIS/MODVOLC data revealed only one pixel on 24 April 2006.
Activity during 2005-2006. The level of tremor slowly decreased from 20 RSAM units in April 2005 to 10 RSAM units a few months later. A short INETER report noted that there were no micro-earthquakes registered in October 2005. Tremor then stood at 15 RSAM (Real-time Seismic Amplitude Measurement) units, occurring with frequencies of 1.5 Hz. Gas fumes remained steady and strong. No activity was reported from April 2005 until 25-30 April 2006 when there was a small increase in emissions, with columns of gases rising ~ 100 m from the crater; there was also a strong odor of sulfur. During May, increased precipitation resulted in acid rains that burned the vegetation. In June, an observer reported a wall collapse in Santiago crater.
On the evening of 3 August 2006 seismic tremor began to increase, reaching approximately 130 RSAM units. This level was maintained throughout the next day; typically RSAM levels are at about 5 units. INETER volcanologists traveled to the volcano on 4 August and around 1030 observed two small phreatomagmatic explosions from the crater with dark gray ash. From the crater rim incandescence was seen at the bottom of the crater, and jet engine sounds could be heard. Civil Defense also reported that residents of Leon saw ash and gas emissions in the morning. Small amounts of ash fell in Cristo Rey, W of the volcano and in Las Marías to the N. Gas emissions remained strong on 4 August. Small explosions on the morning of 6 August again ejected ash. Activity decreased afterwards, with no further ash emissions and a drop in seismicity to 20 RSAM units. Minor gas emissions continued.
Overall during August 2006 the frequency of tremor shifted slightly from 1.5 to 2.0 Hz, which remained constant through August. Gas emissions increased in August 2006 at a point ~ 800 m from the cone. Gas emissions were released from the old crater as well. Temperatures at the San Fernando and Comalito cones remained unchanged. On 20 August, Martha Navarro (INETER) and Gustavo Chigna (INSIVUMEH, Guatemala), measured SO2 emissions with a COSPEC near El Crucero, (16 km W of the summit) and noted a level of ~ 900 tons of SO2 per day.
On 4 September 2006 tremor remained at 15 RSAM units, with frequencies of 1.5 Hz, a level that continued through October. Gas emissions remained constant, steady and strong. INETER reporting on 25 October 2006 discussed a new vent that opened on the floor of Santiago crater with a small lava lake. It displayed intense degassing. Following heavy rains, landslides spilled down the crater walls. Instability was noted at an overlook parking area.
Activity during 2007-2008. The Washington Volcanic Ash Advisory Center (VAAC) provided occasional reports of plumes from 26 April 2007 to 17 December 2008, predominately from GOES-12 satellite observations. Pilots and local residents also contributed observations through the VAAC and INETER.
A steam plume that drifted WSW on 26 April 2007 was visible on satellite imagery and a web camera. Additional plumes on 9 and 12 June, with little or no ash, were noted. No further plumes were reported until 24 December 2007, when a small diffuse plume, possibly containing ash, moved SW; a change in seismicity corresponded to the emission.
Pilots reported an ash plume on 29 April 2008 that was also seen in satellite imagery moving SW at 2.1 km altitude. An explosion on 18 June 2008 registered on the seismometer E of the volcano. The event discharged moderate quantities of gas and volcanic ash, and the resulting cloud was dark in color. Nearby inhabitants felt the explosion.
Satellite imagery during August 2008 revealed plumes described as steam on 12 August and gas on 18 August, both possibly containing ash. Similar plumes on 10 and 12 September drifted ENE. Pilots reported that on 9 October an ash plume rose to an altitude of 4.6 km and drifted NNE. Analysis of satellite imagery through the rest of 2008 showed possible diffuse ash and steam plumes to the SW and S on 4-5 November, a plume with possible ash on 2 December that moved SW, and a gas plume with possible ash to an altitude of 5.3-6.1 km on 17 December.
Geologic Background. Masaya volcano in Nicaragua has erupted frequently since the time of the Spanish Conquistadors, when an active lava lake prompted attempts to extract the volcano's molten "gold" until it was found to be basalt rock upon cooling. It lies within the massive Pleistocene Las Sierras caldera and is itself a broad, 6 x 11 km basaltic caldera with steep-sided walls up to 300 m high. The caldera is filled on its NW end by more than a dozen vents that erupted along a circular, 4-km-diameter fracture system. The Nindirí and Masaya cones, the source of observed eruptions, were constructed at the southern end of the fracture system and contain multiple summit craters, including the currently active Santiago crater. A major basaltic Plinian tephra erupted from Masaya about 6,500 years ago. Recent lava flows cover much of the caldera floor and there is a lake at the far eastern end. A lava flow from the 1670 eruption overtopped the north caldera rim. Periods of long-term vigorous gas emission at roughly quarter-century intervals have caused health hazards and crop damage.
Information Contacts: Wilfried Strauch, Virginia Tenorio, and Martha Navarro, Instituto Nicaraguense de Estudios Territoriales (INETER), Apartado Postal 2110, Managua, Nicaragua; Jaime Cardenas Masaya Volcano National Park, Gustavo Chigna (INSIVUMEH, Guatemala); Washington Volcanic Ash Advisory Center (VAAC), Satellite Analysis Branch (SAB), NOAA/NESDIS E/SP23, NOAA Science Center Room 401, 5200 Auth Rd, Camp Springs, MD 20746, USA (URL: http://www.ospo.noaa.gov/Products/atmosphere/vaac/).
Popocatepetl (Mexico) — March 2009 Cite this Report
Popocatepetl
Mexico
19.023°N, 98.622°W; summit elev. 5393 m
All times are local (unless otherwise noted)
Tremor, numerous earthquakes, and small ash plumes
Our most recent report on Popocatépetl (BGVN 32:04) described minor explosions, sporadic ash plumes, and lava dome growth during 2006 through April 2007. The current report discusses activity from April 2007 through April 2009, when many small ash plumes were noted.
From April 2007 through April 2009, the Centro Nacional de Prevencion de Desastres (CENAPRED) reported modest activity at Popocatépetl, consisting largely of numerous low intensity earthquakes and tremors (figures 54 and 55), and constant degassing of low intensity steam and gas, often accompanied by ash emissions of variable intensity. Based on information from the Mexico City Meteorological Watch Office (MWO), and the Washington Volcanic Ash Advisory Center (VAAC), there were 17 occasions when ash plumes rose at least 1 km above Popocatépetl's 5.4 km summit (table 19).
Table 19. Tabulation of ash plumes rising at least 1 km above Popocatépetl's summit between 1 April 2007 and 1 April 2009. Data provided by the Mexico City Meteorological Watch Office (MWO), and the Washington Volcanic Ash Advisory Center (VAAC) and a web camera operated by the Centro Nacional de Prevención de Desastres (CENAPRED).
| Date |
Plume altitude (km) |
Plume direction |
| 01 Apr 2007 |
7.6 |
NE |
| 28 Jun 2007 |
6.4 |
SSW |
| 28 Jul 2007 |
7 |
WSW |
| 01 Dec 2007 |
7.4-9.1 |
N, NE |
| 31 Dec 2007 |
7.4 |
E, SE |
| 05 Jan 2008 |
7.3 |
E, NE |
| 28 Jan 2008 |
8.6 |
NW |
| 12 Feb 2008 |
7 |
NE |
| 21-22 Feb 2008 |
7.4 |
NE |
| 08-09 Mar 2008 |
6.4 |
NE |
| 17 Mar 2008 |
7.4-7.9 |
NE |
| 17 Nov 2008 |
6.1 |
NW, WSW |
| 21 Jan 2009 |
7 |
E, NE |
| 22 Jan 2009 |
7.4 |
-- |
| 13 Feb 2009 |
7.2 |
NE |
| 23 Mar 2009 |
6.7 |
SE |
| 01 Apr 2009 |
6.4 |
-- |
According to information provided by the Mexican National University geologist Julie Roberge, the tremors lasted from minutes to hours and varied in frequency and amplitude, but were mostly of low amplitude. The microearthquakes were also of low magnitude (M 2-3) with variable depths; epicenters were typically within 10 km of the crater. Plumes consisting of gas, and gas and ash, and seismicity consisting of earthquakes and tremor varied during 2007 through April 2009 (figure 55).
According to Roberge and others (2009), the deep degassing observed in the ongoing eruption of Popocatépetl may indicate an essentially intrusive event, rather than a convective process. The hypothesis of deep magma degassing beneath Popocatépetl is consistent with observations regarding degassing at the summit that suggest separation of magma and gas at depth beneath the volcano. According to additional information provided us by Roberge, the high gas flux is not associated with processes in the central conduit. The volcano has an elliptical crater (600 m by 800 m). Most of the lava that formed domes was extruded through the crater's major central vent (about 30 m wide). However, several other vents were formed in the crater during the explosive events of 1995. These vents are aligned N-S, and the largest has been the site of long term degassing but only rare extrusion of lava. The smaller secondary vents are ephemeral and their activities depend on the explosive events that reopen them. Often, the most vigorous release of gas occurs from the E vent, and thus much of the degassing seems unrelated to the central vent and conduit from which the lava domes form.
Between April 2007 and April 2009, thermal anomalies at Popocatépetl were detected every month by MODVOLC. The number of thermal anomalies per month ranged from three to seventeen, mostly one pixel, but occasionally two pixels, and once three pixels.
As reported in BGVN 32:04, a lava dome irregularly growing since July 2005 covered the floor of the internal crater. People studying the volcano have lacked an image of the dome and crater since 2007, leaving its later status and volume uncertain.
Reference. Roberge, J., Delgado-Granados, H., and Wallace, P. 2009. Mafic magma recharge supplies high CO2 and SO2 gas fluxes from Popocatépetl volcano, Mexico: Geology v. 37, no. 2, pp. 107-110.
Geologic Background. Volcán Popocatépetl, whose name is the Aztec word for smoking mountain, rises 70 km SE of Mexico City to form North America's 2nd-highest volcano. The glacier-clad stratovolcano contains a steep-walled, 400 x 600 m wide crater. The generally symmetrical volcano is modified by the sharp-peaked Ventorrillo on the NW, a remnant of an earlier volcano. At least three previous major cones were destroyed by gravitational failure during the Pleistocene, producing massive debris-avalanche deposits covering broad areas to the south. The modern volcano was constructed south of the late-Pleistocene to Holocene El Fraile cone. Three major Plinian eruptions, the most recent of which took place about 800 CE, have occurred since the mid-Holocene, accompanied by pyroclastic flows and voluminous lahars that swept basins below the volcano. Frequent historical eruptions, first recorded in Aztec codices, have occurred since Pre-Columbian time.
Information Contacts: Centro Nacional de Prevencion de Desastres (CENEPRED), Av. Delfín Madrigal No.665. Coyoacan, México D.F. 04360, México (URL: https://www.gob.mx/cenapred/); Washington Volcanic Ash Advisory Center (VAAC), Satellite Analysis Branch (SAB), NOAA/NESDIS E/SP23, NOAA Science Center Room 401, 5200 Auth Road, Camp Springs, MD 20746, USA (URL: http://www.ospo.noaa.gov/Products/atmosphere/vaac/); Julie Roberge, Instituto de Geología, Dept. Geoquimíca, Universidad Nacional Autonóma de México (UNAM), Ciudad Universitaria, Coyoacán D.F.(Federal District of Mexico City) 04510, Mexico.
Reventador (Ecuador) — March 2009 Cite this Report
Reventador
Ecuador
0.077°S, 77.656°W; summit elev. 3562 m
All times are local (unless otherwise noted)
Lava extrudes down two flanks during November 2008-April 2009
Our previous report covered activity through early August 2008, a period that included extrusions of lava flows (BGVN 33:08). This report continues through late April 2009, including a hiatus for much of August into November 2008. In early November observers saw repeated small eruptions emitting plumes with generally minor ash, Strombolian eruptions, and lava flows down two flanks. What follows summarizes reports from the Instituto Geofísico-Escuela Politécnica Nacional (IG).
The last paragraph of the main section of this report discusses an important temporal and spatial correlation made at the volcano on 23 April 2009. The IG correlated satellite thermal data and ground-based observations with high tremor and acoustical noise.
An IG daily report issued 8 August 2008 noted a lack of movement in the lava flows and the emission of gas plumes without ash. That night, glow was observed from the crater. On 18 August, amid rainy conditions, a possible lahar was noted. Except for ongoing seismicity, relative calm prevailed until early November.
The IG noted glow from the crater the night of 7 November, an observation confirmed in satellite thermal data. At 1900 on 8 November high-amplitude seismic signals saturated the seismic stations. Local observers saw an ash-and-steam column that evening to 2 km above the crater. The ash content was moderate. Another IG report noted that in the settlements of Chaco and Quijos residents could hear strong explosions and see gas plumes with low ash content. A pilot report stated the plume blew NW and reached an approximate estimated altitude of 7.6 km.
Special Report 6 (9 November) included a plot of seismicity since 1 February 2007 (figure 29). Long-period (LP) earthquakes began to dominate in March 2008 and the large spike around 8-9 November 2008 was outstanding compared to the recent pattern. Another larger spike in seismicity had been seen during mid-March 2007, but it was composed of volcano-tectonic (VT) earthquakes.
A follow up report on 11 November stated that Reventador had discharged moderate strombolian explosions on 9-10 November, with ongoing lava flows on the N and S flanks of the central cone. Both the summit eruptions and the flank flows were conspicuous at night.
SO2 emissions were clear in Aura/OMI imagery of 9 and 10 November (figure 30). About a day later, Reventador calmed considerably (with seismicity dropping strongly after 1000 on 11 November). The escalating activity drove IG to install two more seismometers, two infrasonic sensors, and a monitoring camera.
The IG's Special Reports of 10 and 11 November (Numbers 7 and 8) offered further information. Lava flows had descended to below 2,600 m elevation (the summit is at 3,562 m elevation but the vent elevation was not stated). During the night of 9 November incandescent ejecta rose 100 m above the crater, along with continuous roars and canon-shot noises. Although light ash fell in Cayambe on 9 November, other towns in the region had not been affected. Strombolian emissions had calmed some on the night of 10 November. After 1000 on 11 November, both gas emissions and seismicity calmed.
Seismicity increased starting on 15 December 2008, and remained elevated through 8 January 2009. During 3-8 January there were almost constant gas emissions (with ash contents moderate to low), small-to-moderate explosions, and tremor lasting several hours. The tremor was accompanied by roaring noises and the ejection of blocks that landed near the summit. Explosions and emission tremors were of variable intensity, causing windows in nearby towns to vibrate. Ash rose 2 km above the summit and drifted W, causing ashfall in the towns of El Manzano, Choglontus, Palictahua, and Cahuají.
After 8 January 2009, the IG reported the steady decrease of seismic activity. There were a few explosions and water vapor emissions with low ash content reaching heights of 1-1.5 km above the crater. These plumes drifted W and SW, with reported minor ashfall in the towns mentioned above. Associated with these emissions, observers heard sporadic roaring noises. Seismic activity continued to decrease during the latter part of January 2009 and into February 2009. Although in mid-February 2009 there was a mild increase in seismicity, overall the level remained low. A single observation revealed the presence of a small column of steam and gas.
During 16-22 February seismic activity remained low, with few seismic events and signals associated with fluid movements at depth. The number of rockfalls was significant, even compared to that seen during cooling of the lava flow from November 2008. During this week there were various episodes of harmonic tremor and explosions. During 23 February-15 March 2009 there was a slight increase in the number of low-intensity seismic events attributed to fluids at depth. There was a later decrease in seismicity.
IG's 2009 Special Report Number 1 (26 March) noted a seismic increase on 26 March, which they again attributed to fluids moving within the volcanic edifice. After 1000 on the 26th, instruments detected a seismic swarm consisting of both LP and hybrid earthquakes, intercalated with banded tremor, the later of which had a 4-hour duration. From past experience, the IG inferred these signals could reflect the onset of new lava approaching the surface.
Special Report Number 2 (23 April) noted that later on the 26th the signals dropped off and remained low through at least early 23 April. Despite low seismicity, there were both episodes of banded tremor and intercalated LP earthquakes.
The tremor was of variable amplitudes, including some that saturated local seismic stations, particularly between 0500 and 0700 on 23 April 2009. On that day, a low, gas-rich cloud blew W from Reventador. Several residents living near the volcano also heard loud noises. A satellite-detected thermal hotspot on the volcano beginning at 0300 continued, with high intensity, between 0500 and 0700. The presence of the highest intensity thermal anomalies coincided with the highest tremor amplitudes and audible noises. Multiple MODVOLC thermal alerts were detected on 24-25 April and on 8 and 10 May 2009.
Geologic Background. Volcán El Reventador is the most frequently active of a chain of Ecuadorian volcanoes in the Cordillera Real, well east of the principal volcanic axis. The forested, dominantly andesitic stratovolcano has 4-km-wide avalanche scarp open to the E formed by edifice collapse. A young, unvegetated, cone rises from the amphitheater floor to a height comparable to the rim. It has been the source of numerous lava flows as well as explosive eruptions visible from Quito, about 90 km ESE. Frequent lahars in this region of heavy rainfall have left extensive deposits on the scarp slope. The largest recorded eruption took place in 2002, producing a 17-km-high eruption column, pyroclastic flows that traveled up to 8 km, and lava flows from summit and flank vents.
Information Contacts: Geophysical Institute (IG), Escuela Politécnica Nacional, Apartado 17-01-2759, Quito, Ecuador (URL: http://www.igepn.edu.ec/); Simon Carn, Dept of Geological and Mining Engineering and Sciences, Michigan Technological University, 1400 Townsend Dr., Houghton, MI 49931, USA (URL: https://so2.gsfc.nasa.gov/); Hawai'i Institute of Geophysics and Planetology (HIGP) Thermal Alerts System, School of Ocean and Earth Science and Technology (SOEST), Univ. of Hawai'i, 2525 Correa Road, Honolulu, HI 96822, USA (URL: http://modis.higp.hawaii.edu/).