Recently Published Bulletin Reports
Erebus (Antarctica) Lava lake remains active; most thermal alerts recorded since 2019
Rincon de la Vieja (Costa Rica) Frequent phreatic explosions during July-December 2023
Bezymianny (Russia) Explosion on 18 October 2023 sends ash plume 8 km high; lava flows and incandescent avalanches
Kilauea (United States) Low-level lava effusions in the lava lake at Halema’uma’u during July-December 2022
Nyamulagira (DR Congo) Lava flows and thermal activity during May-October 2023
Bagana (Papua New Guinea) Explosions, ash plumes, ashfall, and lava flows during April-September 2023
Mayon (Philippines) Lava flows, pyroclastic flows, ash emissions, and seismicity during April-September 2023
Nishinoshima (Japan) Eruption plumes and gas-and-steam plumes during May-August 2023
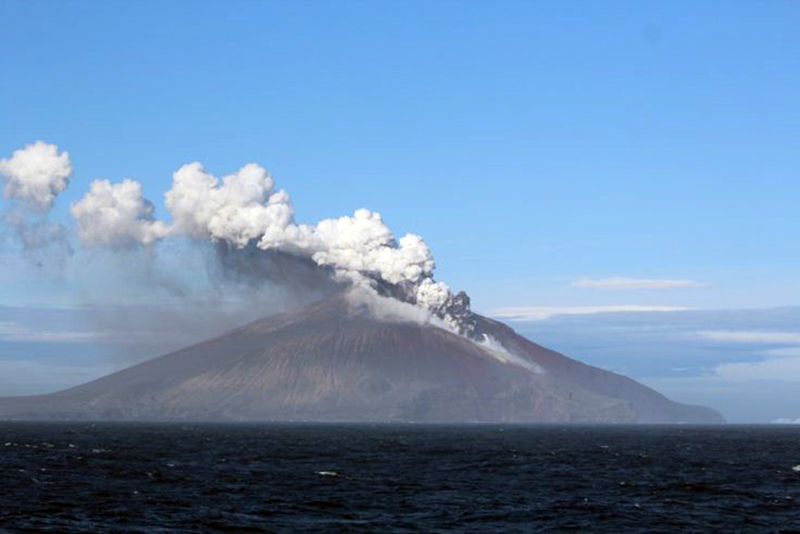
Krakatau (Indonesia) White gas-and-steam plumes and occasional ash plumes during May-August 2023
Villarrica (Chile) Strombolian activity, gas-and-ash emissions, and crater incandescence during April-September 2023
Merapi (Indonesia) Frequent incandescent avalanches during April-September 2023
Ebeko (Russia) Moderate explosive activity with ash plumes continued during June-November 2023
Erebus (Antarctica) — January 2024  Cite this Report
Erebus
Antarctica
77.53°S, 167.17°E; summit elev. 3794 m
All times are local (unless otherwise noted)
Lava lake remains active; most thermal alerts recorded since 2019
The lava lake in the summit crater of Erebus has been active since at least 1972. Located in Antarctica overlooking the McMurdo Station on Ross Island, it is the southernmost active volcano on the planet. Because of the remote location, activity is primarily monitored by satellites. This report covers activity during 2023.
The number of thermal alerts recorded by the Hawai'i Institute of Geophysics and Planetology’s MODVOLC Thermal Alerts System increased considerably in 2023 compared to the years 2020-2022 (table 9). In contrast to previous years, the MODIS instruments aboard the Aqua and Terra satellites captured data from Erebus every month during 2023. Consistent with previous years, the lowest number of anomalous pixels were recorded in January, November, and December.
Table 9. Number of monthly MODIS-MODVOLC thermal alert pixels recorded at Erebus during 2017-2023. See BGVN 42:06 for data from 2000 through 2016. The table was compiled using data provided by the HIGP – MODVOLC Thermal Alerts System.
| Year |
Jan |
Feb |
Mar |
Apr |
May |
Jun |
Jul |
Aug |
Sep |
Oct |
Nov |
Dec |
SUM |
| 2017 |
0 |
21 |
9 |
0 |
0 |
1 |
11 |
61 |
76 |
52 |
0 |
3 |
234 |
| 2018 |
0 |
21 |
58 |
182 |
55 |
17 |
137 |
172 |
103 |
29 |
0 |
0 |
774 |
| 2019 |
2 |
21 |
162 |
151 |
55 |
56 |
75 |
53 |
29 |
19 |
1 |
0 |
624 |
| 2020 |
0 |
2 |
16 |
18 |
4 |
4 |
1 |
3 |
18 |
3 |
1 |
6 |
76 |
| 2021 |
0 |
9 |
1 |
0 |
2 |
56 |
46 |
47 |
35 |
52 |
5 |
3 |
256 |
| 2022 |
1 |
13 |
55 |
22 |
15 |
32 |
39 |
19 |
31 |
11 |
0 |
0 |
238 |
| 2023 |
2 |
33 |
49 |
82 |
41 |
32 |
70 |
64 |
42 |
17 |
5 |
11 |
448 |
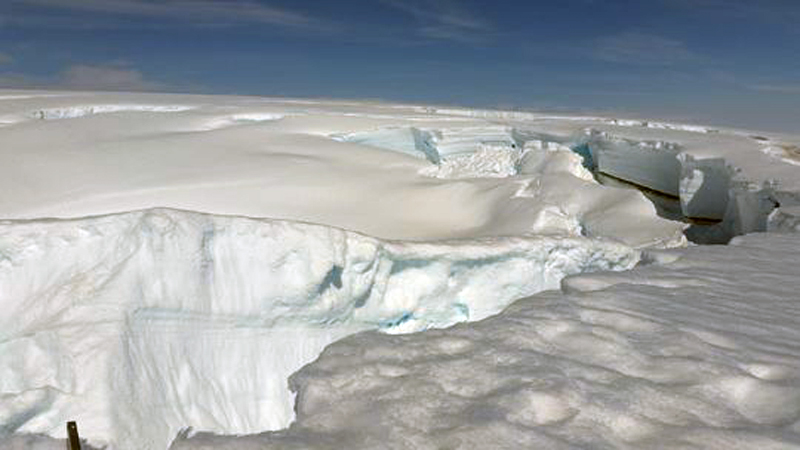
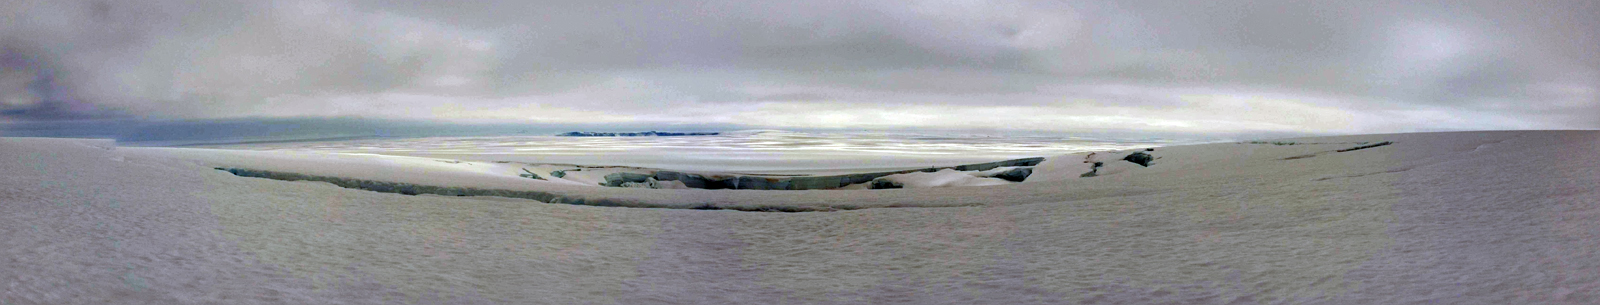
Sentinel-2 infrared images showed one or two prominent heat sources within the summit crater, accompanied by adjacent smaller sources, similar to recent years (see BGVN 46:01, 47:02, and 48:01). A unique image was obtained on 25 November 2023 by the OLI-2 (Operational Land Imager-2) on Landsat 9, showing the upper part of the volcano surrounded by clouds (figure 32).
Geologic Background. Mount Erebus, the world's southernmost historically active volcano, overlooks the McMurdo research station on Ross Island. It is the largest of three major volcanoes forming the crudely triangular Ross Island. The summit of the dominantly phonolitic volcano has been modified by one or two generations of caldera formation. A summit plateau at about 3,200 m elevation marks the rim of the youngest caldera, which formed during the late-Pleistocene and within which the modern cone was constructed. An elliptical 500 x 600 m wide, 110-m-deep crater truncates the summit and contains an active lava lake within a 250-m-wide, 100-m-deep inner crater; other lava lakes are sometimes present. The glacier-covered volcano was erupting when first sighted by Captain James Ross in 1841. Continuous lava-lake activity with minor explosions, punctuated by occasional larger Strombolian explosions that eject bombs onto the crater rim, has been documented since 1972, but has probably been occurring for much of the volcano's recent history.
Information Contacts: Hawai'i Institute of Geophysics and Planetology (HIGP) - MODVOLC Thermal Alerts System, School of Ocean and Earth Science and Technology (SOEST), Univ. of Hawai'i, 2525 Correa Road, Honolulu, HI 96822, USA (URL: http://modis.higp.hawaii.edu/); Copernicus Browser, Copernicus Data Space Ecosystem, European Space Agency (URL: https://dataspace.copernicus.eu/browser/); NASA Earth Observatory, EOS Project Science Office, NASA Goddard Space Flight Center, Goddard, Maryland, USA (URL: https://earthobservatory.nasa.gov/images/152134/erebus-breaks-through).
Rincon de la Vieja (Costa Rica) — January 2024 Cite this Report
Rincon de la Vieja
Costa Rica
10.83°N, 85.324°W; summit elev. 1916 m
All times are local (unless otherwise noted)
Frequent phreatic explosions during July-December 2023
Rincón de la Vieja is a volcanic complex in Costa Rica with a hot convecting acid lake that exhibits frequent weak phreatic explosions, gas-and-steam emissions, and occasional elevated sulfur dioxide levels (BGVN 45:10, 46:03, 46:11). The current eruption period began June 2021. This report covers activity during July-December 2023 and is based on weekly bulletins and occasional daily reports from the Observatorio Vulcanologico Sismologica de Costa Rica-Universidad Nacional (OVSICORI-UNA).
Numerous weak phreatic explosions continued during July-December 2023, along with gas-and-steam emissions and plumes that rose as high as 3 km above the crater rim. Many weekly OVSICORI-UNA bulletins included the previous week's number of explosions and emissions (table 9). For many explosions, the time of explosion was given (table 10). Frequent seismic activity (long-period earthquakes, volcano-tectonic earthquakes, and tremor) accompanied the phreatic activity.
Table 9. Number of reported weekly phreatic explosions and gas-and-steam emissions at Rincón de la Vieja, July-December 2023. Counts are reported for the week before the Weekly Bulletin date; not all reports included these data. Courtesy of OVSICORI-UNA.
| OVSICORI Weekly Bulletin |
Number of explosions |
Number of emissions |
| 28 Jul 2023 |
6 |
14 |
| 4 Aug 2023 |
10 |
12 |
| 1 Sep 2023 |
13 |
11 |
| 22 Sep 2023 |
12 |
13 |
| 29 Sep 2023 |
6 |
11 |
| 6 Oct 2023 |
12 |
5 |
| 13 Oct 2023 |
7 |
9 |
| 20 Oct 2023 |
1 |
15 |
| 27 Oct 2023 |
3 |
23 |
| 3 Nov 2023 |
3 |
10 |
| 17 Nov 2023 |
0 |
Some |
| 24 Nov 2023 |
0 |
14 |
| 8 Dec 2023 |
4 |
16 |
| 22 Dec 2023 |
8 |
18 |
Table 10. Summary of activity at Rincón de la Vieja during July-December 2023. Weak phreatic explosions and gas emissions are noted where the time of explosion was indicated in the weekly or daily bulletins. Height of plumes or emissions are distance above the crater rim. Courtesy of OVSICORI-UNA.
| Date |
Time |
Description of Activity |
| 1 Jul 2023 |
0156 |
Explosion. |
| 2 Jul 2023 |
0305 |
Explosion. |
| 4 Jul 2023 |
0229, 0635 |
Event at 0635 produced a gas-and-steam plume that rose 700 m and drifted W; seen by residents in Liberia (21 km SW). |
| 9 Jul 2023 |
1843 |
Explosion. |
| 21 Jul 2023 |
0705 |
Explosion. |
| 26 Jul 2023 |
1807 |
Explosion. |
| 28 Jul 2023 |
0802 |
Explosion generated a gas-and-steam plume that rose 500 m. |
| 30 Jul 2023 |
1250 |
Explosion. |
| 31 Jul 2023 |
2136 |
Explosion. |
| 11 Aug 2023 |
0828 |
Explosion. |
| 18 Aug 2023 |
1304 |
Explosion. |
| 21 Aug 2023 |
1224 |
Explosion generated gas-and-steam plumes rose 500-600 m. |
| 22 Aug 2023 |
0749 |
Explosion generated gas-and-steam plumes rose 500-600 m. |
| 24 Aug 2023 |
1900 |
Explosion. |
| 25 Aug 2023 |
0828 |
Event produced a steam-and-gas plume that rose 3 km and drifted NW. |
| 27-28 Aug 2023 |
0813 |
Four small events; the event at 0813 on 28 August lasted two minutes and generated a steam-and-gas plume that rose 2.5 km. |
| 1 Sep 2023 |
1526 |
Explosion generated plume that rose 2 km and ejected material onto the flanks. |
| 2-3 Sep 2023 |
- |
Small explosions detected in infrasound data. |
| 4 Sep 2023 |
1251 |
Gas-and-steam plume rose 1 km and drifted W. |
| 7 Nov 2023 |
1113 |
Explosion. |
| 8 Nov 2023 |
0722 |
Explosion. |
| 12 Nov 2023 |
0136 |
Small gas emissions. |
| 14 Nov 2023 |
0415 |
Small gas emissions. |
According to OVSICORI-UNA, during July-October the average weekly sulfur dioxide (SO2) flux ranged from 68 to 240 tonnes/day. However, in mid-November the flux increased to as high as 334 tonnes/day, the highest value measured in recent years. The high SO2 flux in mid-November was also detected by the TROPOMI instrument on the Sentinel-5P satellite (figure 43).
Geologic Background. Rincón de la Vieja, the largest volcano in NW Costa Rica, is a remote volcanic complex in the Guanacaste Range. The volcano consists of an elongated, arcuate NW-SE-trending ridge constructed within the 15-km-wide early Pleistocene Guachipelín caldera, whose rim is exposed on the south side. Sometimes known as the "Colossus of Guanacaste," it has an estimated volume of 130 km3 and contains at least nine major eruptive centers. Activity has migrated to the SE, where the youngest-looking craters are located. The twin cone of Santa María volcano, the highest peak of the complex, is located at the eastern end of a smaller, 5-km-wide caldera and has a 500-m-wide crater. A Plinian eruption producing the 0.25 km3 Río Blanca tephra about 3,500 years ago was the last major magmatic eruption. All subsequent eruptions, including numerous historical eruptions possibly dating back to the 16th century, have been from the prominent active crater containing a 500-m-wide acid lake located ENE of Von Seebach crater.
Information Contacts: Observatorio Vulcanológico Sismológica de Costa Rica-Universidad Nacional (OVSICORI-UNA), Apartado 86-3000, Heredia, Costa Rica (URL: http://www.ovsicori.una.ac.cr/); NASA Global Sulfur Dioxide Monitoring Page, Atmospheric Chemistry and Dynamics Laboratory, NASA Goddard Space Flight Center (NASA/GSFC), 8800 Greenbelt Road, Goddard MD 20771, USA (URL: https://so2.gsfc.nasa.gov/).
Bezymianny (Russia) — November 2023 Cite this Report
Bezymianny
Russia
55.972°N, 160.595°E; summit elev. 2882 m
All times are local (unless otherwise noted)
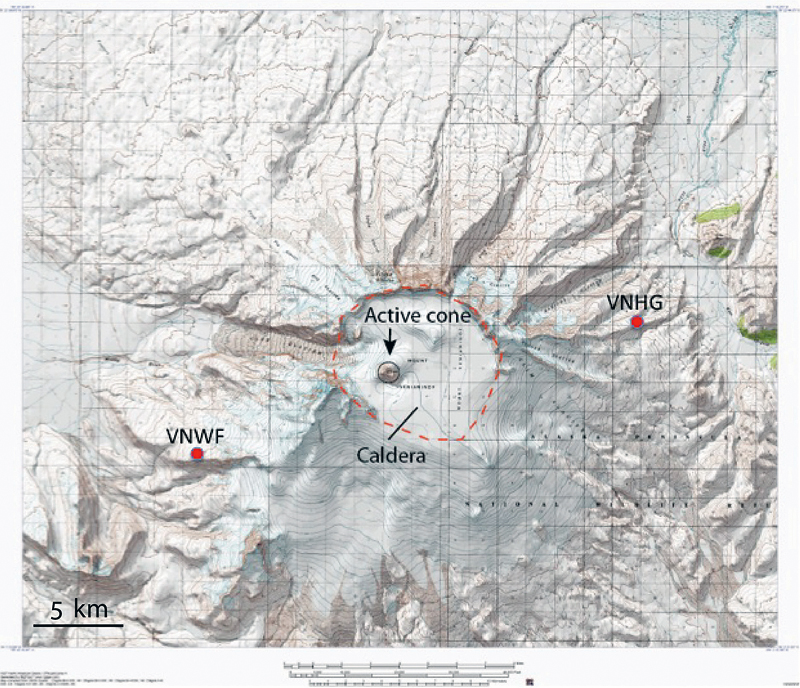
Explosion on 18 October 2023 sends ash plume 8 km high; lava flows and incandescent avalanches
Bezymianny, located on Russia’s Kamchatka Peninsula, has had eruptions since 1955 characterized by dome growth, explosions, pyroclastic flows, ash plumes, and ashfall. Activity during November 2022-April 2023 included gas-and-steam emissions, lava dome collapses generating avalanches, and persistent thermal activity. Similar eruptive activity continued from May through October 2023, described here based on information from weekly and daily reports of the Kamchatka Volcano Eruptions Response Team (KVERT), notices from Tokyo VAAC (Volcanic Ash Advisory Center), and from satellite data.
Overall activity decreased after the strong period of activity in late March through April 2023, which included ash explosions during 29 March and 7-8 April 2023 that sent plumes as high as 10-12 km altitude, along with dome growth and lava flows (BGVN 48:05). This reduced activity can be seen in the MIROVA thermal detection system graph (figure 56), which was consistent with data from the MODVOLC thermal detection system and with Sentinel-2 satellite images that showed persistent hotspots in the summit crater when conditions allowed observations. A renewed period of strong activity began in mid-October 2023.
Activity increased significantly on 17 October 2023 when large collapses began during 0700-0830 on the E flanks of the lava dome and continued to after 0930 the next day (figure 57). Ash plumes rose to an altitude of 4.5-5 km, extending 220 km NNE by 18 October. A large explosion at 1630 on 18 October produced an ash plume that rose to an altitude of 11 km (8 km above the summit) and drifted NNE and then NW, extending 900 km NW within two days at an altitude of 8 km. Minor ashfall was noted in Kozyrevsk (45 km WNW). At 0820 on 20 October an ash plume was identified in satellite images drifting 100 km ENE at altitudes of 4-4.5 km.
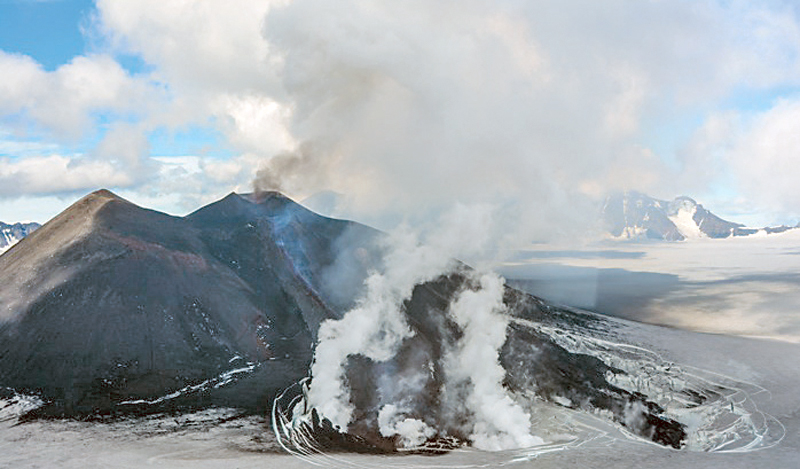
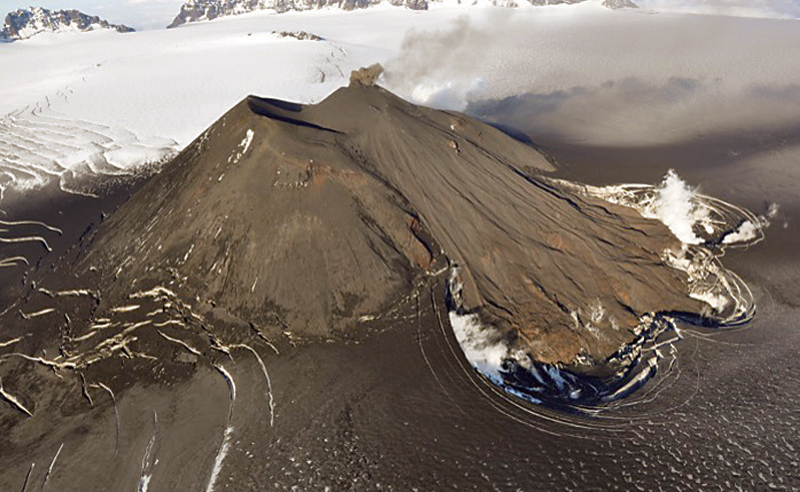
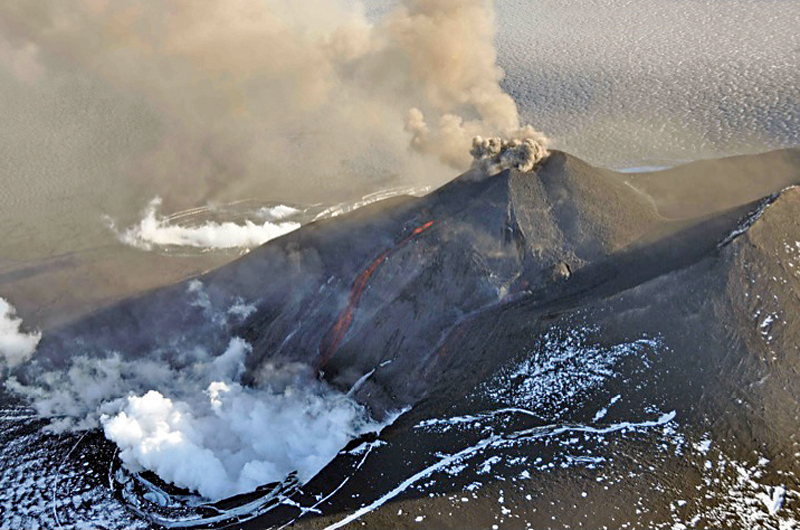
Lava flows and hot avalanches from the dome down the SE flank continued over the next few days, including 23 October when clear conditions allowed good observations (figures 58 and 59). A large thermal anomaly was observed over the volcano through 24 October, and in the summit crater on 30 October (figure 60). Strong fumarolic activity continued, with numerous avalanches and occasional incandescence. By the last week of October, volcanic activity had decreased to a level consistent with that earlier in the reporting period.
Aviation warnings were frequently updated during 17-20 October. KVERT issued a Volcano Observatory Notice for Aviation (VONA) on 17 October at 1419 and 1727 (0219 and 0527 UTC) raising the Aviation Color Code (ACC) from Yellow to Orange (second highest level). The next day, KVERT issued a VONA at 1705 (0505 UTC) raising the ACC to Red (highest level) but lowered it back to Orange at 2117 (0917 UTC). After another decrease to Yellow and back to Orange, the ACC was reduced to Yellow on 20 October at 1204 (0004 UTC). In addition, the Tokyo VAAC issued a series of Volcanic Ash Advisories beginning on 16 October and continuing through 30 October.
Geologic Background. The modern Bezymianny, much smaller than its massive neighbors Kamen and Kliuchevskoi on the Kamchatka Peninsula, was formed about 4,700 years ago over a late-Pleistocene lava-dome complex and an edifice built about 11,000-7,000 years ago. Three periods of intensified activity have occurred during the past 3,000 years. The latest period, which was preceded by a 1,000-year quiescence, began with the dramatic 1955-56 eruption. This eruption, similar to that of St. Helens in 1980, produced a large open crater that was formed by collapse of the summit and an associated lateral blast. Subsequent episodic but ongoing lava-dome growth, accompanied by intermittent explosive activity and pyroclastic flows, has largely filled the 1956 crater.
Information Contacts: Kamchatka Volcanic Eruptions Response Team (KVERT), Far Eastern Branch, Russian Academy of Sciences, 9 Piip Blvd., Petropavlovsk-Kamchatsky, 683006, Russia (URL: http://www.kscnet.ru/ivs/kvert/); Kamchatka Volcanological Station, Kamchatka Branch of Geophysical Survey, (KB GS RAS), Klyuchi, Kamchatka Krai, Russia (URL: http://volkstat.ru/); Tokyo Volcanic Ash Advisory Center (VAAC), 1-3-4 Otemachi, Chiyoda-ku, Tokyo 100-8122, Japan (URL: http://ds.data.jma.go.jp/svd/vaac/data/); Hawai'i Institute of Geophysics and Planetology (HIGP) - MODVOLC Thermal Alerts System, School of Ocean and Earth Science and Technology (SOEST), Univ. of Hawai'i, 2525 Correa Road, Honolulu, HI 96822, USA (URL: http://modis.higp.hawaii.edu/); MIROVA (Middle InfraRed Observation of Volcanic Activity), a collaborative project between the Universities of Turin and Florence (Italy) supported by the Centre for Volcanic Risk of the Italian Civil Protection Department (URL: http://www.mirovaweb.it/); Copernicus Browser, Copernicus Data Space Ecosystem, European Space Agency (URL: https://dataspace.copernicus.eu/browser/).chr
Kilauea (United States) — January 2023 Cite this Report
Kilauea
United States
19.421°N, 155.287°W; summit elev. 1222 m
All times are local (unless otherwise noted)
Low-level lava effusions in the lava lake at Halema’uma’u during July-December 2022
Kīlauea is the southeastern-most volcano in Hawaii and overlaps the E flank of the Mauna Loa volcano. Its East Rift Zone (ERZ) has been intermittently active for at least 2,000 years. An extended eruption period began in January 1983 and was characterized by open lava lakes and lava flows from the summit caldera and the East Rift Zone. During May 2018 magma migrated into the Lower East Rift Zone (LERZ) and opened 24 fissures along a 6-km-long NE-trending fracture zone that produced lava flows traveling in multiple directions. As lava emerged from the fissures, the lava lake at Halema'uma'u drained and explosions sent ash plumes to several kilometers altitude (BGVN 43:10).
The current eruption period started during September 2021 and has recently been characterized by lava effusions, spatter, and sulfur dioxide emissions in the active Halema’uma’u lava lake (BGVN 47:08). Lava effusions, some spatter, and sulfur dioxide emissions have continued during this reporting period of July through December 2022 using daily reports, volcanic activity notices, and abundant photo, map, and video data from the US Geological Survey's (USGS) Hawaiian Volcano Observatory (HVO).
Summary of activity during July-December 2022. Low-level effusions have continued at the western vent of the Halema’uma’u crater during July through early December 2022. Occasional weak ooze-outs (also called lava break outs) would occur along the margins of the crater floor. The overall level of the active lava lake throughout the reporting period gradually increased due to infilling, however it stagnated in mid-September (table 13). During September through November, activity began to decline, though lava effusions persisted at the western vent. By 9 December, the active part of the lava lake had completely crusted over, and incandescence was no longer visible.
Table 13. Summary of measurements taken during overflights at Kīlauea that show a gradual increase in the active lava lake level and the volume of lava effused since 29 September 2021. Lower activity was reported during September-October. Data collected during July-December 2022. Courtesy of HVO.
| Date: |
Level of the active lava lake (m): |
Cumulative volume of lava effused (million cubic meters): |
| 7 Jul 2022 |
130 |
95 |
| 19 Jul 2022 |
133 |
98 |
| 4 Aug 2022 |
136 |
102 |
| 16 Aug 2022 |
137 |
104 |
| 12 Sep 2022 |
143 |
111 |
| 5 Oct 2022 |
143 |
111 |
| 28 Oct 2022 |
143 |
111 |
Activity during July 2022. Lava effusions were reported from the western vent in the Halema’uma’u crater, along with occasional weak ooze-outs along the margins of the crater floor. The height of the lava lake was variable due to deflation-inflation tilt events; for example, the lake level dropped approximately 3-4 m during a summit deflation-inflation event reported on 1 July. Webcam images taken during the night of 6-12 July showed intermittent low-level spattering at the western vent that rose less than 10 m above the vent (figure 519). Measurements made during an overflight on 7 July indicated that the crater floor was infilled about 130 m and that 95 million cubic meters of lava had been effused since 29 September 2021. A single, relatively small lava ooze-out was active to the S of the lava lake. Around midnight on 8 July there were two brief periods of lava overflow onto the lake margins. On 9 July lava ooze-outs were reported near the SE and NE edges of the crater floor and during 10-11 July they occurred near the E, NE, and NW edges. On 16 July crater incandescence was reported, though the ooze-outs and spattering were not visible. On 18 July overnight webcam images showed incandescence in the western vent complex and two ooze-outs were reported around 0000 and 0200 on 19 July. By 0900 there were active ooze-outs along the SW edge of the crater floor. Measurements made from an overflight on 19 July indicated that the crater floor was infilled about 133 m and 98 million cubic meters of lava had erupted since 29 September 2021 (figure 520). On 20 July around 1600 active ooze-outs were visible along the N edge of the crater, which continued through the next day. Extensive ooze-outs occurred along the W margin during 24 July until 1900; on 26 July minor ooze-outs were noted along the N margin. Minor spattering was visible on 29 July along the E margin of the lake. The sulfur dioxide emission rates ranged 650-2,800 tons per day (t/d), the higher of which was measured on 8 July (figure 519).
Activity during August 2022. The eruption continued in the Halema’uma’u crater at the western vent. According to HVO the lava in the active lake remained at the level of the bounding levees. Occasional minor ooze-outs were observed along the margins of the crater floor. Strong nighttime crater incandescence was visible after midnight on 6 August over the western vent cone. During 6-7 August scattered small lava lobes were active along the crater floor and incandescence persisted above the western vent through 9 August. During 7-9 August HVO reported a single lava effusion source was active along the NW margin of the crater floor. Measurements from an overflight on 4 August indicated that the crater floor was infilled about 136 m total and that 102 million cubic meters of lava had been erupted since the start of the eruption. Lava breakouts were reported along the N, NE, E, S, and W margins of the crater during 10-16 August. Another overflight survey conducted on 16 August indicated that the crater floor infilled about 137 m and 104 million cubic meters of lava had been erupted since September 2021. Measured sulfur dioxide emissions rates ranged 1,150-2,450 t/d, the higher of which occurred on 8 August.
Activity during September 2022. During September, lava effusion continued from the western vent into the active lava lake and onto the crater floor. Intermittent minor ooze-outs were reported through the month. A small ooze-out was visible on the W crater floor margin at 0220 on 2 September, which showed decreasing surface activity throughout the day, but remained active through 3 September. On 3 September around 1900 a lava outbreak occurred along the NW margin of the crater floor but had stopped by the evening of 4 September. Field crews monitoring the summit lava lake on 9 September observed spattering on the NE margin of the lake that rose no higher than 10 m, before falling back onto the lava lake crust (figure 521). Overflight measurements on 12 September indicated that the crater floor was infilled a total of 143 m and 111 million cubic meters of lava had been erupted since September 2021. Extensive breakouts in the W and N part of the crater floor were reported at 1600 on 20 September and continued into 26 September. The active part of the lava lake dropped by 10 m while other parts of the crater floor dropped by several meters. Summit tiltmeters recorded a summit seismic swarm of more than 80 earthquakes during 1500-1800 on 21 September, which occurred about 1.5 km below Halema’uma’u; a majority of these were less than Mw 2. By 22 September the active part of the lava lake was infilled about 2 m. On 23 September the western vent areas exhibited several small spatter cones with incandescent openings, along with weak, sporadic spattering (figure 522). The sulfur dioxide emission rate ranged from 930 t/d to 2,000 t/d, the higher of which was measured on 6 September.
Activity during October 2022. Activity during October declined slightly compared to previous months, though lava effusions persisted from the western vent into the active lava lake and onto the crater floor during October (figure 523). Slight variations in the lava lake were noted throughout the month. HVO reported that around 0600 on 3 October the level of the lava lake has lowered slightly. Overflight measurements taken on 5 October indicated that the crater floor was infilled a total of about 143 m and that 111 million cubic meters of lava had been effused since September 2021. During 6-7 October the lake gradually rose 0.5 m. Sulfur dioxide measurements made on 22 October had an emission rate of 700 t/d. Another overflight taken on 28 October showed that there was little to no change in the elevation of the crater floor: the crater floor was infilled a total of 143 m and 111 million cubic meters of lava had erupted since the start of the eruption.
Activity during November 2022. Activity remained low during November, though HVO reported that lava from the western vent continued to effuse into the active lava lake and onto the crater floor throughout the month. The rate of sulfur dioxide emissions during November ranged from 300-600 t/d, the higher amount of which occurred on 9 November.
Activity during December 2022. Similar low activity was reported during December, with lava effusing from the western vent into the active lava lake and onto the crater floor. During 4-5 December the active part of the lava lake was slightly variable in elevation and fluctuated within 1 m. On 9 December HVO reported that lava was no longer erupting from the western vent in the Halema’uma’u crater and that sulfur dioxide emissions had returned to near pre-eruption background levels; during 10-11 December, the lava lake had completely crusted over, and no incandescence was visible (figure 524). Time lapse camera images covering the 4-10 December showed that the crater floor showed weak deflation and no inflation. Some passive events of crustal overturning were reported during 14-15 December, which brought fresh incandescent lava to the lake surface. The sulfur dioxide emission rate was approximately 200 t/d on 14 December. A smaller overturn event on 17 December and another that occurred around 0000 and into the morning of 20 December were also detected. A small seismic swarm was later detected on 30 December.
Geologic Background. Kilauea overlaps the E flank of the massive Mauna Loa shield volcano in the island of Hawaii. Eruptions are prominent in Polynesian legends; written documentation since 1820 records frequent summit and flank lava flow eruptions interspersed with periods of long-term lava lake activity at Halemaumau crater in the summit caldera until 1924. The 3 x 5 km caldera was formed in several stages about 1,500 years ago and during the 18th century; eruptions have also originated from the lengthy East and Southwest rift zones, which extend to the ocean in both directions. About 90% of the surface of the basaltic shield volcano is formed of lava flows less than about 1,100 years old; 70% of the surface is younger than 600 years. The long-term eruption from the East rift zone between 1983 and 2018 produced lava flows covering more than 100 km2, destroyed hundreds of houses, and added new coastline.
Information Contacts: Hawaiian Volcano Observatory (HVO), U.S. Geological Survey, PO Box 51, Hawai'i National Park, HI 96718, USA (URL: http://hvo.wr.usgs.gov/).
Nyamulagira (DR Congo) — November 2023 Cite this Report
Nyamulagira
DR Congo
1.408°S, 29.2°E; summit elev. 3058 m
All times are local (unless otherwise noted)
Lava flows and thermal activity during May-October 2023
Nyamulagira (also known as Nyamuragira) is a shield volcano in the Democratic Republic of Congo with the summit truncated by a small 2 x 2.3 km caldera with walls up to about 100 m high. Documented eruptions have occurred within the summit caldera, as well as from numerous flank fissures and cinder cones. The current eruption period began in April 2018 and has more recently been characterized by summit crater lava flows and thermal activity (BGVN 48:05). This report describes lava flows and variable thermal activity during May through October 2023, based on information from the Observatoire Volcanologique de Goma (OVG) and various satellite data.
Lava lake activity continued during May. The MIROVA (Middle InfraRed Observation of Volcanic Activity) system recorded moderate-to-strong thermal activity throughout the reporting period; activity was more intense during May and October and relatively weaker from June through September (figure 95). The MODVOLC thermal algorithm, detected a total of 209 thermal alerts. There were 143 hotspots detected during May, eight during June, nine during September, and 49 during October. This activity was also reflected in infrared satellite images, where a lava flow was visible in the NW part of the crater on 7 May and strong activity was seen in the center of the crater on 4 October (figure 96). Another infrared satellite image taken on 12 May showed still active lava flows along the NW margin of the crater. According to OVG lava effusions were active during 7-29 May and moved to the N and NW parts of the crater beginning on 9 May. Strong summit crater incandescence was visible from Goma (27 km S) during the nights of 17, 19, and 20 May (figure 97). On 17 May there was an increase in eruptive activity, which peaked at 0100 on 20 May. Notable sulfur dioxide plumes drifted NW and W during 19-20 May (figure 98). Drone footage acquired in partnership with the USGS (United States Geological Survey) on 20 May captured images of narrow lava flows that traveled about 100 m down the W flank (figure 99). Data from the Rumangabo seismic station indicated a decreasing trend in activity during 17-21 May. Although weather clouds prevented clear views of the summit, a strong thermal signature on the NW flank was visible in an infrared satellite image on 22 May, based on an infrared satellite image. On 28 May the lava flows on the upper W flank began to cool and solidify. By 29 May seismicity returned to levels similar to those recorded before the 17 May increase. Lava effusion continued but was confined to the summit crater; periodic crater incandescence was observed.
Low-level activity was noted during June through October. On 1 June OVG reported that seismicity remained at lower levels and that crater incandescence had been absent for three days, though infrared satellite imagery showed continued lava effusion in the summit crater. The lava flows on the flanks covered an estimated 0.6 km2. Satellite imagery continued to show thermal activity confined to the lava lake through October (figure 96), although no lava flows or significant sulfur dioxide emissions were reported.
Geologic Background. Africa's most active volcano, Nyamulagira (also known as Nyamuragira), is a massive high-potassium basaltic shield about 25 km N of Lake Kivu and 13 km NNW of the steep-sided Nyiragongo volcano. The summit is truncated by a small 2 x 2.3 km caldera that has walls up to about 100 m high. Documented eruptions have occurred within the summit caldera, as well as from the numerous flank fissures and cinder cones. A lava lake in the summit crater, active since at least 1921, drained in 1938, at the time of a major flank eruption. Recent lava flows extend down the flanks more than 30 km from the summit as far as Lake Kivu; extensive lava flows from this volcano have covered 1,500 km2 of the western branch of the East African Rift.
Information Contacts: Observatoire Volcanologique de Goma (OVG), Departement de Geophysique, Centre de Recherche en Sciences Naturelles, Lwiro, D.S. Bukavu, DR Congo; Hawai'i Institute of Geophysics and Planetology (HIGP) - MODVOLC Thermal Alerts System, School of Ocean and Earth Science and Technology (SOEST), Univ. of Hawai'i, 2525 Correa Road, Honolulu, HI 96822, USA (URL: http://modis.higp.hawaii.edu/); MIROVA (Middle InfraRed Observation of Volcanic Activity), a collaborative project between the Universities of Turin and Florence (Italy) supported by the Centre for Volcanic Risk of the Italian Civil Protection Department (URL: http://www.mirovaweb.it/); NASA Global Sulfur Dioxide Monitoring Page, Atmospheric Chemistry and Dynamics Laboratory, NASA Goddard Space Flight Center (NASA/GSFC), 8800 Greenbelt Road, Goddard, Maryland, USA (URL: https://so2.gsfc.nasa.gov/); Copernicus Browser, Copernicus Data Space Ecosystem, European Space Agency (URL: https://dataspace.copernicus.eu/browser/); Charles Balagizi, Goma Volcano Observatory, Departement de Geophysique, Centre de Recherche en Sciences Naturelles, Lwiro, D.S. Bukavu, DR Congo.
Bagana (Papua New Guinea) — October 2023 Cite this Report
Bagana
Papua New Guinea
6.137°S, 155.196°E; summit elev. 1855 m
All times are local (unless otherwise noted)
Explosions, ash plumes, ashfall, and lava flows during April-September 2023
The remote volcano of Bagana is located in central Bougainville Island, Papua New Guinea. Recorded eruptions date back to 1842 and activity has consisted of effusive activity that has built a small lava dome in the summit crater and occasional explosions that produced pyroclastic flows. The most recent eruption has been ongoing since February 2000 and has produced occasional explosions, ash plumes, and lava flows. More recently, activity has been characterized by ongoing effusive activity and ash emissions (BGVN 48:04). This report updates activity from April through September 2023 that has consisted of explosions, ash plumes, ashfall, and lava flows, using information from the Darwin Volcanic Ash Advisory Center (VAAC) and satellite data.
An explosive eruption was reported on 7 July that generated a large gas-and-ash plume to high altitudes and caused significant ashfall in local communities; the eruption plume had reached upper tropospheric (16-18 km altitude) altitudes by 2200, according to satellite images. Sulfur dioxide plumes were detected in satellite images on 8 July and indicated that the plume was likely a mixture of gas, ice, and ash. A report issued by the Autonomous Bougainville Government (ABG) (Torokina District, Education Section) on 10 July noted that significant ash began falling during 2000-2100 on 7 July and covered most areas in the Vuakovi, Gotana (9 km SW), Koromaketo, Laruma (25 km W) and Atsilima (27 km NW) villages. Pyroclastic flows also occurred, according to ground-based reports; small deposits confined to one drainage were inspected by RVO during an overflight on 17 July and were confirmed to be from the 7 July event. Ashfall continued until 10 July and covered vegetation, which destroyed bushes and gardens and contaminated rivers and streams.
RVO reported another eruption on 14 July. The Darwin VAAC stated that an explosive event started around 0830 on 15 July and produced an ash plume that rose to 16.5 km altitude by 1000 and drifted N, according to satellite images. The plume continued to drift N and remained visible through 1900, and by 2150 it had dissipated.
Ashfall likely from both the 7 and 15 July events impacted about 8,111 people in Torokina (20 km SW), including Tsito/Vuakovi, Gotana, Koromaketo, Kenaia, Longkogari, Kenbaki, Piva (13 km SW), and Atsinima, and in the Tsitovi district, according to ABG. Significant ashfall was also reported in Ruruvu (22 km N) in the Wakunai District of Central Bougainville, though the thickness of these deposits could not be confirmed. An evacuation was called for the villages in Wakunai, where heavy ashfall had contaminated water sources; the communities of Ruruvu, Togarau, Kakarapaia, Karauturi, Atao, and Kuritaturi were asked to evacuate to a disaster center at the Wakunai District Station, and communities in Torokina were asked to evacuate to the Piva District station. According to a news article, more than 7,000 people needed temporary accommodations, with about 1,000 people in evacuation shelters. Ashfall had deposited over a broad area, contaminating water supplies, affecting crops, and collapsing some roofs and houses in rural areas. Schools were temporarily shut down. Intermittent ash emissions continued through the end of July and drifted NNW, NW, and SW. Fine ashfall was reported on the coast of Torokina, and ash plumes also drifted toward Laruma and Atsilima.
A small explosive eruption occurred at 2130 on 28 July that ejected material from the crater vents, according to reports from Torokina, in addition to a lava flow that contained two lobes. A second explosion was detected at 2157. Incandescence from the lava flow was visible from Piva as it descended the W flank around 2000 on 29 July (figure 47). The Darwin VAAC reported that a strong thermal anomaly was visible in satellite images during 30-31 July and that ash emissions rose to 2.4 km altitude and drifted WSW on 30 July. A ground report from RVO described localized emissions at 0900 on 31 July.
The Darwin VAAC reported that ash plumes were identified in satellite imagery at 0800 and 1220 on 12 August and rose to 2.1 km and 3 km altitude and drifted NW and W, respectively. A news report stated that aid was sent to more than 6,300 people that were adversely affected by the eruption. Photos taken during 17-19 August showed ash emissions rising no higher than 1 km above the summit and drifting SE. A small explosion generated an ash plume during the morning of 19 August. Deposits from small pyroclastic flows were also captured in the photos. Satellite images captured lava flows and pyroclastic flow deposits. Two temporary seismic stations were installed near Bagana on 17 August at distances of 7 km WSW (Vakovi station) and 11 km SW (Kepox station). The Kepox station immediately started to record continuous, low-frequency background seismicity.
Satellite data. Little to no thermal activity was detected during April through mid-July 2023; only one anomaly was recorded during early April and one during early June, according to MIROVA (Middle InfraRed Observation of Volcanic Activity) data (figure 48). Thermal activity increased in both power and frequency during mid-July through September, although there were still some short gaps in detected activity. MODVOLC also detected increased thermal activity during August; thermal hotspots were detected a total of five times on 19, 20, and 27 August. Weak thermal anomalies were also captured in infrared satellite images on clear weather days throughout the reporting period on 7, 12, and 17 April, 27 May, 1, 6, 16, and 31 July, and 19 September (figure 48); a strong thermal anomaly was visible on 31 July. Distinct sulfur dioxide plumes that drifted generally NW were intermittently captured by the TROPOMI instrument on the Sentinel-5P satellite and sometimes exceeded two Dobson Units (DUs) (figure 49).
Geologic Background. Bagana volcano, in a remote portion of central Bougainville Island, is frequently active. This massive symmetrical cone was largely constructed by an accumulation of viscous andesitic lava flows. The entire edifice could have been constructed in about 300 years at its present rate of lava production. Eruptive activity is characterized by non-explosive effusion of viscous lava that maintains a small lava dome in the summit crater, although occasional explosive activity produces pyroclastic flows. Lava flows with tongue-shaped lobes up to 50 m thick and prominent levees descend the flanks on all sides.
Information Contacts: Rabaul Volcano Observatory (RVO), Geohazards Management Division, Department of Mineral Policy and Geohazards Management (DMPGM), PO Box 3386, Kokopo, East New Britain Province, Papua New Guinea; Darwin Volcanic Ash Advisory Centre (VAAC), Bureau of Meteorology, Northern Territory Regional Office, PO Box 40050, Casuarina, NT 0811, Australia (URL: http://www.bom.gov.au/info/vaac/); MIROVA (Middle InfraRed Observation of Volcanic Activity), a collaborative project between the Universities of Turin and Florence (Italy) supported by the Centre for Volcanic Risk of the Italian Civil Protection Department (URL: http://www.mirovaweb.it/); Hawai'i Institute of Geophysics and Planetology (HIGP) - MODVOLC Thermal Alerts System, School of Ocean and Earth Science and Technology (SOEST), Univ. of Hawai'i, 2525 Correa Road, Honolulu, HI 96822, USA (URL: http://modis.higp.hawaii.edu/); NASA Global Sulfur Dioxide Monitoring Page, Atmospheric Chemistry and Dynamics Laboratory, NASA Goddard Space Flight Center (NASA/GSFC), 8800 Greenbelt Road, Goddard, Maryland, USA (URL: https://so2.gsfc.nasa.gov/); Copernicus Browser, Copernicus Data Space Ecosystem, European Space Agency (URL: https://dataspace.copernicus.eu/browser/); Autonomous Bougainville Government, P.O Box 322, Buka, AROB, PNG (URL: https://abg.gov.pg/); Andrew Tupper (Twitter: @andrewcraigtupp); Simon Carn, Geological and Mining Engineering and Sciences, Michigan Technological University, 1400 Townsend Drive, Houghton, MI 49931, USA (URL: http://www.volcarno.com/, Twitter: @simoncarn); Radio NZ (URL: https://www.rnz.co.nz/news/pacific/494464/more-than-7-000-people-in-bougainville-need-temporary-accommodation-after-eruption); USAID, 1300 Pennsylvania Ave, NW, Washington DC 20004, USA (URL: https://www.usaid.gov/pacific-islands/press-releases/aug-08-2023-united-states-provides-immediate-emergency-assistance-support-communities-affected-mount-bagana-volcanic-eruptions).
Mayon (Philippines) — October 2023 Cite this Report
Mayon
Philippines
13.257°N, 123.685°E; summit elev. 2462 m
All times are local (unless otherwise noted)
Lava flows, pyroclastic flows, ash emissions, and seismicity during April-September 2023
Mayon is located in the Philippines and has steep upper slopes capped by a small summit crater. Historical eruptions date back to 1616 CE that have been characterized by Strombolian eruptions, lava flows, pyroclastic flows, and mudflows. Eruptions mostly originated from a central conduit. Pyroclastic flows and mudflows have commonly descended many of the approximately 40 drainages that surround the volcano. The most recent eruption occurred during June through October 2022 and consisted of lava dome growth and gas-and-steam emissions (BGVN 47:12). A new eruption was reported during late April 2023 and has included lava flows, pyroclastic density currents, ash emissions, and seismicity. This report covers activity during April through September 2023 based on daily bulletins from the Philippine Institute of Volcanology and Seismology (PHIVOLCS).
During April through September 2023, PHIVOLCS reported near-daily rockfall events, frequent volcanic earthquakes, and sulfur dioxide measurements. Gas-and-steam emissions rose 100-900 m above the crater and drifted in different directions. Nighttime crater incandescence was often visible during clear weather and was accompanied by incandescent avalanches of material. Activity notably increased during June when lava flows were reported on the S, SE, and E flanks (figure 52). The MIROVA graph (Middle InfraRed Observation of Volcanic Activity) showed strong thermal activity coincident with these lava flows, which remained active through September (figure 53). According to the MODVOLC thermal algorithm, a total of 110 thermal alerts were detected during the reporting period: 17 during June, 40 during July, 27 during August, and 26 during September. During early June, pyroclastic density currents (PDCs) started to occur more frequently.
Low activity was reported during much of April and May; gas-and-steam emissions rose 100-900 m above the crater and generally drifted in different directions. A total of 52 rockfall events and 18 volcanic earthquakes were detected during April and 147 rockfall events and 13 volcanic events during May. Sulfur dioxide flux measurements ranged between 400-576 tons per day (t/d) during April, the latter of which was measured on 29 April and between 162-343 t/d during May, the latter of which was measured on 13 May.
Activity during June increased, characterized by lava flows, pyroclastic density currents (PDCs), crater incandescence and incandescent rockfall events, gas-and-steam emissions, and continued seismicity. Weather clouds often prevented clear views of the summit, but during clear days, moderate gas-and-steam emissions rose 100-2,500 m above the crater and drifted in multiple directions. A total of 6,237 rockfall events and 288 volcanic earthquakes were detected. The rockfall events often deposited material on the S and SE flanks within 700-1,500 m of the summit crater and ash from the events drifted SW, S, SE, NE, and E. Sulfur dioxide emissions ranged between 149-1,205 t/d, the latter of which was measured on 10 June. Short-term observations from EDM and electronic tiltmeter monitoring indicated that the upper slopes were inflating since February 2023. Longer-term ground deformation parameters based on EDM, precise leveling, continuous GPS, and electronic tilt monitoring indicated that the volcano remained inflated, especially on the NW and SE flanks. At 1000 on 5 June the Volcano Alert Level (VAL) was raised to 2 (on a 0-5 scale). PHIVOLCS noted that although low-level volcanic earthquakes, ground deformation, and volcanic gas emissions indicated unrest, the steep increase in rockfall frequency may indicate increased dome activity.
A total of 151 dome-collapse PDCs occurred during 8-9 and 11-30 June, traveled 500-2,000 m, and deposited material on the S flank within 2 km of the summit crater. During 8-9 June the VAL was raised to 3. At approximately 1947 on 11 June lava flow activity was reported; two lobes traveled within 500 m from the crater and deposited material on the S (Mi-isi), SE (Bonga), and E (Basud) flanks. Weak seismicity accompanied the lava flow and slight inflation on the upper flanks. This lava flow remained active through 30 June, moving down the S and SE flank as far as 2.5 km and 1.8 km, respectively and depositing material up to 3.3 km from the crater. During 15-16 June traces of ashfall from the PDCs were reported in Sitio Buga, Nabonton, City of Ligao and Purok, and San Francisco, Municipality of Guinobatan. During 28-29 June there were two PDCs generated by the collapse of the lava flow front, which generated a light-brown ash plume 1 km high. Satellite monitors detected significant concentrations of sulfur dioxide beginning on 29 June. On 30 June PDCs primarily affected the Basud Gully on the E flank, the largest of which occurred at 1301 and lasted eight minutes, based on the seismic record. Four PDCs generated between 1800 and 2000 that lasted approximately four minutes each traveled 3-4 km on the E flank and generated an ash plume that rose 1 km above the crater and drifted N and NW. Ashfall was recorded in Tabaco City.
Similar strong activity continued during July; slow lava effusion remained active on the S and SE flanks and traveled as far as 2.8 km and 2.8 km, respectively and material was deposited as far as 4 km from the crater. There was a total of 6,983 rockfall events and 189 PDCs that affected the S, SE, and E flanks. The volcano network detected a total of 2,124 volcanic earthquakes. Continuous gas-and-steam emissions rose 200-2,000 m above the crater and drifted in multiple directions. Sulfur dioxide emissions averaged 792-4,113 t/d, the latter of which was measured on 28 July. During 2-4 July three PDCs were generated from the collapse of the lava flow and resulting light brown plumes rose 200-300 m above the crater. Continuous tremor pulses were reported beginning at 1547 on 3 July through 7 July at 1200, at 2300 on 8 July and going through 0300 on 10 July, and at 2300 on 16 July, as recorded by the seismic network. During 6-9 July there were 10 lava flow-collapse-related PDCs that generated light brown plumes 300-500 m above the crater. During 10-11 July light ashfall was reported in some areas of Mabinit, Legazpi City, Budiao and Salvacion, Daraga, and Camalig, Albay. By 18 July the lava flow advanced 600 m on the E flank as well.
During 1733 on 18 July and 0434 on 19 July PHIVOLCS reported 30 “ashing” events, which are degassing events accompanied by audible thunder-like sounds and entrained ash at the crater, which produced short, dark plumes that drifted SW. These events each lasted 20-40 seconds, and plume heights ranged from 150-300 m above the crater, as recorded by seismic, infrasound, visual, and thermal monitors. Three more ashing events occurred during 19-20 July. Short-term observations from electronic tilt and GPS monitoring indicate deflation on the E lower flanks in early July and inflation on the NW middle flanks during the third week of July. Longer-term ground deformation parameters from EDM, precise leveling, continuous GPS, and electronic tilt monitoring indicated that the volcano was still generally inflated relative to baseline levels. A short-lived lava pulse lasted 28 seconds at 1956 on 21 July, which was accompanied by seismic and infrasound signals. By 22 July, the only lava flow that remained active was on the SE flank, and continued to extend 3.4 km, while those on the S and E flanks weakened markedly. One ashing event was detected during 30-31 July, whereas there were 57 detected during 31 July-1 August; according to PHIVOLCS beginning at approximately 1800 on 31 July eruptive activity was dominated by phases of intermittent ashing, as well as increased in the apparent rates of lava effusion from the summit crater. The ashing phases consisted of discrete events recorded as low-frequency volcanic earthquakes (LFVQ) typically 30 seconds in duration, based on seismic and infrasound signals. Gray ash plume rose 100 m above the crater and generally drifted NE. Shortly after these ashing events began, new lava began to effuse rapidly from the crater, feeding the established flowed on the SE, E, and E flanks and generating frequent rockfall events.
Intensified unrest persisted during August. There was a total of 4,141 rockfall events, 2,881 volcanic earthquakes, which included volcanic tremor events, 32 ashing events, and 101 PDCs detected throughout the month. On clear weather days, gas-and-steam emissions rose 300-1,500 m above the crater and drifted in different directions (figure 54). Sulfur dioxide emissions averaged 735-4,756 t/d, the higher value of which was measured on 16 August. During 1-2 August the rate of lava effusion decreased, but continued to feed the flows on the SE, S, and E flanks, maintaining their advances to 3.4 km, 2.8 km, and 1.1 km from the crater, respectively (figure 55). Rockfall and PDCs generated by collapses at the lava flow margins and from the summit dome deposited material within 4 km of the crater. During 3-4 August there were 10 tremor events detected that lasted 1-4 minutes. Short-lived lava pulse lasted 35 seconds and was accompanied by seismic and infrasound signals at 0442 on 6 August. Seven collapses were recorded at the front of the lava flow during 12-14 August.
During September, similar activity of slow lava effusion, PDCs, gas-and-steam emissions, and seismicity continued. There was a total of 4,452 rockfall events, 329 volcanic earthquakes, which included volcanic tremor events, two ashing events, and 85 PDCs recorded throughout the month. On clear weather days, gas-and-steam emissions rose 100-1,500 m above the crater and drifted in multiple directions. Sulfur dioxide emissions averaged 609-2,252 t/d, the higher average of which was measured on 6 September. Slow lava effusion continued advancing on the SE, S, and E flanks, maintaining lengths of 3.4 km, 2.8 km, and 1.1 km, respectively. Rockfall and PDC events generated by collapses along the lava flow margins and at the summit dome deposited material within 4 km of the crater.
Geologic Background. Symmetrical Mayon, which rises above the Albay Gulf NW of Legazpi City, is the most active volcano of the Philippines. The steep upper slopes are capped by a small summit crater. Recorded eruptions since 1616 CE range from Strombolian to basaltic Plinian, with cyclical activity beginning with basaltic eruptions, followed by longer periods of andesitic lava flows. Eruptions occur predominately from the central conduit and have also produced lava flows that travel far down the flanks. Pyroclastic density currents and mudflows have commonly swept down many of the approximately 40 ravines that radiate from the summit and have often damaged populated lowland areas. A violent eruption in 1814 killed more than 1,200 people and devastated several towns.
Information Contacts: Philippine Institute of Volcanology and Seismology (PHIVOLCS), Department of Science and Technology, University of the Philippines Campus, Diliman, Quezon City, Philippines (URL: http://www.phivolcs.dost.gov.ph/); MIROVA (Middle InfraRed Observation of Volcanic Activity), a collaborative project between the Universities of Turin and Florence (Italy) supported by the Centre for Volcanic Risk of the Italian Civil Protection Department (URL: http://www.mirovaweb.it/); Hawai'i Institute of Geophysics and Planetology (HIGP) - MODVOLC Thermal Alerts System, School of Ocean and Earth Science and Technology (SOEST), Univ. of Hawai'i, 2525 Correa Road, Honolulu, HI 96822, USA (URL: http://modis.higp.hawaii.edu/); Copernicus Browser, Copernicus Data Space Ecosystem, European Space Agency (URL: https://dataspace.copernicus.eu/browser/); William Rogers, Legazpi City, Albay Province, Philippines.
Nishinoshima (Japan) — October 2023 Cite this Report
Nishinoshima
Japan
27.247°N, 140.874°E; summit elev. 100 m
All times are local (unless otherwise noted)
Eruption plumes and gas-and-steam plumes during May-August 2023
Nishinoshima, located about 1,000 km S of Tokyo, is a small island in the Ogasawara Arc in Japan. The island is the summit of a massive submarine volcano that has prominent submarine peaks to the S, W, and NE. Eruptions date back to 1973 and the current eruption period began in October 2022. Recent activity has consisted of small ash plumes and fumarolic activity (BGVN 48:07). This report covers activity during May through August 2023, using information from monthly reports of the Japan Meteorological Agency (JMA) monthly reports and satellite data.
Activity during May through June was relatively low. The Japan Coast Guard (JCG) did overflights on 14 and 22 June and reported white gas-and-steam emissions rising 600 m and 1,200 m from the central crater of the pyroclastic cone, respectively (figure 125). In addition, multiple white gas-and-steam emissions rose from the inner rim of the W side of the crater and from the SE flank of the pyroclastic cone. Discolored brown-to-green water was observed around almost the entire perimeter of the island; on 22 June light green discolored water was observed off the S coast of the island.
Observations from the Himawari meteorological satellite confirmed an eruption on 9 and 10 July. An eruption plume rose 1.6 km above the crater and drifted N around 1300 on 9 July. Satellite images acquired at 1420 and 2020 on 9 July and at 0220 on 10 July showed continuing emissions that rose 1.3-1.6 km above the crater and drifted NE and N. The Tokyo VAAC reported that an ash plume seen by a pilot and identified in a satellite image at 0630 on 21 July rose to 3 km altitude and drifted S.
Aerial observations conducted by JCG on 8 August showed a white-and-gray plume rising from the central crater of the pyroclastic cone, and multiple white gas-and-steam emissions were rising from the inner edge of the western crater and along the NW-SE flanks of the island (figure 126). Brown-to-green discolored water was also noted around the perimeter of the island.
Intermittent low-to-moderate power thermal anomalies were recorded in the MIROVA graph (Middle InfraRed Observation of Volcanic Activity), showing an increase in both frequency and power beginning in July (figure 127). This increase in activity coincides with eruptive activity on 9 and 10 July, characterized by eruption plumes. According to the MODVOLC thermal alert algorithm, one thermal hotspot was recorded on 20 July. Weak thermal anomalies were also detected in infrared satellite imagery, accompanied by strong gas-and-steam plumes (figure 128).
Geologic Background. The small island of Nishinoshima was enlarged when several new islands coalesced during an eruption in 1973-74. Multiple eruptions that began in 2013 completely covered the previous exposed surface and continued to enlarge the island. The island is the summit of a massive submarine volcano that has prominent peaks to the S, W, and NE. The summit of the southern cone rises to within 214 m of the ocean surface 9 km SSE.
Information Contacts: Japan Meteorological Agency (JMA), 1-3-4 Otemachi, Chiyoda-ku, Tokyo 100-8122, Japan (URL: http://www.jma.go.jp/jma/indexe.html); Tokyo Volcanic Ash Advisory Center (VAAC), 1-3-4 Otemachi, Chiyoda-ku, Tokyo 100-8122, Japan (URL: http://ds.data.jma.go.jp/svd/vaac/data/); MIROVA (Middle InfraRed Observation of Volcanic Activity), a collaborative project between the Universities of Turin and Florence (Italy) supported by the Centre for Volcanic Risk of the Italian Civil Protection Department (URL: http://www.mirovaweb.it/); Copernicus Browser, Copernicus Data Space Ecosystem, European Space Agency (URL: https://dataspace.copernicus.eu/browser/).
Krakatau (Indonesia) — October 2023 Cite this Report
Krakatau
Indonesia
6.1009°S, 105.4233°E; summit elev. 285 m
All times are local (unless otherwise noted)
White gas-and-steam plumes and occasional ash plumes during May-August 2023
Krakatau is located in the Sunda Strait between Java and Sumatra, Indonesia. Caldera collapse during the catastrophic 1883 eruption destroyed Danan and Perbuwatan cones and left only a remnant of Rakata. The post-collapse cone of Anak Krakatau (Child of Krakatau) was constructed within the 1883 caldera at a point between the former Danan and Perbuwatan cones; it has been the site of frequent eruptions since 1927. The current eruption period began in May 2021 and has recently consisted of Strombolian eruptions and ash plumes (BGVN 48:07). This report describes lower levels of activity consisting of ash and white gas-and-steam plumes during May through August 2023, based on information provided by the Indonesian Center for Volcanology and Geological Hazard Mitigation, referred to as Pusat Vulkanologi dan Mitigasi Bencana Geologi (PVMBG), MAGMA Indonesia, and satellite data.
Activity was relatively low during May and June. Daily white gas-and-steam emissions rose 25-200 m above the crater and drifted in different directions. Five ash plumes were detected at 0519 on 10 May, 1241 on 11 May, 0920 on 12 May, 2320 on 12 May, and at 0710 on 13 May, and rose 1-2.5 km above the crater and drifted SW. A webcam image taken on 12 May showed ejection of incandescent material above the vent. A total of nine ash plumes were detected during 6-11 June: at 1434 and 00220 on 6 and 7 June the ash plumes rose 500 m above the crater and drifted NW, at 1537 on 8 June the ash plume rose 1 km above the crater and drifted SW, at 0746 and at 0846 on 9 June the ash plumes rose 800 m and 3 km above the crater and drifted SW, respectively, at 0423, 1431, and 1750 on 10 June the ash plumes rose 2 km, 1.5 km, and 3.5 km above the crater and drifted NW, respectively, and at 0030 on 11 June an ash plume rose 2 km above the crater and drifted NW. Webcam images taken on 10 and 11 June at 0455 and 0102, respectively, showed incandescent material ejected above the vent. On 19 June an ash plume at 0822 rose 1.5 km above the crater and drifted SE.
Similar low activity of white gas-and-steam emissions and few ash plumes were reported during July and August. Daily white gas-and-steam emissions rose 25-300 m above the crater and drifted in multiple directions. Three ash plumes were reported at 0843, 0851, and 0852 on 20 July that rose 500-2,000 m above the crater and drifted NW.
The MIROVA (Middle InfraRed Observation of Volcanic Activity) graph of MODIS thermal anomaly data showed intermittent low-to-moderate power thermal anomalies during May through August 2023 (figure 140). Although activity was often obscured by weather clouds, a thermal anomaly was visible in an infrared satellite image of the crater on 12 May, accompanied by an eruption plume that drifted SW (figure 141).
Geologic Background. The renowned Krakatau (frequently mis-named as Krakatoa) volcano lies in the Sunda Strait between Java and Sumatra. Collapse of an older edifice, perhaps in 416 or 535 CE, formed a 7-km-wide caldera. Remnants of that volcano are preserved in Verlaten and Lang Islands; subsequently the Rakata, Danan, and Perbuwatan cones were formed, coalescing to create the pre-1883 Krakatau Island. Caldera collapse during the catastrophic 1883 eruption destroyed Danan and Perbuwatan, and left only a remnant of Rakata. This eruption caused more than 36,000 fatalities, most as a result of tsunamis that swept the adjacent coastlines of Sumatra and Java. Pyroclastic surges traveled 40 km across the Sunda Strait and reached the Sumatra coast. After a quiescence of less than a half century, the post-collapse cone of Anak Krakatau (Child of Krakatau) was constructed within the 1883 caldera at a point between the former Danan and Perbuwatan cones. Anak Krakatau has been the site of frequent eruptions since 1927.
Information Contacts: Pusat Vulkanologi dan Mitigasi Bencana Geologi (PVMBG, also known as Indonesian Center for Volcanology and Geological Hazard Mitigation, CVGHM), Jalan Diponegoro 57, Bandung 40122, Indonesia (URL: http://www.vsi.esdm.go.id/); MAGMA Indonesia, Kementerian Energi dan Sumber Daya Mineral (URL: https://magma.esdm.go.id/v1); MIROVA (Middle InfraRed Observation of Volcanic Activity), a collaborative project between the Universities of Turin and Florence (Italy) supported by the Centre for Volcanic Risk of the Italian Civil Protection Department (URL: http://www.mirovaweb.it/); Copernicus Browser, Copernicus Data Space Ecosystem, European Space Agency (URL: https://dataspace.copernicus.eu/browser/).
Villarrica (Chile) — October 2023 Cite this Report
Villarrica
Chile
39.42°S, 71.93°W; summit elev. 2847 m
All times are local (unless otherwise noted)
Strombolian activity, gas-and-ash emissions, and crater incandescence during April-September 2023
Villarrica, in central Chile, consists of a 2-km-wide caldera that formed about 3,500 years ago and is located at the base of the presently active cone at the NW margin of a 6-km-wide caldera. Historical eruptions eruptions date back to 1558 and have been characterized by mild-to-moderate explosive activity with occasional lava effusions. The current eruption period began in December 2014 and has recently consisted of nighttime crater incandescence, ash emissions, and seismicity (BGVN 48:04). This report covers activity during April through September 2023 and describes occasional Strombolian activity, gas-and-ash emissions, and nighttime crater incandescence. Information for this report primarily comes from the Southern Andes Volcano Observatory (Observatorio Volcanológico de Los Andes del Sur, OVDAS), part of Chile's National Service of Geology and Mining (Servicio Nacional de Geología y Minería, SERNAGEOMIN) and satellite data.
Seismicity during April consisted of long period (LP) events and tremor (TRE); a total of 9,413 LP-type events and 759 TR-type events were detected throughout the month. Nighttime crater incandescence persisted and was visible in the degassing column. Sulfur dioxide data was obtained using Differential Absorption Optical Spectroscopy Equipment (DOAS) that showed an average value of 1,450 ± 198 tons per day (t/d) during 1-15 April and 1,129 ± 201 t/d during 16-30 April, with a maximum daily value of 2,784 t/d on 9 April. Gas-and-steam emissions of variable intensities rose above the active crater as high as 1.3 km above the crater on 13 April. Strombolian explosions were not observed and there was a slight decrease in the lava lake level.
There were 14,123 LP-type events and 727 TR-type events detected during May. According to sulfur dioxide measurements taken with DOAS equipment, the active crater emitted an average value of 1,826 ± 482 t/d during 1-15 May and 912 ± 41 t/d during 16-30 May, with a daily maximum value of 5,155 t/d on 13 May. Surveillance cameras showed continuous white gas-and-steam emissions that rose as high as 430 m above the crater on 27 May. Nighttime incandescence illuminated the gas column less than 300 m above the crater rim was and no pyroclastic emissions were reported. A landslide was identified on 13 May on the E flank of the volcano 50 m from the crater rim and extending 300 m away; SERNAGEOMIN noted that this event may have occurred on 12 May. During the morning of 27 and 28 May minor Strombolian explosions characterized by incandescent ejecta were recorded at the crater rim; the last reported Strombolian explosions had occurred at the end of March.
Seismic activity during June consisted of five volcano-tectonic (VT)-type events, 21,606 LP-type events, and 2,085 TR-type events. The average value of sulfur dioxide flux obtained by DOAS equipment was 1,420 ± 217 t/d during 1-15 June and 2,562 ± 804 t/d, with a maximum daily value of 4,810 t/d on 17 June. White gas-and-steam emissions rose less than 480 m above the crater; frequent nighttime crater incandescence was reflected in the degassing plume. On 12 June an emission rose 100 m above the crater and drifted NNW. On 15 June one or several emissions resulted in ashfall to the NE as far as 5.5 km from the crater, based on a Skysat satellite image. Several Strombolian explosions occurred within the crater; activity on 15 June was higher energy and ejected blocks 200-300 m on the NE slope. Surveillance cameras showed white gas-and-steam emissions rising 480 m above the crater on 16 June. On 19 and 24 June low-intensity Strombolian activity was observed, ejecting material as far as 200 m from the center of the crater to the E.
During July, seismicity included 29,319 LP-type events, 3,736 TR-type events, and two VT-type events. DOAS equipment recorded two days of sulfur dioxide emissions of 4,220 t/d and 1,009 t/d on 1 and 13 July, respectively. Constant nighttime incandescence was also recorded and was particularly noticeable when accompanied by eruptive columns on 12 and 16 July. Minor explosive events were detected in the crater. According to Skysat satellite images taken on 12, 13, and 16 July, ashfall deposits were identified 155 m S of the crater. According to POVI, incandescence was visible from two vents on the crater floor around 0336 on 12 July. Gas-and-ash emissions rose as high as 1.2 km above the crater on 13 July and drifted E and NW. A series of gas-and-steam pulses containing some ash deposited material on the upper E flank around 1551 on 13 July. During 16-31 July, average sulfur dioxide emissions of 1,679 ± 406 t/d were recorded, with a maximum daily value of 2,343 t/d on 28 July. Fine ash emissions were also reported on 16, 17, and 23 July.
Seismicity persisted during August, characterized by 27,011 LP-type events, 3,323 TR-type events, and three VT-type events. The average value of sulfur dioxide measurements taken during 1-15 August was 1,642 ± 270 t/d and 2,207 ± 4,549 t/d during 16-31 August, with a maximum daily value of 3,294 t/d on 27 August. Nighttime crater incandescence remained visible in degassing columns. White gas-and-steam emissions rose 480 m above the crater on 6 August. According to a Skysat satellite image from 6 August, ash accumulation was observed proximal to the crater and was mainly distributed toward the E slope. White gas-and-steam emissions rose 320 m above the crater on 26 August. Nighttime incandescence and Strombolian activity that generated ash emissions were reported on 27 August.
Seismicity during September was characterized by five VT-type events, 12,057 LP-type events, and 2,058 TR-type events. Nighttime incandescence persisted. On 2 September an ash emission rose 180 m above the crater and drifted SE at 1643 (figure 125) and a white gas-and-steam plume rose 320 m above the crater. According to the Buenos Aires VAAC, periods of continuous gas-and-ash emissions were visible in webcam images from 1830 on 2 September to 0110 on 3 September. Strombolian activity was observed on 2 September and during the early morning of 3 September, the latter event of which generated an ash emission that rose 60 m above the crater and drifted 100 m from the center of the crater to the NE and SW. Ashfall was reported to the SE and S as far as 750 m from the crater. The lava lake was active during 3-4 September and lava fountaining was visible for the first time since 26 March 2023, according to POVI. Fountains captured in webcam images at 2133 on 3 September and at 0054 on 4 September rose as high as 60 m above the crater rim and ejected material onto the upper W flank. Sulfur dioxide flux of 1,730 t/d and 1,281 t/d was measured on 3 and 4 September, respectively, according to data obtained by DOAS equipment.
Strong Strombolian activity and larger gas-and-ash plumes were reported during 18-20 September. On 18 September activity was also associated with energetic LP-type events and notable sulfur dioxide fluxes (as high as 4,277 t/d). On 19 September Strombolian activity and incandescence were observed. On 20 September at 0914 ash emissions rose 50 m above the crater and drifted SSE, accompanied by Strombolian activity that ejected material less than 100 m SSE, causing fall deposits on that respective flank. SERNAGEOMIN reported that a Planet Scope satellite image taken on 20 September showed the lava lake in the crater, measuring 32 m x 35 m and an area of 0.001 km2. Several ash emissions were recorded at 0841, 0910, 1251, 1306, 1312, 1315, and 1324 on 23 September and rose less than 150 m above the crater. The sulfur dioxide flux value was 698 t/d on 23 September and 1,097 t/d on 24 September. On 24 September the Volcanic Alert Level (VAL) was raised to Orange (the third level on a four-color scale). SENAPRED maintained the Alert Level at Yellow (the middle level on a three-color scale) for the communities of Villarrica, Pucón (16 km N), Curarrehue, and Panguipulli.
During 24-25 September there was an increase in seismic energy (observed at TR-events) and acoustic signals, characterized by 1 VT-type event, 213 LP-type events, and 124 TR-type events. Mainly white gas-and-steam emissions, in addition to occasional fine ash emissions were recorded. During the early morning of 25 September Strombolian explosions were reported and ejected material 250 m in all directions, though dominantly toward the NW. On 25 September the average value of sulfur dioxide flux was 760 t/d. Seismicity during 25-30 September consisted of five VT-type events, 1,937 LP-type events, and 456 TR-type events.
During 25-29 September moderate Strombolian activity was observed and ejected material as far as the crater rim. In addition, ash pulses lasting roughly 50 minutes were observed around 0700 and dispersed ENE. During 26-27 September a TR episode lasted 6.5 hours and was accompanied by discrete acoustic signals. Satellite images from 26 September showed a spatter cone on the crater floor with one vent that measured 10 x 14 m and a smaller vent about 35 m NE of the cone. SERNAGEOMIN reported an abundant number of bomb-sized blocks up to 150 m from the crater, as well as impact marks on the snow, which indicated explosive activity. A low-altitude ash emission was observed drifting NW around 1140 on 28 September, based on webcam images. Between 0620 and 0850 on 29 September an ash emission rose 60 m above the crater and drifted NW. During an overflight taken around 1000 on 29 September scientists observed molten material in the vent, a large accumulation of pyroclasts inside the crater, and energetic degassing, some of which contained a small amount of ash. Block-sized pyroclasts were deposited on the internal walls and near the crater, and a distal ash deposit was also visible. The average sulfur dioxide flux measured on 28 September was 344 t/d. Satellite images taken on 29 September ashfall was deposited roughly 3 km WNW from the crater and nighttime crater incandescence remained visible. The average sulfur dioxide flux value from 29 September was 199 t/d. On 30 September at 0740 a pulsating ash emission rose 1.1 km above the crater and drifted NNW (figure 126). Deposits on the S flank extended as far as 4.5 km from the crater rim, based on satellite images from 30 September.
Infrared MODIS satellite data processed by MIROVA (Middle InfraRed Observation of Volcanic Activity) showed intermittent thermal activity during April through September, with slightly stronger activity detected during late September (figure 127). Small clusters of thermal activity were detected during mid-June, early July, early August, and late September. According to the MODVOLC thermal alert system, a total of four thermal hotspots were detected on 7 July and 3 and 23 September. This activity was also intermittently captured in infrared satellite imagery on clear weather days (figure 128).
Geologic Background. The glacier-covered Villarrica stratovolcano, in the northern Lakes District of central Chile, is ~15 km south of the city of Pucon. A 2-km-wide caldera that formed about 3,500 years ago is located at the base of the presently active, dominantly basaltic to basaltic andesite cone at the NW margin of a 6-km-wide Pleistocene caldera. More than 30 scoria cones and fissure vents are present on the flanks. Plinian eruptions and pyroclastic flows that have extended up to 20 km from the volcano were produced during the Holocene. Lava flows up to 18 km long have issued from summit and flank vents. Eruptions documented since 1558 CE have consisted largely of mild-to-moderate explosive activity with occasional lava effusion. Glaciers cover 40 km2 of the volcano, and lahars have damaged towns on its flanks.
Information Contacts: Servicio Nacional de Geología y Minería (SERNAGEOMIN), Observatorio Volcanológico de Los Andes del Sur (OVDAS), Avda Sta María No. 0104, Santiago, Chile (URL: http://www.sernageomin.cl/); Proyecto Observación Villarrica Internet (POVI) (URL: http://www.povi.cl/); Sistema y Servicio Nacional de Prevención y Repuesta Ante Desastres (SENAPRED), Av. Beauchef 1671, Santiago, Chile (URL: https://web.senapred.cl/); Buenos Aires Volcanic Ash Advisory Center (VAAC), Servicio Meteorológico Nacional-Fuerza Aérea Argentina, 25 de mayo 658, Buenos Aires, Argentina (URL: http://www.smn.gov.ar/vaac/buenosaires/inicio.php); MIROVA (Middle InfraRed Observation of Volcanic Activity), a collaborative project between the Universities of Turin and Florence (Italy) supported by the Centre for Volcanic Risk of the Italian Civil Protection Department (URL: http://www.mirovaweb.it/); Hawai'i Institute of Geophysics and Planetology (HIGP) - MODVOLC Thermal Alerts System, School of Ocean and Earth Science and Technology (SOEST), Univ. of Hawai'i, 2525 Correa Road, Honolulu, HI 96822, USA (URL: http://modis.higp.hawaii.edu/); Copernicus Browser, Copernicus Data Space Ecosystem, European Space Agency (URL: https://dataspace.copernicus.eu/browser/).
Merapi (Indonesia) — October 2023 Cite this Report
Merapi
Indonesia
7.54°S, 110.446°E; summit elev. 2910 m
All times are local (unless otherwise noted)
Frequent incandescent avalanches during April-September 2023
Merapi, located just north of the major city of Yogyakarta in central Java, Indonesia, has had activity within the last 20 years characterized by pyroclastic flows and lahars accompanying growth and collapse of the steep-sided active summit lava dome. The current eruption period began in late December 2020 and has more recently consisted of ash plumes, intermittent incandescent avalanches of material, and pyroclastic flows (BGVN 48:04). This report covers activity during April through September 2023, based on information from Balai Penyelidikan dan Pengembangan Teknologi Kebencanaan Geologi (BPPTKG), the Center for Research and Development of Geological Disaster Technology, a branch of PVMBG which specifically monitors Merapi. Additional information comes from the Pusat Vulkanologi dan Mitigasi Bencana Geologi (PVMBG, also known as Indonesian Center for Volcanology and Geological Hazard Mitigation, CVGHM), MAGMA Indonesia, the Darwin Volcanic Ash Advisory Centre (VAAC), and various satellite data.
Activity during April through September 2023 primarily consisted of incandescent avalanches of material that mainly affected the SW and W flanks and traveled as far as 2.3 km from the summit (table 25) and white gas-and-steam emissions that rose 10-1,000 m above the crater.
Table 25. Monthly summary of avalanches and avalanche distances recorded at Merapi during April through September 2023. The number of reported avalanches does not include instances where possible avalanches were heard but could not be visually confirmed as a result of inclement weather. Data courtesy of BPPTKG (April-September 2023 daily reports).
| Month |
Average number of avalanches per day |
Distance avalanches traveled (m) |
| Apr 2023 |
19 |
1,200-2,000 |
| May 2023 |
22 |
500-2,000 |
| Jun 2023 |
18 |
1,200-2,000 |
| Jul 2023 |
30 |
300-2,000 |
| Aug 2023 |
25 |
400-2,300 |
| Sep 2023 |
23 |
600-2,000 |
BPPTKG reported that during April and May white gas-and-steam emissions rose 10-750 m above the crater, incandescent avalanches descended 500-2,000 m on the SW and W flanks (figure 135). Cloudy weather often prevented clear views of the summit, and sometimes avalanches could not be confirmed. According to a webcam image, a pyroclastic flow was visible on 17 April at 0531. During the week of 28 April and 4 May a pyroclastic flow was reported on the SW flank, traveling up to 2.5 km. According to a drone overflight taken on 17 May the SW lava dome volume was an estimated 2,372,800 cubic meters and the dome in the main crater was an estimated 2,337,300 cubic meters.
During June and July similar activity persisted with white gas-and-steam emissions rising 10-350 m above the crater and frequent incandescent avalanches that traveled 300-2,000 m down the SW, W, and S flanks (figure 136). Based on an analysis of aerial photos taken on 24 June the volume of the SW lava dome was approximately 2.5 million cubic meters. A pyroclastic flow was observed on 5 July that traveled 2.7 km on the SW flank. According to the Darwin VAAC multiple minor ash plumes were identified in satellite images on 19 July that rose to 3.7 km altitude and drifted S and SW. During 22, 25, and 26 July a total of 17 avalanches descended as far as 1.8 km on the S flank.
Frequent white gas-and-steam emissions continued during August and September, rising 10-450 m above the crater. Incandescent avalanches mainly affected the SW and W flanks and traveled 400-2,300 m from the vent (figure 137). An aerial survey conducted on 10 August was analyzed and reported that estimates of the SW dome volume was 2,764,300 cubic meters and the dome in the main crater was 2,369,800 cubic meters.
Frequent and moderate-power thermal activity continued throughout the reporting period, according to a MIROVA (Middle InfraRed Observation of Volcanic Activity) analysis of MODIS satellite data (figure 138). There was an increase in the number of detected anomalies during mid-May. The MODVOLC thermal algorithm recorded a total of 47 thermal hotspots: six during April, nine during May, eight during June, 15 during July, four during August, and five during September. Some of this activity was captured in infrared satellite imagery on clear weather days, sometimes accompanied by incandescent material on the SW flank (figure 139).
Geologic Background. Merapi, one of Indonesia's most active volcanoes, lies in one of the world's most densely populated areas and dominates the landscape immediately north of the major city of Yogyakarta. It is the youngest and southernmost of a volcanic chain extending NNW to Ungaran volcano. Growth of Old Merapi during the Pleistocene ended with major edifice collapse perhaps about 2,000 years ago, leaving a large arcuate scarp cutting the eroded older Batulawang volcano. Subsequent growth of the steep-sided Young Merapi edifice, its upper part unvegetated due to frequent activity, began SW of the earlier collapse scarp. Pyroclastic flows and lahars accompanying growth and collapse of the steep-sided active summit lava dome have devastated cultivated lands on the western-to-southern flanks and caused many fatalities.
Information Contacts: Balai Penyelidikan dan Pengembangan Teknologi Kebencanaan Geologi (BPPTKG), Center for Research and Development of Geological Disaster Technology (URL: http://merapi.bgl.esdm.go.id/, Twitter: @BPPTKG); MAGMA Indonesia, Kementerian Energi dan Sumber Daya Mineral (URL: https://magma.esdm.go.id/v1); Pusat Vulkanologi dan Mitigasi Bencana Geologi (PVMBG, also known as Indonesian Center for Volcanology and Geological Hazard Mitigation, CVGHM), Jalan Diponegoro 57, Bandung 40122, Indonesia (URL: http://www.vsi.esdm.go.id/); Darwin Volcanic Ash Advisory Centre (VAAC), Bureau of Meteorology, Northern Territory Regional Office, PO Box 40050, Casuarina, NT 0811, Australia (URL: http://www.bom.gov.au/info/vaac/); MIROVA (Middle InfraRed Observation of Volcanic Activity), a collaborative project between the Universities of Turin and Florence (Italy) supported by the Centre for Volcanic Risk of the Italian Civil Protection Department (URL: http://www.mirovaweb.it/); Hawai'i Institute of Geophysics and Planetology (HIGP) - MODVOLC Thermal Alerts System, School of Ocean and Earth Science and Technology (SOEST), Univ. of Hawai'i, 2525 Correa Road, Honolulu, HI 96822, USA (URL: http://modis.higp.hawaii.edu/); Copernicus Browser, Copernicus Data Space Ecosystem, European Space Agency (URL: https://dataspace.copernicus.eu/browser/); Øystein Lund Andersen (URL: https://www.oysteinlundandersen.com/, https://twitter.com/oysteinvolcano).
Ebeko
Russia
50.686°N, 156.014°E; summit elev. 1103 m
All times are local (unless otherwise noted)
Moderate explosive activity with ash plumes continued during June-November 2023
Ebeko, located on the N end of Paramushir Island in Russia’s Kuril Islands just S of the Kamchatka Peninsula, consists of three summit craters along a SSW-NNE line at the northern end of a complex of five volcanic cones. Observed eruptions date back to the late 18th century and have been characterized as small-to-moderate explosions from the summit crater, accompanied by intense fumarolic activity. The current eruptive period began in June 2022, consisting of frequent explosions, ash plumes, and thermal activity (BGVN 47:10, 48:06). This report covers similar activity during June-November 2023, based on information from the Kamchatka Volcanic Eruptions Response Team (KVERT) and satellite data.
Moderate explosive activity continued during June-November 2023 (figures 50 and 51). According to visual data from Severo-Kurilsk, explosions sent ash 2-3.5 km above the summit (3-4.5 km altitude) during most days during June through mid-September. Activity after mid-September was slightly weaker, with ash usually reaching less than 2 km above the summit. According to KVERT the volcano in October and November was, with a few exceptions, either quiet or obscured by clouds that prevented satellite observations. KVERT issued Volcano Observatory Notices for Aviation (VONA) on 8 and 12 June, 13 and 22 July, 3 and 21 August, and 31 October warning of potential aviation hazards from ash plumes drifting 3-15 km from the volcano. Based on satellite data, KVERT reported a persistent thermal anomaly whenever weather clouds permitted viewing.
Geologic Background. The flat-topped summit of the central cone of Ebeko volcano, one of the most active in the Kuril Islands, occupies the northern end of Paramushir Island. Three summit craters located along a SSW-NNE line form Ebeko volcano proper, at the northern end of a complex of five volcanic cones. Blocky lava flows extend west from Ebeko and SE from the neighboring Nezametnyi cone. The eastern part of the southern crater contains strong solfataras and a large boiling spring. The central crater is filled by a lake about 20 m deep whose shores are lined with steaming solfataras; the northern crater lies across a narrow, low barrier from the central crater and contains a small, cold crescentic lake. Historical activity, recorded since the late-18th century, has been restricted to small-to-moderate explosive eruptions from the summit craters. Intense fumarolic activity occurs in the summit craters, on the outer flanks of the cone, and in lateral explosion craters.
Information Contacts: Kamchatka Volcanic Eruptions Response Team (KVERT), Far Eastern Branch, Russian Academy of Sciences, 9 Piip Blvd., Petropavlovsk-Kamchatsky, 683006, Russia (URL: http://www.kscnet.ru/ivs/kvert/).
Search Bulletin Archive by Publication Date
Select a month and year from the drop-downs and click "Show Issue" to have that issue displayed in this tab.
The default month and year is the latest issue available.
Bulletin of the Global Volcanism Network - Volume 42, Number 02 (February 2017)
Managing Editor: Edward Venzke
Bardarbunga (Iceland)
Monitoring data from early 2016
Bulusan (Philippines)
Phreatic explosions with minor ashfall continue during June-December 2016
Karangetang (Indonesia)
Intermittent ash plumes, lava flows, pyroclastic flows, and lahars; persistent thermal anomalies, June 2014-December 2016
Marapi (Indonesia)
Phreatic explosion on 14 November 2015 causes ashfall on the SW flank
Monowai (New Zealand)
Frequent submarine eruptions through November 2016; discolored water observations
Rabaul (Papua New Guinea)
Details of 29 August 2014 Strombolian eruption; update through 2016
Sheveluch (Russia)
Dome extrusion, hot block avalanches, and strong explosions continue through August 2015
Sinabung (Indonesia)
Eruption continues during May-October 2016; multiple fatalities from pyroclastic flows and lahars
Veniaminof (United States)
Lava flows, Strombolian activity, and ash plumes during 13 June-17 October 2013
Zavodovski (United Kingdom)
Eruption of ash and steam observed in June 2016
Bardarbunga (Iceland) — February 2017 Cite this Report
Bardarbunga
Iceland
64.633°N, 17.516°W; summit elev. 2000 m
All times are local (unless otherwise noted)
Monitoring data from early 2016
The fissure eruption from the Bardarbunga volcanic system began on 29 August 2014 (BGVN 39:10) about 45 km NE of the subglacial caldera at what was designated the Holuhraun vent. Lava emission ended on 28 February 2015 (BGVN 40:01), after creating a lava field almost 85 km2 in size. This report includes additional information provided by the Icelandic Meterological Office and NASA's Earth Observatory. Information from a report of the Icelandic Civil Protection Scientific Advisory Board, which met on 23 June 2016 to review recent data, is included below.
A scientific team working on the Vatnajökull glacier during 3-10 June 2016 did echo soundings to examine whether changes in bedrock topography within the Bardarbunga caldera could be detected from the recent eruption. No changes in the bedrock topography were apparent. There were also no indications that meltwater was accumulating within the caldera. The 65-m-deep depression in the glacier formed during the 2014-2015 activity was getting shallower due to the flow of ice into the caldera and snow accumulation, and the depression had decreased in depth by 8 m since the previous year.
Expedition scientists also measured gas emissions at ice cauldrons (figures 13 and 14), which are formed by subglacial geothermal activity, along the caldera rim; these measurements showed little change since the previous year's expedition. Seismic data showed that accumulated moment magnitude had been increasing since mid-September 2015. A total of 51 earthquakes stronger than M3 had been registered at Bardarbunga since the end of the eruption in 2015. GPS stations showed slow movement away from the caldera.
The Advisory Board report concluded that the most probable explanations for the ground deformation and seismicity was the inflow of magma from around 10-15 km below Bardarbunga into the area from which the magma erupted at Holuhraun during 2014-2015. There were no indications of magma collecting at shallower depths.
An image posted by the NASA Earth Observatory showed the extent of the Holuhraun lava field on 5 November 2016 surrounded by snow (figure 15).
Geologic Background. The large central volcano of Bárðarbunga lies beneath the NW part of the Vatnajökull icecap, NW of Grímsvötn volcano, and contains a subglacial 700-m-deep caldera. Related fissure systems include the Veidivötn and Trollagigar fissures, which extend about 100 km SW to near Torfajökull volcano and 50 km NE to near Askja volcano, respectively. Voluminous fissure eruptions, including one at Thjorsarhraun, which produced the largest known Holocene lava flow on Earth with a volume of more than 21 km3, have occurred throughout the Holocene into historical time from the Veidivötn fissure system. The last major eruption of Veidivötn, in 1477, also produced a large tephra deposit. The subglacial Loki-Fögrufjöll volcanic system to the SW is also part of the Bárðarbunga volcanic system and contains two subglacial ridges extending from the largely subglacial Hamarinn central volcano; the Loki ridge trends to the NE and the Fögrufjöll ridge to the SW. Jökulhlaups (glacier-outburst floods) from eruptions at Bárðarbunga potentially affect drainages in all directions.
Information Contacts: Icelandic Met Office (IMO), Reykjavík, Iceland (URL: http://en.vedur.is/); NASA Earth Observatory, EOS Project Science Office, NASA Goddard Space Flight Center, Goddard, Maryland, USA (URL: http://earthobservatory.nasa.gov/).
Bulusan (Philippines) — February 2017 Cite this Report
Bulusan
Philippines
12.769°N, 124.056°E; summit elev. 1535 m
All times are local (unless otherwise noted)
Phreatic explosions with minor ashfall continue during June-December 2016
Recent eruptive activity at Bulusan included episodes during 6 November 2010-16 May 2011, 1 May-17 July 2015, and 22 February 2016; activity typically included phreatic explosions from the summit crater and flank vents, ash-and-steam plumes, and minor ashfall in nearby villages (BGVN 41:03). The most recent eruption began 10 June 2016 and continued through the end of the year. Information was provided by the Philippine Institute of Volcanology and Seismology (PHIVOLCS) and the Tokyo Volcanic Ash Advisory Center (VAAC).
During the reporting period of June-December 2016, the Alert Level remained at 1 (on a scale of 0-5), indicating abnormal conditions and a 4-km radius Permanent Danger Zone (PDZ). Activity consisted of intermittent phreatic explosions generating emissions of ash and steam that typically rose 70-2,500 m above the summit crater (table 7). Minor ashfall in nearby municipalities often accompanied the explosions.
In October 2016, PHIVOLCS extended the danger zone an additional 2 km as a result of a fissure that extended 2 km down the upper S flank; PHIVOLCS was concerned that active vents along the upper part of the SE flank could pose a greater risk to the populated barangays (neighborhoods) of Mapaso (Irosin), Patag (Irosin), and San Roque (Bulusan). The municipalities of Irosin and Bulusan are about 8 km SSW and 7 km ESE, respectively, of the volcano.
Table 7. Summary of volcanic activity at Bulusan, June-December 2016.
| Date(s) |
Max. Plume height (m) |
Plume drift |
Remarks |
| 10 Jun 2016 |
2,000 |
NW |
5-min long phreatic explosion began at 1135 and generated ash plume. |
| 19 Jun 2016 |
300 |
NW |
7-min long phreatic explosion from NW summit vent began at 1303 and generated dirty-white ash plume. |
| 23 Jun 2016 |
-- |
-- |
Dirty-white steam plumes from summit vent drifted down WNW flank. Minor ashfall on nearby municipalities NW. Sulfur odor. |
| 25-26 Jun 2016 |
200 |
NW |
Steam plumes. |
| 28 Jun 2016 |
-- |
-- |
Steam plumes drifted down flank. |
| 05 Jul 2016 |
250 |
SSE, SSW |
Copious emissions of white-to-grayish steam plumes. |
| 06 Jul 2016 |
700 |
-- |
Copious emissions of steam. |
| 10-12 Jul 2016 |
70 |
-- |
Diffuse steam plumes. |
| 20 Jul 2016 |
-- |
WNW |
White-to-light gray plumes at low levels. |
| 21-25 Jul 2016 |
250 |
NW, SW |
Diffuse white plumes. |
| 16 Sep 2016 |
1,500 |
NE |
4-min long phreatic explosion began at 1654, and generated a dark gray ash plume. Ashfall in nearby municipalities NNW, NNE, and NE. |
| 01 Oct 2016 |
200 |
SE |
White-to-grayish emissions during 0650-1240 rose from vents on SE flank. Minor ashfall in nearby communities. |
| 06 Oct 2016 |
-- |
-- |
15-min long minor phreatic explosion with ashfall on nearby municipalities. |
| 12-16 Oct 2016 |
500 |
SE, SSE |
Steam plumes. 2-6 volcanic earthquakes per day. |
| 17 Oct 2016 |
1,000 |
-- |
24-min long phreatic explosion at the SE vent at 0736. 24 volcanic earthquakes 16-17 October. |
| 19 Oct 2016 |
1,000 |
-- |
Phreatic explosion at 0458 from upper SE flank. Explosion-type earthquake lasted 9 min. |
| 21 Oct 2016 |
-- |
-- |
20-min long phreatic explosion from summit crater began at 1234. Minor ashfall in nearby municipalities. |
| 23 Oct 2016 |
2,500 |
WSW |
15-min long phreatic explosion from summit vent began at 1531 and generated an ash plume. Small pyroclastic flows traveled 2 km down flank. Trace ashfall in nearby municipalities. Another, much smaller, explosion at 1539 from SE vent generated ash plume that rose 500 m. Rumbling and sulfur odor noted in several nearby areas. |
| 29 Dec 2016 |
2,000 |
WSW |
Phreatic explosion at 1440 from vent on upper SE flank generated grayish ash plume. Explosion-type earthquake lasted about 16 min. Minor ashfall on nearby municipalities. Sulfur odor noted. |
Ashfall. On 23 June 2016, minor amounts of ash fell in the barangays (neighborhoods) of Poblacion (11 km NW), Añog (12 km NW), and Bacolod (13 km NW), all in the municipality of Juban (about 12 km NW), and the municipality of Mabini (12 km NNW). A sulfur odor was detected in the neighborhoods of Mabini, Bacolod (Irosin), Añog (Juban), and Puting Sapa (Juban).
On 16 September there was ashfall in the municipalities of Casiguran (11 km NNW), Gubat (18 km NNE), and Barcelona (14 km NE). Minor amounts of ash fell during 1 October in the barangays of San Rafael, San Roque, and San Jose, all in the municipality of Bulusan. A minor explosion on 6 October caused ashfall in some areas of the municipality of Gubat, and rumbling was noted in San Roque.
A phreatic explosion on 21 October generated a plume that resulted in a thin layer of ash in Casiguran and Gubat, and trace amounts in barangays in Barcelona, Casiguran, and Gubat. On 23 October, a phreatic explosion produced trace ashfall in multiple barangays in Irosin; the most ash, 1 mm-thick deposits, were found in Puting Sapa (Juban).
On 29 December, a phreatic explosion generated an ash plume that resulted in minor amounts of ashfall in areas downwind, including several Irosin barangays (Cogon, Tinampo, Bolos, Umagom, Gulang-gulang, and Monbon) and two Juban barangays (Caladgao and Guruyan). Residents of Guruyan, Monbon, and Tinampo noted a sulfur odor.
Geologic Background. Luzon's southernmost volcano, Bulusan, was constructed along the rim of the 11-km-diameter dacitic-to-rhyolitic Irosin caldera, which was formed about 36,000 years ago. It lies at the SE end of the Bicol volcanic arc occupying the peninsula of the same name that forms the elongated SE tip of Luzon. A broad, flat moat is located below the topographically prominent SW rim of Irosin caldera; the NE rim is buried by the andesitic complex. Bulusan is flanked by several other large intracaldera lava domes and cones, including the prominent Mount Jormajan lava dome on the SW flank and Sharp Peak to the NE. The summit is unvegetated and contains a 300-m-wide, 50-m-deep crater. Three small craters are located on the SE flank. Many moderate explosive eruptions have been recorded since the mid-19th century.
Information Contacts: Philippine Institute of Volcanology and Seismology (PHIVOLCS), University of the Philippines Campus, Diliman, Quezon City, Philippines (URL: http://www.phivolcs.dost.gov.ph/); Tokyo Volcanic Ash Advisory Center (VAAC), Tokyo, Japan (URL: http://ds.data.jma.go.jp/svd/vaac/data/).
Karangetang (Indonesia) — February 2017 Cite this Report
Karangetang
Indonesia
2.781°N, 125.407°E; summit elev. 1797 m
All times are local (unless otherwise noted)
Intermittent ash plumes, lava flows, pyroclastic flows, and lahars; persistent thermal anomalies, June 2014-December 2016
The Karangetang andesitic-basaltic stratovolcano (also referred to as Api Siau) at the northern end of the island of Siau, north of Sulawesi, Indonesia has had more than 50 historically-observed eruptions since 1675. Frequent explosive activity is accompanied by pyroclastic flows and lahars, and lava-dome growth has created multiple summit craters. Rock avalanches, observed incandescence, and satellite thermal anomalies at the summit confirmed continuing volcanic activity through 5 September 2013 (BGVN 39:01). Activity is monitored by Indonesia's Pusat Vulkanologi dan Mitigasi Bencana Geologi (PVMBG, also known as CVGHM, or the Center of Volcanology and Geological Hazard Mitigation), and ash plumes are monitored by the Darwin VAAC (Volcanic Ash Advisory Center). Information is also available from MODIS thermal anomaly satellite data through both the University of Hawaii's MODVOLC system and the Italian MIROVA project.
An ash plume reported by the Darwin VAAC on 9 February 2014 that rose to an altitude of 4.3 km (2.5 km above the summit) and drifted over 80 km W was the only recorded activity at Karangetang between MODVOLC thermal anomalies on 5 September 2013 and on 8 June 2014. Additional thermal anomalies identified between June and September 2014, and increased seismicity reported by PVMBG in September, indicated ongoing activity. An ash plume was reported by the Darwin VAAC in October 2014. A spike in thermal activity was recognized during 12 January-1 February 2015. Another strong thermal signal began on 13 May that continued through 9 December 2015, when visual reports of lava flows and ash plumes were all recorded. Ash plumes were last reported by the Darwin VAAC in January 2016; night incandescence at the summit was reported by PVMBG until 15 March 2016. The Alert Level remained at 3 from September 2013 through 16 March 2016, when it was lowered to 2. Persistent low-energy thermal anomalies were captured by MIROVA throughout 2016, but there were no PVMBG observations indicating ongoing dome growth or other eruptive activity.
Activity during 2014. On 9 February 2014, the Darwin VAAC reported an ash plume rising to 4.3 km and extending over 80 km to the W based on satellite images. The next observation of activity was a single MODVOLC thermal alert pixel on 8 June 2014 located precisely over the summit. More substantial thermal anomalies appeared between 19 and 24 July, followed by two more on 2 August, after which there is a break of more than five months with no MODVOLC thermal anomalies. The MIROVA system, however, does record intermittent, low-level anomalies through early December 2014 (figure 11).
On 15 September 2014, PVMBG issued a report noting that seismic amplitudes were relatively high at the volcano, increasing from much lower levels on 12 September. Seismic data also indicated an increase in earthquakes indicating avalanches in late July which corresponded in time with the thermal anomalies recorded by MODVOLC and MIROVA. PVMBG observed steam plumes rising to between 100 and 150 m above the main summit crater, and to around 25 m above the second crater during the second week of September 2014, along with incandescence at the summit. The last 2014 report of activity came from the Darwin VAAC; they reported an ash plume on 20 October rising to 3 km and drifting 75 km NW.
Activity during 2015. Both the MODVOLC and MIROVA systems report the abrupt appearance of strong thermal anomalies on 12 January 2015, continuing until 1 February when they stopped just as suddenly (figure 11). A news article by a local newspaper (Jaringan Berita Terluas di Indonesia) reported that a lahar on 22 January 2015, triggered by heavy rains, descended the volcano's flanks, overflowed the banks of the Batu River, and damaged a number of public and private buildings in the village of Bahu about 7.5 km S of the volcano, and in Bebali, 4.5 km S. It also damaged the main road between the communities of Ulu and Ondong but the debris was quickly cleared by authorities.
The MIROVA system recorded thermal anomalies beginning again at the very end of March 2015 (figure 11); MODVOLC noted a single thermal alert on 13 April, and then strong, multi-pixel anomalies nearly continuously from 24 April through 11 June 2015. During the second half of April, PVMBG staff at the Volcano Observation Post in the village of Salili, 4 km SW, noted white steam plumes ranging from 50 to 350 m above the main crater and 25 m above the second crater, and incandescence from the summit. Additionally, they observed bluish-white plumes on 16 and 17 April rising to 50-150 m. They also concluded that the amplitude of seismic activity had decreased since the end of February.
Lava flows were first observed on 22 April; incandescent avalanches from the fronts of 150-m-long lava flows traveled up to 2 km down Batuawang and Kahetang drainages (E) during 22-29 April. On 26 April pyroclastic flows traveled 2.2 km along the Kahetang drainage. On 28 April explosions produced plumes and ejected incandescent material 50 m high (figure 12). Seismicity also increased from the previous week. The MIROVA data indicated a sudden spike of high thermal activity beginning around 22 April and continuing past the end of May (figure 11).
Activity at the volcano increased significantly at the beginning of May 2015. BNPB (Badan Nasional Penanggulangan Bencana) reported that on 7 May at 1400 an eruption that ejected incandescent material and produced a dense ash plume also generated a pyroclastic flow that traveled 4 km E, leveling four houses in Kora-Kora. The next day pyroclastic flows descended the S flank 2.5 km into the Kahetang (E) and Batuawang drainages. There were no reported fatalities; 465 people were evacuated from the village of Bebali, 4.5 km S. Also on 8 May, the Darwin VAAC reported an ash plume that rose to an altitude of 3 km drifted almost 85 km E, and dissipated two days later. On 12 May another ash plume rose to an altitude of 3.7 km and drifted 55 km SW, and there were reports by the Darwin VAAC via social media of continued pyroclastic flow activity. Steam plumes rising to 400 m continued into the last week of May, along with incandescence from the summit at night. The lava flows that first appeared on 22 April were 300 m long by the end of May and continued to send block avalanches from the fronts up to 2 km down the Batuawang, Kahetang, and Keting drainages to the SW, S and SE. Seismic amplitudes continued at a high level; seismicity was dominated by signals characteristic of avalanches, with harmonic tremor frequently detected.
On 5 June 2015 BNPB reported that activity remained high; a total of 339 people (106 families) from the villages of Ulu, Salili, Belali, and Tarorane, all a few kilometers S of the summit, remained displaced since early May. PVMBG reported that on 18 June a lahar descending Batuawang drainage (E) covered a 100-m section of roadway with 25 cm of mud containing 1-m-diameter boulders. The lahar also damaged or destroyed four homes. White plumes rising 150 m above the main crater and 25 m above crater II were observed from the Volcano Observation Post in Salili during late June. Incandescence from the lava dome was also observed at night. Lava flowed from the S part of the dome; incandescent avalanches from the front of the lava flow again traveled up to 2.3 km down the Batuawang and Kahetang drainages. Seismic activity continued to be high, although the number of daily earthquake indicating avalanches had dropped below 100 per day at the end of June. MODVOLC thermal anomaly pixels were recorded on 2-4, 9, and 11 June, far fewer than in May.
PVMBG reported that during the last two weeks of July 2015, white plumes rose 250 m above the main crater and 25 m above the second crater (crater II). Incandescence from the lava dome was observed at night when skies were clear, and incandescent avalanches from the fronts of new 150-m-long lava flows traveled up to 2.3 km E down the Batuawang, Kahetang and Keting drainages. Seismicity was dominated by signals characteristic of avalanches, with rare volcanic earthquakes. The Alert Level remained at 3. During the month, fewer MODVOLC thermal alerts were recorded than during May and June, only on 4, 6, 11, and 25 July.
Seismicity related to avalanche activity increased significantly on 14 August 2015 and the number of daily events spiked on 20 August to 599, marking a period of increased activity that continued into November (figure 13). Strong MODVOLC thermal alert signals reappeared on 10 August 2015 and continued with multiple-pixel signals almost daily until 1 October when they became more intermittent. The MIROVA thermal anomaly data also corroborated increased thermal activity during this period (figure 14).
The Darwin VAAC reported that on 28 August 2015 a pyroclastic cloud was observed on satellite. The ash plume rose to an altitude of 2.4 km and drifted 55 km ENE. They also observed a number of ash plumes between 10 and 17 September that rose as high as 3 km and drifted up to 130 km generally E. Lava fountains as high as 300 m were observed from the Volcano Observation Post in Salili during 9-16 September. Debris fell as far as 300 m from the summit crater into the Kinali River. Incandescent avalanches from the fronts of 200-m-long lava flows traveled up to 2.5 km down the Batuawang, Kahetang, Keting, and Batang drainages; brownish smoke was observed at the end of the Batuawang flows. The Alert Level remained at 3.
During October 2015, MODVOLC thermal anomaly pixels became more intermittent, appearing on 10 days during the month, far fewer than September. Steam plumes from the main crater were observed from Salili up to 150 m above the crater along with incandescence on clear nights. Lava flows remained active 200 m from the crater still sending pyroclastic avalanches down the Batuawang, Kahetang, Keting, and Batang drainages up to 2 km from the lava fronts. The flows had increased to 600 m long between 19 and 22 October and the avalanches continued. Most seismicity decreased in early October, except harmonic tremor, suggesting that magma movement inside the volcano persisted. The Darwin VAAC reported that on 8 October an ash plume rose to an altitude of 2.7 km and drifted 65 km E and that during 18 October ash plumes rose to an altitude of 2.1 km and drifted 75-95 km NE. Constant harmonic tremors for 6 hours on 20 October indicated magma was still active.
Seismicity continued its steady decline since early September during November (figure 13), although tremor activity continued. Incandescence was still visible from the lava dome at night according to PVMBG, and the incandescent avalanches were still travelling up to 1.5 km down the Batuawang and Kahetang drainages. Steam plumes rose generally 50-200 m, and occasionally 400 m from the main crater. A lahar in Batuawang drainage flowed as far as the village of Bebali and covered about 50 m of the Ondong-Ulu highway on 20 November, similar to the event of 18 June. MODVOLC recorded only two thermal anomaly pixels at the summit, both on 25 November.
By December 2015, incandescence was still observed at the crater from the Volcano Observatory in Salili, but steam plumes rarely exceeded 150 m. A single MODVOLC thermal anomaly pixel, was recorded on 9 December, and spikes in seismic amplitudes were recorded on 21 and 22 December.
Activity during 2016. According to PVMBG, Karangetang was quiet during most of January 2016, although incandescence was reported from the main crater, and plumes of bluish and white smoke rose 50-100 m. There were no reports of active lava flows or incandescent avalanches, but the accumulation of material in the Batuawang drainage made the possibility of damaging lahars during the rainy season very high. The relatively constant number of shallow (VB) earthquakes suggested that the lava dome was growing slowly; there was a two-fold increase in RSAM values during the month (figure 13). Based on analyses of satellite imagery and wind data, the Darwin VAAC reported three ash plumes during the month; on 12 January an ash plume rose to an altitude of 5.2 km and drifted 65 km NW, on 14 January a steam-and-ash plume rose to an altitude of 5.2 km and drifted over 35 km W, and the next day an ash-and-steam plume rose to an altitude of 2.7 km and drifted about 20 km SW.
Incandescence continued at the summit during February and early March 2016 along with bluish-white plumes rising 25-100 m from the summit crater. Seismic energy values (RSAM) remained elevated during February, suggesting continued growth of the lava dome. The last MODIS thermal anomaly observed by PVMBG was on 8 March. Although they continued to observe incandescence 10-25 m above the summit and bluish-white emissions to 150 m through 15 March, they lowered the Alert Level from 3 to 2 on 16 March, noting that even though the RSAM seismic energy values were still above normal, they had been stable for some time. The MIROVA Thermal Anomaly Radiative Power data from March 2016 also showed a significant decline in thermal energy released from the volcano compared with the period from late April through November 2015 (figure 14). Although no further reports were issued by PVMBG or Darwin VAAC, the thermal anomalies detected by MIROVA continued at low to moderate levels during 2016, suggesting a persistent heat source at the volcano (figure 15).
Geologic Background. Karangetang (Api Siau) volcano lies at the northern end of the island of Siau, about 125 km NNE of the NE-most point of Sulawesi. The stratovolcano contains five summit craters along a N-S line. It is one of Indonesia's most active volcanoes, with more than 40 eruptions recorded since 1675 and many additional small eruptions that were not documented (Neumann van Padang, 1951). Twentieth-century eruptions have included frequent explosive activity sometimes accompanied by pyroclastic flows and lahars. Lava dome growth has occurred in the summit craters; collapse of lava flow fronts have produced pyroclastic flows.
Information Contacts: Pusat Vulkanologi dan Mitigasi Bencana Geologi (PVMBG, also known as Indonesian Center for Volcanology and Geological Hazard Mitigation, CVGHM), Jalan Diponegoro 57, Bandung 40122, Indonesia (URL: http://www.vsi.esdm.go.id/); Badan Nasional Penanggulangan Bencana (BNPB), National Disaster Management Agency, Graha BNPB - Jl. Scout Kav.38 East Jakarta 13120 (URL: http://www.bnpb.go.id/); Darwin Volcanic Ash Advisory Centre (VAAC), Bureau of Meteorology, Northern Territory Regional Office, PO Box 40050, Casuarina, NT 0811, Australia (URL: http://www.bom.gov.au/info/vaac/); Hawai'i Institute of Geophysics and Planetology (HIGP), MODVOLC Thermal Alerts System, School of Ocean and Earth Science and Technology (SOEST), Univ. of Hawai'i, 2525 Correa Road, Honolulu, HI 96822, USA (URL: http://modis.higp.hawaii.edu/, http://modis.higp.hawaii.edu/cgi-bin/modisnew.cgi); MIROVA (Middle InfraRed Observation of Volcanic Activity), a collaborative project between the Universities of Turin and Florence (Italy) supported by the Centre for Volcanic Risk of the Italian Civil Protection Department (URL: http://www.mirovaweb.it/); Jaringan Berita Terluas di Indonesia, http://www.jpnn.com/read/2015/01/23/283204/Awas,-Lahar-Dingin-Karangetang-Kembali-Mengancam.
Marapi (Indonesia) — February 2017 Cite this Report
Marapi
Indonesia
0.38°S, 100.474°E; summit elev. 2885 m
All times are local (unless otherwise noted)
Phreatic explosion on 14 November 2015 causes ashfall on the SW flank
Explosions occurred at Marapi (not to be confused with the better known Merapi on Java) during August 2011; March, May, and September 2012; and February 2014 (BGVN 40:05). This report discusses activity during 2015 and 2016. All information was provided by the Indonesian Center of Volcanology and Geological Hazard Mitigation (PVMBG, also known as CVGHM). During the reporting period, the Alert Level remained at 2 (on a scale of 1-4); residents and visitors were advised not to enter an area within 3 km of the summit.
According to PVMBG, diffuse white plumes rose as high as 300 above Marapi's crater during February-25 May 2015, 150 m above the crater during 1 August-16 November 2015, and 250 m above the crater during 1 November 2015-19 January 2016. Inclement weather often prevented observations.
Seismicity fluctuated during this time, dominated by earthquakes centered a long distance from the volcano. However, tremor increased significantly during August 2015 through at least the middle of January 2016 (figure 4). A phreatic explosion at 2233 on 14 November 2015, generated an ash plume, and ashfall was noted in Panyalaian and Aia Angek on the SW flank.
Geologic Background. Gunung Marapi, not to be confused with the better-known Merapi volcano on Java, is Sumatra's most active volcano. This massive complex stratovolcano rises 2,000 m above the Bukittinggi Plain in the Padang Highlands. A broad summit contains multiple partially overlapping summit craters constructed within the small 1.4-km-wide Bancah caldera. The summit craters are located along an ENE-WSW line, with volcanism migrating to the west. More than 50 eruptions, typically consisting of small-to-moderate explosive activity, have been recorded since the end of the 18th century; no lava flows outside the summit craters have been reported in historical time.
Information Contacts: Pusat Vulkanologi dan Mitigasi Bencana Geologi (PVMBG, also known as Indonesian Center for Volcanology and Geological Hazard Mitigation, CVGHM), Jalan Diponegoro 57, Bandung 40122, Indonesia (URL: http://www.vsi.esdm.go.id/).
Monowai (New Zealand) — February 2017 Cite this Report
Monowai
New Zealand
25.887°S, 177.188°W; summit elev. -132 m
All times are local (unless otherwise noted)
Frequent submarine eruptions through November 2016; discolored water observations
Evidence of submarine volcanism at Monowai has been frequently observed since October 1977, when the Royal New Zealand Air Force (RNZAF) noted a plume of discolored water above the seamount. Most subsequent eruptions have been determined based on additional observations of discolored water or the seismic detection of acoustic waves (T waves or T phases) caused by explosive activity. Monitoring reports are provided by New Zealand's GeoNet through their website and other publications. The hydro-acoustic signals are most frequently detected by seismometers in Rarotonga (Cook Islands) or by the Polynesian Seismic Network (Réseau Sismique Polynésien, or RSP) in Tahiti. Research visits over the past 20 years have resulted in many detailed analyses of morphological changes due to volcanism and subsequent collapses.
Some of those results have been reviewed in previous Bulletin reports. This issue will focus on reviewing eruptive episodes after a sector-collapse event on 24 May 2002, which caused anomalous seismic signals originally thought to be explosive in nature. Following the May 2002 event, no activity was detected until T phases were recorded during 1-24 November 2002 (figure 28 and see BGVN 28:02). The next eruptive period began on 10 April 2003 (figure 28 and see BGVN 28:05) and continued until a seismic swarm on 14 August 2004 (BGVN 28:11, 30:07), which included the building of a new cone and ended just prior to a bathymetric survey from the R/V Tangaroa in September 2004. Another sequence of swarms began on 2 March 2005 and continued until 27 June 2006. Although there appear to have been small signals in September 2006, scientists at the Laboratoire de Géophysique, Commissariat à l'Energie Atomique (CEA/DASE/LDG) reported that there were 6 months of quiet after the June 2006 swarms (BGVN 32:01).
While the R/V Sonne was on site conducting a bathymetric survey during 1-4 May 2007 (Chadwick et al, 2008), scientists heard booming sounds and saw slicks and bubbles on the surface (BGVN 33:03). That activity was part of an eruptive period that began on 12 December 2006 and continued into at least early November 2007 (figure 29 and see BGVN 32:01). A "big acoustic event" was detected by the Polynesian Seismic Network (Réseau Sismique Polynésien, or RSP) on 8 February 2008 (BGVN 33:03).
A network of 23 ocean-bottom seismometers (OBS) and hydrophones was deployed in July 2007 over the fore-arc just to the E of Monowai at distances of 70-250 km to acquire data about local seismicity associated with subduction (Grevemeyer et al., 2016). The instruments also detected T waves and direct wave signals from the ongoing explosive activity. Analysis by Grevemeyer et al. (2016) showed that between deployment and recovery at the end of January 2008 there had been more than 2,000 events associated with Monowai, clustered into 13-15 major sequences that each lasted between several hours to about two days. Quiet periods between the event sequences varied between 1 and 70 days.
Intermittent activity during 2009 was described in a GeoNet posting from 6 January 2010. Activity was noted in early and mid-May, early July, mid-September (figure 30), late October (figure 31), mid-November, late November to early December, and mid-December 2009 based on seismic data recorded in Rarotonga, Cook Islands. On 27 October the RNZAF overflew the area and confirmed the activity, observing discolored sea water related to suspended sediment and precipitates. Another flight in May 2010 did not show similar activity. A summary of 2010 activity in New Zealand by GeoNet noted continued evidence of small-scale eruptive activity on the Rarotonga seismic record during the year (no dates given), but no activity was confirmed by surface observations.
[Discolored water with gas bubbles and a sulfurous odor was observed during a planned swath mapping visit by the R/V Sonne on 14 May 2011 (Peirce and Watts, 2011).] According to Metz et al. (2016), explosive eruptions took place over [17-22 May] as detected by T phase waves recorded at broadband seismic stations on Rarotonga (Cook Islands), Papeete (Tahiti), and the Marquesas Islands. Signals were also received at an International Monitoring System hydrophone array (maintained by the Comprehensive Nuclear-Test-Ban Treaty Organization) near Ascension Island, ~15,800 km from the seamount in the equatorial South Atlantic Ocean. A second round of mapping by R/V Sonne on the return transit was accomplished on 1-2 June, [following the explosive activity]. Watts et al. (2012) showed that there had been a depth change to the summit of 18.8 m between two surveys (BGVN 37:06), which was attributed to the growth of a cone or lava spine during the intervening eruption. There was an additional visual confirmation of activity in August 2011, and GeoNet stated that activity was continuing in September. The 2011 volcanic summary by GeoNet again noted undated evidence of small-scale activity seen in the Rarotonga seismic data.
Seismicity during 1-4 June 2012 indicated another period of significant activity, which was confirmed by discolored seawater in the area observed from an RNZAF flight on 3 June. Seismographs in Rarotonga recorded eruptive activity during 3-19 August 2012 (figure 32). A posting from GeoNet on 2 October noted that Monowai had "not been active recently."
There were no GeoNet reports of activity during 2013. However, the R/V Sonne was planning to add to the time series of maps of Monowai while making a final transit to Auckland (Werner et al., 2013). While they were approaching the seamount on 1 January 2014, with a summit estimated to be ~60 m below the surface based on 2011 bathymetry data, scientists noticed a light yellowish water discoloration and a faint rumble. The cruise report further noted that during profiling close to the summit a "sudden and significant increase in volcanic activity with explosive hydroclastic eruptions was accompanied by thunder and shock waves rapidly spreading out on the water surface." Pumice was also collected in the vicinity, but the source volcano was not known.
In a GeoNet volcanic activity update on 10 November 2014, Brad Scott observed that there had been eruptions detected during approximately 16-22 and 23-27 October, and 1-5 November (figure 33) based on T phase waves measured at Rarotonga, but the activity appeared to be weaker than that seen in 2009 and 2012. Confirming these observations was material seen floating on the ocean surface over the seamount by a RNZAF airplane on 31 October 2014 (figure 34). GeoNet noted that volcanic activity regularly occurs about 3-10 days a month; the yearly summary said the seamount erupted often in 2014.
There were no reports of activity during 2015, but a plume of discolored water was once again seen by the RNZAF on 19 May 2016. According to a 16 November 2016 GeoNet update by Brad Scott, activity was recorded for about 24 hours over 11-12 November. The report noted that this type of activity is seen a few days every month.
References: Chadwick, W.W., Jr., Wright, I.C., Schwarz-Schampera, U., Hyvernaud O., Reymond, D., and de Ronde, C.E.J., 2008, Cyclic eruptions and sector collapses at Monowai submarine volcano, Kermadec arc: 1998-2007, GeochemistryGeophysicsGeosystemsG3, v. 9, p. 1-17 (DOI: 10.1029/2008GC002113).
Grevemeyer, I., Metz, D., and Watts, A., 2016, Submarine explosive activity and ocean noise generation at Monowai Volcano, Kermadec Arc: constraints from hydroacoustic T-waves: EGU General Assembly 2016.
Peirce C, Watts A, 2011, R/V Sonne SO 215 - Cruise Report, The Louisville Ridge - Tonga Trench collision: Implications for subduction zone dynamics: Durham, Department of Earth Sciences, Durham University.
Metz, D., Watts, A.B., Grevemeyer, I., Rodgers, M., and Paulatto, M., 2016 (22 February), Ultra-long-range hydroacoustic observations of submarine volcanic activity at Monowai, Kermadec Arc, Geophysical Research Letters, v. 43, no. 4, p. 1529-1536.
Watts, A.B., Peirce, C., Grevemeyer, I., Paulatto, M., Stratford, W., Bassett, D., Hunter, J.A., Kalnins, L.M., and de Ronde, C.E.J., 2012 (13 May), Rapid rates of growth and collapse of Monowai submarine volcano in the Kermadec Arc, Nature Geoscience, v. 5, p. 510-515 (DOI: 10.1038/ngeo1473).
Werner, R., D. Nürnberg, and F. Hauff, 2013, RV SONNE — Cruise report SO 225, Helmholtz-Zentrum fur Ozeanforschung Kiel (GEOMAR) (DOI: 10.3289/GEOMAR_REP_NS_5_2012).
Geologic Background. Monowai, also known as Orion seamount, is a basaltic stratovolcano that rises from a depth of about 1,500 to within 100 m of the ocean surface about halfway between the Kermadec and Tonga island groups, at the southern end of the Tonga Ridge. Small cones occur on the N and W flanks, and an 8.5 x 11 km submarine caldera with a depth of more than 1,500 m lies to the NNE. Numerous eruptions have been identified using submarine acoustic signals since it was first recognized as a volcano in 1977. A shoal that had been reported in 1944 may have been a pumice raft or water disturbance due to degassing. Surface observations have included water discoloration, vigorous gas bubbling, and areas of upwelling water, sometimes accompanied by rumbling noises. It was named for one of the New Zealand Navy bathymetric survey ships that documented its morphology.
Information Contacts: New Zealand GeoNet Project, a collaboration between the Earthquake Commission and GNS Science, Wairakei Research Centre, Private Bag 2000, Taupo 3352, New Zealand (URL: http://www.geonet.org.nz/).
Rabaul (Papua New Guinea) — February 2017 Cite this Report
Rabaul
Papua New Guinea
4.2459°S, 152.1937°E; summit elev. 688 m
All times are local (unless otherwise noted)
Details of 29 August 2014 Strombolian eruption; update through 2016
The large eruption of 29 August 2014 at the Tavurvur stratovolcano of Rabaul caldera, on the NE tip of New Britain Island in Papua New Guinea, followed a period of minor ash eruptions earlier in the year (BGVN 39:08). The volcano has been intermittently active since a major eruption in September 1994, which was its first eruption in over 50 years. During the 1994 eruption, a lava flow, tephra ejection, and an ash plume rising to 18 km caused the evacuation of over 50,000 people from the surrounding area, significant damage to nearby Rabaul Town, several deaths, and disrupted air traffic for several days (BGVN 19:08, 19:09). Additional information for the 2014 eruption, and subsequent activity covered in this report, was compiled by the Rabaul Volcano Observatory (RVO) and issued by the Department of Mineral Policy and Geohazards Management of Papua New Guinea (DMPGM). Aviation alerts for Rabaul are issued by the Darwin Volcanic Ash Advisory Center (VAAC). A number of news outlets also covered the eruption with photographs, videos, and interviews of local residents.
A Strombolian eruption at Tavurvur began shortly after 0330 local time on 29 August 2014. This was followed by an ash plume rising to 18 km altitude. Smaller explosions at irregular intervals continued through 0641 on 30 August. After this, plumes of white vapor and slightly bluish gas returned, except for an ash plume reported on 12 September and a small explosion on 18 September. The volcano remained quiet after this and through 2016, although ground deformation data indicated a gradual inflation of about 6 cm over the period.
Activity during August-December 2014. Prior to August 2014, DMPGM reported that ground deformation measurements from the GPS station on Matupit Island (3 km W) had been showing increasing inflation, first detected in March 2014 (figure 67). In the days immediately before the 29 August 2014 eruption, Tavurvur had been emitting a diffuse plume of white vapor. An explosion occurred on 6 August, and an inspection of the summit crater on 8 August revealed an incandescent area covered by debris.
The activity on 29 August 2014 started slowly between 0330 and 0400 local time and then developed into a Strombolian eruption accompanied by loud explosions, roaring, and rumbling. The stronger explosions generated shockwaves which rattled windows and doors in the area. At dawn, the eruption plume could be seen blowing W over the Malguna villages, about 8 km NW, at an altitude of 3,000 m (figure 68). Rabaul Town, 7 km NW of Tavurvur, was initially affected by ash, as was Volavolo (20 km W), but a shift in wind direction sent the plume in a more WNW direction by mid-morning. Villages to the E and S were not affected by ash, but ashfall was reported in Keravat, about 25 km SW. High levels of seismic tremor were recorded during the eruption.
DMPGM reported that the Strombolian eruption had begun to subside around 0645, and by 0700 only a diffuse white plume was being emitted and seismicity had decreased. Another report at 1600 noted that strong explosions continued throughout the day at irregular intervals, producing ash plumes that rose rapidly to 1,000 m above the summit before drifting NW. The explosions also ejected lava fragments of various sizes in all directions 500 to 1,000 m from the summit crater (figure 69). Shock waves accompanied the loud explosions and rattled buildings within several kilometers of the volcano. Intermittent explosions at increasing intervals continued into the following night generating incandescent lava fragments around the summit. Seismicity was dominated by discrete events that were associated with the explosions. The strong explosions ceased at 0641 on 30 August, and no incandescence was observed after that. By the morning of 31 August, seismicity had decreased from 80 events/hour to 15/hour. According to DMPGM, the eruption deposited a significant amount of ash and scoria on the hillsides of Rabaul Town and Malaguna Villages to the NW.
The initial ash plume from the eruption was first observed in satellite imagery by the Darwin VAAC around 0900 local time on 29 August, and rose to over 18 km altitude. The upper part of the plume was originally drifting SW, then changed to NW, and the lower part at 4.3 km altitude was moving NW. By late morning, the plume was moving in three directions at different altitudes; NW at 4.3 km, S at 16.7 km, and W at 18.3 km. The high-level ash from the original eruption had dissipated by the evening on 30 August, but low-level plumes to 2.1 km were still reported.
A substantial SO2 plume was recorded by the OMI Instrument on the Aura Satellite on 29 August, and was still measurable a day later (figure 70) drifting S. The MODVOLC thermal anomaly system recorded anomalous pixels at Rabaul captured by MODIS satellite data between 29 August and 1 September 2014.
From 1 to 17 September emissions consisted of variable amounts of diffuse to dense white vapor and small traces of diffuse blue vapor. Southeast winds were recirculating significant amounts of fine ash back into the atmosphere. A plume was reported by the Darwin VAAC on 12 September at 3 km altitude, drifting NW. Seismicity had decreased to very low levels with only 10-30 events recorded per day during the first half of September. A single small explosion occurred at 1242 on 18 September according to DMPGM that produced a small, light-gray ash plume that rose a few hundred meters above the summit crater before dissipating to the NW.
A site inspection of Tavurvur crater was conducted by DMPGM on 23 September 2014, and they observed significant changes in the crater since the 29 August eruption. The crater floor was filled with blocky lavas, and thus much shallower than when last observed prior to the eruption. Three or four areas of active emissions were present within the crater, and the rim was covered with large blocks of lava. By the end of September, seismicity had dropped to less than 10 low-frequency earthquakes per week. In mid-October DMPGM observed that the ground deformation data from the Matupit GPS station indicated that there had been an inflation of about 4 cm since the benchmark reached on 29 August during the eruption. Ground deformation was stable during November. During a field inspection of the summit crater on 9 December 2014, scientists measured a temperature of 310°C at a hot spot on the upper flank. Numerous patches of diffuse white vapor emissions were present at different places on the inner walls of the crater, and the crater floor seemed to have subsided slightly since the prior visit.
Activity during 2015 and 2016. A report by DMPGM from March 2015 noted that Tavurvur remained quiet with the summit crater releasing various amounts of diffuse white vapor, which was slightly denser during periods of rain. There was no observed incandescence or noise, and seismicity was low, with only a small number of both high-frequency and volcano-tectonic earthquakes recorded on 10 and 13 February. Ground deformation data indicated a general inflationary trend since September 2014 of about 5 cm. Monthly reports issued by DMPGM in March and April indicated little activity at Tavurvur, and stability of the ground deformation data. On 17 May 2015 a strong, earthquake of M 5.1 originating NE of Rabaul Caldera 1-2 km offshore from Korere and Nodup (about 9 km NW of Tavurvur) generated a swarm of aftershocks in the same area. They occurred at a depth of about 9 km and caused several small landslides in various places on the N flank of Kombiu, another stratovolcano at Rabaul about 2.5 km NE of Tavurvur.
Tavurvur remained quiet from September through November with occasional diffuse white vapor plumes rising from the summit caldera, and no volcanic earthquakes reported. While a long-term inflationary trend continued through November, shorter term fluctuations up and down of a few centimeters in the ground deformation data were also observed. The trend of vertical uplift between January 2015 and December 2016 showed an increase of approximately 6 cm during the period (figure 71).
Geologic Background. The low-lying Rabaul caldera on the tip of the Gazelle Peninsula at the NE end of New Britain forms a broad sheltered harbor utilized by what was the island's largest city prior to a major eruption in 1994. The outer flanks of the asymmetrical shield volcano are formed by thick pyroclastic-flow deposits. The 8 x 14 km caldera is widely breached on the east, where its floor is flooded by Blanche Bay and was formed about 1,400 years ago. An earlier caldera-forming eruption about 7,100 years ago is thought to have originated from Tavui caldera, offshore to the north. Three small stratovolcanoes lie outside the N and NE caldera rims. Post-caldera eruptions built basaltic-to-dacitic pyroclastic cones on the caldera floor near the NE and W caldera walls. Several of these, including Vulcan cone, which was formed during a large eruption in 1878, have produced major explosive activity during historical time. A powerful explosive eruption in 1994 occurred simultaneously from Vulcan and Tavurvur volcanoes and forced the temporary abandonment of Rabaul city.
Information Contacts: Department of Mineral Policy and Geohazards Management (DMPGM), Volcano Observatory, Geohazards Management Division, PO Box 3386, KOKOPO, East New Britain Province, Papua New Guinea; Darwin Volcanic Ash Advisory Centre (VAAC), Bureau of Meteorology, Northern Territory Regional Office, PO Box 40050, Casuarina, NT 0811, Australia (URL: http://www.bom.gov.au/info/vaac/); Hawai'i Institute of Geophysics and Planetology (HIGP), MODVOLC Thermal Alerts System, School of Ocean and Earth Science and Technology (SOEST), Univ. of Hawai'i, 2525 Correa Road, Honolulu, HI 96822, USA (URL: http://modis.higp.hawaii.edu/, http://modis.higp.hawaii.edu/cgi-bin/modisnew.cgi); NASA Goddard Space Flight Center (NASA/GSFC), Global Sulfur Dioxide Monitoring Page, Atmospheric Chemistry and Dynamics Laboratory, Goddard, Maryland, USA (URL: https://so2.gsfc.nasa.gov/); World Organization of Volcano Observatories (WOVOdat), hosted by Earth Observatory of Singapore, Nanyang Technological University, 50 Nanyang Avenue, Singapore 639798 www.wovodat.org; The Washington Post, http://www.washingtonpost.com/news/morning-mix/wp/2014/08/29/photos-in-papua-new-guinea-mount-tavurvur-explodes-in-spectacular-style/); Traveller.com, http://www.traveller.com.au/qantas-reroutes-flights-as-pngs-rabaul-volcano-erupts-109utz .
Sheveluch (Russia) — February 2017 Cite this Report
Sheveluch
Russia
56.653°N, 161.36°E; summit elev. 3283 m
All times are local (unless otherwise noted)
Dome extrusion, hot block avalanches, and strong explosions continue through August 2015
An eruption at Sheveluch has been ongoing since 1999, and the activity there was previously described through February 2015 (BGVN 42:01). During March-August 2015, the same type of activity prevailed, with lava dome extrusion, incandescence, hot block avalanches, fumarolic activity, and occasional strong explosions that generated ash plumes. Most of the following data comes from Kamchatka Volcanic Eruption Response Team (KVERT) reports. During this period the Aviation Color Code remained at Orange (the second highest level on a four-color scale).
KVERT reported that during 27 February-15 May 2015, lava-dome extrusion onto the N flank continued to be accompanied by incandescence, hot block avalanches, and fumarolic activity. This activity diminished somewhat during 22 May-14 July, when lava-dome extrusion was accompanied only by fumarolic activity. However, heightened activity resumed during 15 July-31 August, when KVERT reported that lava-dome extrusion was accompanied by fumarolic activity, dome incandescence, and hot avalanches.
Between 28 February and the middle of April 2015, strong explosions generated ash plumes that rose to 7-12 km altitude. Ash drifted as much as 885 km in various directions, and ash fell in Ust-Kamchatsk (85 km SE) at least twice in March. Based on KVERT reports, ash plumes on 15 June and 5-6 July only rose as high as 3.3-5 km in altitude.
A daily thermal anomaly was detected 27 February-15 May, except when cloud cover obscured views. During 16-30 May, thermal anomalies were only detected occasionally in satellite images, but became more frequent thereafter, depending on cloud cover. KVERT reported that during 10 July-31 August, satellite images again detected an almost daily thermal anomaly over the dome.
Thermal anomalies based on MODIS satellite instruments analyzed using the MODVOLC algorithm were infrequent during the reporting period, in contrast to the almost daily hotspots reported by KVERT. One hotspot was detected in March, April, and June, none in May, four in July, and eight in August.
Geologic Background. The high, isolated massif of Sheveluch volcano (also spelled Shiveluch) rises above the lowlands NNE of the Kliuchevskaya volcano group. The 1,300 km3 andesitic volcano is one of Kamchatka's largest and most active volcanic structures, with at least 60 large eruptions during the Holocene. The summit of roughly 65,000-year-old Stary Shiveluch is truncated by a broad 9-km-wide late-Pleistocene caldera breached to the south. Many lava domes occur on its outer flanks. The Molodoy Shiveluch lava dome complex was constructed during the Holocene within the large open caldera; Holocene lava dome extrusion also took place on the flanks of Stary Shiveluch. Widespread tephra layers from these eruptions have provided valuable time markers for dating volcanic events in Kamchatka. Frequent collapses of dome complexes, most recently in 1964, have produced debris avalanches whose deposits cover much of the floor of the breached caldera.
Information Contacts: Kamchatka Volcanic Eruptions Response Team (KVERT), Far Eastern Branch, Russian Academy of Sciences, 9 Piip Blvd., Petropavlovsk-Kamchatsky, 683006, Russia (URL: http://www.kscnet.ru/ivs/kvert/); Hawai'i Institute of Geophysics and Planetology (HIGP), MODVOLC Thermal Alerts System, School of Ocean and Earth Science and Technology (SOEST), Univ. of Hawai'i, 2525 Correa Road, Honolulu, HI 96822, USA (URL: http://modis.higp.hawaii.edu/).
Sinabung (Indonesia) — February 2017 Cite this Report
Sinabung
Indonesia
3.17°N, 98.392°E; summit elev. 2460 m
All times are local (unless otherwise noted)
Eruption continues during May-October 2016; multiple fatalities from pyroclastic flows and lahars
The latest eruption of Sinabung that began mid-September 2013 (BGVN 38:09) had persisted through April 2016 (BGVN 41:09). This report describes the continuing activity from May-October 2016, and unfortunately included a fatality. Data were primarily drawn from reports issued by the Indonesian Center of Volcanology and Geological Hazard Mitigation (PVMBG, CVGHM), the Darwin Volcanic Ash Advisory Centre (VAAC), and the Badan Nacional Penanggulangan Bencana (National Disaster Management Authority, BNPB).
Inclement weather sometimes prevented visual observations. Throughout the reporting period, the Alert Level remained at 4 (on a scale of 1-4), indicating that the public should remain outside of a 3-km radius; those within 7 km of the volcano on the SSE sector, and within 6 km in the ESE sector, and 4 km in the NNE sector should evacuate.
According to the Darwin VAAC and PVMBG reports, a number of ash plumes were observed each month (table 6). They generally rose to altitudes of 3.3-5.5, although one rose as high as 5.9 km.
Table 6. Ash plumes with altitudes and drift directions reported at Sinabung from May 2016 to October 2016. Weather clouds often prevented observations. Courtesy of PVMBG, Darwin VAAC, and BNPB.
| Date |
Ash plume altitude (km) |
Ash plume drift |
| 04-05, 09-10 May 2016 |
3.6-4.8 |
W |
| 11-13, 16 May 2016 |
3-4.5 |
SW, W, WNW, NW |
| 18, 21-22, 24 May 2016 |
3.6-5.5 |
S, E |
| 26-29 May 2016 |
3.6-4.9 |
-- |
| 05-07 Jun 2016 |
3.3-3.9 |
SW |
| 10-11 Jun 2016 |
3.3-5.9 |
S, WSW, W |
| 19-20 Jun 2016 |
4.3-4.6 |
SE, E |
| 25-27 Jun 2016 |
3.7 |
E |
| 29 Jun-05 Jul 2016 |
3.4-5.5 |
Multiple |
| 06, 08-09, 11 Jul 2016 |
3.7-5.5 |
SE, E, NE, W |
| 15-16, 19 Jul 2016 |
4.6 |
NW, W, SW |
| 21-22, 24-25 Jul 2016 |
3.7-4.6 |
NW, NE, SE |
| 27-28 Jul, 01 Aug 2016 |
4-4.3 |
NE, E, SSE |
| 03-05, 07 Aug 2016 |
3.7-5.5 |
SE, NE, NNW |
| 15 Aug 2016 |
4.3 |
E |
| 17, 21-22 Aug 2016 |
4 |
SE |
| 26 Aug 2016 |
6.1 |
NW, NNE |
| 29 Aug 2016 |
4.6 |
ENE |
| 30 Aug 2016 |
5.2 |
NW |
| 01-03 Sep 2016 |
4.3-5.5 |
W, WSW |
| 17 Sep 2016 |
3.3 |
E |
| 23-25 Sep 2016 |
3.6-4.2 |
E, ESE, SE |
| 28-29 Sep 2016 |
3.6-3.9 |
E |
| 05 Oct 2016 |
3.3 |
SE |
| 12 Oct 2016 |
4.6 |
E |
| 26, 29 Oct 2016 |
4.2 |
SSE |
| 31 Oct-01 Nov 2016 |
3.4 |
NE |
According to BNPB, a lahar passed through Kutambaru village, 20 km NW of Sinabung and near the Lau Barus River, at 1545 on 9 May 2016, killing a boy and injuring four more. One person was missing. A news article (Okezone News) noted that three houses were also damaged.
BNPB reported that a pyroclastic flow descended the flanks at 1648 on 21 May, killing six people and critically injuring three more. A later CBS news account on 22 May indicated that seven people had died, with two in critical condition. The victims were gardening in the village of Gamber, 4 km SE from the summit crater, in the restricted zone. The report noted that activity remained high; four pyroclastic flows descended the flanks on 21 May.
On 3 July, BNPB reported that the eruption continued at a very high level. Lava was incandescent as far as 1 km down the SE and E flanks, and multiple avalanches were detected. An explosion at 1829 generated an ash plume that rose 1.5 km and drifted E and SE, causing ashfall in Medan (55 km NE). There were 2,592 families (9,319 people) displaced to nine shelters, and an additional 1,683 families in temporary shelters waiting for relocation.
According to BNPB, on 24 August, observers at the PVMBG Sinabung observation post noted a marked increase in seismicity and counted 19 pyroclastic flows and 137 avalanches from the early morning until the late afternoon. Foggy conditions obscured visual observations through most of the day, although incandescent lava as far as 500 m SSE and 1 km ESE was noted in the morning, and a pyroclastic flow was seen traveling 3.5 km ESE at 1546. The lava dome had grown to a volume of 2.6 million cubic meters. Activity remained very high on 25 August; pyroclastic flows continuously descended the flanks, traveling as far as 2.5 km E and SE, and 84 avalanches occurred during the first part of the day.
Thermal anomalies. During the reporting period, thermal anomalies, based on MODIS satellite instruments analyzed using the MODVOLC algorithm, occurred during one to five days every month. Only three days had more than one pixel (1, 3 May, 8 October). The Mirova (Middle InfraRed Observation of Volcanic Activity) volcano hotspot detection system, also based on analysis of MODIS data, detected thermal anomalies every month during the reporting period within 5 km of the volcano, with the heaviest concentration in May and fewest in September and October.
Geologic Background. Gunung Sinabung is a Pleistocene-to-Holocene stratovolcano with many lava flows on its flanks. The migration of summit vents along a N-S line gives the summit crater complex an elongated form. The youngest crater of this conical andesitic-to-dacitic edifice is at the southern end of the four overlapping summit craters. The youngest deposit is a SE-flank pyroclastic flow 14C dated by Hendrasto et al. (2012) at 740-880 CE. An unconfirmed eruption was noted in 1881, and solfataric activity was seen at the summit and upper flanks in 1912. No confirmed historical eruptions were recorded prior to explosive eruptions during August-September 2010 that produced ash plumes to 5 km above the summit.
Information Contacts: Badan Nasional Penanggulangan Bencana (BNPB), National Disaster Management Agency, Graha BNPB - Jl. Scout Kav.38, East Jakarta 13120, Indonesia (URL: http://www.bnpb.go.id/); Pusat Vulkanologi dan Mitigasi Bencana Geologi (PVMBG, also known as Indonesian Center for Volcanology and Geological Hazard Mitigation, CVGHM), Jalan Diponegoro 57, Bandung 40122, Indonesia (URL: http://www.vsi.esdm.go.id/); Darwin Volcanic Ash Advisory Centre (VAAC), Bureau of Meteorology, Northern Territory Regional Office, PO Box 40050, Casuarina, NT 0811, Australia (URL: http://www.bom.gov.au/info/vaac/); Hawai'i Institute of Geophysics and Planetology (HIGP), MODVOLC Thermal Alerts System, School of Ocean and Earth Science and Technology (SOEST), Univ. of Hawai'i, 2525 Correa Road, Honolulu, HI 96822, USA (URL: http://modis.higp.hawaii.edu/); MIROVA (Middle InfraRed Observation of Volcanic Activity), a collaborative project between the Universities of Turin and Florence (Italy) supported by the Centre for Volcanic Risk of the Italian Civil Protection Department (URL: http://www.mirovaweb.it/); Okezone News (URL: http://news.okezone.com/); CBS News (URL: http://www.cbsnews.com/).
Veniaminof (United States) — February 2017 Cite this Report
Veniaminof
United States
56.17°N, 159.38°W; summit elev. 2507 m
All times are local (unless otherwise noted)
Lava flows, Strombolian activity, and ash plumes during 13 June-17 October 2013
Mount Veniaminof, located on the Alaska Peninsula, has a large glacier-filled summit caldera that formed around 3,700 years ago. A cone within the crater has been the source of at least 13 eruptions in the last 200 years that included intermittent steam and ash emissions, incandescent lava flows, and Strombolian activity. Prior to an eruptive episode that began in June 2013, lava had last erupted during Strombolian activity in February 2005; subsequent minor ash emissions occurred later in 2005, November 2006, and February 2008. Pilots reported ash plumes in January and June 2009, but the Alaska Volcano Observatory (AVO) concluded that the plumes were steam-only. Veniaminof is closely monitored by AVO and the Anchorage Volcanic Ash Advisory Center (VAAC). The Federal Aviation Administration (FAA) also has a web camera in Perryville, 35 km E of the volcano. This review draws heavily from a USGS report on the June through October 2013 eruption (Dixon et al., 2015).
Beginning on 7 June 2013, a several-day period of increasing levels of seismic tremor indicated the start of a largely effusive eruption from the intracaldera cinder cone (figure 17). The first ash plume was observed on 13 June. Over the next four months, numerous emissions rose to altitudes generally below 4.6 km and coated the flanks of the cone with ash, Strombolian explosions were visually observed several times, and lava flowed down the N and S flanks of the active cone and advanced onto the surrounding ice-filled caldera creating ice cauldrons. The eruption constructed a new spatter cone within the summit crater of the main active cone. Activity had ceased by 17 October 2013. A brief period of elevated seismicity occurred during October and November 2015, but no eruptive activity was recorded.
Gradually increasing low-frequency tremor was recorded on two seismograph stations at Veniaminof, along with elevated surface temperatures of the intracaldera cinder cone recorded via satellite images on 7 June 2013. This led AVO to increase the 4-level Aviation Color Code and the Volcano Alert Level from Green/Normal to Yellow/Advisory the next day. By 13 June, seismicity levels and elevated surface temperatures at the summit of the cinder cone (as measured by satellite images) indicated an eruption was likely underway, causing AVO to raise the Aviation Color Code and the Volcano Alert Level to Orange/Watch. Observation of an ash plume at an altitude of 3.7 km by a pilot that evening along with a lava flow effusing from the intra-caldera cinder cone confirmed the eruption.
Residents in Perryville (32 km SSE) and Port Moller (77 km WSW) also observed ash emissions at about 2330 local time that evening. The first VAAC report around the same time listed the ash plume at 4.3 km altitude, drifting NNE. Ash deposits on the snow-covered caldera floor, and lava on the cone, were visible in satellite images on 14 June. The first MODVOLC thermal anomaly pixels from MODIS satellite data also appeared on 14 June. On 18 June the web camera in Perryville captured short-lived ash plumes rising to less than 4.6 km, and residents in Sandy River (33 km W) reported visible plumes to similar altitudes the next day. The 100-m-wide lava flow extended 500 m down the SW flank of the cone onto the adjacent snow and ice field by 18 June. Interaction of the lava with the caldera snow-and-ice field generated water-rich ash plumes. Clear satellite views the following day showed active flow lobes advancing over the ice at the base of the cone.
In subsequent weeks, three flows descended the S flank, and minor amounts of ash accumulated on the caldera floor. Strombolian activity was captured by infrared satellite imagery, from the FAA web camera in Perryville, and from several local lodges and remote camps (figure 18).
On 16 July 2013 an AVO geologist visited the caldera by helicopter, making observations and taking the first close-up photographs documenting the lava flows and ice cauldron formation (figure 19). Images of the vent area showed a new cone of accumulated spatter nested within the summit crater of the main cone.
Strong MODVOLC thermal alert pixels, up to 12 per day, continued almost daily through the end of July. A pilot report from 0800 AKDT on 25 July described an ash plume to 100 m above the erupting cone dispersing 25 km to the S, and a "river of lava" flowing from the intracaldera cone. Numerous reports from the Anchorage VAAC between 27 and 31 July confirmed ash plumes rising as high as 4.6 km altitude and drifting up to 20 km NW.
After a brief period of quiet in early August 2013, activity resumed with lava flows and ash plumes on 11 August. On 12 August, satellite imagery confirmed incandescence from the cone and an ash plume was also observed from Perryville. A second overflight under clear skies by AVO geologists on 18 August revealed ash covering the immediate area of the glacier and the lava flows, and an active incandescent flow down the S flank into the ice cauldrons where the hottest parts of the flows were still in contact with ice and water. The S-flank lava flows had coalesced and largely melted into the surrounding ice (figures 20 and 21).
Strombolian explosions of incandescent lava and minor ash emissions were observed at the central active vent on 18 August during the flyover. Two new lava flows were also observed issuing from the NE flank of the new cone. Forward Looking Infrared Radiometer (FLIR) images delineated the lava flows and hot spatter on the cone (figure 22). As measured by the FLIR, maximum temperatures reached 700° to 800°C.
The Anchorage VAAC reported ash plumes on 20 and 21 August 2013 rising to 3.7 km altitude moving SE within a few kilometers of the summit. Residents of Perryville reported rumbling noises, explosions, and trace ashfall on 20 August. Similar, low-level ash plumes and persistent thermal anomalies were detected during the remainder of August. A noted increase in activity on 30 August included elevated levels of continuous tremor, lava fountaining, and ash emissions as high as 6.1 km altitude; this was some of the strongest unrest detected since the eruption began in June. Trace amounts of ashfall were again reported in Perryville. Lava effusion, fountaining, and nearly continuous small ash plumes continued through the first week in September. Satellite and aerial images on 6 and 7 September indicated further development of the flows on the NE flank and expansion of the ice cauldron as well as a new lobe of lava advancing southward from the NE flank ice cauldron (figure 23).
MODVOLC thermal alert pixels ceased on 8 September 2013; the last September satellite imagery detection of volcanic ash emissions as reported by the Anchorage VAAC was on 9 September. By 19 September no evidence of active lava flows was observed in satellite images; seismicity had begun to decrease during the week, and the eruption appeared to be waning. This short-lived period of quiescence ended on 6 October when MODVOLC pixels reappeared through 11 October, suggesting active lava effusion. An ash plume reported by the Anchorage VAAC on 11 October rose to 6.1 km altitude (the highest of this eruption) and trace amounts of ash were reported in the communities of Chignik Lake and Chignik Lagoon, 40-55 km E of the active vent; it was the last VAAC report of an ash plume in 2013. On 17 October AVO noted that seismicity had decreased during the previous week and satellite observations during periods of clear weather showed no evidence of eruptive activity. The Aviation Color Code/Volcano Alert Level was lowered to Yellow/Advisory. Seismicity remained slightly above background levels through the following June, although no further activity was reported. The Alert Level was lowered to Green/Normal on 9 July 2014.
According to the USGS and AVO, the 2013 eruption produced about 5 X 10⁵ m3 of erupted lava, comparable in size to the 1983 eruption. A chart of eruptive events and the real-time seismic amplitude (RSAM) time series data between 13 June and 17 October 2013 prepared by USGS/AVO illustrates the significant eruptive events of this period (figure 24). Additional details of the eruption can be found in Dixon et al., 2015.
No further reports of activity from Veniaminof were issued until increased seismic activity began on 30 September 2015. This led AVO to increase the Color Code/Alert Level to Yellow/Advisory the next day. Occasional, clear web camera images from Perryville in the subsequent weeks showed small steam plumes rising from the intracaldera cone but no ash emissions or lava effusions. Slightly elevated levels of seismicity continued until the beginning of December. AVO downgraded the status from Yellow/Advisory to Green/Normal on 11 December 2015.
References: Dixon, J.P., Cameron, Cheryl, McGimsey, R.G., Neal, C.A., and Waythomas, Chris, 2015, 2013 Volcanic activity in Alaska - Summary of events and response of the Alaska Volcano Observatory: U.S. Geological Survey Scientific Investigations Report 2015-5110, 92 p., http://dx.doi.org/10.3133/sir20155110
Waythomas, C.F., 2013, Volcano-ice interactions during recent eruptions of Aleutian Arc volcanoes and implications for melt water generation: Eos Transactions, American Geophysical Union, Fall Meeting, abstract V34C-03.
Geologic Background. Veniaminof, on the Alaska Peninsula, is truncated by a steep-walled, 8 x 11 km, glacier-filled caldera that formed around 3,700 years ago. The caldera rim is up to 520 m high on the north, is deeply notched on the west by Cone Glacier, and is covered by an ice sheet on the south. Post-caldera vents are located along a NW-SE zone bisecting the caldera that extends 55 km from near the Bering Sea coast, across the caldera, and down the Pacific flank. Historical eruptions probably all originated from the westernmost and most prominent of two intra-caldera cones, which rises about 300 m above the surrounding icefield. The other cone is larger, and has a summit crater or caldera that may reach 2.5 km in diameter, but is more subdued and barely rises above the glacier surface.
Information Contacts: Alaska Volcano Observatory (AVO), a cooperative program of a) U.S. Geological Survey, 4200 University Drive, Anchorage, AK 99508-4667 USA (URL: http://www.avo.alaska.edu/), b) Geophysical Institute, University of Alaska, PO Box 757320, Fairbanks, AK 99775-7320, USA, and c) Alaska Division of Geological & Geophysical Surveys, 794 University Ave., Suite 200, Fairbanks, AK 99709, USA (URL: http://www.dggs.alaska.gov/); Anchorage Volcanic Ash Advisory Center (VAAC), Alaska Aviation Weather Unit, NWS NOAA US Dept. of Commerce, 6930 Sand Lake Road, Anchorage, AK 99502-1845(URL: http://www.ssd.noaa.gov/); Hawai'i Institute of Geophysics and Planetology (HIGP), MODVOLC Thermal Alerts System, School of Ocean and Earth Science and Technology (SOEST), Univ. of Hawai'i, 2525 Correa Road, Honolulu, HI 96822, USA (URL: http://modis.higp.hawaii.edu/).
Zavodovski (United Kingdom) — February 2017 Cite this Report
Zavodovski
United Kingdom
56.3°S, 27.57°W; summit elev. 551 m
All times are local (unless otherwise noted)
Eruption of ash and steam observed in June 2016
Remote Zavodovski Island, located in the Southern Atlantic Ocean, is the northernmost of the South Sandwich Islands, 570 km SE of South Georgia Island. The basaltic stratovolcano on the island, known as Mount Curry, has a large lava platform extending east from two parasitic cones on the side of the main edifice. Steam emissions from the summit have been observed by researchers, fishing vessels, and tourists who visit the island to see the population of over one million chinstrap penguins. The only confirmed historical eruption was that observed in 1819 by the Russian explorer Bellingshausen. In early July 2016, a photograph of ash and steam emitting from the volcano was released by the British Antarctic Survey (BAS).
While steam plumes have been observed emitting from Mt. Curry on a number of occasions, observations of volcanic ash had not been documented in modern times until June 2016. The MODIS instrument (Moderate Resolution Imaging Spectroradiometer) on NASA's Aqua satellite captured a unique image of the interaction of low-level emissions from Zavodovski and the atmosphere on 27 April 2012 (figure 1). Aerosol particles from the volcano are key to the formation of clouds, but whether they are derived from steam plumes, magmatic gases, or volcanic ash is unclear from this image.
The BBC conducted a filming expedition to Zavodovski in January 2015 to document the landscape of the island and the behavior of its resident chinstrap penguin colony; while there they observed regular puffs of steam rising from the summit, shown in their expedition report to the SGSSI Government (figure 2). Additional NASA MODIS satellite images of white plumes issuing from Mount Curry were captured by the South Sandwich Islands Volcano Monitoring Blog in January and December 2015, but are inconclusive as to the presence of volcanic ash.
The plumes in 2016 first appeared in images dated 30 March and 7 April, but the plume content beyond steam is difficult to assess. Images from 1 and 13 June 2016 also show white gas plumes. The British Antarctic Survey (BAS) reported on 6 July 2016 that Mt. Curry began erupting in March 2016. A fishing observer captured an image of an ash-and-steam eruption in June 2016 (figure 3). The BAS noted that fishing vessels in the area captured photos of the eruption with "smoke" and ash drifting to the E, covering the lower slopes of the volcano, and bombs being ejected from the crater.
Satellite images confirmed that up to half of the island was coated with ash. On 20 July 2016 the Government of South Georgia and South Sandwich Islands issued a Navigation Warning noting that eruptions on Zavodovski and nearby Bristol Island were emitting significant ash and dust particles and advised Mariners to remain at least 3 nautical miles from the area.
Frequent satellite images of white plumes issuing from Zavodovski were captured in satellite images during the rest of 2016. On 29 August a white plume was drifting NE. Between 17 September and 10 October satellite images captured several white plumes drifting in various directions. On 1 November a grayish white plume was observed drifting E; on 19 and 20 November and 6 December white plumes were observed. A grayish-white plume was captured on 9 December drifting SSW, and on 17 December a large white plume was drifting SE.
References: BBC, 2015, BBC Natural History Unit filming expedition to Zavodovski Island, a report to the commissioners office, South Georgia Government, posted at www.gov.gs.
Geologic Background. The 5-km-wide Zavodovski Island, the northernmost of the South Sandwich Islands, consists of a single basaltic stratovolcano with two cones on the east side. Mount Curry, the island's summit, lies west of the center of the island, which is more eroded on that side. Two fissures extend NE from the summit towards the E-flank craters, and a lava platform is located along the eastern coast. The volcano was producing abundant emissions when observed in 1819 by the explorer Bellingshausen. A landing party in 1830 also reported strong emissions along with a fresh lava field on the east side from which pumice was being eroded into the ocean.
Information Contacts: British Antarctic Survey, Natural Environment Research Council, High Cross, Madingly Road, Cambridge CB3 0ET, United Kingdom (URL: https://www.bas.ac.uk/ , https://www.bas.ac.uk/media-post/penguin-colonies-at-risk-from-erupting-volcano/); Government of South Georgia and the South Sandwich Islands, Government House, Stanley, Falkland Islands, South Atlantic (URL: http://www.gov.gs/); NASA Earth Observatory, EOS Project Science Office, NASA Goddard Space Flight Center, Goddard, Maryland, USA (URL: http://earthobservatory.nasa.gov/); South Sandwich Islands Volcano Monitoring Blog (URL: http://southsandwichmonitoring.blogspot.com/).