Recently Published Bulletin Reports
Erebus (Antarctica) Lava lake remains active; most thermal alerts recorded since 2019
Rincon de la Vieja (Costa Rica) Frequent phreatic explosions during July-December 2023
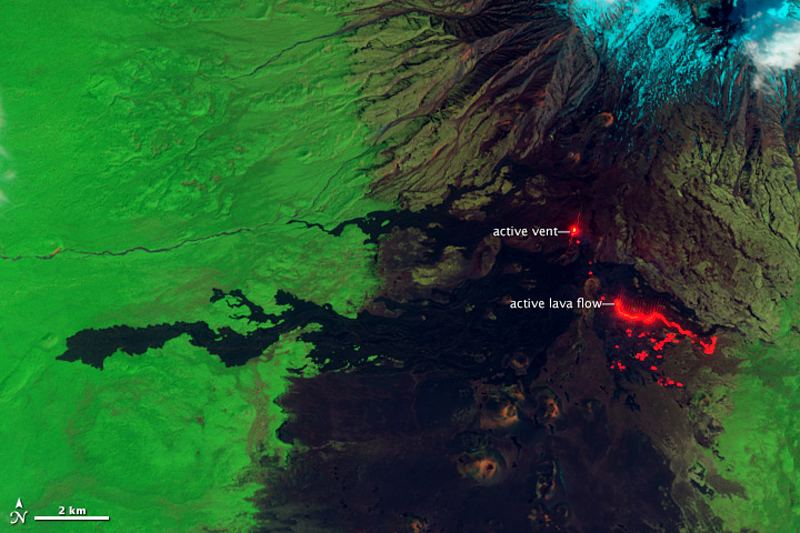
Bezymianny (Russia) Explosion on 18 October 2023 sends ash plume 8 km high; lava flows and incandescent avalanches
Kilauea (United States) Low-level lava effusions in the lava lake at Halema’uma’u during July-December 2022
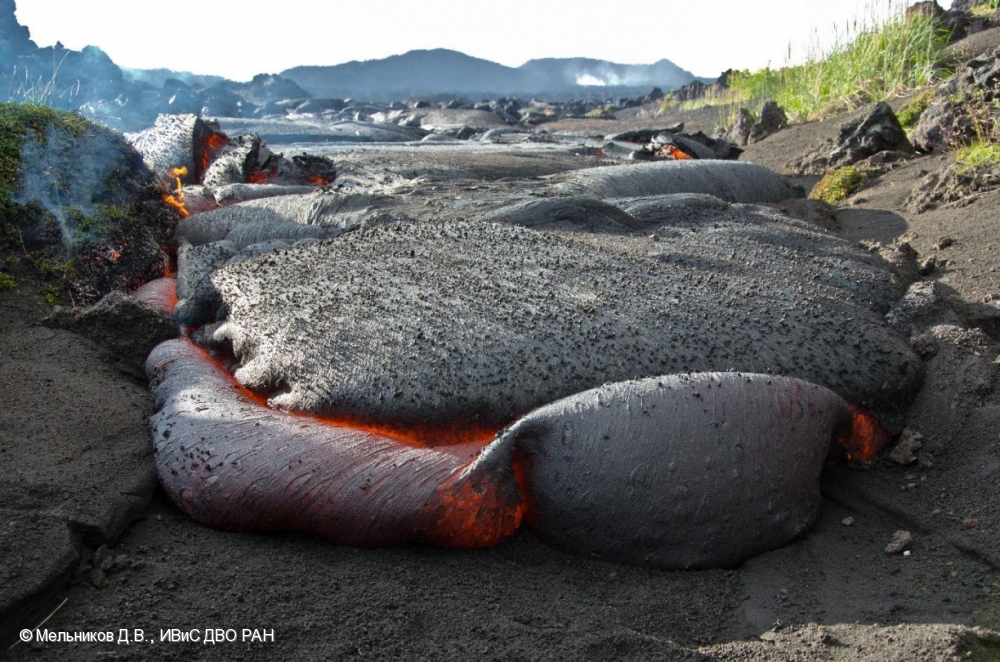
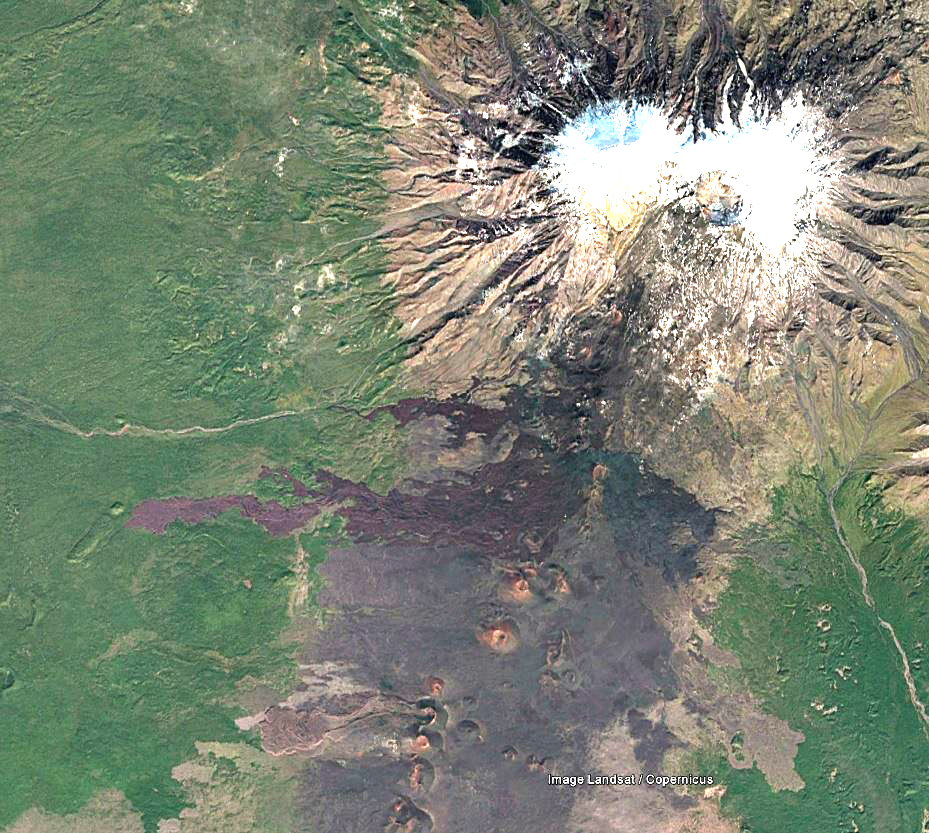
Nyamulagira (DR Congo) Lava flows and thermal activity during May-October 2023
Bagana (Papua New Guinea) Explosions, ash plumes, ashfall, and lava flows during April-September 2023
Mayon (Philippines) Lava flows, pyroclastic flows, ash emissions, and seismicity during April-September 2023
Nishinoshima (Japan) Eruption plumes and gas-and-steam plumes during May-August 2023
Krakatau (Indonesia) White gas-and-steam plumes and occasional ash plumes during May-August 2023
Merapi (Indonesia) Frequent incandescent avalanches during April-September 2023
Villarrica (Chile) Strombolian activity, gas-and-ash emissions, and crater incandescence during April-September 2023
Ebeko (Russia) Moderate explosive activity with ash plumes continued during June-November 2023
Erebus (Antarctica) — January 2024  Cite this Report
Erebus
Antarctica
77.53°S, 167.17°E; summit elev. 3794 m
All times are local (unless otherwise noted)
Lava lake remains active; most thermal alerts recorded since 2019
The lava lake in the summit crater of Erebus has been active since at least 1972. Located in Antarctica overlooking the McMurdo Station on Ross Island, it is the southernmost active volcano on the planet. Because of the remote location, activity is primarily monitored by satellites. This report covers activity during 2023.
The number of thermal alerts recorded by the Hawai'i Institute of Geophysics and Planetology’s MODVOLC Thermal Alerts System increased considerably in 2023 compared to the years 2020-2022 (table 9). In contrast to previous years, the MODIS instruments aboard the Aqua and Terra satellites captured data from Erebus every month during 2023. Consistent with previous years, the lowest number of anomalous pixels were recorded in January, November, and December.
Table 9. Number of monthly MODIS-MODVOLC thermal alert pixels recorded at Erebus during 2017-2023. See BGVN 42:06 for data from 2000 through 2016. The table was compiled using data provided by the HIGP – MODVOLC Thermal Alerts System.
| Year |
Jan |
Feb |
Mar |
Apr |
May |
Jun |
Jul |
Aug |
Sep |
Oct |
Nov |
Dec |
SUM |
| 2017 |
0 |
21 |
9 |
0 |
0 |
1 |
11 |
61 |
76 |
52 |
0 |
3 |
234 |
| 2018 |
0 |
21 |
58 |
182 |
55 |
17 |
137 |
172 |
103 |
29 |
0 |
0 |
774 |
| 2019 |
2 |
21 |
162 |
151 |
55 |
56 |
75 |
53 |
29 |
19 |
1 |
0 |
624 |
| 2020 |
0 |
2 |
16 |
18 |
4 |
4 |
1 |
3 |
18 |
3 |
1 |
6 |
76 |
| 2021 |
0 |
9 |
1 |
0 |
2 |
56 |
46 |
47 |
35 |
52 |
5 |
3 |
256 |
| 2022 |
1 |
13 |
55 |
22 |
15 |
32 |
39 |
19 |
31 |
11 |
0 |
0 |
238 |
| 2023 |
2 |
33 |
49 |
82 |
41 |
32 |
70 |
64 |
42 |
17 |
5 |
11 |
448 |
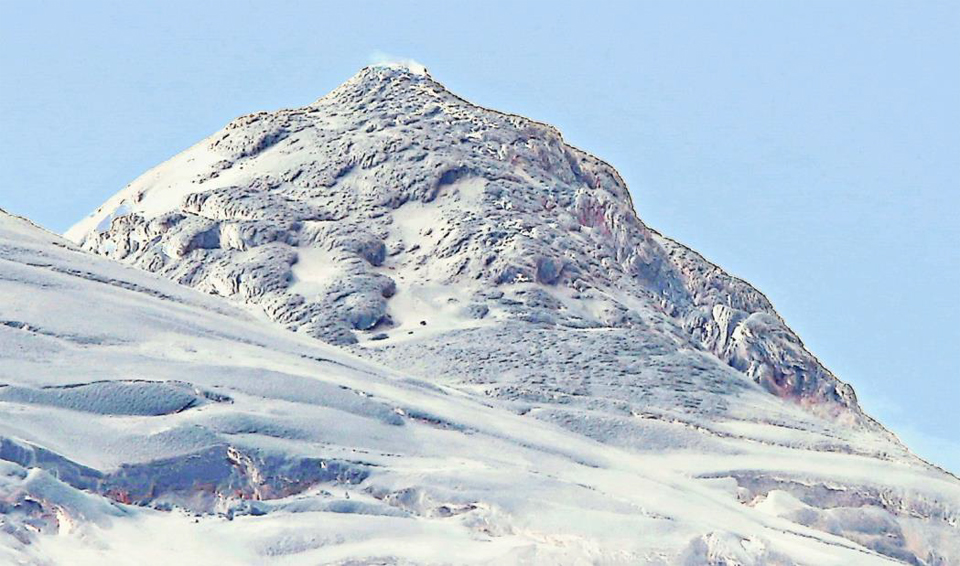
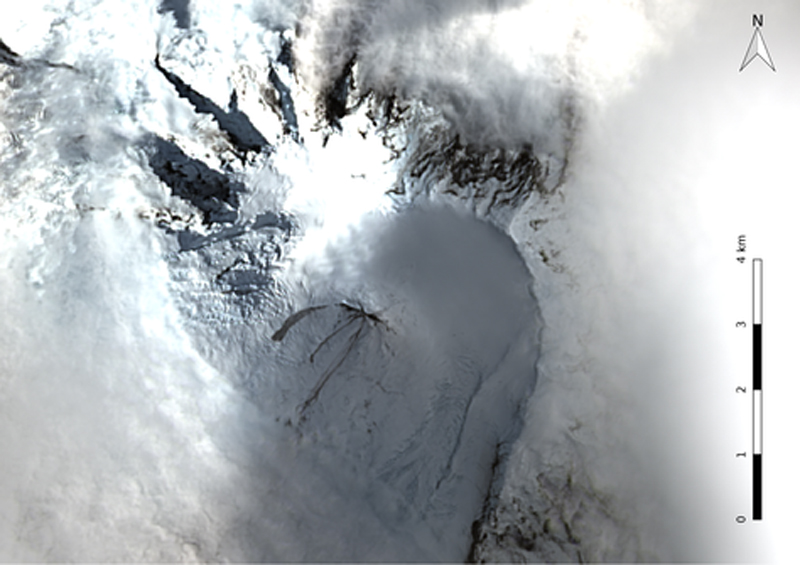
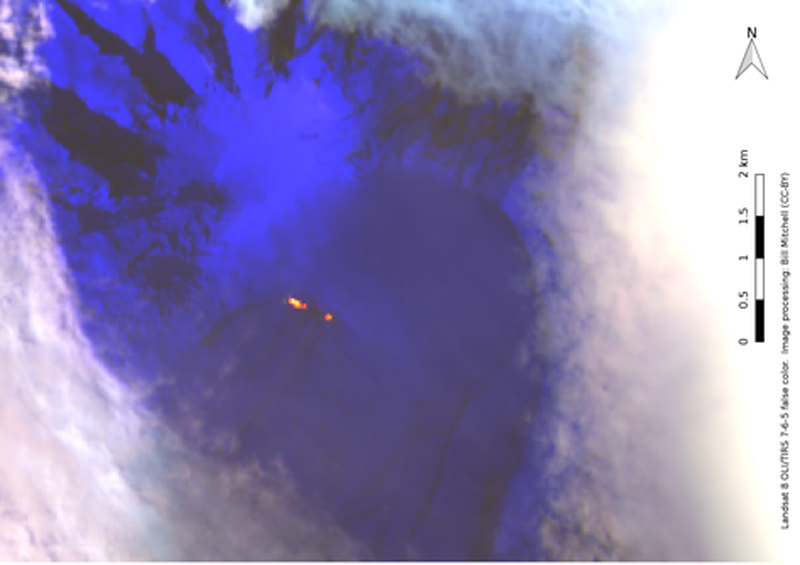
Sentinel-2 infrared images showed one or two prominent heat sources within the summit crater, accompanied by adjacent smaller sources, similar to recent years (see BGVN 46:01, 47:02, and 48:01). A unique image was obtained on 25 November 2023 by the OLI-2 (Operational Land Imager-2) on Landsat 9, showing the upper part of the volcano surrounded by clouds (figure 32).
Geologic Background. Mount Erebus, the world's southernmost historically active volcano, overlooks the McMurdo research station on Ross Island. It is the largest of three major volcanoes forming the crudely triangular Ross Island. The summit of the dominantly phonolitic volcano has been modified by one or two generations of caldera formation. A summit plateau at about 3,200 m elevation marks the rim of the youngest caldera, which formed during the late-Pleistocene and within which the modern cone was constructed. An elliptical 500 x 600 m wide, 110-m-deep crater truncates the summit and contains an active lava lake within a 250-m-wide, 100-m-deep inner crater; other lava lakes are sometimes present. The glacier-covered volcano was erupting when first sighted by Captain James Ross in 1841. Continuous lava-lake activity with minor explosions, punctuated by occasional larger Strombolian explosions that eject bombs onto the crater rim, has been documented since 1972, but has probably been occurring for much of the volcano's recent history.
Information Contacts: Hawai'i Institute of Geophysics and Planetology (HIGP) - MODVOLC Thermal Alerts System, School of Ocean and Earth Science and Technology (SOEST), Univ. of Hawai'i, 2525 Correa Road, Honolulu, HI 96822, USA (URL: http://modis.higp.hawaii.edu/); Copernicus Browser, Copernicus Data Space Ecosystem, European Space Agency (URL: https://dataspace.copernicus.eu/browser/); NASA Earth Observatory, EOS Project Science Office, NASA Goddard Space Flight Center, Goddard, Maryland, USA (URL: https://earthobservatory.nasa.gov/images/152134/erebus-breaks-through).
Rincon de la Vieja (Costa Rica) — January 2024 Cite this Report
Rincon de la Vieja
Costa Rica
10.83°N, 85.324°W; summit elev. 1916 m
All times are local (unless otherwise noted)
Frequent phreatic explosions during July-December 2023
Rincón de la Vieja is a volcanic complex in Costa Rica with a hot convecting acid lake that exhibits frequent weak phreatic explosions, gas-and-steam emissions, and occasional elevated sulfur dioxide levels (BGVN 45:10, 46:03, 46:11). The current eruption period began June 2021. This report covers activity during July-December 2023 and is based on weekly bulletins and occasional daily reports from the Observatorio Vulcanologico Sismologica de Costa Rica-Universidad Nacional (OVSICORI-UNA).
Numerous weak phreatic explosions continued during July-December 2023, along with gas-and-steam emissions and plumes that rose as high as 3 km above the crater rim. Many weekly OVSICORI-UNA bulletins included the previous week's number of explosions and emissions (table 9). For many explosions, the time of explosion was given (table 10). Frequent seismic activity (long-period earthquakes, volcano-tectonic earthquakes, and tremor) accompanied the phreatic activity.
Table 9. Number of reported weekly phreatic explosions and gas-and-steam emissions at Rincón de la Vieja, July-December 2023. Counts are reported for the week before the Weekly Bulletin date; not all reports included these data. Courtesy of OVSICORI-UNA.
| OVSICORI Weekly Bulletin |
Number of explosions |
Number of emissions |
| 28 Jul 2023 |
6 |
14 |
| 4 Aug 2023 |
10 |
12 |
| 1 Sep 2023 |
13 |
11 |
| 22 Sep 2023 |
12 |
13 |
| 29 Sep 2023 |
6 |
11 |
| 6 Oct 2023 |
12 |
5 |
| 13 Oct 2023 |
7 |
9 |
| 20 Oct 2023 |
1 |
15 |
| 27 Oct 2023 |
3 |
23 |
| 3 Nov 2023 |
3 |
10 |
| 17 Nov 2023 |
0 |
Some |
| 24 Nov 2023 |
0 |
14 |
| 8 Dec 2023 |
4 |
16 |
| 22 Dec 2023 |
8 |
18 |
Table 10. Summary of activity at Rincón de la Vieja during July-December 2023. Weak phreatic explosions and gas emissions are noted where the time of explosion was indicated in the weekly or daily bulletins. Height of plumes or emissions are distance above the crater rim. Courtesy of OVSICORI-UNA.
| Date |
Time |
Description of Activity |
| 1 Jul 2023 |
0156 |
Explosion. |
| 2 Jul 2023 |
0305 |
Explosion. |
| 4 Jul 2023 |
0229, 0635 |
Event at 0635 produced a gas-and-steam plume that rose 700 m and drifted W; seen by residents in Liberia (21 km SW). |
| 9 Jul 2023 |
1843 |
Explosion. |
| 21 Jul 2023 |
0705 |
Explosion. |
| 26 Jul 2023 |
1807 |
Explosion. |
| 28 Jul 2023 |
0802 |
Explosion generated a gas-and-steam plume that rose 500 m. |
| 30 Jul 2023 |
1250 |
Explosion. |
| 31 Jul 2023 |
2136 |
Explosion. |
| 11 Aug 2023 |
0828 |
Explosion. |
| 18 Aug 2023 |
1304 |
Explosion. |
| 21 Aug 2023 |
1224 |
Explosion generated gas-and-steam plumes rose 500-600 m. |
| 22 Aug 2023 |
0749 |
Explosion generated gas-and-steam plumes rose 500-600 m. |
| 24 Aug 2023 |
1900 |
Explosion. |
| 25 Aug 2023 |
0828 |
Event produced a steam-and-gas plume that rose 3 km and drifted NW. |
| 27-28 Aug 2023 |
0813 |
Four small events; the event at 0813 on 28 August lasted two minutes and generated a steam-and-gas plume that rose 2.5 km. |
| 1 Sep 2023 |
1526 |
Explosion generated plume that rose 2 km and ejected material onto the flanks. |
| 2-3 Sep 2023 |
- |
Small explosions detected in infrasound data. |
| 4 Sep 2023 |
1251 |
Gas-and-steam plume rose 1 km and drifted W. |
| 7 Nov 2023 |
1113 |
Explosion. |
| 8 Nov 2023 |
0722 |
Explosion. |
| 12 Nov 2023 |
0136 |
Small gas emissions. |
| 14 Nov 2023 |
0415 |
Small gas emissions. |
According to OVSICORI-UNA, during July-October the average weekly sulfur dioxide (SO2) flux ranged from 68 to 240 tonnes/day. However, in mid-November the flux increased to as high as 334 tonnes/day, the highest value measured in recent years. The high SO2 flux in mid-November was also detected by the TROPOMI instrument on the Sentinel-5P satellite (figure 43).
Geologic Background. Rincón de la Vieja, the largest volcano in NW Costa Rica, is a remote volcanic complex in the Guanacaste Range. The volcano consists of an elongated, arcuate NW-SE-trending ridge constructed within the 15-km-wide early Pleistocene Guachipelín caldera, whose rim is exposed on the south side. Sometimes known as the "Colossus of Guanacaste," it has an estimated volume of 130 km3 and contains at least nine major eruptive centers. Activity has migrated to the SE, where the youngest-looking craters are located. The twin cone of Santa María volcano, the highest peak of the complex, is located at the eastern end of a smaller, 5-km-wide caldera and has a 500-m-wide crater. A Plinian eruption producing the 0.25 km3 Río Blanca tephra about 3,500 years ago was the last major magmatic eruption. All subsequent eruptions, including numerous historical eruptions possibly dating back to the 16th century, have been from the prominent active crater containing a 500-m-wide acid lake located ENE of Von Seebach crater.
Information Contacts: Observatorio Vulcanológico Sismológica de Costa Rica-Universidad Nacional (OVSICORI-UNA), Apartado 86-3000, Heredia, Costa Rica (URL: http://www.ovsicori.una.ac.cr/); NASA Global Sulfur Dioxide Monitoring Page, Atmospheric Chemistry and Dynamics Laboratory, NASA Goddard Space Flight Center (NASA/GSFC), 8800 Greenbelt Road, Goddard MD 20771, USA (URL: https://so2.gsfc.nasa.gov/).
Bezymianny (Russia) — November 2023 Cite this Report
Bezymianny
Russia
55.972°N, 160.595°E; summit elev. 2882 m
All times are local (unless otherwise noted)
Explosion on 18 October 2023 sends ash plume 8 km high; lava flows and incandescent avalanches
Bezymianny, located on Russia’s Kamchatka Peninsula, has had eruptions since 1955 characterized by dome growth, explosions, pyroclastic flows, ash plumes, and ashfall. Activity during November 2022-April 2023 included gas-and-steam emissions, lava dome collapses generating avalanches, and persistent thermal activity. Similar eruptive activity continued from May through October 2023, described here based on information from weekly and daily reports of the Kamchatka Volcano Eruptions Response Team (KVERT), notices from Tokyo VAAC (Volcanic Ash Advisory Center), and from satellite data.
Overall activity decreased after the strong period of activity in late March through April 2023, which included ash explosions during 29 March and 7-8 April 2023 that sent plumes as high as 10-12 km altitude, along with dome growth and lava flows (BGVN 48:05). This reduced activity can be seen in the MIROVA thermal detection system graph (figure 56), which was consistent with data from the MODVOLC thermal detection system and with Sentinel-2 satellite images that showed persistent hotspots in the summit crater when conditions allowed observations. A renewed period of strong activity began in mid-October 2023.
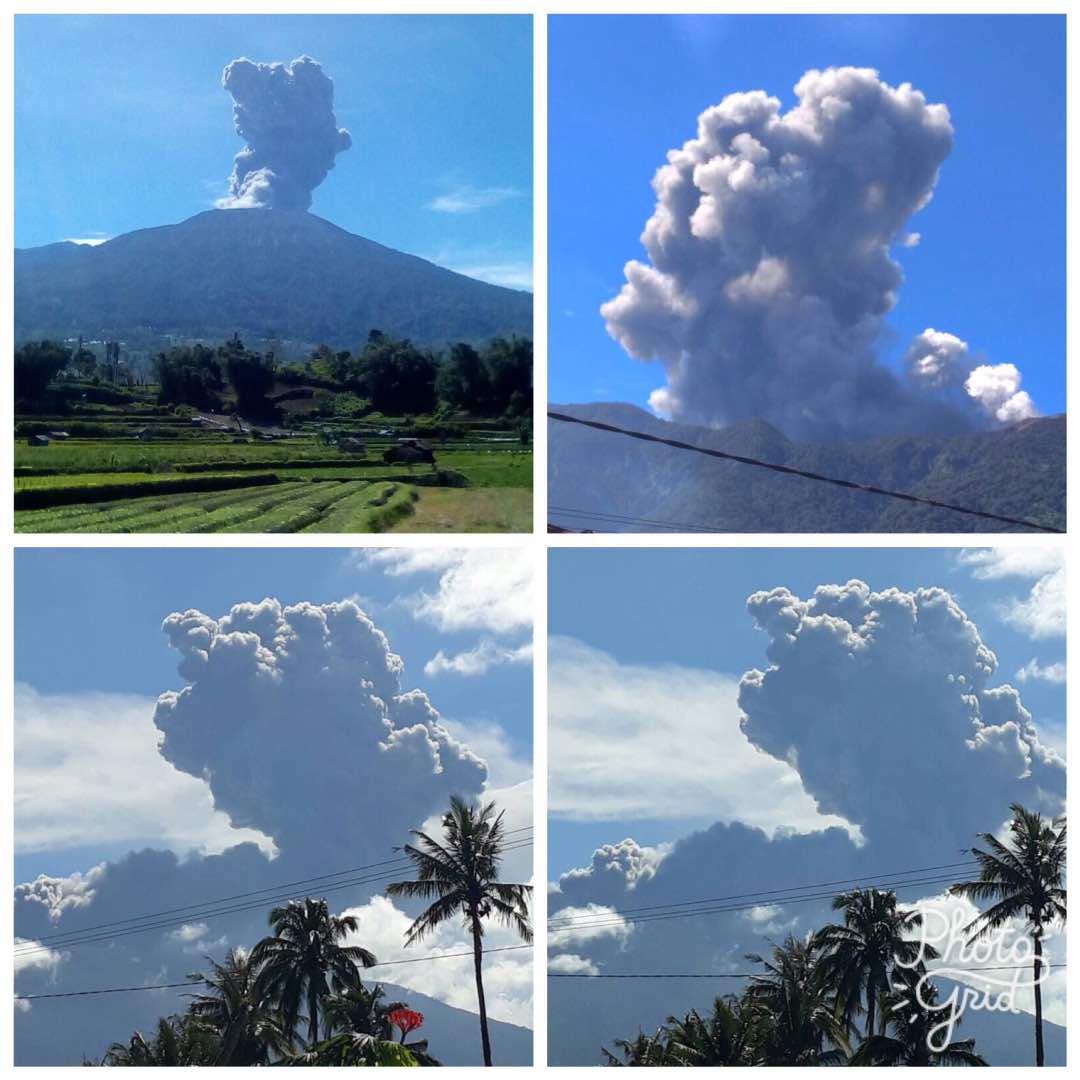
Activity increased significantly on 17 October 2023 when large collapses began during 0700-0830 on the E flanks of the lava dome and continued to after 0930 the next day (figure 57). Ash plumes rose to an altitude of 4.5-5 km, extending 220 km NNE by 18 October. A large explosion at 1630 on 18 October produced an ash plume that rose to an altitude of 11 km (8 km above the summit) and drifted NNE and then NW, extending 900 km NW within two days at an altitude of 8 km. Minor ashfall was noted in Kozyrevsk (45 km WNW). At 0820 on 20 October an ash plume was identified in satellite images drifting 100 km ENE at altitudes of 4-4.5 km.
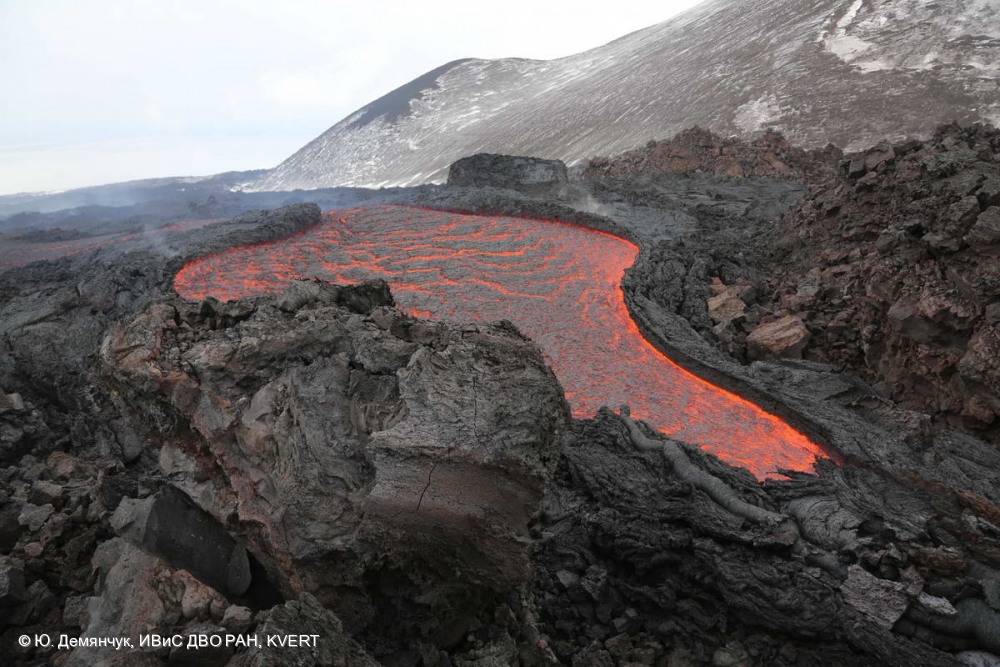
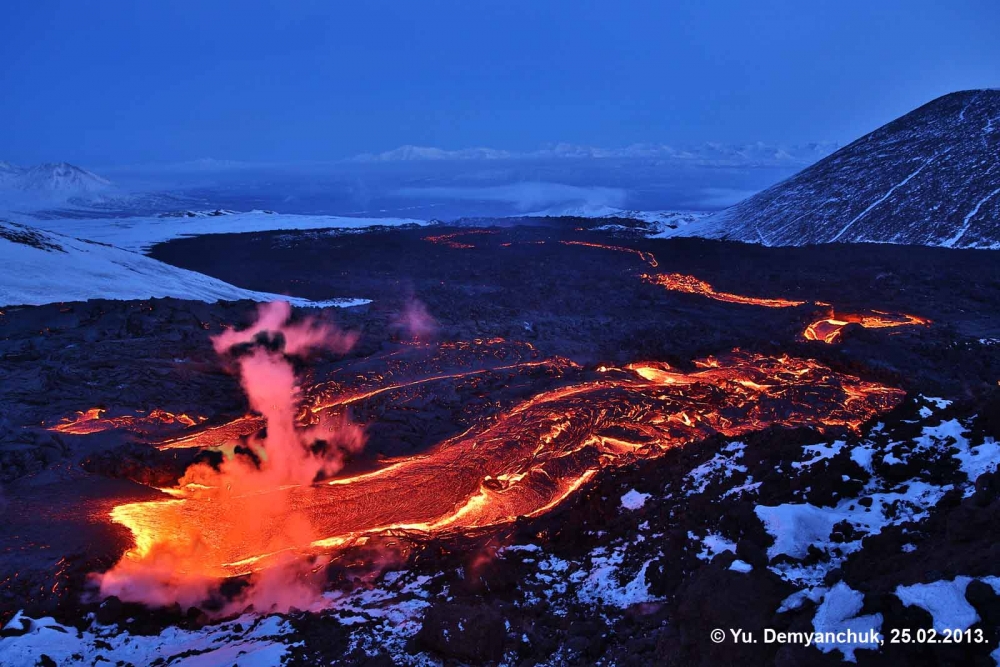
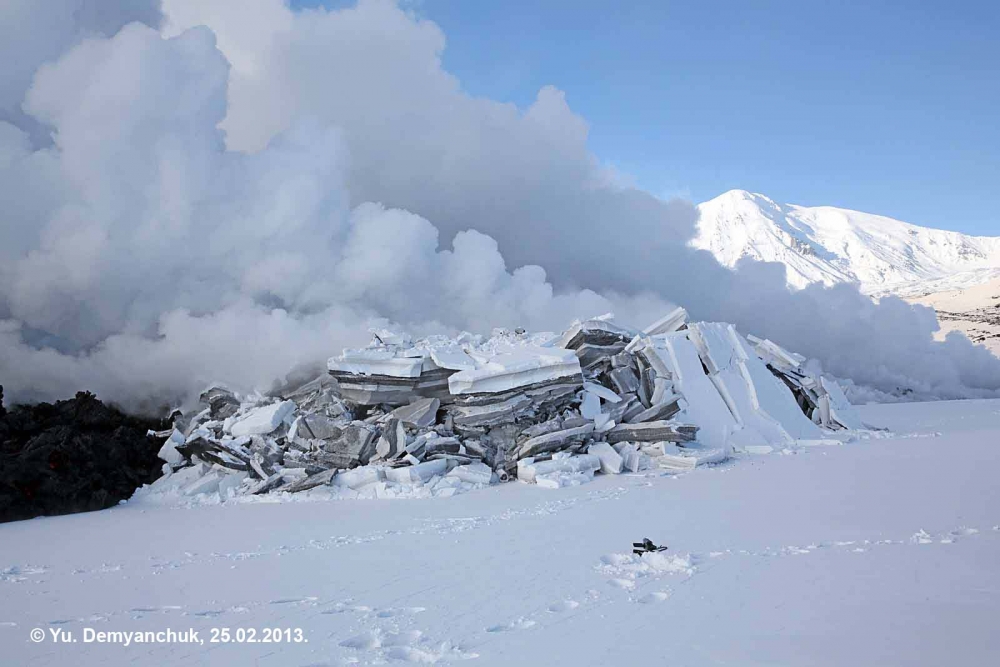
Lava flows and hot avalanches from the dome down the SE flank continued over the next few days, including 23 October when clear conditions allowed good observations (figures 58 and 59). A large thermal anomaly was observed over the volcano through 24 October, and in the summit crater on 30 October (figure 60). Strong fumarolic activity continued, with numerous avalanches and occasional incandescence. By the last week of October, volcanic activity had decreased to a level consistent with that earlier in the reporting period.
Aviation warnings were frequently updated during 17-20 October. KVERT issued a Volcano Observatory Notice for Aviation (VONA) on 17 October at 1419 and 1727 (0219 and 0527 UTC) raising the Aviation Color Code (ACC) from Yellow to Orange (second highest level). The next day, KVERT issued a VONA at 1705 (0505 UTC) raising the ACC to Red (highest level) but lowered it back to Orange at 2117 (0917 UTC). After another decrease to Yellow and back to Orange, the ACC was reduced to Yellow on 20 October at 1204 (0004 UTC). In addition, the Tokyo VAAC issued a series of Volcanic Ash Advisories beginning on 16 October and continuing through 30 October.
Geologic Background. The modern Bezymianny, much smaller than its massive neighbors Kamen and Kliuchevskoi on the Kamchatka Peninsula, was formed about 4,700 years ago over a late-Pleistocene lava-dome complex and an edifice built about 11,000-7,000 years ago. Three periods of intensified activity have occurred during the past 3,000 years. The latest period, which was preceded by a 1,000-year quiescence, began with the dramatic 1955-56 eruption. This eruption, similar to that of St. Helens in 1980, produced a large open crater that was formed by collapse of the summit and an associated lateral blast. Subsequent episodic but ongoing lava-dome growth, accompanied by intermittent explosive activity and pyroclastic flows, has largely filled the 1956 crater.
Information Contacts: Kamchatka Volcanic Eruptions Response Team (KVERT), Far Eastern Branch, Russian Academy of Sciences, 9 Piip Blvd., Petropavlovsk-Kamchatsky, 683006, Russia (URL: http://www.kscnet.ru/ivs/kvert/); Kamchatka Volcanological Station, Kamchatka Branch of Geophysical Survey, (KB GS RAS), Klyuchi, Kamchatka Krai, Russia (URL: http://volkstat.ru/); Tokyo Volcanic Ash Advisory Center (VAAC), 1-3-4 Otemachi, Chiyoda-ku, Tokyo 100-8122, Japan (URL: http://ds.data.jma.go.jp/svd/vaac/data/); Hawai'i Institute of Geophysics and Planetology (HIGP) - MODVOLC Thermal Alerts System, School of Ocean and Earth Science and Technology (SOEST), Univ. of Hawai'i, 2525 Correa Road, Honolulu, HI 96822, USA (URL: http://modis.higp.hawaii.edu/); MIROVA (Middle InfraRed Observation of Volcanic Activity), a collaborative project between the Universities of Turin and Florence (Italy) supported by the Centre for Volcanic Risk of the Italian Civil Protection Department (URL: http://www.mirovaweb.it/); Copernicus Browser, Copernicus Data Space Ecosystem, European Space Agency (URL: https://dataspace.copernicus.eu/browser/).chr
Kilauea (United States) — January 2023 Cite this Report
Kilauea
United States
19.421°N, 155.287°W; summit elev. 1222 m
All times are local (unless otherwise noted)
Low-level lava effusions in the lava lake at Halema’uma’u during July-December 2022
Kīlauea is the southeastern-most volcano in Hawaii and overlaps the E flank of the Mauna Loa volcano. Its East Rift Zone (ERZ) has been intermittently active for at least 2,000 years. An extended eruption period began in January 1983 and was characterized by open lava lakes and lava flows from the summit caldera and the East Rift Zone. During May 2018 magma migrated into the Lower East Rift Zone (LERZ) and opened 24 fissures along a 6-km-long NE-trending fracture zone that produced lava flows traveling in multiple directions. As lava emerged from the fissures, the lava lake at Halema'uma'u drained and explosions sent ash plumes to several kilometers altitude (BGVN 43:10).
The current eruption period started during September 2021 and has recently been characterized by lava effusions, spatter, and sulfur dioxide emissions in the active Halema’uma’u lava lake (BGVN 47:08). Lava effusions, some spatter, and sulfur dioxide emissions have continued during this reporting period of July through December 2022 using daily reports, volcanic activity notices, and abundant photo, map, and video data from the US Geological Survey's (USGS) Hawaiian Volcano Observatory (HVO).
Summary of activity during July-December 2022. Low-level effusions have continued at the western vent of the Halema’uma’u crater during July through early December 2022. Occasional weak ooze-outs (also called lava break outs) would occur along the margins of the crater floor. The overall level of the active lava lake throughout the reporting period gradually increased due to infilling, however it stagnated in mid-September (table 13). During September through November, activity began to decline, though lava effusions persisted at the western vent. By 9 December, the active part of the lava lake had completely crusted over, and incandescence was no longer visible.
Table 13. Summary of measurements taken during overflights at Kīlauea that show a gradual increase in the active lava lake level and the volume of lava effused since 29 September 2021. Lower activity was reported during September-October. Data collected during July-December 2022. Courtesy of HVO.
| Date: |
Level of the active lava lake (m): |
Cumulative volume of lava effused (million cubic meters): |
| 7 Jul 2022 |
130 |
95 |
| 19 Jul 2022 |
133 |
98 |
| 4 Aug 2022 |
136 |
102 |
| 16 Aug 2022 |
137 |
104 |
| 12 Sep 2022 |
143 |
111 |
| 5 Oct 2022 |
143 |
111 |
| 28 Oct 2022 |
143 |
111 |
Activity during July 2022. Lava effusions were reported from the western vent in the Halema’uma’u crater, along with occasional weak ooze-outs along the margins of the crater floor. The height of the lava lake was variable due to deflation-inflation tilt events; for example, the lake level dropped approximately 3-4 m during a summit deflation-inflation event reported on 1 July. Webcam images taken during the night of 6-12 July showed intermittent low-level spattering at the western vent that rose less than 10 m above the vent (figure 519). Measurements made during an overflight on 7 July indicated that the crater floor was infilled about 130 m and that 95 million cubic meters of lava had been effused since 29 September 2021. A single, relatively small lava ooze-out was active to the S of the lava lake. Around midnight on 8 July there were two brief periods of lava overflow onto the lake margins. On 9 July lava ooze-outs were reported near the SE and NE edges of the crater floor and during 10-11 July they occurred near the E, NE, and NW edges. On 16 July crater incandescence was reported, though the ooze-outs and spattering were not visible. On 18 July overnight webcam images showed incandescence in the western vent complex and two ooze-outs were reported around 0000 and 0200 on 19 July. By 0900 there were active ooze-outs along the SW edge of the crater floor. Measurements made from an overflight on 19 July indicated that the crater floor was infilled about 133 m and 98 million cubic meters of lava had erupted since 29 September 2021 (figure 520). On 20 July around 1600 active ooze-outs were visible along the N edge of the crater, which continued through the next day. Extensive ooze-outs occurred along the W margin during 24 July until 1900; on 26 July minor ooze-outs were noted along the N margin. Minor spattering was visible on 29 July along the E margin of the lake. The sulfur dioxide emission rates ranged 650-2,800 tons per day (t/d), the higher of which was measured on 8 July (figure 519).
Activity during August 2022. The eruption continued in the Halema’uma’u crater at the western vent. According to HVO the lava in the active lake remained at the level of the bounding levees. Occasional minor ooze-outs were observed along the margins of the crater floor. Strong nighttime crater incandescence was visible after midnight on 6 August over the western vent cone. During 6-7 August scattered small lava lobes were active along the crater floor and incandescence persisted above the western vent through 9 August. During 7-9 August HVO reported a single lava effusion source was active along the NW margin of the crater floor. Measurements from an overflight on 4 August indicated that the crater floor was infilled about 136 m total and that 102 million cubic meters of lava had been erupted since the start of the eruption. Lava breakouts were reported along the N, NE, E, S, and W margins of the crater during 10-16 August. Another overflight survey conducted on 16 August indicated that the crater floor infilled about 137 m and 104 million cubic meters of lava had been erupted since September 2021. Measured sulfur dioxide emissions rates ranged 1,150-2,450 t/d, the higher of which occurred on 8 August.
Activity during September 2022. During September, lava effusion continued from the western vent into the active lava lake and onto the crater floor. Intermittent minor ooze-outs were reported through the month. A small ooze-out was visible on the W crater floor margin at 0220 on 2 September, which showed decreasing surface activity throughout the day, but remained active through 3 September. On 3 September around 1900 a lava outbreak occurred along the NW margin of the crater floor but had stopped by the evening of 4 September. Field crews monitoring the summit lava lake on 9 September observed spattering on the NE margin of the lake that rose no higher than 10 m, before falling back onto the lava lake crust (figure 521). Overflight measurements on 12 September indicated that the crater floor was infilled a total of 143 m and 111 million cubic meters of lava had been erupted since September 2021. Extensive breakouts in the W and N part of the crater floor were reported at 1600 on 20 September and continued into 26 September. The active part of the lava lake dropped by 10 m while other parts of the crater floor dropped by several meters. Summit tiltmeters recorded a summit seismic swarm of more than 80 earthquakes during 1500-1800 on 21 September, which occurred about 1.5 km below Halema’uma’u; a majority of these were less than Mw 2. By 22 September the active part of the lava lake was infilled about 2 m. On 23 September the western vent areas exhibited several small spatter cones with incandescent openings, along with weak, sporadic spattering (figure 522). The sulfur dioxide emission rate ranged from 930 t/d to 2,000 t/d, the higher of which was measured on 6 September.
Activity during October 2022. Activity during October declined slightly compared to previous months, though lava effusions persisted from the western vent into the active lava lake and onto the crater floor during October (figure 523). Slight variations in the lava lake were noted throughout the month. HVO reported that around 0600 on 3 October the level of the lava lake has lowered slightly. Overflight measurements taken on 5 October indicated that the crater floor was infilled a total of about 143 m and that 111 million cubic meters of lava had been effused since September 2021. During 6-7 October the lake gradually rose 0.5 m. Sulfur dioxide measurements made on 22 October had an emission rate of 700 t/d. Another overflight taken on 28 October showed that there was little to no change in the elevation of the crater floor: the crater floor was infilled a total of 143 m and 111 million cubic meters of lava had erupted since the start of the eruption.
Activity during November 2022. Activity remained low during November, though HVO reported that lava from the western vent continued to effuse into the active lava lake and onto the crater floor throughout the month. The rate of sulfur dioxide emissions during November ranged from 300-600 t/d, the higher amount of which occurred on 9 November.
Activity during December 2022. Similar low activity was reported during December, with lava effusing from the western vent into the active lava lake and onto the crater floor. During 4-5 December the active part of the lava lake was slightly variable in elevation and fluctuated within 1 m. On 9 December HVO reported that lava was no longer erupting from the western vent in the Halema’uma’u crater and that sulfur dioxide emissions had returned to near pre-eruption background levels; during 10-11 December, the lava lake had completely crusted over, and no incandescence was visible (figure 524). Time lapse camera images covering the 4-10 December showed that the crater floor showed weak deflation and no inflation. Some passive events of crustal overturning were reported during 14-15 December, which brought fresh incandescent lava to the lake surface. The sulfur dioxide emission rate was approximately 200 t/d on 14 December. A smaller overturn event on 17 December and another that occurred around 0000 and into the morning of 20 December were also detected. A small seismic swarm was later detected on 30 December.
Geologic Background. Kilauea overlaps the E flank of the massive Mauna Loa shield volcano in the island of Hawaii. Eruptions are prominent in Polynesian legends; written documentation since 1820 records frequent summit and flank lava flow eruptions interspersed with periods of long-term lava lake activity at Halemaumau crater in the summit caldera until 1924. The 3 x 5 km caldera was formed in several stages about 1,500 years ago and during the 18th century; eruptions have also originated from the lengthy East and Southwest rift zones, which extend to the ocean in both directions. About 90% of the surface of the basaltic shield volcano is formed of lava flows less than about 1,100 years old; 70% of the surface is younger than 600 years. The long-term eruption from the East rift zone between 1983 and 2018 produced lava flows covering more than 100 km2, destroyed hundreds of houses, and added new coastline.
Information Contacts: Hawaiian Volcano Observatory (HVO), U.S. Geological Survey, PO Box 51, Hawai'i National Park, HI 96718, USA (URL: http://hvo.wr.usgs.gov/).
Nyamulagira (DR Congo) — November 2023 Cite this Report
Nyamulagira
DR Congo
1.408°S, 29.2°E; summit elev. 3058 m
All times are local (unless otherwise noted)
Lava flows and thermal activity during May-October 2023
Nyamulagira (also known as Nyamuragira) is a shield volcano in the Democratic Republic of Congo with the summit truncated by a small 2 x 2.3 km caldera with walls up to about 100 m high. Documented eruptions have occurred within the summit caldera, as well as from numerous flank fissures and cinder cones. The current eruption period began in April 2018 and has more recently been characterized by summit crater lava flows and thermal activity (BGVN 48:05). This report describes lava flows and variable thermal activity during May through October 2023, based on information from the Observatoire Volcanologique de Goma (OVG) and various satellite data.
Lava lake activity continued during May. The MIROVA (Middle InfraRed Observation of Volcanic Activity) system recorded moderate-to-strong thermal activity throughout the reporting period; activity was more intense during May and October and relatively weaker from June through September (figure 95). The MODVOLC thermal algorithm, detected a total of 209 thermal alerts. There were 143 hotspots detected during May, eight during June, nine during September, and 49 during October. This activity was also reflected in infrared satellite images, where a lava flow was visible in the NW part of the crater on 7 May and strong activity was seen in the center of the crater on 4 October (figure 96). Another infrared satellite image taken on 12 May showed still active lava flows along the NW margin of the crater. According to OVG lava effusions were active during 7-29 May and moved to the N and NW parts of the crater beginning on 9 May. Strong summit crater incandescence was visible from Goma (27 km S) during the nights of 17, 19, and 20 May (figure 97). On 17 May there was an increase in eruptive activity, which peaked at 0100 on 20 May. Notable sulfur dioxide plumes drifted NW and W during 19-20 May (figure 98). Drone footage acquired in partnership with the USGS (United States Geological Survey) on 20 May captured images of narrow lava flows that traveled about 100 m down the W flank (figure 99). Data from the Rumangabo seismic station indicated a decreasing trend in activity during 17-21 May. Although weather clouds prevented clear views of the summit, a strong thermal signature on the NW flank was visible in an infrared satellite image on 22 May, based on an infrared satellite image. On 28 May the lava flows on the upper W flank began to cool and solidify. By 29 May seismicity returned to levels similar to those recorded before the 17 May increase. Lava effusion continued but was confined to the summit crater; periodic crater incandescence was observed.
Low-level activity was noted during June through October. On 1 June OVG reported that seismicity remained at lower levels and that crater incandescence had been absent for three days, though infrared satellite imagery showed continued lava effusion in the summit crater. The lava flows on the flanks covered an estimated 0.6 km2. Satellite imagery continued to show thermal activity confined to the lava lake through October (figure 96), although no lava flows or significant sulfur dioxide emissions were reported.
Geologic Background. Africa's most active volcano, Nyamulagira (also known as Nyamuragira), is a massive high-potassium basaltic shield about 25 km N of Lake Kivu and 13 km NNW of the steep-sided Nyiragongo volcano. The summit is truncated by a small 2 x 2.3 km caldera that has walls up to about 100 m high. Documented eruptions have occurred within the summit caldera, as well as from the numerous flank fissures and cinder cones. A lava lake in the summit crater, active since at least 1921, drained in 1938, at the time of a major flank eruption. Recent lava flows extend down the flanks more than 30 km from the summit as far as Lake Kivu; extensive lava flows from this volcano have covered 1,500 km2 of the western branch of the East African Rift.
Information Contacts: Observatoire Volcanologique de Goma (OVG), Departement de Geophysique, Centre de Recherche en Sciences Naturelles, Lwiro, D.S. Bukavu, DR Congo; Hawai'i Institute of Geophysics and Planetology (HIGP) - MODVOLC Thermal Alerts System, School of Ocean and Earth Science and Technology (SOEST), Univ. of Hawai'i, 2525 Correa Road, Honolulu, HI 96822, USA (URL: http://modis.higp.hawaii.edu/); MIROVA (Middle InfraRed Observation of Volcanic Activity), a collaborative project between the Universities of Turin and Florence (Italy) supported by the Centre for Volcanic Risk of the Italian Civil Protection Department (URL: http://www.mirovaweb.it/); NASA Global Sulfur Dioxide Monitoring Page, Atmospheric Chemistry and Dynamics Laboratory, NASA Goddard Space Flight Center (NASA/GSFC), 8800 Greenbelt Road, Goddard, Maryland, USA (URL: https://so2.gsfc.nasa.gov/); Copernicus Browser, Copernicus Data Space Ecosystem, European Space Agency (URL: https://dataspace.copernicus.eu/browser/); Charles Balagizi, Goma Volcano Observatory, Departement de Geophysique, Centre de Recherche en Sciences Naturelles, Lwiro, D.S. Bukavu, DR Congo.
Bagana (Papua New Guinea) — October 2023 Cite this Report
Bagana
Papua New Guinea
6.137°S, 155.196°E; summit elev. 1855 m
All times are local (unless otherwise noted)
Explosions, ash plumes, ashfall, and lava flows during April-September 2023
The remote volcano of Bagana is located in central Bougainville Island, Papua New Guinea. Recorded eruptions date back to 1842 and activity has consisted of effusive activity that has built a small lava dome in the summit crater and occasional explosions that produced pyroclastic flows. The most recent eruption has been ongoing since February 2000 and has produced occasional explosions, ash plumes, and lava flows. More recently, activity has been characterized by ongoing effusive activity and ash emissions (BGVN 48:04). This report updates activity from April through September 2023 that has consisted of explosions, ash plumes, ashfall, and lava flows, using information from the Darwin Volcanic Ash Advisory Center (VAAC) and satellite data.
An explosive eruption was reported on 7 July that generated a large gas-and-ash plume to high altitudes and caused significant ashfall in local communities; the eruption plume had reached upper tropospheric (16-18 km altitude) altitudes by 2200, according to satellite images. Sulfur dioxide plumes were detected in satellite images on 8 July and indicated that the plume was likely a mixture of gas, ice, and ash. A report issued by the Autonomous Bougainville Government (ABG) (Torokina District, Education Section) on 10 July noted that significant ash began falling during 2000-2100 on 7 July and covered most areas in the Vuakovi, Gotana (9 km SW), Koromaketo, Laruma (25 km W) and Atsilima (27 km NW) villages. Pyroclastic flows also occurred, according to ground-based reports; small deposits confined to one drainage were inspected by RVO during an overflight on 17 July and were confirmed to be from the 7 July event. Ashfall continued until 10 July and covered vegetation, which destroyed bushes and gardens and contaminated rivers and streams.
RVO reported another eruption on 14 July. The Darwin VAAC stated that an explosive event started around 0830 on 15 July and produced an ash plume that rose to 16.5 km altitude by 1000 and drifted N, according to satellite images. The plume continued to drift N and remained visible through 1900, and by 2150 it had dissipated.
Ashfall likely from both the 7 and 15 July events impacted about 8,111 people in Torokina (20 km SW), including Tsito/Vuakovi, Gotana, Koromaketo, Kenaia, Longkogari, Kenbaki, Piva (13 km SW), and Atsinima, and in the Tsitovi district, according to ABG. Significant ashfall was also reported in Ruruvu (22 km N) in the Wakunai District of Central Bougainville, though the thickness of these deposits could not be confirmed. An evacuation was called for the villages in Wakunai, where heavy ashfall had contaminated water sources; the communities of Ruruvu, Togarau, Kakarapaia, Karauturi, Atao, and Kuritaturi were asked to evacuate to a disaster center at the Wakunai District Station, and communities in Torokina were asked to evacuate to the Piva District station. According to a news article, more than 7,000 people needed temporary accommodations, with about 1,000 people in evacuation shelters. Ashfall had deposited over a broad area, contaminating water supplies, affecting crops, and collapsing some roofs and houses in rural areas. Schools were temporarily shut down. Intermittent ash emissions continued through the end of July and drifted NNW, NW, and SW. Fine ashfall was reported on the coast of Torokina, and ash plumes also drifted toward Laruma and Atsilima.
A small explosive eruption occurred at 2130 on 28 July that ejected material from the crater vents, according to reports from Torokina, in addition to a lava flow that contained two lobes. A second explosion was detected at 2157. Incandescence from the lava flow was visible from Piva as it descended the W flank around 2000 on 29 July (figure 47). The Darwin VAAC reported that a strong thermal anomaly was visible in satellite images during 30-31 July and that ash emissions rose to 2.4 km altitude and drifted WSW on 30 July. A ground report from RVO described localized emissions at 0900 on 31 July.
The Darwin VAAC reported that ash plumes were identified in satellite imagery at 0800 and 1220 on 12 August and rose to 2.1 km and 3 km altitude and drifted NW and W, respectively. A news report stated that aid was sent to more than 6,300 people that were adversely affected by the eruption. Photos taken during 17-19 August showed ash emissions rising no higher than 1 km above the summit and drifting SE. A small explosion generated an ash plume during the morning of 19 August. Deposits from small pyroclastic flows were also captured in the photos. Satellite images captured lava flows and pyroclastic flow deposits. Two temporary seismic stations were installed near Bagana on 17 August at distances of 7 km WSW (Vakovi station) and 11 km SW (Kepox station). The Kepox station immediately started to record continuous, low-frequency background seismicity.
Satellite data. Little to no thermal activity was detected during April through mid-July 2023; only one anomaly was recorded during early April and one during early June, according to MIROVA (Middle InfraRed Observation of Volcanic Activity) data (figure 48). Thermal activity increased in both power and frequency during mid-July through September, although there were still some short gaps in detected activity. MODVOLC also detected increased thermal activity during August; thermal hotspots were detected a total of five times on 19, 20, and 27 August. Weak thermal anomalies were also captured in infrared satellite images on clear weather days throughout the reporting period on 7, 12, and 17 April, 27 May, 1, 6, 16, and 31 July, and 19 September (figure 48); a strong thermal anomaly was visible on 31 July. Distinct sulfur dioxide plumes that drifted generally NW were intermittently captured by the TROPOMI instrument on the Sentinel-5P satellite and sometimes exceeded two Dobson Units (DUs) (figure 49).
Geologic Background. Bagana volcano, in a remote portion of central Bougainville Island, is frequently active. This massive symmetrical cone was largely constructed by an accumulation of viscous andesitic lava flows. The entire edifice could have been constructed in about 300 years at its present rate of lava production. Eruptive activity is characterized by non-explosive effusion of viscous lava that maintains a small lava dome in the summit crater, although occasional explosive activity produces pyroclastic flows. Lava flows with tongue-shaped lobes up to 50 m thick and prominent levees descend the flanks on all sides.
Information Contacts: Rabaul Volcano Observatory (RVO), Geohazards Management Division, Department of Mineral Policy and Geohazards Management (DMPGM), PO Box 3386, Kokopo, East New Britain Province, Papua New Guinea; Darwin Volcanic Ash Advisory Centre (VAAC), Bureau of Meteorology, Northern Territory Regional Office, PO Box 40050, Casuarina, NT 0811, Australia (URL: http://www.bom.gov.au/info/vaac/); MIROVA (Middle InfraRed Observation of Volcanic Activity), a collaborative project between the Universities of Turin and Florence (Italy) supported by the Centre for Volcanic Risk of the Italian Civil Protection Department (URL: http://www.mirovaweb.it/); Hawai'i Institute of Geophysics and Planetology (HIGP) - MODVOLC Thermal Alerts System, School of Ocean and Earth Science and Technology (SOEST), Univ. of Hawai'i, 2525 Correa Road, Honolulu, HI 96822, USA (URL: http://modis.higp.hawaii.edu/); NASA Global Sulfur Dioxide Monitoring Page, Atmospheric Chemistry and Dynamics Laboratory, NASA Goddard Space Flight Center (NASA/GSFC), 8800 Greenbelt Road, Goddard, Maryland, USA (URL: https://so2.gsfc.nasa.gov/); Copernicus Browser, Copernicus Data Space Ecosystem, European Space Agency (URL: https://dataspace.copernicus.eu/browser/); Autonomous Bougainville Government, P.O Box 322, Buka, AROB, PNG (URL: https://abg.gov.pg/); Andrew Tupper (Twitter: @andrewcraigtupp); Simon Carn, Geological and Mining Engineering and Sciences, Michigan Technological University, 1400 Townsend Drive, Houghton, MI 49931, USA (URL: http://www.volcarno.com/, Twitter: @simoncarn); Radio NZ (URL: https://www.rnz.co.nz/news/pacific/494464/more-than-7-000-people-in-bougainville-need-temporary-accommodation-after-eruption); USAID, 1300 Pennsylvania Ave, NW, Washington DC 20004, USA (URL: https://www.usaid.gov/pacific-islands/press-releases/aug-08-2023-united-states-provides-immediate-emergency-assistance-support-communities-affected-mount-bagana-volcanic-eruptions).
Mayon (Philippines) — October 2023 Cite this Report
Mayon
Philippines
13.257°N, 123.685°E; summit elev. 2462 m
All times are local (unless otherwise noted)
Lava flows, pyroclastic flows, ash emissions, and seismicity during April-September 2023
Mayon is located in the Philippines and has steep upper slopes capped by a small summit crater. Historical eruptions date back to 1616 CE that have been characterized by Strombolian eruptions, lava flows, pyroclastic flows, and mudflows. Eruptions mostly originated from a central conduit. Pyroclastic flows and mudflows have commonly descended many of the approximately 40 drainages that surround the volcano. The most recent eruption occurred during June through October 2022 and consisted of lava dome growth and gas-and-steam emissions (BGVN 47:12). A new eruption was reported during late April 2023 and has included lava flows, pyroclastic density currents, ash emissions, and seismicity. This report covers activity during April through September 2023 based on daily bulletins from the Philippine Institute of Volcanology and Seismology (PHIVOLCS).
During April through September 2023, PHIVOLCS reported near-daily rockfall events, frequent volcanic earthquakes, and sulfur dioxide measurements. Gas-and-steam emissions rose 100-900 m above the crater and drifted in different directions. Nighttime crater incandescence was often visible during clear weather and was accompanied by incandescent avalanches of material. Activity notably increased during June when lava flows were reported on the S, SE, and E flanks (figure 52). The MIROVA graph (Middle InfraRed Observation of Volcanic Activity) showed strong thermal activity coincident with these lava flows, which remained active through September (figure 53). According to the MODVOLC thermal algorithm, a total of 110 thermal alerts were detected during the reporting period: 17 during June, 40 during July, 27 during August, and 26 during September. During early June, pyroclastic density currents (PDCs) started to occur more frequently.
Low activity was reported during much of April and May; gas-and-steam emissions rose 100-900 m above the crater and generally drifted in different directions. A total of 52 rockfall events and 18 volcanic earthquakes were detected during April and 147 rockfall events and 13 volcanic events during May. Sulfur dioxide flux measurements ranged between 400-576 tons per day (t/d) during April, the latter of which was measured on 29 April and between 162-343 t/d during May, the latter of which was measured on 13 May.
Activity during June increased, characterized by lava flows, pyroclastic density currents (PDCs), crater incandescence and incandescent rockfall events, gas-and-steam emissions, and continued seismicity. Weather clouds often prevented clear views of the summit, but during clear days, moderate gas-and-steam emissions rose 100-2,500 m above the crater and drifted in multiple directions. A total of 6,237 rockfall events and 288 volcanic earthquakes were detected. The rockfall events often deposited material on the S and SE flanks within 700-1,500 m of the summit crater and ash from the events drifted SW, S, SE, NE, and E. Sulfur dioxide emissions ranged between 149-1,205 t/d, the latter of which was measured on 10 June. Short-term observations from EDM and electronic tiltmeter monitoring indicated that the upper slopes were inflating since February 2023. Longer-term ground deformation parameters based on EDM, precise leveling, continuous GPS, and electronic tilt monitoring indicated that the volcano remained inflated, especially on the NW and SE flanks. At 1000 on 5 June the Volcano Alert Level (VAL) was raised to 2 (on a 0-5 scale). PHIVOLCS noted that although low-level volcanic earthquakes, ground deformation, and volcanic gas emissions indicated unrest, the steep increase in rockfall frequency may indicate increased dome activity.
A total of 151 dome-collapse PDCs occurred during 8-9 and 11-30 June, traveled 500-2,000 m, and deposited material on the S flank within 2 km of the summit crater. During 8-9 June the VAL was raised to 3. At approximately 1947 on 11 June lava flow activity was reported; two lobes traveled within 500 m from the crater and deposited material on the S (Mi-isi), SE (Bonga), and E (Basud) flanks. Weak seismicity accompanied the lava flow and slight inflation on the upper flanks. This lava flow remained active through 30 June, moving down the S and SE flank as far as 2.5 km and 1.8 km, respectively and depositing material up to 3.3 km from the crater. During 15-16 June traces of ashfall from the PDCs were reported in Sitio Buga, Nabonton, City of Ligao and Purok, and San Francisco, Municipality of Guinobatan. During 28-29 June there were two PDCs generated by the collapse of the lava flow front, which generated a light-brown ash plume 1 km high. Satellite monitors detected significant concentrations of sulfur dioxide beginning on 29 June. On 30 June PDCs primarily affected the Basud Gully on the E flank, the largest of which occurred at 1301 and lasted eight minutes, based on the seismic record. Four PDCs generated between 1800 and 2000 that lasted approximately four minutes each traveled 3-4 km on the E flank and generated an ash plume that rose 1 km above the crater and drifted N and NW. Ashfall was recorded in Tabaco City.
Similar strong activity continued during July; slow lava effusion remained active on the S and SE flanks and traveled as far as 2.8 km and 2.8 km, respectively and material was deposited as far as 4 km from the crater. There was a total of 6,983 rockfall events and 189 PDCs that affected the S, SE, and E flanks. The volcano network detected a total of 2,124 volcanic earthquakes. Continuous gas-and-steam emissions rose 200-2,000 m above the crater and drifted in multiple directions. Sulfur dioxide emissions averaged 792-4,113 t/d, the latter of which was measured on 28 July. During 2-4 July three PDCs were generated from the collapse of the lava flow and resulting light brown plumes rose 200-300 m above the crater. Continuous tremor pulses were reported beginning at 1547 on 3 July through 7 July at 1200, at 2300 on 8 July and going through 0300 on 10 July, and at 2300 on 16 July, as recorded by the seismic network. During 6-9 July there were 10 lava flow-collapse-related PDCs that generated light brown plumes 300-500 m above the crater. During 10-11 July light ashfall was reported in some areas of Mabinit, Legazpi City, Budiao and Salvacion, Daraga, and Camalig, Albay. By 18 July the lava flow advanced 600 m on the E flank as well.
During 1733 on 18 July and 0434 on 19 July PHIVOLCS reported 30 “ashing” events, which are degassing events accompanied by audible thunder-like sounds and entrained ash at the crater, which produced short, dark plumes that drifted SW. These events each lasted 20-40 seconds, and plume heights ranged from 150-300 m above the crater, as recorded by seismic, infrasound, visual, and thermal monitors. Three more ashing events occurred during 19-20 July. Short-term observations from electronic tilt and GPS monitoring indicate deflation on the E lower flanks in early July and inflation on the NW middle flanks during the third week of July. Longer-term ground deformation parameters from EDM, precise leveling, continuous GPS, and electronic tilt monitoring indicated that the volcano was still generally inflated relative to baseline levels. A short-lived lava pulse lasted 28 seconds at 1956 on 21 July, which was accompanied by seismic and infrasound signals. By 22 July, the only lava flow that remained active was on the SE flank, and continued to extend 3.4 km, while those on the S and E flanks weakened markedly. One ashing event was detected during 30-31 July, whereas there were 57 detected during 31 July-1 August; according to PHIVOLCS beginning at approximately 1800 on 31 July eruptive activity was dominated by phases of intermittent ashing, as well as increased in the apparent rates of lava effusion from the summit crater. The ashing phases consisted of discrete events recorded as low-frequency volcanic earthquakes (LFVQ) typically 30 seconds in duration, based on seismic and infrasound signals. Gray ash plume rose 100 m above the crater and generally drifted NE. Shortly after these ashing events began, new lava began to effuse rapidly from the crater, feeding the established flowed on the SE, E, and E flanks and generating frequent rockfall events.
Intensified unrest persisted during August. There was a total of 4,141 rockfall events, 2,881 volcanic earthquakes, which included volcanic tremor events, 32 ashing events, and 101 PDCs detected throughout the month. On clear weather days, gas-and-steam emissions rose 300-1,500 m above the crater and drifted in different directions (figure 54). Sulfur dioxide emissions averaged 735-4,756 t/d, the higher value of which was measured on 16 August. During 1-2 August the rate of lava effusion decreased, but continued to feed the flows on the SE, S, and E flanks, maintaining their advances to 3.4 km, 2.8 km, and 1.1 km from the crater, respectively (figure 55). Rockfall and PDCs generated by collapses at the lava flow margins and from the summit dome deposited material within 4 km of the crater. During 3-4 August there were 10 tremor events detected that lasted 1-4 minutes. Short-lived lava pulse lasted 35 seconds and was accompanied by seismic and infrasound signals at 0442 on 6 August. Seven collapses were recorded at the front of the lava flow during 12-14 August.
During September, similar activity of slow lava effusion, PDCs, gas-and-steam emissions, and seismicity continued. There was a total of 4,452 rockfall events, 329 volcanic earthquakes, which included volcanic tremor events, two ashing events, and 85 PDCs recorded throughout the month. On clear weather days, gas-and-steam emissions rose 100-1,500 m above the crater and drifted in multiple directions. Sulfur dioxide emissions averaged 609-2,252 t/d, the higher average of which was measured on 6 September. Slow lava effusion continued advancing on the SE, S, and E flanks, maintaining lengths of 3.4 km, 2.8 km, and 1.1 km, respectively. Rockfall and PDC events generated by collapses along the lava flow margins and at the summit dome deposited material within 4 km of the crater.
Geologic Background. Symmetrical Mayon, which rises above the Albay Gulf NW of Legazpi City, is the most active volcano of the Philippines. The steep upper slopes are capped by a small summit crater. Recorded eruptions since 1616 CE range from Strombolian to basaltic Plinian, with cyclical activity beginning with basaltic eruptions, followed by longer periods of andesitic lava flows. Eruptions occur predominately from the central conduit and have also produced lava flows that travel far down the flanks. Pyroclastic density currents and mudflows have commonly swept down many of the approximately 40 ravines that radiate from the summit and have often damaged populated lowland areas. A violent eruption in 1814 killed more than 1,200 people and devastated several towns.
Information Contacts: Philippine Institute of Volcanology and Seismology (PHIVOLCS), Department of Science and Technology, University of the Philippines Campus, Diliman, Quezon City, Philippines (URL: http://www.phivolcs.dost.gov.ph/); MIROVA (Middle InfraRed Observation of Volcanic Activity), a collaborative project between the Universities of Turin and Florence (Italy) supported by the Centre for Volcanic Risk of the Italian Civil Protection Department (URL: http://www.mirovaweb.it/); Hawai'i Institute of Geophysics and Planetology (HIGP) - MODVOLC Thermal Alerts System, School of Ocean and Earth Science and Technology (SOEST), Univ. of Hawai'i, 2525 Correa Road, Honolulu, HI 96822, USA (URL: http://modis.higp.hawaii.edu/); Copernicus Browser, Copernicus Data Space Ecosystem, European Space Agency (URL: https://dataspace.copernicus.eu/browser/); William Rogers, Legazpi City, Albay Province, Philippines.
Nishinoshima (Japan) — October 2023 Cite this Report
Nishinoshima
Japan
27.247°N, 140.874°E; summit elev. 100 m
All times are local (unless otherwise noted)
Eruption plumes and gas-and-steam plumes during May-August 2023
Nishinoshima, located about 1,000 km S of Tokyo, is a small island in the Ogasawara Arc in Japan. The island is the summit of a massive submarine volcano that has prominent submarine peaks to the S, W, and NE. Eruptions date back to 1973 and the current eruption period began in October 2022. Recent activity has consisted of small ash plumes and fumarolic activity (BGVN 48:07). This report covers activity during May through August 2023, using information from monthly reports of the Japan Meteorological Agency (JMA) monthly reports and satellite data.
Activity during May through June was relatively low. The Japan Coast Guard (JCG) did overflights on 14 and 22 June and reported white gas-and-steam emissions rising 600 m and 1,200 m from the central crater of the pyroclastic cone, respectively (figure 125). In addition, multiple white gas-and-steam emissions rose from the inner rim of the W side of the crater and from the SE flank of the pyroclastic cone. Discolored brown-to-green water was observed around almost the entire perimeter of the island; on 22 June light green discolored water was observed off the S coast of the island.
Observations from the Himawari meteorological satellite confirmed an eruption on 9 and 10 July. An eruption plume rose 1.6 km above the crater and drifted N around 1300 on 9 July. Satellite images acquired at 1420 and 2020 on 9 July and at 0220 on 10 July showed continuing emissions that rose 1.3-1.6 km above the crater and drifted NE and N. The Tokyo VAAC reported that an ash plume seen by a pilot and identified in a satellite image at 0630 on 21 July rose to 3 km altitude and drifted S.
Aerial observations conducted by JCG on 8 August showed a white-and-gray plume rising from the central crater of the pyroclastic cone, and multiple white gas-and-steam emissions were rising from the inner edge of the western crater and along the NW-SE flanks of the island (figure 126). Brown-to-green discolored water was also noted around the perimeter of the island.
Intermittent low-to-moderate power thermal anomalies were recorded in the MIROVA graph (Middle InfraRed Observation of Volcanic Activity), showing an increase in both frequency and power beginning in July (figure 127). This increase in activity coincides with eruptive activity on 9 and 10 July, characterized by eruption plumes. According to the MODVOLC thermal alert algorithm, one thermal hotspot was recorded on 20 July. Weak thermal anomalies were also detected in infrared satellite imagery, accompanied by strong gas-and-steam plumes (figure 128).
Geologic Background. The small island of Nishinoshima was enlarged when several new islands coalesced during an eruption in 1973-74. Multiple eruptions that began in 2013 completely covered the previous exposed surface and continued to enlarge the island. The island is the summit of a massive submarine volcano that has prominent peaks to the S, W, and NE. The summit of the southern cone rises to within 214 m of the ocean surface 9 km SSE.
Information Contacts: Japan Meteorological Agency (JMA), 1-3-4 Otemachi, Chiyoda-ku, Tokyo 100-8122, Japan (URL: http://www.jma.go.jp/jma/indexe.html); Tokyo Volcanic Ash Advisory Center (VAAC), 1-3-4 Otemachi, Chiyoda-ku, Tokyo 100-8122, Japan (URL: http://ds.data.jma.go.jp/svd/vaac/data/); MIROVA (Middle InfraRed Observation of Volcanic Activity), a collaborative project between the Universities of Turin and Florence (Italy) supported by the Centre for Volcanic Risk of the Italian Civil Protection Department (URL: http://www.mirovaweb.it/); Copernicus Browser, Copernicus Data Space Ecosystem, European Space Agency (URL: https://dataspace.copernicus.eu/browser/).
Krakatau (Indonesia) — October 2023 Cite this Report
Krakatau
Indonesia
6.1009°S, 105.4233°E; summit elev. 285 m
All times are local (unless otherwise noted)
White gas-and-steam plumes and occasional ash plumes during May-August 2023
Krakatau is located in the Sunda Strait between Java and Sumatra, Indonesia. Caldera collapse during the catastrophic 1883 eruption destroyed Danan and Perbuwatan cones and left only a remnant of Rakata. The post-collapse cone of Anak Krakatau (Child of Krakatau) was constructed within the 1883 caldera at a point between the former Danan and Perbuwatan cones; it has been the site of frequent eruptions since 1927. The current eruption period began in May 2021 and has recently consisted of Strombolian eruptions and ash plumes (BGVN 48:07). This report describes lower levels of activity consisting of ash and white gas-and-steam plumes during May through August 2023, based on information provided by the Indonesian Center for Volcanology and Geological Hazard Mitigation, referred to as Pusat Vulkanologi dan Mitigasi Bencana Geologi (PVMBG), MAGMA Indonesia, and satellite data.
Activity was relatively low during May and June. Daily white gas-and-steam emissions rose 25-200 m above the crater and drifted in different directions. Five ash plumes were detected at 0519 on 10 May, 1241 on 11 May, 0920 on 12 May, 2320 on 12 May, and at 0710 on 13 May, and rose 1-2.5 km above the crater and drifted SW. A webcam image taken on 12 May showed ejection of incandescent material above the vent. A total of nine ash plumes were detected during 6-11 June: at 1434 and 00220 on 6 and 7 June the ash plumes rose 500 m above the crater and drifted NW, at 1537 on 8 June the ash plume rose 1 km above the crater and drifted SW, at 0746 and at 0846 on 9 June the ash plumes rose 800 m and 3 km above the crater and drifted SW, respectively, at 0423, 1431, and 1750 on 10 June the ash plumes rose 2 km, 1.5 km, and 3.5 km above the crater and drifted NW, respectively, and at 0030 on 11 June an ash plume rose 2 km above the crater and drifted NW. Webcam images taken on 10 and 11 June at 0455 and 0102, respectively, showed incandescent material ejected above the vent. On 19 June an ash plume at 0822 rose 1.5 km above the crater and drifted SE.
Similar low activity of white gas-and-steam emissions and few ash plumes were reported during July and August. Daily white gas-and-steam emissions rose 25-300 m above the crater and drifted in multiple directions. Three ash plumes were reported at 0843, 0851, and 0852 on 20 July that rose 500-2,000 m above the crater and drifted NW.
The MIROVA (Middle InfraRed Observation of Volcanic Activity) graph of MODIS thermal anomaly data showed intermittent low-to-moderate power thermal anomalies during May through August 2023 (figure 140). Although activity was often obscured by weather clouds, a thermal anomaly was visible in an infrared satellite image of the crater on 12 May, accompanied by an eruption plume that drifted SW (figure 141).
Geologic Background. The renowned Krakatau (frequently mis-named as Krakatoa) volcano lies in the Sunda Strait between Java and Sumatra. Collapse of an older edifice, perhaps in 416 or 535 CE, formed a 7-km-wide caldera. Remnants of that volcano are preserved in Verlaten and Lang Islands; subsequently the Rakata, Danan, and Perbuwatan cones were formed, coalescing to create the pre-1883 Krakatau Island. Caldera collapse during the catastrophic 1883 eruption destroyed Danan and Perbuwatan, and left only a remnant of Rakata. This eruption caused more than 36,000 fatalities, most as a result of tsunamis that swept the adjacent coastlines of Sumatra and Java. Pyroclastic surges traveled 40 km across the Sunda Strait and reached the Sumatra coast. After a quiescence of less than a half century, the post-collapse cone of Anak Krakatau (Child of Krakatau) was constructed within the 1883 caldera at a point between the former Danan and Perbuwatan cones. Anak Krakatau has been the site of frequent eruptions since 1927.
Information Contacts: Pusat Vulkanologi dan Mitigasi Bencana Geologi (PVMBG, also known as Indonesian Center for Volcanology and Geological Hazard Mitigation, CVGHM), Jalan Diponegoro 57, Bandung 40122, Indonesia (URL: http://www.vsi.esdm.go.id/); MAGMA Indonesia, Kementerian Energi dan Sumber Daya Mineral (URL: https://magma.esdm.go.id/v1); MIROVA (Middle InfraRed Observation of Volcanic Activity), a collaborative project between the Universities of Turin and Florence (Italy) supported by the Centre for Volcanic Risk of the Italian Civil Protection Department (URL: http://www.mirovaweb.it/); Copernicus Browser, Copernicus Data Space Ecosystem, European Space Agency (URL: https://dataspace.copernicus.eu/browser/).
Merapi (Indonesia) — October 2023 Cite this Report
Merapi
Indonesia
7.54°S, 110.446°E; summit elev. 2910 m
All times are local (unless otherwise noted)
Frequent incandescent avalanches during April-September 2023
Merapi, located just north of the major city of Yogyakarta in central Java, Indonesia, has had activity within the last 20 years characterized by pyroclastic flows and lahars accompanying growth and collapse of the steep-sided active summit lava dome. The current eruption period began in late December 2020 and has more recently consisted of ash plumes, intermittent incandescent avalanches of material, and pyroclastic flows (BGVN 48:04). This report covers activity during April through September 2023, based on information from Balai Penyelidikan dan Pengembangan Teknologi Kebencanaan Geologi (BPPTKG), the Center for Research and Development of Geological Disaster Technology, a branch of PVMBG which specifically monitors Merapi. Additional information comes from the Pusat Vulkanologi dan Mitigasi Bencana Geologi (PVMBG, also known as Indonesian Center for Volcanology and Geological Hazard Mitigation, CVGHM), MAGMA Indonesia, the Darwin Volcanic Ash Advisory Centre (VAAC), and various satellite data.
Activity during April through September 2023 primarily consisted of incandescent avalanches of material that mainly affected the SW and W flanks and traveled as far as 2.3 km from the summit (table 25) and white gas-and-steam emissions that rose 10-1,000 m above the crater.
Table 25. Monthly summary of avalanches and avalanche distances recorded at Merapi during April through September 2023. The number of reported avalanches does not include instances where possible avalanches were heard but could not be visually confirmed as a result of inclement weather. Data courtesy of BPPTKG (April-September 2023 daily reports).
| Month |
Average number of avalanches per day |
Distance avalanches traveled (m) |
| Apr 2023 |
19 |
1,200-2,000 |
| May 2023 |
22 |
500-2,000 |
| Jun 2023 |
18 |
1,200-2,000 |
| Jul 2023 |
30 |
300-2,000 |
| Aug 2023 |
25 |
400-2,300 |
| Sep 2023 |
23 |
600-2,000 |
BPPTKG reported that during April and May white gas-and-steam emissions rose 10-750 m above the crater, incandescent avalanches descended 500-2,000 m on the SW and W flanks (figure 135). Cloudy weather often prevented clear views of the summit, and sometimes avalanches could not be confirmed. According to a webcam image, a pyroclastic flow was visible on 17 April at 0531. During the week of 28 April and 4 May a pyroclastic flow was reported on the SW flank, traveling up to 2.5 km. According to a drone overflight taken on 17 May the SW lava dome volume was an estimated 2,372,800 cubic meters and the dome in the main crater was an estimated 2,337,300 cubic meters.
During June and July similar activity persisted with white gas-and-steam emissions rising 10-350 m above the crater and frequent incandescent avalanches that traveled 300-2,000 m down the SW, W, and S flanks (figure 136). Based on an analysis of aerial photos taken on 24 June the volume of the SW lava dome was approximately 2.5 million cubic meters. A pyroclastic flow was observed on 5 July that traveled 2.7 km on the SW flank. According to the Darwin VAAC multiple minor ash plumes were identified in satellite images on 19 July that rose to 3.7 km altitude and drifted S and SW. During 22, 25, and 26 July a total of 17 avalanches descended as far as 1.8 km on the S flank.
Frequent white gas-and-steam emissions continued during August and September, rising 10-450 m above the crater. Incandescent avalanches mainly affected the SW and W flanks and traveled 400-2,300 m from the vent (figure 137). An aerial survey conducted on 10 August was analyzed and reported that estimates of the SW dome volume was 2,764,300 cubic meters and the dome in the main crater was 2,369,800 cubic meters.
Frequent and moderate-power thermal activity continued throughout the reporting period, according to a MIROVA (Middle InfraRed Observation of Volcanic Activity) analysis of MODIS satellite data (figure 138). There was an increase in the number of detected anomalies during mid-May. The MODVOLC thermal algorithm recorded a total of 47 thermal hotspots: six during April, nine during May, eight during June, 15 during July, four during August, and five during September. Some of this activity was captured in infrared satellite imagery on clear weather days, sometimes accompanied by incandescent material on the SW flank (figure 139).
Geologic Background. Merapi, one of Indonesia's most active volcanoes, lies in one of the world's most densely populated areas and dominates the landscape immediately north of the major city of Yogyakarta. It is the youngest and southernmost of a volcanic chain extending NNW to Ungaran volcano. Growth of Old Merapi during the Pleistocene ended with major edifice collapse perhaps about 2,000 years ago, leaving a large arcuate scarp cutting the eroded older Batulawang volcano. Subsequent growth of the steep-sided Young Merapi edifice, its upper part unvegetated due to frequent activity, began SW of the earlier collapse scarp. Pyroclastic flows and lahars accompanying growth and collapse of the steep-sided active summit lava dome have devastated cultivated lands on the western-to-southern flanks and caused many fatalities.
Information Contacts: Balai Penyelidikan dan Pengembangan Teknologi Kebencanaan Geologi (BPPTKG), Center for Research and Development of Geological Disaster Technology (URL: http://merapi.bgl.esdm.go.id/, Twitter: @BPPTKG); MAGMA Indonesia, Kementerian Energi dan Sumber Daya Mineral (URL: https://magma.esdm.go.id/v1); Pusat Vulkanologi dan Mitigasi Bencana Geologi (PVMBG, also known as Indonesian Center for Volcanology and Geological Hazard Mitigation, CVGHM), Jalan Diponegoro 57, Bandung 40122, Indonesia (URL: http://www.vsi.esdm.go.id/); Darwin Volcanic Ash Advisory Centre (VAAC), Bureau of Meteorology, Northern Territory Regional Office, PO Box 40050, Casuarina, NT 0811, Australia (URL: http://www.bom.gov.au/info/vaac/); MIROVA (Middle InfraRed Observation of Volcanic Activity), a collaborative project between the Universities of Turin and Florence (Italy) supported by the Centre for Volcanic Risk of the Italian Civil Protection Department (URL: http://www.mirovaweb.it/); Hawai'i Institute of Geophysics and Planetology (HIGP) - MODVOLC Thermal Alerts System, School of Ocean and Earth Science and Technology (SOEST), Univ. of Hawai'i, 2525 Correa Road, Honolulu, HI 96822, USA (URL: http://modis.higp.hawaii.edu/); Copernicus Browser, Copernicus Data Space Ecosystem, European Space Agency (URL: https://dataspace.copernicus.eu/browser/); Øystein Lund Andersen (URL: https://www.oysteinlundandersen.com/, https://twitter.com/oysteinvolcano).
Villarrica (Chile) — October 2023 Cite this Report
Villarrica
Chile
39.42°S, 71.93°W; summit elev. 2847 m
All times are local (unless otherwise noted)
Strombolian activity, gas-and-ash emissions, and crater incandescence during April-September 2023
Villarrica, in central Chile, consists of a 2-km-wide caldera that formed about 3,500 years ago and is located at the base of the presently active cone at the NW margin of a 6-km-wide caldera. Historical eruptions eruptions date back to 1558 and have been characterized by mild-to-moderate explosive activity with occasional lava effusions. The current eruption period began in December 2014 and has recently consisted of nighttime crater incandescence, ash emissions, and seismicity (BGVN 48:04). This report covers activity during April through September 2023 and describes occasional Strombolian activity, gas-and-ash emissions, and nighttime crater incandescence. Information for this report primarily comes from the Southern Andes Volcano Observatory (Observatorio Volcanológico de Los Andes del Sur, OVDAS), part of Chile's National Service of Geology and Mining (Servicio Nacional de Geología y Minería, SERNAGEOMIN) and satellite data.
Seismicity during April consisted of long period (LP) events and tremor (TRE); a total of 9,413 LP-type events and 759 TR-type events were detected throughout the month. Nighttime crater incandescence persisted and was visible in the degassing column. Sulfur dioxide data was obtained using Differential Absorption Optical Spectroscopy Equipment (DOAS) that showed an average value of 1,450 ± 198 tons per day (t/d) during 1-15 April and 1,129 ± 201 t/d during 16-30 April, with a maximum daily value of 2,784 t/d on 9 April. Gas-and-steam emissions of variable intensities rose above the active crater as high as 1.3 km above the crater on 13 April. Strombolian explosions were not observed and there was a slight decrease in the lava lake level.
There were 14,123 LP-type events and 727 TR-type events detected during May. According to sulfur dioxide measurements taken with DOAS equipment, the active crater emitted an average value of 1,826 ± 482 t/d during 1-15 May and 912 ± 41 t/d during 16-30 May, with a daily maximum value of 5,155 t/d on 13 May. Surveillance cameras showed continuous white gas-and-steam emissions that rose as high as 430 m above the crater on 27 May. Nighttime incandescence illuminated the gas column less than 300 m above the crater rim was and no pyroclastic emissions were reported. A landslide was identified on 13 May on the E flank of the volcano 50 m from the crater rim and extending 300 m away; SERNAGEOMIN noted that this event may have occurred on 12 May. During the morning of 27 and 28 May minor Strombolian explosions characterized by incandescent ejecta were recorded at the crater rim; the last reported Strombolian explosions had occurred at the end of March.
Seismic activity during June consisted of five volcano-tectonic (VT)-type events, 21,606 LP-type events, and 2,085 TR-type events. The average value of sulfur dioxide flux obtained by DOAS equipment was 1,420 ± 217 t/d during 1-15 June and 2,562 ± 804 t/d, with a maximum daily value of 4,810 t/d on 17 June. White gas-and-steam emissions rose less than 480 m above the crater; frequent nighttime crater incandescence was reflected in the degassing plume. On 12 June an emission rose 100 m above the crater and drifted NNW. On 15 June one or several emissions resulted in ashfall to the NE as far as 5.5 km from the crater, based on a Skysat satellite image. Several Strombolian explosions occurred within the crater; activity on 15 June was higher energy and ejected blocks 200-300 m on the NE slope. Surveillance cameras showed white gas-and-steam emissions rising 480 m above the crater on 16 June. On 19 and 24 June low-intensity Strombolian activity was observed, ejecting material as far as 200 m from the center of the crater to the E.
During July, seismicity included 29,319 LP-type events, 3,736 TR-type events, and two VT-type events. DOAS equipment recorded two days of sulfur dioxide emissions of 4,220 t/d and 1,009 t/d on 1 and 13 July, respectively. Constant nighttime incandescence was also recorded and was particularly noticeable when accompanied by eruptive columns on 12 and 16 July. Minor explosive events were detected in the crater. According to Skysat satellite images taken on 12, 13, and 16 July, ashfall deposits were identified 155 m S of the crater. According to POVI, incandescence was visible from two vents on the crater floor around 0336 on 12 July. Gas-and-ash emissions rose as high as 1.2 km above the crater on 13 July and drifted E and NW. A series of gas-and-steam pulses containing some ash deposited material on the upper E flank around 1551 on 13 July. During 16-31 July, average sulfur dioxide emissions of 1,679 ± 406 t/d were recorded, with a maximum daily value of 2,343 t/d on 28 July. Fine ash emissions were also reported on 16, 17, and 23 July.
Seismicity persisted during August, characterized by 27,011 LP-type events, 3,323 TR-type events, and three VT-type events. The average value of sulfur dioxide measurements taken during 1-15 August was 1,642 ± 270 t/d and 2,207 ± 4,549 t/d during 16-31 August, with a maximum daily value of 3,294 t/d on 27 August. Nighttime crater incandescence remained visible in degassing columns. White gas-and-steam emissions rose 480 m above the crater on 6 August. According to a Skysat satellite image from 6 August, ash accumulation was observed proximal to the crater and was mainly distributed toward the E slope. White gas-and-steam emissions rose 320 m above the crater on 26 August. Nighttime incandescence and Strombolian activity that generated ash emissions were reported on 27 August.
Seismicity during September was characterized by five VT-type events, 12,057 LP-type events, and 2,058 TR-type events. Nighttime incandescence persisted. On 2 September an ash emission rose 180 m above the crater and drifted SE at 1643 (figure 125) and a white gas-and-steam plume rose 320 m above the crater. According to the Buenos Aires VAAC, periods of continuous gas-and-ash emissions were visible in webcam images from 1830 on 2 September to 0110 on 3 September. Strombolian activity was observed on 2 September and during the early morning of 3 September, the latter event of which generated an ash emission that rose 60 m above the crater and drifted 100 m from the center of the crater to the NE and SW. Ashfall was reported to the SE and S as far as 750 m from the crater. The lava lake was active during 3-4 September and lava fountaining was visible for the first time since 26 March 2023, according to POVI. Fountains captured in webcam images at 2133 on 3 September and at 0054 on 4 September rose as high as 60 m above the crater rim and ejected material onto the upper W flank. Sulfur dioxide flux of 1,730 t/d and 1,281 t/d was measured on 3 and 4 September, respectively, according to data obtained by DOAS equipment.
Strong Strombolian activity and larger gas-and-ash plumes were reported during 18-20 September. On 18 September activity was also associated with energetic LP-type events and notable sulfur dioxide fluxes (as high as 4,277 t/d). On 19 September Strombolian activity and incandescence were observed. On 20 September at 0914 ash emissions rose 50 m above the crater and drifted SSE, accompanied by Strombolian activity that ejected material less than 100 m SSE, causing fall deposits on that respective flank. SERNAGEOMIN reported that a Planet Scope satellite image taken on 20 September showed the lava lake in the crater, measuring 32 m x 35 m and an area of 0.001 km2. Several ash emissions were recorded at 0841, 0910, 1251, 1306, 1312, 1315, and 1324 on 23 September and rose less than 150 m above the crater. The sulfur dioxide flux value was 698 t/d on 23 September and 1,097 t/d on 24 September. On 24 September the Volcanic Alert Level (VAL) was raised to Orange (the third level on a four-color scale). SENAPRED maintained the Alert Level at Yellow (the middle level on a three-color scale) for the communities of Villarrica, Pucón (16 km N), Curarrehue, and Panguipulli.
During 24-25 September there was an increase in seismic energy (observed at TR-events) and acoustic signals, characterized by 1 VT-type event, 213 LP-type events, and 124 TR-type events. Mainly white gas-and-steam emissions, in addition to occasional fine ash emissions were recorded. During the early morning of 25 September Strombolian explosions were reported and ejected material 250 m in all directions, though dominantly toward the NW. On 25 September the average value of sulfur dioxide flux was 760 t/d. Seismicity during 25-30 September consisted of five VT-type events, 1,937 LP-type events, and 456 TR-type events.
During 25-29 September moderate Strombolian activity was observed and ejected material as far as the crater rim. In addition, ash pulses lasting roughly 50 minutes were observed around 0700 and dispersed ENE. During 26-27 September a TR episode lasted 6.5 hours and was accompanied by discrete acoustic signals. Satellite images from 26 September showed a spatter cone on the crater floor with one vent that measured 10 x 14 m and a smaller vent about 35 m NE of the cone. SERNAGEOMIN reported an abundant number of bomb-sized blocks up to 150 m from the crater, as well as impact marks on the snow, which indicated explosive activity. A low-altitude ash emission was observed drifting NW around 1140 on 28 September, based on webcam images. Between 0620 and 0850 on 29 September an ash emission rose 60 m above the crater and drifted NW. During an overflight taken around 1000 on 29 September scientists observed molten material in the vent, a large accumulation of pyroclasts inside the crater, and energetic degassing, some of which contained a small amount of ash. Block-sized pyroclasts were deposited on the internal walls and near the crater, and a distal ash deposit was also visible. The average sulfur dioxide flux measured on 28 September was 344 t/d. Satellite images taken on 29 September ashfall was deposited roughly 3 km WNW from the crater and nighttime crater incandescence remained visible. The average sulfur dioxide flux value from 29 September was 199 t/d. On 30 September at 0740 a pulsating ash emission rose 1.1 km above the crater and drifted NNW (figure 126). Deposits on the S flank extended as far as 4.5 km from the crater rim, based on satellite images from 30 September.
Infrared MODIS satellite data processed by MIROVA (Middle InfraRed Observation of Volcanic Activity) showed intermittent thermal activity during April through September, with slightly stronger activity detected during late September (figure 127). Small clusters of thermal activity were detected during mid-June, early July, early August, and late September. According to the MODVOLC thermal alert system, a total of four thermal hotspots were detected on 7 July and 3 and 23 September. This activity was also intermittently captured in infrared satellite imagery on clear weather days (figure 128).
Geologic Background. The glacier-covered Villarrica stratovolcano, in the northern Lakes District of central Chile, is ~15 km south of the city of Pucon. A 2-km-wide caldera that formed about 3,500 years ago is located at the base of the presently active, dominantly basaltic to basaltic andesite cone at the NW margin of a 6-km-wide Pleistocene caldera. More than 30 scoria cones and fissure vents are present on the flanks. Plinian eruptions and pyroclastic flows that have extended up to 20 km from the volcano were produced during the Holocene. Lava flows up to 18 km long have issued from summit and flank vents. Eruptions documented since 1558 CE have consisted largely of mild-to-moderate explosive activity with occasional lava effusion. Glaciers cover 40 km2 of the volcano, and lahars have damaged towns on its flanks.
Information Contacts: Servicio Nacional de Geología y Minería (SERNAGEOMIN), Observatorio Volcanológico de Los Andes del Sur (OVDAS), Avda Sta María No. 0104, Santiago, Chile (URL: http://www.sernageomin.cl/); Proyecto Observación Villarrica Internet (POVI) (URL: http://www.povi.cl/); Sistema y Servicio Nacional de Prevención y Repuesta Ante Desastres (SENAPRED), Av. Beauchef 1671, Santiago, Chile (URL: https://web.senapred.cl/); Buenos Aires Volcanic Ash Advisory Center (VAAC), Servicio Meteorológico Nacional-Fuerza Aérea Argentina, 25 de mayo 658, Buenos Aires, Argentina (URL: http://www.smn.gov.ar/vaac/buenosaires/inicio.php); MIROVA (Middle InfraRed Observation of Volcanic Activity), a collaborative project between the Universities of Turin and Florence (Italy) supported by the Centre for Volcanic Risk of the Italian Civil Protection Department (URL: http://www.mirovaweb.it/); Hawai'i Institute of Geophysics and Planetology (HIGP) - MODVOLC Thermal Alerts System, School of Ocean and Earth Science and Technology (SOEST), Univ. of Hawai'i, 2525 Correa Road, Honolulu, HI 96822, USA (URL: http://modis.higp.hawaii.edu/); Copernicus Browser, Copernicus Data Space Ecosystem, European Space Agency (URL: https://dataspace.copernicus.eu/browser/).
Ebeko
Russia
50.686°N, 156.014°E; summit elev. 1103 m
All times are local (unless otherwise noted)
Moderate explosive activity with ash plumes continued during June-November 2023
Ebeko, located on the N end of Paramushir Island in Russia’s Kuril Islands just S of the Kamchatka Peninsula, consists of three summit craters along a SSW-NNE line at the northern end of a complex of five volcanic cones. Observed eruptions date back to the late 18th century and have been characterized as small-to-moderate explosions from the summit crater, accompanied by intense fumarolic activity. The current eruptive period began in June 2022, consisting of frequent explosions, ash plumes, and thermal activity (BGVN 47:10, 48:06). This report covers similar activity during June-November 2023, based on information from the Kamchatka Volcanic Eruptions Response Team (KVERT) and satellite data.
Moderate explosive activity continued during June-November 2023 (figures 50 and 51). According to visual data from Severo-Kurilsk, explosions sent ash 2-3.5 km above the summit (3-4.5 km altitude) during most days during June through mid-September. Activity after mid-September was slightly weaker, with ash usually reaching less than 2 km above the summit. According to KVERT the volcano in October and November was, with a few exceptions, either quiet or obscured by clouds that prevented satellite observations. KVERT issued Volcano Observatory Notices for Aviation (VONA) on 8 and 12 June, 13 and 22 July, 3 and 21 August, and 31 October warning of potential aviation hazards from ash plumes drifting 3-15 km from the volcano. Based on satellite data, KVERT reported a persistent thermal anomaly whenever weather clouds permitted viewing.
Geologic Background. The flat-topped summit of the central cone of Ebeko volcano, one of the most active in the Kuril Islands, occupies the northern end of Paramushir Island. Three summit craters located along a SSW-NNE line form Ebeko volcano proper, at the northern end of a complex of five volcanic cones. Blocky lava flows extend west from Ebeko and SE from the neighboring Nezametnyi cone. The eastern part of the southern crater contains strong solfataras and a large boiling spring. The central crater is filled by a lake about 20 m deep whose shores are lined with steaming solfataras; the northern crater lies across a narrow, low barrier from the central crater and contains a small, cold crescentic lake. Historical activity, recorded since the late-18th century, has been restricted to small-to-moderate explosive eruptions from the summit craters. Intense fumarolic activity occurs in the summit craters, on the outer flanks of the cone, and in lateral explosion craters.
Information Contacts: Kamchatka Volcanic Eruptions Response Team (KVERT), Far Eastern Branch, Russian Academy of Sciences, 9 Piip Blvd., Petropavlovsk-Kamchatsky, 683006, Russia (URL: http://www.kscnet.ru/ivs/kvert/).
Search Bulletin Archive by Publication Date
Select a month and year from the drop-downs and click "Show Issue" to have that issue displayed in this tab.
The default month and year is the latest issue available.
Bulletin of the Global Volcanism Network - Volume 42, Number 10 (October 2017)
Managing Editor: Edward Venzke
Chillan, Nevados de (Chile)
Intermittent ash emissions from new craters along the E flanks of Volcáns Nuevo and Arrau persist through September 2017
Dieng Volcanic Complex (Indonesia)
Three phreatic eruptions at Sileri Crater; deaths due to helicopter crash involved in evacuations
Etna (Italy)
Extensive lava flows during February-May 2017; new summit crater emerges
Fuego (Guatemala)
Six eruptive episodes with Strombolian fountains, lava flows, ash plumes, and pyroclastic flows during July-December 2016
Heard (Australia)
Expedition visit in March-April 2016, intermittent eruptive activity through September 2017
Ibu (Indonesia)
Occasional weak ash explosions and thermal anomalies during April-August 2017
Marapi (Indonesia)
Four short ash explosions on 4 June 2017
Tolbachik (Russia)
Eruption that started in late November 2012 ends by mid-September 2013
Ubinas (Peru)
Intermittent ash explosions during September 2016-February 2017
Wrangell (United States)
Occasional steam plumes and wind-blown ash, but no recent eruptive activity
Nevados de Chillan (Chile) — October 2017 Cite this Report
Nevados de Chillan
Chile
36.868°S, 71.378°W; summit elev. 3180 m
All times are local (unless otherwise noted)
Intermittent ash emissions from new craters along the E flanks of Volcáns Nuevo and Arrau persist through September 2017
Nevados de Chillán, in the Chilean Central Andes, is a complex of late-Pleistocene to Holocene stratovolcanoes constructed along a NNW-SSE trend (figure 5). The Nuevo and Arrau craters, active during 1906-1945 and 1973-1986, respectively, are adjacent vents on the NW cone of a large stratovolcano complex 5 km SE of Cerro Blanco; the summit 1 km SE of Arrau is named Volcán Viejo (figure 6). A short eruption during August-September 2003 created a new fissure vent between the Nuevo and Arrau craters (BGVN 29:03, figure 3). Increased seismicity and fumarolic activity were recorded during December 2015, and a new eruption started with a phreatic explosion and ash emission on 8 January 2016 from a new crater on the E flank of Nuevo cones (BGVN 41:06). This report adds information about the beginning of the event and continues with activity through September 2017. Information for this report is provided by Chile's Servicio Nacional de Geología y Minería (SERNAGEOMIN) - Observatorio Volcanológico de Los Andes del Sur (OVDAS), Oficina Nacional de Emergencia - Ministerio del Interior (ONEMI), Corporación Ciudadana Red Nacional de Emergencia (RNE), and by the Buenos Aires Volcanic Ash Advisory Center (VAAC).
Ash emissions at Nevados de Chillán began on 8 January 2016, and were intermittent through September 2017. Four new craters emerged in a NNE trend along the flanks of Volcán Nuevo and Volcán Arrau; two eventually merged into a single 100-m-diameter crater. Most plumes were brief pulses of steam and ash that rose 200-300 m above the craters. Larger events sent a few plumes as high as 2.2 km above the summit (to 5.4 km altitude). Strong prevailing winds quickly dissipated most ash plumes. Periods of multiple small explosions lasted for 1-2 weeks, separated by periods of relative quiet characterized by only steam-and-gas emissions from the active craters and nearby fumarolic centers. The first observable incandescence at the craters was noted in early March 2016. Incandescent bombs were thrown 300 m above the craters during July and September 2016, and 500 m high during March-May 2017 when blocks also fell with 500 m of the craters.
Activity during 2016. After the first explosion with ash emissions on 8 January 2016, nine more pulses of ash were emitted the next day, and small sporadic emissions were reported in the following days (figure 7). OVDAS researchers flew over the volcano on 9 January and concluded that the explosions came from a new crater on the E slope of Volcán Nuevo, about 40 m from the edge of the crater. Researchers from the University of Cambridge who visited the site on 13 January observed continuous degassing at the new 20-m-wide crater. The Buenos Aires VAAC noted puffs of steam and gas dissipating a few hundred meters above the summit (at 3.7 km altitude) in satellite imagery on 16 January 2016. ONEMI reported an ash emission on 29 January that originated from the Arrau crater (see figure 6). During an overflight on 30 January, OVDAS researchers saw occasional explosions from the new crater at Nuevo, as well as activity at a new 30-m-diameter crater about 50 m from the Arrau crater on its NE flank (figure 8). Several fumaroles were also identified on the E flank of Arrau crater.
During the first two weeks of February 2016, there were 175 episodes of discrete tremor; webcams recorded explosions that ejected material from both craters. The Buenos Aires VAAC reported a brief ash emission on 3 February that dissipated quickly near the summit. During an overflight on 11 February coordinated with ONEMI, scientists identified a third crater, which created a 150-m-long NNE trend with the other two active craters identified during January. During the second half of February, emissions consisted mostly of steam plumes rising no more than 300 m above the crater.
Activity during March 2016 was characterized by steam plumes rising from the active craters; on 3 March, however, a small ash emission was observed. Incandescence was observed in the crater area on the night of 9 March. SERNAGEOMIN reported the beginning of an episode of long-period (LP) seismicity on 18 March, with a pulsating pattern of 3-4 events per minute. During the second half of March, LP and tremor activity was associated with ash emissions. Notably, a low-energy tremor on 30 March lasted for several hours, and concurrently a dense ash plume rose 200 m.
Ash emissions were observed on 7, 8, 9, 18, and 19 April 2016. Plumes were reported rising 400 m on 8 April, and 200 m on 18 and 19 April. Incandescence was observed along with the ash on 18 April. A significant explosion on 9 May 2016 generated an ash plume that rose 1,700 m above the summit (figure 9). The Buenos Aires VAAC reported the ash plume at 3.9 km altitude (700 m above the summit) drifting SE. An overflight by OVDAS on 9 May confirmed the presence of three active craters on the active summit, with the central one having enlarged by 50% since the previous overflight on 11 February. Only pulsating steam emissions were observed in the webcam during the remainder of May and June 2016.
Only steam emissions were reported during the first half of July 2016, but on 21 July an ash-laden emission sent incandescent bombs 300 m above the crater. The Buenos Aires VAAC reported that the webcam showed an ash emission to 3.4 km altitude (200 m above the craters) that day. Webcam Images obtained on 25 July showed debris from an explosion scattered 300 m down the NE flank. During the next few days, ash emissions were inferred from the seismic tremors, but weather conditions prevented direct observations.
During the first two weeks of August 2016, 14 explosions were recorded from the new craters on the E flanks of Nuevo and Arrau. The largest explosion, on 8 August, sent an ash plume 2 km above the crater, according to SERNAGEOMIN (figure 10). The Buenos Aires VAAC reported brief ash emissions on 1, 4, 8, and 9 August at altitudes of 3.7, 3.4, 4.3, and 3.7 km altitude, respectively. Fresh ashfall was visible on the flanks during a flyover on 12 August (figure 11). On the few days when the weather permitted observation of the summit during the remainder of the month, only steam plumes were observed rising no more than 400 m above the crater.
Pulsating steam plumes, interrupted by periodic ash emissions, were typical during September 2016. During the first two weeks of the month, 37 recorded explosions were characterized by a high concentration of particulate material. The largest explosion, during the evening of 1 September, generated incandescent bombs for 20 minutes. Incandescence was observed during nighttime explosions a number of times. The Buenos Aires VAAC noted a pilot report of an ash cloud moving SW at 5.2 km altitude on 2 September. They also reported a weak emission of steam and gas with possible diffuse ash visible in the webcam that day. Another pilot report on 6 September indicated an ash cloud moving NE at 6.4 km altitude from a brief but intense emission event around 1420 UTC (figure 12). SERNAGEOMIN noted in their late September report that there had been six explosive episodes since January 2016, with the latest one that occurred during 1-10 September being the strongest.
Explosive activity was recorded on 3, 7, and 8 October 2016 by SERNAGEOMIN; The events were low-energy episodes that emitted small quantities of ash. The Buenos Aires VAAC noted a pilot report on 3 October of an ash cloud moving SE near the summit. It was visible in the webcam but not in satellite imagery, and dissipated quickly. The tallest emission of those days rose to 300 m above the crater on 7 October. During an overflight on 22 October, the continued presence of the three craters along the E flanks of Nueva and Arrau reported previously was confirmed. In addition, the existence of a fourth crater was noted along the same trend as the others. The Buenos Aires VAAC noted ash emissions on 26 and 28 October rising to between 3.7 and 4.3 km altitude and dissipating quickly near the summit.
Seismic activity during the first half of November 2016 included 17 explosions from the active craters. An explosion on 18 November generated an ash plume that rose 1.2 km (figure 13). The Buenos Aires VAAC noted a pilot report of possible ash emissions between 4.6 and 6.1 km altitude on 17 and 27 November, although neither were identified in satellite data.
Explosions associated with LP and tremor seismicity continued into December 2016. There were 14 explosive seismic events during the second half of the month, reported by SERNAGEOMIN. The largest occurred on 28 December. The Buenos Aires VAAC noted pilot reports of ash emissions that dissipated near the summit on 13, 28, and 29 December.
Activity during January-September 2017. Explosions related to LP and tremor seismicity increased again on 5 January 2017. The Buenos Aires VAAC reported a dark fumarolic plume drifting E at 4.5 km altitude on 6 January that was observed by a pilot and in the webcam. On 11 and 13 January, the webcam showed sporadic puffs of ash that dissipated very quickly. The largest event occurred on 15 January; the Buenos Aires VAAC reported a narrow plume of ash in satellite imagery at 3.9 km altitude moving W. The webcam also showed sporadic and small puffs that dissipated quickly. An event on 16 January produced an emission that rose 700 m above the crater according to SERNAGEOMIN. This was the last LP-associated explosion of the month. Scientists on a 20 January overflight noted low-intensity steam plumes from the Nuevo and Arrau craters, and from the Chudcún crater which formed in 2003 between them (see figure 6). Yellow and ocher-colored areas, indicating the presence of precipitated sulfur, were visible around the fumaroles and craters.
Low-level degassing rising less than 200 m above the crater was the only surface activity observed during February 2017. A new stage of explosive activity began on 7 March 2017 with emissions that rose as high as 300 m above the crater. The Buenos Aires VAAC noted a pilot report of an ash plume at 3.7 km altitude, and a short-lived puff of ash seen in the webcam. On 11 March, eight explosions sent incandescent blocks up to 0.5 km from the active craters, and emissions rose to 500 m above the crater. Another series of eight explosions on 14 March produced incandescent material and sent an ash plume 1.5 km above the craters. The Buenos Aires VAAC reported intermittent emissions rising up to 4.9 km altitude that day, followed by continuing steam emissions. The following day they noted a small plume near the volcano at 3.9 km altitude visible in satellite data.
During a flyover on 15 March, OVDAS scientists noted that two of the craters (craters 3 and 4) had merged into a single crater 100 m in diameter (figure 14). They also observed five explosions within the space of an hour, the highest resulting plume rose 900 m above the active crater. Webcam images during 16-17 March showed ash emissions rising to 2 km above the crater. The Buenos Aires VAAC reported an ash emission visible in satellite imagery at 5.5 km altitude moving SW on 16 March. For the remainder of the month, only weak degassing under 200 m above the crater was observed. Beginning on 24 March, low-level incandescence at night was reported for the rest of the month.
Between 1 and 12 April 2017, there were 56 intermittent explosions marking a new phase of activity according to SERNAGEOMIN. The webcams around the complex imaged emissions up to 3 km above the crater throughout the month. The Buenos Aires VAAC reported sporadic emissions of ash visible in the webcam on 3 and 6-8 April. A faint emission at 3.7 km altitude was spotted in satellite imagery on 10 April. From 16 to 30 April, there were 79 intermittent explosions recorded. During dusk and dawn, incandescent material was observed traveling 600 m down the flanks, with some episodes lasting for 60 minutes. The Buenos Aires VAAC reported a brief ash emission and incandescent material visible in the webcam on 17 April, and sporadic ash emissions that rose to 3.9 km altitude on 21, 29, and 30 April (figure 15).
Nine intermittent explosions occurred between 1 and 11 May 2017. The webcams showed emissions from the explosions rising generally 300 m above the craters according to SERNAGEOMIN. Intermittent explosions increased again during 27-31 May. Emissions rose to 1.5 km above the craters and incandescent blocks could be seen traveling 600 m down the flank. Periods of constant incandescence lasted for 30 minutes.
This explosive episode continued into June 2017, with 23 intermittent explosions between 1 and 5 June. The largest emission event on 5 June sent a plume 2.2 km above the craters (figure 16). The Buenos Aires VAAC observed the ash plume at 4.6 km altitude in satellite imagery. During 6-15 June, only steam emissions rising to 300 m were reported. Intermittent explosions on 20, 22, 25, and 26 June produced plumes that rose only 200 m above the craters; cloudy weather prevented observation from the webcams during these events.
No explosive events were observed in the webcams during the first half of July 2017; only steam plumes rising 200 m were reported. A single low-energy explosion was recorded on 31 July; the emission rose to only 100 m above the crater. During August 2017, there were 83 intermittent explosions associated with ash emissions recorded by SERNAGEOMIN. The emissions rose to about 300 m above the active craters; a few larger emissions rose 1,000 m. The Buenos Aires VAAC noted a pilot report of ash emissions on 17 August; the webcam captured a brief emission that dissipated rapidly.
About 150 intermittent explosions were reported during September 2017. The highest plumes, generally composed of steam and ash, rose 2,000 m above the craters. The Buenos Aires VAAC observed a narrow plume of ash in satellite imagery moving N at 3.9 km altitude and dissipating rapidly on 15 September, and a similar plume moving SE near the summit on 26 September 2017.
Reference: Orozco, G.; Jara, G.; Bertin, D. 2016. Peligros del Complejo Volcánico Nevados de Chillán, Región del Biobío. Servicio Nacional de Geología y Minería, Carta Geológica de Chile, Serie Geología Ambiental 28: 34 p., 1 mapa escala 1:75.000. Santiago.
Geologic Background. The compound volcano of Nevados de Chillán is one of the most active of the Central Andes. Three late-Pleistocene to Holocene stratovolcanoes were constructed along a NNW-SSE line within three nested Pleistocene calderas, which produced ignimbrite sheets extending more than 100 km into the Central Depression of Chile. The dominantly andesitic Cerro Blanco (Volcán Nevado) stratovolcano is located at the NW end of the massif. Volcán Viejo (Volcán Chillán), which was the main active vent during the 17th-19th centuries, occupies the SE end. The Volcán Nuevo lava-dome complex formed during 1906-1945 on the NW flank of Viejo. The Volcán Arrau dome complex was then constructed on the SE side of Volcán Nuevo between 1973 and 1986, and eventually exceeded its height. Smaller domes or cones are present in the 5-km valley between the two major edifices.
Information Contacts: Servicio Nacional de Geología y Minería, (SERNAGEOMIN), Observatorio Volcanológico de Los Andes del Sur (OVDAS), Avda Sta María No. 0104, Santiago, Chile ( URL: http://www.sernageomin.cl/); Oficina Nacional de Emergencia - Ministerio del Interior (ONEMI), Beaucheff 1637/1671, Santiago, Chile (URL: http://www.onemi.cl/); Corporación Ciudadana Red Nacional de Emergencia (RNE, Citizen Corporation National Emergency Network), Avda. Vicuña Mackenna Nº3125, San Joaquín, Santiago de Chile, Chile (URL: http://www.reddeemergencia.cl/); Buenos Aires Volcanic Ash Advisory Center (VAAC), Servicio Meteorológico Nacional-Fuerza Aérea Argentina, 25 de mayo 658, Buenos Aires, Argentina (URL: http://www.smn.gov.ar/vaac/buenosaires/inicio.php?lang=es).
Dieng Volcanic Complex (Indonesia) — October 2017 Cite this Report
Dieng Volcanic Complex
Indonesia
7.2°S, 109.879°E; summit elev. 2565 m
All times are local (unless otherwise noted)
Three phreatic eruptions at Sileri Crater; deaths due to helicopter crash involved in evacuations
Located on an elevated plateau in central Java NW of Yogyakarta (figure 4), multiple craters within the Dieng Volcanic Complex (figure 5) have been intermittently active over the past 200 years. Brief phreatic eruptions took place at Sibanteng crater on 15 January 2009 (BGVN 34:04) and at Sileri crater on 26 September later that year (BGVN 34:08). Increased unrest during March-April 2013 (BGVN 38:08) consisted of elevated volcanic gas emissions from Timbang Crater that resulted in an increase in the Alert Level to as high as 3 on 27 March, then back to Level 2 on 8 May. There was a precautionary evacuation of local villages, but no eruption took place. Regular monitoring is done by the Pusat Vulkanologi dan Mitigasi Bencana Geologi (PVMBG, also known as Centre for Volcanology and Geological Hazard Mitigation or CVGHM).
The alert status remained at Level 2 for about 15 months following the hazardous gas emissions in 2013. On 11 August 2014 the PVMBG noted that, due to decreased activity and no observable flow of gas in high concentrations from the crater, the Alert Level was lowered to 1 (on a scale of 1-4). No further activity was reported until late April 2017.
A phreatic event from Sileri Crater at 1303 on 30 April 2017 ejected material 10 m high and 1 m past the crater edge, forming a 1-2 mm thick deposit. Another emission at 0941 on 24 May consisted of gas and black "smoke" that rose 20 m.
The Disaster Management Authority, Badan Nacional Penanggulangan Bencana (BNPB), reported that there had been another phreatic eruption from the Sileri Crater lake at 1154 on 2 July 2017, ejecting mud and material 150 m high, and 50 m to the N and S. The event injured 11 of 18 tourists that were near the crater. According to a news article a helicopter on the way to assist with evacuations after the event crashed, killing all eight people (four crewmen and four rescuers) on board. PVMBG scientists visited the next day and observed weak white emissions rising 60 m.
PVMBG reported that during 8 July-14 September 2017 measurements indicated an increase in water temperature at Sileri Crater lake from 90.7 to 93.5°C. Soil temperatures also increased, from 58.6 to 69.4°C. At Timbang Crater temperatures in the lake increased from 57.3 to 62.7°C, and in the soil they decreased from 18.6 to 17.2°C. The report noted that conditions at Timbang Crater were normal.
Temperature increases at Sileri, along with tremor detected during 13-14 September, prompted PVMBG to raise the Alert Level to 2 (on a scale of 1-4). PVMBG warned the public to stay at least 1 km away from the crater rim, and for residents living within that radius to evacuate. However, after 20 September tremor and water temperatures both declined. The Alert Level was lowered back to 1 on 2 October, with a warning to stay at least 100 m from the crater rim.
Geologic Background. The Dieng plateau in the highlands of central Java is renowned both for the variety of its volcanic scenery and as a sacred area housing Java's oldest Hindu temples, dating back to the 9th century CE. The Dieng Volcanic Complex consists of multiple stratovolcanoes and more than 20 small Pleistocene-to-Holocene craters and cones over a 6 x 14 km area. Prahu stratovolcano was truncated by a large Pleistocene caldera, which was subsequently filled by a series of cones, lava domes, and craters, many containing lakes. Lava flows cover much of the plateau, but observed activity has been restricted to minor phreatic eruptions. Gas emissions are a hazard at several craters and have caused fatalities. There are abundant thermal features and high heat flow across the area.
Information Contacts: Pusat Vulkanologi dan Mitigasi Bencana Geologi (PVMBG, also known as Indonesian Center for Volcanology and Geological Hazard Mitigation, CVGHM), Jalan Diponegoro 57, Bandung 40122, Indonesia (URL: http://www.vsi.esdm.go.id/); Badan Nasional Penanggulangan Bencana (BNPB), National Disaster Management Agency, Graha BNPB - Jl. Scout Kav.38, East Jakarta 13120, Indonesia (URL: http://www.bnpb.go.id/); Peakery (URL: https://peakery.com/).
Etna
Italy
37.748°N, 14.999°E; summit elev. 3357 m
All times are local (unless otherwise noted)
Extensive lava flows during February-May 2017; new summit crater emerges
Italy's Mount Etna on the island of Sicily has had historically recorded eruptions for the past 3,500 years. Lava flows, explosive eruptions with ash plumes, and lava fountains commonly occur from its major summit crater areas, the North East Crater (NEC), the Voragine-Bocca Nuova (or Central) complex (VOR-BN), the South East Crater (SEC) (formed in 1978), and the New South East Crater (NSEC) (formed in 2011). A new crater, the SEC3 or "saddle cone" emerged during early 2017 from the saddle between SEC and NSEC.
After a major explosive event in December 2015 (BGVN 42:05), activity subsided for a few months before renewed Strombolian eruptions and lava flows affected all of the summit craters during late May 2016 (BGVN 42:09). These events were followed by a lengthy period of subsidence and intense fumarolic activity across the summit that lasted until a new eruptive episode began at the end of January 2017. The Osservatorio Etneo (OE), which provides weekly reports and special updates on activity, is run by the Catania Branch of Italy's Istituo Nazionale di Geofisica e Vulcanologica (INGV). This report uses information from INGV to provide a detailed summary of events between January and August 2017.
Summary of January-August 2017 Activity. Minor ash emissions began from a new vent in the saddle between NSEC and SEC on 20 January 2017, followed by Strombolian activity a few days later. Activity intensified at the end of February when the first of several lava flows emerged from this vent, and then from several other vents on the S flank of the new, rapidly growing cone during March and April. By mid-March 2017, Strombolian activity, ash emissions, and lava flows had created a cone higher than the adjacent NSEC and SEC cones. The last effusive episode at the end of April 2017 sent flows down both the N and S flanks of the new cone from multiple vents. Intermittent weak Strombolian activity at the new summit area was associated with abrupt tremor amplitude increases during May, but no additional flows were reported. During June-August, fumarolic activity persisted at several crater areas, and minor ash emissions were observed a few times, but no major eruptive activity took place. The sharp increase in heat flow resulting from the lava flows of March and April 2017 are clearly visible in the MIROVA thermal anomaly plot of log radiative power for the year ending on 12 October 2017 (figure 186).
Activity during January-February 2017. Sporadic incandescence continued from the 7 August 2016 vent on the E side of VOR during January 2017, and minor ash plumes rose from the NSEC "saddle" vent on 20 January. Modest Strombolian activity began at the saddle vent that on 23 January and continued into February (figure 187). Small bombs were ejected onto the flank of NSEC and minor ash plumes quickly dissipated in the high winds near the summit. Also during February, steady subsidence continued at BN, especially in the BN-1 area (see figure 185, BGVN 42:09), where active degassing with minor amounts of ash was observed on 1 February (figure 187). Debris deposits from Strombolian activity at the saddle vent covered the S side of the pyroclastic cone and travelled to its base during the end of February.
During the late afternoon of 27 February, the Strombolian activity that began on 20 January from the saddle vent between SEC and NSEC rapidly intensified, and lava emerged from the vent and flowed down the S flank of SEC (figure 188). It slowed after reaching the flat ground at the base of the cone, and expanded slowly SE toward the older cones of Monte Frumento Supino. Intense activity that evening sent shards and bombs 200 m above the vent while the flow continued. Ash from the Strombolian activity dispersed NE, with minor ashfall reported in Linguaglossa and Zafferana. A new cone of pyroclastic material that formed around the saddle vent quickly grew to about the same elevation as the NSEC and SEC crater rims, approximately 3,290 m (figure 189). The lava continued to flow until 2 March 2017, when it stopped at about 2,750 m elevation with an overall length of 2,180 m, covering an area of 306 x 103 m2, for a total volume of slightly less than 1 x 10⁶ m3.
Activity during March 2017. Sporadic ash emissions continued from the new saddle vent during early March 2017, accompanied by weak Strombolian activity during the night of 12-13 March. Intense degassing continued from VOR during March as well, with incandescent bursts visible on many clear nights. On the morning of 15 March the Montagnola webcam recorded a lava overflow from the saddle vent down the S flank of NSEC, and an intensification of explosive activity that caused the flow to reach the base of the complex at about 3,000 m elevation. During the day, it advanced towards Monte Frumento Supino; it had reached elevation 2,800 m by the late evening, overlapping significantly with the earlier flow from 27 February. Strombolian eruptions were nearly constant until late afternoon, and continued intermittently, along with ash emissions, for several days.
Shortly before 2300 UTC on 15 March (0100 on 16 March local time), a second new flow emerged from a vent near the base of the S flank of the new NSEC/SEC cone (at about 3,200 m elevation) and travelled SE (figure 190), splitting into two lobes. INGV personnel in the summit area reported a series of phreato-magmatic explosions at 0043 (just after midnight) along the lava front at an elevation of approximately 2,700 m along the W edge of the Valle del Bove. The contact of the active flow with the underlying snow caused several explosions. An INGV volcanologist suffered minor injuries during one of the explosions. Increased emissions also caused minor ashfall in Adrano and Santa Maria di Licodia (both about 17 km SW).
By the afternoon of 17 March 2017, the second flow had reached an elevation of about 2,600 m, near the base of the W slope of the Valle del Bove. INGV personnel at Monte Zoccolaro (1.5 km S) spotted a third flow on 18 March, located S of the other two (figure 191). The front had reached about 2,200 m elevation, and was responsible for some phreato-magmatic explosions during 18 and 19 March. Several avalanches of incandescent material reached the base of the slope at the edge of Valle del Bove as the flow fronts collapsed during 18 March. Two Landsat 8 Operational Land Imager images on 18 and 19 March captured evidence of the lava flows, an ash plume, and Strombolian activity during this episode (figure 192). By 19 March, the advance had slowed as the flows began to spread out over the valley floor. The flows into the Valle del Bove ceased on 20 March.
Strombolian activity and ash emissions ceased at the summit vent of the NSEC/SEC cone between 20 and 22 March 2017 leaving a new pyroclastic cone that rose above the adjacent NSEC and SEC cones (figure 193). Once the Strombolian activity had ended, yet another lava flow emerged from the base of the cone at an elevation of about 3,010-3,030 m, and spread into several segments, one of which flowed W around Monti Barbagallo (near the former Torre del Filosofo) and then turned SW following the valley between Monti Barbagallo and Monte Frumento Supino. By 26 March the front of this flow segment had reached an elevation of 2,300 m and travelled about 2.5 km from the vent. A second segment of the flow travelled E of Monti Barbagallo, following the earlier flows that had been active along the W slope of the Valle del Bove; it slowed and broke into several additional segments, reaching 1.3 km from the vent on 26 March, and advancing through the first week of April.
Activity during April 2017. The active lava flow continued WSW towards the cones of the 2002-2003 eruption from the vent at the base of the NSEC/SEC cone until it stopped advancing sometime during the night between 8 and 9 April (figure 194). Another new flow then emerged from the same vent on 10 April and was active for just over 24 hours. This flow travelled SE to the W edge of the Valle del Bove and moved a few hundred meters along the edge before stopping during the day of 12 April.
During the evening of 13 April 2017, Strombolian activity at the summit crater of the NSEC/SEC cone accompanied the emergence of flows from three vents along the S flank at elevations of approximately 3,200 m, 3,150 m, and 3,010 m which headed S and SE. The upper flows were active for only a few hours, but the lower flow continued SE towards the Valle del Bove and had overlapped the 10-11 April flow by the next day. The active front of the flow was at an elevation of 2,400 m on the western slope of the Valle del Bove, just north of the Serra Giannicola Grande. A flyover on 14 April revealed the extent of the fracture system on the flank of the NSEC/SEC complex from which the numerous flows emerged (figure 195). The flow rate diminished during the day of 15 April, and the flow stopped sometime during the next night.
A thermal anomaly appeared at the S edge of the NSEC/SEC summit vent, which INGV began calling SEC3, on the morning of 19 April. Weak Strombolian activity from the vent was followed by the emergence of a lava flow from the S side of the crater rim that flowed down the S flank of the cone. Dense, brown ash emissions about an hour later accompanied the re-opening of three vents on the S flank from which new lava flows emerged (figure 196). Lava jets rose tens of meters above the crater rim for about an hour in the afternoon. The lava flows from the three vents formed into two branches moving down the S flank (figure 197), then turned E and spread over the W slope of the Valle del Bove; by 20 April they had reached an elevation of 1,950 m. Explosive activity ceased at SEC3 that afternoon, and the flows stopped advancing sometime during the night of 20-21 April. Observations of the summit of SEC3 on 22 April revealed a N-S trending graben formed in the S rim of the summit crater about 100 m long, 10 m wide, and several tens of meters deep.
The next eruptive episode began late in the day on 26 April 2017, with a slow-moving lava flow that emerged from the summit vent of SEC3. The flow made it part way down the S flank before another flow from the same vent covered it and reached the base of the flank. Strombolian activity began at the summit vent during the late evening while the flow continued to spread SE toward the Valle del Bove (figure 198). Strombolian activity intensified during the early hours of 27 April and a new vent opened at the summit immediately N of the first one. At around 0220, two new eruptive fractures opened on the N flank of SEC3, from which lava flowed N toward the Valle del Leone (figure 199). At daybreak, an ash plume was visible about 1.5 km above the summit drifting E. Phreato-magmatic explosions were observed in the Valle del Leone when the northern lava flow encountered snow on the ground. Strombolian activity ceased around noon and the flows on both the N and S flanks had ceased by the following morning.
Activity during May-August 2017. Intense degassing with incandescence at night continued from the vent at VOR throughout April and into May 2017. At NEC, degassing continued from the large fumarole field at the bottom of the summit crater. No further lava flows erupted during May 2017, however, there were several short, high-energy tremor episodes in the area around SEC3. During May, more than 35 episodes of transient increases in tremor amplitude were recorded by INGV seismic instruments (figure 200). During 15-18 May, there were 11 episodes of Strombolian activity from the northern SEC3 summit vent, repeated at regular intervals of about every 8-9 hours. Lava fragments were ejected outside the crater rim and rolled down the flanks (figure 201). Each episode was accompanied by a sharp increase in volcanic tremor amplitude. Eight additional episodes of weak and discontinuous Strombolian activity occurred between 25 and 28 May at intervals ranging from 3 to 14 hours, each lasting about an hour, and accompanied by increased tremor amplitude. A short sequence of dense ash emissions from BN-1 on the morning of 31 May was the only ash plume reported during May.
Weak and discontinuous Strombolian activity resumed at NSEC on 6 June 2017, along with a sudden increase in tremor. The activity lasted until 9 June and included four episodes of roughly one hour each. Very little material fell outside the crater rim during these events. Vigorous degassing and nighttime incandescence continued at the VOR vent during June. INGV-OE personnel inspected the summit on 23 and 29 June, and 2 July 2017. High temperatures (around 600°C) were recorded at the VOR vent on 23 June. The other fumarolic areas, especially in the fracture field between NEC and VOR, were around 250°C, cooler than when last measured on 31 August 2016. Occasional weak ash emissions began on 24 June from SEC3; they lasted for a few days and quickly dissipated near the top of the cone. They ceased late in the evening of 28 June.
In a survey by drone on 4 July 2017, INGV-OE personnel noted widespread degassing along the rim and E side of the SEC3 crater. The vent that had formed during 27 February-26 April appeared to be blocked (figure 202). During the late morning of 9 July, the vent that had formed during 26-27 April emitted a small amount of red-gray ash. The next day a small amount of ash emerged from the base of BN-1. Incandescence was frequently observed at night from the VOR vent and from the NSEC. Degassing was observed regularly throughout the month at the VOR vent, the bottom of BN-1, and NEC (figure 203).
Occasional weak, diffuse ash emissions continued during August 2017 from the bottom of BN-1. INGV-OE scientists attributed this to collapse at the base of the crater. Limited degassing was noted at NEC, but persistent degassing continued from the 7 August 2016 vent at VOR, and from a vent on the E side of NSEC in addition to a vent at the SEC3 summit (figures 204 and 205).
Geologic Background. Mount Etna, towering above Catania on the island of Sicily, has one of the world's longest documented records of volcanism, dating back to 1500 BCE. Historical lava flows of basaltic composition cover much of the surface of this massive volcano, whose edifice is the highest and most voluminous in Italy. The Mongibello stratovolcano, truncated by several small calderas, was constructed during the late Pleistocene and Holocene over an older shield volcano. The most prominent morphological feature of Etna is the Valle del Bove, a 5 x 10 km caldera open to the east. Two styles of eruptive activity typically occur, sometimes simultaneously. Persistent explosive eruptions, sometimes with minor lava emissions, take place from one or more summit craters. Flank vents, typically with higher effusion rates, are less frequently active and originate from fissures that open progressively downward from near the summit (usually accompanied by Strombolian eruptions at the upper end). Cinder cones are commonly constructed over the vents of lower-flank lava flows. Lava flows extend to the foot of the volcano on all sides and have reached the sea over a broad area on the SE flank.
Information Contacts: Sezione di Catania - Osservatorio Etneo, Istituto Nazionale di Geofisica e Vulcanologia (INGV-OE), Sezione di Catania, Piazza Roma 2, 95123 Catania, Italy (URL: http://www.ct.ingv.it/it/); NASA Earth Observatory, EOS Project Science Office, NASA Goddard Space Flight Center, Goddard, Maryland, USA (URL: http://earthobservatory.nasa.gov/); MIROVA (Middle InfraRed Observation of Volcanic Activity), a collaborative project between the Universities of Turin and Florence (Italy) supported by the Centre for Volcanic Risk of the Italian Civil Protection Department (URL: http://www.mirovaweb.it/); Global Times, http://www.globaltimes.cn/galleries/774.html.
Fuego (Guatemala) — October 2017 Cite this Report
Fuego
Guatemala
14.4748°N, 90.8806°W; summit elev. 3799 m
All times are local (unless otherwise noted)
Six eruptive episodes with Strombolian fountains, lava flows, ash plumes, and pyroclastic flows during July-December 2016
Volcán de Fuego has been erupting continuously since 2002. Historical observations of eruptions date back to 1531, and radiocarbon dates are confirmed back to 1580 BCE. These eruptions have resulted in major ashfalls, pyroclastic flows, lava flows, and damaging lahars. Fuego was continuously active from January to June 2016. Daily explosions that generated ash plumes to within 1 km above the summit (less than 5 km altitude) were typical. In addition, there were ten eruptive episodes that included Strombolian activity, lava flows, pyroclastic flows, and ash plumes rising above 5 km altitude (BGVN 42:06). Every month, lahars flowed down several drainages. This report continues with a summary of similar activity during July-December 2016. In addition to regular reports from the Instituto Nacional de Sismologia, Vulcanología, Meteorología e Hidrologia (INSIVUMEH), the Washington Volcanic Ash Advisory Center (VAAC) provides aviation alerts. Locations of many towns and drainages are listed in table 12 (BGVN 42:05).
Activity during July-December 2016 was very similar to the previous six months. Background activity included daily explosions, and ash emissions that often generated minor ashfall in communities within 15 km, generally to the SW. Strombolian activity sent material 300 m above the crater, and block avalanches down the flanks. Six eruptive episodes occurred during the second half of 2016, with characteristics very similar to the ten that occurred during the first half of the year (table 13). The episodes usually lasted around 48 hours. During the eruptive episodes, the amplitude and frequency of explosions increased to several per hour, and ash emissions that rose 1-3 km above the summit crater (4.8-7.8 km altitude) distributed ash tens of kilometers away. Diffuse ash plumes were often visible in satellite imagery several hundred kilometers from the volcano. Each episode was also accompanied by Strombolian activity that sent incandescent material 200-500 m above the summit crater, creating lava flows that descended major drainages. Episodes 11 and 16, in July and December, also included pyroclastic flows. The thermal signature recorded in the University of Hawaii's MODVOLC thermal alert system closely correlated with the increased heat flow from the lava flows during the eruptive episodes. Numerous lahars descended major drainages after heavy rains during August, but no damage was reported. A modest lahar was reported near the end of September.
Table 13. Eruptive episodes at Fuego during 2016. Details of episodes 1-10 are described in BGVN 42:06, episodes 11-16 are discussed in this report. The eruptive episode number is just for 2016 and was assigned by the Instituto Nacional de Sismologia, Vulcanología, Meteorología e Hidrologia (INSIVUMEH).
| Dates |
Episode |
Max Ash Plume altitude |
Ash Plume drift |
Ash Plume max distance |
Ashfall report locations |
Lava Flow drainages |
Lava Flow lengths |
Incandescence above crater |
Pyroclastic Flow drainages |
| 3-5 Jan 2016 |
1 |
6.0 km |
SW, SE, S |
40 km |
8-12 km SW and SE |
Las Lajas (SE), Trinidad (S), Santa Teresa (S) |
2.5 km |
400 m |
-- |
| 19-21 Jan 2016 |
2 |
6.7 km |
NE |
90 km |
8-18 km NE, 12 km NW |
Las Lajas (SE), Trinidad (S), Santa Teresa (S) |
3 km |
400-500 m |
Las Lajas (SE), El Jute (SE) |
| 9-10 Feb 2016 |
3 |
5.2 km |
NNW |
40 km |
45 km N, NE |
Las Lajas (SE), Trinidad (S), Santa Teresa (S) |
800 m-3 km |
300-400 m |
Las Lajas (SE), El Jute (SE) |
| 29 Feb-3 Mar 2016 |
4 |
7.3 km |
N |
400 km |
10 km SW, N, NW |
Las Lajas (SE), El Jute (SE) |
2-3 km |
yes |
Las Lajas (SE), El Jute (SE) |
| 26-27 Mar 2016 |
5 |
6.1 km |
W |
150 km |
9-12 km, SW, NW |
Las Lajas (SE), Santa Theresa (S), Trinidad (SE) |
2.0, 1.3, 1.0 km |
500 m |
-- |
| 12-14 Apr 2016 |
6 |
5.8 km |
SW |
185 km |
10 km SW |
Las Lajas (SE), Santa Theresa (S) |
2.0, 1.0 km |
100-300 m |
-- |
| 6-7 May 2016 |
7 |
5.5 km |
S, SW, SE |
65 km |
21 km SE |
Las Lajas (SE), Trinidad (SE) |
3.0 km, 1.5 km |
300 m |
-- |
| 18-19 May 2016 |
8 |
5.5 km |
SSW |
90 km |
30 km NW, S, SW, W |
-- |
-- |
-- |
Las Lajas (SE), Honda (E) |
| 21-23 May 2016 |
9 |
5.5 km |
SW, W, S |
75 km |
8-12 km, SW, ENE |
Las Lajas (SE) |
2 km |
200-300 m |
-- |
| 24-26 Jun 2016 |
10 |
5.5 km |
S, SW, W |
120 km |
8-12 km NW, SW |
Las Lajas (SE), El Jute (SE), Taniluyá (SW) |
2.5 km, 2.3 km, 600 m |
300 m |
-- |
| 28-29 Jul 2016 |
11 |
5.5 km |
SW, W, NW |
250 km |
12 km SW, W, 27 km NW |
Santa Teresa, Las Lajas |
1.5 km, 3 km |
500 m |
Santa Teresa |
| 6-8 Sep 2016 |
12 |
5.0 km |
W, SW |
25 km |
SW, W |
Las Lajas, Taniluyá |
1.2 km, 500 m |
300 m |
-- |
| 27-28 Sep 2016 |
13 |
5.0 km |
W, SW |
20 km |
-- |
Las Lajas, Santa Theresa |
1.5 km, 1.8 km |
300 m |
-- |
| 29-30 Oct 2016 |
14 |
7.0 km |
W, NW |
110 km |
10 km NW, SW |
Las Lajas, Santa Teresa, Taniluyá |
2.0 km, 300 m, 500 m |
400-500 m |
-- |
| 20-21 Nov 2016 |
15 |
5.0 km |
SSW |
175 km |
8-12 km SW |
Trinidad, Ceniza, Las Lajas |
1.0 km, 2.0 km, 2.5 km |
300 m |
-- |
| 20-21 Dec 2016 |
16 |
5.2 km |
W, SW |
230 km |
8-12 km SW |
Santa Teresa, Taniluyá, Trinidad, Las Lajas |
2.5, 2.0, 600, 1.8 |
400 m |
3.5 km Taniluyá |
Activity during July 2016. Explosions of incandescent material from the summit crater of Fuego were constant during July 2016, according to INSIVUMEH. On 5 July, an increase in the number of explosions per hour led to an ash plume rising to 4.5 km altitude and drifting W and SW. Incandescent blocks reached the vegetation on the W flank a few hundred meters from the summit. Ashfall was reported in the villages of Morelia, Santa Sofia, Sangre de Cristo (all around 10-12 km SW), and San Pedro Yepocapa (9 km NW). Another increase in activity on 15 July resulted in eight weak-to-moderate explosions per hour, which generated ash plumes that rose to about 4.3-4.8 km altitude and drifted more than 15 km W and SW; ash fell on the flanks in those directions. The Washington VAAC reported ash emissions rising to 4.6-5.2 km altitude, and MODVOLC issued one thermal alert. On 17 July, the Washington VAAC reported an ash emission drifting about 18 km W at 4.9 km altitude. Another ash emission was observed in satellite imagery on 19 July, at 5.2 km altitude drifting NW. The Washington VAAC also reported that the webcam showed lava on the flank near the summit that day.
Eruptive episode 11 began on 28 July 2016 and lasted for about 48 hours. Moderate-to-strong explosions expelled ash plumes to 5.5 km altitude that eventually drifted more than 250 km SW, W, and NW. The INSIVUMEH webcam at Finca La Reunion (SE) captured an image of the ash plume accompanied by a pyroclastic flow which descended the Santa Teresa ravine (barranca) around midday on 29 July (figure 50). Incandescent material was ejected about 500 m above the crater and fed two lava flows; one traveled 1.5 km down the Santa Teresa ravine, and the other traveled 3 km down the Las Lajas ravine. Some of the villages that reported ashfall included Sangre de Cristo, San Pedro Yepocapa, and Patzún (27 km NW). The Washington VAAC observed the ash plume in the early morning of 29 July extending 30 km WNW from the summit at 5.8 km altitude. By late morning, the plume had risen to 6.7 km altitude and was visible 150 km NW. The plume altitude dropped later in the day to 5.2 km, and the drift direction changed more toward the W. The farthest edge of the plume was faintly visible over 250 km W before it dissipated that evening. Incandescent explosions continued into the night, but had subsided by the next morning. A MODVOLC thermal anomaly signal first appeared on 26 July and persisted through 31 July; there were 17 thermal alert pixels reported on 29 July.
Activity during August 2016. Weak and moderate explosions that generated ash plumes characterized activity during August 2016. Although a few strong explosions were recorded, there were no distinct eruptive episodes documented by INSIVUMEH. Constant rains, however, led to several lahars descending the major ravines. Persistent steam plumes rose to 4.2 km and drifted W and SW. Weak-to-moderate explosions with ash reached 4.3 to 4.8 km altitude, and drifted more than 15 km SW and W before dissipating. Ashfall was reported primarily in the communities of Sangre de Cristo, Yepocapa, Morelia, Hagia Sophia, and Panimaché I and II. Incandescent material was ejected 300 m above the crater, and generated weak-to-moderate avalanches within the crater.
The Washington VAAC reported an ash plume visible in satellite imagery on 7 August at 4.9 km altitude extending about 10 km WNW from the summit. On 11 August, a narrow plume was spotted in both visible and multispectral imagery extending about 80 km W at the same altitude. A puff of volcanic ash appeared in clear satellite and webcam images drifting W at 4.9 km on 19 August. A series of ash emissions were spotted on 20 August in satellite imagery. The head of the plume was about 35 km W of the summit. The highest altitude plume reported by the Washington VAAC during August was at 5.8 km on 25 August, drifting 25 km W. A single MODVOLC thermal alert was also recorded that day. On 15 and 16 August moderate-to-large lahars descended the Las Lajas and El Jute ravines, carrying blocks as large as 3 m in diameter, tree trunks, branches, and other debris. Another lahar recorded on 28 August descended the Santa Teresa tributary of the Pantaleón River, where the residents noted the warm temperature of the debris.
Activity during September 2016. Two eruptive episodes took place during September 2016. Episode 12 began on 6 September and lasted about 48 hours. Moderate-to-strong explosions generated ash plumes that rose to 5 km altitude and drifted 25 km W and SW. Incandescent material rose to 300 m above the crater and fed two lava flows, one traveled 1.2 km down the Las Lajas ravine (figure 51), and the other travelled 500 m down the Taniluyá. The Washington VAAC reported an ash plume, identified in satellite imagery, on 7 September moving WSW at 4.9 km altitude. MODVOLC thermal alerts were issued during 4-8 September, with 10 alerts appearing on 8 September.
A bright hotspot in satellite imagery was reported by the Washington VAAC on 25 September 2016. A modest lahar descended the Santa Teresa ravine on 26 September, carrying 50-cm-diameter blocks, branches, and tree trunks; it was 10 m wide and 1 m high. Eruptive episode 13 began the next day, 27 September 2016, with moderate-to-strong explosions, and an ash plume that rose to 5 km altitude and drifted more than 20 km W and SW (figure 52). Incandescent material rose 300 m above the crater, feeding two lava flows. Lava traveled 1.5 km down the Las Lajas ravine (figure 53) and 1.8 km down the Santa Teresa ravine. A fissure developed on the S flank of the crater rim, and new fumarolic activity was observed during the day. Constant rumbling noises were audible in the areas of Finca Palo Verde, Sangre de Cristo, and San Pedro Yepocapa on the W and SW flanks. The Washington VAAC reported an intense hotspot in shortwave imagery. Activity subsided on 28 September. A strong multi-pixel thermal alert signal appeared in the MODVOLC data from 24-29 September.
Activity during October 2016. Six to ten explosions per day were recorded at Fuego during October 2016. Some of them generated ashfall on the SW flank. Episode 14, which began at the end of the month, produced three lava flows and strong explosions with an ash plume that rose to 7 km altitude and drifted N and NW. The Washington VAAC reported multiple ash emissions at 5.2 km altitude on 3 October, with the furthest one extending 35 km S. The next day, ash emissions were observed at 4.9 km altitude and drifted 22 km SSE. Pyroclastic flows were seen in an INSIVUMEH webcam on 10 October. They also reported ashfall in nearby communities that day.
Incandescent material rose 150-200 m above the summit crater on 28 October, and lava traveled 500 m down the Las Lajas ravine. Episode 14 began the next day with a strong explosion that generated an ash plume to 7 km altitude that drifted 110 km W and NW. Constant loud rumbling was reported up to 15 km from the volcano, and ashfall was reported in San Pedro Yepocapa, Sangre de Cristo, and La Conchita. Three incandescent lava fountains were seen in the early hours of 30 October (figure 54). The first, 450 m above the crater, fed a 2-km-long flow in the Las Lajas ravine. The second fountain rose to 250 m and fed a flow that traveled 300 m down the Santa Teresa canyon. The third fountain rose 200 m and formed a flow that traveled down the Taniluyá drainage for 500 m. Activity declined during the night of 30 October, but weak and moderate avalanches of incandescent material continued into the first part of the next day.
The first ash emissions of episode 14 were visible in satellite imagery on 29 October, extending roughly 45 km NNW from the summit. By early the next day, the ash emissions were detected at 7.3 km altitude, based on a pilot report. They extended about 110 km NNW from the summit. Later in the day, the plume had lowered to 5 km altitude and drifted 15 km N and NW. A single MODVOLC thermal alert was reported on 13 October, but a lengthy series of multi-pixel alerts were generated during 24-31 October, including 19 pixels on 30 October at the peak of episode 14.
Activity during November 2016. Activity during November 2016 remained at background levels until the third week of the month; explosions increased in amplitude and frequency to as many as 15 per hour, leading to episode 15 which began on 20 November. The background levels of the second and third weeks included incandescent material rising to 300 m above the crater, causing avalanches down the flanks around the crater rim and continuous explosions of weak-to-moderate energy that generated ash plumes rising to altitudes between 4.3 and 4.7 km that drifted W and SW.
The Washington VAAC reported ash emissions in satellite imagery every day from 8 to15 November 2016. A plume was seen on 8 November rising to 4.6 km altitude and drifting 25 km SW. The next day, a plume at the same altitude drifted 45 km NW. On 10 November, a faint plume was seen in visible imagery, extending about 25 km NNW. A larger plume was visible in morning imagery on 11 November at 5.5 km altitude extending 35 km WSW. The next day, at the same altitude, a diffuse plume was visible 10 km W of the summit. Multiple emissions were spotted drifting W from the summit at 4.6-4.9 km altitude on 13 and 14 November. Two single MODVOLC thermal alerts were reported on 12 and 14 November. A hotspot was detected in satellite imagery on 15 November, along with continuing emissions to 4.6 km altitude that drifted within 10 km SW of the summit. On 17 November ashfall was reported in Morelia, Santa Sofia, and Panimache I and II. Emissions on 18 November rose to 4.7 km altitude and drifted 10 km SW, and on 20 November they rose to 4.9 km altitude and drifted 24 km from the summit (figure 55).
Eruptive episode 15 began on 20 November with strong explosions that caused ash plumes to rise to 5 km altitude and drift as far as 175 km SSW and W, generating ashfall again in Morelia, Santa Sofia, and Panimache I and II. Three lava flows emerged from the 300-m-high Strombolian ejections; one traveled 1 km down the Trinidad ravine, one descended 2 km down barranca Ceniza, and the third flowed 2.5 km down barranca Las Lajas (figure 56). Numerous clouds of volcanic ash rose from block avalanches in Las Ceniza ravine on 20 and 21 November.
The Washington VAAC reported an extremely large hotspot on 20 November 2016 (local time) in infrared imagery, along with ash emissions at 4.9 km altitude drifting SW to 65 km. Emissions at 3.8 km persisted into the night. By early morning on 21 November, they were visible extending 175 km W. A lengthy period of multi-pixel MODVOLC thermal alerts coincided with eruptive episode 15 during 17-23 November, and included 26 pixels on 21 November 2016. Eruptive activity decreased to background levels by 22 November, and only weak explosions and fumarolic activity were reported for the rest of the month.
Activity during December 2016. Weak-to-moderate explosions and ash plumes characterized background activity at Fuego during December 2016. Minor ashfall was regularly reported in communities located 8-12 km SW. Activity increased somewhat during 15-16 December, and eruptive episode 16 was recorded during 20-21 December. During episode 16, Strombolian activity created three lava flows that descended major ravines, and a large pyroclastic flow traveled 3.5 km from the summit, burning vegetation in its path.
The Washington VAAC reported an ash emission on 5 December at 5.8 km altitude drifting N. On 8 December, intermittent ash plumes were drifting W over the East Pacific Ocean at 6.1 km altitude. Remnants over 450 km W were seen in multispectral imagery by early on 9 December. Multiple new detached plumes continued moving WNW between 5.5 and 6.1 km altitude on 9 December. They were 80 km NW by late afternoon. New discrete emissions at 4.6 km altitude appeared in satellite imagery on 10 December, drifting W up to 130 km before dissipating.
During the afternoon of 20 December 2016, eruptive episode 16 began with moderate-to-strong ash emissions producing an ash plume that rose to 4.7 km altitude and drifted more than 15 km W and SW. Incandescent material rose 400 m above the crater, and bombs fell more than 300 m away. Block avalanches were concentrated in the Ceniza and Trinidad ravines. By the evening of 20 December, three lava flows had formed, in the Santa Teresa, the Taniluyá, and the Las Lajas ravines (figure 57). By the morning of 21 December, they were 2.5, 2.0, and 1.8 km long, respectively. During that day, strong explosions generated ash plumes that rose to 5.2 km altitude and drifted 18 km S, SW, W, and NW. Some of the communities that reported ash from this event included Panimaché, Morelia, Santa Sofia, Sangre de Cristo, San Pedro Yepocapa, and Palo Verde.
Around 1000 on 21 December, pyroclastic flows that descended the Taniluyá ravine generated an ash plume that rose 2 km and drifted W and SW. The flows traveled 3.5 km and were estimated to be 300 m wide. They descended the ravine at high speed and high temperature, burning everything in their path (figure 58). These were the first pyroclastic flows in several months. By the end of eruptive episode 16, the lava flow in the Taniluyá ravine had reached 2.8 km in length (figure 59).
During episode 16, the Washington VAAC reported ash emissions rising to 5.2 km (about 1.4 km above the summit crater) altitude and drifting about 230 km SW. Continuing ash emissions on 23 December were visible in satellite imagery moving 45 km SW from the summit at 4.3 km altitude. Intermittent diffuse ash emissions extended up to 30 km WSW and NW from the summit during 28-31 December at 4.3-5.2 km altitude.
MODVOLC thermal alerts were intermittent throughout December. They were recorded on 8 (2), 11 (2), 12, 14 (2), 16 (3), and 18 (3) December prior to episode 16. The biggest interval of multi-pixel alerts was during episode 16 from 20-22 December, and included 14 alerts on 21 December 2016. Additional single alerts were recorded on 25 and 29 December.
Geologic Background. Volcán Fuego, one of Central America's most active volcanoes, is also one of three large stratovolcanoes overlooking Guatemala's former capital, Antigua. The scarp of an older edifice, Meseta, lies between Fuego and Acatenango to the north. Construction of Meseta dates back to about 230,000 years and continued until the late Pleistocene or early Holocene. Collapse of Meseta may have produced the massive Escuintla debris-avalanche deposit, which extends about 50 km onto the Pacific coastal plain. Growth of the modern Fuego volcano followed, continuing the southward migration of volcanism that began at the mostly andesitic Acatenango. Eruptions at Fuego have become more mafic with time, and most historical activity has produced basaltic rocks. Frequent vigorous eruptions have been recorded since the onset of the Spanish era in 1524, and have produced major ashfalls, along with occasional pyroclastic flows and lava flows.
Information Contacts: Instituto Nacional de Sismologia, Vulcanologia, Meteorologia e Hydrologia (INSIVUMEH), Unit of Volcanology, Geologic Department of Investigation and Services, 7a Av. 14-57, Zona 13, Guatemala City, Guatemala (URL: http://www.insivumeh.gob.gt/); Washington Volcanic Ash Advisory Center (VAAC), Satellite Analysis Branch (SAB), NOAA/NESDIS OSPO, NOAA Science Center Room 401, 5200 Auth Rd, Camp Springs, MD 20746, USA (URL: http://www.ospo.noaa.gov/Products/atmosphere/vaac/, archive at: http://www.ssd.noaa.gov/VAAC/archive.html); Hawai'i Institute of Geophysics and Planetology (HIGP) - MODVOLC Thermal Alerts System, School of Ocean and Earth Science and Technology (SOEST), Univ. of Hawai'i, 2525 Correa Road, Honolulu, HI 96822, USA (URL: http://modis.higp.hawaii.edu/); NASA Earth Observatory, EOS Project Science Office, NASA Goddard Space Flight Center, Goddard, Maryland, USA (URL: http://earthobservatory.nasa.gov/); Martin Rietze (URL: http://www.mrietze.com/index.htm).
Heard (Australia) — October 2017 Cite this Report
Heard
Australia
53.106°S, 73.513°E; summit elev. 2745 m
All times are local (unless otherwise noted)
Expedition visit in March-April 2016, intermittent eruptive activity through September 2017
The remote island of Heard in the southern Indian Ocean is home to the Big Ben stratovolcano, which has had confirmed intermittent activity since 1910. The nearest continental landmass, Antarctica, lies over 1,000 km S. Visual confirmation of lava flows on Heard are rare; thermal anomalies detected by satellite-based instruments provide the most reliable information about eruptive activity. Thermal alerts reappeared in September 2012 after a four-year hiatus (BGVN 38:01), and have been intermittent since that time. Information comes primarily from MODVOLC and MIROVA thermal anomaly data, but Australia's Commonwealth Scientific and Industrial Research Organisation (CSIRO) also provides reports from research expeditions. The independent March-April 2016 Cordell Expedition also provided recent ground-based observations mentioned in this report, which covers activity through September 2017.
Expeditions during January-April 2016. Scientists aboard the CSIRO Research Vessel Investigator observed an eruption of Big Ben on 31 January 2016. Vapor was seen emanating from the peak and lava flowed down the flank over a glacier (see figure 23, BGVN 41:08, and video link in Information Contacts). The research team, lead by the University of Tasmania's Institute for Marine and Antarctic Studies (IMAS), was conducting a study of the link between active volcanoes on the seafloor and the mobilization of iron by hydrothermal systems which enriches and supports life in the Southern Ocean.
During a private expedition from 22 March to 11 April 2016, scientists and engineers from the 2016 Cordell Expedition documented changes to the island and its life since a prior visit in 1997, and tested radio operations. On 23 March the team was able to photograph the usually cloud-covered Mawson Peak, the summit of Big Ben (figure 24). Steam was visible above the flat upper surface, possibly a crater rim or fissure. They estimated a height of about 45 m of an edifice rising above the adjacent slope. The ground at the site of the team campsite, near Atlas Cove on the NW side of the island, was covered with lava flows (figure 25). While the expedition had to cancel a planned expedition to the summit, rocks collected from the shoreline confirmed the diversity of volcanic rocks on the island (figure 26).
At the southern end of Sydney Cove, near Magnet Point on the northern tip of Laurens Peninsula (the NW side of the island), the team identified a small islet, with dimensions of about 40 x 120 m and nearly vertical sides about 100 m high. Columnar jointing in the volcanic rocks is well exposed at the base and on the nearly flat upper surface (figure 27).
Satellite thermal and visual data, 2012-2017. The most consistent source of information about eruptive activity at Heard comes from satellite instruments in the form of visual and thermal imagery, and thermal anomaly detection. From the time that renewed activity was detected in MODVOLC data in late September 2012 through September 2017, either the MODVOLC or MIROVA systems have consistently detected thermal signals, with only a few short breaks. A four-month span from mid-July to mid-November 2014, and a two-month gap during February and March 2015 are the only periods longer than a month when no thermal signal was reported. Continuous MIROVA information from late January 2016 through September 2017 shows intermittent but persistent thermal anomalies throughout the period (figure 28).
The moderate signal at the very end of January 2016 coincides with the CSIRO expedition observing the lava flows on the flank of Big Ben. Low-level MIROVA anomalies were recorded in April and early May 2016. Activity picked up during June, and strengthened through July and August 2016. Late September through November 2016 was a period with heightened activity as well. From December 2016 through August 2017, intermittent low-to-moderate intensity anomalies were recorded every month. Activity appeared to increase briefly during early February and September 2017. On 4 February 2017, Landsat 8 captured a rare clear view that showed fresh lava and debris flows emanating from the summit on top of the snow (figure 29). The longest flow is estimated to be 1,300 m long. False-color infrared imagery of the same image of Mawson Peak also reveals two vents separated by about 250 m (figure 30). Subsequent imagery on 20 and 27 February also detected thermal anomalies at the summit. The visual imagery of the lava flows on 4 February 2017 corresponds to the early February spike in MIROVA thermal anomaly data.
Geologic Background. Heard Island on the Kerguelen Plateau in the southern Indian Ocean consists primarily of the emergent portion of two volcanic structures. The large glacier-covered composite basaltic-to-trachytic cone of Big Ben comprises most of the island, and the smaller Mt. Dixon lies at the NW tip of the island across a narrow isthmus. Little is known about the structure of Big Ben because of its extensive ice cover. The active Mawson Peak forms the island's high point and lies within a 5-6 km wide caldera breached to the SW side of Big Ben. Small satellitic scoria cones are mostly located on the northern coast. Several subglacial eruptions have been reported at this isolated volcano, but observations are infrequent and additional activity may have occurred.
Information Contacts: Commonwealth Scientific and Industrial Research Organisation (CSIRO) (URL: http://www.csiro.au/); CSIROscope, CSIRO Blog, Big Ben Erupts: Australia's active volcano cluster blows its lid (URL: https://blog.csiro.au/big-ben-erupts/); Robert W. Schmieder, 2016 Cordell Expedition, 4295 Walnut Blvd., Walnut Creek, CA 94596, Post Expedition report to the Australian Antarctic Division (AAD) (URL: http://www.cordell.org/, http://www.heardisland.org/); MIROVA (Middle InfraRed Observation of Volcanic Activity), a collaborative project between the Universities of Turin and Florence (Italy) supported by the Centre for Volcanic Risk of the Italian Civil Protection Department (URL: http://www.mirovaweb.it/); Hawai'i Institute of Geophysics and Planetology (HIGP) - MODVOLC Thermal Alerts System, School of Ocean and Earth Science and Technology (SOEST), Univ. of Hawai'i, 2525 Correa Road, Honolulu, HI 96822, USA (URL: http://modis.higp.hawaii.edu/); NASA Earth Observatory, EOS Project Science Office, NASA Goddard Space Flight Center, Goddard, Maryland, USA (URL: http://earthobservatory.nasa.gov/); Bill Mitchell, The Inquisitive Rockhopper, Big Ben eruption update 2017-02-27 (URL: https://inquisitiverockhopper.wordpress.com/2017/02/).
Ibu
Indonesia
1.488°N, 127.63°E; summit elev. 1325 m
All times are local (unless otherwise noted)
Occasional weak ash explosions and thermal anomalies during April-August 2017
During March 2014-March 2017, activity at Ibu consisted of lava-dome growth, occasional weak emissions containing ash (figure 11), and frequent thermal anomalies (BGVN 40:11 and 42:05). Ongoing activity between April and August 2017 consisted primarily of intermittent ash explosions. Data come from Pusat Vulkanologi dan Mitigasi Bencana Geologi (PVMBG, also known as CVGHM) and the Darwin Volcanic Ash Advisory Centre (VAAC).
On 3 April 2017, at 0757 (local), an explosion produced an ash plume that rose to an altitude of 1.7 km and drifted S. Seismic signals indicated explosions and avalanches. During the rest of April through August, occasional explosions generated weak ash plumes that generally rose to altitudes of 1.5-1.8 km (0.2-0.5 km above the volcano) and drifted in various directions (table 2).
Table 2. Ash plume data for Ibu, April-August 2017. Courtesy of PVMBG and Darwin VAAC.
| Date |
Maximum plume altitude (km) |
Plume drift direction |
| 03 Apr 2017 |
1.7 |
S |
| 07-08 Apr 2017 |
1.7 |
N |
| 10-11 Apr 2017 |
1.5-1.6 |
S |
| 12-13, 17 Apr 2017 |
1.5-1.8 |
S, SW |
| 19-21 Apr 2017 |
1.5-1.8 |
E, N |
| 26-27, 29-30 Apr 2017 |
1.5-1.8 |
E, NE, N |
| 10-11 May 2017 |
1.8 |
E, SW |
| 16 May 2017 |
1.5 |
-- |
| 19-20, 23 May 2017 |
1.5-1.8 |
E, NE, S |
| 01, 05 Jun 2017 |
0.15-0.25 |
N, SE |
| 09-12, 14 Jun 2017 |
1.5-1.8 |
N, W, SSW |
| 14, 17-19 Jun 2017 |
1.5-1.8 |
S, SW, W, N |
| 15 Aug 2017 |
1.8 |
N |
| 24, 28 Aug 2017 |
1.5-1.8 |
W |
Between April and August 2017, thermal anomalies (based on MODIS satellite instruments analyzed using the MODVOLC algorithm) were recorded 2-5 days per month, with no monthly trend. The MIROVA (Middle InfraRed Observation of Volcanic Activity) system detected numerous hotspots each month; all except one were within 3 km of the volcano, and all were of low or moderately-low power.
Geologic Background. The truncated summit of Gunung Ibu stratovolcano along the NW coast of Halmahera Island has large nested summit craters. The inner crater, 1 km wide and 400 m deep, has contained several small crater lakes. The 1.2-km-wide outer crater is breached on the N, creating a steep-walled valley. A large cone grew ENE of the summit, and a smaller one to the WSW has fed a lava flow down the W flank. A group of maars is located below the N and W flanks. The first observed and recorded eruption was a small explosion from the summit crater in 1911. Eruptive activity began again in December 1998, producing a lava dome that eventually covered much of the floor of the inner summit crater along with ongoing explosive ash emissions.
Information Contacts: Pusat Vulkanologi dan Mitigasi Bencana Geologi (PVMBG, also known as Indonesian Center for Volcanology and Geological Hazard Mitigation, CVGHM), Jalan Diponegoro 57, Bandung 40122, Indonesia (URL: http://www.vsi.esdm.go.id/); Darwin Volcanic Ash Advisory Centre (VAAC), Bureau of Meteorology, Northern Territory Regional Office, PO Box 40050, Casuarina, NT 0811, Australia (URL: http://www.bom.gov.au/info/vaac/); MIROVA (Middle InfraRed Observation of Volcanic Activity), a collaborative project between the Universities of Turin and Florence (Italy) supported by the Centre for Volcanic Risk of the Italian Civil Protection Department (URL: http://www.mirovaweb.it/); Hawai'i Institute of Geophysics and Planetology (HIGP) - MODVOLC Thermal Alerts System, School of Ocean and Earth Science and Technology (SOEST), Univ. of Hawai'i, 2525 Correa Road, Honolulu, HI 96822, USA (URL: http://modis.higp.hawaii.edu/); Tom Pfeiffer, Volcano Discovery (URL: http://www.volcanodiscovery.com/).
Marapi (Indonesia) — October 2017 Cite this Report
Marapi
Indonesia
0.38°S, 100.474°E; summit elev. 2885 m
All times are local (unless otherwise noted)
Four short ash explosions on 4 June 2017
Recent activity at the large Gunung Marapi stratovolcano on Sumatra has consisted of small ash plumes, with eruptions of a single day to periods of a few months. Ashfall around the active crater rim (figure 5) and thin layers of ash deposits seen in the crater wall (figure 6) provide evidence of both the recent and very long history of explosive activity. Since 2011 there have been eruptive episodes during August-October 2011, March-May 2012, 26 September 2012, February 2014, and 14 November 2015. As reported by the Indonesian Center of Volcanology and Geological Hazard Mitigation (PVMBG), another series of explosions took place on 4 June 2017.
Four explosions on 4 June lasted less than one minute each, and generated ash plumes above the summit (figure 7) and drifted E. The explosions occurred at 1001 local time (0301 UTC), 1011, 1256, and 1550. Dense ash-and-steam plumes from each explosion rose 300 m, at least 700 m, 200 m, and 250 m above the crater, respectively. The Darwin VAAC reported ash at about 3.6 km altitude extending 37 km ENE, based on satellite imagery. Ejected bombs were deposited around the crater, and minor ashfall was reported in the Pariangan District (8 km SSE), Tanah Datar Regency. Seismicity increased after the explosions. The Alert Level remained at 2 (on a scale of 1-4); residents and visitors were advised not to enter an area within 3 km of the summit.
The broad summit area with multiple craters is a popular destination for hiking expeditions. A video posted by YouTube user "SiGiTZ" documented the experience of one group during visits on 30 April 2016 and on 11 May 2017. The video provides excellent views from 2016 of the entire crater complex and of the Verbeek Crater, from which a steam-and-gas plume appears to be rising. A video posted by YouTube user "yogi antula" included a television broadcast from the Anak Borneo Channel of a video from climbers in the crater area during the 4 June explosions, taken from approximately 400-500 m away. In that video, a significant dark ash plume can be seen rising from Bungsu-Verbeek crater complex, along with a smaller white plume from a closer location. The news report was concerned with 16 hikers known to be on the mountain; there were no later reports of anyone being injured.
References: SiGiTZ, 1 August 2017, Expedisi puncak Gunung Marapi Bukittingi Sumbar Mei 2017 (URL: https://www.youtube.com/watch?v=pVxhWAbo2VA).
yogi antula, 5 June 2017, Video amatir pendakian saat Gunung Marapi Erupsi – 4 Juni 2017 (by Anak Borneo Channel) (URL: https://www.youtube.com/watch?v=8GAY6lsTLEE).
Geologic Background. Gunung Marapi, not to be confused with the better-known Merapi volcano on Java, is Sumatra's most active volcano. This massive complex stratovolcano rises 2,000 m above the Bukittinggi Plain in the Padang Highlands. A broad summit contains multiple partially overlapping summit craters constructed within the small 1.4-km-wide Bancah caldera. The summit craters are located along an ENE-WSW line, with volcanism migrating to the west. More than 50 eruptions, typically consisting of small-to-moderate explosive activity, have been recorded since the end of the 18th century; no lava flows outside the summit craters have been reported in historical time.
Information Contacts: Pusat Vulkanologi dan Mitigasi Bencana Geologi (PVMBG, also known as Indonesian Center for Volcanology and Geological Hazard Mitigation, CVGHM), Jalan Diponegoro 57, Bandung 40122, Indonesia (URL: http://www.vsi.esdm.go.id/); Badan Nasional Penanggulangan Bencana (BNPB), National Disaster Management Agency, Graha BNPB - Jl. Scout Kav.38, East Jakarta 13120, Indonesia (URL: http://www.bnpb.go.id/); Sutopo Purwo Nugroho, Badan Nasional Penanggulangan Bencana (BNPB) (URL: https://twitter.com/Sutopo_BNPB); Axel Drainville, Flickr.com, with Creative Commons license Attribution-NonCommercial 2.0 Generic (CC BY-NC 2.0, https://creativecommons.org/licenses/by-nc/2.0/) (URL: https://www.flickr.com/photos/axelrd/).
Tolbachik (Russia) — October 2017 Cite this Report
Tolbachik
Russia
55.832°N, 160.326°E; summit elev. 3611 m
All times are local (unless otherwise noted)
Eruption that started in late November 2012 ends by mid-September 2013
The most recent eruption began on 27 November 2012 along two fissures a few kilometers S of the main Tolbachik edifice, within the Tolbachinsky Dol lava plateau (BGVN 37:12). Monitoring is done by the Kamchatkan Volcanic Eruption Response Team (KVERT); they recorded an end date for this eruption as 15 September 2013.
Activity reported through February 2013 included Strombolian fire fountains (figure 14), voluminous lava flows on the surface (figure 15 and 16) and under the ice and snow cover (figure 17), ash explosions, and the building of cinder cones (BGVN 37:12). Satellite imagery in early June 2013 revealed both a lava pond at the active vent and a large lava flow lower down the flank, with multiple flow-front breakouts (figure 18). Cinder cones continued to grow along the S fissure through 16-22 August 2013, and lava flows remained active (figure 19), but then gas-and-ash plumes weakened and seismicity decreased during the last week of the month (BGVN 38:08).
Seismicity continued to decrease during 22-24 August 2013, and KVERT noted on 27 August that no incandescence had been seen in recent days, and there were no current ash plumes. Satellite data did still show a large thermal anomaly in the northern area of Tolbachinsky Dol, which KVERT attributed to the lava flows remaining hot. The MODIS thermal anomaly data recorded in the MODVOLC system identified the latest hotspot on 27 August 2013. According to the Kamchatkan Volcanic Eruption Response Team (KVERT), the Aviation Color Code (ACC) was lowered from Orange to Yellow on 27 August 2013.
When the ACC was lowered to Green on 31 January 2014, KVERT reported that weak seismic activity and episodes of tremor continued, gas-and-steam activity was sometimes observed, and satellite data continued to show a weak thermal anomaly. However, they also stated that "probably its active phase was finishing in September 2013." The KVERT website recorded an end date of 15 September 2013. The new lava flows were still noticeable in visible satellite imagery more than a year after the eruption ended (figure 20).
Geologic Background. The massive Tolbachik volcano is located at the southern end of the Kliuchevskaya volcano group. The massif is composed of two overlapping, but morphologically distinct, volcanoes. The flat-topped Plosky Tolbachik shield volcano with its nested Holocene calderas up to 3 km in diameter is located east of the older and higher sharp-topped Ostry Tolbachik stratovolcano. The summit caldera at Plosky Tolbachik was formed in association with major lava effusion about 6,500 years ago and simultaneously with a major southward-directed sector collapse of Ostry Tolbachik. Long rift zones extending NE and SSW of the volcano have erupted voluminous basaltic lava flows during the Holocene, with activity during the past two thousand years being confined to the narrow axial zone of the rifts. The 1975-76 eruption originating from the SSW-flank fissure system and the summit was the largest historical basaltic eruption in Kamchatka.
Information Contacts: Kamchatka Volcanic Eruptions Response Team (KVERT), Far Eastern Branch, Russian Academy of Sciences, 9 Piip Blvd., Petropavlovsk-Kamchatsky, 683006, Russia (URL: http://www.kscnet.ru/ivs/kvert/); Institute of Volcanology and Seismology, Far Eastern Branch, Russian Academy of Sciences (IVS FEB RAS), 9 Piip Blvd., Petropavlovsk-Kamchatsky 683006, Russia (URL: http://www.kscnet.ru/ivs/eng/); Hawai'i Institute of Geophysics and Planetology (HIGP) - MODVOLC Thermal Alerts System, School of Ocean and Earth Science and Technology (SOEST), Univ. of Hawai'i, 2525 Correa Road, Honolulu, HI 96822, USA (URL: http://modis.higp.hawaii.edu/); NASA Earth Observatory, EOS Project Science Office, NASA Goddard Space Flight Center, Goddard, Maryland, USA (URL: http://earthobservatory.nasa.gov/); Google Earth (URL: https://www.google.com/earth/).
Ubinas
Peru
16.345°S, 70.8972°W; summit elev. 5608 m
All times are local (unless otherwise noted)
Intermittent ash explosions during September 2016-February 2017
Ubinas is an active stratovolcano in southern Peru about 70 km E of the city of Arequipa. Holocene lava flows cover its flanks, and the historical record since the mid-1500's contains evidence of minor explosive eruptions, debris avalanches, tephra deposits, phreatic outbursts, and pyroclastic flows and lahars. An eruptive episode that began with phreatic explosions on 1 September 2013 lasted through 27 February 2016, producing numerous small ash emissions, several large explosions with ash plumes that rose above 10 km altitude, large SO2 anomalies, evacuations, and several millimeters of ashfall in surrounding villages. Significant MIROVA thermal anomalies first appeared in mid-June 2015 and persisted through January 2016. A smaller eruptive episode described below began on 13 September 2016 and continued with intermittent explosive activity through 2 March 2017. Information is provided by the Instituto Geofísico del Perú, Observatoria Vulcanologico del Sur (IGP-OVS), the Observatorio Volcanológico del INGEMMET (Instituto Geológical Minero y Metalúrgico) (OVI-INGEMMET), and the Buenos Aires VAAC (Volcanic Ash Advisory Center).
After activity subsided at the end of February 2016, Ubinas remained quiet through August 2016, with only sporadic steam and gas emissions, and very low levels of seismicity. Seismicity increased again beginning on 9 September, and the first ash emission of a new episode was reported on 13 September 2016. An explosion on 3 October released a significant ash plume that rose 2 km above the 5,672-m-summit. Four additional explosions with minor ash emissions were reported in November, and one occurred on 6 December. Webcams captured images of sporadic low-density ash emissions throughout February 2017, with the last report of possible emissions on 2 March 2017. Emissions of steam and gas and seismicity decreased throughout April 2017, and IGP-OVS lowered the alert level to Green by the end of May. Ubinas remained quiet through September 2017.
Activity during April-December 2016. After the small ash emission of 27 February 2016, seismicity at Ubinas dropped to very low levels of a few events per day (BGVN 41:10, figure 40). Sporadic steam emissions with small quantities of bluish magmatic gases rose no more than a few hundred meters above the summit during March-August 2016; there were no reports of ash emissions. A small seismic swarm of about 100 earthquakes was recorded on 5 April. The first "tornillo" type earthquakes seen in several months appeared beginning on 4 June, indicating to IGP-OVS the beginning of a new eruptive cycle. The lagoon that had formed at the bottom of the summit crater due to rains earlier in the year began to disappear as the dry season approached (figure 41).
Beginning on 9 September 2016, both OVI and OVS noted an increase in seismic activity of LP, hybrid, and VT-type events (figure 42). On 13 September, OVS reported that steam plumes rose higher than 1,000 m above the summit for the first time in many months, and a minor ash emission was observed. OVI reported possible ash emissions in weekly reports on 12, 17, and 24 September. Emissions of bluish gas and steam were typical for the remainder of September (figure 43).
Both OVI and OVS reported ash emissions from explosions on 3 October 2016 (figure 44). Seismic tremor, associated with ash emissions, lasted for nine and a half hours. The ash plume drifted NE, E, SE, and SW up to 2 km above the summit, according to OVS. Fumarolic activity then returned, with steam and bluish gases rising no more than 1,500 m above the crater rim for the remainder of October. The Buenos Aires VAAC noted the eruption reported by IGP, but was not able to identify volcanic ash from satellite data under clear skies. After peaking in early October at several hundred events per day, seismicity declined to below 50 events on 21 October, and then rose slightly to around 200 events per day for the rest of the month. Steam and gas emissions remained less than 500 m above the summit.
Three explosions with minor ash and gas (mostly SO2) were reported by IGP-OVS on 8 November (local time). NASA Goddard Space Flight Center reported a significant SO2 emission associated with this event. The ash plume rose to about 1,500 m above the crater rim (about 7.2 km altitude). Seismicity remained high, with 250-350 events per day for several days after the explosion before declining back to around 150 events per day by 15 November. Another explosion, with minor ash emissions that rose 500 m, was reported by both OVS and OVI on 17 November 2016. After a small spike in seismicity between 23 and 29 November, the number of seismic events dropped below 50 per day. OVS reported a small ash emission that rose 100 m above the summit and drifted NW on 6 December 2016. OVI noted a modest increase in seismicity between 6 and 15 December, but only sporadic emissions of water vapor and gas were detected for the remainder of the month.
Activity during January-September 2017. Gas and steam emissions remained below 500 m above the crater rim during January 2017. OVS reported an explosion at 0223 on 24 January, but could not confirm ash emissions due to darkness. Occasional emissions of steam and gas rose as high at 2 km above the summit crater, but they generally remained below 500 m. OVI observed five lahars during January, but no damage was reported. Seismicity remained below 60 events per day during the month, except for a few days during 8-12 January when the frequency increased to 100-150 events per day.
OVS reported sporadic low-density ash emissions throughout February 2017 (figure 45). They were accompanied, occasionally, by water vapor and bluish gas, and did not rise more than 1,500 m above the summit crater. Weather clouds obscured the summit for much of the month. OVI reported minor ash emissions on 4, 10, 14, and 18 February (figure 46). Seismicity fluctuated throughout the month from values as high as almost 70 events per day (8 February) to fewer than 10 events per day (10-19 February).
OVS reported only magmatic gas and steam emissions (with no ash) during March 2017, with plumes rising to a maximum height of 300 m above the summit crater. OVI noted possible diffuse ash emissions on 1 and 2 March, but only steam and gas emissions for the remainder of the month. They reported variable seismicity with the frequency of daily events ranging from less than 10 per day to almost 70, averaging about 30 events per day.
Seismic energy decreased significantly during April 2017. Sporadic steam emissions reached maximum heights of only a few hundred meters above the crater. This relative quiet enabled OVS scientist Melquiades Álvarez to make a brief inspection of the summit crater on 14 April where he observed intermittent steam emissions rising from the base of the summit crater (figure 47). No ash emissions were reported during April. OVI reported that the number of seismic events dropped consistently during April from a high of 20 daily events on 1 April, to fewer than 5 events per day at the end of the month.
The reduction in activity continued during May 2017; steam and gas emissions became more sporadic and were rarely reported rising above 500 m over the summit crater. IGP-OVS reduced the alert level from Yellow to Green (2 to 1 on a 4-level scale) during the second half of the month. Seismicity reported by OVI fluctuated between 2 and 14 daily events. Ubinas remained quiet from June through September 2017, with only occasional minor fumarolic activity of steam or magmatic gas plumes that rose a few hundred meters above the summit crater (figure 48). Frequency of seismic events remained below 20 events per day through August and dropped to less than 10 per day in September.
Geologic Background. The truncated appearance of Ubinas, Perú's most active volcano, is a result of a 1.4-km-wide crater at the summit. It is the northernmost of three young volcanoes located along a regional structural lineament about 50 km behind the main volcanic front. The growth and destruction of Ubinas I was followed by construction of Ubinas II beginning in the mid-Pleistocene. The upper slopes of the andesitic-to-rhyolitic Ubinas II stratovolcano are composed primarily of andesitic and trachyandesitic lava flows and steepen to nearly 45°. The steep-walled, 150-m-deep summit crater contains an ash cone with a 500-m-wide funnel-shaped vent that is 200 m deep. Debris-avalanche deposits from the collapse of the SE flank about 3,700 years ago extend 10 km from the volcano. Widespread Plinian pumice-fall deposits include one from about 1,000 years ago. Holocene lava flows are visible on the flanks, but activity documented since the 16th century has consisted of intermittent minor-to-moderate explosive eruptions.
Information Contacts: Instituto Geofisico del Peru, Observatoria Vulcanologico del Sur (IGP-OVS), Arequipa Regional Office, Urb La Marina B-19, Cayma, Arequipa, Peru (URL: http://ovs.igp.gob.pe/); Observatorio Volcanologico del INGEMMET, (Instituto Geológical Minero y Metalúrgico), Barrio Magisterial Nro. 2 B-16 Umacollo - Yanahuara Arequipa (URL: http://ovi.ingemmet.gob.pe); Buenos Aires Volcanic Ash Advisory Center (VAAC), Servicio Meteorológico Nacional-Fuerza Aérea Argentina, 25 de mayo 658, Buenos Aires, Argentina (URL: http://www.smn.gov.ar/vaac/buenosaires/inicio.php?lang=es).
Wrangell (United States) — October 2017 Cite this Report
Wrangell
United States
62.006°N, 144.017°W; summit elev. 4278 m
All times are local (unless otherwise noted)
Occasional steam plumes and wind-blown ash, but no recent eruptive activity
A previous report on Wrangell noted that the heat flux from a crater on the N side of the summit rim had increased by an order of magnitude between 1964 and 1986 (SEAN 11:04). Wrangell has several active fumarolic areas in its summit caldera. These fumaroles frequently produce steam plumes that are mistaken for eruptive activity. The Alaska Volcano Observatory (AVO) receives several reports per year from pilots and local residents who observe larger than normal steam clouds over the summit. Although there have been some events possibly involving wind-blown ash, there have been no recent confirmed eruptions.
Activity during 1996-2000. According to Neal and McGimsey (1997), a pilot reported a suspicious cloud around 18 January 1996 rising about 1.5 km near Wrangell. The National Weather Service (NWS) confirmed that a robust steam plume had been visible over the volcano for several weeks.
McGimsey and Wallace (1999) reported that, on 3 June 1997, a pilot reported steam rising from the summit. On 24 June another report described a steam plume rising about 200 m above the summit. This sighting was not observed on satellite imagery.
McGimsey and others (2004) reported that on the morning of 14 May 1999, a NWS observer in Gulkana (about 75 km WNW) reported anomalous steam emissions containing a small amount of ash. During clear weather at approximately 0930 local time, a rapidly billowing grayish-white plume rose to about 900 m above the N summit crater. The observer stated that at this time of year, on clear days, a small, wispy, steam plume is usually visible above Wrangell in the early morning, and dissipates by early afternoon. On this day, the plume developed quickly, was abnormally voluminous, and had a grayish color.
A pilot had also observed the activity and noticed that more "dirt" surrounded the N crater than usual, and that on the upper part of the Chestnina Glacier high on the SW flank, blocks of ice were chaotically jumbled (higher relief between blocks) and that the glacier surface was much more crevassed than he had ever previously seen. He also observed that one of two known fumaroles at 3,350 m elevation on the S flank, which typically issue steam through ice holes, was surrounded by a sizeable patch of bare rock, a new development since his last recent flight over the area. The pilot further reported that he had observed no sign of flowage or melting events high on the flank, but that he had not flown over the lower reaches of the glacier. As of 1700 that day the NWS observer in Gulkana could still see a small steam plume and with binoculars could see that the snow around the summit area appeared to be light gray and that this was a definite color contrast and not an effect from shadows.
According to Neal and others (2004), a Trans Alaska Pipeline worker reported an unusually strong, white steam plume on 18 March 2000 between 0500 and 0600 local time. Later that day a National Park Service (NPS) employee in Kenny Lake reported robust steaming during the previous month from multiple sources on the SW flank between approximately 600-1,500 m below the summit. AVO found no anomalies in satellite imagery and concluded that no significant unrest had occurred.
Activity during 2002-2003. Neal and others (2005) reported that on 1 August 2002, AVO received several calls reporting a dark cloud drifting downwind from the general summit area and a dark deposit high on its snow-covered flank. AVO seismologists, however, checked data from the Wrangell seismic network and, based on a lack of correlative seismicity, concluded that no eruption or explosion had occurred. AVO also consulted with a local NPS geologist, who suggested that high winds had lofted fine-grained material exposed in the area near the summit fumaroles. On 4 August, an AVO geologist traveling in the area verified that a diffuse, light gray stripe extended a short distance down the flank of the volcano, emanating from the W caldera rim.
Subsequently, a local resident presented AVO with a video showing the waning portion of the event and his written observations. The witness described multiple dark billowing black ash puffs; the wind was from the E and the puffs were not rising over the summit. By the time he had returned to a good vantage point to film, about 10-12 minutes later, the billowing had stopped and the puffs had "turned a more grayish color."
According to the authors, the video showed discrete, light gray "puffs" that moved downwind and retained their individual integrity. There were no other weather clouds in the vicinity. A light gray, relatively motionless and irregular-shaped cloud sat near the caldera rim. A breeze could be observed at ground level (indicated by motion in the trees) but at altitude, clouds were not shearing rapidly. High on the snow-covered flank, a gray-colored swath extended from a high point at the W caldera rim near Wrangell's crater. The end of the video footage showed two distinct dark areas on the rim that were normally snow-covered. The resident's son reported a similar but more vigorous event on 2 August at about the same time of the day, but AVO received no further inquiries or reports.
AVO concluded that no volcanic process of significance had occurred. However, the authors stated "these observations remain enigmatic: lack of any seismicity would seem to preclude a phreatic or magmatic eruption and yet the pulsatory, 'puffing' nature of the dirty clouds is difficult to reconcile with a wind phenomenon."
McGimsey and others (2005) reported that NPS geologist Danny Rosenkrans contacted AVO with photographs taken by a local resident on 11 June 2003 showing an unusual towering cloud over the summit. Although the authors acknowledged that it could simply have been a common cumulus cloud, they noted that the absence of cumulus clouds in the area over nearby Mts. Drum and Sanford suggested that calm weather conditions permitted steam emissions from the known summit fumaroles to coalesce and form the plume-like cloud.
McGimsey and others (2005) also reported that on 18 September 2003 the Center Weather Service Unit called with a Pilot Weather Report of a steam plume 600-700 m over the volcano. The pilot reported no ash or sulfur smell. AVO scientists checked satellite imagery and seismograms and found nothing unusual.
Activity during 2007. McGimsey and others (2011) stated that an M 8.2 earthquake in the Kurile Islands on 13 January 2007 may have triggered seismicity at Wrangell and other nearby volcanoes. There were no reports of steaming immediately following this event; however, two weeks later, on 7 February, a relatively large local earthquake was recorded on the Wrangell network that was followed another two weeks later by steaming from the summit. According to the authors, this was the first report of Wrangell steaming in several years.
The authors also mentioned additional episodes of steaming in March 2007. On 25 March, a resident living about 80 km N of the summit reported a strong sulfur odor, an occurrence the resident stated was rare in his 15 years of living in the area. Earlier that day, the Wrangell network had recorded several multi-station seismic events. The authors note that several months later, local residents sent AVO photographs taken on 20 June of steaming from Wrangell and a deposit of ash extending from the W crater many hundreds of meters down the SW flank (figure 2). According to the authors, this ash was likely redistributed from the summit craters by strong winds. No anomalous seismic activity was observed.
Activity during 2010. A report by Neal and others (2014) noted that no significant eruptive activity or restlessness had occurred in 2010. However, the authors stated that AVO had received a report of possible vapor emission from the summit area. In May 2010, a single LIDAR swath taken during a summit overflight by glaciologists from the Geophysical Institute, University of Alaska-Fairbanks, depicted the topography of North Crater, a long-known fumarolic source on the NW rim of the ice-filled summit caldera. According to the authors, there are several secondary depressions, including a complex, kidney-bean shaped pit about 20 m deep and 200 m across, located in the center of North crater. This result is broadly consistent with previously recorded surveys of North Crater using photogrammetric techniques.
Neal and others (2014) reported that in early November 2010, a long-time local resident called AVO to report "more activity at the Mount Wrangell summit than he had ever seen before." He sent AVO several images of the volcano taken on 2 November and assured AVO that when the activity in question began, there had been no weather clouds in the area. He noted about ten "bursts" from the summit and said this was unusual compared to the typical steady emissions often seen. The authors stated that AVO reviewed available seismic and satellite data and, finding no evidence of volcanic signals, concluded that the phenomenon was most likely weather-related.
Activity during 2012. According to Herrick and others (2014), no eruptive activity or significant unrest had occurred in 2012, but as in previous years AVO received reports of fumarolic activity high on its flanks. The authors noted that, because of seismic station outages, AVO had removed Wrangell from its monitored list on 27 January 2012, where it remained for at least through the rest of the year. At the same time, the Aviation Color Code and Volcano Alert Level were downgraded from Green/Normal to Unassigned.
Herrick and others (2014) reported that on 11 March 2012, local observers noted "puffs of steam." AVO analysts using satellite images detected small plumes above known fumaroles. On 20 March 2012, a citizen noticed unusually rigorous steaming and described it as looking like "a pressure cooker shot through with nails." Steam rose from both the summit and a location on the SW flank at an elevation of about 3 km. Other calls to AVO registered concern about the significant plumes. Because no other evidence of significant volcanic unrest was detected, AVO concluded these events were likely generated by normal fumarolic activity.
References. Neal, C., and McGimsey, R. G., 1997, 1996 volcanic activity in Alaska and Kamchatka: Summary of events and response of the Alaska Volcano Observatory: U.S. Geological Survey Open-File Report OF 97-0433, 34 p.
McGimsey, R. G., and Wallace, K. L., 1999, 1997 volcanic activity in Alaska and Kamchatka: Summary of events and response of the Alaska Volcano Observatory: U.S. Geological Survey Open-File Report OF 99-0448, 42 p.
McGimsey, R. G., Neal, C. A., and Girina, O., 2004, 1999 Volcanic activity in Alaska and Kamchatka: Summary of events and response of the Alaska Volcano Observatory: U.S. Geological Survey Open-File Report OF 2004-1033, 49 p.
McGimsey, R. G., Neal, C. A., Dixon, J. P., Malik, N., and Chibisova, M., 2011, 2007 Volcanic activity in Alaska, Kamchatka, and the Kurile Islands: Summary of events and response of the Alaska Volcano Observatory: U.S. Geological Survey Scientific Investigations Report 2010-5242, 110 p. Available online at http://pubs.usgs.gov/sir/2010/5242/.
Neal, C. A., McGimsey, R. G., and Chubarova, O., 2004, 2000 Volcanic activity in Alaska and Kamchatka: Summary of events and response of the Alaska Volcano Observatory: U.S. Geological Survey Open-File Report OF 2004-1034, 37 p.
Neal, C. A., McGimsey, R. G., and Girina, O., 2005, 2002 Volcanic activity in Alaska and Kamchatka: Summary of events and response of the Alaska Volcano Observatory: U.S. Geological Survey Open-File Report OF 2004-1058, 55 p., available online at http://pubs.usgs.gov/of/2004/1058/.
McGimsey, R. G., Neal, C. A., and Girina, O., 2005, 2003 volcanic activity in Alaska and Kamchatka: Summary of events and response of the Alaska Volcano Observatory: U.S. Geological Survey Open-File Report 2005-1310, 62 p., http://pubs.usgs.gov/of/2005/1310/.
McGimsey, R. G., Neal, C. A., Dixon, J. P., Malik, N., and Chibisova, M., 2011, 2007 Volcanic activity in Alaska, Kamchatka, and the Kurile Islands: Summary of events and response of the Alaska Volcano Observatory: U.S. Geological Survey Scientific Investigations Report 2010-5242, 110 p. Available online at http://pubs.usgs.gov/sir/2010/5242/.
Neal, C. A., Herrick, J., Girina, O. A., Chibisova, M., Rybin, A., McGimsey, R. G., and Dixon, J., 2014, 2010 Volcanic activity in Alaska, Kamchatka, and the Kurile Islands - Summary of events and response of the Alaska Volcano Observatory: U.S. Geological Survey Scientific Investigations Report 2014-5034, 76 p., http://dx.doi.org/10.3133/sir20145034/.
Herrick, J. A., Neal, C. A., Cameron, C. E., Dixon, J. P., and McGimsey, R. G., 2014, 2012 Volcanic activity in Alaska: Summary of events and response of the Alaska Volcano Observatory: U.S. Geological Survey Scientific Investigations Report 2014-5160, 82p., http://dx.doi.org/10.3133/sir20145160/.
Geologic Background. Mount Wrangell is one of the world's largest continental-margin volcanoes, with a diameter of 30 km at 2,000 m elevation. The andesitic shield volcano has produced fluid lava flows as long as 58 km and contains an ice-filled caldera 4-6 km in diameter and 1 km deep, located within an older 15-km-wide caldera. Most of the edifice was constructed during eruptions between about 600,000 and 200,000 years ago. Formation of the summit caldera followed sometime between about 200,000 and 50,000 years ago. Three post-caldera craters are located at the broad summit, along the northern and western caldera rim. A steep-sided flank cinder cone, Mount Zanetti, is located 6 km NW of the summit. The westernmost cone has been the source of infrequent eruptions beginning in the 18th century. Increased heat flux in recent years has melted large volumes of ice in the northern crater.
Information Contacts: Alaska Volcano Observatory (AVO), a cooperative program of a) U.S. Geological Survey, 4200 University Drive, Anchorage, AK 99508-4667 USA (URL: https://avo.alaska.edu/), b) Geophysical Institute, University of Alaska, PO Box 757320, Fairbanks, AK 99775-7320, USA, and c) Alaska Division of Geological & Geophysical Surveys, 794 University Ave., Suite 200, Fairbanks, AK 99709, USA (URL: http://dggs.alaska.gov/).