Recently Published Bulletin Reports
Erebus (Antarctica) Lava lake remains active; most thermal alerts recorded since 2019
Rincon de la Vieja (Costa Rica) Frequent phreatic explosions during July-December 2023
Bezymianny (Russia) Explosion on 18 October 2023 sends ash plume 8 km high; lava flows and incandescent avalanches
Kilauea (United States) Low-level lava effusions in the lava lake at Halema’uma’u during July-December 2022
Nyamulagira (DR Congo) Lava flows and thermal activity during May-October 2023
Bagana (Papua New Guinea) Explosions, ash plumes, ashfall, and lava flows during April-September 2023
Mayon (Philippines) Lava flows, pyroclastic flows, ash emissions, and seismicity during April-September 2023
Nishinoshima (Japan) Eruption plumes and gas-and-steam plumes during May-August 2023
Krakatau (Indonesia) White gas-and-steam plumes and occasional ash plumes during May-August 2023
Merapi (Indonesia) Frequent incandescent avalanches during April-September 2023
Villarrica (Chile) Strombolian activity, gas-and-ash emissions, and crater incandescence during April-September 2023
Ebeko (Russia) Moderate explosive activity with ash plumes continued during June-November 2023
Erebus (Antarctica) — January 2024  Cite this Report
Erebus
Antarctica
77.53°S, 167.17°E; summit elev. 3794 m
All times are local (unless otherwise noted)
Lava lake remains active; most thermal alerts recorded since 2019
The lava lake in the summit crater of Erebus has been active since at least 1972. Located in Antarctica overlooking the McMurdo Station on Ross Island, it is the southernmost active volcano on the planet. Because of the remote location, activity is primarily monitored by satellites. This report covers activity during 2023.
The number of thermal alerts recorded by the Hawai'i Institute of Geophysics and Planetology’s MODVOLC Thermal Alerts System increased considerably in 2023 compared to the years 2020-2022 (table 9). In contrast to previous years, the MODIS instruments aboard the Aqua and Terra satellites captured data from Erebus every month during 2023. Consistent with previous years, the lowest number of anomalous pixels were recorded in January, November, and December.
Table 9. Number of monthly MODIS-MODVOLC thermal alert pixels recorded at Erebus during 2017-2023. See BGVN 42:06 for data from 2000 through 2016. The table was compiled using data provided by the HIGP – MODVOLC Thermal Alerts System.
| Year |
Jan |
Feb |
Mar |
Apr |
May |
Jun |
Jul |
Aug |
Sep |
Oct |
Nov |
Dec |
SUM |
| 2017 |
0 |
21 |
9 |
0 |
0 |
1 |
11 |
61 |
76 |
52 |
0 |
3 |
234 |
| 2018 |
0 |
21 |
58 |
182 |
55 |
17 |
137 |
172 |
103 |
29 |
0 |
0 |
774 |
| 2019 |
2 |
21 |
162 |
151 |
55 |
56 |
75 |
53 |
29 |
19 |
1 |
0 |
624 |
| 2020 |
0 |
2 |
16 |
18 |
4 |
4 |
1 |
3 |
18 |
3 |
1 |
6 |
76 |
| 2021 |
0 |
9 |
1 |
0 |
2 |
56 |
46 |
47 |
35 |
52 |
5 |
3 |
256 |
| 2022 |
1 |
13 |
55 |
22 |
15 |
32 |
39 |
19 |
31 |
11 |
0 |
0 |
238 |
| 2023 |
2 |
33 |
49 |
82 |
41 |
32 |
70 |
64 |
42 |
17 |
5 |
11 |
448 |
Sentinel-2 infrared images showed one or two prominent heat sources within the summit crater, accompanied by adjacent smaller sources, similar to recent years (see BGVN 46:01, 47:02, and 48:01). A unique image was obtained on 25 November 2023 by the OLI-2 (Operational Land Imager-2) on Landsat 9, showing the upper part of the volcano surrounded by clouds (figure 32).
Geologic Background. Mount Erebus, the world's southernmost historically active volcano, overlooks the McMurdo research station on Ross Island. It is the largest of three major volcanoes forming the crudely triangular Ross Island. The summit of the dominantly phonolitic volcano has been modified by one or two generations of caldera formation. A summit plateau at about 3,200 m elevation marks the rim of the youngest caldera, which formed during the late-Pleistocene and within which the modern cone was constructed. An elliptical 500 x 600 m wide, 110-m-deep crater truncates the summit and contains an active lava lake within a 250-m-wide, 100-m-deep inner crater; other lava lakes are sometimes present. The glacier-covered volcano was erupting when first sighted by Captain James Ross in 1841. Continuous lava-lake activity with minor explosions, punctuated by occasional larger Strombolian explosions that eject bombs onto the crater rim, has been documented since 1972, but has probably been occurring for much of the volcano's recent history.
Information Contacts: Hawai'i Institute of Geophysics and Planetology (HIGP) - MODVOLC Thermal Alerts System, School of Ocean and Earth Science and Technology (SOEST), Univ. of Hawai'i, 2525 Correa Road, Honolulu, HI 96822, USA (URL: http://modis.higp.hawaii.edu/); Copernicus Browser, Copernicus Data Space Ecosystem, European Space Agency (URL: https://dataspace.copernicus.eu/browser/); NASA Earth Observatory, EOS Project Science Office, NASA Goddard Space Flight Center, Goddard, Maryland, USA (URL: https://earthobservatory.nasa.gov/images/152134/erebus-breaks-through).
Rincon de la Vieja (Costa Rica) — January 2024 Cite this Report
Rincon de la Vieja
Costa Rica
10.83°N, 85.324°W; summit elev. 1916 m
All times are local (unless otherwise noted)
Frequent phreatic explosions during July-December 2023
Rincón de la Vieja is a volcanic complex in Costa Rica with a hot convecting acid lake that exhibits frequent weak phreatic explosions, gas-and-steam emissions, and occasional elevated sulfur dioxide levels (BGVN 45:10, 46:03, 46:11). The current eruption period began June 2021. This report covers activity during July-December 2023 and is based on weekly bulletins and occasional daily reports from the Observatorio Vulcanologico Sismologica de Costa Rica-Universidad Nacional (OVSICORI-UNA).
Numerous weak phreatic explosions continued during July-December 2023, along with gas-and-steam emissions and plumes that rose as high as 3 km above the crater rim. Many weekly OVSICORI-UNA bulletins included the previous week's number of explosions and emissions (table 9). For many explosions, the time of explosion was given (table 10). Frequent seismic activity (long-period earthquakes, volcano-tectonic earthquakes, and tremor) accompanied the phreatic activity.
Table 9. Number of reported weekly phreatic explosions and gas-and-steam emissions at Rincón de la Vieja, July-December 2023. Counts are reported for the week before the Weekly Bulletin date; not all reports included these data. Courtesy of OVSICORI-UNA.
| OVSICORI Weekly Bulletin |
Number of explosions |
Number of emissions |
| 28 Jul 2023 |
6 |
14 |
| 4 Aug 2023 |
10 |
12 |
| 1 Sep 2023 |
13 |
11 |
| 22 Sep 2023 |
12 |
13 |
| 29 Sep 2023 |
6 |
11 |
| 6 Oct 2023 |
12 |
5 |
| 13 Oct 2023 |
7 |
9 |
| 20 Oct 2023 |
1 |
15 |
| 27 Oct 2023 |
3 |
23 |
| 3 Nov 2023 |
3 |
10 |
| 17 Nov 2023 |
0 |
Some |
| 24 Nov 2023 |
0 |
14 |
| 8 Dec 2023 |
4 |
16 |
| 22 Dec 2023 |
8 |
18 |
Table 10. Summary of activity at Rincón de la Vieja during July-December 2023. Weak phreatic explosions and gas emissions are noted where the time of explosion was indicated in the weekly or daily bulletins. Height of plumes or emissions are distance above the crater rim. Courtesy of OVSICORI-UNA.
| Date |
Time |
Description of Activity |
| 1 Jul 2023 |
0156 |
Explosion. |
| 2 Jul 2023 |
0305 |
Explosion. |
| 4 Jul 2023 |
0229, 0635 |
Event at 0635 produced a gas-and-steam plume that rose 700 m and drifted W; seen by residents in Liberia (21 km SW). |
| 9 Jul 2023 |
1843 |
Explosion. |
| 21 Jul 2023 |
0705 |
Explosion. |
| 26 Jul 2023 |
1807 |
Explosion. |
| 28 Jul 2023 |
0802 |
Explosion generated a gas-and-steam plume that rose 500 m. |
| 30 Jul 2023 |
1250 |
Explosion. |
| 31 Jul 2023 |
2136 |
Explosion. |
| 11 Aug 2023 |
0828 |
Explosion. |
| 18 Aug 2023 |
1304 |
Explosion. |
| 21 Aug 2023 |
1224 |
Explosion generated gas-and-steam plumes rose 500-600 m. |
| 22 Aug 2023 |
0749 |
Explosion generated gas-and-steam plumes rose 500-600 m. |
| 24 Aug 2023 |
1900 |
Explosion. |
| 25 Aug 2023 |
0828 |
Event produced a steam-and-gas plume that rose 3 km and drifted NW. |
| 27-28 Aug 2023 |
0813 |
Four small events; the event at 0813 on 28 August lasted two minutes and generated a steam-and-gas plume that rose 2.5 km. |
| 1 Sep 2023 |
1526 |
Explosion generated plume that rose 2 km and ejected material onto the flanks. |
| 2-3 Sep 2023 |
- |
Small explosions detected in infrasound data. |
| 4 Sep 2023 |
1251 |
Gas-and-steam plume rose 1 km and drifted W. |
| 7 Nov 2023 |
1113 |
Explosion. |
| 8 Nov 2023 |
0722 |
Explosion. |
| 12 Nov 2023 |
0136 |
Small gas emissions. |
| 14 Nov 2023 |
0415 |
Small gas emissions. |
According to OVSICORI-UNA, during July-October the average weekly sulfur dioxide (SO2) flux ranged from 68 to 240 tonnes/day. However, in mid-November the flux increased to as high as 334 tonnes/day, the highest value measured in recent years. The high SO2 flux in mid-November was also detected by the TROPOMI instrument on the Sentinel-5P satellite (figure 43).
Geologic Background. Rincón de la Vieja, the largest volcano in NW Costa Rica, is a remote volcanic complex in the Guanacaste Range. The volcano consists of an elongated, arcuate NW-SE-trending ridge constructed within the 15-km-wide early Pleistocene Guachipelín caldera, whose rim is exposed on the south side. Sometimes known as the "Colossus of Guanacaste," it has an estimated volume of 130 km3 and contains at least nine major eruptive centers. Activity has migrated to the SE, where the youngest-looking craters are located. The twin cone of Santa María volcano, the highest peak of the complex, is located at the eastern end of a smaller, 5-km-wide caldera and has a 500-m-wide crater. A Plinian eruption producing the 0.25 km3 Río Blanca tephra about 3,500 years ago was the last major magmatic eruption. All subsequent eruptions, including numerous historical eruptions possibly dating back to the 16th century, have been from the prominent active crater containing a 500-m-wide acid lake located ENE of Von Seebach crater.
Information Contacts: Observatorio Vulcanológico Sismológica de Costa Rica-Universidad Nacional (OVSICORI-UNA), Apartado 86-3000, Heredia, Costa Rica (URL: http://www.ovsicori.una.ac.cr/); NASA Global Sulfur Dioxide Monitoring Page, Atmospheric Chemistry and Dynamics Laboratory, NASA Goddard Space Flight Center (NASA/GSFC), 8800 Greenbelt Road, Goddard MD 20771, USA (URL: https://so2.gsfc.nasa.gov/).
Bezymianny (Russia) — November 2023 Cite this Report
Bezymianny
Russia
55.972°N, 160.595°E; summit elev. 2882 m
All times are local (unless otherwise noted)
Explosion on 18 October 2023 sends ash plume 8 km high; lava flows and incandescent avalanches
Bezymianny, located on Russia’s Kamchatka Peninsula, has had eruptions since 1955 characterized by dome growth, explosions, pyroclastic flows, ash plumes, and ashfall. Activity during November 2022-April 2023 included gas-and-steam emissions, lava dome collapses generating avalanches, and persistent thermal activity. Similar eruptive activity continued from May through October 2023, described here based on information from weekly and daily reports of the Kamchatka Volcano Eruptions Response Team (KVERT), notices from Tokyo VAAC (Volcanic Ash Advisory Center), and from satellite data.
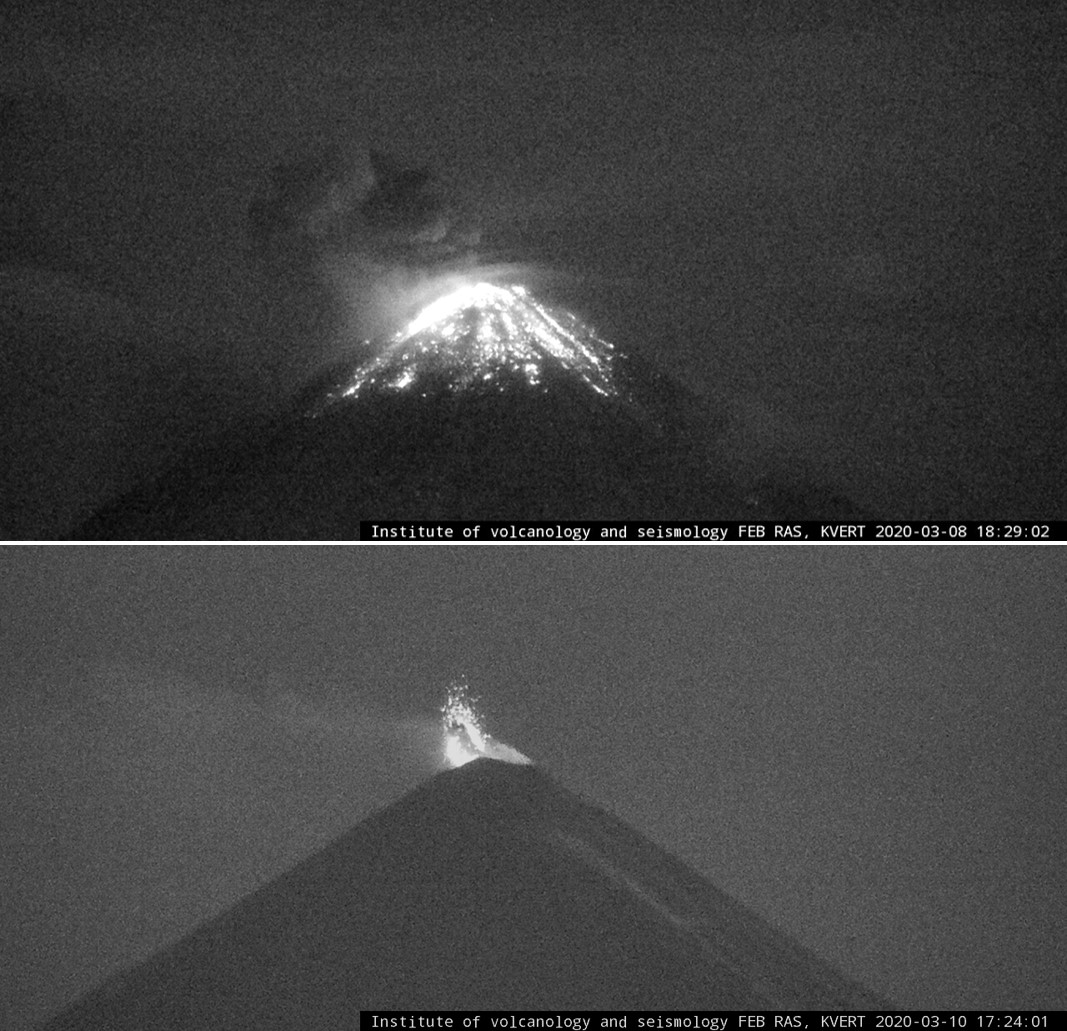
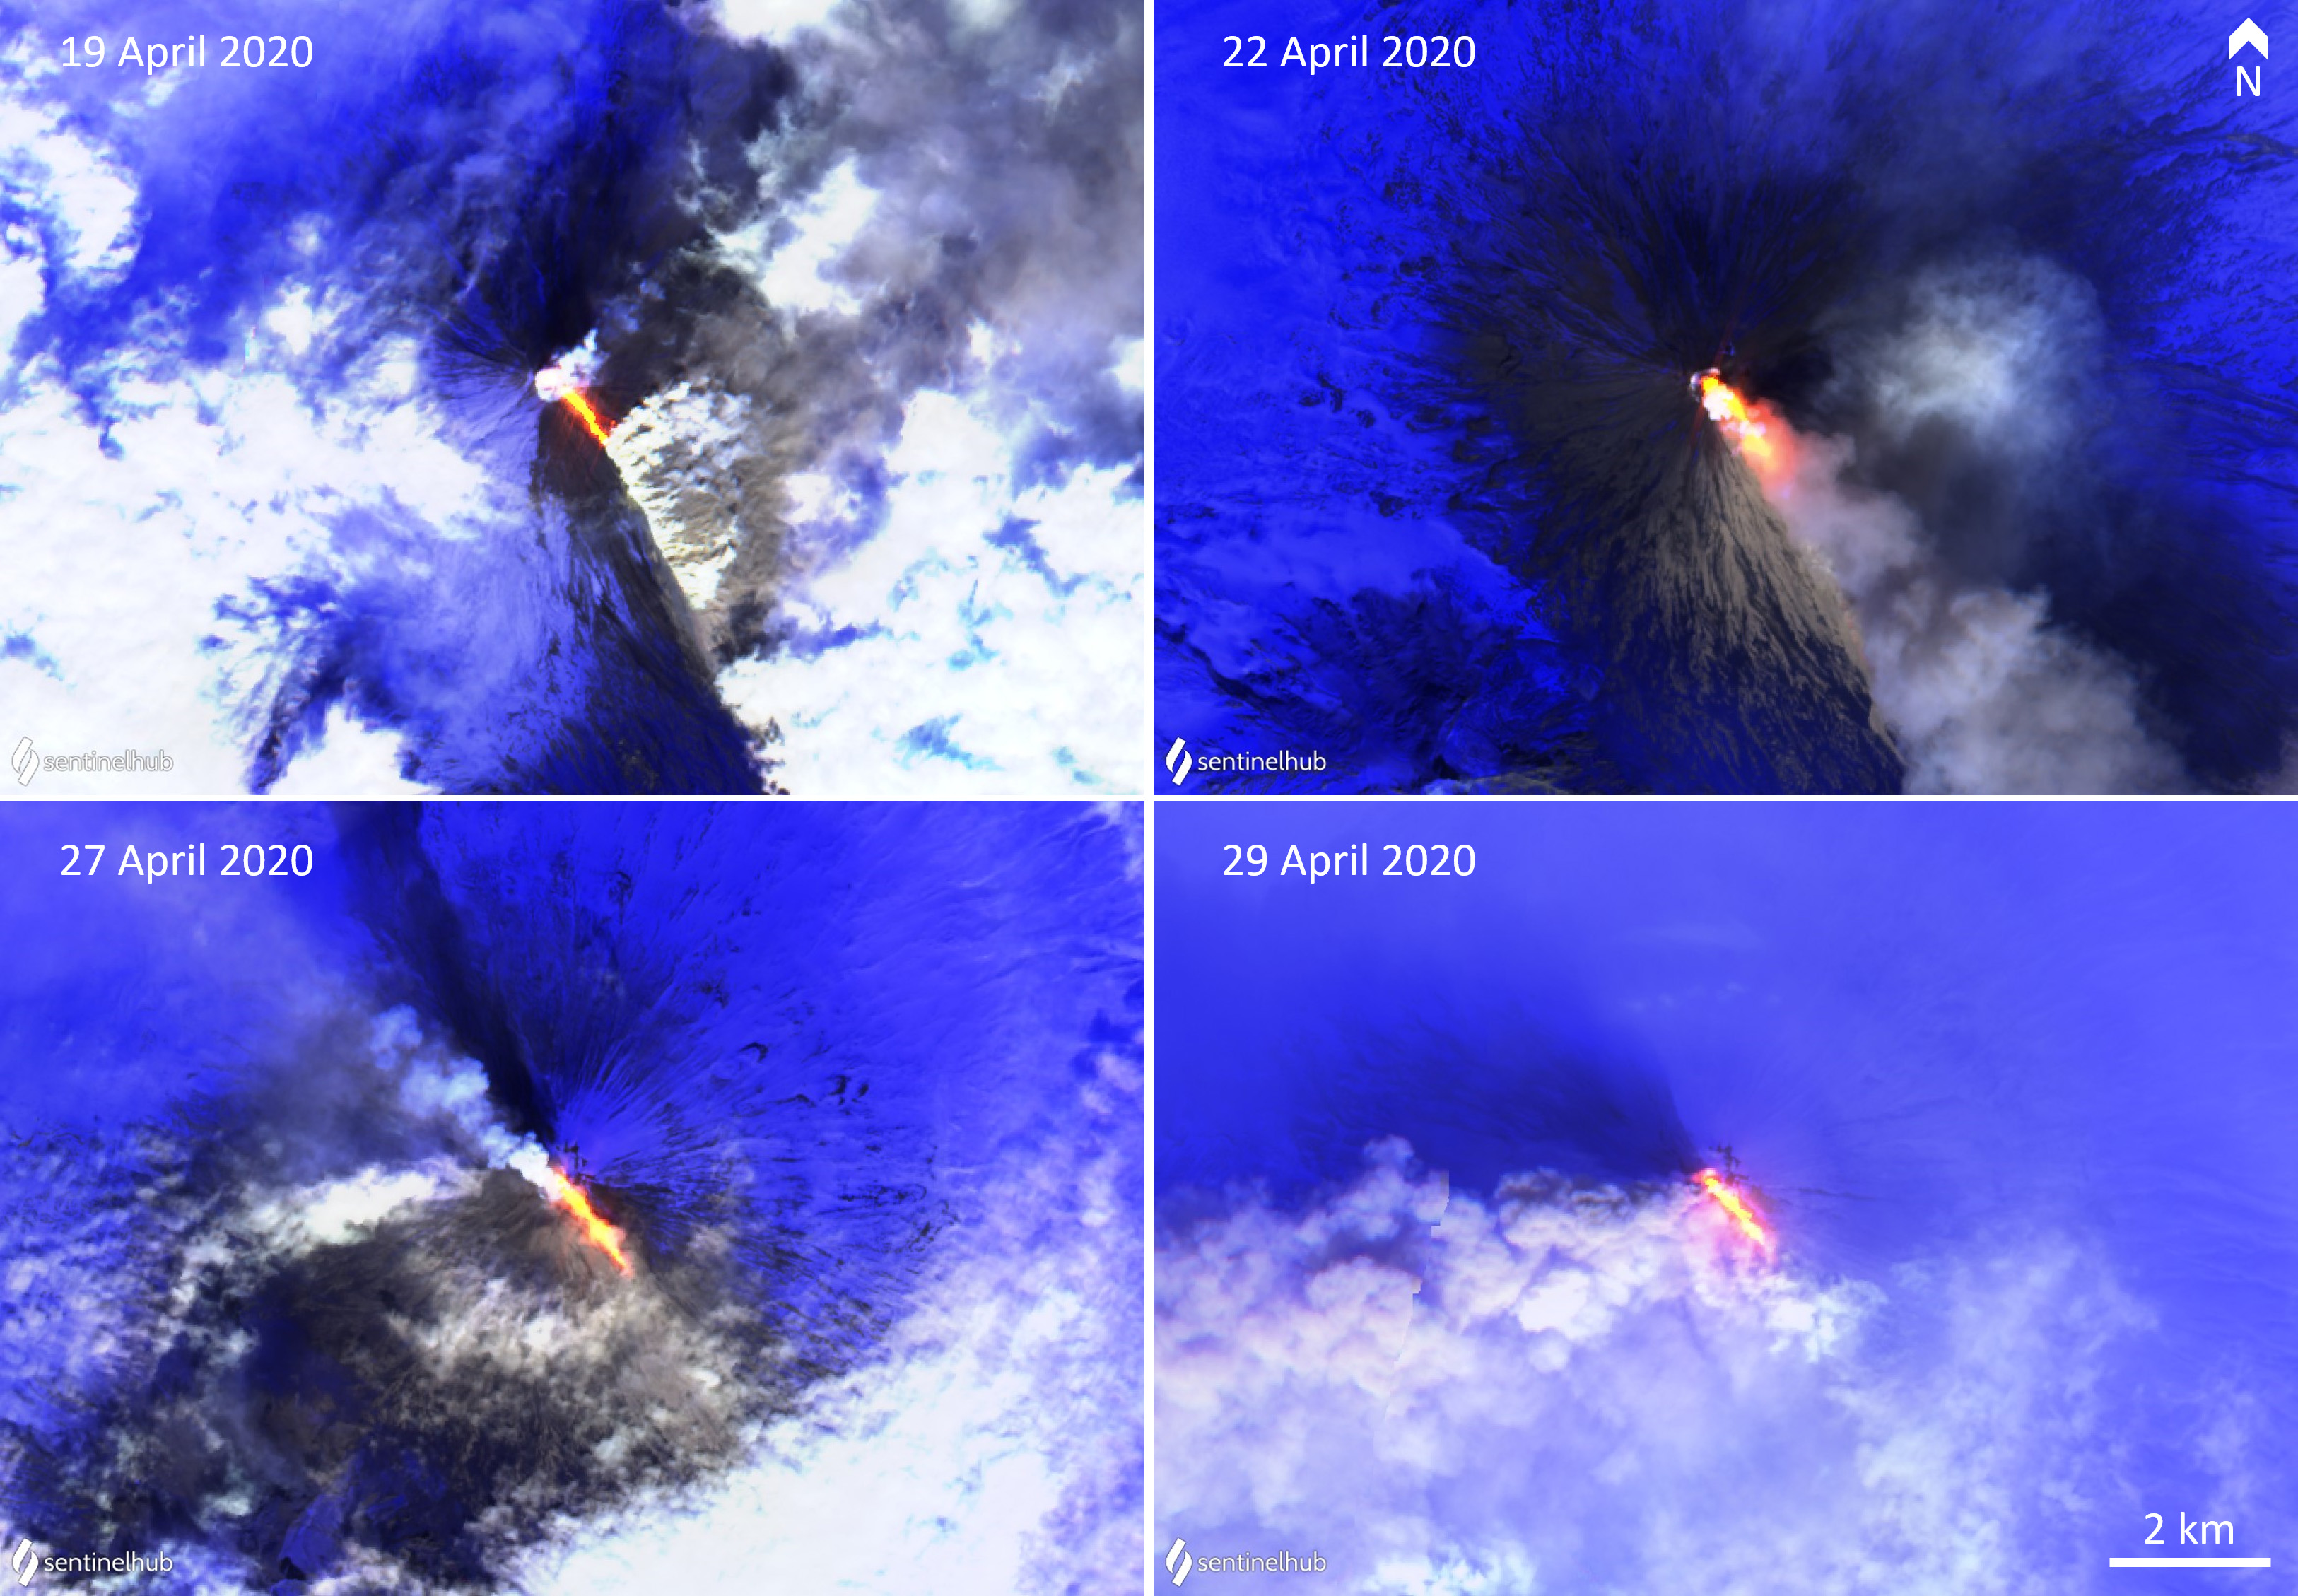
Overall activity decreased after the strong period of activity in late March through April 2023, which included ash explosions during 29 March and 7-8 April 2023 that sent plumes as high as 10-12 km altitude, along with dome growth and lava flows (BGVN 48:05). This reduced activity can be seen in the MIROVA thermal detection system graph (figure 56), which was consistent with data from the MODVOLC thermal detection system and with Sentinel-2 satellite images that showed persistent hotspots in the summit crater when conditions allowed observations. A renewed period of strong activity began in mid-October 2023.
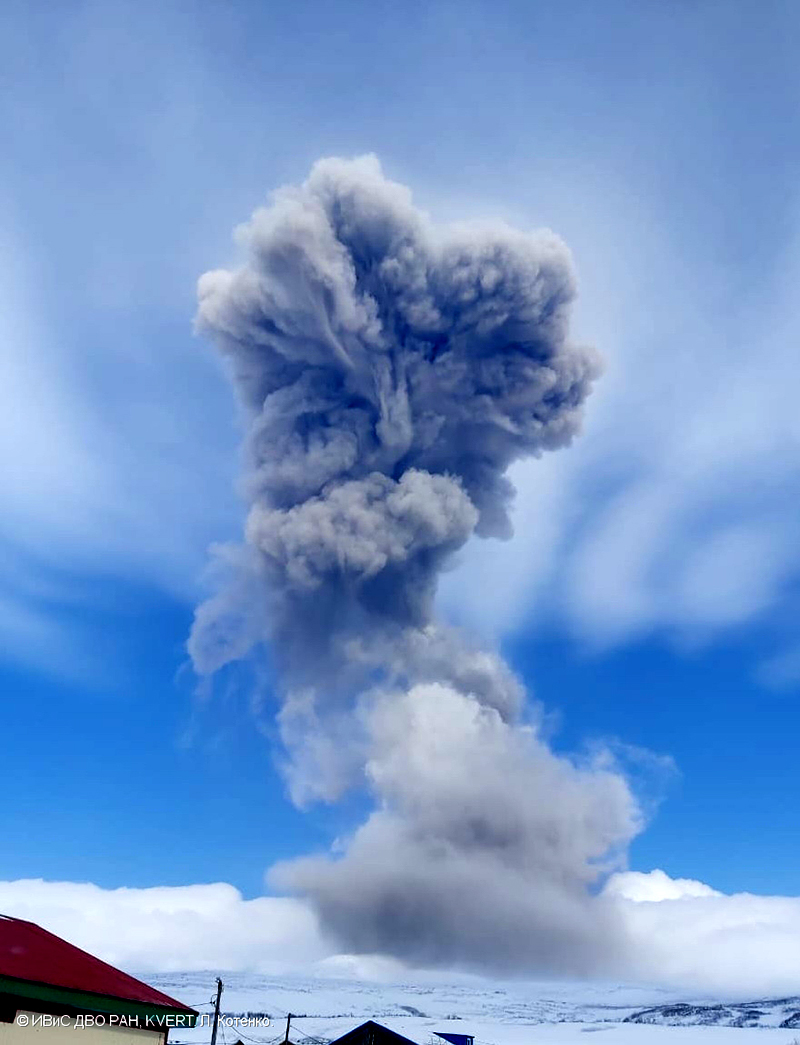
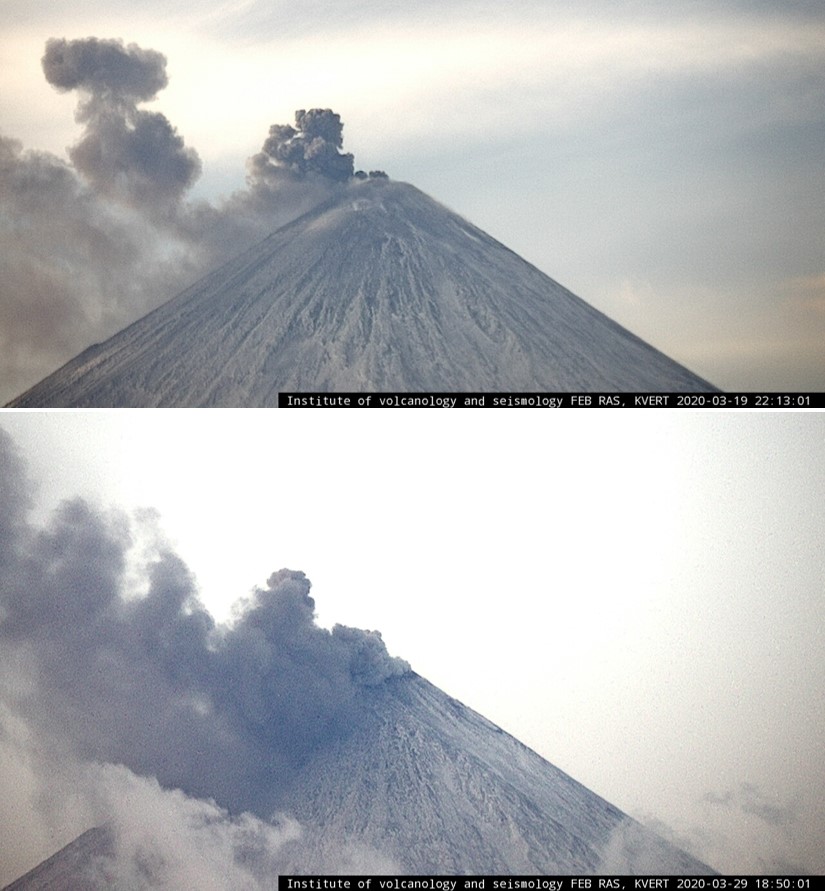
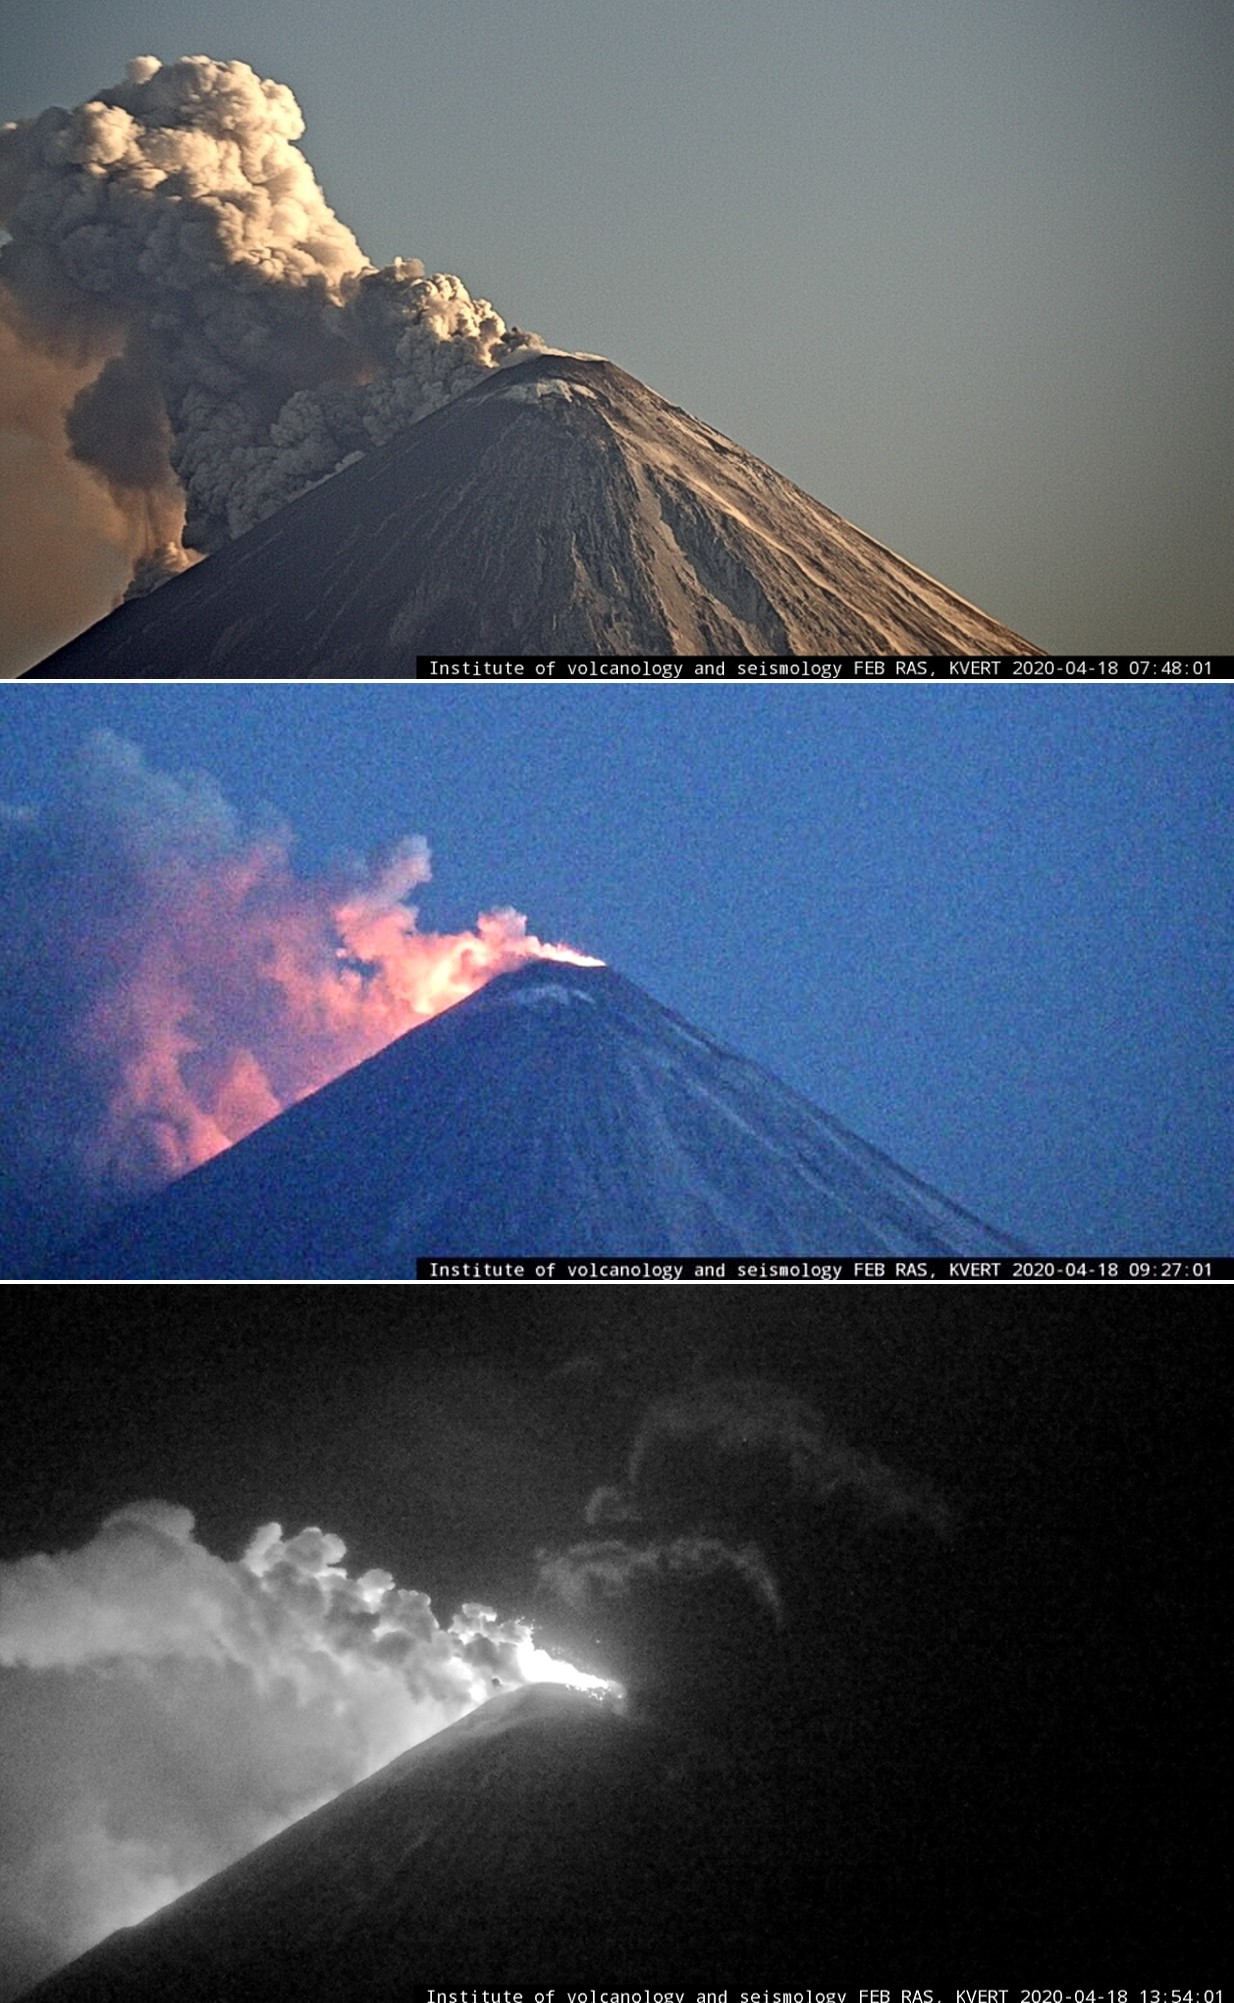
Activity increased significantly on 17 October 2023 when large collapses began during 0700-0830 on the E flanks of the lava dome and continued to after 0930 the next day (figure 57). Ash plumes rose to an altitude of 4.5-5 km, extending 220 km NNE by 18 October. A large explosion at 1630 on 18 October produced an ash plume that rose to an altitude of 11 km (8 km above the summit) and drifted NNE and then NW, extending 900 km NW within two days at an altitude of 8 km. Minor ashfall was noted in Kozyrevsk (45 km WNW). At 0820 on 20 October an ash plume was identified in satellite images drifting 100 km ENE at altitudes of 4-4.5 km.
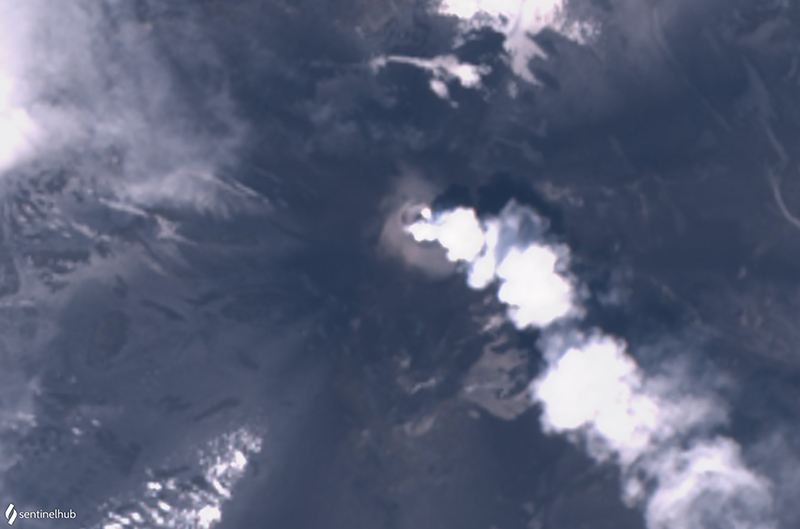
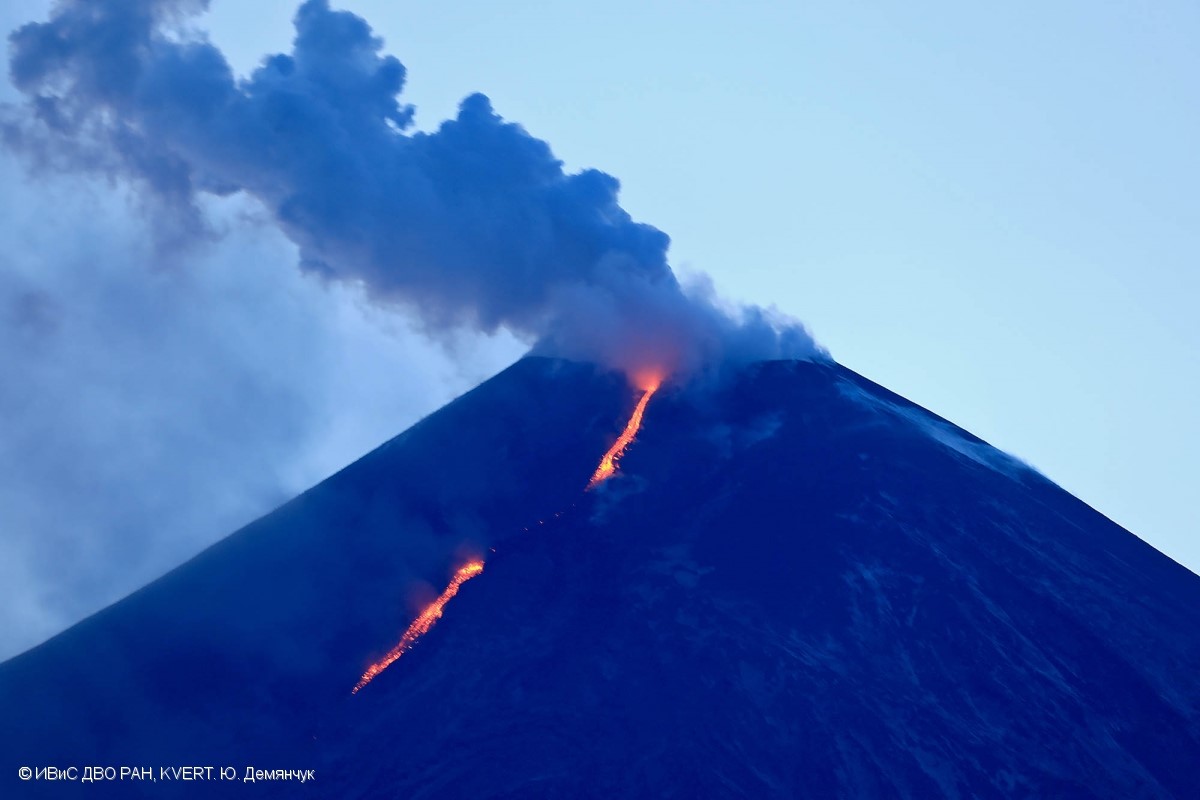
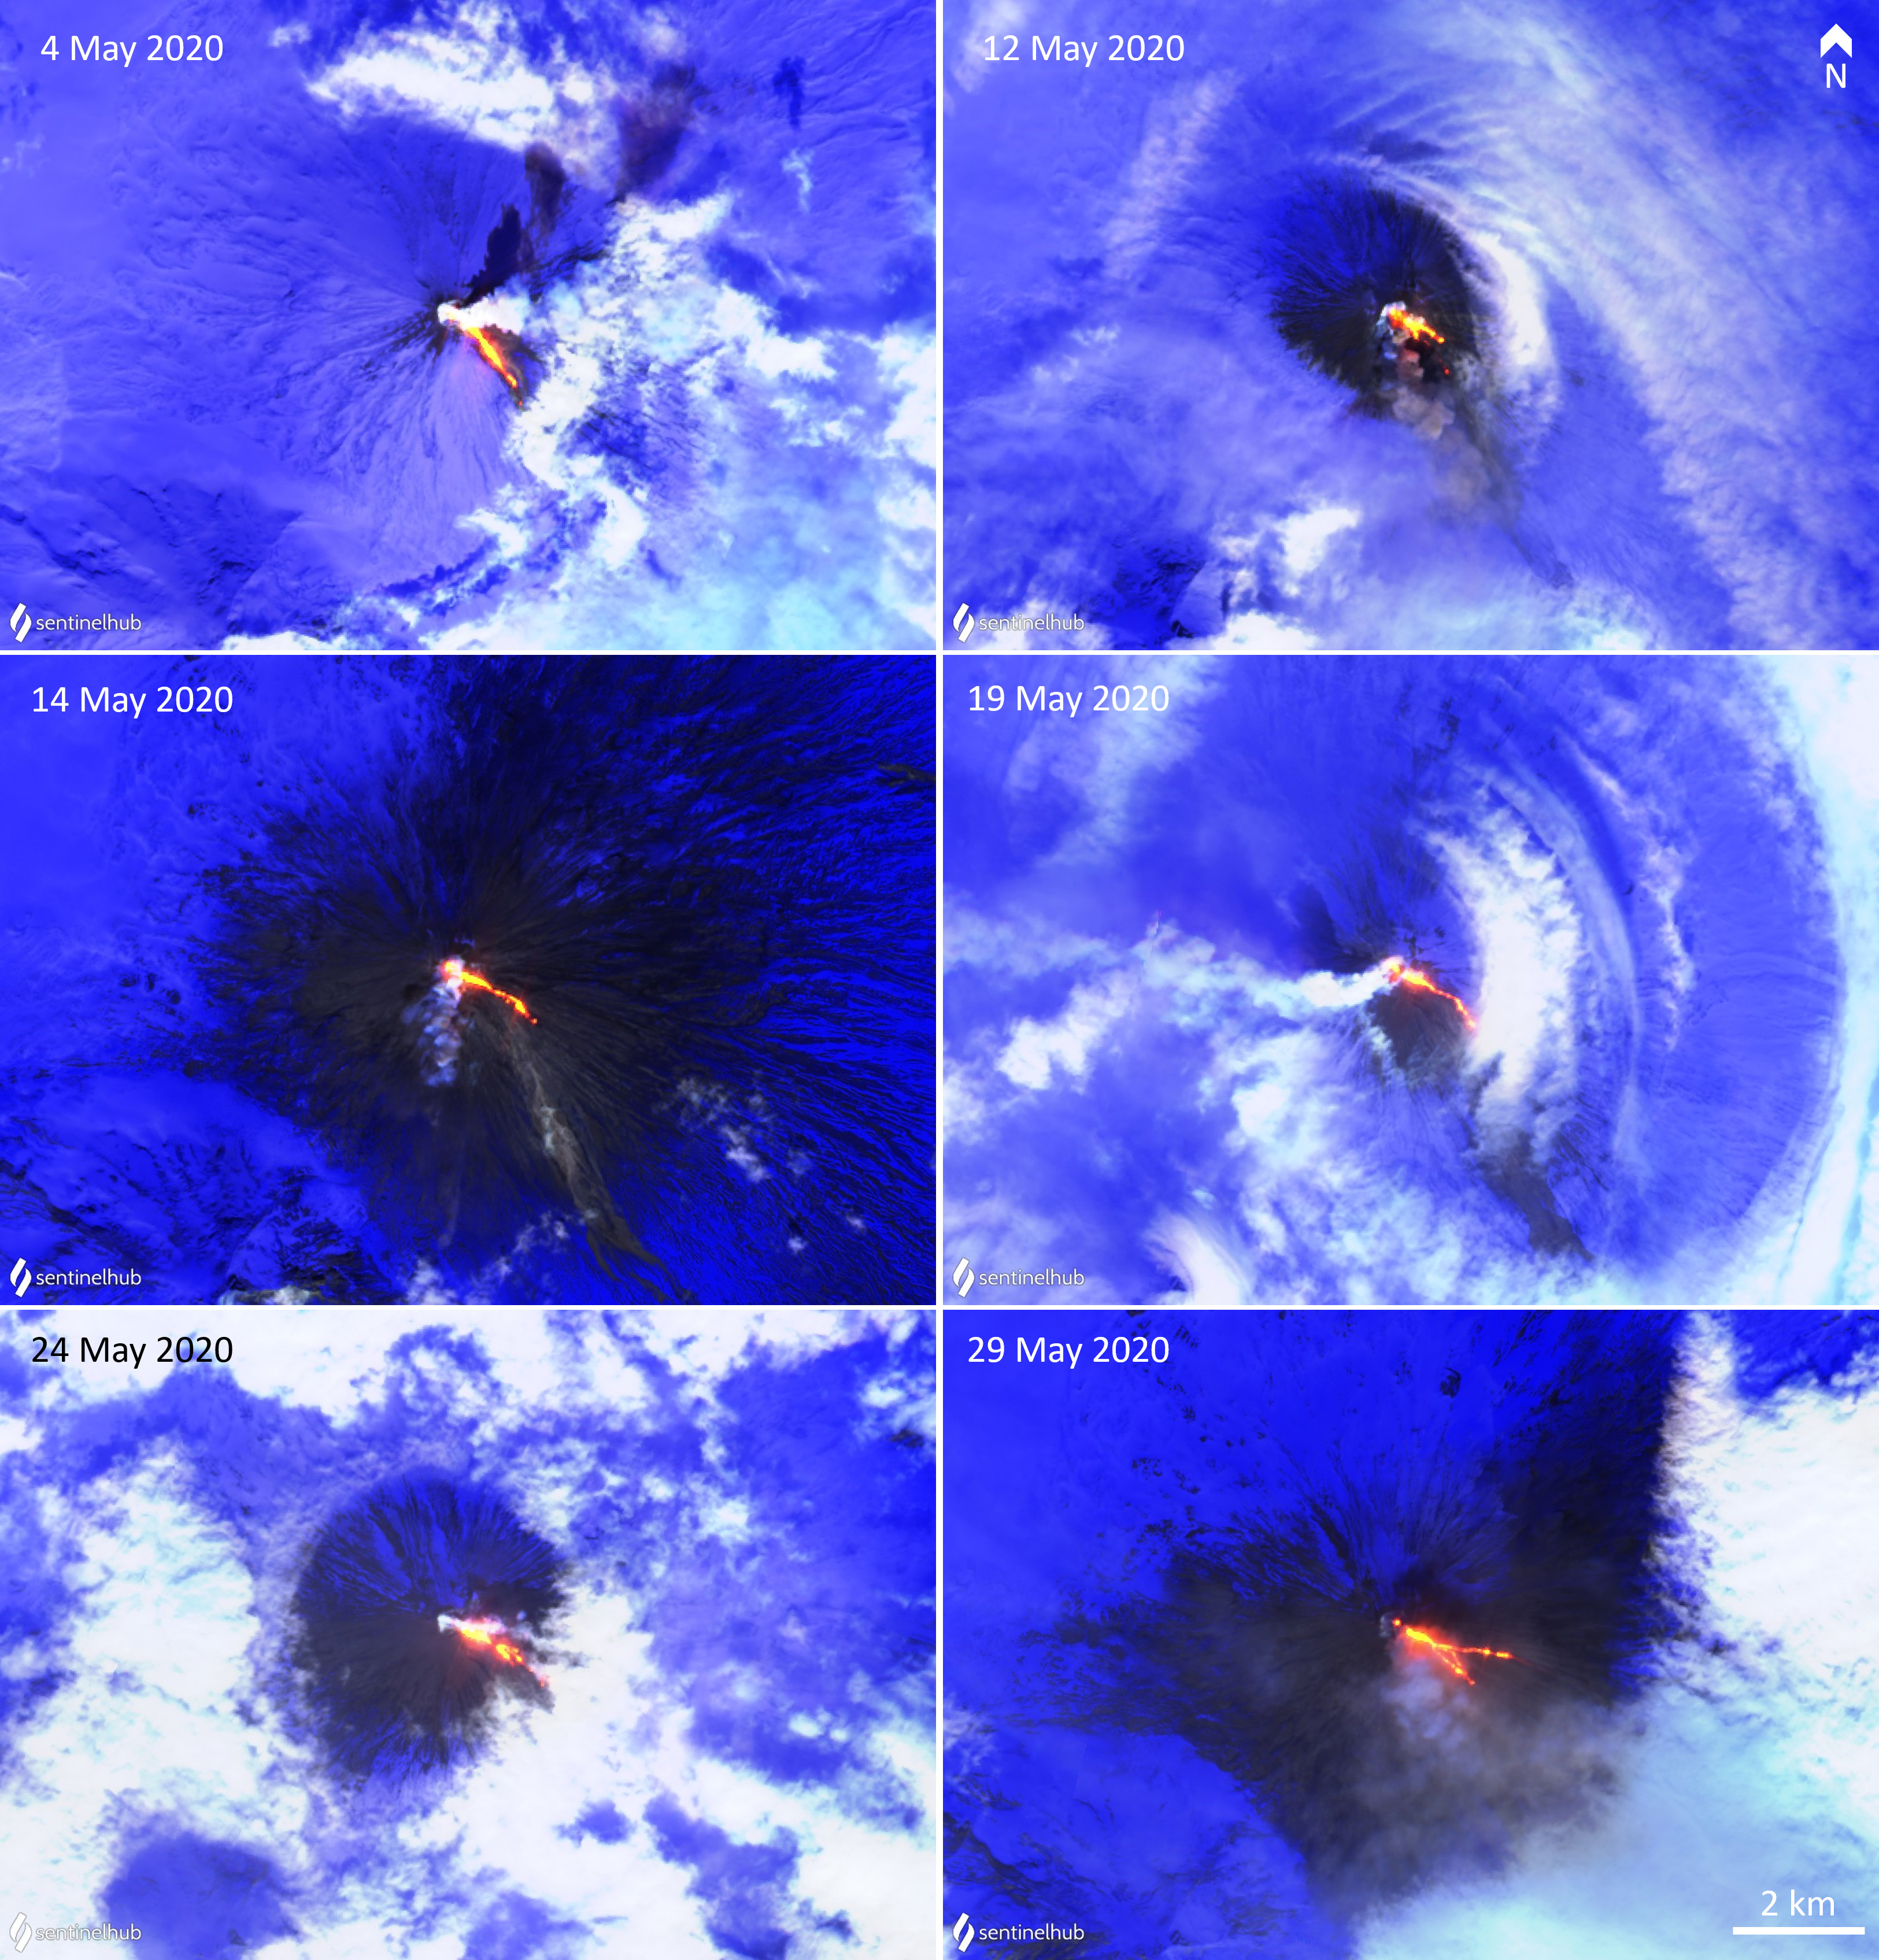
Lava flows and hot avalanches from the dome down the SE flank continued over the next few days, including 23 October when clear conditions allowed good observations (figures 58 and 59). A large thermal anomaly was observed over the volcano through 24 October, and in the summit crater on 30 October (figure 60). Strong fumarolic activity continued, with numerous avalanches and occasional incandescence. By the last week of October, volcanic activity had decreased to a level consistent with that earlier in the reporting period.
Aviation warnings were frequently updated during 17-20 October. KVERT issued a Volcano Observatory Notice for Aviation (VONA) on 17 October at 1419 and 1727 (0219 and 0527 UTC) raising the Aviation Color Code (ACC) from Yellow to Orange (second highest level). The next day, KVERT issued a VONA at 1705 (0505 UTC) raising the ACC to Red (highest level) but lowered it back to Orange at 2117 (0917 UTC). After another decrease to Yellow and back to Orange, the ACC was reduced to Yellow on 20 October at 1204 (0004 UTC). In addition, the Tokyo VAAC issued a series of Volcanic Ash Advisories beginning on 16 October and continuing through 30 October.
Geologic Background. The modern Bezymianny, much smaller than its massive neighbors Kamen and Kliuchevskoi on the Kamchatka Peninsula, was formed about 4,700 years ago over a late-Pleistocene lava-dome complex and an edifice built about 11,000-7,000 years ago. Three periods of intensified activity have occurred during the past 3,000 years. The latest period, which was preceded by a 1,000-year quiescence, began with the dramatic 1955-56 eruption. This eruption, similar to that of St. Helens in 1980, produced a large open crater that was formed by collapse of the summit and an associated lateral blast. Subsequent episodic but ongoing lava-dome growth, accompanied by intermittent explosive activity and pyroclastic flows, has largely filled the 1956 crater.
Information Contacts: Kamchatka Volcanic Eruptions Response Team (KVERT), Far Eastern Branch, Russian Academy of Sciences, 9 Piip Blvd., Petropavlovsk-Kamchatsky, 683006, Russia (URL: http://www.kscnet.ru/ivs/kvert/); Kamchatka Volcanological Station, Kamchatka Branch of Geophysical Survey, (KB GS RAS), Klyuchi, Kamchatka Krai, Russia (URL: http://volkstat.ru/); Tokyo Volcanic Ash Advisory Center (VAAC), 1-3-4 Otemachi, Chiyoda-ku, Tokyo 100-8122, Japan (URL: http://ds.data.jma.go.jp/svd/vaac/data/); Hawai'i Institute of Geophysics and Planetology (HIGP) - MODVOLC Thermal Alerts System, School of Ocean and Earth Science and Technology (SOEST), Univ. of Hawai'i, 2525 Correa Road, Honolulu, HI 96822, USA (URL: http://modis.higp.hawaii.edu/); MIROVA (Middle InfraRed Observation of Volcanic Activity), a collaborative project between the Universities of Turin and Florence (Italy) supported by the Centre for Volcanic Risk of the Italian Civil Protection Department (URL: http://www.mirovaweb.it/); Copernicus Browser, Copernicus Data Space Ecosystem, European Space Agency (URL: https://dataspace.copernicus.eu/browser/).chr
Kilauea (United States) — January 2023 Cite this Report
Kilauea
United States
19.421°N, 155.287°W; summit elev. 1222 m
All times are local (unless otherwise noted)
Low-level lava effusions in the lava lake at Halema’uma’u during July-December 2022
Kīlauea is the southeastern-most volcano in Hawaii and overlaps the E flank of the Mauna Loa volcano. Its East Rift Zone (ERZ) has been intermittently active for at least 2,000 years. An extended eruption period began in January 1983 and was characterized by open lava lakes and lava flows from the summit caldera and the East Rift Zone. During May 2018 magma migrated into the Lower East Rift Zone (LERZ) and opened 24 fissures along a 6-km-long NE-trending fracture zone that produced lava flows traveling in multiple directions. As lava emerged from the fissures, the lava lake at Halema'uma'u drained and explosions sent ash plumes to several kilometers altitude (BGVN 43:10).
The current eruption period started during September 2021 and has recently been characterized by lava effusions, spatter, and sulfur dioxide emissions in the active Halema’uma’u lava lake (BGVN 47:08). Lava effusions, some spatter, and sulfur dioxide emissions have continued during this reporting period of July through December 2022 using daily reports, volcanic activity notices, and abundant photo, map, and video data from the US Geological Survey's (USGS) Hawaiian Volcano Observatory (HVO).
Summary of activity during July-December 2022. Low-level effusions have continued at the western vent of the Halema’uma’u crater during July through early December 2022. Occasional weak ooze-outs (also called lava break outs) would occur along the margins of the crater floor. The overall level of the active lava lake throughout the reporting period gradually increased due to infilling, however it stagnated in mid-September (table 13). During September through November, activity began to decline, though lava effusions persisted at the western vent. By 9 December, the active part of the lava lake had completely crusted over, and incandescence was no longer visible.
Table 13. Summary of measurements taken during overflights at Kīlauea that show a gradual increase in the active lava lake level and the volume of lava effused since 29 September 2021. Lower activity was reported during September-October. Data collected during July-December 2022. Courtesy of HVO.
| Date: |
Level of the active lava lake (m): |
Cumulative volume of lava effused (million cubic meters): |
| 7 Jul 2022 |
130 |
95 |
| 19 Jul 2022 |
133 |
98 |
| 4 Aug 2022 |
136 |
102 |
| 16 Aug 2022 |
137 |
104 |
| 12 Sep 2022 |
143 |
111 |
| 5 Oct 2022 |
143 |
111 |
| 28 Oct 2022 |
143 |
111 |
Activity during July 2022. Lava effusions were reported from the western vent in the Halema’uma’u crater, along with occasional weak ooze-outs along the margins of the crater floor. The height of the lava lake was variable due to deflation-inflation tilt events; for example, the lake level dropped approximately 3-4 m during a summit deflation-inflation event reported on 1 July. Webcam images taken during the night of 6-12 July showed intermittent low-level spattering at the western vent that rose less than 10 m above the vent (figure 519). Measurements made during an overflight on 7 July indicated that the crater floor was infilled about 130 m and that 95 million cubic meters of lava had been effused since 29 September 2021. A single, relatively small lava ooze-out was active to the S of the lava lake. Around midnight on 8 July there were two brief periods of lava overflow onto the lake margins. On 9 July lava ooze-outs were reported near the SE and NE edges of the crater floor and during 10-11 July they occurred near the E, NE, and NW edges. On 16 July crater incandescence was reported, though the ooze-outs and spattering were not visible. On 18 July overnight webcam images showed incandescence in the western vent complex and two ooze-outs were reported around 0000 and 0200 on 19 July. By 0900 there were active ooze-outs along the SW edge of the crater floor. Measurements made from an overflight on 19 July indicated that the crater floor was infilled about 133 m and 98 million cubic meters of lava had erupted since 29 September 2021 (figure 520). On 20 July around 1600 active ooze-outs were visible along the N edge of the crater, which continued through the next day. Extensive ooze-outs occurred along the W margin during 24 July until 1900; on 26 July minor ooze-outs were noted along the N margin. Minor spattering was visible on 29 July along the E margin of the lake. The sulfur dioxide emission rates ranged 650-2,800 tons per day (t/d), the higher of which was measured on 8 July (figure 519).
Activity during August 2022. The eruption continued in the Halema’uma’u crater at the western vent. According to HVO the lava in the active lake remained at the level of the bounding levees. Occasional minor ooze-outs were observed along the margins of the crater floor. Strong nighttime crater incandescence was visible after midnight on 6 August over the western vent cone. During 6-7 August scattered small lava lobes were active along the crater floor and incandescence persisted above the western vent through 9 August. During 7-9 August HVO reported a single lava effusion source was active along the NW margin of the crater floor. Measurements from an overflight on 4 August indicated that the crater floor was infilled about 136 m total and that 102 million cubic meters of lava had been erupted since the start of the eruption. Lava breakouts were reported along the N, NE, E, S, and W margins of the crater during 10-16 August. Another overflight survey conducted on 16 August indicated that the crater floor infilled about 137 m and 104 million cubic meters of lava had been erupted since September 2021. Measured sulfur dioxide emissions rates ranged 1,150-2,450 t/d, the higher of which occurred on 8 August.
Activity during September 2022. During September, lava effusion continued from the western vent into the active lava lake and onto the crater floor. Intermittent minor ooze-outs were reported through the month. A small ooze-out was visible on the W crater floor margin at 0220 on 2 September, which showed decreasing surface activity throughout the day, but remained active through 3 September. On 3 September around 1900 a lava outbreak occurred along the NW margin of the crater floor but had stopped by the evening of 4 September. Field crews monitoring the summit lava lake on 9 September observed spattering on the NE margin of the lake that rose no higher than 10 m, before falling back onto the lava lake crust (figure 521). Overflight measurements on 12 September indicated that the crater floor was infilled a total of 143 m and 111 million cubic meters of lava had been erupted since September 2021. Extensive breakouts in the W and N part of the crater floor were reported at 1600 on 20 September and continued into 26 September. The active part of the lava lake dropped by 10 m while other parts of the crater floor dropped by several meters. Summit tiltmeters recorded a summit seismic swarm of more than 80 earthquakes during 1500-1800 on 21 September, which occurred about 1.5 km below Halema’uma’u; a majority of these were less than Mw 2. By 22 September the active part of the lava lake was infilled about 2 m. On 23 September the western vent areas exhibited several small spatter cones with incandescent openings, along with weak, sporadic spattering (figure 522). The sulfur dioxide emission rate ranged from 930 t/d to 2,000 t/d, the higher of which was measured on 6 September.
Activity during October 2022. Activity during October declined slightly compared to previous months, though lava effusions persisted from the western vent into the active lava lake and onto the crater floor during October (figure 523). Slight variations in the lava lake were noted throughout the month. HVO reported that around 0600 on 3 October the level of the lava lake has lowered slightly. Overflight measurements taken on 5 October indicated that the crater floor was infilled a total of about 143 m and that 111 million cubic meters of lava had been effused since September 2021. During 6-7 October the lake gradually rose 0.5 m. Sulfur dioxide measurements made on 22 October had an emission rate of 700 t/d. Another overflight taken on 28 October showed that there was little to no change in the elevation of the crater floor: the crater floor was infilled a total of 143 m and 111 million cubic meters of lava had erupted since the start of the eruption.
Activity during November 2022. Activity remained low during November, though HVO reported that lava from the western vent continued to effuse into the active lava lake and onto the crater floor throughout the month. The rate of sulfur dioxide emissions during November ranged from 300-600 t/d, the higher amount of which occurred on 9 November.
Activity during December 2022. Similar low activity was reported during December, with lava effusing from the western vent into the active lava lake and onto the crater floor. During 4-5 December the active part of the lava lake was slightly variable in elevation and fluctuated within 1 m. On 9 December HVO reported that lava was no longer erupting from the western vent in the Halema’uma’u crater and that sulfur dioxide emissions had returned to near pre-eruption background levels; during 10-11 December, the lava lake had completely crusted over, and no incandescence was visible (figure 524). Time lapse camera images covering the 4-10 December showed that the crater floor showed weak deflation and no inflation. Some passive events of crustal overturning were reported during 14-15 December, which brought fresh incandescent lava to the lake surface. The sulfur dioxide emission rate was approximately 200 t/d on 14 December. A smaller overturn event on 17 December and another that occurred around 0000 and into the morning of 20 December were also detected. A small seismic swarm was later detected on 30 December.
Geologic Background. Kilauea overlaps the E flank of the massive Mauna Loa shield volcano in the island of Hawaii. Eruptions are prominent in Polynesian legends; written documentation since 1820 records frequent summit and flank lava flow eruptions interspersed with periods of long-term lava lake activity at Halemaumau crater in the summit caldera until 1924. The 3 x 5 km caldera was formed in several stages about 1,500 years ago and during the 18th century; eruptions have also originated from the lengthy East and Southwest rift zones, which extend to the ocean in both directions. About 90% of the surface of the basaltic shield volcano is formed of lava flows less than about 1,100 years old; 70% of the surface is younger than 600 years. The long-term eruption from the East rift zone between 1983 and 2018 produced lava flows covering more than 100 km2, destroyed hundreds of houses, and added new coastline.
Information Contacts: Hawaiian Volcano Observatory (HVO), U.S. Geological Survey, PO Box 51, Hawai'i National Park, HI 96718, USA (URL: http://hvo.wr.usgs.gov/).
Nyamulagira (DR Congo) — November 2023 Cite this Report
Nyamulagira
DR Congo
1.408°S, 29.2°E; summit elev. 3058 m
All times are local (unless otherwise noted)
Lava flows and thermal activity during May-October 2023
Nyamulagira (also known as Nyamuragira) is a shield volcano in the Democratic Republic of Congo with the summit truncated by a small 2 x 2.3 km caldera with walls up to about 100 m high. Documented eruptions have occurred within the summit caldera, as well as from numerous flank fissures and cinder cones. The current eruption period began in April 2018 and has more recently been characterized by summit crater lava flows and thermal activity (BGVN 48:05). This report describes lava flows and variable thermal activity during May through October 2023, based on information from the Observatoire Volcanologique de Goma (OVG) and various satellite data.
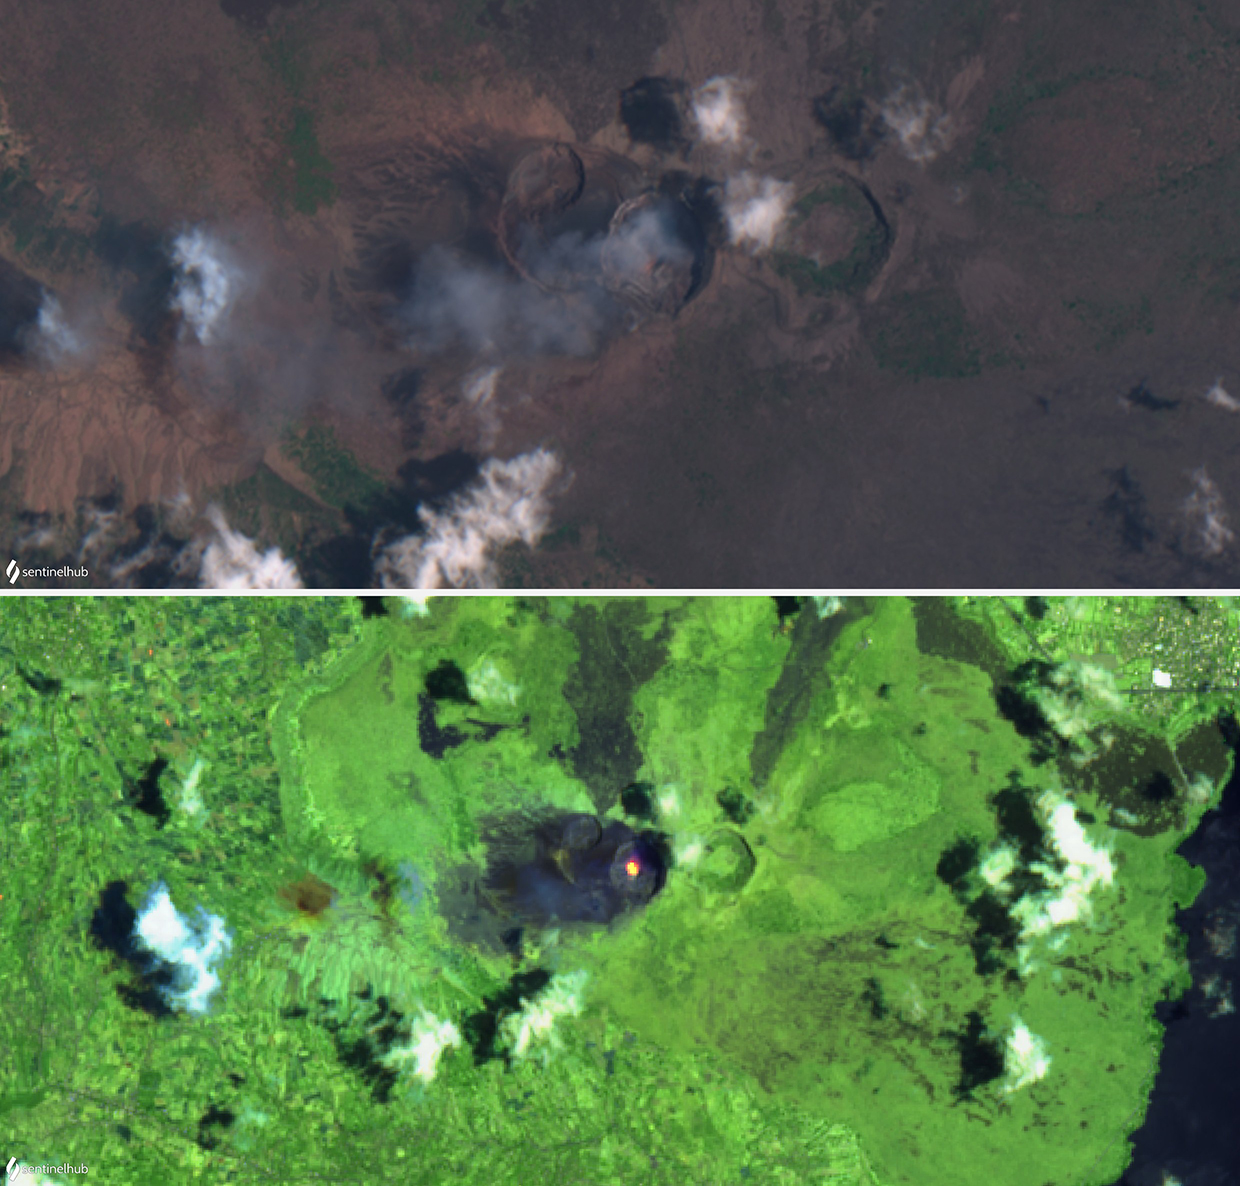
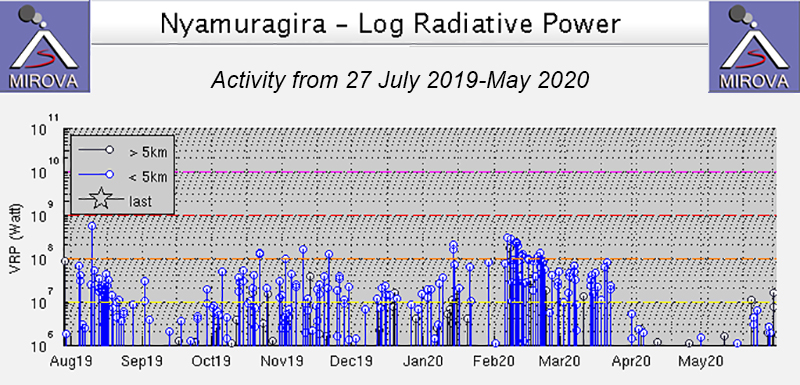
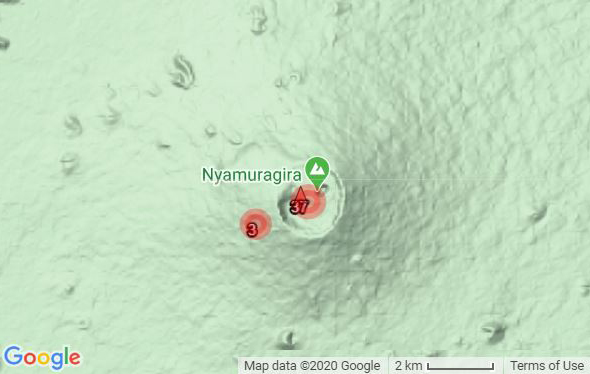
Lava lake activity continued during May. The MIROVA (Middle InfraRed Observation of Volcanic Activity) system recorded moderate-to-strong thermal activity throughout the reporting period; activity was more intense during May and October and relatively weaker from June through September (figure 95). The MODVOLC thermal algorithm, detected a total of 209 thermal alerts. There were 143 hotspots detected during May, eight during June, nine during September, and 49 during October. This activity was also reflected in infrared satellite images, where a lava flow was visible in the NW part of the crater on 7 May and strong activity was seen in the center of the crater on 4 October (figure 96). Another infrared satellite image taken on 12 May showed still active lava flows along the NW margin of the crater. According to OVG lava effusions were active during 7-29 May and moved to the N and NW parts of the crater beginning on 9 May. Strong summit crater incandescence was visible from Goma (27 km S) during the nights of 17, 19, and 20 May (figure 97). On 17 May there was an increase in eruptive activity, which peaked at 0100 on 20 May. Notable sulfur dioxide plumes drifted NW and W during 19-20 May (figure 98). Drone footage acquired in partnership with the USGS (United States Geological Survey) on 20 May captured images of narrow lava flows that traveled about 100 m down the W flank (figure 99). Data from the Rumangabo seismic station indicated a decreasing trend in activity during 17-21 May. Although weather clouds prevented clear views of the summit, a strong thermal signature on the NW flank was visible in an infrared satellite image on 22 May, based on an infrared satellite image. On 28 May the lava flows on the upper W flank began to cool and solidify. By 29 May seismicity returned to levels similar to those recorded before the 17 May increase. Lava effusion continued but was confined to the summit crater; periodic crater incandescence was observed.
Low-level activity was noted during June through October. On 1 June OVG reported that seismicity remained at lower levels and that crater incandescence had been absent for three days, though infrared satellite imagery showed continued lava effusion in the summit crater. The lava flows on the flanks covered an estimated 0.6 km2. Satellite imagery continued to show thermal activity confined to the lava lake through October (figure 96), although no lava flows or significant sulfur dioxide emissions were reported.
Geologic Background. Africa's most active volcano, Nyamulagira (also known as Nyamuragira), is a massive high-potassium basaltic shield about 25 km N of Lake Kivu and 13 km NNW of the steep-sided Nyiragongo volcano. The summit is truncated by a small 2 x 2.3 km caldera that has walls up to about 100 m high. Documented eruptions have occurred within the summit caldera, as well as from the numerous flank fissures and cinder cones. A lava lake in the summit crater, active since at least 1921, drained in 1938, at the time of a major flank eruption. Recent lava flows extend down the flanks more than 30 km from the summit as far as Lake Kivu; extensive lava flows from this volcano have covered 1,500 km2 of the western branch of the East African Rift.
Information Contacts: Observatoire Volcanologique de Goma (OVG), Departement de Geophysique, Centre de Recherche en Sciences Naturelles, Lwiro, D.S. Bukavu, DR Congo; Hawai'i Institute of Geophysics and Planetology (HIGP) - MODVOLC Thermal Alerts System, School of Ocean and Earth Science and Technology (SOEST), Univ. of Hawai'i, 2525 Correa Road, Honolulu, HI 96822, USA (URL: http://modis.higp.hawaii.edu/); MIROVA (Middle InfraRed Observation of Volcanic Activity), a collaborative project between the Universities of Turin and Florence (Italy) supported by the Centre for Volcanic Risk of the Italian Civil Protection Department (URL: http://www.mirovaweb.it/); NASA Global Sulfur Dioxide Monitoring Page, Atmospheric Chemistry and Dynamics Laboratory, NASA Goddard Space Flight Center (NASA/GSFC), 8800 Greenbelt Road, Goddard, Maryland, USA (URL: https://so2.gsfc.nasa.gov/); Copernicus Browser, Copernicus Data Space Ecosystem, European Space Agency (URL: https://dataspace.copernicus.eu/browser/); Charles Balagizi, Goma Volcano Observatory, Departement de Geophysique, Centre de Recherche en Sciences Naturelles, Lwiro, D.S. Bukavu, DR Congo.
Bagana (Papua New Guinea) — October 2023 Cite this Report
Bagana
Papua New Guinea
6.137°S, 155.196°E; summit elev. 1855 m
All times are local (unless otherwise noted)
Explosions, ash plumes, ashfall, and lava flows during April-September 2023
The remote volcano of Bagana is located in central Bougainville Island, Papua New Guinea. Recorded eruptions date back to 1842 and activity has consisted of effusive activity that has built a small lava dome in the summit crater and occasional explosions that produced pyroclastic flows. The most recent eruption has been ongoing since February 2000 and has produced occasional explosions, ash plumes, and lava flows. More recently, activity has been characterized by ongoing effusive activity and ash emissions (BGVN 48:04). This report updates activity from April through September 2023 that has consisted of explosions, ash plumes, ashfall, and lava flows, using information from the Darwin Volcanic Ash Advisory Center (VAAC) and satellite data.
An explosive eruption was reported on 7 July that generated a large gas-and-ash plume to high altitudes and caused significant ashfall in local communities; the eruption plume had reached upper tropospheric (16-18 km altitude) altitudes by 2200, according to satellite images. Sulfur dioxide plumes were detected in satellite images on 8 July and indicated that the plume was likely a mixture of gas, ice, and ash. A report issued by the Autonomous Bougainville Government (ABG) (Torokina District, Education Section) on 10 July noted that significant ash began falling during 2000-2100 on 7 July and covered most areas in the Vuakovi, Gotana (9 km SW), Koromaketo, Laruma (25 km W) and Atsilima (27 km NW) villages. Pyroclastic flows also occurred, according to ground-based reports; small deposits confined to one drainage were inspected by RVO during an overflight on 17 July and were confirmed to be from the 7 July event. Ashfall continued until 10 July and covered vegetation, which destroyed bushes and gardens and contaminated rivers and streams.
RVO reported another eruption on 14 July. The Darwin VAAC stated that an explosive event started around 0830 on 15 July and produced an ash plume that rose to 16.5 km altitude by 1000 and drifted N, according to satellite images. The plume continued to drift N and remained visible through 1900, and by 2150 it had dissipated.
Ashfall likely from both the 7 and 15 July events impacted about 8,111 people in Torokina (20 km SW), including Tsito/Vuakovi, Gotana, Koromaketo, Kenaia, Longkogari, Kenbaki, Piva (13 km SW), and Atsinima, and in the Tsitovi district, according to ABG. Significant ashfall was also reported in Ruruvu (22 km N) in the Wakunai District of Central Bougainville, though the thickness of these deposits could not be confirmed. An evacuation was called for the villages in Wakunai, where heavy ashfall had contaminated water sources; the communities of Ruruvu, Togarau, Kakarapaia, Karauturi, Atao, and Kuritaturi were asked to evacuate to a disaster center at the Wakunai District Station, and communities in Torokina were asked to evacuate to the Piva District station. According to a news article, more than 7,000 people needed temporary accommodations, with about 1,000 people in evacuation shelters. Ashfall had deposited over a broad area, contaminating water supplies, affecting crops, and collapsing some roofs and houses in rural areas. Schools were temporarily shut down. Intermittent ash emissions continued through the end of July and drifted NNW, NW, and SW. Fine ashfall was reported on the coast of Torokina, and ash plumes also drifted toward Laruma and Atsilima.
A small explosive eruption occurred at 2130 on 28 July that ejected material from the crater vents, according to reports from Torokina, in addition to a lava flow that contained two lobes. A second explosion was detected at 2157. Incandescence from the lava flow was visible from Piva as it descended the W flank around 2000 on 29 July (figure 47). The Darwin VAAC reported that a strong thermal anomaly was visible in satellite images during 30-31 July and that ash emissions rose to 2.4 km altitude and drifted WSW on 30 July. A ground report from RVO described localized emissions at 0900 on 31 July.
The Darwin VAAC reported that ash plumes were identified in satellite imagery at 0800 and 1220 on 12 August and rose to 2.1 km and 3 km altitude and drifted NW and W, respectively. A news report stated that aid was sent to more than 6,300 people that were adversely affected by the eruption. Photos taken during 17-19 August showed ash emissions rising no higher than 1 km above the summit and drifting SE. A small explosion generated an ash plume during the morning of 19 August. Deposits from small pyroclastic flows were also captured in the photos. Satellite images captured lava flows and pyroclastic flow deposits. Two temporary seismic stations were installed near Bagana on 17 August at distances of 7 km WSW (Vakovi station) and 11 km SW (Kepox station). The Kepox station immediately started to record continuous, low-frequency background seismicity.
Satellite data. Little to no thermal activity was detected during April through mid-July 2023; only one anomaly was recorded during early April and one during early June, according to MIROVA (Middle InfraRed Observation of Volcanic Activity) data (figure 48). Thermal activity increased in both power and frequency during mid-July through September, although there were still some short gaps in detected activity. MODVOLC also detected increased thermal activity during August; thermal hotspots were detected a total of five times on 19, 20, and 27 August. Weak thermal anomalies were also captured in infrared satellite images on clear weather days throughout the reporting period on 7, 12, and 17 April, 27 May, 1, 6, 16, and 31 July, and 19 September (figure 48); a strong thermal anomaly was visible on 31 July. Distinct sulfur dioxide plumes that drifted generally NW were intermittently captured by the TROPOMI instrument on the Sentinel-5P satellite and sometimes exceeded two Dobson Units (DUs) (figure 49).
Geologic Background. Bagana volcano, in a remote portion of central Bougainville Island, is frequently active. This massive symmetrical cone was largely constructed by an accumulation of viscous andesitic lava flows. The entire edifice could have been constructed in about 300 years at its present rate of lava production. Eruptive activity is characterized by non-explosive effusion of viscous lava that maintains a small lava dome in the summit crater, although occasional explosive activity produces pyroclastic flows. Lava flows with tongue-shaped lobes up to 50 m thick and prominent levees descend the flanks on all sides.
Information Contacts: Rabaul Volcano Observatory (RVO), Geohazards Management Division, Department of Mineral Policy and Geohazards Management (DMPGM), PO Box 3386, Kokopo, East New Britain Province, Papua New Guinea; Darwin Volcanic Ash Advisory Centre (VAAC), Bureau of Meteorology, Northern Territory Regional Office, PO Box 40050, Casuarina, NT 0811, Australia (URL: http://www.bom.gov.au/info/vaac/); MIROVA (Middle InfraRed Observation of Volcanic Activity), a collaborative project between the Universities of Turin and Florence (Italy) supported by the Centre for Volcanic Risk of the Italian Civil Protection Department (URL: http://www.mirovaweb.it/); Hawai'i Institute of Geophysics and Planetology (HIGP) - MODVOLC Thermal Alerts System, School of Ocean and Earth Science and Technology (SOEST), Univ. of Hawai'i, 2525 Correa Road, Honolulu, HI 96822, USA (URL: http://modis.higp.hawaii.edu/); NASA Global Sulfur Dioxide Monitoring Page, Atmospheric Chemistry and Dynamics Laboratory, NASA Goddard Space Flight Center (NASA/GSFC), 8800 Greenbelt Road, Goddard, Maryland, USA (URL: https://so2.gsfc.nasa.gov/); Copernicus Browser, Copernicus Data Space Ecosystem, European Space Agency (URL: https://dataspace.copernicus.eu/browser/); Autonomous Bougainville Government, P.O Box 322, Buka, AROB, PNG (URL: https://abg.gov.pg/); Andrew Tupper (Twitter: @andrewcraigtupp); Simon Carn, Geological and Mining Engineering and Sciences, Michigan Technological University, 1400 Townsend Drive, Houghton, MI 49931, USA (URL: http://www.volcarno.com/, Twitter: @simoncarn); Radio NZ (URL: https://www.rnz.co.nz/news/pacific/494464/more-than-7-000-people-in-bougainville-need-temporary-accommodation-after-eruption); USAID, 1300 Pennsylvania Ave, NW, Washington DC 20004, USA (URL: https://www.usaid.gov/pacific-islands/press-releases/aug-08-2023-united-states-provides-immediate-emergency-assistance-support-communities-affected-mount-bagana-volcanic-eruptions).
Mayon (Philippines) — October 2023 Cite this Report
Mayon
Philippines
13.257°N, 123.685°E; summit elev. 2462 m
All times are local (unless otherwise noted)
Lava flows, pyroclastic flows, ash emissions, and seismicity during April-September 2023
Mayon is located in the Philippines and has steep upper slopes capped by a small summit crater. Historical eruptions date back to 1616 CE that have been characterized by Strombolian eruptions, lava flows, pyroclastic flows, and mudflows. Eruptions mostly originated from a central conduit. Pyroclastic flows and mudflows have commonly descended many of the approximately 40 drainages that surround the volcano. The most recent eruption occurred during June through October 2022 and consisted of lava dome growth and gas-and-steam emissions (BGVN 47:12). A new eruption was reported during late April 2023 and has included lava flows, pyroclastic density currents, ash emissions, and seismicity. This report covers activity during April through September 2023 based on daily bulletins from the Philippine Institute of Volcanology and Seismology (PHIVOLCS).
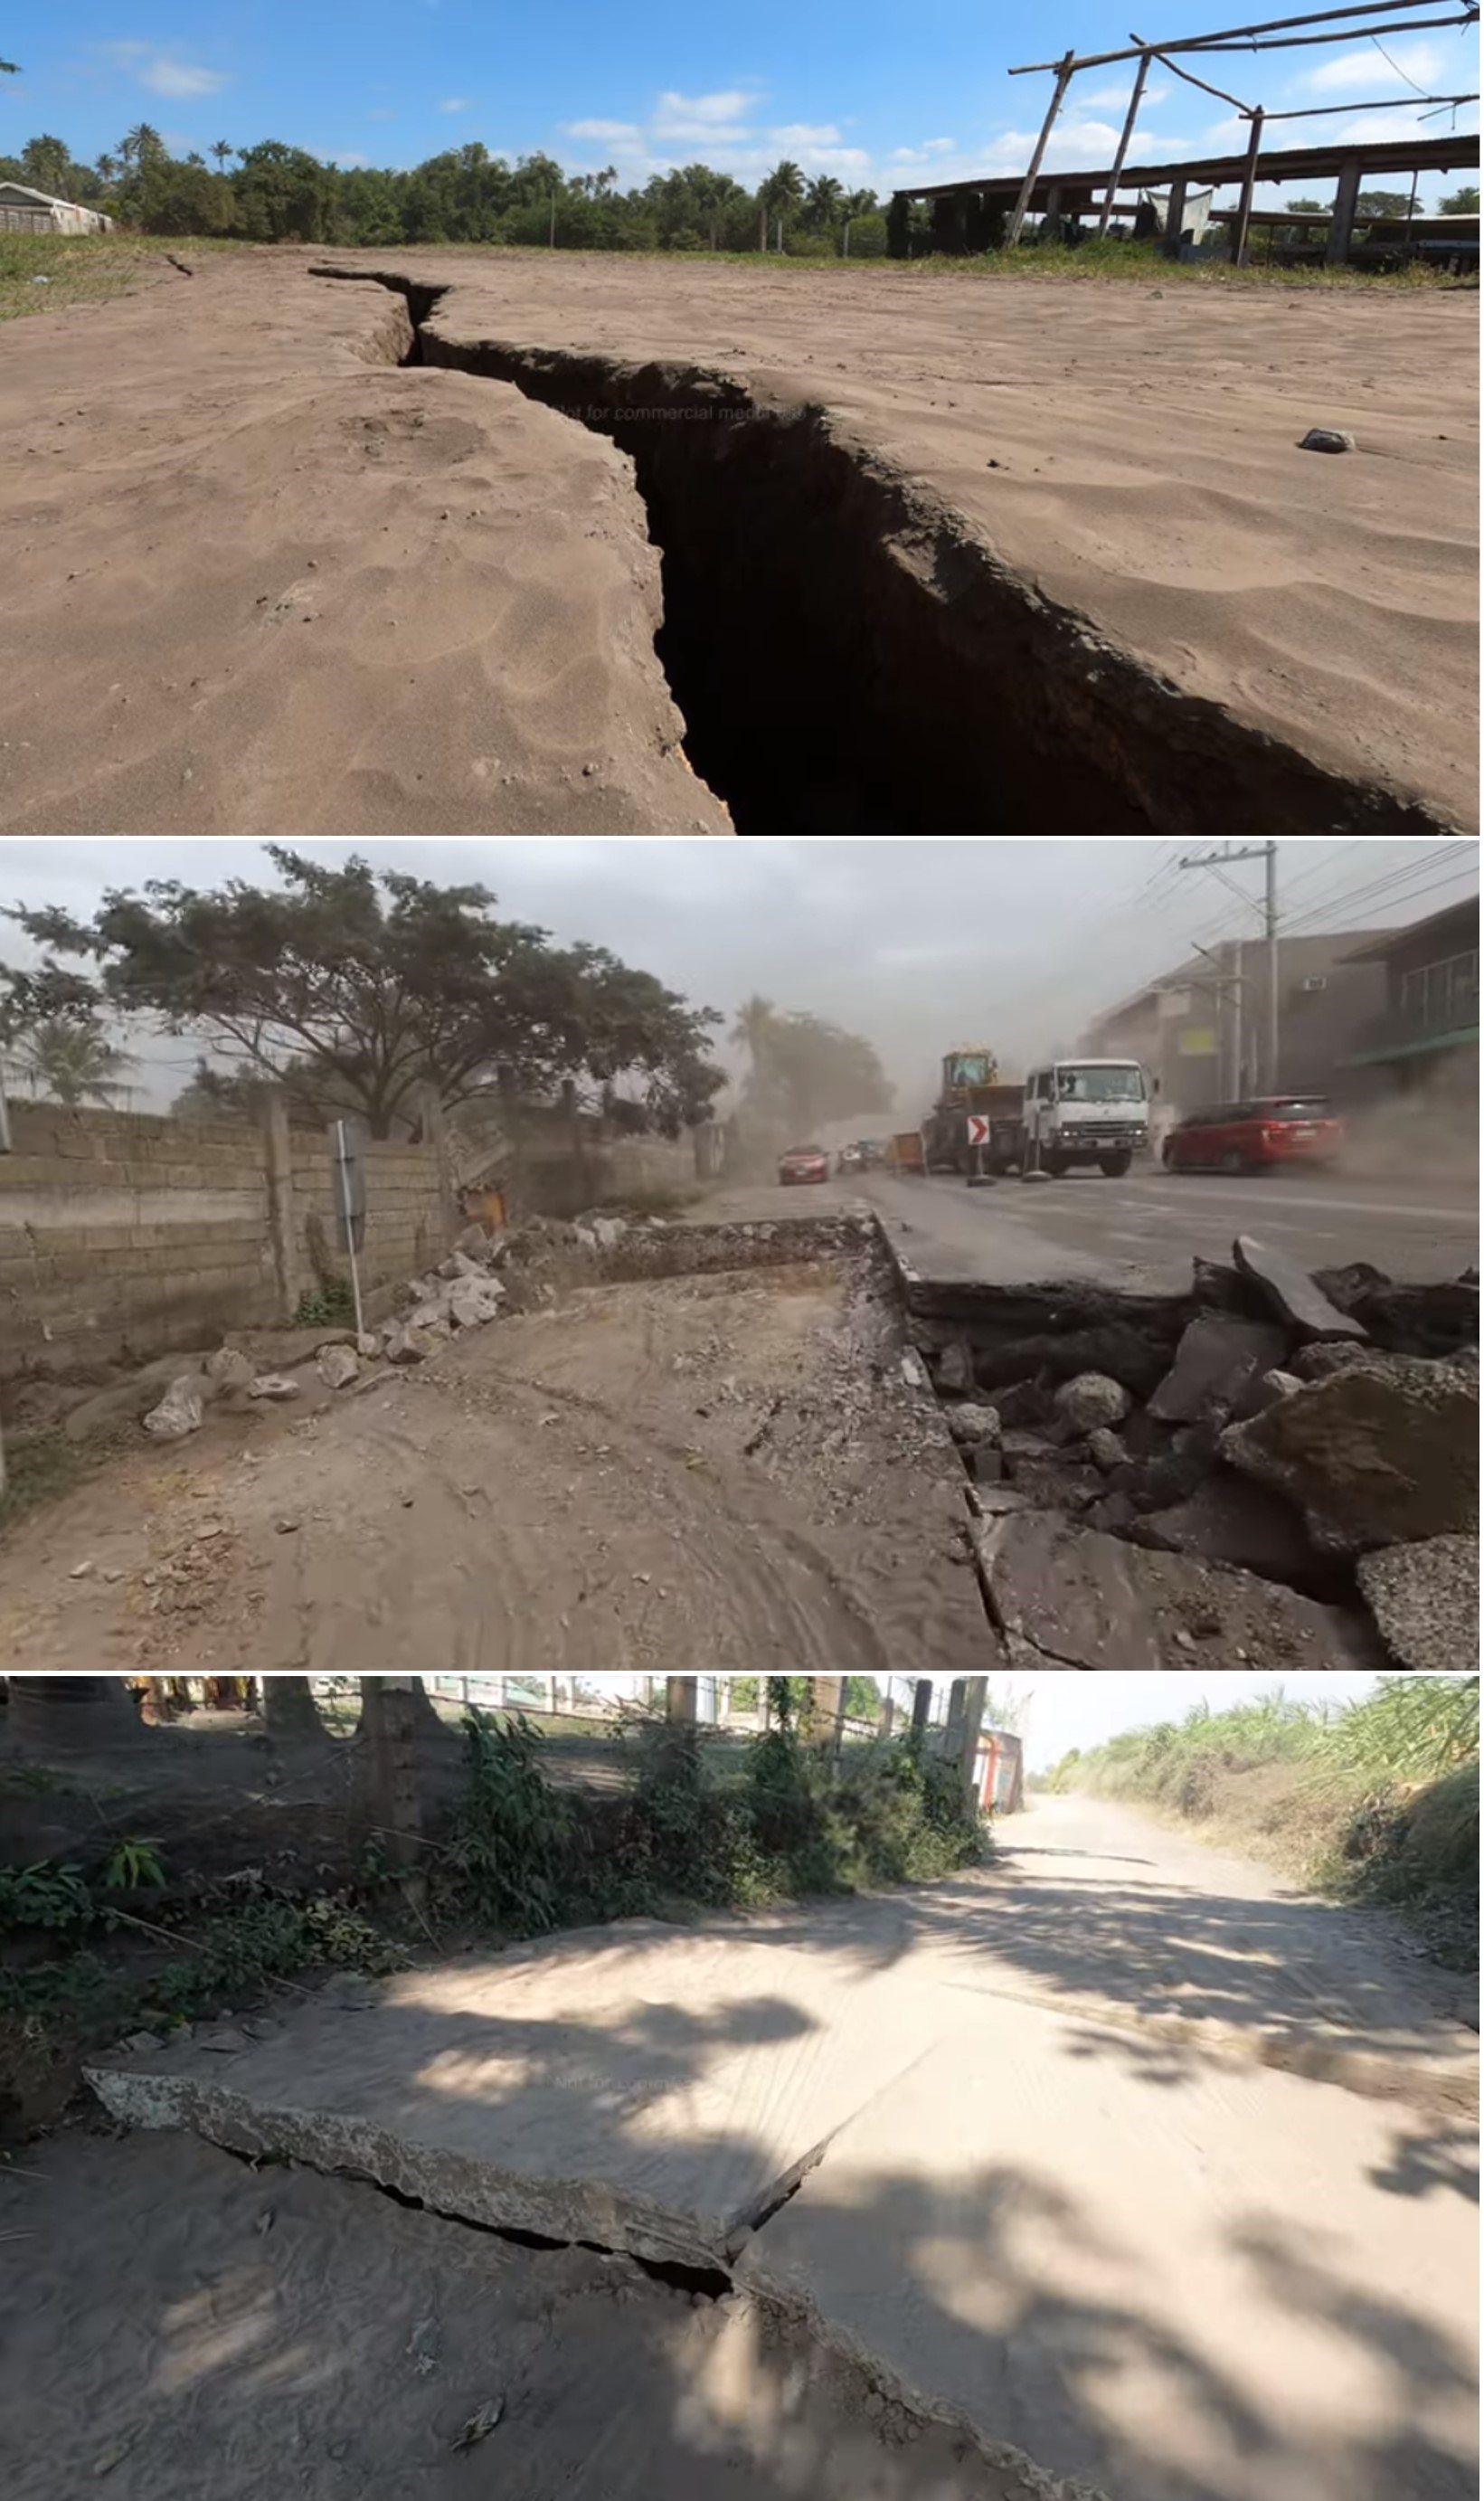
During April through September 2023, PHIVOLCS reported near-daily rockfall events, frequent volcanic earthquakes, and sulfur dioxide measurements. Gas-and-steam emissions rose 100-900 m above the crater and drifted in different directions. Nighttime crater incandescence was often visible during clear weather and was accompanied by incandescent avalanches of material. Activity notably increased during June when lava flows were reported on the S, SE, and E flanks (figure 52). The MIROVA graph (Middle InfraRed Observation of Volcanic Activity) showed strong thermal activity coincident with these lava flows, which remained active through September (figure 53). According to the MODVOLC thermal algorithm, a total of 110 thermal alerts were detected during the reporting period: 17 during June, 40 during July, 27 during August, and 26 during September. During early June, pyroclastic density currents (PDCs) started to occur more frequently.
Low activity was reported during much of April and May; gas-and-steam emissions rose 100-900 m above the crater and generally drifted in different directions. A total of 52 rockfall events and 18 volcanic earthquakes were detected during April and 147 rockfall events and 13 volcanic events during May. Sulfur dioxide flux measurements ranged between 400-576 tons per day (t/d) during April, the latter of which was measured on 29 April and between 162-343 t/d during May, the latter of which was measured on 13 May.
Activity during June increased, characterized by lava flows, pyroclastic density currents (PDCs), crater incandescence and incandescent rockfall events, gas-and-steam emissions, and continued seismicity. Weather clouds often prevented clear views of the summit, but during clear days, moderate gas-and-steam emissions rose 100-2,500 m above the crater and drifted in multiple directions. A total of 6,237 rockfall events and 288 volcanic earthquakes were detected. The rockfall events often deposited material on the S and SE flanks within 700-1,500 m of the summit crater and ash from the events drifted SW, S, SE, NE, and E. Sulfur dioxide emissions ranged between 149-1,205 t/d, the latter of which was measured on 10 June. Short-term observations from EDM and electronic tiltmeter monitoring indicated that the upper slopes were inflating since February 2023. Longer-term ground deformation parameters based on EDM, precise leveling, continuous GPS, and electronic tilt monitoring indicated that the volcano remained inflated, especially on the NW and SE flanks. At 1000 on 5 June the Volcano Alert Level (VAL) was raised to 2 (on a 0-5 scale). PHIVOLCS noted that although low-level volcanic earthquakes, ground deformation, and volcanic gas emissions indicated unrest, the steep increase in rockfall frequency may indicate increased dome activity.
A total of 151 dome-collapse PDCs occurred during 8-9 and 11-30 June, traveled 500-2,000 m, and deposited material on the S flank within 2 km of the summit crater. During 8-9 June the VAL was raised to 3. At approximately 1947 on 11 June lava flow activity was reported; two lobes traveled within 500 m from the crater and deposited material on the S (Mi-isi), SE (Bonga), and E (Basud) flanks. Weak seismicity accompanied the lava flow and slight inflation on the upper flanks. This lava flow remained active through 30 June, moving down the S and SE flank as far as 2.5 km and 1.8 km, respectively and depositing material up to 3.3 km from the crater. During 15-16 June traces of ashfall from the PDCs were reported in Sitio Buga, Nabonton, City of Ligao and Purok, and San Francisco, Municipality of Guinobatan. During 28-29 June there were two PDCs generated by the collapse of the lava flow front, which generated a light-brown ash plume 1 km high. Satellite monitors detected significant concentrations of sulfur dioxide beginning on 29 June. On 30 June PDCs primarily affected the Basud Gully on the E flank, the largest of which occurred at 1301 and lasted eight minutes, based on the seismic record. Four PDCs generated between 1800 and 2000 that lasted approximately four minutes each traveled 3-4 km on the E flank and generated an ash plume that rose 1 km above the crater and drifted N and NW. Ashfall was recorded in Tabaco City.
Similar strong activity continued during July; slow lava effusion remained active on the S and SE flanks and traveled as far as 2.8 km and 2.8 km, respectively and material was deposited as far as 4 km from the crater. There was a total of 6,983 rockfall events and 189 PDCs that affected the S, SE, and E flanks. The volcano network detected a total of 2,124 volcanic earthquakes. Continuous gas-and-steam emissions rose 200-2,000 m above the crater and drifted in multiple directions. Sulfur dioxide emissions averaged 792-4,113 t/d, the latter of which was measured on 28 July. During 2-4 July three PDCs were generated from the collapse of the lava flow and resulting light brown plumes rose 200-300 m above the crater. Continuous tremor pulses were reported beginning at 1547 on 3 July through 7 July at 1200, at 2300 on 8 July and going through 0300 on 10 July, and at 2300 on 16 July, as recorded by the seismic network. During 6-9 July there were 10 lava flow-collapse-related PDCs that generated light brown plumes 300-500 m above the crater. During 10-11 July light ashfall was reported in some areas of Mabinit, Legazpi City, Budiao and Salvacion, Daraga, and Camalig, Albay. By 18 July the lava flow advanced 600 m on the E flank as well.
During 1733 on 18 July and 0434 on 19 July PHIVOLCS reported 30 “ashing” events, which are degassing events accompanied by audible thunder-like sounds and entrained ash at the crater, which produced short, dark plumes that drifted SW. These events each lasted 20-40 seconds, and plume heights ranged from 150-300 m above the crater, as recorded by seismic, infrasound, visual, and thermal monitors. Three more ashing events occurred during 19-20 July. Short-term observations from electronic tilt and GPS monitoring indicate deflation on the E lower flanks in early July and inflation on the NW middle flanks during the third week of July. Longer-term ground deformation parameters from EDM, precise leveling, continuous GPS, and electronic tilt monitoring indicated that the volcano was still generally inflated relative to baseline levels. A short-lived lava pulse lasted 28 seconds at 1956 on 21 July, which was accompanied by seismic and infrasound signals. By 22 July, the only lava flow that remained active was on the SE flank, and continued to extend 3.4 km, while those on the S and E flanks weakened markedly. One ashing event was detected during 30-31 July, whereas there were 57 detected during 31 July-1 August; according to PHIVOLCS beginning at approximately 1800 on 31 July eruptive activity was dominated by phases of intermittent ashing, as well as increased in the apparent rates of lava effusion from the summit crater. The ashing phases consisted of discrete events recorded as low-frequency volcanic earthquakes (LFVQ) typically 30 seconds in duration, based on seismic and infrasound signals. Gray ash plume rose 100 m above the crater and generally drifted NE. Shortly after these ashing events began, new lava began to effuse rapidly from the crater, feeding the established flowed on the SE, E, and E flanks and generating frequent rockfall events.
Intensified unrest persisted during August. There was a total of 4,141 rockfall events, 2,881 volcanic earthquakes, which included volcanic tremor events, 32 ashing events, and 101 PDCs detected throughout the month. On clear weather days, gas-and-steam emissions rose 300-1,500 m above the crater and drifted in different directions (figure 54). Sulfur dioxide emissions averaged 735-4,756 t/d, the higher value of which was measured on 16 August. During 1-2 August the rate of lava effusion decreased, but continued to feed the flows on the SE, S, and E flanks, maintaining their advances to 3.4 km, 2.8 km, and 1.1 km from the crater, respectively (figure 55). Rockfall and PDCs generated by collapses at the lava flow margins and from the summit dome deposited material within 4 km of the crater. During 3-4 August there were 10 tremor events detected that lasted 1-4 minutes. Short-lived lava pulse lasted 35 seconds and was accompanied by seismic and infrasound signals at 0442 on 6 August. Seven collapses were recorded at the front of the lava flow during 12-14 August.
During September, similar activity of slow lava effusion, PDCs, gas-and-steam emissions, and seismicity continued. There was a total of 4,452 rockfall events, 329 volcanic earthquakes, which included volcanic tremor events, two ashing events, and 85 PDCs recorded throughout the month. On clear weather days, gas-and-steam emissions rose 100-1,500 m above the crater and drifted in multiple directions. Sulfur dioxide emissions averaged 609-2,252 t/d, the higher average of which was measured on 6 September. Slow lava effusion continued advancing on the SE, S, and E flanks, maintaining lengths of 3.4 km, 2.8 km, and 1.1 km, respectively. Rockfall and PDC events generated by collapses along the lava flow margins and at the summit dome deposited material within 4 km of the crater.
Geologic Background. Symmetrical Mayon, which rises above the Albay Gulf NW of Legazpi City, is the most active volcano of the Philippines. The steep upper slopes are capped by a small summit crater. Recorded eruptions since 1616 CE range from Strombolian to basaltic Plinian, with cyclical activity beginning with basaltic eruptions, followed by longer periods of andesitic lava flows. Eruptions occur predominately from the central conduit and have also produced lava flows that travel far down the flanks. Pyroclastic density currents and mudflows have commonly swept down many of the approximately 40 ravines that radiate from the summit and have often damaged populated lowland areas. A violent eruption in 1814 killed more than 1,200 people and devastated several towns.
Information Contacts: Philippine Institute of Volcanology and Seismology (PHIVOLCS), Department of Science and Technology, University of the Philippines Campus, Diliman, Quezon City, Philippines (URL: http://www.phivolcs.dost.gov.ph/); MIROVA (Middle InfraRed Observation of Volcanic Activity), a collaborative project between the Universities of Turin and Florence (Italy) supported by the Centre for Volcanic Risk of the Italian Civil Protection Department (URL: http://www.mirovaweb.it/); Hawai'i Institute of Geophysics and Planetology (HIGP) - MODVOLC Thermal Alerts System, School of Ocean and Earth Science and Technology (SOEST), Univ. of Hawai'i, 2525 Correa Road, Honolulu, HI 96822, USA (URL: http://modis.higp.hawaii.edu/); Copernicus Browser, Copernicus Data Space Ecosystem, European Space Agency (URL: https://dataspace.copernicus.eu/browser/); William Rogers, Legazpi City, Albay Province, Philippines.
Nishinoshima (Japan) — October 2023 Cite this Report
Nishinoshima
Japan
27.247°N, 140.874°E; summit elev. 100 m
All times are local (unless otherwise noted)
Eruption plumes and gas-and-steam plumes during May-August 2023
Nishinoshima, located about 1,000 km S of Tokyo, is a small island in the Ogasawara Arc in Japan. The island is the summit of a massive submarine volcano that has prominent submarine peaks to the S, W, and NE. Eruptions date back to 1973 and the current eruption period began in October 2022. Recent activity has consisted of small ash plumes and fumarolic activity (BGVN 48:07). This report covers activity during May through August 2023, using information from monthly reports of the Japan Meteorological Agency (JMA) monthly reports and satellite data.
Activity during May through June was relatively low. The Japan Coast Guard (JCG) did overflights on 14 and 22 June and reported white gas-and-steam emissions rising 600 m and 1,200 m from the central crater of the pyroclastic cone, respectively (figure 125). In addition, multiple white gas-and-steam emissions rose from the inner rim of the W side of the crater and from the SE flank of the pyroclastic cone. Discolored brown-to-green water was observed around almost the entire perimeter of the island; on 22 June light green discolored water was observed off the S coast of the island.
Observations from the Himawari meteorological satellite confirmed an eruption on 9 and 10 July. An eruption plume rose 1.6 km above the crater and drifted N around 1300 on 9 July. Satellite images acquired at 1420 and 2020 on 9 July and at 0220 on 10 July showed continuing emissions that rose 1.3-1.6 km above the crater and drifted NE and N. The Tokyo VAAC reported that an ash plume seen by a pilot and identified in a satellite image at 0630 on 21 July rose to 3 km altitude and drifted S.
Aerial observations conducted by JCG on 8 August showed a white-and-gray plume rising from the central crater of the pyroclastic cone, and multiple white gas-and-steam emissions were rising from the inner edge of the western crater and along the NW-SE flanks of the island (figure 126). Brown-to-green discolored water was also noted around the perimeter of the island.
Intermittent low-to-moderate power thermal anomalies were recorded in the MIROVA graph (Middle InfraRed Observation of Volcanic Activity), showing an increase in both frequency and power beginning in July (figure 127). This increase in activity coincides with eruptive activity on 9 and 10 July, characterized by eruption plumes. According to the MODVOLC thermal alert algorithm, one thermal hotspot was recorded on 20 July. Weak thermal anomalies were also detected in infrared satellite imagery, accompanied by strong gas-and-steam plumes (figure 128).
Geologic Background. The small island of Nishinoshima was enlarged when several new islands coalesced during an eruption in 1973-74. Multiple eruptions that began in 2013 completely covered the previous exposed surface and continued to enlarge the island. The island is the summit of a massive submarine volcano that has prominent peaks to the S, W, and NE. The summit of the southern cone rises to within 214 m of the ocean surface 9 km SSE.
Information Contacts: Japan Meteorological Agency (JMA), 1-3-4 Otemachi, Chiyoda-ku, Tokyo 100-8122, Japan (URL: http://www.jma.go.jp/jma/indexe.html); Tokyo Volcanic Ash Advisory Center (VAAC), 1-3-4 Otemachi, Chiyoda-ku, Tokyo 100-8122, Japan (URL: http://ds.data.jma.go.jp/svd/vaac/data/); MIROVA (Middle InfraRed Observation of Volcanic Activity), a collaborative project between the Universities of Turin and Florence (Italy) supported by the Centre for Volcanic Risk of the Italian Civil Protection Department (URL: http://www.mirovaweb.it/); Copernicus Browser, Copernicus Data Space Ecosystem, European Space Agency (URL: https://dataspace.copernicus.eu/browser/).
Krakatau (Indonesia) — October 2023 Cite this Report
Krakatau
Indonesia
6.1009°S, 105.4233°E; summit elev. 285 m
All times are local (unless otherwise noted)
White gas-and-steam plumes and occasional ash plumes during May-August 2023
Krakatau is located in the Sunda Strait between Java and Sumatra, Indonesia. Caldera collapse during the catastrophic 1883 eruption destroyed Danan and Perbuwatan cones and left only a remnant of Rakata. The post-collapse cone of Anak Krakatau (Child of Krakatau) was constructed within the 1883 caldera at a point between the former Danan and Perbuwatan cones; it has been the site of frequent eruptions since 1927. The current eruption period began in May 2021 and has recently consisted of Strombolian eruptions and ash plumes (BGVN 48:07). This report describes lower levels of activity consisting of ash and white gas-and-steam plumes during May through August 2023, based on information provided by the Indonesian Center for Volcanology and Geological Hazard Mitigation, referred to as Pusat Vulkanologi dan Mitigasi Bencana Geologi (PVMBG), MAGMA Indonesia, and satellite data.
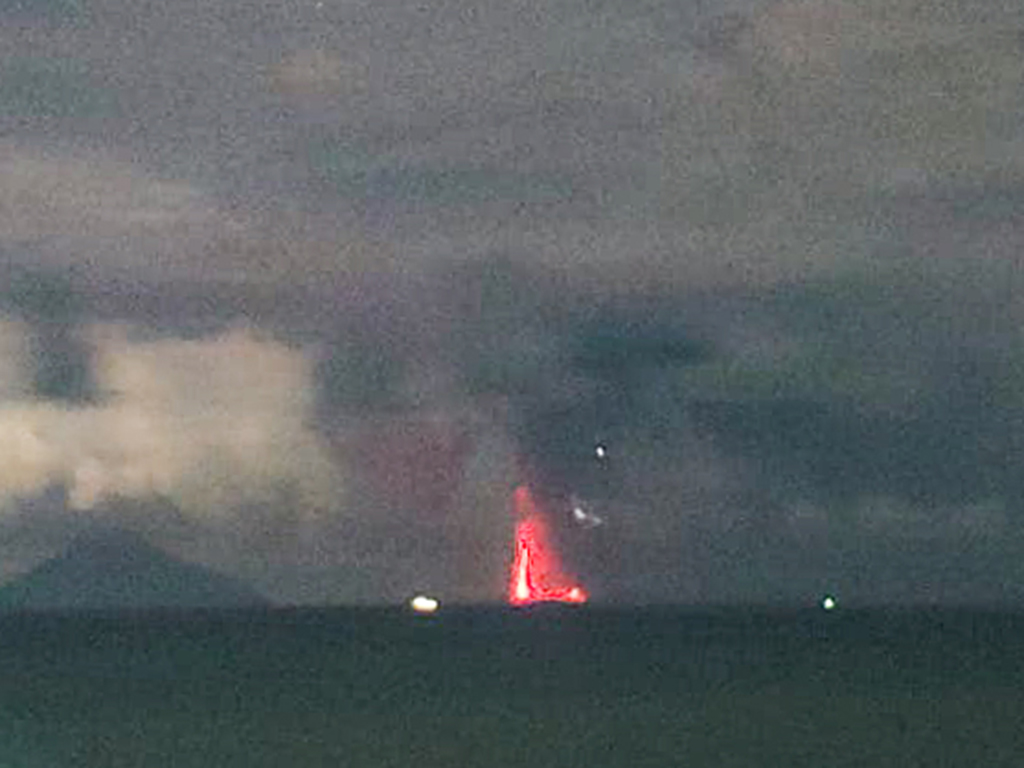
Activity was relatively low during May and June. Daily white gas-and-steam emissions rose 25-200 m above the crater and drifted in different directions. Five ash plumes were detected at 0519 on 10 May, 1241 on 11 May, 0920 on 12 May, 2320 on 12 May, and at 0710 on 13 May, and rose 1-2.5 km above the crater and drifted SW. A webcam image taken on 12 May showed ejection of incandescent material above the vent. A total of nine ash plumes were detected during 6-11 June: at 1434 and 00220 on 6 and 7 June the ash plumes rose 500 m above the crater and drifted NW, at 1537 on 8 June the ash plume rose 1 km above the crater and drifted SW, at 0746 and at 0846 on 9 June the ash plumes rose 800 m and 3 km above the crater and drifted SW, respectively, at 0423, 1431, and 1750 on 10 June the ash plumes rose 2 km, 1.5 km, and 3.5 km above the crater and drifted NW, respectively, and at 0030 on 11 June an ash plume rose 2 km above the crater and drifted NW. Webcam images taken on 10 and 11 June at 0455 and 0102, respectively, showed incandescent material ejected above the vent. On 19 June an ash plume at 0822 rose 1.5 km above the crater and drifted SE.
Similar low activity of white gas-and-steam emissions and few ash plumes were reported during July and August. Daily white gas-and-steam emissions rose 25-300 m above the crater and drifted in multiple directions. Three ash plumes were reported at 0843, 0851, and 0852 on 20 July that rose 500-2,000 m above the crater and drifted NW.
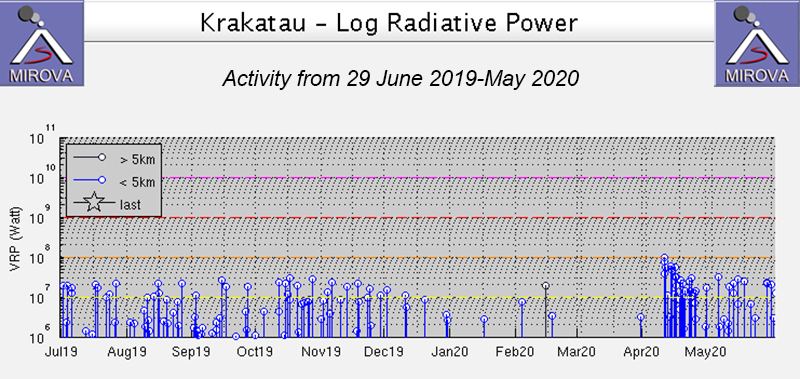
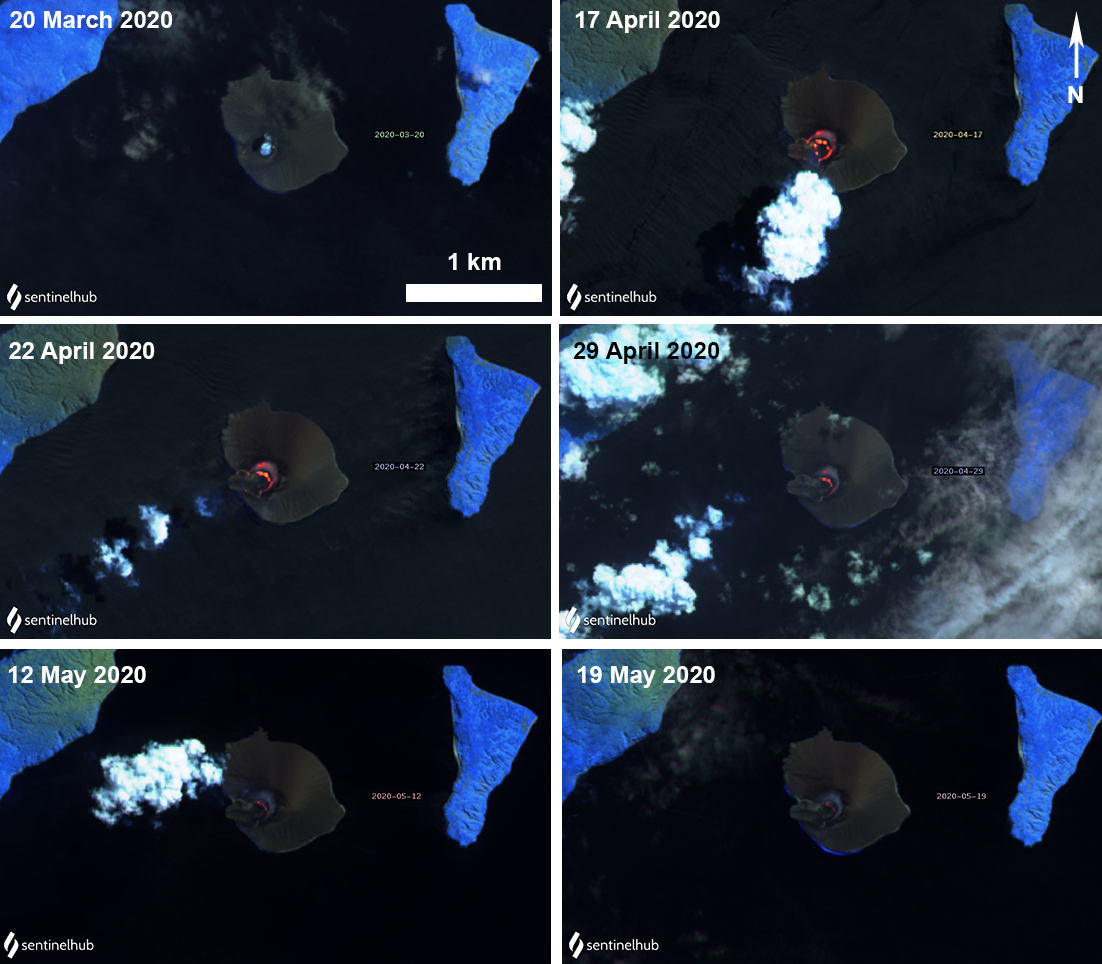
The MIROVA (Middle InfraRed Observation of Volcanic Activity) graph of MODIS thermal anomaly data showed intermittent low-to-moderate power thermal anomalies during May through August 2023 (figure 140). Although activity was often obscured by weather clouds, a thermal anomaly was visible in an infrared satellite image of the crater on 12 May, accompanied by an eruption plume that drifted SW (figure 141).
Geologic Background. The renowned Krakatau (frequently mis-named as Krakatoa) volcano lies in the Sunda Strait between Java and Sumatra. Collapse of an older edifice, perhaps in 416 or 535 CE, formed a 7-km-wide caldera. Remnants of that volcano are preserved in Verlaten and Lang Islands; subsequently the Rakata, Danan, and Perbuwatan cones were formed, coalescing to create the pre-1883 Krakatau Island. Caldera collapse during the catastrophic 1883 eruption destroyed Danan and Perbuwatan, and left only a remnant of Rakata. This eruption caused more than 36,000 fatalities, most as a result of tsunamis that swept the adjacent coastlines of Sumatra and Java. Pyroclastic surges traveled 40 km across the Sunda Strait and reached the Sumatra coast. After a quiescence of less than a half century, the post-collapse cone of Anak Krakatau (Child of Krakatau) was constructed within the 1883 caldera at a point between the former Danan and Perbuwatan cones. Anak Krakatau has been the site of frequent eruptions since 1927.
Information Contacts: Pusat Vulkanologi dan Mitigasi Bencana Geologi (PVMBG, also known as Indonesian Center for Volcanology and Geological Hazard Mitigation, CVGHM), Jalan Diponegoro 57, Bandung 40122, Indonesia (URL: http://www.vsi.esdm.go.id/); MAGMA Indonesia, Kementerian Energi dan Sumber Daya Mineral (URL: https://magma.esdm.go.id/v1); MIROVA (Middle InfraRed Observation of Volcanic Activity), a collaborative project between the Universities of Turin and Florence (Italy) supported by the Centre for Volcanic Risk of the Italian Civil Protection Department (URL: http://www.mirovaweb.it/); Copernicus Browser, Copernicus Data Space Ecosystem, European Space Agency (URL: https://dataspace.copernicus.eu/browser/).
Merapi (Indonesia) — October 2023 Cite this Report
Merapi
Indonesia
7.54°S, 110.446°E; summit elev. 2910 m
All times are local (unless otherwise noted)
Frequent incandescent avalanches during April-September 2023
Merapi, located just north of the major city of Yogyakarta in central Java, Indonesia, has had activity within the last 20 years characterized by pyroclastic flows and lahars accompanying growth and collapse of the steep-sided active summit lava dome. The current eruption period began in late December 2020 and has more recently consisted of ash plumes, intermittent incandescent avalanches of material, and pyroclastic flows (BGVN 48:04). This report covers activity during April through September 2023, based on information from Balai Penyelidikan dan Pengembangan Teknologi Kebencanaan Geologi (BPPTKG), the Center for Research and Development of Geological Disaster Technology, a branch of PVMBG which specifically monitors Merapi. Additional information comes from the Pusat Vulkanologi dan Mitigasi Bencana Geologi (PVMBG, also known as Indonesian Center for Volcanology and Geological Hazard Mitigation, CVGHM), MAGMA Indonesia, the Darwin Volcanic Ash Advisory Centre (VAAC), and various satellite data.
Activity during April through September 2023 primarily consisted of incandescent avalanches of material that mainly affected the SW and W flanks and traveled as far as 2.3 km from the summit (table 25) and white gas-and-steam emissions that rose 10-1,000 m above the crater.
Table 25. Monthly summary of avalanches and avalanche distances recorded at Merapi during April through September 2023. The number of reported avalanches does not include instances where possible avalanches were heard but could not be visually confirmed as a result of inclement weather. Data courtesy of BPPTKG (April-September 2023 daily reports).
| Month |
Average number of avalanches per day |
Distance avalanches traveled (m) |
| Apr 2023 |
19 |
1,200-2,000 |
| May 2023 |
22 |
500-2,000 |
| Jun 2023 |
18 |
1,200-2,000 |
| Jul 2023 |
30 |
300-2,000 |
| Aug 2023 |
25 |
400-2,300 |
| Sep 2023 |
23 |
600-2,000 |
BPPTKG reported that during April and May white gas-and-steam emissions rose 10-750 m above the crater, incandescent avalanches descended 500-2,000 m on the SW and W flanks (figure 135). Cloudy weather often prevented clear views of the summit, and sometimes avalanches could not be confirmed. According to a webcam image, a pyroclastic flow was visible on 17 April at 0531. During the week of 28 April and 4 May a pyroclastic flow was reported on the SW flank, traveling up to 2.5 km. According to a drone overflight taken on 17 May the SW lava dome volume was an estimated 2,372,800 cubic meters and the dome in the main crater was an estimated 2,337,300 cubic meters.
During June and July similar activity persisted with white gas-and-steam emissions rising 10-350 m above the crater and frequent incandescent avalanches that traveled 300-2,000 m down the SW, W, and S flanks (figure 136). Based on an analysis of aerial photos taken on 24 June the volume of the SW lava dome was approximately 2.5 million cubic meters. A pyroclastic flow was observed on 5 July that traveled 2.7 km on the SW flank. According to the Darwin VAAC multiple minor ash plumes were identified in satellite images on 19 July that rose to 3.7 km altitude and drifted S and SW. During 22, 25, and 26 July a total of 17 avalanches descended as far as 1.8 km on the S flank.
Frequent white gas-and-steam emissions continued during August and September, rising 10-450 m above the crater. Incandescent avalanches mainly affected the SW and W flanks and traveled 400-2,300 m from the vent (figure 137). An aerial survey conducted on 10 August was analyzed and reported that estimates of the SW dome volume was 2,764,300 cubic meters and the dome in the main crater was 2,369,800 cubic meters.
Frequent and moderate-power thermal activity continued throughout the reporting period, according to a MIROVA (Middle InfraRed Observation of Volcanic Activity) analysis of MODIS satellite data (figure 138). There was an increase in the number of detected anomalies during mid-May. The MODVOLC thermal algorithm recorded a total of 47 thermal hotspots: six during April, nine during May, eight during June, 15 during July, four during August, and five during September. Some of this activity was captured in infrared satellite imagery on clear weather days, sometimes accompanied by incandescent material on the SW flank (figure 139).
Geologic Background. Merapi, one of Indonesia's most active volcanoes, lies in one of the world's most densely populated areas and dominates the landscape immediately north of the major city of Yogyakarta. It is the youngest and southernmost of a volcanic chain extending NNW to Ungaran volcano. Growth of Old Merapi during the Pleistocene ended with major edifice collapse perhaps about 2,000 years ago, leaving a large arcuate scarp cutting the eroded older Batulawang volcano. Subsequent growth of the steep-sided Young Merapi edifice, its upper part unvegetated due to frequent activity, began SW of the earlier collapse scarp. Pyroclastic flows and lahars accompanying growth and collapse of the steep-sided active summit lava dome have devastated cultivated lands on the western-to-southern flanks and caused many fatalities.
Information Contacts: Balai Penyelidikan dan Pengembangan Teknologi Kebencanaan Geologi (BPPTKG), Center for Research and Development of Geological Disaster Technology (URL: http://merapi.bgl.esdm.go.id/, Twitter: @BPPTKG); MAGMA Indonesia, Kementerian Energi dan Sumber Daya Mineral (URL: https://magma.esdm.go.id/v1); Pusat Vulkanologi dan Mitigasi Bencana Geologi (PVMBG, also known as Indonesian Center for Volcanology and Geological Hazard Mitigation, CVGHM), Jalan Diponegoro 57, Bandung 40122, Indonesia (URL: http://www.vsi.esdm.go.id/); Darwin Volcanic Ash Advisory Centre (VAAC), Bureau of Meteorology, Northern Territory Regional Office, PO Box 40050, Casuarina, NT 0811, Australia (URL: http://www.bom.gov.au/info/vaac/); MIROVA (Middle InfraRed Observation of Volcanic Activity), a collaborative project between the Universities of Turin and Florence (Italy) supported by the Centre for Volcanic Risk of the Italian Civil Protection Department (URL: http://www.mirovaweb.it/); Hawai'i Institute of Geophysics and Planetology (HIGP) - MODVOLC Thermal Alerts System, School of Ocean and Earth Science and Technology (SOEST), Univ. of Hawai'i, 2525 Correa Road, Honolulu, HI 96822, USA (URL: http://modis.higp.hawaii.edu/); Copernicus Browser, Copernicus Data Space Ecosystem, European Space Agency (URL: https://dataspace.copernicus.eu/browser/); Øystein Lund Andersen (URL: https://www.oysteinlundandersen.com/, https://twitter.com/oysteinvolcano).
Villarrica (Chile) — October 2023 Cite this Report
Villarrica
Chile
39.42°S, 71.93°W; summit elev. 2847 m
All times are local (unless otherwise noted)
Strombolian activity, gas-and-ash emissions, and crater incandescence during April-September 2023
Villarrica, in central Chile, consists of a 2-km-wide caldera that formed about 3,500 years ago and is located at the base of the presently active cone at the NW margin of a 6-km-wide caldera. Historical eruptions eruptions date back to 1558 and have been characterized by mild-to-moderate explosive activity with occasional lava effusions. The current eruption period began in December 2014 and has recently consisted of nighttime crater incandescence, ash emissions, and seismicity (BGVN 48:04). This report covers activity during April through September 2023 and describes occasional Strombolian activity, gas-and-ash emissions, and nighttime crater incandescence. Information for this report primarily comes from the Southern Andes Volcano Observatory (Observatorio Volcanológico de Los Andes del Sur, OVDAS), part of Chile's National Service of Geology and Mining (Servicio Nacional de Geología y Minería, SERNAGEOMIN) and satellite data.
Seismicity during April consisted of long period (LP) events and tremor (TRE); a total of 9,413 LP-type events and 759 TR-type events were detected throughout the month. Nighttime crater incandescence persisted and was visible in the degassing column. Sulfur dioxide data was obtained using Differential Absorption Optical Spectroscopy Equipment (DOAS) that showed an average value of 1,450 ± 198 tons per day (t/d) during 1-15 April and 1,129 ± 201 t/d during 16-30 April, with a maximum daily value of 2,784 t/d on 9 April. Gas-and-steam emissions of variable intensities rose above the active crater as high as 1.3 km above the crater on 13 April. Strombolian explosions were not observed and there was a slight decrease in the lava lake level.
There were 14,123 LP-type events and 727 TR-type events detected during May. According to sulfur dioxide measurements taken with DOAS equipment, the active crater emitted an average value of 1,826 ± 482 t/d during 1-15 May and 912 ± 41 t/d during 16-30 May, with a daily maximum value of 5,155 t/d on 13 May. Surveillance cameras showed continuous white gas-and-steam emissions that rose as high as 430 m above the crater on 27 May. Nighttime incandescence illuminated the gas column less than 300 m above the crater rim was and no pyroclastic emissions were reported. A landslide was identified on 13 May on the E flank of the volcano 50 m from the crater rim and extending 300 m away; SERNAGEOMIN noted that this event may have occurred on 12 May. During the morning of 27 and 28 May minor Strombolian explosions characterized by incandescent ejecta were recorded at the crater rim; the last reported Strombolian explosions had occurred at the end of March.
Seismic activity during June consisted of five volcano-tectonic (VT)-type events, 21,606 LP-type events, and 2,085 TR-type events. The average value of sulfur dioxide flux obtained by DOAS equipment was 1,420 ± 217 t/d during 1-15 June and 2,562 ± 804 t/d, with a maximum daily value of 4,810 t/d on 17 June. White gas-and-steam emissions rose less than 480 m above the crater; frequent nighttime crater incandescence was reflected in the degassing plume. On 12 June an emission rose 100 m above the crater and drifted NNW. On 15 June one or several emissions resulted in ashfall to the NE as far as 5.5 km from the crater, based on a Skysat satellite image. Several Strombolian explosions occurred within the crater; activity on 15 June was higher energy and ejected blocks 200-300 m on the NE slope. Surveillance cameras showed white gas-and-steam emissions rising 480 m above the crater on 16 June. On 19 and 24 June low-intensity Strombolian activity was observed, ejecting material as far as 200 m from the center of the crater to the E.
During July, seismicity included 29,319 LP-type events, 3,736 TR-type events, and two VT-type events. DOAS equipment recorded two days of sulfur dioxide emissions of 4,220 t/d and 1,009 t/d on 1 and 13 July, respectively. Constant nighttime incandescence was also recorded and was particularly noticeable when accompanied by eruptive columns on 12 and 16 July. Minor explosive events were detected in the crater. According to Skysat satellite images taken on 12, 13, and 16 July, ashfall deposits were identified 155 m S of the crater. According to POVI, incandescence was visible from two vents on the crater floor around 0336 on 12 July. Gas-and-ash emissions rose as high as 1.2 km above the crater on 13 July and drifted E and NW. A series of gas-and-steam pulses containing some ash deposited material on the upper E flank around 1551 on 13 July. During 16-31 July, average sulfur dioxide emissions of 1,679 ± 406 t/d were recorded, with a maximum daily value of 2,343 t/d on 28 July. Fine ash emissions were also reported on 16, 17, and 23 July.
Seismicity persisted during August, characterized by 27,011 LP-type events, 3,323 TR-type events, and three VT-type events. The average value of sulfur dioxide measurements taken during 1-15 August was 1,642 ± 270 t/d and 2,207 ± 4,549 t/d during 16-31 August, with a maximum daily value of 3,294 t/d on 27 August. Nighttime crater incandescence remained visible in degassing columns. White gas-and-steam emissions rose 480 m above the crater on 6 August. According to a Skysat satellite image from 6 August, ash accumulation was observed proximal to the crater and was mainly distributed toward the E slope. White gas-and-steam emissions rose 320 m above the crater on 26 August. Nighttime incandescence and Strombolian activity that generated ash emissions were reported on 27 August.
Seismicity during September was characterized by five VT-type events, 12,057 LP-type events, and 2,058 TR-type events. Nighttime incandescence persisted. On 2 September an ash emission rose 180 m above the crater and drifted SE at 1643 (figure 125) and a white gas-and-steam plume rose 320 m above the crater. According to the Buenos Aires VAAC, periods of continuous gas-and-ash emissions were visible in webcam images from 1830 on 2 September to 0110 on 3 September. Strombolian activity was observed on 2 September and during the early morning of 3 September, the latter event of which generated an ash emission that rose 60 m above the crater and drifted 100 m from the center of the crater to the NE and SW. Ashfall was reported to the SE and S as far as 750 m from the crater. The lava lake was active during 3-4 September and lava fountaining was visible for the first time since 26 March 2023, according to POVI. Fountains captured in webcam images at 2133 on 3 September and at 0054 on 4 September rose as high as 60 m above the crater rim and ejected material onto the upper W flank. Sulfur dioxide flux of 1,730 t/d and 1,281 t/d was measured on 3 and 4 September, respectively, according to data obtained by DOAS equipment.
Strong Strombolian activity and larger gas-and-ash plumes were reported during 18-20 September. On 18 September activity was also associated with energetic LP-type events and notable sulfur dioxide fluxes (as high as 4,277 t/d). On 19 September Strombolian activity and incandescence were observed. On 20 September at 0914 ash emissions rose 50 m above the crater and drifted SSE, accompanied by Strombolian activity that ejected material less than 100 m SSE, causing fall deposits on that respective flank. SERNAGEOMIN reported that a Planet Scope satellite image taken on 20 September showed the lava lake in the crater, measuring 32 m x 35 m and an area of 0.001 km2. Several ash emissions were recorded at 0841, 0910, 1251, 1306, 1312, 1315, and 1324 on 23 September and rose less than 150 m above the crater. The sulfur dioxide flux value was 698 t/d on 23 September and 1,097 t/d on 24 September. On 24 September the Volcanic Alert Level (VAL) was raised to Orange (the third level on a four-color scale). SENAPRED maintained the Alert Level at Yellow (the middle level on a three-color scale) for the communities of Villarrica, Pucón (16 km N), Curarrehue, and Panguipulli.
During 24-25 September there was an increase in seismic energy (observed at TR-events) and acoustic signals, characterized by 1 VT-type event, 213 LP-type events, and 124 TR-type events. Mainly white gas-and-steam emissions, in addition to occasional fine ash emissions were recorded. During the early morning of 25 September Strombolian explosions were reported and ejected material 250 m in all directions, though dominantly toward the NW. On 25 September the average value of sulfur dioxide flux was 760 t/d. Seismicity during 25-30 September consisted of five VT-type events, 1,937 LP-type events, and 456 TR-type events.
During 25-29 September moderate Strombolian activity was observed and ejected material as far as the crater rim. In addition, ash pulses lasting roughly 50 minutes were observed around 0700 and dispersed ENE. During 26-27 September a TR episode lasted 6.5 hours and was accompanied by discrete acoustic signals. Satellite images from 26 September showed a spatter cone on the crater floor with one vent that measured 10 x 14 m and a smaller vent about 35 m NE of the cone. SERNAGEOMIN reported an abundant number of bomb-sized blocks up to 150 m from the crater, as well as impact marks on the snow, which indicated explosive activity. A low-altitude ash emission was observed drifting NW around 1140 on 28 September, based on webcam images. Between 0620 and 0850 on 29 September an ash emission rose 60 m above the crater and drifted NW. During an overflight taken around 1000 on 29 September scientists observed molten material in the vent, a large accumulation of pyroclasts inside the crater, and energetic degassing, some of which contained a small amount of ash. Block-sized pyroclasts were deposited on the internal walls and near the crater, and a distal ash deposit was also visible. The average sulfur dioxide flux measured on 28 September was 344 t/d. Satellite images taken on 29 September ashfall was deposited roughly 3 km WNW from the crater and nighttime crater incandescence remained visible. The average sulfur dioxide flux value from 29 September was 199 t/d. On 30 September at 0740 a pulsating ash emission rose 1.1 km above the crater and drifted NNW (figure 126). Deposits on the S flank extended as far as 4.5 km from the crater rim, based on satellite images from 30 September.
Infrared MODIS satellite data processed by MIROVA (Middle InfraRed Observation of Volcanic Activity) showed intermittent thermal activity during April through September, with slightly stronger activity detected during late September (figure 127). Small clusters of thermal activity were detected during mid-June, early July, early August, and late September. According to the MODVOLC thermal alert system, a total of four thermal hotspots were detected on 7 July and 3 and 23 September. This activity was also intermittently captured in infrared satellite imagery on clear weather days (figure 128).
Geologic Background. The glacier-covered Villarrica stratovolcano, in the northern Lakes District of central Chile, is ~15 km south of the city of Pucon. A 2-km-wide caldera that formed about 3,500 years ago is located at the base of the presently active, dominantly basaltic to basaltic andesite cone at the NW margin of a 6-km-wide Pleistocene caldera. More than 30 scoria cones and fissure vents are present on the flanks. Plinian eruptions and pyroclastic flows that have extended up to 20 km from the volcano were produced during the Holocene. Lava flows up to 18 km long have issued from summit and flank vents. Eruptions documented since 1558 CE have consisted largely of mild-to-moderate explosive activity with occasional lava effusion. Glaciers cover 40 km2 of the volcano, and lahars have damaged towns on its flanks.
Information Contacts: Servicio Nacional de Geología y Minería (SERNAGEOMIN), Observatorio Volcanológico de Los Andes del Sur (OVDAS), Avda Sta María No. 0104, Santiago, Chile (URL: http://www.sernageomin.cl/); Proyecto Observación Villarrica Internet (POVI) (URL: http://www.povi.cl/); Sistema y Servicio Nacional de Prevención y Repuesta Ante Desastres (SENAPRED), Av. Beauchef 1671, Santiago, Chile (URL: https://web.senapred.cl/); Buenos Aires Volcanic Ash Advisory Center (VAAC), Servicio Meteorológico Nacional-Fuerza Aérea Argentina, 25 de mayo 658, Buenos Aires, Argentina (URL: http://www.smn.gov.ar/vaac/buenosaires/inicio.php); MIROVA (Middle InfraRed Observation of Volcanic Activity), a collaborative project between the Universities of Turin and Florence (Italy) supported by the Centre for Volcanic Risk of the Italian Civil Protection Department (URL: http://www.mirovaweb.it/); Hawai'i Institute of Geophysics and Planetology (HIGP) - MODVOLC Thermal Alerts System, School of Ocean and Earth Science and Technology (SOEST), Univ. of Hawai'i, 2525 Correa Road, Honolulu, HI 96822, USA (URL: http://modis.higp.hawaii.edu/); Copernicus Browser, Copernicus Data Space Ecosystem, European Space Agency (URL: https://dataspace.copernicus.eu/browser/).
Ebeko
Russia
50.686°N, 156.014°E; summit elev. 1103 m
All times are local (unless otherwise noted)
Moderate explosive activity with ash plumes continued during June-November 2023
Ebeko, located on the N end of Paramushir Island in Russia’s Kuril Islands just S of the Kamchatka Peninsula, consists of three summit craters along a SSW-NNE line at the northern end of a complex of five volcanic cones. Observed eruptions date back to the late 18th century and have been characterized as small-to-moderate explosions from the summit crater, accompanied by intense fumarolic activity. The current eruptive period began in June 2022, consisting of frequent explosions, ash plumes, and thermal activity (BGVN 47:10, 48:06). This report covers similar activity during June-November 2023, based on information from the Kamchatka Volcanic Eruptions Response Team (KVERT) and satellite data.
Moderate explosive activity continued during June-November 2023 (figures 50 and 51). According to visual data from Severo-Kurilsk, explosions sent ash 2-3.5 km above the summit (3-4.5 km altitude) during most days during June through mid-September. Activity after mid-September was slightly weaker, with ash usually reaching less than 2 km above the summit. According to KVERT the volcano in October and November was, with a few exceptions, either quiet or obscured by clouds that prevented satellite observations. KVERT issued Volcano Observatory Notices for Aviation (VONA) on 8 and 12 June, 13 and 22 July, 3 and 21 August, and 31 October warning of potential aviation hazards from ash plumes drifting 3-15 km from the volcano. Based on satellite data, KVERT reported a persistent thermal anomaly whenever weather clouds permitted viewing.
Geologic Background. The flat-topped summit of the central cone of Ebeko volcano, one of the most active in the Kuril Islands, occupies the northern end of Paramushir Island. Three summit craters located along a SSW-NNE line form Ebeko volcano proper, at the northern end of a complex of five volcanic cones. Blocky lava flows extend west from Ebeko and SE from the neighboring Nezametnyi cone. The eastern part of the southern crater contains strong solfataras and a large boiling spring. The central crater is filled by a lake about 20 m deep whose shores are lined with steaming solfataras; the northern crater lies across a narrow, low barrier from the central crater and contains a small, cold crescentic lake. Historical activity, recorded since the late-18th century, has been restricted to small-to-moderate explosive eruptions from the summit craters. Intense fumarolic activity occurs in the summit craters, on the outer flanks of the cone, and in lateral explosion craters.
Information Contacts: Kamchatka Volcanic Eruptions Response Team (KVERT), Far Eastern Branch, Russian Academy of Sciences, 9 Piip Blvd., Petropavlovsk-Kamchatsky, 683006, Russia (URL: http://www.kscnet.ru/ivs/kvert/).
Search Bulletin Archive by Publication Date
Select a month and year from the drop-downs and click "Show Issue" to have that issue displayed in this tab.
The default month and year is the latest issue available.
Bulletin of the Global Volcanism Network - Volume 45, Number 06 (June 2020)
Managing Editor: Edward Venzke
Ebeko (Russia)
Frequent moderate explosions, ash plumes, and ashfall continue, December 2019-May 2020
Karangetang (Indonesia)
Incandescent block avalanches through mid-January 2020; crater anomalies through May
Klyuchevskoy (Russia)
Strombolian activity November 2019 through May 2020; lava flow down the SE flank in April
Krakatau (Indonesia)
Strombolian explosions, ash plumes, and crater incandescence during April 2020
Masaya (Nicaragua)
Lava lake level drops but remains active through May 2020; weak gas plumes
Nyamulagira (DR Congo)
Intermittent thermal anomalies within the summit crater during December 2019-May 2020
Nyiragongo (DR Congo)
Activity in the lava lake and small eruptive cone persists during December 2019-May 2020
Sabancaya (Peru)
Daily explosions with ash emissions, large SO2 flux, ongoing thermal anomalies, December 2019-May 2020
Shishaldin (United States)
Intermittent thermal activity and a possible new cone at the summit crater during February-May 2020
Taal (Philippines)
Eruption on 12 January with explosions through 22 January; steam plumes continuing into March
Ebeko
Russia
50.686°N, 156.014°E; summit elev. 1103 m
All times are local (unless otherwise noted)
Frequent moderate explosions, ash plumes, and ashfall continue, December 2019-May 2020
The current moderate explosive eruption of Ebeko has been ongoing since October 2016, with frequent ash explosions that have reached altitudes of 1.3-6 km (BGVN 42:08, 43:03, 43:06, 43:12, 44:12). Ashfall is common in Severo-Kurilsk, a town of about 2,500 residents 7 km ESE, where the Kamchatka Volcanic Eruptions Response Team (KVERT) monitor the volcano. During the reporting period, December 2019-May 2020, the Aviation Color Code remained at Orange (the second highest level on a four-color scale).
During December 2019-May 2020, frequent explosions generated ash plumes that reached altitudes of 1.5-4.6 km (table 9); reports of ashfall in Severo-Kurilsk were common. Ash explosions in late April caused ashfall in Severo-Kurilsk during 25-30 April (figure 24), and the plume drifted 180 km SE on the 29th. There was also a higher level of activity during the second half of May (figure 25), when plumes drifted up to 80 km downwind.
Table 9. Summary of activity at Ebeko, December 2019-May 2020. S-K is Severo-Kurilsk (7 km ESE of the volcano). TA is thermal anomaly in satellite images. In the plume distance column, only plumes that drifted more than 10 km are indicated. Dates based on UTC times. Data courtesy of KVERT.
| Date |
Plume Altitude (km) |
Plume Distance |
Plume Directions |
Other Observations |
| 30 Nov-05 Dec 2019 |
3 |
-- |
NE, E |
Intermittent explosions. |
| 06-13 Dec 2019 |
4 |
-- |
E |
Explosions all week. Ashfall in S-K on 10-12 Dec. |
| 15-17 Dec 2019 |
3 |
-- |
E |
Explosions. Ashfall in S-K on 16-17 Dec. |
| 22-24 Dec 2019 |
3 |
-- |
NE |
Explosions. |
| 01-02 Jan 2020 |
3 |
30 km N |
N |
Explosions. TA over dome on 1 Jan. |
| 03, 05, 09 Jan 2020 |
2.9 |
-- |
NE, SE |
Explosions. Ashfall in S-K on 8 Jan. |
| 11, 13-14 Jan 2020 |
3 |
-- |
E |
Explosions. Ashfall in S-K. |
| 19-20 Jan 2020 |
3 |
-- |
E |
Ashfall in S-K on 19 Jan. |
| 24-31 Jan 2020 |
4 |
-- |
E |
Explosions. |
| 01-07 Feb 2020 |
3 |
-- |
E, S |
Explosions all week. |
| 12-13 Feb 2020 |
1.5 |
-- |
E |
Explosions. Ashfall in S-K. |
| 18-19 Feb 2020 |
2.3 |
-- |
SE |
Explosions. |
| 21, 25, 27 Feb 2020 |
2.9 |
-- |
S, SE, NE |
Explosions. Ashfall in S-K on 22 Feb. |
| 01-02, 05 Mar 2020 |
2 |
-- |
S, E |
Explosions. |
| 08 Mar 2020 |
2.5 |
-- |
NE |
Explosions. |
| 13, 17 Mar 2020 |
2.5 |
-- |
NE, SE |
Bursts of gas, steam, and small amount of ash. |
| 24-25 Mar 2020 |
2.5 |
-- |
NE, W |
Explosions. |
| 29 Mar-02 Apr 2020 |
2.2 |
-- |
NE, E |
Explosions. Ashfall in S-K on 1 Apr. TA on 30-31 Mar. |
| 04-05, 09 Apr 2020 |
1.5 |
-- |
NE |
Explosions. TA on 5 Apr. |
| 13 Apr 2020 |
2.5 |
-- |
SE |
Explosions. |
| 18, 20 Apr 2020 |
-- |
-- |
-- |
TA on 18, 20 Apr. |
| 24 Apr-01 May 2020 |
3.5 |
180 km SE on 29 Apr |
E, SE |
Explosions all week. Ashfall in S-K on 25-30 Apr. |
| 01-08 May 2020 |
2.6 |
-- |
E |
Explosions all week. Ashfall in S-K on 3-5 May. TA on 3 May. |
| 08-15 May 2020 |
4 |
-- |
E |
Explosions. Ashfall in S-K on 8-12 May. TA during 12-14 May. |
| 14-15, 19-21 May 2020 |
3.6 |
80 km SW, S, SE during 14, 20-21 May |
-- |
Explosions. TA on same days. |
| 22-29 May 2020 |
4.6 |
60 km SE |
E, SE |
Explosions all week. Ashfall in S-K on 22, 24 May. |
| 29-31 May 2020 |
4.5 |
-- |
E, S |
Explosions. TA on 30 May. |
Geologic Background. The flat-topped summit of the central cone of Ebeko volcano, one of the most active in the Kuril Islands, occupies the northern end of Paramushir Island. Three summit craters located along a SSW-NNE line form Ebeko volcano proper, at the northern end of a complex of five volcanic cones. Blocky lava flows extend west from Ebeko and SE from the neighboring Nezametnyi cone. The eastern part of the southern crater contains strong solfataras and a large boiling spring. The central crater is filled by a lake about 20 m deep whose shores are lined with steaming solfataras; the northern crater lies across a narrow, low barrier from the central crater and contains a small, cold crescentic lake. Historical activity, recorded since the late-18th century, has been restricted to small-to-moderate explosive eruptions from the summit craters. Intense fumarolic activity occurs in the summit craters, on the outer flanks of the cone, and in lateral explosion craters.
Information Contacts: Kamchatka Volcanic Eruptions Response Team (KVERT), Far Eastern Branch, Russian Academy of Sciences, 9 Piip Blvd., Petropavlovsk-Kamchatsky, 683006, Russia (URL: http://www.kscnet.ru/ivs/kvert/); Institute of Volcanology and Seismology, Far Eastern Branch, Russian Academy of Sciences (IVS FEB RAS), 9 Piip Blvd., Petropavlovsk-Kamchatsky 683006, Russia (URL: http://www.kscnet.ru/ivs/eng/); Sentinel Hub Playground (URL: https://www.sentinel-hub.com/explore/sentinel-playground).
Karangetang (Indonesia) — June 2020 Cite this Report
Karangetang
Indonesia
2.781°N, 125.407°E; summit elev. 1797 m
All times are local (unless otherwise noted)
Incandescent block avalanches through mid-January 2020; crater anomalies through May
The Karangetang andesitic-basaltic stratovolcano (also referred to as Api Siau) at the northern end of the island of Siau, north of Sulawesi, Indonesia, has had more than 50 observed eruptions since 1675. Frequent explosive activity is accompanied by pyroclastic flows and lahars, and lava-dome growth has created two active summit craters (Main to the S and Second Crater to the N). Rock avalanches, observed incandescence, and satellite thermal anomalies at the summit confirmed continuing volcanic activity since the latest eruption started in November 2018 (BGVN 44:05). This report covers activity from December 2019 through May 2020. Activity is monitored by Indonesia's Pusat Vulkanologi dan Mitigasi Bencana Geologi (PVMBG, also known as CVGHM, or the Center of Volcanology and Geological Hazard Mitigation), and ash plumes are monitored by the Darwin VAAC (Volcanic Ash Advisory Center). Information is also available from MODIS thermal anomaly satellite data through both the University of Hawaii's MODVOLC system and the Italian MIROVA project.
Increased activity that included daily incandescent avalanche blocks traveling down the W and NW flanks lasted from mid-July 2019 (BGVN 44:12) through mid-January 2020 according to multiple sources. The MIROVA data showed increased number and intensity of thermal anomalies during this period, with a sharp drop during the second half of January (figure 40). The MODVOLC thermal alert data reported 29 alerts in December and ten alerts in January, ending on 14 January, with no further alerts through May 2020. During December and the first half of January incandescent blocks traveled 1,000-1,500 m down multiple drainages on the W and NW flanks (figure 41). After this, thermal anomalies were still present at the summit craters, but no additional activity down the flanks was identified in remote satellite data or direct daily observations from PVMBG.
A single VAAC report in early April noted a short-lived ash plume that drifted SW. Intermittent low-level activity continued through May 2020. Small SO2 plumes appeared in satellite data multiple times in December 2019 and January 2020; they decreased in size and frequency after that but were still intermittently recorded into May 2020 (figure 42).
PVMBG reported in their daily summaries that steam plumes rose 50-150 m above the Main Crater and 25-50 m above Second Crater on most days in December. The incandescent avalanche activity that began in mid-July 2019 also continued throughout December 2019 and January 2020 (figure 43). Incandescent blocks from the Main Crater descended river drainages (Kali) on the W and NW flanks throughout December. They were reported nearly every day in the Nanitu, Sense, and Pangi drainages, traveling 1,000-1,500 m. Incandescence from both craters was visible 10-25 m above the crater rim most nights.
A few blocks were noted traveling 800 m down Kali Beha Barat on 1 December. Incandescence above the Main crater reached 50-75 m during 4-6 December. During 4-7 December incandescent blocks appeared in Kali Sesepe, traveling 1,000-1,500 m down from the summit. They were also reported in Kali Batang and Beha Barat during 4-14 December, usually moving 800-1,000 m downslope. Between 5 and 14 December, gray and white plumes from Second Crater reached 300 m multiple times. During 12-15 December steam plumes rose 300-500 m above the Main crater. Activity decreased during 18-26 December but increased again during the last few days of the month. On 28 December, incandescent blocks were reported 1,500 m down Kali Pangi and Nanitu, and 1,750 m down Kali Sense.
Incandescent blocks were reported in Kali Sesepi during 4-6 January and in Kali Batang and Beha Barat during 4-8 and 12-15 January (figure 44); they often traveled 800-1,200 m downslope. Activity tapered off in those drainages and incandescent blocks were last reported in Kali Beha Barat on 15 January traveling 800 m from the summit. Incandescent blocks were also reported traveling usually 1,000-1,500 m down the Nanitu, Sense, and Pangi drainages during 4-19 January. Blocks continued to occasionally descend up to 1,000 m down Kali Nanitu through 24 January. Pulses of activity occurred at the summit of Second Crater a few times in January. Steam plumes rose 25-50 m during 8-9 January and again during 16-31 January, with plumes rising 300-400 m on 20, 29, and 31 January. Incandescence was noted 10-25 m above the summit of Second Crater during 27-30 January.
Activity diminished significantly after mid-January 2020. Steam plumes at the Main Crater rose 50-100 m on the few days where the summit was not obscured by fog during February. Faint incandescence occurred at the Main Crater on 7 February, and steam plumes rising 25-50 m from Second Crater that day were the only events reported there in February. During March, steam plumes persisted from the Main Crater, with heights of over 100 m during short periods from 8-16 March and 25-30 March. Weak incandescence was reported from the Main Crater only once, on 25 March. Very little activity occurred at Second Crater during March, with only steam plumes reported rising 25-300 m from the 22nd to the 28th (figure 45).
The Darwin VAAC reported a continuous ash emission on 4 April 2020 that rose to 2.1 km altitude and drifted SW for a few hours before dissipating. Incandescence visible 25 m above both craters on 13 April was the only April activity reported by PVMBG other than steam plumes from the Main Crater that rose 50-500 m on most days. Steam plumes of 50-100 m were reported from Second Crater during 11-13 April. Activity remained sporadic throughout May 2020. Steam plumes from the Main Crater rose 50-300 m each day. Satellite imagery identified steam plumes and incandescence from both summit craters on 3 May (figure 46). Faint incandescence was observed at the Main Crater on 12 and 27 May. Steam plumes rose 25-50 m from Second Crater on a few days; a 200-m-high plume was reported on 27 May. Bluish emissions were observed on the S and SW flanks on 28 May.
Geologic Background. Karangetang (Api Siau) volcano lies at the northern end of the island of Siau, about 125 km NNE of the NE-most point of Sulawesi. The stratovolcano contains five summit craters along a N-S line. It is one of Indonesia's most active volcanoes, with more than 40 eruptions recorded since 1675 and many additional small eruptions that were not documented (Neumann van Padang, 1951). Twentieth-century eruptions have included frequent explosive activity sometimes accompanied by pyroclastic flows and lahars. Lava dome growth has occurred in the summit craters; collapse of lava flow fronts have produced pyroclastic flows.
Information Contacts: Pusat Vulkanologi dan Mitigasi Bencana Geologi (PVMBG, also known as Indonesian Center for Volcanology and Geological Hazard Mitigation, CVGHM), Jalan Diponegoro 57, Bandung 40122, Indonesia (URL: http://www.vsi.esdm.go.id/); MIROVA (Middle InfraRed Observation of Volcanic Activity), a collaborative project between the Universities of Turin and Florence (Italy) supported by the Centre for Volcanic Risk of the Italian Civil Protection Department (URL: http://www.mirovaweb.it/); Hawai'i Institute of Geophysics and Planetology (HIGP) - MODVOLC Thermal Alerts System, School of Ocean and Earth Science and Technology (SOEST), Univ. of Hawai'i, 2525 Correa Road, Honolulu, HI 96822, USA (URL: http://modis.higp.hawaii.edu/); Sentinel Hub Playground (URL: https://www.sentinel-hub.com/explore/sentinel-playground); Global Sulfur Dioxide Monitoring Page, Atmospheric Chemistry and Dynamics Laboratory, NASA Goddard Space Flight Center (NASA/GSFC), 8800 Greenbelt Road, Goddard, Maryland, USA (URL: https://so2.gsfc.nasa.gov/); Darwin Volcanic Ash Advisory Centre (VAAC), Bureau of Meteorology, Northern Territory Regional Office, PO Box 40050, Casuarina, NT 0811, Australia (URL: http://www.bom.gov.au/info/vaac/); Øystein Lund Andersen (Twitter: @OysteinLAnderse, https://twitter.com/OysteinLAnderse, URL: http://www.oysteinlundandersen.com); Bobyson Lamanepa, Yogyakarta, Indonesia, (URL: https://twitter.com/BobyLamanepa/status/1214165637028728832).
Klyuchevskoy (Russia) — June 2020 Cite this Report
Klyuchevskoy
Russia
56.056°N, 160.642°E; summit elev. 4754 m
All times are local (unless otherwise noted)
Strombolian activity November 2019 through May 2020; lava flow down the SE flank in April
Klyuchevskoy is part of the Klyuchevskaya volcanic group in northern Kamchatka and is one of the most frequently active volcanoes of the region. Eruptions produce lava flows, ashfall, and lahars originating from summit and flank activity. This report summarizes activity during October 2019 through May 2020, and is based on reports by the Kamchatkan Volcanic Eruption Response Team (KVERT) and satellite data.
There were no activity reports from 1 to 22 October, but gas emissions were visible in satellite images. At 1020 on 24 October (2220 on 23 October UTC) KVERT noted that there was a small ash component in the ash plume from erosion of the conduit, with the plume reaching 130 km ENE. The Aviation Colour Code was raised from Green to Yellow, then to Orange the following day. An ash plume continued on the 25th to 5-7 km altitude and extending 15 km SE and 70 km SW and reached 30 km ESE on the 26th. Similar activity continued through to the end of the month.
Moderate gas emissions continued during 1-19 November, but the summit was obscured by clouds. Strong nighttime incandescence was visible at the crater during the 10-11 November and thermal anomalies were detected on 8 and 10-13 November. Explosions produced ash plumes up to 6 km altitude on the 20-21st and Strombolian activity was reported during 20-22 November. Degassing continued from 23 November through 12 December, and a thermal anomaly was visible on the days when the summit was not covered by clouds. An ash plume was reported moving to the NW on the 13th, and degassing with a thermal anomaly and intermittent Strombolian activity then resumed, continuing through to the end of December with an ash plume reported on the 30th.
Gas-and-steam plumes continued into January 2020 with incandescence noted when the summit was clear (figure 33). Strombolian activity was reported again starting on the 3rd. A weak ash plume produced on the 6th extended 55 km E, and on the 21st an ash plume reached 5-5.5 km altitude and extended 190 km NE (figure 34). Another ash plume the next day rose to the same altitude and extended 388 km NE. During 23-29 Strombolian activity continued, and Vulcanian activity produced ash plumes up to 5.5 altitude, extending to 282 km E on the 30th, and 145 km E on the 31st.
Strombolian activity continued throughout February with occasional explosions producing ash plumes up to 5.5 km altitude, as well as gas-and-steam plumes and a persistent thermal anomaly with incandescence visible at night. Starting in late February thermal anomalies were detected much more frequently, and with higher energy output compared to the previous year (figure 35). A lava fountain was reported on 1 March with the material falling back into the summit crater. Strombolian activity continued through early March. Lava fountaining was reported again on the 8th with ejecta landing in the crater and down the flanks (figure 36). A strong persistent gas-and-steam plume containing some ash continued along with Strombolian activity through 25 March (figure 37), with Vulcanian activity noted on the 20th and 25th. Strombolian and Vulcanian activity was reported through the end of March.
Activity was dominantly Strombolian during 1-5 April and included intermittent Vulcanian explosions from the 6th onwards, with ash plumes reaching 6 km altitude. On 18 April a lava flow began moving down the SE flank (figures 38). A report on the 26th reported explosions from lava-water interactions with avalanches from the active lava flow, which continued to move down the SE flank and into the Apakhonchich chute (figures 39 and 40). This continued throughout April and May with sustained Strombolian and intermittent Vulcanian activity at the summit (figures 41 and 42).
Geologic Background. Klyuchevskoy is the highest and most active volcano on the Kamchatka Peninsula. Since its origin about 6,000 years ago, this symmetrical, basaltic stratovolcano has produced frequent moderate-volume explosive and effusive eruptions without major periods of inactivity. It rises above a saddle NE of Kamen volcano and lies SE of the broad Ushkovsky massif. More than 100 flank eruptions have occurred during approximately the past 3,000 years, with most lateral craters and cones occurring along radial fissures between the unconfined NE-to-SE flanks of the conical volcano between 500 and 3,600 m elevation. Eruptions recorded since the late 17th century have resulted in frequent changes to the morphology of the 700-m-wide summit crater. These eruptions over the past 400 years have originated primarily from the summit crater, but have also included numerous major explosive and effusive eruptions from flank craters.
Information Contacts: Kamchatka Volcanic Eruptions Response Team (KVERT), Far Eastern Branch, Russian Academy of Sciences, 9 Piip Blvd., Petropavlovsk-Kamchatsky, 683006, Russia (URL: http://www.kscnet.ru/ivs/kvert/); MIROVA (Middle InfraRed Observation of Volcanic Activity), a collaborative project between the Universities of Turin and Florence (Italy) supported by the Centre for Volcanic Risk of the Italian Civil Protection Department (URL: http://www.mirovaweb.it/); Sentinel Hub Playground (URL: https://www.sentinel-hub.com/explore/sentinel-playground).
Krakatau (Indonesia) — June 2020 Cite this Report
Krakatau
Indonesia
6.1009°S, 105.4233°E; summit elev. 285 m
All times are local (unless otherwise noted)
Strombolian explosions, ash plumes, and crater incandescence during April 2020
Krakatau, located in the Sunda Strait between Indonesia’s Java and Sumatra Islands, experienced a major caldera collapse around 535 CE, forming a 7-km-wide caldera ringed by three islands. On 22 December 2018, a large explosion and flank collapse destroyed most of the 338-m-high island of Anak Krakatau (Child of Krakatau) and generated a deadly tsunami (BGVN 44:03). The near-sea level crater lake inside the remnant of Anak Krakatau was the site of numerous small steam and tephra explosions. A larger explosion in December 2019 produced the beginnings of a new cone above the surface of crater lake (BGVN 45:02). Recently, volcanism has been characterized by occasional Strombolian explosions, dense ash plumes, and crater incandescence. This report covers activity from February through May 2020 using information provided by the Indonesian Center for Volcanology and Geological Hazard Mitigation, also known as Pusat Vulkanologi dan Mitigasi Bencana Geologi (PVMBG), the Darwin Volcanic Ash Advisory Center (VAAC), and various satellite data.
Activity during February 2020 consisted of dominantly white gas-and-steam emissions rising 300 m above the crater, according to PVMBG. According to the Darwin VAAC, a ground observer reported an eruption on 7 and 8 February, but no volcanic ash was observed. During 10-11 February, a short-lived eruption was detected by seismograms which produced an ash plume up to 1 km above the crater drifting E. MAGMA Indonesia reported two eruptions on 18 March, both of which rose to 300 m above the crater. White gas-and-steam emissions were observed for the rest of the month and early April.
On 10 April PVMBG reported two eruptions, at 2158 and 2235, both of which produced dark ash plumes rising 2 km above the crater followed by Strombolian explosions ejecting incandescent material that landed on the crater floor (figures 108 and 109). The Darwin VAAC issued a notice at 0145 on 11 April reporting an ash plume to 14.3 km altitude drifting WNW, however this was noted with low confidence due to the possible mixing of clouds. During the same day, an intense thermal hotspot was detected in the HIMAWARI thermal satellite imagery and the NASA Global Sulfur Dioxide page showed a strong SO2 plume at 11.3 km altitude drifting W (figure 110). The CCTV Lava93 webcam showed new lava flows and lava fountaining from the 10-11 April eruptions. This activity was evident in the MIROVA (Middle InfraRed Observation of Volcanic Activity) graph of MODIS thermal anomaly data (figure 111).
Strombolian activity rising up to 500 m continued into 12 April and was accompanied by SO2 emissions that rose 3 km altitude, drifting NW according to a VAAC notice. PVMBG reported an eruption on 13 April at 2054 that resulted in incandescence as high as 25 m above the crater. Volcanic ash, accompanied by white gas-and-steam emissions, continued intermittently through 18 April, many of which were observed by the CCTV webcam. After 18 April only gas-and-steam plumes were reported, rising up to 100 m above the crater; Sentinel-2 satellite imagery showed faint thermal anomalies in the crater (figure 112). SO2 emissions continued intermittently throughout April, though at lower volumes and altitudes compared to the 11th. MODIS satellite data seen in MIROVA showed intermittent thermal anomalies through May.
Geologic Background. The renowned Krakatau (frequently mis-named as Krakatoa) volcano lies in the Sunda Strait between Java and Sumatra. Collapse of an older edifice, perhaps in 416 or 535 CE, formed a 7-km-wide caldera. Remnants of that volcano are preserved in Verlaten and Lang Islands; subsequently the Rakata, Danan, and Perbuwatan cones were formed, coalescing to create the pre-1883 Krakatau Island. Caldera collapse during the catastrophic 1883 eruption destroyed Danan and Perbuwatan, and left only a remnant of Rakata. This eruption caused more than 36,000 fatalities, most as a result of tsunamis that swept the adjacent coastlines of Sumatra and Java. Pyroclastic surges traveled 40 km across the Sunda Strait and reached the Sumatra coast. After a quiescence of less than a half century, the post-collapse cone of Anak Krakatau (Child of Krakatau) was constructed within the 1883 caldera at a point between the former Danan and Perbuwatan cones. Anak Krakatau has been the site of frequent eruptions since 1927.
Information Contacts: Pusat Vulkanologi dan Mitigasi Bencana Geologi (PVMBG, also known as Indonesian Center for Volcanology and Geological Hazard Mitigation, CVGHM), Jalan Diponegoro 57, Bandung 40122, Indonesia (URL: http://www.vsi.esdm.go.id/); MAGMA Indonesia, Kementerian Energi dan Sumber Daya Mineral (URL: https://magma.vsi.esdm.go.id/); MIROVA (Middle InfraRed Observation of Volcanic Activity), a collaborative project between the Universities of Turin and Florence (Italy) supported by the Centre for Volcanic Risk of the Italian Civil Protection Department (URL: http://www.mirovaweb.it/); Global Sulfur Dioxide Monitoring Page, Atmospheric Chemistry and Dynamics Laboratory, NASA Goddard Space Flight Center (NASA/GSFC), 8800 Greenbelt Road, Goddard, Maryland, USA (URL: https://so2.gsfc.nasa.gov/); Sentinel Hub Playground (URL: https://www.sentinel-hub.com/explore/sentinel-playground).
Masaya
Nicaragua
11.9844°N, 86.1688°W; summit elev. 594 m
All times are local (unless otherwise noted)
Lava lake level drops but remains active through May 2020; weak gas plumes
Masaya, which is about 20 km NW of the Nicaragua’s capital of Managua, is one of the most active volcanoes in that country and has a caldera that contains a number of craters (BGVN 43:11). The Santiago crater is the one most currently active and it contains a small lava lake that emits weak gas plumes (figure 85). This report summarizes activity during February through May 2020 and is based on Instituto Nicaragüense de Estudios Territoriales (INETER) monthly reports and satellite data. During the reporting period, the volcano was relatively calm, with only weak gas plumes.
According to INETER, thermal images of the lava lake and temperature data in the fumaroles were taken using an Omega infrared gun and a forward-looking infrared (FLIR) SC620 thermal camera. The temperatures above the lava lake have decreased since November 2019, when the temperature was 287°C, dropping to 96°C when measured on 14 May 2020. INETER attributed this decrease to subsidence in the level of the lava lake by 5 m which obstructed part of the lake and concentrated the gas emissions in the weak plume. Convection continued in the lava lake, which in May had decreased to a diameter of 3 m. Many landslides had occurred in the E, NE, and S walls of the crater rim due to rock fracturing caused by the high heat and acidity of the emissions.
During the reporting period, the MIROVA (Middle InfraRed Observation of Volcanic Activity) volcano hotspot detection system recorded numerous thermal anomalies from the lava lake based on MODIS data (figure 86). Infrared satellite images from Sentinel-2 regularly showed a strong signature from the lava lake through 18 May, after which the volcano was covered by clouds.
Measurements of sulfur dioxide (SO2) made by INETER in the section of the Ticuantepe - La Concepción highway (just W of the volcano) with a mobile DOAS system varied between a low of just over 1,000 metric tons/day in mid-November 2019 to a high of almost 2,500 tons/day in late May. Temperatures of fumaroles in the Cerro El Comalito area, just ENE of Santiago crater, ranged from 58 to 76°C during February-May 2020, with most values in the 69-72°C range.
Geologic Background. Masaya volcano in Nicaragua has erupted frequently since the time of the Spanish Conquistadors, when an active lava lake prompted attempts to extract the volcano's molten "gold" until it was found to be basalt rock upon cooling. It lies within the massive Pleistocene Las Sierras caldera and is itself a broad, 6 x 11 km basaltic caldera with steep-sided walls up to 300 m high. The caldera is filled on its NW end by more than a dozen vents that erupted along a circular, 4-km-diameter fracture system. The Nindirí and Masaya cones, the source of observed eruptions, were constructed at the southern end of the fracture system and contain multiple summit craters, including the currently active Santiago crater. A major basaltic Plinian tephra erupted from Masaya about 6,500 years ago. Recent lava flows cover much of the caldera floor and there is a lake at the far eastern end. A lava flow from the 1670 eruption overtopped the north caldera rim. Periods of long-term vigorous gas emission at roughly quarter-century intervals have caused health hazards and crop damage.
Information Contacts: Instituto Nicaragüense de Estudios Territoriales (INETER), Apartado Postal 2110, Managua, Nicaragua (URL: http://www.ineter.gob.ni/); MIROVA (Middle InfraRed Observation of Volcanic Activity), a collaborative project between the Universities of Turin and Florence (Italy) supported by the Centre for Volcanic Risk of the Italian Civil Protection Department (URL: http://www.mirovaweb.it/); Sentinel Hub Playground (URL: https://www.sentinel-hub.com/explore/sentinel-playground).
Nyamulagira (DR Congo) — June 2020 Cite this Report
Nyamulagira
DR Congo
1.408°S, 29.2°E; summit elev. 3058 m
All times are local (unless otherwise noted)
Intermittent thermal anomalies within the summit crater during December 2019-May 2020
Nyamuragira (also known as Nyamulagira) is located in the Virunga Volcanic Province (VVP) in the Democratic Republic of the Congo and consists of a lava lake that reappeared in the summit crater in mid-April 2018. Volcanism has been characterized by lava emissions, thermal anomalies, seismicity, and gas-and-steam emissions. This report summarizes activity during December 2019 through May 2020 using information from monthly reports by the Observatoire Volcanologique de Goma (OVG) and satellite data.
According to OVG, intermittent eruptive activity was detected in the lava lake of the central crater during December 2019 and January-April 2020, which also resulted in few seismic events. MIROVA (Middle InfraRed Observation of Volcanic Activity) analysis of MODIS satellite data shows thermal anomalies within the summit crater that varied in both frequency and power between August 2019 and mid-March 2020, but very few were recorded afterward through late May (figure 81). Thermal hotspots identified by MODVOLC from 15 December 2019 through March 2020 were mainly located in the active central crater, with only three hotspots just outside the SW crater rim (figure 82). Sentinel-2 thermal satellite imagery also showed activity within the summit crater during January-May 2020, but by mid-March the thermal anomaly had visibly decreased in power (figure 83).
Geologic Background. Africa's most active volcano, Nyamulagira (also known as Nyamuragira), is a massive high-potassium basaltic shield about 25 km N of Lake Kivu and 13 km NNW of the steep-sided Nyiragongo volcano. The summit is truncated by a small 2 x 2.3 km caldera that has walls up to about 100 m high. Documented eruptions have occurred within the summit caldera, as well as from the numerous flank fissures and cinder cones. A lava lake in the summit crater, active since at least 1921, drained in 1938, at the time of a major flank eruption. Recent lava flows extend down the flanks more than 30 km from the summit as far as Lake Kivu; extensive lava flows from this volcano have covered 1,500 km2 of the western branch of the East African Rift.
Information Contacts: Information contacts:
Observatoire Volcanologique de Goma (OVG), Departement de Geophysique, Centre de Recherche en Sciences Naturelles, Lwiro, D.S. Bukavu, DR Congo;
MIROVA (Middle InfraRed Observation of Volcanic Activity), a collaborative project between the Universities of Turin and Florence (Italy) supported by the Centre for Volcanic Risk of the Italian Civil Protection Department (URL: http://www.mirovaweb.it/);
Hawai'i Institute of Geophysics and Planetology (HIGP) - MODVOLC Thermal Alerts System, School of Ocean and Earth Science and Technology (SOEST), Univ. of Hawai'i, 2525 Correa Road, Honolulu, HI 96822, USA (URL: http://modis.higp.hawaii.edu/);
Sentinel Hub Playground (URL: https://www.sentinel-hub.com/exp.
Nyiragongo (DR Congo) — June 2020 Cite this Report
Nyiragongo
DR Congo
1.52°S, 29.25°E; summit elev. 3470 m
All times are local (unless otherwise noted)
Activity in the lava lake and small eruptive cone persists during December 2019-May 2020
Nyiragongo is located in the Virunga Volcanic Province (VVP) in the Democratic Republic of the Congo, part of the western branch of the East African Rift System and contains a 1.2 km-wide summit crater with a lava lake that has been active since at least 1971. Volcanism has been characterized by strong and frequent thermal anomalies, incandescence, gas-and-steam emissions, and seismicity. This report summarizes activity during December 2019 through May 2020 using information from monthly reports by the Observatoire Volcanologique de Goma (OVG) and satellite data.
In the December 2019 monthly report, OVG stated that the level of the lava lake had increased. This level of the lava lake was maintained for the duration of the reporting period, according to later OVG monthly reports. Seismicity increased starting in November 2019 and was detected in the NE part of the crater, but it decreased by mid-April 2020. SO2 emissions increased in January 2020 to roughly 7,000 tons/day but decreased again near the end of the month. OVG reported that SO2 emissions rose again in February to roughly 8,500 tons/day before declining to about 6,000 tons/day. Unlike in the previous report (BGVN 44:12), incandescence was visible during the day in the active lava lake and activity at the small eruptive cone within the 1.2-km-wide summit crater has since increased, consisting of incandescence and some lava fountaining (figure 72). A field survey was conducted on 3-4 March where an OVG team observed active lava fountains and ejecta that produced Pele’s hair from the small eruptive cone (figure 73). During this survey, OVG reported that the level of the lava lake had reached the second terrace, which was formed on 17 January 2002 and represents remnants of the lava lake at different eruption stages. There, the open surface lava lake was observed; gas-and-steam emissions accompanied both the active lava lake and the small eruptive cone (figures 72 and 73).
MIROVA (Middle InfraRed Observation of Volcanic Activity) analysis of MODIS satellite data continued to show frequent strong thermal anomalies within 5 km of the summit crater through May 2020 (figure 74). Similarly, the MODVOLC algorithm reported multiple thermal hotspots almost daily within the summit crater between December 2019 and May 2020. These thermal signatures were also observed in Sentinel-2 thermal satellite imagery within the summit crater (figure 75).
Geologic Background. The Nyiragongo stratovolcano contained a lava lake in its deep summit crater that was active for half a century before draining catastrophically through its outer flanks in 1977. The steep slopes contrast to the low profile of its neighboring shield volcano, Nyamuragira. Benches in the steep-walled, 1.2-km-wide summit crater mark levels of former lava lakes, which have been observed since the late-19th century. Two older stratovolcanoes, Baruta and Shaheru, are partially overlapped by Nyiragongo on the north and south. About 100 cones are located primarily along radial fissures south of Shaheru, east of the summit, and along a NE-SW zone extending as far as Lake Kivu. Many cones are buried by voluminous lava flows that extend long distances down the flanks, which is characterized by the eruption of foiditic rocks. The extremely fluid 1977 lava flows caused many fatalities, as did lava flows that inundated portions of the major city of Goma in January 2002.
Information Contacts: Observatoire Volcanologique de Goma (OVG), Departement de Geophysique, Centre de Recherche en Sciences Naturelles, Lwiro, D.S. Bukavu, DR Congo; MIROVA (Middle InfraRed Observation of Volcanic Activity), a collaborative project between the Universities of Turin and Florence (Italy) supported by the Centre for Volcanic Risk of the Italian Civil Protection Department (URL: http://www.mirovaweb.it/); Hawai'i Institute of Geophysics and Planetology (HIGP) - MODVOLC Thermal Alerts System, School of Ocean and Earth Science and Technology (SOEST), Univ. of Hawai'i, 2525 Correa Road, Honolulu, HI 96822, USA (URL: http://modis.higp.hawaii.edu/); Sentinel Hub Playground (URL: https://www.sentinel-hub.com/explore/sentinel-playground).
Sabancaya
Peru
15.787°S, 71.857°W; summit elev. 5960 m
All times are local (unless otherwise noted)
Daily explosions with ash emissions, large SO2 flux, ongoing thermal anomalies, December 2019-May 2020
Although tephrochronology has dated activity at Sabancaya back several thousand years, renewed activity that began in 1986 was the first recorded in over 200 years. Intermittent activity since then has produced significant ashfall deposits, seismic unrest, and fumarolic emissions. A new period of explosive activity that began in November 2016 has been characterized by pulses of ash emissions with some plumes exceeding 10 km altitude, thermal anomalies, and significant SO2 plumes. Ash emissions and high levels of SO2 continued each week during December 2019-May 2020. The Observatorio Vulcanologico INGEMMET (OVI) reports weekly on numbers of daily explosions, ash plume heights and directions of drift, seismicity, and other activity. The Buenos Aires Volcanic Ash Advisory Center (VAAC) issued three or four daily reports of ongoing ash emissions at Sabancaya throughout the period.
The dome inside the summit crater continued to grow throughout this period, along with nearly constant ash, gas, and steam emissions; the average number of daily explosions ranged from 4 to 29. Ash and gas plume heights rose 1,800-3,800 m above the summit crater, and multiple communities around the volcano reported ashfall every month (table 6). Sulfur dioxide emissions were notably high and recorded daily with the TROPOMI satellite instrument (figure 75). Thermal activity declined during December 2019 from levels earlier in the year but remained steady and increased in both frequency and intensity during April and May 2020 (figure 76). Infrared satellite images indicated that the primary heat source throughout the period was from the dome inside the summit crater (figure 77).
Table 6. Persistent activity at Sabancaya during December 2019-May 2020 included multiple daily explosions with ash plumes that rose several kilometers above the summit and drifted in many directions; this resulted in ashfall in communities within 30 km of the volcano. Satellite instruments recorded SO2 emissions daily. Data courtesy of OVI-INGEMMET.
| Month |
Avg. Daily Explosions by week |
Max plume Heights (m above crater) |
Plume drift (km) and direction |
Communities reporting ashfall |
Min Days with SO2 over 2 DU |
| Dec 2019 |
16, 13, 5, 5 |
2,600-3,800 |
20-30 NW |
Pinchollo, Madrigal, Lari, Maca, Achoma, Coporaque, Yanque, Chivay, Huambo, Cabanaconde |
27 |
| Jan 2020 |
10, 8, 11, 14, 4 |
1,800-3,400 |
30 km W, NW, SE, S |
Chivay, Yanque, Achoma |
29 |
| Feb 2020 |
8, 11, 20, 19 |
2,000-2,200 |
30 km SE, E, NE, W |
Huambo |
29 |
| Mar 2020 |
14, 22, 29, 18 |
2,000-3,000 |
30 km NE, W, NW, SW |
Madrigal, Lari, Pinchollo |
30 |
| Apr 2020 |
12, 12, 16, 13, 8 |
2,000-3,000 |
30 km SE, NW, E, S |
Pinchollo, Madrigal, Lari, Maca, Ichupampa, Yanque, Chivay, Coporaque, Achoma |
27 |
| May 2020 |
15, 14, 6, 16 |
1,800-2,400 |
30 km SW, SE, E, NE, W |
Chivay, Achoma, Maca, Lari, Madrigal, Pinchollo |
27 |
The average number of daily explosions during December 2019 decreased from a high of 16 the first week of the month to a low of five during the last week. Six pyroclastic flows occurred on 10 December (figure 78). Tremors were associated with gas-and-ash emissions for most of the month. Ashfall was reported in Pinchollo, Madrigal, Lari, Maca, Achoma, Coporaque, Yanque, and Chivay during the first week of the month, and in Huambo and Cabanaconde during the second week (figure 79). Inflation of the volcano was measured throughout the month. SO2 flux was measured by OVI as ranging from 2,500 to 4,300 tons per day.
During January and February 2020 the number of daily explosions averaged 4-20. Ash plumes rose as high as 3.4 km above the summit (figure 80) and drifted up to 30 km in multiple directions. Ashfall was reported in Chivay, Yanque, and Achoma on 8 January, and in Huambo on 25 February. Sulfur dioxide flux ranged from a low of 1,200 t/d on 29 February to a high of 8,200 t/d on 28 January. Inflation of the edifice was measured during January; deformation changed to deflation in early February but then returned to inflation by the end of the month.
Explosions continued during March and April 2020, averaging 8-29 per day. Explosions appeared to come from multiple vents on 11 March (figure 81). Ash plumes rose 3 km above the summit during the first week of March and again the first week of April; they were lower during the other weeks. Ashfall was reported in Madrigal, Lari, and Pinchollo on 27 March and 5 April. On 17 April ashfall was reported in Maca, Ichupampa, Yanque, Chivay, Coporaque, and Achoma. Sulfur dioxide flux ranged from 1,900 t/d on 5 March to 10,700 t/d on 30 March. Inflation at depth continued throughout March and April with 10 ± 4 mm recorded between 21 and 26 April. Similar activity continued during May 2020; explosions averaged 6-16 per day (figure 82). Ashfall was reported on 6 May in Chivay, Achoma, Maca, Lari, Madrigal, and Pinchollo; heavy ashfall was reported in Achoma on 12 May. Additional ashfall was reported in Achoma, Maca, Madrigal, and Lari on 23 May.
Geologic Background. Sabancaya, located in the saddle NE of Ampato and SE of Hualca Hualca volcanoes, is the youngest of these volcanic centers and the only one to have erupted in historical time. The oldest of the three, Nevado Hualca Hualca, is of probable late-Pliocene to early Pleistocene age. The name Sabancaya (meaning "tongue of fire" in the Quechua language) first appeared in records in 1595 CE, suggesting activity prior to that date. Holocene activity has consisted of Plinian eruptions followed by emission of voluminous andesitic and dacitic lava flows, which form an extensive apron around the volcano on all sides but the south. Records of observed eruptions date back to 1750 CE.
Information Contacts: Observatorio Volcanologico del INGEMMET (Instituto Geológical Minero y Metalúrgico), Barrio Magisterial Nro. 2 B-16 Umacollo - Yanahuara Arequipa, Peru (URL: http://ovi.ingemmet.gob.pe); Buenos Aires Volcanic Ash Advisory Center (VAAC), Servicio Meteorológico Nacional-Fuerza Aérea Argentina, 25 de mayo 658, Buenos Aires, Argentina (URL: http://www.smn.gov.ar/vaac/buenosaires/inicio.php); Global Sulfur Dioxide Monitoring Page, Atmospheric Chemistry and Dynamics Laboratory, NASA Goddard Space Flight Center (NASA/GSFC), 8800 Greenbelt Road, Goddard, Maryland, USA (URL: https://so2.gsfc.nasa.gov/); MIROVA (Middle InfraRed Observation of Volcanic Activity), a collaborative project between the Universities of Turin and Florence (Italy) supported by the Centre for Volcanic Risk of the Italian Civil Protection Department (URL: http://www.mirovaweb.it/); Sentinel Hub Playground (URL: https://www.sentinel-hub.com/explore/sentinel-playground).
Shishaldin (United States) — June 2020 Cite this Report
Shishaldin
United States
54.756°N, 163.97°W; summit elev. 2857 m
All times are local (unless otherwise noted)
Intermittent thermal activity and a possible new cone at the summit crater during February-May 2020
Shishaldin is located near the center of Unimak Island in Alaska, with the current eruption phase beginning in July 2019 and characterized by ash plumes, lava flows, lava fountaining, pyroclastic flows, and lahars. More recently, in late 2019 and into January 2020, activity consisted of multiple lava flows, pyroclastic flows, lahars, and ashfall events (BGVN 45:02). This report summarizes activity from February through May 2020, including gas-and-steam emissions, brief thermal activity in mid-March, and a possible new cone within the summit crater. The primary source of information comes from the Alaska Volcano Observatory (AVO) reports and various satellite data.
Volcanism during February 2020 was relatively low, consisting of weakly to moderately elevated surface temperatures during 1-4 February and occasional small gas-and-steam plumes (figure 37). By 6 February both seismicity and surface temperatures had decreased. Seismicity and surface temperatures increased slightly again on 8 March and remained elevated through the rest of the reporting period. Intermittent gas-and-steam emissions were also visible from mid-March (figure 38) through May. Minor ash deposits visible on the upper SE flank may have been due to ash resuspension or a small collapse event at the summit, according to AVO.
On 14 March, lava and a possible new cone were visible in the summit crater using satellite imagery, accompanied by small explosion signals. Strong thermal signatures due to the lava were also seen in Sentinel-2 satellite data and continued strongly through the month (figure 39). The lava reported by AVO in the summit crater was also reflected in satellite-based MODIS thermal anomalies recorded by the MIROVA system (figure 40). Seismic and infrasound data identified small explosions signals within the summit crater during 14-19 March.
AVO released a Volcano Observatory Notice for Aviation (VONA) stating that seismicity had decreased by 16 April and that satellite data no longer showed lava or additional changes in the crater since the start of April. Sentinel-2 thermal satellite imagery continued to show a weak hotspot in the crater summit through May (figure 41), which was also detected by the MIROVA system on two days. A daily report on 6 May reported a visible ash deposit extending a short distance SE from the summit, which had likely been present since 29 April. AVO noted that the timing of the deposit corresponds to an increase in the summit crater diameter and depth, further supporting a possible small collapse. Small gas-and-steam emissions continued intermittently and were accompanied by weak tremors and occasional low-frequency earthquakes through May (figure 42). Minor amounts of sulfur dioxide were detected in the gas-and-steam emissions during 20 and 29 April, and 2, 16, and 28 May.
Geologic Background. The symmetrical glacier-covered Shishaldin in the Aleutian Islands is the westernmost of three large stratovolcanoes in the eastern half of Unimak Island. The Aleuts named the volcano Sisquk, meaning "mountain which points the way when I am lost." Constructed atop an older glacially dissected edifice, it is largely basaltic in composition. Remnants of an older edifice are exposed on the W and NE sides at 1,500-1,800 m elevation. There are over two dozen pyroclastic cones on its NW flank, which is covered by massive aa lava flows. Frequent explosive activity, primarily consisting of Strombolian ash eruptions from the small summit crater, but sometimes producing lava flows, has been recorded since the 18th century. A steam plume often rises from the summit crater.
Information Contacts: Alaska Volcano Observatory (AVO), a cooperative program of a) U.S. Geological Survey, 4200 University Drive, Anchorage, AK 99508-4667 USA (URL: https://avo.alaska.edu/), b) Geophysical Institute, University of Alaska, PO Box 757320, Fairbanks, AK 99775-7320, USA, and c) Alaska Division of Geological & Geophysical Surveys, 794 University Ave., Suite 200, Fairbanks, AK 99709, USA (URL: http://dggs.alaska.gov/); MIROVA (Middle InfraRed Observation of Volcanic Activity), a collaborative project between the Universities of Turin and Florence (Italy) supported by the Centre for Volcanic Risk of the Italian Civil Protection Department (URL: http://www.mirovaweb.it/); Sentinel Hub Playground (URL: https://www.sentinel-hub.com/explore/sentinel-playground).
Taal
Philippines
14.0106°N, 120.9975°E; summit elev. 311 m
All times are local (unless otherwise noted)
Eruption on 12 January with explosions through 22 January; steam plumes continuing into March
Taal volcano is in a caldera system located in southern Luzon island and is one of the most active volcanoes in the Philippines. It has produced around 35 recorded eruptions since 3,580 BCE, ranging from VEI 1 to 6, with the majority of eruptions being a VEI 2. The caldera contains a lake with an island that also contains a lake within the Main Crater (figure 12). Prior to 2020 the most recent eruption was in 1977, on the south flank near Mt. Tambaro. The United Nations Office for the Coordination of Humanitarian Affairs in the Philippines reports that over 450,000 people live within 40 km of the caldera (figure 13). This report covers activity during January through February 2020 including the 12 to 22 January eruption, and is based on reports by Philippine Institute of Volcanology and Seismology (PHIVOLCS), satellite data, geophysical data, and media reports.
The hazard status at Taal was raised to Alert Level 1 (abnormal, on a scale of 0-5) on 28 March 2019. From that date through to 1 December there were 4,857 earthquakes registered, with some felt nearby. Inflation was detected during 21-29 November and an increase in CO2 emission within the Main Crater was observed. Seismicity increased beginning at 1100 on 12 January. At 1300 there were phreatic (steam) explosions from several points inside Main Crater and the Alert Level was raised to 2 (increasing unrest). Booming sounds were heard in Talisay, Batangas, at 1400; by 1402 the plume had reached 1 km above the crater, after which the Alert Level was raised to 3 (magmatic unrest).
Phreatic eruption on 12 January 2020. A seismic swarm began at 1100 on 12 January 2020 followed by a phreatic eruption at 1300. The initial activity consisted of steaming from at least five vents in Main Crater and phreatic explosions that generated 100-m-high plumes. PHIVOLCS raised the Alert Level to 2. The Earth Observatory of Singapore reported that the International Data Center (IDC) for the Comprehensive test Ban Treaty (CTBT) in Vienna noted initial infrasound detections at 1450 that day.
Booming sounds were heard at 1400 in Talisay, Batangas (4 km NNE from the Main Crater), and at 1404 volcanic tremor and earthquakes felt locally were accompanied by an eruption plume that rose 1 km; ash fell to the SSW. The Alert Level was raised to 3 and the evacuation of high-risk barangays was recommended. Activity again intensified around 1730, prompting PHIVOLCS to raise the Alert Level to 4 and recommend a total evacuation of the island and high-risk areas within a 14-km radius. The eruption plume of steam, gas, and tephra significantly intensified, rising to 10-15 km altitude and producing frequent lightning (figures 14 and 15). Wet ash fell as far away as Quezon City (75 km N). According to news articles schools and government offices were ordered to close and the Ninoy Aquino International Airport (56 km N) in Manila suspended flights. About 6,000 people had been evacuated. Residents described heavy ashfall, low visibility, and fallen trees.
In a statement issued at 0320 on 13 January, PHIVOLCS noted that ashfall had been reported across a broad area to the north in Tanauan (18 km NE), Batangas; Escala (11 km NW), Tagaytay; Sta. Rosa (32 km NNW), Laguna; Dasmariñas (32 km N), Bacoor (44 km N), and Silang (22 km N), Cavite; Malolos (93 km N), San Jose Del Monte (87 km N), and Meycauayan (80 km N), Bulacan; Antipolo (68 km NNE), Rizal; Muntinlupa (43 km N), Las Piñas (47 km N), Marikina (70 km NNE), Parañaque (51 km N), Pasig (62 km NNE), Quezon City, Mandaluyong (62 km N), San Juan (64 km N), Manila; Makati City (59 km N) and Taguig City (55 km N). Lapilli (2-64 mm in diameter) fell in Tanauan and Talisay; Tagaytay City (12 km N); Nuvali (25 km NNE) and Sta (figure 16). Rosa, Laguna. Felt earthquakes (Intensities II-V) continued to be recorded in local areas.
Magmatic eruption on 13 January 2020. A magmatic eruption began during 0249-0428 on 13 January, characterized by weak lava fountaining accompanied by thunder and flashes of lightning. Activity briefly waned then resumed with sporadic weak fountaining and explosions that generated 2-km-high, dark gray, steam-laden ash plumes (figure 17). New lateral vents opened on the N flank, producing 500-m-tall lava fountains. Heavy ashfall impacted areas to the SW, including in Cuenca (15 km SSW), Lemery (16 km SW), Talisay, and Taal (15 km SSW), Batangas (figure 18).
News articles noted that more than 300 domestic and 230 international flights were cancelled as the Manila Ninoy Aquino International Airport was closed during 12-13 January. Some roads from Talisay to Lemery and Agoncillo were impassible and electricity and water services were intermittent. Ashfall in several provinces caused power outages. Authorities continued to evacuate high-risk areas, and by 13 January more than 24,500 people had moved to 75 shelters out of a total number of 460,000 people within 14 km.
A PHIVOLCS report for 0800 on the 13th through 0800 on 14 January noted that lava fountaining had continued, with steam-rich ash plumes reaching around 2 km above the volcano and dispersing ash SE and W of Main Crater. Volcanic lighting continued at the base of the plumes. Fissures on the N flank produced 500-m-tall lava fountains. Heavy ashfall continued in the Lemery, Talisay, Taal, and Cuenca, Batangas Municipalities. By 1300 on the 13th lava fountaining generated 800-m-tall, dark gray, steam-laden ash plumes that drifted SW. Sulfur dioxide emissions averaged 5,299 metric tons/day (t/d) on 13 January and dispersed NNE (figure 19).
Explosions and ash emission through 22 January 2020. At 0800 on 15 January PHIVOLCS stated that activity was generally weaker; dark gray, steam-laden ash plumes rose about 1 km and drifted SW. Satellite images showed that the Main Crater lake was gone and new craters had formed inside Main Crater and on the N side of Volcano Island.
PHIVOLCS reported that activity during 15-16 January was characterized by dark gray, steam-laden plumes that rose as high as 1 km above the vents in Main Crater and drifted S and SW. Sulfur dioxide emissions were 4,186 t/d on 15 January. Eruptive events at 0617 and 0621 on 16 January generated short-lived, dark gray ash plumes that rose 500 and 800 m, respectively, and drifted SW. Weak steam plumes rose 800 m and drifted SW during 1100-1700, and nine weak explosions were recorded by the seismic network.
Steady steam emissions were visible during 17-21 January. Infrequent weak explosions generated ash plumes that rose as high as 1 km and drifted SW. Sulfur dioxide emissions fluctuated and were as high as 4,353 t/d on 20 January and as low as 344 t/d on 21 January. PHIVOLCS reported that white steam-laden plumes rose as high as 800 m above main vent during 22-28 January and drifted SW and NE; ash emissions ceased around 0500 on 22 January. Remobilized ash drifted SW on 22 January due to strong low winds, affecting the towns of Lemery (16 km SW) and Agoncillo, and rose as high as 5.8 km altitude as reported by pilots. Sulfur dioxide emissions were low at 140 t/d.
Steam plumes through mid-April 2020. The Alert Level was lowered to 3 on 26 January and PHIVOLCS recommended no entry onto Volcano Island and Taal Lake, nor into towns on the western side of the island within a 7-km radius. PHIVOLCS reported that whitish steam plumes rose as high as 800 m during 29 January-4 February and drifted SW (figure 20). The observed steam plumes rose as high as 300 m during 5-11 February and drifted SW.
Sulfur dioxide emissions averaged around 250 t/d during 22-26 January; emissions were 87 t/d on 27 January and below detectable limits the next day. During 29 January-4 February sulfur dioxide emissions ranged to a high of 231 t/d (on 3 February). The following week sulfur dioxide emissions ranged from values below detectable limits to a high of 116 t/d (on 8 February).
On 14 February PHIVOLCS lowered the Alert Level to 2, noting a decline in the number of volcanic earthquakes, stabilizing ground deformation of the caldera and Volcano Island, and diffuse steam-and-gas emission that continued to rise no higher than 300 m above the main vent during the past three weeks. During 14-18 February sulfur dioxide emissions ranged from values below detectable limits to a high of 58 tonnes per day (on 16 February). Sulfur dioxide emissions were below detectable limits during 19-20 February. During 26 February-2 March steam plumes rose 50-300 m above the vent and drifted SW and NE. PHIVOLCS reported that during 4-10 March weak steam plumes rose 50-100 m and drifted SW and NE; moderate steam plumes rose 300-500 m and drifted SW during 8-9 March. During 11-17 March weak steam plumes again rose only 50-100 m and drifted SW and NE.
PHIVOLCS lowered the Alert Level to 1 on 19 March and recommended no entry onto Volcano Island, the area defined as the Permanent Danger Zone. During 8-9 April steam plumes rose 100-300 m and drifted SW. As of 1-2 May 2020 only weak steaming and fumarolic activity from fissure vents along the Daang Kastila trail was observed.
Evacuations. According to the Disaster Response Operations Monitoring and Information Center (DROMIC) there were a total of 53,832 people dispersed to 244 evacuation centers by 1800 on 15 January. By 21 January there were 148,987 people in 493 evacuation. The number of residents in evacuation centers dropped over the next week to 125,178 people in 497 locations on 28 January. However, many residents remained displaced as of 3 February, with DROMIC reporting 23,915 people in 152 evacuation centers, but an additional 224,188 people staying at other locations.
By 10 February there were 17,088 people in 110 evacuation centers, and an additional 211,729 staying at other locations. According to the DROMIC there were a total of 5,321 people in 21 evacuation centers, and an additional 195,987 people were staying at other locations as of 19 February.
The number of displaced residents continued to drop, and by 3 March there were 4,314 people in 12 evacuation centers, and an additional 132,931 people at other locations. As of 11 March there were still 4,131 people in 11 evacuation centers, but only 17,563 staying at other locations.
Deformation and ground cracks. New ground cracks were observed on 13 January in Sinisian (18 km SW), Mahabang Dahilig (14 km SW), Dayapan (15 km SW), Palanas (17 km SW), Sangalang (17 km SW), and Poblacion (19 km SW) Lemery; Pansipit (11 km SW), Agoncillo; Poblacion 1, Poblacion 2, Poblacion 3, Poblacion 5 (all around 17 km SW), Talisay, and Poblacion (11 km SW), San Nicolas (figure 21). A fissure opened across the road connecting Agoncillo to Laurel, Batangas. New ground cracking was reported the next day in Sambal Ibaba (17 km SW), and portions of the Pansipit River (SW) had dried up.
Dropping water levels of Taal Lake were first observed in some areas on 16 January but reported to be lake-wide the next day. The known ground cracks in the barangays of Lemery, Agoncillo, Talisay, and San Nicolas in Batangas Province widened a few centimeters by 17 January, and a new steaming fissure was identified on the N flank of the island.
GPS data had recorded a sudden widening of the caldera by ~1 m, uplift of the NW sector by ~20 cm, and subsidence of the SW part of Volcano Island by ~1 m just after the main eruption phase. The rate of deformation was smaller during 15-22 January, and generally corroborated by field observations; Taal Lake had receded about 30 cm by 25 January but about 2.5 m of the change (due to uplift) was observed around the SW portion of the lake, near the Pansipit River Valley where ground cracking had been reported.
Weak steaming (plumes 10-20 m high) from ground cracks was visible during 5-11 February along the Daang Kastila trail which connects the N part of Volcano Island to the N part of the main crater. PHIVOLCS reported that during 19-24 February steam plumes rose 50-100 m above the vent and drifted SW. Weak steaming (plumes up to 20 m high) from ground cracks was visible during 8-14 April along the Daang Kastila trail which connects the N part of Volcano Island to the N part of the main crater.
Seismicity. Between 1300 on 12 January and 0800 on 21 January the Philippine Seismic Network (PSN) had recorded a total of 718 volcanic earthquakes; 176 of those had magnitudes ranging from 1.2-4.1 and were felt with Intensities of I-V. During 20-21 January there were five volcanic earthquakes with magnitudes of 1.6-2.5; the Taal Volcano network (which can detect smaller events not detectable by the PSN) recorded 448 volcanic earthquakes, including 17 low-frequency events. PHIVOLCS stated that by 21 January hybrid earthquakes had ceased and both the number and magnitude of low-frequency events had diminished.
Geologic Background. Taal is one of the most active volcanoes in the Philippines and has produced some powerful eruptions. The 15 x 20 km Talisay (Taal) caldera is largely filled by Lake Taal, whose 267 km2 surface lies only 3 m above sea level. The maximum depth of the lake is 160 m, with several submerged eruptive centers. The 5-km-wide Volcano Island in north-central Lake Taal is the location of all observed eruptions. The island is composed of coalescing small stratovolcanoes, tuff rings, and scoria cones. Powerful pyroclastic flows and surges have caused many fatalities.
Information Contacts: Philippine Institute of Volcanology and Seismology (PHIVOLCS), Department of Science and Technology, University of the Philippines Campus, Diliman, Quezon City, Philippines (URL: http://www.phivolcs.dost.gov.ph/); Disaster Response Operations Monitoring and Information Center (DROMIC) (URL: https://dromic.dswd.gov.ph/); United Nations Office for the Coordination of Humanitarian Affairs, Philippines (URL: https://www.unocha.org/philippines); James Reynolds, Earth Uncut TV (Twitter: @EarthUncutTV, URL: https://www.earthuncut.tv/, YouTube: https://www.youtube.com/user/TyphoonHunter); Chris Vagasky, Vaisala Inc., Louisville, Colorado, USA (URL: https://www.vaisala.com/en?type=1, Twitter: @COweatherman, URL: https://twitter.com/COweatherman); Earth Observatory of Singapore, Nanyang Technological University, 50 Nanyang Avenue, Singapore (URL: https://www.earthobservatory.sg/); Global Sulfur Dioxide Monitoring Page, Atmospheric Chemistry and Dynamics Laboratory, NASA Goddard Space Flight Center (NASA/GSFC), 8800 Greenbelt Road, Goddard, Maryland, USA (URL: https://so2.gsfc.nasa.gov/); Relief Web, Flash Update No. 1 - Philippines: Taal Volcano eruption (As of 13 January 2020, 2 p.m. local time) (URL: https://reliefweb.int/report/philippines/flash-update-no-1-philippines-taal-volcano-eruption-13-january-2020-2-pm-local); Bloomberg, Philippines Braces for Hazardous Volcano Eruption (URL: https://www.bloomberg.com/news/articles/2020-01-12/philippines-raises-alert-level-in-taal-as-volcano-spews-ash); National Public Radio (NPR), Volcanic Eruption In Philippines Causes Thousands To Flee (URL: npr.org/2020/01/13/795815351/volcanic-eruption-in-philippines-causes-thousands-to-flee); Reuters (http://www.reuters.com/); Agence France-Presse (URL: http://www.afp.com/); Pacific Press (URL: http://www.pacificpress.com/); Shutterstock (URL: https://www.shutterstock.com/); Getty Images (URL: http://www.gettyimages.com/); Google Earth (URL: https://www.google.com/earth/).