
Steam emission and local seismicity continue
Geologists (Gerardo Sánchez Rubio, UNAM; Rudy Machorro Sagastume, Univ of Guanajuato; Aroldo López Perdomo, CUNOR, Guatemala; Napoleón Rodríguez and Víctor Danilo Valdez, INTECAP, Guatemala; and Juan Sánchez Márquez, México) visited Tacaná on 27-28 January. A flank steam plume continued to be emitted. Residents of Tacaná and Sibinal, the nearest villages in Guatemala, reported infrequent to occasional seismicity.
Information Contacts: Gerardo Sánchez Rubio, Estación Regional del Centro, Instituto de Geología, UNAM, Guanajuato, México.
The Global Volcanism Program has no Weekly Reports available for Tacaná.
Reports are organized chronologically and indexed below by Month/Year (Publication Volume:Number), and include a one-line summary. Click on the index link or scroll down to read the reports.
Two months of increased seismicity
A series of shallow earthquakes centered within 20 km of Tacaná began 15-16 December and was continuing in early February. On 19 December, a magnitude 5 earthquake centered near Ixchiguan at 15.18°N, 91.99°W (about 15 km ENE of the volcano) caused minor damage to 60 adobe houses and a school built of reinforced concrete. This event was followed by a series of aftershocks that had ended by 30 January.
UNAM geologists from the UNAM visited the volcano in late January, finding no evidence of increased volcanic activity. A temperature of 9°C was measured at 20 cm depth in the summit lava dome. At Agua Caliente hot springs at the foot of the volcano, water temperatures were 50°C; temperature and water outflow rate have apparently remained unchanged for 50 years. A portable seismometer placed on the volcano's summit for 2 hours and at its base for 4 hours on 26 January recorded small earthquakes but no harmonic tremor.
On 3 February, another M 5 earthquake was recorded in the same area as the 19 December event. Moderate damage occurred to 500 adobe houses in the villages of Ixchiguan (18 km ENE of the summit of Tacaná), Calapte, Toacá (13 km NE of the summit), Sanajaba, Sibinal (7 km NE of the summit), Vega del Volcán, María Cecilia, and Toaman. Shocks of magnitudes 4.2, 3.0, and <3.0 followed. Some of the earthquakes had a NW-SE alignment in the Toacá-Ixchiguan area. Volcanic earthquakes were felt in Sibinal and rumbling was heard at the base of the volcano.
A joint INSIVUMEH/UNAM team recorded only volcanic earthquakes 3-7 February. However, [low-level] harmonic tremor began to appear on 8 February. [A signal that could be interpreted as] harmonic tremor strengthened the next day and seismicity was migrating around the volcano.
Information Contacts: S. de la Cruz-Reyna, UNAM, México D.F.; E. Sánchez, Carlos Martínez, and Edgar Quevec R., INSIVUMEH.
Local seismicity continues
The series of shallow earthquakes near Tacaná was continuing in early March. Many of the shocks were felt near the volcano. There were no apparent changes to fumaroles on and around the volcano. To supplement permanent seismometers 30 km SW and 80 km N of the volcano (near Tapachula and Comitán), Mexican geophysicists installed portable instruments about 27 km NW of the volcano (at Motozintla), W of the volcano (at El Aguila) and about 6 km S of the summit (at Unión Juárez).
The majority of felt events were subduction zone earthquakes centered under the coast of northernmost Guatemala. Other events originated in a fault system NE of the volcano, in Guatemala. A third type consisted of events under the volcano, characterized by sharp P arrivals and very long S-wave trains, that were strong enough to be felt and heard within 10 km of the volcano. Apparent volcanic tremor episodes with amplitudes just above noise levels were recorded 2-3 times a day. The rate of seismic energy release increased substantially 18-25 February, declined significantly after 25 February, then started to increase again on 3 March. On 3 March between 0400 and 1200, a bubble tiltmeter 6 km S of the summit (at 1,800 m elevation) indicated a sharp deformation event corresponding to about 100 microradians of deflation on an azimuth of 073°. However, relevelling of a line extending 1 km N and 4 km S of the tiltmeter (including one station only a few tens of meters away) revealed no changes. On 10 March about 0200, seismic instruments detected several events that looked like explosion shocks, followed by about 2 minutes of very minor tremor. The events were felt and heard by many residents of towns around the volcano, but no eruption occurred. The government of the state of Chiapas, México has prepared a contingency plan to respond to several levels of volcanic risk, including evacuation of people within 15 km of the volcano if necessary.
Information Contacts: S. de la Cruz-Reyna, UNAM, México D.F.
Earthquake swarm then small phreatic eruption
A series of shallow earthquakes, many strong enough to be felt near the volcano, began in mid-December and continued through April.
The following is from Servando de la Cruz Reyna. "A volcanic earthquake swarm started in Tacaná volcano on 7 May at 1500. Earthquakes occurred at an average rate of 1/minute, accompanied by thunder-like noises that continued for 23 hours. On 8 May near noon, a moderate phreatic explosion opened a [20-m-diameter] vent that ejected a small amount of fine ash, partially destroying vegetation in an area 200 x 100 m. The vent is located on the upper NE flank (right on the México/Guatemala border) at about 3,800 m altitude [see also 11:09]. The seismic activity continued unchanged through 9 May, then started decreasing on 10 May to a rate of about one earthquake every 5 minutes that has persisted through 11 May. A white plume some 300 m high continued to be emitted as of 11 May. H2S has been qualitatively detected in the plume. No deformation changes have been detected on a bubble tiltmeter located about 1/3 of the way up the S flank. Dry tiltmeter measurements and radon counting are underway. The intensity of the swarm motivated the issuance of an orange alert at three levels (10, 15, and 20 km radius) effective on May 8." Press sources reported that 17,000 people, mostly residents of flank villages, had left their homes.
Information Contacts: S. de la Cruz Reyna, M. Mena, N. Segovia, L. Gonzalez, E. Ramos, A. González, V.H. Espindola, A. Nava, J.M. Espindola, Z. Jimenez, and M.A. Armienta, UNAM, México D.F.; E. Sánchez, INSIVUMEH; AP.
Gas emission continues but seismicity declines
Since the small phreatic explosion on 8 May, vapor emission has continued. Steaming increased slightly from some older fumaroles, probably because of recent heavy rains. As of late May, about 2-3 fairly large and a dozen small tectonic events were recorded daily. About 90% of the shocks were very shallow and most epicenters were within 3 km of the vent. Seismicity had declined somewhat by mid-June, while deformation and temperatures of nearby hot springs remained stable.
Information Contacts: M. Mena and S. de la Cruz Reyna, UNAM, México D.F.
Seismicity declines after May explosion; steaming
Seismicity declined after the 8 May phreatic explosion and in early June about 1-2 events were recorded/day. In late June, the active vent continually emitted steam, typically to about 500 m height, with a noise like a jet engine. The vent, about 20 m in diameter, was located at the foot of a 30-m cliff along an apparent radial fault extending from the summit. Poor access prevented direct gas sampling, but a weak odor of H2S was noted in the vicinity of the cloud. An apron of muddy, clay-rich debris surrounded the vent. Samples of February ejecta examined under a microscope were strongly altered. May and June material was less altered, but no glass was evident in any of the samples. Residents of the area who experienced the last activity in 1949-50 reported that the 1986 seismicity seemed stronger and the vent developed much more suddenly. The 1949-50 activity, on the upper SW flank, occurred from numerous small fumaroles rather than from a single vent and was apparently shorter-lived (Müllerried, 1951).
Vigorous monitoring efforts by scientists in México and Guatemala continue. Contingency plans have been prepared by the state government of Chiapas México, and a hazards assessment and map were produced under the auspices of Guatemala's INSIVUMEH (Rose and Mercado, 1986).
References. Müllerried, F.K.G., 1951, La reciente actividad del Volcán de Tacaná, Estado de Chiapas, a fines de 1949 y principios de 1950: Depto. de Prensa y Turismo, Tuxtla-Gutierrez, México, 28 p.
De la Cruz Martínez, V., and Hernández Zuñiga, R., 1986, Geología del Volcán Tacaná: Geotermia, Revista Mexicana de Geoenergía, v. 2, no. 1, p. 5-21.
Rose, W.I., and Mercado. R., 1986, Report on UNDRO/OFDA mission to Tacaná Volcano Guatemala/México: INSIVUMEH, Guatemala, 30 p. + 3 maps (in English or Spanish).
Further Reference. de la Cruz-Reyna, S., Armienta, M.A., Zamora, V., and Juarez, F., 1989, Chemical changes at spring waters at Tacana Volcano, Chiapas, Mexico; a possible precursor of the May 1986 seismic crisis and phreatic explosion: JVGR, v. 38, p. 345-353.
Information Contacts: W.I. Rose, Michigan Tech; E. Sánchez, Edgar Quevec R., and Enrique Molina C., INSIVUMEH; Stephen Malone, Univ of Washington, USA.
New fumaroles above 8 May crater
Geologists flew over Tacaná in early October. They noted that many small new fumaroles had formed in an area extending about 200 m above the level of the crater that formed on 8 May. The highest of the new fumaroles was also the largest, producing a white steam column 10-20 m high. The 8 May crater, at 3,400 m altitude (as measured by the aircraft altimeter) [but see 11:4], consisted of two vents about 8 and 12 m in diameter. Since May, the smaller vent has produced a white vapor column 200-300 m high. The larger vent was filled with water and had ceased emitting steam. Seismicity continued at a rather low level (similar to that of March). The geologists warned civil protection authorities from the state of Chiapas that unconsolidated material could form landslides when further loosened by the effect of the new fumaroles, and actions were being taken accordingly.
Information Contacts: S. de la Cruz-Reyna, UNAM, México D.F.
Seismic swarms
Three seismic swarms in the vicinity of Tacaná were recorded 20-28 January [see also 12:3]. Two began with magnitude 3 events. During a swarm that began 25 January, about 35 microearthquakes occurred/hour, with 750 events (M <1) recorded 25-26 January. The velocity model for the area remains uncertain, precluding precise hypocenter determinations, but events from the 25-26 January swarm appeared to be at 5-10 km depth. Geologists suspected that the seismicity may have been tectonic. No change in activity at the volcano has been reported.
Information Contacts: E. Sánchez, INSIVUMEH; Norman Banks and Michael Doukas, USGS CVO.
January seismicity not recorded by other stations
Three apparent earthquake swarms were observed 20-28 January on seismic data from Sibinal, Guatemala, on Tacaná's E flank. However, no local activity was recorded during this period by a seismic station 6.3 km away (in México), although two fairly large distant events were well-registered by both stations, sited on the same rock type with similar gain settings. Although the signals on the Sibinal records could be interpreted as microtremors, Mexican seismologists who have looked at the records believe that they may be the result of telemetry noise.
Information Contacts: S. de la Cruz-Reyna, UNAM, México D.F.
Steam output decreases; gas analyses
On 11 April a team of Italian scientists inspected the craters and fumaroles produced by the explosion. A steam column more than 100 m high was being emitted, but total steam output appeared to have decreased. The largest fumarole had a temperature of 89.3°C. Analysis of samples from that fumarole gave the following results (in volume percent): CO2, 1.07; H2O, 98.7; H2S, 0.15; N2, 0.019; H2, 0.00082; CH2, 0.00015; NH4, 0.000037; B, 0.00020; O2, 0.000016. The volcanologists interpreted the composition as resulting from the interaction of a convective flow of deep origin with a shallow aquifer. This interpretation appeared to correlate with the mainly phreatic character of the more recent activity, inferred from the deposits. The scientists felt that phreatic explosions of weak intensity could provide a sufficient trigger for dangerous landslides because of the volcano's steep slopes.
Information Contacts: M. Martini, Univ di Firenze, Italy.
Continued minor seismicity and gas emission
Seismic activity continued in May and June at about the same level as in previous months. Seismic station SBG, 6 km E of the summit, recorded 40 microearthquakes in May and 30 in June with S-P <= 2.0 seconds. Gas emission continued at the fumarolic vent formed by the 8 May 1986 phreatic eruption. A small lake was seen inside the vent by an INSIVUMEH team during their November 1986 visit.
Information Contacts: E. Sánchez, INSIVUMEH.
Fewer microearthquakes
During July, the SBG seismic station registered 20 microearthquakes with S-P <= 2.0 seconds. There have been no recent reports about the state of the vent formed by the 8 May 1986 phreatic eruption.
Information Contacts: E. Sánchez, INSIVUMEH.
Steam emission and local seismicity continue
Geologists (Gerardo Sánchez Rubio, UNAM; Rudy Machorro Sagastume, Univ of Guanajuato; Aroldo López Perdomo, CUNOR, Guatemala; Napoleón Rodríguez and Víctor Danilo Valdez, INTECAP, Guatemala; and Juan Sánchez Márquez, México) visited Tacaná on 27-28 January. A flank steam plume continued to be emitted. Residents of Tacaná and Sibinal, the nearest villages in Guatemala, reported infrequent to occasional seismicity.
Information Contacts: Gerardo Sánchez Rubio, Estación Regional del Centro, Instituto de Geología, UNAM, Guanajuato, México.
|
|
||||||||||||||||||||||||||||
There is data available for 10 confirmed eruptive periods.
1986 Feb 16 ± 15 days - 1986 Jun 16 ± 15 days Confirmed Eruption (Explosive / Effusive) VEI: 1
| Episode 1 | Eruption (Explosive / Effusive) | NE flank (ca. 3600 m) | ||||||||||||||||||||||||||||
|---|---|---|---|---|---|---|---|---|---|---|---|---|---|---|---|---|---|---|---|---|---|---|---|---|---|---|---|---|---|
| 1986 Feb 16 ± 15 days - 1986 Jun 16 ± 15 days | Evidence from Observations: Reported | ||||||||||||||||||||||||||||
|
List of 4 Events for Episode 1 at NE flank (ca. 3600 m)
|
|||||||||||||||||||||||||||||
1949 Dec 22 - 1950 Jan 16 ± 15 days Confirmed Eruption (Explosive / Effusive) VEI: 1
| Episode 1 | Eruption (Explosive / Effusive) | SW flank | |||||||||||||||||||||||||||||||||
|---|---|---|---|---|---|---|---|---|---|---|---|---|---|---|---|---|---|---|---|---|---|---|---|---|---|---|---|---|---|---|---|---|---|---|
| 1949 Dec 22 - 1950 Jan 16 ± 15 days | Evidence from Observations: Reported | |||||||||||||||||||||||||||||||||
|
List of 5 Events for Episode 1 at SW flank
|
||||||||||||||||||||||||||||||||||
1878 Confirmed Eruption (Explosive / Effusive) VEI: 1
| Episode 1 | Eruption (Explosive / Effusive) | SW side | |||||||||||||||||||||||
|---|---|---|---|---|---|---|---|---|---|---|---|---|---|---|---|---|---|---|---|---|---|---|---|---|
| 1878 - Unknown | Evidence from Observations: Reported | |||||||||||||||||||||||
|
List of 3 Events for Episode 1 at SW side
|
||||||||||||||||||||||||
[ 1855 Jan 12 ] Uncertain Eruption
| Episode 1 | Eruption (Explosive / Effusive) | SW side | ||||||||||||||||||||||||||||
|---|---|---|---|---|---|---|---|---|---|---|---|---|---|---|---|---|---|---|---|---|---|---|---|---|---|---|---|---|---|
| 1855 Jan 12 - Unknown | Evidence from Unknown | ||||||||||||||||||||||||||||
|
List of 4 Events for Episode 1 at SW side
|
|||||||||||||||||||||||||||||
1030 ± 40 years Confirmed Eruption (Explosive / Effusive)
| Episode 1 | Eruption (Explosive / Effusive) | |||||||||||||||||||||||||||||
|---|---|---|---|---|---|---|---|---|---|---|---|---|---|---|---|---|---|---|---|---|---|---|---|---|---|---|---|---|---|
| 1030 ± 40 years - Unknown | Evidence from Isotopic: 14C (uncalibrated) | ||||||||||||||||||||||||||||
|
List of 4 Events for Episode 1
|
|||||||||||||||||||||||||||||
0070 ± 100 years Confirmed Eruption (Explosive / Effusive) VEI: 4 (?)
| Episode 1 | Eruption (Explosive / Effusive) | San Antonio (upper SW flank) | |||||||||||||||||||||||||||||||||||||||||||||||||||||||||||||||
|---|---|---|---|---|---|---|---|---|---|---|---|---|---|---|---|---|---|---|---|---|---|---|---|---|---|---|---|---|---|---|---|---|---|---|---|---|---|---|---|---|---|---|---|---|---|---|---|---|---|---|---|---|---|---|---|---|---|---|---|---|---|---|---|---|
| 0070 ± 100 years - Unknown | Evidence from Isotopic: 14C (calibrated) | |||||||||||||||||||||||||||||||||||||||||||||||||||||||||||||||
|
List of 11 Events for Episode 1 at San Antonio (upper SW flank)
|
||||||||||||||||||||||||||||||||||||||||||||||||||||||||||||||||
1080 BCE ± 150 years Confirmed Eruption (Explosive / Effusive)
| Episode 1 | Eruption (Explosive / Effusive) | |||||||||||||||||||||||||||||
|---|---|---|---|---|---|---|---|---|---|---|---|---|---|---|---|---|---|---|---|---|---|---|---|---|---|---|---|---|---|
| 1080 BCE ± 150 years - Unknown | Evidence from Isotopic: 14C (calibrated) | ||||||||||||||||||||||||||||
|
List of 4 Events for Episode 1
|
|||||||||||||||||||||||||||||
4740 BCE ± 200 years Confirmed Eruption (Explosive / Effusive)
| Episode 1 | Eruption (Explosive / Effusive) | ||||||||||||||||||||||||
|---|---|---|---|---|---|---|---|---|---|---|---|---|---|---|---|---|---|---|---|---|---|---|---|---|
| 4740 BCE ± 200 years - Unknown | Evidence from Isotopic: 14C (calibrated) | |||||||||||||||||||||||
|
List of 3 Events for Episode 1
|
||||||||||||||||||||||||
5720 BCE ± 200 years Confirmed Eruption (Explosive / Effusive)
| Episode 1 | Eruption (Explosive / Effusive) | ||||||||||||||||||||||||
|---|---|---|---|---|---|---|---|---|---|---|---|---|---|---|---|---|---|---|---|---|---|---|---|---|
| 5720 BCE ± 200 years - Unknown | Evidence from Isotopic: 14C (calibrated) | |||||||||||||||||||||||
|
List of 3 Events for Episode 1
|
||||||||||||||||||||||||
5940 BCE ± 500 years Confirmed Eruption (Explosive / Effusive)
| Episode 1 | Eruption (Explosive / Effusive) | ||||||||||||||||||||||||
|---|---|---|---|---|---|---|---|---|---|---|---|---|---|---|---|---|---|---|---|---|---|---|---|---|
| 5940 BCE ± 500 years - Unknown | Evidence from Isotopic: 14C (uncalibrated) | |||||||||||||||||||||||
|
List of 3 Events for Episode 1
|
||||||||||||||||||||||||
9450 BCE ± 150 years Confirmed Eruption (Explosive / Effusive)
| Episode 1 | Eruption (Explosive / Effusive) | ||||||||||||||||||||||||
|---|---|---|---|---|---|---|---|---|---|---|---|---|---|---|---|---|---|---|---|---|---|---|---|---|
| 9450 BCE ± 150 years - Unknown | Evidence from Isotopic: 14C (calibrated) | |||||||||||||||||||||||
|
List of 3 Events for Episode 1
|
||||||||||||||||||||||||
This compilation of synonyms and subsidiary features may not be comprehensive. Features are organized into four major categories: Cones, Craters, Domes, and Thermal Features. Synonyms of features appear indented below the primary name. In some cases additional feature type, elevation, or location details are provided.
Synonyms |
||||
| Soconusco | ||||
Cones |
||||
| Feature Name | Feature Type | Elevation | Latitude | Longitude |
| Chichuj
Talquian |
Stratovolcano | 3800 m | ||
| San Antonio
Aguila, El |
Stratovolcano | 3700 m | ||
Craters |
||||
| Feature Name | Feature Type | Elevation | Latitude | Longitude |
| Chanjale | Caldera | |||
| San Rafael | Caldera | |||
| Sibinal | Caldera | |||
Domes |
||||
| Feature Name | Feature Type | Elevation | Latitude | Longitude |
| Plan de las Ardillas | Dome | |||
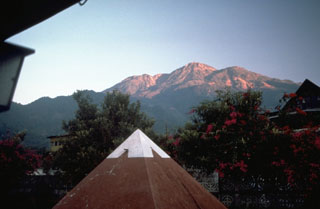 Tacaná is located along the México/Guatemala border, seen here from the SSE from the Mexican town of Unión Juárez, where it rises above the Pacific coastal plain. The elongate summit region is composed of a series of lava domes. Historical activity has included mild phreatic eruptions, but stronger explosive activity, and production of pyroclastic flows, occurred earlier.
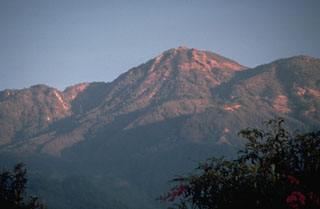 Tacaná lies about 30 km south of the Polochic‐Motagua fault, in the zone which marks the Caribbean and North American plate boundary. The summit, seen here from the SSE, is elongated as a result of the extrusion of a series of lava domes with the youngest center, San Antonio, being at the SW (left). In the center is the Tacaná itself, with Chichuj to the right.
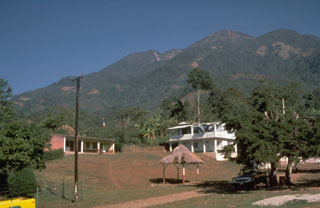 The peak to the left is San Antonio, the youngest of the Tacaná volcanic complex. A major eruption from the upper SW flank about 1,950 years ago produced a block-and-ash flow that traveled about 14 km to the south with associated lahars. The eruption concluded with the extrusion of lava flows and a lava dome. Construction at the pre-Hispanic center of Izapa was halted because of temporary abandonment of the city due to the lahars.
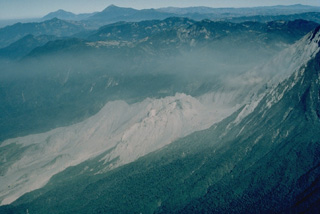 The Santiaguito lava-dome complex (center) has been in continual activity since 1922. It is seen here in March 1983 from the SE, with Siete Orejas volcano forming the broad forested ridge above it and Tacaná (left) and Tajumulco (right) volcanoes appearing on the left skyline. Santiaguito was constructed within the large 1902 explosion crater, which cuts the SW flank of Santa María volcano at the right.
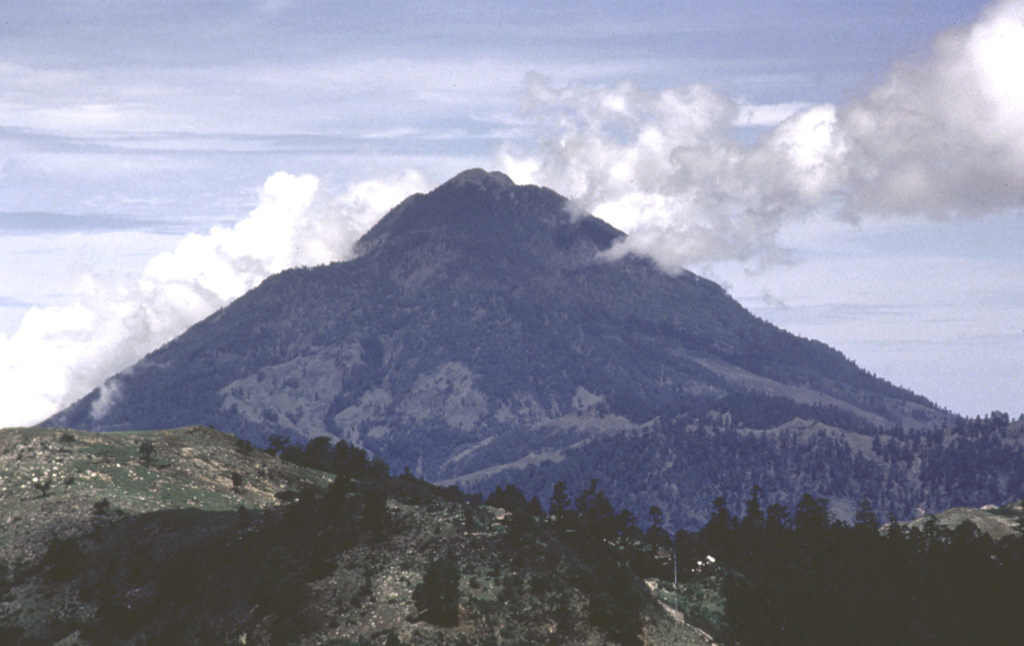
 Tacaná is located on the México/Guatemala border at the far NW end of the Central American volcanic belt. It is seen here from the Guatemalan side of the border to the ENE, where it rises steeply above a 9-km-wide caldera surrounded by deeply eroded plutonic rocks. Historical activity has included mild phreatic eruptions, but stronger explosive activity and production of pyroclastic flows occurred earlier.
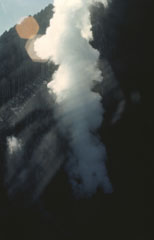 Minor phreatic eruptions took place at Tacaná in February, May, and June 1986. Following a seismic swarm that began the previous day, a moderate phreatic explosion around noon on 8 May created a new 10-m-wide vent and ejected a small amount of fine ash. Vegetation was damaged over an area of 200 x 100 m. Vigorous steam emission was continuing at the time of this 25 June photo. The new vent formed at about 3,600 m elevation on the NE flank.
 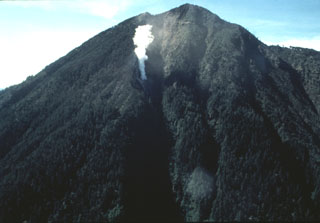 An aerial view of the NE flank of Tacaná volcano on 25 June 1986 shows a steam plume rising above a new vent. Minor phreatic eruptions, the first since 1949, took place in February, May, and June 1986. Following a seismic swarm beginning the previous day, a moderate phreatic explosion around noon on 8 May created a new 10-m-wide vent and ejected a small amount of fine ash. Vegetation was damaged over an area of 200 x 100 m.
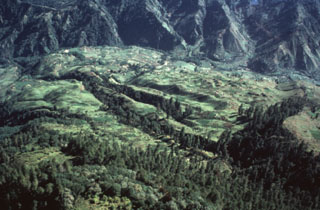 An aerial view of the Río Las Majadas valley in Guatemala on the NNE side of Tacaná volcano shows thick deposits of lahars and debris avalanches filling the valley. These deposits provide a flat surface for agricultural use in deeply eroded terrain. The valley drains from its headwaters in Guatemala through México into the Pacific Ocean, and lahars during future eruptions could affect both countries.
There are no samples for Tacaná in the Smithsonian's NMNH Department of Mineral Sciences Rock and Ore collection.
| Copernicus Browser | The Copernicus Browser replaced the Sentinel Hub Playground browser in 2023, to provide access to Earth observation archives from the Copernicus Data Space Ecosystem, the main distribution platform for data from the EU Copernicus missions. |
| MIROVA | Middle InfraRed Observation of Volcanic Activity (MIROVA) is a near real time volcanic hot-spot detection system based on the analysis of MODIS (Moderate Resolution Imaging Spectroradiometer) data. In particular, MIROVA uses the Middle InfraRed Radiation (MIR), measured over target volcanoes, in order to detect, locate and measure the heat radiation sourced from volcanic activity. |
| MODVOLC Thermal Alerts | Using infrared satellite Moderate Resolution Imaging Spectroradiometer (MODIS) data, scientists at the Hawai'i Institute of Geophysics and Planetology, University of Hawai'i, developed an automated system called MODVOLC to map thermal hot-spots in near real time. For each MODIS image, the algorithm automatically scans each 1 km pixel within it to check for high-temperature hot-spots. When one is found the date, time, location, and intensity are recorded. MODIS looks at every square km of the Earth every 48 hours, once during the day and once during the night, and the presence of two MODIS sensors in space allows at least four hot-spot observations every two days. Each day updated global maps are compiled to display the locations of all hot spots detected in the previous 24 hours. There is a drop-down list with volcano names which allow users to 'zoom-in' and examine the distribution of hot-spots at a variety of spatial scales. |
|
WOVOdat
Single Volcano View Temporal Evolution of Unrest Side by Side Volcanoes |
WOVOdat is a database of volcanic unrest; instrumentally and visually recorded changes in seismicity, ground deformation, gas emission, and other parameters from their normal baselines. It is sponsored by the World Organization of Volcano Observatories (WOVO) and presently hosted at the Earth Observatory of Singapore.
GVMID Data on Volcano Monitoring Infrastructure The Global Volcano Monitoring Infrastructure Database GVMID, is aimed at documenting and improving capabilities of volcano monitoring from the ground and space. GVMID should provide a snapshot and baseline view of the techniques and instrumentation that are in place at various volcanoes, which can be use by volcano observatories as reference to setup new monitoring system or improving networks at a specific volcano. These data will allow identification of what monitoring gaps exist, which can be then targeted by remote sensing infrastructure and future instrument deployments. |
| Volcanic Hazard Maps | The IAVCEI Commission on Volcanic Hazards and Risk has a Volcanic Hazard Maps database designed to serve as a resource for hazard mappers (or other interested parties) to explore how common issues in hazard map development have been addressed at different volcanoes, in different countries, for different hazards, and for different intended audiences. In addition to the comprehensive, searchable Volcanic Hazard Maps Database, this website contains information about diversity of volcanic hazard maps, illustrated using examples from the database. This site is for educational purposes related to volcanic hazard maps. Hazard maps found on this website should not be used for emergency purposes. For the most recent, official hazard map for a particular volcano, please seek out the proper institutional authorities on the matter. |
| IRIS seismic stations/networks | Incorporated Research Institutions for Seismology (IRIS) Data Services map showing the location of seismic stations from all available networks (permanent or temporary) within a radius of 0.18° (about 20 km at mid-latitudes) from the given location of Tacaná. Users can customize a variety of filters and options in the left panel. Note that if there are no stations are known the map will default to show the entire world with a "No data matched request" error notice. |
| UNAVCO GPS/GNSS stations | Geodetic Data Services map from UNAVCO showing the location of GPS/GNSS stations from all available networks (permanent or temporary) within a radius of 20 km from the given location of Tacaná. Users can customize the data search based on station or network names, location, and time window. Requires Adobe Flash Player. |
| DECADE Data | The DECADE portal, still in the developmental stage, serves as an example of the proposed interoperability between The Smithsonian Institution's Global Volcanism Program, the Mapping Gas Emissions (MaGa) Database, and the EarthChem Geochemical Portal. The Deep Earth Carbon Degassing (DECADE) initiative seeks to use new and established technologies to determine accurate global fluxes of volcanic CO2 to the atmosphere, but installing CO2 monitoring networks on 20 of the world's 150 most actively degassing volcanoes. The group uses related laboratory-based studies (direct gas sampling and analysis, melt inclusions) to provide new data for direct degassing of deep earth carbon to the atmosphere. |
| Large Eruptions of Tacaná | Information about large Quaternary eruptions (VEI >= 4) is cataloged in the Large Magnitude Explosive Volcanic Eruptions (LaMEVE) database of the Volcano Global Risk Identification and Analysis Project (VOGRIPA). |
| EarthChem | EarthChem develops and maintains databases, software, and services that support the preservation, discovery, access and analysis of geochemical data, and facilitate their integration with the broad array of other available earth science parameters. EarthChem is operated by a joint team of disciplinary scientists, data scientists, data managers and information technology developers who are part of the NSF-funded data facility Integrated Earth Data Applications (IEDA). IEDA is a collaborative effort of EarthChem and the Marine Geoscience Data System (MGDS). |