
A partly cloudy ASTER satellite image from 3 November appeared to indicate that large-scale effusive activity from the summit of Montagu Island (Mt. Belinda) had ceased. The image showed that the 3.5-km-long lava flow noted in previous reports (observed entering the sea in an image from 23 September 2005) had extended the shoreline on the N side of island. The new land extended approximately 500 m from the previous shoreline, and was ~400 m wide, equating to a total area of 0.2 square kilometers.
Sources: Hawai'i Institute of Geophysics and Planetology (HIGP) Thermal Alerts Team, British Antarctic Survey
Quiet, with minor thermal anomalies, since September 2007
As of late October 2010, Montagu Island displayed only very localized and minor thermal anomalies of insufficient size to indicate an eruption. As previously reported, Montagu Island displayed frequent thermal anomalies, several lava flows, and a low-level ash plume in December 2006, but eruptions ceased after September 2007 (BGVN 33:03 and 33:07).
MODVOLC thermal anomalies have remained absent between September 2007 and 31 October 2010, and ASTER thermal images over the past few years lacked indication of eruptive activity. The most recent cloud-free ASTER image (figure 21) shows relatively small thermal anomalies on the 2005 flow field that Patrick believes likely represent fumaroles venting residual heat from the lava flow.
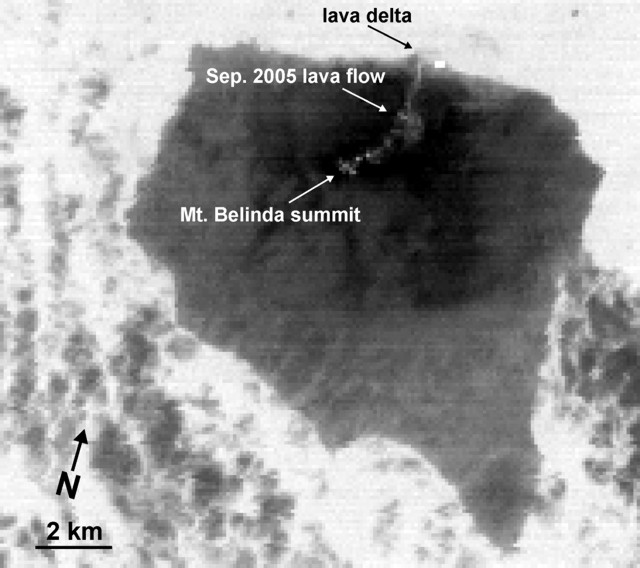 |
Figure 21. ASTER image of Montagu Island taken on 21 March 2010 showing the 2005 lava flow from Mt. Belinda. As of late October 2010, this was the most recent cloud-free ASTER image of Montagu Island (based on Aster band 14, 11-micron wavelength). Courtesy of Matt Patrick (USGS) and the ASTER project. |
According to Matt Patrick (USGS), several small (1-2 pixels in size) thermal anomalies are situated near the summit of Mt. Belinda on the proximal section of the 2005 flow. In addition, a larger (3 x 2 pixels) anomaly is at the E end of the delta formed in 2005 when lava entered the ocean. Patrick notes that this thermal anomaly on the delta has been present in ASTER images going back to 2008 and, as with the anomaly above, likely indicates residual heat escape.
Information Contacts: Matthew R. Patrick, Hawaiian Volcano Observatory (HVO), U.S. Geological Survey, PO Box 51, Hawai'i National Park, HI 96718, USA (URL: https://volcanoes.usgs.gov/observatories/hvo/); Hawai'i Institute of Geophysics and Planetology (HIGP) Thermal Alerts System, School of Ocean and Earth Science and Technology (SOEST), Univ. of Hawai'i, 2525 Correa Road, Honolulu, HI 96822, USA (URL: http://modis.higp.hawaii.edu/); ASTER (Advanced Spaceborne Thermal Emission and Reflection Radiometer), Earth Remote Sensing Data Analysis Center (ERSDAC) in Japan, and the Jet Propulsion Laboratory in the U.S. (URL: http://asterweb.jpl.nasa.gov/).
2005: October
| November
2004: February
| October
A partly cloudy ASTER satellite image from 3 November appeared to indicate that large-scale effusive activity from the summit of Montagu Island (Mt. Belinda) had ceased. The image showed that the 3.5-km-long lava flow noted in previous reports (observed entering the sea in an image from 23 September 2005) had extended the shoreline on the N side of island. The new land extended approximately 500 m from the previous shoreline, and was ~400 m wide, equating to a total area of 0.2 square kilometers.
Sources: Hawai'i Institute of Geophysics and Planetology (HIGP) Thermal Alerts Team; British Antarctic Survey
An ASTER satellite image from 23 September showed a 3.5-km-long lava flow extending from the summit of Montagu Island (Mt. Belinda) into the sea. This was the largest effusive event observed during the 4-year-old eruption. Based on MODVOLC alerts, the flow appeared to have started sometime between 10 and 14 September. A conspicuous 90-m-wide channel was visible ~1 km from the vent. The image also showed a steam plume at the location of the ocean entry, and an ash-rich plume extending NE from the volcano's summit.
Sources: Hawai'i Institute of Geophysics and Planetology (HIGP) Thermal Alerts Team; British Antarctic Survey
According to NASA's Earth Observatory News website, the IKONOS satellite acquired an image of Montagu Island (Mount Belinda) on 1 October that showed a steaming vent, and dark basaltic tephra covering ice surfaces N of the lava that erupted down the volcano's N flank. A steam plume drifted N, and light colored clouds surrounded the S side of the crater.
Source: NASA Earth Observatory
Satellite imagery from 7 December 2003 showed that low-level ash emission and lava effusion had persisted steadily at Montagu Island (Mount Belinda) for the past 2 years. A NE-trending, 2-km-long lava flow was emplaced on the summit ice shelf in July 2003, and ash continued to blanket the eastern side of the island. The automated MODVOLC satellite monitoring system indicated that total heat output from the volcano reached its highest intensity in October 2003.
Source: Hawai'i Institute of Geophysics and Planetology (HIGP) Thermal Alerts Team
Reports are organized chronologically and indexed below by Month/Year (Publication Volume:Number), and include a one-line summary. Click on the index link or scroll down to read the reports.
Satellite data provide first evidence of Holocene eruptive activity
Although previous eruptions have been recorded elsewhere in the South Sandwich Islands (Coombs and Landis, 1966), ongoing volcanic activity has only recently been detected and studied. These islands (figure 1) are all volcanic in origin, but sufficiently distant from population centers and shipping lanes that eruptions, if and when they do occur, currently go unnoticed. Visual observations of the islands probably do not occur on more than a few days each year (LeMasurier and Thomson, 1990). Satellite data have recently provided observations of volcanic activity in the group, and offer the only practical means to regularly characterize activity in these islands. These observations are especially significant because there has previously been no evidence of Holocene activity on Montagu Island (LeMasurier and Thomson, 1990).
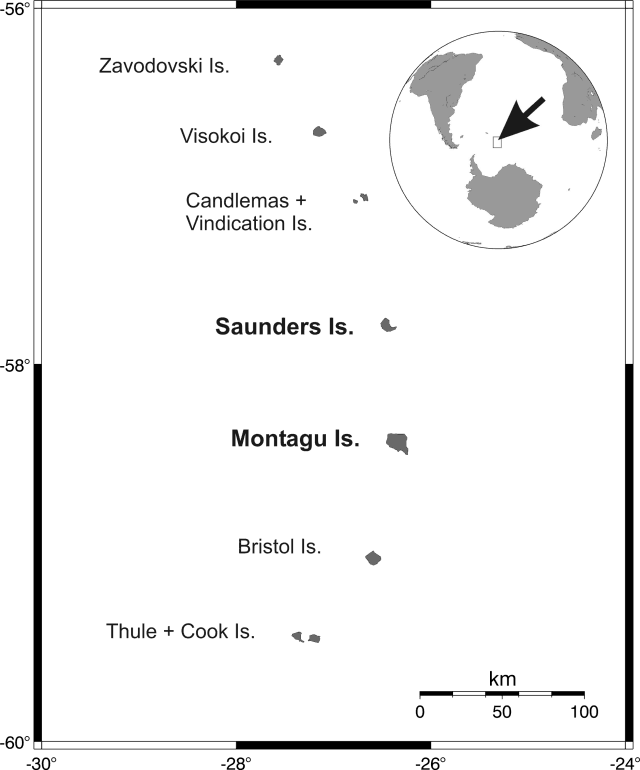 |
Figure 1. The South Sandwich Island archipelago, located in the Scotia Sea. The South Sandwich Trench lies approximately 100 km E, paralleling the trend of the islands, where the South American Plate subducts westward beneath the Scotia Plate. Courtesy Hawaii Institute of Geophysics and Planetology and British Antarctic Survey. |
Using Advanced Very High Resolution Radiometer (AVHRR) data, Lachlan-Cope and others (2001) observed apparent plumes and unreported single anomalous pixels intermittently on images of Montagu Island during March 1995 to February 1998. However, field investigations in January 1997 revealed that Montagu Island, as viewed from Saunders Island, was apparently inactive, with the summit region entirely covered in snow and ice. Hand-held photographs of the island obtained in September 1992 also showed the summit to be wholly inactive.
Significant volcanic activity may have begun on Montagu Island in late 2001 based upon analysis of thermal satellite imagery (1 km pixel size) from NASA's Moderate Resolution Imaging Spectroradiometer (MODIS) instrument. Using the automated MODIS Thermal Alert system (Wright and others, 2002), image pixels containing volcanic activity were detected and analyzed to characterize the eruption. From its location, the erupting center may be associated with a small hill on the NW edge of the ice-filled summit caldera, ~6 km from Mount Belinda (figure 2).
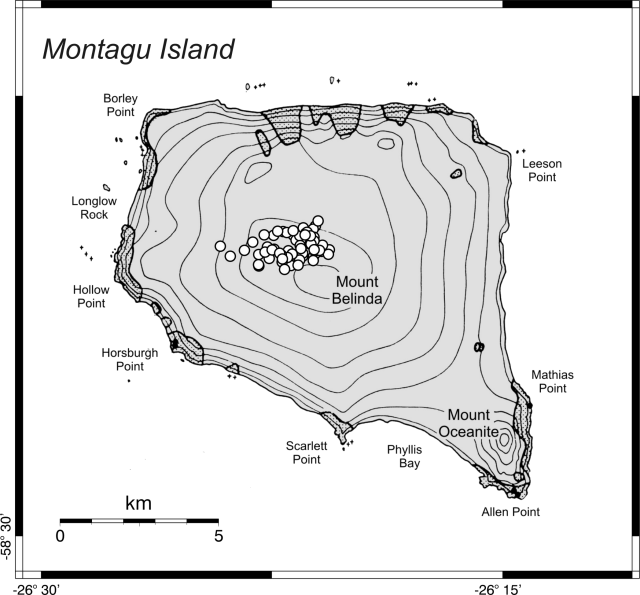 |
Figure 2. Map of Montagu Island with circles showing the location of all anomalous MODIS pixels detected since October 2001. Stippled areas show rock outcrop, the remainder is snow or ice covered. Relief is shown by form lines that should not be interpreted as fixed-interval contours. Map adapted from Holdgate and Baker (1979); courtesy Hawaii Institute of Geophysics and Planetology and British Antarctic Survey. |
The first thermal alert on Montagu occurred on 20 October 2001 with a single anomalous pixel on the N side of the island. Subsequent anomalies generally involved 1-2 pixels, with the exception of several images in August and September 2002 that peaked at four pixels in size (figures 3 and 4). Visual inspection of the images revealed that the anomalies were all located between the summit of Mount Belinda and the N shore, changing in position either due to satellite viewing geometry or actual migration of hot material. We can generally discount other possible explanations for the anomalies, the most likely being solar reflectance influencing the short-wave bands, due to the presence of clear anomalies in nighttime imagery and the concomitance of apparent low-level ash plumes in several of the images. The persistence of the anomaly, and the lack of large ash plumes, suggests that activity here may involve a lava lake.
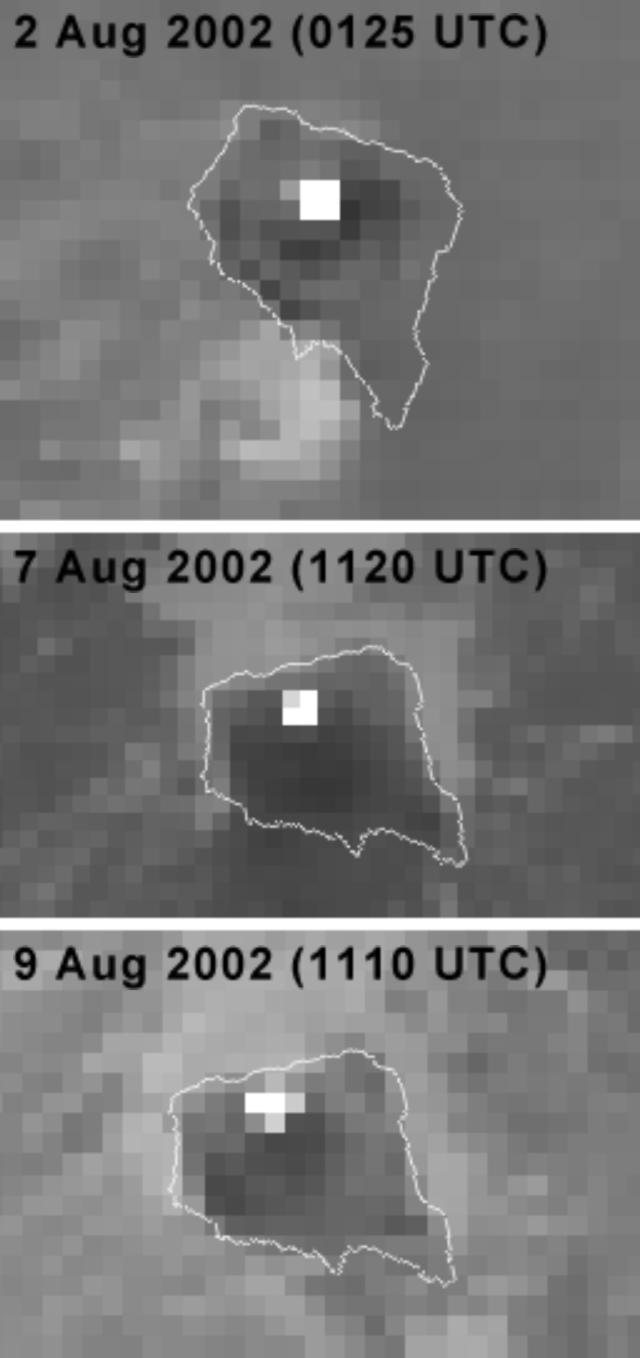 |
Figure 3. Selected MODIS images showing thermal anomalies on Montagu Island. Band 20 (3.7 µm) is shown here. The thermal anomalies appear to be located between the summit of Mount Belinda and the N shore. Images are not georeferenced for purposes of radiance integrity, therefore coastlines are approximate. Courtesy Hawaii Institute of Geophysics and Planetology and British Antarctic Survey. |
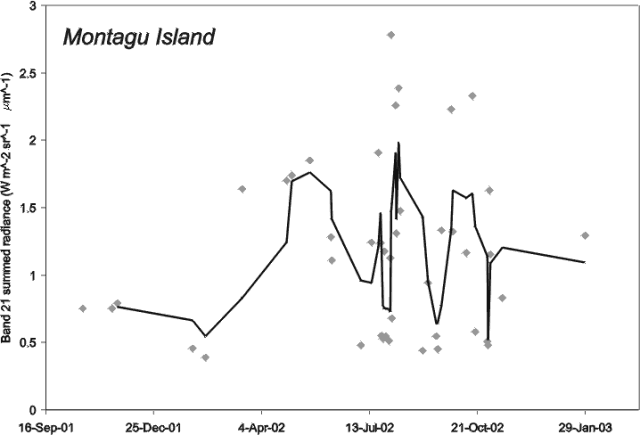 |
Figure 4. Summed radiance of anomalous pixels in each image. Band 21 (3.9 µm) was used for these plots. Points show the result for each image, and the line is a three point running mean of values. Courtesy Hawaii Institute of Geophysics and Planetology and British Antarctic Survey. |
References. Coombs, D.S., and Landis, C.A., 1966, Pumice from the South Sandwich eruption of March 1962 reaches New Zealand: Nature, v. 209, p. 289-290.
Holdgate, M.W., and Baker, P.E., 1979, The South Sandwich Islands, I, General description: British Antarctic Survey Science Report, v. 91, 76 p.
Lachlan-Cope, T., Smellie, J.L., and Ladkin, R., 2001, Discovery of a recurrent lava lake on Saunders Island (South Sandwich Islands) using AVHRR imagery: Journal of Volcanology and Geothermal Research, v. 112, p. 105-116.
LeMasurier, W.E., and Thomson, J.W. (eds), 1990, Volcanoes of the Antarctic Plate and Southern Oceans: American Geophysical Union, Washington, D.C., AGU Monograph, Antarctic Research Series, v. 48.
Wright, R., Flynn, L.P., Garbeil, H., Harris, A.J.L., and Pilger, E, 2002, Automated volcanic eruption detection using MODIS: Remote Sensing of Environment, v. 82, p. 135-155.
Information Contacts: Matt Patrick, Luke Flynn, Harold Garbeil, Andy Harris, Eric Pilger, Glyn Williams-Jones, and Rob Wright, HIGP Thermal Alerts Team, Hawai'i Institute of Geophysics and Planetology (HIGP) / School of Ocean and Earth Science and Technology (SOEST), University of Hawai'i, 2525 Correa Road, Honolulu, HI 96822, USA (URL: http://modis.higp.hawaii.edu/); John Smellie, British Antarctic Survey, Natural Environment Research Council, High Cross, Madingly Road, Cambridge CB3 0ET, United Kingdom (URL: https://www.bas.ac.uk/).
Eruption continues through 2003; new image shows ash and lava
The first recorded eruption of Montagu island (sometimes called Belinda volcano) has continued for more than two years according to satellite thermal imagery (see BGVN 28:02). First detected on imagery from the Moderate Resolution Imaging Spectroradiometer (MODIS) satellite on 20 October 2001 by the MODVOLC automated monitoring system at the University of Hawaii Manoa, the eruption appeared to continue with persistent low-level ash emission and occasional lava effusion into at least December 2003.
MODIS thermal anomalies have been present on a regular basis since the 20 October 2001 eruption. Figure 5 shows the MODIS-measured radiative heat output through 2003 (see also Wright and Flynn, 2004). High heat output occurred in August 2002, perhaps corresponding to lava effusion down the W flank of the cinder cone (figure 6). Following a relaxation in heat output levels, values rose again in late 2003, the highest level occurring in October 2003.
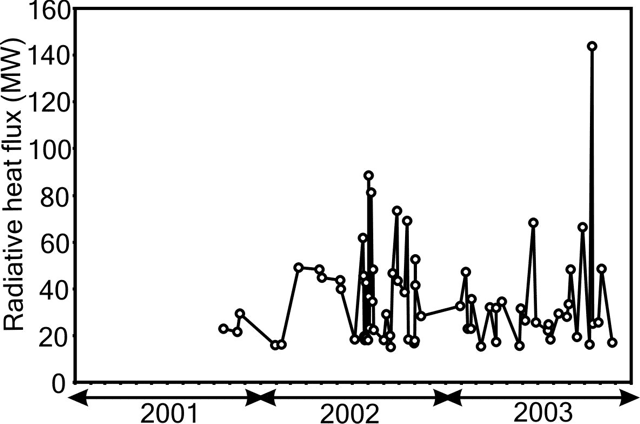 |
Figure 5. Radiative heat output from Montagu during the period October 2001-December 2003 measured by the MODVOLC monitoring system using MODIS satellite data. Courtesy of the HIGP Thermal Alerts Team, Hawai'i Institute of Geophysics and Planetology (HIGP). |
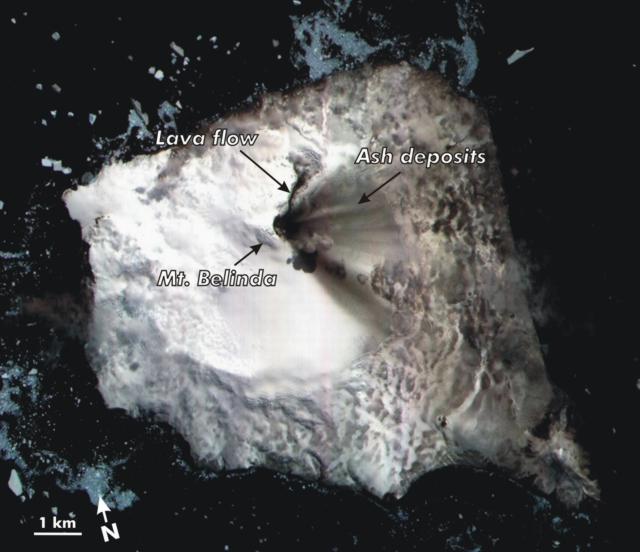 |
Figure 6. Montagu Island and the surrounding iceberg-laden seas appear in this ASTER satellite image (visual spectrum, bands 3-2-1, 15 m pixel size) take on 7 December 2003. This image shows recent volcanic deposits on Montagu's ice-covered surface. The image will also help refine existing maps. The volcano on the island's lower right-hand extreme is called Mount Oceanite. Courtesy of NASA/ GSFC/ MITI/ ERSDAC/ JAROS, and U.S./ Japan ASTER Science Team. |
High-resolution images from the Advanced Spaceborne Thermal Emission and Reflection Radiometer (ASTER) satellite (15 m pixel size) and the Landsat Enhanced Thematic Mapper Plus (ETM+) (15-30 m pixel size) were used to examine the processes acting on the surface. An ETM+ image on 4 January 2002 showed a ~600 m lava flow near the summit of the cinder cone while low-level ash emission ensued. An ASTER image on 1 August 2003 showed a 2-km-long lava flow that was emplaced on the summit ice cover, corresponding, perhaps, to a 25 July 2003 MODIS radiance spike. The flow emanated from the summit of the cinder cone in a NE trend and cut through the ice cover creating a deep gully that confined the flow laterally. The gully, ~ 100 m wide near the source, swelled to a fan-shaped chasm ~600 m in diameter. An ash-rich plume was observed and ubiquitous ash cover blanketed the E half of the island. An ASTER image on 7 December 2003 showed the cooling lava flow devoid of snow cover with a small ash plume drifting SE from the summit (figure 6).
The high-resolution ASTER images improved previously published maps, leading to revised estimates of the island's size. Thus, previously reports described the island as 15 x 20 km across, but a better estimate is 10 x 12 km. The previous sketch map (in BGVN 28:02) had the correct scale.
The ASTER images also provide some of the first clear views of the island's morphology and some of the recent deposits. The active cinder cone is a small peak situated on the N side of an extensive and gently sloping ice field. This ice field fills the largest caldera known in the island group, a feature ~6 km in diameter and filled by permanent ice of uncertain depth. Mount Oceanite forms a conspicuous promontory on the SE corner of the island with a 270-m-diameter summit crater (figure 6).
Satellite remote sensing of remote regions. The South Sandwich Islands are situated well to the E of the southern tip of South America and over 10 degrees N of mainland Antarctica. They comprise a volcanic province called the Scotia arc, formed by the subduction of the South American plate beneath the Scotia plate. Due to this region's inaccessibility, satellite monitoring holds promise as a means to track volcanism there.
Terra (Latin for land) is the name of the Earth Observing System (EOS) flagship satellite that began science operations in 2000. Terra is a multi-national, multi-disciplinary satellite carrying a payload of five remote sensors that are measuring comprehensively the state of Earth's environment and ongoing changes in its climate system. The Terra MODIS sensor detects thermal data and forms part of the satellite monitoring system called MODVOLC. The monitoring system is run by the HIGP Thermal Alerts Team at the University of Hawaii-Manoa.
Another sensor on Terra is ASTER (Advanced Spaceborne Thermal Emission and Reflection Radiometer), an imaging instrument. This sensor, a cooperative effort between NASA and Japan's Ministry of Economy, Trade, and Industry (METI), and the Earth Remote Sensing Data Analysis Center (ERSDAC), provides detailed maps of land surface temperature, emissivity, reflectance, and elevation.
References. Wright, R., and Flynn, L.P., 2004, A space-based estimate of the volcanic heat flux into the atmosphere during 2001 and 2002: Geology, v. 32, p. 189-192.
Wright, R., Flynn, L.P., Garbeil, H., Harris, A.J.L., and Pilger, E., (in press), MODVOLC: near-real-time thermal monitoring of global volcanism: Journal of Volcanology and Geothermal Research, Elsevier (2004)
Information Contacts: Matt Patrick, Luke Flynn, Harold Garbeil, Andy Harris, Eric Pilger, and Rob Wright, HIGP Thermal Alerts Team, Hawai'i Institute of Geophysics and Planetology (HIGP) / School of Ocean and Earth Science and Technology (SOEST), University of Hawai'i, 2525 Correa Road, Honolulu, HI 96822, USA (URL: http://modis.higp.hawaii.edu/); John Smellie, British Antarctic Survey, Natural Environment Research Council, High Cross, Madingly Road, Cambridge CB3 0ET, United Kingdom (URL: https://www.bas.ac.uk/).
1 October 2004 satellite image suggests a complex and ongoing eruption
A high-resolution image of Montagu island and volcano of the same name suggests the earlier recognized, ongoing eruption (BGVN 28:02; v. 29, no. 1 ) continued through at least 1 October 2004. On a NASA website, scientist James Garvin posted an image of the 1 October scene (figure 7). Imagery taken prior to late 2001 showed the island as entirely white. The new image deserves and requires considerable study, but some initial observations from James Garvin and Bulletin editors follow.
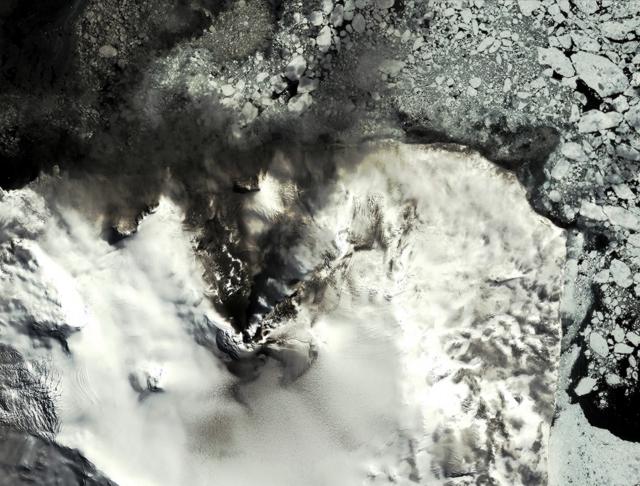 |
Figure 7. Montagu Island as imaged on 1 October 2004 by the IKONOS satellite. N is towards the top. The apex of the black zone of lava flows near the island's center presumably represents a vent within the summit crater. The distance from that spot to the coast is ~ 3 km. This image depicts numerous recent volcanogenic features. Montagu Island lies in the South Sandwich islands at the E edge of the Scotia plate, 2,600 km E of Cape Horn, ~ 1,000 km from the Antarctic circle, and ~ 3,500 km from the S pole. Courtesy of Space Imaging and James B. Garvin, NASA. |
The 1 October 2004 image shows the N flank of the central cone, Mount Belinda, emitting a NNE-drifting steam plume. Much of Montagu island sat amid a mosaic of floating ice. In contrast, on the previous image taken 7 December 2003 (BGVN 29:01), icebergs were sparse. Several square kilometers of sea ice on the island's lower right appears comparatively coherent and tightly butted against the island's margin. These changes may reflect sea-ice abundance during the S-hemisphere winter.
In addition, the higher detail in the new higher resolution image portrays a variety of patterns and features of volcanological significance that were absent or at least less clearly visible on earlier images. In the new image, the area of apparently continuous lava flows seems to have reached the island's N margin (a distance of ~ 3 km). On the 7 December 2003 image these flows had reached little more than 1 km in length and were considerably narrower, and stood alongside broad, dark swaths of SE- to E-directed ash deposits (BGVN 29:01). These latter ash deposits have become less apparent on the newer image, conceivably due to cover beneath winter's snowfall.
The newer image depicts the S-flank's upper slopes as containing much broader areas of darkened snow and ice. Some of the sea ice N of the previously mentioned lava flows also appears darkened. To the S of the Belinda summit lies a previously unseen, sinuously shaped 'beard,' presumably composed of darkened snow. Another newly visible feature, the black area to the NNW (upper left), presumably reveals lava flows emerging from beneath the ice. This zone of lava flows resides without clear connection to the conspicuous, larger, previously mentioned one flowing from higher up-slope. The black area to the NNW may thus be a new vent area. Alternatively, the black area may represent the spot where a longer sub-glacial lava flow transited some unknown distance beneath the ice and here melted its way to the surface. Another such area may reside on the NNE flanks, midway from the summit area and the coast. On the island's W (left) side exists a newly imaged network of broken ice. It could suggest an episode of fresh crevassing there.
Although the version shown in figure 7 has reduced resolution for print and web distribution, the full-resolution version of the IKONOS color image distributed by NASA has a resolution of 4 m per pixel and another version, 1 m per pixel (creating a 3.20 Mb image). James Garvin noted that dynamic processes such as those on remote, uninhabited islands, can be monitored from orbit, thereby serving to target more intensive field studies when they are justified. As such, IKONOS imaging of localities such as active eruptions involving ice-lava interactions, represents a new form of scientific exploration of planet Earth. The eruption has produced a 'natural laboratory' for studying lava-ice interactions relevant to the biology of extreme environments as well as to processes believed to be important on the planet Mars.
The IKONOS earth-imaging satellite launched in September 1999. IKONOS includes optical, radar, and infrared sensors. These can be combined in a variety of ways to accommodate a wide range of imagery applications (including stereo images).
Geographic terminology. The nomenclature of volcanic features on Montagu Island, particularly in regard to Mount Belinda, has been quite variable. Although the name Montagu has been applied to the major volcanic edifice forming the island (LeMasurier and Thomson, 1990), the name Mount Belinda has been variously applied to the entire volcano, the currently active young cone on the northern side of the island, the 6-km-wide summit caldera, and a peak on the southern caldera rim that is the island's high point. In consultation with John Smellie of the British Antarctic Survey, we have used Montagu to refer to the volcano forming the island and Mount Belinda for the currently active cone.
Reference. LeMasurier, W.E., and Thomson, J.W. (eds.), 1990, Volcanoes of the Antarctic Plate and Southern Oceans: Washington, D C: American Geophysical Union, 487 p.
Information Contacts: James B. Garvin, National Aeronautics and Space Administration (NASA), Goddard Space Flight Center (GSFC), Code 921, Greenbelt, MD 20771, USA (URL: https://earthobservatory.nasa.gov/); John Smellie, British Antarctic Survey, Natural Environment Research Council, High Cross, Madingly Road, Cambridge CB3 0ET, United Kingdom (URL: https://www.bas.ac.uk/).
Higher-resolution image shows abundant ash, not lava, on the N-flank
Matt Patrick of the Hawaii Institute of Geophysics and Planetology reviewed our previous report on Montagu Island (BGVN 29:09) and noted some erroneous interpretations. These had relied on imagery from 1 October 2004. Patrick generated a significantly improved, scaled, higher (4-m) resolution IKONOS image from the same time frame (figure 8), and offered some refinements and important corrections.
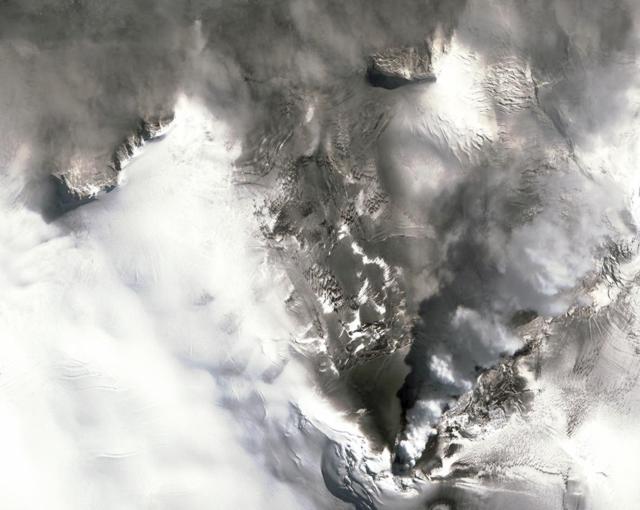 |
Figure 8. A 1 October 2004 image of Montagu Island taken with the IKONOS satellite (N towards the top; distance from summit vent to N coast is ~3 km). A lower higher resolution image appeared in BGVN 29:09. This new image indicates that tephra—not lava flows as previously reported—covers much of the ice over a sector on the island's N side. Courtesy of Space Imaging, NASA, and Matt Patrick. |
First, the previous report noted that "the area of apparently continuous flows seems to have reached the island's N margin (a distance of 3 km)." Over the entire new image there doesn't seem to be any new vents nor lava. The darkened area N of the Belinda summit cone contains clear crevasses indicating a region of ice entirely covered in ash.
A second erroneous statement was, "Another visible feature, the black area to the NNW . . . presumably reveals lava flows emerging from beneath the ice." Patrick points out that on the new image this area is seen to contain some of the island's rocky cliffs contrasting against the ice cover. He attributed the darkness around this area mainly to shadow. The presence of rocky cliffs negates another statement in the previous issue: "The black area to the NNW may thus be a new vent area."
The previous report commented that, "Another such [dark, presumably lava-covered] area may reside on the NNE flanks, midway from the summit area and the coast." Patrick noted that on the new image this area appears chaotic and can easily be misidentified as recent volcanics. He goes on to say, "We made a similar mistake earlier on, thinking there were concentric fractures related to subglacial melting. But it turned out from pre-eruption images that this area is just covered in topographic crevasses. Looking at the [improved] IKONOS image, one can see this more clearly."
Patrick offered interpretations of some features on the new image, the first high-resolution image since February 2004. It shows continued steaming from Mount Belinda as well as tephra cover on the surrounding ice field, activity very similar to that seen on all the previous imagery. Although the new IKONOS image lacks any evidence of new lava since the 2003 lava flow, that particular lava field lies hidden under the steam plume in the IKONOS image. Thus, there could be newer material in that small region. The IKONOS image appears devoid of new vents, and emissions come solely from the summit area.
Information Contacts: Matt Patrick, HIGP Thermal Alerts Team, Hawai'i Institute of Geophysics and Planetology (HIGP) / School of Ocean and Earth Science and Technology (SOEST), University of Hawai'i, 2525 Correa Road, Honolulu, HI 96822, USA (URL: http://modis.higp.hawaii.edu/).
September 2005 satellite image and infrared data portray ongoing eruption
The first recorded eruption of Mt. Belinda volcano (Montagu Island), which began around 20 October 2001, continued (as reported in BGVN 28:02, 29:01, 29:09, 29:10) until at least the latter part of 2005. Information for the following report was prepared and submitted by Matt Patrick of the Hawai'i Institute of Geophysics and Planetology (HIGP) and John Smelie of the British Antarctic Survey, with the assistance of the HIGP Thermal Alerts Team.
This eruption was detected by the MODVOLC automated satellite detection system, which scans for anomalous thermal activity in MODIS (Moderate Resolution Imaging Spectroradiometer) satellite data over the entire Earth approximately twice per day (Wright and others, 2004). Investigators acquired a recent, 23 Sept 2005, cloud-free ASTER (Advanced Spaceborne Thermal Emission and Reflection Radiometer) image (15-30 m pixel size), which provided valuable information on a new phase of activity. It revealed a larger effusive eruption than previously identified in satellite imagery of Montagu Island (figure 9).
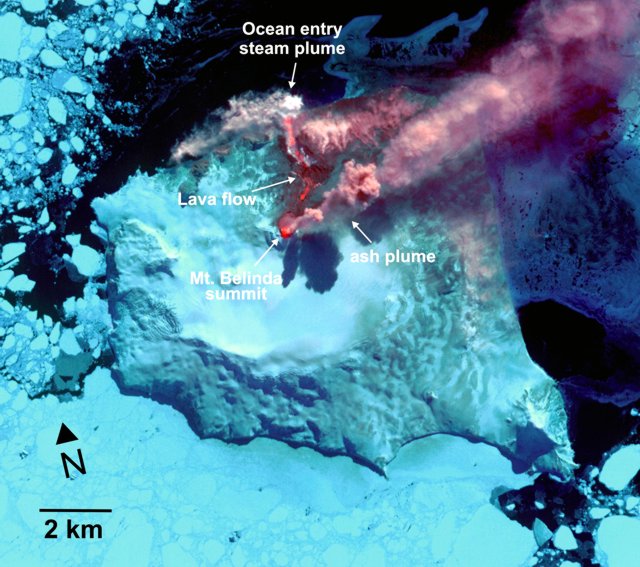 |
Figure 9. ASTER image showing Montagu Island's Mount Belinda on 23 September 2005. Courtesy of HIGP Thermal Alerts Team. |
Based on frequent MODVOLC alerts (figure 10) and occasional high-resolution satellite data (ASTER, IKONOS, and Quickbird), Mount Belinda has maintained persistent activity since the start of the eruption. Activity has consisted of continuous steaming and low-intensity explosive events at the summit (presumably Strombolian), producing low-level ash plumes and ubiquitous tephra deposits on the island's ice cover, and at least three distinct effusive events. Several satellite images were posted by HIGP on the National Aeronautics and Space Administration (NASA) Earth Observer website, 13 October 2004 and 19 October 2005.
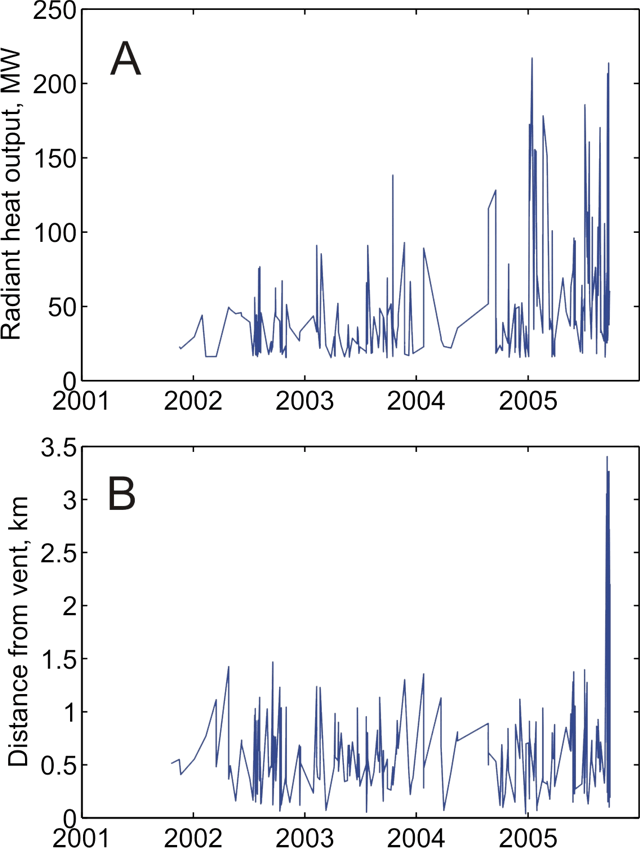 |
Figure 10. (A) Chronological graph of radiant heat output from Mount Belinda measured from satellite sensors. The date range depicted along the x-axis of this graph is from late 2001 to September 2005. (B) A plot showing the distance of satellite-measured thermal anomaly pixels from the Mount Belinda vent during the period 2001 to September 2005. Courtesy of HIGP Thermal Alerts Team. |
Scientists noted an intense shortwave-IR anomaly at the summit of Mt. Belinda in all cloud-free ASTER images acquired throughout the eruption. This suggested the presence of a lava lake in the summit crater (see Patrick and others, 2005, for more detailed information on the eruption).
Far from slowing down, the activity throughout 2005 marked the highest levels yet registered by MODVOLC (figure 10a). For the first time in 2005, radiant heat output exceeded 150 MW (see Wright and Flynn, 2004, and Wright and others, 2005, for calculation details).
By plotting the position of each anomalous MODVOLC pixel relative to the central vent (figure 10b) one can see that most pixels are within 1 km of the vent. This reflects the approximate scale of MODIS pixels and thus the inherent level of location ambiguity (note, however, these results fail to show the 2-km-long lava flow emplaced in mid-2003 — see BGVN 29:01).
For the first time during this eruption, anomalous pixels began appearing more than 2 km away from the central vent on the satellite image for 0100 UTC on 15 September 2005, some up to 3.3 km away (figure 10b). This suggested the presence of a ~ 3 km long lava flow. Corroborating this was the ASTER image from 23 September 2005 (figure 9), which indicated heightened activity and a 3.5-km long lava flow extending from the summit cone of Mt. Belinda into the sea. A steam plume originated in the vicinity of the ocean entry. Note that the steam plume appears to drift W from its origin (where the plume is whitest), while the ash plume from the summit of Mt. Belinda (1,370 m elev.) drifts E, indicating varying wind directions at different elevations.
The lava flow initially traveled NE from the vent, but farther on it ran into a rocky arete, which diverted its path to due N. A 90-m-wide lava channel is visible at a distance of 1 km from the summit. The flow appears to be covered (perhaps entering a tube) within its first kilometer, where no anomalous shortwave IR pixels exist. It is unlikely that the flow is subglacial in this first kilometer, as its path is coincident with emplacement of the previously mentioned lava flow of mid-2003, which was 2 km long and had already melted ice along this route.
At the request of the British Antarctic Survey, the Royal Air Force sent an airplane from the Falkland Islands on 11 October 2005. The plane encountered cloudy conditions but those on board recognized steam rising from the sea. This flight took place prior to study of the 23 September ASTER image and thus it marked the first observation that lava reached the sea.
References. Patrick, M., Smellie, J.L., Harris, A.J.L., Wright, R., Dean, K., Izbekov, P., Garbeil, H., and Pilger, E., 2005, First recorded eruption of Mount Belinda volcano (Montagu Island), South Sandwich Islands: Bulletin of Volcanology, v. 67, p. 415-422.
Wright, R., and Flynn, L.P., 2004, A space-based estimate of the volcanic heat flux into the atmosphere during 2001 and 2002: Geology, v. 32, p. 189-192.
Wright, R., Flynn, L.P., Garbeil, H., Harris, A.J.L., and Pilger, E., 2004, MODVOLC: near-real-time thermal monitoring of global volcanism: Journal of Volcanology and Geothermal Research, v. 135, p. 29-49.
Wright, R., Carn, S., and Flynn, L.P., 2005, A satellite chronology of the May-June 2003 eruption of Anatahan volcano: Journal of Volcanology and Geothermal Research, v. 146, p. 102-116.
Information Contacts: Matt Patrick, University of Hawaii, Hawaii Institute of Geophysics and Planetology (HIGP) Thermal Alerts Team, 2525 Correa Road, Honolulu, HI 96822 (URL: http://modis.higp.hawaii.edu/); John Smelie, British Antarctic Survey, Natural Environment Research Council, High Cross, Madingly Road, Cambridge CB3 0ET, United Kingdom (URL: https://www.bas.ac.uk/); NASA Earth Observer (URL: http://earthobservatory.nasa.gov/NaturalHazards/).
N-coast delta grew during 14 September-4 October 2005
MODVOLC radiant heat-flux data and ASTER high-resolution satellite imagery revealed discharging lava flows that traveled N to the sea where they constructed a lava delta. The large effusive episode described in BGVN 30:09 had ceased, followed by a smaller episode in November. MODVOLC responses were most intense during 14 September to 4 October 2005. Figure 11a shows the radiant heat flux for the volcano since the start of the eruption in October 2001, providing rough idea eruptive intensity. Figure 11b indicates the distance of each alert pixel from the vent, giving insights into the timing of significant effusive episodes.
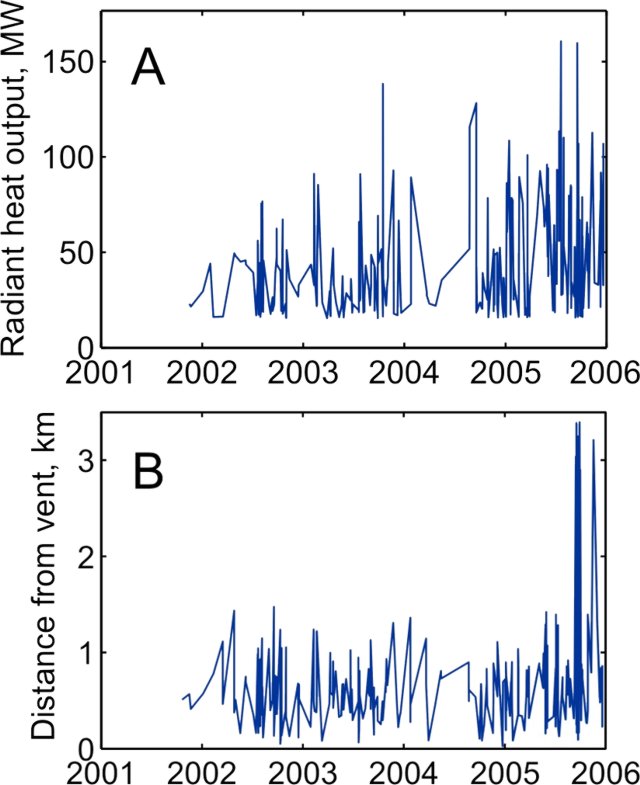 |
Figure 11. Plots of MODVOLC data at Belinda volcano on Montagu Island. Courtesy of Matt Patrick, HIGP. |
As figure 12b suggests, the September-October 2005 episode was likely the largest effusive episode of the eruption in that it involved the only sustained occurrence of alert pixels (i.e. active lava) more than 2 km from the vent. Following 4 October 2005, a single alert pixel appeared more than 3 km from the vent on 17 November 2005, but subsequent alert pixels were all near-vent. It is not yet clear if this 17 November anomaly represents the start of a substantial additional episode of lava effusion.
An ASTER image collected on 3 November 2005, shows the result from the September-October 2005 effusive episode (visible wavelength image shown in figure 12a). The shortwave infrared anomaly in this image (not shown) is minor compared to the 23 September 2005 image (BGVN 30:09), suggesting that any effusion had dropped to low levels by early November. The 3 November image indicates that a significant lava delta had formed on the N shore of the island during the September-October effusive phase (see arrow in figure 12a). The delta comprises two major lobes, and is approximately 400-500 m in width and length, equating to approximately 0.2 km2. An enlarged view of the visible image is provided in figure 12b, where the approximate path of the September-October 2005 lava flow is shown by the dotted arrow. The current coastline is shown by the dotted line, with the lava delta (denoted by solid arrow) clearly jutting out. Note the faint steam wisps extending E from delta's eastern margin. The thermal infrared image (band 14, at 11-micron wavelength) of the island is shown in figure 12c, and clearly indicates the anomalously warm delta.
 |
Figure 12. An ASTER image and enlargement on Montagu Island showing Belinda as it appeared in visible wavelength data on 3 November 2005 (a and b). An ASTER thermal-infrared image was obtained of the island on the same date (c). Courtesy of Matt Patrick, HIGP. |
A Royal Air Force overflight on 11 October 2005, captured an oblique photograph of the delta (not shown). The lava flow appears to have steeply cut through thick ice approaching the shore, producing a broad and relatively flat delta that is vigorously steaming from the delta margins in the photograph.
Information Contacts: Matt Patrick, University of Hawaii, Hawaii Institute of Geophysics and Planetology (HIGP) Thermal Alerts Team, 2525 Correa Road, Honolulu, HI 96822 (URL: http://modis.higp.hawaii.edu/); John Smelie, British Antarctic Survey, Natural Environment Research Council, High Cross, Madingly Road, Cambridge CB3 0ET, United Kingdom (URL: https://www.bas.ac.uk/); NASA Earth Observatory (URL: http://earthobservatory.nasa.gov/).
January 2006 visit documenting steam and new lava flows
Recent volcanism on Montagu Island was discovered based on satellite information (BGVN 30:11). Thanks to a visit from the South African icebreaker MV SA Agulhas, the first photographs of the island are now available, taken from just offshore. The Agulhas is an Antarctic supply and oceanographic research vessel built in the late 1970s; it is affiliated with the South African Department of Environmental Affairs and Tourism, Antarctica and Islands Division. She left Cape Town on 1 December 2005, and her journey was the focus of several reports (e.g., Hunter, 2005). The westerly position of pack ice during the course of this voyage enabled the Agulhas to visit Penguin Bukta, an indentation (bay) in the coastal ice shelf (figure 13).
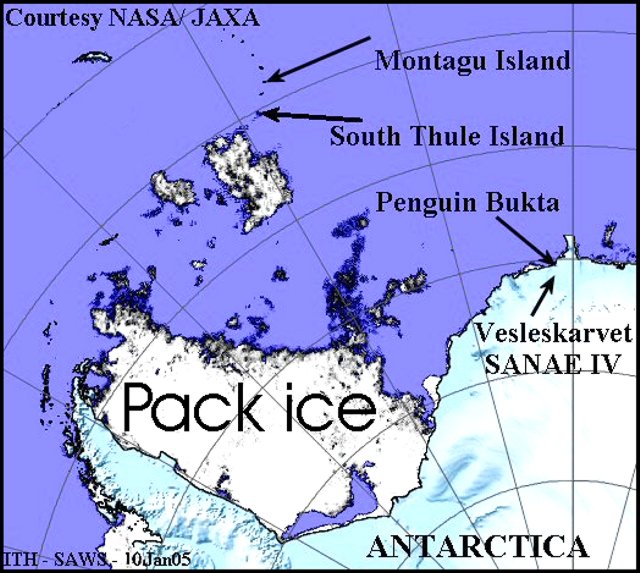 |
Figure 13. A map indicating the location of Montagu island with respect to features in the region. The pack ice is mobile and the position shown refers to conditions on 10 January 2006 as mapped by satellite radar (NASA/JAXA). Courtesy of Ian Hunter, South African Weather Service. |
The Agulhas departed Penguin Bukta on 8 January to deploy drifting weather buoys and to install an automatic weather station on South Thule island at the extreme S end of the South Sandwich Islands. Besides the usual hazards of Antarctic travel and navigation, the South Sandwich Islands were the scene of some severe undersea earthquakes as the Agulhas entered those waters. This was of concern because such earthquakes can cause significant bathymetric change. The US Geological Survey posted detailed information on two large 2006 earthquakes to the E of the islands. The first, on 2 January, had M 7.3 and, fortunately, a moderately deep focal depth of 46 km.
The ship reached offshore of the remote, uninhabited Montagu island in mid-January 2006 (figures 14 and 15). These pictures were forwarded to the Smithsonian by Ian Hunter who received them from Frikkie Viljoen (the ice navigator), and Dave Hall (the ship's Master) after the Agulhas returned from Antarctica on 19 February 2006.
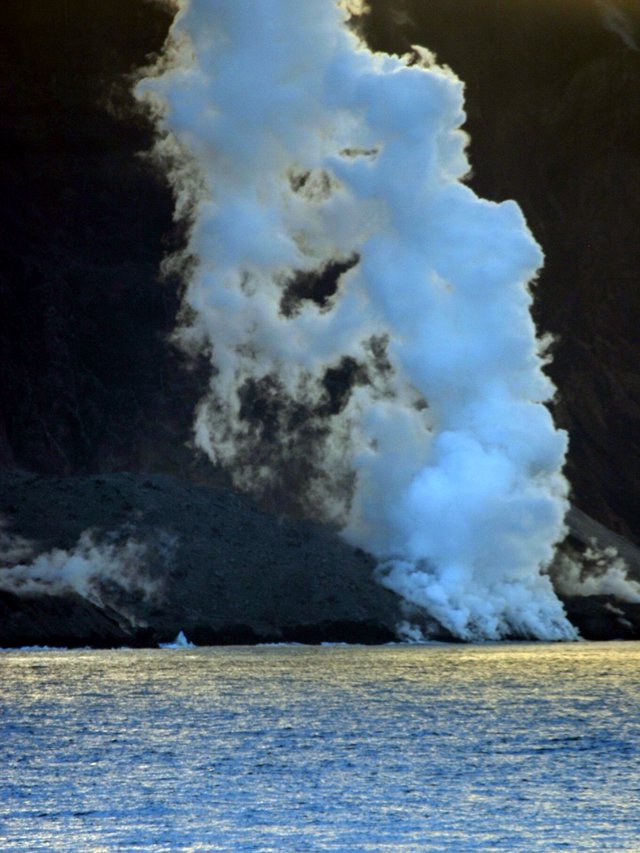 |
Figure 14. Lava from Montagu Island eruption entering the sea. The photo was taken on 13 January 2006 from the SA Agulhas while lying to the N of the Island. The geometry of the setting given here is based on the MODIS photo taken on 9 September 2005 (BGVN 30:11) that clearly indicates the lava flow streaming N into the sea. Courtesy of Dave Hall and Frikkie Viljoen, SA Agulhas, and Ian Hunter, South African Weather Service. |
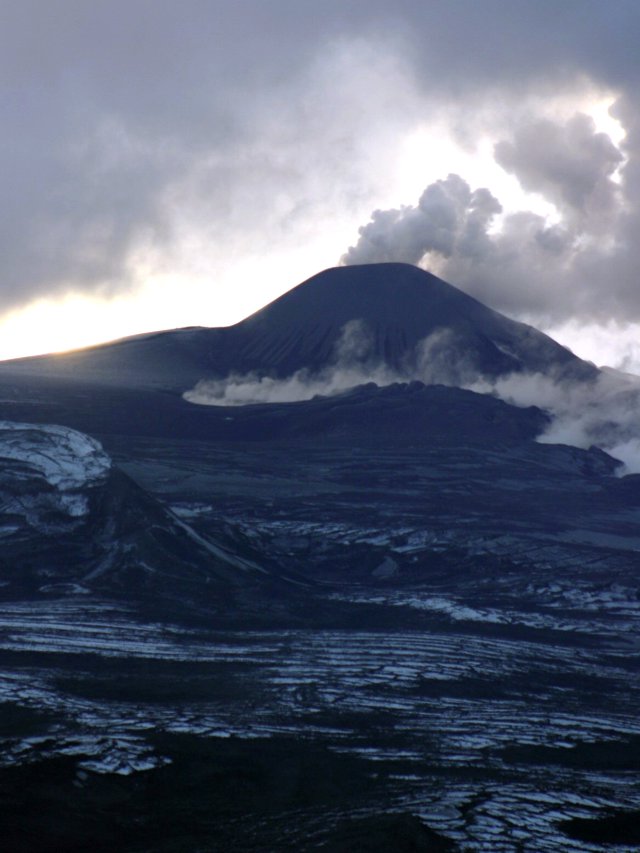 |
Figure 15. Photo taken on 13 January 2006 from the SA Agulhas from N of Montagu Island showing the lava field formed by the recent eruption. Courtesy of Dave Hall and Frikkie Viljoen, SA Agulhas, and Ian Hunter, South African Weather Service. |
In an e-mail message to Hunter on the return leg of the voyage (on 16 January), Hall noted the following. "By now you will have heard that we successfully deployed the new weather station at Thule Island and had a good look at the eruption on Montagu. We got to within 1.5 miles [2.4 km] of the lava flow, but it was strangely disappointing. Although it was during the evening it was still full daylight so the lava flow was just the same colour as the surrounding rock, not dramatic at all! The most visible feature was the steam plume as the hot lava entered the sea. The top of the island was covered in cloud but that did part long enough to get a quick sighting of the summit, emitting the smoke and ash cloud."
John Smellie of the British Antarctic Survey reported hearing from a Falklands contact that an RAF flight sent at Christmas 2005 had taken photos and reported the eruption was "over." In addition, there could also be first-hand news from a yacht that was to be in the area during January 2006.
Reference. Hunter, Ian, (12 January) 2006, International Support for the SA Agulhas's mission in Antarctica, in Ports & Ships, Shipping News?reporting from the harbours of South Africa & Southern Africa (URL: http://www.ports.co.za/didyouknow/)
Information Contacts: Ian T. Hunter, South African Weather Service, Private Bag X097, Pretoria 0001, South Africa (URL: http://www.weathersa.co.za/); Department of Environmental Affairs and Tourism, Antarctica and Islands Division, Private Bag X447, Pretoria 0001, South Africa; John Smellie, British Antarctic Survey, Natural Environment Research Council, High Cross, Madingly Road, Cambridge CB3 0ET, United Kingdom (URL: https://www.bas.ac.uk/).
Five years of nearly persistent eruptive activity
Matthew Patrick reported that the month of October represents the 5-year anniversary of the start of the still-ongoing eruption at Mount Belinda on Montagu Island. The first satellite thermal alert for the volcano occurred on 20 October 2001, and was the first definitive record of historical volcanic activity on the island (BGVN 28:02) (Patrick and others, 2005). The MODVOLC monitoring system uses MODIS (Moderate Resolution Imaging Spectroradiometer) satellite data processed at the University of Hawai'i-Manoa. Current MODVOLC results, shown in figure 16A, indicate more-or-less persistent activity throughout the 5-year period, with radiant heat flux apparently peaking in late 2005 and early 2006.
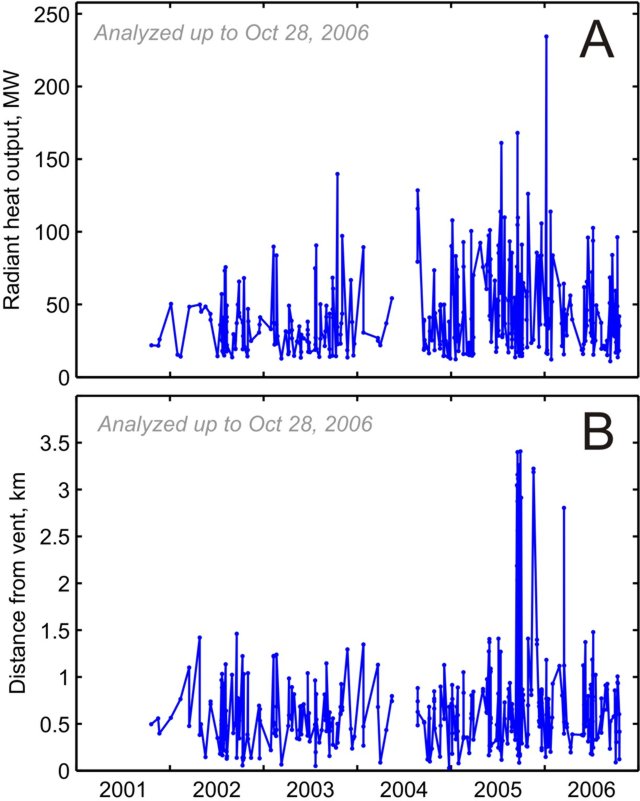 |
Figure 16. Plots of MODVOLC data at Belinda volcano on Montagu Island from 2001 to October 2006. (A) Chronological graph of radiant heat output from Mount Belinda measured from satellite sensors. (B) Chronological plot showing the distance of satellite-measured thermal anomaly pixels from the Mount Belinda vent. Courtesy of HIGP Thermal Alerts Team. |
Landsat and ASTER (Advanced Spaceborne Thermal Emission and Reflection Radiometer) imagery has shown that the eruption consisted of central vent activity producing lava flows. Small-scale explosive activity has also commonly blanketed the E side of the island. Three effusive events have been observed in ASTER/Landsat imagery, with the most recent (September-October 2005) producing a lava flow that traveled 3.5 km and reached the sea to build a 500-m-wide delta of lava (BGVN 30:09 and 30:11).
Figure 16B shows relative location (distance from the vent) comparing Mount Belinda's vent with the locations of MODVOLC alert pixels. This plot clearly shows longer flows during the September 2005 effusive event. Following this period, there were several other long-distance events. It is unclear if these reflect additional effusive events.
In addition, the first two effusive events observed in the ASTER/Landsat images do not appear on the MODVOLC plot (figure 16B), due either to cloud cover or their short flow lengths. Since the beginning of 2006, no cloud-free ASTER images have been available.
Geographic terminology. The nomenclature of volcanic features on Montagu Island, particularly in regard to Mount Belinda, has been quite variable. Although the name Montagu has been applied to the major volcanic edifice forming the island (LeMasurier and Thomson, 1990), the name Mount Belinda has been variously applied to the entire volcano, the currently active young cone on the northern side of the island, the 6-km-wide summit caldera, and a peak on the southern caldera rim that is the island's high point. In consultation with John Smellie of the British Antarctic Survey, we have used Montagu to refer to the volcano forming the island and Mount Belinda for the currently active cone.
References. LeMasurier, W.E., and Thomson, J.W. (eds.), 1990, Volcanoes of the Antarctic Plate and Southern Oceans: Washington, D C: American Geophysical Union, 487 p.
Patrick, M.R., Smellie, J.L., Harris, A.J.L., Wright, R., Dean, K., Izbekov, P., Garbeil, H., and Pilger, E., 2005, First recorded eruption of Mount Belinda volcano (Montagu Island), South Sandwich Islands, Bulletin of Volcanology, v. 67, no. 5, p. 415-422.
Information Contacts: Matthew Patrick, Dept. of Geological and Mining Engineering and Sciences, Michigan Technological University, 1400 Townsend Drive, Houghton, MI 49931, USA; HIGP MODIS Thermal Alert System, Hawai'i Institute of Geophysics and Planetology (HIGP), University of Hawaii at Manoa, 168 East-West Road, Post 602, Honolulu, HI 96822, USA (URL: http://modis.higp.hawaii.edu/); John Smellie, British Antarctic Survey, Natural Environment Research Council, High Cross, Madingly Road, Cambridge CB3 0ET, United Kingdom (URL: https://www.bas.ac.uk/).
Explosive and possible effusive activity continues in December 2006
Matt Patrick provided three new ASTER images showing Montagu on 28 October 2006. The ASTER VNIR image (Bands 3-2-1, RGB) (figure 17) depicts Montagu in a state similar to that observed in other ASTER images of the eruption. The persistent ash plume has covered the NE quadrant of the island in dark tephra, while the lava field extending from the summit vent to the coast is clearly visible. The lava delta, extending to a distance of ~ 3.5 km from the vent, first formed during the September-October 2005 eruptive phase and remains intact (BGVN 30:11). It is unclear if any new lava flows erupted since that time have extended as far.
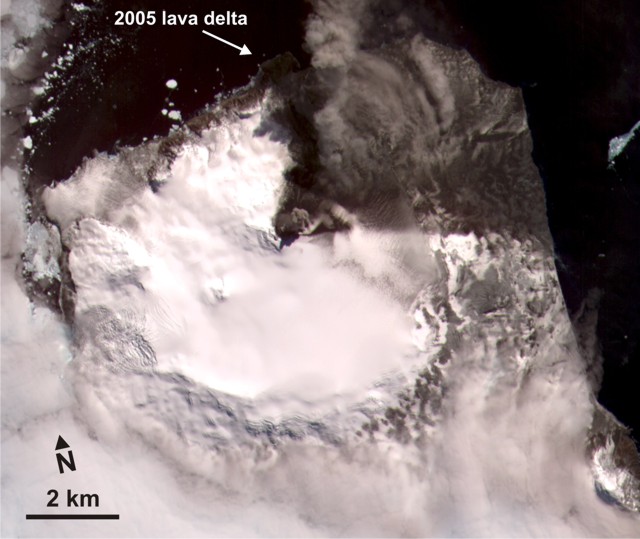 |
Figure 17. An image of Montagu Island captured on 28 October 2006 by ASTER VNIR. Courtesy of NASA with interpretation in text by Matt Patrick, Michigan Technological University. |
ASTER (Advanced Spaceborne Thermal Emission and Reflection Radiometer) is an imaging radiometer that consists of three distinct telescope subsystems: near infrared (VNIR), shortwave infrared (SWIR), and thermal infrared (TIR). These have the following spectral ranges, number of bands, and spatial resolutions: VNIR (spectral range, 0.5-0.9 ?m in three bands; spatial resolution, 15 m); SWIR (spectral range 1.6-2.5 ?m in six bands, spatial resolution 30 m); TIR (8-12 ?m in five bands; spatial resolution, 90 m).
Patrick noted that the ASTER TIR (Band 14; thermal infrared wavelength 10.95-11.65 ?m) and SWIR (Band 9; short-wave infrared wavelength 2.360-2.430 ?m) images (figure 18) may show a new lava flow reaching ~ 1.5 km NE from the summit. An elongated section of warm pixels in the TIR corresponds to a feature which appears to have a faint outline of anomalous pixels in the SWIR, possibly reflecting a new flow.
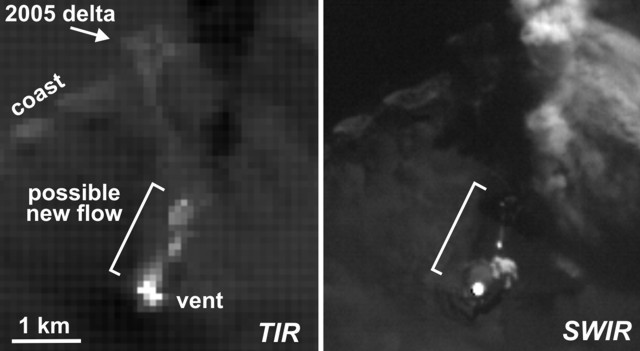 |
Figure 18. Two image of Montagu Island captured on 28 October 2006 by ASTER TIR and SWIR, which show slightly different features than seen on the previous (ASTER VNIR) image, and may disclose a new lava flow. Courtesy of NASA with interpretation by Matt Patrick. |
Information Contacts: Matthew Patrick, Dept. of Geological and Mining Engineering and Sciences, Michigan Technological University, 1400 Townsend Drive, Houghton, MI 49931, USA; Hawai'i Institute of Geophysics and Planetology (HIGP) Thermal Alerts Team, School of Ocean and Earth Science and Technology (SOEST), Univ. of Hawai'i, 2525 Correa Road, Honolulu, HI 96822, USA (URL: http://modis.higp.hawaii.edu/).
December 2006 plume seen in satellite imagery
An ASTER (Advanced Spaceborne Thermal Emission and Reflection Radiometry) satellite image became available, showing a Montagu Island plume blowing NNE on 17 December 2006 (figure 19). A persistent ash plume over Montagu was previously noted in October 2006 ASTER imagery (BGVN 31:11).
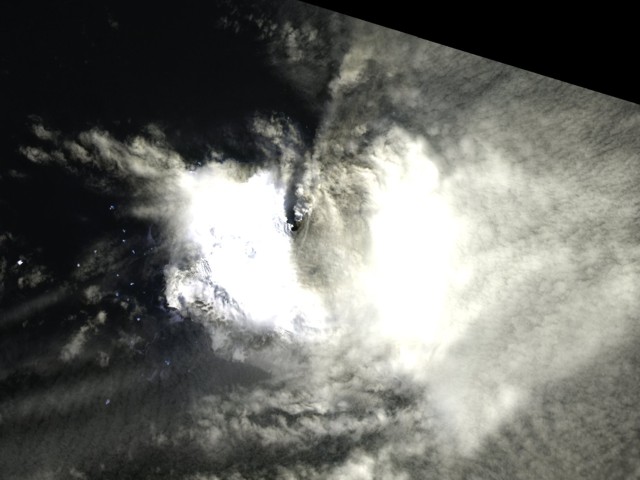 |
Figure 19. ASTER near-infrared image of Montagu Island volcano at 1115 UTC on 17 December 2006. Courtesy of ASTER Volcano Archive. |
Thermal anomalies from Montagu were often detected by MODIS satellite instruments nearly weekly from at least 2006 until 20 September 2007. However, during that interval anomalies were absent for more than two months, from January 2007 through late March 2007. Anomalies were also absent from 21 September 2007 to 17 April 2008. The absence of anomalies could be due to lack of visibility, or the chilling of lava flows after the end of an eruptive phase.
Information Contacts: ASTER Volcano Archive (URL: http://ava.jpl.nasa.gov/); Hawai'i Institute of Geophysics and Planetology (HIGP) Thermal Alerts System, School of Ocean and Earth Science and Technology (SOEST), Univ. of Hawai'i, 2525 Correa Road, Honolulu, HI 96822, USA (URL: http://modis.higp.hawaii.edu/);.
Eruption of Mount Belinda ceased by late 2007
MODVOLC thermal alerts and a recent ASTER image indicate that the eruption of Mount Belinda, on Montagu Island, which began in 2001, has ceased. There have been no MODVOLC alerts over the volcano since September 2007 (BGVN 33:03) and a cloud-free ASTER thermal image from 19 July 2008 confirms the absence of a thermal anomaly at the summit of Mount Belinda.
The eruption, the first recorded historical activity at the volcano, began in October 2001 and probably ceased in September 2007, amounting to almost six years of persistent activity. The activity was characterized by low-level ash emission from the summit of Mount Belinda, an intra-caldera cone. At least three effusive events produced lava flows that cut into the island's ice cover. The largest effusive event, in September 2005, created a flow which traveled 3.5 km to reach the sea, creating a 500 m wide delta on the N shore. This delta remained on a July 2008 ASTER image (figure 20).
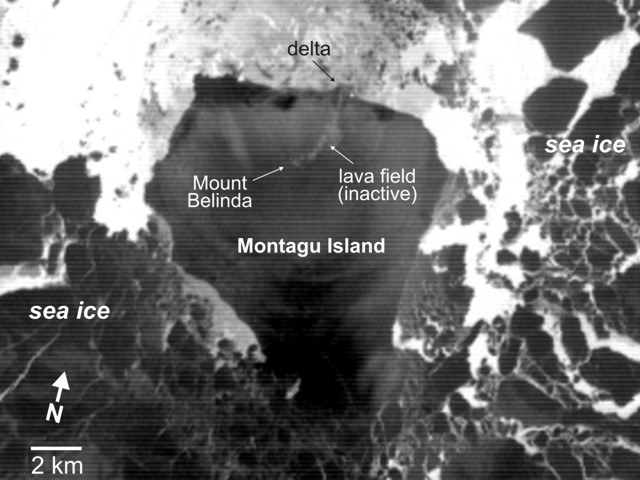 |
Figure 20. ASTER thermal image taken on 19 July 2008 showing Montagu Island and surroundings. The absence of eruptive activity is shown by the lack of high thermal radiance areas. The September 2005 lava delta on the N coast had not eroded away. Courtesy of Matt Patrick. |
Information Contacts: Matt Patrick, Hawaiian Volcano Observatory (HVO), U.S. Geological Survey, PO Box 51, Hawai'i National Park, HI 96718, USA (URL: https://volcanoes.usgs.gov/observatories/hvo/); John Smellie, British Antarctic Survey, Natural Environment Research Council, High Cross, Madingly Road, Cambridge CB3 0ET, United Kingdom (URL: https://www.bas.ac.uk/).
Quiet, with minor thermal anomalies, since September 2007
As of late October 2010, Montagu Island displayed only very localized and minor thermal anomalies of insufficient size to indicate an eruption. As previously reported, Montagu Island displayed frequent thermal anomalies, several lava flows, and a low-level ash plume in December 2006, but eruptions ceased after September 2007 (BGVN 33:03 and 33:07).
MODVOLC thermal anomalies have remained absent between September 2007 and 31 October 2010, and ASTER thermal images over the past few years lacked indication of eruptive activity. The most recent cloud-free ASTER image (figure 21) shows relatively small thermal anomalies on the 2005 flow field that Patrick believes likely represent fumaroles venting residual heat from the lava flow.
|
Figure 21. ASTER image of Montagu Island taken on 21 March 2010 showing the 2005 lava flow from Mt. Belinda. As of late October 2010, this was the most recent cloud-free ASTER image of Montagu Island (based on Aster band 14, 11-micron wavelength). Courtesy of Matt Patrick (USGS) and the ASTER project. |
According to Matt Patrick (USGS), several small (1-2 pixels in size) thermal anomalies are situated near the summit of Mt. Belinda on the proximal section of the 2005 flow. In addition, a larger (3 x 2 pixels) anomaly is at the E end of the delta formed in 2005 when lava entered the ocean. Patrick notes that this thermal anomaly on the delta has been present in ASTER images going back to 2008 and, as with the anomaly above, likely indicates residual heat escape.
Information Contacts: Matthew R. Patrick, Hawaiian Volcano Observatory (HVO), U.S. Geological Survey, PO Box 51, Hawai'i National Park, HI 96718, USA (URL: https://volcanoes.usgs.gov/observatories/hvo/); Hawai'i Institute of Geophysics and Planetology (HIGP) Thermal Alerts System, School of Ocean and Earth Science and Technology (SOEST), Univ. of Hawai'i, 2525 Correa Road, Honolulu, HI 96822, USA (URL: http://modis.higp.hawaii.edu/); ASTER (Advanced Spaceborne Thermal Emission and Reflection Radiometer), Earth Remote Sensing Data Analysis Center (ERSDAC) in Japan, and the Jet Propulsion Laboratory in the U.S. (URL: http://asterweb.jpl.nasa.gov/).
|
|
||||||||||||||||||||||||||
There is data available for 1 confirmed eruptive period.
2001 Oct 1 ± 20 days - 2007 Sep 20 Confirmed Eruption (Explosive / Effusive) VEI: 1 (?)
| Episode 1 | Eruption (Explosive / Effusive) | NW of Mount Belinda | ||||||||||||||||||||||||||||||||||||||
|---|---|---|---|---|---|---|---|---|---|---|---|---|---|---|---|---|---|---|---|---|---|---|---|---|---|---|---|---|---|---|---|---|---|---|---|---|---|---|---|
| 2001 Oct 1 ± 20 days - 2007 Sep 20 | Evidence from Observations: Reported | ||||||||||||||||||||||||||||||||||||||
|
List of 6 Events for Episode 1 at NW of Mount Belinda
|
|||||||||||||||||||||||||||||||||||||||
[ 1996 Sep 1 ± 180 days ] Uncertain Eruption
| Episode 1 | Eruption (Explosive / Effusive) | |||||||||||||||||||
|---|---|---|---|---|---|---|---|---|---|---|---|---|---|---|---|---|---|---|---|
| 1996 Sep 1 ± 180 days - Unknown | Evidence from Unknown | ||||||||||||||||||
|
List of 2 Events for Episode 1
|
|||||||||||||||||||
This compilation of synonyms and subsidiary features may not be comprehensive. Features are organized into four major categories: Cones, Craters, Domes, and Thermal Features. Synonyms of features appear indented below the primary name. In some cases additional feature type, elevation, or location details are provided.
Synonyms |
||||
| Isla Jorge | ||||
Cones |
||||
| Feature Name | Feature Type | Elevation | Latitude | Longitude |
| Belinda, Mount | Cone | 1295 m | 58° 26' 11.00" S | 26° 20' 43.00" W |
| Oceanite, Mount | Cone | 900 m | 58° 30' 0.00" S | 26° 17' 25.00" W |
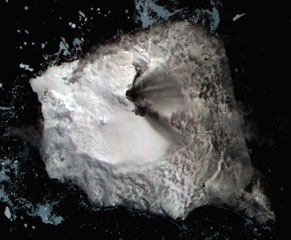 This 7 December 2003 ASTER satellite image shows Montagu island with recent volcanic deposits visible across the icy surface of the island from Mount Belinda. The smooth ice and snow south of Belinda reflects 6 km wide caldera. A dark lava flow can be seen extending NE from the summit vent (towards the top). The dark feature extending south from the summit (towards the bottom right) is the shadow of a small ash plume rising to the southeast. Ash deposits are visible in a fan right of the central vent (E).
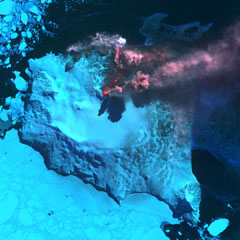 An ASTER satellite infrared image shows Montagu Island's Mount Belinda in eruption on 23 September 2005. A reddish dot (center) marks a thermal anomaly representing an active lava lake at the summit vent. An ash plume rising above the cone casts a shadow on the glacier and is blown eastward by prevailing winds. An active lava flow extends northeast of the vent, before turning to the north and entering the sea on the north coast of the island. Steam clouds are visible where the flow reaches the sea. The eruption was first detected using thermal anomalies detected by satellite instruments in October 2001. Sea ice partially surrounds the island.
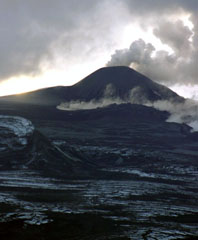 This 13 January 2006 view of the north side of Montagu Island shows the lava field formed by a recent eruption. A plume rising above Mount Belinda appears to be dominantly composed of steam. The snaking plume of steam in front of the cone likely indicates the location of hot lava flow. There was no record of Holocene activity at Montagu until satellite data, beginning in late 2001, revealed thermal anomalies consistent with lava lake activity.
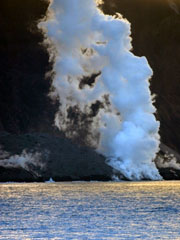 Steam rises from lava flows entering the ocean on the north side of Montagu Island on 13 January 2006. Satellite imagery showed that the lava flow had reached the north coast in September 2005 and began forming a new lava delta.
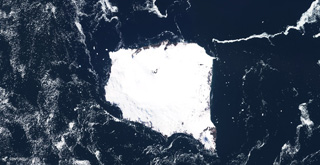 The glaciated 12 x 12 km Montagu Island in the South Sandwich Islands is shown in this 2 December 2019 Sentinel-2 satellite image (N is at the top). The highest point is Mount Belinda near the northern coastline with the dark crater apparent here, which appears to have formed within a 6-km-diameter, ice-filled caldera. The SE peninsula is Mount Oceanite.
There are no samples for Montagu Island in the Smithsonian's NMNH Department of Mineral Sciences Rock and Ore collection.
| Copernicus Browser | The Copernicus Browser replaced the Sentinel Hub Playground browser in 2023, to provide access to Earth observation archives from the Copernicus Data Space Ecosystem, the main distribution platform for data from the EU Copernicus missions. |
| MIROVA | Middle InfraRed Observation of Volcanic Activity (MIROVA) is a near real time volcanic hot-spot detection system based on the analysis of MODIS (Moderate Resolution Imaging Spectroradiometer) data. In particular, MIROVA uses the Middle InfraRed Radiation (MIR), measured over target volcanoes, in order to detect, locate and measure the heat radiation sourced from volcanic activity. |
| MODVOLC Thermal Alerts | Using infrared satellite Moderate Resolution Imaging Spectroradiometer (MODIS) data, scientists at the Hawai'i Institute of Geophysics and Planetology, University of Hawai'i, developed an automated system called MODVOLC to map thermal hot-spots in near real time. For each MODIS image, the algorithm automatically scans each 1 km pixel within it to check for high-temperature hot-spots. When one is found the date, time, location, and intensity are recorded. MODIS looks at every square km of the Earth every 48 hours, once during the day and once during the night, and the presence of two MODIS sensors in space allows at least four hot-spot observations every two days. Each day updated global maps are compiled to display the locations of all hot spots detected in the previous 24 hours. There is a drop-down list with volcano names which allow users to 'zoom-in' and examine the distribution of hot-spots at a variety of spatial scales. |
|
WOVOdat
Single Volcano View Temporal Evolution of Unrest Side by Side Volcanoes |
WOVOdat is a database of volcanic unrest; instrumentally and visually recorded changes in seismicity, ground deformation, gas emission, and other parameters from their normal baselines. It is sponsored by the World Organization of Volcano Observatories (WOVO) and presently hosted at the Earth Observatory of Singapore.
GVMID Data on Volcano Monitoring Infrastructure The Global Volcano Monitoring Infrastructure Database GVMID, is aimed at documenting and improving capabilities of volcano monitoring from the ground and space. GVMID should provide a snapshot and baseline view of the techniques and instrumentation that are in place at various volcanoes, which can be use by volcano observatories as reference to setup new monitoring system or improving networks at a specific volcano. These data will allow identification of what monitoring gaps exist, which can be then targeted by remote sensing infrastructure and future instrument deployments. |
| Volcanic Hazard Maps | The IAVCEI Commission on Volcanic Hazards and Risk has a Volcanic Hazard Maps database designed to serve as a resource for hazard mappers (or other interested parties) to explore how common issues in hazard map development have been addressed at different volcanoes, in different countries, for different hazards, and for different intended audiences. In addition to the comprehensive, searchable Volcanic Hazard Maps Database, this website contains information about diversity of volcanic hazard maps, illustrated using examples from the database. This site is for educational purposes related to volcanic hazard maps. Hazard maps found on this website should not be used for emergency purposes. For the most recent, official hazard map for a particular volcano, please seek out the proper institutional authorities on the matter. |
| IRIS seismic stations/networks | Incorporated Research Institutions for Seismology (IRIS) Data Services map showing the location of seismic stations from all available networks (permanent or temporary) within a radius of 0.18° (about 20 km at mid-latitudes) from the given location of Montagu Island. Users can customize a variety of filters and options in the left panel. Note that if there are no stations are known the map will default to show the entire world with a "No data matched request" error notice. |
| UNAVCO GPS/GNSS stations | Geodetic Data Services map from UNAVCO showing the location of GPS/GNSS stations from all available networks (permanent or temporary) within a radius of 20 km from the given location of Montagu Island. Users can customize the data search based on station or network names, location, and time window. Requires Adobe Flash Player. |
| DECADE Data | The DECADE portal, still in the developmental stage, serves as an example of the proposed interoperability between The Smithsonian Institution's Global Volcanism Program, the Mapping Gas Emissions (MaGa) Database, and the EarthChem Geochemical Portal. The Deep Earth Carbon Degassing (DECADE) initiative seeks to use new and established technologies to determine accurate global fluxes of volcanic CO2 to the atmosphere, but installing CO2 monitoring networks on 20 of the world's 150 most actively degassing volcanoes. The group uses related laboratory-based studies (direct gas sampling and analysis, melt inclusions) to provide new data for direct degassing of deep earth carbon to the atmosphere. |
| Large Eruptions of Montagu Island | Information about large Quaternary eruptions (VEI >= 4) is cataloged in the Large Magnitude Explosive Volcanic Eruptions (LaMEVE) database of the Volcano Global Risk Identification and Analysis Project (VOGRIPA). |
| EarthChem | EarthChem develops and maintains databases, software, and services that support the preservation, discovery, access and analysis of geochemical data, and facilitate their integration with the broad array of other available earth science parameters. EarthChem is operated by a joint team of disciplinary scientists, data scientists, data managers and information technology developers who are part of the NSF-funded data facility Integrated Earth Data Applications (IEDA). IEDA is a collaborative effort of EarthChem and the Marine Geoscience Data System (MGDS). |

