Keyword Collections | Keyword "volcano monitoring"
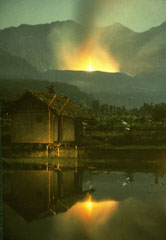 Strombolian eruptions from the crater of Galunggung volcano on 23 December 1982 are reflected in a pond at Kubanghurang village, SE of the volcano. The vertical orange lines crossing the house at the left are the traces of an Electronic Distance Measurement (EDM) laser used by Volcanological Survey of Indonesia scientists to monitor deformation of the volcano.
Photo by Ruska Hadian, 1982 (Volcanological Survey of Indonesia).
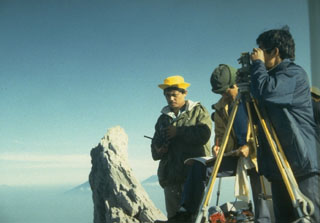 Scientists from the Volcanological Survey of Indonesia make theodolite measurements to determine the height and volume of the growing lava dome at the summit of Merapi volcano in central Java. The pinnacle to the left is the former summit spine of Merapi.
Photo by Ruska Hadian, 1993 (Volcanological Survey of Indonesia).
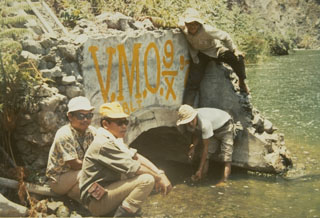 Volcanological Survey of Indonesia scientists measure water levels at a drainage tunnel of Kelud crater lake in 1973. A series of drainage tunnels and shafts were constructed following the devastating 1919 eruption that killed 5,110 people to decrease the amount of water in the summit crater lake. Loss of life from devastating lahars produced by the explosive ejection of crater lake water has been significantly reduced in subsequent eruptions, although a new tunnel needed to be installed after a 1951 eruption deepened the crater by 70 m.
Photo by Sumarma Hamidi, 1973 (Volcanological Survey of Indonesia).
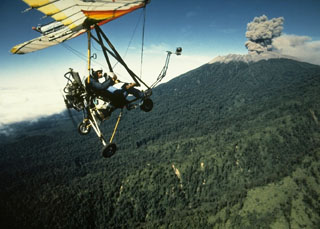 An ultralight aircraft was used by scientists from France and the Volcanological Survey of Indonesia to monitor activity at Raung in 1988. This July view shows an ash plume rising above the forested northern flank of Raung volcano. Hundreds of explosive eruptions were recorded during August and September 1988. This eruption began in 1987 and continued into 1989.
Photo by Willem Rohi, 1988 (Volcanological Survey of Indonesia).
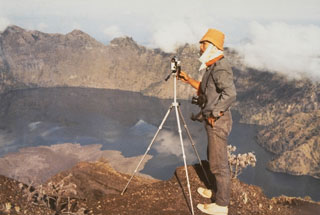 A scientist from the Volcanological Survey of Indonesia makes theodolite measurements along the N rim of the 5-km-wide Segara Anak caldera of Rinjani on Lombok Island. The lobate lava flow entering the lake at the lower left was erupted in 1944 from a vent on the NW flank of Gunung Barujari.
Photo by Sumarna Hamidi, 1973 (Volcanological Survey of Indonesia).
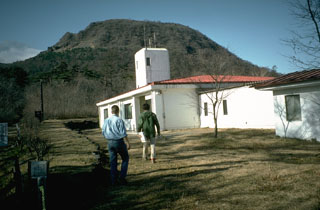 The Asamayama Volcano Observatory, operated by the University of Tokyo, is a base for geological, geophysical, and geochemical monitoring of the active volcano. The observatory is located on the E flank below Ko-Asamayama, the late-Pleistocene lava dome in the background that formed about 18,000 years ago.
Photo by Tom Simkin, 1993 (Smithsonian Institution).
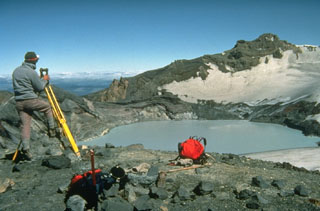 New Zealand volcanologist Brad Scott conducts theodolite (detecting height changes) measurements at Ruapehu’s Crater Lake in 1988. Measurements of the lake height, temperature, and chemistry are made routinely, and along with seismic instrumentation, are used to help forecast future activity of the volcano. Intermittent steam explosions from beneath the lake have produced lahars, which have damaged ski facilities on the upper flanks and structures in valleys below the volcano.
Photo by Don Swanson, 1984 (U.S. Geological Survey).
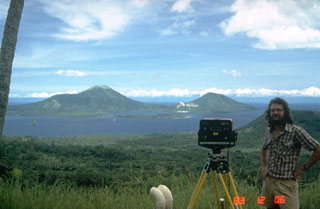 A volcanologist from the Rabaul Volcano Observatory beside an instrument used to make electronic distance measurements (EDM) across Rabaul caldera. Repeated precise measurements of the distance to stations on opposite sides of the caldera are used for monitoring the slow decade-long deformation that preceded a major eruption in 1994. Two pre-caldera peaks, Mount Kombiu (left) and Mount Turanguna (right) are located near the NE caldera rim.
Photo by Norm Banks, 1983 (U.S. Geological Survey).
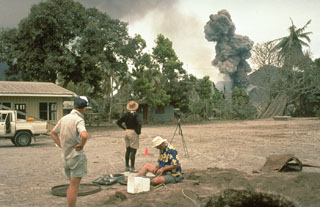 Scientists from the Rabaul Volcano Observatory and the U.S. Geological Survey observe an eruption plume from Tavurvur volcano on 4 October 1994, while conducting deformation measurements on Matupit Island. This location was a tilt site where repeated measurements of uplift or subsidence were made during the course of the eruption. The pit at the lower right was excavated to study ashfall deposits from the eruption.
Photo by Elliot Endo, 1994 (U.S. Geological Survey).
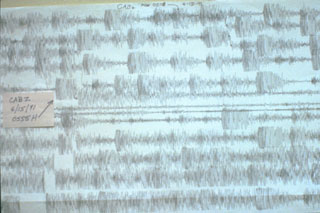 The seismogram for 15 June 1991 shows the intense seismicity accompanying the catastrophic eruption of Mount Pinatubo in the Philippines. This seismic record shows earthquakes over a two-hour period beginning at 0508 hours. The arrow points to the earthquake accompanying a major explosion at 0555, which was preceded by long-period earthquakes. At about 0640 continuous overlapping long-period earthquakes or tremor began, and much of the following record was saturated so that individual earthquakes could not be distinguished.
Photo by Ed Wolfe, 1991 (U.S. Geological Survey).
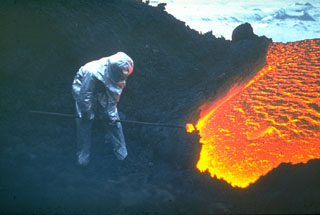 A volcanologist from the Institute of Volcanology in Petropavlovsk, shielded from the intense heat in a reflective suit, extracts a glowing sample of lava from a flank vent of Klyuchevskoy volcano in 1983. Geochemical analysis of lava samples is used to understand the eruption dynamics and the magmatic history of the volcano. Eruptions of flank and summit lava flows are common here. Protective clothing is always needed when working on active volcanoes, but sampling at lava flows such as this is rare.
Photo by A. Ozerov, 1983 (courtesy of Yuri Doubik, Institute of Volcanology, Petropavlovsk).
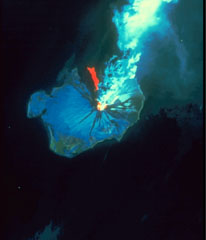 This Landsat thematic mapper image was acquired on 28 August 1986, as Augustine produced a powerful explosive eruption. An 11-km-high ash plume rises from the summit crater to the top of the false-color image. The red area in this false-color image is a hot pyroclastic flow deposit down the north flank. Snow and ice show up as shades of blue and vegetated areas along the coast are green. The dark areas descending the flanks are the paths of lahars and cooled pyroclastic flows.
NASA Landsat image, 1990.
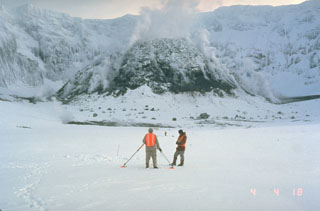 U.S. Geological Survey scientists make precision leveling measurements in the crater of Mount St. Helens in February 1982 with the steaming lava dome in the background. Repeated measurements of deformation was one of several methods used by scientists to successfully forecast later eruptions from the crater.
Photo by Terry Leighley, 1982 (U.S. Geological Survey).
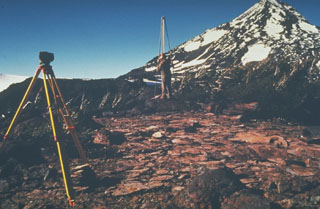 U.S. Geological Survey scientists monitor deformation on the Three Sisters volcanoes in the central Oregon Cascades, with Middle Sister volcano in the background. Precise leveling that permits detection of minor uplift is one of several monitoring techniques used to forecast eruptions.
Photo by John Ewert, 1985 (U.S. Geological Survey).
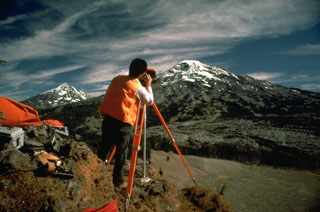 Electronic Distance Measurements (EDM) by the U.S. Geological Survey at South Sister volcano, with Middle Sister to the left, are conducted routinely to monitor these Cascades volcanoes for potential eruptive activity. By measuring the distance between two fixed points, these instruments can detect minor changes in the surface of the volcanic edifice that can occur prior to eruptions.
Photo by Lyn Topinka, 1985 (U.S. Geological Survey).
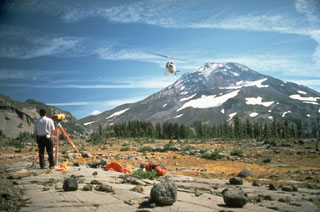 A helicopter delivers supplies to a U.S. Geological Survey field crew conducting Electronic Distance Measurement surveys on the flank of South Sister volcano in the central Cascades of Oregon.
Photo by Lyn Topinka, 1986 (U.S. Geological Survey).
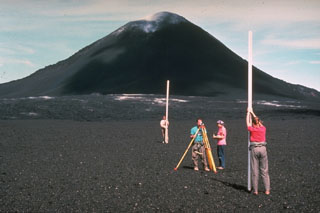 Among the many monitoring techniques used by Hawaiian Volcano Observatory staff at Kīlauea volcano is precision leveling. Millimeter-scale changes can be detected with an optical-level instrument by measuring the precise difference in elevation on leveling rods placed above two fixed points. Slight changes in the shape of a volcanic edifice commonly occurs prior to eruptions. Measurements such as these in 1968, with the Puʻu ʻŌʻō scoria cone in the background, are one of several techniques used to help forecast eruptive events.
Photo by Richard Fiske, 1986 (Smithsonian Institution).
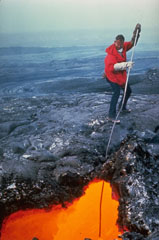 A volcanologist from the Hawaiian Volcano Observatory extracts a sample of fresh lava from an active lava tube during the 1969-74 Mauna Ulu eruption. Asbestos gloves were used for protection against the intense radiant heat. Sampling at various stages of an eruption is used to determine changes in the chemistry and mineralogy of erupted lavas.
Photo by Bob Tilling, 1973 (U.S. Geological Survey).
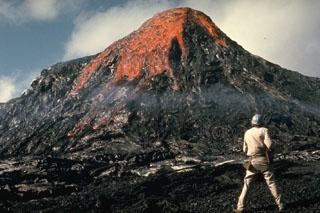 This eruption was observed by Hawaiian Volcano Observatory volcanologist Jack Lockwood on 28 February 1974, near the end of the 5-year-long Mauna Ulu eruption. As the erupting lava solidifies around the vent the feature gets progressively larger.
Photo by Robin Holcomb, 1974 (U.S. Geological Survey).
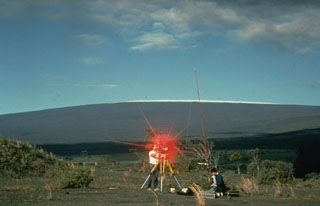 Hawaiian Volcano Observatory scientists conduct an electronic-distance measurement (EDM) survey on the rim of Kīlauea caldera in 1988, with snow-capped Mauna Loa in the background. The procedure uses a laser beam, which is reflected back to the EDM instrument from a distant cluster of reflectors. A precise determination of the distance between the two points is made by a small computer in the EDM instrument. These measurements allow scientists to detect inflation or deflation of the volcano due to changes in the magmatic or hydrothermal systems.
Photo by J. D. Griggs, 1988 (U.S. Geological Survey).
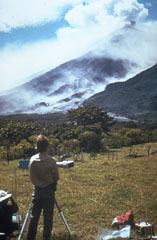 Scientists use a COSPEC (Correlation Spectrometer) instrument to measure the sulfur dioxide (SO2) content of a volcanic plume from Fuego volcano in Guatemala. Measuring the amount of SO2 and other gases in volcanic plumes are useful tools for eruption monitoring. This photo of Dick Stoiber (left) and Gary Malone (standing) was taken by Tom Crafford from Finca Capetillo NE of Fuego during its October 1974 eruption.
Photo by Tom Crafford, 1974 (Dartmouth College, courtesy of Dick Stoiber).
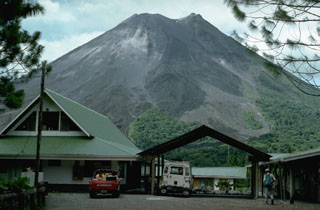 The Arenal Observatory Lodge was constructed at the site of a joint OVSICORI-UNA/Smithsonian Institution volcano observatory established on the SSW flank. The observatory building itself, out of view to the right, was used for seismic monitoring and visual documentation of the frequent eruptive activity from Arenal. This photo was taken in 1992.
Photo by William Melson, 1992 (Smithsonian Institution).
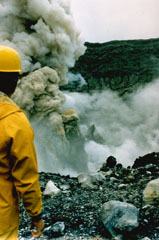 A geologist observes an ash plume rising 400 m above the summit crater of Poás on 25 April 1989. By 19 April, four days before this explosion, the crater lake had disappeared. In May 1989 ash plumes reached 1.5-2 km above the crater.
Photo by Gerardo Soto, 1989 (Instituto Costarricense de Electridad).
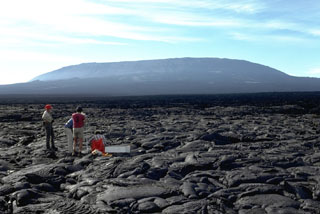 Fernandina volcano in the Galápagos exhibits steep upper flanks formed by eruptions of lava flows from circumferential fissures around a summit caldera rim, contrasting with the broad, low-angle lower flanks. Scientists from the Smithsonian Institution, U.S. Geological Survey, and the Charles Darwin Research Station conduct measurements on a pāhoehoe lava flow near the SE coast. Young, unvegetated lava flows cover the flanks.
Photo by Chuck Wood, 1978 (Smithsonian Institution).
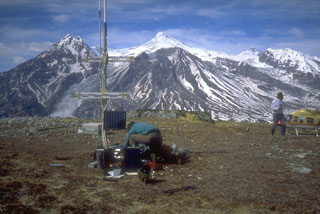 Seismometers such as this one installed near Mount Spurr volcano (on skyline in background) provide the Alaska Volcano Observatory with a continuous, telemetered record of volcanic earthquakes. Scientists use this data to monitor earthquake types, locations, and magnitudes to decipher different processes under and within a volcano.
Photo by Christina Neal, 1993 (Alaska Volcano Observatory, U.S. Geological Survey).
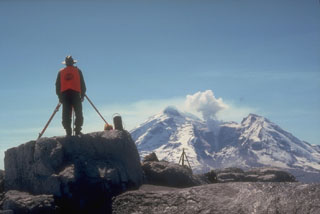 An Alaska Volcano Observatory geologist uses a laser-surveying instrument to measure precise distances to targets installed on the flanks of Redoubt. Minute changes in distances to the targets can reflect ground deformation that may indicate magma movement or other processes. Steam rises above a lava dome in the crater of Redoubt in this photo taken on 5 May 1990, near the end of an eruption that had begun the previous December.
Photo by Game McGimsey, 1990 (Alaska Volcano Observatory, U.S. Geological Survey).
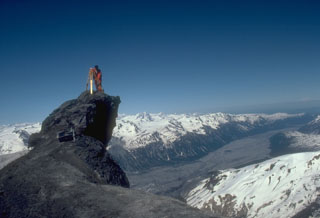 An Alaska Volcano Observatory geologist sets up GPS (Global Positioning System) instrumentation on the N flank of Redoubt volcano. The GPS receiver calculates an extremely accurate location through satellite-based triangulation. This helps pinpoint locations for electronic distance measurements that detect deformation that may be related to eruptive activity. The Drift River valley extending away from the volcano to the NE was covered with pyroclastic-flow and mudflow deposits from the 1989-90 eruption.
Photo by Game McGimsey, 1991 (Alaska Volcano Observatory, U.S. Geological Survey).
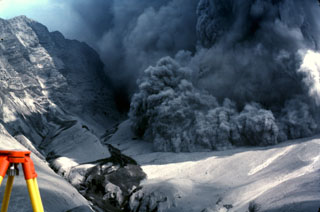 An explosive eruption from Galunggung on 7 August 1982 is accompanied by a pyroclastic flow advancing over the crater rim towards a reflector station that was being measured using the tripod to the lower left. The photo was taken from Butik Pasir Bentag, about 2 km from the crater. The 1-km-high ash-covered cliff to the left is a wall of the breached caldera.
Photo by Jack Lockwood, 1982 (U.S. Geological Survey).
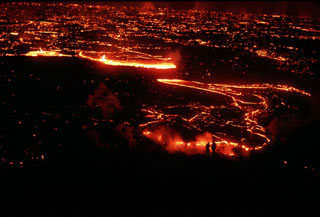 Scientists investigating a lava flow from Krafla volcano are silhouetted (lower right) against the glowing margin of the slowly advancing flow. This photo was taken on 5 September 1984, the day after the onset of an eruption from the Leihrnjúkur fissure. Cracks on the surface of the advancing flow reveal the still-molten interior.
Photo by Michael Ryan, 1984 (U.S. Geological Survey).
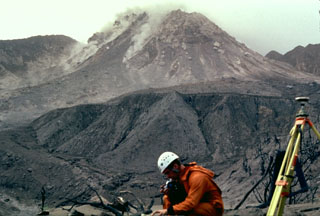 Scientists from the Montserrat Volcano Observatory make monitoring measurements in February 1997 as small rockfalls descend the flanks of the lava dome. Castle Peak lava dome, constructed during the previous eruption of Soufrière Hills during the 17th century, had collapsed three days before this photograph was taken from the Tar River Estate house, 2 km NE of the dome. Periodic collapse of the growing lava dome produced pyroclastic flows that in some cases reached the sea.
Photo by Mark Davies, 1997 (Montserrat Volcano Observatory).
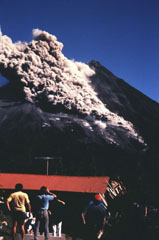 People at the Arenal Volcano Observatory watch a S-flank pyroclastic flow on 23 January 1991. Pyroclastic flows occasionally descended the flanks throughout the long-lived eruption that began in 1968.
Photo by McDiarmid, 1991 (courtesy of William Melson, Smithsonian Institution).
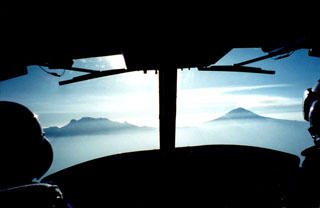 A view from a helicopter heading east towards Popocatépetl (right) and Iztaccíhuatl (left) in March 2000 during a monitoring flight. Opposing winds above 6 km give the gas plume from Popocatépetl an "S" shape. The Centro Nacional de Prevención de Desastres (CENAPRED) is engaged in an active monitoring program on Popocatépetl using instrumentation to evaluate seismic, geodetic, and geochemical parameters of the ongoing eruption.
Photo by Servando De la Cruz-Reyna, 2000 (Universidad Nacional Autónoma de México).
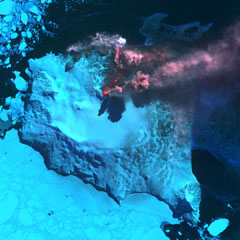 An ASTER satellite infrared image shows Montagu Island's Mount Belinda in eruption on 23 September 2005. A reddish dot (center) marks a thermal anomaly representing an active lava lake at the summit vent. An ash plume rising above the cone casts a shadow on the glacier and is blown eastward by prevailing winds. An active lava flow extends northeast of the vent, before turning to the north and entering the sea on the north coast of the island. Steam clouds are visible where the flow reaches the sea. The eruption was first detected using thermal anomalies detected by satellite instruments in October 2001. Sea ice partially surrounds the island.
ASTER satellite image courtesy of Hawaii Institute of Geophysics and Planetology (HIGP) Thermal Alerts Team, 2005.
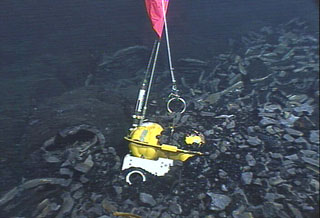 An eruption in 2005-2006 that covered 23 km2 of sea floor with lava at the East Pacific Rise encased three ocean-bottom seismometers. Scientists successfully recovered two seismometers that were deployed in 2003 with the remotely operated vehicle Jason during a National Science Foundation/Woods Hole Oceanographic Institution expedition in April 2007.
Photo courtesy National Deep Submergence Facility, ROV Jason, Woods Hole Oceanographic Institution and National Science Foundation.
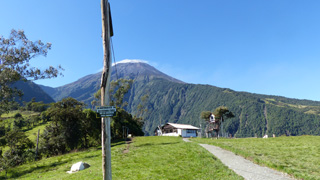 This 3 December 2015 photo shows the Volcán Tungurahua SSW flank from the Casa de Arbol, where IG-EPN operate a seismic station (Runtun). The station is managed by a member of the vigía network, which is a community based monitoring system of volunteers who observe nearby volcanoes and communicate activity to Tungurahua Volcano Observatory volcanologists and local officials. A weak degassing plume is dispersing to the right from the summit, which is also under a small meteorological cloud.
Photo by Ailsa Naismith, 2015.