Recently Published Bulletin Reports
Erebus (Antarctica) Lava lake remains active; most thermal alerts recorded since 2019
Rincon de la Vieja (Costa Rica) Frequent phreatic explosions during July-December 2023
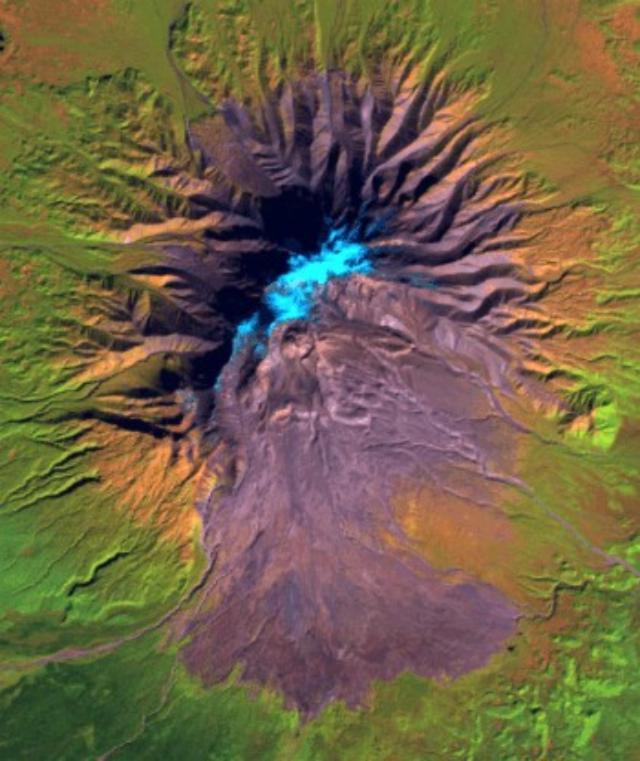
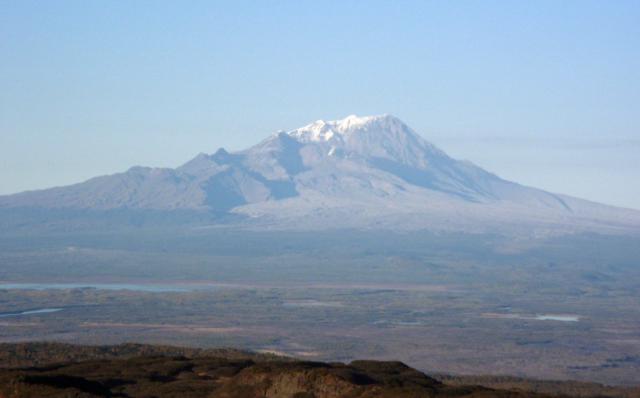
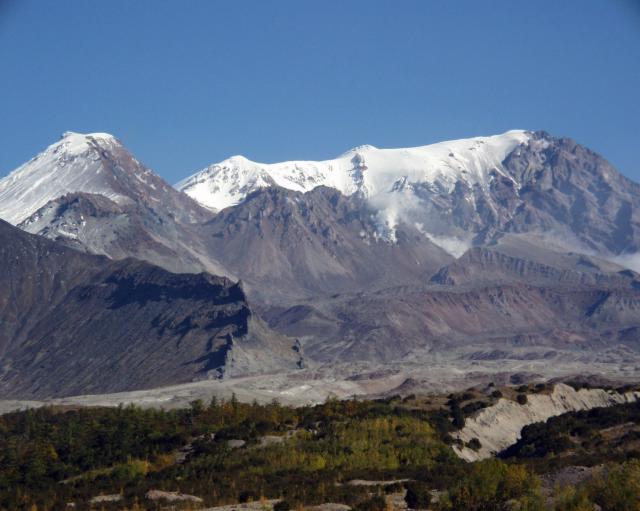
Bezymianny (Russia) Explosion on 18 October 2023 sends ash plume 8 km high; lava flows and incandescent avalanches
Kilauea (United States) Low-level lava effusions in the lava lake at Halema’uma’u during July-December 2022
Nyamulagira (DR Congo) Lava flows and thermal activity during May-October 2023
Bagana (Papua New Guinea) Explosions, ash plumes, ashfall, and lava flows during April-September 2023
Mayon (Philippines) Lava flows, pyroclastic flows, ash emissions, and seismicity during April-September 2023
Nishinoshima (Japan) Eruption plumes and gas-and-steam plumes during May-August 2023
Krakatau (Indonesia) White gas-and-steam plumes and occasional ash plumes during May-August 2023
Villarrica (Chile) Strombolian activity, gas-and-ash emissions, and crater incandescence during April-September 2023
Merapi (Indonesia) Frequent incandescent avalanches during April-September 2023
Ebeko (Russia) Moderate explosive activity with ash plumes continued during June-November 2023
Erebus (Antarctica) — January 2024  Cite this Report
Erebus
Antarctica
77.53°S, 167.17°E; summit elev. 3794 m
All times are local (unless otherwise noted)
Lava lake remains active; most thermal alerts recorded since 2019
The lava lake in the summit crater of Erebus has been active since at least 1972. Located in Antarctica overlooking the McMurdo Station on Ross Island, it is the southernmost active volcano on the planet. Because of the remote location, activity is primarily monitored by satellites. This report covers activity during 2023.
The number of thermal alerts recorded by the Hawai'i Institute of Geophysics and Planetology’s MODVOLC Thermal Alerts System increased considerably in 2023 compared to the years 2020-2022 (table 9). In contrast to previous years, the MODIS instruments aboard the Aqua and Terra satellites captured data from Erebus every month during 2023. Consistent with previous years, the lowest number of anomalous pixels were recorded in January, November, and December.
Table 9. Number of monthly MODIS-MODVOLC thermal alert pixels recorded at Erebus during 2017-2023. See BGVN 42:06 for data from 2000 through 2016. The table was compiled using data provided by the HIGP – MODVOLC Thermal Alerts System.
| Year |
Jan |
Feb |
Mar |
Apr |
May |
Jun |
Jul |
Aug |
Sep |
Oct |
Nov |
Dec |
SUM |
| 2017 |
0 |
21 |
9 |
0 |
0 |
1 |
11 |
61 |
76 |
52 |
0 |
3 |
234 |
| 2018 |
0 |
21 |
58 |
182 |
55 |
17 |
137 |
172 |
103 |
29 |
0 |
0 |
774 |
| 2019 |
2 |
21 |
162 |
151 |
55 |
56 |
75 |
53 |
29 |
19 |
1 |
0 |
624 |
| 2020 |
0 |
2 |
16 |
18 |
4 |
4 |
1 |
3 |
18 |
3 |
1 |
6 |
76 |
| 2021 |
0 |
9 |
1 |
0 |
2 |
56 |
46 |
47 |
35 |
52 |
5 |
3 |
256 |
| 2022 |
1 |
13 |
55 |
22 |
15 |
32 |
39 |
19 |
31 |
11 |
0 |
0 |
238 |
| 2023 |
2 |
33 |
49 |
82 |
41 |
32 |
70 |
64 |
42 |
17 |
5 |
11 |
448 |
Sentinel-2 infrared images showed one or two prominent heat sources within the summit crater, accompanied by adjacent smaller sources, similar to recent years (see BGVN 46:01, 47:02, and 48:01). A unique image was obtained on 25 November 2023 by the OLI-2 (Operational Land Imager-2) on Landsat 9, showing the upper part of the volcano surrounded by clouds (figure 32).
Geologic Background. Mount Erebus, the world's southernmost historically active volcano, overlooks the McMurdo research station on Ross Island. It is the largest of three major volcanoes forming the crudely triangular Ross Island. The summit of the dominantly phonolitic volcano has been modified by one or two generations of caldera formation. A summit plateau at about 3,200 m elevation marks the rim of the youngest caldera, which formed during the late-Pleistocene and within which the modern cone was constructed. An elliptical 500 x 600 m wide, 110-m-deep crater truncates the summit and contains an active lava lake within a 250-m-wide, 100-m-deep inner crater; other lava lakes are sometimes present. The glacier-covered volcano was erupting when first sighted by Captain James Ross in 1841. Continuous lava-lake activity with minor explosions, punctuated by occasional larger Strombolian explosions that eject bombs onto the crater rim, has been documented since 1972, but has probably been occurring for much of the volcano's recent history.
Information Contacts: Hawai'i Institute of Geophysics and Planetology (HIGP) - MODVOLC Thermal Alerts System, School of Ocean and Earth Science and Technology (SOEST), Univ. of Hawai'i, 2525 Correa Road, Honolulu, HI 96822, USA (URL: http://modis.higp.hawaii.edu/); Copernicus Browser, Copernicus Data Space Ecosystem, European Space Agency (URL: https://dataspace.copernicus.eu/browser/); NASA Earth Observatory, EOS Project Science Office, NASA Goddard Space Flight Center, Goddard, Maryland, USA (URL: https://earthobservatory.nasa.gov/images/152134/erebus-breaks-through).
Rincon de la Vieja (Costa Rica) — January 2024 Cite this Report
Rincon de la Vieja
Costa Rica
10.83°N, 85.324°W; summit elev. 1916 m
All times are local (unless otherwise noted)
Frequent phreatic explosions during July-December 2023
Rincón de la Vieja is a volcanic complex in Costa Rica with a hot convecting acid lake that exhibits frequent weak phreatic explosions, gas-and-steam emissions, and occasional elevated sulfur dioxide levels (BGVN 45:10, 46:03, 46:11). The current eruption period began June 2021. This report covers activity during July-December 2023 and is based on weekly bulletins and occasional daily reports from the Observatorio Vulcanologico Sismologica de Costa Rica-Universidad Nacional (OVSICORI-UNA).
Numerous weak phreatic explosions continued during July-December 2023, along with gas-and-steam emissions and plumes that rose as high as 3 km above the crater rim. Many weekly OVSICORI-UNA bulletins included the previous week's number of explosions and emissions (table 9). For many explosions, the time of explosion was given (table 10). Frequent seismic activity (long-period earthquakes, volcano-tectonic earthquakes, and tremor) accompanied the phreatic activity.
Table 9. Number of reported weekly phreatic explosions and gas-and-steam emissions at Rincón de la Vieja, July-December 2023. Counts are reported for the week before the Weekly Bulletin date; not all reports included these data. Courtesy of OVSICORI-UNA.
| OVSICORI Weekly Bulletin |
Number of explosions |
Number of emissions |
| 28 Jul 2023 |
6 |
14 |
| 4 Aug 2023 |
10 |
12 |
| 1 Sep 2023 |
13 |
11 |
| 22 Sep 2023 |
12 |
13 |
| 29 Sep 2023 |
6 |
11 |
| 6 Oct 2023 |
12 |
5 |
| 13 Oct 2023 |
7 |
9 |
| 20 Oct 2023 |
1 |
15 |
| 27 Oct 2023 |
3 |
23 |
| 3 Nov 2023 |
3 |
10 |
| 17 Nov 2023 |
0 |
Some |
| 24 Nov 2023 |
0 |
14 |
| 8 Dec 2023 |
4 |
16 |
| 22 Dec 2023 |
8 |
18 |
Table 10. Summary of activity at Rincón de la Vieja during July-December 2023. Weak phreatic explosions and gas emissions are noted where the time of explosion was indicated in the weekly or daily bulletins. Height of plumes or emissions are distance above the crater rim. Courtesy of OVSICORI-UNA.
| Date |
Time |
Description of Activity |
| 1 Jul 2023 |
0156 |
Explosion. |
| 2 Jul 2023 |
0305 |
Explosion. |
| 4 Jul 2023 |
0229, 0635 |
Event at 0635 produced a gas-and-steam plume that rose 700 m and drifted W; seen by residents in Liberia (21 km SW). |
| 9 Jul 2023 |
1843 |
Explosion. |
| 21 Jul 2023 |
0705 |
Explosion. |
| 26 Jul 2023 |
1807 |
Explosion. |
| 28 Jul 2023 |
0802 |
Explosion generated a gas-and-steam plume that rose 500 m. |
| 30 Jul 2023 |
1250 |
Explosion. |
| 31 Jul 2023 |
2136 |
Explosion. |
| 11 Aug 2023 |
0828 |
Explosion. |
| 18 Aug 2023 |
1304 |
Explosion. |
| 21 Aug 2023 |
1224 |
Explosion generated gas-and-steam plumes rose 500-600 m. |
| 22 Aug 2023 |
0749 |
Explosion generated gas-and-steam plumes rose 500-600 m. |
| 24 Aug 2023 |
1900 |
Explosion. |
| 25 Aug 2023 |
0828 |
Event produced a steam-and-gas plume that rose 3 km and drifted NW. |
| 27-28 Aug 2023 |
0813 |
Four small events; the event at 0813 on 28 August lasted two minutes and generated a steam-and-gas plume that rose 2.5 km. |
| 1 Sep 2023 |
1526 |
Explosion generated plume that rose 2 km and ejected material onto the flanks. |
| 2-3 Sep 2023 |
- |
Small explosions detected in infrasound data. |
| 4 Sep 2023 |
1251 |
Gas-and-steam plume rose 1 km and drifted W. |
| 7 Nov 2023 |
1113 |
Explosion. |
| 8 Nov 2023 |
0722 |
Explosion. |
| 12 Nov 2023 |
0136 |
Small gas emissions. |
| 14 Nov 2023 |
0415 |
Small gas emissions. |
According to OVSICORI-UNA, during July-October the average weekly sulfur dioxide (SO2) flux ranged from 68 to 240 tonnes/day. However, in mid-November the flux increased to as high as 334 tonnes/day, the highest value measured in recent years. The high SO2 flux in mid-November was also detected by the TROPOMI instrument on the Sentinel-5P satellite (figure 43).
Geologic Background. Rincón de la Vieja, the largest volcano in NW Costa Rica, is a remote volcanic complex in the Guanacaste Range. The volcano consists of an elongated, arcuate NW-SE-trending ridge constructed within the 15-km-wide early Pleistocene Guachipelín caldera, whose rim is exposed on the south side. Sometimes known as the "Colossus of Guanacaste," it has an estimated volume of 130 km3 and contains at least nine major eruptive centers. Activity has migrated to the SE, where the youngest-looking craters are located. The twin cone of Santa María volcano, the highest peak of the complex, is located at the eastern end of a smaller, 5-km-wide caldera and has a 500-m-wide crater. A Plinian eruption producing the 0.25 km3 Río Blanca tephra about 3,500 years ago was the last major magmatic eruption. All subsequent eruptions, including numerous historical eruptions possibly dating back to the 16th century, have been from the prominent active crater containing a 500-m-wide acid lake located ENE of Von Seebach crater.
Information Contacts: Observatorio Vulcanológico Sismológica de Costa Rica-Universidad Nacional (OVSICORI-UNA), Apartado 86-3000, Heredia, Costa Rica (URL: http://www.ovsicori.una.ac.cr/); NASA Global Sulfur Dioxide Monitoring Page, Atmospheric Chemistry and Dynamics Laboratory, NASA Goddard Space Flight Center (NASA/GSFC), 8800 Greenbelt Road, Goddard MD 20771, USA (URL: https://so2.gsfc.nasa.gov/).
Bezymianny (Russia) — November 2023 Cite this Report
Bezymianny
Russia
55.972°N, 160.595°E; summit elev. 2882 m
All times are local (unless otherwise noted)
Explosion on 18 October 2023 sends ash plume 8 km high; lava flows and incandescent avalanches
Bezymianny, located on Russia’s Kamchatka Peninsula, has had eruptions since 1955 characterized by dome growth, explosions, pyroclastic flows, ash plumes, and ashfall. Activity during November 2022-April 2023 included gas-and-steam emissions, lava dome collapses generating avalanches, and persistent thermal activity. Similar eruptive activity continued from May through October 2023, described here based on information from weekly and daily reports of the Kamchatka Volcano Eruptions Response Team (KVERT), notices from Tokyo VAAC (Volcanic Ash Advisory Center), and from satellite data.
Overall activity decreased after the strong period of activity in late March through April 2023, which included ash explosions during 29 March and 7-8 April 2023 that sent plumes as high as 10-12 km altitude, along with dome growth and lava flows (BGVN 48:05). This reduced activity can be seen in the MIROVA thermal detection system graph (figure 56), which was consistent with data from the MODVOLC thermal detection system and with Sentinel-2 satellite images that showed persistent hotspots in the summit crater when conditions allowed observations. A renewed period of strong activity began in mid-October 2023.
Activity increased significantly on 17 October 2023 when large collapses began during 0700-0830 on the E flanks of the lava dome and continued to after 0930 the next day (figure 57). Ash plumes rose to an altitude of 4.5-5 km, extending 220 km NNE by 18 October. A large explosion at 1630 on 18 October produced an ash plume that rose to an altitude of 11 km (8 km above the summit) and drifted NNE and then NW, extending 900 km NW within two days at an altitude of 8 km. Minor ashfall was noted in Kozyrevsk (45 km WNW). At 0820 on 20 October an ash plume was identified in satellite images drifting 100 km ENE at altitudes of 4-4.5 km.
Lava flows and hot avalanches from the dome down the SE flank continued over the next few days, including 23 October when clear conditions allowed good observations (figures 58 and 59). A large thermal anomaly was observed over the volcano through 24 October, and in the summit crater on 30 October (figure 60). Strong fumarolic activity continued, with numerous avalanches and occasional incandescence. By the last week of October, volcanic activity had decreased to a level consistent with that earlier in the reporting period.
Aviation warnings were frequently updated during 17-20 October. KVERT issued a Volcano Observatory Notice for Aviation (VONA) on 17 October at 1419 and 1727 (0219 and 0527 UTC) raising the Aviation Color Code (ACC) from Yellow to Orange (second highest level). The next day, KVERT issued a VONA at 1705 (0505 UTC) raising the ACC to Red (highest level) but lowered it back to Orange at 2117 (0917 UTC). After another decrease to Yellow and back to Orange, the ACC was reduced to Yellow on 20 October at 1204 (0004 UTC). In addition, the Tokyo VAAC issued a series of Volcanic Ash Advisories beginning on 16 October and continuing through 30 October.
Geologic Background. The modern Bezymianny, much smaller than its massive neighbors Kamen and Kliuchevskoi on the Kamchatka Peninsula, was formed about 4,700 years ago over a late-Pleistocene lava-dome complex and an edifice built about 11,000-7,000 years ago. Three periods of intensified activity have occurred during the past 3,000 years. The latest period, which was preceded by a 1,000-year quiescence, began with the dramatic 1955-56 eruption. This eruption, similar to that of St. Helens in 1980, produced a large open crater that was formed by collapse of the summit and an associated lateral blast. Subsequent episodic but ongoing lava-dome growth, accompanied by intermittent explosive activity and pyroclastic flows, has largely filled the 1956 crater.
Information Contacts: Kamchatka Volcanic Eruptions Response Team (KVERT), Far Eastern Branch, Russian Academy of Sciences, 9 Piip Blvd., Petropavlovsk-Kamchatsky, 683006, Russia (URL: http://www.kscnet.ru/ivs/kvert/); Kamchatka Volcanological Station, Kamchatka Branch of Geophysical Survey, (KB GS RAS), Klyuchi, Kamchatka Krai, Russia (URL: http://volkstat.ru/); Tokyo Volcanic Ash Advisory Center (VAAC), 1-3-4 Otemachi, Chiyoda-ku, Tokyo 100-8122, Japan (URL: http://ds.data.jma.go.jp/svd/vaac/data/); Hawai'i Institute of Geophysics and Planetology (HIGP) - MODVOLC Thermal Alerts System, School of Ocean and Earth Science and Technology (SOEST), Univ. of Hawai'i, 2525 Correa Road, Honolulu, HI 96822, USA (URL: http://modis.higp.hawaii.edu/); MIROVA (Middle InfraRed Observation of Volcanic Activity), a collaborative project between the Universities of Turin and Florence (Italy) supported by the Centre for Volcanic Risk of the Italian Civil Protection Department (URL: http://www.mirovaweb.it/); Copernicus Browser, Copernicus Data Space Ecosystem, European Space Agency (URL: https://dataspace.copernicus.eu/browser/).chr
Kilauea (United States) — January 2023 Cite this Report
Kilauea
United States
19.421°N, 155.287°W; summit elev. 1222 m
All times are local (unless otherwise noted)
Low-level lava effusions in the lava lake at Halema’uma’u during July-December 2022
Kīlauea is the southeastern-most volcano in Hawaii and overlaps the E flank of the Mauna Loa volcano. Its East Rift Zone (ERZ) has been intermittently active for at least 2,000 years. An extended eruption period began in January 1983 and was characterized by open lava lakes and lava flows from the summit caldera and the East Rift Zone. During May 2018 magma migrated into the Lower East Rift Zone (LERZ) and opened 24 fissures along a 6-km-long NE-trending fracture zone that produced lava flows traveling in multiple directions. As lava emerged from the fissures, the lava lake at Halema'uma'u drained and explosions sent ash plumes to several kilometers altitude (BGVN 43:10).
The current eruption period started during September 2021 and has recently been characterized by lava effusions, spatter, and sulfur dioxide emissions in the active Halema’uma’u lava lake (BGVN 47:08). Lava effusions, some spatter, and sulfur dioxide emissions have continued during this reporting period of July through December 2022 using daily reports, volcanic activity notices, and abundant photo, map, and video data from the US Geological Survey's (USGS) Hawaiian Volcano Observatory (HVO).
Summary of activity during July-December 2022. Low-level effusions have continued at the western vent of the Halema’uma’u crater during July through early December 2022. Occasional weak ooze-outs (also called lava break outs) would occur along the margins of the crater floor. The overall level of the active lava lake throughout the reporting period gradually increased due to infilling, however it stagnated in mid-September (table 13). During September through November, activity began to decline, though lava effusions persisted at the western vent. By 9 December, the active part of the lava lake had completely crusted over, and incandescence was no longer visible.
Table 13. Summary of measurements taken during overflights at Kīlauea that show a gradual increase in the active lava lake level and the volume of lava effused since 29 September 2021. Lower activity was reported during September-October. Data collected during July-December 2022. Courtesy of HVO.
| Date: |
Level of the active lava lake (m): |
Cumulative volume of lava effused (million cubic meters): |
| 7 Jul 2022 |
130 |
95 |
| 19 Jul 2022 |
133 |
98 |
| 4 Aug 2022 |
136 |
102 |
| 16 Aug 2022 |
137 |
104 |
| 12 Sep 2022 |
143 |
111 |
| 5 Oct 2022 |
143 |
111 |
| 28 Oct 2022 |
143 |
111 |
Activity during July 2022. Lava effusions were reported from the western vent in the Halema’uma’u crater, along with occasional weak ooze-outs along the margins of the crater floor. The height of the lava lake was variable due to deflation-inflation tilt events; for example, the lake level dropped approximately 3-4 m during a summit deflation-inflation event reported on 1 July. Webcam images taken during the night of 6-12 July showed intermittent low-level spattering at the western vent that rose less than 10 m above the vent (figure 519). Measurements made during an overflight on 7 July indicated that the crater floor was infilled about 130 m and that 95 million cubic meters of lava had been effused since 29 September 2021. A single, relatively small lava ooze-out was active to the S of the lava lake. Around midnight on 8 July there were two brief periods of lava overflow onto the lake margins. On 9 July lava ooze-outs were reported near the SE and NE edges of the crater floor and during 10-11 July they occurred near the E, NE, and NW edges. On 16 July crater incandescence was reported, though the ooze-outs and spattering were not visible. On 18 July overnight webcam images showed incandescence in the western vent complex and two ooze-outs were reported around 0000 and 0200 on 19 July. By 0900 there were active ooze-outs along the SW edge of the crater floor. Measurements made from an overflight on 19 July indicated that the crater floor was infilled about 133 m and 98 million cubic meters of lava had erupted since 29 September 2021 (figure 520). On 20 July around 1600 active ooze-outs were visible along the N edge of the crater, which continued through the next day. Extensive ooze-outs occurred along the W margin during 24 July until 1900; on 26 July minor ooze-outs were noted along the N margin. Minor spattering was visible on 29 July along the E margin of the lake. The sulfur dioxide emission rates ranged 650-2,800 tons per day (t/d), the higher of which was measured on 8 July (figure 519).
Activity during August 2022. The eruption continued in the Halema’uma’u crater at the western vent. According to HVO the lava in the active lake remained at the level of the bounding levees. Occasional minor ooze-outs were observed along the margins of the crater floor. Strong nighttime crater incandescence was visible after midnight on 6 August over the western vent cone. During 6-7 August scattered small lava lobes were active along the crater floor and incandescence persisted above the western vent through 9 August. During 7-9 August HVO reported a single lava effusion source was active along the NW margin of the crater floor. Measurements from an overflight on 4 August indicated that the crater floor was infilled about 136 m total and that 102 million cubic meters of lava had been erupted since the start of the eruption. Lava breakouts were reported along the N, NE, E, S, and W margins of the crater during 10-16 August. Another overflight survey conducted on 16 August indicated that the crater floor infilled about 137 m and 104 million cubic meters of lava had been erupted since September 2021. Measured sulfur dioxide emissions rates ranged 1,150-2,450 t/d, the higher of which occurred on 8 August.
Activity during September 2022. During September, lava effusion continued from the western vent into the active lava lake and onto the crater floor. Intermittent minor ooze-outs were reported through the month. A small ooze-out was visible on the W crater floor margin at 0220 on 2 September, which showed decreasing surface activity throughout the day, but remained active through 3 September. On 3 September around 1900 a lava outbreak occurred along the NW margin of the crater floor but had stopped by the evening of 4 September. Field crews monitoring the summit lava lake on 9 September observed spattering on the NE margin of the lake that rose no higher than 10 m, before falling back onto the lava lake crust (figure 521). Overflight measurements on 12 September indicated that the crater floor was infilled a total of 143 m and 111 million cubic meters of lava had been erupted since September 2021. Extensive breakouts in the W and N part of the crater floor were reported at 1600 on 20 September and continued into 26 September. The active part of the lava lake dropped by 10 m while other parts of the crater floor dropped by several meters. Summit tiltmeters recorded a summit seismic swarm of more than 80 earthquakes during 1500-1800 on 21 September, which occurred about 1.5 km below Halema’uma’u; a majority of these were less than Mw 2. By 22 September the active part of the lava lake was infilled about 2 m. On 23 September the western vent areas exhibited several small spatter cones with incandescent openings, along with weak, sporadic spattering (figure 522). The sulfur dioxide emission rate ranged from 930 t/d to 2,000 t/d, the higher of which was measured on 6 September.
Activity during October 2022. Activity during October declined slightly compared to previous months, though lava effusions persisted from the western vent into the active lava lake and onto the crater floor during October (figure 523). Slight variations in the lava lake were noted throughout the month. HVO reported that around 0600 on 3 October the level of the lava lake has lowered slightly. Overflight measurements taken on 5 October indicated that the crater floor was infilled a total of about 143 m and that 111 million cubic meters of lava had been effused since September 2021. During 6-7 October the lake gradually rose 0.5 m. Sulfur dioxide measurements made on 22 October had an emission rate of 700 t/d. Another overflight taken on 28 October showed that there was little to no change in the elevation of the crater floor: the crater floor was infilled a total of 143 m and 111 million cubic meters of lava had erupted since the start of the eruption.
Activity during November 2022. Activity remained low during November, though HVO reported that lava from the western vent continued to effuse into the active lava lake and onto the crater floor throughout the month. The rate of sulfur dioxide emissions during November ranged from 300-600 t/d, the higher amount of which occurred on 9 November.
Activity during December 2022. Similar low activity was reported during December, with lava effusing from the western vent into the active lava lake and onto the crater floor. During 4-5 December the active part of the lava lake was slightly variable in elevation and fluctuated within 1 m. On 9 December HVO reported that lava was no longer erupting from the western vent in the Halema’uma’u crater and that sulfur dioxide emissions had returned to near pre-eruption background levels; during 10-11 December, the lava lake had completely crusted over, and no incandescence was visible (figure 524). Time lapse camera images covering the 4-10 December showed that the crater floor showed weak deflation and no inflation. Some passive events of crustal overturning were reported during 14-15 December, which brought fresh incandescent lava to the lake surface. The sulfur dioxide emission rate was approximately 200 t/d on 14 December. A smaller overturn event on 17 December and another that occurred around 0000 and into the morning of 20 December were also detected. A small seismic swarm was later detected on 30 December.
Geologic Background. Kilauea overlaps the E flank of the massive Mauna Loa shield volcano in the island of Hawaii. Eruptions are prominent in Polynesian legends; written documentation since 1820 records frequent summit and flank lava flow eruptions interspersed with periods of long-term lava lake activity at Halemaumau crater in the summit caldera until 1924. The 3 x 5 km caldera was formed in several stages about 1,500 years ago and during the 18th century; eruptions have also originated from the lengthy East and Southwest rift zones, which extend to the ocean in both directions. About 90% of the surface of the basaltic shield volcano is formed of lava flows less than about 1,100 years old; 70% of the surface is younger than 600 years. The long-term eruption from the East rift zone between 1983 and 2018 produced lava flows covering more than 100 km2, destroyed hundreds of houses, and added new coastline.
Information Contacts: Hawaiian Volcano Observatory (HVO), U.S. Geological Survey, PO Box 51, Hawai'i National Park, HI 96718, USA (URL: http://hvo.wr.usgs.gov/).
Nyamulagira (DR Congo) — November 2023 Cite this Report
Nyamulagira
DR Congo
1.408°S, 29.2°E; summit elev. 3058 m
All times are local (unless otherwise noted)
Lava flows and thermal activity during May-October 2023
Nyamulagira (also known as Nyamuragira) is a shield volcano in the Democratic Republic of Congo with the summit truncated by a small 2 x 2.3 km caldera with walls up to about 100 m high. Documented eruptions have occurred within the summit caldera, as well as from numerous flank fissures and cinder cones. The current eruption period began in April 2018 and has more recently been characterized by summit crater lava flows and thermal activity (BGVN 48:05). This report describes lava flows and variable thermal activity during May through October 2023, based on information from the Observatoire Volcanologique de Goma (OVG) and various satellite data.
Lava lake activity continued during May. The MIROVA (Middle InfraRed Observation of Volcanic Activity) system recorded moderate-to-strong thermal activity throughout the reporting period; activity was more intense during May and October and relatively weaker from June through September (figure 95). The MODVOLC thermal algorithm, detected a total of 209 thermal alerts. There were 143 hotspots detected during May, eight during June, nine during September, and 49 during October. This activity was also reflected in infrared satellite images, where a lava flow was visible in the NW part of the crater on 7 May and strong activity was seen in the center of the crater on 4 October (figure 96). Another infrared satellite image taken on 12 May showed still active lava flows along the NW margin of the crater. According to OVG lava effusions were active during 7-29 May and moved to the N and NW parts of the crater beginning on 9 May. Strong summit crater incandescence was visible from Goma (27 km S) during the nights of 17, 19, and 20 May (figure 97). On 17 May there was an increase in eruptive activity, which peaked at 0100 on 20 May. Notable sulfur dioxide plumes drifted NW and W during 19-20 May (figure 98). Drone footage acquired in partnership with the USGS (United States Geological Survey) on 20 May captured images of narrow lava flows that traveled about 100 m down the W flank (figure 99). Data from the Rumangabo seismic station indicated a decreasing trend in activity during 17-21 May. Although weather clouds prevented clear views of the summit, a strong thermal signature on the NW flank was visible in an infrared satellite image on 22 May, based on an infrared satellite image. On 28 May the lava flows on the upper W flank began to cool and solidify. By 29 May seismicity returned to levels similar to those recorded before the 17 May increase. Lava effusion continued but was confined to the summit crater; periodic crater incandescence was observed.
Low-level activity was noted during June through October. On 1 June OVG reported that seismicity remained at lower levels and that crater incandescence had been absent for three days, though infrared satellite imagery showed continued lava effusion in the summit crater. The lava flows on the flanks covered an estimated 0.6 km2. Satellite imagery continued to show thermal activity confined to the lava lake through October (figure 96), although no lava flows or significant sulfur dioxide emissions were reported.
Geologic Background. Africa's most active volcano, Nyamulagira (also known as Nyamuragira), is a massive high-potassium basaltic shield about 25 km N of Lake Kivu and 13 km NNW of the steep-sided Nyiragongo volcano. The summit is truncated by a small 2 x 2.3 km caldera that has walls up to about 100 m high. Documented eruptions have occurred within the summit caldera, as well as from the numerous flank fissures and cinder cones. A lava lake in the summit crater, active since at least 1921, drained in 1938, at the time of a major flank eruption. Recent lava flows extend down the flanks more than 30 km from the summit as far as Lake Kivu; extensive lava flows from this volcano have covered 1,500 km2 of the western branch of the East African Rift.
Information Contacts: Observatoire Volcanologique de Goma (OVG), Departement de Geophysique, Centre de Recherche en Sciences Naturelles, Lwiro, D.S. Bukavu, DR Congo; Hawai'i Institute of Geophysics and Planetology (HIGP) - MODVOLC Thermal Alerts System, School of Ocean and Earth Science and Technology (SOEST), Univ. of Hawai'i, 2525 Correa Road, Honolulu, HI 96822, USA (URL: http://modis.higp.hawaii.edu/); MIROVA (Middle InfraRed Observation of Volcanic Activity), a collaborative project between the Universities of Turin and Florence (Italy) supported by the Centre for Volcanic Risk of the Italian Civil Protection Department (URL: http://www.mirovaweb.it/); NASA Global Sulfur Dioxide Monitoring Page, Atmospheric Chemistry and Dynamics Laboratory, NASA Goddard Space Flight Center (NASA/GSFC), 8800 Greenbelt Road, Goddard, Maryland, USA (URL: https://so2.gsfc.nasa.gov/); Copernicus Browser, Copernicus Data Space Ecosystem, European Space Agency (URL: https://dataspace.copernicus.eu/browser/); Charles Balagizi, Goma Volcano Observatory, Departement de Geophysique, Centre de Recherche en Sciences Naturelles, Lwiro, D.S. Bukavu, DR Congo.
Bagana (Papua New Guinea) — October 2023 Cite this Report
Bagana
Papua New Guinea
6.137°S, 155.196°E; summit elev. 1855 m
All times are local (unless otherwise noted)
Explosions, ash plumes, ashfall, and lava flows during April-September 2023
The remote volcano of Bagana is located in central Bougainville Island, Papua New Guinea. Recorded eruptions date back to 1842 and activity has consisted of effusive activity that has built a small lava dome in the summit crater and occasional explosions that produced pyroclastic flows. The most recent eruption has been ongoing since February 2000 and has produced occasional explosions, ash plumes, and lava flows. More recently, activity has been characterized by ongoing effusive activity and ash emissions (BGVN 48:04). This report updates activity from April through September 2023 that has consisted of explosions, ash plumes, ashfall, and lava flows, using information from the Darwin Volcanic Ash Advisory Center (VAAC) and satellite data.
An explosive eruption was reported on 7 July that generated a large gas-and-ash plume to high altitudes and caused significant ashfall in local communities; the eruption plume had reached upper tropospheric (16-18 km altitude) altitudes by 2200, according to satellite images. Sulfur dioxide plumes were detected in satellite images on 8 July and indicated that the plume was likely a mixture of gas, ice, and ash. A report issued by the Autonomous Bougainville Government (ABG) (Torokina District, Education Section) on 10 July noted that significant ash began falling during 2000-2100 on 7 July and covered most areas in the Vuakovi, Gotana (9 km SW), Koromaketo, Laruma (25 km W) and Atsilima (27 km NW) villages. Pyroclastic flows also occurred, according to ground-based reports; small deposits confined to one drainage were inspected by RVO during an overflight on 17 July and were confirmed to be from the 7 July event. Ashfall continued until 10 July and covered vegetation, which destroyed bushes and gardens and contaminated rivers and streams.
RVO reported another eruption on 14 July. The Darwin VAAC stated that an explosive event started around 0830 on 15 July and produced an ash plume that rose to 16.5 km altitude by 1000 and drifted N, according to satellite images. The plume continued to drift N and remained visible through 1900, and by 2150 it had dissipated.
Ashfall likely from both the 7 and 15 July events impacted about 8,111 people in Torokina (20 km SW), including Tsito/Vuakovi, Gotana, Koromaketo, Kenaia, Longkogari, Kenbaki, Piva (13 km SW), and Atsinima, and in the Tsitovi district, according to ABG. Significant ashfall was also reported in Ruruvu (22 km N) in the Wakunai District of Central Bougainville, though the thickness of these deposits could not be confirmed. An evacuation was called for the villages in Wakunai, where heavy ashfall had contaminated water sources; the communities of Ruruvu, Togarau, Kakarapaia, Karauturi, Atao, and Kuritaturi were asked to evacuate to a disaster center at the Wakunai District Station, and communities in Torokina were asked to evacuate to the Piva District station. According to a news article, more than 7,000 people needed temporary accommodations, with about 1,000 people in evacuation shelters. Ashfall had deposited over a broad area, contaminating water supplies, affecting crops, and collapsing some roofs and houses in rural areas. Schools were temporarily shut down. Intermittent ash emissions continued through the end of July and drifted NNW, NW, and SW. Fine ashfall was reported on the coast of Torokina, and ash plumes also drifted toward Laruma and Atsilima.
A small explosive eruption occurred at 2130 on 28 July that ejected material from the crater vents, according to reports from Torokina, in addition to a lava flow that contained two lobes. A second explosion was detected at 2157. Incandescence from the lava flow was visible from Piva as it descended the W flank around 2000 on 29 July (figure 47). The Darwin VAAC reported that a strong thermal anomaly was visible in satellite images during 30-31 July and that ash emissions rose to 2.4 km altitude and drifted WSW on 30 July. A ground report from RVO described localized emissions at 0900 on 31 July.
The Darwin VAAC reported that ash plumes were identified in satellite imagery at 0800 and 1220 on 12 August and rose to 2.1 km and 3 km altitude and drifted NW and W, respectively. A news report stated that aid was sent to more than 6,300 people that were adversely affected by the eruption. Photos taken during 17-19 August showed ash emissions rising no higher than 1 km above the summit and drifting SE. A small explosion generated an ash plume during the morning of 19 August. Deposits from small pyroclastic flows were also captured in the photos. Satellite images captured lava flows and pyroclastic flow deposits. Two temporary seismic stations were installed near Bagana on 17 August at distances of 7 km WSW (Vakovi station) and 11 km SW (Kepox station). The Kepox station immediately started to record continuous, low-frequency background seismicity.
Satellite data. Little to no thermal activity was detected during April through mid-July 2023; only one anomaly was recorded during early April and one during early June, according to MIROVA (Middle InfraRed Observation of Volcanic Activity) data (figure 48). Thermal activity increased in both power and frequency during mid-July through September, although there were still some short gaps in detected activity. MODVOLC also detected increased thermal activity during August; thermal hotspots were detected a total of five times on 19, 20, and 27 August. Weak thermal anomalies were also captured in infrared satellite images on clear weather days throughout the reporting period on 7, 12, and 17 April, 27 May, 1, 6, 16, and 31 July, and 19 September (figure 48); a strong thermal anomaly was visible on 31 July. Distinct sulfur dioxide plumes that drifted generally NW were intermittently captured by the TROPOMI instrument on the Sentinel-5P satellite and sometimes exceeded two Dobson Units (DUs) (figure 49).
Geologic Background. Bagana volcano, in a remote portion of central Bougainville Island, is frequently active. This massive symmetrical cone was largely constructed by an accumulation of viscous andesitic lava flows. The entire edifice could have been constructed in about 300 years at its present rate of lava production. Eruptive activity is characterized by non-explosive effusion of viscous lava that maintains a small lava dome in the summit crater, although occasional explosive activity produces pyroclastic flows. Lava flows with tongue-shaped lobes up to 50 m thick and prominent levees descend the flanks on all sides.
Information Contacts: Rabaul Volcano Observatory (RVO), Geohazards Management Division, Department of Mineral Policy and Geohazards Management (DMPGM), PO Box 3386, Kokopo, East New Britain Province, Papua New Guinea; Darwin Volcanic Ash Advisory Centre (VAAC), Bureau of Meteorology, Northern Territory Regional Office, PO Box 40050, Casuarina, NT 0811, Australia (URL: http://www.bom.gov.au/info/vaac/); MIROVA (Middle InfraRed Observation of Volcanic Activity), a collaborative project between the Universities of Turin and Florence (Italy) supported by the Centre for Volcanic Risk of the Italian Civil Protection Department (URL: http://www.mirovaweb.it/); Hawai'i Institute of Geophysics and Planetology (HIGP) - MODVOLC Thermal Alerts System, School of Ocean and Earth Science and Technology (SOEST), Univ. of Hawai'i, 2525 Correa Road, Honolulu, HI 96822, USA (URL: http://modis.higp.hawaii.edu/); NASA Global Sulfur Dioxide Monitoring Page, Atmospheric Chemistry and Dynamics Laboratory, NASA Goddard Space Flight Center (NASA/GSFC), 8800 Greenbelt Road, Goddard, Maryland, USA (URL: https://so2.gsfc.nasa.gov/); Copernicus Browser, Copernicus Data Space Ecosystem, European Space Agency (URL: https://dataspace.copernicus.eu/browser/); Autonomous Bougainville Government, P.O Box 322, Buka, AROB, PNG (URL: https://abg.gov.pg/); Andrew Tupper (Twitter: @andrewcraigtupp); Simon Carn, Geological and Mining Engineering and Sciences, Michigan Technological University, 1400 Townsend Drive, Houghton, MI 49931, USA (URL: http://www.volcarno.com/, Twitter: @simoncarn); Radio NZ (URL: https://www.rnz.co.nz/news/pacific/494464/more-than-7-000-people-in-bougainville-need-temporary-accommodation-after-eruption); USAID, 1300 Pennsylvania Ave, NW, Washington DC 20004, USA (URL: https://www.usaid.gov/pacific-islands/press-releases/aug-08-2023-united-states-provides-immediate-emergency-assistance-support-communities-affected-mount-bagana-volcanic-eruptions).
Mayon (Philippines) — October 2023 Cite this Report
Mayon
Philippines
13.257°N, 123.685°E; summit elev. 2462 m
All times are local (unless otherwise noted)
Lava flows, pyroclastic flows, ash emissions, and seismicity during April-September 2023
Mayon is located in the Philippines and has steep upper slopes capped by a small summit crater. Historical eruptions date back to 1616 CE that have been characterized by Strombolian eruptions, lava flows, pyroclastic flows, and mudflows. Eruptions mostly originated from a central conduit. Pyroclastic flows and mudflows have commonly descended many of the approximately 40 drainages that surround the volcano. The most recent eruption occurred during June through October 2022 and consisted of lava dome growth and gas-and-steam emissions (BGVN 47:12). A new eruption was reported during late April 2023 and has included lava flows, pyroclastic density currents, ash emissions, and seismicity. This report covers activity during April through September 2023 based on daily bulletins from the Philippine Institute of Volcanology and Seismology (PHIVOLCS).
During April through September 2023, PHIVOLCS reported near-daily rockfall events, frequent volcanic earthquakes, and sulfur dioxide measurements. Gas-and-steam emissions rose 100-900 m above the crater and drifted in different directions. Nighttime crater incandescence was often visible during clear weather and was accompanied by incandescent avalanches of material. Activity notably increased during June when lava flows were reported on the S, SE, and E flanks (figure 52). The MIROVA graph (Middle InfraRed Observation of Volcanic Activity) showed strong thermal activity coincident with these lava flows, which remained active through September (figure 53). According to the MODVOLC thermal algorithm, a total of 110 thermal alerts were detected during the reporting period: 17 during June, 40 during July, 27 during August, and 26 during September. During early June, pyroclastic density currents (PDCs) started to occur more frequently.
Low activity was reported during much of April and May; gas-and-steam emissions rose 100-900 m above the crater and generally drifted in different directions. A total of 52 rockfall events and 18 volcanic earthquakes were detected during April and 147 rockfall events and 13 volcanic events during May. Sulfur dioxide flux measurements ranged between 400-576 tons per day (t/d) during April, the latter of which was measured on 29 April and between 162-343 t/d during May, the latter of which was measured on 13 May.
Activity during June increased, characterized by lava flows, pyroclastic density currents (PDCs), crater incandescence and incandescent rockfall events, gas-and-steam emissions, and continued seismicity. Weather clouds often prevented clear views of the summit, but during clear days, moderate gas-and-steam emissions rose 100-2,500 m above the crater and drifted in multiple directions. A total of 6,237 rockfall events and 288 volcanic earthquakes were detected. The rockfall events often deposited material on the S and SE flanks within 700-1,500 m of the summit crater and ash from the events drifted SW, S, SE, NE, and E. Sulfur dioxide emissions ranged between 149-1,205 t/d, the latter of which was measured on 10 June. Short-term observations from EDM and electronic tiltmeter monitoring indicated that the upper slopes were inflating since February 2023. Longer-term ground deformation parameters based on EDM, precise leveling, continuous GPS, and electronic tilt monitoring indicated that the volcano remained inflated, especially on the NW and SE flanks. At 1000 on 5 June the Volcano Alert Level (VAL) was raised to 2 (on a 0-5 scale). PHIVOLCS noted that although low-level volcanic earthquakes, ground deformation, and volcanic gas emissions indicated unrest, the steep increase in rockfall frequency may indicate increased dome activity.
A total of 151 dome-collapse PDCs occurred during 8-9 and 11-30 June, traveled 500-2,000 m, and deposited material on the S flank within 2 km of the summit crater. During 8-9 June the VAL was raised to 3. At approximately 1947 on 11 June lava flow activity was reported; two lobes traveled within 500 m from the crater and deposited material on the S (Mi-isi), SE (Bonga), and E (Basud) flanks. Weak seismicity accompanied the lava flow and slight inflation on the upper flanks. This lava flow remained active through 30 June, moving down the S and SE flank as far as 2.5 km and 1.8 km, respectively and depositing material up to 3.3 km from the crater. During 15-16 June traces of ashfall from the PDCs were reported in Sitio Buga, Nabonton, City of Ligao and Purok, and San Francisco, Municipality of Guinobatan. During 28-29 June there were two PDCs generated by the collapse of the lava flow front, which generated a light-brown ash plume 1 km high. Satellite monitors detected significant concentrations of sulfur dioxide beginning on 29 June. On 30 June PDCs primarily affected the Basud Gully on the E flank, the largest of which occurred at 1301 and lasted eight minutes, based on the seismic record. Four PDCs generated between 1800 and 2000 that lasted approximately four minutes each traveled 3-4 km on the E flank and generated an ash plume that rose 1 km above the crater and drifted N and NW. Ashfall was recorded in Tabaco City.
Similar strong activity continued during July; slow lava effusion remained active on the S and SE flanks and traveled as far as 2.8 km and 2.8 km, respectively and material was deposited as far as 4 km from the crater. There was a total of 6,983 rockfall events and 189 PDCs that affected the S, SE, and E flanks. The volcano network detected a total of 2,124 volcanic earthquakes. Continuous gas-and-steam emissions rose 200-2,000 m above the crater and drifted in multiple directions. Sulfur dioxide emissions averaged 792-4,113 t/d, the latter of which was measured on 28 July. During 2-4 July three PDCs were generated from the collapse of the lava flow and resulting light brown plumes rose 200-300 m above the crater. Continuous tremor pulses were reported beginning at 1547 on 3 July through 7 July at 1200, at 2300 on 8 July and going through 0300 on 10 July, and at 2300 on 16 July, as recorded by the seismic network. During 6-9 July there were 10 lava flow-collapse-related PDCs that generated light brown plumes 300-500 m above the crater. During 10-11 July light ashfall was reported in some areas of Mabinit, Legazpi City, Budiao and Salvacion, Daraga, and Camalig, Albay. By 18 July the lava flow advanced 600 m on the E flank as well.
During 1733 on 18 July and 0434 on 19 July PHIVOLCS reported 30 “ashing” events, which are degassing events accompanied by audible thunder-like sounds and entrained ash at the crater, which produced short, dark plumes that drifted SW. These events each lasted 20-40 seconds, and plume heights ranged from 150-300 m above the crater, as recorded by seismic, infrasound, visual, and thermal monitors. Three more ashing events occurred during 19-20 July. Short-term observations from electronic tilt and GPS monitoring indicate deflation on the E lower flanks in early July and inflation on the NW middle flanks during the third week of July. Longer-term ground deformation parameters from EDM, precise leveling, continuous GPS, and electronic tilt monitoring indicated that the volcano was still generally inflated relative to baseline levels. A short-lived lava pulse lasted 28 seconds at 1956 on 21 July, which was accompanied by seismic and infrasound signals. By 22 July, the only lava flow that remained active was on the SE flank, and continued to extend 3.4 km, while those on the S and E flanks weakened markedly. One ashing event was detected during 30-31 July, whereas there were 57 detected during 31 July-1 August; according to PHIVOLCS beginning at approximately 1800 on 31 July eruptive activity was dominated by phases of intermittent ashing, as well as increased in the apparent rates of lava effusion from the summit crater. The ashing phases consisted of discrete events recorded as low-frequency volcanic earthquakes (LFVQ) typically 30 seconds in duration, based on seismic and infrasound signals. Gray ash plume rose 100 m above the crater and generally drifted NE. Shortly after these ashing events began, new lava began to effuse rapidly from the crater, feeding the established flowed on the SE, E, and E flanks and generating frequent rockfall events.
Intensified unrest persisted during August. There was a total of 4,141 rockfall events, 2,881 volcanic earthquakes, which included volcanic tremor events, 32 ashing events, and 101 PDCs detected throughout the month. On clear weather days, gas-and-steam emissions rose 300-1,500 m above the crater and drifted in different directions (figure 54). Sulfur dioxide emissions averaged 735-4,756 t/d, the higher value of which was measured on 16 August. During 1-2 August the rate of lava effusion decreased, but continued to feed the flows on the SE, S, and E flanks, maintaining their advances to 3.4 km, 2.8 km, and 1.1 km from the crater, respectively (figure 55). Rockfall and PDCs generated by collapses at the lava flow margins and from the summit dome deposited material within 4 km of the crater. During 3-4 August there were 10 tremor events detected that lasted 1-4 minutes. Short-lived lava pulse lasted 35 seconds and was accompanied by seismic and infrasound signals at 0442 on 6 August. Seven collapses were recorded at the front of the lava flow during 12-14 August.
During September, similar activity of slow lava effusion, PDCs, gas-and-steam emissions, and seismicity continued. There was a total of 4,452 rockfall events, 329 volcanic earthquakes, which included volcanic tremor events, two ashing events, and 85 PDCs recorded throughout the month. On clear weather days, gas-and-steam emissions rose 100-1,500 m above the crater and drifted in multiple directions. Sulfur dioxide emissions averaged 609-2,252 t/d, the higher average of which was measured on 6 September. Slow lava effusion continued advancing on the SE, S, and E flanks, maintaining lengths of 3.4 km, 2.8 km, and 1.1 km, respectively. Rockfall and PDC events generated by collapses along the lava flow margins and at the summit dome deposited material within 4 km of the crater.
Geologic Background. Symmetrical Mayon, which rises above the Albay Gulf NW of Legazpi City, is the most active volcano of the Philippines. The steep upper slopes are capped by a small summit crater. Recorded eruptions since 1616 CE range from Strombolian to basaltic Plinian, with cyclical activity beginning with basaltic eruptions, followed by longer periods of andesitic lava flows. Eruptions occur predominately from the central conduit and have also produced lava flows that travel far down the flanks. Pyroclastic density currents and mudflows have commonly swept down many of the approximately 40 ravines that radiate from the summit and have often damaged populated lowland areas. A violent eruption in 1814 killed more than 1,200 people and devastated several towns.
Information Contacts: Philippine Institute of Volcanology and Seismology (PHIVOLCS), Department of Science and Technology, University of the Philippines Campus, Diliman, Quezon City, Philippines (URL: http://www.phivolcs.dost.gov.ph/); MIROVA (Middle InfraRed Observation of Volcanic Activity), a collaborative project between the Universities of Turin and Florence (Italy) supported by the Centre for Volcanic Risk of the Italian Civil Protection Department (URL: http://www.mirovaweb.it/); Hawai'i Institute of Geophysics and Planetology (HIGP) - MODVOLC Thermal Alerts System, School of Ocean and Earth Science and Technology (SOEST), Univ. of Hawai'i, 2525 Correa Road, Honolulu, HI 96822, USA (URL: http://modis.higp.hawaii.edu/); Copernicus Browser, Copernicus Data Space Ecosystem, European Space Agency (URL: https://dataspace.copernicus.eu/browser/); William Rogers, Legazpi City, Albay Province, Philippines.
Nishinoshima (Japan) — October 2023 Cite this Report
Nishinoshima
Japan
27.247°N, 140.874°E; summit elev. 100 m
All times are local (unless otherwise noted)
Eruption plumes and gas-and-steam plumes during May-August 2023
Nishinoshima, located about 1,000 km S of Tokyo, is a small island in the Ogasawara Arc in Japan. The island is the summit of a massive submarine volcano that has prominent submarine peaks to the S, W, and NE. Eruptions date back to 1973 and the current eruption period began in October 2022. Recent activity has consisted of small ash plumes and fumarolic activity (BGVN 48:07). This report covers activity during May through August 2023, using information from monthly reports of the Japan Meteorological Agency (JMA) monthly reports and satellite data.
Activity during May through June was relatively low. The Japan Coast Guard (JCG) did overflights on 14 and 22 June and reported white gas-and-steam emissions rising 600 m and 1,200 m from the central crater of the pyroclastic cone, respectively (figure 125). In addition, multiple white gas-and-steam emissions rose from the inner rim of the W side of the crater and from the SE flank of the pyroclastic cone. Discolored brown-to-green water was observed around almost the entire perimeter of the island; on 22 June light green discolored water was observed off the S coast of the island.
Observations from the Himawari meteorological satellite confirmed an eruption on 9 and 10 July. An eruption plume rose 1.6 km above the crater and drifted N around 1300 on 9 July. Satellite images acquired at 1420 and 2020 on 9 July and at 0220 on 10 July showed continuing emissions that rose 1.3-1.6 km above the crater and drifted NE and N. The Tokyo VAAC reported that an ash plume seen by a pilot and identified in a satellite image at 0630 on 21 July rose to 3 km altitude and drifted S.
Aerial observations conducted by JCG on 8 August showed a white-and-gray plume rising from the central crater of the pyroclastic cone, and multiple white gas-and-steam emissions were rising from the inner edge of the western crater and along the NW-SE flanks of the island (figure 126). Brown-to-green discolored water was also noted around the perimeter of the island.
Intermittent low-to-moderate power thermal anomalies were recorded in the MIROVA graph (Middle InfraRed Observation of Volcanic Activity), showing an increase in both frequency and power beginning in July (figure 127). This increase in activity coincides with eruptive activity on 9 and 10 July, characterized by eruption plumes. According to the MODVOLC thermal alert algorithm, one thermal hotspot was recorded on 20 July. Weak thermal anomalies were also detected in infrared satellite imagery, accompanied by strong gas-and-steam plumes (figure 128).
Geologic Background. The small island of Nishinoshima was enlarged when several new islands coalesced during an eruption in 1973-74. Multiple eruptions that began in 2013 completely covered the previous exposed surface and continued to enlarge the island. The island is the summit of a massive submarine volcano that has prominent peaks to the S, W, and NE. The summit of the southern cone rises to within 214 m of the ocean surface 9 km SSE.
Information Contacts: Japan Meteorological Agency (JMA), 1-3-4 Otemachi, Chiyoda-ku, Tokyo 100-8122, Japan (URL: http://www.jma.go.jp/jma/indexe.html); Tokyo Volcanic Ash Advisory Center (VAAC), 1-3-4 Otemachi, Chiyoda-ku, Tokyo 100-8122, Japan (URL: http://ds.data.jma.go.jp/svd/vaac/data/); MIROVA (Middle InfraRed Observation of Volcanic Activity), a collaborative project between the Universities of Turin and Florence (Italy) supported by the Centre for Volcanic Risk of the Italian Civil Protection Department (URL: http://www.mirovaweb.it/); Copernicus Browser, Copernicus Data Space Ecosystem, European Space Agency (URL: https://dataspace.copernicus.eu/browser/).
Krakatau (Indonesia) — October 2023 Cite this Report
Krakatau
Indonesia
6.1009°S, 105.4233°E; summit elev. 285 m
All times are local (unless otherwise noted)
White gas-and-steam plumes and occasional ash plumes during May-August 2023
Krakatau is located in the Sunda Strait between Java and Sumatra, Indonesia. Caldera collapse during the catastrophic 1883 eruption destroyed Danan and Perbuwatan cones and left only a remnant of Rakata. The post-collapse cone of Anak Krakatau (Child of Krakatau) was constructed within the 1883 caldera at a point between the former Danan and Perbuwatan cones; it has been the site of frequent eruptions since 1927. The current eruption period began in May 2021 and has recently consisted of Strombolian eruptions and ash plumes (BGVN 48:07). This report describes lower levels of activity consisting of ash and white gas-and-steam plumes during May through August 2023, based on information provided by the Indonesian Center for Volcanology and Geological Hazard Mitigation, referred to as Pusat Vulkanologi dan Mitigasi Bencana Geologi (PVMBG), MAGMA Indonesia, and satellite data.
Activity was relatively low during May and June. Daily white gas-and-steam emissions rose 25-200 m above the crater and drifted in different directions. Five ash plumes were detected at 0519 on 10 May, 1241 on 11 May, 0920 on 12 May, 2320 on 12 May, and at 0710 on 13 May, and rose 1-2.5 km above the crater and drifted SW. A webcam image taken on 12 May showed ejection of incandescent material above the vent. A total of nine ash plumes were detected during 6-11 June: at 1434 and 00220 on 6 and 7 June the ash plumes rose 500 m above the crater and drifted NW, at 1537 on 8 June the ash plume rose 1 km above the crater and drifted SW, at 0746 and at 0846 on 9 June the ash plumes rose 800 m and 3 km above the crater and drifted SW, respectively, at 0423, 1431, and 1750 on 10 June the ash plumes rose 2 km, 1.5 km, and 3.5 km above the crater and drifted NW, respectively, and at 0030 on 11 June an ash plume rose 2 km above the crater and drifted NW. Webcam images taken on 10 and 11 June at 0455 and 0102, respectively, showed incandescent material ejected above the vent. On 19 June an ash plume at 0822 rose 1.5 km above the crater and drifted SE.
Similar low activity of white gas-and-steam emissions and few ash plumes were reported during July and August. Daily white gas-and-steam emissions rose 25-300 m above the crater and drifted in multiple directions. Three ash plumes were reported at 0843, 0851, and 0852 on 20 July that rose 500-2,000 m above the crater and drifted NW.
The MIROVA (Middle InfraRed Observation of Volcanic Activity) graph of MODIS thermal anomaly data showed intermittent low-to-moderate power thermal anomalies during May through August 2023 (figure 140). Although activity was often obscured by weather clouds, a thermal anomaly was visible in an infrared satellite image of the crater on 12 May, accompanied by an eruption plume that drifted SW (figure 141).
Geologic Background. The renowned Krakatau (frequently mis-named as Krakatoa) volcano lies in the Sunda Strait between Java and Sumatra. Collapse of an older edifice, perhaps in 416 or 535 CE, formed a 7-km-wide caldera. Remnants of that volcano are preserved in Verlaten and Lang Islands; subsequently the Rakata, Danan, and Perbuwatan cones were formed, coalescing to create the pre-1883 Krakatau Island. Caldera collapse during the catastrophic 1883 eruption destroyed Danan and Perbuwatan, and left only a remnant of Rakata. This eruption caused more than 36,000 fatalities, most as a result of tsunamis that swept the adjacent coastlines of Sumatra and Java. Pyroclastic surges traveled 40 km across the Sunda Strait and reached the Sumatra coast. After a quiescence of less than a half century, the post-collapse cone of Anak Krakatau (Child of Krakatau) was constructed within the 1883 caldera at a point between the former Danan and Perbuwatan cones. Anak Krakatau has been the site of frequent eruptions since 1927.
Information Contacts: Pusat Vulkanologi dan Mitigasi Bencana Geologi (PVMBG, also known as Indonesian Center for Volcanology and Geological Hazard Mitigation, CVGHM), Jalan Diponegoro 57, Bandung 40122, Indonesia (URL: http://www.vsi.esdm.go.id/); MAGMA Indonesia, Kementerian Energi dan Sumber Daya Mineral (URL: https://magma.esdm.go.id/v1); MIROVA (Middle InfraRed Observation of Volcanic Activity), a collaborative project between the Universities of Turin and Florence (Italy) supported by the Centre for Volcanic Risk of the Italian Civil Protection Department (URL: http://www.mirovaweb.it/); Copernicus Browser, Copernicus Data Space Ecosystem, European Space Agency (URL: https://dataspace.copernicus.eu/browser/).
Villarrica (Chile) — October 2023 Cite this Report
Villarrica
Chile
39.42°S, 71.93°W; summit elev. 2847 m
All times are local (unless otherwise noted)
Strombolian activity, gas-and-ash emissions, and crater incandescence during April-September 2023
Villarrica, in central Chile, consists of a 2-km-wide caldera that formed about 3,500 years ago and is located at the base of the presently active cone at the NW margin of a 6-km-wide caldera. Historical eruptions eruptions date back to 1558 and have been characterized by mild-to-moderate explosive activity with occasional lava effusions. The current eruption period began in December 2014 and has recently consisted of nighttime crater incandescence, ash emissions, and seismicity (BGVN 48:04). This report covers activity during April through September 2023 and describes occasional Strombolian activity, gas-and-ash emissions, and nighttime crater incandescence. Information for this report primarily comes from the Southern Andes Volcano Observatory (Observatorio Volcanológico de Los Andes del Sur, OVDAS), part of Chile's National Service of Geology and Mining (Servicio Nacional de Geología y Minería, SERNAGEOMIN) and satellite data.
Seismicity during April consisted of long period (LP) events and tremor (TRE); a total of 9,413 LP-type events and 759 TR-type events were detected throughout the month. Nighttime crater incandescence persisted and was visible in the degassing column. Sulfur dioxide data was obtained using Differential Absorption Optical Spectroscopy Equipment (DOAS) that showed an average value of 1,450 ± 198 tons per day (t/d) during 1-15 April and 1,129 ± 201 t/d during 16-30 April, with a maximum daily value of 2,784 t/d on 9 April. Gas-and-steam emissions of variable intensities rose above the active crater as high as 1.3 km above the crater on 13 April. Strombolian explosions were not observed and there was a slight decrease in the lava lake level.
There were 14,123 LP-type events and 727 TR-type events detected during May. According to sulfur dioxide measurements taken with DOAS equipment, the active crater emitted an average value of 1,826 ± 482 t/d during 1-15 May and 912 ± 41 t/d during 16-30 May, with a daily maximum value of 5,155 t/d on 13 May. Surveillance cameras showed continuous white gas-and-steam emissions that rose as high as 430 m above the crater on 27 May. Nighttime incandescence illuminated the gas column less than 300 m above the crater rim was and no pyroclastic emissions were reported. A landslide was identified on 13 May on the E flank of the volcano 50 m from the crater rim and extending 300 m away; SERNAGEOMIN noted that this event may have occurred on 12 May. During the morning of 27 and 28 May minor Strombolian explosions characterized by incandescent ejecta were recorded at the crater rim; the last reported Strombolian explosions had occurred at the end of March.
Seismic activity during June consisted of five volcano-tectonic (VT)-type events, 21,606 LP-type events, and 2,085 TR-type events. The average value of sulfur dioxide flux obtained by DOAS equipment was 1,420 ± 217 t/d during 1-15 June and 2,562 ± 804 t/d, with a maximum daily value of 4,810 t/d on 17 June. White gas-and-steam emissions rose less than 480 m above the crater; frequent nighttime crater incandescence was reflected in the degassing plume. On 12 June an emission rose 100 m above the crater and drifted NNW. On 15 June one or several emissions resulted in ashfall to the NE as far as 5.5 km from the crater, based on a Skysat satellite image. Several Strombolian explosions occurred within the crater; activity on 15 June was higher energy and ejected blocks 200-300 m on the NE slope. Surveillance cameras showed white gas-and-steam emissions rising 480 m above the crater on 16 June. On 19 and 24 June low-intensity Strombolian activity was observed, ejecting material as far as 200 m from the center of the crater to the E.
During July, seismicity included 29,319 LP-type events, 3,736 TR-type events, and two VT-type events. DOAS equipment recorded two days of sulfur dioxide emissions of 4,220 t/d and 1,009 t/d on 1 and 13 July, respectively. Constant nighttime incandescence was also recorded and was particularly noticeable when accompanied by eruptive columns on 12 and 16 July. Minor explosive events were detected in the crater. According to Skysat satellite images taken on 12, 13, and 16 July, ashfall deposits were identified 155 m S of the crater. According to POVI, incandescence was visible from two vents on the crater floor around 0336 on 12 July. Gas-and-ash emissions rose as high as 1.2 km above the crater on 13 July and drifted E and NW. A series of gas-and-steam pulses containing some ash deposited material on the upper E flank around 1551 on 13 July. During 16-31 July, average sulfur dioxide emissions of 1,679 ± 406 t/d were recorded, with a maximum daily value of 2,343 t/d on 28 July. Fine ash emissions were also reported on 16, 17, and 23 July.
Seismicity persisted during August, characterized by 27,011 LP-type events, 3,323 TR-type events, and three VT-type events. The average value of sulfur dioxide measurements taken during 1-15 August was 1,642 ± 270 t/d and 2,207 ± 4,549 t/d during 16-31 August, with a maximum daily value of 3,294 t/d on 27 August. Nighttime crater incandescence remained visible in degassing columns. White gas-and-steam emissions rose 480 m above the crater on 6 August. According to a Skysat satellite image from 6 August, ash accumulation was observed proximal to the crater and was mainly distributed toward the E slope. White gas-and-steam emissions rose 320 m above the crater on 26 August. Nighttime incandescence and Strombolian activity that generated ash emissions were reported on 27 August.
Seismicity during September was characterized by five VT-type events, 12,057 LP-type events, and 2,058 TR-type events. Nighttime incandescence persisted. On 2 September an ash emission rose 180 m above the crater and drifted SE at 1643 (figure 125) and a white gas-and-steam plume rose 320 m above the crater. According to the Buenos Aires VAAC, periods of continuous gas-and-ash emissions were visible in webcam images from 1830 on 2 September to 0110 on 3 September. Strombolian activity was observed on 2 September and during the early morning of 3 September, the latter event of which generated an ash emission that rose 60 m above the crater and drifted 100 m from the center of the crater to the NE and SW. Ashfall was reported to the SE and S as far as 750 m from the crater. The lava lake was active during 3-4 September and lava fountaining was visible for the first time since 26 March 2023, according to POVI. Fountains captured in webcam images at 2133 on 3 September and at 0054 on 4 September rose as high as 60 m above the crater rim and ejected material onto the upper W flank. Sulfur dioxide flux of 1,730 t/d and 1,281 t/d was measured on 3 and 4 September, respectively, according to data obtained by DOAS equipment.
Strong Strombolian activity and larger gas-and-ash plumes were reported during 18-20 September. On 18 September activity was also associated with energetic LP-type events and notable sulfur dioxide fluxes (as high as 4,277 t/d). On 19 September Strombolian activity and incandescence were observed. On 20 September at 0914 ash emissions rose 50 m above the crater and drifted SSE, accompanied by Strombolian activity that ejected material less than 100 m SSE, causing fall deposits on that respective flank. SERNAGEOMIN reported that a Planet Scope satellite image taken on 20 September showed the lava lake in the crater, measuring 32 m x 35 m and an area of 0.001 km2. Several ash emissions were recorded at 0841, 0910, 1251, 1306, 1312, 1315, and 1324 on 23 September and rose less than 150 m above the crater. The sulfur dioxide flux value was 698 t/d on 23 September and 1,097 t/d on 24 September. On 24 September the Volcanic Alert Level (VAL) was raised to Orange (the third level on a four-color scale). SENAPRED maintained the Alert Level at Yellow (the middle level on a three-color scale) for the communities of Villarrica, Pucón (16 km N), Curarrehue, and Panguipulli.
During 24-25 September there was an increase in seismic energy (observed at TR-events) and acoustic signals, characterized by 1 VT-type event, 213 LP-type events, and 124 TR-type events. Mainly white gas-and-steam emissions, in addition to occasional fine ash emissions were recorded. During the early morning of 25 September Strombolian explosions were reported and ejected material 250 m in all directions, though dominantly toward the NW. On 25 September the average value of sulfur dioxide flux was 760 t/d. Seismicity during 25-30 September consisted of five VT-type events, 1,937 LP-type events, and 456 TR-type events.
During 25-29 September moderate Strombolian activity was observed and ejected material as far as the crater rim. In addition, ash pulses lasting roughly 50 minutes were observed around 0700 and dispersed ENE. During 26-27 September a TR episode lasted 6.5 hours and was accompanied by discrete acoustic signals. Satellite images from 26 September showed a spatter cone on the crater floor with one vent that measured 10 x 14 m and a smaller vent about 35 m NE of the cone. SERNAGEOMIN reported an abundant number of bomb-sized blocks up to 150 m from the crater, as well as impact marks on the snow, which indicated explosive activity. A low-altitude ash emission was observed drifting NW around 1140 on 28 September, based on webcam images. Between 0620 and 0850 on 29 September an ash emission rose 60 m above the crater and drifted NW. During an overflight taken around 1000 on 29 September scientists observed molten material in the vent, a large accumulation of pyroclasts inside the crater, and energetic degassing, some of which contained a small amount of ash. Block-sized pyroclasts were deposited on the internal walls and near the crater, and a distal ash deposit was also visible. The average sulfur dioxide flux measured on 28 September was 344 t/d. Satellite images taken on 29 September ashfall was deposited roughly 3 km WNW from the crater and nighttime crater incandescence remained visible. The average sulfur dioxide flux value from 29 September was 199 t/d. On 30 September at 0740 a pulsating ash emission rose 1.1 km above the crater and drifted NNW (figure 126). Deposits on the S flank extended as far as 4.5 km from the crater rim, based on satellite images from 30 September.
Infrared MODIS satellite data processed by MIROVA (Middle InfraRed Observation of Volcanic Activity) showed intermittent thermal activity during April through September, with slightly stronger activity detected during late September (figure 127). Small clusters of thermal activity were detected during mid-June, early July, early August, and late September. According to the MODVOLC thermal alert system, a total of four thermal hotspots were detected on 7 July and 3 and 23 September. This activity was also intermittently captured in infrared satellite imagery on clear weather days (figure 128).
Geologic Background. The glacier-covered Villarrica stratovolcano, in the northern Lakes District of central Chile, is ~15 km south of the city of Pucon. A 2-km-wide caldera that formed about 3,500 years ago is located at the base of the presently active, dominantly basaltic to basaltic andesite cone at the NW margin of a 6-km-wide Pleistocene caldera. More than 30 scoria cones and fissure vents are present on the flanks. Plinian eruptions and pyroclastic flows that have extended up to 20 km from the volcano were produced during the Holocene. Lava flows up to 18 km long have issued from summit and flank vents. Eruptions documented since 1558 CE have consisted largely of mild-to-moderate explosive activity with occasional lava effusion. Glaciers cover 40 km2 of the volcano, and lahars have damaged towns on its flanks.
Information Contacts: Servicio Nacional de Geología y Minería (SERNAGEOMIN), Observatorio Volcanológico de Los Andes del Sur (OVDAS), Avda Sta María No. 0104, Santiago, Chile (URL: http://www.sernageomin.cl/); Proyecto Observación Villarrica Internet (POVI) (URL: http://www.povi.cl/); Sistema y Servicio Nacional de Prevención y Repuesta Ante Desastres (SENAPRED), Av. Beauchef 1671, Santiago, Chile (URL: https://web.senapred.cl/); Buenos Aires Volcanic Ash Advisory Center (VAAC), Servicio Meteorológico Nacional-Fuerza Aérea Argentina, 25 de mayo 658, Buenos Aires, Argentina (URL: http://www.smn.gov.ar/vaac/buenosaires/inicio.php); MIROVA (Middle InfraRed Observation of Volcanic Activity), a collaborative project between the Universities of Turin and Florence (Italy) supported by the Centre for Volcanic Risk of the Italian Civil Protection Department (URL: http://www.mirovaweb.it/); Hawai'i Institute of Geophysics and Planetology (HIGP) - MODVOLC Thermal Alerts System, School of Ocean and Earth Science and Technology (SOEST), Univ. of Hawai'i, 2525 Correa Road, Honolulu, HI 96822, USA (URL: http://modis.higp.hawaii.edu/); Copernicus Browser, Copernicus Data Space Ecosystem, European Space Agency (URL: https://dataspace.copernicus.eu/browser/).
Merapi (Indonesia) — October 2023 Cite this Report
Merapi
Indonesia
7.54°S, 110.446°E; summit elev. 2910 m
All times are local (unless otherwise noted)
Frequent incandescent avalanches during April-September 2023
Merapi, located just north of the major city of Yogyakarta in central Java, Indonesia, has had activity within the last 20 years characterized by pyroclastic flows and lahars accompanying growth and collapse of the steep-sided active summit lava dome. The current eruption period began in late December 2020 and has more recently consisted of ash plumes, intermittent incandescent avalanches of material, and pyroclastic flows (BGVN 48:04). This report covers activity during April through September 2023, based on information from Balai Penyelidikan dan Pengembangan Teknologi Kebencanaan Geologi (BPPTKG), the Center for Research and Development of Geological Disaster Technology, a branch of PVMBG which specifically monitors Merapi. Additional information comes from the Pusat Vulkanologi dan Mitigasi Bencana Geologi (PVMBG, also known as Indonesian Center for Volcanology and Geological Hazard Mitigation, CVGHM), MAGMA Indonesia, the Darwin Volcanic Ash Advisory Centre (VAAC), and various satellite data.
Activity during April through September 2023 primarily consisted of incandescent avalanches of material that mainly affected the SW and W flanks and traveled as far as 2.3 km from the summit (table 25) and white gas-and-steam emissions that rose 10-1,000 m above the crater.
Table 25. Monthly summary of avalanches and avalanche distances recorded at Merapi during April through September 2023. The number of reported avalanches does not include instances where possible avalanches were heard but could not be visually confirmed as a result of inclement weather. Data courtesy of BPPTKG (April-September 2023 daily reports).
| Month |
Average number of avalanches per day |
Distance avalanches traveled (m) |
| Apr 2023 |
19 |
1,200-2,000 |
| May 2023 |
22 |
500-2,000 |
| Jun 2023 |
18 |
1,200-2,000 |
| Jul 2023 |
30 |
300-2,000 |
| Aug 2023 |
25 |
400-2,300 |
| Sep 2023 |
23 |
600-2,000 |
BPPTKG reported that during April and May white gas-and-steam emissions rose 10-750 m above the crater, incandescent avalanches descended 500-2,000 m on the SW and W flanks (figure 135). Cloudy weather often prevented clear views of the summit, and sometimes avalanches could not be confirmed. According to a webcam image, a pyroclastic flow was visible on 17 April at 0531. During the week of 28 April and 4 May a pyroclastic flow was reported on the SW flank, traveling up to 2.5 km. According to a drone overflight taken on 17 May the SW lava dome volume was an estimated 2,372,800 cubic meters and the dome in the main crater was an estimated 2,337,300 cubic meters.
During June and July similar activity persisted with white gas-and-steam emissions rising 10-350 m above the crater and frequent incandescent avalanches that traveled 300-2,000 m down the SW, W, and S flanks (figure 136). Based on an analysis of aerial photos taken on 24 June the volume of the SW lava dome was approximately 2.5 million cubic meters. A pyroclastic flow was observed on 5 July that traveled 2.7 km on the SW flank. According to the Darwin VAAC multiple minor ash plumes were identified in satellite images on 19 July that rose to 3.7 km altitude and drifted S and SW. During 22, 25, and 26 July a total of 17 avalanches descended as far as 1.8 km on the S flank.
Frequent white gas-and-steam emissions continued during August and September, rising 10-450 m above the crater. Incandescent avalanches mainly affected the SW and W flanks and traveled 400-2,300 m from the vent (figure 137). An aerial survey conducted on 10 August was analyzed and reported that estimates of the SW dome volume was 2,764,300 cubic meters and the dome in the main crater was 2,369,800 cubic meters.
Frequent and moderate-power thermal activity continued throughout the reporting period, according to a MIROVA (Middle InfraRed Observation of Volcanic Activity) analysis of MODIS satellite data (figure 138). There was an increase in the number of detected anomalies during mid-May. The MODVOLC thermal algorithm recorded a total of 47 thermal hotspots: six during April, nine during May, eight during June, 15 during July, four during August, and five during September. Some of this activity was captured in infrared satellite imagery on clear weather days, sometimes accompanied by incandescent material on the SW flank (figure 139).
Geologic Background. Merapi, one of Indonesia's most active volcanoes, lies in one of the world's most densely populated areas and dominates the landscape immediately north of the major city of Yogyakarta. It is the youngest and southernmost of a volcanic chain extending NNW to Ungaran volcano. Growth of Old Merapi during the Pleistocene ended with major edifice collapse perhaps about 2,000 years ago, leaving a large arcuate scarp cutting the eroded older Batulawang volcano. Subsequent growth of the steep-sided Young Merapi edifice, its upper part unvegetated due to frequent activity, began SW of the earlier collapse scarp. Pyroclastic flows and lahars accompanying growth and collapse of the steep-sided active summit lava dome have devastated cultivated lands on the western-to-southern flanks and caused many fatalities.
Information Contacts: Balai Penyelidikan dan Pengembangan Teknologi Kebencanaan Geologi (BPPTKG), Center for Research and Development of Geological Disaster Technology (URL: http://merapi.bgl.esdm.go.id/, Twitter: @BPPTKG); MAGMA Indonesia, Kementerian Energi dan Sumber Daya Mineral (URL: https://magma.esdm.go.id/v1); Pusat Vulkanologi dan Mitigasi Bencana Geologi (PVMBG, also known as Indonesian Center for Volcanology and Geological Hazard Mitigation, CVGHM), Jalan Diponegoro 57, Bandung 40122, Indonesia (URL: http://www.vsi.esdm.go.id/); Darwin Volcanic Ash Advisory Centre (VAAC), Bureau of Meteorology, Northern Territory Regional Office, PO Box 40050, Casuarina, NT 0811, Australia (URL: http://www.bom.gov.au/info/vaac/); MIROVA (Middle InfraRed Observation of Volcanic Activity), a collaborative project between the Universities of Turin and Florence (Italy) supported by the Centre for Volcanic Risk of the Italian Civil Protection Department (URL: http://www.mirovaweb.it/); Hawai'i Institute of Geophysics and Planetology (HIGP) - MODVOLC Thermal Alerts System, School of Ocean and Earth Science and Technology (SOEST), Univ. of Hawai'i, 2525 Correa Road, Honolulu, HI 96822, USA (URL: http://modis.higp.hawaii.edu/); Copernicus Browser, Copernicus Data Space Ecosystem, European Space Agency (URL: https://dataspace.copernicus.eu/browser/); Øystein Lund Andersen (URL: https://www.oysteinlundandersen.com/, https://twitter.com/oysteinvolcano).
Ebeko
Russia
50.686°N, 156.014°E; summit elev. 1103 m
All times are local (unless otherwise noted)
Moderate explosive activity with ash plumes continued during June-November 2023
Ebeko, located on the N end of Paramushir Island in Russia’s Kuril Islands just S of the Kamchatka Peninsula, consists of three summit craters along a SSW-NNE line at the northern end of a complex of five volcanic cones. Observed eruptions date back to the late 18th century and have been characterized as small-to-moderate explosions from the summit crater, accompanied by intense fumarolic activity. The current eruptive period began in June 2022, consisting of frequent explosions, ash plumes, and thermal activity (BGVN 47:10, 48:06). This report covers similar activity during June-November 2023, based on information from the Kamchatka Volcanic Eruptions Response Team (KVERT) and satellite data.
Moderate explosive activity continued during June-November 2023 (figures 50 and 51). According to visual data from Severo-Kurilsk, explosions sent ash 2-3.5 km above the summit (3-4.5 km altitude) during most days during June through mid-September. Activity after mid-September was slightly weaker, with ash usually reaching less than 2 km above the summit. According to KVERT the volcano in October and November was, with a few exceptions, either quiet or obscured by clouds that prevented satellite observations. KVERT issued Volcano Observatory Notices for Aviation (VONA) on 8 and 12 June, 13 and 22 July, 3 and 21 August, and 31 October warning of potential aviation hazards from ash plumes drifting 3-15 km from the volcano. Based on satellite data, KVERT reported a persistent thermal anomaly whenever weather clouds permitted viewing.
Geologic Background. The flat-topped summit of the central cone of Ebeko volcano, one of the most active in the Kuril Islands, occupies the northern end of Paramushir Island. Three summit craters located along a SSW-NNE line form Ebeko volcano proper, at the northern end of a complex of five volcanic cones. Blocky lava flows extend west from Ebeko and SE from the neighboring Nezametnyi cone. The eastern part of the southern crater contains strong solfataras and a large boiling spring. The central crater is filled by a lake about 20 m deep whose shores are lined with steaming solfataras; the northern crater lies across a narrow, low barrier from the central crater and contains a small, cold crescentic lake. Historical activity, recorded since the late-18th century, has been restricted to small-to-moderate explosive eruptions from the summit craters. Intense fumarolic activity occurs in the summit craters, on the outer flanks of the cone, and in lateral explosion craters.
Information Contacts: Kamchatka Volcanic Eruptions Response Team (KVERT), Far Eastern Branch, Russian Academy of Sciences, 9 Piip Blvd., Petropavlovsk-Kamchatsky, 683006, Russia (URL: http://www.kscnet.ru/ivs/kvert/).
Search Bulletin Archive by Publication Date
Select a month and year from the drop-downs and click "Show Issue" to have that issue displayed in this tab.
The default month and year is the latest issue available.
Bulletin of the Global Volcanism Network - Volume 26, Number 04 (April 2001)
Managing Editor: Richard Wunderman
Cleveland (United States)
Further eruptions and ash plumes during March 2001
Colima (Mexico)
Correction to last report; a strong dome explosion on 22 February 2001
Klyuchevskoy (Russia)
Consistent gas-and-steam emissions; high seismicity
Masaya (Nicaragua)
Tourists experience a brief, bomb-charged 23 April 2001 explosion: no fatalities
Pacaya (Guatemala)
Substantial increases in SO2 degassing
Santa Ana (El Salvador)
2000-2001 observations of glowing fumaroles and release of magmatic gas
Santa Maria (Guatemala)
Block lava flow continues, filling in valleys and destroying vegetation
Sheveluch (Russia)
Hazard status reaches Red; new dome formation during May 2001
Stromboli (Italy)
Variable seismicity during late 2000 and early 2001; spatter ejected above crater rims
Cleveland (United States) — April 2001 Cite this Report
Cleveland
United States
52.825°N, 169.944°W; summit elev. 1730 m
All times are local (unless otherwise noted)
Further eruptions and ash plumes during March 2001
As predicted in February 2001 (BGVN 26:01) by staff at the Alaska Volcano Observatory (AVO), Cleveland erupted again, sending up noteworthy plumes on both 11 and 19 March. The 11 March event produced an ash plume that reached a height of ~4.4-5.9 km above Cleveland's summit (figure 3). On 19 March, AVO detected an explosive eruption on satellite imagery that began at ~1430. According to images taken at 1830, the ash cloud was V-shaped with one portion extending 185 km to the E and the other extending ~200 km to the SE (figure 4). The National Weather Service estimated the top of the cloud to be at ~9.7 km altitude. At about 1900, an observer in Nikolski, ~70 km to the E of the volcano, reported an intense haze resulting from the ash that extended to the SE, but saw no local ashfall.
The Washington Volcanic Ash Advisory Center (VAAC) issued advisories for both eruptions based on information from GOES-10 infrared and multi-spectral imagery (figure 4). No ash was detected in satellite imagery reported in the subsequent advisory issued at 0500 on 20 March; the ash from the eruption had dissipated.
Volcanic unrest continued at Cleveland through 4 May. Pulses of volcanic tremor continued to be detected by an AVO seismic network 230 km to the E of the volcano. AVO personnel installed a temporary seismic-recording instrument at Nikolski in an attempt to verify that the source of the tremor was Cleveland. AVO had received no reports of significant volcanic activity from either pilots, nearby residents, or satellite remote sensors since the last eruption on 19 March.
Geologic Background. The beautifully symmetrical Mount Cleveland stratovolcano is situated at the western end of the uninhabited Chuginadak Island. It lies SE across Carlisle Pass strait from Carlisle volcano and NE across Chuginadak Pass strait from Herbert volcano. Joined to the rest of Chuginadak Island by a low isthmus, Cleveland is the highest of the Islands of the Four Mountains group and is one of the most active of the Aleutian Islands. The native name, Chuginadak, refers to the Aleut goddess of fire, who was thought to reside on the volcano. Numerous large lava flows descend the steep-sided flanks. It is possible that some 18th-to-19th century eruptions attributed to Carlisle should be ascribed to Cleveland (Miller et al., 1998). In 1944 it produced the only known fatality from an Aleutian eruption. Recent eruptions have been characterized by short-lived explosive ash emissions, at times accompanied by lava fountaining and lava flows down the flanks.
Information Contacts: Tom Miller and Dave Schneider, Alaska Volcano Observatory (AVO), a cooperative program of a) U.S. Geological Survey, 4200 University Drive, Anchorage, AK 99508-4667, USA (URL: http://www.avo.alaska.edu/), b) Geophysical Institute, University of Alaska, PO Box 757320, Fairbanks, AK 99775-7320, USA, and c) Alaska Division of Geological & Geophysical Surveys, 794 University Ave., Suite 200, Fairbanks, AK 99709, USA; Washington Volcanic Ash Advisory Center (VAAC), Washington, DC, USA (URL: http://www.ospo.noaa.gov/Products/atmosphere/vaac/).
Colima
Mexico
19.514°N, 103.62°W; summit elev. 3850 m
All times are local (unless otherwise noted)
Correction to last report; a strong dome explosion on 22 February 2001
This report primarily covers an explosion that occurred on 22 February 2001. Colima was previously discussed in BGVN 25:06 in a summary of reports by the University of Colima's Volcano Observatory covering the interval from August 1999-May 2000. That report contained several mistakes worth noting here. First, at that time residents were not evacuated but rather were advised to avoid entering closer than a radius of 6.5 km. Second, the 11.5 km radius serves to alert residents of settlements like Yerbabuena (at 8 km radial distance) and La Becerrara (12 km) in cases of heightened activity when evacuations are called for. Such evacuations did not occur in the stated interval. Those corrections addressed, its also worth noting that citizens continued to be cautioned to avoid drainages for fear of lahars. Occasional volcanic outbursts continued, as noted in an early August 2000 observatory report. Authorities remained concerned about the possibility of strong outbursts like those seen on 10 February and 17 July 1999 (BGVN 24:01, 24:02, 24:06, and 24:08). An observatory report on 22 September 2000 noted a slight decline in activity seen in monitored parameters during the previous week. A volcanic ash advisory on 11 November 2000 reported ash to ~6 km altitude, although this could not be confirmed by GOES-8 satellite imagery.
22 February 2001: Visual and video observations. On 22 February at 0532 a strong explosion took place at Colima's intracrater dome. Based on images from video cameras at both the infrared and visible wavelengths, the explosive column expanded laterally at ~100 m/s and rose with mean velocity of ~200 m/s to attain an altitude ~3 km above the summit. The ash cloud, which on the videos appeared as a broad and conspicuous zone above the summit, proceeded to travel to the ENE and produced ashfall at a distance of ~25 km from the volcano in Tuxpan, Jalisco. Small pyroclastic flows formed in the SW sector and descended to the 3,000 m contour interval.
Inside of Colima's 250-m-diameter summit crater the explosion left a new crater ~150 m in diameter and ~30 m deep. The largest ejected blocks measured greater than 5 m in diameter and fell ~300-400 m below the crater. Principally in the volcano's NE sector, observers found rock fragments up to 1.5 km from the vent that created impact craters up to 2 m in diameter. The rock fragments consisted of fresh andesite, dome material presumably emplaced during the 1998-1999 eruption.
Seismic and tilt observations. Figure 38 shows the epicenters and hypocenters of 33 earthquakes located during February 2001. The figure shows events at depths ranging from the summit crater to 5 km below sea level. Fifteen earthquakes (M 1.9-3.9) were recorded during the 9-hour interval prior to the 22 February explosion. These events are shown on figure 38 as points surrounded by open circles.
Figure 39 shows the variations in seismic energy release during February as recorded by station EZV4. The increase in seismicity starting 48 hours before the 22 February explosion is clearly seen. The seismic signal labeled "explosion" on 22 February was much larger than any others seen in the same month.
The 22 February explosion accompanied sharp deflation. Tilt at inclinometer station Aguila (AGL, figure 38) was measured in both tangential and radial components. At this station, inclinometers underwent large sudden and non-reversing offsets due to the 22 February explosion. Specifically in the radial direction the offset was ~10 µrad and in the tangential direction, ~32 µrad. For comparison, at other times during February, diurnal variation at this station was on the order of 2 to 3 µrad. Ignoring the large 22 February displacement, the overall offsets seen for the bulk of February amounted to less than ~8 µrad. These comparisons underscore the size of station AGL's non-reversing offsets on 22 Februrary.
Geologic Background. The Colima complex is the most prominent volcanic center of the western Mexican Volcanic Belt. It consists of two southward-younging volcanoes, Nevado de Colima (the high point of the complex) on the north and the historically active Volcán de Colima at the south. A group of late-Pleistocene cinder cones is located on the floor of the Colima graben west and east of the complex. Volcán de Colima (also known as Volcán Fuego) is a youthful stratovolcano constructed within a 5-km-wide scarp, breached to the south, that has been the source of large debris avalanches. Major slope failures have occurred repeatedly from both the Nevado and Colima cones, producing thick debris-avalanche deposits on three sides of the complex. Frequent recorded eruptions date back to the 16th century. Occasional major explosive eruptions have destroyed the summit (most recently in 1913) and left a deep, steep-sided crater that was slowly refilled and then overtopped by lava dome growth.
Information Contacts: Observatorio Vulcanológico de la Universidad de Colima, Colima, Col., 28045, México (URL: https://portal.ucol.mx/cueiv/).
Klyuchevskoy (Russia) — April 2001 Cite this Report
Klyuchevskoy
Russia
56.056°N, 160.642°E; summit elev. 4754 m
All times are local (unless otherwise noted)
Consistent gas-and-steam emissions; high seismicity
The following report covers the interval of 30 December 2000-10 May 2001, during which Kliuchevskoi had a maximum Level of Concern Color Code of Yellow. Since the previous report (BGVN 25:09), gas-and-steam plumes rose from the volcano throughout the entire report period. During 30 December 2000-1 February 2001, seismicity remained at background levels and fumarolic plumes rose up to 1,000 m. Strong shallow earthquakes were subsequently recorded on 4 and 18 February. Gas-and-steam plumes continued to rise and reached a maximum height of 1,200 m above the summit through 22 February.
Beginning during 22-24 and 27-28 February, episodes of weak spasmodic tremor were registered. Weak interrupted tremor continued during 2-29 March. On 4 March the Kamchatka Volcanic Eruptions Response Team (KVERT) reported a gas-and-steam plume with a maximum height of 1,000 m extending 10 km NE of the volcano. Satellite imagery detected the large plume and prompted the Tokyo Volcanic Ash Advisory Center (VAAC) to issue an ash advisory the same day despite no reported detection of ash by KVERT. From 1925 to 1940 on 15 March seismographs recorded an intense series of shallow earthquakes. Gas-and-steam plumes reached heights of 2,000 m during mid-March. At about this time KVERT raised the hazard level of Kliuchevskoi from Green to Yellow.
The level of volcanic tremor began to gradually increase again at 1000 on 7 April; a significantly high level of tremor occurred at 1300 on the same day. At 0717 on 8 April seismicity increased sharply with a swarm of shallow earthquakes (M ~ 2) accompanied by volcanic tremor. No eruptive activity was observed, and after 0900 activity decreased substantially. Similar low-level seismicity continued through 12 April, and KVERT decreased the volcano's hazard level from Yellow to Green following this date.
Elevated seismicity continued at 1259 on 13 April with a strong earthquake (M ~ 5) that occurred between Kliuchevskoi and Ushkovsky volcanoes at a depth of ~12 km. Aftershocks of this event (M <= ~ 4.2) continued to occur through 19 April. Small shallow earthquakes were also registered. During 20 April-10 May low-level fumarolic activity was prevalent with plumes that rose up to 1,500 m and background-level seismicity. KVERT maintained a hazard status of GREEN as of 10 May 2001.
Geologic Background. Klyuchevskoy is the highest and most active volcano on the Kamchatka Peninsula. Since its origin about 6,000 years ago, this symmetrical, basaltic stratovolcano has produced frequent moderate-volume explosive and effusive eruptions without major periods of inactivity. It rises above a saddle NE of Kamen volcano and lies SE of the broad Ushkovsky massif. More than 100 flank eruptions have occurred during approximately the past 3,000 years, with most lateral craters and cones occurring along radial fissures between the unconfined NE-to-SE flanks of the conical volcano between 500 and 3,600 m elevation. Eruptions recorded since the late 17th century have resulted in frequent changes to the morphology of the 700-m-wide summit crater. These eruptions over the past 400 years have originated primarily from the summit crater, but have also included numerous major explosive and effusive eruptions from flank craters.
Information Contacts: Olga Chubarova, Kamchatka Volcanic Eruptions Response Team (KVERT), Institute of Volcanic Geology and Geochemistry, Piip Ave. 9, Petropavlovsk-Kamchatsky, 683006, Russia; Tom Miller, Alaska Volcano Observatory (AVO), a cooperative program of a) U.S. Geological Survey, 4200 University Drive, Anchorage, AK 99508-4667, USA (URL: http://www.avo.alaska.edu/), b) Geophysical Institute, University of Alaska, PO Box 757320, Fairbanks, AK 99775-7320, USA, and c) Alaska Division of Geological & Geophysical Surveys, 794 University Ave., Suite 200, Fairbanks, AK 99709, USA; Tokyo Volcanic Ash Advisory Center (VAAC), Tokyo, Japan (URL: https://ds.data.jma.go.jp/svd/vaac/data/).
Masaya
Nicaragua
11.9844°N, 86.1688°W; summit elev. 594 m
All times are local (unless otherwise noted)
Tourists experience a brief, bomb-charged 23 April 2001 explosion: no fatalities
INETER report. The Nicaraguan group INETER (Instituto Nicaragüense de Estudios Territoriales) stated that Masaya's active summit crater, Santiago, produced an explosion at 1426 on 23 April. The explosion continued for ~2 minutes and a new 10-m-diameter vent opened on the crater floor ~30 m S of the previous vent. Fragments up to 60 cm in diameter flew through the air, falling up to 500 m from the crater. Episodic ashfall was reported near the settlement of Tecuantepe, 6 km NW of Masaya volcano, and people there contended with abnormal concentrations of volcanic gases. Scientists from Cambridge University (UK) who carried out gas measurements at Santiago crater left just one hour before the explosion and had not noticed any unusual precursory behavior. Preliminary, post-event scrutiny of the seismicity failed to reveal precursory signs.
After the explosion, the volcano returned to its typical stable state and monitored parameters remained at normal levels. INETER volcanologists who continuously monitored Santiago in the afternoon and during the night reported several smaller explosions, gas outbreaks and minor collapses of the crater wall. Following the explosion, Masaya National Park closed public access to the crater-rim areas (including the Plaza Sapper visitor platform and parking lot) for the next several days.
The 24 April report noted minor ash-bearing explosions (specifically mentioning one at 1526), but these events did not exceed those typically seen nor did they accompany abnormally large seismic signals. On this day, the previously active vent no longer gave off gases. The report noted that in the current circumstances, the area of primary hazard lay within 500 m of the vent. It also said that areas farther out, particularly as far away as local habitations or along the Managua-Masaya highway, should not be affected.
SO2 monitoring at the visitor's plaza was conducted at 1020 on 24 April. It indicated that, with respect to 23 April at 1800, the ambient gas concentration there had decreased more than 72%. Since these were not flux measurements but were only ambient SO2 concentrations, fresh winds may have contributed to the decreased concentrations. The 25 April report on Masaya noted slightly larger output than the day before, including ash deposition, but noted 29% lower SO2 concentration than the day before. In harmony with the SO2 concentration decrease on 25 April, sulfurous gases then measured ~2.0 ppm in local settlements (Comarcas La Borgoña and San José de los Ríos), half the value measured the previous day.
The 27 April report noted few episodes of strong degassing during the previous two days, but normal tremor and little seismicity. A second seismic station was installed on the volcano at a spot near the visitor's platform.
23 April eyewitness account and photos. What started out as a routine sightseeing stop escalated into a local crisis as over 120 tourists found themselves on the crater rim during what was one of the more energetic Masaya explosions reported in the Bulletin in the past 30 years. Few, if any, of those earlier events had been witnessed at close range, and in retrospect it seems fortuitous that in this event no one was killed.
The event highlights the difficulty of assessing, preparing for, and conveying the possibility of infrequent, sudden events. The accompanying photos document the ambiguity of assessing the event's magnitude during the explosion's critical early stages. After the event, the majority of eye witnesses with photographs and videos quickly departed from Nicaragua, having shared almost no information with authorities.
Figures 13-19 show selected scenes the tourists captured on film during and just after the explosion. The photos were taken from the 500-m-diameter Santiago crater's N side (for maps of the crater area see SEAN 14:06 and BGVN 16:02). Figures 13-17 are in chronological order; figures 17-19 show selected scenes in the aftermath of the explosion, after the parking area had been largely vacated of vehicles.
The buses were parked in the crater rim area's N parking area. Progressing upslope and along the crater rim, a foot trail leads to the elevated overlook (~200 m W of the parking lot's center). During the explosion this trail became very exposed to ash and ballistics. Although not shown on any of the included photos, a large cross stands at the elevated overlook in the vicinity of where many of the photographers were standing at the time of the eruption (not shown in figures here but labled "La Cruz" on maps in earlier Bulletins).
The photos were furnished to the Bulletin by Joanne Gordon; Mark Headrick also helped explain the significance of some features in the photos. Photos shot by Headrick used an auto-focusing camera with a fixed-focus lens.
Figures 13-15 show the early progression of the ash- and bomb-charged plume. Although in these photos the rising plume can be seen blown towards the W, during the explosion significant numbers of bombs also fell well beyond the plume's margins. For example, some bombs began pelting the N parking lot, forcing people there to take shelter in buses and cars. Fortunately, comparatively few bombs were launched over the local high adjacent the NNW rim where photographers shot figures 13-16. The tens of tourists who had stood at the elevated overlook later retreated in haste cross-country down the hill's more sheltered but trackless back-side (figure 16).
Figures 17 and 18 show portions of the bomb-strewn parking lot. Many bombs of roughly half-liter to several-liters in volume can be easily seen. Parking stalls in the lot can be assumed to be roughly 2 x 3 m in size (~6 m2) and typically contain about 1 to 3 such bombs. This implies that on average, roughly 1 such bomb landed in each 2 to 3 m2 area.
Some bombs landing in the parking lot broke into bits on impact and sprayed local areas of the lot with their light-colored fragments (figure 18). Both figures 17 and 18 document local, sometimes circular grass fires, suggesting that some of the bombs were hotter than the several hundred degree kindling temperature of the dry, brown vegetation. Several bombs significantly damaged vehicles in the lot, causing fires, breaking windows, and puncturing and deforming bus roofs. One bomb landed in a then-unoccupied bus seat, and another plowed deep into the hood and engine compartment of a car (figure 19).
Joanne Gordon recounted the events of 23 April as follows: "While traveling by cruise ship from Costa Rica through the Panama Canal towards our final destination of Aruba, we made a one-day stop in Nicaragua for a city bus tour. The Nicaragua stop was the second day of our seven-day cruise. Approximately 150 cruisers [in] five buses were scheduled for the city tour and a short visit to Masaya volcano. The first two buses visited the volcano and were scheduled to have ~ 30 minutes to view the crater. Many of the tourists reported that the odor of sulfur greatly increased during their visit . . . . Those two buses left before the following three buses arrived.
"I was on the last bus to arrive at the crater. After getting off the bus my brother and I excitedly ascended to the top lookout point next to the cross overlooking the lip of the crater. The climb to the top of the crater was about 200 steps up a very unstable staircase . . . . Once we arrived at the top I took a few pictures of the crater and of us. Then I heard a deep rumble and the ground began to shake. It sounded as if it was a huge landslide at the opposite side of the crater. Within seconds I could see a massive black mushroom-shaped cloud of smoke filling the inside of the crater. At that point I ran–thinking, 'Is this normal?' but not wanting to stand at the edge of the crater to find out.
" . . . I ran down the [steep] back side of the hill not realizing it was like running down a slope of marbles . . . . Then I heard a second boom followed by more black smoke, and I heard rocks being thrown from the crater—people screaming—children crying . . . . "I heard a little girl's voice . . . [then] I lost my footing and rolled down the hill. After falling for the second time, I stopped to look for her. She had fallen and was caught on some brush. I could see the sky was black but the smoke was moving away from us and the explosion had stopped. I waited with her, trying to calm her . . . . I could see her dad and my brother rushing down the hill trying to keep from falling. When they caught up to us we traversed our way down the hill to the buses, which had been parked about 10-15 feet [3-5 m] from the crater and had now moved out of sight. They had driven away, moving out from under the shower of rocks.
"At this point I had thought it was just the 30-50 people crowded at the top lookout point that were in danger. Little did I know that while I was running to get away from the blast of smoke from the top, the people at the bottom were dodging rocks. It looked like a war zone. Bus windows [had] broken . . . [and (according to Mark Headrick) one bus with its backside facing the crater suffered extensive damage from ejecta, including the loss of its rear window and severe damage to the fiberglass engine cowling. The damage went deeper, and although it drove a short distance away, this bus soon ceased functioning and had to be abandoned]. One lava rock had landed on the top of a bus, and . . . [wedged into the roof where it caught fire to combustible material]. People [were] bleeding, limping, crying, and desperate to get as far away as possible. The hillside next to the parking lot was filled with burned circles. As the lava rocks hit the ground they caught fire to the surrounding brush.
"We all piled on buses and drove a little ways to the park entrance to make sure all were accounted for. I got out of the bus for first aid. I suffered abrasions down both of my arms and legs . . . . We all wanted to get in the buses and get the heck away from the mountain as quickly as possible. We left just before the news cameras and fire department arrived. We drove for about an hour and a half back to the port to board the ship and . . . [departed] Nicaragua.
"At least 15 of the 90 people on the last buses were treated by the ship's infirmary for wounds ranging from a broken arm [wrist], broken foot, abrasions, and cuts and bruises from falling or being struck by rocks. Most of the people that were struck with rocks were injured after the rocks bounced and hit the legs, shoulders, and backs.
" . . . [the cruise line] was very accommodating—they flew a crisis counselor to the ship to comfort the passengers and the 28 crew members that were also at the volcano."
Report from the ship's doctor. Medical doctor Sydney Schneidman practices emergency medicine and was the acting physician on board the cruise ship, which was moored at San Juan del Sur when the accident occurred. As injured people returned to the ship, Schneidman quickly learned that the people suffered from both physical and psychological trauma, and many of the injuries within each of these groups were quite similar.
He recalled that the most serious physical injury was a broken wrist due to a fall. This and many other injuries to 10-15 people occurred when people fleeing the fallout took the steep, off-trail escape route described above. The visitors were forced to move quickly in this direction because flying debris blocked the trail leading back to the parking lot and the buses. Many of the abrasions obtained on this forced evacuation route were leg wounds from sharp-edged volcanic rocks. In addition, Schneidman noted two or three missile injuries, one a head puncture, two others to the flank (side of the stomach), and one to a hip. (Joanne Gordon noted that a broken foot bone sustained by one of the passengers was diagnosed sometime after the trip was over.)
Regarding the psychological aspect of the injuries, Schneidman described these as mental trauma from people who thought they were going to die. He advised the visitors be treated without delay by a psychologist skilled in dealing with "critical-instance stress" (CIS) debriefing, and when in Panama one day later, the cruise ship had arranged to pick up a psychologist flown in from the USA specializing in trauma counseling. Over the next several days the psychologist held group therapy sessions. Studies have shown that rapid treatment for trauma can circumvent or decrease several years of difficulties, including sleeplessness, anxiety, and depression (Goenjian and others, 2000; Schmookler, 1996).
Media coverage. The explosion and its effect on tourists were discussed in news articles in the Los Angeles Times and at least one other Southern-California paper (Reich, 2001; Lee, 2001). The television show Inside Edition aired videos and photos taken of the explosion by visitors returning from the cruise ship (Inside Edition, 2001). At the time, Nicaraguan papers covering the story included few if any details about the experiences of the tourists from the cruise ship because they lacked contact with them.
References. Goenjian, A.K., Steinberg, A.M., Najarian, L.M., Fairbanks, L.A., Tashjian, M., and Pynoos, R.S. , 2000, Prospective study of posttraumatic stress, anxiety, and depressive reactions after earthquake and political violence: American Journal of Psychiatry, v. 157, no. 6, p. 911-916.
Inside Edition, 2001, Volcano survivors: King World Productions, 8 May 2001 telecast (video ordering information at the phone number 212-817-5656 ext. 5583); 515 W 57th St., New York, NY 10019 USA.
Lee, Jasmine, 2001, Tested by fire—Area residents recount terror of volcano blast in Nicaragua: Daily Breeze (A Copley Newspaper, Torrance, CA), 3 May 2001, p. A1 and A9.
Reich, Kenneth, 2001, Volcano's eruption shook up vacation of southland sisters—Nicaragua: The two dodged rocks and ash on a sightseeing stop at a crater during a Latin American cruise; one broke her arm: Los Angeles Times, Metro News, 3 May 2001, p. B2.
Schmookler, Edward L., 1996, Trauma treatment manual (URL: http://amsterdam.park.org/Guests/Stream/ trauma_manual.htm).
Geologic Background. Masaya volcano in Nicaragua has erupted frequently since the time of the Spanish Conquistadors, when an active lava lake prompted attempts to extract the volcano's molten "gold" until it was found to be basalt rock upon cooling. It lies within the massive Pleistocene Las Sierras caldera and is itself a broad, 6 x 11 km basaltic caldera with steep-sided walls up to 300 m high. The caldera is filled on its NW end by more than a dozen vents that erupted along a circular, 4-km-diameter fracture system. The Nindirí and Masaya cones, the source of observed eruptions, were constructed at the southern end of the fracture system and contain multiple summit craters, including the currently active Santiago crater. A major basaltic Plinian tephra erupted from Masaya about 6,500 years ago. Recent lava flows cover much of the caldera floor and there is a lake at the far eastern end. A lava flow from the 1670 eruption overtopped the north caldera rim. Periods of long-term vigorous gas emission at roughly quarter-century intervals have caused health hazards and crop damage.
Information Contacts: INETER, Apartado Postal 2110, Managua, Nicaragua; Joanne Gordon, 222 East Carrillo, Ste. 106, c/o PaineWebber, Santa Barbara, CA 93101 USA; Sydney Schneidman, M.D., 1757 Holicong Rd., New Hope, PA 18938 USA.
Pacaya
Guatemala
14.382°N, 90.601°W; summit elev. 2569 m
All times are local (unless otherwise noted)
Substantial increases in SO2 degassing
Activity at Pacaya was at a low level during 21-23 January 2001 based on field observations. Activity was characterized by persistent degassing only from a vent on the floor of the MacKenney cone crater. During the afternoon of 22 January, a low-resonance rumbling was noted within 100 m of the crater rim and continuous tremor was felt at the crater rim. Such activity had not been apparent during the previous afternoon.
On 22 February, according to a report from INSIVUMEH, a local seismometer recorded >600 tremors/day, up from <100 tremors/day in earlier weeks. At the same time, gaseous emission had increased from ~253 metric tons/day (equivalent to the SI unit megagrams per day, Mg/d) to ~550 metric tons/day and there was visible magma in the crater.
The SO2 flux was measured by COSPEC along the highway from Guatemala to Escuintla on 1, 15, and 28 February and on 8 March. The respective flux values in metric tons/day were 951, 1,740, 1,448, and 1,673. These flux rates suggested that although lava outpouring was almost nonexistent, degassing of SO2 was quite high. The average gas emission rate for the 20-year period of 1973-93 at Pacaya was estimated by Andres and others (1993) to be 260 metric tons/day.
Reference. Andres, R.J., Rose, W.I., Stoiber, R.E., Williams, S.N., Matías, O., Morales, R., 1993, A summary of sulfur dioxide emission rate measurements from Guatemalan volcanoes: Bull. Volc. 55, p. 379-388.
Geologic Background. Eruptions from Pacaya are frequently visible from Guatemala City, the nation's capital. This complex basaltic volcano was constructed just outside the southern topographic rim of the 14 x 16 km Pleistocene Amatitlán caldera. A cluster of dacitic lava domes occupies the southern caldera floor. The post-caldera Pacaya massif includes the older Pacaya Viejo and Cerro Grande stratovolcanoes and the currently active Mackenney stratovolcano. Collapse of Pacaya Viejo between 600 and 1,500 years ago produced a debris-avalanche deposit that extends 25 km onto the Pacific coastal plain and left an arcuate scarp inside which the modern Pacaya volcano (Mackenney cone) grew. The NW-flank Cerro Chino crater was last active in the 19th century. During the past several decades, activity has consisted of frequent Strombolian eruptions with intermittent lava flow extrusion that has partially filled in the caldera moat and covered the flanks of Mackenney cone, punctuated by occasional larger explosive eruptions that partially destroy the summit.
Information Contacts: Andy Harris and Luke Flynn, HIGP/SOEST, University of Hawai'i, 2525 Correa Road, Honolulu, HI 96822, USA (URL: http://modis.higp.hawaii.edu/); Mark Davies, School of Environmental Sciences, University of East Anglia, Norwich, NR4 7TJ, United Kingdom; Bill Rose, Gregg Bluth, and Jeremy Shannon, Department of Geological Engineering and Sciences, Michigan Technological University, Houghton, MI 49931, USA; Otoniel Matías and Gustavo Chigna, INSIVUMEH, 7a Av. 14-57, Zona 13, Guatemala City, Guatemala; Rafael W. Rodriguez, Regional Program Manager, U.S. Geological Survey, Hurricane Mitch Relief Program.
Santa Ana (El Salvador) — April 2001 Cite this Report
Santa Ana
El Salvador
13.853°N, 89.63°W; summit elev. 2381 m
All times are local (unless otherwise noted)
2000-2001 observations of glowing fumaroles and release of magmatic gas
Santa Ana's summit crater contains an acid lake that in 2000 was ~200 m in diameter with a maximum depth of 27 m; its volume was estimated at ~200,000 m3. The lake water has a composition typical of acid-sulfate-chloride lakes (table 1). Dissolved sulfates yielded delta34S of 16.0, suggesting that a significant sulfur source is magmatic SO2 gas. Several hot springs with 80°C temperatures lie along the shore of the lake and have compositions close to that of the lake waters. Fumaroles on the W side of the lake had a maximum temperature, recorded in January 2000, of 523°C.
Table 1. Compositions of Santa Ana's crater lake waters for 2000-2001. Samples were collected in 2000 during January (sample designation, SAL), July (SAN1), and August (SAN2), and collected in 2001 during February (SAP). Chemical concentrations are in mg/L. Courtesy of the authors.
| Component |
January 2000 |
July 2000 |
August 2000 |
February 2001 |
| Water pH |
0.91 |
0.91 |
0.9 |
0.85 |
| T, °C |
18.9 |
30 |
30 |
26 |
| |
| Al |
1155 |
1214 |
1161 |
1617 |
| Ca |
819 |
862 |
805 |
1126 |
| Fe |
761 |
832 |
720 |
1020 |
| K |
137 |
145 |
139 |
203 |
| Mg |
299 |
307 |
283 |
379 |
| Mn |
16 |
17 |
16 |
19 |
| Na |
377 |
395 |
367 |
496 |
| Si |
115 |
132 |
129 |
168 |
| F |
218 |
194 |
194 |
383 |
| Cl |
5555 |
7603 |
7267 |
8564 |
| SO4 |
8647 |
10907 |
10661 |
12682 |
| |
| TDS |
18118 |
22639 |
21773 |
26657 |
| SO4/Cl ratio |
1.56 |
1.43 |
1.47 |
1.48 |
| δ34S |
16 |
16.1 |
16 |
16 |
The Centro de Investigaciones Geotecnicas (CIG) noted that during May-September 2000 the lake temperature increased from 19 to 30°C. On 15 February 2001, the temperature was 26°C and the pH was 0.8-0.9. Bubbling and increased gas emissions were observed in several areas of the lake. During February 2001, sulfur spherules in the lake caused the water color to change to a shade of milky yellow-brown. During May-September 2000, the composition of the lake was only slightly affected, suggesting that no major changes occurred within the hydrothermal system beneath the lake (table 1).
Beginning in August 2000, observers found the increasingly deleterious effects of acidic vapor and rainfall on vegetation in the area SW and N of the crater. Winds are dominated by NE trades, which generally drive the plume from the volcano over the rim of the crater to the S and W. By December 2000, more severe effects on the flora were reported, and an area of ~8-10 km2 located S and W of the crater contained markedly discolored and defoliated vegetation. Brief periods of acidic rainfall were reported at Juayua, 13 km W of the crater. In January 2001, incandescent areas within the fumarolic region W of the crater lake were observed at night and may have been present earlier.
COSPEC measurements of the plume were made using the Guatemalan COSPEC on 8 and 9 February 2001. Tripod-based surveys were made from Cerro Verde (elevation ~2,000 m), 2 km S of the crater. Automobile-based traverses conducted along the Santa Ana - Sonsonate highway (5 km W of Santa Ana) were made on 9 February. These surveys resulted in an average SO2 flux of 393 tons/day on 8 February and 244 tons/day on 9 February. During measurements of the plume from the Cerro Verde site, periods of noticeable puffing were observed, affecting the COSPEC measurements by a factor greater than 8.
Two new, permanent telemetered seismic stations, located 1.5 km SE of the crater and 5.5 km NW on Cerro Retiro, were installed by USGS/VDAP and CIG personnel in February 2001. During February, these stations did not detect abnormal seismicity beneath the volcano. A portable recorder located at Finca San Blas from about 20 January through 9 February registered little volcano-seismic activity apart from a few small fumarolic emissions in late January.
Interpretation: The changes since the summer of 2000 are apparently due to increased venting of a well-developed hydrothermal system through the lake, hot springs, and fumaroles. This hydrothermal system is venting substantially higher SO2 (and presumably other gases) in an acidic plume blown by NE trade winds. The lack of seismic activity suggests that the hydrothermal activity increase was not driven by the arrival of new magma beneath the crater.
The SO2 emission rate was high for a quiescent volcano that lacks an open vent. The SO2 may evolve from a gas reservoir below the hydrothermal system, trapped by a hydrothermal cap (clay or silica) as a result of long term (centuries or millennia) crystallization of magma below the cap (Giggenbach and others, 1990). The recent increase in degassing may reflect fracturing or leaking of the hydrothermal cap.
Crater hazards. Reports suggest that significant phreatic activity could occur at Santa Ana, including ejected bombs and blocks, even without magmatic movement under the volcano. This eventuality, a potential extension of the pulsating SO2 emissions, could make conditions unsafe in the crater region. Furthermore, unsubstantiated rumors from local residents and ambiguous geological observations (e.g., abundant dust-possibly settled ash-coating the upper surfaces of leaves of plants in the crater and on the upper slopes) have suggested to some that minor, rare phreatic eruptive events have already occurred.
January 2001 earthquake. At about 1135 on 13 January 2001, an earthquake with a magnitude of 7.6 and a depth of 60 km occurred off the El Salvadoran coastline, its epicenter (at 12.8° N latitude and 88.8°W longitude) lay ~150 km SE of Santa Ana volcano. The earthquake caused extensive damage and destruction throughout much of El Salvador. By 19 January the country was struck by over 660 aftershocks. According to information provided by the National Emergency Committee (COEN) on 17 January 2001, the death toll was put at 681, with 2,615 injured. Approximately 20,000 people moved into over 80 temporary shelters; 90,929 houses sustained damaged, with 24,759 destroyed; and 45,842 people had been evacuated.
News sources based on reports from local residents raised concern that the earthquake was the result of eruptions from Santa Ana volcano. This conclusion was almost certainly in error.
However, during a helicopter overflight on 17 January, James Vallance, an American volcanologist, believed he saw incandescence in the crater. During a subsequent overflight on 18 January, Vallance, Carlos Pullinger, and Demetrio Escobar observed that the incandescence came from glowing cracks in the fumarole field, which, as noted above, had measured temperatures exceeding 500°C. They noted that there was no new lava or magma visible in the crater to indicate recent eruptions. This conclusion was substantiated later by measurements with a portable seismograph, which failed to detect local earthquakes under the volcano.
References. Pullinger, C., 1998, Evolution of the Santa Ana Volcanic complex, El Salvador: Unpublished MS thesis, Michigan Technological University, 152 p.
Larde, J., 1923, El Volcan de Izalco, San Salvador.
Gutierrez, R.E., and Escobar, C.D., 1994, Crisis en la actividad del Volcan de Santa Ana (Ilamatepec), del 22 de Julio al 21 de Agosto 1992: San Salvador, Publicacion Especial, Centro de Investiagiones Geotecnicas, 13 p.
Giggenbach, W.F., Garcia, N., Londono, C., Rodriguez, L., Rojas, N., and Calvache, M., 1990, The chemistry of fumarolic vapor and thermal-spring discharges from the Nevado del Ruiz volcanic-magmatic-hydrothermal system, Colombia: J. Volcanol. Geoth. Res. 42, p. 13-40.
Geologic Background. Santa Ana (also known as Ilamatepec), is a massive, dominantly andesitic-to-trachyandesitic stratovolcano in El Salvador immediately W of Coatepeque Caldera. Collapse during the late Pleistocene produced a voluminous debris avalanche that swept into the Pacific Ocean, forming the Acajutla Peninsula. Reconstruction of the volcano subsequently filled most of the collapse scarp. The broad summit is cut by several crescentic craters, and a series of vents and cones have formed along a 20-km-long fissure system that extends from near the town of Chalchuapa NNW of the volcano to the San Marcelino and Cerro la Olla cinder cones on the SE flank. Small to moderate explosive eruptions from both summit and flank vents have been documented since the 16th century. The San Marcelino cinder cone on the SE flank produced a lava flow in 1722 that traveled 13 km E.
Information Contacts: Demetrio Escobar and Marisa Orantes, Centro de Investigaciones Geotecnicas (CIG), Calle Antigua La Chacra, Costado Oriente de Talleres "El Coro," PP 109 San Salvador, El Salvador; Alain Bernard, Université Libre de Bruxelles 160/02 50, Ave. Roosevelt, 1050 Brussels, Belgium; William L. Rose, Department of Geological Engineering and Sciences, Michigan Technological University, Houghton, MI 49931, USA; Otoniel Matias and Gustavo Chigna, INSIVUMEH, 7a Av. 14-57, Zona 13, Guatemala City, Guatemala; James Vallance, Department of Civil Engineering and Applied Mechanics, McGill University, Montreal, Quebec H3A 2K6, Canada.
Santa Maria (Guatemala) — April 2001 Cite this Report
Santa Maria
Guatemala
14.757°N, 91.552°W; summit elev. 3745 m
All times are local (unless otherwise noted)
Block lava flow continues, filling in valleys and destroying vegetation
The block lava flow that began to extend S from the Caliente vent during July 1999 (BGVN 24:12 and 25:06) remained active during January 2001. The toe of this active flow reached 3.6 km from the vent, extending down the narrow ravine of the Río Nimá II (figure 30). Across the medial section, the flow had enlarged considerably. At the location of the January 2000 flow front, flow thickness increased from 18 m to 43-67 m according to laser range finder measurements. At this point the flow was also at its widest, with a maximum width of ~510 m, and displayed prominent levees. Where the flow moved alongside the 1902 crater rim, inflation caused the flow top to rise 5-10 m above the rim. Collapses from the flow margins have fallen over this divide and extended into and down the adjacent valley. At the mouth of this valley, pyroclastic-flow deposits mantle vegetation within ~75 m of the valley floor, where upstream facing bamboo stems are charred and smaller bushes have been flattened and imbricated in the direction of flow. At this location a ~30 m deep, marginal ravine has been entirely filled with debris over a 12-month period.
As during January 2000 (BGVN 25:06), the Caliente vent was filled to the brim and the area marked by a low dome feature. Between 0443 and 1105 on 25 January 2001, observers counted 25 small ash eruptions, giving a rate of ~4 per hour. Eighteen of these events were paired, comprised of two emissions separated by 1-3 minutes. More powerful events generated small (less than 400-m-long) pyroclastic flows. During the observation period, both the dome and upper flow zone suffered frequent collapses, with 156 rock falls observed. Of the 23 rock falls observed before sunrise, seven were incandescent.
The now inactive 1996-99 flow (figure 30) is being undercut by the Río Nimá I causing considerable collapse activity. A major collapse at ~0822 on 25 January fed repeated ash clouds that rose ~1 km. Repeated events of this type have removed ~33% of the distal section of this flow in 12 months. Most of this volume has collapsed into the Río Nimá I to feed continued aggradation along this river. Ashfalls from these events mantled vegetation to the E, where the zone of impacted vegetation is readily apparent in figure 30.
The rates of SO2 emission at Santiaguito were measured from a tripod site N of the Finca El Faro on four dates (25 January: 229 metric tons/day; 26 January: 90 metric tons/day; 23 February: 155 metric tons/day and 28 February: 193 metric tons/day). These emission rates represent about twice the average SO2 emission rate over the 20 year period of 1973-93 as determined by Andres and others (1993). The data suggest that SO2 emission rates increase only moderately during periods of elevated dome extrusion rate at Santiaguito.
Reference. Andres, R.J., Rose, W.I., Stoiber, R.E., Williams, S.N., Matías, O., Morales, R., 1993, A summary of sulfur dioxide emission rate measurements from Guatemalan volcanoes: Bull. Volc. 55, p. 379-388.
Geologic Background. Symmetrical, forest-covered Santa María volcano is part of a chain of large stratovolcanoes that rise above the Pacific coastal plain of Guatemala. The sharp-topped, conical profile is cut on the SW flank by a 1.5-km-wide crater. The oval-shaped crater extends from just below the summit to the lower flank, and was formed during a catastrophic eruption in 1902. The renowned Plinian eruption of 1902 that devastated much of SW Guatemala followed a long repose period after construction of the large basaltic andesite stratovolcano. The massive dacitic Santiaguito lava-dome complex has been growing at the base of the 1902 crater since 1922. Compound dome growth at Santiaguito has occurred episodically from four vents, with activity progressing E towards the most recent, Caliente. Dome growth has been accompanied by almost continuous minor explosions, with periodic lava extrusion, larger explosions, pyroclastic flows, and lahars.
Information Contacts: Andy Harris and Luke Flynn, HIGP/SOEST, University of Hawai'i, 2525 Correa Road, Honolulu, HI 96822, USA (URL: http://modis.higp.hawaii.edu/); James Vallance, Department of Civil Engineering and Applied Mechanics, McGill University, Montreal, Quebec H3A 2K6, Canada; Mark Davies, School of Environmental Sciences, University of East Anglia, Norwich, NR4 7TJ, United Kingdom; Bill Rose, Gregg Bluth, and Jeremy Shannon, Department of Geological Engineering and Sciences, Michigan Technological University, Houghton, MI 49931, USA; Otoniel Matías and Gustavo Chigna, INSIVUMEH, 7a Av. 14-57, Zona 13, Guatemala City, Guatemala.
Sheveluch
Russia
56.653°N, 161.36°E; summit elev. 3283 m
All times are local (unless otherwise noted)
Hazard status reaches Red; new dome formation during May 2001
At Shiveluch (figures 4, 5, and 6) elevated volcanic activity occurred during 15 December 2000-22 May 2001. The character of the activity had not changed significantly since the previous report (BGVN 25:11). On 15 December 2000 at 2105 seismicity indicated a possible gas-and-ash explosion. On 20 December gas-and-steam plumes rose 200-300 m above the volcano.
Late December 2000: Hazard Status Yellow. The Level of Concern Color Code was raised from Green to Yellow during late December 2000. On 29 December at 0743 seismographs registered shallow earthquakes and a short-lived explosion was inferred to send ash and gas ~2,000-3,000 m above the summit. Gas-and-steam plumes continued to rise through the end of the month.
During 31 December 2000-1 February 2001 similar activity continued, featuring shallow seismicity, small gas-and-ash explosions, and fumarolic emissions. A Yellow hazard status remained in effect. On 2 February at 1100 a powerful gas-and-ash plume rose 800 m above the volcano and extended 3 km W. Visual reports from the nearby community of Kliuchi, 50 km SW of the summit, suggested that another short-lived explosive eruption the same day at 1804 sent an ash plume to a height of 2,000 m; a coeval shallow two-minute-duration event was recorded by seismographs more than 110 km from the volcano. From 1807 to 1825 strong volcanic tremor was registered.
Gas-and-steam plumes that rose up to 1,200 m predominated until 19-20 February when seismographs recorded a series of two-and-four-minute-long shallow earthquakes that may have indicated weak explosions. Two-and-three-minute-long series of shallow earthquakes were recorded on 25 and 27 February, again possibly indicating weak gas-and-ash explosions; minor volcanic tremor followed.
Similar shallow earthquakes and explosions (?) took place during 2-6 March. On 7 March seismic data and visual observations from Kliuchi indicated a 1,500-m-high ash-and-gas plume that extended NW. Ash reports were issued by the Tokyo Volcanic Ash Advisory Center (VAAC). According to information from Elizovo airport (~ 450 km SSW of Shiveluch), at 1620 pilots aboard flight #74052 flying at 8,100 m altitude observed an ash plume ~10 km above Shiveluch that extended 30 km NE. Satellite images processed by the Alaska Volcano Observatory (AVO) from 1715 showed bifurcations of the plume. One composed mostly of steam extended E from the volcano at a low altitude while the other stretched 50 km N at an altitude of 7-8 km. Short series of shallow earthquakes and spasmodic volcanic tremor continued to be recorded.
24 April 2001: Hazard Status Orange. Fumarolic emissions, series of seismic events, and inferred explosions occurred through mid-April. The Tokyo VAAC issued an ash advisory to aviators on 6 April. On 22 April seismicity increased sharply. Earthquakes of MBGVN 18:03 and 18:04); KVERT raised the hazard status from Yellow to Orange on 24 April. Cloudy conditions prevented direct observation of Shiveluch's status through 28 April. The energy of individual events increased (up to M ~3.4) through 25 April, and further increased in number and energy the following day. On the morning of 27 April a M ~ 4 event occurred. Beginning on 28 April the quantity and intensity of the events began to decrease slightly. Gas-and-steam plumes were visible up to 700 m above the crater and extended 5 km W. A satellite image processed by AVO taken on 30 April at 0739 showed a four-pixel thermal anomaly at the volcano.
Seismicity began to increase again on 1 May with continued shallow earthquakes and weak spasmodic tremor episodes. A satellite image captured on 2 May at 0652 showed a very weak three-pixel thermal anomaly. By 1757 the following day a satellite image showed a three-to-four-pixel thermal anomaly with two pixels at or near saturation. On 4 May the anomaly had temperatures of 16-25°C against a background of -5-0°C. An ash advisory was issued by the Tokyo VAAC on 6 May.
7 May 2001: New Dome Formation. According to seismicity, eruptive activity initiated on 7 May at 0958 when strong spasmodic volcanic tremor began to occur. Visual reports from Kliuchi at 1015 indicated that a gas-and-ash plume rose ~1,200 m and extended NW; ash fell on the town. AVO satellite imagery showed the plume extending ~40 km WNW by 2026. Small pyroclastic flows were visible on the SW slopes of the dome. On 12 May at 0900 Kliuchi residents observed a new, intensely steaming extrusive dome located between the NW wall of the 1964 eruption crater and the older dome that began forming in 1980 (figure 6). The new dome was ~100 m high with a ~200-m-wide base and a volume of ~107 m3.
On 12 May at 1100 a weak explosion sent a column of ash 1,000 m above the new dome. By 13 May at 2140 Kliuchi observers reported that the dome had grown ~50 m higher. Two days later the height of the new dome had reached that of the old one. No thermal anomalies were observed at Shiveluch on 14-15 May. KVERT decreased the hazard status from Orange to Yellow. A gas-and-steam column rose 400-500 m above the domes on 16 May; weak explosions sent an ash-poor plume to a height of 100-500 m. Satellite images from 17 May at 1710 and 1734 showed a 2-3-pixel thermal anomaly with a temperature of 35°C against a background of ~7.5-11°C. The anomaly likely corresponded to the new growing dome. The Anchorage VAAC issued an ash advisory on 18 May due to a reported short-lived explosive eruption observed from the ground. An ash cloud from the eruption drifted slowly N and dissipated quickly.
19 May 2001: Hazard Status Red. On 19 May at 1756 Shiveluch erupted explosively for about 40 minutes and produced an ash cloud to an altitude of 10 km. The National Weather Service reported the plume moving NE. Short pyroclastic flows and hot avalanches were observed in the dome area. Seismic activity continued, although at a decreased rate, with many earthquakes occurring within the volcano's edifice. The following day KVERT reduced the hazard status to Yellow.
The Anchorage VAAC issued an ash advisory on 20 May at 1500. GOES-10 imagery detected a narrow band of ash at 1400 about 110 km wide moving SE at over 50 km/hour. The ash cloud appeared to be becoming more diffuse with time; the cloud had dissipated by 1800 according to a subsequent ash report.
A large thermal anomaly was detected in satellite images on 20 May from 1802 and 1814. Background temperatures for both images were 15°C. The former image had 10 pixels with temperatures ranging from 30° to 49°C, of which 6 were at or near saturation. The latter image had 8 pixels between 30° and 40°C, of which 5 were at or near saturation. Two explosions at 1925 and 2014 sent ash to altitudes of ~4.7-5.0 km.
On 21 May KVERT again raised the hazard level to Red. At 0713 an explosion caused an ash column to rise 10-12 km. Satellite imagery from AVO captured at 0750 showed a small plume ~15 km long situated above the volcano. A subsequent image from 1032 revealed the plume beginning to move N or NE. Seismic activity remained above background levels.
Shiveluch erupted on 22 May at 0209 and produced a mushroom-shaped ash column to an estimated altitude of ~20 km. The ash cloud moved S-SE toward the Pacific Ocean (figure 7). Residents of Kliuchi observed incandescent illumination from the eruption although the ash column covered all of the volcano edifice. Shiveluch's Level of Concern Color Code remained at Red as of 22 May. More recent information is available on the AVO website and will be covered in future issues of the Bulletin.
Geologic Background. The high, isolated massif of Sheveluch volcano (also spelled Shiveluch) rises above the lowlands NNE of the Kliuchevskaya volcano group. The 1,300 km3 andesitic volcano is one of Kamchatka's largest and most active volcanic structures, with at least 60 large eruptions during the Holocene. The summit of roughly 65,000-year-old Stary Shiveluch is truncated by a broad 9-km-wide late-Pleistocene caldera breached to the south. Many lava domes occur on its outer flanks. The Molodoy Shiveluch lava dome complex was constructed during the Holocene within the large open caldera; Holocene lava dome extrusion also took place on the flanks of Stary Shiveluch. Widespread tephra layers from these eruptions have provided valuable time markers for dating volcanic events in Kamchatka. Frequent collapses of dome complexes, most recently in 1964, have produced debris avalanches whose deposits cover much of the floor of the breached caldera.
Information Contacts: Olga Chubarova, Kamchatka Volcanic Eruptions Response Team (KVERT), Institute of Volcanic Geology and Geochemistry, Piip Ave. 9, Petropavlovsk-Kamchatsky, 683006, Russia; Tom Miller and Dave Schneider, Alaska Volcano Observatory (AVO), a cooperative program of a) U.S. Geological Survey, 4200 University Drive, Anchorage, AK 99508-4667, USA (URL: http://www.avo.alaska.edu/), b) Geophysical Institute, University of Alaska, PO Box 757320, Fairbanks, AK 99775-7320, USA, and c) Alaska Division of Geological & Geophysical Surveys, 794 University Ave., Suite 200, Fairbanks, AK 99709, USA; Philip Kyle, Department of Earth & Environmental Science, New Mexico Institute of Mining and Technology, Socorro, NM 87801-4796, USA (URL: https://nmtearth.com/); Anchorage Volcanic Ash Advisory Center (VAAC), NOAA Alaska Aviation Weather Unit, 6930 Sand Lake Road, Anchorage, AK 99502-1845, USA (URL: http://vaac.arh.noaa.gov/); Tokyo Volcanic Ash Advisory Center, Tokyo, Japan (URL: https://ds.data.jma.go.jp/svd/vaac/data/).
Stromboli
Italy
38.789°N, 15.213°E; summit elev. 924 m
All times are local (unless otherwise noted)
Variable seismicity during late 2000 and early 2001; spatter ejected above crater rims
This report covers the period of October 2000-February 2001, describing variable activity since the last report (BGVN 25:08).
During the last three months of 2000 the seismic activity recorded by the University of Udine summit station (figure 63) remained in the low to moderate range, comparable to the previous months. Short periods were again characterized by a very low number of events. In particular, under 50 events were recorded on several days during the period 29 October-16 November. The period between late December 2000 and early January 2001 was characterized by slightly increased activity, with more than 250 events/day and a tremor intensity occasionally exceeding the value of 5 volt·seconds (V·s). A drop in seismicity at the end of January was followed by an increase in all parameters during February, with the number of seismic events again exceeding 250 per day on 20 and 21 February. "Major" seismic events, which caused instrument saturations, were concentrated in the period 17-22 February, with a peak of 44 and 48 saturating events on 20 and 21 February, respectively (figure 63). The tremor intensity showed a slower but steady growth, with values slightly over 2 V·s at the beginning of February, and near 6 V·s at the end of February.
Jürg Alean visited the volcano several times during mid-October 2000. On 10 October 2000, he observed about 6 eruptions/hour at the Southwest Crater (formerly called Crater 3), expelling large amounts of ash, sometimes almost hiding the glowing spatters that were being ejected to moderate heights. Vent 3B glowed intensely but never ejected lava. The Northeast Crater (formerly called Crater 1) had grown substantially over the last 7 years (figure 64) and was clearly separated into two pits, both of which were glowing at night with vent 1/1 glowing more strongly (vent clusters 1/1 and 1/2 are located on the floors of two coalesced depressions within the main Northeast Crater).
Alean reported that on 13 October Southwest Crater had more eruptions, ~10 per hour. Further, the kind of activity was different with a total absence of ash and a much longer duration of individual eruptions, some over 30 sec; spatters reached ~100 m above the crater rim. Activity had also increased at Northeast Crater: vent 1/1 delivered several eruptions/hour, mostly at an oblique angle towards Pizzo, while vent 1/2 erupted only weakly about once/hour. On 15 October, the sudden occurrence of very noisy degassing events heard several times at Stromboli village (e.g. 1106, 1125, 1145 and 1245) confirmed the variability of the eruptive activity during this week. No similar noises were heard later that day.
Roberto Carniel visited the summit crater area on 29 November 2000 and noted that there were significant changes since Alean's earlier visit in October. The hornito, located where the Central Crater (formerly called Crater 2) was located, was showing more intense degassing, and a new vent had opened between the hornito itself and vent 3B (figure 64), thus suggesting a renewal of the activity in this sector. This new vent, which Carniel labeled 3C, showed continuously puffing degassing, similar to vent 3B. At night, both were incandescent and continuously moderate spattering was observed at vent 3C, with small-sized spatters sometimes reaching the vent rim, landing on the crater terrace. Vent 3C also showed Strombolian eruptions, with vertically ejected, molten material reaching over 50 m above the rim.
Geologic Background. Spectacular incandescent nighttime explosions at Stromboli have long attracted visitors to the "Lighthouse of the Mediterranean" in the NE Aeolian Islands. This volcano has lent its name to the frequent mild explosive activity that has characterized its eruptions throughout much of historical time. The small island is the emergent summit of a volcano that grew in two main eruptive cycles, the last of which formed the western portion of the island. The Neostromboli eruptive period took place between about 13,000 and 5,000 years ago. The active summit vents are located at the head of the Sciara del Fuoco, a prominent scarp that formed about 5,000 years ago due to a series of slope failures which extends to below sea level. The modern volcano has been constructed within this scarp, which funnels pyroclastic ejecta and lava flows to the NW. Essentially continuous mild Strombolian explosions, sometimes accompanied by lava flows, have been recorded for more than a millennium.
Information Contacts: Roberto Carniel, Dipartimento di Georisorse e Territorio, Universitá di Udine, via Cotonificio 114, I-33100 Udine, Italy; Jürg Alean, Rheinstrasse 6, CH-8193 Eglisau, Switzerland; Stromboli On-line website, maintained by Alean and Carniel (URL: http://www.swisseduc.ch/stromboli/).