Recently Published Bulletin Reports
Erebus (Antarctica) Lava lake remains active; most thermal alerts recorded since 2019
Rincon de la Vieja (Costa Rica) Frequent phreatic explosions during July-December 2023
Bezymianny (Russia) Explosion on 18 October 2023 sends ash plume 8 km high; lava flows and incandescent avalanches
Kilauea (United States) Low-level lava effusions in the lava lake at Halema’uma’u during July-December 2022
Nyamulagira (DR Congo) Lava flows and thermal activity during May-October 2023
Bagana (Papua New Guinea) Explosions, ash plumes, ashfall, and lava flows during April-September 2023
Mayon (Philippines) Lava flows, pyroclastic flows, ash emissions, and seismicity during April-September 2023
Nishinoshima (Japan) Eruption plumes and gas-and-steam plumes during May-August 2023
Krakatau (Indonesia) White gas-and-steam plumes and occasional ash plumes during May-August 2023
Villarrica (Chile) Strombolian activity, gas-and-ash emissions, and crater incandescence during April-September 2023
Merapi (Indonesia) Frequent incandescent avalanches during April-September 2023
Ebeko (Russia) Moderate explosive activity with ash plumes continued during June-November 2023
Erebus (Antarctica) — January 2024  Cite this Report
Erebus
Antarctica
77.53°S, 167.17°E; summit elev. 3794 m
All times are local (unless otherwise noted)
Lava lake remains active; most thermal alerts recorded since 2019
The lava lake in the summit crater of Erebus has been active since at least 1972. Located in Antarctica overlooking the McMurdo Station on Ross Island, it is the southernmost active volcano on the planet. Because of the remote location, activity is primarily monitored by satellites. This report covers activity during 2023.
The number of thermal alerts recorded by the Hawai'i Institute of Geophysics and Planetology’s MODVOLC Thermal Alerts System increased considerably in 2023 compared to the years 2020-2022 (table 9). In contrast to previous years, the MODIS instruments aboard the Aqua and Terra satellites captured data from Erebus every month during 2023. Consistent with previous years, the lowest number of anomalous pixels were recorded in January, November, and December.
Table 9. Number of monthly MODIS-MODVOLC thermal alert pixels recorded at Erebus during 2017-2023. See BGVN 42:06 for data from 2000 through 2016. The table was compiled using data provided by the HIGP – MODVOLC Thermal Alerts System.
| Year |
Jan |
Feb |
Mar |
Apr |
May |
Jun |
Jul |
Aug |
Sep |
Oct |
Nov |
Dec |
SUM |
| 2017 |
0 |
21 |
9 |
0 |
0 |
1 |
11 |
61 |
76 |
52 |
0 |
3 |
234 |
| 2018 |
0 |
21 |
58 |
182 |
55 |
17 |
137 |
172 |
103 |
29 |
0 |
0 |
774 |
| 2019 |
2 |
21 |
162 |
151 |
55 |
56 |
75 |
53 |
29 |
19 |
1 |
0 |
624 |
| 2020 |
0 |
2 |
16 |
18 |
4 |
4 |
1 |
3 |
18 |
3 |
1 |
6 |
76 |
| 2021 |
0 |
9 |
1 |
0 |
2 |
56 |
46 |
47 |
35 |
52 |
5 |
3 |
256 |
| 2022 |
1 |
13 |
55 |
22 |
15 |
32 |
39 |
19 |
31 |
11 |
0 |
0 |
238 |
| 2023 |
2 |
33 |
49 |
82 |
41 |
32 |
70 |
64 |
42 |
17 |
5 |
11 |
448 |
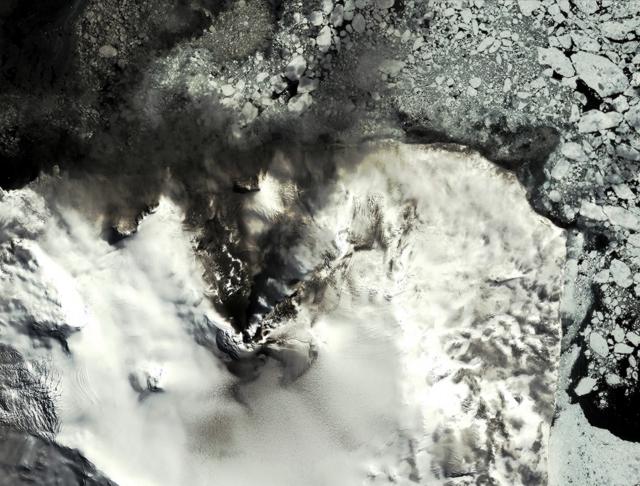
Sentinel-2 infrared images showed one or two prominent heat sources within the summit crater, accompanied by adjacent smaller sources, similar to recent years (see BGVN 46:01, 47:02, and 48:01). A unique image was obtained on 25 November 2023 by the OLI-2 (Operational Land Imager-2) on Landsat 9, showing the upper part of the volcano surrounded by clouds (figure 32).
Geologic Background. Mount Erebus, the world's southernmost historically active volcano, overlooks the McMurdo research station on Ross Island. It is the largest of three major volcanoes forming the crudely triangular Ross Island. The summit of the dominantly phonolitic volcano has been modified by one or two generations of caldera formation. A summit plateau at about 3,200 m elevation marks the rim of the youngest caldera, which formed during the late-Pleistocene and within which the modern cone was constructed. An elliptical 500 x 600 m wide, 110-m-deep crater truncates the summit and contains an active lava lake within a 250-m-wide, 100-m-deep inner crater; other lava lakes are sometimes present. The glacier-covered volcano was erupting when first sighted by Captain James Ross in 1841. Continuous lava-lake activity with minor explosions, punctuated by occasional larger Strombolian explosions that eject bombs onto the crater rim, has been documented since 1972, but has probably been occurring for much of the volcano's recent history.
Information Contacts: Hawai'i Institute of Geophysics and Planetology (HIGP) - MODVOLC Thermal Alerts System, School of Ocean and Earth Science and Technology (SOEST), Univ. of Hawai'i, 2525 Correa Road, Honolulu, HI 96822, USA (URL: http://modis.higp.hawaii.edu/); Copernicus Browser, Copernicus Data Space Ecosystem, European Space Agency (URL: https://dataspace.copernicus.eu/browser/); NASA Earth Observatory, EOS Project Science Office, NASA Goddard Space Flight Center, Goddard, Maryland, USA (URL: https://earthobservatory.nasa.gov/images/152134/erebus-breaks-through).
Rincon de la Vieja (Costa Rica) — January 2024 Cite this Report
Rincon de la Vieja
Costa Rica
10.83°N, 85.324°W; summit elev. 1916 m
All times are local (unless otherwise noted)
Frequent phreatic explosions during July-December 2023
Rincón de la Vieja is a volcanic complex in Costa Rica with a hot convecting acid lake that exhibits frequent weak phreatic explosions, gas-and-steam emissions, and occasional elevated sulfur dioxide levels (BGVN 45:10, 46:03, 46:11). The current eruption period began June 2021. This report covers activity during July-December 2023 and is based on weekly bulletins and occasional daily reports from the Observatorio Vulcanologico Sismologica de Costa Rica-Universidad Nacional (OVSICORI-UNA).
Numerous weak phreatic explosions continued during July-December 2023, along with gas-and-steam emissions and plumes that rose as high as 3 km above the crater rim. Many weekly OVSICORI-UNA bulletins included the previous week's number of explosions and emissions (table 9). For many explosions, the time of explosion was given (table 10). Frequent seismic activity (long-period earthquakes, volcano-tectonic earthquakes, and tremor) accompanied the phreatic activity.
Table 9. Number of reported weekly phreatic explosions and gas-and-steam emissions at Rincón de la Vieja, July-December 2023. Counts are reported for the week before the Weekly Bulletin date; not all reports included these data. Courtesy of OVSICORI-UNA.
| OVSICORI Weekly Bulletin |
Number of explosions |
Number of emissions |
| 28 Jul 2023 |
6 |
14 |
| 4 Aug 2023 |
10 |
12 |
| 1 Sep 2023 |
13 |
11 |
| 22 Sep 2023 |
12 |
13 |
| 29 Sep 2023 |
6 |
11 |
| 6 Oct 2023 |
12 |
5 |
| 13 Oct 2023 |
7 |
9 |
| 20 Oct 2023 |
1 |
15 |
| 27 Oct 2023 |
3 |
23 |
| 3 Nov 2023 |
3 |
10 |
| 17 Nov 2023 |
0 |
Some |
| 24 Nov 2023 |
0 |
14 |
| 8 Dec 2023 |
4 |
16 |
| 22 Dec 2023 |
8 |
18 |
Table 10. Summary of activity at Rincón de la Vieja during July-December 2023. Weak phreatic explosions and gas emissions are noted where the time of explosion was indicated in the weekly or daily bulletins. Height of plumes or emissions are distance above the crater rim. Courtesy of OVSICORI-UNA.
| Date |
Time |
Description of Activity |
| 1 Jul 2023 |
0156 |
Explosion. |
| 2 Jul 2023 |
0305 |
Explosion. |
| 4 Jul 2023 |
0229, 0635 |
Event at 0635 produced a gas-and-steam plume that rose 700 m and drifted W; seen by residents in Liberia (21 km SW). |
| 9 Jul 2023 |
1843 |
Explosion. |
| 21 Jul 2023 |
0705 |
Explosion. |
| 26 Jul 2023 |
1807 |
Explosion. |
| 28 Jul 2023 |
0802 |
Explosion generated a gas-and-steam plume that rose 500 m. |
| 30 Jul 2023 |
1250 |
Explosion. |
| 31 Jul 2023 |
2136 |
Explosion. |
| 11 Aug 2023 |
0828 |
Explosion. |
| 18 Aug 2023 |
1304 |
Explosion. |
| 21 Aug 2023 |
1224 |
Explosion generated gas-and-steam plumes rose 500-600 m. |
| 22 Aug 2023 |
0749 |
Explosion generated gas-and-steam plumes rose 500-600 m. |
| 24 Aug 2023 |
1900 |
Explosion. |
| 25 Aug 2023 |
0828 |
Event produced a steam-and-gas plume that rose 3 km and drifted NW. |
| 27-28 Aug 2023 |
0813 |
Four small events; the event at 0813 on 28 August lasted two minutes and generated a steam-and-gas plume that rose 2.5 km. |
| 1 Sep 2023 |
1526 |
Explosion generated plume that rose 2 km and ejected material onto the flanks. |
| 2-3 Sep 2023 |
- |
Small explosions detected in infrasound data. |
| 4 Sep 2023 |
1251 |
Gas-and-steam plume rose 1 km and drifted W. |
| 7 Nov 2023 |
1113 |
Explosion. |
| 8 Nov 2023 |
0722 |
Explosion. |
| 12 Nov 2023 |
0136 |
Small gas emissions. |
| 14 Nov 2023 |
0415 |
Small gas emissions. |
According to OVSICORI-UNA, during July-October the average weekly sulfur dioxide (SO2) flux ranged from 68 to 240 tonnes/day. However, in mid-November the flux increased to as high as 334 tonnes/day, the highest value measured in recent years. The high SO2 flux in mid-November was also detected by the TROPOMI instrument on the Sentinel-5P satellite (figure 43).
Geologic Background. Rincón de la Vieja, the largest volcano in NW Costa Rica, is a remote volcanic complex in the Guanacaste Range. The volcano consists of an elongated, arcuate NW-SE-trending ridge constructed within the 15-km-wide early Pleistocene Guachipelín caldera, whose rim is exposed on the south side. Sometimes known as the "Colossus of Guanacaste," it has an estimated volume of 130 km3 and contains at least nine major eruptive centers. Activity has migrated to the SE, where the youngest-looking craters are located. The twin cone of Santa María volcano, the highest peak of the complex, is located at the eastern end of a smaller, 5-km-wide caldera and has a 500-m-wide crater. A Plinian eruption producing the 0.25 km3 Río Blanca tephra about 3,500 years ago was the last major magmatic eruption. All subsequent eruptions, including numerous historical eruptions possibly dating back to the 16th century, have been from the prominent active crater containing a 500-m-wide acid lake located ENE of Von Seebach crater.
Information Contacts: Observatorio Vulcanológico Sismológica de Costa Rica-Universidad Nacional (OVSICORI-UNA), Apartado 86-3000, Heredia, Costa Rica (URL: http://www.ovsicori.una.ac.cr/); NASA Global Sulfur Dioxide Monitoring Page, Atmospheric Chemistry and Dynamics Laboratory, NASA Goddard Space Flight Center (NASA/GSFC), 8800 Greenbelt Road, Goddard MD 20771, USA (URL: https://so2.gsfc.nasa.gov/).
Bezymianny (Russia) — November 2023 Cite this Report
Bezymianny
Russia
55.972°N, 160.595°E; summit elev. 2882 m
All times are local (unless otherwise noted)
Explosion on 18 October 2023 sends ash plume 8 km high; lava flows and incandescent avalanches
Bezymianny, located on Russia’s Kamchatka Peninsula, has had eruptions since 1955 characterized by dome growth, explosions, pyroclastic flows, ash plumes, and ashfall. Activity during November 2022-April 2023 included gas-and-steam emissions, lava dome collapses generating avalanches, and persistent thermal activity. Similar eruptive activity continued from May through October 2023, described here based on information from weekly and daily reports of the Kamchatka Volcano Eruptions Response Team (KVERT), notices from Tokyo VAAC (Volcanic Ash Advisory Center), and from satellite data.
Overall activity decreased after the strong period of activity in late March through April 2023, which included ash explosions during 29 March and 7-8 April 2023 that sent plumes as high as 10-12 km altitude, along with dome growth and lava flows (BGVN 48:05). This reduced activity can be seen in the MIROVA thermal detection system graph (figure 56), which was consistent with data from the MODVOLC thermal detection system and with Sentinel-2 satellite images that showed persistent hotspots in the summit crater when conditions allowed observations. A renewed period of strong activity began in mid-October 2023.
Activity increased significantly on 17 October 2023 when large collapses began during 0700-0830 on the E flanks of the lava dome and continued to after 0930 the next day (figure 57). Ash plumes rose to an altitude of 4.5-5 km, extending 220 km NNE by 18 October. A large explosion at 1630 on 18 October produced an ash plume that rose to an altitude of 11 km (8 km above the summit) and drifted NNE and then NW, extending 900 km NW within two days at an altitude of 8 km. Minor ashfall was noted in Kozyrevsk (45 km WNW). At 0820 on 20 October an ash plume was identified in satellite images drifting 100 km ENE at altitudes of 4-4.5 km.
Lava flows and hot avalanches from the dome down the SE flank continued over the next few days, including 23 October when clear conditions allowed good observations (figures 58 and 59). A large thermal anomaly was observed over the volcano through 24 October, and in the summit crater on 30 October (figure 60). Strong fumarolic activity continued, with numerous avalanches and occasional incandescence. By the last week of October, volcanic activity had decreased to a level consistent with that earlier in the reporting period.
Aviation warnings were frequently updated during 17-20 October. KVERT issued a Volcano Observatory Notice for Aviation (VONA) on 17 October at 1419 and 1727 (0219 and 0527 UTC) raising the Aviation Color Code (ACC) from Yellow to Orange (second highest level). The next day, KVERT issued a VONA at 1705 (0505 UTC) raising the ACC to Red (highest level) but lowered it back to Orange at 2117 (0917 UTC). After another decrease to Yellow and back to Orange, the ACC was reduced to Yellow on 20 October at 1204 (0004 UTC). In addition, the Tokyo VAAC issued a series of Volcanic Ash Advisories beginning on 16 October and continuing through 30 October.
Geologic Background. The modern Bezymianny, much smaller than its massive neighbors Kamen and Kliuchevskoi on the Kamchatka Peninsula, was formed about 4,700 years ago over a late-Pleistocene lava-dome complex and an edifice built about 11,000-7,000 years ago. Three periods of intensified activity have occurred during the past 3,000 years. The latest period, which was preceded by a 1,000-year quiescence, began with the dramatic 1955-56 eruption. This eruption, similar to that of St. Helens in 1980, produced a large open crater that was formed by collapse of the summit and an associated lateral blast. Subsequent episodic but ongoing lava-dome growth, accompanied by intermittent explosive activity and pyroclastic flows, has largely filled the 1956 crater.
Information Contacts: Kamchatka Volcanic Eruptions Response Team (KVERT), Far Eastern Branch, Russian Academy of Sciences, 9 Piip Blvd., Petropavlovsk-Kamchatsky, 683006, Russia (URL: http://www.kscnet.ru/ivs/kvert/); Kamchatka Volcanological Station, Kamchatka Branch of Geophysical Survey, (KB GS RAS), Klyuchi, Kamchatka Krai, Russia (URL: http://volkstat.ru/); Tokyo Volcanic Ash Advisory Center (VAAC), 1-3-4 Otemachi, Chiyoda-ku, Tokyo 100-8122, Japan (URL: http://ds.data.jma.go.jp/svd/vaac/data/); Hawai'i Institute of Geophysics and Planetology (HIGP) - MODVOLC Thermal Alerts System, School of Ocean and Earth Science and Technology (SOEST), Univ. of Hawai'i, 2525 Correa Road, Honolulu, HI 96822, USA (URL: http://modis.higp.hawaii.edu/); MIROVA (Middle InfraRed Observation of Volcanic Activity), a collaborative project between the Universities of Turin and Florence (Italy) supported by the Centre for Volcanic Risk of the Italian Civil Protection Department (URL: http://www.mirovaweb.it/); Copernicus Browser, Copernicus Data Space Ecosystem, European Space Agency (URL: https://dataspace.copernicus.eu/browser/).chr
Kilauea (United States) — January 2023 Cite this Report
Kilauea
United States
19.421°N, 155.287°W; summit elev. 1222 m
All times are local (unless otherwise noted)
Low-level lava effusions in the lava lake at Halema’uma’u during July-December 2022
Kīlauea is the southeastern-most volcano in Hawaii and overlaps the E flank of the Mauna Loa volcano. Its East Rift Zone (ERZ) has been intermittently active for at least 2,000 years. An extended eruption period began in January 1983 and was characterized by open lava lakes and lava flows from the summit caldera and the East Rift Zone. During May 2018 magma migrated into the Lower East Rift Zone (LERZ) and opened 24 fissures along a 6-km-long NE-trending fracture zone that produced lava flows traveling in multiple directions. As lava emerged from the fissures, the lava lake at Halema'uma'u drained and explosions sent ash plumes to several kilometers altitude (BGVN 43:10).
The current eruption period started during September 2021 and has recently been characterized by lava effusions, spatter, and sulfur dioxide emissions in the active Halema’uma’u lava lake (BGVN 47:08). Lava effusions, some spatter, and sulfur dioxide emissions have continued during this reporting period of July through December 2022 using daily reports, volcanic activity notices, and abundant photo, map, and video data from the US Geological Survey's (USGS) Hawaiian Volcano Observatory (HVO).
Summary of activity during July-December 2022. Low-level effusions have continued at the western vent of the Halema’uma’u crater during July through early December 2022. Occasional weak ooze-outs (also called lava break outs) would occur along the margins of the crater floor. The overall level of the active lava lake throughout the reporting period gradually increased due to infilling, however it stagnated in mid-September (table 13). During September through November, activity began to decline, though lava effusions persisted at the western vent. By 9 December, the active part of the lava lake had completely crusted over, and incandescence was no longer visible.
Table 13. Summary of measurements taken during overflights at Kīlauea that show a gradual increase in the active lava lake level and the volume of lava effused since 29 September 2021. Lower activity was reported during September-October. Data collected during July-December 2022. Courtesy of HVO.
| Date: |
Level of the active lava lake (m): |
Cumulative volume of lava effused (million cubic meters): |
| 7 Jul 2022 |
130 |
95 |
| 19 Jul 2022 |
133 |
98 |
| 4 Aug 2022 |
136 |
102 |
| 16 Aug 2022 |
137 |
104 |
| 12 Sep 2022 |
143 |
111 |
| 5 Oct 2022 |
143 |
111 |
| 28 Oct 2022 |
143 |
111 |
Activity during July 2022. Lava effusions were reported from the western vent in the Halema’uma’u crater, along with occasional weak ooze-outs along the margins of the crater floor. The height of the lava lake was variable due to deflation-inflation tilt events; for example, the lake level dropped approximately 3-4 m during a summit deflation-inflation event reported on 1 July. Webcam images taken during the night of 6-12 July showed intermittent low-level spattering at the western vent that rose less than 10 m above the vent (figure 519). Measurements made during an overflight on 7 July indicated that the crater floor was infilled about 130 m and that 95 million cubic meters of lava had been effused since 29 September 2021. A single, relatively small lava ooze-out was active to the S of the lava lake. Around midnight on 8 July there were two brief periods of lava overflow onto the lake margins. On 9 July lava ooze-outs were reported near the SE and NE edges of the crater floor and during 10-11 July they occurred near the E, NE, and NW edges. On 16 July crater incandescence was reported, though the ooze-outs and spattering were not visible. On 18 July overnight webcam images showed incandescence in the western vent complex and two ooze-outs were reported around 0000 and 0200 on 19 July. By 0900 there were active ooze-outs along the SW edge of the crater floor. Measurements made from an overflight on 19 July indicated that the crater floor was infilled about 133 m and 98 million cubic meters of lava had erupted since 29 September 2021 (figure 520). On 20 July around 1600 active ooze-outs were visible along the N edge of the crater, which continued through the next day. Extensive ooze-outs occurred along the W margin during 24 July until 1900; on 26 July minor ooze-outs were noted along the N margin. Minor spattering was visible on 29 July along the E margin of the lake. The sulfur dioxide emission rates ranged 650-2,800 tons per day (t/d), the higher of which was measured on 8 July (figure 519).
Activity during August 2022. The eruption continued in the Halema’uma’u crater at the western vent. According to HVO the lava in the active lake remained at the level of the bounding levees. Occasional minor ooze-outs were observed along the margins of the crater floor. Strong nighttime crater incandescence was visible after midnight on 6 August over the western vent cone. During 6-7 August scattered small lava lobes were active along the crater floor and incandescence persisted above the western vent through 9 August. During 7-9 August HVO reported a single lava effusion source was active along the NW margin of the crater floor. Measurements from an overflight on 4 August indicated that the crater floor was infilled about 136 m total and that 102 million cubic meters of lava had been erupted since the start of the eruption. Lava breakouts were reported along the N, NE, E, S, and W margins of the crater during 10-16 August. Another overflight survey conducted on 16 August indicated that the crater floor infilled about 137 m and 104 million cubic meters of lava had been erupted since September 2021. Measured sulfur dioxide emissions rates ranged 1,150-2,450 t/d, the higher of which occurred on 8 August.
Activity during September 2022. During September, lava effusion continued from the western vent into the active lava lake and onto the crater floor. Intermittent minor ooze-outs were reported through the month. A small ooze-out was visible on the W crater floor margin at 0220 on 2 September, which showed decreasing surface activity throughout the day, but remained active through 3 September. On 3 September around 1900 a lava outbreak occurred along the NW margin of the crater floor but had stopped by the evening of 4 September. Field crews monitoring the summit lava lake on 9 September observed spattering on the NE margin of the lake that rose no higher than 10 m, before falling back onto the lava lake crust (figure 521). Overflight measurements on 12 September indicated that the crater floor was infilled a total of 143 m and 111 million cubic meters of lava had been erupted since September 2021. Extensive breakouts in the W and N part of the crater floor were reported at 1600 on 20 September and continued into 26 September. The active part of the lava lake dropped by 10 m while other parts of the crater floor dropped by several meters. Summit tiltmeters recorded a summit seismic swarm of more than 80 earthquakes during 1500-1800 on 21 September, which occurred about 1.5 km below Halema’uma’u; a majority of these were less than Mw 2. By 22 September the active part of the lava lake was infilled about 2 m. On 23 September the western vent areas exhibited several small spatter cones with incandescent openings, along with weak, sporadic spattering (figure 522). The sulfur dioxide emission rate ranged from 930 t/d to 2,000 t/d, the higher of which was measured on 6 September.
Activity during October 2022. Activity during October declined slightly compared to previous months, though lava effusions persisted from the western vent into the active lava lake and onto the crater floor during October (figure 523). Slight variations in the lava lake were noted throughout the month. HVO reported that around 0600 on 3 October the level of the lava lake has lowered slightly. Overflight measurements taken on 5 October indicated that the crater floor was infilled a total of about 143 m and that 111 million cubic meters of lava had been effused since September 2021. During 6-7 October the lake gradually rose 0.5 m. Sulfur dioxide measurements made on 22 October had an emission rate of 700 t/d. Another overflight taken on 28 October showed that there was little to no change in the elevation of the crater floor: the crater floor was infilled a total of 143 m and 111 million cubic meters of lava had erupted since the start of the eruption.
Activity during November 2022. Activity remained low during November, though HVO reported that lava from the western vent continued to effuse into the active lava lake and onto the crater floor throughout the month. The rate of sulfur dioxide emissions during November ranged from 300-600 t/d, the higher amount of which occurred on 9 November.
Activity during December 2022. Similar low activity was reported during December, with lava effusing from the western vent into the active lava lake and onto the crater floor. During 4-5 December the active part of the lava lake was slightly variable in elevation and fluctuated within 1 m. On 9 December HVO reported that lava was no longer erupting from the western vent in the Halema’uma’u crater and that sulfur dioxide emissions had returned to near pre-eruption background levels; during 10-11 December, the lava lake had completely crusted over, and no incandescence was visible (figure 524). Time lapse camera images covering the 4-10 December showed that the crater floor showed weak deflation and no inflation. Some passive events of crustal overturning were reported during 14-15 December, which brought fresh incandescent lava to the lake surface. The sulfur dioxide emission rate was approximately 200 t/d on 14 December. A smaller overturn event on 17 December and another that occurred around 0000 and into the morning of 20 December were also detected. A small seismic swarm was later detected on 30 December.
Geologic Background. Kilauea overlaps the E flank of the massive Mauna Loa shield volcano in the island of Hawaii. Eruptions are prominent in Polynesian legends; written documentation since 1820 records frequent summit and flank lava flow eruptions interspersed with periods of long-term lava lake activity at Halemaumau crater in the summit caldera until 1924. The 3 x 5 km caldera was formed in several stages about 1,500 years ago and during the 18th century; eruptions have also originated from the lengthy East and Southwest rift zones, which extend to the ocean in both directions. About 90% of the surface of the basaltic shield volcano is formed of lava flows less than about 1,100 years old; 70% of the surface is younger than 600 years. The long-term eruption from the East rift zone between 1983 and 2018 produced lava flows covering more than 100 km2, destroyed hundreds of houses, and added new coastline.
Information Contacts: Hawaiian Volcano Observatory (HVO), U.S. Geological Survey, PO Box 51, Hawai'i National Park, HI 96718, USA (URL: http://hvo.wr.usgs.gov/).
Nyamulagira (DR Congo) — November 2023 Cite this Report
Nyamulagira
DR Congo
1.408°S, 29.2°E; summit elev. 3058 m
All times are local (unless otherwise noted)
Lava flows and thermal activity during May-October 2023
Nyamulagira (also known as Nyamuragira) is a shield volcano in the Democratic Republic of Congo with the summit truncated by a small 2 x 2.3 km caldera with walls up to about 100 m high. Documented eruptions have occurred within the summit caldera, as well as from numerous flank fissures and cinder cones. The current eruption period began in April 2018 and has more recently been characterized by summit crater lava flows and thermal activity (BGVN 48:05). This report describes lava flows and variable thermal activity during May through October 2023, based on information from the Observatoire Volcanologique de Goma (OVG) and various satellite data.
Lava lake activity continued during May. The MIROVA (Middle InfraRed Observation of Volcanic Activity) system recorded moderate-to-strong thermal activity throughout the reporting period; activity was more intense during May and October and relatively weaker from June through September (figure 95). The MODVOLC thermal algorithm, detected a total of 209 thermal alerts. There were 143 hotspots detected during May, eight during June, nine during September, and 49 during October. This activity was also reflected in infrared satellite images, where a lava flow was visible in the NW part of the crater on 7 May and strong activity was seen in the center of the crater on 4 October (figure 96). Another infrared satellite image taken on 12 May showed still active lava flows along the NW margin of the crater. According to OVG lava effusions were active during 7-29 May and moved to the N and NW parts of the crater beginning on 9 May. Strong summit crater incandescence was visible from Goma (27 km S) during the nights of 17, 19, and 20 May (figure 97). On 17 May there was an increase in eruptive activity, which peaked at 0100 on 20 May. Notable sulfur dioxide plumes drifted NW and W during 19-20 May (figure 98). Drone footage acquired in partnership with the USGS (United States Geological Survey) on 20 May captured images of narrow lava flows that traveled about 100 m down the W flank (figure 99). Data from the Rumangabo seismic station indicated a decreasing trend in activity during 17-21 May. Although weather clouds prevented clear views of the summit, a strong thermal signature on the NW flank was visible in an infrared satellite image on 22 May, based on an infrared satellite image. On 28 May the lava flows on the upper W flank began to cool and solidify. By 29 May seismicity returned to levels similar to those recorded before the 17 May increase. Lava effusion continued but was confined to the summit crater; periodic crater incandescence was observed.
Low-level activity was noted during June through October. On 1 June OVG reported that seismicity remained at lower levels and that crater incandescence had been absent for three days, though infrared satellite imagery showed continued lava effusion in the summit crater. The lava flows on the flanks covered an estimated 0.6 km2. Satellite imagery continued to show thermal activity confined to the lava lake through October (figure 96), although no lava flows or significant sulfur dioxide emissions were reported.
Geologic Background. Africa's most active volcano, Nyamulagira (also known as Nyamuragira), is a massive high-potassium basaltic shield about 25 km N of Lake Kivu and 13 km NNW of the steep-sided Nyiragongo volcano. The summit is truncated by a small 2 x 2.3 km caldera that has walls up to about 100 m high. Documented eruptions have occurred within the summit caldera, as well as from the numerous flank fissures and cinder cones. A lava lake in the summit crater, active since at least 1921, drained in 1938, at the time of a major flank eruption. Recent lava flows extend down the flanks more than 30 km from the summit as far as Lake Kivu; extensive lava flows from this volcano have covered 1,500 km2 of the western branch of the East African Rift.
Information Contacts: Observatoire Volcanologique de Goma (OVG), Departement de Geophysique, Centre de Recherche en Sciences Naturelles, Lwiro, D.S. Bukavu, DR Congo; Hawai'i Institute of Geophysics and Planetology (HIGP) - MODVOLC Thermal Alerts System, School of Ocean and Earth Science and Technology (SOEST), Univ. of Hawai'i, 2525 Correa Road, Honolulu, HI 96822, USA (URL: http://modis.higp.hawaii.edu/); MIROVA (Middle InfraRed Observation of Volcanic Activity), a collaborative project between the Universities of Turin and Florence (Italy) supported by the Centre for Volcanic Risk of the Italian Civil Protection Department (URL: http://www.mirovaweb.it/); NASA Global Sulfur Dioxide Monitoring Page, Atmospheric Chemistry and Dynamics Laboratory, NASA Goddard Space Flight Center (NASA/GSFC), 8800 Greenbelt Road, Goddard, Maryland, USA (URL: https://so2.gsfc.nasa.gov/); Copernicus Browser, Copernicus Data Space Ecosystem, European Space Agency (URL: https://dataspace.copernicus.eu/browser/); Charles Balagizi, Goma Volcano Observatory, Departement de Geophysique, Centre de Recherche en Sciences Naturelles, Lwiro, D.S. Bukavu, DR Congo.
Bagana (Papua New Guinea) — October 2023 Cite this Report
Bagana
Papua New Guinea
6.137°S, 155.196°E; summit elev. 1855 m
All times are local (unless otherwise noted)
Explosions, ash plumes, ashfall, and lava flows during April-September 2023
The remote volcano of Bagana is located in central Bougainville Island, Papua New Guinea. Recorded eruptions date back to 1842 and activity has consisted of effusive activity that has built a small lava dome in the summit crater and occasional explosions that produced pyroclastic flows. The most recent eruption has been ongoing since February 2000 and has produced occasional explosions, ash plumes, and lava flows. More recently, activity has been characterized by ongoing effusive activity and ash emissions (BGVN 48:04). This report updates activity from April through September 2023 that has consisted of explosions, ash plumes, ashfall, and lava flows, using information from the Darwin Volcanic Ash Advisory Center (VAAC) and satellite data.
An explosive eruption was reported on 7 July that generated a large gas-and-ash plume to high altitudes and caused significant ashfall in local communities; the eruption plume had reached upper tropospheric (16-18 km altitude) altitudes by 2200, according to satellite images. Sulfur dioxide plumes were detected in satellite images on 8 July and indicated that the plume was likely a mixture of gas, ice, and ash. A report issued by the Autonomous Bougainville Government (ABG) (Torokina District, Education Section) on 10 July noted that significant ash began falling during 2000-2100 on 7 July and covered most areas in the Vuakovi, Gotana (9 km SW), Koromaketo, Laruma (25 km W) and Atsilima (27 km NW) villages. Pyroclastic flows also occurred, according to ground-based reports; small deposits confined to one drainage were inspected by RVO during an overflight on 17 July and were confirmed to be from the 7 July event. Ashfall continued until 10 July and covered vegetation, which destroyed bushes and gardens and contaminated rivers and streams.
RVO reported another eruption on 14 July. The Darwin VAAC stated that an explosive event started around 0830 on 15 July and produced an ash plume that rose to 16.5 km altitude by 1000 and drifted N, according to satellite images. The plume continued to drift N and remained visible through 1900, and by 2150 it had dissipated.
Ashfall likely from both the 7 and 15 July events impacted about 8,111 people in Torokina (20 km SW), including Tsito/Vuakovi, Gotana, Koromaketo, Kenaia, Longkogari, Kenbaki, Piva (13 km SW), and Atsinima, and in the Tsitovi district, according to ABG. Significant ashfall was also reported in Ruruvu (22 km N) in the Wakunai District of Central Bougainville, though the thickness of these deposits could not be confirmed. An evacuation was called for the villages in Wakunai, where heavy ashfall had contaminated water sources; the communities of Ruruvu, Togarau, Kakarapaia, Karauturi, Atao, and Kuritaturi were asked to evacuate to a disaster center at the Wakunai District Station, and communities in Torokina were asked to evacuate to the Piva District station. According to a news article, more than 7,000 people needed temporary accommodations, with about 1,000 people in evacuation shelters. Ashfall had deposited over a broad area, contaminating water supplies, affecting crops, and collapsing some roofs and houses in rural areas. Schools were temporarily shut down. Intermittent ash emissions continued through the end of July and drifted NNW, NW, and SW. Fine ashfall was reported on the coast of Torokina, and ash plumes also drifted toward Laruma and Atsilima.
A small explosive eruption occurred at 2130 on 28 July that ejected material from the crater vents, according to reports from Torokina, in addition to a lava flow that contained two lobes. A second explosion was detected at 2157. Incandescence from the lava flow was visible from Piva as it descended the W flank around 2000 on 29 July (figure 47). The Darwin VAAC reported that a strong thermal anomaly was visible in satellite images during 30-31 July and that ash emissions rose to 2.4 km altitude and drifted WSW on 30 July. A ground report from RVO described localized emissions at 0900 on 31 July.
The Darwin VAAC reported that ash plumes were identified in satellite imagery at 0800 and 1220 on 12 August and rose to 2.1 km and 3 km altitude and drifted NW and W, respectively. A news report stated that aid was sent to more than 6,300 people that were adversely affected by the eruption. Photos taken during 17-19 August showed ash emissions rising no higher than 1 km above the summit and drifting SE. A small explosion generated an ash plume during the morning of 19 August. Deposits from small pyroclastic flows were also captured in the photos. Satellite images captured lava flows and pyroclastic flow deposits. Two temporary seismic stations were installed near Bagana on 17 August at distances of 7 km WSW (Vakovi station) and 11 km SW (Kepox station). The Kepox station immediately started to record continuous, low-frequency background seismicity.
Satellite data. Little to no thermal activity was detected during April through mid-July 2023; only one anomaly was recorded during early April and one during early June, according to MIROVA (Middle InfraRed Observation of Volcanic Activity) data (figure 48). Thermal activity increased in both power and frequency during mid-July through September, although there were still some short gaps in detected activity. MODVOLC also detected increased thermal activity during August; thermal hotspots were detected a total of five times on 19, 20, and 27 August. Weak thermal anomalies were also captured in infrared satellite images on clear weather days throughout the reporting period on 7, 12, and 17 April, 27 May, 1, 6, 16, and 31 July, and 19 September (figure 48); a strong thermal anomaly was visible on 31 July. Distinct sulfur dioxide plumes that drifted generally NW were intermittently captured by the TROPOMI instrument on the Sentinel-5P satellite and sometimes exceeded two Dobson Units (DUs) (figure 49).
Geologic Background. Bagana volcano, in a remote portion of central Bougainville Island, is frequently active. This massive symmetrical cone was largely constructed by an accumulation of viscous andesitic lava flows. The entire edifice could have been constructed in about 300 years at its present rate of lava production. Eruptive activity is characterized by non-explosive effusion of viscous lava that maintains a small lava dome in the summit crater, although occasional explosive activity produces pyroclastic flows. Lava flows with tongue-shaped lobes up to 50 m thick and prominent levees descend the flanks on all sides.
Information Contacts: Rabaul Volcano Observatory (RVO), Geohazards Management Division, Department of Mineral Policy and Geohazards Management (DMPGM), PO Box 3386, Kokopo, East New Britain Province, Papua New Guinea; Darwin Volcanic Ash Advisory Centre (VAAC), Bureau of Meteorology, Northern Territory Regional Office, PO Box 40050, Casuarina, NT 0811, Australia (URL: http://www.bom.gov.au/info/vaac/); MIROVA (Middle InfraRed Observation of Volcanic Activity), a collaborative project between the Universities of Turin and Florence (Italy) supported by the Centre for Volcanic Risk of the Italian Civil Protection Department (URL: http://www.mirovaweb.it/); Hawai'i Institute of Geophysics and Planetology (HIGP) - MODVOLC Thermal Alerts System, School of Ocean and Earth Science and Technology (SOEST), Univ. of Hawai'i, 2525 Correa Road, Honolulu, HI 96822, USA (URL: http://modis.higp.hawaii.edu/); NASA Global Sulfur Dioxide Monitoring Page, Atmospheric Chemistry and Dynamics Laboratory, NASA Goddard Space Flight Center (NASA/GSFC), 8800 Greenbelt Road, Goddard, Maryland, USA (URL: https://so2.gsfc.nasa.gov/); Copernicus Browser, Copernicus Data Space Ecosystem, European Space Agency (URL: https://dataspace.copernicus.eu/browser/); Autonomous Bougainville Government, P.O Box 322, Buka, AROB, PNG (URL: https://abg.gov.pg/); Andrew Tupper (Twitter: @andrewcraigtupp); Simon Carn, Geological and Mining Engineering and Sciences, Michigan Technological University, 1400 Townsend Drive, Houghton, MI 49931, USA (URL: http://www.volcarno.com/, Twitter: @simoncarn); Radio NZ (URL: https://www.rnz.co.nz/news/pacific/494464/more-than-7-000-people-in-bougainville-need-temporary-accommodation-after-eruption); USAID, 1300 Pennsylvania Ave, NW, Washington DC 20004, USA (URL: https://www.usaid.gov/pacific-islands/press-releases/aug-08-2023-united-states-provides-immediate-emergency-assistance-support-communities-affected-mount-bagana-volcanic-eruptions).
Mayon (Philippines) — October 2023 Cite this Report
Mayon
Philippines
13.257°N, 123.685°E; summit elev. 2462 m
All times are local (unless otherwise noted)
Lava flows, pyroclastic flows, ash emissions, and seismicity during April-September 2023
Mayon is located in the Philippines and has steep upper slopes capped by a small summit crater. Historical eruptions date back to 1616 CE that have been characterized by Strombolian eruptions, lava flows, pyroclastic flows, and mudflows. Eruptions mostly originated from a central conduit. Pyroclastic flows and mudflows have commonly descended many of the approximately 40 drainages that surround the volcano. The most recent eruption occurred during June through October 2022 and consisted of lava dome growth and gas-and-steam emissions (BGVN 47:12). A new eruption was reported during late April 2023 and has included lava flows, pyroclastic density currents, ash emissions, and seismicity. This report covers activity during April through September 2023 based on daily bulletins from the Philippine Institute of Volcanology and Seismology (PHIVOLCS).
During April through September 2023, PHIVOLCS reported near-daily rockfall events, frequent volcanic earthquakes, and sulfur dioxide measurements. Gas-and-steam emissions rose 100-900 m above the crater and drifted in different directions. Nighttime crater incandescence was often visible during clear weather and was accompanied by incandescent avalanches of material. Activity notably increased during June when lava flows were reported on the S, SE, and E flanks (figure 52). The MIROVA graph (Middle InfraRed Observation of Volcanic Activity) showed strong thermal activity coincident with these lava flows, which remained active through September (figure 53). According to the MODVOLC thermal algorithm, a total of 110 thermal alerts were detected during the reporting period: 17 during June, 40 during July, 27 during August, and 26 during September. During early June, pyroclastic density currents (PDCs) started to occur more frequently.
Low activity was reported during much of April and May; gas-and-steam emissions rose 100-900 m above the crater and generally drifted in different directions. A total of 52 rockfall events and 18 volcanic earthquakes were detected during April and 147 rockfall events and 13 volcanic events during May. Sulfur dioxide flux measurements ranged between 400-576 tons per day (t/d) during April, the latter of which was measured on 29 April and between 162-343 t/d during May, the latter of which was measured on 13 May.
Activity during June increased, characterized by lava flows, pyroclastic density currents (PDCs), crater incandescence and incandescent rockfall events, gas-and-steam emissions, and continued seismicity. Weather clouds often prevented clear views of the summit, but during clear days, moderate gas-and-steam emissions rose 100-2,500 m above the crater and drifted in multiple directions. A total of 6,237 rockfall events and 288 volcanic earthquakes were detected. The rockfall events often deposited material on the S and SE flanks within 700-1,500 m of the summit crater and ash from the events drifted SW, S, SE, NE, and E. Sulfur dioxide emissions ranged between 149-1,205 t/d, the latter of which was measured on 10 June. Short-term observations from EDM and electronic tiltmeter monitoring indicated that the upper slopes were inflating since February 2023. Longer-term ground deformation parameters based on EDM, precise leveling, continuous GPS, and electronic tilt monitoring indicated that the volcano remained inflated, especially on the NW and SE flanks. At 1000 on 5 June the Volcano Alert Level (VAL) was raised to 2 (on a 0-5 scale). PHIVOLCS noted that although low-level volcanic earthquakes, ground deformation, and volcanic gas emissions indicated unrest, the steep increase in rockfall frequency may indicate increased dome activity.
A total of 151 dome-collapse PDCs occurred during 8-9 and 11-30 June, traveled 500-2,000 m, and deposited material on the S flank within 2 km of the summit crater. During 8-9 June the VAL was raised to 3. At approximately 1947 on 11 June lava flow activity was reported; two lobes traveled within 500 m from the crater and deposited material on the S (Mi-isi), SE (Bonga), and E (Basud) flanks. Weak seismicity accompanied the lava flow and slight inflation on the upper flanks. This lava flow remained active through 30 June, moving down the S and SE flank as far as 2.5 km and 1.8 km, respectively and depositing material up to 3.3 km from the crater. During 15-16 June traces of ashfall from the PDCs were reported in Sitio Buga, Nabonton, City of Ligao and Purok, and San Francisco, Municipality of Guinobatan. During 28-29 June there were two PDCs generated by the collapse of the lava flow front, which generated a light-brown ash plume 1 km high. Satellite monitors detected significant concentrations of sulfur dioxide beginning on 29 June. On 30 June PDCs primarily affected the Basud Gully on the E flank, the largest of which occurred at 1301 and lasted eight minutes, based on the seismic record. Four PDCs generated between 1800 and 2000 that lasted approximately four minutes each traveled 3-4 km on the E flank and generated an ash plume that rose 1 km above the crater and drifted N and NW. Ashfall was recorded in Tabaco City.
Similar strong activity continued during July; slow lava effusion remained active on the S and SE flanks and traveled as far as 2.8 km and 2.8 km, respectively and material was deposited as far as 4 km from the crater. There was a total of 6,983 rockfall events and 189 PDCs that affected the S, SE, and E flanks. The volcano network detected a total of 2,124 volcanic earthquakes. Continuous gas-and-steam emissions rose 200-2,000 m above the crater and drifted in multiple directions. Sulfur dioxide emissions averaged 792-4,113 t/d, the latter of which was measured on 28 July. During 2-4 July three PDCs were generated from the collapse of the lava flow and resulting light brown plumes rose 200-300 m above the crater. Continuous tremor pulses were reported beginning at 1547 on 3 July through 7 July at 1200, at 2300 on 8 July and going through 0300 on 10 July, and at 2300 on 16 July, as recorded by the seismic network. During 6-9 July there were 10 lava flow-collapse-related PDCs that generated light brown plumes 300-500 m above the crater. During 10-11 July light ashfall was reported in some areas of Mabinit, Legazpi City, Budiao and Salvacion, Daraga, and Camalig, Albay. By 18 July the lava flow advanced 600 m on the E flank as well.
During 1733 on 18 July and 0434 on 19 July PHIVOLCS reported 30 “ashing” events, which are degassing events accompanied by audible thunder-like sounds and entrained ash at the crater, which produced short, dark plumes that drifted SW. These events each lasted 20-40 seconds, and plume heights ranged from 150-300 m above the crater, as recorded by seismic, infrasound, visual, and thermal monitors. Three more ashing events occurred during 19-20 July. Short-term observations from electronic tilt and GPS monitoring indicate deflation on the E lower flanks in early July and inflation on the NW middle flanks during the third week of July. Longer-term ground deformation parameters from EDM, precise leveling, continuous GPS, and electronic tilt monitoring indicated that the volcano was still generally inflated relative to baseline levels. A short-lived lava pulse lasted 28 seconds at 1956 on 21 July, which was accompanied by seismic and infrasound signals. By 22 July, the only lava flow that remained active was on the SE flank, and continued to extend 3.4 km, while those on the S and E flanks weakened markedly. One ashing event was detected during 30-31 July, whereas there were 57 detected during 31 July-1 August; according to PHIVOLCS beginning at approximately 1800 on 31 July eruptive activity was dominated by phases of intermittent ashing, as well as increased in the apparent rates of lava effusion from the summit crater. The ashing phases consisted of discrete events recorded as low-frequency volcanic earthquakes (LFVQ) typically 30 seconds in duration, based on seismic and infrasound signals. Gray ash plume rose 100 m above the crater and generally drifted NE. Shortly after these ashing events began, new lava began to effuse rapidly from the crater, feeding the established flowed on the SE, E, and E flanks and generating frequent rockfall events.
Intensified unrest persisted during August. There was a total of 4,141 rockfall events, 2,881 volcanic earthquakes, which included volcanic tremor events, 32 ashing events, and 101 PDCs detected throughout the month. On clear weather days, gas-and-steam emissions rose 300-1,500 m above the crater and drifted in different directions (figure 54). Sulfur dioxide emissions averaged 735-4,756 t/d, the higher value of which was measured on 16 August. During 1-2 August the rate of lava effusion decreased, but continued to feed the flows on the SE, S, and E flanks, maintaining their advances to 3.4 km, 2.8 km, and 1.1 km from the crater, respectively (figure 55). Rockfall and PDCs generated by collapses at the lava flow margins and from the summit dome deposited material within 4 km of the crater. During 3-4 August there were 10 tremor events detected that lasted 1-4 minutes. Short-lived lava pulse lasted 35 seconds and was accompanied by seismic and infrasound signals at 0442 on 6 August. Seven collapses were recorded at the front of the lava flow during 12-14 August.
During September, similar activity of slow lava effusion, PDCs, gas-and-steam emissions, and seismicity continued. There was a total of 4,452 rockfall events, 329 volcanic earthquakes, which included volcanic tremor events, two ashing events, and 85 PDCs recorded throughout the month. On clear weather days, gas-and-steam emissions rose 100-1,500 m above the crater and drifted in multiple directions. Sulfur dioxide emissions averaged 609-2,252 t/d, the higher average of which was measured on 6 September. Slow lava effusion continued advancing on the SE, S, and E flanks, maintaining lengths of 3.4 km, 2.8 km, and 1.1 km, respectively. Rockfall and PDC events generated by collapses along the lava flow margins and at the summit dome deposited material within 4 km of the crater.
Geologic Background. Symmetrical Mayon, which rises above the Albay Gulf NW of Legazpi City, is the most active volcano of the Philippines. The steep upper slopes are capped by a small summit crater. Recorded eruptions since 1616 CE range from Strombolian to basaltic Plinian, with cyclical activity beginning with basaltic eruptions, followed by longer periods of andesitic lava flows. Eruptions occur predominately from the central conduit and have also produced lava flows that travel far down the flanks. Pyroclastic density currents and mudflows have commonly swept down many of the approximately 40 ravines that radiate from the summit and have often damaged populated lowland areas. A violent eruption in 1814 killed more than 1,200 people and devastated several towns.
Information Contacts: Philippine Institute of Volcanology and Seismology (PHIVOLCS), Department of Science and Technology, University of the Philippines Campus, Diliman, Quezon City, Philippines (URL: http://www.phivolcs.dost.gov.ph/); MIROVA (Middle InfraRed Observation of Volcanic Activity), a collaborative project between the Universities of Turin and Florence (Italy) supported by the Centre for Volcanic Risk of the Italian Civil Protection Department (URL: http://www.mirovaweb.it/); Hawai'i Institute of Geophysics and Planetology (HIGP) - MODVOLC Thermal Alerts System, School of Ocean and Earth Science and Technology (SOEST), Univ. of Hawai'i, 2525 Correa Road, Honolulu, HI 96822, USA (URL: http://modis.higp.hawaii.edu/); Copernicus Browser, Copernicus Data Space Ecosystem, European Space Agency (URL: https://dataspace.copernicus.eu/browser/); William Rogers, Legazpi City, Albay Province, Philippines.
Nishinoshima (Japan) — October 2023 Cite this Report
Nishinoshima
Japan
27.247°N, 140.874°E; summit elev. 100 m
All times are local (unless otherwise noted)
Eruption plumes and gas-and-steam plumes during May-August 2023
Nishinoshima, located about 1,000 km S of Tokyo, is a small island in the Ogasawara Arc in Japan. The island is the summit of a massive submarine volcano that has prominent submarine peaks to the S, W, and NE. Eruptions date back to 1973 and the current eruption period began in October 2022. Recent activity has consisted of small ash plumes and fumarolic activity (BGVN 48:07). This report covers activity during May through August 2023, using information from monthly reports of the Japan Meteorological Agency (JMA) monthly reports and satellite data.
Activity during May through June was relatively low. The Japan Coast Guard (JCG) did overflights on 14 and 22 June and reported white gas-and-steam emissions rising 600 m and 1,200 m from the central crater of the pyroclastic cone, respectively (figure 125). In addition, multiple white gas-and-steam emissions rose from the inner rim of the W side of the crater and from the SE flank of the pyroclastic cone. Discolored brown-to-green water was observed around almost the entire perimeter of the island; on 22 June light green discolored water was observed off the S coast of the island.
Observations from the Himawari meteorological satellite confirmed an eruption on 9 and 10 July. An eruption plume rose 1.6 km above the crater and drifted N around 1300 on 9 July. Satellite images acquired at 1420 and 2020 on 9 July and at 0220 on 10 July showed continuing emissions that rose 1.3-1.6 km above the crater and drifted NE and N. The Tokyo VAAC reported that an ash plume seen by a pilot and identified in a satellite image at 0630 on 21 July rose to 3 km altitude and drifted S.
Aerial observations conducted by JCG on 8 August showed a white-and-gray plume rising from the central crater of the pyroclastic cone, and multiple white gas-and-steam emissions were rising from the inner edge of the western crater and along the NW-SE flanks of the island (figure 126). Brown-to-green discolored water was also noted around the perimeter of the island.
Intermittent low-to-moderate power thermal anomalies were recorded in the MIROVA graph (Middle InfraRed Observation of Volcanic Activity), showing an increase in both frequency and power beginning in July (figure 127). This increase in activity coincides with eruptive activity on 9 and 10 July, characterized by eruption plumes. According to the MODVOLC thermal alert algorithm, one thermal hotspot was recorded on 20 July. Weak thermal anomalies were also detected in infrared satellite imagery, accompanied by strong gas-and-steam plumes (figure 128).
Geologic Background. The small island of Nishinoshima was enlarged when several new islands coalesced during an eruption in 1973-74. Multiple eruptions that began in 2013 completely covered the previous exposed surface and continued to enlarge the island. The island is the summit of a massive submarine volcano that has prominent peaks to the S, W, and NE. The summit of the southern cone rises to within 214 m of the ocean surface 9 km SSE.
Information Contacts: Japan Meteorological Agency (JMA), 1-3-4 Otemachi, Chiyoda-ku, Tokyo 100-8122, Japan (URL: http://www.jma.go.jp/jma/indexe.html); Tokyo Volcanic Ash Advisory Center (VAAC), 1-3-4 Otemachi, Chiyoda-ku, Tokyo 100-8122, Japan (URL: http://ds.data.jma.go.jp/svd/vaac/data/); MIROVA (Middle InfraRed Observation of Volcanic Activity), a collaborative project between the Universities of Turin and Florence (Italy) supported by the Centre for Volcanic Risk of the Italian Civil Protection Department (URL: http://www.mirovaweb.it/); Copernicus Browser, Copernicus Data Space Ecosystem, European Space Agency (URL: https://dataspace.copernicus.eu/browser/).
Krakatau (Indonesia) — October 2023 Cite this Report
Krakatau
Indonesia
6.1009°S, 105.4233°E; summit elev. 285 m
All times are local (unless otherwise noted)
White gas-and-steam plumes and occasional ash plumes during May-August 2023
Krakatau is located in the Sunda Strait between Java and Sumatra, Indonesia. Caldera collapse during the catastrophic 1883 eruption destroyed Danan and Perbuwatan cones and left only a remnant of Rakata. The post-collapse cone of Anak Krakatau (Child of Krakatau) was constructed within the 1883 caldera at a point between the former Danan and Perbuwatan cones; it has been the site of frequent eruptions since 1927. The current eruption period began in May 2021 and has recently consisted of Strombolian eruptions and ash plumes (BGVN 48:07). This report describes lower levels of activity consisting of ash and white gas-and-steam plumes during May through August 2023, based on information provided by the Indonesian Center for Volcanology and Geological Hazard Mitigation, referred to as Pusat Vulkanologi dan Mitigasi Bencana Geologi (PVMBG), MAGMA Indonesia, and satellite data.
Activity was relatively low during May and June. Daily white gas-and-steam emissions rose 25-200 m above the crater and drifted in different directions. Five ash plumes were detected at 0519 on 10 May, 1241 on 11 May, 0920 on 12 May, 2320 on 12 May, and at 0710 on 13 May, and rose 1-2.5 km above the crater and drifted SW. A webcam image taken on 12 May showed ejection of incandescent material above the vent. A total of nine ash plumes were detected during 6-11 June: at 1434 and 00220 on 6 and 7 June the ash plumes rose 500 m above the crater and drifted NW, at 1537 on 8 June the ash plume rose 1 km above the crater and drifted SW, at 0746 and at 0846 on 9 June the ash plumes rose 800 m and 3 km above the crater and drifted SW, respectively, at 0423, 1431, and 1750 on 10 June the ash plumes rose 2 km, 1.5 km, and 3.5 km above the crater and drifted NW, respectively, and at 0030 on 11 June an ash plume rose 2 km above the crater and drifted NW. Webcam images taken on 10 and 11 June at 0455 and 0102, respectively, showed incandescent material ejected above the vent. On 19 June an ash plume at 0822 rose 1.5 km above the crater and drifted SE.
Similar low activity of white gas-and-steam emissions and few ash plumes were reported during July and August. Daily white gas-and-steam emissions rose 25-300 m above the crater and drifted in multiple directions. Three ash plumes were reported at 0843, 0851, and 0852 on 20 July that rose 500-2,000 m above the crater and drifted NW.
The MIROVA (Middle InfraRed Observation of Volcanic Activity) graph of MODIS thermal anomaly data showed intermittent low-to-moderate power thermal anomalies during May through August 2023 (figure 140). Although activity was often obscured by weather clouds, a thermal anomaly was visible in an infrared satellite image of the crater on 12 May, accompanied by an eruption plume that drifted SW (figure 141).
Geologic Background. The renowned Krakatau (frequently mis-named as Krakatoa) volcano lies in the Sunda Strait between Java and Sumatra. Collapse of an older edifice, perhaps in 416 or 535 CE, formed a 7-km-wide caldera. Remnants of that volcano are preserved in Verlaten and Lang Islands; subsequently the Rakata, Danan, and Perbuwatan cones were formed, coalescing to create the pre-1883 Krakatau Island. Caldera collapse during the catastrophic 1883 eruption destroyed Danan and Perbuwatan, and left only a remnant of Rakata. This eruption caused more than 36,000 fatalities, most as a result of tsunamis that swept the adjacent coastlines of Sumatra and Java. Pyroclastic surges traveled 40 km across the Sunda Strait and reached the Sumatra coast. After a quiescence of less than a half century, the post-collapse cone of Anak Krakatau (Child of Krakatau) was constructed within the 1883 caldera at a point between the former Danan and Perbuwatan cones. Anak Krakatau has been the site of frequent eruptions since 1927.
Information Contacts: Pusat Vulkanologi dan Mitigasi Bencana Geologi (PVMBG, also known as Indonesian Center for Volcanology and Geological Hazard Mitigation, CVGHM), Jalan Diponegoro 57, Bandung 40122, Indonesia (URL: http://www.vsi.esdm.go.id/); MAGMA Indonesia, Kementerian Energi dan Sumber Daya Mineral (URL: https://magma.esdm.go.id/v1); MIROVA (Middle InfraRed Observation of Volcanic Activity), a collaborative project between the Universities of Turin and Florence (Italy) supported by the Centre for Volcanic Risk of the Italian Civil Protection Department (URL: http://www.mirovaweb.it/); Copernicus Browser, Copernicus Data Space Ecosystem, European Space Agency (URL: https://dataspace.copernicus.eu/browser/).
Villarrica (Chile) — October 2023 Cite this Report
Villarrica
Chile
39.42°S, 71.93°W; summit elev. 2847 m
All times are local (unless otherwise noted)
Strombolian activity, gas-and-ash emissions, and crater incandescence during April-September 2023
Villarrica, in central Chile, consists of a 2-km-wide caldera that formed about 3,500 years ago and is located at the base of the presently active cone at the NW margin of a 6-km-wide caldera. Historical eruptions eruptions date back to 1558 and have been characterized by mild-to-moderate explosive activity with occasional lava effusions. The current eruption period began in December 2014 and has recently consisted of nighttime crater incandescence, ash emissions, and seismicity (BGVN 48:04). This report covers activity during April through September 2023 and describes occasional Strombolian activity, gas-and-ash emissions, and nighttime crater incandescence. Information for this report primarily comes from the Southern Andes Volcano Observatory (Observatorio Volcanológico de Los Andes del Sur, OVDAS), part of Chile's National Service of Geology and Mining (Servicio Nacional de Geología y Minería, SERNAGEOMIN) and satellite data.
Seismicity during April consisted of long period (LP) events and tremor (TRE); a total of 9,413 LP-type events and 759 TR-type events were detected throughout the month. Nighttime crater incandescence persisted and was visible in the degassing column. Sulfur dioxide data was obtained using Differential Absorption Optical Spectroscopy Equipment (DOAS) that showed an average value of 1,450 ± 198 tons per day (t/d) during 1-15 April and 1,129 ± 201 t/d during 16-30 April, with a maximum daily value of 2,784 t/d on 9 April. Gas-and-steam emissions of variable intensities rose above the active crater as high as 1.3 km above the crater on 13 April. Strombolian explosions were not observed and there was a slight decrease in the lava lake level.
There were 14,123 LP-type events and 727 TR-type events detected during May. According to sulfur dioxide measurements taken with DOAS equipment, the active crater emitted an average value of 1,826 ± 482 t/d during 1-15 May and 912 ± 41 t/d during 16-30 May, with a daily maximum value of 5,155 t/d on 13 May. Surveillance cameras showed continuous white gas-and-steam emissions that rose as high as 430 m above the crater on 27 May. Nighttime incandescence illuminated the gas column less than 300 m above the crater rim was and no pyroclastic emissions were reported. A landslide was identified on 13 May on the E flank of the volcano 50 m from the crater rim and extending 300 m away; SERNAGEOMIN noted that this event may have occurred on 12 May. During the morning of 27 and 28 May minor Strombolian explosions characterized by incandescent ejecta were recorded at the crater rim; the last reported Strombolian explosions had occurred at the end of March.
Seismic activity during June consisted of five volcano-tectonic (VT)-type events, 21,606 LP-type events, and 2,085 TR-type events. The average value of sulfur dioxide flux obtained by DOAS equipment was 1,420 ± 217 t/d during 1-15 June and 2,562 ± 804 t/d, with a maximum daily value of 4,810 t/d on 17 June. White gas-and-steam emissions rose less than 480 m above the crater; frequent nighttime crater incandescence was reflected in the degassing plume. On 12 June an emission rose 100 m above the crater and drifted NNW. On 15 June one or several emissions resulted in ashfall to the NE as far as 5.5 km from the crater, based on a Skysat satellite image. Several Strombolian explosions occurred within the crater; activity on 15 June was higher energy and ejected blocks 200-300 m on the NE slope. Surveillance cameras showed white gas-and-steam emissions rising 480 m above the crater on 16 June. On 19 and 24 June low-intensity Strombolian activity was observed, ejecting material as far as 200 m from the center of the crater to the E.
During July, seismicity included 29,319 LP-type events, 3,736 TR-type events, and two VT-type events. DOAS equipment recorded two days of sulfur dioxide emissions of 4,220 t/d and 1,009 t/d on 1 and 13 July, respectively. Constant nighttime incandescence was also recorded and was particularly noticeable when accompanied by eruptive columns on 12 and 16 July. Minor explosive events were detected in the crater. According to Skysat satellite images taken on 12, 13, and 16 July, ashfall deposits were identified 155 m S of the crater. According to POVI, incandescence was visible from two vents on the crater floor around 0336 on 12 July. Gas-and-ash emissions rose as high as 1.2 km above the crater on 13 July and drifted E and NW. A series of gas-and-steam pulses containing some ash deposited material on the upper E flank around 1551 on 13 July. During 16-31 July, average sulfur dioxide emissions of 1,679 ± 406 t/d were recorded, with a maximum daily value of 2,343 t/d on 28 July. Fine ash emissions were also reported on 16, 17, and 23 July.
Seismicity persisted during August, characterized by 27,011 LP-type events, 3,323 TR-type events, and three VT-type events. The average value of sulfur dioxide measurements taken during 1-15 August was 1,642 ± 270 t/d and 2,207 ± 4,549 t/d during 16-31 August, with a maximum daily value of 3,294 t/d on 27 August. Nighttime crater incandescence remained visible in degassing columns. White gas-and-steam emissions rose 480 m above the crater on 6 August. According to a Skysat satellite image from 6 August, ash accumulation was observed proximal to the crater and was mainly distributed toward the E slope. White gas-and-steam emissions rose 320 m above the crater on 26 August. Nighttime incandescence and Strombolian activity that generated ash emissions were reported on 27 August.
Seismicity during September was characterized by five VT-type events, 12,057 LP-type events, and 2,058 TR-type events. Nighttime incandescence persisted. On 2 September an ash emission rose 180 m above the crater and drifted SE at 1643 (figure 125) and a white gas-and-steam plume rose 320 m above the crater. According to the Buenos Aires VAAC, periods of continuous gas-and-ash emissions were visible in webcam images from 1830 on 2 September to 0110 on 3 September. Strombolian activity was observed on 2 September and during the early morning of 3 September, the latter event of which generated an ash emission that rose 60 m above the crater and drifted 100 m from the center of the crater to the NE and SW. Ashfall was reported to the SE and S as far as 750 m from the crater. The lava lake was active during 3-4 September and lava fountaining was visible for the first time since 26 March 2023, according to POVI. Fountains captured in webcam images at 2133 on 3 September and at 0054 on 4 September rose as high as 60 m above the crater rim and ejected material onto the upper W flank. Sulfur dioxide flux of 1,730 t/d and 1,281 t/d was measured on 3 and 4 September, respectively, according to data obtained by DOAS equipment.
Strong Strombolian activity and larger gas-and-ash plumes were reported during 18-20 September. On 18 September activity was also associated with energetic LP-type events and notable sulfur dioxide fluxes (as high as 4,277 t/d). On 19 September Strombolian activity and incandescence were observed. On 20 September at 0914 ash emissions rose 50 m above the crater and drifted SSE, accompanied by Strombolian activity that ejected material less than 100 m SSE, causing fall deposits on that respective flank. SERNAGEOMIN reported that a Planet Scope satellite image taken on 20 September showed the lava lake in the crater, measuring 32 m x 35 m and an area of 0.001 km2. Several ash emissions were recorded at 0841, 0910, 1251, 1306, 1312, 1315, and 1324 on 23 September and rose less than 150 m above the crater. The sulfur dioxide flux value was 698 t/d on 23 September and 1,097 t/d on 24 September. On 24 September the Volcanic Alert Level (VAL) was raised to Orange (the third level on a four-color scale). SENAPRED maintained the Alert Level at Yellow (the middle level on a three-color scale) for the communities of Villarrica, Pucón (16 km N), Curarrehue, and Panguipulli.
During 24-25 September there was an increase in seismic energy (observed at TR-events) and acoustic signals, characterized by 1 VT-type event, 213 LP-type events, and 124 TR-type events. Mainly white gas-and-steam emissions, in addition to occasional fine ash emissions were recorded. During the early morning of 25 September Strombolian explosions were reported and ejected material 250 m in all directions, though dominantly toward the NW. On 25 September the average value of sulfur dioxide flux was 760 t/d. Seismicity during 25-30 September consisted of five VT-type events, 1,937 LP-type events, and 456 TR-type events.
During 25-29 September moderate Strombolian activity was observed and ejected material as far as the crater rim. In addition, ash pulses lasting roughly 50 minutes were observed around 0700 and dispersed ENE. During 26-27 September a TR episode lasted 6.5 hours and was accompanied by discrete acoustic signals. Satellite images from 26 September showed a spatter cone on the crater floor with one vent that measured 10 x 14 m and a smaller vent about 35 m NE of the cone. SERNAGEOMIN reported an abundant number of bomb-sized blocks up to 150 m from the crater, as well as impact marks on the snow, which indicated explosive activity. A low-altitude ash emission was observed drifting NW around 1140 on 28 September, based on webcam images. Between 0620 and 0850 on 29 September an ash emission rose 60 m above the crater and drifted NW. During an overflight taken around 1000 on 29 September scientists observed molten material in the vent, a large accumulation of pyroclasts inside the crater, and energetic degassing, some of which contained a small amount of ash. Block-sized pyroclasts were deposited on the internal walls and near the crater, and a distal ash deposit was also visible. The average sulfur dioxide flux measured on 28 September was 344 t/d. Satellite images taken on 29 September ashfall was deposited roughly 3 km WNW from the crater and nighttime crater incandescence remained visible. The average sulfur dioxide flux value from 29 September was 199 t/d. On 30 September at 0740 a pulsating ash emission rose 1.1 km above the crater and drifted NNW (figure 126). Deposits on the S flank extended as far as 4.5 km from the crater rim, based on satellite images from 30 September.
Infrared MODIS satellite data processed by MIROVA (Middle InfraRed Observation of Volcanic Activity) showed intermittent thermal activity during April through September, with slightly stronger activity detected during late September (figure 127). Small clusters of thermal activity were detected during mid-June, early July, early August, and late September. According to the MODVOLC thermal alert system, a total of four thermal hotspots were detected on 7 July and 3 and 23 September. This activity was also intermittently captured in infrared satellite imagery on clear weather days (figure 128).
Geologic Background. The glacier-covered Villarrica stratovolcano, in the northern Lakes District of central Chile, is ~15 km south of the city of Pucon. A 2-km-wide caldera that formed about 3,500 years ago is located at the base of the presently active, dominantly basaltic to basaltic andesite cone at the NW margin of a 6-km-wide Pleistocene caldera. More than 30 scoria cones and fissure vents are present on the flanks. Plinian eruptions and pyroclastic flows that have extended up to 20 km from the volcano were produced during the Holocene. Lava flows up to 18 km long have issued from summit and flank vents. Eruptions documented since 1558 CE have consisted largely of mild-to-moderate explosive activity with occasional lava effusion. Glaciers cover 40 km2 of the volcano, and lahars have damaged towns on its flanks.
Information Contacts: Servicio Nacional de Geología y Minería (SERNAGEOMIN), Observatorio Volcanológico de Los Andes del Sur (OVDAS), Avda Sta María No. 0104, Santiago, Chile (URL: http://www.sernageomin.cl/); Proyecto Observación Villarrica Internet (POVI) (URL: http://www.povi.cl/); Sistema y Servicio Nacional de Prevención y Repuesta Ante Desastres (SENAPRED), Av. Beauchef 1671, Santiago, Chile (URL: https://web.senapred.cl/); Buenos Aires Volcanic Ash Advisory Center (VAAC), Servicio Meteorológico Nacional-Fuerza Aérea Argentina, 25 de mayo 658, Buenos Aires, Argentina (URL: http://www.smn.gov.ar/vaac/buenosaires/inicio.php); MIROVA (Middle InfraRed Observation of Volcanic Activity), a collaborative project between the Universities of Turin and Florence (Italy) supported by the Centre for Volcanic Risk of the Italian Civil Protection Department (URL: http://www.mirovaweb.it/); Hawai'i Institute of Geophysics and Planetology (HIGP) - MODVOLC Thermal Alerts System, School of Ocean and Earth Science and Technology (SOEST), Univ. of Hawai'i, 2525 Correa Road, Honolulu, HI 96822, USA (URL: http://modis.higp.hawaii.edu/); Copernicus Browser, Copernicus Data Space Ecosystem, European Space Agency (URL: https://dataspace.copernicus.eu/browser/).
Merapi (Indonesia) — October 2023 Cite this Report
Merapi
Indonesia
7.54°S, 110.446°E; summit elev. 2910 m
All times are local (unless otherwise noted)
Frequent incandescent avalanches during April-September 2023
Merapi, located just north of the major city of Yogyakarta in central Java, Indonesia, has had activity within the last 20 years characterized by pyroclastic flows and lahars accompanying growth and collapse of the steep-sided active summit lava dome. The current eruption period began in late December 2020 and has more recently consisted of ash plumes, intermittent incandescent avalanches of material, and pyroclastic flows (BGVN 48:04). This report covers activity during April through September 2023, based on information from Balai Penyelidikan dan Pengembangan Teknologi Kebencanaan Geologi (BPPTKG), the Center for Research and Development of Geological Disaster Technology, a branch of PVMBG which specifically monitors Merapi. Additional information comes from the Pusat Vulkanologi dan Mitigasi Bencana Geologi (PVMBG, also known as Indonesian Center for Volcanology and Geological Hazard Mitigation, CVGHM), MAGMA Indonesia, the Darwin Volcanic Ash Advisory Centre (VAAC), and various satellite data.
Activity during April through September 2023 primarily consisted of incandescent avalanches of material that mainly affected the SW and W flanks and traveled as far as 2.3 km from the summit (table 25) and white gas-and-steam emissions that rose 10-1,000 m above the crater.
Table 25. Monthly summary of avalanches and avalanche distances recorded at Merapi during April through September 2023. The number of reported avalanches does not include instances where possible avalanches were heard but could not be visually confirmed as a result of inclement weather. Data courtesy of BPPTKG (April-September 2023 daily reports).
| Month |
Average number of avalanches per day |
Distance avalanches traveled (m) |
| Apr 2023 |
19 |
1,200-2,000 |
| May 2023 |
22 |
500-2,000 |
| Jun 2023 |
18 |
1,200-2,000 |
| Jul 2023 |
30 |
300-2,000 |
| Aug 2023 |
25 |
400-2,300 |
| Sep 2023 |
23 |
600-2,000 |
BPPTKG reported that during April and May white gas-and-steam emissions rose 10-750 m above the crater, incandescent avalanches descended 500-2,000 m on the SW and W flanks (figure 135). Cloudy weather often prevented clear views of the summit, and sometimes avalanches could not be confirmed. According to a webcam image, a pyroclastic flow was visible on 17 April at 0531. During the week of 28 April and 4 May a pyroclastic flow was reported on the SW flank, traveling up to 2.5 km. According to a drone overflight taken on 17 May the SW lava dome volume was an estimated 2,372,800 cubic meters and the dome in the main crater was an estimated 2,337,300 cubic meters.
During June and July similar activity persisted with white gas-and-steam emissions rising 10-350 m above the crater and frequent incandescent avalanches that traveled 300-2,000 m down the SW, W, and S flanks (figure 136). Based on an analysis of aerial photos taken on 24 June the volume of the SW lava dome was approximately 2.5 million cubic meters. A pyroclastic flow was observed on 5 July that traveled 2.7 km on the SW flank. According to the Darwin VAAC multiple minor ash plumes were identified in satellite images on 19 July that rose to 3.7 km altitude and drifted S and SW. During 22, 25, and 26 July a total of 17 avalanches descended as far as 1.8 km on the S flank.
Frequent white gas-and-steam emissions continued during August and September, rising 10-450 m above the crater. Incandescent avalanches mainly affected the SW and W flanks and traveled 400-2,300 m from the vent (figure 137). An aerial survey conducted on 10 August was analyzed and reported that estimates of the SW dome volume was 2,764,300 cubic meters and the dome in the main crater was 2,369,800 cubic meters.
Frequent and moderate-power thermal activity continued throughout the reporting period, according to a MIROVA (Middle InfraRed Observation of Volcanic Activity) analysis of MODIS satellite data (figure 138). There was an increase in the number of detected anomalies during mid-May. The MODVOLC thermal algorithm recorded a total of 47 thermal hotspots: six during April, nine during May, eight during June, 15 during July, four during August, and five during September. Some of this activity was captured in infrared satellite imagery on clear weather days, sometimes accompanied by incandescent material on the SW flank (figure 139).
Geologic Background. Merapi, one of Indonesia's most active volcanoes, lies in one of the world's most densely populated areas and dominates the landscape immediately north of the major city of Yogyakarta. It is the youngest and southernmost of a volcanic chain extending NNW to Ungaran volcano. Growth of Old Merapi during the Pleistocene ended with major edifice collapse perhaps about 2,000 years ago, leaving a large arcuate scarp cutting the eroded older Batulawang volcano. Subsequent growth of the steep-sided Young Merapi edifice, its upper part unvegetated due to frequent activity, began SW of the earlier collapse scarp. Pyroclastic flows and lahars accompanying growth and collapse of the steep-sided active summit lava dome have devastated cultivated lands on the western-to-southern flanks and caused many fatalities.
Information Contacts: Balai Penyelidikan dan Pengembangan Teknologi Kebencanaan Geologi (BPPTKG), Center for Research and Development of Geological Disaster Technology (URL: http://merapi.bgl.esdm.go.id/, Twitter: @BPPTKG); MAGMA Indonesia, Kementerian Energi dan Sumber Daya Mineral (URL: https://magma.esdm.go.id/v1); Pusat Vulkanologi dan Mitigasi Bencana Geologi (PVMBG, also known as Indonesian Center for Volcanology and Geological Hazard Mitigation, CVGHM), Jalan Diponegoro 57, Bandung 40122, Indonesia (URL: http://www.vsi.esdm.go.id/); Darwin Volcanic Ash Advisory Centre (VAAC), Bureau of Meteorology, Northern Territory Regional Office, PO Box 40050, Casuarina, NT 0811, Australia (URL: http://www.bom.gov.au/info/vaac/); MIROVA (Middle InfraRed Observation of Volcanic Activity), a collaborative project between the Universities of Turin and Florence (Italy) supported by the Centre for Volcanic Risk of the Italian Civil Protection Department (URL: http://www.mirovaweb.it/); Hawai'i Institute of Geophysics and Planetology (HIGP) - MODVOLC Thermal Alerts System, School of Ocean and Earth Science and Technology (SOEST), Univ. of Hawai'i, 2525 Correa Road, Honolulu, HI 96822, USA (URL: http://modis.higp.hawaii.edu/); Copernicus Browser, Copernicus Data Space Ecosystem, European Space Agency (URL: https://dataspace.copernicus.eu/browser/); Øystein Lund Andersen (URL: https://www.oysteinlundandersen.com/, https://twitter.com/oysteinvolcano).
Ebeko
Russia
50.686°N, 156.014°E; summit elev. 1103 m
All times are local (unless otherwise noted)
Moderate explosive activity with ash plumes continued during June-November 2023
Ebeko, located on the N end of Paramushir Island in Russia’s Kuril Islands just S of the Kamchatka Peninsula, consists of three summit craters along a SSW-NNE line at the northern end of a complex of five volcanic cones. Observed eruptions date back to the late 18th century and have been characterized as small-to-moderate explosions from the summit crater, accompanied by intense fumarolic activity. The current eruptive period began in June 2022, consisting of frequent explosions, ash plumes, and thermal activity (BGVN 47:10, 48:06). This report covers similar activity during June-November 2023, based on information from the Kamchatka Volcanic Eruptions Response Team (KVERT) and satellite data.
Moderate explosive activity continued during June-November 2023 (figures 50 and 51). According to visual data from Severo-Kurilsk, explosions sent ash 2-3.5 km above the summit (3-4.5 km altitude) during most days during June through mid-September. Activity after mid-September was slightly weaker, with ash usually reaching less than 2 km above the summit. According to KVERT the volcano in October and November was, with a few exceptions, either quiet or obscured by clouds that prevented satellite observations. KVERT issued Volcano Observatory Notices for Aviation (VONA) on 8 and 12 June, 13 and 22 July, 3 and 21 August, and 31 October warning of potential aviation hazards from ash plumes drifting 3-15 km from the volcano. Based on satellite data, KVERT reported a persistent thermal anomaly whenever weather clouds permitted viewing.
Geologic Background. The flat-topped summit of the central cone of Ebeko volcano, one of the most active in the Kuril Islands, occupies the northern end of Paramushir Island. Three summit craters located along a SSW-NNE line form Ebeko volcano proper, at the northern end of a complex of five volcanic cones. Blocky lava flows extend west from Ebeko and SE from the neighboring Nezametnyi cone. The eastern part of the southern crater contains strong solfataras and a large boiling spring. The central crater is filled by a lake about 20 m deep whose shores are lined with steaming solfataras; the northern crater lies across a narrow, low barrier from the central crater and contains a small, cold crescentic lake. Historical activity, recorded since the late-18th century, has been restricted to small-to-moderate explosive eruptions from the summit craters. Intense fumarolic activity occurs in the summit craters, on the outer flanks of the cone, and in lateral explosion craters.
Information Contacts: Kamchatka Volcanic Eruptions Response Team (KVERT), Far Eastern Branch, Russian Academy of Sciences, 9 Piip Blvd., Petropavlovsk-Kamchatsky, 683006, Russia (URL: http://www.kscnet.ru/ivs/kvert/).
Search Bulletin Archive by Publication Date
Select a month and year from the drop-downs and click "Show Issue" to have that issue displayed in this tab.
The default month and year is the latest issue available.
Bulletin of the Global Volcanism Network - Volume 29, Number 09 (September 2004)
Managing Editor: Richard Wunderman
Etna (Italy)
New effusive eruption begins on 7 September and spreads to several fissure vents
Kilauea (United States)
June-October 2004 period has lava entering ocean and ample lava flows
Mauna Loa (United States)
Deep, long-period earthquake swarm and contraction in July and August 2004
Montagu Island (United Kingdom)
1 October 2004 satellite image suggests a complex and ongoing eruption
Negra, Sierra (Ecuador)
12 June-29 August 2004, GPS data indicate 77 cm of caldera-floor uplift
Soufriere Hills (United Kingdom)
Generally low activity; small lake forms in summit crater
St. Helens (United States)
New eruption starts suddenly—first dome-growth in 18 years
Etna
Italy
37.748°N, 14.999°E; summit elev. 3357 m
All times are local (unless otherwise noted)
New effusive eruption begins on 7 September and spreads to several fissure vents
At about 1030 on 7 September 2004 a new effusive eruption started from the summit of Mount Etna. A N110°E-trending eruptive fissure about 230 m long opened at the base of the SE Crater without any significant seismic activity. A degassed lava flow poured from the base of the fissure, spreading towards the Valle del Bove. The lava flow had very low output rate (between 0.2 and 0.5 m3/s), and was ~ 1 m thick, 10 m wide, and up to 250 m long. On the morning of 8 September the lava flow appeared to lack new input from its source, but the eruptive fissure continued to advance down slope. These events were not accompanied by seismicity or explosive activity.
After two days of slow expansion of the fracture field, a new effusive vent opened at a lower elevation, 2,650 m, on the upper western flank of the Valle del Bove. This occurred between 0600 and 0700 on 10 September. Lava poured from this vent, spreading over the upper wall of the Valle del Bove. No explosive activity accompanied the emission of lava, but some phreatic explosions were triggered by lava intersecting a thick cover of snow. The lava flow was degassed and flowed out at a rate of about 2-4 m3/s. It spread E to the Serra Giannicola Piccola before splitting in two branches. At about 0930 the longest branch was about 300 m long and 50 m wide. Due to the high slope-angle, the front of the N lava flow breached. Hot blocks rolled down slope, causing the flow front to expand due to the collapse of hot debris rather than by flowage. At 1400 the lowest elevation of the lava flow front was about 2,250 m elevation within the upper Valle del Bove. At that time, no villages were threatened by the lava flows since they had spread out over a deserted zone at least 10 km away from the nearest village.
Activity appeared similar on 14-15 September 2004, when Mike Burton, Enza Longo, and Margherita Polacci had clear views of the Valle Del Bove in fair weather. Their first observations were carried out at the Southeast Crater (SEC), where the team saw a conspicuous plume emitted from a fumarole field on the SEC's SE rim. This activity, not seen prior to the eruption, had been consistently observed during the previous 3-4 days.
A visit to a vent at 2,830 m elevation revealed behavior similar to previous days, consisting of continuous high-pressure degassing in the absence of explosive activity (figure 104). At this vent, in contrast to the one at 2,630 m (which emitted lava), incandescence was limited to a circular zone at the vent area. No recent scoria were observed near the degassing vent. At this degassing vent the peak temperature, measured with a thermal camera, was ~ 900°C (see thermal image, figure 8).
The team also visited the lava flow at 2,630 m (figure 105). Fresh scoria had fallen along the path leading to the lava flow, and samples were collected. The estimated flux rate of the lava flow was between 2 and 4 m3/s, using an estimated flow velocity of 1 m/s, a width of 2 m, and a depth of 1-2 m. Estimates were obtained by observing the lava flow just above the rock island seen in figure 9. This flux was roughly equal to that seen on 13 September.
A pair of hornitos lay up slope of the lava flow originating at 2,630 m elevation. One hornito sat just behind the spot where lava was first observed on the surface. The second hornito was larger and resided about 20-30 m farther up slope (figure 106). It released gas at high pressure, creating noise. No scoria were emitted during their observation.
Polacci and Burton then walked down to the lava flow that began on 13 September (figure 107). The lava flow's flux rate was low. The team estimated an outflow rate of ~ 1 m3/s, using a width of 2 m, a flow velocity of 0.5 m/s, and a depth of 1 m, dimensions noted near the lava flow's source. The lava flow emanated from a small depression; no scoria deposits were seen nearby. GPS established the flow's source at 2,340 m elevation. The team observed several distinct overflows escaping from the principal lava flow, which originated at 2,630 m elevation (figure 108).
Geologic Background. Mount Etna, towering above Catania on the island of Sicily, has one of the world's longest documented records of volcanism, dating back to 1500 BCE. Historical lava flows of basaltic composition cover much of the surface of this massive volcano, whose edifice is the highest and most voluminous in Italy. The Mongibello stratovolcano, truncated by several small calderas, was constructed during the late Pleistocene and Holocene over an older shield volcano. The most prominent morphological feature of Etna is the Valle del Bove, a 5 x 10 km caldera open to the east. Two styles of eruptive activity typically occur, sometimes simultaneously. Persistent explosive eruptions, sometimes with minor lava emissions, take place from one or more summit craters. Flank vents, typically with higher effusion rates, are less frequently active and originate from fissures that open progressively downward from near the summit (usually accompanied by Strombolian eruptions at the upper end). Cinder cones are commonly constructed over the vents of lower-flank lava flows. Lava flows extend to the foot of the volcano on all sides and have reached the sea over a broad area on the SE flank.
Information Contacts: Sonia Calvari, Mike Burton, Enza Longo, and Margherita Polacci, Istituto Nazionale di Geofisica e Vulcanologia (INGV), Piazza Roma 2, 95123 Catania, Italy.
Kilauea (United States) — September 2004 Cite this Report
Kilauea
United States
19.421°N, 155.287°W; summit elev. 1222 m
All times are local (unless otherwise noted)
June-October 2004 period has lava entering ocean and ample lava flows
Scientists at the Hawaiian Volcano Observatory (HVO) noted that throughout June and July 2004, lava from Kīlauea continued to enter the ocean at several points, culminating in several new lava deltas. Some small littoral explosions were reported, but otherwise the ocean entry was passive. Many small lava flows were observed in the area of the ocean entries, on the coastal flat, in the Paliuli area, and in the Kuhio area. Incandescence and some minor spattering was observed at Pu`u `O`o throughout the week. On 13 June, two collapses occurred at Kīlauea's western lava delta, sending sizable chunks of the delta into the sea.
On 14 June, most lava was being supplied to the ocean through lava tubes, but several surface lava flows were visible on the delta and traveling down the old sea cliff behind the Wilipe`a delta. The larger eastern lava delta had several active lava entries into the ocean, mostly larger than those on the western delta. Seismicity at Pu`u `O`o was moderate to high, but the overall seismicity at Kīlauea was low. Several episodes of inflation and deflation were recorded. Relatively large deflation events occurred on 29 June and 11 July, with no obvious accompanying changes in eruptive activity. An episode of deformation consisting of deflation, inflation, then deflation began at Kīlauea on the morning of 27 July. It was accompanied by increased surface activity at several places. During inflation, seismicity greatly increased below Kīlauea's caldera. Field observers reported that deformation may have occurred at the S flank of Pu`u `O`o. Aside from the deflation-inflation-deflation event, seismicity was weak beneath Kīlauea's summit and tremor at Pu`u `O`o was at moderate-to-high levels.
During August and September 2004, no lava entered the sea. Surface lava flows were active on the coastal flat and the Pulama pali fault scarp, and the vents in the crater of Pu`u `O`o were incandescent. Seismicity was weak beneath Kīlauea's summit and tremor was at moderate-to-high levels at Pu`u `O`o. In addition, there were small periods of inflation and deflation. HVO scientists reported that all vents in Pu`u `O`o's crater were incandescent during parts of both August and September.
From 30 September to 18 October 2004, patches of incandescence were visible at the PKK lava flow on the Pulama pali scarp, and all vents in the crater of Pu`u `O`o were incandescent. Seismicity was weak at Kīlauea's summit, with essentially no tremor recorded. An M 4.0 earthquake occurred on 11 October. It was focused ~ 32 km beneath Kīlauea's summit and affected tilt meters. Taking earthquake- and rainfall-induced tilts into account, the volcanic tilt was minor. On 13 October 2004 an M 4.5 earthquake occurred at 1318 ~ 6 km S of Pu`u `O`o at a depth of ~ 9 km. The earthquake permanently offset the Pu`u `O`o tiltmeter and several others on the volcano. Tremor was moderate at Pu`u `O`o. In addition, small amounts of inflation and deflation occurred.
On the morning of 24 October 2004 HVO scientists noted activity at that the three arms of the PKK flow (the Kuhio flow, named for Prince Kuhio Kalaniana`ole). Largest and most vigorous, the W arm descended down to an elevation of ~ 200 m, well out onto the gentle slope below Pulama pali. A series of channels and incandescent fingers were visible along a 600-m-long stretch, and tiny spots marked the upstream course of the arm, roughly following the E side of the Mother's Day flow.
The middle arm had advanced 100-200 m since the previous morning (23 October) and reached down to an elevation of ~ 335 m. It was the smallest of the three active arms.
The E arm was quite active that morning, its front also located on the gentle slope below Pulama pali at ~ 300 m elevation; it was nearly continuously incandescent up to ~ 440 m elevation. The distance between the W and middle arms was about 400 m and between the middle and E arms, about 600 m. These distances changed constantly as flows widen and narrow. Figures 167 and 168 show lava flows since 1983 to aid the reader in locating features discussed in this Bulletin report.
Moderately bright glow came from the 640- to 670-m elevations farther upstream in the PKK flow. All vents in Pu`u `O`o's crater were incandescent on 24 October, creating a glow visible from several distant places. Seismicity was weak at Kīlauea's summit, with essentially no tremor recorded. Tremor was moderate at Pu`u `O`o. Kīlauea's summit deflated moderately during 23 October and then took a plunge during the middle of the night. It lost about 0.3 microradians before the plunge began just before midnight, and it lost another 0.5 microradians thereafter. Pu`u `O`o, too, was deflating rapidly, shifting up and down a little but maintaining an overall flat tilt until the plunge began. It also lost about 0.5 microradians after midnight.
Geologic Background. Kilauea overlaps the E flank of the massive Mauna Loa shield volcano in the island of Hawaii. Eruptions are prominent in Polynesian legends; written documentation since 1820 records frequent summit and flank lava flow eruptions interspersed with periods of long-term lava lake activity at Halemaumau crater in the summit caldera until 1924. The 3 x 5 km caldera was formed in several stages about 1,500 years ago and during the 18th century; eruptions have also originated from the lengthy East and Southwest rift zones, which extend to the ocean in both directions. About 90% of the surface of the basaltic shield volcano is formed of lava flows less than about 1,100 years old; 70% of the surface is younger than 600 years. The long-term eruption from the East rift zone between 1983 and 2018 produced lava flows covering more than 100 km2, destroyed hundreds of houses, and added new coastline.
Information Contacts: Hawaiian Volcano Observatory (HVO), U.S. Geological Survey, PO Box 51, Hawaii National Park, HI 96718, USA (URL: https://volcanoes.usgs.gov/observatories/hvo/).
Mauna Loa (United States) — September 2004 Cite this Report
Mauna Loa
United States
19.475°N, 155.608°W; summit elev. 4170 m
All times are local (unless otherwise noted)
Deep, long-period earthquake swarm and contraction in July and August 2004
After a swarm of deep earthquakes centered just S of Mauna Loa's summit caldera in late April 2002, seismicity remained barely elevated until July 2004. In other words, seismicity during late April 2002-July 2004 stood far lower than it did in the months prior to the 1975 and 1984 eruptions.
Starting in July 2004, a swarm of small (M < 3), deep (> 40 km), mostly long-period (LP) earthquakes occurred just S of the caldera and adjacent areas. Neither the depth nor the magnitude of the earthquakes changed significantly. Through 13 October 2004 more than 730 related earthquakes occurred beneath the summit caldera and the adjacent part of the SW rift zone.
The location and magnitude of earthquakes making up the recent swarm (seismicity from 24 April-15 October 2004, a 6-month interval) are shown in figure 23. Such a concentration of deep LP earthquakes from this part of Mauna Loa was unprecedented in the modern earthquake record dating back to the 1960s. In contrast, more typical seismicity over a 6-month period at Mauna Loa is shown in a figure in a previous issue (BGVN 27:09). By comparison to the interval 24 April-15 October 2004, earthquakes in a typical 6 month interval are relatively sparse.
Inflation continued at the summit through the start of the earthquake swarm. In late August 2004, however, distances across the summit caldera began to contract significantly, apparently caused by the center of inflation shifting slightly to the S, rather than by deflation. This was the first contraction since inflation started in late April or early May 2002. Toward the end of September, the contraction ended and the line once again began to lengthen. During 2004, the inflation had been at a fairly steady to slightly increasing rate until the contraction in late August. When present, the lengthening, uplift, and tilting were taken to indicate swelling of the magma reservoir within the volcano.
Geologic Background. Massive Mauna Loa is a basaltic shield volcano that rises almost 9 km from the ocean floor to form the world's largest Holocene volcano. Flank eruptions typically occur from the lengthy NE and SW rift zones, and from the Moku'aweoweo summit is caldera, which is within an older and larger 6 x 8 km caldera. Two of the youngest large debris avalanches documented in Hawaii traveled nearly 100 km from Mauna Loa; the second of the Alika avalanches was emplaced about 105,000 years ago (Moore et al., 1989). Almost 90% of the surface of the volcano is covered by lavas less than 4,000 years old (Lockwood and Lipman, 1987). Beginning about 1,500 years ago, a series of voluminous overflows from a summit lava lake covered about 25% of the volcano's surface. Over the last 750 years, from shortly after the formation of Moku'aweoweo caldera until the present, an additional 25% of the volcano has been covered with lava flows, mainly from summit and NW rift zone vents.
Information Contacts: Hawaiian Volcano Observatory (HVO), U.S. Geological Survey, PO Box 51, Hawaii National Park, HI 96718, USA (URL: https://volcanoes.usgs.gov/observatories/hvo/).
Montagu Island (United Kingdom) — September 2004 Cite this Report
Montagu Island
United Kingdom
58.445°S, 26.374°W; summit elev. 1370 m
All times are local (unless otherwise noted)
1 October 2004 satellite image suggests a complex and ongoing eruption
A high-resolution image of Montagu island and volcano of the same name suggests the earlier recognized, ongoing eruption (BGVN 28:02; v. 29, no. 1 ) continued through at least 1 October 2004. On a NASA website, scientist James Garvin posted an image of the 1 October scene (figure 7). Imagery taken prior to late 2001 showed the island as entirely white. The new image deserves and requires considerable study, but some initial observations from James Garvin and Bulletin editors follow.
The 1 October 2004 image shows the N flank of the central cone, Mount Belinda, emitting a NNE-drifting steam plume. Much of Montagu island sat amid a mosaic of floating ice. In contrast, on the previous image taken 7 December 2003 (BGVN 29:01), icebergs were sparse. Several square kilometers of sea ice on the island's lower right appears comparatively coherent and tightly butted against the island's margin. These changes may reflect sea-ice abundance during the S-hemisphere winter.
In addition, the higher detail in the new higher resolution image portrays a variety of patterns and features of volcanological significance that were absent or at least less clearly visible on earlier images. In the new image, the area of apparently continuous lava flows seems to have reached the island's N margin (a distance of ~ 3 km). On the 7 December 2003 image these flows had reached little more than 1 km in length and were considerably narrower, and stood alongside broad, dark swaths of SE- to E-directed ash deposits (BGVN 29:01). These latter ash deposits have become less apparent on the newer image, conceivably due to cover beneath winter's snowfall.
The newer image depicts the S-flank's upper slopes as containing much broader areas of darkened snow and ice. Some of the sea ice N of the previously mentioned lava flows also appears darkened. To the S of the Belinda summit lies a previously unseen, sinuously shaped 'beard,' presumably composed of darkened snow. Another newly visible feature, the black area to the NNW (upper left), presumably reveals lava flows emerging from beneath the ice. This zone of lava flows resides without clear connection to the conspicuous, larger, previously mentioned one flowing from higher up-slope. The black area to the NNW may thus be a new vent area. Alternatively, the black area may represent the spot where a longer sub-glacial lava flow transited some unknown distance beneath the ice and here melted its way to the surface. Another such area may reside on the NNE flanks, midway from the summit area and the coast. On the island's W (left) side exists a newly imaged network of broken ice. It could suggest an episode of fresh crevassing there.
Although the version shown in figure 7 has reduced resolution for print and web distribution, the full-resolution version of the IKONOS color image distributed by NASA has a resolution of 4 m per pixel and another version, 1 m per pixel (creating a 3.20 Mb image). James Garvin noted that dynamic processes such as those on remote, uninhabited islands, can be monitored from orbit, thereby serving to target more intensive field studies when they are justified. As such, IKONOS imaging of localities such as active eruptions involving ice-lava interactions, represents a new form of scientific exploration of planet Earth. The eruption has produced a 'natural laboratory' for studying lava-ice interactions relevant to the biology of extreme environments as well as to processes believed to be important on the planet Mars.
The IKONOS earth-imaging satellite launched in September 1999. IKONOS includes optical, radar, and infrared sensors. These can be combined in a variety of ways to accommodate a wide range of imagery applications (including stereo images).
Geographic terminology. The nomenclature of volcanic features on Montagu Island, particularly in regard to Mount Belinda, has been quite variable. Although the name Montagu has been applied to the major volcanic edifice forming the island (LeMasurier and Thomson, 1990), the name Mount Belinda has been variously applied to the entire volcano, the currently active young cone on the northern side of the island, the 6-km-wide summit caldera, and a peak on the southern caldera rim that is the island's high point. In consultation with John Smellie of the British Antarctic Survey, we have used Montagu to refer to the volcano forming the island and Mount Belinda for the currently active cone.
Reference. LeMasurier, W.E., and Thomson, J.W. (eds.), 1990, Volcanoes of the Antarctic Plate and Southern Oceans: Washington, D C: American Geophysical Union, 487 p.
Geologic Background. The largest of the South Sandwich Islands, Montagu consists of a massive shield volcano cut by a 6-km-wide ice-filled summit caldera. The summit of the 11 x 15 km island rises about 3,000 m from the sea floor between Bristol and Saunders Islands. Around 90% of the island is ice-covered; glaciers extending to the sea typically form vertical ice cliffs. The name Mount Belinda has been applied both to the high point at the southern end of the summit caldera and to the young central cone. Mount Oceanite, an isolated peak at the SE tip of the island, was the source of lava flows exposed at Mathias Point and Allen Point. There was no record of Holocene activity until MODIS satellite data, beginning in late 2001, revealed thermal anomalies consistent with lava lake activity. Apparent plumes and single anomalous pixels were observed intermittently on AVHRR images from March 1995 to February 1998, possibly indicating earlier volcanic activity.
Information Contacts: James B. Garvin, National Aeronautics and Space Administration (NASA), Goddard Space Flight Center (GSFC), Code 921, Greenbelt, MD 20771, USA (URL: https://earthobservatory.nasa.gov/); John Smellie, British Antarctic Survey, Natural Environment Research Council, High Cross, Madingly Road, Cambridge CB3 0ET, United Kingdom (URL: https://www.bas.ac.uk/).
Sierra Negra (Ecuador) — September 2004 Cite this Report
Sierra Negra
Ecuador
0.83°S, 91.17°W; summit elev. 1124 m
All times are local (unless otherwise noted)
12 June-29 August 2004, GPS data indicate 77 cm of caldera-floor uplift
Sierra Negra volcano contains a six-station, continuously monitored GPS network. The instruments were installed in collaboration with a research consortium (UNAVCO) in May 2002 (figure 2).
Starting on 12 June 2004 and continuing through at least 29 August 2004, the rate of uplift of the caldera floor, as measured by this network, had accelerated to 77 cm/year (table 1). This rate was comparable to that inferred from InSAR data in the late 1990s (Amelung and others, 2000). That late 1990's uplift was attributed to trap-door faulting of the caldera floor along its southern margin, a process presumably driven by a shallow (< 2 km) intrusion of magma. Deflation occurred during 2001-2002, and slower uplift of about 12 cm/y prevailed during March 2003-May 2004 (table 1). The 12 June-29 August interval was noteworthy for the high rates of uplift (table 1).
Table 1. A summary of the geophysically derived movement of the caldera floor at Sierra Negra. Courtesy of Dennis Geist, William Chadwick, and Dan Johnson.
| Interval |
Comments |
Measurement Technique |
| 1992-1998 |
240 cm of uplift punctuated by trapdoor uplift in 1997 or 1998 |
InSAR (Amelung and others, 2000) |
| 1998-1999 |
Inflation at 65 cm/year |
InSAR (Amelung and others, 2000) |
| 2000-2001 |
Deceleration of uplift to 7 cm/year |
Campaign GPS (Geist and others, submitted) |
| 2001-Feb 2003 |
Deflation of ~9 cm/year |
Campaign and continuous GPS |
| Mar 2003-May 2004 |
Inflation at ~12 cm/year |
Continuous GPS |
| 12 Jun-29 Aug 2004 |
Inflation at 77 cm/year |
Continuous GPS |
The Instituto Geofísico in Quito, Ecuador monitors seismic activity in the Galápagos, using a network that includes a single station on Sierra Negra. Unfortunately, that network was down for the past year, in need of a variety of hardware, including the seismometer at Sierra Negra. Thus, for the interval of interest, seismic data were absent. Hugo Yepes estimated that to repair the Galápagos system would require about $9,000 (USD) in equipment and $4,000 (USD) in personnel transport and field expenses. He also said that the region requires more stable long-term logistical support.
The 12 June-29 August 2004 uplift was symmetrical about the caldera's center. The pattern and rate of uplift was well modeled as a 2.1 km deep sill intruded by about 12 x 106 m3 of magma since June 2004.
Sierra Negra last erupted in 1979, when nearly 1 km3of lava erupted from a circumferential fissure near the summit, covering its N flank./p>
References. Amelung, F., Jonsson, S., Zebker, H., Segall, P., 2000. Widespread uplift and "trapdoor" faulting on Galápagos volcanoes observed with radar interferometry. Nature 407, 993-998.
Geist, D., Chadwick, W.W., and Johnson, D., Results from new GPS and gravity monitoring networks at Fernandina and Sierra Negra volcanoes, Galápagos, 2000-2002 (submitted to the Journal of Volcanology and Geothermal Research in 2004).
Geologic Background. The broad shield volcano of Sierra Negra at the southern end of Isabela Island contains a shallow 7 x 10.5 km caldera that is the largest in the Galápagos Islands. Flank vents abound, including cinder cones and spatter cones concentrated along an ENE-trending rift system and tuff cones along the coast and forming offshore islands. Although it is the largest of the five major Isabela volcanoes, it has the flattest slopes, averaging less than 5° and diminishing to 2° near the coast. A sinuous 14-km-long, N-S-trending ridge occupies the west part of the caldera floor, which lies only about 100 m below its rim. The Volcán de Azufre fumarolic area lies within a graben between this ridge and the west caldera wall. Lava flows from a major eruption in 1979 extend all the way to the north coast from circumferential fissure vents on the upper northern flank.
Information Contacts: Dennis J. Geist, Department of Geological Sciences, University of Idaho, Moscow, Idaho 83844-3022 USA; William W. Chadwick, Jr., Cooperative Institute for Marine Resources Studies (CIMRS), NOAA Pacific Marine Environmental Laboratory (PMEL), 2115 SE OSU Drive, Newport, OR 97365 USA; Daniel J. Johnson, University of Puget Sound, Department of Geology, 1500 N. Warner, Tacoma, WA 98416, USA; Hugo Yepes, Geophysical Institute (IG), Escuela Politécnica Nacional, Apartado 17-01-2759, Quito, Ecuador (URL: http://www.igepn.edu.ec/).
Soufriere Hills (United Kingdom) — September 2004 Cite this Report
Soufriere Hills
United Kingdom
16.72°N, 62.18°W; summit elev. 915 m
All times are local (unless otherwise noted)
Generally low activity; small lake forms in summit crater
According to reports issued by the Montserrat Volcano Observatory (MVO), activity at Soufrière Hills volcano remained low during 21 May-10 September 2004, becoming slightly elevated from 10 September-15 October 2004. Minor events during this period included mudflows, rockfalls, and several small, shallow earthquakes originating at upper regions of the lava dome and conduit.
On 21 May 2004, heavy rainfall caused large mudflows for about two hours (1420 to 1636). The mudflows traveled into the Belham Valley, an area within the exclusion zone on the volcano's NW side, flooding the entire width of the valley floor at Belham bridge. Scientists from MVO noted that at the peak of flow, standing waves of mud reached 2 m high. Intense rains on 25 July, 14 September, and 16 September again caused up-slope erosion and mudflows descended into the Belham Valley.
Surface water from the intense rain of 21 May percolated into the subsurface of the hot dome and vent complex, converting into steam. Steam venting may have initiated the 44 mixed earthquakes recorded the week of 21-28 May (table 56). The earthquakes were short in duration (~ 30 seconds each), and their amplitude decay characteristics suggested that they originated at shallow depths within the remnant dome and at the top of the conduit. The term 'remnant dome' refers to the fact that the late May 2004 dome was considerably reduced in size compared to the dome of about a year before, in large part because of major collapse events on 12 July 2003 and 3 March 2004.
Table 56. Seismicity recorded at Soufrière Hills, 21 May to 15 October 2004. Courtesy of Montserrat Volcano Observatory.
| Date |
Activity Level |
Hybrid |
Mixed |
Volcano-tectonic |
Long-period |
Rockfall |
| 21 May-28 May 2004 |
Low |
7 |
44 |
-- |
-- |
-- |
| 28 May-04 Jun 2004 |
Low |
4 |
16 |
-- |
-- |
-- |
| 04 Jun-11 Jun 2004 |
Low |
3 |
9 |
-- |
-- |
-- |
| 11 Jun-18 Jun 2004 |
Low |
5 |
-- |
-- |
-- |
10 |
| 18 Jun-25 Jun 2004 |
Low |
5 |
-- |
6 |
-- |
15 |
| 25 Jun-02 Jul 2004 |
Low |
5 |
-- |
6 |
2 |
8 |
| 02 Jul-09 Jul 2004 |
Low |
8 |
-- |
4 |
-- |
10 |
| 09 Jul-16 Aug 2004 |
Low |
6 |
-- |
1 |
1 |
5 |
| 16 Jul-23 Jul 2004 |
Low |
7 |
-- |
-- |
-- |
7 |
| 23 Jul-30 Jul 2004 |
Low |
2 |
-- |
-- |
-- |
8 |
| 30 Jul-06 Aug 2004 |
Low |
1 |
-- |
-- |
-- |
8 |
| 06 Aug-13 Aug 2004 |
Low |
1 |
-- |
-- |
-- |
3 |
| 13 Aug-20 Aug 2004 |
Low |
1 |
-- |
1 |
-- |
1 |
| 20 Aug-27 Aug 2004 |
Low |
1 |
-- |
-- |
-- |
1 |
| 27 Aug-03 Sep 2004 |
Low |
2 |
-- |
-- |
-- |
-- |
| 03 Sep-10 Sep 2004 |
Low |
-- |
-- |
1 |
-- |
2 |
| 10 Sep-17 Sep 2004 |
slightly elevated |
14 |
-- |
-- |
1 |
1 |
| 17 Sep-24 Sep 2004 |
slightly elevated |
8 |
-- |
-- |
2 |
2 |
| 24 Sep-01 Oct 2004 |
slightly elevated |
8 |
-- |
-- |
1 |
3 |
During 18-25 June, winds blew the volcanic plume NE, and the clouds over the volcano's summit lifted, making the tallest remnants of the dome complex visible for the first time since 7 May. Observers noted a loss of material from the upper regions of the dome due to rockfalls.
Later, on 30 August, MVO personnel on an observation flight discovered a small brown pond within the dome complex (figure 5). This pond was the first seen on the volcano since the beginning of its eruption in 1995. The pond lies in a small crater formed by an explosion and dome collapse on 3 March 2004 (figure 57). It probably developed following the cooling of deposits within the crater, and after recent heavy rainfall.
Sulfur dioxide (SO2) emissions typically remained low throughout the period. Measured fluxes ranged between about 90 and 1,100 metric tons per day (table 57). Moderate fluctuations occurred during 21-24 May (225-922 metric tons/day) and 7-11 June (169-788 metric tons/day). During 2-9 July, SO2 emissions dropped to the lowest levels since the collapse event of 12-13 July 2003, and fell even lower during the weeks of 30 July and 17 September.
Table 57. SO2 gas flux estimates made at Soufrière Hills, 21 May to 15 October 2004. Courtesy of Montserrat Volcano Observatory.
| Date |
SO2 emissions (tons/day) |
| 21 May-28 May 2004 |
225-922 |
| 28 May-04 Jun 2004 |
179-496 |
| 04 Jun-11 Jun 2004 |
169-788 |
| 11 Jun-18 Jun 2004 |
240-477 |
| 18 Jun-25 Jun 2004 |
-- |
| 25 Jun-02 Jul 2004 |
177-364 |
| 02 Jul-09 Jul 2004 |
120-160 |
| 09 Jul-16 Aug 2004 |
222-243 |
| 16 Jul-23 Jul 2004 |
170-400 |
| 23 Jul-30 Jul 2004 |
175-300 |
| 30 Jul-06 Aug 2004 |
90-280 |
| 06 Aug-13 Aug 2004 |
126-296 |
| 13 Aug-20 Aug 2004 |
200-622 |
| 20 Aug-27 Aug 2004 |
175-311 |
| 27 Aug-03 Sep 2004 |
240-456 |
| 03 Sep-10 Sep 2004 |
175-405 |
| 10 Sep-17 Sep 2004 |
130-250 |
| 17 Sep-24 Sep 2004 |
87-454 |
| 24 Sep-01 Oct 2004 |
200-540 |
| 01 Oct-08 Oct 2004 |
187-1144 |
| 08 Oct-15 Oct 2004 |
156-553 |
Measurements of expansion made by dilatometers embedded on either side of the Soufriere Hills edifice suggested that in July, the volcano changed from contraction to slight expansion.
Geologic Background. The complex, dominantly andesitic Soufrière Hills volcano occupies the southern half of the island of Montserrat. The summit area consists primarily of a series of lava domes emplaced along an ESE-trending zone. The volcano is flanked by Pleistocene complexes to the north and south. English's Crater, a 1-km-wide crater breached widely to the east by edifice collapse, was formed about 2000 years ago as a result of the youngest of several collapse events producing submarine debris-avalanche deposits. Block-and-ash flow and surge deposits associated with dome growth predominate in flank deposits, including those from an eruption that likely preceded the 1632 CE settlement of the island, allowing cultivation on recently devegetated land to near the summit. Non-eruptive seismic swarms occurred at 30-year intervals in the 20th century, but no historical eruptions were recorded until 1995. Long-term small-to-moderate ash eruptions beginning in that year were later accompanied by lava-dome growth and pyroclastic flows that forced evacuation of the southern half of the island and ultimately destroyed the capital city of Plymouth, causing major social and economic disruption.
Information Contacts: Montserrat Volcano Observatory (MVO), Fleming, Montserrat, West Indies (URL: http://www.mvo.ms/).
St. Helens (United States) — September 2004 Cite this Report
St. Helens
United States
46.2°N, 122.18°W; summit elev. 2549 m
All times are local (unless otherwise noted)
New eruption starts suddenly—first dome-growth in 18 years
After a hiatus of over 13 years, following phreatic eruptions during November 1990 to February 1991, a new eruption began in the crater at Mount St. Helens. Some shallow seismicity preceded the eruption, but this came only 9 days prior to the first ash emission. There was no progression of deep earthquakes propagating upward with time during the preceding months. Also apparently absent were other classical monitored parameters (deformation, gas emissions, geochemical or thermal anomalies) that could help foretell of an eruption several weeks or months ahead.
The eruption extruded a two-pyroxene, hornblende dacite of low vesicularity. The initial extrusions and uplift affected the S dome area and adjacent crater floor to the S. The intrusion included uplift and deformation of glacial ice, as well as some melting of ice, forming a small, short-lived bubbling lake (nicknamed 'the Jacuzzi') and a minor lahar out of the crater.
This report discusses the first 16 days of the eruption, from the first sign, shallow earthquakes, which began on 23 September 2004. This report was chiefly put together from reports posted by the Cascades Volcano Observatory (CVO), but also benefitted from personal communications with James Quick, Marianne Guffanti (both at USGS, Reston, Virginia), and James Vallance (USGS-CVO).
Synopsis. A photograph of the scene several weeks before the eruption came from climbers on the S rim. They visited during the last week of August 2004, a time when all still seemed quiet (figure 46). A chronology of events in the first 16 days (table 4) includes the dates and times of the events, the hazard status to people on the ground and to aviation traffic, and some brief comments on the seismicity and volcanism taking place.
Table 4. A simplified chronology of the events at Mt. St. Helens from 23 September to 8 October 2004. Taken from material posted by the Cascades Volcano Observatory.
| Day |
Date |
Hazard Status |
Comment |
| DAY 1-3 |
23-25 Sep 2004 |
None posted |
Swarm of small, shallow earthquakes (less than M 1) began on morning of the 23rd, peaked mid-day on the 24th, then declined through the afternoon of the 25th. |
| DAY 4 |
26 Sep 2004 |
1 - Notice (green) |
Seismicity increased; ten M 2-2.8 events; volcanic unrest at 1500 hours. First Yellow alert since Oct. 1986. |
| DAY 7 |
29 Sep 2004 |
2 - Advisory (yellow) |
Higher advisory issued at 1040 hours. |
| DAY 8 |
30 Sep 2004 |
2 - Advisory (yellow) |
Deformation S of dome; fissures on ~200 m of ice. |
| DAY 9 |
01 Oct 2004 |
2 - Advisory (yellow) |
Ash emission rose to 3 km altitude. |
| DAY 10 |
02 Oct 2004 |
3 - Alert (red) |
Increased fumaroles, CO2 and H2S detected. |
| DAY 11 |
03 Oct 2004 |
3 - Alert (red) |
Tremor episode; no eruptive plume. Continued detection of CO2 and H2S. Small steam and ash emission with plume to the crater rim. Temporary flight restriction within 9 km radius of summit. |
| DAY 12 |
04 Oct 2004 |
3 - Alert (red) |
Large-scale glacial uplift. Steam and ash emission with plume to 3 km. |
| DAY 13 |
05 Oct 2004 |
3 - Alert (red) |
Most vigorous ash/steam emission from both vent areas. Ash to 5 km. |
| DAY 14 |
06 Oct 2004 |
2 - Advisory (yellow) |
Seismicity and tremor low. |
| DAY 15 |
07 Oct 2004 |
2 - Advisory (yellow) |
Seismic activity low. Weak puffs of steam and a new vigorously erupting vent were observed. |
| DAY 16 |
08 Oct 2004 |
2 - Advisory (yellow) |
Light seismic activity continued (1-2 events/hour; largest ~M 1.5). |
The CVO website contains a complete discussion of the 3-level hazard-status scheme used there during this reporting interval. In brief form, the status rises from 1 - Notice, to 2 - Advisory, to 3 - Alert. (These are short-hand for Notice of Volcanic Unrest: Alert Level One, Volcano Advisory: Alert Level Two, and Volcano Alert: Alert Level Three.) These respective levels of hazard status correspond to an informal color code, rising from green, to yellow, to red (shown in parentheses on table 1). A type of announcement, the Information Statement, discusses events that are unusual or short-lived, or both. On days 1-3, at the start of this crisis, a specific volcanic hazard was not specified.
Description of activity. At about 0200 on the morning of 23 September 2004, an earthquake swarm began at Mount St. Helens. Through 1700 hours on that date about 200 small (less than M 1) earthquakes had been located at the volcano, and many smaller events were recorded throughout the morning. The earthquakes occurred at shallow depths (less than 1 km) mostly under the lava dome that formed between 1980 and 1986.
Such earthquakes are common for the volcano. But a swarm with this many earthquakes has not been recorded for several years. The most recently case was on 3-4 November 2001. By 25 September 2004 seismicity had declined significantly. However it remained elevated above background. On 26 September the character of the swarm changed to include more than ten larger earthquakes (M 2-2.8), the most in a 24-hour period since the eruption of October 1986. Some of the earthquake types suggested pressurized fluids (water and steam) or perhaps magma. As a consequence, CVO and the University of Washington's Pacific Northwest Seismograph Network released the first Notice of Volcanic Unrest at this site in 18 years. The earthquakes occurred at shallow depths (less than 2 km) below the 1980-1986 lava dome.
On 27 September seismicity increased very slowly throughout the day. All earthquake locations were still shallow and beneath the dome. The largest earthquake recorded in the prior 24 hours was about M 1.5. Preliminary results from a gas flight late in the afternoon of 27 September did not indicate any magmatic gas.
Throughout the day of 28 September seismic activity remained at a fairly constant, but high rate of about two small (less than M 2) earthquakes per minute. All earthquake locations were still shallow and in or below the lava dome. That night seismic activity increased significantly. Throughout the day the seismicity remained elevated at 3-4 events per minute. A number of these events were between M 2 and 3. All earthquakes remained in or below the dome. By 30 September and 1 October the seismicity level had increased slightly, including events as large as M 3.3.
Around noon on 1 October a small 25-minute-long eruption occurred from a vent just S of the lava dome. The vent opened in a portion of the glacier that had become increasingly crevassed and uplifted over the past few days. The eruption sent a steam and minor ash plume to an altitude of about 3 km that drifted SW, accompanied by minor, local ashfall. Seismicity dropped several hours after the eruption, but gradually increased with earthquakes (maximum M 3) occurring 1- to 2-times per minute.
A 40-minute steam-and-ash emission started on 2 October at 0943. Steam clouds carrying minor ash billowed out of the crater to an altitude of 3 to 4 km. The emission occurred during a time of gradually increasing seismicity, which dropped slightly after the emission, but continued to increase gradually through the afternoon. CVO's preliminary reports indicated that despite this increase, the event did not generate diagnostic earthquakes or explosion signals. Scientists inferred that hot rock was pushed up into the glacier, which then melted ice and generated the steam.
An interval of tremor lasting 50 minutes occurred immediately after a small steam emission at 1215 on 2 October. When the tremor stopped, the seismic character changed back to the earlier mode with shallow earthquakes under about maximum magnitude M 3 occurring 1- to 2-times per minute. Another period of smaller steam and ash bursts occurred between 1410 and 1440. Visual observations showed that the area of uplift, which includes part of the glacier and a nearby segment of the S flank of the lava dome, continued to rise. Part of the vent for the steam and ash emissions of the past few days was discovered to be covered by a boiling lake.
A gas flight on 3 October found slightly lower concentrations of carbon dioxide. On the other hand, for the first time hydrogen sulfide was detected. The 4 October gas flight detected carbon dioxide, often in association with hydrogen sulfide and occasional sulphur dioxide.
On 5 October at 0943 a 30-minute-long steam-and-ash emission started, and at 1410 a 10-minute-long steam-and-ash emission began. Ashfall on roads SE of the volcano achieved a maximum thickness of 0.2 mm at 8 km from the source. Neither emissions generated diagnostic earthquakes or explosion signals. As on 4 October, steam and ash emissions were associated with sightings of a bubbling lake. After the 4 October emissions, earthquake energy slowly increased to previous high values.
On 5 October continued uplift included part of the glacier and a nearby segment of the dome's S flank. Cracks opened in the dome. Portions of the cracks reached temperatures of 40-50°C (above ambient temperatures at the dome and glacier's surface, but far below the minimum magmatic temperature of ~ 800°C). Rocks avalanched off the dome, falling into the lake and onto the S crater floor. The dome's N flank appeared thermally stable.
The most vigorous steam and ash emission of the reporting period began on 5 October amid an interval with high seismicity shortly after 0900. Steam clouds billowed from the crater for over an hour, with variable ash content. For the first time, the ash content was sufficient to be detected by National Weather Service Doppler Radar. Steam and ash clouds reached about 3 km high and drifted NNE. A light dusting of ash fell in Morton, Randle, and Packwood, Washington, towns about 50 km from the volcano. Seismicity dropped during the emission and stayed relatively low the next day.
On 6 October the low-level tremor observed following the eruption gradually declined. Brief crater observations from Coldwater Visitor Center noted weak steam emissions. Small lahars from the crater traveled N onto the pumice plain during a rainstorm in the early morning of 6 October. Lahars flowed a short distance toward both Spirit Lake and the North Fork of the Toutle river.
The GPS station on the dome's N flank showed a trend of northward displacement totaling 2 cm over the last three days. This is the same sense of movement recorded by the nearby station that was destroyed by the first steam-and-ash emission on 1 October. In contrast, GPS instruments on the outer flanks of the volcano showed no movement.
Additional analysis based on lidar (LIght Detection And Ranging) and photographs of the intensely uplifting area suggested that the total volume change represented by the deformation between late September and 6 October was about 16-20 million cubic meters. The average rate of change was about 2 million cubic meters per day. If this value represents the rate of intrusion of magma into shallow levels of the dome and underlying crater floor, or both, it was an intrusion rate about twice that measured during dome-building eruptions at Mount St. Helens in the 1980s.
The 7 October report noted that a new steam vent opened overnight to join the two that had been present for several days. Steaming from the vents generated a cloud that rose above the lava dome's S side and extended toward the crater rim. Seismic activity was low to moderate with earthquakes of M 1 to 2 occurring about once per minute. Seismicity increased slightly during 7 October. Earthquakes up to M 1 occurred at a rate of ~ 1-1.5 per minute.
Reports issued on 8 October noted seismic activity continued to be low to moderate. Earthquakes occurred at a rate of 1 to 2 per minute with the largest magnitudes about M 1.5. That day field crews reported that there had not been noticeable additional uplift of the S part of the dome and adjacent glacier in the past 24 hours. Measurements from the recent photographs and lidar showed that the intensely deformed and uplifted area on the S side of the lava dome was then about 400 m (N-S) x 500 m (E-W) with a maximum uplift of about 100-130 m.
Seismicity rose gradually for most of 8 October and leveled off overnight. Earthquakes of M 2.4 occurred about once every two minutes. During 10 October seismicity decreased slightly, to levels similar to those observed during the evening hours of 7 October. Earthquakes of 1.0 M or less continued to occur at a rate of about 1 per minute, but most had magnitudes of M 1.0 or less.
On 12 October seismicity remained low. Small earthquakes (maximum about M 1) continued to occur every 5-10 minutes. Thermal imaging around 12 October of the W part of the uplifting area revealed temperatures of 500-600°C, by far the highest yet reported. They were greatest on a large pinkish-gray fin of rock and in nearby fumaroles and cracks. These observations were consistent with new lava having reached the ground surface. Later sampling of adjacent fresh talus using a metal trash can on a line below a helicopter confirmed it's dacitic composition.
Aviation advisories. The Washington VAAC issued advisories beginning on 29 September. Between then and through 8 October, they issued 23 Volcanic Ash Advisories. Some of these were also 'volcano watches.' Most of these were cautionary in nature, and actual plumes were generally minor, frequently steam dominated rather than heavily ash laden.
Geologic Background. Prior to 1980, Mount St. Helens was a conical volcano sometimes known as the Fujisan of America. During the 1980 eruption the upper 400 m of the summit was removed by slope failure, leaving a 2 x 3.5 km breached crater now partially filled by a lava dome. There have been nine major eruptive periods beginning about 40-50,000 years ago, and it has been the most active volcano in the Cascade Range during the Holocene. Prior to 2,200 years ago, tephra, lava domes, and pyroclastic flows were erupted, forming the older edifice, but few lava flows extended beyond the base of the volcano. The modern edifice consists of basaltic as well as andesitic and dacitic products from summit and flank vents. Eruptions in the 19th century originated from the Goat Rocks area on the N flank, and were witnessed by early settlers.
Information Contacts: Cascades Volcano Observatory (USGS/CVO), U.S. Geological Survey, 1300 SE Cardinal Court, Building 10, Suite 100, Vancouver, WA 98683-9589, USA (URL: https://volcanoes.usgs.gov/observatories/cvo/); Pacific Northwest Seismograph Network (PNSN), Seismology Lab, University of Washington, Department of Earth and Space Sciences, Box 351310, Seattle, WA 98195-1310, USA (URL: http://www.pnsn.org/); Ivan Savov, Department of Mineral Sciences, National Museum of Natural History, Smithsonian Institution, Washington, DC 20560-0119, USA; Washington Volcanic Ash Advisory Center (VAAC), Satellite Analysis Branch (SAB), NOAA/NESDIS E/SP23, NOAA Science Center Room 401, 5200 Auth Road, Camp Springs, MD 20746, USA (URL: http://www.ospo.noaa.gov/Products/atmosphere/vaac/).