Recently Published Bulletin Reports
Erebus (Antarctica) Lava lake remains active; most thermal alerts recorded since 2019
Rincon de la Vieja (Costa Rica) Frequent phreatic explosions during July-December 2023
Bezymianny (Russia) Explosion on 18 October 2023 sends ash plume 8 km high; lava flows and incandescent avalanches
Kilauea (United States) Low-level lava effusions in the lava lake at Halema’uma’u during July-December 2022
Nyamulagira (DR Congo) Lava flows and thermal activity during May-October 2023
Bagana (Papua New Guinea) Explosions, ash plumes, ashfall, and lava flows during April-September 2023
Mayon (Philippines) Lava flows, pyroclastic flows, ash emissions, and seismicity during April-September 2023
Nishinoshima (Japan) Eruption plumes and gas-and-steam plumes during May-August 2023
Krakatau (Indonesia) White gas-and-steam plumes and occasional ash plumes during May-August 2023
Villarrica (Chile) Strombolian activity, gas-and-ash emissions, and crater incandescence during April-September 2023
Merapi (Indonesia) Frequent incandescent avalanches during April-September 2023
Ebeko (Russia) Moderate explosive activity with ash plumes continued during June-November 2023
Erebus (Antarctica) — January 2024  Cite this Report
Erebus
Antarctica
77.53°S, 167.17°E; summit elev. 3794 m
All times are local (unless otherwise noted)
Lava lake remains active; most thermal alerts recorded since 2019
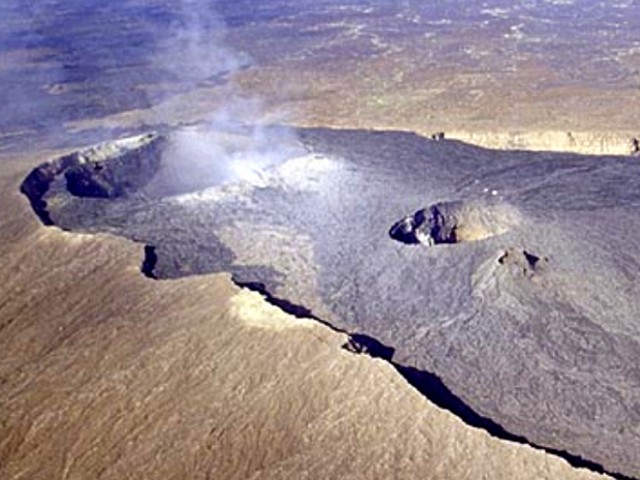
The lava lake in the summit crater of Erebus has been active since at least 1972. Located in Antarctica overlooking the McMurdo Station on Ross Island, it is the southernmost active volcano on the planet. Because of the remote location, activity is primarily monitored by satellites. This report covers activity during 2023.
The number of thermal alerts recorded by the Hawai'i Institute of Geophysics and Planetology’s MODVOLC Thermal Alerts System increased considerably in 2023 compared to the years 2020-2022 (table 9). In contrast to previous years, the MODIS instruments aboard the Aqua and Terra satellites captured data from Erebus every month during 2023. Consistent with previous years, the lowest number of anomalous pixels were recorded in January, November, and December.
Table 9. Number of monthly MODIS-MODVOLC thermal alert pixels recorded at Erebus during 2017-2023. See BGVN 42:06 for data from 2000 through 2016. The table was compiled using data provided by the HIGP – MODVOLC Thermal Alerts System.
| Year |
Jan |
Feb |
Mar |
Apr |
May |
Jun |
Jul |
Aug |
Sep |
Oct |
Nov |
Dec |
SUM |
| 2017 |
0 |
21 |
9 |
0 |
0 |
1 |
11 |
61 |
76 |
52 |
0 |
3 |
234 |
| 2018 |
0 |
21 |
58 |
182 |
55 |
17 |
137 |
172 |
103 |
29 |
0 |
0 |
774 |
| 2019 |
2 |
21 |
162 |
151 |
55 |
56 |
75 |
53 |
29 |
19 |
1 |
0 |
624 |
| 2020 |
0 |
2 |
16 |
18 |
4 |
4 |
1 |
3 |
18 |
3 |
1 |
6 |
76 |
| 2021 |
0 |
9 |
1 |
0 |
2 |
56 |
46 |
47 |
35 |
52 |
5 |
3 |
256 |
| 2022 |
1 |
13 |
55 |
22 |
15 |
32 |
39 |
19 |
31 |
11 |
0 |
0 |
238 |
| 2023 |
2 |
33 |
49 |
82 |
41 |
32 |
70 |
64 |
42 |
17 |
5 |
11 |
448 |
Sentinel-2 infrared images showed one or two prominent heat sources within the summit crater, accompanied by adjacent smaller sources, similar to recent years (see BGVN 46:01, 47:02, and 48:01). A unique image was obtained on 25 November 2023 by the OLI-2 (Operational Land Imager-2) on Landsat 9, showing the upper part of the volcano surrounded by clouds (figure 32).
Geologic Background. Mount Erebus, the world's southernmost historically active volcano, overlooks the McMurdo research station on Ross Island. It is the largest of three major volcanoes forming the crudely triangular Ross Island. The summit of the dominantly phonolitic volcano has been modified by one or two generations of caldera formation. A summit plateau at about 3,200 m elevation marks the rim of the youngest caldera, which formed during the late-Pleistocene and within which the modern cone was constructed. An elliptical 500 x 600 m wide, 110-m-deep crater truncates the summit and contains an active lava lake within a 250-m-wide, 100-m-deep inner crater; other lava lakes are sometimes present. The glacier-covered volcano was erupting when first sighted by Captain James Ross in 1841. Continuous lava-lake activity with minor explosions, punctuated by occasional larger Strombolian explosions that eject bombs onto the crater rim, has been documented since 1972, but has probably been occurring for much of the volcano's recent history.
Information Contacts: Hawai'i Institute of Geophysics and Planetology (HIGP) - MODVOLC Thermal Alerts System, School of Ocean and Earth Science and Technology (SOEST), Univ. of Hawai'i, 2525 Correa Road, Honolulu, HI 96822, USA (URL: http://modis.higp.hawaii.edu/); Copernicus Browser, Copernicus Data Space Ecosystem, European Space Agency (URL: https://dataspace.copernicus.eu/browser/); NASA Earth Observatory, EOS Project Science Office, NASA Goddard Space Flight Center, Goddard, Maryland, USA (URL: https://earthobservatory.nasa.gov/images/152134/erebus-breaks-through).
Rincon de la Vieja (Costa Rica) — January 2024 Cite this Report
Rincon de la Vieja
Costa Rica
10.83°N, 85.324°W; summit elev. 1916 m
All times are local (unless otherwise noted)
Frequent phreatic explosions during July-December 2023
Rincón de la Vieja is a volcanic complex in Costa Rica with a hot convecting acid lake that exhibits frequent weak phreatic explosions, gas-and-steam emissions, and occasional elevated sulfur dioxide levels (BGVN 45:10, 46:03, 46:11). The current eruption period began June 2021. This report covers activity during July-December 2023 and is based on weekly bulletins and occasional daily reports from the Observatorio Vulcanologico Sismologica de Costa Rica-Universidad Nacional (OVSICORI-UNA).
Numerous weak phreatic explosions continued during July-December 2023, along with gas-and-steam emissions and plumes that rose as high as 3 km above the crater rim. Many weekly OVSICORI-UNA bulletins included the previous week's number of explosions and emissions (table 9). For many explosions, the time of explosion was given (table 10). Frequent seismic activity (long-period earthquakes, volcano-tectonic earthquakes, and tremor) accompanied the phreatic activity.
Table 9. Number of reported weekly phreatic explosions and gas-and-steam emissions at Rincón de la Vieja, July-December 2023. Counts are reported for the week before the Weekly Bulletin date; not all reports included these data. Courtesy of OVSICORI-UNA.
| OVSICORI Weekly Bulletin |
Number of explosions |
Number of emissions |
| 28 Jul 2023 |
6 |
14 |
| 4 Aug 2023 |
10 |
12 |
| 1 Sep 2023 |
13 |
11 |
| 22 Sep 2023 |
12 |
13 |
| 29 Sep 2023 |
6 |
11 |
| 6 Oct 2023 |
12 |
5 |
| 13 Oct 2023 |
7 |
9 |
| 20 Oct 2023 |
1 |
15 |
| 27 Oct 2023 |
3 |
23 |
| 3 Nov 2023 |
3 |
10 |
| 17 Nov 2023 |
0 |
Some |
| 24 Nov 2023 |
0 |
14 |
| 8 Dec 2023 |
4 |
16 |
| 22 Dec 2023 |
8 |
18 |
Table 10. Summary of activity at Rincón de la Vieja during July-December 2023. Weak phreatic explosions and gas emissions are noted where the time of explosion was indicated in the weekly or daily bulletins. Height of plumes or emissions are distance above the crater rim. Courtesy of OVSICORI-UNA.
| Date |
Time |
Description of Activity |
| 1 Jul 2023 |
0156 |
Explosion. |
| 2 Jul 2023 |
0305 |
Explosion. |
| 4 Jul 2023 |
0229, 0635 |
Event at 0635 produced a gas-and-steam plume that rose 700 m and drifted W; seen by residents in Liberia (21 km SW). |
| 9 Jul 2023 |
1843 |
Explosion. |
| 21 Jul 2023 |
0705 |
Explosion. |
| 26 Jul 2023 |
1807 |
Explosion. |
| 28 Jul 2023 |
0802 |
Explosion generated a gas-and-steam plume that rose 500 m. |
| 30 Jul 2023 |
1250 |
Explosion. |
| 31 Jul 2023 |
2136 |
Explosion. |
| 11 Aug 2023 |
0828 |
Explosion. |
| 18 Aug 2023 |
1304 |
Explosion. |
| 21 Aug 2023 |
1224 |
Explosion generated gas-and-steam plumes rose 500-600 m. |
| 22 Aug 2023 |
0749 |
Explosion generated gas-and-steam plumes rose 500-600 m. |
| 24 Aug 2023 |
1900 |
Explosion. |
| 25 Aug 2023 |
0828 |
Event produced a steam-and-gas plume that rose 3 km and drifted NW. |
| 27-28 Aug 2023 |
0813 |
Four small events; the event at 0813 on 28 August lasted two minutes and generated a steam-and-gas plume that rose 2.5 km. |
| 1 Sep 2023 |
1526 |
Explosion generated plume that rose 2 km and ejected material onto the flanks. |
| 2-3 Sep 2023 |
- |
Small explosions detected in infrasound data. |
| 4 Sep 2023 |
1251 |
Gas-and-steam plume rose 1 km and drifted W. |
| 7 Nov 2023 |
1113 |
Explosion. |
| 8 Nov 2023 |
0722 |
Explosion. |
| 12 Nov 2023 |
0136 |
Small gas emissions. |
| 14 Nov 2023 |
0415 |
Small gas emissions. |
According to OVSICORI-UNA, during July-October the average weekly sulfur dioxide (SO2) flux ranged from 68 to 240 tonnes/day. However, in mid-November the flux increased to as high as 334 tonnes/day, the highest value measured in recent years. The high SO2 flux in mid-November was also detected by the TROPOMI instrument on the Sentinel-5P satellite (figure 43).
Geologic Background. Rincón de la Vieja, the largest volcano in NW Costa Rica, is a remote volcanic complex in the Guanacaste Range. The volcano consists of an elongated, arcuate NW-SE-trending ridge constructed within the 15-km-wide early Pleistocene Guachipelín caldera, whose rim is exposed on the south side. Sometimes known as the "Colossus of Guanacaste," it has an estimated volume of 130 km3 and contains at least nine major eruptive centers. Activity has migrated to the SE, where the youngest-looking craters are located. The twin cone of Santa María volcano, the highest peak of the complex, is located at the eastern end of a smaller, 5-km-wide caldera and has a 500-m-wide crater. A Plinian eruption producing the 0.25 km3 Río Blanca tephra about 3,500 years ago was the last major magmatic eruption. All subsequent eruptions, including numerous historical eruptions possibly dating back to the 16th century, have been from the prominent active crater containing a 500-m-wide acid lake located ENE of Von Seebach crater.
Information Contacts: Observatorio Vulcanológico Sismológica de Costa Rica-Universidad Nacional (OVSICORI-UNA), Apartado 86-3000, Heredia, Costa Rica (URL: http://www.ovsicori.una.ac.cr/); NASA Global Sulfur Dioxide Monitoring Page, Atmospheric Chemistry and Dynamics Laboratory, NASA Goddard Space Flight Center (NASA/GSFC), 8800 Greenbelt Road, Goddard MD 20771, USA (URL: https://so2.gsfc.nasa.gov/).
Bezymianny (Russia) — November 2023 Cite this Report
Bezymianny
Russia
55.972°N, 160.595°E; summit elev. 2882 m
All times are local (unless otherwise noted)
Explosion on 18 October 2023 sends ash plume 8 km high; lava flows and incandescent avalanches
Bezymianny, located on Russia’s Kamchatka Peninsula, has had eruptions since 1955 characterized by dome growth, explosions, pyroclastic flows, ash plumes, and ashfall. Activity during November 2022-April 2023 included gas-and-steam emissions, lava dome collapses generating avalanches, and persistent thermal activity. Similar eruptive activity continued from May through October 2023, described here based on information from weekly and daily reports of the Kamchatka Volcano Eruptions Response Team (KVERT), notices from Tokyo VAAC (Volcanic Ash Advisory Center), and from satellite data.
Overall activity decreased after the strong period of activity in late March through April 2023, which included ash explosions during 29 March and 7-8 April 2023 that sent plumes as high as 10-12 km altitude, along with dome growth and lava flows (BGVN 48:05). This reduced activity can be seen in the MIROVA thermal detection system graph (figure 56), which was consistent with data from the MODVOLC thermal detection system and with Sentinel-2 satellite images that showed persistent hotspots in the summit crater when conditions allowed observations. A renewed period of strong activity began in mid-October 2023.
Activity increased significantly on 17 October 2023 when large collapses began during 0700-0830 on the E flanks of the lava dome and continued to after 0930 the next day (figure 57). Ash plumes rose to an altitude of 4.5-5 km, extending 220 km NNE by 18 October. A large explosion at 1630 on 18 October produced an ash plume that rose to an altitude of 11 km (8 km above the summit) and drifted NNE and then NW, extending 900 km NW within two days at an altitude of 8 km. Minor ashfall was noted in Kozyrevsk (45 km WNW). At 0820 on 20 October an ash plume was identified in satellite images drifting 100 km ENE at altitudes of 4-4.5 km.
Lava flows and hot avalanches from the dome down the SE flank continued over the next few days, including 23 October when clear conditions allowed good observations (figures 58 and 59). A large thermal anomaly was observed over the volcano through 24 October, and in the summit crater on 30 October (figure 60). Strong fumarolic activity continued, with numerous avalanches and occasional incandescence. By the last week of October, volcanic activity had decreased to a level consistent with that earlier in the reporting period.
Aviation warnings were frequently updated during 17-20 October. KVERT issued a Volcano Observatory Notice for Aviation (VONA) on 17 October at 1419 and 1727 (0219 and 0527 UTC) raising the Aviation Color Code (ACC) from Yellow to Orange (second highest level). The next day, KVERT issued a VONA at 1705 (0505 UTC) raising the ACC to Red (highest level) but lowered it back to Orange at 2117 (0917 UTC). After another decrease to Yellow and back to Orange, the ACC was reduced to Yellow on 20 October at 1204 (0004 UTC). In addition, the Tokyo VAAC issued a series of Volcanic Ash Advisories beginning on 16 October and continuing through 30 October.
Geologic Background. The modern Bezymianny, much smaller than its massive neighbors Kamen and Kliuchevskoi on the Kamchatka Peninsula, was formed about 4,700 years ago over a late-Pleistocene lava-dome complex and an edifice built about 11,000-7,000 years ago. Three periods of intensified activity have occurred during the past 3,000 years. The latest period, which was preceded by a 1,000-year quiescence, began with the dramatic 1955-56 eruption. This eruption, similar to that of St. Helens in 1980, produced a large open crater that was formed by collapse of the summit and an associated lateral blast. Subsequent episodic but ongoing lava-dome growth, accompanied by intermittent explosive activity and pyroclastic flows, has largely filled the 1956 crater.
Information Contacts: Kamchatka Volcanic Eruptions Response Team (KVERT), Far Eastern Branch, Russian Academy of Sciences, 9 Piip Blvd., Petropavlovsk-Kamchatsky, 683006, Russia (URL: http://www.kscnet.ru/ivs/kvert/); Kamchatka Volcanological Station, Kamchatka Branch of Geophysical Survey, (KB GS RAS), Klyuchi, Kamchatka Krai, Russia (URL: http://volkstat.ru/); Tokyo Volcanic Ash Advisory Center (VAAC), 1-3-4 Otemachi, Chiyoda-ku, Tokyo 100-8122, Japan (URL: http://ds.data.jma.go.jp/svd/vaac/data/); Hawai'i Institute of Geophysics and Planetology (HIGP) - MODVOLC Thermal Alerts System, School of Ocean and Earth Science and Technology (SOEST), Univ. of Hawai'i, 2525 Correa Road, Honolulu, HI 96822, USA (URL: http://modis.higp.hawaii.edu/); MIROVA (Middle InfraRed Observation of Volcanic Activity), a collaborative project between the Universities of Turin and Florence (Italy) supported by the Centre for Volcanic Risk of the Italian Civil Protection Department (URL: http://www.mirovaweb.it/); Copernicus Browser, Copernicus Data Space Ecosystem, European Space Agency (URL: https://dataspace.copernicus.eu/browser/).chr
Kilauea (United States) — January 2023 Cite this Report
Kilauea
United States
19.421°N, 155.287°W; summit elev. 1222 m
All times are local (unless otherwise noted)
Low-level lava effusions in the lava lake at Halema’uma’u during July-December 2022
Kīlauea is the southeastern-most volcano in Hawaii and overlaps the E flank of the Mauna Loa volcano. Its East Rift Zone (ERZ) has been intermittently active for at least 2,000 years. An extended eruption period began in January 1983 and was characterized by open lava lakes and lava flows from the summit caldera and the East Rift Zone. During May 2018 magma migrated into the Lower East Rift Zone (LERZ) and opened 24 fissures along a 6-km-long NE-trending fracture zone that produced lava flows traveling in multiple directions. As lava emerged from the fissures, the lava lake at Halema'uma'u drained and explosions sent ash plumes to several kilometers altitude (BGVN 43:10).
The current eruption period started during September 2021 and has recently been characterized by lava effusions, spatter, and sulfur dioxide emissions in the active Halema’uma’u lava lake (BGVN 47:08). Lava effusions, some spatter, and sulfur dioxide emissions have continued during this reporting period of July through December 2022 using daily reports, volcanic activity notices, and abundant photo, map, and video data from the US Geological Survey's (USGS) Hawaiian Volcano Observatory (HVO).
Summary of activity during July-December 2022. Low-level effusions have continued at the western vent of the Halema’uma’u crater during July through early December 2022. Occasional weak ooze-outs (also called lava break outs) would occur along the margins of the crater floor. The overall level of the active lava lake throughout the reporting period gradually increased due to infilling, however it stagnated in mid-September (table 13). During September through November, activity began to decline, though lava effusions persisted at the western vent. By 9 December, the active part of the lava lake had completely crusted over, and incandescence was no longer visible.
Table 13. Summary of measurements taken during overflights at Kīlauea that show a gradual increase in the active lava lake level and the volume of lava effused since 29 September 2021. Lower activity was reported during September-October. Data collected during July-December 2022. Courtesy of HVO.
| Date: |
Level of the active lava lake (m): |
Cumulative volume of lava effused (million cubic meters): |
| 7 Jul 2022 |
130 |
95 |
| 19 Jul 2022 |
133 |
98 |
| 4 Aug 2022 |
136 |
102 |
| 16 Aug 2022 |
137 |
104 |
| 12 Sep 2022 |
143 |
111 |
| 5 Oct 2022 |
143 |
111 |
| 28 Oct 2022 |
143 |
111 |
Activity during July 2022. Lava effusions were reported from the western vent in the Halema’uma’u crater, along with occasional weak ooze-outs along the margins of the crater floor. The height of the lava lake was variable due to deflation-inflation tilt events; for example, the lake level dropped approximately 3-4 m during a summit deflation-inflation event reported on 1 July. Webcam images taken during the night of 6-12 July showed intermittent low-level spattering at the western vent that rose less than 10 m above the vent (figure 519). Measurements made during an overflight on 7 July indicated that the crater floor was infilled about 130 m and that 95 million cubic meters of lava had been effused since 29 September 2021. A single, relatively small lava ooze-out was active to the S of the lava lake. Around midnight on 8 July there were two brief periods of lava overflow onto the lake margins. On 9 July lava ooze-outs were reported near the SE and NE edges of the crater floor and during 10-11 July they occurred near the E, NE, and NW edges. On 16 July crater incandescence was reported, though the ooze-outs and spattering were not visible. On 18 July overnight webcam images showed incandescence in the western vent complex and two ooze-outs were reported around 0000 and 0200 on 19 July. By 0900 there were active ooze-outs along the SW edge of the crater floor. Measurements made from an overflight on 19 July indicated that the crater floor was infilled about 133 m and 98 million cubic meters of lava had erupted since 29 September 2021 (figure 520). On 20 July around 1600 active ooze-outs were visible along the N edge of the crater, which continued through the next day. Extensive ooze-outs occurred along the W margin during 24 July until 1900; on 26 July minor ooze-outs were noted along the N margin. Minor spattering was visible on 29 July along the E margin of the lake. The sulfur dioxide emission rates ranged 650-2,800 tons per day (t/d), the higher of which was measured on 8 July (figure 519).
Activity during August 2022. The eruption continued in the Halema’uma’u crater at the western vent. According to HVO the lava in the active lake remained at the level of the bounding levees. Occasional minor ooze-outs were observed along the margins of the crater floor. Strong nighttime crater incandescence was visible after midnight on 6 August over the western vent cone. During 6-7 August scattered small lava lobes were active along the crater floor and incandescence persisted above the western vent through 9 August. During 7-9 August HVO reported a single lava effusion source was active along the NW margin of the crater floor. Measurements from an overflight on 4 August indicated that the crater floor was infilled about 136 m total and that 102 million cubic meters of lava had been erupted since the start of the eruption. Lava breakouts were reported along the N, NE, E, S, and W margins of the crater during 10-16 August. Another overflight survey conducted on 16 August indicated that the crater floor infilled about 137 m and 104 million cubic meters of lava had been erupted since September 2021. Measured sulfur dioxide emissions rates ranged 1,150-2,450 t/d, the higher of which occurred on 8 August.
Activity during September 2022. During September, lava effusion continued from the western vent into the active lava lake and onto the crater floor. Intermittent minor ooze-outs were reported through the month. A small ooze-out was visible on the W crater floor margin at 0220 on 2 September, which showed decreasing surface activity throughout the day, but remained active through 3 September. On 3 September around 1900 a lava outbreak occurred along the NW margin of the crater floor but had stopped by the evening of 4 September. Field crews monitoring the summit lava lake on 9 September observed spattering on the NE margin of the lake that rose no higher than 10 m, before falling back onto the lava lake crust (figure 521). Overflight measurements on 12 September indicated that the crater floor was infilled a total of 143 m and 111 million cubic meters of lava had been erupted since September 2021. Extensive breakouts in the W and N part of the crater floor were reported at 1600 on 20 September and continued into 26 September. The active part of the lava lake dropped by 10 m while other parts of the crater floor dropped by several meters. Summit tiltmeters recorded a summit seismic swarm of more than 80 earthquakes during 1500-1800 on 21 September, which occurred about 1.5 km below Halema’uma’u; a majority of these were less than Mw 2. By 22 September the active part of the lava lake was infilled about 2 m. On 23 September the western vent areas exhibited several small spatter cones with incandescent openings, along with weak, sporadic spattering (figure 522). The sulfur dioxide emission rate ranged from 930 t/d to 2,000 t/d, the higher of which was measured on 6 September.
Activity during October 2022. Activity during October declined slightly compared to previous months, though lava effusions persisted from the western vent into the active lava lake and onto the crater floor during October (figure 523). Slight variations in the lava lake were noted throughout the month. HVO reported that around 0600 on 3 October the level of the lava lake has lowered slightly. Overflight measurements taken on 5 October indicated that the crater floor was infilled a total of about 143 m and that 111 million cubic meters of lava had been effused since September 2021. During 6-7 October the lake gradually rose 0.5 m. Sulfur dioxide measurements made on 22 October had an emission rate of 700 t/d. Another overflight taken on 28 October showed that there was little to no change in the elevation of the crater floor: the crater floor was infilled a total of 143 m and 111 million cubic meters of lava had erupted since the start of the eruption.
Activity during November 2022. Activity remained low during November, though HVO reported that lava from the western vent continued to effuse into the active lava lake and onto the crater floor throughout the month. The rate of sulfur dioxide emissions during November ranged from 300-600 t/d, the higher amount of which occurred on 9 November.
Activity during December 2022. Similar low activity was reported during December, with lava effusing from the western vent into the active lava lake and onto the crater floor. During 4-5 December the active part of the lava lake was slightly variable in elevation and fluctuated within 1 m. On 9 December HVO reported that lava was no longer erupting from the western vent in the Halema’uma’u crater and that sulfur dioxide emissions had returned to near pre-eruption background levels; during 10-11 December, the lava lake had completely crusted over, and no incandescence was visible (figure 524). Time lapse camera images covering the 4-10 December showed that the crater floor showed weak deflation and no inflation. Some passive events of crustal overturning were reported during 14-15 December, which brought fresh incandescent lava to the lake surface. The sulfur dioxide emission rate was approximately 200 t/d on 14 December. A smaller overturn event on 17 December and another that occurred around 0000 and into the morning of 20 December were also detected. A small seismic swarm was later detected on 30 December.
Geologic Background. Kilauea overlaps the E flank of the massive Mauna Loa shield volcano in the island of Hawaii. Eruptions are prominent in Polynesian legends; written documentation since 1820 records frequent summit and flank lava flow eruptions interspersed with periods of long-term lava lake activity at Halemaumau crater in the summit caldera until 1924. The 3 x 5 km caldera was formed in several stages about 1,500 years ago and during the 18th century; eruptions have also originated from the lengthy East and Southwest rift zones, which extend to the ocean in both directions. About 90% of the surface of the basaltic shield volcano is formed of lava flows less than about 1,100 years old; 70% of the surface is younger than 600 years. The long-term eruption from the East rift zone between 1983 and 2018 produced lava flows covering more than 100 km2, destroyed hundreds of houses, and added new coastline.
Information Contacts: Hawaiian Volcano Observatory (HVO), U.S. Geological Survey, PO Box 51, Hawai'i National Park, HI 96718, USA (URL: http://hvo.wr.usgs.gov/).
Nyamulagira (DR Congo) — November 2023 Cite this Report
Nyamulagira
DR Congo
1.408°S, 29.2°E; summit elev. 3058 m
All times are local (unless otherwise noted)
Lava flows and thermal activity during May-October 2023
Nyamulagira (also known as Nyamuragira) is a shield volcano in the Democratic Republic of Congo with the summit truncated by a small 2 x 2.3 km caldera with walls up to about 100 m high. Documented eruptions have occurred within the summit caldera, as well as from numerous flank fissures and cinder cones. The current eruption period began in April 2018 and has more recently been characterized by summit crater lava flows and thermal activity (BGVN 48:05). This report describes lava flows and variable thermal activity during May through October 2023, based on information from the Observatoire Volcanologique de Goma (OVG) and various satellite data.
Lava lake activity continued during May. The MIROVA (Middle InfraRed Observation of Volcanic Activity) system recorded moderate-to-strong thermal activity throughout the reporting period; activity was more intense during May and October and relatively weaker from June through September (figure 95). The MODVOLC thermal algorithm, detected a total of 209 thermal alerts. There were 143 hotspots detected during May, eight during June, nine during September, and 49 during October. This activity was also reflected in infrared satellite images, where a lava flow was visible in the NW part of the crater on 7 May and strong activity was seen in the center of the crater on 4 October (figure 96). Another infrared satellite image taken on 12 May showed still active lava flows along the NW margin of the crater. According to OVG lava effusions were active during 7-29 May and moved to the N and NW parts of the crater beginning on 9 May. Strong summit crater incandescence was visible from Goma (27 km S) during the nights of 17, 19, and 20 May (figure 97). On 17 May there was an increase in eruptive activity, which peaked at 0100 on 20 May. Notable sulfur dioxide plumes drifted NW and W during 19-20 May (figure 98). Drone footage acquired in partnership with the USGS (United States Geological Survey) on 20 May captured images of narrow lava flows that traveled about 100 m down the W flank (figure 99). Data from the Rumangabo seismic station indicated a decreasing trend in activity during 17-21 May. Although weather clouds prevented clear views of the summit, a strong thermal signature on the NW flank was visible in an infrared satellite image on 22 May, based on an infrared satellite image. On 28 May the lava flows on the upper W flank began to cool and solidify. By 29 May seismicity returned to levels similar to those recorded before the 17 May increase. Lava effusion continued but was confined to the summit crater; periodic crater incandescence was observed.
Low-level activity was noted during June through October. On 1 June OVG reported that seismicity remained at lower levels and that crater incandescence had been absent for three days, though infrared satellite imagery showed continued lava effusion in the summit crater. The lava flows on the flanks covered an estimated 0.6 km2. Satellite imagery continued to show thermal activity confined to the lava lake through October (figure 96), although no lava flows or significant sulfur dioxide emissions were reported.
Geologic Background. Africa's most active volcano, Nyamulagira (also known as Nyamuragira), is a massive high-potassium basaltic shield about 25 km N of Lake Kivu and 13 km NNW of the steep-sided Nyiragongo volcano. The summit is truncated by a small 2 x 2.3 km caldera that has walls up to about 100 m high. Documented eruptions have occurred within the summit caldera, as well as from the numerous flank fissures and cinder cones. A lava lake in the summit crater, active since at least 1921, drained in 1938, at the time of a major flank eruption. Recent lava flows extend down the flanks more than 30 km from the summit as far as Lake Kivu; extensive lava flows from this volcano have covered 1,500 km2 of the western branch of the East African Rift.
Information Contacts: Observatoire Volcanologique de Goma (OVG), Departement de Geophysique, Centre de Recherche en Sciences Naturelles, Lwiro, D.S. Bukavu, DR Congo; Hawai'i Institute of Geophysics and Planetology (HIGP) - MODVOLC Thermal Alerts System, School of Ocean and Earth Science and Technology (SOEST), Univ. of Hawai'i, 2525 Correa Road, Honolulu, HI 96822, USA (URL: http://modis.higp.hawaii.edu/); MIROVA (Middle InfraRed Observation of Volcanic Activity), a collaborative project between the Universities of Turin and Florence (Italy) supported by the Centre for Volcanic Risk of the Italian Civil Protection Department (URL: http://www.mirovaweb.it/); NASA Global Sulfur Dioxide Monitoring Page, Atmospheric Chemistry and Dynamics Laboratory, NASA Goddard Space Flight Center (NASA/GSFC), 8800 Greenbelt Road, Goddard, Maryland, USA (URL: https://so2.gsfc.nasa.gov/); Copernicus Browser, Copernicus Data Space Ecosystem, European Space Agency (URL: https://dataspace.copernicus.eu/browser/); Charles Balagizi, Goma Volcano Observatory, Departement de Geophysique, Centre de Recherche en Sciences Naturelles, Lwiro, D.S. Bukavu, DR Congo.
Bagana (Papua New Guinea) — October 2023 Cite this Report
Bagana
Papua New Guinea
6.137°S, 155.196°E; summit elev. 1855 m
All times are local (unless otherwise noted)
Explosions, ash plumes, ashfall, and lava flows during April-September 2023
The remote volcano of Bagana is located in central Bougainville Island, Papua New Guinea. Recorded eruptions date back to 1842 and activity has consisted of effusive activity that has built a small lava dome in the summit crater and occasional explosions that produced pyroclastic flows. The most recent eruption has been ongoing since February 2000 and has produced occasional explosions, ash plumes, and lava flows. More recently, activity has been characterized by ongoing effusive activity and ash emissions (BGVN 48:04). This report updates activity from April through September 2023 that has consisted of explosions, ash plumes, ashfall, and lava flows, using information from the Darwin Volcanic Ash Advisory Center (VAAC) and satellite data.
An explosive eruption was reported on 7 July that generated a large gas-and-ash plume to high altitudes and caused significant ashfall in local communities; the eruption plume had reached upper tropospheric (16-18 km altitude) altitudes by 2200, according to satellite images. Sulfur dioxide plumes were detected in satellite images on 8 July and indicated that the plume was likely a mixture of gas, ice, and ash. A report issued by the Autonomous Bougainville Government (ABG) (Torokina District, Education Section) on 10 July noted that significant ash began falling during 2000-2100 on 7 July and covered most areas in the Vuakovi, Gotana (9 km SW), Koromaketo, Laruma (25 km W) and Atsilima (27 km NW) villages. Pyroclastic flows also occurred, according to ground-based reports; small deposits confined to one drainage were inspected by RVO during an overflight on 17 July and were confirmed to be from the 7 July event. Ashfall continued until 10 July and covered vegetation, which destroyed bushes and gardens and contaminated rivers and streams.
RVO reported another eruption on 14 July. The Darwin VAAC stated that an explosive event started around 0830 on 15 July and produced an ash plume that rose to 16.5 km altitude by 1000 and drifted N, according to satellite images. The plume continued to drift N and remained visible through 1900, and by 2150 it had dissipated.
Ashfall likely from both the 7 and 15 July events impacted about 8,111 people in Torokina (20 km SW), including Tsito/Vuakovi, Gotana, Koromaketo, Kenaia, Longkogari, Kenbaki, Piva (13 km SW), and Atsinima, and in the Tsitovi district, according to ABG. Significant ashfall was also reported in Ruruvu (22 km N) in the Wakunai District of Central Bougainville, though the thickness of these deposits could not be confirmed. An evacuation was called for the villages in Wakunai, where heavy ashfall had contaminated water sources; the communities of Ruruvu, Togarau, Kakarapaia, Karauturi, Atao, and Kuritaturi were asked to evacuate to a disaster center at the Wakunai District Station, and communities in Torokina were asked to evacuate to the Piva District station. According to a news article, more than 7,000 people needed temporary accommodations, with about 1,000 people in evacuation shelters. Ashfall had deposited over a broad area, contaminating water supplies, affecting crops, and collapsing some roofs and houses in rural areas. Schools were temporarily shut down. Intermittent ash emissions continued through the end of July and drifted NNW, NW, and SW. Fine ashfall was reported on the coast of Torokina, and ash plumes also drifted toward Laruma and Atsilima.
A small explosive eruption occurred at 2130 on 28 July that ejected material from the crater vents, according to reports from Torokina, in addition to a lava flow that contained two lobes. A second explosion was detected at 2157. Incandescence from the lava flow was visible from Piva as it descended the W flank around 2000 on 29 July (figure 47). The Darwin VAAC reported that a strong thermal anomaly was visible in satellite images during 30-31 July and that ash emissions rose to 2.4 km altitude and drifted WSW on 30 July. A ground report from RVO described localized emissions at 0900 on 31 July.
The Darwin VAAC reported that ash plumes were identified in satellite imagery at 0800 and 1220 on 12 August and rose to 2.1 km and 3 km altitude and drifted NW and W, respectively. A news report stated that aid was sent to more than 6,300 people that were adversely affected by the eruption. Photos taken during 17-19 August showed ash emissions rising no higher than 1 km above the summit and drifting SE. A small explosion generated an ash plume during the morning of 19 August. Deposits from small pyroclastic flows were also captured in the photos. Satellite images captured lava flows and pyroclastic flow deposits. Two temporary seismic stations were installed near Bagana on 17 August at distances of 7 km WSW (Vakovi station) and 11 km SW (Kepox station). The Kepox station immediately started to record continuous, low-frequency background seismicity.
Satellite data. Little to no thermal activity was detected during April through mid-July 2023; only one anomaly was recorded during early April and one during early June, according to MIROVA (Middle InfraRed Observation of Volcanic Activity) data (figure 48). Thermal activity increased in both power and frequency during mid-July through September, although there were still some short gaps in detected activity. MODVOLC also detected increased thermal activity during August; thermal hotspots were detected a total of five times on 19, 20, and 27 August. Weak thermal anomalies were also captured in infrared satellite images on clear weather days throughout the reporting period on 7, 12, and 17 April, 27 May, 1, 6, 16, and 31 July, and 19 September (figure 48); a strong thermal anomaly was visible on 31 July. Distinct sulfur dioxide plumes that drifted generally NW were intermittently captured by the TROPOMI instrument on the Sentinel-5P satellite and sometimes exceeded two Dobson Units (DUs) (figure 49).
Geologic Background. Bagana volcano, in a remote portion of central Bougainville Island, is frequently active. This massive symmetrical cone was largely constructed by an accumulation of viscous andesitic lava flows. The entire edifice could have been constructed in about 300 years at its present rate of lava production. Eruptive activity is characterized by non-explosive effusion of viscous lava that maintains a small lava dome in the summit crater, although occasional explosive activity produces pyroclastic flows. Lava flows with tongue-shaped lobes up to 50 m thick and prominent levees descend the flanks on all sides.
Information Contacts: Rabaul Volcano Observatory (RVO), Geohazards Management Division, Department of Mineral Policy and Geohazards Management (DMPGM), PO Box 3386, Kokopo, East New Britain Province, Papua New Guinea; Darwin Volcanic Ash Advisory Centre (VAAC), Bureau of Meteorology, Northern Territory Regional Office, PO Box 40050, Casuarina, NT 0811, Australia (URL: http://www.bom.gov.au/info/vaac/); MIROVA (Middle InfraRed Observation of Volcanic Activity), a collaborative project between the Universities of Turin and Florence (Italy) supported by the Centre for Volcanic Risk of the Italian Civil Protection Department (URL: http://www.mirovaweb.it/); Hawai'i Institute of Geophysics and Planetology (HIGP) - MODVOLC Thermal Alerts System, School of Ocean and Earth Science and Technology (SOEST), Univ. of Hawai'i, 2525 Correa Road, Honolulu, HI 96822, USA (URL: http://modis.higp.hawaii.edu/); NASA Global Sulfur Dioxide Monitoring Page, Atmospheric Chemistry and Dynamics Laboratory, NASA Goddard Space Flight Center (NASA/GSFC), 8800 Greenbelt Road, Goddard, Maryland, USA (URL: https://so2.gsfc.nasa.gov/); Copernicus Browser, Copernicus Data Space Ecosystem, European Space Agency (URL: https://dataspace.copernicus.eu/browser/); Autonomous Bougainville Government, P.O Box 322, Buka, AROB, PNG (URL: https://abg.gov.pg/); Andrew Tupper (Twitter: @andrewcraigtupp); Simon Carn, Geological and Mining Engineering and Sciences, Michigan Technological University, 1400 Townsend Drive, Houghton, MI 49931, USA (URL: http://www.volcarno.com/, Twitter: @simoncarn); Radio NZ (URL: https://www.rnz.co.nz/news/pacific/494464/more-than-7-000-people-in-bougainville-need-temporary-accommodation-after-eruption); USAID, 1300 Pennsylvania Ave, NW, Washington DC 20004, USA (URL: https://www.usaid.gov/pacific-islands/press-releases/aug-08-2023-united-states-provides-immediate-emergency-assistance-support-communities-affected-mount-bagana-volcanic-eruptions).
Mayon (Philippines) — October 2023 Cite this Report
Mayon
Philippines
13.257°N, 123.685°E; summit elev. 2462 m
All times are local (unless otherwise noted)
Lava flows, pyroclastic flows, ash emissions, and seismicity during April-September 2023
Mayon is located in the Philippines and has steep upper slopes capped by a small summit crater. Historical eruptions date back to 1616 CE that have been characterized by Strombolian eruptions, lava flows, pyroclastic flows, and mudflows. Eruptions mostly originated from a central conduit. Pyroclastic flows and mudflows have commonly descended many of the approximately 40 drainages that surround the volcano. The most recent eruption occurred during June through October 2022 and consisted of lava dome growth and gas-and-steam emissions (BGVN 47:12). A new eruption was reported during late April 2023 and has included lava flows, pyroclastic density currents, ash emissions, and seismicity. This report covers activity during April through September 2023 based on daily bulletins from the Philippine Institute of Volcanology and Seismology (PHIVOLCS).
During April through September 2023, PHIVOLCS reported near-daily rockfall events, frequent volcanic earthquakes, and sulfur dioxide measurements. Gas-and-steam emissions rose 100-900 m above the crater and drifted in different directions. Nighttime crater incandescence was often visible during clear weather and was accompanied by incandescent avalanches of material. Activity notably increased during June when lava flows were reported on the S, SE, and E flanks (figure 52). The MIROVA graph (Middle InfraRed Observation of Volcanic Activity) showed strong thermal activity coincident with these lava flows, which remained active through September (figure 53). According to the MODVOLC thermal algorithm, a total of 110 thermal alerts were detected during the reporting period: 17 during June, 40 during July, 27 during August, and 26 during September. During early June, pyroclastic density currents (PDCs) started to occur more frequently.
Low activity was reported during much of April and May; gas-and-steam emissions rose 100-900 m above the crater and generally drifted in different directions. A total of 52 rockfall events and 18 volcanic earthquakes were detected during April and 147 rockfall events and 13 volcanic events during May. Sulfur dioxide flux measurements ranged between 400-576 tons per day (t/d) during April, the latter of which was measured on 29 April and between 162-343 t/d during May, the latter of which was measured on 13 May.
Activity during June increased, characterized by lava flows, pyroclastic density currents (PDCs), crater incandescence and incandescent rockfall events, gas-and-steam emissions, and continued seismicity. Weather clouds often prevented clear views of the summit, but during clear days, moderate gas-and-steam emissions rose 100-2,500 m above the crater and drifted in multiple directions. A total of 6,237 rockfall events and 288 volcanic earthquakes were detected. The rockfall events often deposited material on the S and SE flanks within 700-1,500 m of the summit crater and ash from the events drifted SW, S, SE, NE, and E. Sulfur dioxide emissions ranged between 149-1,205 t/d, the latter of which was measured on 10 June. Short-term observations from EDM and electronic tiltmeter monitoring indicated that the upper slopes were inflating since February 2023. Longer-term ground deformation parameters based on EDM, precise leveling, continuous GPS, and electronic tilt monitoring indicated that the volcano remained inflated, especially on the NW and SE flanks. At 1000 on 5 June the Volcano Alert Level (VAL) was raised to 2 (on a 0-5 scale). PHIVOLCS noted that although low-level volcanic earthquakes, ground deformation, and volcanic gas emissions indicated unrest, the steep increase in rockfall frequency may indicate increased dome activity.
A total of 151 dome-collapse PDCs occurred during 8-9 and 11-30 June, traveled 500-2,000 m, and deposited material on the S flank within 2 km of the summit crater. During 8-9 June the VAL was raised to 3. At approximately 1947 on 11 June lava flow activity was reported; two lobes traveled within 500 m from the crater and deposited material on the S (Mi-isi), SE (Bonga), and E (Basud) flanks. Weak seismicity accompanied the lava flow and slight inflation on the upper flanks. This lava flow remained active through 30 June, moving down the S and SE flank as far as 2.5 km and 1.8 km, respectively and depositing material up to 3.3 km from the crater. During 15-16 June traces of ashfall from the PDCs were reported in Sitio Buga, Nabonton, City of Ligao and Purok, and San Francisco, Municipality of Guinobatan. During 28-29 June there were two PDCs generated by the collapse of the lava flow front, which generated a light-brown ash plume 1 km high. Satellite monitors detected significant concentrations of sulfur dioxide beginning on 29 June. On 30 June PDCs primarily affected the Basud Gully on the E flank, the largest of which occurred at 1301 and lasted eight minutes, based on the seismic record. Four PDCs generated between 1800 and 2000 that lasted approximately four minutes each traveled 3-4 km on the E flank and generated an ash plume that rose 1 km above the crater and drifted N and NW. Ashfall was recorded in Tabaco City.
Similar strong activity continued during July; slow lava effusion remained active on the S and SE flanks and traveled as far as 2.8 km and 2.8 km, respectively and material was deposited as far as 4 km from the crater. There was a total of 6,983 rockfall events and 189 PDCs that affected the S, SE, and E flanks. The volcano network detected a total of 2,124 volcanic earthquakes. Continuous gas-and-steam emissions rose 200-2,000 m above the crater and drifted in multiple directions. Sulfur dioxide emissions averaged 792-4,113 t/d, the latter of which was measured on 28 July. During 2-4 July three PDCs were generated from the collapse of the lava flow and resulting light brown plumes rose 200-300 m above the crater. Continuous tremor pulses were reported beginning at 1547 on 3 July through 7 July at 1200, at 2300 on 8 July and going through 0300 on 10 July, and at 2300 on 16 July, as recorded by the seismic network. During 6-9 July there were 10 lava flow-collapse-related PDCs that generated light brown plumes 300-500 m above the crater. During 10-11 July light ashfall was reported in some areas of Mabinit, Legazpi City, Budiao and Salvacion, Daraga, and Camalig, Albay. By 18 July the lava flow advanced 600 m on the E flank as well.
During 1733 on 18 July and 0434 on 19 July PHIVOLCS reported 30 “ashing” events, which are degassing events accompanied by audible thunder-like sounds and entrained ash at the crater, which produced short, dark plumes that drifted SW. These events each lasted 20-40 seconds, and plume heights ranged from 150-300 m above the crater, as recorded by seismic, infrasound, visual, and thermal monitors. Three more ashing events occurred during 19-20 July. Short-term observations from electronic tilt and GPS monitoring indicate deflation on the E lower flanks in early July and inflation on the NW middle flanks during the third week of July. Longer-term ground deformation parameters from EDM, precise leveling, continuous GPS, and electronic tilt monitoring indicated that the volcano was still generally inflated relative to baseline levels. A short-lived lava pulse lasted 28 seconds at 1956 on 21 July, which was accompanied by seismic and infrasound signals. By 22 July, the only lava flow that remained active was on the SE flank, and continued to extend 3.4 km, while those on the S and E flanks weakened markedly. One ashing event was detected during 30-31 July, whereas there were 57 detected during 31 July-1 August; according to PHIVOLCS beginning at approximately 1800 on 31 July eruptive activity was dominated by phases of intermittent ashing, as well as increased in the apparent rates of lava effusion from the summit crater. The ashing phases consisted of discrete events recorded as low-frequency volcanic earthquakes (LFVQ) typically 30 seconds in duration, based on seismic and infrasound signals. Gray ash plume rose 100 m above the crater and generally drifted NE. Shortly after these ashing events began, new lava began to effuse rapidly from the crater, feeding the established flowed on the SE, E, and E flanks and generating frequent rockfall events.
Intensified unrest persisted during August. There was a total of 4,141 rockfall events, 2,881 volcanic earthquakes, which included volcanic tremor events, 32 ashing events, and 101 PDCs detected throughout the month. On clear weather days, gas-and-steam emissions rose 300-1,500 m above the crater and drifted in different directions (figure 54). Sulfur dioxide emissions averaged 735-4,756 t/d, the higher value of which was measured on 16 August. During 1-2 August the rate of lava effusion decreased, but continued to feed the flows on the SE, S, and E flanks, maintaining their advances to 3.4 km, 2.8 km, and 1.1 km from the crater, respectively (figure 55). Rockfall and PDCs generated by collapses at the lava flow margins and from the summit dome deposited material within 4 km of the crater. During 3-4 August there were 10 tremor events detected that lasted 1-4 minutes. Short-lived lava pulse lasted 35 seconds and was accompanied by seismic and infrasound signals at 0442 on 6 August. Seven collapses were recorded at the front of the lava flow during 12-14 August.
During September, similar activity of slow lava effusion, PDCs, gas-and-steam emissions, and seismicity continued. There was a total of 4,452 rockfall events, 329 volcanic earthquakes, which included volcanic tremor events, two ashing events, and 85 PDCs recorded throughout the month. On clear weather days, gas-and-steam emissions rose 100-1,500 m above the crater and drifted in multiple directions. Sulfur dioxide emissions averaged 609-2,252 t/d, the higher average of which was measured on 6 September. Slow lava effusion continued advancing on the SE, S, and E flanks, maintaining lengths of 3.4 km, 2.8 km, and 1.1 km, respectively. Rockfall and PDC events generated by collapses along the lava flow margins and at the summit dome deposited material within 4 km of the crater.
Geologic Background. Symmetrical Mayon, which rises above the Albay Gulf NW of Legazpi City, is the most active volcano of the Philippines. The steep upper slopes are capped by a small summit crater. Recorded eruptions since 1616 CE range from Strombolian to basaltic Plinian, with cyclical activity beginning with basaltic eruptions, followed by longer periods of andesitic lava flows. Eruptions occur predominately from the central conduit and have also produced lava flows that travel far down the flanks. Pyroclastic density currents and mudflows have commonly swept down many of the approximately 40 ravines that radiate from the summit and have often damaged populated lowland areas. A violent eruption in 1814 killed more than 1,200 people and devastated several towns.
Information Contacts: Philippine Institute of Volcanology and Seismology (PHIVOLCS), Department of Science and Technology, University of the Philippines Campus, Diliman, Quezon City, Philippines (URL: http://www.phivolcs.dost.gov.ph/); MIROVA (Middle InfraRed Observation of Volcanic Activity), a collaborative project between the Universities of Turin and Florence (Italy) supported by the Centre for Volcanic Risk of the Italian Civil Protection Department (URL: http://www.mirovaweb.it/); Hawai'i Institute of Geophysics and Planetology (HIGP) - MODVOLC Thermal Alerts System, School of Ocean and Earth Science and Technology (SOEST), Univ. of Hawai'i, 2525 Correa Road, Honolulu, HI 96822, USA (URL: http://modis.higp.hawaii.edu/); Copernicus Browser, Copernicus Data Space Ecosystem, European Space Agency (URL: https://dataspace.copernicus.eu/browser/); William Rogers, Legazpi City, Albay Province, Philippines.
Nishinoshima (Japan) — October 2023 Cite this Report
Nishinoshima
Japan
27.247°N, 140.874°E; summit elev. 100 m
All times are local (unless otherwise noted)
Eruption plumes and gas-and-steam plumes during May-August 2023
Nishinoshima, located about 1,000 km S of Tokyo, is a small island in the Ogasawara Arc in Japan. The island is the summit of a massive submarine volcano that has prominent submarine peaks to the S, W, and NE. Eruptions date back to 1973 and the current eruption period began in October 2022. Recent activity has consisted of small ash plumes and fumarolic activity (BGVN 48:07). This report covers activity during May through August 2023, using information from monthly reports of the Japan Meteorological Agency (JMA) monthly reports and satellite data.
Activity during May through June was relatively low. The Japan Coast Guard (JCG) did overflights on 14 and 22 June and reported white gas-and-steam emissions rising 600 m and 1,200 m from the central crater of the pyroclastic cone, respectively (figure 125). In addition, multiple white gas-and-steam emissions rose from the inner rim of the W side of the crater and from the SE flank of the pyroclastic cone. Discolored brown-to-green water was observed around almost the entire perimeter of the island; on 22 June light green discolored water was observed off the S coast of the island.
Observations from the Himawari meteorological satellite confirmed an eruption on 9 and 10 July. An eruption plume rose 1.6 km above the crater and drifted N around 1300 on 9 July. Satellite images acquired at 1420 and 2020 on 9 July and at 0220 on 10 July showed continuing emissions that rose 1.3-1.6 km above the crater and drifted NE and N. The Tokyo VAAC reported that an ash plume seen by a pilot and identified in a satellite image at 0630 on 21 July rose to 3 km altitude and drifted S.
Aerial observations conducted by JCG on 8 August showed a white-and-gray plume rising from the central crater of the pyroclastic cone, and multiple white gas-and-steam emissions were rising from the inner edge of the western crater and along the NW-SE flanks of the island (figure 126). Brown-to-green discolored water was also noted around the perimeter of the island.
Intermittent low-to-moderate power thermal anomalies were recorded in the MIROVA graph (Middle InfraRed Observation of Volcanic Activity), showing an increase in both frequency and power beginning in July (figure 127). This increase in activity coincides with eruptive activity on 9 and 10 July, characterized by eruption plumes. According to the MODVOLC thermal alert algorithm, one thermal hotspot was recorded on 20 July. Weak thermal anomalies were also detected in infrared satellite imagery, accompanied by strong gas-and-steam plumes (figure 128).
Geologic Background. The small island of Nishinoshima was enlarged when several new islands coalesced during an eruption in 1973-74. Multiple eruptions that began in 2013 completely covered the previous exposed surface and continued to enlarge the island. The island is the summit of a massive submarine volcano that has prominent peaks to the S, W, and NE. The summit of the southern cone rises to within 214 m of the ocean surface 9 km SSE.
Information Contacts: Japan Meteorological Agency (JMA), 1-3-4 Otemachi, Chiyoda-ku, Tokyo 100-8122, Japan (URL: http://www.jma.go.jp/jma/indexe.html); Tokyo Volcanic Ash Advisory Center (VAAC), 1-3-4 Otemachi, Chiyoda-ku, Tokyo 100-8122, Japan (URL: http://ds.data.jma.go.jp/svd/vaac/data/); MIROVA (Middle InfraRed Observation of Volcanic Activity), a collaborative project between the Universities of Turin and Florence (Italy) supported by the Centre for Volcanic Risk of the Italian Civil Protection Department (URL: http://www.mirovaweb.it/); Copernicus Browser, Copernicus Data Space Ecosystem, European Space Agency (URL: https://dataspace.copernicus.eu/browser/).
Krakatau (Indonesia) — October 2023 Cite this Report
Krakatau
Indonesia
6.1009°S, 105.4233°E; summit elev. 285 m
All times are local (unless otherwise noted)
White gas-and-steam plumes and occasional ash plumes during May-August 2023
Krakatau is located in the Sunda Strait between Java and Sumatra, Indonesia. Caldera collapse during the catastrophic 1883 eruption destroyed Danan and Perbuwatan cones and left only a remnant of Rakata. The post-collapse cone of Anak Krakatau (Child of Krakatau) was constructed within the 1883 caldera at a point between the former Danan and Perbuwatan cones; it has been the site of frequent eruptions since 1927. The current eruption period began in May 2021 and has recently consisted of Strombolian eruptions and ash plumes (BGVN 48:07). This report describes lower levels of activity consisting of ash and white gas-and-steam plumes during May through August 2023, based on information provided by the Indonesian Center for Volcanology and Geological Hazard Mitigation, referred to as Pusat Vulkanologi dan Mitigasi Bencana Geologi (PVMBG), MAGMA Indonesia, and satellite data.
Activity was relatively low during May and June. Daily white gas-and-steam emissions rose 25-200 m above the crater and drifted in different directions. Five ash plumes were detected at 0519 on 10 May, 1241 on 11 May, 0920 on 12 May, 2320 on 12 May, and at 0710 on 13 May, and rose 1-2.5 km above the crater and drifted SW. A webcam image taken on 12 May showed ejection of incandescent material above the vent. A total of nine ash plumes were detected during 6-11 June: at 1434 and 00220 on 6 and 7 June the ash plumes rose 500 m above the crater and drifted NW, at 1537 on 8 June the ash plume rose 1 km above the crater and drifted SW, at 0746 and at 0846 on 9 June the ash plumes rose 800 m and 3 km above the crater and drifted SW, respectively, at 0423, 1431, and 1750 on 10 June the ash plumes rose 2 km, 1.5 km, and 3.5 km above the crater and drifted NW, respectively, and at 0030 on 11 June an ash plume rose 2 km above the crater and drifted NW. Webcam images taken on 10 and 11 June at 0455 and 0102, respectively, showed incandescent material ejected above the vent. On 19 June an ash plume at 0822 rose 1.5 km above the crater and drifted SE.
Similar low activity of white gas-and-steam emissions and few ash plumes were reported during July and August. Daily white gas-and-steam emissions rose 25-300 m above the crater and drifted in multiple directions. Three ash plumes were reported at 0843, 0851, and 0852 on 20 July that rose 500-2,000 m above the crater and drifted NW.
The MIROVA (Middle InfraRed Observation of Volcanic Activity) graph of MODIS thermal anomaly data showed intermittent low-to-moderate power thermal anomalies during May through August 2023 (figure 140). Although activity was often obscured by weather clouds, a thermal anomaly was visible in an infrared satellite image of the crater on 12 May, accompanied by an eruption plume that drifted SW (figure 141).
Geologic Background. The renowned Krakatau (frequently mis-named as Krakatoa) volcano lies in the Sunda Strait between Java and Sumatra. Collapse of an older edifice, perhaps in 416 or 535 CE, formed a 7-km-wide caldera. Remnants of that volcano are preserved in Verlaten and Lang Islands; subsequently the Rakata, Danan, and Perbuwatan cones were formed, coalescing to create the pre-1883 Krakatau Island. Caldera collapse during the catastrophic 1883 eruption destroyed Danan and Perbuwatan, and left only a remnant of Rakata. This eruption caused more than 36,000 fatalities, most as a result of tsunamis that swept the adjacent coastlines of Sumatra and Java. Pyroclastic surges traveled 40 km across the Sunda Strait and reached the Sumatra coast. After a quiescence of less than a half century, the post-collapse cone of Anak Krakatau (Child of Krakatau) was constructed within the 1883 caldera at a point between the former Danan and Perbuwatan cones. Anak Krakatau has been the site of frequent eruptions since 1927.
Information Contacts: Pusat Vulkanologi dan Mitigasi Bencana Geologi (PVMBG, also known as Indonesian Center for Volcanology and Geological Hazard Mitigation, CVGHM), Jalan Diponegoro 57, Bandung 40122, Indonesia (URL: http://www.vsi.esdm.go.id/); MAGMA Indonesia, Kementerian Energi dan Sumber Daya Mineral (URL: https://magma.esdm.go.id/v1); MIROVA (Middle InfraRed Observation of Volcanic Activity), a collaborative project between the Universities of Turin and Florence (Italy) supported by the Centre for Volcanic Risk of the Italian Civil Protection Department (URL: http://www.mirovaweb.it/); Copernicus Browser, Copernicus Data Space Ecosystem, European Space Agency (URL: https://dataspace.copernicus.eu/browser/).
Villarrica (Chile) — October 2023 Cite this Report
Villarrica
Chile
39.42°S, 71.93°W; summit elev. 2847 m
All times are local (unless otherwise noted)
Strombolian activity, gas-and-ash emissions, and crater incandescence during April-September 2023
Villarrica, in central Chile, consists of a 2-km-wide caldera that formed about 3,500 years ago and is located at the base of the presently active cone at the NW margin of a 6-km-wide caldera. Historical eruptions eruptions date back to 1558 and have been characterized by mild-to-moderate explosive activity with occasional lava effusions. The current eruption period began in December 2014 and has recently consisted of nighttime crater incandescence, ash emissions, and seismicity (BGVN 48:04). This report covers activity during April through September 2023 and describes occasional Strombolian activity, gas-and-ash emissions, and nighttime crater incandescence. Information for this report primarily comes from the Southern Andes Volcano Observatory (Observatorio Volcanológico de Los Andes del Sur, OVDAS), part of Chile's National Service of Geology and Mining (Servicio Nacional de Geología y Minería, SERNAGEOMIN) and satellite data.
Seismicity during April consisted of long period (LP) events and tremor (TRE); a total of 9,413 LP-type events and 759 TR-type events were detected throughout the month. Nighttime crater incandescence persisted and was visible in the degassing column. Sulfur dioxide data was obtained using Differential Absorption Optical Spectroscopy Equipment (DOAS) that showed an average value of 1,450 ± 198 tons per day (t/d) during 1-15 April and 1,129 ± 201 t/d during 16-30 April, with a maximum daily value of 2,784 t/d on 9 April. Gas-and-steam emissions of variable intensities rose above the active crater as high as 1.3 km above the crater on 13 April. Strombolian explosions were not observed and there was a slight decrease in the lava lake level.
There were 14,123 LP-type events and 727 TR-type events detected during May. According to sulfur dioxide measurements taken with DOAS equipment, the active crater emitted an average value of 1,826 ± 482 t/d during 1-15 May and 912 ± 41 t/d during 16-30 May, with a daily maximum value of 5,155 t/d on 13 May. Surveillance cameras showed continuous white gas-and-steam emissions that rose as high as 430 m above the crater on 27 May. Nighttime incandescence illuminated the gas column less than 300 m above the crater rim was and no pyroclastic emissions were reported. A landslide was identified on 13 May on the E flank of the volcano 50 m from the crater rim and extending 300 m away; SERNAGEOMIN noted that this event may have occurred on 12 May. During the morning of 27 and 28 May minor Strombolian explosions characterized by incandescent ejecta were recorded at the crater rim; the last reported Strombolian explosions had occurred at the end of March.
Seismic activity during June consisted of five volcano-tectonic (VT)-type events, 21,606 LP-type events, and 2,085 TR-type events. The average value of sulfur dioxide flux obtained by DOAS equipment was 1,420 ± 217 t/d during 1-15 June and 2,562 ± 804 t/d, with a maximum daily value of 4,810 t/d on 17 June. White gas-and-steam emissions rose less than 480 m above the crater; frequent nighttime crater incandescence was reflected in the degassing plume. On 12 June an emission rose 100 m above the crater and drifted NNW. On 15 June one or several emissions resulted in ashfall to the NE as far as 5.5 km from the crater, based on a Skysat satellite image. Several Strombolian explosions occurred within the crater; activity on 15 June was higher energy and ejected blocks 200-300 m on the NE slope. Surveillance cameras showed white gas-and-steam emissions rising 480 m above the crater on 16 June. On 19 and 24 June low-intensity Strombolian activity was observed, ejecting material as far as 200 m from the center of the crater to the E.
During July, seismicity included 29,319 LP-type events, 3,736 TR-type events, and two VT-type events. DOAS equipment recorded two days of sulfur dioxide emissions of 4,220 t/d and 1,009 t/d on 1 and 13 July, respectively. Constant nighttime incandescence was also recorded and was particularly noticeable when accompanied by eruptive columns on 12 and 16 July. Minor explosive events were detected in the crater. According to Skysat satellite images taken on 12, 13, and 16 July, ashfall deposits were identified 155 m S of the crater. According to POVI, incandescence was visible from two vents on the crater floor around 0336 on 12 July. Gas-and-ash emissions rose as high as 1.2 km above the crater on 13 July and drifted E and NW. A series of gas-and-steam pulses containing some ash deposited material on the upper E flank around 1551 on 13 July. During 16-31 July, average sulfur dioxide emissions of 1,679 ± 406 t/d were recorded, with a maximum daily value of 2,343 t/d on 28 July. Fine ash emissions were also reported on 16, 17, and 23 July.
Seismicity persisted during August, characterized by 27,011 LP-type events, 3,323 TR-type events, and three VT-type events. The average value of sulfur dioxide measurements taken during 1-15 August was 1,642 ± 270 t/d and 2,207 ± 4,549 t/d during 16-31 August, with a maximum daily value of 3,294 t/d on 27 August. Nighttime crater incandescence remained visible in degassing columns. White gas-and-steam emissions rose 480 m above the crater on 6 August. According to a Skysat satellite image from 6 August, ash accumulation was observed proximal to the crater and was mainly distributed toward the E slope. White gas-and-steam emissions rose 320 m above the crater on 26 August. Nighttime incandescence and Strombolian activity that generated ash emissions were reported on 27 August.
Seismicity during September was characterized by five VT-type events, 12,057 LP-type events, and 2,058 TR-type events. Nighttime incandescence persisted. On 2 September an ash emission rose 180 m above the crater and drifted SE at 1643 (figure 125) and a white gas-and-steam plume rose 320 m above the crater. According to the Buenos Aires VAAC, periods of continuous gas-and-ash emissions were visible in webcam images from 1830 on 2 September to 0110 on 3 September. Strombolian activity was observed on 2 September and during the early morning of 3 September, the latter event of which generated an ash emission that rose 60 m above the crater and drifted 100 m from the center of the crater to the NE and SW. Ashfall was reported to the SE and S as far as 750 m from the crater. The lava lake was active during 3-4 September and lava fountaining was visible for the first time since 26 March 2023, according to POVI. Fountains captured in webcam images at 2133 on 3 September and at 0054 on 4 September rose as high as 60 m above the crater rim and ejected material onto the upper W flank. Sulfur dioxide flux of 1,730 t/d and 1,281 t/d was measured on 3 and 4 September, respectively, according to data obtained by DOAS equipment.
Strong Strombolian activity and larger gas-and-ash plumes were reported during 18-20 September. On 18 September activity was also associated with energetic LP-type events and notable sulfur dioxide fluxes (as high as 4,277 t/d). On 19 September Strombolian activity and incandescence were observed. On 20 September at 0914 ash emissions rose 50 m above the crater and drifted SSE, accompanied by Strombolian activity that ejected material less than 100 m SSE, causing fall deposits on that respective flank. SERNAGEOMIN reported that a Planet Scope satellite image taken on 20 September showed the lava lake in the crater, measuring 32 m x 35 m and an area of 0.001 km2. Several ash emissions were recorded at 0841, 0910, 1251, 1306, 1312, 1315, and 1324 on 23 September and rose less than 150 m above the crater. The sulfur dioxide flux value was 698 t/d on 23 September and 1,097 t/d on 24 September. On 24 September the Volcanic Alert Level (VAL) was raised to Orange (the third level on a four-color scale). SENAPRED maintained the Alert Level at Yellow (the middle level on a three-color scale) for the communities of Villarrica, Pucón (16 km N), Curarrehue, and Panguipulli.
During 24-25 September there was an increase in seismic energy (observed at TR-events) and acoustic signals, characterized by 1 VT-type event, 213 LP-type events, and 124 TR-type events. Mainly white gas-and-steam emissions, in addition to occasional fine ash emissions were recorded. During the early morning of 25 September Strombolian explosions were reported and ejected material 250 m in all directions, though dominantly toward the NW. On 25 September the average value of sulfur dioxide flux was 760 t/d. Seismicity during 25-30 September consisted of five VT-type events, 1,937 LP-type events, and 456 TR-type events.
During 25-29 September moderate Strombolian activity was observed and ejected material as far as the crater rim. In addition, ash pulses lasting roughly 50 minutes were observed around 0700 and dispersed ENE. During 26-27 September a TR episode lasted 6.5 hours and was accompanied by discrete acoustic signals. Satellite images from 26 September showed a spatter cone on the crater floor with one vent that measured 10 x 14 m and a smaller vent about 35 m NE of the cone. SERNAGEOMIN reported an abundant number of bomb-sized blocks up to 150 m from the crater, as well as impact marks on the snow, which indicated explosive activity. A low-altitude ash emission was observed drifting NW around 1140 on 28 September, based on webcam images. Between 0620 and 0850 on 29 September an ash emission rose 60 m above the crater and drifted NW. During an overflight taken around 1000 on 29 September scientists observed molten material in the vent, a large accumulation of pyroclasts inside the crater, and energetic degassing, some of which contained a small amount of ash. Block-sized pyroclasts were deposited on the internal walls and near the crater, and a distal ash deposit was also visible. The average sulfur dioxide flux measured on 28 September was 344 t/d. Satellite images taken on 29 September ashfall was deposited roughly 3 km WNW from the crater and nighttime crater incandescence remained visible. The average sulfur dioxide flux value from 29 September was 199 t/d. On 30 September at 0740 a pulsating ash emission rose 1.1 km above the crater and drifted NNW (figure 126). Deposits on the S flank extended as far as 4.5 km from the crater rim, based on satellite images from 30 September.
Infrared MODIS satellite data processed by MIROVA (Middle InfraRed Observation of Volcanic Activity) showed intermittent thermal activity during April through September, with slightly stronger activity detected during late September (figure 127). Small clusters of thermal activity were detected during mid-June, early July, early August, and late September. According to the MODVOLC thermal alert system, a total of four thermal hotspots were detected on 7 July and 3 and 23 September. This activity was also intermittently captured in infrared satellite imagery on clear weather days (figure 128).
Geologic Background. The glacier-covered Villarrica stratovolcano, in the northern Lakes District of central Chile, is ~15 km south of the city of Pucon. A 2-km-wide caldera that formed about 3,500 years ago is located at the base of the presently active, dominantly basaltic to basaltic andesite cone at the NW margin of a 6-km-wide Pleistocene caldera. More than 30 scoria cones and fissure vents are present on the flanks. Plinian eruptions and pyroclastic flows that have extended up to 20 km from the volcano were produced during the Holocene. Lava flows up to 18 km long have issued from summit and flank vents. Eruptions documented since 1558 CE have consisted largely of mild-to-moderate explosive activity with occasional lava effusion. Glaciers cover 40 km2 of the volcano, and lahars have damaged towns on its flanks.
Information Contacts: Servicio Nacional de Geología y Minería (SERNAGEOMIN), Observatorio Volcanológico de Los Andes del Sur (OVDAS), Avda Sta María No. 0104, Santiago, Chile (URL: http://www.sernageomin.cl/); Proyecto Observación Villarrica Internet (POVI) (URL: http://www.povi.cl/); Sistema y Servicio Nacional de Prevención y Repuesta Ante Desastres (SENAPRED), Av. Beauchef 1671, Santiago, Chile (URL: https://web.senapred.cl/); Buenos Aires Volcanic Ash Advisory Center (VAAC), Servicio Meteorológico Nacional-Fuerza Aérea Argentina, 25 de mayo 658, Buenos Aires, Argentina (URL: http://www.smn.gov.ar/vaac/buenosaires/inicio.php); MIROVA (Middle InfraRed Observation of Volcanic Activity), a collaborative project between the Universities of Turin and Florence (Italy) supported by the Centre for Volcanic Risk of the Italian Civil Protection Department (URL: http://www.mirovaweb.it/); Hawai'i Institute of Geophysics and Planetology (HIGP) - MODVOLC Thermal Alerts System, School of Ocean and Earth Science and Technology (SOEST), Univ. of Hawai'i, 2525 Correa Road, Honolulu, HI 96822, USA (URL: http://modis.higp.hawaii.edu/); Copernicus Browser, Copernicus Data Space Ecosystem, European Space Agency (URL: https://dataspace.copernicus.eu/browser/).
Merapi (Indonesia) — October 2023 Cite this Report
Merapi
Indonesia
7.54°S, 110.446°E; summit elev. 2910 m
All times are local (unless otherwise noted)
Frequent incandescent avalanches during April-September 2023
Merapi, located just north of the major city of Yogyakarta in central Java, Indonesia, has had activity within the last 20 years characterized by pyroclastic flows and lahars accompanying growth and collapse of the steep-sided active summit lava dome. The current eruption period began in late December 2020 and has more recently consisted of ash plumes, intermittent incandescent avalanches of material, and pyroclastic flows (BGVN 48:04). This report covers activity during April through September 2023, based on information from Balai Penyelidikan dan Pengembangan Teknologi Kebencanaan Geologi (BPPTKG), the Center for Research and Development of Geological Disaster Technology, a branch of PVMBG which specifically monitors Merapi. Additional information comes from the Pusat Vulkanologi dan Mitigasi Bencana Geologi (PVMBG, also known as Indonesian Center for Volcanology and Geological Hazard Mitigation, CVGHM), MAGMA Indonesia, the Darwin Volcanic Ash Advisory Centre (VAAC), and various satellite data.
Activity during April through September 2023 primarily consisted of incandescent avalanches of material that mainly affected the SW and W flanks and traveled as far as 2.3 km from the summit (table 25) and white gas-and-steam emissions that rose 10-1,000 m above the crater.
Table 25. Monthly summary of avalanches and avalanche distances recorded at Merapi during April through September 2023. The number of reported avalanches does not include instances where possible avalanches were heard but could not be visually confirmed as a result of inclement weather. Data courtesy of BPPTKG (April-September 2023 daily reports).
| Month |
Average number of avalanches per day |
Distance avalanches traveled (m) |
| Apr 2023 |
19 |
1,200-2,000 |
| May 2023 |
22 |
500-2,000 |
| Jun 2023 |
18 |
1,200-2,000 |
| Jul 2023 |
30 |
300-2,000 |
| Aug 2023 |
25 |
400-2,300 |
| Sep 2023 |
23 |
600-2,000 |
BPPTKG reported that during April and May white gas-and-steam emissions rose 10-750 m above the crater, incandescent avalanches descended 500-2,000 m on the SW and W flanks (figure 135). Cloudy weather often prevented clear views of the summit, and sometimes avalanches could not be confirmed. According to a webcam image, a pyroclastic flow was visible on 17 April at 0531. During the week of 28 April and 4 May a pyroclastic flow was reported on the SW flank, traveling up to 2.5 km. According to a drone overflight taken on 17 May the SW lava dome volume was an estimated 2,372,800 cubic meters and the dome in the main crater was an estimated 2,337,300 cubic meters.
During June and July similar activity persisted with white gas-and-steam emissions rising 10-350 m above the crater and frequent incandescent avalanches that traveled 300-2,000 m down the SW, W, and S flanks (figure 136). Based on an analysis of aerial photos taken on 24 June the volume of the SW lava dome was approximately 2.5 million cubic meters. A pyroclastic flow was observed on 5 July that traveled 2.7 km on the SW flank. According to the Darwin VAAC multiple minor ash plumes were identified in satellite images on 19 July that rose to 3.7 km altitude and drifted S and SW. During 22, 25, and 26 July a total of 17 avalanches descended as far as 1.8 km on the S flank.
Frequent white gas-and-steam emissions continued during August and September, rising 10-450 m above the crater. Incandescent avalanches mainly affected the SW and W flanks and traveled 400-2,300 m from the vent (figure 137). An aerial survey conducted on 10 August was analyzed and reported that estimates of the SW dome volume was 2,764,300 cubic meters and the dome in the main crater was 2,369,800 cubic meters.
Frequent and moderate-power thermal activity continued throughout the reporting period, according to a MIROVA (Middle InfraRed Observation of Volcanic Activity) analysis of MODIS satellite data (figure 138). There was an increase in the number of detected anomalies during mid-May. The MODVOLC thermal algorithm recorded a total of 47 thermal hotspots: six during April, nine during May, eight during June, 15 during July, four during August, and five during September. Some of this activity was captured in infrared satellite imagery on clear weather days, sometimes accompanied by incandescent material on the SW flank (figure 139).
Geologic Background. Merapi, one of Indonesia's most active volcanoes, lies in one of the world's most densely populated areas and dominates the landscape immediately north of the major city of Yogyakarta. It is the youngest and southernmost of a volcanic chain extending NNW to Ungaran volcano. Growth of Old Merapi during the Pleistocene ended with major edifice collapse perhaps about 2,000 years ago, leaving a large arcuate scarp cutting the eroded older Batulawang volcano. Subsequent growth of the steep-sided Young Merapi edifice, its upper part unvegetated due to frequent activity, began SW of the earlier collapse scarp. Pyroclastic flows and lahars accompanying growth and collapse of the steep-sided active summit lava dome have devastated cultivated lands on the western-to-southern flanks and caused many fatalities.
Information Contacts: Balai Penyelidikan dan Pengembangan Teknologi Kebencanaan Geologi (BPPTKG), Center for Research and Development of Geological Disaster Technology (URL: http://merapi.bgl.esdm.go.id/, Twitter: @BPPTKG); MAGMA Indonesia, Kementerian Energi dan Sumber Daya Mineral (URL: https://magma.esdm.go.id/v1); Pusat Vulkanologi dan Mitigasi Bencana Geologi (PVMBG, also known as Indonesian Center for Volcanology and Geological Hazard Mitigation, CVGHM), Jalan Diponegoro 57, Bandung 40122, Indonesia (URL: http://www.vsi.esdm.go.id/); Darwin Volcanic Ash Advisory Centre (VAAC), Bureau of Meteorology, Northern Territory Regional Office, PO Box 40050, Casuarina, NT 0811, Australia (URL: http://www.bom.gov.au/info/vaac/); MIROVA (Middle InfraRed Observation of Volcanic Activity), a collaborative project between the Universities of Turin and Florence (Italy) supported by the Centre for Volcanic Risk of the Italian Civil Protection Department (URL: http://www.mirovaweb.it/); Hawai'i Institute of Geophysics and Planetology (HIGP) - MODVOLC Thermal Alerts System, School of Ocean and Earth Science and Technology (SOEST), Univ. of Hawai'i, 2525 Correa Road, Honolulu, HI 96822, USA (URL: http://modis.higp.hawaii.edu/); Copernicus Browser, Copernicus Data Space Ecosystem, European Space Agency (URL: https://dataspace.copernicus.eu/browser/); Øystein Lund Andersen (URL: https://www.oysteinlundandersen.com/, https://twitter.com/oysteinvolcano).
Ebeko
Russia
50.686°N, 156.014°E; summit elev. 1103 m
All times are local (unless otherwise noted)
Moderate explosive activity with ash plumes continued during June-November 2023
Ebeko, located on the N end of Paramushir Island in Russia’s Kuril Islands just S of the Kamchatka Peninsula, consists of three summit craters along a SSW-NNE line at the northern end of a complex of five volcanic cones. Observed eruptions date back to the late 18th century and have been characterized as small-to-moderate explosions from the summit crater, accompanied by intense fumarolic activity. The current eruptive period began in June 2022, consisting of frequent explosions, ash plumes, and thermal activity (BGVN 47:10, 48:06). This report covers similar activity during June-November 2023, based on information from the Kamchatka Volcanic Eruptions Response Team (KVERT) and satellite data.
Moderate explosive activity continued during June-November 2023 (figures 50 and 51). According to visual data from Severo-Kurilsk, explosions sent ash 2-3.5 km above the summit (3-4.5 km altitude) during most days during June through mid-September. Activity after mid-September was slightly weaker, with ash usually reaching less than 2 km above the summit. According to KVERT the volcano in October and November was, with a few exceptions, either quiet or obscured by clouds that prevented satellite observations. KVERT issued Volcano Observatory Notices for Aviation (VONA) on 8 and 12 June, 13 and 22 July, 3 and 21 August, and 31 October warning of potential aviation hazards from ash plumes drifting 3-15 km from the volcano. Based on satellite data, KVERT reported a persistent thermal anomaly whenever weather clouds permitted viewing.
Geologic Background. The flat-topped summit of the central cone of Ebeko volcano, one of the most active in the Kuril Islands, occupies the northern end of Paramushir Island. Three summit craters located along a SSW-NNE line form Ebeko volcano proper, at the northern end of a complex of five volcanic cones. Blocky lava flows extend west from Ebeko and SE from the neighboring Nezametnyi cone. The eastern part of the southern crater contains strong solfataras and a large boiling spring. The central crater is filled by a lake about 20 m deep whose shores are lined with steaming solfataras; the northern crater lies across a narrow, low barrier from the central crater and contains a small, cold crescentic lake. Historical activity, recorded since the late-18th century, has been restricted to small-to-moderate explosive eruptions from the summit craters. Intense fumarolic activity occurs in the summit craters, on the outer flanks of the cone, and in lateral explosion craters.
Information Contacts: Kamchatka Volcanic Eruptions Response Team (KVERT), Far Eastern Branch, Russian Academy of Sciences, 9 Piip Blvd., Petropavlovsk-Kamchatsky, 683006, Russia (URL: http://www.kscnet.ru/ivs/kvert/).
Search Bulletin Archive by Publication Date
Select a month and year from the drop-downs and click "Show Issue" to have that issue displayed in this tab.
The default month and year is the latest issue available.
Bulletin of the Global Volcanism Network - Volume 34, Number 07 (July 2009)
Managing Editor: Richard Wunderman
Erta Ale (Ethiopia)
Changes at NW and S pit craters between 2002 and 2009
Galeras (Colombia)
Explosions during February-June 2009, ashfall up to 180 km away
Kie Besi (Indonesia)
Seismicity increased during May 2009 after tectonic earthquakes
Rumble III (New Zealand)
Submarine summit craters underwent collapse and eruption
Sangeang Api (Indonesia)
Increased seismicity, including explosion earthquakes, during May-June 2009
Suwanosejima (Japan)
Explosive eruptions continue through 6 July 2009
Talang (Indonesia)
Sudden occurrence of over 900 earthquakes on 16-17 August 2009
Tungurahua (Ecuador)
Eruptions in 2008-2009; two fatalities in sudden flood on 22 August 2008
Uzon (Russia)
Valley of Geysers two years after the major landslide of June 2007
Erta Ale
Ethiopia
13.601°N, 40.666°E; summit elev. 585 m
All times are local (unless otherwise noted)
Changes at NW and S pit craters between 2002 and 2009
From 7-10 February 2009, an expedition team with Chris Weber visited Erta Ale (figure 22) and observed the long-active lava lake in the S pit crater. Although there have been intervening visits and reports (most recently from February 2008, BGVN 33:06), a comparison of observations from 2002 with 2008-2009 gives a sense of the changes to the craters (table 2).
Table 2. Summary of observations made during 2002, 2008,and 2009 of Erta Ale S and NW pits and lava lakes. The numbered terraces (former lake surfaces that chilled sufficiently to leave a conspicuous ledge) are shown on the sketch maps (figure 23). The undated 2008 observations came from the local guide, Meles Matwose. Courtesy of C. Weber.
| Date |
South Crater |
South Lava Lake |
NW Crater |
NW Lava Flows |
| 04 Dec 2002 |
Elliptical (terraces 1 and 2) ~160 m EW, ~130 m NS. Two levels (terraces 1 and 2). About half the area (terrace 1) covered by basalt on terrace ~45 m below pit rim. |
About half the area (terrace 2) ~100 m EW. Lake surface ~90 m below W rim of pit. |
One level (terrace 3). |
-- |
| 2008 |
-- |
-- |
Massive collapse early in year caused new, deeper level (terrace 4). |
Lava flows covered part of terraces 3 and 4. Latest flow in Nov 2008. |
| 07-10 Feb 2009 |
Elliptical shape (terraces 1, 2, and the lava lake) ~190 m EW, ~150 m NS. Three levels (terraces 1, 2, lava lake). Terrace (terrace 1) and 2002 lava lake edge (terrace 2) ~35 m below W side of pit rim. |
Lava lake ~60 m wide in W half of pit. Lake surface higher than in 2002 and it oscillated ~5 m vertically and at times came close to overflowing terraces 1 and 2. |
Three levels (terraces 3, 4, and 5). |
-- |
South pit crater. The active S pit expanded due to crater collapse on its W side between 2002 and 2009 (figure 23). The shape of the ellipsoidal crater increased by ~ 30 m EW and ~ 20 m NS.
The former lava-lake stand from 2002 left a remnant surface still visible in 2009 (terrace #2), an area marked as well by fractures and fumaroles. In both 2002 and 2009 terraces #1 and #2 still remained, separated by an elevation difference of ~ 40 m (BGVN 28:04).
During 2009, the W half of the S pit contained a 60 m wide active lava lake (figure 24). Fountaining there took place a few times per day, occasionally throwing spatter above the top of the crater walls. Some recent spatter was seen at the pit's W edge.
NW pit crater. In February 2009 the NW crater had preserved ledges at three levels (terraces #3, #4, and #5). This represented a substantive change in comparison to 2002 where only level #3 was observed (figure 11). According to Weber, a local guide (Meles Matwose) reported that the NW crater had a massive collapse in early 2008, establishing the deeper level #4. Lava flows covering the crater floor occurred at that time, as well as new lava flows at level #4. One of the latest lava flows, observed by Matwose in November 2008, covered a part of a new interior plateau at level #4. When the lava lake stood at the lowest level, #5, very little lava entered the NW crater.
During the February 2009 expedition, some hornitos on level #4 degassed vigorously inside the pit crater, and, on 9 February 2009, lava spattered ~ 15 m high associated with Strombolian emissions ejected at one hornito during 1800 to 2200 hours. Many photos taken inside the Erta Ale craters in January-February 2009 are shown on the Volcano Discovery website.
Films of Erta Ale. Marc Szeglat's Streaming Planet website provides some spectacular film taken December 2002 inside the S pit showing eruptive activity and researchers collecting data. Cameraman and author of the film was Szeglat, and the film narration is in German. Another short film by Szeglat taken in February 2008 is shown on his YouTube channel.
Recent research publication. Spampinato and others (2008) noted that active lava lakes represent the exposed, uppermost part of convecting magma systems and provide windows into the dynamics of magma transport and degassing. They reported on the main features of the lava lake surface in the S pit of Erta Ale based on observations from an infrared thermal camera made on 11 November 2006. Efficient magma circulation was reflected in the sustained transport of the surface, which was composed of pronounced incandescent cracks that separated wide plates of cooler crust. These crossed the lake from the upwelling to the down-welling margin with mean speeds ranging between 0.01 and 0.15 m/s. Hot spots eventually opened in the middle of crust plates and/or along cracks. These produced mild explosive activity lasting commonly between ~ 10 and 200 s. Apparent temperatures of cracks ranged between ~ 700 and 1070°C, and those of crust between ~ 300 and 500°C.
Reference. Spampinato, L., Oppenheimer, C., Calvari, S., Cannata, A., and Montalto, P., 2008, Lava lake surface characterization by thermal imaging: Erta 'Ale volcano (Ethiopia), Geochemistry Geophysics Geosystems, v. 9, issue Q12008, doi:10.1029/2008GC002164.
Geologic Background. The Erta Ale basaltic shield volcano in Ethiopia has a 50-km-wide edifice that rises more than 600 m from below sea level in the Danakil depression. The volcano includes a 0.7 x 1.6 km summit crater hosting steep-sided pit craters. Another larger 1.8 x 3.1 km wide depression elongated parallel to the trend of the Erta Ale range is located SE of the summit and is bounded by curvilinear fault scarps on the SE side. Basaltic lava flows from these fissures have poured into the caldera and locally overflowed its rim. The summit caldera usually also holds at least one long-term lava lake that has been active since at least 1967, and possibly since 1906. Recent fissure eruptions have occurred on the N flank.
Information Contacts: Christoph Weber, Volcano Expeditions International (VEI), Muehlweg 11, 74199, Entergruppenbach, Germany (URL: http://www.volcanic-hazards.de/); Hawai'i Institute of Geophysics and Planetology (HIGP) Thermal Alerts System, School of Ocean and Earth Science and Technology (SOEST), Univ. of Hawai'i, 2525 Correa Road, Honolulu, HI 96822, USA (URL: http://modis.higp.hawaii.edu/); Streaming Planet (URL: http://www.streaming-planet.de/); Marc Szeglat (URL: http://www.youtube.com/marcszeglat and http://www.vulkane.net/); Volcano Discovery (URL: http://www.volcanodiscovery.com/); Jürg Alean, Kantonsschule Zürcher Unterland, Bülach, Switzerland.
Galeras
Colombia
1.22°N, 77.37°W; summit elev. 4276 m
All times are local (unless otherwise noted)
Explosions during February-June 2009, ashfall up to 180 km away
Activity during 1 September to 16 December 2008 (BGVN 33:11) included modest seismicity, tremor, plumes, moderate sulfur-dioxide (SO2) emissions, and incandescence from the main crater and lava dome. This report describes activity chronicled by the Instituto Colombiano de Geologia y Mineria (INGEOMINAS) for 17 December 2008-31 July 2009.
This interval included explosive eruptions on 14 and 20 February, 13 March, 24 and 29 April, and 7 and 8 June. Some plumes rose to about 10-14 km altitude (the highest on 8 June) and carried significant ash. Seismicity on or near the volcano suggested fluid movements at depth.
On their website, INGEOMINAS provides comprehensive reports covering half-year intervals (starting in 2004). The latest available discusses the first half of 2008.
Mentioned in the latter report are more details on a large volcanic bomb from the 17 January 2008 eruption, which left a 15-m-diameter crater near the summit (BGVN 33:03). Field workers found only angular fragments of the original bomb in the impact crater (pieces often under 1 m in diameter)?but they estimated that the original bomb was on the order of 5 m in diameter. Photos of the downslope areas detected smaller impact craters thought to have been created by fragments that bounced out beyond the large crater. The same report also features isopach maps and discussion of grain size distributions for the 17 January 2008 eruption. That eruption emitted 870,000 m3 of material, which was dispersed up to 71 km W.
INGEOMINAS reported that the 14 February explosion was preceded by minor plumes (reaching 300-500 m above the crater rim) on 8 and 9 February. On 10 February, SO2 fluxes were 1,040-4,300 metric tons/day. The explosive eruption began at 1910 on 14 February. An accompanying shock wave was detected in multiple areas, including Pasto, a city about ~ 10 km E. Cloud cover prevented observations of the ash plume. From about 1930 until 2030, observers noted ashfall, rain, and an odor of sulfurous gas on the volcano's slopes as well as in Pasto. Ash fell mainly to the E and as far away as 25 km. The Alert Level was raised from III (Yellow; "changes in the behavior of volcanic activity") to I (Red; "imminent eruption or in progress"). The local hazards scale ranges from from IV (low) to I (high).
At 1950 seismicity dropped to levels similar to those recorded before the eruption. On 16 February, the Alert Level was lowered to II (Orange; "probable eruption within days or weeks"). During 16-17 February, small steam plumes rose to altitudes of 4.6-6.7 km and drifted SE, E, and NE. According to news accounts (Agence France-Presse, Caracol Radio), authorities ordered the evacuation of about 8,000 people on the slopes, but few went to shelters.
The explosion at 0705 on 20 February prompted authorities to raise the Alert Level back to I (Red). The 13-minute-long signals represented roughly double the seismic energy seen on the 14th. Shock waves were felt in several local communities. Associated sounds were heard in Popayán (~ 160 km NNE). Observers on the E flank reported two explosions, incandescent blocks ejected above the summit, ash emissions, and a sulfurous odor. Ashfall was reported to the W. Gas plumes with a low ash content continued, especially in the afternoon, reaching 700 m above the summit.
Although INGEOMINAS reported that the 20 February ash plume rose to 8 km altitude, analysis by the Washington Volcanic Ash Advisory Center (VAAC) yielded both a higher plume and variable displacements with altitude. The VAAC analysts, promptly notified by INGEOMINAS, compared plume motion seen on GOES-13 satellite imagery and winds from GFS (the Global Forecast System, a numerical weather prediction computer model run four times per day by NOAA). This enabled them to establish the plume's behavior with altitude. The resulting work indicated some of the ash rose as high as 12.5 km.
The VAAC's Ash Advisory of 20 February issued at 0835 local time was as follows: "INGEOMINAS reported an explosive eruption of Galeras at 1204 [UTC; 0704 local time]. Ash at FL410 [41,000 feet; 12.5 km altitude] was moving towards the E at 30 kts [knots, equivalent to 56 km/hour] while ash at FL220 [6.7 km altitude] was moving towards the W at 15-25 kts [28-46 km/hour]. Ash between these layers was moving N at 25 kts [46 km/hour]."
A Volcanic Ash Advisory issued on 20 February at 0854 local time noted "Ash to FL410 is quickly becoming diffuse as it races E while ash to FL280 remains identifiable moving towards the NW at 1315[UTC]." The next Advisory, at 1450 local time, noted ash had dissipated and no new eruptions were reported.
INGEOMINAS stated that the eruptions of 14 and 20 February released an estimated minimum volume of 2 x 10⁶ m3 of tephra. This was ~ 40% of the lava dome's volume. On 20 February, the SO2 was estimated at 100-800 tons/day. A few days later the values stood below 430 tons/day.
The Alert Level was lowered on 21 February and again on 3 March (to Level III). During 22 February to 10 March, occasional white gas plumes with variable ash content rose to a peak altitude of less than 6.3 km.
On 13 March, another explosive eruption occurred. Bad weather prevented direct observations, but the Washington VAAC noted a plume rising to an altitude of ~ 12.3 km drifting NW. The eruption produced sounds heard 10 km E and W. Ashfall was reported in multiple areas E and NW; a sulfur odor was also reported in some areas. Gas plumes with some ash rose on 14 March to an altitude of 6.3 km.
According to a news account in El Tiempo, authorities again ordered the evacuation of about 8,000 people living in high-risk areas, but as before this order was generally ignored. Soon after, the Alert Level was lowered to back to II. On 24 March, the Alert Level was lowered again to III. During the week ending around 24 March, daily SO2 levels were high. Earthquake levels were low in both intensity and occurrence. During 21-23 March, white-colored gas plumes rose to an altitude of 5.4 km and drifted in multiple directions.
On 3-7 April, pulsating gas plumes, sometimes containing ash, were seen when visibility was good. The plumes rose to altitudes less than ~ 6 km. Overflights on 5, 6, and 7 April revealed emissions from different areas in the main crater. On 7 April some of the higher temperature zones were 180°C, and an incandescent area measured 500°C.
Another explosive eruption occurred on 24 April. Incandescent blocks caused fires on the N flank. An accompanying shock wave was reported by residents up to 25 km away. A second eruption, longer but weaker than the first, was detected about 30 minutes later. Incandescence from both eruptions was seen from the city of Pasto. An ash plume rose to an altitude of ~ 10.3 km and ashfall was reported in areas up to 20 km W, WNW, and NW.
On 25 April, ash-and-gas plumes rose 1 km above the crater. Thermal anomalies in the crater near the W flank measured 100°C. Ejected rocks landed 2-3 km from the crater. According to a news article in Colombia Reports, residents living near the volcano were again ordered to evacuate; about 200 people responded. The Alert Level was lowered to II. Several days later, on 29 April, another eruption occurred. Observers reported that an ash plume drifted NW and ash fell in areas up to 35 km downwind.
During 4-5 May, ash plumes drifted NE and ashfall was reported in multiple areas of Pasto. On 6 May, gas-and-ash plumes rose to an altitude of 5.8 km and drifted NE. An overflight revealed incandescence from a vent 90-100 m in diameter in the main crater that had a temperature of 500°C. White plumes originated from multiple points inside and outside of the crater. The Alert Level was lowered to III.
On 9 May, an M 2.2 volcano-tectonic earthquake occurred 6 km to the NE of the main crater at a depth of ~ 10 km. On 11 May, seismicity increased, and hybrid earthquakes and tremor were detected. The seismicity, along with incandescence in the crater and low SO2 values, led INGEOMINAS to conclude that the volcano might have become overpressurized.
During 12-19 May Galeras emitted gas plumes, occasionally containing some ash. An overflight on 17 May revealed gas emissions from multiple points inside and outside the main crater. Some thermal anomalies surpassed 180°C. During 17-18 May, two M 2.9 earthquakes occurred 6 km SSE at depths of 2-3 km, and on 18 May an M 2.3 earthquake occurred at a depth of 3-5 km, 5 km SSW.
On 7 June, an eruption occurred that was preceded by a M 4 earthquake located about 3 km SSE of the crater at a depth of 2 km. Vibrations from an accompanying acoustic wave were detected by residents. The eruption produced an ash plume that rose to an altitude of 6.8 km and drifted NW; ashfall was reported downwind.
On 8 June, two explosions about 5 minutes apart were heard up to 45 km away. The event was preceded by an M 3.9 earthquake centered 1 km E at a depth near 2 km. Ashfall was reported the NW, up to 180 km away. Based on analysis of satellite imagery, the Washington VAAC reported that the ash plume rose to an altitude of 10 km and drifted NW. A second larger eruption produced an ash plume that rose to an altitude of 13.7 km and drifted SE.
Activity declined in the next few weeks. On 9 June, INGEOMINAS reported that seismicity and sulfur dioxide output were low, and that clear conditions revealed no emissions. On 10 June, INGEOMINAS lowered the Alert Level to II. Pulsating steam plumes rose from the crater and drifted NW.
On 19 June, INGEOMINAS lowered the Alert Level to III, based on increased SO2 degassing and seismicity (related to fluid movement) that seemingly resulted in the overall lowering of pressure in the volcanic system. Around this time, scientists on a monitoring flight saw gas emissions near the crater rim and recorded a thermal anomaly within the main crater. Gas plumes with some ash rose from Galeras on 22-23 June. An overflight on 23 June revealed that temperatures in the main crater measured 60° to 120°C, except for a small 220°C zone. Gas emissions originated from the periphery of the main crater. On 26 June, seismicity similar to that seen during previous eruptions, along with low rates of gas emissions, prompted INGEOMINAS to raise the Alert Level to II.
The last thermal anomalies at Galeras recorded from satellite by the MODVOLC system was on 4 December 2008. No alerts were recorded during 17 December 2008-31 July 2009.
Geologic Background. Galeras, a stratovolcano with a large breached caldera located immediately west of the city of Pasto, is one of Colombia's most frequently active volcanoes. The dominantly andesitic complex has been active for more than 1 million years, and two major caldera collapse eruptions took place during the late Pleistocene. Long-term extensive hydrothermal alteration has contributed to large-scale edifice collapse on at least three occasions, producing debris avalanches that swept to the west and left a large open caldera inside which the modern cone has been constructed. Major explosive eruptions since the mid-Holocene have produced widespread tephra deposits and pyroclastic flows that swept all but the southern flanks. A central cone slightly lower than the caldera rim has been the site of numerous small-to-moderate eruptions since the time of the Spanish conquistadors.
Information Contacts: Instituto Colombiano de Geología y Minería (INGEOMINAS), Observatorio Vulcanológico y Sismológico de Popayán, Popayán, Colombia; Washington Volcanic Ash Advisory Center, Satellite Analysis Branch (SAB), NOAA/NESDIS E/SP23, NOAA Science Center Room 401, 5200 Auth Rd, Camp Springs, MD 20746, USA (URL: http://www.ospo.noaa.gov/Products/atmosphere/vaac/); Hawai'i Institute of Geophysics and Planetology (HIGP) Thermal Alerts System, School of Ocean and Earth Science and Technology (SOEST), Univ. of Hawai'i, 2525 Correa Road, Honolulu, HI 96822, USA (URL: ttp://hotspot.higp.hawaii.edu/); Agence France-Presse (URL: http://www.afp.com/afpcom/en); Caracol Radio (URL: http://www.caracol.com.co/); El Tiempo (URL: http://www.eltiempo.com/).
Kie Besi (Indonesia) — July 2009 Cite this Report
Kie Besi
Indonesia
0.32°N, 127.4°E; summit elev. 1357 m
All times are local (unless otherwise noted)
Seismicity increased during May 2009 after tectonic earthquakes
Makian remained in repose as tectonic earthquakes striking the region preceded a cluster of volcanic earthquakes during May and early June 2009. Makian lies SW of the S-central portion of Halmahera Island (in the province of Maluku Utara). Some local residents refer to the island as Mt. Kie Besi; however, it is better known under the name of Mt. Makian (other variants include Kie Besi, Makjan, Makyan, and Wakiong).
The last eruption of Makian occurred in 1988 (SEAN 13:07, 13:08, 13:10, and 13:11) and created a volcanic dome or plug on the crater floor with a diameter of 600 m and volume of ~ 282,600 m3. The 1988 eruption led to the temporary evacuation of the island's 15,000 residents (SEAN 13:07). Not previously discussed in the Bulletin, the TOMS image archive shows several SO2 clouds from the 1988 eruption (during 30 July-5 August 1988) as well as visible and infrared imagery (Sawada, 1994).
The following information was translated from a Center of Volcanology and Geological Hazard Mitigation (CVGHM) report dated 17 July 2009. Authorities raised the hazard status on 2 June 2009 (from normal, Alert Level 1 to 2) due to the following seismic and other observations.
The pattern of earthquakes and tremor, high for most of May 2009, decreased rapidly after the 28th (table 2). Hot explosions continued until at least mid-June from sulfurous vents on the S side of the lava dome. Emissions from these vents were off-white, with weak pressure, and they fed a plume reaching ~ 10 m above the peak.
Table 2. Seismicity recorded at Makian during 1 May-3 June 2009. Courtesy of Center of Volcanology and Geological Hazard Mitigation (CVGHM).
| Date |
Deep volcanic earthquakes |
Shallow volcanic earthquakes |
Maximum tremor amplitude |
| 01-28 May 2009 |
43 (2/day avg.) |
18 (1/day avg.) |
0.5-1 mm |
| 29-31 May 2009 |
7 (2/day avg.) |
13 (4/day avg.) |
0.5-8 mm |
| 01 June 2009 |
1 |
1 |
0.5-6 mm |
| 02-03 June 2009 |
1-10/day |
1-4/day |
-- |
An increase in tectonic earthquakes in the Maluku Utara (N Moluccas) region preceded the increased activity at Makian. No recent morphological changes have been observed. Based on observations up to 30 June 2009, the hazard status was downgraded to Alert Level 1 on 16 July. However, authorities still prohibited people from climbing to the peak.
The MODVOLC system had no recorded thermal alerts from Makian from at least the beginning of 2000 through August 2009.
Reference. Sawada, Y, 1994, Tracking of Regional Volcanic Ash Clouds by Geostationary Meteorological Satellite, in Volcanic Ash and Aviation Safety: Proceedings of the First International Symposium on Volcanic Ash and Aviation Safety, edited by Thomas J. Casadevall, U.S. Geological Survey Bulletin 2047.
Geologic Background. Kie Besi volcano, forming the 10-km-wide Makian island off the west coast of Halmahera, has been the source of infrequent, but strong eruptions that have devastated villages on the island. The large 1.5-km-wide summit crater, containing a small lake on the NE side, gives the peak a flat-topped profile. Two prominent valleys extend to the coast from the summit crater on the north and east sides. Four cones are found on the western flanks. Eruption have been recorded since about 1550; major eruptions in 1646, 1760-61, 1861-62, 1890, and 1988 caused extensive damage and many fatalities.
Information Contacts: Center of Volcanology and Geological Hazard Mitigation (CVGHM), Jalan Diponegoro 57, Bandung 40122, Indonesia (URL: http://vsi.esdm.go.id/); Hawai'i Institute of Geophysics and Planetology (HIGP) Thermal Alerts System, School of Ocean and Earth Science and Technology (SOEST), Univ. of Hawai'i, 2525 Correa Road, Honolulu, HI 96822, USA (URL: http://modis.higp.hawaii.edu/).
Rumble III (New Zealand) — July 2009 Cite this Report
Rumble III
New Zealand
35.745°S, 178.478°E; summit elev. -220 m
All times are local (unless otherwise noted)
Submarine summit craters underwent collapse and eruption
GNS Science in New Zealand issued a press release on 12 March 2009 reporting that scientists have returned from exploring submarine volcanoes in the Kermadec arc, where they found evidence of a recent large eruption at Rumble III (figure 2). While mapping the volcano aboard the University of Washington research vessel Thomas G. Thompson on 11 March 2009, they found that marked changes had occurred in the bathymetry of the summits and ash deposits there since their previous visit in 2007. The base of the volcano sits at a depth of 1.4 km.
A 2007 bathymetric map prepared by GNS Science showed an 800-m-wide crater near the top of Rumble III. The map, made aboard the RV Thompson in 2009, showed that this crater has been in-filled and a nearby summit cone had been reduced in height by ~ 100 m. "This suggests there has been a major eruption that collapsed the summit cone and filled the adjacent crater," said Co-Chief Scientist on the voyage, Cornel de Ronde of GNS Science. He also stated that the date of collapse was not known.
According to the same report, images taken by a WHOI underwater camera towed by the research ship showed strewn lava boulders covered by black volcanic ash near the summit. Consistent with the lowering of the summit, de Ronde noted that hydrothermal plumes emanating from the summit vents were more vigorous than observed previously. In addition, some new and deeper vents were discovered.
Olivier Hyvernaud looked for acoustic (T-wave) signals recorded by the French Polynesian network that may have originated from Rumble III. He reported that the Laboratoire de Géophysique in Tahiti did not see any acoustic events from that location.
Geologic Background. Rumble III seamount, the largest of the Rumbles group of submarine volcanoes along the South Kermadec Ridge, rises 2,300 m from the seafloor to within about 200 m of the surface. Collapse of the edifice produced a scarp open to the west and a large debris-avalanche deposit. Fresh-looking andesitic rocks have been dredged from the summit and basaltic lava from its flanks. It has been the source of several submarine eruptions detected by hydrophone signals.
Information Contacts: GNS Science, Wairakei Research Centre, Private Bag 2000, Taupo 3352, New Zealand (URL: http://www.gns.cri.nz/); Cornel de Ronde, GNS Science (URL: http://www.gns.cri.nz/); Olivier Hyvernaud, Laboratoire de Géophysique, Commissariat a l'Energie Atomique (CEA/DASE/LDG), PO Box 640, Papeete, Tahiti, French Polynesia.
Sangeang Api (Indonesia) — July 2009 Cite this Report
Sangeang Api
Indonesia
8.2°S, 119.07°E; summit elev. 1912 m
All times are local (unless otherwise noted)
Increased seismicity, including explosion earthquakes, during May-June 2009
According to the Center of Volcanology and Geological Hazard Mitigation (CVGHM), restlessness began at Sangeang Api in May and June 2009. In early May 2009 white emissions reached heights of ~ 5-25 m. In addition, occasional explosion earthquakes and generally minor seismicity continued (table 3). In addition, an earthquake struck on 1-2 June 2009 that was felt at a Modified Mercali intensity of MM I.
Table 3. Summary of reported volcanic activity at Sangeang Api. Courtesy of the Center of Volcanology and Geological Hazard Mitigation (CVGHM).
| Date |
Explosions |
Tremor and amplitude |
Deep volcanic earthquakes |
Shallow volcanic earthquakes |
| 01-17 May 2009 |
Avg. ~3/day |
continuous, 3 mm |
Avg. ~2/day |
~1/day |
| 18-31 May 2009 |
~13/day |
continuous, 7 mm |
~4/day |
~2/day |
| 01-02 Jun 2009 |
~21/day |
continuous, 5 mm |
~2/day |
1/day |
| 03 Jun 2009 |
11 |
continuous, 6 mm |
7 |
-- |
On 4 June the Alert Level was raised to 2 (on a scale of 1-4) due to the increases in the number of explosion earthquakes, tremor, and other local earthquakes. Residents and visitors were prohibited from climbing the volcano. No thermal anomalies have been seen in MODIS imagery between 1999 and August 2009.
Geologic Background. Sangeang Api volcano, one of the most active in the Lesser Sunda Islands, forms a small 13-km-wide island off the NE coast of Sumbawa Island. Two large trachybasaltic-to-tranchyandesitic volcanic cones, Doro Api and Doro Mantoi, were constructed in the center and on the eastern rim, respectively, of an older, largely obscured caldera. Flank vents occur on the south side of Doro Mantoi and near the northern coast. Intermittent eruptions have been recorded since 1512, most of them during in the 20th century.
Information Contacts: Center of Volcanology and Geological Hazard Mitigation (CVGHM), Jalan Diponegoro 57, Bandung 40122, Indonesia (URL: http://vsi.esdm.go.id/).
Suwanosejima (Japan) — July 2009 Cite this Report
Suwanosejima
Japan
29.638°N, 129.714°E; summit elev. 796 m
All times are local (unless otherwise noted)
Explosive eruptions continue through 6 July 2009
This small uninhabited island, one of Japan's most active volcanoes, lies ~ 175 km SSW of Kyushu Island. Previous reports on Suwanose-jima (BGVN 30:07, 32:11, 33:02, and 33:09) listed ash plumes between 28 April 2004 and 26 October 2008. This report continues the compilation through 6 July 2009 (table 8). Ash plumes were consistent and minor, below ~ 2.5 km altitude.
Table 8. A summary of Tokyo Volcanic Ash Advisory Center (VAAC) reports on explosive events and ash plumes from Suwanose-jima, 29 October 2008 to 6 July 2009. For some events, observers detected an explosion but were unable to observe a plume (indicated by --). Courtesy of Tokyo VAAC, based on information from the Japanese Meteorological Agency (JMA), pilot reports, and satellite imagery.
| Date (UTC) |
Plume Altitude (km) |
Drift Direction |
| 29-30 Oct 2008 |
1.5-1.8 |
E |
| 31 Oct-01 Nov 2008 |
-- |
-- |
| 03 Nov 2008 |
1.5-1.8 |
E |
| 05 Nov 2008 |
1.5 |
NE |
| 07 Nov-08 Nov 2008 |
1.2-1.8 |
E |
| 12 Nov-16 Nov 2008 |
-- |
-- |
| 13 Nov-15 Nov 2008 |
1.5-2.1 |
-- |
| 21 Nov 2008 |
1.5 |
E |
| 25 Nov 2008 |
-- |
-- |
| 10 Dec-12 Dec 2008 |
0.9-1.8 |
E |
| 14 Dec-17 Dec 2008 |
0.9-1.8 |
E |
| 19 Dec-20 Dec 2008 |
1.5 |
E (17, 19 Dec) |
| 26 Dec-28 Dec 2008 |
1.5-1.8 |
-- |
| 30 Dec 2008 |
-- |
-- |
| 03 Jan 2009 |
1.2 |
E |
| 09 Jan 2009 |
-- |
-- |
| 21 Jan 2009 |
-- |
-- |
| 18 Feb 2009 |
0.4 |
-- |
| 19 Feb-21 Feb 2009 |
-- |
-- |
| 26 Feb-02 Mar 2009 |
1.2-1.5 |
E (1 Mar) |
| 03 Mar 2009 |
-- |
-- |
| 06 Mar 2009 |
-- |
-- |
| 15 Mar-16 Mar 2009 |
1.5 |
E (15 Mar) |
| 28, 30 Mar 2009 |
-- |
-- |
| 06, 8, 10 Apr 2009 |
-- |
-- |
| 21 Apr 2009 |
-- |
-- |
| 22 Apr-23 Apr 2009 |
1.2-1.5 |
E, S |
| 27 Apr 2009 |
-- |
-- |
| 28 Apr-01 May 2009 |
1.5-1.8 |
E, W |
| 07-09, 12-13 May 2009 |
-- |
-- |
| 17 May 2009 |
2.1 |
-- |
| 25 May 2009 |
1.5 |
-- |
| 16 Jun 2009 |
-- |
-- |
| 06 Jul 2009 |
-- |
-- |
Yukio Hayakawa passed along quantitative data on the explosive eruption on 18 February 2009. The maximum amplitude of ground velocity computed from the analog data was expressed in units of 10-5 m/s (in Japan this unit is expressed as mkine). The values on the 18th were 5.38 x 10⁻⁵ m/s; and the airwave was 11 Pa. Hayakawa also indicated that the two explosive eruptions on 20 February had maximum amplitudes of 4.31 x 10⁻⁵ m/s and 5.76 x 10⁻⁵ m/s, respectively. The airwaves recorded were 20 and 18 Pa, respectively at microphones.
A visible-wavelength image from MODIS captured a small Suwanose-jima plume on 5 July 2009 (figure 13). As of mid-2009, no thermal alerts had been recorded by MODVOLC since 22 September 2008. The island is often covered by clouds, thwarting detection.
Geologic Background. The 8-km-long island of Suwanosejima in the northern Ryukyu Islands consists of an andesitic stratovolcano with two active summit craters. The summit is truncated by a large breached crater extending to the sea on the E flank that was formed by edifice collapse. One of Japan's most frequently active volcanoes, it was in a state of intermittent Strombolian activity from Otake, the NE summit crater, between 1949 and 1996, after which periods of inactivity lengthened. The largest recorded eruption took place in 1813-14, when thick scoria deposits covered residential areas, and the SW crater produced two lava flows that reached the western coast. At the end of the eruption the summit of Otake collapsed, forming a large debris avalanche and creating an open collapse scarp extending to the eastern coast. The island remained uninhabited for about 70 years after the 1813-1814 eruption. Lava flows reached the eastern coast of the island in 1884. Only about 50 people live on the island.
Information Contacts: Tokyo Volcanic Ash Advisory Center (VAAC), Tokyo, Japan (URL: http://ds.data.jma.go.jp/svd/vaac/data/); Japan Meteorological Agency (JMA), Otemachi, 1-3-4, Chiyoda-ku Tokyo 100-8122, Japan (URL: http://www.jma.go.jp/); U.S. Air Force Weather Agency (AFWA)/XOGM, Offutt Air Force Base, NE 68113, USA; Hawai'i Institute of Geophysics and Planetology (HIGP) Thermal Alerts System, School of Ocean and Earth Science and Technology (SOEST), Univ. of Hawai'i, 2525 Correa Road, Honolulu, HI 96822, USA (URL: http://modis.higp.hawaii.edu/); Yukio Hayakawa, Gunma University, Faculty of Education, Aramaki 4-2, Maebashi 371-8510, Japan.
Talang
Indonesia
0.979°S, 100.681°E; summit elev. 2575 m
All times are local (unless otherwise noted)
Sudden occurrence of over 900 earthquakes on 16-17 August 2009
Talang had an increase in seismicity during mid-2009. Minor tremor and emissions of ash and sulfur dioxide (SO2) occurred during 2007 (BGVN 33:02). The Alert Level was lowered to 2 (on a scale of 1-4) on 14 December 2007 based on visual observations and a decrease in earthquakes.
In their report of 17 August the Center of Volcanology and Geological Hazard Mitigation (CVGHM) reported seismic activity between 1430 on 16 August through 0600 on 17 August. On 15 August there were four deep volcanic events and one low-frequency earthquake. Over the next two days they recorded 917 deep volcanic and another 30 shallow volcanic earthquakes, along with continuous tremor. Because of the significant increase in seismic activity, CVGHM increased the Alert Level from 2 to 3. It also stepped up its monitoring and assigned an emergency response team to conduct an onsite evaluation. Foggy conditions prevented visual observations. Visitors and tourists were advised not to go within 3-km of the summit.
Geologic Background. Talang, which forms a twin volcano with the extinct Pasar Arbaa volcano, lies ESE of the major city of Padang and rises NW of Dibawah Lake. Talang has two crater lakes on its flanks; the largest of these is 1 x 2 km wide Danau Talang. The summit exhibits fumarolic activity, but which lacks a crater. Historical eruptions have mostly involved small-to-moderate explosive activity first documented in the 19th century that originated from a series of small craters in a valley on the upper NE flank.
Information Contacts: Center of Volcanology and Geological Hazard Mitigation (CVGHM), Jalan Diponegoro 57, Bandung 40122, Indonesia (URL: http://vsi.esdm.go.id/).
Tungurahua (Ecuador) — July 2009 Cite this Report
Tungurahua
Ecuador
1.467°S, 78.442°W; summit elev. 5023 m
All times are local (unless otherwise noted)
Eruptions in 2008-2009; two fatalities in sudden flood on 22 August 2008
Our previous report on Ecuador's Tungurahua (BGVN 33:06) summarized the ongoing activity through mid-February 2008. This report covers February 2008-July 2009. The Instituto Geofísico-Escuela Politécnica Nacional (IG) has maintained a continuous watch on Tungurahua in order to provide immediate alert of significantly heightened activity to prevent as much damage to property and population as possible. Several pyroclastic flows occurred.
Steam and ash plumes have been continuous since early 2008. These plumes have generally risen to ~8-9 km with occasional higher plumes as a result of increased activity. Ashfalls were frequently associated with the steam, gas and ash emissions, and deposited small layers of the larger particles downwind, sometimes 8-11 km from the crater. On 1 March 2009, an explosion produced a significant plume that rose to an altitude of ~10 km and drifted NW. By 3 March, the ash on the volcano's W side covered at least 2.5 km2 of cropland, and additional cattle-grazing pasture.
Ashfall accumulation (figure 41) was recorded for a time interval slightly before the current reporting interval, but the available later maps were similar. Towns affected on figure 41 included Choglontús, El Manzano, Palitahua, Cahuají, Sabañag, Santa Fe de Galán, Penipe, and Bayushig. Lighter ashfall was also repeatedly noted in Riobamba and Guano.
On various occasions, incandescence and the ejection of large blocks were Strombolian in character. Roaring, explosions, and "cannon shot" noises were reported almost daily. On 4 August 2008 one explosion was heard as far away as Ambato, 31 km to the NW.
Lahars, floods, and two fatalities. Lahars or mudflows descended drainages to the NW, W, SW, and S repeatedly during the reporting period (many times per week). On 8 March 2008, lahars transported blocks up to 3 m in diameter; in many other cases the largest blocks were around 1 m in diameter. Lahars occasionally affected roads in the Pampas sector to the S and disrupted the access road to Baños.
On 21 August 2008, intense rains prompted the Volcanic Observatory of Tungurahua (OVT) to issue a warning of potential lahars in the Vascún river. A natural dam in that river had been previously identified as a potential hazard.
On 22 August, the dam ruptured and a flood descended. A bridge crossing the river on the outskirts of Baños endured the flooding but was overridden by ~ 20 cm above the railing (figure 42). The flood also destroyed two homes and the El Salado public pools, 1,700-1,800 m downstream of the dam (figure 43). Two people were reported injured and two were reported missing and presumably killed.
Lahars on 23 October again descended the Vascún river, causing a landslide and rupturing a water pipe that serviced Baños. On 1 November, lahars descended multiple drainages, carrying blocks up to 1 m in diameter to the SW. Residents bordering the Vascún river temporarily evacuated, but returned after the rain stopped.
Pyroclastic flows and explosive activity. Explosive activity continued through the reporting period, including pyroclastic flows. Noteworthy pyroclastic flows occurred on 29 May 2008, when they descended the N and NW flanks of Tungurahua, with deposits observed the next day. In July 2008, a pyroclastic flow was associated with significant ash and tephra fall (with grains up to ~ 3 mm in diameter) reported in the towns of Cahuají, Chazo, Palestina, Santa Fe de Galán, and Guaranda.
Explosions often ejected incandescent blocks that rolled downslope; on 21 June 2009, lava fountains that rose to a height of 500 m above the crater expelled incandescent blocks that were later discovered as far as 2 km downslope. Notable pyroclastic flows, explosions, as well as some lahars and ash plumes were reported (tables 16 and 17).
Table 16. Tungurahua behavior during 19 February-30 December 2008. Only selected examples of near-daily lahars are shown. A map and table of Tungurahua's drainages (quebradas) and surrounding towns appeared previously (BGVN 29:01); locations mentioned include the Mapayacu and Choglontus drainages to the SW; the Pampas sector to the S; Cusúa, 7 km to the NW; Manzano, 8 km to the SW; and the particularly vulnerable city of Baños, 8 km to the N. Courtesy of IG.
| Date |
Observations |
| 19, 20, 25 Feb 2008 |
Lahars affected roads in Pampas sector |
| 06 and 08 Mar 2008 |
Lahars descended W and S drainages; some carried blocks up to 3 m in diameter |
| 25 Mar 2008 |
Explosions; incandescent blocks from summit fell on flanks |
| 09, 12, 13 Apr 2008 |
Lahars and mudflows on S and NW drainages that disrupted the access road to Banos |
| 21 Apr 2008 |
A lahar disrupted the Ambato-Banos road for a few hours |
| 23 Apr 2008 |
Blocks rolled 600 m down the flanks |
| 01 May 2008 |
Explosions and intense summit incandescence; windows vibrated in areas 6 km NE |
| 11 May 2008 |
Blocks rolled ~1 km down the flanks |
| 12 May 2008 |
Explosion; rockfalls occurred in an area 8 km to the S |
| 17-18 May 2008 |
Explosion similar to that on 12 May; windows rattled in areas to the SW and W |
| 19 May 2008 |
Large explosion; numerous incandescent blocks rolled ~1.6 km down the flanks |
| 22, 25-27 May 2008 |
Windows vibrated in nearby areas, including at the observatory (OVT) in Guadalupe |
| 23 May 2008 |
Marked increase in explosions, ash plumes, and ashfall; summit incandescence at night |
| 29 May 2008 |
Pyroclastic flows descended the N and NW flanks, with deposits observed the next day |
| 15 Jun 2008 |
Lahars descended the NW and S drainages and resulted in a road closure to the S |
| 19 Jun 2008 |
Blocks ejected 500 m above the summit and rolled ~1 km down the flanks |
| 20 Jun 2008 |
Mudflow to the SW towards the Puela river carried blocks up to 80 cm in diameter |
| 31 Jul, 03-04 Aug 2008 |
Blocks rolled ~1 km downslope; ashfall to SW and W; an explosion on the 4th |
| 19-22 Sep 2008 |
Small mudflows in the W and NW; a lahar 50 cm thick to the S |
| 23 Oct 2008 |
Muddy waters caused a landslide and a ruptured water pipe that serviced Banos |
| 01 Nov 2008 |
Lahars carried blocks ~50-70 cm in diameter in Juive, La Pampas, and Bilbao |
| 04 Nov 2008 |
Light ashfall was reported in Pallate and part of Riobamba |
| 15 Dec 2008 |
An ash column rose to ~1 km |
| 15-24 Dec 2008 |
Ash columns reached a height of ~6 km |
| 17, 21-23 Dec 2008 |
Ejecta visible from Guadalupe Observatory |
| 23 Dec 2008 |
Incandescent material rolled down flanks |
| 24 Dec 2008 |
Small pyroclastic flow on NW flank; incandescent lava flowed down one of the flanks |
| 25-26, 28-30 Dec 2008 |
Blocks rolled 500 m downslope on 25 Dec, 1,500 m on 29 Dec, and 800 m on 30 Dec; heavy black ash fell in areas to the SW |
Table 17. Tungurahua behavior during 2 January-7 July 2009. Only selected examples of near-daily lahars are shown. Courtesy of IG.
| Date |
Observations |
| 02-04 Jan 2009 |
Blocks rolled ~800 m down the flanks; Strombolian activity on 4 Jan |
| 07, 10 Jan 2009 |
Incandescent blocks rolled down flanks |
| 08 Jan 2009 |
Continuing gas-and-vapor emission; ash columns less than 2 km high drifted W, NW, SW, and NE. Ashfall in El Manzano, Choglontus, Palictahu and Cahuaji |
| 16 Feb 2009 |
Ash emissions that generated a plume with altitude of ~8 km and drifted W |
| 01 Mar 2009 |
Ash plume that rose to an altitude of ~10 km and drifted NW |
| 03 Mar 2009 |
Ashfall covering at least 2.5 km2 of cropland and additional cattle-grazing pasture |
| 21 Mar 2009 |
Lahars carried blocks up to 30 cm in diameter to the SW |
| 26 Mar 2009 |
Lahar in the Mapayacu drainage carried blocks up to 2 m in diameter |
| 06 Apr 2009 |
Fumarolic plumes rose 500-600 m; light ashfall reported 8 km SW |
| 14 Apr 2009 |
A steam-and-gas plume containing some ash rose to an altitude of ~7.5 km and drifted N |
| 22 Apr 2009 |
Incandescent blocks ejected from the crater and rolled down flanks |
| 06 May 2009 |
Ashfall reported in Banos, ~8 km to the N |
| 13, 18 May 2009 |
A fine layer of ash fell in Manzano, 8 km to the SW |
| 24-26 May 2009 |
Incandescence from the crater seen and blocks rolled 100-500 m down the flanks |
| 27 May-02 Jun 2009 |
Strombolian activity |
| 21 Jun 2009 |
Lava fountains rising to a height of 500 m above the crater |
| 02, 05-07 Jul 2009 |
Lahars descended SW and W drainages carrying blocks up to 40 cm in diameter |
Geologic Background. Tungurahua, a steep-sided andesitic-dacitic stratovolcano that towers more than 3 km above its northern base, is one of Ecuador's most active volcanoes. Three major edifices have been sequentially constructed since the mid-Pleistocene over a basement of metamorphic rocks. Tungurahua II was built within the past 14,000 years following the collapse of the initial edifice. Tungurahua II collapsed about 3,000 years ago and produced a large debris-avalanche deposit to the west. The modern glacier-capped stratovolcano (Tungurahua III) was constructed within the landslide scarp. Historical eruptions have all originated from the summit crater, accompanied by strong explosions and sometimes by pyroclastic flows and lava flows that reached populated areas at the volcano's base. Prior to a long-term eruption beginning in 1999 that caused the temporary evacuation of the city of Baños at the foot of the volcano, the last major eruption had occurred from 1916 to 1918, although minor activity continued until 1925.
Information Contacts: Geophysical Institute (IG), Escuela Politécnica Nacional, Apartado 17-01-2759, Quito, Ecuador (URL: http://www.igepn.edu.ec/); Washington Volcanic Ash Advisory Center, Satellite Analysis Branch (SAB), NOAA/NESDIS E/SP23, NOAA Science Center Room 401, 5200 Auth Rd, Camp Springs, MD 20746, USA (URL: http://www.ospo.noaa.gov/Products/atmosphere/vaac/).
Uzon
Russia
54.4885°N, 159.9741°E; summit elev. 1617 m
All times are local (unless otherwise noted)
Valley of Geysers two years after the major landslide of June 2007
Our previous report on the Valley of Geysers (BGVN 32:07) discussed a major landslide on 3 June 2007 that seriously damaged the landscape and destroyed several beautiful geysers. Scientists again visited the area about two years after the landslide. One of the geysers that was a few meters underwater returned to life after the confining lake waters dropped below the geyser's rim.
The following report came chiefly from Vladimir L. Leonov and his son, A.V. Leonov, who wrote an informal description of events (Leonov, 2008). The S-trending Valley of Geysers cuts radially across the topographic margin of the Geysernaya caldera at the SE end of the Uzon-Geysernaya caldera complex (figure 9).
As previously reported, the landslide created a dam on the Geysernaya River, forming a lake. According to Leonov (2008), the lake surface rose to a maximum elevation of 435 m on 7 June 2007, before eroding, causing a rapid decline in water level to 426 m elevation.
During July and August 2007, the Emergency and Disaster Relief Ministry and volunteers deepened the new bed of the Geysernaya River by hand to lower the lake level by another 2 m, thus freeing the Bolshoi geyser vent from the cover of lake water. After these efforts, on 19 September 2007, the Bolshoi geyser revived and erupted for the first time since the 2007 landslide.
When studied in October 2008, the Bolshoi geyser (figure 10) responded to minor fluctuations of the water level in the lake. Bolshoi was seen to operate in either the regime of a geyser or in the regime of a pulsating source. When the water was low, the geyser regime was seen. With the rise of water of only about 10-15 cm (as a result rains or the melting of snow ) the water began to pour out of Bolshoi's vent in episodic pulsations.
The thickest section of landslide completely covered the 30-m waterfall at Vodopadny Creek (a branch of the Geysernaya River), and the geysers Troynoi (Triple), Sakharny (Sugary), and Sosed (Neighbor) (figures 11 and 12).
Reference. Leonov, A.V., 2008, Valley of Geysers 500 days later; (URL: http://spanishflyer.livejournal.com/39861.html); accessed on 6 July 2009.
Geologic Background. The Uzon and Geysernaya calderas, containing Kamchatka's largest geothermal area, form a 7 x 18 km depression that originated during multiple mid-Pleistocene eruptions. Widespread ignimbrite deposits associated with caldera formation have a volume of 20-25 km3 (exclusive of airfall deposits) and cover an area of 1,700 km2. Post-caldera activity was largely Pleistocene in age and consisted of the extrusion of small silicic lava domes and flows and maar formation in the Geysernaya caldera. The Lake Dal'ny maar in the NE part of the 9 x 12 km western Uzon caldera is early Holocene in age, and several Holocene phreatic eruptions have been documented in the Geysernaya caldera. The extensive high-temperature hydrothermal system includes the many hot springs, mudpots, and geysers of the Valley of Geysers, a 4-km-long canyon on the SE margin of the depression. Hydrothermal explosions took place in the caldera in 1986 and 1989.
Information Contacts: Vladimir L. Leonov, Institute of Volcanology and Seismology FED RAS, Far East Division, Russian Academy of Sciences, Piip Ave. 9, Petropavlovsk-Kamchatsky 683006, Russia (URL: http://www.kscnet.ru/ivs/kvert/); Milkovo (URL: http://www.milkovo.ru/); Dmitry Zadirey, Air Company Kamchatka Airlines, Yelizovo, Russia.