Recently Published Bulletin Reports
Erebus (Antarctica) Lava lake remains active; most thermal alerts recorded since 2019
Rincon de la Vieja (Costa Rica) Frequent phreatic explosions during July-December 2023
Bezymianny (Russia) Explosion on 18 October 2023 sends ash plume 8 km high; lava flows and incandescent avalanches
Kilauea (United States) Low-level lava effusions in the lava lake at Halema’uma’u during July-December 2022
Nyamulagira (DR Congo) Lava flows and thermal activity during May-October 2023
Bagana (Papua New Guinea) Explosions, ash plumes, ashfall, and lava flows during April-September 2023
Mayon (Philippines) Lava flows, pyroclastic flows, ash emissions, and seismicity during April-September 2023
Nishinoshima (Japan) Eruption plumes and gas-and-steam plumes during May-August 2023
Krakatau (Indonesia) White gas-and-steam plumes and occasional ash plumes during May-August 2023
Villarrica (Chile) Strombolian activity, gas-and-ash emissions, and crater incandescence during April-September 2023
Merapi (Indonesia) Frequent incandescent avalanches during April-September 2023
Ebeko (Russia) Moderate explosive activity with ash plumes continued during June-November 2023
Erebus (Antarctica) — January 2024  Cite this Report
Erebus
Antarctica
77.53°S, 167.17°E; summit elev. 3794 m
All times are local (unless otherwise noted)
Lava lake remains active; most thermal alerts recorded since 2019
The lava lake in the summit crater of Erebus has been active since at least 1972. Located in Antarctica overlooking the McMurdo Station on Ross Island, it is the southernmost active volcano on the planet. Because of the remote location, activity is primarily monitored by satellites. This report covers activity during 2023.
The number of thermal alerts recorded by the Hawai'i Institute of Geophysics and Planetology’s MODVOLC Thermal Alerts System increased considerably in 2023 compared to the years 2020-2022 (table 9). In contrast to previous years, the MODIS instruments aboard the Aqua and Terra satellites captured data from Erebus every month during 2023. Consistent with previous years, the lowest number of anomalous pixels were recorded in January, November, and December.
Table 9. Number of monthly MODIS-MODVOLC thermal alert pixels recorded at Erebus during 2017-2023. See BGVN 42:06 for data from 2000 through 2016. The table was compiled using data provided by the HIGP – MODVOLC Thermal Alerts System.
| Year |
Jan |
Feb |
Mar |
Apr |
May |
Jun |
Jul |
Aug |
Sep |
Oct |
Nov |
Dec |
SUM |
| 2017 |
0 |
21 |
9 |
0 |
0 |
1 |
11 |
61 |
76 |
52 |
0 |
3 |
234 |
| 2018 |
0 |
21 |
58 |
182 |
55 |
17 |
137 |
172 |
103 |
29 |
0 |
0 |
774 |
| 2019 |
2 |
21 |
162 |
151 |
55 |
56 |
75 |
53 |
29 |
19 |
1 |
0 |
624 |
| 2020 |
0 |
2 |
16 |
18 |
4 |
4 |
1 |
3 |
18 |
3 |
1 |
6 |
76 |
| 2021 |
0 |
9 |
1 |
0 |
2 |
56 |
46 |
47 |
35 |
52 |
5 |
3 |
256 |
| 2022 |
1 |
13 |
55 |
22 |
15 |
32 |
39 |
19 |
31 |
11 |
0 |
0 |
238 |
| 2023 |
2 |
33 |
49 |
82 |
41 |
32 |
70 |
64 |
42 |
17 |
5 |
11 |
448 |
Sentinel-2 infrared images showed one or two prominent heat sources within the summit crater, accompanied by adjacent smaller sources, similar to recent years (see BGVN 46:01, 47:02, and 48:01). A unique image was obtained on 25 November 2023 by the OLI-2 (Operational Land Imager-2) on Landsat 9, showing the upper part of the volcano surrounded by clouds (figure 32).
Geologic Background. Mount Erebus, the world's southernmost historically active volcano, overlooks the McMurdo research station on Ross Island. It is the largest of three major volcanoes forming the crudely triangular Ross Island. The summit of the dominantly phonolitic volcano has been modified by one or two generations of caldera formation. A summit plateau at about 3,200 m elevation marks the rim of the youngest caldera, which formed during the late-Pleistocene and within which the modern cone was constructed. An elliptical 500 x 600 m wide, 110-m-deep crater truncates the summit and contains an active lava lake within a 250-m-wide, 100-m-deep inner crater; other lava lakes are sometimes present. The glacier-covered volcano was erupting when first sighted by Captain James Ross in 1841. Continuous lava-lake activity with minor explosions, punctuated by occasional larger Strombolian explosions that eject bombs onto the crater rim, has been documented since 1972, but has probably been occurring for much of the volcano's recent history.
Information Contacts: Hawai'i Institute of Geophysics and Planetology (HIGP) - MODVOLC Thermal Alerts System, School of Ocean and Earth Science and Technology (SOEST), Univ. of Hawai'i, 2525 Correa Road, Honolulu, HI 96822, USA (URL: http://modis.higp.hawaii.edu/); Copernicus Browser, Copernicus Data Space Ecosystem, European Space Agency (URL: https://dataspace.copernicus.eu/browser/); NASA Earth Observatory, EOS Project Science Office, NASA Goddard Space Flight Center, Goddard, Maryland, USA (URL: https://earthobservatory.nasa.gov/images/152134/erebus-breaks-through).
Rincon de la Vieja (Costa Rica) — January 2024 Cite this Report
Rincon de la Vieja
Costa Rica
10.83°N, 85.324°W; summit elev. 1916 m
All times are local (unless otherwise noted)
Frequent phreatic explosions during July-December 2023
Rincón de la Vieja is a volcanic complex in Costa Rica with a hot convecting acid lake that exhibits frequent weak phreatic explosions, gas-and-steam emissions, and occasional elevated sulfur dioxide levels (BGVN 45:10, 46:03, 46:11). The current eruption period began June 2021. This report covers activity during July-December 2023 and is based on weekly bulletins and occasional daily reports from the Observatorio Vulcanologico Sismologica de Costa Rica-Universidad Nacional (OVSICORI-UNA).
Numerous weak phreatic explosions continued during July-December 2023, along with gas-and-steam emissions and plumes that rose as high as 3 km above the crater rim. Many weekly OVSICORI-UNA bulletins included the previous week's number of explosions and emissions (table 9). For many explosions, the time of explosion was given (table 10). Frequent seismic activity (long-period earthquakes, volcano-tectonic earthquakes, and tremor) accompanied the phreatic activity.
Table 9. Number of reported weekly phreatic explosions and gas-and-steam emissions at Rincón de la Vieja, July-December 2023. Counts are reported for the week before the Weekly Bulletin date; not all reports included these data. Courtesy of OVSICORI-UNA.
| OVSICORI Weekly Bulletin |
Number of explosions |
Number of emissions |
| 28 Jul 2023 |
6 |
14 |
| 4 Aug 2023 |
10 |
12 |
| 1 Sep 2023 |
13 |
11 |
| 22 Sep 2023 |
12 |
13 |
| 29 Sep 2023 |
6 |
11 |
| 6 Oct 2023 |
12 |
5 |
| 13 Oct 2023 |
7 |
9 |
| 20 Oct 2023 |
1 |
15 |
| 27 Oct 2023 |
3 |
23 |
| 3 Nov 2023 |
3 |
10 |
| 17 Nov 2023 |
0 |
Some |
| 24 Nov 2023 |
0 |
14 |
| 8 Dec 2023 |
4 |
16 |
| 22 Dec 2023 |
8 |
18 |
Table 10. Summary of activity at Rincón de la Vieja during July-December 2023. Weak phreatic explosions and gas emissions are noted where the time of explosion was indicated in the weekly or daily bulletins. Height of plumes or emissions are distance above the crater rim. Courtesy of OVSICORI-UNA.
| Date |
Time |
Description of Activity |
| 1 Jul 2023 |
0156 |
Explosion. |
| 2 Jul 2023 |
0305 |
Explosion. |
| 4 Jul 2023 |
0229, 0635 |
Event at 0635 produced a gas-and-steam plume that rose 700 m and drifted W; seen by residents in Liberia (21 km SW). |
| 9 Jul 2023 |
1843 |
Explosion. |
| 21 Jul 2023 |
0705 |
Explosion. |
| 26 Jul 2023 |
1807 |
Explosion. |
| 28 Jul 2023 |
0802 |
Explosion generated a gas-and-steam plume that rose 500 m. |
| 30 Jul 2023 |
1250 |
Explosion. |
| 31 Jul 2023 |
2136 |
Explosion. |
| 11 Aug 2023 |
0828 |
Explosion. |
| 18 Aug 2023 |
1304 |
Explosion. |
| 21 Aug 2023 |
1224 |
Explosion generated gas-and-steam plumes rose 500-600 m. |
| 22 Aug 2023 |
0749 |
Explosion generated gas-and-steam plumes rose 500-600 m. |
| 24 Aug 2023 |
1900 |
Explosion. |
| 25 Aug 2023 |
0828 |
Event produced a steam-and-gas plume that rose 3 km and drifted NW. |
| 27-28 Aug 2023 |
0813 |
Four small events; the event at 0813 on 28 August lasted two minutes and generated a steam-and-gas plume that rose 2.5 km. |
| 1 Sep 2023 |
1526 |
Explosion generated plume that rose 2 km and ejected material onto the flanks. |
| 2-3 Sep 2023 |
- |
Small explosions detected in infrasound data. |
| 4 Sep 2023 |
1251 |
Gas-and-steam plume rose 1 km and drifted W. |
| 7 Nov 2023 |
1113 |
Explosion. |
| 8 Nov 2023 |
0722 |
Explosion. |
| 12 Nov 2023 |
0136 |
Small gas emissions. |
| 14 Nov 2023 |
0415 |
Small gas emissions. |
According to OVSICORI-UNA, during July-October the average weekly sulfur dioxide (SO2) flux ranged from 68 to 240 tonnes/day. However, in mid-November the flux increased to as high as 334 tonnes/day, the highest value measured in recent years. The high SO2 flux in mid-November was also detected by the TROPOMI instrument on the Sentinel-5P satellite (figure 43).
Geologic Background. Rincón de la Vieja, the largest volcano in NW Costa Rica, is a remote volcanic complex in the Guanacaste Range. The volcano consists of an elongated, arcuate NW-SE-trending ridge constructed within the 15-km-wide early Pleistocene Guachipelín caldera, whose rim is exposed on the south side. Sometimes known as the "Colossus of Guanacaste," it has an estimated volume of 130 km3 and contains at least nine major eruptive centers. Activity has migrated to the SE, where the youngest-looking craters are located. The twin cone of Santa María volcano, the highest peak of the complex, is located at the eastern end of a smaller, 5-km-wide caldera and has a 500-m-wide crater. A Plinian eruption producing the 0.25 km3 Río Blanca tephra about 3,500 years ago was the last major magmatic eruption. All subsequent eruptions, including numerous historical eruptions possibly dating back to the 16th century, have been from the prominent active crater containing a 500-m-wide acid lake located ENE of Von Seebach crater.
Information Contacts: Observatorio Vulcanológico Sismológica de Costa Rica-Universidad Nacional (OVSICORI-UNA), Apartado 86-3000, Heredia, Costa Rica (URL: http://www.ovsicori.una.ac.cr/); NASA Global Sulfur Dioxide Monitoring Page, Atmospheric Chemistry and Dynamics Laboratory, NASA Goddard Space Flight Center (NASA/GSFC), 8800 Greenbelt Road, Goddard MD 20771, USA (URL: https://so2.gsfc.nasa.gov/).
Bezymianny (Russia) — November 2023 Cite this Report
Bezymianny
Russia
55.972°N, 160.595°E; summit elev. 2882 m
All times are local (unless otherwise noted)
Explosion on 18 October 2023 sends ash plume 8 km high; lava flows and incandescent avalanches
Bezymianny, located on Russia’s Kamchatka Peninsula, has had eruptions since 1955 characterized by dome growth, explosions, pyroclastic flows, ash plumes, and ashfall. Activity during November 2022-April 2023 included gas-and-steam emissions, lava dome collapses generating avalanches, and persistent thermal activity. Similar eruptive activity continued from May through October 2023, described here based on information from weekly and daily reports of the Kamchatka Volcano Eruptions Response Team (KVERT), notices from Tokyo VAAC (Volcanic Ash Advisory Center), and from satellite data.
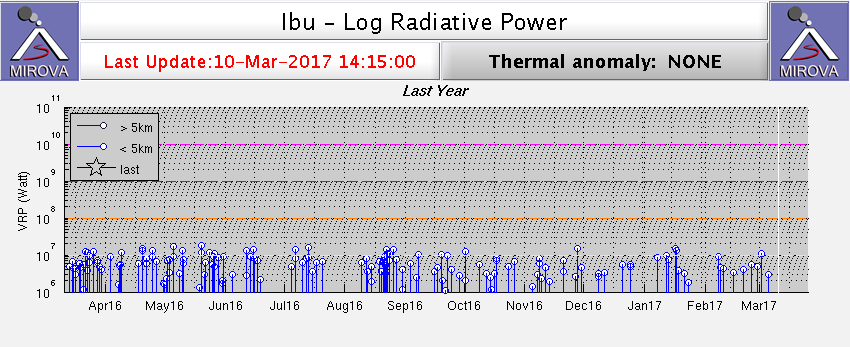
Overall activity decreased after the strong period of activity in late March through April 2023, which included ash explosions during 29 March and 7-8 April 2023 that sent plumes as high as 10-12 km altitude, along with dome growth and lava flows (BGVN 48:05). This reduced activity can be seen in the MIROVA thermal detection system graph (figure 56), which was consistent with data from the MODVOLC thermal detection system and with Sentinel-2 satellite images that showed persistent hotspots in the summit crater when conditions allowed observations. A renewed period of strong activity began in mid-October 2023.
Activity increased significantly on 17 October 2023 when large collapses began during 0700-0830 on the E flanks of the lava dome and continued to after 0930 the next day (figure 57). Ash plumes rose to an altitude of 4.5-5 km, extending 220 km NNE by 18 October. A large explosion at 1630 on 18 October produced an ash plume that rose to an altitude of 11 km (8 km above the summit) and drifted NNE and then NW, extending 900 km NW within two days at an altitude of 8 km. Minor ashfall was noted in Kozyrevsk (45 km WNW). At 0820 on 20 October an ash plume was identified in satellite images drifting 100 km ENE at altitudes of 4-4.5 km.
Lava flows and hot avalanches from the dome down the SE flank continued over the next few days, including 23 October when clear conditions allowed good observations (figures 58 and 59). A large thermal anomaly was observed over the volcano through 24 October, and in the summit crater on 30 October (figure 60). Strong fumarolic activity continued, with numerous avalanches and occasional incandescence. By the last week of October, volcanic activity had decreased to a level consistent with that earlier in the reporting period.
Aviation warnings were frequently updated during 17-20 October. KVERT issued a Volcano Observatory Notice for Aviation (VONA) on 17 October at 1419 and 1727 (0219 and 0527 UTC) raising the Aviation Color Code (ACC) from Yellow to Orange (second highest level). The next day, KVERT issued a VONA at 1705 (0505 UTC) raising the ACC to Red (highest level) but lowered it back to Orange at 2117 (0917 UTC). After another decrease to Yellow and back to Orange, the ACC was reduced to Yellow on 20 October at 1204 (0004 UTC). In addition, the Tokyo VAAC issued a series of Volcanic Ash Advisories beginning on 16 October and continuing through 30 October.
Geologic Background. The modern Bezymianny, much smaller than its massive neighbors Kamen and Kliuchevskoi on the Kamchatka Peninsula, was formed about 4,700 years ago over a late-Pleistocene lava-dome complex and an edifice built about 11,000-7,000 years ago. Three periods of intensified activity have occurred during the past 3,000 years. The latest period, which was preceded by a 1,000-year quiescence, began with the dramatic 1955-56 eruption. This eruption, similar to that of St. Helens in 1980, produced a large open crater that was formed by collapse of the summit and an associated lateral blast. Subsequent episodic but ongoing lava-dome growth, accompanied by intermittent explosive activity and pyroclastic flows, has largely filled the 1956 crater.
Information Contacts: Kamchatka Volcanic Eruptions Response Team (KVERT), Far Eastern Branch, Russian Academy of Sciences, 9 Piip Blvd., Petropavlovsk-Kamchatsky, 683006, Russia (URL: http://www.kscnet.ru/ivs/kvert/); Kamchatka Volcanological Station, Kamchatka Branch of Geophysical Survey, (KB GS RAS), Klyuchi, Kamchatka Krai, Russia (URL: http://volkstat.ru/); Tokyo Volcanic Ash Advisory Center (VAAC), 1-3-4 Otemachi, Chiyoda-ku, Tokyo 100-8122, Japan (URL: http://ds.data.jma.go.jp/svd/vaac/data/); Hawai'i Institute of Geophysics and Planetology (HIGP) - MODVOLC Thermal Alerts System, School of Ocean and Earth Science and Technology (SOEST), Univ. of Hawai'i, 2525 Correa Road, Honolulu, HI 96822, USA (URL: http://modis.higp.hawaii.edu/); MIROVA (Middle InfraRed Observation of Volcanic Activity), a collaborative project between the Universities of Turin and Florence (Italy) supported by the Centre for Volcanic Risk of the Italian Civil Protection Department (URL: http://www.mirovaweb.it/); Copernicus Browser, Copernicus Data Space Ecosystem, European Space Agency (URL: https://dataspace.copernicus.eu/browser/).chr
Kilauea (United States) — January 2023 Cite this Report
Kilauea
United States
19.421°N, 155.287°W; summit elev. 1222 m
All times are local (unless otherwise noted)
Low-level lava effusions in the lava lake at Halema’uma’u during July-December 2022
Kīlauea is the southeastern-most volcano in Hawaii and overlaps the E flank of the Mauna Loa volcano. Its East Rift Zone (ERZ) has been intermittently active for at least 2,000 years. An extended eruption period began in January 1983 and was characterized by open lava lakes and lava flows from the summit caldera and the East Rift Zone. During May 2018 magma migrated into the Lower East Rift Zone (LERZ) and opened 24 fissures along a 6-km-long NE-trending fracture zone that produced lava flows traveling in multiple directions. As lava emerged from the fissures, the lava lake at Halema'uma'u drained and explosions sent ash plumes to several kilometers altitude (BGVN 43:10).
The current eruption period started during September 2021 and has recently been characterized by lava effusions, spatter, and sulfur dioxide emissions in the active Halema’uma’u lava lake (BGVN 47:08). Lava effusions, some spatter, and sulfur dioxide emissions have continued during this reporting period of July through December 2022 using daily reports, volcanic activity notices, and abundant photo, map, and video data from the US Geological Survey's (USGS) Hawaiian Volcano Observatory (HVO).
Summary of activity during July-December 2022. Low-level effusions have continued at the western vent of the Halema’uma’u crater during July through early December 2022. Occasional weak ooze-outs (also called lava break outs) would occur along the margins of the crater floor. The overall level of the active lava lake throughout the reporting period gradually increased due to infilling, however it stagnated in mid-September (table 13). During September through November, activity began to decline, though lava effusions persisted at the western vent. By 9 December, the active part of the lava lake had completely crusted over, and incandescence was no longer visible.
Table 13. Summary of measurements taken during overflights at Kīlauea that show a gradual increase in the active lava lake level and the volume of lava effused since 29 September 2021. Lower activity was reported during September-October. Data collected during July-December 2022. Courtesy of HVO.
| Date: |
Level of the active lava lake (m): |
Cumulative volume of lava effused (million cubic meters): |
| 7 Jul 2022 |
130 |
95 |
| 19 Jul 2022 |
133 |
98 |
| 4 Aug 2022 |
136 |
102 |
| 16 Aug 2022 |
137 |
104 |
| 12 Sep 2022 |
143 |
111 |
| 5 Oct 2022 |
143 |
111 |
| 28 Oct 2022 |
143 |
111 |
Activity during July 2022. Lava effusions were reported from the western vent in the Halema’uma’u crater, along with occasional weak ooze-outs along the margins of the crater floor. The height of the lava lake was variable due to deflation-inflation tilt events; for example, the lake level dropped approximately 3-4 m during a summit deflation-inflation event reported on 1 July. Webcam images taken during the night of 6-12 July showed intermittent low-level spattering at the western vent that rose less than 10 m above the vent (figure 519). Measurements made during an overflight on 7 July indicated that the crater floor was infilled about 130 m and that 95 million cubic meters of lava had been effused since 29 September 2021. A single, relatively small lava ooze-out was active to the S of the lava lake. Around midnight on 8 July there were two brief periods of lava overflow onto the lake margins. On 9 July lava ooze-outs were reported near the SE and NE edges of the crater floor and during 10-11 July they occurred near the E, NE, and NW edges. On 16 July crater incandescence was reported, though the ooze-outs and spattering were not visible. On 18 July overnight webcam images showed incandescence in the western vent complex and two ooze-outs were reported around 0000 and 0200 on 19 July. By 0900 there were active ooze-outs along the SW edge of the crater floor. Measurements made from an overflight on 19 July indicated that the crater floor was infilled about 133 m and 98 million cubic meters of lava had erupted since 29 September 2021 (figure 520). On 20 July around 1600 active ooze-outs were visible along the N edge of the crater, which continued through the next day. Extensive ooze-outs occurred along the W margin during 24 July until 1900; on 26 July minor ooze-outs were noted along the N margin. Minor spattering was visible on 29 July along the E margin of the lake. The sulfur dioxide emission rates ranged 650-2,800 tons per day (t/d), the higher of which was measured on 8 July (figure 519).
Activity during August 2022. The eruption continued in the Halema’uma’u crater at the western vent. According to HVO the lava in the active lake remained at the level of the bounding levees. Occasional minor ooze-outs were observed along the margins of the crater floor. Strong nighttime crater incandescence was visible after midnight on 6 August over the western vent cone. During 6-7 August scattered small lava lobes were active along the crater floor and incandescence persisted above the western vent through 9 August. During 7-9 August HVO reported a single lava effusion source was active along the NW margin of the crater floor. Measurements from an overflight on 4 August indicated that the crater floor was infilled about 136 m total and that 102 million cubic meters of lava had been erupted since the start of the eruption. Lava breakouts were reported along the N, NE, E, S, and W margins of the crater during 10-16 August. Another overflight survey conducted on 16 August indicated that the crater floor infilled about 137 m and 104 million cubic meters of lava had been erupted since September 2021. Measured sulfur dioxide emissions rates ranged 1,150-2,450 t/d, the higher of which occurred on 8 August.
Activity during September 2022. During September, lava effusion continued from the western vent into the active lava lake and onto the crater floor. Intermittent minor ooze-outs were reported through the month. A small ooze-out was visible on the W crater floor margin at 0220 on 2 September, which showed decreasing surface activity throughout the day, but remained active through 3 September. On 3 September around 1900 a lava outbreak occurred along the NW margin of the crater floor but had stopped by the evening of 4 September. Field crews monitoring the summit lava lake on 9 September observed spattering on the NE margin of the lake that rose no higher than 10 m, before falling back onto the lava lake crust (figure 521). Overflight measurements on 12 September indicated that the crater floor was infilled a total of 143 m and 111 million cubic meters of lava had been erupted since September 2021. Extensive breakouts in the W and N part of the crater floor were reported at 1600 on 20 September and continued into 26 September. The active part of the lava lake dropped by 10 m while other parts of the crater floor dropped by several meters. Summit tiltmeters recorded a summit seismic swarm of more than 80 earthquakes during 1500-1800 on 21 September, which occurred about 1.5 km below Halema’uma’u; a majority of these were less than Mw 2. By 22 September the active part of the lava lake was infilled about 2 m. On 23 September the western vent areas exhibited several small spatter cones with incandescent openings, along with weak, sporadic spattering (figure 522). The sulfur dioxide emission rate ranged from 930 t/d to 2,000 t/d, the higher of which was measured on 6 September.
Activity during October 2022. Activity during October declined slightly compared to previous months, though lava effusions persisted from the western vent into the active lava lake and onto the crater floor during October (figure 523). Slight variations in the lava lake were noted throughout the month. HVO reported that around 0600 on 3 October the level of the lava lake has lowered slightly. Overflight measurements taken on 5 October indicated that the crater floor was infilled a total of about 143 m and that 111 million cubic meters of lava had been effused since September 2021. During 6-7 October the lake gradually rose 0.5 m. Sulfur dioxide measurements made on 22 October had an emission rate of 700 t/d. Another overflight taken on 28 October showed that there was little to no change in the elevation of the crater floor: the crater floor was infilled a total of 143 m and 111 million cubic meters of lava had erupted since the start of the eruption.
Activity during November 2022. Activity remained low during November, though HVO reported that lava from the western vent continued to effuse into the active lava lake and onto the crater floor throughout the month. The rate of sulfur dioxide emissions during November ranged from 300-600 t/d, the higher amount of which occurred on 9 November.
Activity during December 2022. Similar low activity was reported during December, with lava effusing from the western vent into the active lava lake and onto the crater floor. During 4-5 December the active part of the lava lake was slightly variable in elevation and fluctuated within 1 m. On 9 December HVO reported that lava was no longer erupting from the western vent in the Halema’uma’u crater and that sulfur dioxide emissions had returned to near pre-eruption background levels; during 10-11 December, the lava lake had completely crusted over, and no incandescence was visible (figure 524). Time lapse camera images covering the 4-10 December showed that the crater floor showed weak deflation and no inflation. Some passive events of crustal overturning were reported during 14-15 December, which brought fresh incandescent lava to the lake surface. The sulfur dioxide emission rate was approximately 200 t/d on 14 December. A smaller overturn event on 17 December and another that occurred around 0000 and into the morning of 20 December were also detected. A small seismic swarm was later detected on 30 December.
Geologic Background. Kilauea overlaps the E flank of the massive Mauna Loa shield volcano in the island of Hawaii. Eruptions are prominent in Polynesian legends; written documentation since 1820 records frequent summit and flank lava flow eruptions interspersed with periods of long-term lava lake activity at Halemaumau crater in the summit caldera until 1924. The 3 x 5 km caldera was formed in several stages about 1,500 years ago and during the 18th century; eruptions have also originated from the lengthy East and Southwest rift zones, which extend to the ocean in both directions. About 90% of the surface of the basaltic shield volcano is formed of lava flows less than about 1,100 years old; 70% of the surface is younger than 600 years. The long-term eruption from the East rift zone between 1983 and 2018 produced lava flows covering more than 100 km2, destroyed hundreds of houses, and added new coastline.
Information Contacts: Hawaiian Volcano Observatory (HVO), U.S. Geological Survey, PO Box 51, Hawai'i National Park, HI 96718, USA (URL: http://hvo.wr.usgs.gov/).
Nyamulagira (DR Congo) — November 2023 Cite this Report
Nyamulagira
DR Congo
1.408°S, 29.2°E; summit elev. 3058 m
All times are local (unless otherwise noted)
Lava flows and thermal activity during May-October 2023
Nyamulagira (also known as Nyamuragira) is a shield volcano in the Democratic Republic of Congo with the summit truncated by a small 2 x 2.3 km caldera with walls up to about 100 m high. Documented eruptions have occurred within the summit caldera, as well as from numerous flank fissures and cinder cones. The current eruption period began in April 2018 and has more recently been characterized by summit crater lava flows and thermal activity (BGVN 48:05). This report describes lava flows and variable thermal activity during May through October 2023, based on information from the Observatoire Volcanologique de Goma (OVG) and various satellite data.
Lava lake activity continued during May. The MIROVA (Middle InfraRed Observation of Volcanic Activity) system recorded moderate-to-strong thermal activity throughout the reporting period; activity was more intense during May and October and relatively weaker from June through September (figure 95). The MODVOLC thermal algorithm, detected a total of 209 thermal alerts. There were 143 hotspots detected during May, eight during June, nine during September, and 49 during October. This activity was also reflected in infrared satellite images, where a lava flow was visible in the NW part of the crater on 7 May and strong activity was seen in the center of the crater on 4 October (figure 96). Another infrared satellite image taken on 12 May showed still active lava flows along the NW margin of the crater. According to OVG lava effusions were active during 7-29 May and moved to the N and NW parts of the crater beginning on 9 May. Strong summit crater incandescence was visible from Goma (27 km S) during the nights of 17, 19, and 20 May (figure 97). On 17 May there was an increase in eruptive activity, which peaked at 0100 on 20 May. Notable sulfur dioxide plumes drifted NW and W during 19-20 May (figure 98). Drone footage acquired in partnership with the USGS (United States Geological Survey) on 20 May captured images of narrow lava flows that traveled about 100 m down the W flank (figure 99). Data from the Rumangabo seismic station indicated a decreasing trend in activity during 17-21 May. Although weather clouds prevented clear views of the summit, a strong thermal signature on the NW flank was visible in an infrared satellite image on 22 May, based on an infrared satellite image. On 28 May the lava flows on the upper W flank began to cool and solidify. By 29 May seismicity returned to levels similar to those recorded before the 17 May increase. Lava effusion continued but was confined to the summit crater; periodic crater incandescence was observed.
Low-level activity was noted during June through October. On 1 June OVG reported that seismicity remained at lower levels and that crater incandescence had been absent for three days, though infrared satellite imagery showed continued lava effusion in the summit crater. The lava flows on the flanks covered an estimated 0.6 km2. Satellite imagery continued to show thermal activity confined to the lava lake through October (figure 96), although no lava flows or significant sulfur dioxide emissions were reported.
Geologic Background. Africa's most active volcano, Nyamulagira (also known as Nyamuragira), is a massive high-potassium basaltic shield about 25 km N of Lake Kivu and 13 km NNW of the steep-sided Nyiragongo volcano. The summit is truncated by a small 2 x 2.3 km caldera that has walls up to about 100 m high. Documented eruptions have occurred within the summit caldera, as well as from the numerous flank fissures and cinder cones. A lava lake in the summit crater, active since at least 1921, drained in 1938, at the time of a major flank eruption. Recent lava flows extend down the flanks more than 30 km from the summit as far as Lake Kivu; extensive lava flows from this volcano have covered 1,500 km2 of the western branch of the East African Rift.
Information Contacts: Observatoire Volcanologique de Goma (OVG), Departement de Geophysique, Centre de Recherche en Sciences Naturelles, Lwiro, D.S. Bukavu, DR Congo; Hawai'i Institute of Geophysics and Planetology (HIGP) - MODVOLC Thermal Alerts System, School of Ocean and Earth Science and Technology (SOEST), Univ. of Hawai'i, 2525 Correa Road, Honolulu, HI 96822, USA (URL: http://modis.higp.hawaii.edu/); MIROVA (Middle InfraRed Observation of Volcanic Activity), a collaborative project between the Universities of Turin and Florence (Italy) supported by the Centre for Volcanic Risk of the Italian Civil Protection Department (URL: http://www.mirovaweb.it/); NASA Global Sulfur Dioxide Monitoring Page, Atmospheric Chemistry and Dynamics Laboratory, NASA Goddard Space Flight Center (NASA/GSFC), 8800 Greenbelt Road, Goddard, Maryland, USA (URL: https://so2.gsfc.nasa.gov/); Copernicus Browser, Copernicus Data Space Ecosystem, European Space Agency (URL: https://dataspace.copernicus.eu/browser/); Charles Balagizi, Goma Volcano Observatory, Departement de Geophysique, Centre de Recherche en Sciences Naturelles, Lwiro, D.S. Bukavu, DR Congo.
Bagana (Papua New Guinea) — October 2023 Cite this Report
Bagana
Papua New Guinea
6.137°S, 155.196°E; summit elev. 1855 m
All times are local (unless otherwise noted)
Explosions, ash plumes, ashfall, and lava flows during April-September 2023
The remote volcano of Bagana is located in central Bougainville Island, Papua New Guinea. Recorded eruptions date back to 1842 and activity has consisted of effusive activity that has built a small lava dome in the summit crater and occasional explosions that produced pyroclastic flows. The most recent eruption has been ongoing since February 2000 and has produced occasional explosions, ash plumes, and lava flows. More recently, activity has been characterized by ongoing effusive activity and ash emissions (BGVN 48:04). This report updates activity from April through September 2023 that has consisted of explosions, ash plumes, ashfall, and lava flows, using information from the Darwin Volcanic Ash Advisory Center (VAAC) and satellite data.
An explosive eruption was reported on 7 July that generated a large gas-and-ash plume to high altitudes and caused significant ashfall in local communities; the eruption plume had reached upper tropospheric (16-18 km altitude) altitudes by 2200, according to satellite images. Sulfur dioxide plumes were detected in satellite images on 8 July and indicated that the plume was likely a mixture of gas, ice, and ash. A report issued by the Autonomous Bougainville Government (ABG) (Torokina District, Education Section) on 10 July noted that significant ash began falling during 2000-2100 on 7 July and covered most areas in the Vuakovi, Gotana (9 km SW), Koromaketo, Laruma (25 km W) and Atsilima (27 km NW) villages. Pyroclastic flows also occurred, according to ground-based reports; small deposits confined to one drainage were inspected by RVO during an overflight on 17 July and were confirmed to be from the 7 July event. Ashfall continued until 10 July and covered vegetation, which destroyed bushes and gardens and contaminated rivers and streams.
RVO reported another eruption on 14 July. The Darwin VAAC stated that an explosive event started around 0830 on 15 July and produced an ash plume that rose to 16.5 km altitude by 1000 and drifted N, according to satellite images. The plume continued to drift N and remained visible through 1900, and by 2150 it had dissipated.
Ashfall likely from both the 7 and 15 July events impacted about 8,111 people in Torokina (20 km SW), including Tsito/Vuakovi, Gotana, Koromaketo, Kenaia, Longkogari, Kenbaki, Piva (13 km SW), and Atsinima, and in the Tsitovi district, according to ABG. Significant ashfall was also reported in Ruruvu (22 km N) in the Wakunai District of Central Bougainville, though the thickness of these deposits could not be confirmed. An evacuation was called for the villages in Wakunai, where heavy ashfall had contaminated water sources; the communities of Ruruvu, Togarau, Kakarapaia, Karauturi, Atao, and Kuritaturi were asked to evacuate to a disaster center at the Wakunai District Station, and communities in Torokina were asked to evacuate to the Piva District station. According to a news article, more than 7,000 people needed temporary accommodations, with about 1,000 people in evacuation shelters. Ashfall had deposited over a broad area, contaminating water supplies, affecting crops, and collapsing some roofs and houses in rural areas. Schools were temporarily shut down. Intermittent ash emissions continued through the end of July and drifted NNW, NW, and SW. Fine ashfall was reported on the coast of Torokina, and ash plumes also drifted toward Laruma and Atsilima.
A small explosive eruption occurred at 2130 on 28 July that ejected material from the crater vents, according to reports from Torokina, in addition to a lava flow that contained two lobes. A second explosion was detected at 2157. Incandescence from the lava flow was visible from Piva as it descended the W flank around 2000 on 29 July (figure 47). The Darwin VAAC reported that a strong thermal anomaly was visible in satellite images during 30-31 July and that ash emissions rose to 2.4 km altitude and drifted WSW on 30 July. A ground report from RVO described localized emissions at 0900 on 31 July.
The Darwin VAAC reported that ash plumes were identified in satellite imagery at 0800 and 1220 on 12 August and rose to 2.1 km and 3 km altitude and drifted NW and W, respectively. A news report stated that aid was sent to more than 6,300 people that were adversely affected by the eruption. Photos taken during 17-19 August showed ash emissions rising no higher than 1 km above the summit and drifting SE. A small explosion generated an ash plume during the morning of 19 August. Deposits from small pyroclastic flows were also captured in the photos. Satellite images captured lava flows and pyroclastic flow deposits. Two temporary seismic stations were installed near Bagana on 17 August at distances of 7 km WSW (Vakovi station) and 11 km SW (Kepox station). The Kepox station immediately started to record continuous, low-frequency background seismicity.
Satellite data. Little to no thermal activity was detected during April through mid-July 2023; only one anomaly was recorded during early April and one during early June, according to MIROVA (Middle InfraRed Observation of Volcanic Activity) data (figure 48). Thermal activity increased in both power and frequency during mid-July through September, although there were still some short gaps in detected activity. MODVOLC also detected increased thermal activity during August; thermal hotspots were detected a total of five times on 19, 20, and 27 August. Weak thermal anomalies were also captured in infrared satellite images on clear weather days throughout the reporting period on 7, 12, and 17 April, 27 May, 1, 6, 16, and 31 July, and 19 September (figure 48); a strong thermal anomaly was visible on 31 July. Distinct sulfur dioxide plumes that drifted generally NW were intermittently captured by the TROPOMI instrument on the Sentinel-5P satellite and sometimes exceeded two Dobson Units (DUs) (figure 49).
Geologic Background. Bagana volcano, in a remote portion of central Bougainville Island, is frequently active. This massive symmetrical cone was largely constructed by an accumulation of viscous andesitic lava flows. The entire edifice could have been constructed in about 300 years at its present rate of lava production. Eruptive activity is characterized by non-explosive effusion of viscous lava that maintains a small lava dome in the summit crater, although occasional explosive activity produces pyroclastic flows. Lava flows with tongue-shaped lobes up to 50 m thick and prominent levees descend the flanks on all sides.
Information Contacts: Rabaul Volcano Observatory (RVO), Geohazards Management Division, Department of Mineral Policy and Geohazards Management (DMPGM), PO Box 3386, Kokopo, East New Britain Province, Papua New Guinea; Darwin Volcanic Ash Advisory Centre (VAAC), Bureau of Meteorology, Northern Territory Regional Office, PO Box 40050, Casuarina, NT 0811, Australia (URL: http://www.bom.gov.au/info/vaac/); MIROVA (Middle InfraRed Observation of Volcanic Activity), a collaborative project between the Universities of Turin and Florence (Italy) supported by the Centre for Volcanic Risk of the Italian Civil Protection Department (URL: http://www.mirovaweb.it/); Hawai'i Institute of Geophysics and Planetology (HIGP) - MODVOLC Thermal Alerts System, School of Ocean and Earth Science and Technology (SOEST), Univ. of Hawai'i, 2525 Correa Road, Honolulu, HI 96822, USA (URL: http://modis.higp.hawaii.edu/); NASA Global Sulfur Dioxide Monitoring Page, Atmospheric Chemistry and Dynamics Laboratory, NASA Goddard Space Flight Center (NASA/GSFC), 8800 Greenbelt Road, Goddard, Maryland, USA (URL: https://so2.gsfc.nasa.gov/); Copernicus Browser, Copernicus Data Space Ecosystem, European Space Agency (URL: https://dataspace.copernicus.eu/browser/); Autonomous Bougainville Government, P.O Box 322, Buka, AROB, PNG (URL: https://abg.gov.pg/); Andrew Tupper (Twitter: @andrewcraigtupp); Simon Carn, Geological and Mining Engineering and Sciences, Michigan Technological University, 1400 Townsend Drive, Houghton, MI 49931, USA (URL: http://www.volcarno.com/, Twitter: @simoncarn); Radio NZ (URL: https://www.rnz.co.nz/news/pacific/494464/more-than-7-000-people-in-bougainville-need-temporary-accommodation-after-eruption); USAID, 1300 Pennsylvania Ave, NW, Washington DC 20004, USA (URL: https://www.usaid.gov/pacific-islands/press-releases/aug-08-2023-united-states-provides-immediate-emergency-assistance-support-communities-affected-mount-bagana-volcanic-eruptions).
Mayon (Philippines) — October 2023 Cite this Report
Mayon
Philippines
13.257°N, 123.685°E; summit elev. 2462 m
All times are local (unless otherwise noted)
Lava flows, pyroclastic flows, ash emissions, and seismicity during April-September 2023
Mayon is located in the Philippines and has steep upper slopes capped by a small summit crater. Historical eruptions date back to 1616 CE that have been characterized by Strombolian eruptions, lava flows, pyroclastic flows, and mudflows. Eruptions mostly originated from a central conduit. Pyroclastic flows and mudflows have commonly descended many of the approximately 40 drainages that surround the volcano. The most recent eruption occurred during June through October 2022 and consisted of lava dome growth and gas-and-steam emissions (BGVN 47:12). A new eruption was reported during late April 2023 and has included lava flows, pyroclastic density currents, ash emissions, and seismicity. This report covers activity during April through September 2023 based on daily bulletins from the Philippine Institute of Volcanology and Seismology (PHIVOLCS).
During April through September 2023, PHIVOLCS reported near-daily rockfall events, frequent volcanic earthquakes, and sulfur dioxide measurements. Gas-and-steam emissions rose 100-900 m above the crater and drifted in different directions. Nighttime crater incandescence was often visible during clear weather and was accompanied by incandescent avalanches of material. Activity notably increased during June when lava flows were reported on the S, SE, and E flanks (figure 52). The MIROVA graph (Middle InfraRed Observation of Volcanic Activity) showed strong thermal activity coincident with these lava flows, which remained active through September (figure 53). According to the MODVOLC thermal algorithm, a total of 110 thermal alerts were detected during the reporting period: 17 during June, 40 during July, 27 during August, and 26 during September. During early June, pyroclastic density currents (PDCs) started to occur more frequently.
Low activity was reported during much of April and May; gas-and-steam emissions rose 100-900 m above the crater and generally drifted in different directions. A total of 52 rockfall events and 18 volcanic earthquakes were detected during April and 147 rockfall events and 13 volcanic events during May. Sulfur dioxide flux measurements ranged between 400-576 tons per day (t/d) during April, the latter of which was measured on 29 April and between 162-343 t/d during May, the latter of which was measured on 13 May.
Activity during June increased, characterized by lava flows, pyroclastic density currents (PDCs), crater incandescence and incandescent rockfall events, gas-and-steam emissions, and continued seismicity. Weather clouds often prevented clear views of the summit, but during clear days, moderate gas-and-steam emissions rose 100-2,500 m above the crater and drifted in multiple directions. A total of 6,237 rockfall events and 288 volcanic earthquakes were detected. The rockfall events often deposited material on the S and SE flanks within 700-1,500 m of the summit crater and ash from the events drifted SW, S, SE, NE, and E. Sulfur dioxide emissions ranged between 149-1,205 t/d, the latter of which was measured on 10 June. Short-term observations from EDM and electronic tiltmeter monitoring indicated that the upper slopes were inflating since February 2023. Longer-term ground deformation parameters based on EDM, precise leveling, continuous GPS, and electronic tilt monitoring indicated that the volcano remained inflated, especially on the NW and SE flanks. At 1000 on 5 June the Volcano Alert Level (VAL) was raised to 2 (on a 0-5 scale). PHIVOLCS noted that although low-level volcanic earthquakes, ground deformation, and volcanic gas emissions indicated unrest, the steep increase in rockfall frequency may indicate increased dome activity.
A total of 151 dome-collapse PDCs occurred during 8-9 and 11-30 June, traveled 500-2,000 m, and deposited material on the S flank within 2 km of the summit crater. During 8-9 June the VAL was raised to 3. At approximately 1947 on 11 June lava flow activity was reported; two lobes traveled within 500 m from the crater and deposited material on the S (Mi-isi), SE (Bonga), and E (Basud) flanks. Weak seismicity accompanied the lava flow and slight inflation on the upper flanks. This lava flow remained active through 30 June, moving down the S and SE flank as far as 2.5 km and 1.8 km, respectively and depositing material up to 3.3 km from the crater. During 15-16 June traces of ashfall from the PDCs were reported in Sitio Buga, Nabonton, City of Ligao and Purok, and San Francisco, Municipality of Guinobatan. During 28-29 June there were two PDCs generated by the collapse of the lava flow front, which generated a light-brown ash plume 1 km high. Satellite monitors detected significant concentrations of sulfur dioxide beginning on 29 June. On 30 June PDCs primarily affected the Basud Gully on the E flank, the largest of which occurred at 1301 and lasted eight minutes, based on the seismic record. Four PDCs generated between 1800 and 2000 that lasted approximately four minutes each traveled 3-4 km on the E flank and generated an ash plume that rose 1 km above the crater and drifted N and NW. Ashfall was recorded in Tabaco City.
Similar strong activity continued during July; slow lava effusion remained active on the S and SE flanks and traveled as far as 2.8 km and 2.8 km, respectively and material was deposited as far as 4 km from the crater. There was a total of 6,983 rockfall events and 189 PDCs that affected the S, SE, and E flanks. The volcano network detected a total of 2,124 volcanic earthquakes. Continuous gas-and-steam emissions rose 200-2,000 m above the crater and drifted in multiple directions. Sulfur dioxide emissions averaged 792-4,113 t/d, the latter of which was measured on 28 July. During 2-4 July three PDCs were generated from the collapse of the lava flow and resulting light brown plumes rose 200-300 m above the crater. Continuous tremor pulses were reported beginning at 1547 on 3 July through 7 July at 1200, at 2300 on 8 July and going through 0300 on 10 July, and at 2300 on 16 July, as recorded by the seismic network. During 6-9 July there were 10 lava flow-collapse-related PDCs that generated light brown plumes 300-500 m above the crater. During 10-11 July light ashfall was reported in some areas of Mabinit, Legazpi City, Budiao and Salvacion, Daraga, and Camalig, Albay. By 18 July the lava flow advanced 600 m on the E flank as well.
During 1733 on 18 July and 0434 on 19 July PHIVOLCS reported 30 “ashing” events, which are degassing events accompanied by audible thunder-like sounds and entrained ash at the crater, which produced short, dark plumes that drifted SW. These events each lasted 20-40 seconds, and plume heights ranged from 150-300 m above the crater, as recorded by seismic, infrasound, visual, and thermal monitors. Three more ashing events occurred during 19-20 July. Short-term observations from electronic tilt and GPS monitoring indicate deflation on the E lower flanks in early July and inflation on the NW middle flanks during the third week of July. Longer-term ground deformation parameters from EDM, precise leveling, continuous GPS, and electronic tilt monitoring indicated that the volcano was still generally inflated relative to baseline levels. A short-lived lava pulse lasted 28 seconds at 1956 on 21 July, which was accompanied by seismic and infrasound signals. By 22 July, the only lava flow that remained active was on the SE flank, and continued to extend 3.4 km, while those on the S and E flanks weakened markedly. One ashing event was detected during 30-31 July, whereas there were 57 detected during 31 July-1 August; according to PHIVOLCS beginning at approximately 1800 on 31 July eruptive activity was dominated by phases of intermittent ashing, as well as increased in the apparent rates of lava effusion from the summit crater. The ashing phases consisted of discrete events recorded as low-frequency volcanic earthquakes (LFVQ) typically 30 seconds in duration, based on seismic and infrasound signals. Gray ash plume rose 100 m above the crater and generally drifted NE. Shortly after these ashing events began, new lava began to effuse rapidly from the crater, feeding the established flowed on the SE, E, and E flanks and generating frequent rockfall events.
Intensified unrest persisted during August. There was a total of 4,141 rockfall events, 2,881 volcanic earthquakes, which included volcanic tremor events, 32 ashing events, and 101 PDCs detected throughout the month. On clear weather days, gas-and-steam emissions rose 300-1,500 m above the crater and drifted in different directions (figure 54). Sulfur dioxide emissions averaged 735-4,756 t/d, the higher value of which was measured on 16 August. During 1-2 August the rate of lava effusion decreased, but continued to feed the flows on the SE, S, and E flanks, maintaining their advances to 3.4 km, 2.8 km, and 1.1 km from the crater, respectively (figure 55). Rockfall and PDCs generated by collapses at the lava flow margins and from the summit dome deposited material within 4 km of the crater. During 3-4 August there were 10 tremor events detected that lasted 1-4 minutes. Short-lived lava pulse lasted 35 seconds and was accompanied by seismic and infrasound signals at 0442 on 6 August. Seven collapses were recorded at the front of the lava flow during 12-14 August.
During September, similar activity of slow lava effusion, PDCs, gas-and-steam emissions, and seismicity continued. There was a total of 4,452 rockfall events, 329 volcanic earthquakes, which included volcanic tremor events, two ashing events, and 85 PDCs recorded throughout the month. On clear weather days, gas-and-steam emissions rose 100-1,500 m above the crater and drifted in multiple directions. Sulfur dioxide emissions averaged 609-2,252 t/d, the higher average of which was measured on 6 September. Slow lava effusion continued advancing on the SE, S, and E flanks, maintaining lengths of 3.4 km, 2.8 km, and 1.1 km, respectively. Rockfall and PDC events generated by collapses along the lava flow margins and at the summit dome deposited material within 4 km of the crater.
Geologic Background. Symmetrical Mayon, which rises above the Albay Gulf NW of Legazpi City, is the most active volcano of the Philippines. The steep upper slopes are capped by a small summit crater. Recorded eruptions since 1616 CE range from Strombolian to basaltic Plinian, with cyclical activity beginning with basaltic eruptions, followed by longer periods of andesitic lava flows. Eruptions occur predominately from the central conduit and have also produced lava flows that travel far down the flanks. Pyroclastic density currents and mudflows have commonly swept down many of the approximately 40 ravines that radiate from the summit and have often damaged populated lowland areas. A violent eruption in 1814 killed more than 1,200 people and devastated several towns.
Information Contacts: Philippine Institute of Volcanology and Seismology (PHIVOLCS), Department of Science and Technology, University of the Philippines Campus, Diliman, Quezon City, Philippines (URL: http://www.phivolcs.dost.gov.ph/); MIROVA (Middle InfraRed Observation of Volcanic Activity), a collaborative project between the Universities of Turin and Florence (Italy) supported by the Centre for Volcanic Risk of the Italian Civil Protection Department (URL: http://www.mirovaweb.it/); Hawai'i Institute of Geophysics and Planetology (HIGP) - MODVOLC Thermal Alerts System, School of Ocean and Earth Science and Technology (SOEST), Univ. of Hawai'i, 2525 Correa Road, Honolulu, HI 96822, USA (URL: http://modis.higp.hawaii.edu/); Copernicus Browser, Copernicus Data Space Ecosystem, European Space Agency (URL: https://dataspace.copernicus.eu/browser/); William Rogers, Legazpi City, Albay Province, Philippines.
Nishinoshima (Japan) — October 2023 Cite this Report
Nishinoshima
Japan
27.247°N, 140.874°E; summit elev. 100 m
All times are local (unless otherwise noted)
Eruption plumes and gas-and-steam plumes during May-August 2023
Nishinoshima, located about 1,000 km S of Tokyo, is a small island in the Ogasawara Arc in Japan. The island is the summit of a massive submarine volcano that has prominent submarine peaks to the S, W, and NE. Eruptions date back to 1973 and the current eruption period began in October 2022. Recent activity has consisted of small ash plumes and fumarolic activity (BGVN 48:07). This report covers activity during May through August 2023, using information from monthly reports of the Japan Meteorological Agency (JMA) monthly reports and satellite data.
Activity during May through June was relatively low. The Japan Coast Guard (JCG) did overflights on 14 and 22 June and reported white gas-and-steam emissions rising 600 m and 1,200 m from the central crater of the pyroclastic cone, respectively (figure 125). In addition, multiple white gas-and-steam emissions rose from the inner rim of the W side of the crater and from the SE flank of the pyroclastic cone. Discolored brown-to-green water was observed around almost the entire perimeter of the island; on 22 June light green discolored water was observed off the S coast of the island.
Observations from the Himawari meteorological satellite confirmed an eruption on 9 and 10 July. An eruption plume rose 1.6 km above the crater and drifted N around 1300 on 9 July. Satellite images acquired at 1420 and 2020 on 9 July and at 0220 on 10 July showed continuing emissions that rose 1.3-1.6 km above the crater and drifted NE and N. The Tokyo VAAC reported that an ash plume seen by a pilot and identified in a satellite image at 0630 on 21 July rose to 3 km altitude and drifted S.
Aerial observations conducted by JCG on 8 August showed a white-and-gray plume rising from the central crater of the pyroclastic cone, and multiple white gas-and-steam emissions were rising from the inner edge of the western crater and along the NW-SE flanks of the island (figure 126). Brown-to-green discolored water was also noted around the perimeter of the island.
Intermittent low-to-moderate power thermal anomalies were recorded in the MIROVA graph (Middle InfraRed Observation of Volcanic Activity), showing an increase in both frequency and power beginning in July (figure 127). This increase in activity coincides with eruptive activity on 9 and 10 July, characterized by eruption plumes. According to the MODVOLC thermal alert algorithm, one thermal hotspot was recorded on 20 July. Weak thermal anomalies were also detected in infrared satellite imagery, accompanied by strong gas-and-steam plumes (figure 128).
Geologic Background. The small island of Nishinoshima was enlarged when several new islands coalesced during an eruption in 1973-74. Multiple eruptions that began in 2013 completely covered the previous exposed surface and continued to enlarge the island. The island is the summit of a massive submarine volcano that has prominent peaks to the S, W, and NE. The summit of the southern cone rises to within 214 m of the ocean surface 9 km SSE.
Information Contacts: Japan Meteorological Agency (JMA), 1-3-4 Otemachi, Chiyoda-ku, Tokyo 100-8122, Japan (URL: http://www.jma.go.jp/jma/indexe.html); Tokyo Volcanic Ash Advisory Center (VAAC), 1-3-4 Otemachi, Chiyoda-ku, Tokyo 100-8122, Japan (URL: http://ds.data.jma.go.jp/svd/vaac/data/); MIROVA (Middle InfraRed Observation of Volcanic Activity), a collaborative project between the Universities of Turin and Florence (Italy) supported by the Centre for Volcanic Risk of the Italian Civil Protection Department (URL: http://www.mirovaweb.it/); Copernicus Browser, Copernicus Data Space Ecosystem, European Space Agency (URL: https://dataspace.copernicus.eu/browser/).
Krakatau (Indonesia) — October 2023 Cite this Report
Krakatau
Indonesia
6.1009°S, 105.4233°E; summit elev. 285 m
All times are local (unless otherwise noted)
White gas-and-steam plumes and occasional ash plumes during May-August 2023
Krakatau is located in the Sunda Strait between Java and Sumatra, Indonesia. Caldera collapse during the catastrophic 1883 eruption destroyed Danan and Perbuwatan cones and left only a remnant of Rakata. The post-collapse cone of Anak Krakatau (Child of Krakatau) was constructed within the 1883 caldera at a point between the former Danan and Perbuwatan cones; it has been the site of frequent eruptions since 1927. The current eruption period began in May 2021 and has recently consisted of Strombolian eruptions and ash plumes (BGVN 48:07). This report describes lower levels of activity consisting of ash and white gas-and-steam plumes during May through August 2023, based on information provided by the Indonesian Center for Volcanology and Geological Hazard Mitigation, referred to as Pusat Vulkanologi dan Mitigasi Bencana Geologi (PVMBG), MAGMA Indonesia, and satellite data.
Activity was relatively low during May and June. Daily white gas-and-steam emissions rose 25-200 m above the crater and drifted in different directions. Five ash plumes were detected at 0519 on 10 May, 1241 on 11 May, 0920 on 12 May, 2320 on 12 May, and at 0710 on 13 May, and rose 1-2.5 km above the crater and drifted SW. A webcam image taken on 12 May showed ejection of incandescent material above the vent. A total of nine ash plumes were detected during 6-11 June: at 1434 and 00220 on 6 and 7 June the ash plumes rose 500 m above the crater and drifted NW, at 1537 on 8 June the ash plume rose 1 km above the crater and drifted SW, at 0746 and at 0846 on 9 June the ash plumes rose 800 m and 3 km above the crater and drifted SW, respectively, at 0423, 1431, and 1750 on 10 June the ash plumes rose 2 km, 1.5 km, and 3.5 km above the crater and drifted NW, respectively, and at 0030 on 11 June an ash plume rose 2 km above the crater and drifted NW. Webcam images taken on 10 and 11 June at 0455 and 0102, respectively, showed incandescent material ejected above the vent. On 19 June an ash plume at 0822 rose 1.5 km above the crater and drifted SE.
Similar low activity of white gas-and-steam emissions and few ash plumes were reported during July and August. Daily white gas-and-steam emissions rose 25-300 m above the crater and drifted in multiple directions. Three ash plumes were reported at 0843, 0851, and 0852 on 20 July that rose 500-2,000 m above the crater and drifted NW.
The MIROVA (Middle InfraRed Observation of Volcanic Activity) graph of MODIS thermal anomaly data showed intermittent low-to-moderate power thermal anomalies during May through August 2023 (figure 140). Although activity was often obscured by weather clouds, a thermal anomaly was visible in an infrared satellite image of the crater on 12 May, accompanied by an eruption plume that drifted SW (figure 141).
Geologic Background. The renowned Krakatau (frequently mis-named as Krakatoa) volcano lies in the Sunda Strait between Java and Sumatra. Collapse of an older edifice, perhaps in 416 or 535 CE, formed a 7-km-wide caldera. Remnants of that volcano are preserved in Verlaten and Lang Islands; subsequently the Rakata, Danan, and Perbuwatan cones were formed, coalescing to create the pre-1883 Krakatau Island. Caldera collapse during the catastrophic 1883 eruption destroyed Danan and Perbuwatan, and left only a remnant of Rakata. This eruption caused more than 36,000 fatalities, most as a result of tsunamis that swept the adjacent coastlines of Sumatra and Java. Pyroclastic surges traveled 40 km across the Sunda Strait and reached the Sumatra coast. After a quiescence of less than a half century, the post-collapse cone of Anak Krakatau (Child of Krakatau) was constructed within the 1883 caldera at a point between the former Danan and Perbuwatan cones. Anak Krakatau has been the site of frequent eruptions since 1927.
Information Contacts: Pusat Vulkanologi dan Mitigasi Bencana Geologi (PVMBG, also known as Indonesian Center for Volcanology and Geological Hazard Mitigation, CVGHM), Jalan Diponegoro 57, Bandung 40122, Indonesia (URL: http://www.vsi.esdm.go.id/); MAGMA Indonesia, Kementerian Energi dan Sumber Daya Mineral (URL: https://magma.esdm.go.id/v1); MIROVA (Middle InfraRed Observation of Volcanic Activity), a collaborative project between the Universities of Turin and Florence (Italy) supported by the Centre for Volcanic Risk of the Italian Civil Protection Department (URL: http://www.mirovaweb.it/); Copernicus Browser, Copernicus Data Space Ecosystem, European Space Agency (URL: https://dataspace.copernicus.eu/browser/).
Villarrica (Chile) — October 2023 Cite this Report
Villarrica
Chile
39.42°S, 71.93°W; summit elev. 2847 m
All times are local (unless otherwise noted)
Strombolian activity, gas-and-ash emissions, and crater incandescence during April-September 2023
Villarrica, in central Chile, consists of a 2-km-wide caldera that formed about 3,500 years ago and is located at the base of the presently active cone at the NW margin of a 6-km-wide caldera. Historical eruptions eruptions date back to 1558 and have been characterized by mild-to-moderate explosive activity with occasional lava effusions. The current eruption period began in December 2014 and has recently consisted of nighttime crater incandescence, ash emissions, and seismicity (BGVN 48:04). This report covers activity during April through September 2023 and describes occasional Strombolian activity, gas-and-ash emissions, and nighttime crater incandescence. Information for this report primarily comes from the Southern Andes Volcano Observatory (Observatorio Volcanológico de Los Andes del Sur, OVDAS), part of Chile's National Service of Geology and Mining (Servicio Nacional de Geología y Minería, SERNAGEOMIN) and satellite data.
Seismicity during April consisted of long period (LP) events and tremor (TRE); a total of 9,413 LP-type events and 759 TR-type events were detected throughout the month. Nighttime crater incandescence persisted and was visible in the degassing column. Sulfur dioxide data was obtained using Differential Absorption Optical Spectroscopy Equipment (DOAS) that showed an average value of 1,450 ± 198 tons per day (t/d) during 1-15 April and 1,129 ± 201 t/d during 16-30 April, with a maximum daily value of 2,784 t/d on 9 April. Gas-and-steam emissions of variable intensities rose above the active crater as high as 1.3 km above the crater on 13 April. Strombolian explosions were not observed and there was a slight decrease in the lava lake level.
There were 14,123 LP-type events and 727 TR-type events detected during May. According to sulfur dioxide measurements taken with DOAS equipment, the active crater emitted an average value of 1,826 ± 482 t/d during 1-15 May and 912 ± 41 t/d during 16-30 May, with a daily maximum value of 5,155 t/d on 13 May. Surveillance cameras showed continuous white gas-and-steam emissions that rose as high as 430 m above the crater on 27 May. Nighttime incandescence illuminated the gas column less than 300 m above the crater rim was and no pyroclastic emissions were reported. A landslide was identified on 13 May on the E flank of the volcano 50 m from the crater rim and extending 300 m away; SERNAGEOMIN noted that this event may have occurred on 12 May. During the morning of 27 and 28 May minor Strombolian explosions characterized by incandescent ejecta were recorded at the crater rim; the last reported Strombolian explosions had occurred at the end of March.
Seismic activity during June consisted of five volcano-tectonic (VT)-type events, 21,606 LP-type events, and 2,085 TR-type events. The average value of sulfur dioxide flux obtained by DOAS equipment was 1,420 ± 217 t/d during 1-15 June and 2,562 ± 804 t/d, with a maximum daily value of 4,810 t/d on 17 June. White gas-and-steam emissions rose less than 480 m above the crater; frequent nighttime crater incandescence was reflected in the degassing plume. On 12 June an emission rose 100 m above the crater and drifted NNW. On 15 June one or several emissions resulted in ashfall to the NE as far as 5.5 km from the crater, based on a Skysat satellite image. Several Strombolian explosions occurred within the crater; activity on 15 June was higher energy and ejected blocks 200-300 m on the NE slope. Surveillance cameras showed white gas-and-steam emissions rising 480 m above the crater on 16 June. On 19 and 24 June low-intensity Strombolian activity was observed, ejecting material as far as 200 m from the center of the crater to the E.
During July, seismicity included 29,319 LP-type events, 3,736 TR-type events, and two VT-type events. DOAS equipment recorded two days of sulfur dioxide emissions of 4,220 t/d and 1,009 t/d on 1 and 13 July, respectively. Constant nighttime incandescence was also recorded and was particularly noticeable when accompanied by eruptive columns on 12 and 16 July. Minor explosive events were detected in the crater. According to Skysat satellite images taken on 12, 13, and 16 July, ashfall deposits were identified 155 m S of the crater. According to POVI, incandescence was visible from two vents on the crater floor around 0336 on 12 July. Gas-and-ash emissions rose as high as 1.2 km above the crater on 13 July and drifted E and NW. A series of gas-and-steam pulses containing some ash deposited material on the upper E flank around 1551 on 13 July. During 16-31 July, average sulfur dioxide emissions of 1,679 ± 406 t/d were recorded, with a maximum daily value of 2,343 t/d on 28 July. Fine ash emissions were also reported on 16, 17, and 23 July.
Seismicity persisted during August, characterized by 27,011 LP-type events, 3,323 TR-type events, and three VT-type events. The average value of sulfur dioxide measurements taken during 1-15 August was 1,642 ± 270 t/d and 2,207 ± 4,549 t/d during 16-31 August, with a maximum daily value of 3,294 t/d on 27 August. Nighttime crater incandescence remained visible in degassing columns. White gas-and-steam emissions rose 480 m above the crater on 6 August. According to a Skysat satellite image from 6 August, ash accumulation was observed proximal to the crater and was mainly distributed toward the E slope. White gas-and-steam emissions rose 320 m above the crater on 26 August. Nighttime incandescence and Strombolian activity that generated ash emissions were reported on 27 August.
Seismicity during September was characterized by five VT-type events, 12,057 LP-type events, and 2,058 TR-type events. Nighttime incandescence persisted. On 2 September an ash emission rose 180 m above the crater and drifted SE at 1643 (figure 125) and a white gas-and-steam plume rose 320 m above the crater. According to the Buenos Aires VAAC, periods of continuous gas-and-ash emissions were visible in webcam images from 1830 on 2 September to 0110 on 3 September. Strombolian activity was observed on 2 September and during the early morning of 3 September, the latter event of which generated an ash emission that rose 60 m above the crater and drifted 100 m from the center of the crater to the NE and SW. Ashfall was reported to the SE and S as far as 750 m from the crater. The lava lake was active during 3-4 September and lava fountaining was visible for the first time since 26 March 2023, according to POVI. Fountains captured in webcam images at 2133 on 3 September and at 0054 on 4 September rose as high as 60 m above the crater rim and ejected material onto the upper W flank. Sulfur dioxide flux of 1,730 t/d and 1,281 t/d was measured on 3 and 4 September, respectively, according to data obtained by DOAS equipment.
Strong Strombolian activity and larger gas-and-ash plumes were reported during 18-20 September. On 18 September activity was also associated with energetic LP-type events and notable sulfur dioxide fluxes (as high as 4,277 t/d). On 19 September Strombolian activity and incandescence were observed. On 20 September at 0914 ash emissions rose 50 m above the crater and drifted SSE, accompanied by Strombolian activity that ejected material less than 100 m SSE, causing fall deposits on that respective flank. SERNAGEOMIN reported that a Planet Scope satellite image taken on 20 September showed the lava lake in the crater, measuring 32 m x 35 m and an area of 0.001 km2. Several ash emissions were recorded at 0841, 0910, 1251, 1306, 1312, 1315, and 1324 on 23 September and rose less than 150 m above the crater. The sulfur dioxide flux value was 698 t/d on 23 September and 1,097 t/d on 24 September. On 24 September the Volcanic Alert Level (VAL) was raised to Orange (the third level on a four-color scale). SENAPRED maintained the Alert Level at Yellow (the middle level on a three-color scale) for the communities of Villarrica, Pucón (16 km N), Curarrehue, and Panguipulli.
During 24-25 September there was an increase in seismic energy (observed at TR-events) and acoustic signals, characterized by 1 VT-type event, 213 LP-type events, and 124 TR-type events. Mainly white gas-and-steam emissions, in addition to occasional fine ash emissions were recorded. During the early morning of 25 September Strombolian explosions were reported and ejected material 250 m in all directions, though dominantly toward the NW. On 25 September the average value of sulfur dioxide flux was 760 t/d. Seismicity during 25-30 September consisted of five VT-type events, 1,937 LP-type events, and 456 TR-type events.
During 25-29 September moderate Strombolian activity was observed and ejected material as far as the crater rim. In addition, ash pulses lasting roughly 50 minutes were observed around 0700 and dispersed ENE. During 26-27 September a TR episode lasted 6.5 hours and was accompanied by discrete acoustic signals. Satellite images from 26 September showed a spatter cone on the crater floor with one vent that measured 10 x 14 m and a smaller vent about 35 m NE of the cone. SERNAGEOMIN reported an abundant number of bomb-sized blocks up to 150 m from the crater, as well as impact marks on the snow, which indicated explosive activity. A low-altitude ash emission was observed drifting NW around 1140 on 28 September, based on webcam images. Between 0620 and 0850 on 29 September an ash emission rose 60 m above the crater and drifted NW. During an overflight taken around 1000 on 29 September scientists observed molten material in the vent, a large accumulation of pyroclasts inside the crater, and energetic degassing, some of which contained a small amount of ash. Block-sized pyroclasts were deposited on the internal walls and near the crater, and a distal ash deposit was also visible. The average sulfur dioxide flux measured on 28 September was 344 t/d. Satellite images taken on 29 September ashfall was deposited roughly 3 km WNW from the crater and nighttime crater incandescence remained visible. The average sulfur dioxide flux value from 29 September was 199 t/d. On 30 September at 0740 a pulsating ash emission rose 1.1 km above the crater and drifted NNW (figure 126). Deposits on the S flank extended as far as 4.5 km from the crater rim, based on satellite images from 30 September.
Infrared MODIS satellite data processed by MIROVA (Middle InfraRed Observation of Volcanic Activity) showed intermittent thermal activity during April through September, with slightly stronger activity detected during late September (figure 127). Small clusters of thermal activity were detected during mid-June, early July, early August, and late September. According to the MODVOLC thermal alert system, a total of four thermal hotspots were detected on 7 July and 3 and 23 September. This activity was also intermittently captured in infrared satellite imagery on clear weather days (figure 128).
Geologic Background. The glacier-covered Villarrica stratovolcano, in the northern Lakes District of central Chile, is ~15 km south of the city of Pucon. A 2-km-wide caldera that formed about 3,500 years ago is located at the base of the presently active, dominantly basaltic to basaltic andesite cone at the NW margin of a 6-km-wide Pleistocene caldera. More than 30 scoria cones and fissure vents are present on the flanks. Plinian eruptions and pyroclastic flows that have extended up to 20 km from the volcano were produced during the Holocene. Lava flows up to 18 km long have issued from summit and flank vents. Eruptions documented since 1558 CE have consisted largely of mild-to-moderate explosive activity with occasional lava effusion. Glaciers cover 40 km2 of the volcano, and lahars have damaged towns on its flanks.
Information Contacts: Servicio Nacional de Geología y Minería (SERNAGEOMIN), Observatorio Volcanológico de Los Andes del Sur (OVDAS), Avda Sta María No. 0104, Santiago, Chile (URL: http://www.sernageomin.cl/); Proyecto Observación Villarrica Internet (POVI) (URL: http://www.povi.cl/); Sistema y Servicio Nacional de Prevención y Repuesta Ante Desastres (SENAPRED), Av. Beauchef 1671, Santiago, Chile (URL: https://web.senapred.cl/); Buenos Aires Volcanic Ash Advisory Center (VAAC), Servicio Meteorológico Nacional-Fuerza Aérea Argentina, 25 de mayo 658, Buenos Aires, Argentina (URL: http://www.smn.gov.ar/vaac/buenosaires/inicio.php); MIROVA (Middle InfraRed Observation of Volcanic Activity), a collaborative project between the Universities of Turin and Florence (Italy) supported by the Centre for Volcanic Risk of the Italian Civil Protection Department (URL: http://www.mirovaweb.it/); Hawai'i Institute of Geophysics and Planetology (HIGP) - MODVOLC Thermal Alerts System, School of Ocean and Earth Science and Technology (SOEST), Univ. of Hawai'i, 2525 Correa Road, Honolulu, HI 96822, USA (URL: http://modis.higp.hawaii.edu/); Copernicus Browser, Copernicus Data Space Ecosystem, European Space Agency (URL: https://dataspace.copernicus.eu/browser/).
Merapi (Indonesia) — October 2023 Cite this Report
Merapi
Indonesia
7.54°S, 110.446°E; summit elev. 2910 m
All times are local (unless otherwise noted)
Frequent incandescent avalanches during April-September 2023
Merapi, located just north of the major city of Yogyakarta in central Java, Indonesia, has had activity within the last 20 years characterized by pyroclastic flows and lahars accompanying growth and collapse of the steep-sided active summit lava dome. The current eruption period began in late December 2020 and has more recently consisted of ash plumes, intermittent incandescent avalanches of material, and pyroclastic flows (BGVN 48:04). This report covers activity during April through September 2023, based on information from Balai Penyelidikan dan Pengembangan Teknologi Kebencanaan Geologi (BPPTKG), the Center for Research and Development of Geological Disaster Technology, a branch of PVMBG which specifically monitors Merapi. Additional information comes from the Pusat Vulkanologi dan Mitigasi Bencana Geologi (PVMBG, also known as Indonesian Center for Volcanology and Geological Hazard Mitigation, CVGHM), MAGMA Indonesia, the Darwin Volcanic Ash Advisory Centre (VAAC), and various satellite data.
Activity during April through September 2023 primarily consisted of incandescent avalanches of material that mainly affected the SW and W flanks and traveled as far as 2.3 km from the summit (table 25) and white gas-and-steam emissions that rose 10-1,000 m above the crater.
Table 25. Monthly summary of avalanches and avalanche distances recorded at Merapi during April through September 2023. The number of reported avalanches does not include instances where possible avalanches were heard but could not be visually confirmed as a result of inclement weather. Data courtesy of BPPTKG (April-September 2023 daily reports).
| Month |
Average number of avalanches per day |
Distance avalanches traveled (m) |
| Apr 2023 |
19 |
1,200-2,000 |
| May 2023 |
22 |
500-2,000 |
| Jun 2023 |
18 |
1,200-2,000 |
| Jul 2023 |
30 |
300-2,000 |
| Aug 2023 |
25 |
400-2,300 |
| Sep 2023 |
23 |
600-2,000 |
BPPTKG reported that during April and May white gas-and-steam emissions rose 10-750 m above the crater, incandescent avalanches descended 500-2,000 m on the SW and W flanks (figure 135). Cloudy weather often prevented clear views of the summit, and sometimes avalanches could not be confirmed. According to a webcam image, a pyroclastic flow was visible on 17 April at 0531. During the week of 28 April and 4 May a pyroclastic flow was reported on the SW flank, traveling up to 2.5 km. According to a drone overflight taken on 17 May the SW lava dome volume was an estimated 2,372,800 cubic meters and the dome in the main crater was an estimated 2,337,300 cubic meters.
During June and July similar activity persisted with white gas-and-steam emissions rising 10-350 m above the crater and frequent incandescent avalanches that traveled 300-2,000 m down the SW, W, and S flanks (figure 136). Based on an analysis of aerial photos taken on 24 June the volume of the SW lava dome was approximately 2.5 million cubic meters. A pyroclastic flow was observed on 5 July that traveled 2.7 km on the SW flank. According to the Darwin VAAC multiple minor ash plumes were identified in satellite images on 19 July that rose to 3.7 km altitude and drifted S and SW. During 22, 25, and 26 July a total of 17 avalanches descended as far as 1.8 km on the S flank.
Frequent white gas-and-steam emissions continued during August and September, rising 10-450 m above the crater. Incandescent avalanches mainly affected the SW and W flanks and traveled 400-2,300 m from the vent (figure 137). An aerial survey conducted on 10 August was analyzed and reported that estimates of the SW dome volume was 2,764,300 cubic meters and the dome in the main crater was 2,369,800 cubic meters.
Frequent and moderate-power thermal activity continued throughout the reporting period, according to a MIROVA (Middle InfraRed Observation of Volcanic Activity) analysis of MODIS satellite data (figure 138). There was an increase in the number of detected anomalies during mid-May. The MODVOLC thermal algorithm recorded a total of 47 thermal hotspots: six during April, nine during May, eight during June, 15 during July, four during August, and five during September. Some of this activity was captured in infrared satellite imagery on clear weather days, sometimes accompanied by incandescent material on the SW flank (figure 139).
Geologic Background. Merapi, one of Indonesia's most active volcanoes, lies in one of the world's most densely populated areas and dominates the landscape immediately north of the major city of Yogyakarta. It is the youngest and southernmost of a volcanic chain extending NNW to Ungaran volcano. Growth of Old Merapi during the Pleistocene ended with major edifice collapse perhaps about 2,000 years ago, leaving a large arcuate scarp cutting the eroded older Batulawang volcano. Subsequent growth of the steep-sided Young Merapi edifice, its upper part unvegetated due to frequent activity, began SW of the earlier collapse scarp. Pyroclastic flows and lahars accompanying growth and collapse of the steep-sided active summit lava dome have devastated cultivated lands on the western-to-southern flanks and caused many fatalities.
Information Contacts: Balai Penyelidikan dan Pengembangan Teknologi Kebencanaan Geologi (BPPTKG), Center for Research and Development of Geological Disaster Technology (URL: http://merapi.bgl.esdm.go.id/, Twitter: @BPPTKG); MAGMA Indonesia, Kementerian Energi dan Sumber Daya Mineral (URL: https://magma.esdm.go.id/v1); Pusat Vulkanologi dan Mitigasi Bencana Geologi (PVMBG, also known as Indonesian Center for Volcanology and Geological Hazard Mitigation, CVGHM), Jalan Diponegoro 57, Bandung 40122, Indonesia (URL: http://www.vsi.esdm.go.id/); Darwin Volcanic Ash Advisory Centre (VAAC), Bureau of Meteorology, Northern Territory Regional Office, PO Box 40050, Casuarina, NT 0811, Australia (URL: http://www.bom.gov.au/info/vaac/); MIROVA (Middle InfraRed Observation of Volcanic Activity), a collaborative project between the Universities of Turin and Florence (Italy) supported by the Centre for Volcanic Risk of the Italian Civil Protection Department (URL: http://www.mirovaweb.it/); Hawai'i Institute of Geophysics and Planetology (HIGP) - MODVOLC Thermal Alerts System, School of Ocean and Earth Science and Technology (SOEST), Univ. of Hawai'i, 2525 Correa Road, Honolulu, HI 96822, USA (URL: http://modis.higp.hawaii.edu/); Copernicus Browser, Copernicus Data Space Ecosystem, European Space Agency (URL: https://dataspace.copernicus.eu/browser/); Øystein Lund Andersen (URL: https://www.oysteinlundandersen.com/, https://twitter.com/oysteinvolcano).
Ebeko
Russia
50.686°N, 156.014°E; summit elev. 1103 m
All times are local (unless otherwise noted)
Moderate explosive activity with ash plumes continued during June-November 2023
Ebeko, located on the N end of Paramushir Island in Russia’s Kuril Islands just S of the Kamchatka Peninsula, consists of three summit craters along a SSW-NNE line at the northern end of a complex of five volcanic cones. Observed eruptions date back to the late 18th century and have been characterized as small-to-moderate explosions from the summit crater, accompanied by intense fumarolic activity. The current eruptive period began in June 2022, consisting of frequent explosions, ash plumes, and thermal activity (BGVN 47:10, 48:06). This report covers similar activity during June-November 2023, based on information from the Kamchatka Volcanic Eruptions Response Team (KVERT) and satellite data.
Moderate explosive activity continued during June-November 2023 (figures 50 and 51). According to visual data from Severo-Kurilsk, explosions sent ash 2-3.5 km above the summit (3-4.5 km altitude) during most days during June through mid-September. Activity after mid-September was slightly weaker, with ash usually reaching less than 2 km above the summit. According to KVERT the volcano in October and November was, with a few exceptions, either quiet or obscured by clouds that prevented satellite observations. KVERT issued Volcano Observatory Notices for Aviation (VONA) on 8 and 12 June, 13 and 22 July, 3 and 21 August, and 31 October warning of potential aviation hazards from ash plumes drifting 3-15 km from the volcano. Based on satellite data, KVERT reported a persistent thermal anomaly whenever weather clouds permitted viewing.
Geologic Background. The flat-topped summit of the central cone of Ebeko volcano, one of the most active in the Kuril Islands, occupies the northern end of Paramushir Island. Three summit craters located along a SSW-NNE line form Ebeko volcano proper, at the northern end of a complex of five volcanic cones. Blocky lava flows extend west from Ebeko and SE from the neighboring Nezametnyi cone. The eastern part of the southern crater contains strong solfataras and a large boiling spring. The central crater is filled by a lake about 20 m deep whose shores are lined with steaming solfataras; the northern crater lies across a narrow, low barrier from the central crater and contains a small, cold crescentic lake. Historical activity, recorded since the late-18th century, has been restricted to small-to-moderate explosive eruptions from the summit craters. Intense fumarolic activity occurs in the summit craters, on the outer flanks of the cone, and in lateral explosion craters.
Information Contacts: Kamchatka Volcanic Eruptions Response Team (KVERT), Far Eastern Branch, Russian Academy of Sciences, 9 Piip Blvd., Petropavlovsk-Kamchatsky, 683006, Russia (URL: http://www.kscnet.ru/ivs/kvert/).
Search Bulletin Archive by Publication Date
Select a month and year from the drop-downs and click "Show Issue" to have that issue displayed in this tab.
The default month and year is the latest issue available.
Bulletin of the Global Volcanism Network - Volume 42, Number 05 (May 2017)
Managing Editor: Edward Venzke
Ambrym (Vanuatu)
Occasional low-level ash emissions; lava lakes in Benbow and Marum craters active into April 2017
Asosan (Japan)
Lengthy eruptive episode 25 November 2014-May 2015; major explosions on 14 September 2015 and 8 October 2016
Etna (Italy)
Major eruptions with lava fountains, ash plumes, and lava flows during January-February, May, and December 2015
Fuego (Guatemala)
Strombolian activity, lava and pyroclastic flows, lahars, and ash plumes, June 2014-December 2015
Ibu (Indonesia)
Dome growth and ash plumes continue during December 2015-March 2017
Pacaya (Guatemala)
Steady growth of intra-crater cone during 2016 fills MacKenney Crater
Sabancaya (Peru)
Eruption with continuing ash plumes began on 6 November 2016
Semeru (Indonesia)
Activity diminishes 2009-2013, active lava dome growth 2014-2016
Tungurahua (Ecuador)
Nine ash plumes over 10 km altitude 2011-2014; lava flow in April 2014
Whakaari/White Island (New Zealand)
Ongoing unrest, with phreatic activity on 27 April and 13 September 2016
Ambrym
Vanuatu
16.25°S, 168.12°E; summit elev. 1334 m
All times are local (unless otherwise noted)
Occasional low-level ash emissions; lava lakes in Benbow and Marum craters active into April 2017
Ambrym, a volcanic island in the archipelago of Vanuatu with a large caldera (figure 35) is frequently active. Since at least 2001 the caldera has been the site of two lava lakes (BGVN 29:06, 32:05, and 40:06). The Vanuatu Geohazards Observatory (VGO) is responsible for monitoring the volcano, and the Wellington Volcanic Ash Advisory Center (VAAC) tracks ash plumes to provide aviation warnings.
On 21 February 2015 the VGO issued a notice reminding the public that a minor eruption was occurring from a new vent inside the caldera. The Alert Level was raised from 2 to 3 (on a new scale of 0-5; see figure 30 in BGVN 40:06). Hazardous areas were near and around the active vents (Benbow, Maben-Mbwelesu, Niri-Mbwelesu and Mbwelesu), and downwind areas prone to ashfall. VGO reported both on 2 March 2015 and 27 May 2016 that activity at Ambrym had slightly decreased but remained elevated. The Alert Level was lowered to 2. Areas deemed hazardous were near and around the active vents, and in downwind areas prone to ashfall.
The Wellington VAAC reported that low-level ash emissions from Ambrym were identified in satellite images on 12 July 2016, 11-13 October 2016, and 3 April 2017. MODIS satellite thermal sensors have measured nearly continuous thermal anomalies over the past year ending in mid-April 2017, evident in both MIROVA (figure 36) and MODVOLC data (figure 37); similar levels of thermal anomalies are present in MODVOLC records since 2009.
Geologic Background. Ambrym, a large basaltic volcano with a 12-km-wide caldera, is one of the most active volcanoes of the New Hebrides Arc. A thick, almost exclusively pyroclastic sequence, initially dacitic then basaltic, overlies lava flows of a pre-caldera shield volcano. The caldera was formed during a major Plinian eruption with dacitic pyroclastic flows about 1,900 years ago. Post-caldera eruptions, primarily from Marum and Benbow cones, have partially filled the caldera floor and produced lava flows that ponded on the floor or overflowed through gaps in the caldera rim. Post-caldera eruptions have also formed a series of scoria cones and maars along a fissure system oriented ENE-WSW. Eruptions have apparently occurred almost yearly during historical time from cones within the caldera or from flank vents. However, from 1850 to 1950, reporting was mostly limited to extra-caldera eruptions that would have affected local populations.
Information Contacts: Vanuatu Geohazards Observatory (VGO), Geo-Hazards office, Vanuatu Meteorology and Geo-Hazards Department (URL: http://www.vmgd.gov.vu/vmgd/); Wellington Volcanic Ash Advisory Centre (VAAC), Meteorological Service of New Zealand Ltd (MetService), PO Box 722, Wellington, New Zealand (URL: http://vaac.metservice.com/); Hawai'i Institute of Geophysics and Planetology (HIGP), MODVOLC Thermal Alerts System, School of Ocean and Earth Science and Technology (SOEST), Univ. of Hawai'i, 2525 Correa Road, Honolulu, HI 96822, USA (URL: http://modis.higp.hawaii.edu/); MIROVA (Middle InfraRed Observation of Volcanic Activity), a collaborative project between the Universities of Turin and Florence (Italy) supported by the Centre for Volcanic Risk of the Italian Civil Protection Department (URL: http://www.mirovaweb.it/); Stromboli Online (URL: http://www.swisseduc.ch/stromboli/perm/van/links-en.html).
Asosan
Japan
32.8849°N, 131.085°E; summit elev. 1592 m
All times are local (unless otherwise noted)
Lengthy eruptive episode 25 November 2014-May 2015; major explosions on 14 September 2015 and 8 October 2016
Japan's 24-km-wide Asosan caldera on the island of Kyushu has been active throughout the Holocene. Nakadake has been the most active of 17 central cones within the caldera for 2,000 years. Historical eruptions have been primarily basaltic to basaltic-andesitic ash eruptions, with periodic Strombolian activity. Minor ash emissions during May-June 2011, January-February 2014, and August-September 2014 preceded a major eruptive episode which began in late November 2014 and continued through 1 May 2016. Another eruption, with the largest ash plume in 20 years, occurred on 8 October 2016. The Japan Meteorological Agency (JMA) provides regular reports of activity; the Tokyo Volcanic Ash Advisory Center (VAAC) issues aviation alerts reporting on possible ash plumes. This report covers the period from the beginning of the late 2014 episode through March 2017.
Minor ash eruptions occurred at Asosan during 13 January-19 February 2014 and 30 August-6 September 2014. Trace ashfall was reported on 24 October 2014. A new large eruptive episode began in late November with ash plumes and Strombolian activity that continued from 25 November 2014 through late May 2015. Ash explosions also occurred on 28 June, 8 August, and 3 and 10-11 September 2015. A large explosion with pyroclastic flows occurred on 14 September. This was followed by intermittent ash plumes until 23 October 2015. Minor ash explosions took place on 7 and 25 December 2015. More explosions with ash were recorded on 17-18 February, 4 March, 16 and 30 April, and 1 May 2016. Nakadake crater was then quiet until a large explosion with an 11.9-km-high ash plume on 8 October 2016, after which no further explosive activity was reported through March 2017.
Activity during January-October 2014. After no activity during 2012 and 2013, increased seismicity in December 2013 preceded a series of minor ash eruptions between 13 January and 19 February 2014 (BGVN 40:02). The largest, on 29 January, rose 2.7 km and drifted NW. The next episode began on 30 August and lasted for only a week until 6 September 2014. The ash plumes were continuous during most of this brief time, but only rose as high as 2.1 km, and drifted N and NE. Other than a small amount of ashfall reported on 24 October, only steam plumes issued from Nakadake between early September and 25 November, the beginning of a lengthy eruptive episode.
Activity during November 2014-May 2015. The details of the beginning of this episode have been covered in a previous Bulletin report (BGVN 40:02). Ashfall was reported from ash plumes in several directions (NE, WSW, SW) as far as 38 km away, although plume heights were seldom above 2.4 km altitude (figure 36). Incandescence was observed at night from the webcams. Strombolian activity occurred from two active vents at Nakadake, producing frequent explosions of incandescent material onto the crater rim (figure 37). Blocks up to 10 cm wide were observed by JMA scientists within 1.2 km SW of the crater in mid-December 2014.
Ash plumes and Strombolian activity continued from 25 November 2014 through late May 2015. The Tokyo VAAC issued near-daily reports through early May, when they became more intermittent until a month-long break beginning on 26 May. Plume heights were rarely higher than 1.5 km above the rim (3 km altitude). Field surveys noted intermittent ejecta from the Strombolian activity as high as 300 m above the crater rim. Ashfall was reported in the surrounding Kumamoto (W), Oita (NE), and Miyazaki (SE) prefectures (figure 38).
The JMA report for February 2015 noted that observations conducted by Kumamoto University indicated that as much as 1,500,000 tons of ash fell from the start of the eruption on 25 November 2014 through 2 February 2015. The results of GNSS (Global Navigation Satellite Systems) measurements suggested a slight inflation across Kusasenri, another cone located W of Nakadake, during February. In late April, ashfall was reported in areas to the SE and NE. A large-amplitude tremor that lasted for 5 minutes was recorded on 3 May. During a field survey on 5 May, JMA scientists observed that the S side of one of the pits (named the 141st pit) in the Nakadake crater had collapsed. On 26 May, an ash plume at 2.1 km altitude was reported 37 km NE of Kumamoto airport (about 25 km W of Asosan). This was the last ash plume reported until 28 June.
Activity during June-October 2015. A field survey by JMA personnel on 10 June noted a lake in part of the 141st pit. Thermal infrared measurements indicated temperatures of up to 80°C in the lake, which had not been observed since 8 July 2014; the lake had disappeared by 29 June. An ash plume was reported by the Tokyo VAAC drifting SW at 1.5 km altitude on 28 June.
Tremor amplitude began decreasing by mid-July, but the number of isolated tremors remained large. Steam plumes and a crater lake were again observed at the 141st pit in late July and August, and temperatures remained high (80-90°C) at the lake. A high-temperature fumarole (around 600°C) was observed SW of the 141st pit on 31 July and again during August. A small eruption was reported on 8 August by JMA with grayish plumes rising 600 m above the crater rim and minor ashfall reported on the S side of the crater. The Tokyo VAAC reported minor ash plumes on 3 and 10-11 September.
A series of new larger explosions began early on 14 September 2015 local time. JMA raised the Alert level from 2 (Do not approach the crater) to 3 (Do not approach the volcano) (on a scale of 1-5) the same day. The ash plumes were reported by JMA at 2,000 m above the crater rim drifting NW. A pyroclastic flow and ejecta impacted the immediate area around the crater. Aerial observation later that day noted discoloration extending 1.3 km SE and 1 km NE from the Nakadake crater as a result of the pyroclastic flow. Ashfall was also observed in areas to the W of the crater from northern Kumamoto Prefecture (including Tamana (50 km NW), Kumamoto City (40 km W), and Yamaga (40 km NW)) to Fukuoka Prefecture (more than 30 k NW). According to a news article in The Japan Times, about 30 tourists in the immediate area were evacuated, and some flights were either canceled or re-routed from Kumamoto Airport, 20 km W. Areas within 4 km of the craters were closed. The Tokyo VAAC reported the plume from the 14 September explosion at 3.7 km altitude drifting NW. During an overflight the following week, scientists observed evidence for pyroclastic flows as far as 3 km SE from the crater. Scientists from Kumamoto University estimated that about 40,000 tons of ash were ejected on 14 September.
Ash plumes were reported daily by the Tokyo VAAC until 23 October 2015, when several small explosions sent plumes up to 1.6 km above the crater rim. A field survey that day noted bombs scattered over the W and NW flank of the crater. After this, only steam plumes to 300 m above the rim were reported from Nakadake during November, leading JMA to lower the Alert level to 2 on 24 November.
Activity during December 2015-May 2016. A small explosion occurred on 7 December 2015. A field survey later that day revealed minor ashfall on the SW side of Nakadake crater. Visual confirmation of emissions associated with a relatively large-amplitude tremor on 25 December was obscured by clouds. During a 7 January 2016 survey, staff from JMA and the Aso Volcanological Laboratory observed fresh ejecta up to 0.5 m in diameter as far as 100 m SW of the crater rim, inferring that it resulted from the 25 December explosion.
The next reported ash eruptions took place on 17-18 February 2016. A field survey on 17 February revealed ashfall in Takamori (7 km SSE). Another survey on 18 February noted lapilli along the SW crater wall from the 17 February explosion. After the 18 February explosion, lapilli were observed 400 m NW of the crater and ashfall was noted in Aso City (10 km NE). Two MODVOLC thermal alerts on 28 February were located about 2 km NE of the active crater and likely unrelated to volcanic activity.
An explosion early in the morning on 4 March 2016 sent a milky-white plume to 1 km above the crater rim. A field survey later in the day confirmed slight ashfall on the E side of the crater. Small explosions were reported by JMA on 16 and 30 April. The Tokyo VAAC issued advisories, but ash was not detected in satellite imagery. The Tokyo VAAC issued no further advisories until 7 October 2016, although JMA noted a small explosion on 1 May with gray-white 'smoke' rising to 300 m above the crater. This was the last reported explosion by JMA until 7 October 2016. Seismic tremor amplitudes decreased after 15 May. During July through September, JMA noted that most of the crater floor was filled with hot water, and seismicity was low and intermittent.
Activity during October 2016-March 2017. After an explosion late in the day on 7 October 2016 and another one in the early hours of 8 October, JMA raised the Alert Level to 3. The Tokyo VAAC reported a large ash plume rising to 11.9 km altitude early on 8 October, and drifting NE. During an overflight on 8 October and a field survey on 12 October, significant ash deposits were observed (figures 39 and 40). They extended as far as 1.6 km on the NW flank and 1 km on the SE flank; ash was also abundant on the NE flank.
Ashfall 3 cm thick was reported at the Aso City police station 6 km NE of Nakadake crater in Kumamoto Prefecture (figure 41). Ashfall was also confirmed in Oita (50 km NE), Ehime (across the Inland Sea, 150 km NE), and Kagawa (300 km NE) prefectures. According to news articles (Reuters), ashfall was reported as far away as 320 km. Kyoto University Volcano Research Center estimated the amount of ash ejected on 8 October to be around 50-60,000 tons. Samples analyzed by the National Institute of Advanced Industrial Science and Technology (AIST) and the National Research Institute for Earth Science and Disaster Prevention (NIED) revealed a 10% juvenile magma component, and that the explosions were possibly phreatomagmatic. Inflation was recorded near the crater up until 8 October, after which it remained steady.
On 12 November 2016, JMA observed incandescence at night at Nakadake crater for the first time since 26 April 2015. While SO2 emissions were reported as continuous after the 8 October explosion, the volcano was otherwise quiet and JMA lowered the Alert Level to 2 on 20 December 2016. There was no change of activity during January 2017, and thus the Alert Level was lowered to 1 on 7 February 2017. Field surveys during February noted that 80% of the bottom of Nakadake was filled with hot water. JMA reported no further activity through the end of March 2017.
Geologic Background. The 24-km-wide Asosan caldera was formed during four major explosive eruptions from 300,000 to 90,000 years ago. These produced voluminous pyroclastic flows that covered much of Kyushu. The last of these, the Aso-4 eruption, produced more than 600 km3 of airfall tephra and pyroclastic-flow deposits. A group of 17 central cones was constructed in the middle of the caldera, one of which, Nakadake, is one of Japan's most active volcanoes. It was the location of Japan's first documented historical eruption in 553 CE. The Nakadake complex has remained active throughout the Holocene. Several other cones have been active during the Holocene, including the Kometsuka scoria cone as recently as about 210 CE. Historical eruptions have largely consisted of basaltic to basaltic andesite ash emission with periodic strombolian and phreatomagmatic activity. The summit crater of Nakadake is accessible by toll road and cable car, and is one of Kyushu's most popular tourist destinations.
Information Contacts: Japan Meteorological Agency (JMA), Otemachi, 1-3-4, Chiyoda-ku Tokyo 100-8122, Japan (URL: http://www.jma.go.jp/); Tokyo Volcanic Ash Advisory Center (VAAC), 1-3-4 Otemachi, Chiyoda-ku, Tokyo, Japan (URL: http://ds.data.jma.go.jp/svd/vaac/data/); NASA Earth Observatory, EOS Project Science Office, NASA Goddard Space Flight Center, Goddard, Maryland, USA (URL: http://earthobservatory.nasa.gov/); Tom Pfeiffer, Volcano Discovery (URL: http://www.volcanodiscovery.com/); The Japan Times (URL: http://www.japantimes.co.jp/news/2015/09/14/national/mount-aso-erupts-belching-black-plume/#.WRBxXlXyuJD); Reuters (URL: http://www.reuters.com/article/us-japan-volcano-idUSKCN12804E?il=0).
Etna
Italy
37.748°N, 14.999°E; summit elev. 3357 m
All times are local (unless otherwise noted)
Major eruptions with lava fountains, ash plumes, and lava flows during January-February, May, and December 2015
Italy's Mount Etna on the island of Sicily has recorded eruptions for the past 3,500 years. Lava flows, and explosive eruptions with ash plumes and lava fountains, commonly occur from its four major summit crater areas, the North East Crater, the Voragine-Bocca Nuova complex, the South East Crater (formed in 1978), and the newest, the New South East Crater (formed in 2011). The Etna Observatory, which provides weekly reports and special updates on activity, is run by the Catania Branch of Italy's Istituo Nazionale di Geofisica e Vulcanologica (INGV). This report uses information from INGV to provide a brief summary of the major events during 2011-2014, and a detailed summary of events between January 2015 and March 2016. Major eruptions took place during 28 December 2014-2 January 2015, 31 January-2 February 2015, 11-16 May 2015, and 3-7 December 2015.
Summary of 2011-2014 activity. Most of the 44 eruptive episodes at Etna reported by INGV between 12 January 2011 and 2 December 2013 occurred at the New South Crater (NSEC) (figure 154) at the SE edge of the summit crater area. These eruptive events generally lasted for less than an hour and were characterized by sustained lava fountains accompanied by dense ash emissions and ejected pyroclastic material. Eruptive episodes occurred at Bocca Nuova (BN) in July 2011, July-August and October 2012, and January-February 2013. In addition, two weeks of intense Strombolian activity took place at Voragine (VOR) between late February and mid-March 2013. After an episode on 27 April 2013, Etna was quiet for six months until a large explosion on 26 October 2013 sent pyroclastic material several kilometers above the summit and caused a brief closure at the Catania airport. Two other episodes at NSEC during the middle and end of December 2013 were characterized by strong Strombolian activity, but without sustained lava fountains and fewer ash emissions.
During 2014, major activity was characterized by four events: 1) modest Strombolian activity and lava flows from the NSEC between 21 January and around 7 April; 2) intense Strombolian activity at NSEC accompanied by a lava flow to the SE during 14-18 June; 3) strong Strombolian explosions and lava flows from several vents between NSEC and the E flank of the North East Crater (NEC) between 5 July and 10 August; and 4) intense Strombolian activity at NSEC accompanied by a lava flow during 10-15 August. Weak explosive activity was also reported from NSEC during the second week of October.
Summary of December 2014-March 2016 activity. Activity from NSEC during 28-29 December 2014 created two major lava flows and an ash plume. During 31 January-2 February 2015 NSEC produced a new lava flow and several ash plumes. A minor ash emission from the BN crater took place on 12 April 2015. A large Strombolian eruption began at NSEC during the night of 11-12 May 2015, followed by a lava flow down the E flank on 13 May. Activity continued until 16 May. Minor ash emissions were reported from the NEC on 20 May, and again during 16, 18, and 19 July 2015.
The VOR crater released minor ash emissions on 20 and 24 August 2015, and again on 18 September. Small amounts of ash were also observed in a plume from NEC on 4 October. This was followed the next week by sporadic ash emissions from VOR which grew into persistent Strombolian explosions by the end of October and continued into mid-November. Strombolian activity at a new crater on the E flank of NSEC began on 25 November; ash emissions began there on 2 December 2015.
A major lava fountaining event from VOR began on 3 December 2015 which generated an ash plume that dispersed ash 70 km NE. This was followed by a 7-km-high (over 10 km altitude) ash plume the next day that sent ash to the E. Three more lava-fountain episodes took place at VOR over the next two days. After this the activity decreased at VOR but increased at NSEC with a 3.5-km-long lava flow on 6 December, followed by ash emissions and Strombolian activity. Sporadic ash emissions continued from VOR, NSEC, and NEC during December 2015-March 2016.
Activity during December 2014-February 2015. After four and a half months of relative quiet, with only minor ash emissions during 7-16 October 2014, the NSEC began a new eruptive episode on 28 December 2014 (BGVN 40:02). This was the 45th major episode at Etna since January 2011, according to INGV, and was characterized by lava fountains, lava flows in two different directions from a NE-SW trending fissure that crossed the NSEC (see figure 152, BGVN 40:02), and a tephra plume that drifted to the E. INGV calculated a volume of lava from the 28-29 December event, based on a lava thickness of 1.5-2 m, of about 3 x 10⁶ m3. Coarse ash and lapilli as large as 4-5 cm were reported in Fornazzo (9 km E), and mostly coarse ash and fine lapilli were deposited in Giarre (15 km E). Fine ash was also reported in Linguaglossa 17 km NE.
Explosive activity at NSEC resumed on 2 January 2015 with dense continuous ash emissions lasting until the next day that dispersed SW (figure 155). During the night of 1-2 January, INGV also observed new Strombolian activity from VOR for the first time in two years. During the next week, incandescent pyroclastic material rose up to 150 m above the crater rim and occasionally fell outside the crater onto the W and SW flanks; this was accompanied by minor ash emissions rising a few hundred meters. MODVOLC thermal alerts were issued nine times between 5 and 10 January. Strombolian and ash plume activity resumed at the NEC on 14 January for a few days (figure 156), but clouds obscured the summit area for most of the rest of the month. Intense degassing and minor ash was seen during clear weather through 31 January.
A sudden increase in volcanic tremor amplitude in the early morning of 31 January 2015 indicated a new ash emission from the summit which was obscured from view by clouds. Later in the morning, fine ash fell over the snow in Rifugio Citelle (6 km NE). Strombolian activity was observed, along with a new lava flow moving to the SW, from the NSEC the next day. Sixteen MODVOLC thermal alerts were issued during 1-2 February while the lava flow was active. A field survey on 2 February determined that the lava front had stopped at 1,950 m elevation near the Monte Scavo area on the SW flank (figure 157). An ash emission occurred at NSEC in the early morning of 2 February; only persistent degassing was observed from the summit craters for the remainder of February.
Activity during March-September 2015. Degassing continued from the summit craters through March 2015 as viewed during limited clear weather. A high-temperature fumarole was observed in an infrared camera image on the E edge of NSEC on 29 March. The next ash emission occurred on 12 April from Bocca Nuova; it produced a plume a few tens of meters high that drifted SE, leaving fallout of fine reddish ash on the snow covering the western wall of the Bove Valley above 2,000 m elevation. A second smaller emission later in the day quickly dissipated.
A visit to the summit on 29 April 2015 confirmed persistent degassing from the craters. INGV scientists noted that the narrow septum separating the BN and VOR craters was much lower in height and broken through at the base, compared with earlier visits (figure 158). A small brownish-red ash plume on 1 May rose from BN; it likely resulted from a collapse inside the NW crater wall.
A Strombolian eruption began during the night of 11-12 May 2015 from the central part of NSEC. By midnight, the activity was strong enough to send tephra out of the crater and onto the flanks. A new lava flow appeared from a fracture just below the rim on the NE side early on 13 May; it generally followed the path of the 28 December 2014 flow to the NE. This was followed by increased ash emissions later in the day. The lava flow continued to advance NE during 14 May, into the Valle del Leone, and crossed near Monte Rittmann, flowing rapidly down the steep slope connecting the Valle del Leone with the Valle del Bove, headed towards Monte Simone (figure 159). By the end of the day it had traveled 3.5 km and was at 2,000 m elevation.
Intense Strombolian activity continued the next day at NSEC along with intermittent ash emissions. The lava flow split and flowed down the central part of the Valle del Bove, travelling 4.5 km to just below 1,800 m elevation. During the morning of 15 May a series of strong ash emissions lasting 2-3 minutes each continued from BN for about two hours. By the evening, the lava flow had traveled about 5 km and was at 1,700 m elevation (figure 160). Between 12 and 16 May, MODVOLC issued 103 thermal alerts for Etna.
By the morning of 16 May, volcanic tremor had diminished and Strombolian activity had ceased, but magma was still feeding the lava flow until the afternoon, when it tapered off. During the morning of 20 May there were sporadic brown ash emissions from the NEC. After this, variable amounts of degassing continued at the summit craters for a few months, with the NEC being the most active. This period of relative quiet permitted INGV scientists to make several surveys of the summit during July to document the effects of the recent eruptions on the craters (figures 161 and 162).
During a field visit on 16 July 2015, INGV scientists witnessed intense pulsating gas emissions and loud noises at NEC; the gas often contained small amounts of reddish fine-grained ash. Increased gas emissions on 18 and 19 July rose a few hundred meters above the summit and occasionally released appreciable amounts of reddish ash that covered the W flank of the crater. Small puffs with minor ash were intermittent for the next several days. Only degassing from the summit craters was observed until 20 August when minor ash emissions were noted from VOR. The next day increased seismicity was recorded at the summit area, but there were no visible surface effects. Frequent gas emissions that included minor ash were observed at the summit during a visit on 24 August (figures 163 and 164).
Degassing continued at the summit craters during September. The Montagnola webcam captured a minor ash emission from VOR on 18 September 2015. A glowing fumarole was observed inside the NSEC during a summit visit on 23 September 2015 (figure 165).
Activity during October-November 2015. Small but appreciable amounts of reddish ash which quickly dissipated were contained in a gas plume from NEC on 4 October 2015. Activity the following week (12-18 October) was characterized by sporadic, minor ash emissions from VOR; they were brownish-red, and were ejected during pulsating events that lasted for a few tens of seconds, repeating for as long as a few hours. Explosive activity was witnessed by a field crew at the bottom of VOR on 19 October. Lithic fragments and ashes were ejected in the immediate area of the crater. Activity increased at VOR during the end of October. During an inspection on 27 October, Strombolian explosions every 5-10 minutes sent incandescent pyroclastic material around the crater and produced minor ash emissions. A few bombs fell along the NW crater rim (figure 166).
On the morning of 2 November, after stormy weather conditions had blocked views of the summit for several days, volcanic ash was observed on the camera lens of the Montagnola (EMOV) webcam that was later washed away by rain. During a 4 November field survey, an ash deposit was discovered within layers of snow that fell between 31 October and 2 November on the upper part of the S flank (figure 167). The source of the ash remains unknown.
Modest Strombolian activity continued from the bottom of VOR during November 2015. A single small explosion occurred at the NSEC in the early hours of 8 November. During a 14 November field visit, INGV scientists observed intracrater explosive activity continuing at VOR which included several explosions with abundant ash emissions, interspersed with periods of strong spattering. On the E rim of the crater, several fresh, large (40 cm) clasts of volcanic debris had fallen as far as 12 m from the edge of the rim (figure 168).
By the third week in November 2015, ash emissions from VOR were more frequent and reached high enough levels to be visible from the webcams on the S slope. Lapilli and bombs rising more than 10 m above the northern edge of VOR were observed on a site visit on 19 November. During 20 and 21 November, a slow and gradual increase in the magnitude of volcanic tremor was noted, but there was no visible change at the summit. Weak Strombolian activity began at NSEC on 25 November and was observed in the Montagnola webcam. This led to the formation of a new "pit crater" located a few tens of meters below the E edge of the NSEC, with a diameter of 15-20 m.
Eruption of 2-8 December 2015. While on a site visit to VOR on 2 December 2015, INGV observed continuing Strombolian explosions with material ejected tens of meters above the crater rim; the cone at the bottom of the crater had continued to grow from the previous week. An explosion at the NSEC pit crater in the afternoon generated minor ash emissions, and Strombolian activity at VOR increased in the evening. A progressive increase in explosive activity began at VOR on 3 December. In the early morning, a lava fountain reached heights well over 1 km (figure 169) above the crater rim.
An ash plume from this eruption initially drifted NE; ashfall was reported in Linguaglossa (17 km NE), Francavilla di Sicilia (20 km NE), Milazzo, Messina (70 km NE) and Reggio Calabria (70 km NE) (figure 170). Weak and sporadic ash emissions also occurred from the NSEC pit crater. INGV reported this as one of the most intense and among the largest eruptions from Etna in the last twenty years, similar to events on 22 July 1998 and 4 September 1999. After about one hour, activity diminished and returned to less intense Strombolian activity.
The explosive activity at VOR intensified again around 0900 UTC on 4 December, with renewed lava fountains and an ash plume that rose 7-8 km above the summit (10-11 km altitude); this episode lasted until about 1025 UTC (figure 171). Ash emissions continued throughout the day from the NSEC as well. Bombs and lapilli were deposited high on the SW slope above 2,000 m elevation. Ashfall was reported in the Giarre-Zafferana area 17 km E. Strombolian activity continued for much of the day at VOR until 2000 UTC, when the third lava fountain (since 3 December) erupted that lasted for about 90 minutes before subsiding again to less intense Strombolian activity.
A fourth episode of lava fountaining from VOR took place mid-afternoon on 5 December 2015 and lasted for about 60 minutes. After this, activity decreased (both ash emissions and Strombolian explosions) from VOR, but increased at the NSEC pit crater, which grew due to continuous activity. In the early morning the following day two pyroclastic flows descended a few hundred meters toward the Valle del Bove. Around 1700 UTC, INGV personnel observed two lava flows, fed from the NSEC, headed toward Valle del Bove; one headed E for 3.5 km and reached 2,100 m elevation, and the other advanced ENE a few hundred meters to 2,600-2,700 m elevation. The easternmost vent at NSEC began emitting dark ash plumes on 7 December along with Strombolian activity that evening (figure 172). Activity at NSEC lasted for about 48 hours, ending in the morning of 8 December.
Activity during December 2015-March 2016. Ash plumes accompanied by sporadic Strombolian activity were ejected from the NEC beginning on 7 December, and lasting intermittently through 14 December. Renewed explosions on 13 December at NSEC produced ash emissions, minor incandescence, and thermal anomalies. MODVOLC reported 84 thermal anomalies at Etna between 2 and 9 December.
INGV scientists observed on a 12 December visit that the BN and VOR craters were essentially joined into a larger, single crater after the early December explosions, similar to the former Central Crater at Etna. VOR was covered with tens of meters of pyroclastic debris. The debris also covered much of the rest of the summit area, including the lava flows from the previous winter. The parking lot of the visitor area, located 0.5-1 km W and NW of VOR, was marked with numerous impact craters several meters in diameter.
Two minor ash emissions occurred at VOR on 19 December. After that, only steam emissions were observed at the summit until 28 December when a new series of ash emissions with minor incandescence were ejected from the vent on the E flank of NSEC. They were sporadic over the next several days and had ceased by 8 January 2016. Trace amounts of ash were again reported from the E flank vent during the last days of January 2016 and on 6 February. During this time, emissions from NEC often contained trace amounts of ash. Modest amounts of brown ash were observed from the NEC in the morning of 9 February.
An explosive event at NEC on 23 February created an ash plume tens of meters high which drifted N and rapidly dissipated. Lightning was observed in the ash cloud. Ashfall was reported in Linguaglossa, Gaggi, and Santa Teresa Riva (40 km NE) from this event. A new emission on 25 February consisted of several pulses of medium-low intensity that produced a very dilute ash plume a few meters above the crater. During March 2016, sporadic ash emissions at NEC accompanied persistent degassing, but there were no reports of ashfall other than in the immediate area of the crater.
Sulfur dioxide data. Numerous images of SO2 emissions from Etna during this period were captured by the Aura instrument on NASA's OMI satellite. Emissions during the four major eruptive events discussed in this report (28-29 December 2014, 31 January-2 February 2015, 11-16 May 2015, and 2-7 December 2015) were the largest (figure 173).
Geologic Background. Mount Etna, towering above Catania on the island of Sicily, has one of the world's longest documented records of volcanism, dating back to 1500 BCE. Historical lava flows of basaltic composition cover much of the surface of this massive volcano, whose edifice is the highest and most voluminous in Italy. The Mongibello stratovolcano, truncated by several small calderas, was constructed during the late Pleistocene and Holocene over an older shield volcano. The most prominent morphological feature of Etna is the Valle del Bove, a 5 x 10 km caldera open to the east. Two styles of eruptive activity typically occur, sometimes simultaneously. Persistent explosive eruptions, sometimes with minor lava emissions, take place from one or more summit craters. Flank vents, typically with higher effusion rates, are less frequently active and originate from fissures that open progressively downward from near the summit (usually accompanied by Strombolian eruptions at the upper end). Cinder cones are commonly constructed over the vents of lower-flank lava flows. Lava flows extend to the foot of the volcano on all sides and have reached the sea over a broad area on the SE flank.
Information Contacts: Sezione di Catania - Osservatorio Etneo, Istituto Nazionale di Geofisica e Vulcanologia (INGV), Sezione di Catania, Piazza Roma 2, 95123 Catania, Italy (URL: http://www.ct.ingv.it/it/); Hawai'i Institute of Geophysics and Planetology (HIGP), MODVOLC Thermal Alerts System, School of Ocean and Earth Science and Technology (SOEST), Univ. of Hawai'i, 2525 Correa Road, Honolulu, HI 96822, USA (URL: http://modis.higp.hawaii.edu/); NASA Earth Observatory, EOS Project Science Office, NASA Goddard Space Flight Center, Goddard, Maryland, USA (URL: http://earthobservatory.nasa.gov/); NASA Goddard Space Flight Center (NASA/GSFC), Global Sulfur Dioxide Monitoring Page, Atmospheric Chemistry and Dynamics Laboratory, 8800 Greenbelt Road, Goddard, Maryland, USA (URL: https://so2.gsfc.nasa.gov/); Erik Klemetti Eruptions Blog, Wired (URL: https://www.wired.com/author/erikvolc/); Tom Pfeiffer, Volcano Discovery (URL: http://www.volcanodiscovery.com/).
Fuego
Guatemala
14.4748°N, 90.8806°W; summit elev. 3799 m
All times are local (unless otherwise noted)
Strombolian activity, lava and pyroclastic flows, lahars, and ash plumes, June 2014-December 2015
Volcán de Fuego, one of three active volcanos in Guatemala, has been erupting continuously since 2002. Historical observations of eruptions date back to 1531, and radiocarbon dates are confirmed back to 1580 BCE. These eruptions have resulted in major ashfalls, pyroclastic flows, lava flows, and damaging lahars. A major explosion on 13 September 2012 that caused significant ashfall to the S and SW (figure 30) was described by the Instituto Nacional de Sismologia, Vulcanología, Meteorología e Hidrologia (INSIVUMEH) as the largest event in the prior 13 years. From September 2012 through June 2014 continuing explosions with ash plumes and ashfall, pyroclastic flows, lahars, and lava flows have impacted much of the region within 20 km of the volcano (BGVN 39:04). This report covers the ongoing activity from June 2014 through mid-December 2015. In addition to regular reports from INSIVUMEH, information comes from the Coordinadora Nacional para la Reducción de Desastres (CONRED), and aviation alerts are provided by the Washington Volcanic Ash Advisory Center (VAAC).
Fuego was continuously active from June 2014 through December 2015. Ash plumes generally rose to heights of less than 1 km above the summit (4.8 km altitude) and dispersed ash over villages located 10-15 km S, SW, and W virtually every week, and occasionally to the NE and E. The highest plumes rose to 5.75 km in October 2014, 5.8 km in January 2015, and at least 6.1 km in February 2015. The most significant ash eruptions were in February 2015 when air traffic was disrupted in Guatemala City and in November 2015 when ashfall was reported up to 90 km SW. Incandescent ejecta rose 100-300 m above the crater rim on a regular basis, but the strongest events sent tephra and lava fountains as high as 500 m in July 2014, 800 m in August 2014, and 500 m in December 2015. Pyroclastic flows descended several drainages during larger explosive events in February, July, September, and November 2015. Numerous lava flows affected at least five different drainages around Fuego. They were reported during June, July, and August 2014, and February-April, June, and September-November 2015. Lahars during June and September 2014 and June 2015 damaged roadways and filled ravines with meter-sized debris. Table 12 shows the towns and drainages mentioned in the report and their distances and directions from the summit of Fuego, and is posted at the end of this report.
Activity during June-December 2014. Activity at Fuego during June 2014 was dominated by explosions that produced ash plumes which rose between 100 and 800 m above the summit (3.9-4.6 km altitude), and drifted most often generally westward. Minor amounts of ash were reported from explosions on 18-19 June in towns within 15 km of the summit, mainly El Porvenir (8 km ENE), Los Yucales (12 km SW), Santa Sofía (12 km SW), Morelia (10 km SW), Sangre de Cristo (10 km SW), and Panimaché (I and II, ~8 km SW). The Washington VAAC issued three reports of minor volcanic ash from explosions on 18, 20, and 23 June, which dissipated within a few hours.
Numerous lahars impacted drainages in June. Las Lajas (SE), Honda (E), and Seca (W) drainages were affected on 1 June, and Las Lajas and El Jute (SE) were impacted the next day. Honda, El Jute, Ceniza (SSW), and Santa Teresa (S) drainages had 1.5-m-diameter blocks in lahars on 5 June, and there were more lahars in Las Lajas and El Jute drainages on 9 June. Incandescent ejecta rose 100-200 m above the crater rim several times, and was responsible for avalanches descending the Taniluyá (SW), Trinidad (S), and Ceniza drainages. A new lava flow reported on 29 June descended the Taniluyá drainage for 150 m and caused avalanches in the nearby Ceniza drainage.
Surges of lava and incandescent avalanches traveled down six drainages (Santa Teresa, Taniluya, Ceniza, Trinidad, Las Lajas, and Honda) during the first half of July 2014, the farthest going 400 m down the Ceniza. MODVOLC thermal alerts possibly related to the lava flows and incandescent material were captured on 1, 2, and 11 July. Pulses of incandescent material rose to 100 m above the rim in early July, but increased to heights up to 500 m above the crater for the second half of the month, causing block avalanches down the flanks. Weak-to-moderate ash-bearing explosions early in the month increased to moderate-to-strong explosions by month's end that sent dark gray ash 400-600 m above the crater. The Washington VAAC reported ash plumes on 8, 11, 18, and 31 July. While no emissions were reported on 11 July, strong winds scattered recent ash as high as 5.5 km altitude (1.8 km above the crater). Ashfall was reported most days in nearby areas, including the Santa Teresa, Taniluya, Ceniza, and Trinidad drainages, and at the Observatory, Morelia, Santa Sophia, Ingenio los Tarros (15 km SW), Panimaché, Yepocapa (9 km NW), and Finca La Conchita.
During August 2014, explosions with incandescent blocks rose 50-400 m above the crater, but explosions as high as 800 m occurred several times. Block avalanches traveled down the flanks into Taniluya, Ceniza, Las Lajas, Trinidad, Honda, and Santa Teresa canyons. Ash plumes rose 300-900 m above the crater and drifted in various directions as far as 15 km before dissipating, numerous times during the month. The Washington VAAC reported a number of discrete ash emissions during 5-8 August, although most were not visible in satellite imagery, and again on 18 August when the highest plume of the month was reported at 5.5 km, or 1.7 km above the crater moving NW. Ashfall was reported in the villages of Yepocapa, Finca La Conchita, Sangre de Cristo, Morelia, and Panimaché I and II, Santa Sofia, Alotenango (8 km ENE), Antigua (18 km NE), San Miguel Dueñas (10 km NE), and around the Observatory. On 30-31 August lava flowed again towards Ceniza Canyon.
On 2 September 2014, INSIVUMEH seismically detected a lahar flowing through the Taniluyá drainage which was measured at a width of 75 m and a height of 2.5 m. The flow cut the road between Santa Lucia Cotzulmaguapa and the communities of Morelia, Santa Sofía, and Panimaché I and II. Lahars were also detected within Río Ceniza and Santa Teresa drainages. Incandescent blocks rose 75-100 m above the crater and weak avalanches were channeled into the Ceniza, Trinidad, Taniluyá, Santa Teresa, Las Lajas, and Honda drainages. Ash plumes rose 500-1,000 m above the summit crater and drifted a few tens of kilometers before dissipating. Fine gray ashfall was reported in communities within 10 km SW and ENE. A lava flow in Ceniza Canyon was 100 m long by 13 September. During 16 September, ashfall was reported in the communities of Alotenango, Antigua, and Ciudad Vieja (13.5 km NE), up to around 20 km NE. Another lahar was detected on 22 September, flowing down the El Jute and Las Lajas drainages on the SE flank carrying volcanic debris, lava blocks, branches, and tree trunks.
This moderate activity continued into early October 2014. Ash plumes that rose to 1,950 m above the summit (5.75 km altitude) were reported by INSIVUMEH during 11-12 October, and plumes to 5.5 km were reported by the Washington VAAC on 28 October. MODVOLC thermal alerts were issued during 5-6-7 October and 23-24 October.
Activity increased again in November 2014. Larger explosions generated block avalanches that descended the drainages on the SE and SW flanks, and ashfall was reported numerous times in the villages within 15 km SW. The Washington VAAC issued 5 series of alerts during 10-11 (drifting NE at 5.2 km), 13 (drifting S), and 17, 23, and 28-29 November (drifting 25 km W at 4.6 to 4.9 km altitude). MODVOLC thermal alerts were also issued on 7 days, including 3 pixels on 25 November.
Heightened activity continued into December 2014 with Special Bulletins issued by INSIVUMEH on 1 and 10 December noting more frequent and intense explosions (as many as 6-8 per hour), and dense gray ash plumes drifting 20 km W and SW depositing fine ash. Lava fountaining was reported on 10 December rising 100-150 m above the crater. The Washington VAAC reported ash plumes on 1-2, 5, 12-15 (S, SE), 27 (NW), and 29-30 (W) December based largely on reports from INSIVUMEH. The plume heights ranged from 4.1 to 4.9 km altitude (300-1,100 m above the crater). There were also MODVOLC thermal alerts on 9 days during December, including three pixels on 6 December.
Activity during 2015. Similar activity continued into January 2015. Ashfall was reported 10-15 km SW from plumes rising 550-950 m above the crater. Incandescent blocks traveled down the SW and SE drainages, generating small fires in vegetated areas. MODVOLC thermal alerts were issued on eight different days during January. The Washington VAAC only issued reports on 9 and 12 January. The 12 January plume was reported as discrete volcanic ash emissions seen in visible satellite imagery fanning out about 16 km W of the summit. The altitude of the plume was noted as 5.8 km, or 2 km above the summit.
A significant Strombolian eruption began on 7 February 2015 that lasted for about 22 hours; pyroclastic flows also descended multiple drainages (figure 31). CONRED reported that ash fell in Guatemala City (about 40 km ENE) and flights were diverted to El Salvador. The communities that reported ashfall from the event are shown in figure 32. The Washington VAAC reported an ash plume visible at about 6.1 km altitude (2.3 km above) and 45 km E of the summit. The next day, the plume was still visible at 5.8 km altitude about 100 km E.
On 8 February, although activity had decreased, the seismic network detected 30 explosions per minute. The explosions generated shock waves detected in areas 15 km S and SW. Lava flows up to 2 km long were observed in the El Jute and Trinidad drainages on the SE flanks, reaching vegetated areas and causing fires. Sixteen MODVOLC thermal alert pixels were recorded on 8 February; they continued on 9, 11-13 and 17 February before a 10 day break. INSIVUMEH noted that by 9 February activity levels had subsided with weak to moderate explosions producing ash plumes that rose 550 m above the summit and drifted 8-10 km NW (figure 33).
More intense activity returned on 16 February with 4-6 ash-bearing explosions per hour. The Washington VAAC reported the plumes at 4.9 km altitude, although INSIVUMEH noted pilot reports of ash at 7-9 km altitude. Ash fell in many villages to the NW, W, S, and SE more than 15 km from the summit. By 19 February, the ash plumes extended up to 150 km S of the summit. Intermittent emissions with dense ash plumes continued to rise from Fuego and disperse through 22 February.
A new effusive episode began on 28 February 2015 when lava fountains rose 300-400 m above the summit. A strong MODVOLC thermal alert signal persisted with multiple pixels through 3 March; afterwards MODVOLC pixels only appeared on six additional days during the month. One lava flow traveled 1.6 km S down the Trinidad drainage and another traveled 600 m W down the Santa Teresa drainage. Ash plumes also rose up to 1.25 km above the crater and drifted 35 km W generating ashfall in communities to the SW. Numerous ash plumes continued intermittently; VAAC reports were issued on 16 days during the month, through 24 March.
Hot spots appeared in satellite data numerous times during April 2015. Incandescent tephra was ejected 150-200 m above the crater. Block avalanches continued from the end of a new 300-m-long lava flow in the Trinidad drainage on 17 April. MODVOLC thermal alert pixels appeared on 12 days through 26 April, with large multi-pixel alerts on 17 and 18 April. According to INSIVUMEH, ash plumes continued rising 650-850 m above the crater and drifting 8-11 km S, SW, and W, but VAAC reports of ash only appeared on 17 and 18 April.
Far fewer MODVOLC thermal alerts were issued during only five different days spanning 5-31 May 2015. The Washington VAAC issued reports of ash plumes on 13, 15, 17, and 18 May. INSIVUMEH noted an increased number and intensity of explosions briefly during 14-15 May; ash plumes rose 450-750 m above the crater and drifted 10-12 km W and SW. They also reported a S-flank lava flow on 18 May. Ashfall was reported in the communities within 10 km SW of the summit. Incandescent material was ejected 150-200 m above the crater, causing block avalanches in drainages on the S and SW.
Strombolian activity again increased during June 2015, ejecting material 300 m above the crater for 30 hours during 4-6 June. Ash plumes rose to around 1 km above the summit and drifted 10-15 km S and SW. During this episode, lava flows traveled 600 and 1,200 m down the Santa Teresa and Trinidad drainages. Two cinder cones within the crater were reported on 6 June. A lahar was detected on 12 June that was 25 m wide and 2-3 m deep, travelling S down the Trinidad drainage carrying abundant volcanic material and blocks 1-2 m in diameter. MODVOLC thermal alerts were captured on 16 days during June. The Washington VAAC reported ash plumes from explosions on 5, 6, and 28 June with altitudes below 4.8 km and ashfall within 10 km in many areas, including La Soledad (11 km N) and Acatenango (12 km NW). During 29-30 June a 300-m-long lava flow was visible in the Las Lajas drainage on the SE flank.
Based on INSIVUMEH notices, CONRED reported that for a 30-hour period during 30 June-1 July 2015 activity at Fuego was at a high level, characterized by explosions, high-temperature pyroclastic flows (that began on 1 July), and ashfall. Ash plumes rose 4.8 km above the crater and drifted 25 km W and NW, producing ashfall in 22 local communities. An SO2 plume drifting NW was captured by the OMI instrument on the Aura satellite on 1 July (figure 34). The majority of material deposited by pyroclastic flows was located in the Las Lajas drainage where the flow reached 4-5 km in length. People in the La Reunion area near the river bed were evacuated. Nine MODVOLC thermal alert pixels were captured on 1 July, and 10 on 2 July, corroborating the high-temperature pyroclastic flows reported by CONRED. Only single thermal alert pixels were captured after that on 14, 25, and 29 July. The Washington VAAC reports issued on 1, 2, 6, and 14 July included reports of ash emissions to 4.9 km extending up to 55 km SW.
Although there were no VAAC reports issued between 14 July and 1 September 2015, the number of MODVOLC thermal alerts increased substantially during August from the previous month, with an especially large multi-pixel signature from 5 through 10 August. INSIVUMEH reported ash plumes rising to 4.2-4.6 m dispersing ash around 12 km in various directions several times during the month, as well as incandescent material rising to 200 m above the crater and sending block avalanches down the drainages on the S and W flanks.
Lava fountains, explosions, pyroclastic flows, and ashfall in surrounding areas picked up again beginning with a strong MODVOLC thermal alert signal on 30 August and lasted through 2 September. By the time activity decreased that day, the remnants of three lava flows were visible in the Santa Teresa, Trinidad and Las Lajas drainages on the S and SE flanks. There were no MODVOLC thermal alerts between 2 and 27 September, and no Washington VAAC reports between 2 and 29 September. During this time, INSIVUMEH reported moderate levels of explosions with ash-bearing plumes rising to 4.5 km altitude and drifting 10-12 km from the summit, dispersing minor amounts of ash to the villages within that radius.
The next pulse of activity began with three MODVOLC thermal alert pixels on 27 September 2015. Lava flows were persistent during October, as reported by INSIVUMEH and evidenced by the number of MODVOLC thermal alert pixels. Multi-pixels days were common between 27 September and 14 October, and again from 23-28 October. INSIVUMEH first reported lava flows on 4 October that were 400 m long in the Santa Teresa drainage and 300 m long in the Trinidad canyon. By 8 October the Trinidad canyon flow was 1.5 km long; the Santa Teresa canyon flow reached 1 km from the crater by 13 October. These flows were fed by Strombolian activity that had increased on 10 October, sending incandescent material 200 m above the crater (figure 35). Lava fountains during 13-14 October produced another lava flow in the Santa Teresa canyon that was 500 m long by 20 October.
A new surge of activity beginning on 21 October through the end of the month generated 200-300 m-high lava fountains that advanced lava flows 1.5 km down the Santa Teresa, Trinidad, and Las Lajas drainages. Ash plumes during October reported by INSIVUMEH rose 450-1,200 m above the crater, dispersing ash to villages 10-12 km S and SW on several occasions; no ash plumes were observed by the Washington VAAC until 26 October when a plume rose to 5.2 km (1.4 km above the summit) and drifted SW.
On 1 November, the Washington VAAC reported discrete ash emissions at 5.2 km altitude drifting SW that dissipated within 50 km early in the day, and a second slightly higher plume later in the day that also dissipated quickly. Most of the rest of the ash plumes at the beginning of November were under 1 km in height above the summit and dispersed ash to communities within 12 km SW. Block avalanches from a 200-m-high fountain of incandescent ejecta traveled down Santa Teresa, Trinidad, and Las Lajas drainages early in the month.
New lava flows were reported in the Las Lajas and El Jute drainages beginning on 9 November 2015. A strong multipixel MODVOLC signal was captured during 7-11 November, including 12 pixels on 9 November. By 10 November the lava flows were 2.5 km long, and incandescent material was ejected 300 m high. Ashfall was reported in Panimache I and II, Morelia, Santa Sofia, El Porvenir, Sangre de Cristo and the municipality of San Pedro Yepocapa. Pyroclastic flows also descended the E flank on 10 November. The Washington VAAC reported an ash plume that morning below 5.2 km altitude drifting WSW at 15 knots. The plume was visible in satellite imagery extending for 110 km to the coast, and possibly out over the ocean to 185 km. By late in the day, ongoing lava flows and rockfalls were causing ash to rise to 6.1 km altitude and the winds were moving the ash out of the valleys around 140 km SW of Fuego. Ashfall was reported from communities as far as 90 km to the west including San Andrés Osuna (12 km SW), El Zapote (10 km S), Siquinala (20 km SW), Santa Lucia Cotzumalguapa (22 km SW), Mazatenango (87 km W), Patulul (30 km W), and Cocales (35 km W).
Strong multi-pixel MODVOLC signatures increased again between 25 November and 2 December and correlate with INSIVUMEH's reporting of large and strong explosions and new lava flows beginning on 29 November. The Washington VAAC reported ongoing emissions to 5.2 km altitude on 25 November which dissipated quickly. INSIVUMEH noted lava fountains rising to 500 m above the crater, feeding four lava flows that traveled 3 km down the Ceniza, Trinidad, Las Lajas, and Santa Teresa drainages on 29 November. A fifth lava flow was seen the next day along with small pyroclastic flows in the Honda drainage on the E flank. A new pulse of ash emissions to 5.5 km began on 30 November extending 45 km SW from the summit and continued through 1 December drifting more to the NW into S Mexico before dissipating.
Discrete ash emissions to 5.5 km altitude which quickly dissipated were observed in webcam imagery on 9 December 2015. Late the following day, another plume was spotted at the same elevation drifting 37 km NNE. Activity increased during the night of 14-15 December, characterized by an increased number of explosions (4-6 per hour). Ash plumes rose almost 1 km high and drifted 10-15 km NE, E, and SE. Two 800-m-long lava flows were active in the Trinidad and Santa Teresa drainages. Strong multi-pixel MODVOLC alerts appeared daily from 11-18 December. The Washington VAAC observed ongoing emissions on 16 December at 5.2 km altitude; they drifted as far as 280 km SW of Fuego. Lava flows remained active in the Las Lajas, Trinidad, and Santa Teresa drainages. Activity decreased toward the end of the month with modest ash emissions rising less than a kilometer above the summit, and incandescent material rising 150 m above the crater.
Table 12. Towns and drainages around Fuego and their distance and direction from the summit.
| Towns |
Location |
| Acatenango |
12 km NW |
| Alotenango |
8 km ENE |
| Antigua |
18 km NE |
| Chimaltenango |
21 km NNE |
| Ciudad Vieja |
13.5 km NE |
| Cocales |
35 km W |
| El Porvenir |
8 km ENE |
| El Zapote |
10 km S |
| Ingenio los Tarros |
15 km SW |
| La Soledad |
11 km N |
| Los Yucales |
12 km SW |
| Mazatenango |
87 km W |
| Morelia |
10 km SW |
| Panimaché (I and II) |
8 km SW |
| Patulul |
30 km W |
| San Andrés Osuna |
12 km SW |
| San Miguel Duenas |
10 km NE |
| Sangre de Cristo |
10 km SW |
| Santa Lucia Cotzumalguapa |
22 km SW |
| Santa Sofía |
12 km SW |
| Siquinala |
20 km SW |
| Yepocapa |
9 km NW |
|
Drainage / Ravine
|
Direction |
| Ceniza |
SSW |
| El Jute |
SE |
| Honda |
E |
| Las Lajas |
SE |
| Santa Teresa |
S |
| Seca |
W |
| Taniluya |
SW |
| Trinidad |
S |
Geologic Background. Volcán Fuego, one of Central America's most active volcanoes, is also one of three large stratovolcanoes overlooking Guatemala's former capital, Antigua. The scarp of an older edifice, Meseta, lies between Fuego and Acatenango to the north. Construction of Meseta dates back to about 230,000 years and continued until the late Pleistocene or early Holocene. Collapse of Meseta may have produced the massive Escuintla debris-avalanche deposit, which extends about 50 km onto the Pacific coastal plain. Growth of the modern Fuego volcano followed, continuing the southward migration of volcanism that began at the mostly andesitic Acatenango. Eruptions at Fuego have become more mafic with time, and most historical activity has produced basaltic rocks. Frequent vigorous eruptions have been recorded since the onset of the Spanish era in 1524, and have produced major ashfalls, along with occasional pyroclastic flows and lava flows.
Information Contacts: Instituto Nacional de Sismologia, Vulcanologia, Meteorologia e Hydrologia (INSIVUMEH), Unit of Volcanology, Geologic Department of Investigation and Services, 7a Av. 14-57, Zona 13, Guatemala City, Guatemala (URL: http://www.insivumeh.gob.gt/); Coordinadora Nacional para la Reducción de Desastres (CONRED), Av. Hincapié 21-72, Zona 13, Guatemala City, Guatemala (URL: http://conred.gob.gt/www/index.php); Washington Volcanic Ash Advisory Center (VAAC), Satellite Analysis Branch (SAB), NOAA/NESDIS OSPO, NOAA Science Center Room 401, 5200 Auth Rd, Camp Springs, MD 20746, USA (URL: http://www.ospo.noaa.gov/Products/atmosphere/vaac/, archive at: http://www.ssd.noaa.gov/VAAC/archive.html); Hawai'i Institute of Geophysics and Planetology (HIGP), MODVOLC Thermal Alerts System, School of Ocean and Earth Science and Technology (SOEST), Univ. of Hawai'i, 2525 Correa Road, Honolulu, HI 96822, USA (URL: http://modis.higp.hawaii.edu/); NASA Earth Observatory, EOS Project Science Office, NASA Goddard Space Flight Center, Goddard, Maryland, USA (URL: http://earthobservatory.nasa.gov/); NASA Goddard Space Flight Center (NASA/GSFC), Global Sulfur Dioxide Monitoring Page, Atmospheric Chemistry and Dynamics Laboratory, 8800 Greenbelt Road, Goddard, Maryland, USA (URL: https://so2.gsfc.nasa.gov/); Tom Pfeiffer, Volcano Discovery (URL: http://www.volcanodiscovery.com/).
Ibu
Indonesia
1.488°N, 127.63°E; summit elev. 1325 m
All times are local (unless otherwise noted)
Dome growth and ash plumes continue during December 2015-March 2017
Previously reported activity at Ibu through November 2015 included shallow seismicity, lava dome growth on the N part of the crater, and occasional white-to-gray plumes rising as high as 500 m above the summit (BGVN 40:11). This report, describing activity through early March 2017, is based on information from the Pusat Vulkanologi dan Mitigasi Bencana Geologi (PVMBG) and the Darwin Volcanic Ash Advisory Centre (VAAC).
During the reporting period (at least through 22 Aug 2016), the Alert Level remained at 2 (on a scale of 1-4) and the public was warned to stay at least 2 km away from the active crater, and 3.5 km away on the N side. Inclement weather often prevented visual observation.
According to PVMBG reports, similar activity to that previously described in 2013-2015 continued through at least 22 August 2016. Seismicity was dominated by signals indicating surface or near-surface activity, and the lava dome in the N part of the crater continued to grow. Occasional plumes (described variously as white-to-medium gray, gray-to-gray black, and ash) rose to altitudes of 1.5-2.4 km (200-1,100 m above the summit crater).
Thermal anomalies, based on MODIS satellite instruments analyzed using the MODVOLC algorithm, were observed infrequently during the reporting period. Hotspots were observed on seven days in December 2015, but only 1-3 days per month for subsequent months through March 2017. No hotspots were recorded during December 2016 and February 2017. In contrast, the MIROVA detection system recorded numerous anomalies between April 2016 and March 2017 (figure 10), almost all of which were at least 1 km from the volcano and of low power output.
Geologic Background. The truncated summit of Gunung Ibu stratovolcano along the NW coast of Halmahera Island has large nested summit craters. The inner crater, 1 km wide and 400 m deep, has contained several small crater lakes. The 1.2-km-wide outer crater is breached on the N, creating a steep-walled valley. A large cone grew ENE of the summit, and a smaller one to the WSW has fed a lava flow down the W flank. A group of maars is located below the N and W flanks. The first observed and recorded eruption was a small explosion from the summit crater in 1911. Eruptive activity began again in December 1998, producing a lava dome that eventually covered much of the floor of the inner summit crater along with ongoing explosive ash emissions.
Information Contacts: Pusat Vulkanologi dan Mitigasi Bencana Geologi (PVMBG, also known as Indonesian Center for Volcanology and Geological Hazard Mitigation, CVGHM), Jalan Diponegoro 57, Bandung 40122, Indonesia (URL: http://www.vsi.esdm.go.id/); Darwin Volcanic Ash Advisory Centre (VAAC), Bureau of Meteorology, Northern Territory Regional Office, PO Box 40050, Casuarina, NT 0811, Australia (URL: http://www.bom.gov.au/info/vaac/); Hawai'i Institute of Geophysics and Planetology (HIGP), MODVOLC Thermal Alerts System, School of Ocean and Earth Science and Technology (SOEST), Univ. of Hawai'i, 2525 Correa Road, Honolulu, HI 96822, USA (URL: http://modis.higp.hawaii.edu/); MIROVA (Middle InfraRed Observation of Volcanic Activity), a collaborative project between the Universities of Turin and Florence (Italy) supported by the Centre for Volcanic Risk of the Italian Civil Protection Department (URL: http://www.mirovaweb.it/).
Pacaya
Guatemala
14.382°N, 90.601°W; summit elev. 2569 m
All times are local (unless otherwise noted)
Steady growth of intra-crater cone during 2016 fills MacKenney Crater
Guatemala's Pacaya volcano has a 450-year record of frequent historical observations of activity, in addition to confirmed radiocarbon dating of eruptions over 1,500 years. Its location approximately 30 km S of the capital of Guatemala City makes it both a popular tourist attraction as a National Park, and a hazard to the several million people that live within 50 km. Activity during the last 50 years has been characterized by extensive lava flows, bomb-laden Strombolian explosions, and ash plumes that have dispersed ash to cities and towns across the region.
Major lava flows and Strombolian activity in January and early March 2014 were previously reported (BGVN 42:04). This report describes activity for the remainder of 2014 through 2016. Information was provided by the Instituto Nacional de Sismologia, Vulcanologia, Meteorologia e Hydrologia (INSIVUMEH), the Coordinadora Nacional para la Reducción de Desastres (CONRED) of Guatemala, and the Washington Volcanic Ash Advisory Center (VAAC), which provides air traffic advisories. Satellite imagery and visitors to the volcano also provided evidence of activity.
Ash plumes were intermittent for the remainder of 2014 after the activity of January and March; they were reported on 10 April, 25 and 28 August, during 11-18 November, and on 22 December. Episodes of ash emissions in mid- and late January 2015 and up to 17 February marked the end of this episode. Renewed activity on 8 June 2015 included intermittent ash plumes and incandescence observed at the summit. Ash plumes were intermittent until 22 September but observations of incandescence grew more frequent and intense during the rest of the year. A small intra-crater cone was growing in mid-December 2015 at the center of MacKenney Crater. Strombolian activity from the cone continued throughout 2016. It was most active during June and July, depositing new ejecta on the N and W flanks of the volcano. Although it had quieted down by the end of the year, persistent degassing, steam plumes, and occasional incandescence were still observed. The intra-crater cone had filled much of MacKenney Crater by December 2016.
Activity during April-December 2014. Extensive lava flows in January and early March 2014 affected large areas on both the N and S flanks of Pacaya (BGVN 42:04). The volcano quieted down significantly after the first week in March. A plume with minor ash was observed rising to 2.6 km altitude and drifting approximately 1 km S and SW on 10 April. During the rest of April through late August 2014 only white and blueish-white plumes rose 50-150 m above the summit, and no thermal anomalies were reported.
INSIVUMEH reported on 25 and 28 August 2014 that small bursts of gray ash rose 200-700 m above the summit and drifted S and SW. Otherwise, only plumes of steam and magmatic gases were observed during August through early November. Small bursts with minor amounts of ash were reported again on 11, 16, and 18 November 2014 that rose a few hundred meters above the summit and drifted S and SW. Incandescence was observed at the summit crater on 9 December. Only steam and gas plumes were observed by INSIVUMEH for the rest of December 2014, but the Washington VAAC reported an emission of gases and possible minor ash to 3.4 km altitude (900 m above the summit) on 22 December drifting S for a few hours before dissipating.
Activity during 2015. Renewed seismic activity with numerous small ash emissions was reported in a special bulletin by INSIVUMEH on 14 January 2015. They noted that about 24 weak explosions with ash had occurred in recent days. In another special notice issued on 28 January, they reported that ash emissions originating from MacKenney Crater had drifted 4 km S and SW. They noted as many as 40 ash explosions within the previous 24 hours. Gas plumes were also observed from an area on the S flank.
Weak ash and steam emissions rising a few hundred meters above the summit were also reported on 1 February 2015. MODVOLC showed three thermal alert pixels on the SE flank on 10 February, but they were near an area of agricultural development and likely not be related to volcanism. Only steam emissions were reported by INSIVUMEH until 13 February when a new series of weak explosions sent dark gray ash plumes 500-700 m above the crater; the plumes were observed until 17 February. After this, INSIVUMEH reported only minor seismicity and steam-and-gas plumes through 5 June. Three MODVOLC pixels on 25 March, located on the E flank, were in agriculture areas similar to the February alerts.
Continuing ash explosions every three or four hours indicated renewed activity on 8 June 2015, as reported by INSIVUMEH. The seismic network detected signals consistent with collapse inside the crater along with ash emissions. Plumes with gas and minor ash were reported on 14, 16, and 18 June rising 50 m above the crater. Increased seismicity on 18 June led to noises that were audible 3 km away. For the rest of June and into the first week of July, ash was frequently dispersed around the crater from gas-and-ash plumes, and incandescence was visible on clear nights. Incandescence from MacKenny crater was reported again on 23 August. CONRED also reported that the low-frequency tremors that started in mid-June were continuing in mid-August.
Blue and white plumes, along with minor ash emissions, were observed drifting W of the summit crater on 1 September 2015, and the low-frequency tremors and incandescence continued on clear nights for the rest of the month. Two ash plumes, on 11 and 22 September, rose to 700 and 900 m above the crater. Although only a single MODVOLC thermal alert pixel appeared near the summit on 2 October, numerous observations of incandescence were made by INSIVUMEH during the month. Cloudy weather limited observations of incandescence during November to only the first and last weeks, but observations were nearly continuous during December.
A visit to the summit of Pacaya on 22 December 2015 by Volcano Discovery provided evidence of the activity responsible for the incandescence observed during the previous months (figure 71). During stronger intervals of activity, lava bombs were ejected 150-200 m above the crater rim, but generally fell back within the crater. A few fresh (days-to-weeks-old) bombs were seen near the eastern crater rim. Around the main vent at the bottom of the approximately 100-m-deep crater, a small cone, about 15 m tall, had formed. Bubbles of lava burst into fragments of spatter from the vent, building up the cone (figure 72). A small secondary vent at the eastern side of the cone also showed occasional spattering, mainly during phases of elevated activity at the main vent. Parts of the crater floor were covered by recent lava flows.
Activity during 2016. INSIVUMEH reported that during January 2016, Pacaya exhibited activity similar to 2015. Incandescence was visible at night during 20-27 January, and during this time a hot spot was captured at the summit in a Landsat image. A small collapse on the NW side of the inner crater generated a column of gray emissions that rose to 3 km altitude (500 m above the summit) on 20 January. A Landsat image on 12 February again showed incandescence and a steam plume rising 100 m above the crater. Incandescence reappeared on 20 February and persisted for the remainder of the month. Emissions from the main crater were primarily magmatic SO2 and steam; they generally rose 50-150 m above the crater and drifted N.
Incandescent activity at MacKenney Crater increased during March and April 2016. Landsat images showed incandescence aligned along a NW-SE trending fissure within the crater. MODVOLC thermal alert pixels appeared on 1, 19, and 26 March and again on 10 April; the 10 April thermal alert was readily visible as a hotspot in satellite imagery (figure 73). INSIVUMEH noted that the intra-crater cone continued to grow during March and April. The MIROVA Log Radiative Power data also registered a number of thermal anomalies during March and April (figure 74).
During May 2016 the intra-crater cone continued to grow, and minor Strombolian activity during the night was observed regularly by INSIVUMEH. Most of the activity occurred on the N flank, with some incandescence on the W flank at the end of the month. Seismicity continued at modest levels with occasional explosions resulting from minor collapses of the crater wall. Strombolian activity increased during June, although the degassing plume did not reach more than 400 m above the crater. The webcam recorded incandescent material accumulating on the NW flank.
Seismic activity during July 2016 remained constant, caused by degassing and Strombolian explosions which were observed during 7-10 July. Material was ejected 75 m above the crater during 23-24 July. Views of Pacaya from the NW and the S during July and August revealed minor fumarolic activity from the summit as well as evidence of the extensive January-March 2014 lava flows (figures 75 and 76). Incandescence continued to be observed at night and in satellite images during July and August, with debris from the Strombolian activity concentrated on the N and NW flanks.
By October 2016, observations of incandescence at the summit were less frequent. INSIVUMEH noted that intermittent incandescence continued for the rest of 2016 with new material accumulating within MacKenney Crater. Visitors to the intra-crater cone in early December 2016 noted strong degassing of steam, magmatic gases, and possible ash, but no Strombolian activity. The intra-caldera cone was significantly larger than when observed a year earlier (figure 77).
Geologic Background. Eruptions from Pacaya are frequently visible from Guatemala City, the nation's capital. This complex basaltic volcano was constructed just outside the southern topographic rim of the 14 x 16 km Pleistocene Amatitlán caldera. A cluster of dacitic lava domes occupies the southern caldera floor. The post-caldera Pacaya massif includes the older Pacaya Viejo and Cerro Grande stratovolcanoes and the currently active Mackenney stratovolcano. Collapse of Pacaya Viejo between 600 and 1,500 years ago produced a debris-avalanche deposit that extends 25 km onto the Pacific coastal plain and left an arcuate scarp inside which the modern Pacaya volcano (Mackenney cone) grew. The NW-flank Cerro Chino crater was last active in the 19th century. During the past several decades, activity has consisted of frequent Strombolian eruptions with intermittent lava flow extrusion that has partially filled in the caldera moat and covered the flanks of Mackenney cone, punctuated by occasional larger explosive eruptions that partially destroy the summit.
Information Contacts: Instituto Nacional de Sismologia, Vulcanologia, Meteorologia e Hydrologia (INSIVUMEH), Unit of Volcanology, Geologic Department of Investigation and Services, 7a Av. 14-57, Zona 13, Guatemala City, Guatemala (URL: http://www.insivumeh.gob.gt/); Coordinadora Nacional para la Reducción de Desastres (CONRED), Av. Hincapié 21-72, Zona 13, Guatemala City, Guatemala (URL: http://conred.gob.gt/www/index.php); Hawai'i Institute of Geophysics and Planetology (HIGP), MODVOLC Thermal Alerts System, School of Ocean and Earth Science and Technology (SOEST), Univ. of Hawai'i, 2525 Correa Road, Honolulu, HI 96822, USA (URL: http://modis.higp.hawaii.edu/); MIROVA (Middle InfraRed Observation of Volcanic Activity), a collaborative project between the Universities of Turin and Florence (Italy) supported by the Centre for Volcanic Risk of the Italian Civil Protection Department (URL: http://www.mirovaweb.it/); European Space Agency (ESA) (URL: http://www.esa.int/ESA); Tom Pfeiffer, Volcano Discovery (URL: http://www.volcanodiscovery.com/).
Sabancaya
Peru
15.787°S, 71.857°W; summit elev. 5960 m
All times are local (unless otherwise noted)
Eruption with continuing ash plumes began on 6 November 2016
Although historical records of eruptive activity at Peru's Sabancaya volcano go back to 1750, there have only been a handful documented since the 1980s; activity that began in 1986 was the first recorded in over 200 years. During the last period of substantial ash eruptions between 1990 and 1998 ashfall deposits up to 4 cm thick were reported 8 km E of the volcano. Evidence for minor ash-emitting events was reported in 2000 and 2003. Intermittent seismic unrest and fumarolic emissions characterized activity from late 2012 through 2015. Seismically detected explosions during August 2014 led to releases of SO2 gases and steam plumes, some as high as 2 km, along with possible minor volcanic ash. Possible minor volcanic ash emissions were also mentioned by Peruvian authorities and pilot reports between September and December 2014 but there were no confirmed reports of ash emissions during this period. A crater inspection during 9-10 July 2015 found trace amounts of ash at the crater that contained crystals of plagioclase, biotite, and amphibole, along with fresh volcanic glass. These were interpreted by the volcanologists to represent minor ash emissions during recent weeks.
Unrest with steam plumes and variable seismicity continued during 2016 until 6 November when continuous ash-bearing explosions began. Activity during 2016 through February 2017 is covered in this report with information from the two Peruvian observatories that monitor the volcano: Instituto Geofisico del Peru - Observatoria Vulcanologico del Sur (IGP-OVS), and Observatorio Volcanologico del INGEMMET (Instituto Geológical Minero y Metalúrgico) (OVI-INGEMMET). Aviation reports and notices come from the Buenos Aires Volcanic Ash Advisory Center (VAAC), and satellite data is reported from several sources.
Sabancaya maintained a level of seismic and fumarolic unrest through most of 2016, similar to levels recorded in 2014 and 2015, with almost constant water-vapor and SO2 plumes rising from the crater. Additionally, tectonic (not volcanic) seismicity caused damage and fatalities in nearby villages. An explosion on 27 August 2016 did not produce ash, but new areas of fumarolic activity on the N flank were observed around this time. Hybrid seismic events related to the movement of magma, and SO2 emissions, increased noticeably during September and October 2016. An explosive eruption with numerous ash plumes began on 6 November 2016. Continuous ash emissions with plume heights exceeding 10 km altitude were recorded several times through February 2017. Thermal anomalies were first measured in satellite data in early November, along with numerous significant SO2 plumes.
Activity during January-October 2016. Heights of plumes consisting of water vapor and minor magmatic gases generally decreased during January 2016, from 1,800 m to less than 1,200 m by the month's end. Seismic activity was generally low in terms of both numbers of events and magnitude. The daily number of events ranged from 8 to 20, and the largest event, a M 4.0, was registered on 29 January.
Plume heights continued declining in February, from 1,000 m during the first week to 400-800 m by the end of the month. During March, April, and May the heights of steam and SO2 plumes ranged from 200 to 1,300 m above the crater, and values of SO2 flux ranged from 600 to 1,500 metric tons per day (t/d). These values increased only slightly in July and August; plumes rose 2,000 m above the crater rim and SO2 emissions were as high as 2,600 t/d.
Seismicity continued at low levels through late August. Three significant tectonic earthquakes in mid-August were not related to volcanic activity, but the earthquake 25 km NE of Sabancaya on the Ichupampa fault on 14 August caused at least four fatalities, and numerous aftershocks were recorded in the region. A spike in SO2 emissions at the volcano to 4,030 t/d occurred shortly after the earthquake.
On 27 August 2016 there was a hybrid-type seismic event that IGP-OVS interpreted as an explosion of 72 MJ (Megajoules) of energy. An official statement from the Scientific and Technical Committee for Risk Management (IGP-OVS, OVI-INGEMMET, and others) issued on 6 September noted that "dense gray gases reached 1,000 m above the crater and drifted E." However, no VAAC reports were issued, and ash was not mentioned in the OVI INGEMMET weekly report.
During the last two weeks of August, two large zones of new fumarolic activity were detected in satellite imagery. OVI visited the site on 25 August, and IGP-OVS visited on 1 September 2016. The scientists observed areas of increased fumarolic emissions outside of the crater on the NE and NW flanks of the volcano (figure 19). The first zone was located on the NW flank and extended from the vicinity of the crater down to 5,700 m elevation, while the second area was located on the NE flank at about 5,600 m. Both areas follow a NW-SE trend. The flux of SO2 increased to values greater than 4,000 t/d at the end of August.
OVI-INGEMMET reported an increase in the total number of seismic events during September 2016, especially hybrid-type events, along with generally lower plume heights, but increased emissions of SO2. IGP-OVS noted a swarm of hybrid-type seismic events on 27 September distinct from the distal tectonic-related events of the previous month, and indicative of an increase in volcanic activity. IGP-OVS returned to Sabancaya on 28 September 2016 to gather temperature measurements at the new fumarole areas. A NW-SE trending belt on the NE side of the volcano had temperature readings between 71° and 91°C.
At the beginning of October, water vapor and SO2 gas plumes rose as high as 2,000 m above the crater, and the SO2 flux was over 3,000 t/d. Volcanic seismicity increased from 220 earthquakes per day during the first week to 470 during the second week. SO2 emissions continued to increase and by 22 October were at 7,173 t/d.
From 9 January through 3 November 2016 the Buenos Aires VAAC issued 52 reports with pilot observations of ash. The VAAC was unable to confirm the presence of ash in emissions and instead described only water vapor or magmatic gases recorded via the web camera. There were no MODIS thermal anomalies shown by the MODVOLC or MIROVA systems from January 2014 through October 2016.
Activity during November 2016-February 2017. OVI-INGEMMET reported an eruption beginning at 2040 local time on 6 November 2016 (0140 on 7 November UTC) that started with an explosion and was followed by the continuous emission of low volume ash that rose up to 1,500 m above the crater rim (about 7,500 m altitude) (figure 20).
Several types of volcanic-related seismic events continued to increase in number and intensity during November and December. The eruption exhibited an average of 39 daily explosive events with ash plumes (figures 21, 22, and 23) between 7 November and 15 December. There were 63 explosions on 30 November, and between 5 and 11 December there were 328 explosions.
Ash emissions were continuous from the beginning of the eruption through mid-December, with heights up to 4.5 km (10.5 km altitude) above the crater, according to the Scientific-Technical Committee of government scientists monitoring the eruption. Ashfall several millimeters thick was recorded in areas as far as 40 km away. During the first weeks of the eruption ash fell mainly to the E and NE on the villages of Maca, Achoma, Yanque and Chivay (18-30 km NE). Later in December, ashfall was reported W and NW in the villages of Huambo (28 km W), Cabanaconde (22 km NW), and Pinchollo (18 km N). On 26 December, ashfall was again reported in the villages of Cabanaconde, Pinchollo, and Tapay (25 km NW) to the NW and N, and Lari and Madrigal (20 km NE), Maca, and areas of Achoma to the NE. The seismic energy released from tremors and explosive events continued to increase throughout November into December (figures 24 and 25).
Beginning on 21 December there was a notable increase in seismicity (mainly of hybrid events), in the number (up to 52 per day) and height of plumes, and ash emissions. These changes led the Scientific-Technical Committee to raise the Volcanic Warning Level from Yellow to Orange (2 to 3 on a 4-level scale) on 28 December, warning people to remain more than 12 km from the crater (figures 26 and 27). A small lahar affected the area of Pinchollo (18 km N) on 3 January 2017.
Seismicity remained high during January with long-period (LP), tremor, and hybrid-type events all continuing, and an average of 70-76 daily explosions. During the second week in January explosions peaked at an average of 84 per day. This number decreased during early February to around 20 per day but then rose back to over 40 by the end of the month. A significant number of hybrid seismic events occurred during the last week of February.
Gas-and-ash plumes rose to 4.5 km above the crater in early January, dropping back to 2-3 km for the rest of the month, before rising again to 3-4 km (9-10 km altitude) during February. In their Special Report in January 2017, the joint Scientific-Technical committee presented a map showing that ash dispersal had affected communities in nearly every direction 40 km from the summit (figure 28).
Buenos Aires VAAC Reports, November 2016-February 2017. The Buenos Aires VAAC first noted minor amounts of volcanic ash in emissions visible from the volcano webcam on 7 November 2016 (UTC). Ash was not identified in satellite imagery until midday 8 November when it was reported at 7.6 km altitude (about 1.7 km above the summit). Observations of continuous emissions of steam and ash were reported daily, when not obscured by weather, from then through the end of February 2017. Plume heights were commonly 7.6-8.2 km altitude, about 1.7-2.3 km above the summit. Higher plumes were also recorded a number of times during this period, including 10.3 km altitude on 17 and 23 November. The plume was clearly visible in satellite imagery on 24 November, drifting SE at 10.9 km. Plumes on 3 December rose 10 km and drifted SW; they were partially hidden by weather clouds. Pulses of volcanic ash drifting over 35 km SE at 10.6 km altitude were visible on 11 and 12 December. For most of January 2017 the plumes were obscured by weather clouds, but were visible on 6 January at 9.1 km altitude. Higher plumes were more often recorded in February; they rose continuously over 10 km from 4 to 7 February. The highest plume during the period was on 26 February, at 11.9 km, drifting SW.
Thermal anomalies in satellite data. The MIROVA thermal anomaly plot of MODIS data provided independent satellite confirmation of the beginning of the eruption. The first thermal anomaly appeared on 2 November 2016, and values increased in frequency and intensity in the subsequent weeks. Energy values reached moderate levels in early February 2017 (figure 29). The first MODVOLC thermal alert pixel for Sabancaya appeared on 6 January 2017. There were seven MODVOLC alert pixels in January and six in February, suggesting a persistent source of heat during this time.
Sulfur dioxide data. Sulfur dioxide plumes from Sabancaya were captured numerous times by the OMI satellite instrument from NASA's Global Sulfur Dioxide Monitoring system between November 2016 and February 2017. They revealed significant SO2 plumes travelling in all directions away from the summit for distances up to 200 km (figure 30).
Geologic Background. Sabancaya, located in the saddle NE of Ampato and SE of Hualca Hualca volcanoes, is the youngest of these volcanic centers and the only one to have erupted in historical time. The oldest of the three, Nevado Hualca Hualca, is of probable late-Pliocene to early Pleistocene age. The name Sabancaya (meaning "tongue of fire" in the Quechua language) first appeared in records in 1595 CE, suggesting activity prior to that date. Holocene activity has consisted of Plinian eruptions followed by emission of voluminous andesitic and dacitic lava flows, which form an extensive apron around the volcano on all sides but the south. Records of observed eruptions date back to 1750 CE.
Information Contacts: Observatorio Volcanologico del INGEMMET, (Instituto Geológical Minero y Metalúrgico), Barrio Magisterial Nro. 2 B-16 Umacollo - Yanahuara Arequipa (URL: http://ovi.ingemmet.gob.pe); Instituto Geofisico del Peru, Observatoria Vulcanologico del Sur (IGP-OVS), Arequipa Regional Office, Urb La Marina B-19, Cayma, Arequipa, Peru (URL: http://ovs.igp.gob.pe/); NASA Earth Observatory, EOS Project Science Office, NASA Goddard Space Flight Center, Goddard, Maryland, USA (URL: http://earthobservatory.nasa.gov/); MIROVA (Middle InfraRed Observation of Volcanic Activity), a collaborative project between the Universities of Turin and Florence (Italy) supported by the Centre for Volcanic Risk of the Italian Civil Protection Department (URL: http://www.mirovaweb.it/); Hawai'i Institute of Geophysics and Planetology (HIGP), MODVOLC Thermal Alerts System, School of Ocean and Earth Science and Technology (SOEST), Univ. of Hawai'i, 2525 Correa Road, Honolulu, HI 96822, USA (URL: http://modis.higp.hawaii.edu/); NASA Goddard Space Flight Center (NASA/GSFC), Global Sulfur Dioxide Monitoring Page, Atmospheric Chemistry and Dynamics Laboratory, Goddard, Maryland, USA (URL: https://so2.gsfc.nasa.gov/).
Semeru
Indonesia
8.108°S, 112.922°E; summit elev. 3657 m
All times are local (unless otherwise noted)
Activity diminishes 2009-2013, active lava dome growth 2014-2016
With hundreds of eruptive events in the 19th and early 20th centuries, and nearly continuous activity since 1967, Indonesia's Semeru is one of the world's most active volcanos. This activity has included lava flows, Vulcanian and Strombolian explosions, nuées ardentes, lava domes, and mudflows; fatalities and serious injuries occurred in 1981, 1994, 1997, and 2000.
Activity at the volcano is tracked by Pusat Vulkanologi dan Mitigasi Bencana Geologi (PVMBG), also known as Indonesian Center for Volcanology and Geological Hazard Mitigation, (CVGHM), the Darwin Volcanic Ash Advisor Center (VAAC), and remote sensing satellite data that provides visible imagery and thermal anomaly data. In this report, imagery and data from 2000-2009 is reviewed, along with details of activity from 2009 through March 2017.
Overview of activity since 2000. Strong evidence for continuous eruption at Semeru was gathered by satellite instruments from March 2000 through 2 January 2009. PVMBG reported ash explosions and an active lava dome in the Jonggring Seloko summit crater during early March 2009; after an ash plume on 15 March the gas and ash "gradually disappeared." A single MODVOLC thermal alert pixel was captured on 8 August 2009. PVMBG noted in their March 2010 report that the character of eruptive activity changed in April 2009 from ash-dominated explosions to emissions associated with dome growth. Only intermittent minor emissions were reported until incandescence appeared at the summit on 5 January 2010; strong thermal alert signals indicated continued lava-dome growth through November 2010. After 29 November 2010, there were no reports of unrest until small ash plumes were observed on 13 May 2011. These were followed by reports of pyroclastic flows in June, observations of the growing lava dome in September, and a new lava flow in December 2011.
Pyroclastic flows in January and February 2012 accompanied observations of incandescence and thermal alerts detected by satellite through mid-May. Small ash plumes from the summit area and incandescence at the lava dome were observed on 19 July 2012, but no further activity was noted until June 2013 when thermal alerts reappeared for about a month. An ash plume was reported by the Darwin VAAC in October 2013 and a thermal alert pixel appeared on 29 November 2013. After this, another break in activity occurred until the following spring.
PVMBG reported 22 incidents of emissions that were white to gray during March 2014, and 21 during 1-27 April 2014. They also reported eight explosions during April with white to gray emissions. A new, longer-lasting eruptive episode began with ash plumes, an incandescent lava flow, and rock avalanches that descended from the summit lava dome on 26 April 2014.
Thermal alert pixels reappeared on 5 June 2014 and remained abundant through 30 July 2016. During this time, the lava dome was actively growing and a lava flow slowly advanced down the S-flank Kembar ravine. Ash plume eruptions increased in frequency during 2015, and during 2016 they became large enough to produce aviation advisories from the Darwin VAAC several times. An image of the incandescent lava flow on the S flank in September 2016 and a thermal alert pixel in November 2016 suggested continuing dome growth through the end of the year. An ash plume reported by the Darwin VAAC on 9 January 2017 indicated continuing activity.
Satellite data from 2000-2009. From March 2000 through 2 January 2009, the University of Hawai'i's MODVOLC system recorded numerous thermally elevated pixels captured by the MODIS satellite instrument every single month except for February 2002. Explosive activity, lava avalanches, and pyroclastic flows were the sources of these abundant alerts (see previous BGVN reports). A NASA image from 14 June 2004 available in Google Earth clearly shows an ash plume erupting from Semeru and abundant ash deposited around its flanks (figure 20).
Imagery from the Moderate Resolution Imaging Spectroradiometer (MODIS) on NASA's Terra satellite also captured images in 2006 and 2007 that demonstrate the characteristics of ash explosions from Semeru. They commonly occur as discrete puffs at regular intervals and can maintain their integrity for tens of kilometers from the volcano (figure 21).
Activity during January 2009-July 2012. The style of activity changed during 2009. MODVOLC recorded only a single thermal alert pixel on 2 January 2009, and nothing after that until August 2009. PVMBG maintains a four-level Volcano Alert system; Level 1 (Normal) is the lowest, followed by Level II (Alert), Level III (Standby), and Level IV (Beware). They reported that typical activity during Alert Level II ("Alert") conditions were ash eruptions at 20-30 minute intervals with plumes rising 100-400 m from the summit. They noted a loud explosion on 8 February 2009, and another on 6 March that was accompanied by lightning. The 6 March event led PVMBG to increase the Alert Level to III (Standby) in their 6 March 2009 report. This activity was followed a few days later by an ash eruption, reported by the Darwin VAAC, with a plume that rose to 4.6 km altitude. After another ash emission on 15 March that rose 600 m above the crater, ash emissions "gradually disappeared" and seismicity decreased, according to a 17 July 2009 report from PVMBG; the Alert Level was then lowered back to II.
A single MODVOLC thermal alert pixel was recorded on the NW flank on 8 August 2009. In their next report in March 2010, PVMBG noted that from November 2009 through February 2010 visibility was generally poor due to weather, but there were occasional undescribed emissions that rose 50-500 m above the summit. They reported that the pattern of activity between April 2009 and 1 March 2010 changed from being dominated by ash eruptions to regular low-level emissions.
Incandescence from the summit on 5 January 2010 was followed by a MODVOLC thermal alert on 21 January. PVMBG reported a new lava flow on 25 February, which by 28 February had traveled 750 m. Rock avalanches from lava flows were reported during February (BGVN 35:08), September, and November 2010 (BGVN 37:04). Thermal alerts increased in number during April and May, before tapering off and ending on 28 November 2010. In their 4 November report PVMBG kept the Alert Level at II but noted an increase in lava-dome growth at the summit. Ash plumes were also observed by the Darwin VAAC rising to 4.6 km and drifting 75-110 km N and NW during 18-19 November.
No activity was reported between 29 November 2010 and 13 May 2011. Evidence for activity beginning again in May comes from a report by Volcano Discovery of 2-3 small ash eruptions per day during 13- 17 May (figure 22). MODVOLC thermal alert pixels reappeared on 2 June and were also noted on 15 June and 1 July. PVMBG reported eruptions of pyroclastic material on 9, 14, and 17 June. Volcano Discovery reported a growing lava dome on 1 September with 3-4 ash explosions per day during the first two weeks of September. MODVOLC thermal alerts were recorded on 5 and 7 October. PVMBG noted that seismicity had increased beginning on 29 December 2011, which was accompanied by dense white-and-gray plumes rising to 600 m above the Jonggring Seloko crater; a 300-m-long lava flow was also observed that day.
Dense gray-white plumes rose 600 m and preceded an explosion on 6 January 2012; the explosion was followed by summit incandescence. Repeated observations of incandescent material flowing up to 400 m SE toward the Besuk Kembar drainage were made during the rest of January. On 2 February, just after midnight, a pyroclastic flow traveled 300 m from the Jongring Seloko crater, and by mid-morning it had traveled farther, to 2.5 km from the crater. This led PVMBG to raise the Alert Level to III that day, prohibiting people from an area on the SE slopes within 4 km of the crater (BGVN 37:04).
Numerous MODVOLC thermal alert pixels were recorded between 30 January and 21 April 2012, and a final pixel recorded on 9 May 2012. PVMBG noted that several pyroclastic flows had occurred during February, and incandescence at the summit was common through the end of March. During April, white plumes rose 500 m above the summit, seismicity decreased, and no incandescence was observed. Based on this, PVMBG lowered the Alert Level to II on 2 May 2012. A Google Earth image of the volcano taken a few weeks later on 21 May 2012 shows a clear view of the summit crater with the lava dome visible (figure 23). Volcano Discovery reported that on an expedition during 18-19 July they observed slow lava dome growth, with an incandescent area at the SW part of the dome producing small to moderate ash explosions. There were no reports of ash plumes from the Darwin VAAC during 2012.
Activity during June 2013-December 2015. After the 19 July 2012 update from Volcano Discovery, there was no evidence for activity at Semeru until a MODVOLC thermal alert pixel appeared on 4 June 2013, followed by four more in June and one on 7 July. No reports were issued by PVMBG during 2013. The Darwin VAAC issued a report on 18 October 2013 that a low-level ash plume had been observed, but was not visible on satellite imagery. A single MODVOLC pixel was recorded on 29 November.
The volcano was quiet again from 29 November 2013 until April 2014. PVMBG reported white-and-gray plumes drifting W from the summit 22 times during March 2014, and 21 times during April, at heights between 100 and 400 m from the summit. They also reported eight explosions during April with gray-to-white emissions rising 300-500 m and drifting W. Incandescent material was reported on 26 and 27 April, with rock avalanches sliding 300 m S from the summit. Strong multi-pixel MODVOLC alerts were recorded beginning on 5 June 2014 and continued for the rest of the year, although there were no further reports from PVMBG or the Darwin VAAC. The thermal anomalies were likely due to the growth of the lava dome. Volcano Discovery reported a lava flow from the dome in July 2014, noting that it extended a few hundred meters down Kembar ravine on the S flank in early September, when they also observed Strombolian activity in the summit crater (figure 24). They reported in November 2014 that the lava dome had a diameter of 100-200 m, and Strombolian activity ejected bombs up to 100 m above the vent (figure 25).
Multiple MODVOLC thermal alert pixels were recorded every month during 2015. Although the volcano was very active during January-March 2015, PVMBG did not raise the Alert Level. Steam plumes rising 200-300 m above the crater were reported almost daily; explosions with gray-white plumes rising to heights of 200-500 m happened several times a week. In January, incandescent material traveled as far as 300 m down the Kembar ravine. In early March a trace amount of ash was deposited at a monitoring post near the summit after one explosion. During April 2015, ash plumes rose 200-600 m above the crater 68 times according to PVMBG; minor ashfall was reported on the flanks, and explosions were heard 30 times.
Activity increased further in May 2015, with ash plumes reported 122 times, rising 200-500 m above the summit and drifting W, NW, and SW. Incandescent rock avalanches descended as far as 1 km in the Kembar ravine. During June and July, ash emissions continued at the rate of a few per day, rising to 500 m above the summit (figure 26).
During August 2015 ash events were reported 47 times, with plumes rising 100-600 m above the summit and drifting S. Rock avalanches were reported twice travelling 500 m down the S flank. By September, explosions with white-and-gray plumes had decreased to 45 for the month. They caused the plumes to rise 100-500 m above the summit and drift W and N. Thirty-two explosions occurred during October producing gray-to-white plumes that rose 200-500 m and drifted W. Incandescent material was observed nine times in November and traveled as far as 500 m down the S flank. Also in November, Volcano Discovery reported continuous degassing and minor explosions from the lava dome (figure 27). Strombolian activity was observed five times in December by PVMBG. Dense gray-to-white ash plumes occurred eight times during November and 20 times in December, rising 100-500 m and drifting W.
Activity during 2016-March 2017. Twenty-one ash explosions were reported in January 2016, with low-level plumes rising to 500 m and drifting E, N, and W. Although activity during 2016 began similarly to 2015, the character of the eruption changed during February. Beginning in mid-February, larger ash plumes triggered a series of VAAC reports, the first in many years. Multiple MODVOLC thermal alert pixels were also captured through the end of July 2016, with another one on 24 August and 19 November, suggesting continued growth of the lava dome and intermittent lava.
The Darwin VAAC reported ash plumes five times in 2016, on 13 February, 17 April (UTC), 25 and 27 May, and 10 June. The 13 February plume rose 7.9 km (4.3 km above the summit) and drifted 45 km NE. A local news source, Tempo Nasional, also reported a pyroclastic flow the same day that traveled 4-5 km down the S and SE flanks (figure 28).
The 18 April 2016 ash plume rose to 4.3 km altitude and drifted 40 km NE. Plumes on 25 and 27 May also rose to 4.3 km but drifted 25-40 km SW. On 10 June another plume rose 3.7 km and drifted 25 km SW. Volcano Discovery observed mild Strombolian activity from the crater on 26 July, and noted that the lava flow in the southern ravine was inactive. On another visit in late September the lava flow was incandescent 1,500 m down the ravine (figure 29). The MODVOLC thermal alert pixel from 19 November suggested that the lava dome remained active.
A report from the Darwin VAAC on 9 January 2017 noted that an ash plume rose 3.9 km altitude that drifted N. A decrease in thermal activity is clear in the MIROVA thermal anomaly data for late March 2016 through late March 2017. Volcanic Radiative Power (VRP) values during April through June 2016 were in the Moderate range; they decreased in intensity (and frequency) to the Low range between July and December, and decreased again in both intensity and frequency after December 2016 (figure 30).
Geologic Background. Semeru, the highest volcano on Java, and one of its most active, lies at the southern end of a volcanic massif extending north to the Tengger caldera. The steep-sided volcano, also referred to as Mahameru (Great Mountain), rises above coastal plains to the south. Gunung Semeru was constructed south of the overlapping Ajek-ajek and Jambangan calderas. A line of lake-filled maars was constructed along a N-S trend cutting through the summit, and cinder cones and lava domes occupy the eastern and NE flanks. Summit topography is complicated by the shifting of craters from NW to SE. Frequent 19th and 20th century eruptions were dominated by small-to-moderate explosions from the summit crater, with occasional lava flows and larger explosive eruptions accompanied by pyroclastic flows that have reached the lower flanks of the volcano.
Information Contacts: Pusat Vulkanologi dan Mitigasi Bencana Geologi (PVMBG, also known as Indonesian Center for Volcanology and Geological Hazard Mitigation, CVGHM), Jalan Diponegoro 57, Bandung 40122, Indonesia (URL: http://www.vsi.esdm.go.id/); Darwin Volcanic Ash Advisory Centre (VAAC), Bureau of Meteorology, Northern Territory Regional Office, PO Box 40050, Casuarina, NT 0811, Australia (URL: http://www.bom.gov.au/info/vaac/); Hawai'i Institute of Geophysics and Planetology (HIGP), MODVOLC Thermal Alerts System, School of Ocean and Earth Science and Technology (SOEST), Univ. of Hawai'i, 2525 Correa Road, Honolulu, HI 96822, USA (URL: http://modis.higp.hawaii.edu/); Volcano Discovery, https://www.volcanodiscovery.com; MIROVA (Middle InfraRed Observation of Volcanic Activity), a collaborative project between the Universities of Turin and Florence (Italy) supported by the Centre for Volcanic Risk of the Italian Civil Protection Department (URL: http://www.mirovaweb.it/); Tempo Nasional, https://nasional.tempo.co, https://nasional.tempo.co/read/news/2016/02/14/058744712/ini-yang-jadi-penyebab-guguran-awan-panas-di-gunung-semeru.
Tungurahua
Ecuador
1.467°S, 78.442°W; summit elev. 5023 m
All times are local (unless otherwise noted)
Nine ash plumes over 10 km altitude 2011-2014; lava flow in April 2014
Abundant ash emissions, Strombolian activity, pyroclastic flows, lahars, and a few lava flows have all been documented at Tungurahua, which lies in the center of Ecuador. Historic observations are recorded back to 1557, and radiocarbon dates are as old as 7750 BCE. Prior to renewed activity in 1999, the last major eruption had occurred during 1916-1918. Since 1999, there have been numerous eruptive episodes, but only a few with breaks in activity longer than three months. Our last bulletin report (BGVN 40:03) covered the first part of the eruption that began on 22 November 2010. This report details activity from November 2011 through December of 2014. Tungurahua is monitored by the Observatorio del Volcán Tungurahua (OVT) of the Instituto Geofísico (IG) of Ecuador, and aviation alerts are reported by the Washington Volcanic Ash Advisory Center (VAAC).
Summary of November 2010-December 2014 activity. After a period of quiescence from 29 July through 21 November 2010, a new eruption began with a series of ash explosions and Strombolian activity on 22 November. Explosions continued through 25 December 2010 (BGVN 40:03), and emissions containing ash continued through 2 January 2011. A new eruption with tremor and ash emissions began on 20 April 2011; explosions with substantial ash plumes occurred on 22 April. Strombolian activity was frequent, and ashfall affected numerous communities within 10 km for the next five weeks. This episode ended with explosions and ash plumes on 21 May (BGVN 40:03), followed by ashfall reported to the SW through 26 May 2011. After damaging lahars at the end of May, Tungurahua was quiet until November 2011.
Volcanic activity between November 2011 and December 2014 occurred in eight discrete episodes (table 19). The length of these episodes ranged from 3 weeks to 9 months, and the lengths of the breaks between them lasted from 4 weeks to 3 months. Ash plumes rising several kilometers above the 5-km-high summit and ashfall in communities tens of kilometers from the volcano characterized each episode. Strombolian activity also sent incandescent blocks down the flanks hundreds of meters, pyroclastic flows traveled several kilometers down the ravines, and lahars during the wet seasons flooded drainages and frequently damaged roadways. A lava flow several hundred meters long descended the upper W flank in April 2014.
Table 19. Episodes of activity at Tungurahua, November 2011 through December 2014. These episodes are based on reported activity as described in this report, and may not correspond to current or previous "Eruptive Episodes" identified by IG.
| Episode Start |
Episode Stop |
Approx. Duration |
Following Interval of Repose |
| 27 Nov 2011 |
4 Sep 2012 |
40 weeks |
12 weeks |
| 14 Dec 2012 |
24 Jan 2013 |
7 weeks |
5 weeks |
| 01 Mar 2013 |
24 Mar 2013 |
3 weeks |
4 weeks |
| 24 Apr 2013 |
15 May 2013 |
3 weeks |
8 weeks |
| 13 Jul 2013 |
23 Aug 2013 |
6 weeks |
6 weeks |
| 06 Oct 2013 |
12 Nov 2013 |
5 weeks |
11 weeks |
| 30 Jan 2014 |
11 May 2014 |
14 weeks |
11 weeks |
| 17 Jul 2014 |
15 Dec 2014 |
20 weeks |
-- |
Hundreds of ash plumes were emitted over this time period. Nine times, the ash plumes were recorded at altitudes over 10 km (more than 5 km above the summit) (table 20), with the highest on 4 April 2014 rising to 15.2 km altitude (50,000 ft).
Table 20. Ash plumes over 10 km altitude recorded at Tungurahua between November 2011 and December 2014.
| Date (local) |
Altitude (km) |
Drift direction(s) |
Distance (km) |
| 27 Nov 2011 |
10.7 |
WNW |
100 |
| 03 Dec 2011 |
11.0 |
SW |
110 |
| 22 Dec 2011 |
12.2 |
NE |
-- |
| 04 Feb 2012 |
12.2 |
NE |
250 |
| 11 Apr 2012 |
10.7 |
NE, W, SE |
170 |
| 16 Dec 2012 |
12.2 |
NW, NE |
140 |
| 14 Jul 2013 |
13.7 |
NNE, WNW |
370 |
| 01 Feb 2014 |
13.7 |
S, SW |
-- |
| 04 Apr 2014 |
15.2 |
NW, N, NE |
300 |
Activity during May 2011-September 2012. After loud explosions and ash emissions on 21 May 2011, constant rains at the end of May caused lahars and muddy water to descend the ravines of Tungurahua (BGVN 40:03). Ashfall was reported on 26 May, although cloud cover prevented observations of plumes. No further ash emissions or thermal anomalies were confirmed for six months. The Washington VAAC issued a volcanic ash advisory on 7 October based on a report from IG, and two additional reports on 24 October and 9 November from pilot reports. They noted that no ash was visible in satellite imagery at the time of those reports; on 9 November a revised statement from IG stated that no ash emissions had occurred since June.
A new eruption began on 27 November 2011, when three large explosions generated pyroclastic flows and caused ashfall within 10 km in several communities. Ashfall was reported in El Manzano (8 km SW), Bilbao (8 km W), Pailitas (8 km W), Cotaló (8 km NW), and Cusúa (8 km NW) (figure 62). The first Washington VAAC reports after these explosions noted an ash plume at 10.7 km altitude (5.7 km above the summit crater) drifting WNW and extending about 100 km from the summit.
During the next three weeks, nearly constant ash emissions with plumes as high as 11 km altitude (3 December) deposited ashfall in numerous communities. In addition to those communities mentioned above, Choglontús (13 WSW), Chacauco (17 km NW), Cahuají 8 km SW), Baños (9 km N), and Vazcún also received ashfall during this period. Many residents in Cusúa, Juive (8 km NNW), Palitahua (6 km SSW), and El Manzano evacuated voluntarily. Strombolian activity sent large incandescent blocks 500 m above the crater and 1,000 m down the flanks (figure 63), and pyroclastic flows traveled as far as 2 km down the flanks (BGVN 40:03). MODVOLC thermal alerts were issued on 1 and 4 December. Substantial plumes of SO2 were recorded by NASA's Global Sulfur Dioxide Monitoring system between 28 November and 8 December (figure 64).
Another major explosion on 22 December sent ash plumes to 12.2 km (7.2 km above the summit), according to the Washington VAAC. Emissions continued through 28 December. Ashfall from explosions near the end of December accumulated to a depth of 2-4 mm in villages to the SW. After two weeks of quiet, with only steam plumes emitting from the summit, a series of explosions between 12 and 15 January 2012 caused ashfall in communities up to 10 km SW. Ash plumes reported by IG rose to 7 km altitude; weather clouds often prevented satellite observations. Three lahars occurred during this time; one descended the Achupashal drainage on the NW flank carrying blocks up to 1 m in diameter, and the other two descended the Juive and Pondoa drainiages farther N on the NW flank, carrying blocks 10-20 cm in diameter. Another lahar on 21 January traveled down the Pampas drainage.
A large explosion on 4 February 2012, with an ash plume reported by the Washington VAAC at 12.2 km altitude, caused lapilli and ash to fall in communities as far away as Cevallos (23 km NW). Ongoing emissions were reported five hours later; the ash cloud was observed 250 km NE near the Ecuador-Colombia border. A pyroclastic flow also descended the Achupashal drainage, and incandescent blocks traveled 1 km down the flanks. Ash plumes during 17-18 February were reported by IG to rise to 6 km altitude, although weather clouds obscured satellite images. From 23 February to 13 March, numerous ash plumes caused ashfall in most communities NW and SW of the volcano, as far as Choglontus (13 km WSW). The Washington VAAC and IG both reported plumes as high as 8.5 km altitude (3.5 km above the summit crater) drifting W and SW during this time. Strombolian activity ejected material 500 m above the crater and onto the W and NW flanks on 24 February, and another pyroclastic flow was observed in the Achupashal drainage on 4 March. Lahars descended the Chacauco (NW) and Mapayacu (SW) drainages on 11 March.
After a short break, explosions were again detected on 19 March 2012. During brief periods when the crater was visible, observers noted incandescence and a few blocks rolling 200 m down the flank. A single MODVOLC thermal alert pixel was recorded on 20 March. IG and the Washington VAAC reported numerous ash plumes between 20 and 29 March, although weather clouds and precipitation made observations difficult for much of the month. Ashfall was reported in the villages within 10 km in most directions. Heavy rain during 24-25 March generated lahars in the Pampas area to the S and caused flooding in the Puela (8 km SW), Palitahua, and Ulba (10 km NNE) sectors. Additional lahars on 1 April descended the Pingullo and Achupashal (NW) drainages, carrying material 30 cm in diameter and causing a temporary road closure.
Persistent ash emissions rising to 8 km altitude and higher began again on 9 April 2012, and occurred with few breaks until mid-June when they became more intermittent. Ashfall was commonly reported from villages within 10 km during this period. A large plume on 11 April was reported by the Washington VAAC at over 10 km altitude drifting NE and SE (figure 65); rice-sized tephra fell in Pillate (7 km W) on 22 April. Ashfall covered houses and pastures in Bilbao and Pillate on 6 May. Several plumes in early June (3, 5, 10, 11, 13) resulted in ashfall, with noise and vibrations noted, within 10 km. IG staff witnessed an ash emission on 4 June (during an overflight) that rose about 1 km above the crater and drifted E (figure 66). Numerous lahars descended drainages on the W and SW flanks in late April, and again down the W flank on 16 May. On 7 June a lahar caused a temporary closure of the Baños-Penipe highway. Smaller lahars were reported in the same area on 24 June.
After an explosion on 27 June 2012 generated an ash plume that rose to 3 km above the crater, only small intermittent explosions with ash plumes occurred during July; steam-and-gas plumes rising up to 1 km above the summit were more common (figure 67). Incandescence at the summit and small explosions were noted on 25 July, and a few days later muddy waters carried blocks 50 cm in diameter down several S and W flank drainages. Surface and seismic activity increased noticeably during the last week of July.
Explosions on 5 August 2012 rattled windows in nearby areas and produced sounds resembling gunshots. A plume rose 3 km above the crater and drifted W. Several periods of continuous ash emissions occurred during the rest of the month; ashfall was reported in villages within 10 km many times. Incandescent blocks that were ejected 100 m above the crater fell 500 m down the flanks on 12-13 August. Activity significantly increased with strong explosions on 17 August. The next day, five small pyroclastic flows descended the NW and NE flanks, stopping 2.5 km from the crater. Numerous explosions continued on 19 and 20 August, with steam-and-ash plumes rising 1.5-2 km above the summit and drifting W and SW. Ash fell in communities farther to the NW than in previous months, including in Igualata (20 km W), El Santuario, Hualpamba, Cevallos (23 km NW), Quero (20 km NW), Mocha (25 km WNW), Santa Anita, and Tisaleo (29 km NW). IG scientists determined that an approximate volume of 400-500,000 cubic meters of ash was deposited within 15 km of the volcano between 10 and 20 August. The maximum deposit thicknesses were 3 mm in Yuibug, 2 mm in Pillate, 1.5 mm in Choglontús and Chontapamba, 1 mm in Cahuají, and 0.5 mm in Puela (figure 68).
An overflight on 20 August revealed an 80-m-wide inner crater. On 21 August, 16 large explosions caused windows to rattle. Strong "cannon shots" were heard in areas as far away as Ambato (31 km NW) and Riobamba (30 km S), although noises had decreased in intensity and duration compared to the previous few days. Ash plumes rose as high as 9.7 km altitude and drifted W, and a pyroclastic flow traveled 2.5 km down the NW flank that day. MODVOLC thermal alert pixels appeared during 16-23 August. Explosions and ash plumes rising up to 4 km above the crater continued for the rest of August, along with ejected incandescent tephra and ashfall in nearby communities. IG reported that the intensity of seismic tremor and emissions decreased beginning on 21 August.
NASA's Global Sulfur Dioxide Monitoring system captured SO2 plumes during 13-21 August, and again from 31 August to 3 September. An explosion on 3 September produced an ash plume that rose 300 m above the crater; two MODVOLC thermal alerts also appeared that day. A final ash plume was reported by IG on 4 September rising to 6.7 km altitude (1.7 km above the summit), but dense cloud cover prevented satellite observation. No more ash plumes were reported until 14 December 2012.
Activity during December 2012-January 2013. A major rainfall event on 1 December generated a large lahar that descended the Vazcún drainage on the N flank, causing an evacuation of people at the El Salado resort (8 km N) before the 6-m-deep lahar that carried 3-m-diameter blocks reached the area. An increase in seismicity beginning on 12 December preceded a large explosion on 14 December. The explosion created an ash plume, identified in satellite imagery by the Washington VAAC, that rose to 7.9 km altitude. The leading edge of the 10-km-wide, detached plume was 15 km SE of the summit. Pyroclastic flows traveled down the SW flank. A smaller ash plume the next day caused a trace of ashfall in Runtún (6 km NNE).
Three large explosions on 16 December 2012 ejected incandescent blocks and expelled an ash plume, containing lightning, that rose to 12.2 km altitude (7.2 km above the summit) (figure 69). The soundwaves from the explosion reportedly broke the windows of the church of Cusúa. The Washington VAAC identified the plume in satellite imagery extending up to 140 km NW, and 110 km NE at a lower altitude of 7.9 km. Ashfall was reported up to 31 km NW from Tungurahua, in Cotaló (8 km NW), Pondoa (8 km N), Runtún, and Pillate (8 km W). More specifically, coarse-grained ash fell in Baños (9 km N), Vascún, and Ulba (NNE), and medium-to-fine-grained ash fell in Palitahua (S), Choglontús (SW), El Manzano (8 km SW), Capil, Guadalupe Observatory (13 km N), Cevallos (23 km NW), Tisaleo (29 km NW), Ambato (31 km NW), Patate (NW), Píllaro, Pelileo (8 km N), Salcedo, and Pujilí, Latacunga, Rio Verde, Agoyán, and Palora.
Explosions and ashfall continued on 17 December; a dense ash plume was observed drifting over 200 km NE at an altitude of 7 km. A seven-pixel MODVOLC thermal alert also appeared. Substantial SO2 plumes were recorded by the OMI satellite instrument between 16 and 29 December. Two pyroclastic flows traveled 3-4 km down the flanks and burned vegetation on 18 December. Explosions shook structures, were often heard by local residents, and generated ashfall in the neighboring communities for several days. The following week, ash plumes decreased in frequency and density, but explosions of incandescent blocks increased. During 21-24 December Strombolian explosions appeared at night; they peaked at over 500 m above the crater, sending blocks more than one kilometer down the W and NW flanks. On the night of 23 December, observers noted intermittent lava fountains rising to 500 m. Another MODVOLC thermal alert pixel was recorded on 24 December. After this, seismicity decreased significantly; the Washington VAAC last reported emissions on 30 December.
Trace amounts of ashfall were reported by IG on 6 and 10 January 2013 in Choglontús (SW) and El Manzano (8 km SW), after small explosions on those days. Explosions, but no ash, were recorded on 21 January; in the evening of 24 January, a column of steam and gas with very low ash content rose less than 1 km and drifted W and SW after reported explosions. The lookout at Palitahua reported black ashfall the following morning. After this, Tungurahua was quiet until the end of February 2013.
Activity during March 2013. IG reported increased seismicity on 28 February 2013. Explosions occurred, and ash emissions rose a few hundred meters above the crater the next day. Ashfall was reported in areas on the SW flank including Choglontús and El Manzano. Multiple VAAC reports were issued daily from 1 to 18 March. Ash plume heights were generally 1-1.5 km above the summit crater (6-6.5 km altitude), but were reported 4 km above the crater on 17 March. Several times during March, IG reported incandescent blocks rolling as far as 500 m down the flanks, and repeated ashfall in communities within 15 km (figure 70). Deformation measurements suggested that a small magma body was rising beneath the NW flank. An SO2 plume first appeared in the OMI satellite data on 2 March, and was visible daily until 12 March. From 10 to 15 March, MODVOLC recorded 15 thermal alert pixels. Pyroclastic flows occurred on 15 and 17 March; lava fountains rose 200-300 m above the crater on 17 March. A notable decline in seismicity began on 21 March, and a low-ash-content plume that rose 1 km above the crater on 24 March was the last ash emission until the end of April.
Activity during April-May 2013. The webcam confirmed the minor emission of volcanic ash on 24 April 2013; the Washington VAAC reported an ash plume at 6.7 km altitude extending 50 km WNW from the summit on the same day. A series of large explosions began on 27 April. During the next week, these explosions sent steam-and-ash plumes up to 4.7 km above the summit (9.7 km altitude) which drifted at least 100 km SW and W. Ash plumes reported daily by the Washington VAAC rose 1-3 km above the summit until 15 May, and ash fell in communities across the region up to 30 km away in many directions. Lahars traveled down drainages on the S, N, and NW flanks on 4 May. A pyroclastic flow traveled 2 km down the NW flank on 5 May, and Strombolian activity was visible on most nights. During 9-10 May, lava fountains rose 700 m above the crater. MODVOLC thermal alert pixels appeared on 1, 10, 12, and 13 May. An SO2 plume was recorded in the OMI satellite data on 29 and 30 April, and again from 5 to 12 May. After a slight amount of ash was reported in Choglontus (SW) on 15 May, there were no more reports of ash plumes for two months.
Activity during July-August 2013. IG reported increased seismicity on 13 July 2012 in advance of two large explosions on the morning of 14 July; the first was heard in areas as far away as Guayaquil (about 180 km SW). The Washington VAAC reported the plume from these explosions at 13.7 km altitude (8.7 km above the summit) around midday. They noted that satellite imagery showed a dense ash plume expanding in all directions from the summit, but moving generally N and W. Significant amounts of tephra fell in areas near the volcano including Bilbao (4-cm-diameter), Chacauco (5-cm-diameter), Cotaló, Cahuají, Choglontus, El Manzano, Puela, and Penipe (15 km SW). Thinner deposits were reported in towns including Pelileo, Ambato, Cevallos, Colta (45 km SW), Guanujo (65 km WSW), and Guaranda (65 km WSW), and in the cantons of Guano (30 km SW), Valencia, Empalme, Buena Fé, and areas in the province of Manabi (180 km NW).
Several significant pyroclastic flows also descended drainages on the NW flanks, including the Achupashal and Juive Grande drainages, during the explosions of 14 July. The pyroclastic flows at Juive Grande reached a distance of 6.3 km and stopped a kilometer above the road (figure 71). The temperature measured in the deposit with a thermal camera the next day was 95°C. In the Achupashal stream, the pyroclastic flows reached 6.5 km and crossed the Chambo River. The temperature measured in this deposit was 65°C. According to USA Today, over 200 people were evacuated from Cusua, Chacauco, and Juive.
Volcanic ash advisories were issued daily by the Washington VAAC until 1 August 2013. IG reported that on 19 July the geodetic monitoring system indicated an inflationary trend on the N flank and deflation SW of the volcano, a continuing indication of the presence of a magma body about 2 km below the crater. Ash fell in communities up to 30 km away several times during the period, including after large plumes that rose to 9.6 and 9.9 km altitude on 21 and 24 July. Minor amounts of ash were reported in the Guaranda, Salinas, and Guanujo (65 km WSW) areas after explosions on 26 July, one of which also generated a small pyroclastic flow. Strombolian activity occurred throughout the period, with activity including incandescent blocks rolling up to 500 m down the flanks several times. The OMI instrument captured SO2 plumes from 15 July through 2 August. MODVOLC thermal alerts were issued on 27 and 29 July. Seismic and explosive activity decreased during the first week in August. An ash plume on 8 August that rose 2 km above the summit and drifted W caused minor ashfall in Choglontus (SW). Trace ashfall was reported in Choglontús and El Manzano on 23 August.
Activity during October-November 2013. Activity resumed in early October 2013 with increased seismicity, Strombolian activity, ash plumes, and pyroclastic flows. A small explosion on 6 October produced ashfall in nearby areas. A larger high-level ash plume on 11 October was observed by the Washington VAAC rising to 8.5 km altitude; ashfall spread to nearby towns. Pyroclastic flows were reported on 14 October. Daily VAAC reports that began on 11 October continued through 30 October, followed by reports on 3, 7, and 9 November. The near-continuous ash emissions during this time generally rose 2-4 km above the crater, and deposited ash in communities within 30 km. Daily SO2 plumes were captured by OMI between 7 and 22 October, and eight MODVOLC thermal alerts appeared between 19 and 24 October. The last reports of ashfall during this episode were on 12 November when plumes rose 1.5 km from the summit and drifted W, with ashfall reported in El Manzano.
Activity during January-May 2014. The community of Pungal, 40 km SSW of Tungurahua, received ashfall on 30 January from a series of explosions that began after two and a half months of quiet. The Washington VAAC reported the ash plume visible at 8.2 km altitude extending 11 km ESE from the summit. A swarm of VT earthquakes on 1 February was followed by two explosions that generated ash plumes to 2-4 km above the summit, and pyroclastic flows that traveled 500 m down the NE and NW flanks. These explosions were followed a few minutes later by a larger explosion that produced an ash plume reported by IG that rose more than 8 km above the summit (figure 72).
Based on reports from IG, satellite images, pilot observations, web-camera images, and the Guayaquil MWO, the Washington VAAC reported that the ash plume from the 1 February explosions rose to an estimated altitude of 13.7 km, and drifted S at high altitudes and SW at lower altitudes. IG noted that pyroclastic flows traveled 7-8 km, reaching the base of the volcano and crossing over the Achupashal Baños- Penipe highway. Continuous ash-and-gas emissions followed; ash fell in multiple areas and total darkness was reported in Chacauco (NW). Explosions continued every minute and vibrated structures in local towns. Pyroclastic flows descended the SW, W, NW, and NE flanks, but stopped short of towns and infrastructure. Ash emissions were sustained through the rest of the evening, and Strombolian explosions ejected incandescent blocks 800 m above the crater that fell and rolled 500 m down the flanks.
Numerous explosions and ashfall continued in subsequent days; on 3 February 2014 an ash plume rose 4 km above the summit and drifted N, reaching Quito (130 km N) as a mist of suspended very fine material that lingered most of the day. The Washington VAAC issued multiple daily reports of ash plumes from 30 January until 23 February. An eight-pixel thermal alert on 2 February was the beginning of a sequence of MODVOLC thermal alerts that included 10 more during February. SO2 plumes drifting W were captured by the OMI satellite instrument between 7 and 10 February. During 16-18 February, ash plumes again rose to altitudes between 9 and 10 km, dispersing ash to the W and NW. Strombolian activity and loud noises were common during this interval.
Fewer ash plumes were reported during March 2014, at generally lower heights of 1-3 km above the crater; ash fell in communities within 15 km. Only three MODVOLC thermal alerts were recorded: two on 6 March and one on 15 March. On 11 and 21 March rains caused major lahars in the Achupashal drainage which led to traffic disruption on the Baños- Penipe highway. Lahars on 31 March traveled down the Vascún (N) and Mapayacu (SW) drainages, carrying blocks up to 1 m in diameter in the latter drainage.
Explosions and substantial ash plumes increased in April 2014, with multiple daily VAAC reports issued between 2 and 25 April. The largest explosion, on 4 April, lasted five minutes, and generated pyroclastic flows that descended the NW and N flanks. It also caused an ash plume that rose over 10 km above the crater, reported at 15.2 km altitude (50,000 ft) by the Washington VAAC, the highest reported in many years (figure 73). Tephra up to 7 cm in diameter fell in Cusúa and Píllaro.
During 5-11 April, SO2 plumes drifting W were detected by the OMI satellite instrument. Large lahars descended the Achupashal (NW) and Confesionario drainages (WSW) on 8 April. On 9 April Strombolian activity caused incandescent blocks to roll 3 km down the flanks (figure 74). The next day a lava flow on the upper W flank, in the Mandur drainage, was estimated to be 2 km long, 100 m wide, and 15 m thick (figure 75). This was likely the cause of the six MODVOLC thermal alerts recorded on 11 April.
A significant explosion on 14 April 2014 produced an infrasound signal that was detected at 150 decibels 5.5 km away. Unconfirmed reports indicated that windows in Chacauco and Cusúa shattered. The shock wave was also detected in other locations, including Ambato and Riobamba (30 km S). Although IG reported an ash plume rising to over 5 km above the crater (10 km altitude), the Washington VAAC only reported the plume to 8.5 km. A lahar in the Achupashal drainage on 15 April affected traffic on the main highway. Repeated ashfall was reported for the rest of the month in communities within 30 km; crater incandescence was often observed at night.
OVT reported a gas-and-ash emission to an estimated 9 km altitude on 8 May 2014. Three explosions on 10 May generated ash emissions that rose an estimated 5 km above the crater, with ashfall reported in the communities to the SW. There were no VAAC reports issued for the 10 May explosions. A small plume on 11 May had minor amounts of ash. After this, there were no further reports of ash until the end of July. Intense rains on 10 and 11 May caused lahars to flow down most drainages, and roads crossing the Chontapamba and Romero gorges were washed out (figure 76).
The episodic nature of the activity at Tungurahua is demonstrated well by the plot of MIROVA thermal anomaly data captured between April 2013 and April 2014 (figure 77). While the whole duration of the episode is seldom recorded due to weather and other factors, each set of anomalies based on MODIS satellite data is within the boundaries of each episode listed in table 19.
Activity during June-December 2014. Seasonal rains in June and July 2014 generated numerous lahars, some causing major damage to roads. Otherwise, the volcano was largely quiet with only 100-m-high steam plumes rising from the summit crater on clear days, until seismicity increased once again on 27 July. The seismicity was accompanied by a small ash plume that rose 1 km above the crater and drifted NW. This event was the beginning of a lengthy episode of explosions, ash plumes, Strombolian activity, pyroclastic flows, and lahars that lasted through most of December 2014.
Deformation data revealed additional information about the the activity at Tungurahua (figure 78). The inclinometer of the RETU station is located on the NNE flank at an elevation of 4,000 m. During a 14-month period from 1 June 2013 to 1 August 2014 the radial axis inflation and deflation correlated with four significant explosion events. Periods of gradual inflation were followed by sudden deflation that accompanied an explosion. A new series of explosions began shortly after 24 July 2014 when the last deflation on the graph was detected.
Seismicity increased on 28 July 2014; a small explosion with an ash plume rose 1 km above the crater and drifted NW with ashfall reported in the Chontapamba area. The Washington VAAC issued multiple daily reports of ash plumes between 1 August and 11 September 2014. They were generally reported at 1-4 km above the summit, or to altitudes of 6-9 km. Ashfall was reported a number of times in communities within 30 km. Strombolian activity sent incandescent blocks as high as 1 km above the crater and up to 1.5 km down the flanks (figure 79). Incandescence appeared on most clear nights. Lahars occurred after rainy episodes during 8-9 and 13 August. On 30 and 31 August, near-constant explosions were detected, and pyroclastic flows traveled 1,500 m down the NW flank. The pyroclastic flows surrounded the lava flow from April 2014, in the La Hacienda, Achupashal, and Mandur drainages. Another pyroclastic flow reported on 3 September descended 500 m from the crater. During 10 August and 7 September, 12 MODVOLC thermal alerts were issued. SO2 plumes reappeared on the OMI satellite instrument on 2 August and were captured daily until 6 September.
Activity decreased slightly toward the end of September 2014, although intermittent ash plumes were still reported as high as 2.5 km above the crater; ashfall was recorded in communities up to 25 km away, generally to the W. Rains on 12 and 14 September resulted in lahars within the NW drainages of Achupashal and La Pampa. LP seismic events increased slightly at the end of September along with several low-level ash plumes. The last reports of nighttime incandescence were on 27 September.
Emissions with low to moderate ash content were noted most days in early October. Ashfall was reported from a few communities within 30 km on 1, 3, and 6 October. Trace amounts of ashfall appeared on the SW flank the following week. OVT reported emissions with moderate ash content rising 2-3 km above the summit during 19 and 20 October. Plumes rising to 2 km with low ash content were observed on 25 October. During the end of October and the first few days of November, IG observed only water vapor emissions to 500 m above the crater.
Although quieter, Tungurahua was still active through November and December 2014. Trace amounts of ash in the emissions were observed from El Manzano on 3 November. On 7 and 8 November ash-bearing plumes rose less than 300 m and drifted WSW. For the rest of November, only steam plumes rose to 700 m above the crater. Incandescence was visible at the summit in the early morning hours of 21 November, and again on 4 December. Residents in Choglontus reported a steam-and-ash plume drifting S early on 6 December. A significant lahar on the NW flank washed out the Penipe-Banos road in the Achupashal gorge on 7 December. Low ash content was reported in plumes rising to 500 m above the crater each day from 9-15 December, and magmatic gases and steam emissions were persistent (figure 80). Slight incandescence was seen at night on 11 December. On 14 December, a column consisting of re-suspended ash was seen drifting E. For the remainder of December, weak water vapor plumes rose a few hundred meters above the crater; lahars were reported on 25 December.
Geologic Background. Tungurahua, a steep-sided andesitic-dacitic stratovolcano that towers more than 3 km above its northern base, is one of Ecuador's most active volcanoes. Three major edifices have been sequentially constructed since the mid-Pleistocene over a basement of metamorphic rocks. Tungurahua II was built within the past 14,000 years following the collapse of the initial edifice. Tungurahua II collapsed about 3,000 years ago and produced a large debris-avalanche deposit to the west. The modern glacier-capped stratovolcano (Tungurahua III) was constructed within the landslide scarp. Historical eruptions have all originated from the summit crater, accompanied by strong explosions and sometimes by pyroclastic flows and lava flows that reached populated areas at the volcano's base. Prior to a long-term eruption beginning in 1999 that caused the temporary evacuation of the city of Baños at the foot of the volcano, the last major eruption had occurred from 1916 to 1918, although minor activity continued until 1925.
Information Contacts: Instituto Geofísico (IG), Escuela Politécnica Nacional, Casilla 17-01-2759, Quito, Ecuador (URL: http://www.igepn.edu.ec/); Washington Volcanic Ash Advisory Center (VAAC), Satellite Analysis Branch (SAB), NOAA/NESDIS OSPO, NOAA Science Center Room 401, 5200 Auth Rd, Camp Springs, MD 20746, USA (URL: http://www.ospo.noaa.gov/Products/atmosphere/vaac/, archive at: http://www.ssd.noaa.gov/VAAC/archive.html); Hawai'i Institute of Geophysics and Planetology (HIGP), MODVOLC Thermal Alerts System, School of Ocean and Earth Science and Technology (SOEST), Univ. of Hawai'i, 2525 Correa Road, Honolulu, HI 96822, USA (URL: http://modis.higp.hawaii.edu/); MIROVA (Middle InfraRed Observation of Volcanic Activity), a collaborative project between the Universities of Turin and Florence (Italy) supported by the Centre for Volcanic Risk of the Italian Civil Protection Department (URL: http://www.mirovaweb.it/); NASA Goddard Space Flight Center (NASA/GSFC), Global Sulfur Dioxide Monitoring Page, Atmospheric Chemistry and Dynamics Laboratory, 8800 Greenbelt Road, Goddard, Maryland, USA (URL: https://so2.gsfc.nasa.gov/); USA Today (URL: http://www.usatoday.com/story/news/world/2013/07/14/ecuador-volcano-spews-ash/2516393/).
Whakaari/White Island (New Zealand) — May 2017 Cite this Report
Whakaari/White Island
New Zealand
37.52°S, 177.18°E; summit elev. 294 m
All times are local (unless otherwise noted)
Ongoing unrest, with phreatic activity on 27 April and 13 September 2016
Following a period with frequent eruptions between 1995 and 2001, White Island (officially called Whakaari/White Island) was quiet until 2012, when plumes began rising from the crater lake on 5 August that included ash two days later (BGVN 37:06). Hydrothermal activity was vigorous, generating phreatic explosions and ash emissions through July 2013, followed by larger explosions in August and October (BGVN 39:02). No further eruptive activity was observed until 2016, when brief phreatic explosions took place on 27 April and 13 September. Monitoring by GNS Science is conducted under the GeoNet Project, the official source of geological hazard information in New Zealand. The following information comes from the GeoNet website.
GNS scientists visited in early February 2014 and measured the crater lake temperature of 57°C and that of fumarole F0, on the S part of the crater floor, at 147°C. The lake level was still rising, and had drowned one of the fumaroles on the southern lakeshore, causing occasional geysering in that area. A new Global Positioning System (GPS) station was installed on the crater floor to strengthen the deformation monitoring network. The average SO2 gas flux remained below 500 metric tons per day; this was lower than the previous few months and may have been partly due to the higher lake level. On 28 August 2014 the GeoNet seismic network detected a sequence of small earthquakes near White Island, the largest event was magnitude 3.3 and located within 5 km of the island. All the quakes were shallow (less than 10 km depth).
Monitoring by plane, ground instruments, and visual observation throughout 2015 indicated that minor volcanic unrest continued. In October 2015, GNS Science volcanologists measured such factors are ground deformation, CO2 soil gas, fumarole and crater lake temperature, lake level, and SO2 gas. Seismometers continued to monitor volcanic tremors, and airborne monitoring measured CO2, SO2, and H2S levels. Elevated amounts of CO2 emitted from one of the large accessible fumaroles was detected on 1 October; temperatures and SO2 emissions also increased. On 8 October volcanic tremor magnitude strengthened and became banded (the signal disappeared and reappeared every few hours), commonly noted during periods on unrest and eruptive periods.
Over two weeks in mid-April 2016 the lake level dropped by 2 m. Then, on the morning of 27 April, a brief eruption occurred (lasting about 90 minutes) accompanied by moderately elevated seismic activity. The eruption appears to have deposited material over the N side of the crater floor and up onto the N crater wall. The Volcanic Alert Level was raised to 3 (minor volcanic eruption) and the Aviation Colour Code (ACC) changed from Green to Orange. A subsequent lack of activity resulted in a lowering of the Volcanic Alert Level to 2 (moderate to heightened volcanic unrest) that evening. Observers who flew over the volcano the following day saw a dark-green ash covering at least 80% of the crater floor and up the sides of the crater wall on both N and S sides; the deposit was ~5 mm thick at a distance of 500 m from the eruption site (figure 65).
An aerial inspection two days after the eruption revealed a new crater and vent in the NE corner of the 1978/1990 crater complex. Analysis of the deposit showed the ash to be strongly hydrothermally altered old rock; no evidence of new, juvenile lava was found, suggesting that the eruption was likely driven by steam and gas, like the eruptions in 2012 and 2013. The eruption did produce very energetic blasts and surges that broke survey pegs at ground level. The eruption sequence, as reported by GNS, was that the area around Donald Duck Crater collapsed and exploded (figure 66), then the former lake and sediments erupted, resulting in the blast and surge deposits. The lake floor dropped at least 13 m, and there was a collapse of the 1978/90 Crater walls.
By 2 May, observations indicated no change in volcanic activity. As a consequence, the ACC was lowered to Yellow, and by 9 May the Volcanic Alert Level was lowered to 1. Although the April activity was a moderate steam and gas eruption, it did result in a new vent and ash deposits.
GeoNet reported that in the morning of 13 September 2016 a vent on the 2012 lava dome had a minor passive ash emission. The Volcanic Alert Level was raised to 3 from 1, and the ACC was changed from Green to Orange. Observations from a visit on 14 September found that the ash emissions had ceased; the Volcanic Alert Level was lowered to 2 and the ACC lowered to Yellow. The Alert Level was lowered to 1 on 19 September. The crater lake water level began to drop on 24 September, and by 26 September the lake was gone.
GNS has been using Unmanned Aerial Vehicles (UAV's; also known as drones), to monitor the volcano. In December 2016 the drone was used to obtain images of the active crater area, resulting in a new Digital Terrain Model (DTM) of the area (figure 67).
According to a GeoNet report on 3 April 2017, visits to White Island over the previous 3-4 months confirmed that activity remained at low levels. Activity was confined to the gas-rich vents on the western side of the active crater. Hot, clear gas continued to be emitted. Some water had ponded on the floor of the active crater but no permanent lake had reformed. The seismic and acoustic activity generally remain low, and the SO2 gas flux was slowly declining (figures 68 and 69).
Geologic Background. The uninhabited Whakaari/White Island is the 2 x 2.4 km emergent summit of a 16 x 18 km submarine volcano in the Bay of Plenty about 50 km offshore of North Island. The island consists of two overlapping andesitic-to-dacitic stratovolcanoes. The SE side of the crater is open at sea level, with the recent activity centered about 1 km from the shore close to the rear crater wall. Volckner Rocks, sea stacks that are remnants of a lava dome, lie 5 km NW. Descriptions of volcanism since 1826 have included intermittent moderate phreatic, phreatomagmatic, and Strombolian eruptions; activity there also forms a prominent part of Maori legends. The formation of many new vents during the 19th and 20th centuries caused rapid changes in crater floor topography. Collapse of the crater wall in 1914 produced a debris avalanche that buried buildings and workers at a sulfur-mining project. Explosive activity in December 2019 took place while tourists were present, resulting in many fatalities. The official government name Whakaari/White Island is a combination of the full Maori name of Te Puia o Whakaari ("The Dramatic Volcano") and White Island (referencing the constant steam plume) given by Captain James Cook in 1769.
Information Contacts: New Zealand GeoNet Project, a collaboration between the Earthquake Commission and GNS Science, Wairakei Research Centre, Private Bag 2000, Taupo 3352, New Zealand (URL: http://www.geonet.org.nz/).