The Pusat Vulkanologi dan Mitigasi Bencana Geologi (PVMBG) reported that blue flames on the crater walls of Papandayan’s Baru Crater were visible at 1900 on 12 July. The blue flames suggested increased temperatures at the solfatara along with the presence of oxidized sulfur. Dense emissions were seen rising 15-30 m from the crater at 2140 during a field visit. The plumes drifted W. The report noted that white plumes rose 5-30 m from both Baru and Mas craters during 1-12 July. Blue flames were last observed in March 2023. The Alert Level remained at 1 (on a scale of 1-4) and tourists were advised to stay 500 m away from the active craters.
Source: Pusat Vulkanologi dan Mitigasi Bencana Geologi (PVMBG, also known as CVGHM)
Seismic increases in July and August 2011, with no eruption
Minor seismic activity and fumarolic plumes at Papandayan occurred in July 2005, July and August 2007, and April 2008 (BGVN 33:06; figure 9). This report covers a seismic swarm reported in July and August 2011. According to the Center of Volcanology and Geological Hazard Mitigation (CVGHM), Papandayan is monitored by eight seismic stations (three permanent and five temporary).
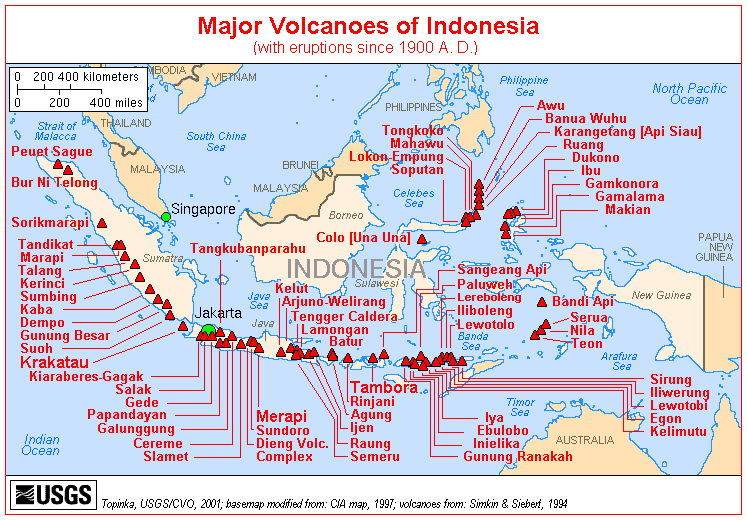 |
Figure 9. A map showing the location of Papandayan relative to many other Indonesian volcanoes of Holocene age. Courtesy of USGS. |
Since April 2008, reports on seismicity were sparse. Then, in July 2011, seismicity increased; several hundred earthquakes were detected per month, and the occurrence of deep earthquakes nearly tripled. (figure 10, table 4).
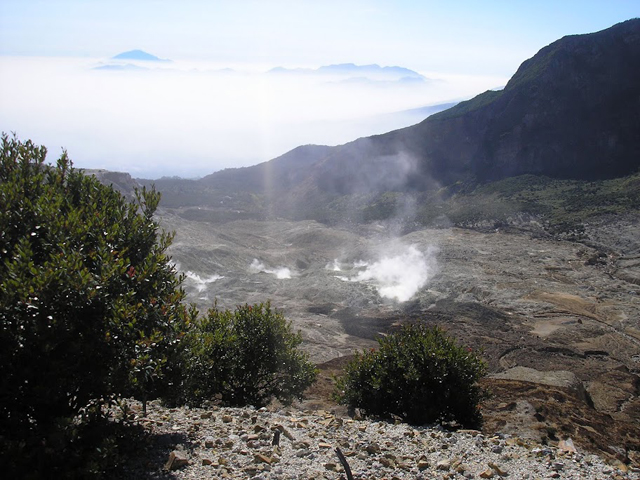 |
Figure 10. Papandayan crater as seen from the trail to Pondok Salada in August 2011. Courtesy of Daniel Quinn. |
Table 4. The occurrence of various types of seismicity at Papandayan during July-24 August 2011. '--' indicates data not reported. Data from CVGHM.
| Date | Deep volcanic | Shallow volcanic | Low-frequency | Distant Tectonic | Local Tectonic |
| Jun 2011 | 31 | 339 | 9 | 112 | 37 |
| Jul 2011 | 91 | 431 | 9 | 165 | 97 |
| 1-24 Aug 2011 | 94 | 501 | -- | 100 | 34 |
According to CVGHM, sulfur-dioxide (SO2) plumes rose 20-75 m above the vents between 1 June and at least 12 August 2011. Between 12-23 August, SO2 emissions ranged from 3-8 tons per day. Carbon dioxide (CO2) levels measured in the soil at 1 m depth in multiple areas did not increase. The temperature in the Manuk thermal area increased during 29 June to 12 August, and deformation measurements indicated inflation from 4 July to 10 August. On 13 August 2011, CVGHM announced that the Alert Level for Papandayan had been increased to 3 (on a scale of 1-4) based on seismicity, deformation, geochemistry, and visual observations. Visitors and residents were warned not to venture within 2 km of the active crater. The increase spurred multiple news reports.
On 14 August 2011, the Jakarta Globe reported that Sutopo Purwo Nugroho, a spokesman for the National Disaster Mitigation Agency, had stated that gas was emanating from three craters - Walirang, Manuk and Balagadama. The same report quoted Surono, who heads CVGHM, as saying: "For now, we are not too worried about a major eruption. We are more concerned by the toxic gas."
According to other news reports, by mid-August 2011 local officials had completed evacuation planning, especially for three vulnerable villages within 7 km of the active crater. The report also mentioned that as of 19 August, residents near the volcano were continuing their normal activities, but that tourist visitation had dropped sharply at the popular destination.
On 26 August 2011, CVGHM reported that Papandayan's activity had not increased during the previous few days. Seismicity remained high, but stable, and was dominated by shallow volcanic earthquakes. Deformation measurements (such as leveling and Electronic Distance Measurement - EDM) showed no change, and water temperatures in multiple fumarolic areas and lakes remained relatively constant.
On 31 January 2012, CVGHM lowered the Alert Level from 3 to 2, without indication of eruption details or reasons for the change. As of 30 June 2012, the Alert Level remained at 2.
Crater emission videos. Video clips of crater emissions taken at Papandayan in October 2009, and at an uncertain other date can be found on YouTube:
Pwarr3n, 2009, YouTube (URL: http://www.youtube.com/watch?feature=endscreen&NR=1&v=H_GIwMdkWT8).
Sweetmarias, undated, posted 13 August 2010, YouTube (URL: http://www.youtube.com/watch?v=tSFoybapqe0).
Information Contacts: Center of Volcanology and Geological Hazard Mitigation (CVGHM), Jalan Diponegoro 57, Bandung 40122, Indonesia (URL: http://www.vsi.esdm.go.id/); Jakarta Globe (URL: http://www.thejakartaglobe.com).
2025: July
2023: March
2016: October
2015: April
| May
| June
| July
| November
2013: May
| June
2012: February
2011: August
2008: January
| April
2007: August
2005: June
2004: July
2003: January
2002: November
| December
The Pusat Vulkanologi dan Mitigasi Bencana Geologi (PVMBG) reported that blue flames on the crater walls of Papandayan’s Baru Crater were visible at 1900 on 12 July. The blue flames suggested increased temperatures at the solfatara along with the presence of oxidized sulfur. Dense emissions were seen rising 15-30 m from the crater at 2140 during a field visit. The plumes drifted W. The report noted that white plumes rose 5-30 m from both Baru and Mas craters during 1-12 July. Blue flames were last observed in March 2023. The Alert Level remained at 1 (on a scale of 1-4) and tourists were advised to stay 500 m away from the active craters.
Source: Pusat Vulkanologi dan Mitigasi Bencana Geologi (PVMBG, also known as CVGHM)
PVMBG issued a special report based on recent observations of Papandayan. The number of shallow volcanic earthquakes had increased in January and although the numbers fluctuated, low-frequency earthquakes also increased overall during January and February. Webcam images from the camera in the parking area showed incandescence emanating from Kawah Baru during the night on 22 February. A team of PVMBG scientists inspected the crater during 2100-2300 on an unspecified date to identify the source of the incandescence. They observed intense emissions rising from Kawah Baru, heard faint rumbling, and detected a strong sulfur odor, but did not see incandescence. Gas plumes rose 300 m from a solfatara. The color of the lake in Kawah Baru was greenish. Rumbling sounds from both the Kawah Mas and Kawah Baru solfatara complexes varied from weak to strong and gas emissions were sometimes intense. Solfatara temperatures were variable at Kawah Mas, Kawah Manuk, and Kawah Baru with a maximum temperature of 123.8 degrees Celsius. Sulfur dioxide gas concentrations were high at a distance of 500 m from the solfatara complexes. Based on the field observations PVMBG concluded that conditions at Papandayan were relatively normal. The Alert Level remained at 1 (on a scale of 1-4) and tourists were advised to stay 500 m away from the active craters.
Source: Pusat Vulkanologi dan Mitigasi Bencana Geologi (PVMBG, also known as CVGHM)
PVMBG reported that during 1 August-17 October seismicity at Papandayan fluctuated but decreased overall. Visual monitoring occurred from the Pakuwon Village post where observers noted white plumes rising at most 35 m above the crater. The Alert Level was lowered to 1 (on a scale of 1-4) on 19 October; residents and tourists were reminded not to approach the craters within a 500-m radius.
Source: Pusat Vulkanologi dan Mitigasi Bencana Geologi (PVMBG, also known as CVGHM)
PVMBG reported that during 1 September-16 November seismicity at Papandayan was dominated by shallow volcanic earthquakes but also consisted of deep volcanic earthquakes, low-frequency earthquakes, harmonic tremor, and hybrid events. Visual monitoring occurred from the Pakuwon Village post where observers noted white plumes rising at most 35 m above the crater. The Alert Level remained at 2 (on a scale of 1-4); residents and tourists were reminded not to approach the craters within a 1-km radius.
Source: Pusat Vulkanologi dan Mitigasi Bencana Geologi (PVMBG, also known as CVGHM)
PVMBG reported that during 1 June-13 July seismicity at Papandayan was dominated by shallow volcanic earthquakes but also consisted of deep volcanic earthquakes, low-frequency earthquakes, harmonic tremor, and hybrid events. Visual monitoring occurred from the Pakuwon Village post; where observers noted white plumes rising at most 30 m above the crater. The Alert Level remained at 2 (on a scale of 1-4); residents and tourists were reminded not to approach the craters within a 1-km radius.
Source: Pusat Vulkanologi dan Mitigasi Bencana Geologi (PVMBG, also known as CVGHM)
PVMBG reported that during 1-11 June shallow volcanic earthquakes at Papandayan occurred at an average rate of 26 events/day. Visual monitoring occurred from the Pakuwon Village post; observers noted white plumes rising at most 50 m above the crater. The Alert Level remained at 2 (on a scale of 1-4); residents and tourists were reminded not to approach the craters within a 1-km radius.
Source: Pusat Vulkanologi dan Mitigasi Bencana Geologi (PVMBG, also known as CVGHM)
PVMBG reported that during 22 April-25 May seismicity at Papandayan was dominated by shallow volcanic earthquakes but also consisted of volcanic earthquakes, low-frequency earthquakes, tremor, and local and remote tectonic earthquakes. Visual monitoring occurred from the Pakuwon Village post; observers noted white plumes rising at most 30 m above the crater. The Alert Level remained at 2 (on a scale of 1-4); residents and tourists were reminded not to approach the craters within a 1-km radius.
Source: Pusat Vulkanologi dan Mitigasi Bencana Geologi (PVMBG, also known as CVGHM)
PVMBG reported that during 1 March-21 April seismicity at Papandayan was dominated by shallow volcanic earthquakes but also consisted of volcanic earthquakes, low-frequency earthquakes, and local and remote tectonic earthquakes. Visual monitoring occurred from the Pakuwon Village post; observers noted white plumes rising at most 100 m above the crater. The Alert Level remained at 2 (on a scale of 1-4); residents and tourists were reminded not to approach the craters within a 1-km radius.
Source: Pusat Vulkanologi dan Mitigasi Bencana Geologi (PVMBG, also known as CVGHM)
CVGHM reported that observers at the Papandayan observation post in Pakuwon Village reported no significant changes at Papandayan during May and the beginning of June. They noted that during May plumes rose less than 100 m above Baru and Emas craters, and during 1-5 June plumes rose 20 m at most.
The energy of volcanic earthquakes sharply increased during 2-4 May, and then decreased on 5 May. The average number of volcanic earthquakes declined from 35-49 events per day in early-to-mid May, to 14 events per day in mid-to-late May. The number of events continued to decline through the beginning of June. The number of local tectonic earthquakes also decreased significantly from an average of 67-71 events per day in early-to-mid May, to 2-17 events per day the latter half of May, to about 2 events per day in early June.
Based on the visual observations and decline in seismicity, CVGHM lowered the Alert Level to 2 (on a scale of 1-4).
Source: Pusat Vulkanologi dan Mitigasi Bencana Geologi (PVMBG, also known as CVGHM)
CVGHM reported that during 1 April-5 May soil temperatures around Papandayan's crater fluctuated but increased overall. During 1-5 May seismicity increased, prompting CVGHM to raise the Alert level to 3 (on a scale of 1-4) on 5 May. Tourists and residents were reminded not to venture within 2 km of the active crater.
Source: Pusat Vulkanologi dan Mitigasi Bencana Geologi (PVMBG, also known as CVGHM)
CVGHM lowered the Alert Level for Papandayan from 3 to 2 (on a scale of 1-4) on 31 January. No eruption details or reasons for the change were given in the report.
Source: Pusat Vulkanologi dan Mitigasi Bencana Geologi (PVMBG, also known as CVGHM)
On 26 August CVGHM reported that Papandayan showed minor to no changes in recent seismicity, deformation, geochemistry, and visual observations; therefore the Alert Level remained at 3 (on a scale of 1-4). Seismicity remained high, but stable, and was dominated by shallow volcanic earthquakes. Deformation measurements showed no change, and water temperatures in multiple fumarolic areas and lakes remained relatively unchanged. Sulfur dioxide gas emissions decreased from 8 tons per day on 12 August to 6 tons per day on 23 August. Carbon dioxide in the soil at a 1 m depth in multiple areas did not increase. Visitors and residents were advised not to venture within 2 km of the active crater.
Source: Pusat Vulkanologi dan Mitigasi Bencana Geologi (PVMBG, also known as CVGHM)
On 13 August CVGHM reported that based on seismicity, deformation, geochemistry, and visual observations, the Alert Level for Papandayan was raised to 3 (on a scale of 1-4). During 1 June-12 August sulfur plumes rose 20-75 m above the vents. During the same period, seismicity increased with several hundreds of earthquakes detected per month. Temperature measurements in the Manuk thermal area indicated a relative increase from 29 June to 12 August and deformation measurements indicated inflation from 4 July to 10 August. Visitors and residents were not to venture within 2 km of the active crater.
Source: Pusat Vulkanologi dan Mitigasi Bencana Geologi (PVMBG, also known as CVGHM)
CVGHM reported that the seismic network recorded one volcanic tremor signal from Papandayan on 15 April. On 16 April, measurements of summit fumaroles revealed an increase in temperature and changes in water chemistry since 7 April. White plumes continued to rise to an altitude of 2.7 km (8,900 ft) a.s.l. and did not change. CVGHM increased the Alert Level to 2 (on a scale of 1-4) and reminded visitors and residents not to venture within 1 km of the active crater.
Source: Pusat Vulkanologi dan Mitigasi Bencana Geologi (PVMBG, also known as CVGHM)
On 7 January, CVGHM lowered the Alert Level at Papandayan from 2 to 1 (on a scale of 1-4) due to a decrease in activity over approximately four months. Seismic events decreased in number after 2 August 2007, and earthquake tremor was not recorded since 14 November 2007. Data from deformation-monitoring instruments indicated deflation. White fumarolic plumes rose to an altitude of 2.9 km (9,500 ft) a.s.l.
Source: Pusat Vulkanologi dan Mitigasi Bencana Geologi (PVMBG, also known as CVGHM)
On 2 August, CVGHM raised the Alert Level at Papandayan from 1 to 2 (on a scale of 1-4) due to increased activity at the volcano. During 15 July-1 August, the number of volcanic earthquakes increased. By 31 July, the temperatures of fumaroles had increased 10 degrees C above normal levels in Mas crater. Temperatures were 3.5 degrees C above normal levels in Balagadama crater since 26 June. On 1 August, a diffuse white plume rose to an altitude of 2.7 km (8,900 ft) a.s.l. Associated with the increase in Alert Level, villagers and tourists were not permitted within a 1 km radius of the active craters.
Source: Pusat Vulkanologi dan Mitigasi Bencana Geologi (PVMBG, also known as CVGHM)
On 16 June, DVGHM raised the Alert Level at Papandayan from 1 to 2 (on a scale of 1-4) due to increased activity at the volcano. Beginning in early June 2005 the number of volcanic earthquakes increased in comparison to the previous months and the temperatures of fumaroles increased 3-9 degrees C above normal levels. People were not permitted to visit Mas and Baru craters.
Source: Pusat Vulkanologi dan Mitigasi Bencana Geologi (PVMBG, also known as CVGHM)
DVGHM reported that seismic and volcanic activity were at heightened levels on 17 July at Papandayan. The number of volcanic earthquakes increased on 13 July from 1-3 per day to 7-9, then further increased to 57 earthquakes on 16 July. The temperature at Baru crater I increased from 84 to 88.5 °C, and the temperature of Baru crater II rose from 89 to 102 °C. The Alert Level was raised from 1 to 2 (on a scale of 1-4) and visits to the crater were prohibited.
Source: Pusat Vulkanologi dan Mitigasi Bencana Geologi (PVMBG, also known as CVGHM)
On 13 January VSI decreased the Alert Level at Papandayan from 3 to 2 (on a scale of 1-4). Seismicity decreased during 13-19 January in comparison to the previous week, with ash emissions rising 25-100 m above the craters. Seismicity slightly increased during 20-26 January.
Source: Pusat Vulkanologi dan Mitigasi Bencana Geologi (PVMBG, also known as CVGHM)
During 9-22 December, low-level ash plumes were continuously emitted from Papandayan's Baru crater. On 12 December at 1758 an explosion occurred, causing stepped landslides on the wall of Nangkak crater. Small lahars traveled down Cibeureum Gede and Ciparugpug rivers on 13 December at 1600 and on 14 December at 1700. On 21 December at 1154 stepped landslides occurred again. Papandayan remained at Alert Level 3 (on a scale of 1-4).
Source: Pusat Vulkanologi dan Mitigasi Bencana Geologi (PVMBG, also known as CVGHM)
During 2-8 December, ash plumes continually emitted from Papandayan's Baru crater rose 150-400 m above the rim and drifted NE. Explosions occurred on 4 December at 0700 and on 8 December at 1758. The number of shallow volcanic earthquakes decreased during the report week, while deep volcanic and tectonic earthquakes increased in comparison to the previous week. Papandayan remained at Alert Level 3 (on a scale of 1-4).
Source: Pusat Vulkanologi dan Mitigasi Bencana Geologi (PVMBG, also known as CVGHM)
During 22-25 November at Papandayan small-scale continuous ash-and-gas explosions occurred, sending plumes to 300-600 m above the volcano. Tremor, tectonic earthquakes, and shallow and deep-volcanic earthquakes were recorded. An eruption on the 20th produced a NE-directed blast that sent material as far as 2 km away from the crater, burning the crater-facing sides of trees as far as 400 m away. The eruption covered the area around the volcano in 4-8 cm of ash. Papandayan remained at Alert Level 3 (on a scale of 1-4), with a 4-km-wide exclusion zone.
Source: Pusat Vulkanologi dan Mitigasi Bencana Geologi (PVMBG, also known as CVGHM)
An eruption began at Papandayan on 11 November that led to the evacuation of thousands of residents near the volcano. Increased seismicity was first recorded in early October 2002 when deep volcanic earthquakes occurred. By mid-October, shallow volcanic earthquakes were recorded, which were indicative of earthquake migration towards the surface. These earthquakes continued until the day of the eruption. On 11 November felt earthquakes and tremor were recorded and at 1530 there was a phreatic eruption at Kawah Baru Crater. At 1650 landslides from the W wall of the old crater complex traveled to the river and became lahars. By the 14th the eruption had progressed into a phreatomagmatic or magmatic phase, and 17 eruptions had produced thick gray ash clouds 500-1,000 m above the volcano. Many people who did not live in the most dangerous areas were allowed to return to their homes on the 14th. A relatively large eruption on the 15th at 0630 generated an ash cloud that reached 5 km above the summit. At this point Papandayan was at Alert Level 4 (on a scale of 1-4). During 16-18 November, volcanism was dominated by ash emissions that rose to 700 m and seismicity was dominated by continuous emission and explosion earthquakes. On the 18th at 1200 the Alert Level at Papandayan was reduced to 3.
Sources: The Jakarta Post; Pusat Vulkanologi dan Mitigasi Bencana Geologi (PVMBG, also known as CVGHM); Reuters
News agencies reported that an eruption began at Papandayan on 11 November. According to a police officer on duty in a nearby town, ash and lava emitted from one of the volcano's craters began flowing into the nearby Cibeureum River at 1600. Evacuations from towns near the volcano involved 1,000-2,000 residents. The Darwin VAAC reported that a small, low-level plume may have been visible on satellite imagery.
Sources: Darwin Volcanic Ash Advisory Centre (VAAC); Agence France-Presse (AFP); Associated Press
Reports are organized chronologically and indexed below by Month/Year (Publication Volume:Number), and include a one-line summary. Click on the index link or scroll down to read the reports.
Minor phreatic explosions eject mud and gas on 23 June
The normal seismic activity of about ten events per day increased significantly after 20 June. Deep and shallow seismic events with large amplitudes were recorded during the last week of June and first few days of July. The increase also included events with low amplitude and long duration corresponding to gas emission from Emas Crater. Small phreatic explosions ejected gas and mud from fumarolic vents on 23 June, lofting material up to 5 m above the crater. A white plume under moderate pressure reached heights of 10-100 m in the first week of July. After 20 June there was an increased amount of A-type seismicity, but B-type, tectonic, and emission earthquakes changed little or decreased (table 1). Tremors and felt shocks began to be recorded at this time.
Table 1. Daily seismic events at Papandayan in late June and early July 1998. Data courtesy of VSI.
| Date | Volcanic A | Volcanic B | Tectonic | Emission | Tremor | Felt Shock |
| 22 Jun-29 Jun 1998 | 26 | 80 | 36 | 162 | -- | -- |
| 30 Jun-05 Jul 1998 | 83 | 39 | 39 | 15 | 11 | 1 |
The Volcanological Survey of Indonesia (VSI) installed four telemetric seismographs and eight temporary data-loggers around Papandayan. On 3 July they installed an infrasonic microphone on the crater to monitor the eruption.
Information Contacts: Volcanological Survey of Indonesia, Jalan Diponegoro No.57, Bandung 40122, Indonesia (URL: http://www.vsi.esdm.go.id/).
Large explosive eruption with landslide and lahars begins 11 November 2002
On 11 November 2002 a substantial eruption began at Papandayan. The last reported activity here, during June 1998, consisted of increased seismicity and minor phreatic explosions that ejected mud and gas (BGVN 23:07). The volcano lies ~50 km SE of Bandung.
The Volcanological Survey of Indonesia (VSI) reported that the seismograph recorded a deep volcanic earthquake in early October 2002. During mid-October, hypocenters of shallow volcanic earthquakes were migrating toward the surface. Volcanic earthquakes continued until the eruption.
One or more earthquakes at 0452 and 0454 on 11 November were felt with a Modified Mercalli intensity of II. The shaking is thought to have triggered instability at Papandayan. Associated tremor signals during 1200-1506 had ~6 mm amplitudes (peak-to-peak).
At 1530 on 11 November a phreatic eruption vented from the 1942 crater, Kawah Baru. An hour and 20 minutes later, a landslide began. The landslide, which occurred at the W wall of the old crater complex, advanced into the Cibeureum Gede river where it became a lahar and flood.
Figures 1, 2, and 3 show some of the near-source effects and processes seen two days after the 11 November eruption. The Cibeureum river is a tributary of the major, NNE-flowing Cimanuk river, which empties on Java's N coast. The lahar and flood destroyed eight houses, two bridges, and rice fields. News and web articles also mentioned some evacuations, damage to tea farms, and the reduced water-storage capacity of some impacted reservoirs. There were no reported deaths.
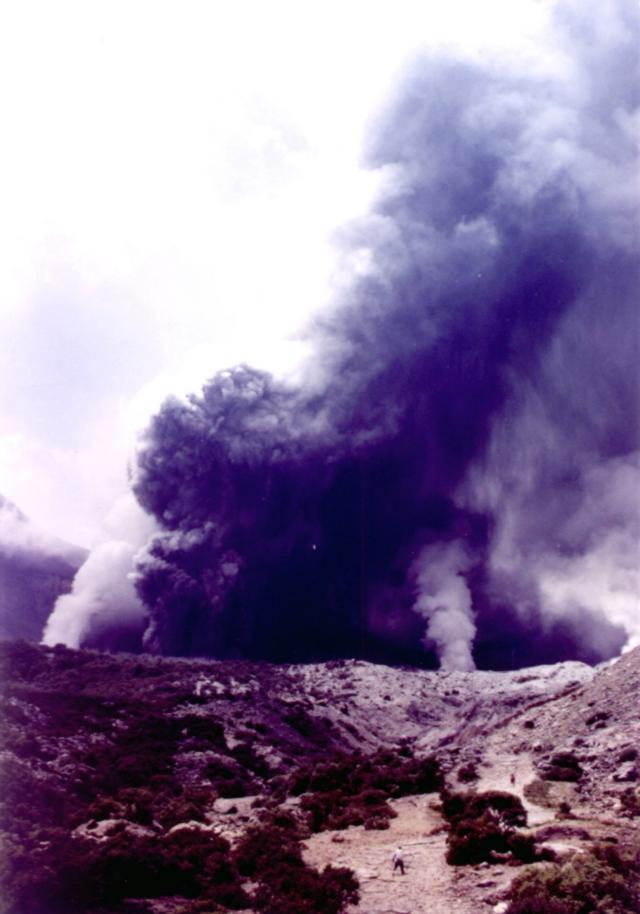 |
Figure 1. A photo showing Papandayan's phreatomagmatic eruption at Kawah Baru on 13 November 2002. For scale, note several people in open areas in the center foreground and beyond. Photo taken by Mas Atje Purbawinata (VSI). |
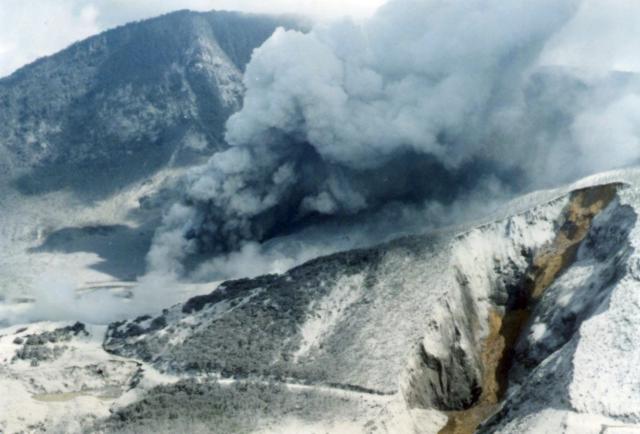 |
Figure 2. On 11 November 2002, Papandayan's cone Gunung Nangklak underwent slope failure at the old crater complex's W wall, leaving behind a fresh landslide scarp (right). The large cloud in the background consists of a modest background-level ash emission from Kawah Baru. Photograph taken on 13 November 2002 by R. D. Hadisantono (VSI). |
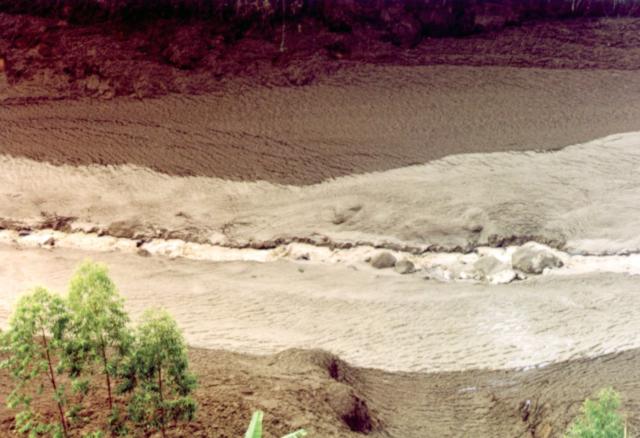 |
Figure 3. Papandayan's November eruption and landslide resulted in a lahar and flood on the Cibeureum Gede river. This is a view looking across a portion of that river as seen several days after the 11 November 2002 lahar and flood started. Downstream is towards the left. This photo taken on 13 November 2002 by Mas Atje Purbawinata (VSI). |
The eruption progressed into a phreatomagmatic (or magmatic) eruption until 14 November (figure 4). During this interval there were seven eruptive vents inside Kawah Baru; four of these discharged only sporadic magmatic eruptions, while three produced continuous ash eruptions. On the 14th, a total of 17 magmatic eruptions occurred between 0017 and 1150. The eruptions produced thick gray ash that reached 500-1,000 m above the vent.
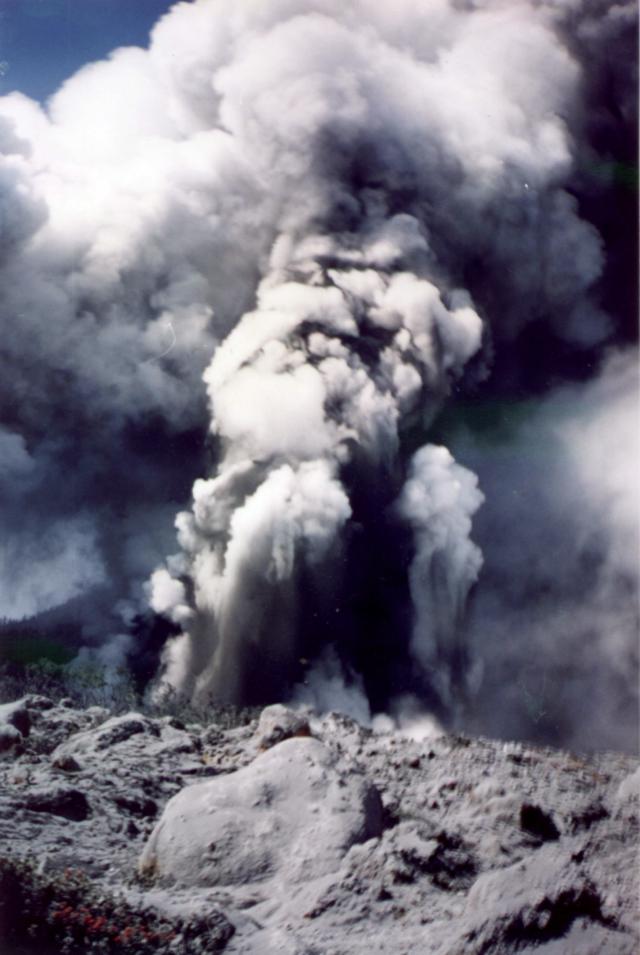 |
Figure 4. Papandayan discharges one of its many 14 November 2002 eruptions. Courtesy VSI. |
On 15 November at 0630 a larger eruption produced thick dark ash that reached 5.0 km above the summit. The Alert Level was raised to 4 (on a scale of 1-4).
On 16 November during 0600-1800 a thick white ash plume rose 300 m and drifted W. The seismograph recorded signals interpreted as intervals of continuous explosion, and continuous emission. The seismicity of that interval was also characterized by earthquakes (six volcanic, and one tectonic) and continuous tremor.
VSI reported that during 1800-0600 on 17-18 November, volcanic activity at Papandayan was dominated by ash emissions, while medium-pressure ash explosions occurred continuously. A thin white ash plume rose ~200-700 m above the crater and drifted W. The seismograph recorded explosion and tectonic earthquakes, along with continuous tremor and 2 volcanic earthquakes. Seismic signals also disclosed continuous emissions. The Alert Level was reduced to 3 at 1200 on 18 November.
On 19 November, a thick white ash plume of weak to medium pressure rose 200-500 m above the crater and drifted W. The seismograph recorded 11 shallow volcanic and 3 tectonic earthquakes, along with continuous tremor.
On 20 November a thick white ash plume reached 100-1,500 m above the crater and drifted W. Heavy rain occurred at 0502. An eruption from Nangklak crater produced a `dark-gray ash plume that reached 1.5 km above the crater and drifted NE, then N and NW. Ashfall reached a thickness up to 2 cm within a 2-km radius, directed towards the NW.
Earthquakes recorded on 20 November included 17 shallow volcanic, 1 deep volcanic, 2 tectonic, and 1 low frequency. Continuous tremor and continuous emissions of medium intensity also occurred.
A visit to the crater the next day confirmed that energetic eruptions had taken place on 20 November (figures 5, 6, and 7). Scientists found that a directed lateral blast had traveled NE as far as 2 km, stripping all trees growing along the inside of the horseshoe-shaped crater. Within this crater, the blast left blocks and smaller fragments of altered rocks and a 4-8 cm thick deposit of wet ash. Within a 500 m radius of the crater, the sides of some trees had charred due to contact with passing high-temperature gases from the blast, which had discharged from Nangklak crater (figure 6). Breadcrust bombs with maximum diameters of 50 cm were found around Nangklak crater.
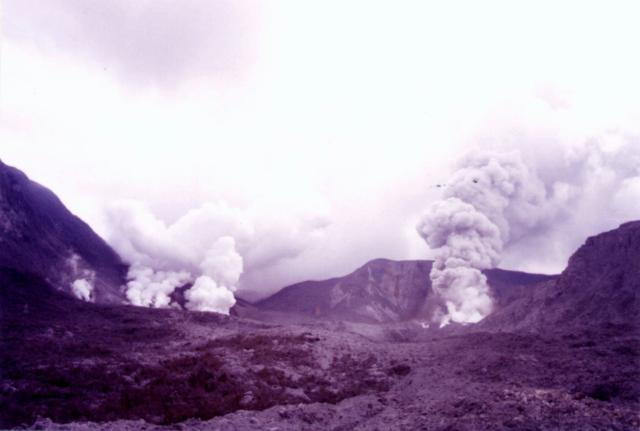 |
Figure 5. This 21 November 2002 photo documents Papandayan's multiple active vents. All the vents resided in craters within the volcano's larger horseshoe-shaped crater. Three white plumes issued from Baru crater (left), and one, more substantial plume came from the then very active Nangklak crater (right). Photographed by Igan S. Sutawidjaja (VSI). |
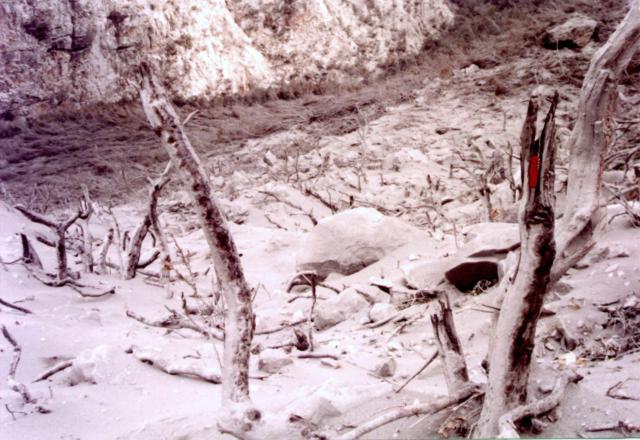 |
Figure 6. This photo was taken a day after Papandayan's 20 November eruption at a spot ~ 300 m from Nangklak crater. The area appears to be covered by an unspecified thickness of tephra. Widespread damage seen in the photo includes the near absence of smaller vegetation on the present ground surface, and the denuded, scorched, and splintered remnants of the larger vegetation. The charred sides of remaining tree stumps faced towards Nangklak crater. For scale, note the open jack-knife perched in the broken end of the closest tree. Photographed on 21 November 2002 by Igan S. Sutawidjaja (VSI). |
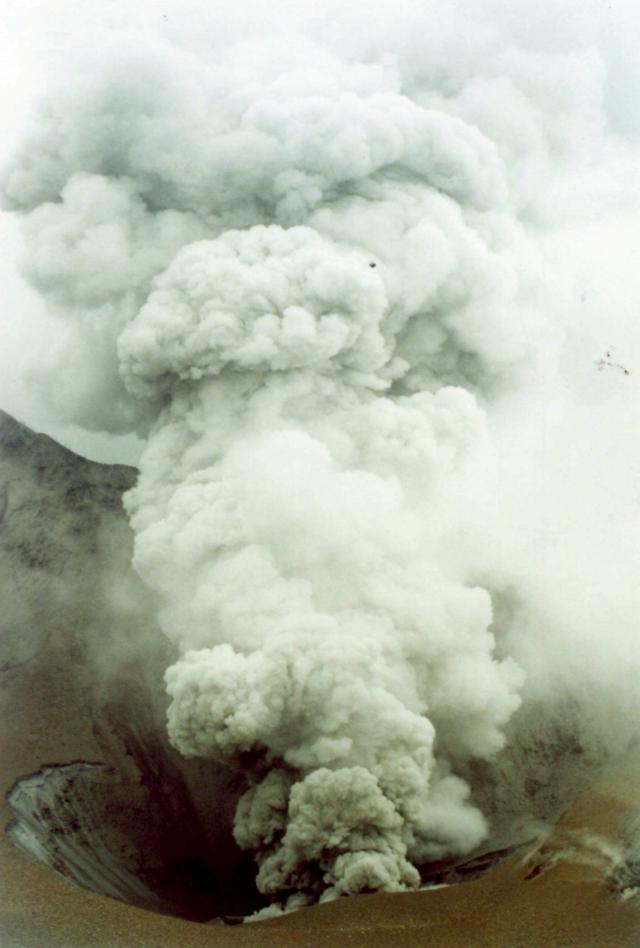 |
Figure 7. At Papandayan, ash explosions at Kawah Nangklak on 21 November 2002. Photographed by Igan S.Sutawidjaja (VSI). |
On 21 November, volcanism was dominated by explosions and ash emissions of medium-high intensity. Crater wall collapse also occurred, mostly at Kawah Baru. Through 0745 there were 98 explosions; they produced white gray ash that rose 200-600 m high and drifted W. The seismograph recorded a total of 10 shallow volcanic and 1 low-frequency earthquake, along with continuous tremor and emission (medium-high intensity). Citizens were asked to stay at least 4 km from the vent.
On 22 November there was a low level of continuous ash-and-gas explosions. A thick white plume with ash rose 300-600 m above Nangklak crater. Seismicity was dominated by explosion earthquakes (maximum amplitude, 23 mm) and also included shallow volcanic, deep volcanic, and tectonic earthquakes. A medium-intensity ash explosion along with lahars occurred along the Cibeureum Gede, and the Ciparugpug rivers.
During 23-25 November activity at Papandayan was dominated by ash explosions reaching more than 600 m above Nangklak crater. Six other craters emitted a white plume up to 200-400 m.
Information Contacts: Volcanological Survey of Indonesia (VSI), Jalan Diponegoro No. 57, Bandung 40122, Indonesia (URL: http://www.vsi.esdm.go.id/).
After the explosions of November 2002, seismicity and eruptions waned
On 11 November 2002, ash eruptions occurred at Papandayan (BGVN 27:11 and figure 8). Subsequently, seismic and eruptive activity waned, although gas emission continued (ending 4 May 2003). Lessening seismicity and volcanism in January 2003 resulted in a reduction of the hazard status from 3 to 2 (on a scale of 1 to 4, where 4 is the highest). Reduction in the activity continued through the beginning of May 2003 at which time the Volcanological Survey of Indonesia (VSI) terminated its weekly reporting on Papandayan.
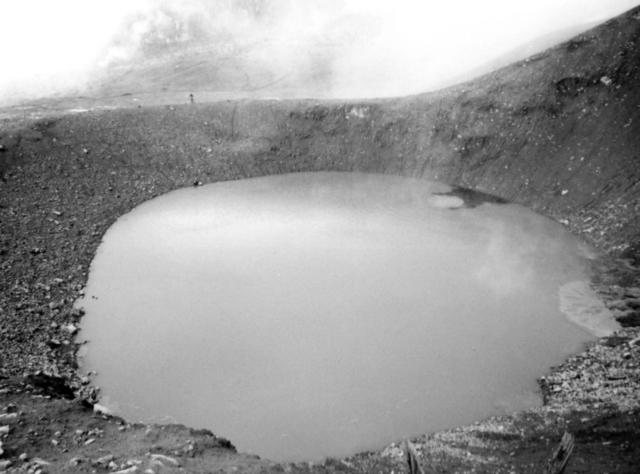 |
Figure 8. Photograph of the new crater at Papandayan formed on 11 November 2002; by 8 December it was no longer active and was filled by water. The crater diameter is ~ 300 m. Courtesy of VSI. |
During December 2002, white-gray ash plume was emitted continually from Baru crater and rose 150-400 m to the NE. [After the week of 16-22 December only gas plumes were emitted (described as "white ash emission").] As the activity level reduced (table 2) the typical height of the plume dropped from 150-400 m during December and early January 2003 to 75-250 m by late-January.
Table 2. Weekly seismic events at Papandayan from 2 December 2002 to 4 May 2003. Courtesy of VSI.
| Date | Deep | Shallow | Tectonic | Avalanches |
| 02 Dec-08 Dec 2002 | 9 | 10 | 17 | -- |
| 09 Dec-15 Dec 2002 | 1 | 25 | -- | -- |
| 16 Dec-22 Dec 2002 | 1 | 20 | 21 | -- |
| 23 Dec-29 Dec 2002 | 3 | 16 | 12 | -- |
| 30 Dec-05 Jan 2003 | 28 | 42 | 29 | -- |
| 06 Jan-12 Jan 2003 | 11 | 21 | 33 | 7 |
| 13 Jan-19 Jan 2003 | 7 | 11 | 16 | 12 |
| 20 Jan-26 Jan 2003 | 14 | 30 | 29 | -- |
| 27 Jan-02 Feb 2003 | 8 | 25 | 30 | -- |
| 03 Feb-09 Feb 2003 | 3 | 18 | 12 | 1 |
| 10 Feb-16 Feb 2003 | -- | 14 | 18 | 2 |
| 17 Feb-23 Feb 2003 | 3 | 24 | 17 | 3 |
| 24 Feb-02 Mar 2003 | 2 | 1 | 3 | -- |
| 03 Mar-09 Mar 2003 | -- | 1 | -- | 7 |
| 10 Mar-16 Mar 2003 | 1 | 10 | 16 | -- |
| 17 Mar-23 Mar 2003 | 2 | 8 | 24 | -- |
| 24 Mar-30 Mar 2003 | 2 | 10 | 14 | -- |
| 31 Mar-06 Apr 2003 | 3 | 15 | 33 | -- |
| 07 Apr-13 Apr 2003 | 1 | 8 | 9 | -- |
| 14 Apr-20 Apr 2003 | 2 | 12 | 16 | -- |
| 21 Apr-27 Apr 2003 | 8 | 5 | 23 | -- |
| 28 Apr-04 May 2003 | 2 | 7 | 3 | -- |
Two explosions occurred at 0700 on 4 December and at 1758 on 8 December 2002, and another occurred at 1758 on 12 December. During the week of 2-8 December, shallow volcanic earthquakes decreased, while deep volcanic and tectonic earthquakes increased. During the subsequent week, shallow earthquakes increased, while deep earthquakes decreased (table 2). Insignificant lahars occurred at Cibeureum Gede and Ciparugpug rivers at 1600 on 13 December and at 1700 on 14 December. The movement of stepped landslides on the wall of Nangklak crater were recorded on the seismograph throughout most of December; the last landslide occurred at 1154 on 21 December. The hazard level was reduced to 2 by the week of 13-19 January 2003.
Information Contacts: Dali Ahmad, Volcanological Survey of Indonesia (VSI), Jalan Diponegoro No. 57, Bandung 40122, Indonesia (URL: http://www.vsi.esdm.go.id/).
Increased seismicity and elevated crater temperatures in July
Volcanic activity increased at Papandayan beginning 17 July 2004. On 13 July, volcanic earthquakes increased from a range of between 1-3 events per day to 7-9 events per day and increased to 57 events on 16 July (table 3). The temperature on Baru Crater I increased from 84 to 88.5°C, and at Baru Crater II the temperature increased from 89 to 102°C. A visible thin white plume rose 25-100 m. This activity prompted a rise in the hazard status to Alert Level II. During the following week volcanic and local tectonic earthquakes increased, but there were no emissions. A white thin plume rose to 50-150 m above the summit. After 26 July seismicity declined and remained low through at least mid-August. The thin white plume was observed throughout this time, but its maximum height decreased each week until it was only 25-75 m above the summit during 9-15 August.
Table 3. Seismicity at Papandayan, 5 July-15 August 2004. Courtesy of DVGHM.
| Date | Volcanic A | Volcanic B | Local Tectonic | Emission |
| 05 Jul-11 Jul 2004 | -- | 21 | -- | -- |
| 12 Jul-18 Jul 2004 | 20 | 101 | 4 | 2 |
| 19 Jul-25 Jul 2004 | 65 | 129 | 10 | -- |
| 26 Jul-01 Aug 2004 | 8 | 44 | 8 | -- |
| 02 Aug-08 Aug 2004 | 4 | 32 | 3 | -- |
| 09 Aug-15 Aug 2004 | 1 | 46 | 4 | -- |
Information Contacts: Dali Ahmad, Hetty Triastuty, Nia Haerani, Suswati, and Sri Kisyati, Directorate of Volcanology and Geological Hazard Mitigation, Jalan Diponegoro No. 57, Bandung 40122, Indonesia, URL: http://www.vsi.esdm.go.id/).
Minor seismic activity and fumarolic plumes through 16 April 2008
Our last report on Papandayan (BGVN 29:08) described a modest surge in seismicity that began in July 2004, which rose for a short time but began to subside in mid-August 2004. We received no subsequent reports until June 2005. This report discusses non-eruptive restlessness from early June 2005 through the middle of April 2008, including wide fumarolic temperature variations, seismicity, and occasional minor steam plumes.
Beginning in early June 2005, the number of volcanic earthquakes increased in comparison to the previous months, and fumarole temperatures increased 3-9°C above normal levels. People were not permitted to visit Mas and Baru craters. On 16 June 2005, the Center of Volcanology and Geological Hazard Mitigation (CVGHM) in Indonesia raised the Alert Level at Papandayan from 1 to 2 (on a scale of 1-4) due to increased activity at the volcano. The Alert Level remained at 2 at least through 13 December 2005.
No subsequent reports were received until July 2007. On 15 July there was one volcanic earthquake; the next day 2-10 volcanic earthquakes were recorded. By 31 July, fumarole temperatures had increased 10°C above normal levels in Mas crater. On 1 August up to 53 volcanic earthquakes were recorded and a diffuse white plume rose to an altitude of 2.7 km. Residents and tourists were not permitted within a 1 km radius of the active craters.
On 2 August 2007, CVGHM raised the Alert Level from 1 to 2 (on a scale of 1-4) due to increased seismic activity at the volcano. Seismic events decreased in number after 2 August; earthquake tremors were not recorded after 14 November 2007, and on 7 January 2008, CVGHM lowered the Alert Level at Papandayan from 2 to 1 due to the decrease in activity during the previous four months. Data from deformation-monitoring instruments indicated deflation. White fumarolic plumes rose to an altitude of 2.9 km.
No subsequent reports were received until April 2008. According to the CVGHM, on 15 April the seismic network recorded one tremor signal. On 16 April, measurements of summit fumaroles revealed that the temperature had increased and water chemistry had changed since 7 April. White plumes continued to rise to an altitude of 2.7 km. CVGHM again increased the Alert Level to 2 and warned people not to venture within 1 km of the active crater.
Information Contacts: Center of Volcanology and Geological Hazard Mitigation (CVGHM), Jalan Diponegoro No. 57, Bandung 40122, Indonesia (URL: http://vsi.esdm.go.id/).
Seismic increases in July and August 2011, with no eruption
Minor seismic activity and fumarolic plumes at Papandayan occurred in July 2005, July and August 2007, and April 2008 (BGVN 33:06; figure 9). This report covers a seismic swarm reported in July and August 2011. According to the Center of Volcanology and Geological Hazard Mitigation (CVGHM), Papandayan is monitored by eight seismic stations (three permanent and five temporary).
|
Figure 9. A map showing the location of Papandayan relative to many other Indonesian volcanoes of Holocene age. Courtesy of USGS. |
Since April 2008, reports on seismicity were sparse. Then, in July 2011, seismicity increased; several hundred earthquakes were detected per month, and the occurrence of deep earthquakes nearly tripled. (figure 10, table 4).
|
Figure 10. Papandayan crater as seen from the trail to Pondok Salada in August 2011. Courtesy of Daniel Quinn. |
Table 4. The occurrence of various types of seismicity at Papandayan during July-24 August 2011. '--' indicates data not reported. Data from CVGHM.
| Date | Deep volcanic | Shallow volcanic | Low-frequency | Distant Tectonic | Local Tectonic |
| Jun 2011 | 31 | 339 | 9 | 112 | 37 |
| Jul 2011 | 91 | 431 | 9 | 165 | 97 |
| 1-24 Aug 2011 | 94 | 501 | -- | 100 | 34 |
According to CVGHM, sulfur-dioxide (SO2) plumes rose 20-75 m above the vents between 1 June and at least 12 August 2011. Between 12-23 August, SO2 emissions ranged from 3-8 tons per day. Carbon dioxide (CO2) levels measured in the soil at 1 m depth in multiple areas did not increase. The temperature in the Manuk thermal area increased during 29 June to 12 August, and deformation measurements indicated inflation from 4 July to 10 August. On 13 August 2011, CVGHM announced that the Alert Level for Papandayan had been increased to 3 (on a scale of 1-4) based on seismicity, deformation, geochemistry, and visual observations. Visitors and residents were warned not to venture within 2 km of the active crater. The increase spurred multiple news reports.
On 14 August 2011, the Jakarta Globe reported that Sutopo Purwo Nugroho, a spokesman for the National Disaster Mitigation Agency, had stated that gas was emanating from three craters - Walirang, Manuk and Balagadama. The same report quoted Surono, who heads CVGHM, as saying: "For now, we are not too worried about a major eruption. We are more concerned by the toxic gas."
According to other news reports, by mid-August 2011 local officials had completed evacuation planning, especially for three vulnerable villages within 7 km of the active crater. The report also mentioned that as of 19 August, residents near the volcano were continuing their normal activities, but that tourist visitation had dropped sharply at the popular destination.
On 26 August 2011, CVGHM reported that Papandayan's activity had not increased during the previous few days. Seismicity remained high, but stable, and was dominated by shallow volcanic earthquakes. Deformation measurements (such as leveling and Electronic Distance Measurement - EDM) showed no change, and water temperatures in multiple fumarolic areas and lakes remained relatively constant.
On 31 January 2012, CVGHM lowered the Alert Level from 3 to 2, without indication of eruption details or reasons for the change. As of 30 June 2012, the Alert Level remained at 2.
Crater emission videos. Video clips of crater emissions taken at Papandayan in October 2009, and at an uncertain other date can be found on YouTube:
Pwarr3n, 2009, YouTube (URL: http://www.youtube.com/watch?feature=endscreen&NR=1&v=H_GIwMdkWT8).
Sweetmarias, undated, posted 13 August 2010, YouTube (URL: http://www.youtube.com/watch?v=tSFoybapqe0).
Information Contacts: Center of Volcanology and Geological Hazard Mitigation (CVGHM), Jalan Diponegoro 57, Bandung 40122, Indonesia (URL: http://www.vsi.esdm.go.id/); Jakarta Globe (URL: http://www.thejakartaglobe.com).
|
|
||||||||||||||||||||||||||
There is data available for 4 confirmed eruptive periods.
2002 Nov 11 - 2002 Dec 19 ± 3 days Confirmed Eruption (Explosive / Effusive) VEI: 2
| Episode 1 | Eruption (Explosive / Effusive) | Kawah Baru, Kawah Nangklak | |||||||||||||||||||||||||||||||||||||||||||||||||||||||||||||||||||||||||
|---|---|---|---|---|---|---|---|---|---|---|---|---|---|---|---|---|---|---|---|---|---|---|---|---|---|---|---|---|---|---|---|---|---|---|---|---|---|---|---|---|---|---|---|---|---|---|---|---|---|---|---|---|---|---|---|---|---|---|---|---|---|---|---|---|---|---|---|---|---|---|---|---|---|---|
| 2002 Nov 11 - 2002 Dec 19 ± 3 days | Evidence from Observations: Reported | |||||||||||||||||||||||||||||||||||||||||||||||||||||||||||||||||||||||||
|
List of 13 Events for Episode 1 at Kawah Baru, Kawah Nangklak
|
||||||||||||||||||||||||||||||||||||||||||||||||||||||||||||||||||||||||||
1942 Aug 15 - 1942 Aug 16 Confirmed Eruption (Explosive / Effusive) VEI: 1 (?)
| Episode 1 | Eruption (Explosive / Effusive) | |||||||||||||||||||
|---|---|---|---|---|---|---|---|---|---|---|---|---|---|---|---|---|---|---|---|
| 1942 Aug 15 - 1942 Aug 16 | Evidence from Observations: Reported | ||||||||||||||||||
|
List of 2 Events for Episode 1
|
|||||||||||||||||||
1923 Mar 11 - 1925 Mar 9 Confirmed Eruption (Explosive / Effusive) VEI: 1
| Episode 1 | Eruption (Explosive / Effusive) | Kawah Baru, Kawah Nangklak | ||||||||||||||||||||||||||||||||||||||
|---|---|---|---|---|---|---|---|---|---|---|---|---|---|---|---|---|---|---|---|---|---|---|---|---|---|---|---|---|---|---|---|---|---|---|---|---|---|---|---|
| 1923 Mar 11 - 1925 Mar 9 | Evidence from Observations: Reported | ||||||||||||||||||||||||||||||||||||||
|
List of 6 Events for Episode 1 at Kawah Baru, Kawah Nangklak
|
|||||||||||||||||||||||||||||||||||||||
1772 Aug 12 - 1772 Aug 12 Confirmed Eruption (Explosive / Effusive) VEI: 3
| Episode 1 | Eruption (Explosive / Effusive) | |||||||||||||||||||||||||||||||||||||||||||||||||
|---|---|---|---|---|---|---|---|---|---|---|---|---|---|---|---|---|---|---|---|---|---|---|---|---|---|---|---|---|---|---|---|---|---|---|---|---|---|---|---|---|---|---|---|---|---|---|---|---|---|
| 1772 Aug 12 - 1772 Aug 12 | Evidence from Observations: Reported | ||||||||||||||||||||||||||||||||||||||||||||||||
|
List of 8 Events for Episode 1
|
|||||||||||||||||||||||||||||||||||||||||||||||||
This compilation of synonyms and subsidiary features may not be comprehensive. Features are organized into four major categories: Cones, Craters, Domes, and Thermal Features. Synonyms of features appear indented below the primary name. In some cases additional feature type, elevation, or location details are provided.
Synonyms |
||||
| Papandajan | ||||
Cones |
||||
| Feature Name | Feature Type | Elevation | Latitude | Longitude |
| Jaya | Stratovolcano | |||
| Puntang | Stratovolcano | |||
Craters |
||||
| Feature Name | Feature Type | Elevation | Latitude | Longitude |
| Alunalun | Crater | 2665 m | ||
| Baru, Kawah | Crater | 2200 m | ||
| Bungbrung | Crater | 2510 m | ||
| Nangklak, Kawah | Crater | 2240 m | ||
| Parugpug | Crater | 2640 m | ||
Thermal |
||||
| Feature Name | Feature Type | Elevation | Latitude | Longitude |
| Manuk, Kawah | Thermal | 2155 m | ||
| Mas, Kawah | Thermal | 2175 m | ||
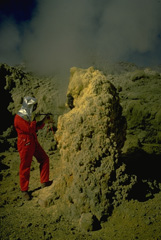 Volcanologist Maurice Krafft, wearing heat-resistant headgear, measures the temperature of a sulfur-encrusted fumarole in the Kawah Mas ("Golden Crater") thermal area on Papandayan volcano.
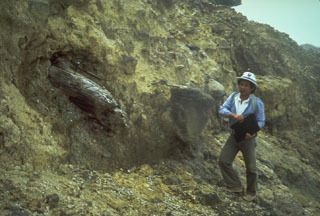 A scientist from the Volcanological Survey of Indonesia examines a debris avalanche deposit at Papandayan volcano that predates the historic 1772 debris avalanche. The deposit contains large angular clasts in a hydrothermally altered matrix and the large log to the left.
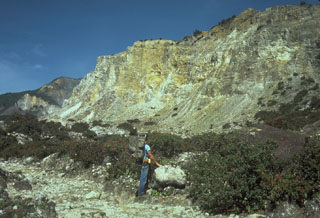 The hydrothermally altered rocks of Welirang Ridge in the background is the NE scarp resulting from the partial flank collapse of Papandayan volcano in 1772. The extensive alteration of rocks within the volcano contributed to the collapse that produced a debris avalanche that traveled 11 km from the volcano, destroying 40 villages.
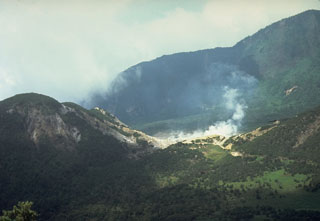 A plume rises above the Kawah Mas thermal area in the crater of Papandayan volcano. This view from the NW shows Gunung Warirang at the left and the eastern wall of the Papandayan crater in the background. The 1772 debris avalanche traveled to the NE down the valley at the left.
 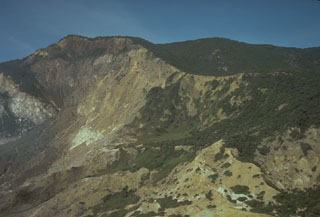 The steep, hydrothermally altered scarp on the left is the headwall of the 1772 collapse of Papandayan, which produced a debris avalanche that traveled at high velocities up to 11 km from the volcano, destroying 40 villages and causing nearly 3,000 fatalities.
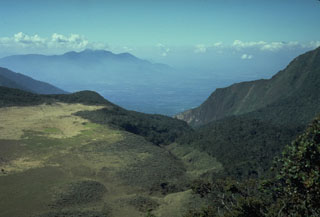 The flat area to the left is Alun-Alun, the uppermost of four large craters on Papandayan volcano. The v-shaped valley in the center of the photo extending to the NE is the breach left by collapse of Papandayan volcano in 1772. The volcano in the distance on the left horizon is Gunung Guntur, another historically active volcano bordering the Garut Plain.
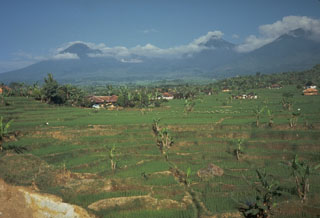 The collapse of the summit of Papandayan volcano on 8 August 1772 produced a debris avalanche that swept over lowland areas to the east, destroying 40 villages and killing 2,957 people. The farmlands in the foreground of this photo are underlain by the deposits from this avalanche, which traveled 11 km from the volcano. The collapse event was accompanied by a 5-minute-long explosive eruption.
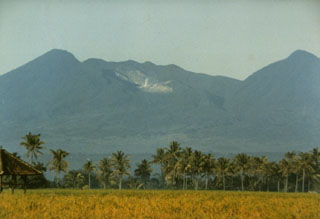 Papandayan volcano has four large summit craters. The light-colored area in this view from the east is Kawah Mas ("Golden Crater"), an active hydrothermal area that was the site of two small phreatic eruptions in the first half of the twentieth century. In 1772 the volcano underwent flank collapsed that produced a debris avalanche that swept over lowland areas to the east, destroying 40 villages.
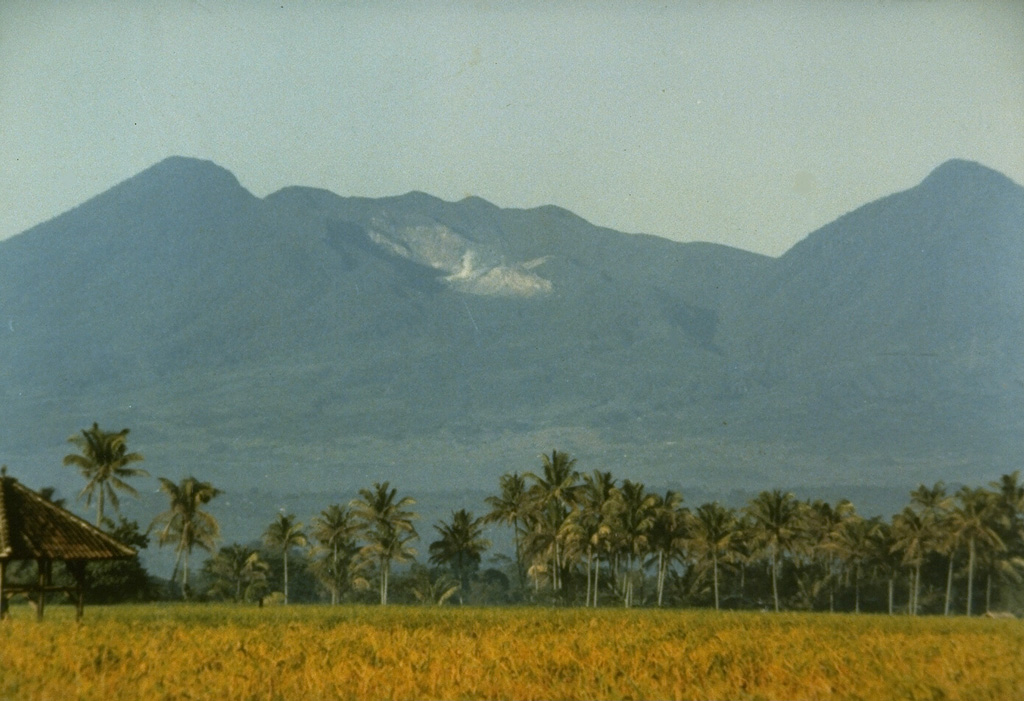
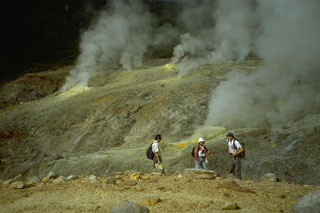 The active Kawah Mas crater contains numerous high-temperature fumarolic vents, many surrounded by deposits of sulfur. The fumarole temperatures are monitored by scientists from the Volcanological Survey of Indonesia. Phreatic explosions have occurred during historical time from vents near Kawah Mas.
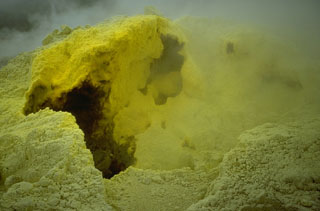 Volcanic gas emissions from a sulfur-encrusted fumarole at Kawah Mas ("Golden Crater") at Papandayan. The crater contains a large number of high-temperature fumaroles with temperatures of several hundred degrees Celsius.
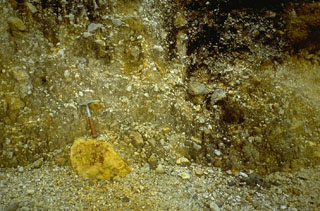 The debris-avalanche deposit produced by the 1772 collapse of Papandayan volcano contains abundant angular clasts including the sulfur-rich clast beneath the rock hammer, in a hydrothermally altered, clay-rich matrix. Extensive thermal alteration of rocks within the volcano had occurred prior to the collapse.
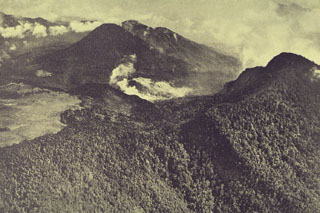 An aerial view from the south shows the complex summit of Papandayan volcano. The lighter-colored, flat area at the left is Alun-Alun, the uppermost of four summit craters. A gas plume rises from a hydrothermal area within the area remaining after the collapse of the summit in 1772. The forested peak at the right is the eastern summit. The two peaks at the upper left are Gunung Puntang and Gunung Jaja.
The following 1 samples associated with this volcano can be found in the Smithsonian's NMNH Department of Mineral Sciences collections, and may be availble for research (contact the Rock and Ore Collections Manager). Catalog number links will open a window with more information.
| Catalog Number | Sample Description | Lava Source | Collection Date |
|---|---|---|---|
| NMNH 101602 | Unidentified | -- | -- |
| Copernicus Browser | The Copernicus Browser replaced the Sentinel Hub Playground browser in 2023, to provide access to Earth observation archives from the Copernicus Data Space Ecosystem, the main distribution platform for data from the EU Copernicus missions. |
| MIROVA | Middle InfraRed Observation of Volcanic Activity (MIROVA) is a near real time volcanic hot-spot detection system based on the analysis of MODIS (Moderate Resolution Imaging Spectroradiometer) data. In particular, MIROVA uses the Middle InfraRed Radiation (MIR), measured over target volcanoes, in order to detect, locate and measure the heat radiation sourced from volcanic activity. |
| MODVOLC Thermal Alerts | Using infrared satellite Moderate Resolution Imaging Spectroradiometer (MODIS) data, scientists at the Hawai'i Institute of Geophysics and Planetology, University of Hawai'i, developed an automated system called MODVOLC to map thermal hot-spots in near real time. For each MODIS image, the algorithm automatically scans each 1 km pixel within it to check for high-temperature hot-spots. When one is found the date, time, location, and intensity are recorded. MODIS looks at every square km of the Earth every 48 hours, once during the day and once during the night, and the presence of two MODIS sensors in space allows at least four hot-spot observations every two days. Each day updated global maps are compiled to display the locations of all hot spots detected in the previous 24 hours. There is a drop-down list with volcano names which allow users to 'zoom-in' and examine the distribution of hot-spots at a variety of spatial scales. |
|
WOVOdat
Single Volcano View Temporal Evolution of Unrest Side by Side Volcanoes |
WOVOdat is a database of volcanic unrest; instrumentally and visually recorded changes in seismicity, ground deformation, gas emission, and other parameters from their normal baselines. It is sponsored by the World Organization of Volcano Observatories (WOVO) and presently hosted at the Earth Observatory of Singapore.
GVMID Data on Volcano Monitoring Infrastructure The Global Volcano Monitoring Infrastructure Database GVMID, is aimed at documenting and improving capabilities of volcano monitoring from the ground and space. GVMID should provide a snapshot and baseline view of the techniques and instrumentation that are in place at various volcanoes, which can be use by volcano observatories as reference to setup new monitoring system or improving networks at a specific volcano. These data will allow identification of what monitoring gaps exist, which can be then targeted by remote sensing infrastructure and future instrument deployments. |
| Volcanic Hazard Maps | The IAVCEI Commission on Volcanic Hazards and Risk has a Volcanic Hazard Maps database designed to serve as a resource for hazard mappers (or other interested parties) to explore how common issues in hazard map development have been addressed at different volcanoes, in different countries, for different hazards, and for different intended audiences. In addition to the comprehensive, searchable Volcanic Hazard Maps Database, this website contains information about diversity of volcanic hazard maps, illustrated using examples from the database. This site is for educational purposes related to volcanic hazard maps. Hazard maps found on this website should not be used for emergency purposes. For the most recent, official hazard map for a particular volcano, please seek out the proper institutional authorities on the matter. |
| IRIS seismic stations/networks | Incorporated Research Institutions for Seismology (IRIS) Data Services map showing the location of seismic stations from all available networks (permanent or temporary) within a radius of 0.18° (about 20 km at mid-latitudes) from the given location of Papandayan. Users can customize a variety of filters and options in the left panel. Note that if there are no stations are known the map will default to show the entire world with a "No data matched request" error notice. |
| UNAVCO GPS/GNSS stations | Geodetic Data Services map from UNAVCO showing the location of GPS/GNSS stations from all available networks (permanent or temporary) within a radius of 20 km from the given location of Papandayan. Users can customize the data search based on station or network names, location, and time window. Requires Adobe Flash Player. |
| DECADE Data | The DECADE portal, still in the developmental stage, serves as an example of the proposed interoperability between The Smithsonian Institution's Global Volcanism Program, the Mapping Gas Emissions (MaGa) Database, and the EarthChem Geochemical Portal. The Deep Earth Carbon Degassing (DECADE) initiative seeks to use new and established technologies to determine accurate global fluxes of volcanic CO2 to the atmosphere, but installing CO2 monitoring networks on 20 of the world's 150 most actively degassing volcanoes. The group uses related laboratory-based studies (direct gas sampling and analysis, melt inclusions) to provide new data for direct degassing of deep earth carbon to the atmosphere. |
| Large Eruptions of Papandayan | Information about large Quaternary eruptions (VEI >= 4) is cataloged in the Large Magnitude Explosive Volcanic Eruptions (LaMEVE) database of the Volcano Global Risk Identification and Analysis Project (VOGRIPA). |
| EarthChem | EarthChem develops and maintains databases, software, and services that support the preservation, discovery, access and analysis of geochemical data, and facilitate their integration with the broad array of other available earth science parameters. EarthChem is operated by a joint team of disciplinary scientists, data scientists, data managers and information technology developers who are part of the NSF-funded data facility Integrated Earth Data Applications (IEDA). IEDA is a collaborative effort of EarthChem and the Marine Geoscience Data System (MGDS). |

