The Pusat Vulkanologi dan Mitigasi Bencana Geologi (PVMBG) reported that activity at Sangeang Api increased during 1-22 November. Notably, five tornillo earthquakes were detected and on 18 November there was a significant increase in seismic signals indicating emissions. White, gray, and brown emissions rose as high as 35 m above the crater rim on 20 November, followed by white emissions that rose 15-25 m above the crater rim during 21-22 November. Seismicity intensified further on 22 November, and a new eruption was confirmed by visual observations of emissions that appeared to be rising from a different vent that had been active in 2014. At 0600 the Alert Level was raised to 2 (on a scale of 1-4) and the public was warned to stay 3 km away from the active crater and additionally from an area on the ESE flank than spanned from the crater to the coastline, 6.5 km away. White-and-gray emissions rose 200-300 m above the crater rim on 23 November.
Source: Pusat Vulkanologi dan Mitigasi Bencana Geologi (PVMBG, also known as CVGHM)
Small ash plume on 17 February 2022
Sangeang Api is a complex volcano on the small island of Sangeang in the Lesser Sunda Islands, Indonesia, consisting of two volcanic cones. After a major explosion in May 2014, activity continued until November 2015, with thermal anomalies indicating possible lava dome growth or lava flows (BGVN 39:02 and 41:10). Another eruptive period during July 2017 into June 2020 included occasional weak ash explosions with ash plumes and emissions, hot material discharged from the summit crater, periods of numerous thermal anomalies, summit incandescence, and infrequent Strombolian activity (BGVN 42:09, 43:11, 44:05, 45:02, and 45:08). The volcano is monitored by Pusat Vulkanologi dan Mitigasi Bencana Geologi (PVMBG, or CVGHM), the Darwin Volcanic Ash Advisory Center (VAAC), and by various satellites.
The only documented activity during August 2020-February 2022 was an ash plume on 17 February 2022 reported by the Darwin VAAC that rose to an altitude of 4-4.9 km (~3 km above the summit) and drifted SW and WSW. During August 2020-February 2022, Sentinel-2 satellite images during this time were usually obscured by weather clouds, but no thermal signals or volcanic activity were observed when there were clear views. During May 2021 through February 2022, the MIROVA (Middle InfraRed Observation of Volcanic Activity) volcano hotspot detection system recorded ten scattered hotspots within 5 km of the summit; the cause of the weak anomalies is unknown.
Information Contacts: Pusat Vulkanologi dan Mitigasi Bencana Geologi (PVMBG, also known as Indonesian Center for Volcanology and Geological Hazard Mitigation, CVGHM), Jalan Diponegoro 57, Bandung 40122, Indonesia (URL: http://www.vsi.esdm.go.id/); Darwin Volcanic Ash Advisory Centre (VAAC), Bureau of Meteorology, Northern Territory Regional Office, PO Box 40050, Casuarina, NT 0811, Australia (URL: http://www.bom.gov.au/info/vaac/); MIROVA (Middle InfraRed Observation of Volcanic Activity), a collaborative project between the Universities of Turin and Florence (Italy) supported by the Centre for Volcanic Risk of the Italian Civil Protection Department (URL: http://www.mirovaweb.it/); Sentinel Hub Playground (URL: https://www.sentinel-hub.com/explore/sentinel-playground).
2025: November
2022: February
2020: January
| May
| June
2019: June
| July
| August
| September
| October
| November
| December
2018: May
| October
2017: July
| August
2015: July
| November
2014: May
| June
2013: May
| June
2012: October
| December
2009: June
The Pusat Vulkanologi dan Mitigasi Bencana Geologi (PVMBG) reported that activity at Sangeang Api increased during 1-22 November. Notably, five tornillo earthquakes were detected and on 18 November there was a significant increase in seismic signals indicating emissions. White, gray, and brown emissions rose as high as 35 m above the crater rim on 20 November, followed by white emissions that rose 15-25 m above the crater rim during 21-22 November. Seismicity intensified further on 22 November, and a new eruption was confirmed by visual observations of emissions that appeared to be rising from a different vent that had been active in 2014. At 0600 the Alert Level was raised to 2 (on a scale of 1-4) and the public was warned to stay 3 km away from the active crater and additionally from an area on the ESE flank than spanned from the crater to the coastline, 6.5 km away. White-and-gray emissions rose 200-300 m above the crater rim on 23 November.
Source: Pusat Vulkanologi dan Mitigasi Bencana Geologi (PVMBG, also known as CVGHM)
The Darwin VAAC reported that on 17 February ash plumes from Sangeang Api rose to altitudes of 4-4.9 km (13,000-16,000 ft) a.s.l. and drifted SW and WSW. The Alert Level remained at 2 (on a scale of 1-4).
Sources: Darwin Volcanic Ash Advisory Centre (VAAC); Pusat Vulkanologi dan Mitigasi Bencana Geologi (PVMBG, also known as CVGHM)
The Darwin VAAC reported that on 10 June an ash plume from Sangeang Api rose to an altitude of 3 km (10,000 ft) a.s.l. and drifted NE. The Alert Level remained at 2 (on a scale of 1-4).
Sources: Pusat Vulkanologi dan Mitigasi Bencana Geologi (PVMBG, also known as CVGHM); Darwin Volcanic Ash Advisory Centre (VAAC)
The Darwin VAAC reported that on 10 May a discrete ash emission from Sangeang Api rose to an altitude of 2.1 km (7,000 ft) a.s.l. and drifted E. The Alert Level remained at 2 (on a scale of 1-4).
Sources: Darwin Volcanic Ash Advisory Centre (VAAC); Pusat Vulkanologi dan Mitigasi Bencana Geologi (PVMBG, also known as CVGHM)
The Darwin VAAC reported that on 23 January an ash emission from Sangeang Api rose to an altitude of 3 km (10,000 ft) a.s.l. and drifted NNE. The Alert Level remained at 2 (on a scale of 1-4).
Sources: Darwin Volcanic Ash Advisory Centre (VAAC); Pusat Vulkanologi dan Mitigasi Bencana Geologi (PVMBG, also known as CVGHM)
The Darwin VAAC reported that during 25-28 December discrete minor ash emissions from Sangeang Api rose to altitudes of 2.4-3 km (8,000-10,000 ft) a.s.l. and drifted W, SW, and E. The Alert Level remained at 2 (on a scale of 1-4).
Source: Darwin Volcanic Ash Advisory Centre (VAAC)
The Darwin VAAC reported that during 18-19 December discrete minor ash emissions from Sangeang Api rose to an altitude of 2.4 km (8,000 ft) a.s.l. and drifted W. The Alert Level remained at 2 (on a scale of 1-4).
Source: Darwin Volcanic Ash Advisory Centre (VAAC)
The Darwin VAAC reported that during 11-13 and 17 December discrete ash emissions from Sangeang Api rose to an altitude of 2.4 km (8,000 ft) a.s.l. and drifted NW and W. A thermal anomaly was visible on 27 November. The Alert Level remained at 2 (on a scale of 1-4).
Source: Darwin Volcanic Ash Advisory Centre (VAAC)
The Darwin VAAC reported that during 4-5 and 7-9 December discrete ash emissions from Sangeang Api rose to an altitude of 2.4 km (8,000 ft) a.s.l. and drifted NW, W, and SW. A thermal anomaly was visible on 27 November. The Alert Level remained at 2 (on a scale of 1-4).
Source: Darwin Volcanic Ash Advisory Centre (VAAC)
The Darwin VAAC reported that during 27 November-3 December discrete and short-lived ash emissions from Sangeang Api rose to altitudes of 2.4-3.3 km (8,000-11,000 ft) a.s.l. and drifted NW, W, and SW. A thermal anomaly was visible on 27 November. The Alert Level remained at 2 (on a scale of 1-4).
Source: Darwin Volcanic Ash Advisory Centre (VAAC)
The Darwin VAAC reported that during 20-26 November discrete and short-lived ash emissions from Sangeang Api rose to 2.4 km (8,000 ft) a.s.l. and drifted SW and W. The Alert Level remained at 2 (on a scale of 1-4).
Source: Darwin Volcanic Ash Advisory Centre (VAAC)
The Darwin VAAC reported that during 14-19 November discrete and short-lived ash emissions from Sangeang Api rose to 2.4 km (8,000 ft) a.s.l. and drifted NW and W. Thermal anomalies were recorded at least during 18-19 November. The Alert Level remained at 2 (on a scale of 1-4).
Source: Darwin Volcanic Ash Advisory Centre (VAAC)
The Darwin VAAC reported that during 6-12 November discrete and short-lived ash emissions from Sangeang Api rose to 3 km (10,000 ft) a.s.l. and drifted NW, W, and SW. Thermal anomalies were visible during 6-8 November. The Alert Level remained at 2 (on a scale of 1-4).
Source: Darwin Volcanic Ash Advisory Centre (VAAC)
The Darwin VAAC reported that during 30-31 October and 3-4 November discrete and short-lived ash emissions from Sangeang Api rose 2.7-3.5 km (9,000-11,000 ft) a.s.l. and drifted NW, W, and SW. Thermal anomalies were visible on 3 and 5 November. The Alert Level remained at 2 (on a scale of 1-4).
Source: Darwin Volcanic Ash Advisory Centre (VAAC)
The Darwin VAAC reported that during 26-28 October multiple discrete ash emissions from Sangeang Api rose to 2.1-2.7 km (7,000-9,000 ft) a.s.l. and dissipated rapidly to the NW, WNW, and W. A thermal anomaly was visible in satellite images on 26 October. The Alert Level remained at 2 (on a scale of 1-4).
Source: Darwin Volcanic Ash Advisory Centre (VAAC)
The Darwin VAAC reported that on 11 September a diffuse ash plume from Sangeang Api was identified in satellite images rising to 3 km (10,000 ft) a.s.l. and drifting N. The Alert Level remained at 2 (on a scale of 1-4).
Source: Darwin Volcanic Ash Advisory Centre (VAAC)
The Darwin VAAC reported that during 5-7 September intermittent diffuse ash plumes from Sangeang Api were identified in satellite images rising to 3 km (10,000 ft) a.s.l. and drifting S and SW. The Alert Level remained at 2 (on a scale of 1-4).
Source: Darwin Volcanic Ash Advisory Centre (VAAC)
The Darwin VAAC reported that during 28 August-3 September intermittent ash plumes from Sangeang Api were identified in satellite images rising to 3 km (10,000 ft) a.s.l. and drifting N, NW, W, and SW. The Alert Level remained at 2 (on a scale of 1-4).
Source: Darwin Volcanic Ash Advisory Centre (VAAC)
The Darwin VAAC reported that during 21-26 August intermittent ash plumes from Sangeang Api were identified in satellite images rising to 3 km (10,000 ft) a.s.l. and drifting W and WNW. The Alert Level remained at 2 (on a scale of 1-4).
Source: Darwin Volcanic Ash Advisory Centre (VAAC)
The Darwin VAAC reported that during 14-20 August intermittent ash plumes from Sangeang Api were identified in satellite images rising to 2.4-3 km (8,000-10,000 ft) a.s.l. and quickly dissipating to the N, NW, W, and SW. The Alert Level remained at 2 (on a scale of 1-4).
Source: Darwin Volcanic Ash Advisory Centre (VAAC)
The Darwin VAAC reported that during 7-13 August ash plumes from Sangeang Api were identified in satellite images rising to 2.4-3 km (8,000-10,000 ft) a.s.l. and drifting in multiple directions. The Alert Level remained at 2 (on a scale of 1-4).
Source: Darwin Volcanic Ash Advisory Centre (VAAC)
The Darwin VAAC reported that during 31 July-3 August ash plumes from Sangeang Api were identified in satellite images rising to 2.4-3 km (8,000-10,000 ft) a.s.l. and drifting in multiple directions. The Alert Level remained at 2 (on a scale of 1-4).
Source: Darwin Volcanic Ash Advisory Centre (VAAC)
The Darwin VAAC reported that during 24-30 July multiple ash plumes from Sangeang Api were identified by pilots and in satellite images rising to 2.4-3 km (8,000-10,000 ft) a.s.l. and quickly dissipating N, NW, W, and SW. The Alert Level remained at 2 (on a scale of 1-4).
Source: Darwin Volcanic Ash Advisory Centre (VAAC)
The Darwin VAAC reported that during 17-18 and 20-22 July ash plumes from Sangeang Api were identified by pilots and in satellite images rising to 2.1-4.6 km (7,000-15,000 ft) a.s.l. and drifting NW, W, and SW. The Alert Level remained at 2 (on a scale of 1-4).
Source: Darwin Volcanic Ash Advisory Centre (VAAC)
The Darwin VAAC reported that during 10-16 July ash plumes from Sangeang Api were visible in satellite images rising to 2.1-3 km (7,000-10,000 ft) a.s.l. and drifting in multiple directions. The Alert Level remained at 2 (on a scale of 1-4).
Source: Darwin Volcanic Ash Advisory Centre (VAAC)
The Darwin VAAC reported that during 4-5 July ash plumes from Sangeang Api were visible in satellite images rising to 2.1-2.3 km (7,000-8,000 ft) a.s.l. and drifting SW and W. During 6-9 July multiple ash plumes rose to 3-4.6 km (10,000-15,000 ft) a.s.l. and drifted N, NW, and SW. Thermal anomalies were visible on 4 and 8 July.
Source: Darwin Volcanic Ash Advisory Centre (VAAC)
The Darwin VAAC reported that on 27 June ash plumes from Sangeang Api rose to 2.1 km (7,000 ft) a.s.l. and drifted NW. A thermal anomaly was also visible. On 29 June a discrete ash puff that rose to 2.4 km (8,000 ft) a.s.l. drifted NW, and steam emissions were ongoing.
Source: Darwin Volcanic Ash Advisory Centre (VAAC)
The Darwin VAAC reported that on 17 June multiple discrete emissions with increasing ash content over a period of about an hour rose from Sangeang Api to altitudes of 1.2-2.1 (4,000-7,000 ft) a.s.l. and drifted W and WNW, based on satellite images and weather models. A thermal anomaly was also visible. The Alert Level remained at 2 (on a scale of 1-4).
Sources: Darwin Volcanic Ash Advisory Centre (VAAC); Pusat Vulkanologi dan Mitigasi Bencana Geologi (PVMBG, also known as CVGHM)
Based on a VONA from PVMBG an ash emission from Sangeang Api was generated at 1338 on 15 October; it rose 250 m above the summit and drifted SW, W, and NW. The VONA noted that the ash emission possibly rose higher than what a ground observer had estimated. Seismic data was dominated by signals indicating emissions as well as local tectonic earthquakes. The Aviation Color Code was changed from Yellow to Orange.
Source: Pusat Vulkanologi dan Mitigasi Bencana Geologi (PVMBG, also known as CVGHM)
Based on a VONA from PVMBG, on 9 May a gas emission was observed at 1807 from Sangeang Api that rose to 4,150 m (13,000 ft) a.s.l. and drifted west. On 9 May the Aviation Color Code was changed from unassigned to Yellow.
Sources: Darwin Volcanic Ash Advisory Centre (VAAC); Pusat Vulkanologi dan Mitigasi Bencana Geologi (PVMBG, also known as CVGHM)
Based on analyses of satellite imagery, the Darwin VAAC reported that on 12 August an ash plume from Sangeang Api rose to 2.7 km (9,000 ft) a.s.l. and drifted NW.
Source: Darwin Volcanic Ash Advisory Centre (VAAC)
Based on analyses of satellite imagery, the Darwin VAAC reported that during 7-8 August minor emissions from Sangeang Api rose 2.4 km (8,000 ft) a.s.l. and drifted WSW.
Source: Darwin Volcanic Ash Advisory Centre (VAAC)
Based on analyses of satellite imagery, pilot observations, and wind data, the Darwin VAAC reported that during 29-30 July ash plumes from Sangeang Api rose to altitudes of 2.4-2.7 km (8,000-9,000 ft) a.s.l. and drifted NW and W.
Source: Darwin Volcanic Ash Advisory Centre (VAAC)
Based on analyses of satellite imagery, PVMBG observations, and wind data, the Darwin VAAC reported that during 19-20 July ash plumes from Sangeang Api rose to altitudes of 2.4-4.3 km (8,000-14,000 ft) a.s.l. and drifted NW.
Source: Darwin Volcanic Ash Advisory Centre (VAAC)
PVMBG reported a small eruption at Sangeang Api at 1154 on 15 July characterized by Strombolian activity, and an ash plume that rose 100-200 m above the crater rim and drifted SW. Prior to the event, thermal anomalies had increased beginning in March, and seismicity had increased starting in April.
Based on analyses of satellite imagery, PVMBG observations, and wind data, the Darwin VAAC reported that on 16 July an ash plume rose to an altitude of 2.1 km (7,000 ft) a.s.l., or 200 m above the crater rim, and drifted NW.
Sources: Pusat Vulkanologi dan Mitigasi Bencana Geologi (PVMBG, also known as CVGHM); Darwin Volcanic Ash Advisory Centre (VAAC)
PVMBG reported that observers at the Sangeang Api observation post in Desa Sangeang Darat, Bima, West Nusa Tenggara, reported that during 1 July-30 September diffuse white plumes rose up to 250 m above the crater rim. During 1 October-1 November white-to-gray plumes rose as high as 350 m. Beginning on 23 October occasional weak thumping noises were reported. Crater incandescence possibly indicated lava-dome growth or lava-flow advancement. The Alert Level remained at 2 (on a scale of 1-4); visitors and residents were warned not to approach the crater within a 1.5-km radius.
Source: Pusat Vulkanologi dan Mitigasi Bencana Geologi (PVMBG, also known as CVGHM)
Based on analyses of satellite imagery and wind data, the Darwin VAAC reported that on 8 July an ash plume from Sangeang Api rose to an altitude of 2.7 km (9,000 ft) a.s.l. and drifted over 35 km SE.
Source: Darwin Volcanic Ash Advisory Centre (VAAC)
Based on analyses of satellite imagery and wind data, the Darwin VAAC reported that on 7 July an ash plume from Sangeang Api rose to an altitude of 2.7 km (9,000 ft) a.s.l. and drifted over 35 km E.
Source: Darwin Volcanic Ash Advisory Centre (VAAC)
PVMBG reported seismic and visual monitoring of Sangeang Api during 1-17 June. During clear conditions, incandescence at the summit and white-and-gray plumes (100-1,500 m above the summit) were visible. On 1 June seismicity dramatically decreased, and as of 17 June was still declining. The Alert Level was reduced from 3 to 2 (on a scale of 1-4) on 17 June.
Source: Pusat Vulkanologi dan Mitigasi Bencana Geologi (PVMBG, also known as CVGHM)
Based on analyses of satellite imagery and wind data, the Darwin VAAC reported that on 14 June an ash plume from Sangeang Api rose to an altitude of 2.1 km (7,000 ft) a.s.l. and drifted 55 km NW.
Source: Darwin Volcanic Ash Advisory Centre (VAAC)
Based on analyses of satellite imagery and wind data, the Darwin VAAC reported that during 4-7 June ash plumes from Sangeang Api rose to an altitude of 3 km (10,000 ft) a.s.l. and drifted 45-110 km W and NW.
Source: Darwin Volcanic Ash Advisory Centre (VAAC)
PVMBG reported that during January-29 May diffuse white plumes rose at most 25 m above Sangeang Api's crater. On 30 May seismicity increased, with tremor starting at 0500 and becoming continuous at 1348. An eruption at 1555 generated an ash plume that rose 3 km and drifted W, causing ashfall over the sea. The Alert Level was raised to 3 (on a scale of 1-4). The island has no permanent settlements, and is only occupied during the growing and harvest seasons; civil authorities evacuated 135 people to the mainland. Based on satellite images, pilot observations, and the Indonesian Meteorological Office, the Darwin VAAC reported that on 30 May an ash plume rose to an altitude of 15.2 km (50,000 ft) a.s.l. and drifted 440 km E and 750 km SE.
BNPB reported that on 31 May two larger explosions occurred at 1330 and 2242. According to the VAAC, ash plumes from those explosions rose to altitudes of 13.7-15.2 km (45,000-50,000 ft) a.s.l. and drifted 280 km NW and other various directions. Later in the day the ash plumes became detached. Ashfall affected many areas in the Bima Regency on the mainland, including Wera, and prompted the evacuation of 7,328 people from four villages within a radius of 8 km from Sangeang Api. The Bima and Tambolaka airports were temporarily closed. According to a news article, all flights to and from the Darwin International Airport in Australia on 31 May were canceled.
The VAAC noted that ash plumes rose to an altitude of 4.3 km (14,000 ft) a.s.l. on 1 June and drifted W and SW. During 2-3 June ash plumes rose to altitudes of 3-4.3 km (10,000-14,000 ft) a.s.l. and drifted 45 km W.
Sources: Pusat Vulkanologi dan Mitigasi Bencana Geologi (PVMBG, also known as CVGHM); Badan Nacional Penanggulangan Bencana (BNPB); Darwin Volcanic Ash Advisory Centre (VAAC); The Guardian News
CVGHM reported that during May through 13 June diffuse white plumes rose 10 m above Sangeang Api's crater. Both the lava dome and surrounding areas showed no changes since November 2012. The Alert Level had been increased to 3 (on a scale of 1-4) on 19 May due to a trend of increasing seismicity; as many as 77 shallow earthquakes and 66 deep earthquakes had been detected daily. Residents and tourists were advised to stay away from the craters within a radius of 5 km. Since then seismicity decreased; 15 shallow earthquakes and three deep earthquakes were recorded on 13 June. The Alert Level was lowered to 2 on 14 June. The public were advised not to approach the craters within a radius of 1.5 km.
Source: Pusat Vulkanologi dan Mitigasi Bencana Geologi (PVMBG, also known as CVGHM)
CVGHM reported that during 1-19 May diffuse white plumes rose 10 m above Sangeang Api's crater. Both the lava dome and surrounding areas showed no changes since November 2012. Seismicity had increased on 26 April and remained high. The Alert Level was raised to 3 (on a scale of 1-4) on 19 May. Residents and tourists were advised not to approach the craters within a radius of 5 km.
Source: Pusat Vulkanologi dan Mitigasi Bencana Geologi (PVMBG, also known as CVGHM)
CVGHM reported that during November through mid-December observers at the Sangeang, Bima observation post (50 km SW) noted occasional diffuse white plumes rising 5-15 m above Sangeang Api's crater. The lava dome and surrounding areas had not changed compared to October observations. Avalanches had occurred on the W and SW flanks. Earthquakes had declined. The Alert Level was lowered to 2 (on a scale of 1-4) on 21 December.
Source: Pusat Vulkanologi dan Mitigasi Bencana Geologi (PVMBG, also known as CVGHM)
CVGHM reported that during 1-10 October Sangeang Api was often not visible due to fog; occasionally plumes were visible and rose as high as 20 m above the crater. The lava dome and surrounding areas had not changed compared to the beginning of the year. Both the number and magnitude of earthquakes increased on 5 October, declined during 6-8 October, then again increased on 9 October. The Alert Level was raised to 3 (on a scale of 1-4) on 10 October.
Source: Pusat Vulkanologi dan Mitigasi Bencana Geologi (PVMBG, also known as CVGHM)
CVGHM reported that on 4 June the Alert Level for Sangeang Api was raised to 2 (on a scale of 1-4) due to recent increases in the number of earthquakes. White plumes rose 5-25 m during 1 May-3 June.
Source: Pusat Vulkanologi dan Mitigasi Bencana Geologi (PVMBG, also known as CVGHM)
Reports are organized chronologically and indexed below by Month/Year (Publication Volume:Number), and include a one-line summary. Click on the index link or scroll down to read the reports.
Explosions eject tephra, lava flow; island evacuated
"Sangeang Api . . . began to erupt on 30 July, with a series of explosions from the summit crater (Doro Api). The first explosion occured at about 0900 and produced a plume of tephra and gas to about 3,500 m altitude. Additional explosions occurred at 1130 (6,500 m), 1320 (6,500 m), and 1800 (1,500 m). Ashfall in Bima (50 km SW of the volcano), the capital of Sumbawa, totaled about 2 mm, and ashfall along the NE coast of Sumbawa, in the vicinity of the village of Wera, totaled about 2 cm. Between 30 July and 1 August, the 1,242 inhabitants of Sangeang Api island were evacuated to Sumbawa. Numerous additional Vulcanian explosions took place during the following week, reaching a maximum altitude of 2,500 m. Poor weather prevented systematic observations 1-5 August. On 6 August at 1939, a 0.7-km-long aa flow was observed advancing W from the region of Doro Api crater, toward the village of Doro Sangeang. By 9 August, the flow was 1.7 km long.
"The most recent eruption of Sangeang Api was in 1966; earlier eruptions occurred in 1512, 1715, 1821, 1860, 1911, 1912, 1927, 1953, [1954-1958 (six eruptions)], and 1964. Typical activity begins with strong Vulcanian explosions followed within a few days by Strombolian explosions. Eruptions in 1953 and 1964 ended with a lava flow and weak Strombolian explosions. Lavas from Sangeang Api are of basaltic composition (49-51% SiO2)."
Information Contacts: VSI.
Eruption declines; 4.5 km lava flow
"Sangeang Api continued to erupt in early September. Activity consisted of a single lava flow that has moved approximately 4.5 km W from Doro Api. The frequency of explosions has declined steadily from ~150/day in early August to ~50/day in early September. The maximum explosion cloud height was ~1 km. From 9 to 14 August, the number of small (M < 1) shallow volcanic earthquakes ranged from 190-400/day. By 6-11 September the number of volcanic earthquakes had decreased to 12-40/day."
"A gas plume has been continuously emitted from the volcano since activity began on 30 July. In late August, the gas plume rose less than 0.5 km and was carried W by steady winds. The plume was translucent with a bluish gray to bluish white color. The larger explosions contributed dark gray clouds of fine tephra to the plume. Its SO2 content was in the range of 50-100 metric tons/hour when measured on 23 August."
"The evacuation of the approximately 1,250 inhabitants from Sangeang Island was completed in early August. Inhabitants are in the process of moving their homes to Sumbawa Island."
Information Contacts: J. Matahelumual and T. Casadevall, VSI.
30 July eruption plume seen on satellite images
GMS images showed plumes from the initial 30 July activity (figure 1). Digital data analyses of temperatures at the tops of the plumes compared with radiosonde altitude profiles suggested that they reached a maximum altitude of 14.1 km (table 1), below the tropopause. However, Yosihiro Sawada notes that for both this and other eruptions, altitudes calculated with this technique seem to be consistently higher than estimates from ground observers.
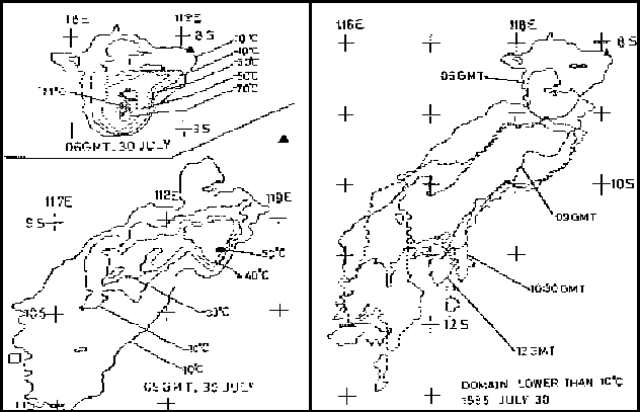 |
Figure 1. Surface temperatures (in °C) of eruption clouds from Sangeang Api (left), 30 July 1985, 1400 (top) and 1700 (bottom) Zones of plume surface from Sangeang Api (right) with temperatures less than 10°C on 30 July at 1400, 1700, 1830, and 2000. Courtesy of Yosihiro Sawada. |
Table 1. Sangeang Api eruption cloud data from GMS satellite images on 30 July 1985. Maximum altitude of the eruption cloud is estimated by comparing the GMS digital temperature data with temperature/altitude data profiles from nearby radiosondes. No plume was evident on the image returned at 1100. A plume could be detected from 30 July at 1400 until 31 July at 0200, but none was visible 3 hours later. Maximum plume extent was reached at 1900.
| Date | Time | Length (km) | Width (km) | Min Temp | Max Alt (km) | Remarks |
| 30 Jul 1985 | 1400 | 135 | 105 | -71°C | 14.1 | emerging from volcano |
| 30 Jul 1985 | 1700 | 315 | 100 | -50°C | 11.8 | detached from volcano |
| 30 Jul 1985 | 1800 | 385 | 150 | -37°C | 10.2 | detached from volcano |
| 30 Jul 1985 | 1830 | 405 | 160 | -30°C | 9.4 | detached from volcano |
| 30 Jul 1985 | 1900 | 425 | 130 | -24°C | 8.5 | detached from volcano |
Information Contacts: Y. Sawada, MRI, Tsukuba.
Lava advance stops; fewer and smaller explosions
"Sangeang Api entered into eruption on 30 July. The main features of the activity included an initial phase of mild Vulcanian explosions, followed by Strombolian explosions, a lava flow, and a persistent plume of water vapor and gas. The initial explosions on 30 July were accompanied by a small nuée ardente that followed the drainage of the Sori Kawangge 4 km down the SSW flank to ~200 m altitude, and produced a dark-colored, hornblende-bearing pumice. The eruption has continued through the first week of November but at a greatly reduced level from August. The frequency of explosions has declined steadily from ~150/day in early August to ~50/day in early September and fewer than 6/day in early November. The maximum height of the explosion cloud was ~1 km above the vent in August and
". . . The daily earthquake count shows a steadily decreasing trend, and in early November the number of earthquakes was less than 30/day. The lava flow, first observed on 6 August flowing W from the region of Doro Api crater (toward the village of Doro Sangeang), had advanced to about 4.7 km from the summit by 1 October. The flow showed no additional growth during October."
Photographs taken by astronauts from Space Shuttle mission 61A (30 October-5 November) showed a fairly dense plume extending roughly 50-100 km from Sangeang Api (figure 2).
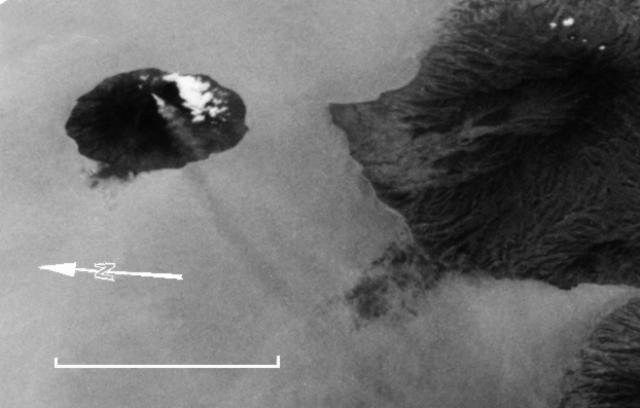 |
Figure 2. Space Shuttle photograph (no. 61A-40-062), taken 5 November 1985, showing a plume emerging from Sangeang Api, plus a portion of Sumbawa Island. Note that north is to the left. Courtesy of Charles A. Wood. |
Information Contacts: J. Matahelumual, Suparto S., and T. Casadevall, VSI; C. Wood, NASA.
Strombolian explosions; lava flow in growing channel; pyroclastic flow deposit
"Sangeang Api continued to erupt with 10-30 Strombolian explosions/day in November and the first week in December. The 1985 lava channel had not lengthened from the 4.7 km observed in late September. However, the volume of the main channel has grown because of a considerable increase in height during the past 2 months. A slow-moving lava flow in the central channel is located atop the main feeder tube. Periodic overflows of this channel add both fluid lava and rubble to the outer flanks of this tube. On 5 December, four separate overflows of fluid lava and rock rubble were observed rolling down the sides of the central channel.
"A brief visit was made to the central crater on 4 December during a period of quiet. The active vent was a large cinder cone in Doro Api Crater. This central cone, which previously rose about 40 m from the floor of Doro Api, was estimated to be approximately 180-200 m above the floor during the 4 December visit. Thundering detonations were heard almost continuously during the 15 minutes spent in the crater and 1 mild Strombolian explosion hurled incandescent blocks. At night, a continuous reddish glow at the bottom of the gas plume over the crater suggested that a small lava lake may exist within Doro Api or the central cone. Fountaining of fluid lava, sheets, or ribbons was observed to accompany some of the larger Strombolian explosions at night.
"We also confirmed the existence of a small-volume pyroclastic flow that was probably produced during the initial activity of 30 July. Local residents reported that the activity caused a number of small fires in the vicinity of Doro Montoy crater (just N of Doro Api) and the Sori Mbere drainage on the S flank of the volcano. A small block and ash flow, still hot to the touch, was found in the Sori Mbere drainage in December. Lahars generated by heavy rainfall and unconsolidated material on the upper slopes of the volcano have been common during and immediately after previous episodes. Outcrops along the shoreline indicate that a number of lahars and possibly also pyroclastic flows have entered the sea. Small mudflows were produced by heavy rains on 2 December. One traveled down the Sori Mbere drainage while a second mudflow entered the sea at Oi Nono Jara on the S side of Sangeang Island.
"This pattern of activity conforms to that of previous 20th century eruptions of Sangeang Api. The 1911 activity included numerous explosions and a lava flow from the summit crater that moved more than 6 km down the W flank. The activity that began in March 1953 produced a lava flow and intermittent explosions through 1954. The 1964 eruption began on 29 January with strong explosions from the 1954 crater, and a lava flow first observed on 3-4 February moved N and E to about 750 m elevation. Explosions and outflow of lava continued for at least several months and possibly until the end of 1965."
Information Contacts: T. Casadevall and L. Pardyanto, VSI.
Summit explosions in July and December
"Sangeang Api continued to erupt in December. Compositions of 30 July pumice and mid-August dense lava bombs are given in table 2."
Table 2. Whole rock analyses of samples collected from Sangeang Api. X-ray fluorescence analyses by the USGS Laboratory, Denver, Colorado. Sample 1: pumice from eruption on 30 July 1985. Sample 2: ejected block, dense lava explosion mid-August 1985. Total iron expressed as Fe2O3; loss on ignition at 900°C.
| Element | Sample 1 (pumice) | Sample 2 (block) |
| SiO2 | 53.8 | 49.3 |
| Al2O3 | 18.9 | 17.9 |
| Fe2O3 | 7.23 | 11.1 |
| MgO | 2.51 | 4.60 |
| CaO | 7.30 | 10.2 |
| Na20 | 4.33 | 3.07 |
| K20 | 3.60 | 2.40 |
| TiO2 | [0.66] | 1.03 |
| P2O5 | 0.38 | 0.32 |
| MnO | 0.22 | 0.23 |
| LOI | 1.09 | 0.05 |
| Total | [100.02] | 100.2 |
Information Contacts: Suparto S. and T. Casadevall, VSI.
Continued gas explosions and lava ejection
"Activity started on 30 July [1985] from the main summit crater (Doro Api . . .). At about 0900 a thick plume rose to 3,500 m height. The eruption continued with explosions at 1130 (6,500 m), 1320 (6,500 m) and 1800 (1,500 m). About 2 mm of ash fell in Bima, 50 km SW of the volcano. Between then and 5 August explosions occurred every 30-60 minutes. Black plumes reached 2,000-2,500 m height. On 6 August at 1939 lava was observed flowing W from Doro Api crater. At the end of September the lava flow had advanced ~4,750 m. Numerous explosions took place from September to November, producing columns ~400-500 m high. On 17 November an explosion ejected incandescent lava fragments to ~250 m height and a plume rose to 1,200 m above the crater [see also 10:7-12]. During December and January, gas explosions, sometimes accompanied by ejection of incandescent lava fragments, averaged ~80 events/day. The 1,242 inhabitants of the island were evacuated to the main island of Sumbawa. There were no casualties."
Information Contacts: A. Sudradjat, VSI.
Small explosions increase slightly
". . . By comparison with activity in December and January, the frequency of small explosions increased slightly during February and March to ~80/day [but see 11:1]. The height of the eruption clouds averaged ~900 m. Since December 1985, no visits have been made to examine the 1985 lava flow, but continued lava production is suspected."
Information Contacts: Olas, A. Sudradjat, and T. Casadevall, VSI.
Continued small explosions; glow
". . . Activity consisted of small explosions with eruption clouds reaching <1 km above the crater. Persistent glow has been observed above the summit crater during the night, suggesting the presence of lava within the crater and in the 1985 lava channel which drains W from the crater."
Information Contacts: Olas, Suratman, Suparto, Kaswanda, and A. Sudradjat, VSI.
Explosions and lava flow advance continue
Observers at Sangeang Api reported no changes in the eruption . . . . Several explosions/hour at Doro Api crater and slow growth of the lava flow continued. Only rockfall earthquakes were recorded.
Information Contacts: A. Sudradjat, L. Pardyanto, and T. Casadevall, VSI.
Explosions and crater glow continue
The eruption continued through June with several explosions/day that produced clouds reaching ~1 km above the summit. A persistent reddish glow continued to be visible at night above Doro Api crater.
Information Contacts: L. Pardyanto, Olas, Kaswanda, A. Sudradjat, and T. Casadevall, VSI.
Ash clouds; red glow above crater
Sangeang Api has been in continuous eruption for a year. Activity in July included several explosions/day, producing eruption clouds . . . ~1 km above the summit. A persistent reddish glow was visible at night above the Doro Api crater.
Information Contacts: L. Pardyanto, Olas, Kaswanda, Suratman, A. Sudradjat, and T. Casadevall, VSI.
Fewer explosions
"Explosions from the summit crater decreased in frequency during September."
Information Contacts: L. Pardyanto, Olas, Kaswanda, Suratman, A. Sudradjat, and T. Casadevall, VSI.
Explosions continue
Summit explosions . . . were continuing in October.
Information Contacts: Suratman and T. Casadevall, VSI.
Numerous explosions
During November >130 explosions were recorded from Dori Api crater. The maximum height of eruption columns was 700 m. Continued extrusion of lava was suspected but not confirmed. No volcanic earthquakes were recorded.
Information Contacts: VSI; ANS.
Small explosions but no seismicity
Explosions continued from Doro Api Crater, ranging from 40 to 70/day from December through the first week in January. Maximum plume height was 800 m. No volcanic earthquakes were recorded.
Information Contacts: VSI.
Frequent small gas explosions
About 60 small gas explosions/day continued to occur through February. Plumes reached maximum heights of 600 m. No volcanic seismicity was recorded.
Information Contacts: VSI.
Small gas explosions continue
March eruptive activity consisted of ~250 small gas explosions with plumes reaching a maximum height of 600 m above the crater rim. Of the 22 earthquakes recorded during March, 17 were of tectonic origin (deep) and five were volcanic (shallow).
Information Contacts: VSI; T. Casadevall, USGS & VSI.
About 50 small explosions daily
Sangeang Api continued in eruption with an average of ~50 small explosions/day during April. The maximum plume height was 600 m. No earthquakes were detected during April.
Information Contacts: T. Casadevall, USGS & VSI.
Frequent explosions continue
Eruptive activity continued during May and June with ~50 explosions/day . . . . Plumes reached ~600 m above the crater rim. No earthquakes accompanied the explosions.
Information Contacts: VSI.
Activity continues; plumes to 600 m
Eruptive activity continued during July with ~45 explosions/day producing plumes to 600 m above the crater rim. No earthquakes accompanied the explosions. No VSI geologist has been able to visit the island to inspect the activity since early 1986.
Information Contacts: VSI.
Small explosions continue
The eruption . . . continued in August, with ~25 explosions/day ejecting plumes to ~600 m above the crater rim. A seismometer 5 km from the summit recorded no earthquakes accompanying the explosions.
Information Contacts: VSI.
Small explosions continue
September activity was similar to . . . August, with ~25 explosions/day. Plumes reached ~600 m above the crater rim.
Information Contacts: VSI.
Fewer explosions
Eruptive activity continued in October at a rate of ~18 explosions/day, with plumes reaching ~600 m above the crater rim. The number of daily explosions has declined steadily from 50-70/day in early 1987, and the October rate is the lowest since the eruption started in July 1985.
Information Contacts: VSI.
Eruptive activity continues at steady rate
Eruptive activity continued during November and December at ~18 explosions/day, about the same rate as in October.
Information Contacts: VSI.
Explosions and earthquakes end
The number of explosions . . . declined steadily from 50-70/day in early 1987 to ~15/day at the end of the year. By February, explosions had stopped, although fuming continued from the summit crater, producing a whitish plume. No earthquakes were reported during February.
Information Contacts: VSI.
March to May plumes are thin and rise to 150 m above the summit
As of 21 February the seismograph was under repair so the volcano was monitored visually. During 9 March-24 May a "white ash plume" rose 10-150 m above the summit. During 27 April - 3 May the plume remained thin, but after 4 May it vacillated between thick and thin.
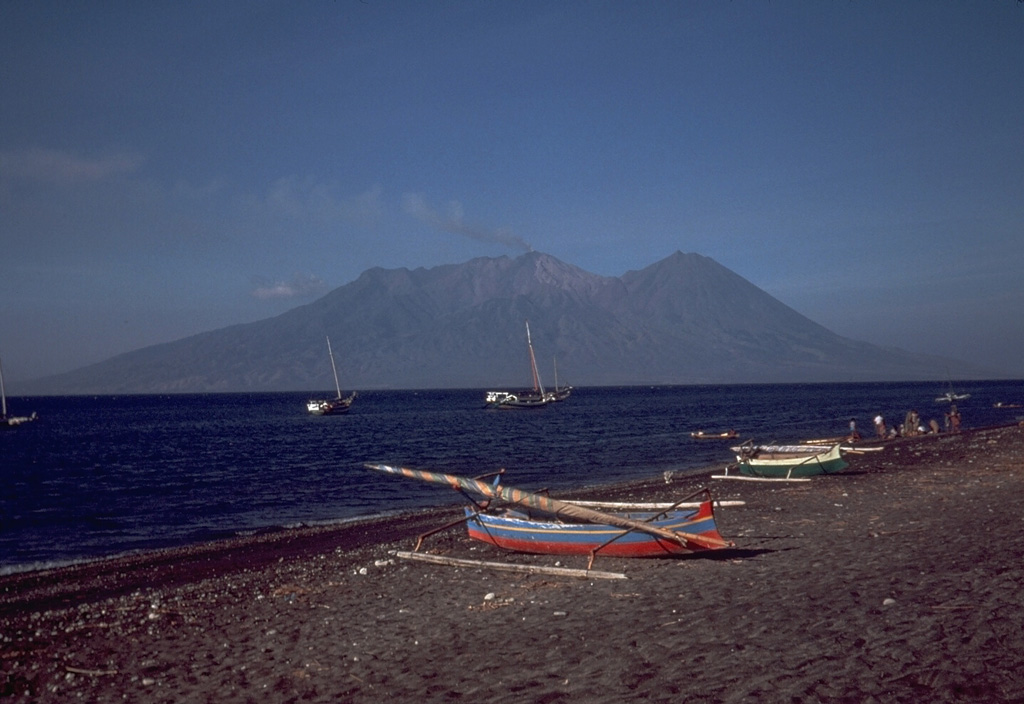
Sangeang Api volcano, one of the most active in the Lesser Sunda Islands, forms a small 13-km-wide island off the NE coast of Sumbawa Island. Two large volcanic cones, 1,949-m-high Doro Api and 1,795-m-high Doro Mantoi, were constructed in the center and on the eastern rim, respectively, of an older, largely obscured caldera. Flank vents occur on the south side of Doro Mantoi and near the northern coast. Intermittent historical eruptions have been recorded since 1512, most of them during in the 20th century.
Information Contacts: Volcanological Survey of Indonesia (VSI), Jalan Diponegoro No. 57, Bandung 40122, Indonesia (URL: http://www.vsi.esdm.go.id/).
Increased seismicity, including explosion earthquakes, during May-June 2009
According to the Center of Volcanology and Geological Hazard Mitigation (CVGHM), restlessness began at Sangeang Api in May and June 2009. In early May 2009 white emissions reached heights of ~ 5-25 m. In addition, occasional explosion earthquakes and generally minor seismicity continued (table 3). In addition, an earthquake struck on 1-2 June 2009 that was felt at a Modified Mercali intensity of MM I.
Table 3. Summary of reported volcanic activity at Sangeang Api. Courtesy of the Center of Volcanology and Geological Hazard Mitigation (CVGHM).
| Date | Explosions | Tremor and amplitude | Deep volcanic earthquakes | Shallow volcanic earthquakes |
| 01-17 May 2009 | Avg. ~3/day | continuous, 3 mm | Avg. ~2/day | ~1/day |
| 18-31 May 2009 | ~13/day | continuous, 7 mm | ~4/day | ~2/day |
| 01-02 Jun 2009 | ~21/day | continuous, 5 mm | ~2/day | 1/day |
| 03 Jun 2009 | 11 | continuous, 6 mm | 7 | -- |
On 4 June the Alert Level was raised to 2 (on a scale of 1-4) due to the increases in the number of explosion earthquakes, tremor, and other local earthquakes. Residents and visitors were prohibited from climbing the volcano. No thermal anomalies have been seen in MODIS imagery between 1999 and August 2009.
Information Contacts: Center of Volcanology and Geological Hazard Mitigation (CVGHM), Jalan Diponegoro 57, Bandung 40122, Indonesia (URL: http://vsi.esdm.go.id/).
Explosive eruptions during 1997-1999 were previously unreported
A recent translation of an older report from the Center of Volcanology and Geological Hazard Mitigation (CVGHM) discussed previously undocumented interval of eruptions at Sangeang Api (figure 3) during 1997-1999. These eruptions were described, along with other known eruptions, in broad terms in their report. They were generally explosive, with lava domes and lava discharges, similar to the eruptions of 1911, 1953, 1954, 1985-1988.
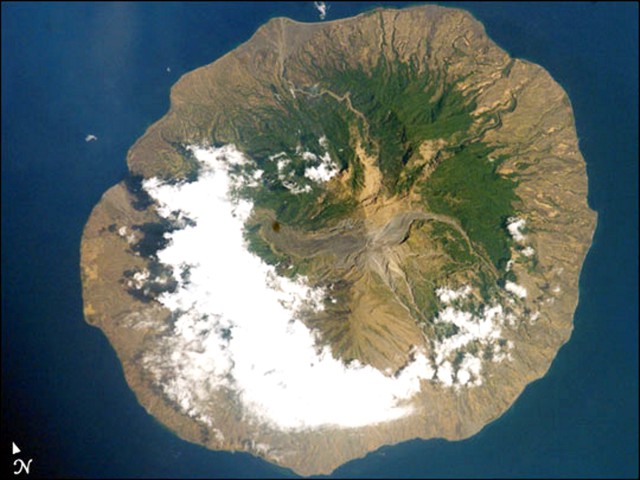 |
Figure 3. A photograph of the 13-km-wide Sangeang Api taken on 15 October 2002 by Space Shuttle astronauts (photo STS-112-E-5628). A wide channel running W from provides a path for inferred lava and pyroclastic flows. Courtesy of NASA Earth Observatory. |
Dali Ahmad confirmed the occurrence of explosive activity during the 1997-1999 period. These took place without causing casualties because, since 1989, all of the island residents had departed to the nearby Sumbawa Island. No additional eruptions were indicated through at least 2009. In recent times the island's summit crater has produced intermittent steam clouds.
Turner and others (2003) used Uranium-series isotopes to provide insights into Sangeang Api magma evolution. The volcano erupts potassic lavas (SiO2 ~47?55%) with a spectrum of xenoliths that record the liquid line of descent. The scientists estimated that the Sangeang Api magma chamber was about 6-10 km3 in volume and underwent cooling rates of ~0.05°C/year.
Reference. Turner, S., Foden, J., George, R., Evans, P., Varne, R., Elburg, M., and Jenner, G., 2003, Rates and processes of potassic magma evolution beneath Sangeang Api volcano, East Sunda Arc, Indonesia: Journal of Petrology, v. 44, no. 3, pp. 491-515.
Information Contacts: Dali Ahmad, Center of Volcanology and Geological Hazard Mitigation (CVGHM), Jalan Diponegoro 57, Bandung 40122, Indonesia (URL: http://www.vsi.esdm.go.id/); NASA Earth Observatory (URL: http://earthobservatory.nasa.gov/).
Fumarolic emissions and variable seismicity during 2012-2013
This Bulletin reports Sangeang Api activity since our last report of December 2009, (BGVN 34:12) until 1 November 2013. Sangeang Api volcano resides in the Flores Sea of Indonesia (figures 4 and 5). Several seismic events and corresponding white plumes were observed in 2012 and 2013. The Alert Level corresponding to the events were temporarily raised then lowered. The Alert Level scale extends from a low of 1 to a high of 5.
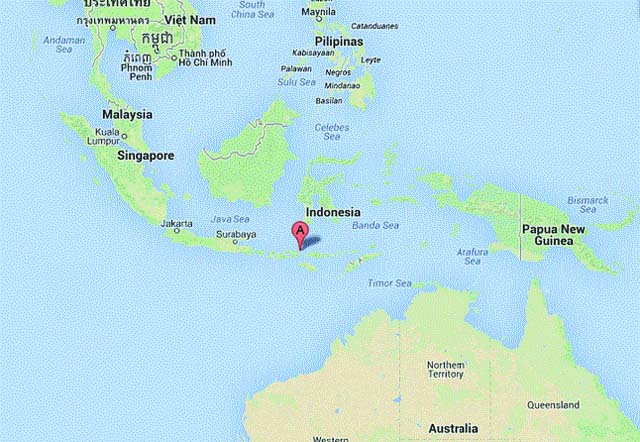 |
Figure 4. Sangeang Api volcano is on a 13-km-wide island of the same name located in the Lesser Sunda Islands of the Indonesian Archipelago. |
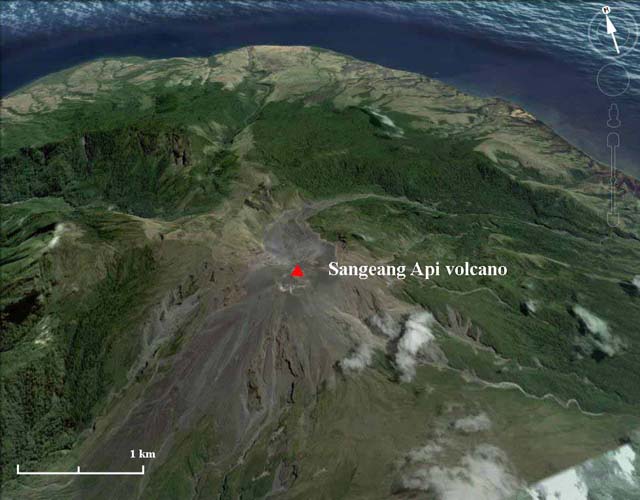 |
Figure 5. Sangeang Api seen in a N-looking view showing the summit area with active crater rim cut by the red triangle. A conspicuous older dormant crater lies NNE. Courtesy of Google Earth. |
The Indonesian government's Center for Volcanology and Geologic Hazard Mitigation (CVGHM) performs in situ visual, seismicity and satellite monitoring of Sangeang Api volcano and reports significant events. The same agency is also called Pusat Volkanologi dan Mitigasi Bencana Geolog - or PVMBG, a name that also appears on reports.
2009 - 2011 activity. Sangeang Api seismicity increased during May and June 2009 at the same time white plumes were observed with heights from 5 to 25 m. On 4 June 2009, CVGHM increased the alert level from 1 to 2 on the scale of 1 to 4. During 2010 and 2011 Sangeang Api reporting was unarchived on the web.
2012 activity. CVGHM reported that during 1-10 October 2012 Sangeang Api was often not visible due to fog; however when visible occasionally plumes were visible and rose as high as 20 m above the crater. The lava dome and surrounding areas had not changed compared to the beginning of the year. Both the number and magnitude of earthquakes increased on 5 October, declined during 6-8 October, then again increased on 9 October 2012. The Alert Level was raised to 3 on 10 October.
CVGHM issued an eruption warning on 12 October 2012 based on increased seismic activity. They commented that surface activity had not been detected so far, but a new eruption from the summit lava dome would not be a surprise. However, the hazard warning status definitions are not a robust basis for describing predictions.
CVGHM reported that during November through mid-December 2012 observers at the Sangeang, Bima District observation post (50 km SW) noted occasional diffuse white plumes rising 5-15 m above Sangeang Api's crater. The lava dome and surrounding areas had not changed compared to October observations. Avalanches had occurred on the W and SW flanks however their size was omitted. Earthquakes had declined. The Alert Level was lowered to 2 on 21 December.
2013 activity. CVGHM reported that 1-19 May 2013 diffuse white plumes rose 10 m above Sangeang Api's crater. Both the lava dome and surrounding areas showed no changes since November 2012. Seismicity had increased on 26 April 2013 which included 14 tremor events and remained high through June. From May through 13 June 2013 diffuse white plumes rose 10 m above Sangeang Api's crater. As many as 77 shallow earthquakes and 66 deep earthquakes had been detected daily (figure 6). The risk analysis by Surono (2013) noted that lava dome growth and avalanches had occurred on the W and SW flanks (figure 7). Note figure 3 seismicity records cease after 30 May 2013.
In June 2013, 15 shallow earthquakes and three deep earthquakes were detected. The Alert Level was lowered to 2 on 14 June. The public were advised not to approach the craters within a radius of 1.5 km.
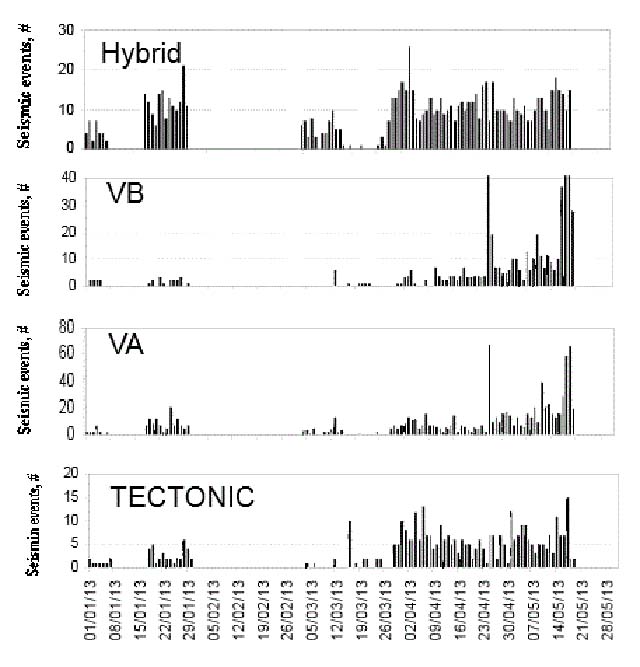 |
Figure 6. Sangeang Api seismicity registered during the period 1 January - 28 May 2013. Later reporting by CVGHM states shortly after this period the seismicity decreased and the alert level decreased. Courtesy of CVGHM. |
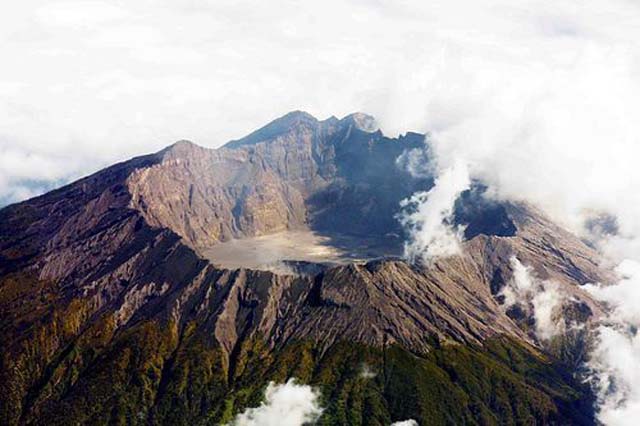 |
Figure 7. Sangeang Api volcano, which is truncated by a sharp rim and central crater. This image accompanied the CVGHM risk and situation summary power point update on 30 May 2013 for alert level 3 volcanoes. Date, location, look direction, and photographer unknown. Taken from Surono (2013). Courtesy of CVGHM. |
Reference. Surono (no first name), 5/30/2013 Risk and Situation Update Of Each Volcano Under Alert Level III, Ministry Of Energy and Mineral Resources, Indonesia https://docs.unocha.org/sites/dms/ROAP/Indonesia/Documents/PVMBG - VOLCANO_IN_LEVEL_III-30May2013.pdf
Information Contacts: Dali Ahmad, Center of Volcanology and Geological Hazard Mitigation (CVGHM), Jalan Diponegoro 57, Bandung 40122, Indonesia (URL: http://www.vsi.esdm.go.id/); and NASA Earth Observatory (URL: http://earthobservatory.nasa.gov/).
Ashfall from 30 May 2014 eruption causes evacuations, airline delays
Due to elevated seismic activity, the Indonesian Center for Volcanology and Geologic Hazard Mitigation (CVGHM) issued an alert for Sangeang Api volcano on 21 May 2014. On 30 May 2014 at 1555, CVGHM reported an eruption of the island volcano that generated an explosive eruption column of ash and sulfur dioxide into the atmosphere, extending >3 km above the summit (figure 8). While the 13-km-wide island of Sangeang has no permanent settlements or residents, dozens of farmers cultivate land on the island during the growing and harvest seasons. Photographs of the eruption showed several pyroclastic flows coming down the volcano summit to the S and E that may be hazardous to anyone of the island. On 30 May, the Alert Level was raised from 2 to 3 (on a scale of 1-4). Civil authorities evacuated 135 people from within 1.5 km of the volcano to the mainland (nearby Sumbawa Island), with the result that no one was reported to have been killed or injured during the eruption.
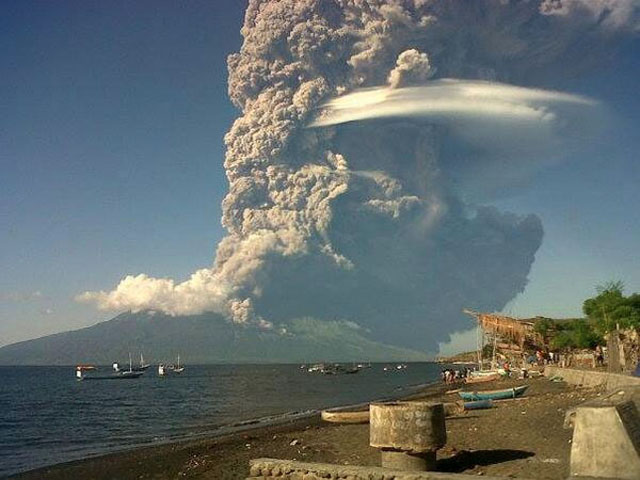 |
Figure 8. Eruption plume rising from Sangeang Api volcano on 30 May 2014, photographed to the N from Sambawa Island. Note the distinctive lenticular white cloud condensed from uplifted moist air carried by the rising plume. Pyroclastic flows can also be seen moving down along the S and E sides of the volcano. Courtesy of Anonymous (2014). |
Based on satellite images, pilot observations, and the Indonesian Meteorological Office, the Darwin VAAC reported that on 30 May an ash plume rose to an maximum altitude of 15.2 km and drifted 440 km E and 750 km SE (figure 9).
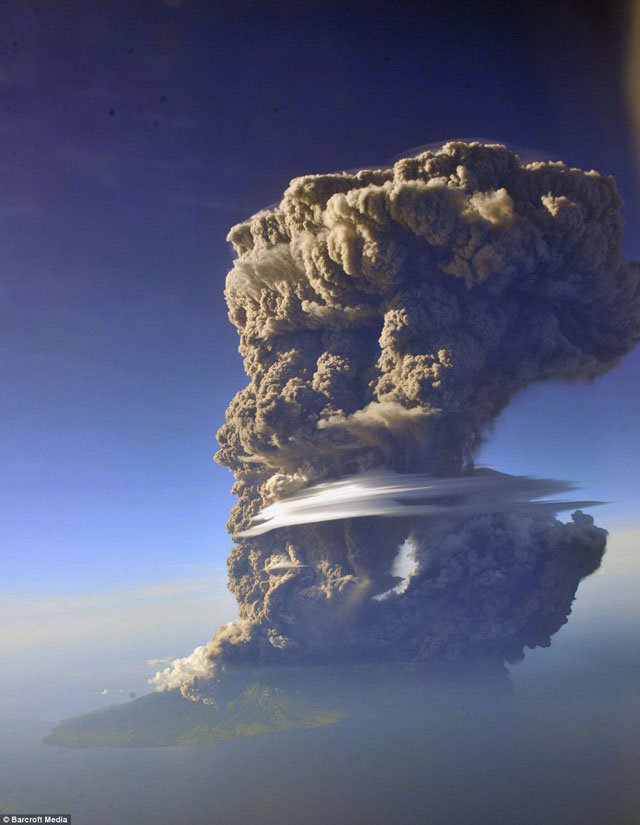 |
Figure 9. After erupting, the Sangeang Api volcano sent an ash plume to the E, along with a distinctive lenticular white cloud condensed from uplifted moist air. Pilots in the area reported seeing the cloud rising to 19.8 km, spreading over a 40 km area. Photograph taken on 30 May 2014 by Sofyan Efendi looking N during a commercial flight from Bali to the fishing town of Labuan Bajo; from Hall (2014). |
The Indonesian Regional Disaster Management Agency (BNPB) reported that on 31 May two larger explosions occurred at 1330 and 2242 hrs. According to the VAAC, ash plumes from these two explosions rose to altitudes of 13.7-15.2 km and drifted 280 km NW (and other various directions, including S). Later in the day the ash plumes, including one from the previous day, eventually became detached. Ashfall affected many areas in the Bima Regency on the mainland, including Wera, and prompted the evacuation of 7,328 people from four villages within a radius of 8 km from Sangeang Api. The Bima and Tambolaka airports were temporarily closed. According to a news article, all flights to and from the Darwin International Airport in Australia on 31 May were canceled (figure 10). The VAAC noted that ash plumes rose to an altitude of 4.3 km on 1 June and drifted W and SW (figure 11). During 2-3 June ash plumes rose to altitudes of 3-4.3 km and drifted 45 km W. Based on analyses of satellite imagery and wind data, the Darwin VAAC reported that on 14 June an ash plume from Sangeang Api rose to an altitude of 2.1 km and drifted 55 km NW.
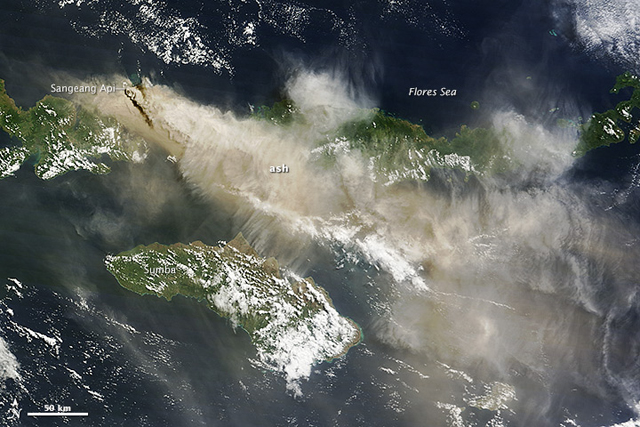 |
Figure 10. The Moderate Resolution Imaging Spectroradiometer (MODIS) aboard the Terra satellite captured imagery of the eruption plume from Sangeang Api (dark brown line on the image extending from the volcanic island to the SE) at 0235 UTC (1035 local time) on 31 May 2014. Ash drifted SE, shutting down airports in Bima, Indonesia, and Darwin, Australia. Service to Darwin resumed by 1 June, but Bima remained shut down as of 2 June, according to the Jakarta Globe. Other satellites have observed the ash plume as well. A near real-time tool developed by University of Wisconsin and NOAA scientists estimated that the plume reached an altitude of at least 12 to 14 km based on observations from multiple weather satellites. The Ozone Mapping & Profiler Suite on Suomi NPP also observed ash drifting toward Australia on 31 May. NASA image courtesy Jeff Schmaltz LANCE/EOSDIS MODIS Rapid Response Team, GSFC; Caption by Adam Voiland. From NASA Earth Observatory (2014, 3 June). |
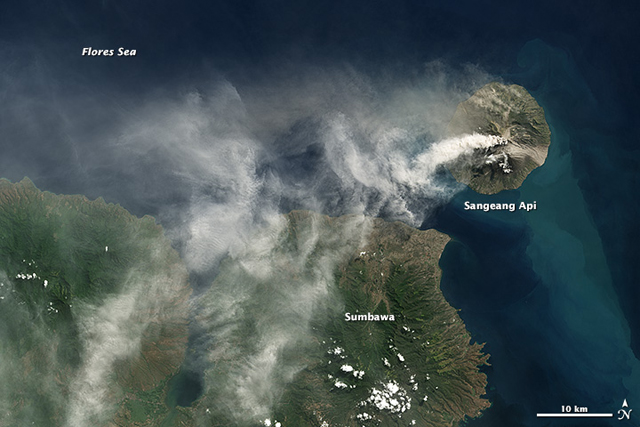 |
Figure 11. Landsat 8 satellite collected this true-color image of an ash plume rising from the Sangeang Api, an island volcano just of the coast of Sumbawa Island, Indonesia, on 1 June 2014. Note that on this day the plume is being blown W and then SW as compared with the previous day shown in figure 8. NASA Earth Observatory images by Robert Simmon, using Landsat 8 data from the USGS Earth Explorer. From NASA Earth Observatory (2014, 1 June). |
During the period from 2-17 June, thin to thick white smoke was ejected as high as 200-500 m. Seismic activity during the major part of the eruption is shown on Table 4; as of 17 June, seismicity continued to decline. The Alert Level was reduced from 3 to 2 (on a scale of 1-4) on 17 June.
Table 4. Numbers of daily earthquakes measured for 3 days during and after the eruption of Sangeang Api, as reported by CVGHM. 'VB' represents shallow volcanic earthquakes; 'VA' represents deep volcanic earthquakes; 'TL' represents local earthquake tectonics; 'X' indicates activity present; 'nr' is not reported .
| Date, 2014 | 30 May | 31 May | 1 June |
| VB | 88 | 143 | 35 |
| VA | 270 | 157 | 62 |
| TL | nr | nr | 5 |
| Volcanic swarm | X | nr | nr |
| Continuous tremor | X | X | X |
| Tremor eruption | X | X | X |
| Blowing earthquake | nr | nr | 36 |
MODVOLC and other satellite imaging. Satellite infrared measurements of thermal alerts over this Sangeang Api volcano eruption first appeared as 2 pixels (an area of thermal anomaly of ≥2 km2) at 1405 UTC on 30 May 2014. These were the first thermal alerts measured over Sangeang Api since 20 October 2013. From 30 May 2014 through 7 July, satellite crossings measured alerts of between 1 and 9 pixels (areas of ≥1 to ≥9 km2, respectively) daily until 1500 UTC on 30 June; the 9-pixel thermal alert was measured 20 June 2014 at 1425 UTC (figure 12). (Note: As an explanation for this technique, the MODVOLC web site states that "Using infrared satellite data provided by the Moderate Resolution Imaging Spectroradiometer (MODIS), scientists at the Hawai'i Institute of Geophysics and Planetology, University of Hawai'i, have developed an automated system [MODVOLC] which maps the global distribution of thermal hot-spots in near-real-time, and displays the results on this web-site." A paper by Wright and others (2004) states that "Although MODIS pixels are nominally 1 km, pixel size increases with distance from nadir and at the edges of the MODIS swath (where the scan angle reaches ±55°) MODIS pixels measure ~2.08 km in the along-track, and ~4.83 km in the across-track direction.")
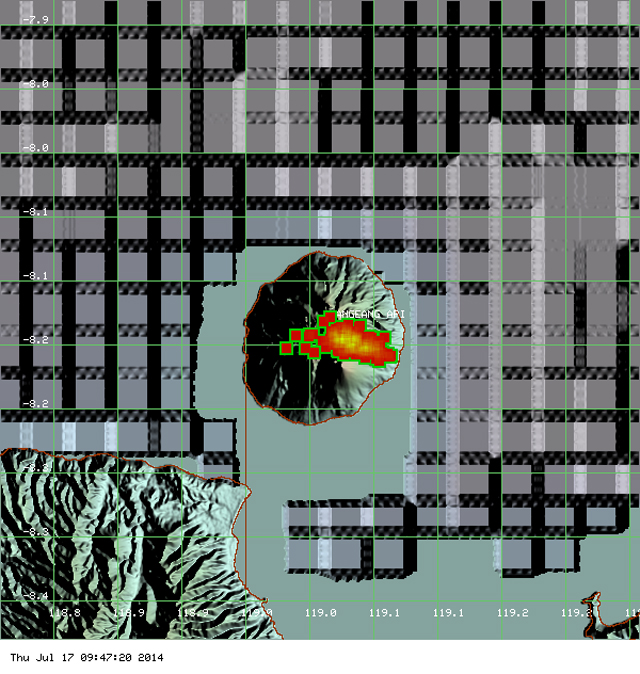 |
Figure 12. MODVOLC image for the period 30 May to 7 July 2014 of thermal alerts measured on Sangeang Api volcano. The volcano lies on the island of Sangeang just off the Indonesian island of Sumbawa. The central array of pixels trending E-W are for those alerts measured for the period 30 May - 30 June 2014. Courtesy of MODVOLC. |
Figures 13 and 14 show satellite images of ash plume temperature and SO2 plume from Sangeang Api volcano on 30 and 31 May 2014, respectively. The plume is obviously drifting to the E and S toward Australia.
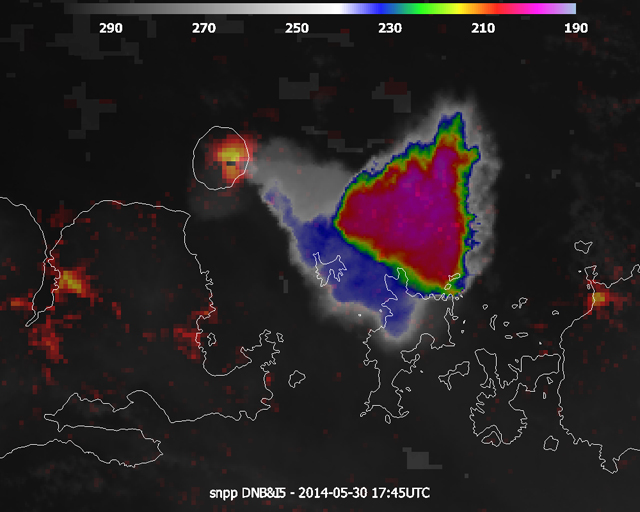 |
Figure 13. Composite of the Day-Night Band (DNB, red-to-yellow) at 750m resolution and the IR11.45 (I5, color scale at the top) channel at 375m resolution, image made 30 May 2014 at 1745 UTC. The DNB shows two craters at Sangeang Api volcano, Doro Api and Doro Mantoi. The brighter one was emanating the big plume with temperature values down to -196.5 K (76.6 °C) at the top. The secondary crater was emanating some material, but at much lower level so could hardly be seen. Courtesy of EUMETSAT (2014). |
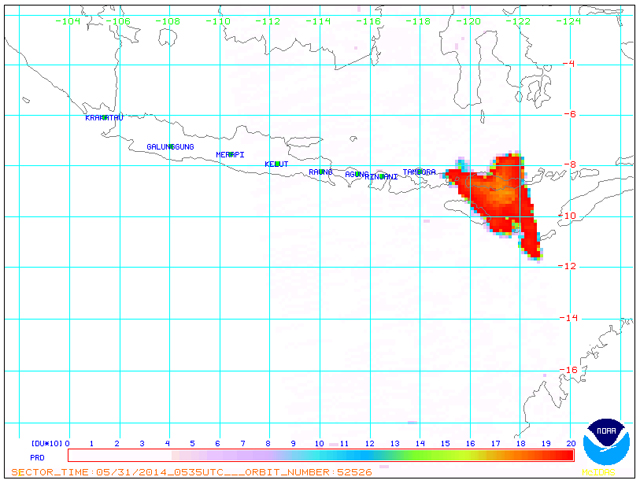 |
Figure 14. SO2 measured from the Sangeang Api volcano plume on 31 May 2014 at 0535 UTC. The volcano is located at the W end of the measured area. Courtesy of NOAA. |
References. Anonymous, 2014 (30 May), Massive volcano eruption: Sangeang Api volcano - Sunda Islands, Indonesia, Before Its News web site (http://beforeitsnews.com/environment/2014/05/massive-volcano-eruption-sangeang-api-volcano-sunda-islands-indonesia-2502094.html).
EUMETSAT, 2014, Eruption of Sangeang Api volcano: There were a series of spectacular eruptions from the Indonesian volcano Sangeang Api at the end of the May. URL: http://www.eumetsat.int/website/home/Images/ImageLibrary/DAT_2235292.html
NASA Earth Observatory, 2014 (3 June), Sangeang Api Erupts (URL: http://earthobservatory.nasa.gov/IOTD/view.php?id=83799).
NASA Earth Observatory, 2014 (1 June), Sangeang Api Eruption (URL: http://earthobservatory.nasa.gov/NaturalHazards/view.php?id=83887&eocn=image&eoci=nh_viewall)
Wright, R., Flynn, L.P, Garbeil, H., Harris, A.J.L., and Pilger, E., 2004, MODVOLC: near-real-time thermal monitoring of global volcanism, Journal of Volcanology and Geothermal Research, v. 135, pp. 29-49.
Hall, J., 2014 (30 May), Pictured from a passenger plane: Menacing 12-mile-high ash cloud looms over Indonesia's 'Mountain of Spirits' after volcano erupts, Daily Mail (URL: http://www.dailymail.co.uk/news/article-2644253/Incredible-moment-huge-volcano-erupts-Indonesia-sending-ash-spewing-thousands-feet-sky.html).
Information Contacts: Indonesian Centre for Volcanology and Geological Hazard Mitigation – CVGHM (also known as Pusat Vulkanologi dan Mitigasi Bencana Geologi - PVMBG)), Jalan Diponegoro 57, Bandung 40122, Indonesia (URL: http://www.vsi.esdm.go.id/); MODVOLC, Hawai'i Institute of Geophysics and Planetology (HIGP) Thermal Alerts System, School of Ocean and Earth Science and Technology (SOEST), Univ. of Hawai'i, 2525 Correa Road, Honolulu, HI 96822, USA (URL: http://modis.higp.hawaii.edu/); DARWIN VAAC (Darwin Volcanic Ash Advisory Centre), Bureau of Meteorology, Northern Territory Regional Office, PO Box 40050, Casuarina, NT 0811, Australia (URL: http://www.bom.gov.au/info/vaac/); Badan Penanggulangan Bencana Daerah (BPBD), Indonesian Regional Disaster Management Agency (URL: http://bpbd.malangkab.go.id/); and Badan Nasional Penanggulangan Bencana (BNPB), Indonesian National Disaster Management Agency (URL: http://www.bnpb.go.id/).
Large explosions in May 2014 followed by thermal anomalies until early November 2015
On 21 May 2014 the PVMBG (Pusat Vulkanologi dan Mitigasi Bencana Geologi) issued an alert for Sangeang Api based on elevated seismic activity. An explosive eruption followed on 30 May (BGVN 39:02), sending a dense column of ash and sulfur dioxide billowing more than 3 km above the volcano. Two larger explosions occurred the next day. No further explosive activity was seen, but thermal anomalies were recorded by satellite-based instruments during June-December 2014 and March-November 2015.
Review of May-June 2014 activity. PVMBG reported that during January-29 May 2014 diffuse white plumes rose at most 25 m above the crater. On 30 May seismicity increased, with tremor starting at 0500 and becoming continuous at 1348. An eruption at 1555 generated an ash plume that rose 3 km and drifted W, causing ashfall over the sea. The Alert Level was raised to 3 (on a scale of 1-4). The island has no permanent settlements, and is only occupied during the growing and harvest seasons; civil authorities evacuated 135 people to the mainland. Based on satellite images, pilot observations, and the Indonesian Meteorological Office, the Darwin VAAC reported that the 30 May ash plume rose to an altitude of 15.2 km and drifted 440 km E and 750 km SE (figure 15).
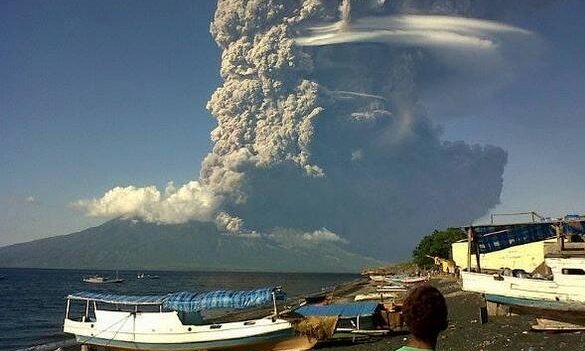 |
Figure 15. An ash plume rises from Sangeang Api during an eruption on 30 May 2014. Photo taken looking NE from Sumbawa Island. Courtesy of Australian Associated Press. |
BNPB reported that on 31 May two larger explosions occurred at 1330 and 2242 hours. According to the VAAC, ash plumes from those explosions rose to altitudes of 13.7-15.2 km and drifted 280 km NW and other various directions. Later in the day the ash plumes became detached. Ashfall affected many areas in the Bima Regency on the mainland, including Wera, and prompted the evacuation of 7,328 people from four villages within a radius of 8 km from Sangeang Api. The Bima and Tambolaka airports were temporarily closed. According to a news article, all flights to and from the Darwin International Airport in Australia on 31 May were canceled.
The VAAC noted that ash plumes rose to an altitude of 4.3 km on 1 June 2014 and drifted W and SW. During 2-3 June ash plumes rose to altitudes of 3-4.3 km and drifted 45 km W. During clear conditions on 1-17 June, incandescence at the summit and white-and-gray plumes (100-1,500 m above the summit) were visible. On 1 June 2014 seismicity dramatically decreased, and as of 17 June was still declining. The Alert Level was reduced from 3 to 2 (on a scale of 1-4) on 17 June.
Activity during 2015. PVMBG observers at the Sangeang Api post in Desa Sangeang Darat, Bima, West Nusa Tenggara, reported that during 1 July-30 September 2015 diffuse white plumes rose up to 250 m above the crater rim. During 1 October-1 November 2015 white-to-gray plumes rose as high as 350 m. Beginning on 23 October occasional weak thumping noises were reported. Crater incandescence possibly indicated lava-dome growth or lava-flow advancement. The Alert Level remained at 2 (on a scale of 1-4); visitors and residents were warned not to approach the crater within a 1.5-km radius.
Thermal anomaly data. Nearly daily thermal alerts were measured by MODVOLC (using MODIS data) following the 30 May eruption from 7 June until about 27 December 2014. Alerts appeared again, frequently but not daily, between 17 March and 13 October 2015, with a final alert pixel on 5 November 2015. MIROVA measured low to medium radiative power thermal anomalies from early June 2014 until late November 2015.
Information Contacts: Pusat Vulkanologi dan Mitigasi Bencana Geologi (PVMBG, also known as Indonesian Center for Volcanology and Geological Hazard Mitigation, CVGHM), Jalan Diponegoro 57, Bandung 40122, Indonesia (URL: http://www.vsi.esdm.go.id/); Darwin Volcanic Ash Advisory Centre (VAAC), Bureau of Meteorology, Northern Territory Regional Office, PO Box 40050, Casuarina, NT 0811, Australia (URL: http://www.bom.gov.au/info/vaac/); The Guardian News (URL: https://www.theguardian.com/world/2014/may/31/indonesian-volcanic-ash-cloud-halts-flights-in-and-out-of-darwin); MIROVA (Middle InfraRed Observation of Volcanic Activity), a collaborative project between the Universities of Turin and Florence (Italy) supported by the Centre for Volcanic Risk of the Italian Civil Protection Department (URL: http://www.mirovaweb.it/); Hawai'i Institute of Geophysics and Planetology (HIGP), MODVOLC Thermal Alerts System, School of Ocean and Earth Science and Technology (SOEST), Univ. of Hawai'i, 2525 Correa Road, Honolulu, HI 96822, USA (URL: http://modis.higp.hawaii.edu/, http://modis.higp.hawaii.edu/).
Weak Strombolian activity and occasional weak ash plumes, 15 July-12 August 2017
Strong explosions at Sangeang Api on 30-31 May 2014 generated ash plumes that rose as high as 15 km altitude, followed by less intense activity that produced ash plumes during the first half of June 2014 and 1 July-1 November 2015 (BGVN 41:10). No further activity was reported by the Pusat Vulkanologi dan Mitigasi Bencana Geologi (PVMBG) and Darwin Volcanic Ash Advisory Centre (VAAC) until June 2017.
The MIROVA (Middle InfraRed Observation of Volcanic Activity) system detected thermal anomalies in MODIS satellite data near the summit during the second week of January 2017, when four were recorded (figure 16). The number increased significantly beginning with the latter half of February. Another increase in the number and power of the anomalies took place at the beginning of June 2017 and continued into mid-August.
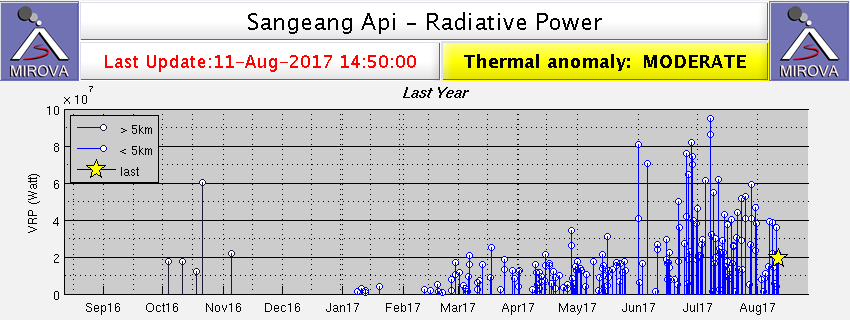 |
Figure 16. Thermal anomalies identified by the MIROVA system (radiative power) at Sangeang Api for the year ending 11 August 2017. Note that the anomaly lines in late 2016 are not on the island. Courtesy of MIROVA. |
Thermal anomalies identified using the MODVOLC algorithm were first recorded on 25 February 2017. Over the same time period as the MIROVA data, through 11 August, there were 105 thermal alerts. Cumulatively, the locations of the alert pixels define an area extending from the summit crater to about 2.5 km down the E flank (figure 17).
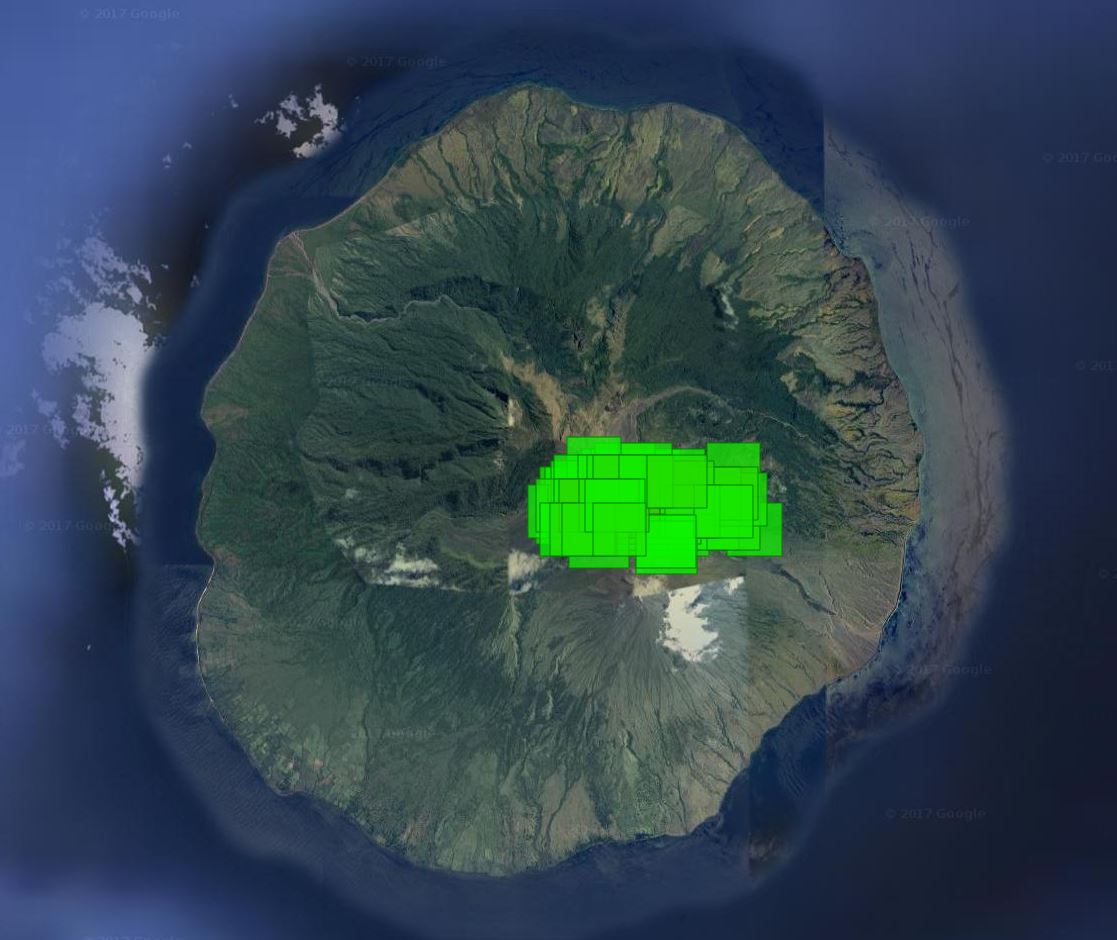 |
Figure 17. Thermal anomalies (alert pixels) identified by the MODVOLC system at Sangeang Api for 25 February-11 August 2017. The eastern-most pixels are at the summit area. Courtesy of HIGP - MODVOLC Thermal Alerts System. |
According to PVMBG, a small Strombolian eruption at 1154 on 15 July 2017 generated an ash plume that rose 100-200 m above the crater rim and drifted SW. Seismicity had increased starting in April. Based on analyses of satellite imagery, PVMBG observations, and wind data, the Darwin VAAC reported that on 16 July an ash plume rose to an altitude of 2.1 km, or 200 m above the crater rim, and drifted NW. The Darwin VAAC also reported ash plumes to altitudes of 2.4-4.3 km on 19-20 July, 29-30 July, 7-8 August, and 12 August 2017; in most cases they drifted NW.
Information Contacts: Pusat Vulkanologi dan Mitigasi Bencana Geologi (PVMBG, also known as Indonesian Center for Volcanology and Geological Hazard Mitigation, CVGHM), Jalan Diponegoro 57, Bandung 40122, Indonesia (URL: http://www.vsi.esdm.go.id/); Darwin Volcanic Ash Advisory Centre (VAAC), Bureau of Meteorology, Northern Territory Regional Office, PO Box 40050, Casuarina, NT 0811, Australia (URL: http://www.bom.gov.au/info/vaac/); Hawai'i Institute of Geophysics and Planetology (HIGP) - MODVOLC Thermal Alerts System, School of Ocean and Earth Science and Technology (SOEST), Univ. of Hawai'i, 2525 Correa Road, Honolulu, HI 96822, USA (URL: http://modis.higp.hawaii.edu/); MIROVA (Middle InfraRed Observation of Volcanic Activity), a collaborative project between the Universities of Turin and Florence (Italy) supported by the Centre for Volcanic Risk of the Italian Civil Protection Department (URL: http://www.mirovaweb.it/).
Ongoing crater activity and thermal anomalies during September 2017-October 2018
A significant increase in the number of thermal anomalies at Sangeang Api was recorded during February and June through mid-August 2017, along with a small Strombolian eruption in mid-July that generated an ash plume (BGVN 42:09). The high number of thermal anomalies continued through at least 20 October 2018. The current report summarizes activity between 1 September 2017 and 20 October 2018. The volcano is monitored by the Pusat Vulkanologi dan Mitigasi Bencana Geologi (PVMBG) and Darwin Volcanic Ash Advisory Centre (VAAC).
Based on a Volcano Observatory Notice for Aviation (VONA) from PVMBG, on 9 May 2018 a gas emission was observed at 1807 that rose to an altitude of 4,150 m and drifted W. Consequently, the Aviation Color Code was raised from unassigned to Yellow. Clear thermal satellite imagery the next day showed hot material traveling about 500 m SE out of the summit crater and continuing another 500 m down the E flank (figure 18).
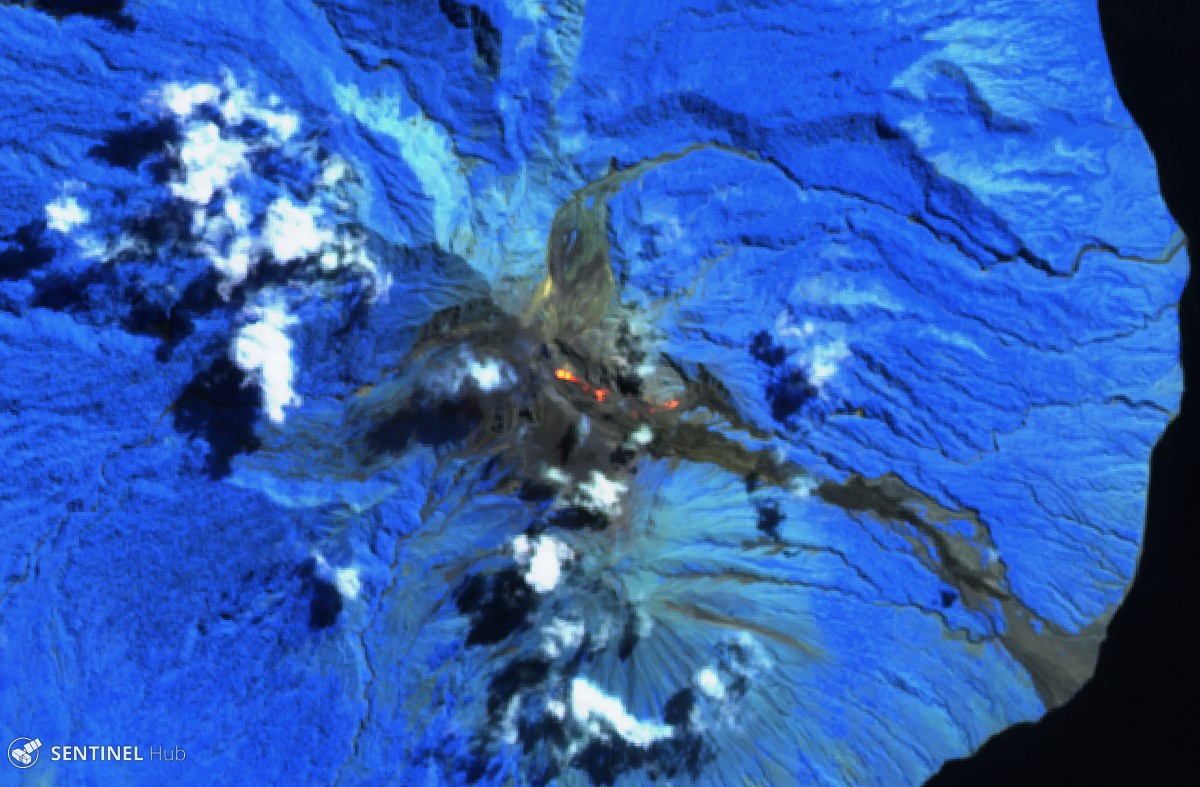 |
Figure 18. Sentinel-2 satellite image of Sangeang Api on 10 May 2018. This "Atmospheric penetration" view (bands 12, 11, and 8A) highlights hot material extending more than a kilometer from the vent in the summit crater to the SE and onto the E flank. Courtesy of Sentinel Hub. |
Based on another VONA from PVMBG, an ash emission at 1338 on 15 October 2018 rose 250 m above the summit and drifted SW, W, and NW. The VONA noted that the ash emission possibly rose higher than what a ground observer had estimated. Seismic data was dominated by signals indicating emissions as well as local tectonic earthquakes. The Aviation Color Code was raised from Yellow to Orange.
During the reporting period, MODIS satellite instruments using the MODVOLC algorithm recorded thermal anomalies between 3 and 12 days per month, many of which had multiple pixels. October 2017 had the greatest number of days with hotspots (12), while the lowest number was recorded during December 2017 through February 2018 (3-4 days per month). The vast majority of anomalies issued from the summit; a few were along the E flanks. The MIROVA (Middle InfraRed Observation of Volcanic Activity) volcano hotspot detection system, also based on analysis of MODIS data, recorded numerous hotspots during the previous 12 months through mid-October 2018, except for the second half of January 2018 (figure 19). Almost all recorded MIROVA anomalies were within 5 km of the volcano and of low to moderate radiative power.
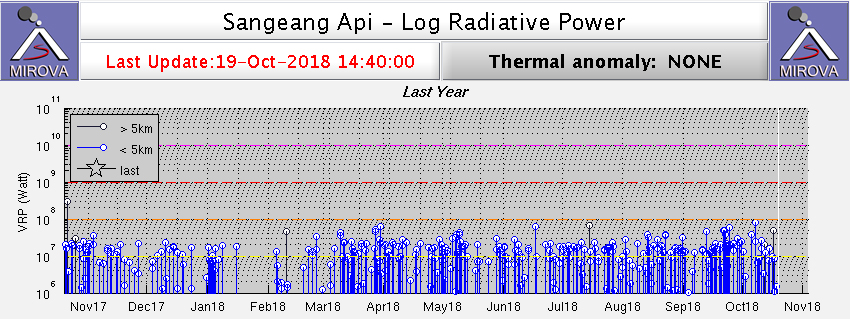 |
Figure 19. Thermal anomalies identified by the MIROVA system (Log Radiative Power) at Sangeang Api for the year ending 19 October 2018. Courtesy of MIROVA. |
Information Contacts: Pusat Vulkanologi dan Mitigasi Bencana Geologi (PVMBG, also known as Indonesian Center for Volcanology and Geological Hazard Mitigation, CVGHM), Jalan Diponegoro 57, Bandung 40122, Indonesia (URL: http://www.vsi.esdm.go.id/); Darwin Volcanic Ash Advisory Centre (VAAC), Bureau of Meteorology, Northern Territory Regional Office, PO Box 40050, Casuarina, NT 0811, Australia (URL: http://www.bom.gov.au/info/vaac/); Hawai'i Institute of Geophysics and Planetology (HIGP) - MODVOLC Thermal Alerts System, School of Ocean and Earth Science and Technology (SOEST), Univ. of Hawai'i, 2525 Correa Road, Honolulu, HI 96822, USA (URL: http://modis.higp.hawaii.edu/); MIROVA (Middle InfraRed Observation of Volcanic Activity), a collaborative project between the Universities of Turin and Florence (Italy) supported by the Centre for Volcanic Risk of the Italian Civil Protection Department (URL: http://www.mirovaweb.it/); Sentinel Hub Playground (URL: https://www.sentinel-hub.com/explore/sentinel-playground).
Ongoing frequent explosions with ash plumes, Strombolian activity, and block avalanches, November 2018-April 2019
Sangeang Api is a small 13-km-wide island volcano off the NE coast of Sumbawa Island, part of Indonesia's Lesser Sunda Islands. Intermittent historical eruptions have been recorded since 1512, most of them during in the 20th century. Ash plumes, Strombolian activity and pyroclastic and lava flows during 1985-1987 from the Doro Api summit crater were the first activity in 20 years and led to the evacuation of over 1,200 residents on the island. Explosive activity resumed for about two years during 1997-1999; no further activity was reported until increased seismicity and white emissions were noted in mid-2009. This activity was intermittent from 2009 through early 2014.
On 30 and 31 May 2014, Pusat Vulkanologi dan Mitigasi Bencana Geologi (PVMBG, or CVGHM) reported large explosions with ash plumes that rose to around 15 km altitude and pyroclastic flows down the flanks (BGVN 39:03, 41:10). The massive ash plume drifted SE, closing airports as far away as Darwin, Australia. The ashfall caused airline disruption and evacuation of thousands in villages on nearby Sumbawa Island. Strong thermal anomalies appeared after the explosions and lasted for the rest of 2014, indicative of flow activity down the E flank; mostly steam plumes, with occasional ash emissions were reported during 2015. Renewed thermal activity appeared in satellite data in mid-January 2017. The thermal signature increased through July 2017 when Strombolian activity and ash emissions were reported (BGVN 42:09). A high level of thermal activity continued through October 2018, with satellite imagery confirming incandescent activity on the E flank, and PVMBG reporting ash emissions that rose a few kilometers above the summit (BGVN 43:11).
During October 2018-April 2019, covered in this report, elevated thermal activity was recorded with satellite data and imagery, and visitors to the island recorded ash plumes, Strombolian activity, lava bombs, and a blocky avalanche flow down the E flank from the pyroclastic cone inside Doro Api cone. Information comes from satellite thermal data and imagery, and reports from visitors to the island. Indonesia's Pusat Vulkanologi dan Mitigasi Bencana Geologi (PVMBG) listed Sangeang Api at Alert Level II for the period. There were no reports from the Darwin VAAC.
Thermal activity became more intermittent during December 2018-March 2019 compared with the previous six months, and then increased again in April according to the MIROVA project thermal data (figure 20). The MODVOLC thermal alerts showed a similar pattern, with a decrease in the number of monthly alerts during December through March. In spite of this, a strong thermal signal was still apparent near the summit throughout the period (figure 21). Sentinel-2 satellite images confirmed the presence of hot material at the summit and down the E-flank ravine throughout the period (figure 22).
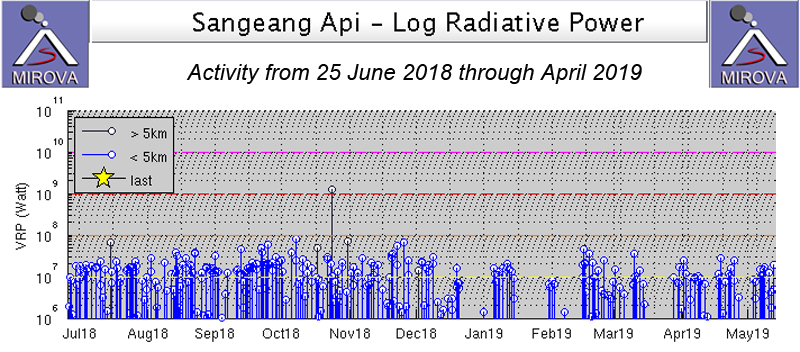 |
Figure 20. Thermal activity at Sangeang Api persisted during November 2018-April 2019. Activity was more intermittent from December 2018 through March 2019 but increased again in frequency and intensity in April 2019. Courtesy of MIROVA. |
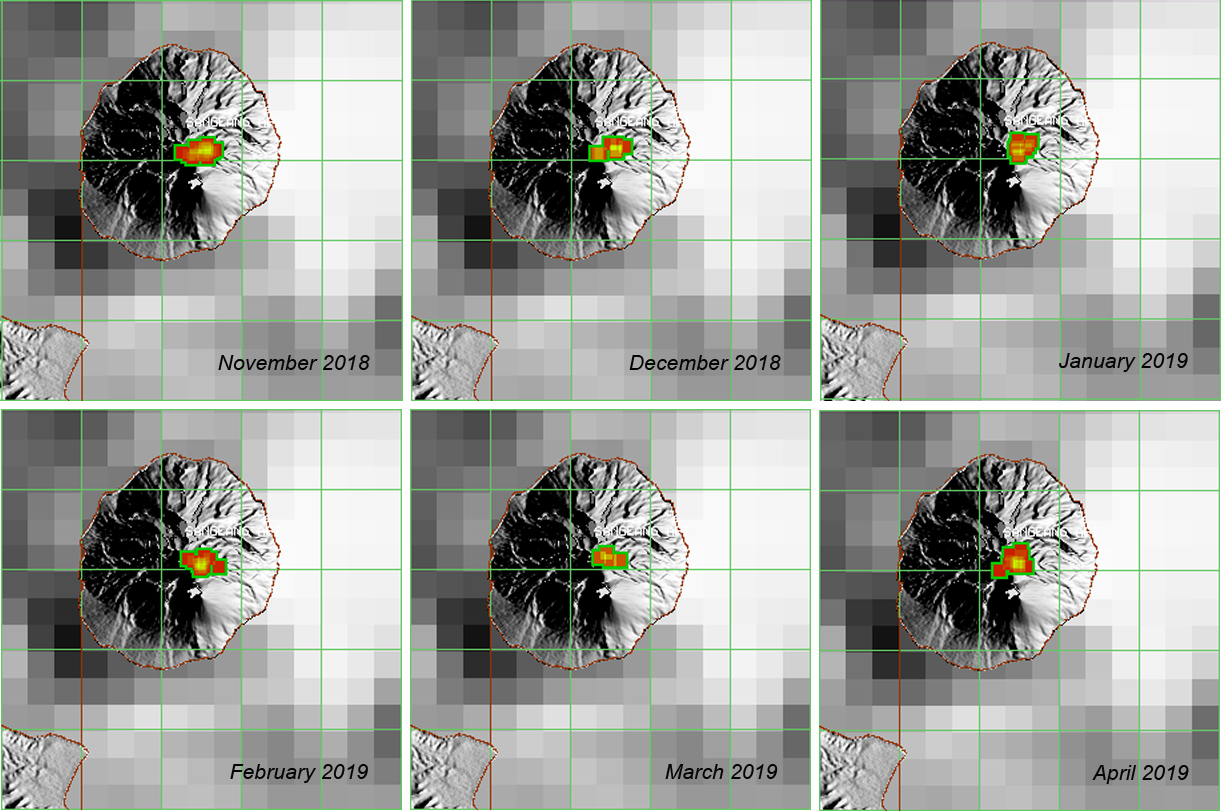 |
Figure 21. MODVOLC thermal alert images of Sangeang Api for each month from November 2018-April 2019 indicated persistent thermal activity each month, concentrated at the summit and on the upper part of the E flank. Courtesy of Hawai'i Institute of Geophysics and Planetology (HIGP) - MODVOLC Thermal Alerts System. |
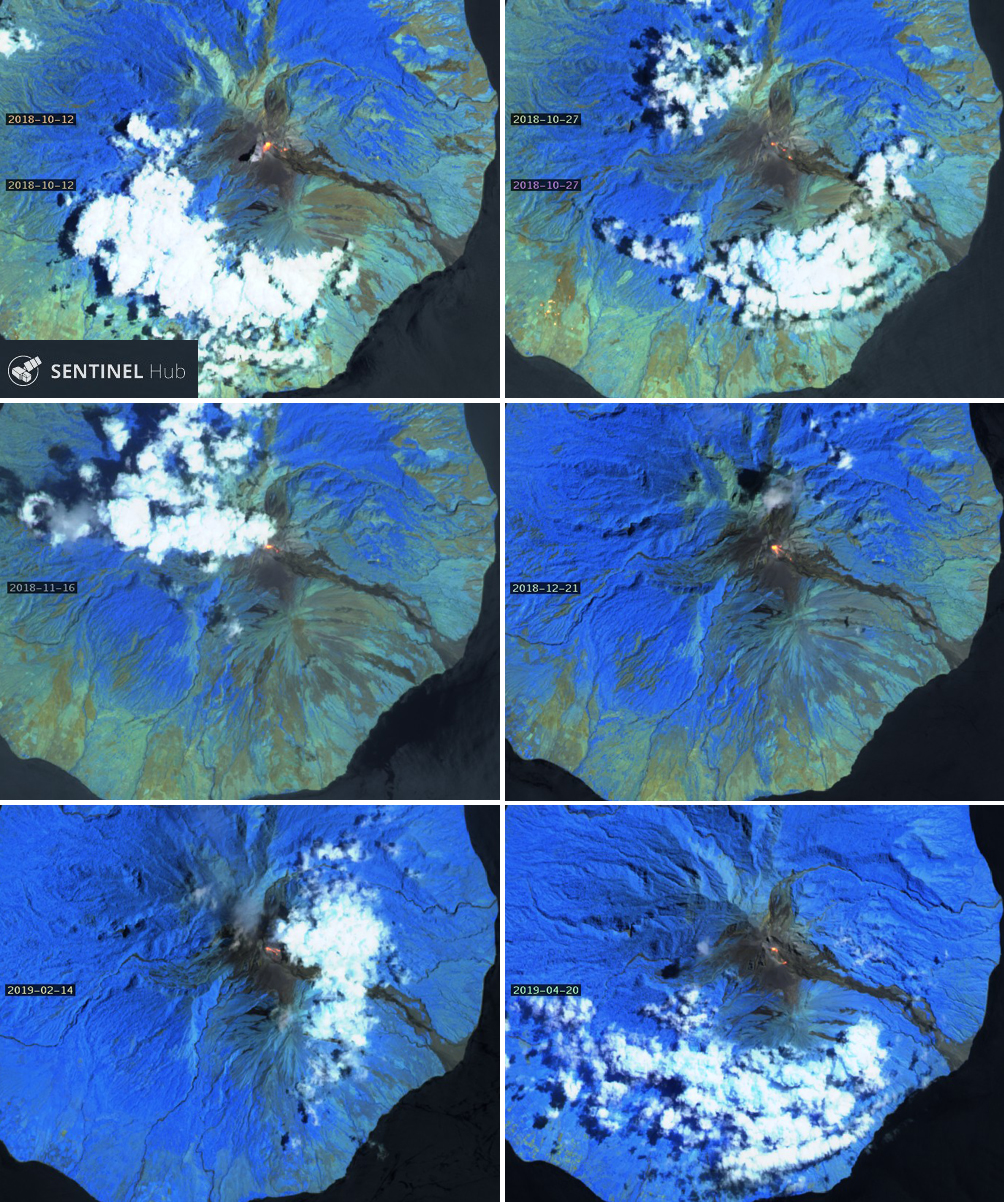 |
Figure 22. Sentinel-2 satellite infrared images confirmed thermal activity at the summit crater and down the ravine on the E flank of Sangeang Api during October 2018 through April 2019. The activity migrated and varied in intensity, indicative of ongoing activity throughout the period. Top left: 12 October 2018. Top right: 27 October 2018. Middle left: 16 November 2018. Middle right: 21 December 2018. Bottom left: 14 February 2019. Bottom Right: 20 April 2019. Courtesy of Sentinel Hub Playground ('Atmospheric Penetration' rendering with bands 12, 11, and 8A). |
A Google Earth image dated 7 October 2018 shows dark lava in the drainage on the SE flank extending to within 1 km of the shoreline (figure 23). A visit to Sangeang Api by photographer Martin Rietze during 25 September-3 October 2018 provided excellent ground and drone-based photographic and video documentation of the eruptive activity at that time (see information contacts for link to video footage). Regular small ash emissions were recorded multiple times per day from a pyroclastic cone inside the Doro Api cone (figure 24); the explosions produced volcanic bombs that traveled hundreds of meters down the flanks of Doro Api (figure 25) as well as sending lava fragments down all sides of the pyroclastic cone (figures 26 and 27). Steam and ash rose a few hundred meters above the summit of the pyroclastic cone and was incandescent after dark (figures 28 and 29).
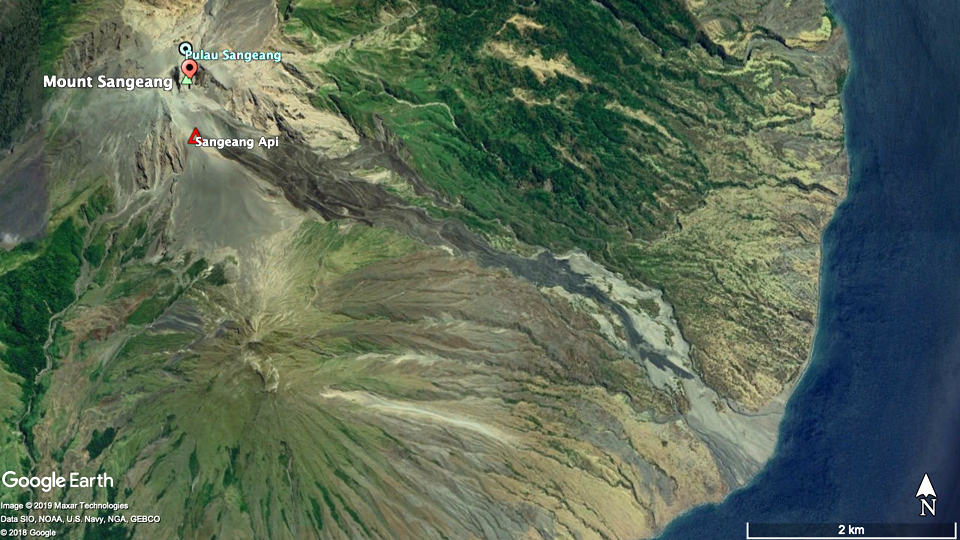 |
Figure 23. A Google Earth image of the SE flank of Sangeang Api taken on 7 October 2018 shows dark channels of lava descending the ravine to within about 1 km of the shore. Data from SIO, NOAA, U.S. Navy, NGA, GEBCO, Copyright 2018, Google, 2019 Maxar Technologies. Courtesy of Google Earth. |
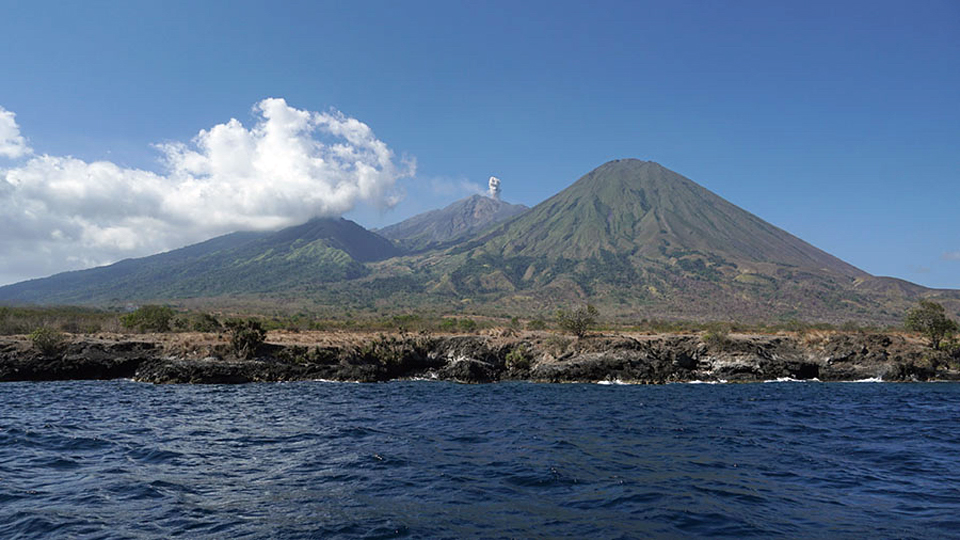 |
Figure 24. A view from the SW of Sangeang Api island with the two cones of the volcano taken during a 25 September-3 October 2018 expedition. In the foreground is inactive Doro Mantai and, in the background, a small ash plume rises from the active Doro Api cone. Copyrighted photo by Martin Rietze (used with permission). |
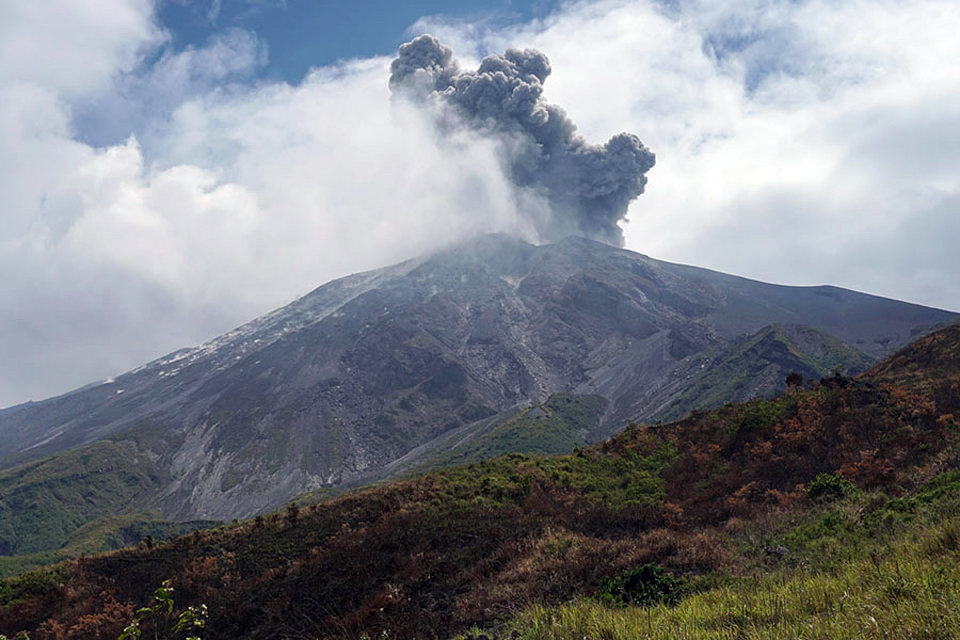 |
Figure 25. Explosions with ash plumes sent ejecta hundreds of meters down the W flank of Doro Api (left), the active cone at Sangeang Api, photographed during a 25 September-3 October 2018 expedition. Copyrighted photo by Martin Rietze (used with permission). |
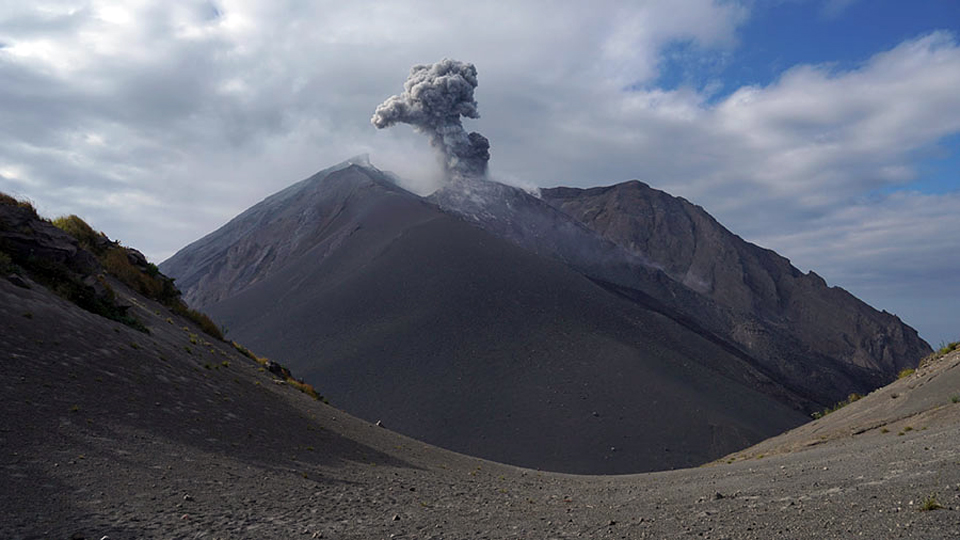 |
Figure 26. A large pyroclastic cone fills the summit crater of Doro Api cone on Sangeang Api, photographed during a 25 September-3 October 2018 expedition. Copyrighted photo by Martin Rietze (used with permission). |
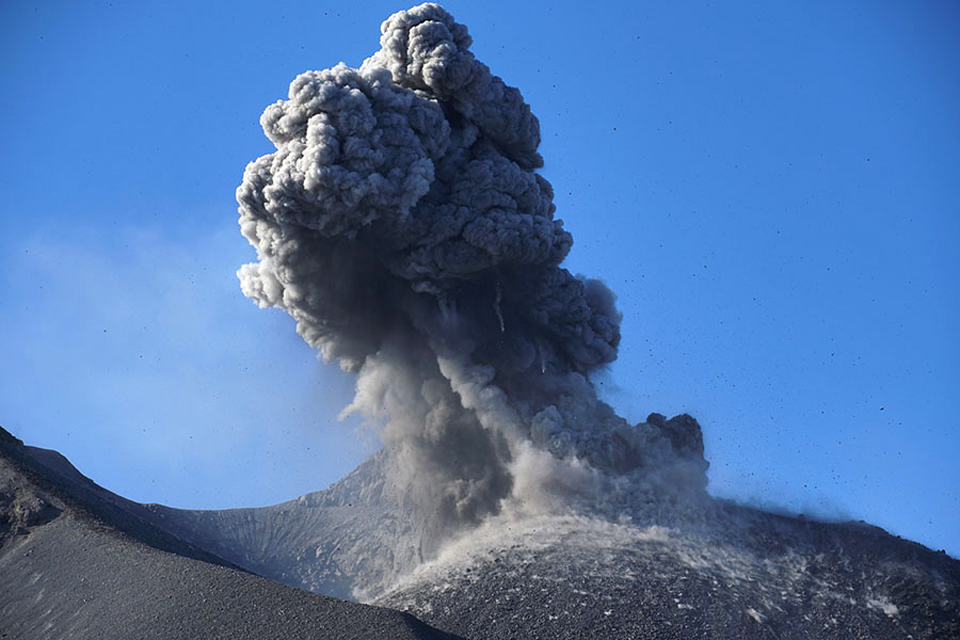 |
Figure 27. Ash explosions sent plumes to a few hundred meters above the summit of Sangeang Api's Doro Api cone, and large bombs and tephra fell around the flanks of the cone. Photographed during a 25 September-3 October 2018 expedition. Copyrighted photo by Martin Rietze (used with permission). |
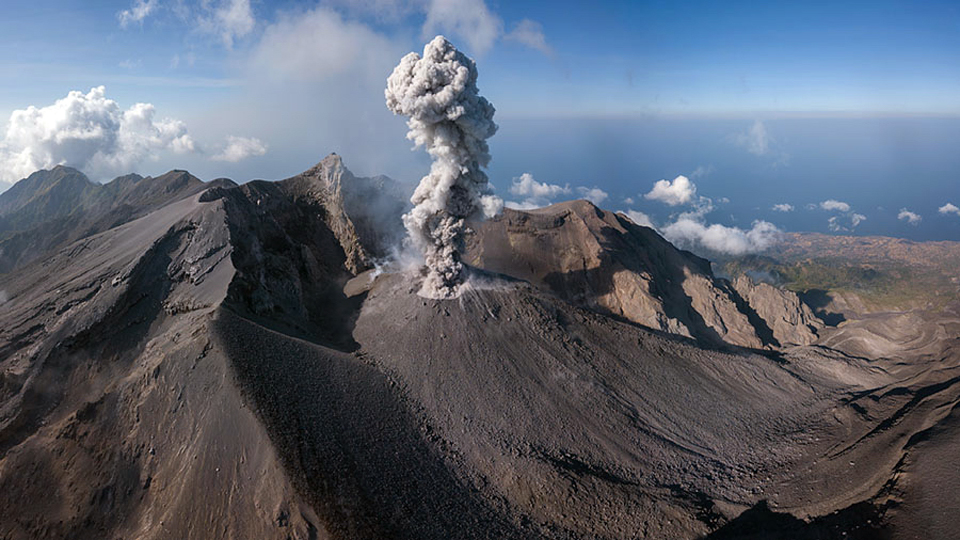 |
Figure 28. Ash and steam rose from the pyroclastic cone inside Doro Api, the active cone at Sangeang Api. Photographed during a 25 September-3 October 2018 expedition. Avalanche blocks form channels of lava in the ravine on the E flank (right). View is from the SW, taken by drone. Copyrighted photo by Martin Rietze (used with permission). |
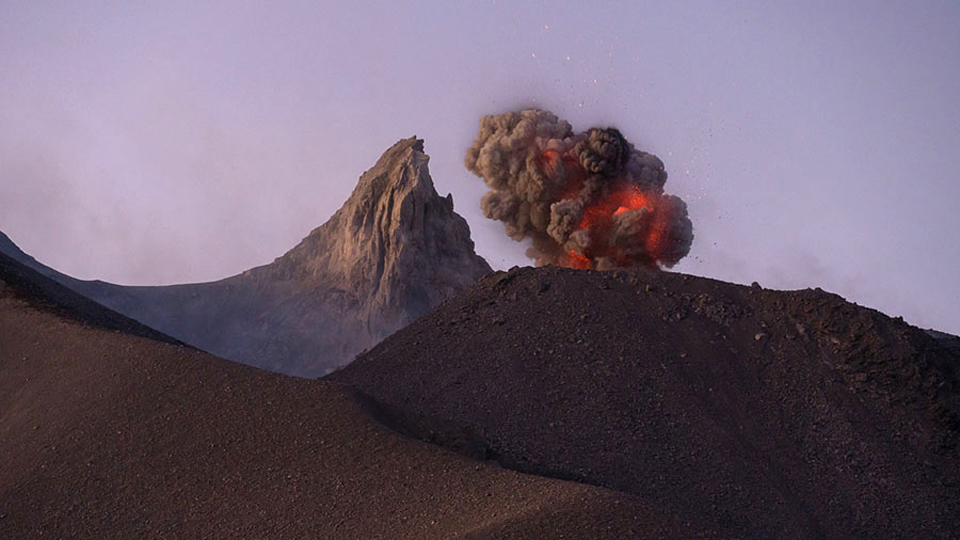 |
Figure 29. Incandescence in the ash plumes rising from the pyroclastic cone inside the Doro Api crater was visible at dusk at Sangeang Api when photographed during a 25 September-3 October 2018 expedition. Copyrighted photo by Martin Rietze (used with permission). |
Incandescent bombs and blocks from Strombolian activity cascaded down the flanks of the pyroclastic cone and also reached outside of the Doro Api crater, landing on the W flank (figures 30 and 31). Steaming tephra on the flanks of the pyroclastic cone was visible during daylight hours (figure 32); the active Doro Api cone is near the center of the island, the inactive Doro Mantai is on the SE flank. In a nighttime view of Doro Api as seen from the summit of Doro Mantai, the incandescent ejecta is clearly visible hundreds of meters from the erupting pyroclastic cone (figure 33). Video footage showed incandescent lava emerging from a fissure near the base of the pyroclastic cone, and a blocky avalanche on the E flank of the cone; as blocks rolled down the slope, incandescence was visible just below the surface.
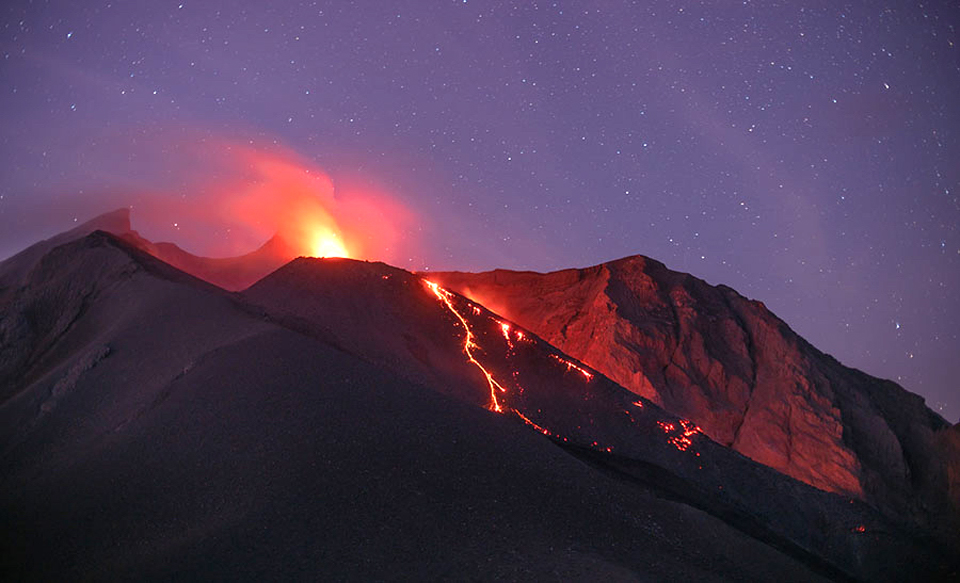 |
Figure 30. Incandescent blocks and bombs were visible at night descending the flank of the pyroclastic cone inside the crater of the Doro Api cone at Sangeang Api when photographed during a 25 September-3 October 2018 expedition. Copyrighted photo by Martin Rietze (used with permission). |
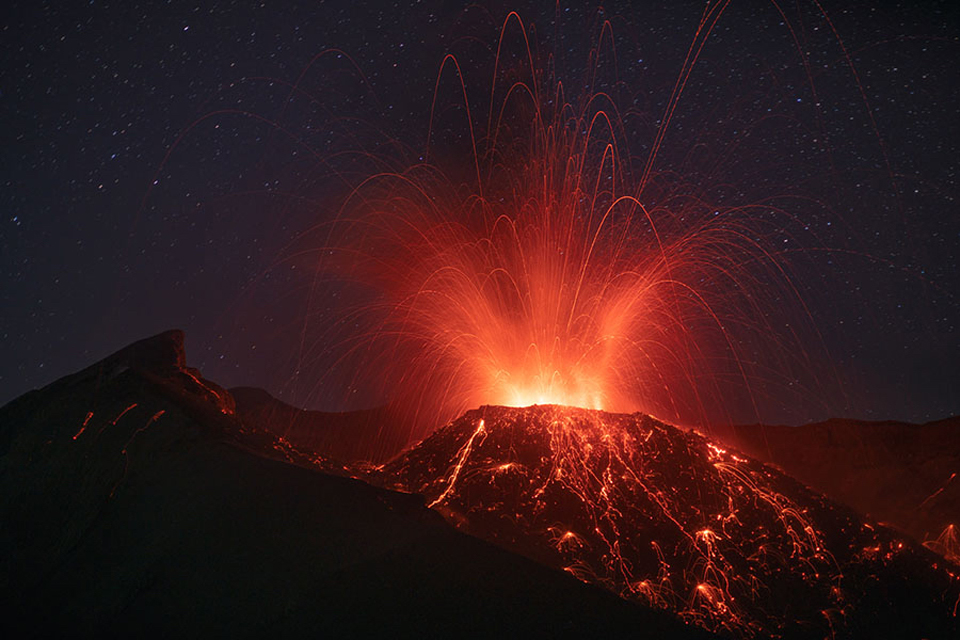 |
Figure 31. Strombolian activity lit up the night sky and scattered bombs around the flanks of the pyroclastic cone inside of the Doro Api cone at Sangeang Api when photographed during a 25 September-3 October 2018 expedition. Fragments also landed on the outer flank of Doro Api (left). Copyrighted photo by Martin Rietze (used with permission). |
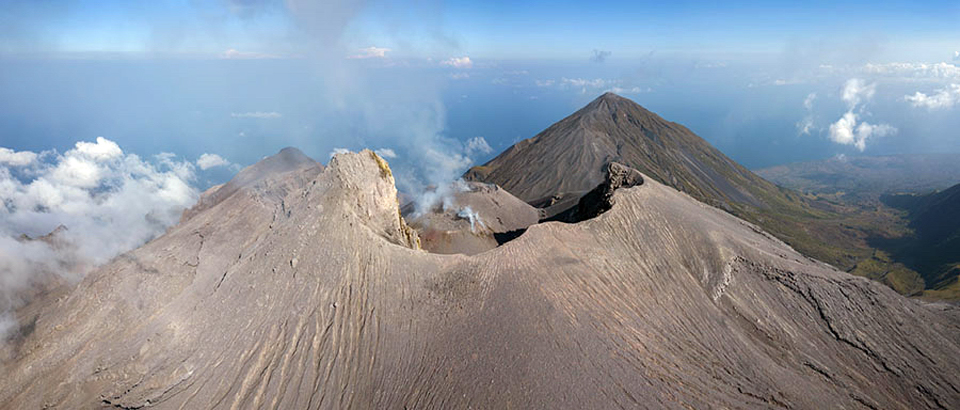 |
Figure 32. Steaming tephra surrounded the flanks of the pyroclastic cone inside the Doro Api cone on Sangeang Api when photographed during a 25 September-3 October 2018 expedition. The view, taken by drone, is from the NW, and the quiet Doro Mantai peak lies SE of the active cone closer to the coast. Copyrighted photo by Martin Rietze (used with permission). |
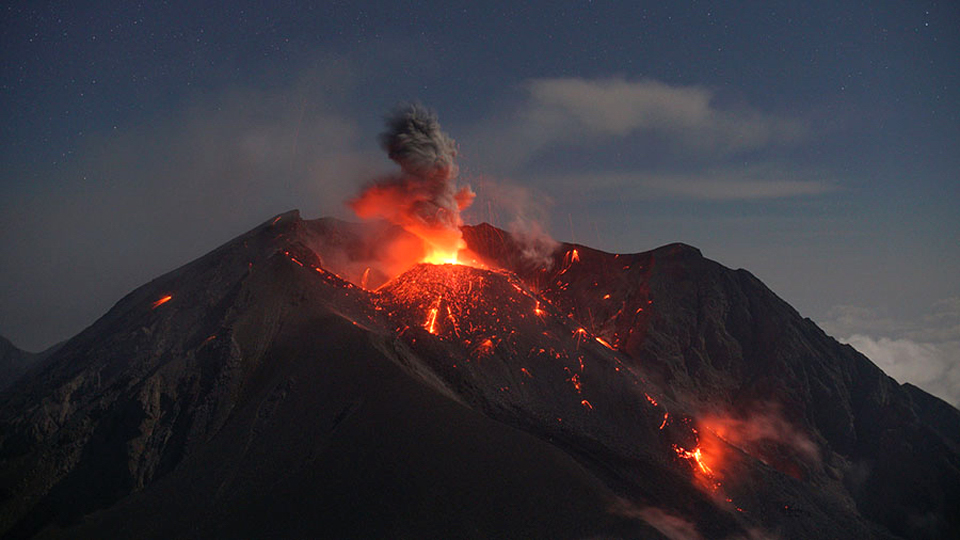 |
Figure 33. This nighttime view of Doro Api cone on Sangeang Api was taken from the summit of adjacent Doro Mantai to the SE during a 25 September-3 October 2018 expedition. Ash rose from the vent at the top of the pyroclastic cone, and incandescent ejecta descended the flanks of the pyroclastic cone, covered the inner walls of the Doro Api summit crater, and also fell outside of the crater onto the W flank of Doro Api (left). In addition, lava emerged from a fissure near the base of the cone (lower right). Copyrighted photo by Martin Rietze (used with permission). |
Blocks of lava formed an avalanche down the ravine on the E flank of Doro Api; the avalanche formed channels tens of meters wide on the steep slope (figure 34) when photographed by drone in early October 2018. The PVMBG webcam located on nearby Sumbawa island about 10 km SW captured an image of a small ash emission rising from the Doro Api summit in late October (figure 35). Visitors to the island in November recorded continued activity in the form of ash plumes and incandescent lava emerging from a fissure on the flank of the pyroclastic cone (figure 36).
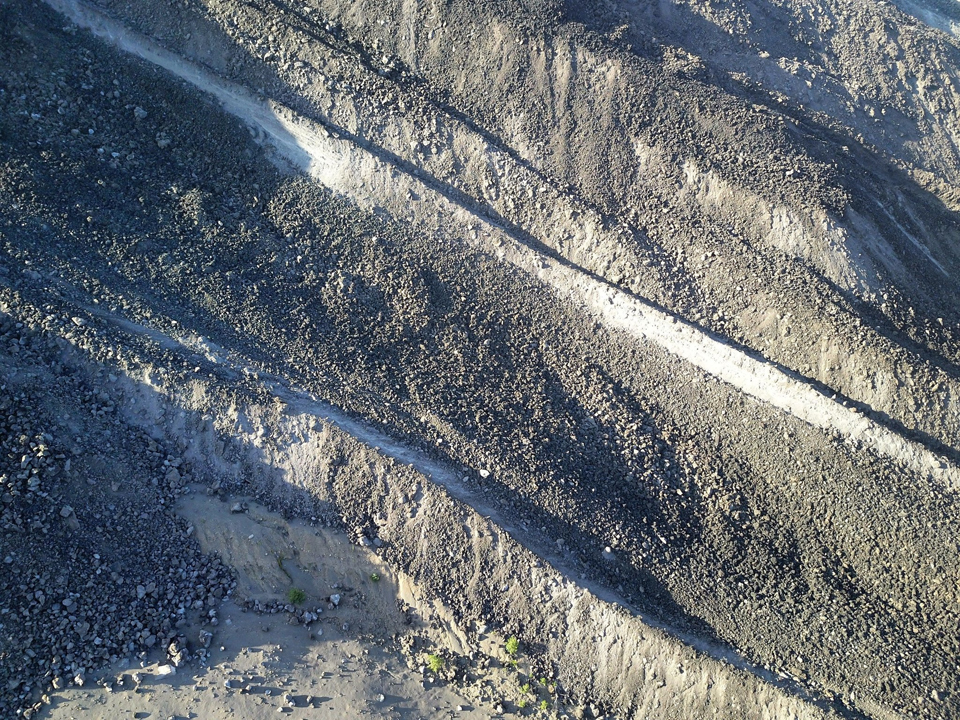 |
Figure 34. Fresh blocky lava on the E flank of Doro Api on Sangeang Api was visible in drone images taken by visitors in early October 2019. Bushes in bottom center of the image suggest that the channels of lava blocks are tens of meters across. Courtesy of Doro Adventures. |
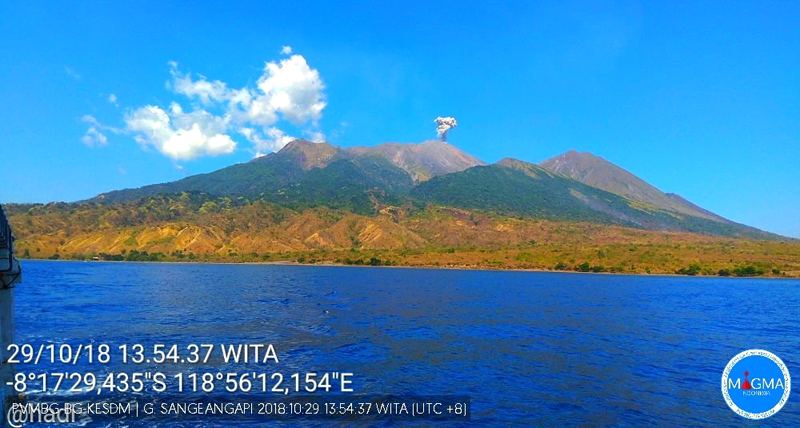 |
Figure 35. The PVMBG webcam located about 10 km SW on nearby Sumbawa island captured an ash emission from the Doro Api cone at Sangeang Api on 29 October 2018. Courtesy of PVMBG and Øystein Lund Andersen. |
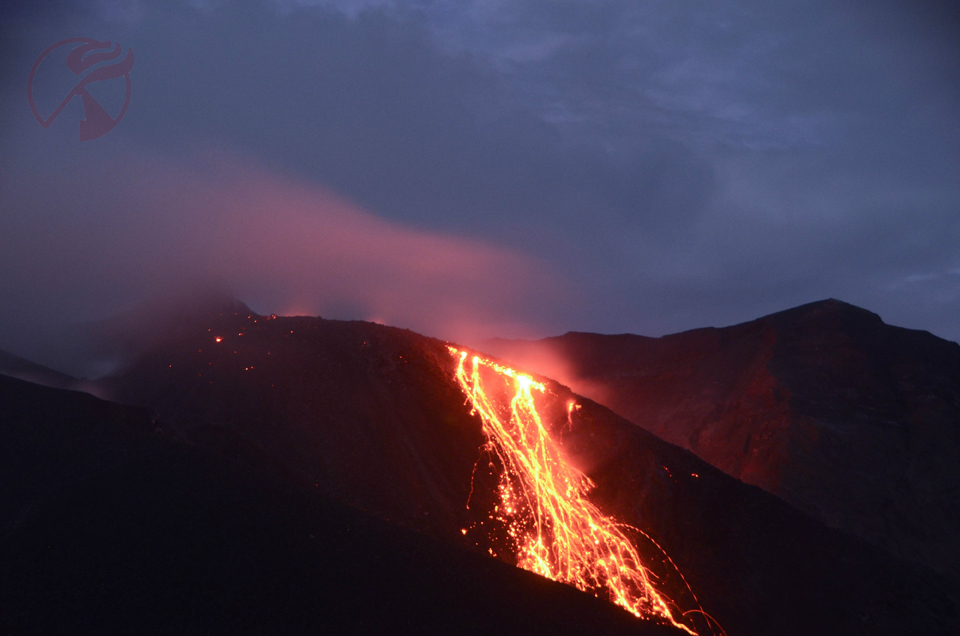 |
Figure 36. Visitors to Sangeang Api in November 2018 witnessed incandescent bombs and lava emerging from a fissure on the flank of the pyroclastic cone inside Doro Api crater. Courtesy of 80 Jours Voyages. |
Information Contacts: Pusat Vulkanologi dan Mitigasi Bencana Geologi (PVMBG, also known as Indonesian Center for Volcanology and Geological Hazard Mitigation, CVGHM), Jalan Diponegoro 57, Bandung 40122, Indonesia (URL: http://www.vsi.esdm.go.id/); MAGMA Indonesia, Kementerian Energi dan Sumber Daya Mineral (URL: https://magma.vsi.esdm.go.id/); MIROVA (Middle InfraRed Observation of Volcanic Activity), a collaborative project between the Universities of Turin and Florence (Italy) supported by the Centre for Volcanic Risk of the Italian Civil Protection Department (URL: http://www.mirovaweb.it/); Hawai'i Institute of Geophysics and Planetology (HIGP) - MODVOLC Thermal Alerts System, School of Ocean and Earth Science and Technology (SOEST), Univ. of Hawai'i, 2525 Correa Road, Honolulu, HI 96822, USA (URL: http://modis.higp.hawaii.edu/); Google Earth (URL: https://www.google.com/earth/); Sentinel Hub Playground (URL: https://www.sentinel-hub.com/explore/sentinel-playground); Martin Rietze, Taubenstr. 1, D-82223 Eichenau, Germany (URL: https://mrietze.com/, Videos at https://www.youtube.com/channel/UC5LzAA_nyNWEUfpcUFOCpJw/videos); Øystein Lund Andersen (Twitter: @OysteinLAnderse, https://twitter.com/OysteinLAnderse, URL: http://www.oysteinlundandersen.com); 80 Jours Voyages, Lyon, France (Twitter: https://twitter.com/jours_80, URL: https://80joursvoyages.com/); Doro Adventures (Twitter: https://twitter.com/DoroAdventures, URL: http://doroadventures.com/).
Ash emissions and lava flow extrusion continue during May 2019 through January 2020
Sangeang Api is located in the eastern Sunda-Banda Arc in Indonesia, forming a small island in the Flores Strait, north of the eastern side of West Nusa Tenggara. It has been frequently active in recent times with documented eruptions spanning back to 1512. The edifice has two peaks – the active Doro Api cone and the inactive Doro Mantori within an older caldera (figure 37). The current activity is focused at the summit of the cone within a horseshoe-shaped crater at the summit of Doro Api. This bulletin summarizes activity during May 2019 through January 2020 and is based on Darwin Volcanic Ash Advisory Center (VAAC) reports, Pusat Vulkanologi dan Mitigasi Bencana Geologi (PVMBG, or CVGHM) MAGMA Indonesia Volcano Observatory Notice for Aviation (VONA) reports, and various satellite data.
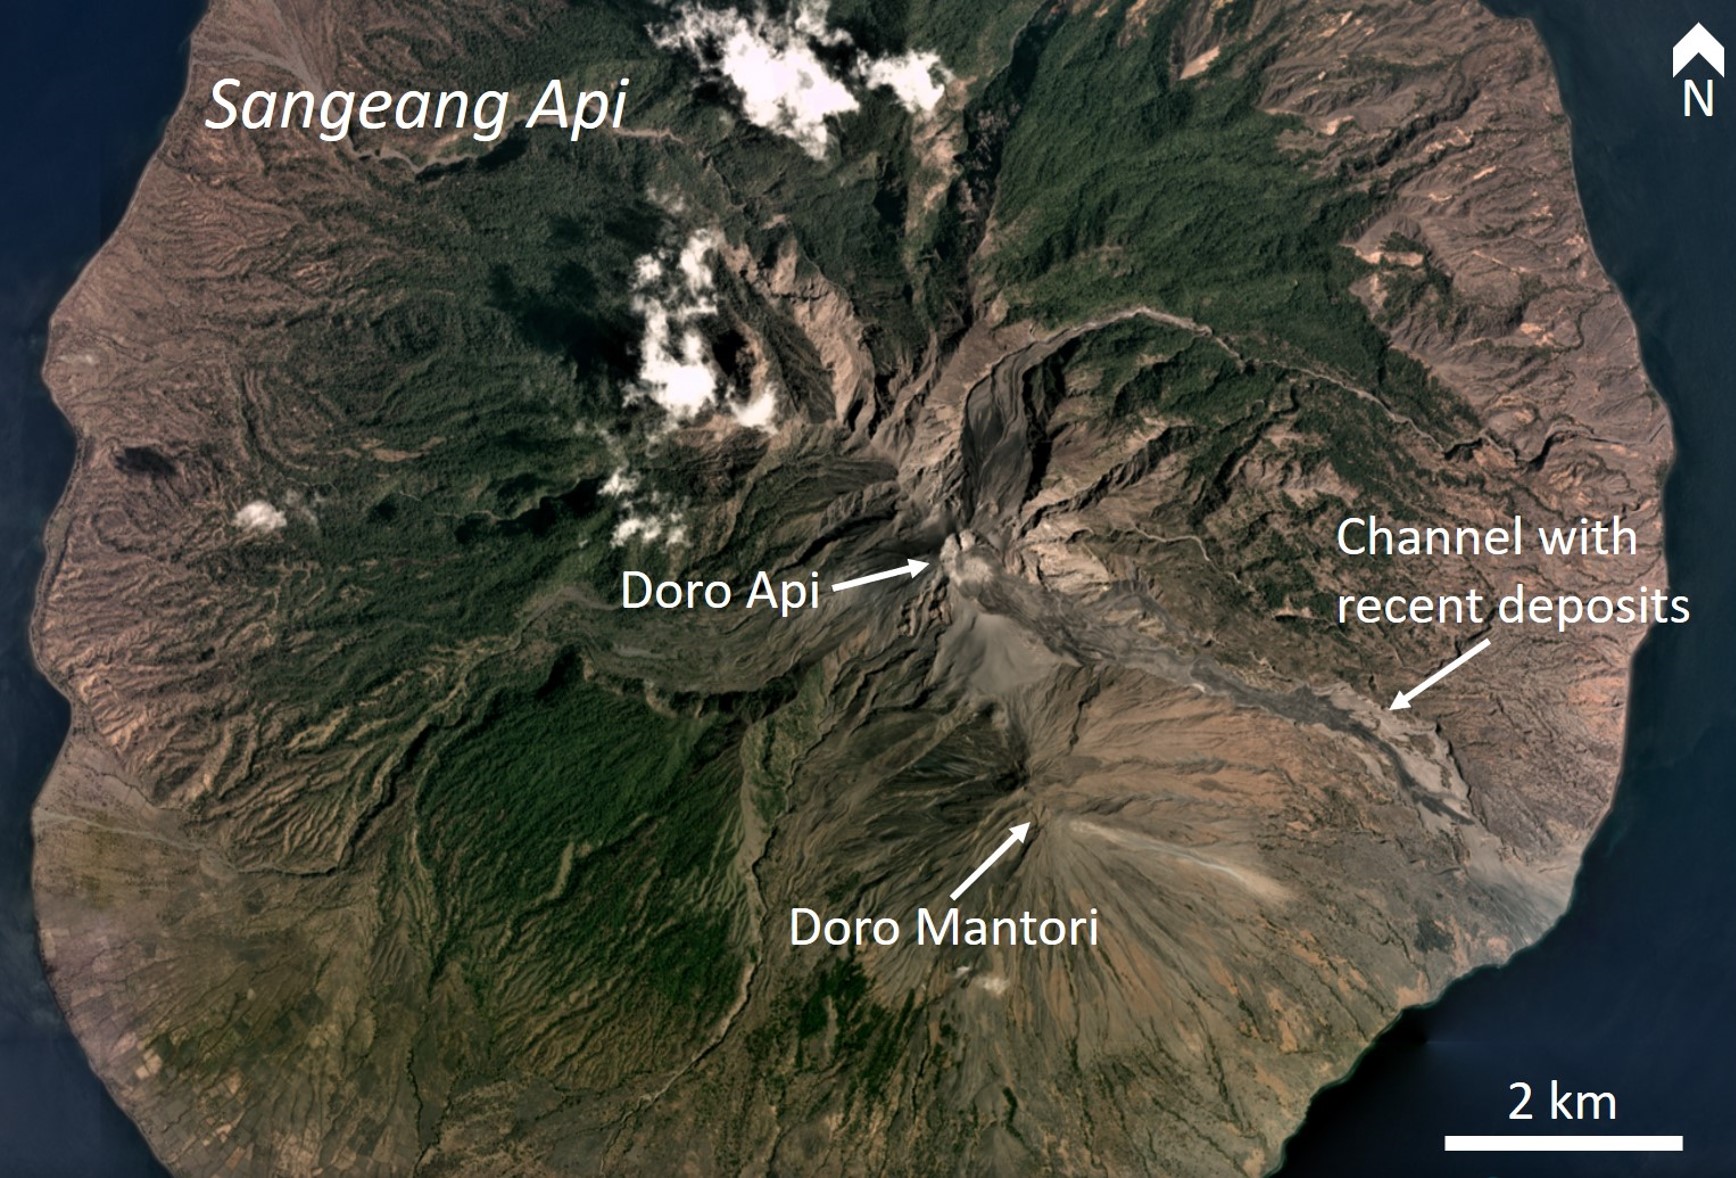 |
Figure 37. A PlanetScope satellite image of Sangeang Api with the active Doro Api and the inactive Doro Mantori cones indicated, and the channel SE of the active area that contains recent lava flows and other deposits. December 2019 monthly mosaic copyright of Planet Labs 2019. |
Thermal anomalies were visible in Sentinel-2 satellite thermal images on 4 and 5 May with some ash and gas emission visible; bright pixels from the summit of the active cone extended to the SE towards the end of the month, indicating an active lava flow (figure 38). Multiple small emissions with increasing ash content reached 1.2-2.1 km altitude on 17 June. The emissions drifted W and WNW, and a thermal anomaly was also visible. On the 27th ash plumes rose to 2.1 km and drifted NW and the thermal anomaly persisted. One ash plume reached 2.4 km and drifted NW on the 29th, and steam emissions were ongoing. Satellite images showed two active lava flows in June, an upper and a lower flow, with several lobes descending the same channel and with lateral levees visible in satellite imagery (figure 39). The lava extrusion appeared to have ceased by late June with lower temperatures detected in Sentinel-2 thermal data.
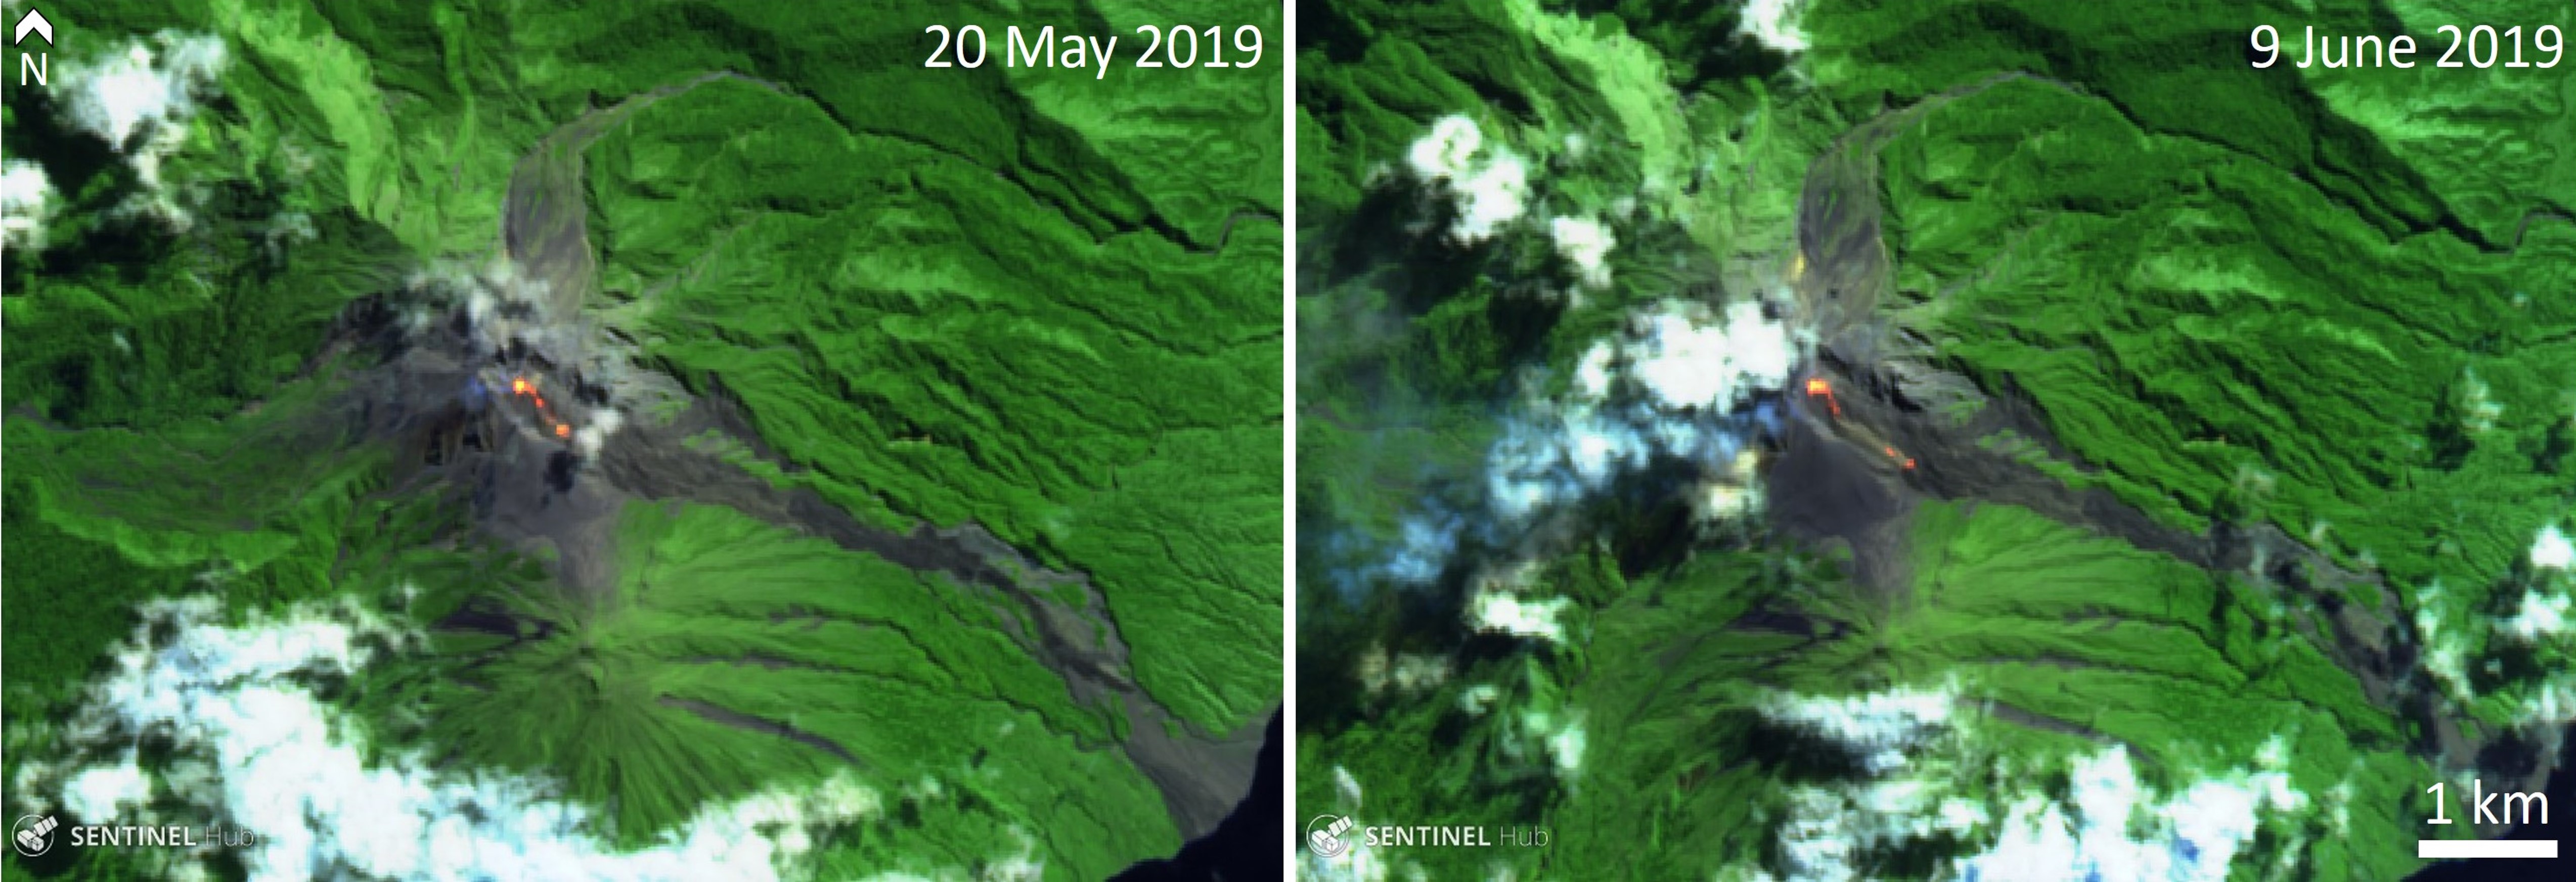 |
Figure 38. Sentinel-2 satellite thermal images of Sangeang Api on 20 May and 9 June 2019 show an active lava flow from the summit, traveling to the SE. False color (urban) image (bands 12, 11, 4) courtesy of Sentinel Hub Playground. |
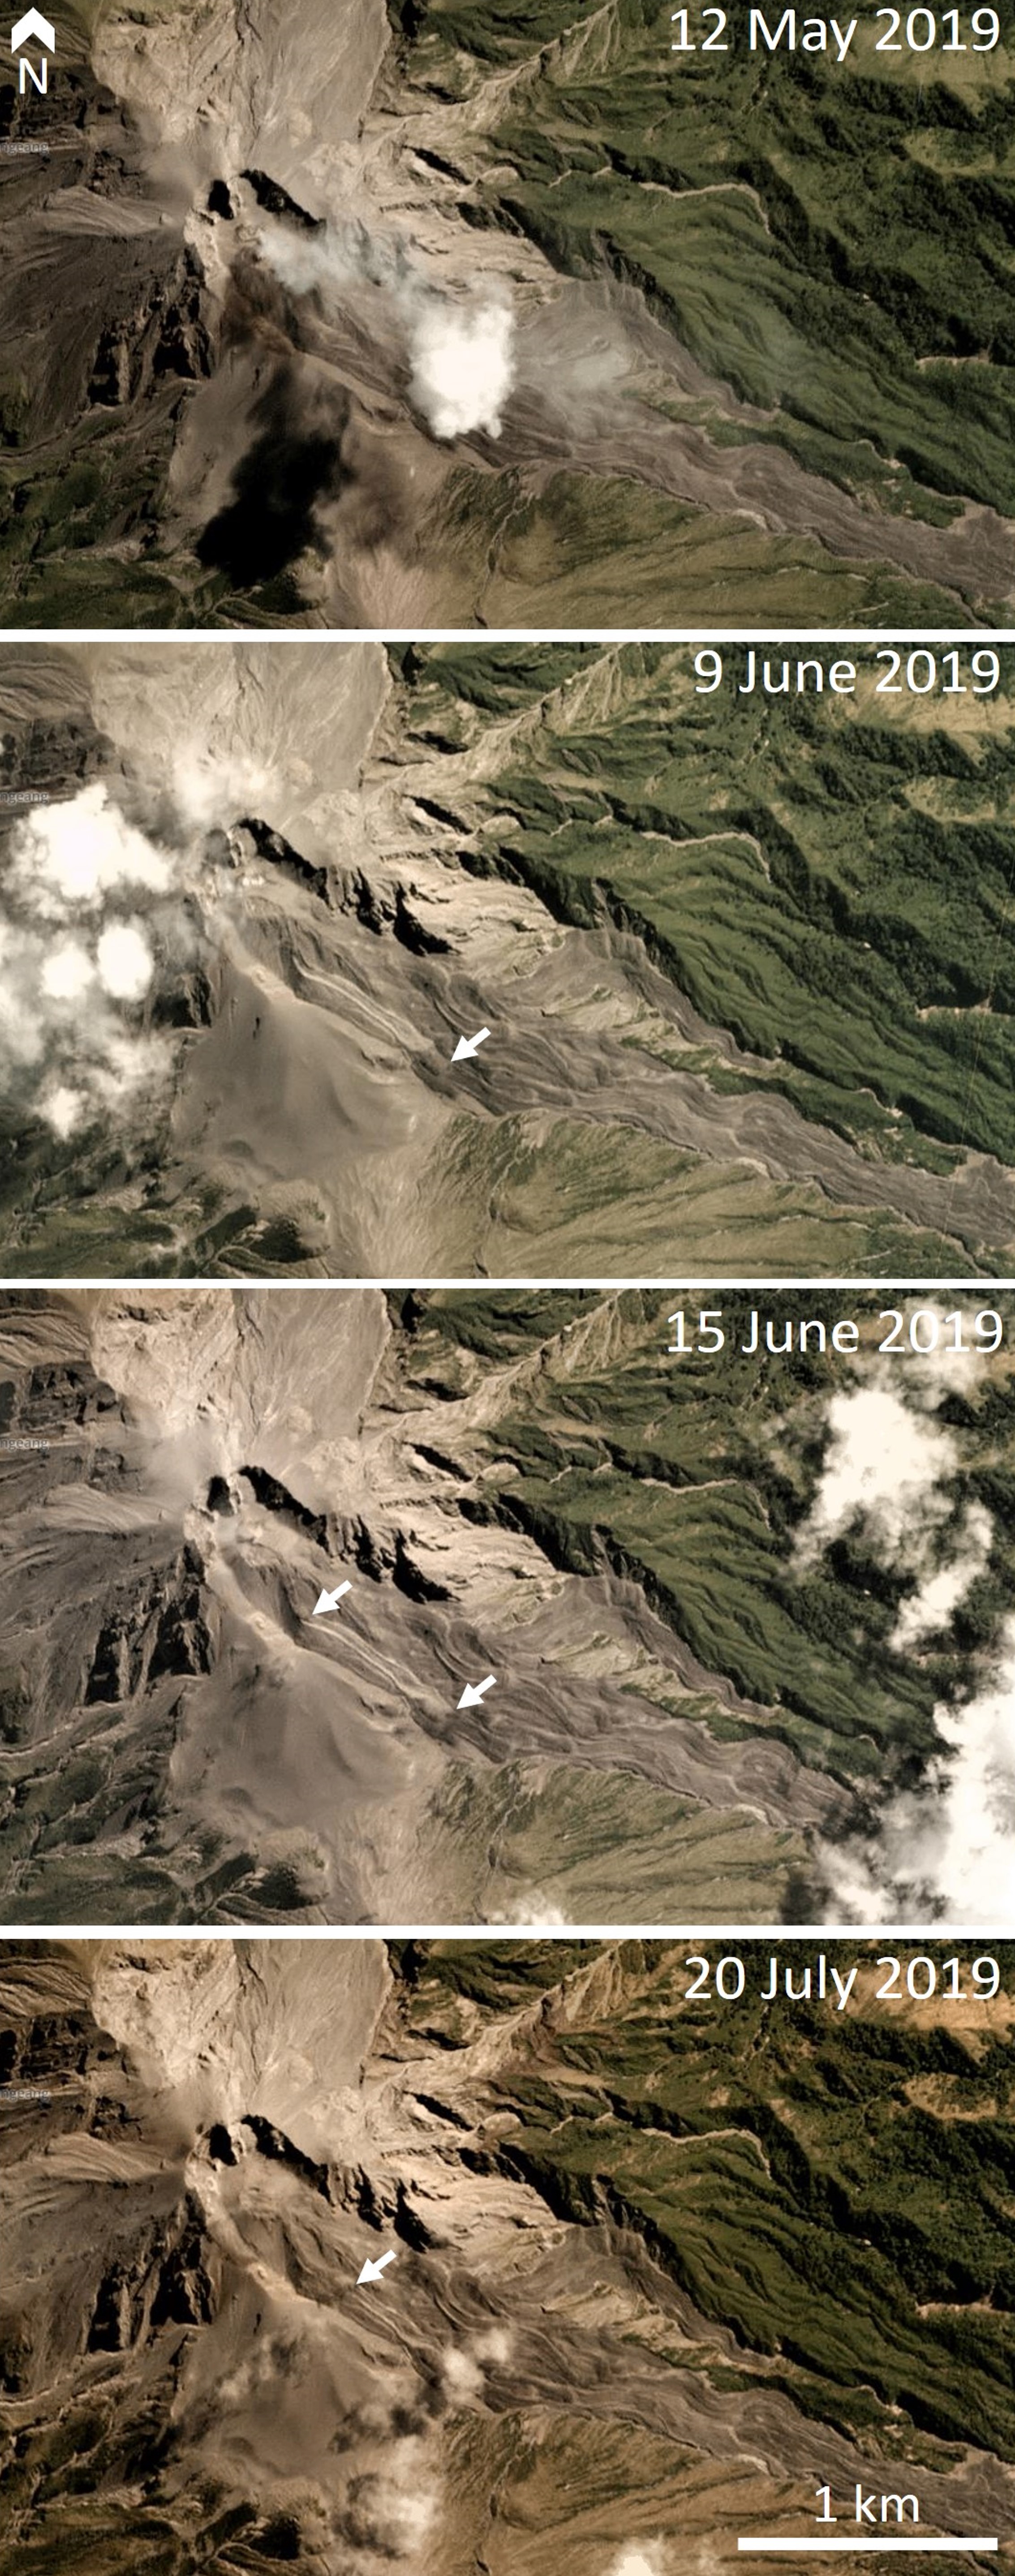 |
Figure 39. PlanetScope satellite images of Sangeang Api show new lava flows during June and July, with white arrows indicating the flow fronts. Copyright Planet Labs 2019. |
During 4-5 July the Darwin VAAC reported ash plumes reaching 2.1-2.3 km altitude and drifting SW and W. Activity continued during 6-9 July with plumes up to 4.6 km drifting N, NW, and SW. Thermal anomalies were noted on the 4th and 8th. Plumes rose to 2.1-3 km during 10-16th, and to a maximum altitude of 4.6 km during 17-18 and 20-22. Similar activity was reported during 24-30 July with plumes reaching 2.4-3 km and dispersing NW, W, and SW. The upper lava flow had increased in length since 15 June (see figure 39).
During 31 July through 3 September ash plumes continued to reach 2.4-3 km altitude and disperse in multiple directions. Similar activity was reported throughout September. Thermal anomalies also persisted through July-September, with evidence of hot avalanches in Sentinel-2 thermal satellite imagery on 23 August, and 9, 12, 22, and 27 September. Thermal anomalies suggested hot avalanches or lava flows during October (figure 40). During 26-28 October short-lived ash plumes were reported to 2.1-2.7 km above sea level and dissipated to the NW, WNW, and W. Short-lived explosions produced ash plumes up to 2.7-3.5 km altitude were noted during 30-31 October and 3-4 November 2019.
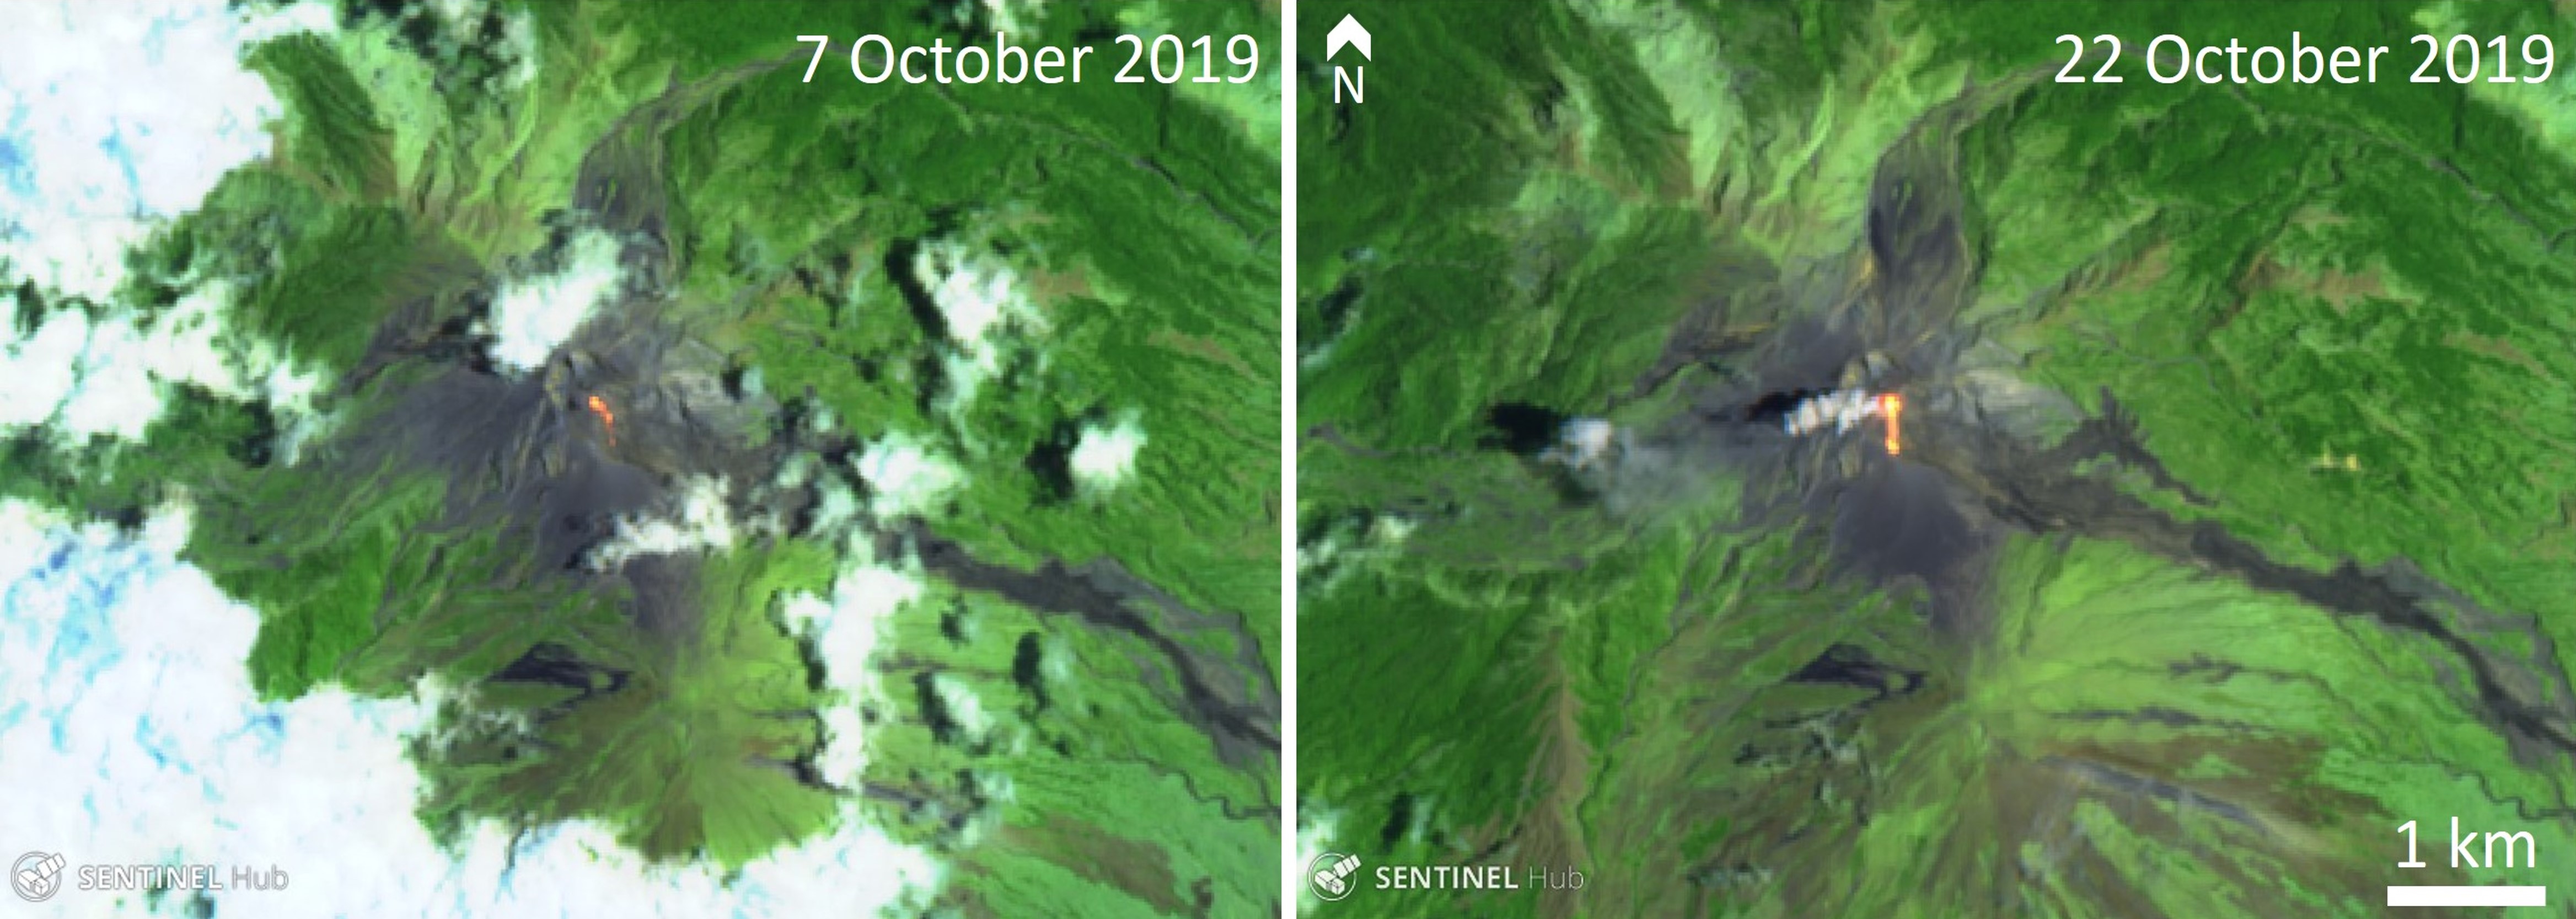 |
Figure 40. Sentinel-2 satellite thermal images of Sangeang Api on 7 and 22 October 2019 show an area of elevated temperatures trending from the summit of the active cone down the SE flank. False color (urban) image rendering (bands 12, 11, 4) courtesy of Sentinel Hub Playground. |
Discrete explosions produced ash plumes up to 2.7-3.5 km altitude during 3-4 November, and during the 6-12th the Darwin VAAC reported short-lived ash emissions reaching 3 km altitude. Thermal anomalies were visible in satellite images during 6-8 November. A VONA was released on 14 November for an ash plume that reached about 2 km altitude and dispersed to the west. During 14-19 November the Darwin VAAC reported short-lived ash plumes reaching 2.4 km that drifted NW and W. Additional ash plumes were observed reaching a maximum altitude of 2.4 km during 20-26 November. Thermal anomalies were detected during the 18-19th, and on the 27th.
Ash plumes were recorded reaching 2.4 km during 4-5, 7-9, 11-13, and 17-19 December, and up to 3 km during 25-28 December. There were no reports of activity in early to mid-January 2020 until the Darwin VAAC reported ash reaching 3 km on 23 January. A webcam image on 15 January showed a gas plume originating from the summit. Several fires were visible on the flanks during May 2019 through January 2020, and this is seen in the MIROVA log thermal plot with the thermal anomalies greater than 5 km away from the crater (figure 41).
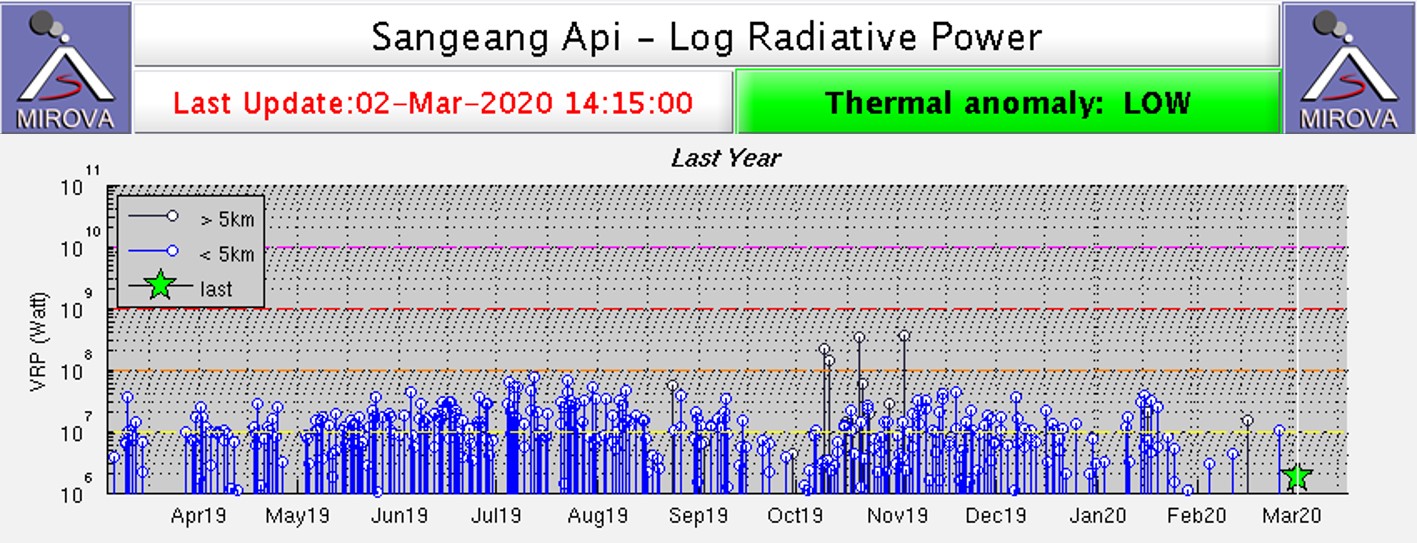 |
Figure 41. MIROVA log plot of radiative power indicates the persistent activity at Sangeang Api during April 2019 through March 2020. There was a slight decline in September-October 2019 and again in February 2020. Courtesy of MIROVA. |
Information Contacts: Pusat Vulkanologi dan Mitigasi Bencana Geologi (PVMBG, also known as Indonesian Center for Volcanology and Geological Hazard Mitigation, CVGHM), Jalan Diponegoro 57, Bandung 40122, Indonesia (URL: http://www.vsi.esdm.go.id/); MIROVA (Middle InfraRed Observation of Volcanic Activity), a collaborative project between the Universities of Turin and Florence (Italy) supported by the Centre for Volcanic Risk of the Italian Civil Protection Department (URL: http://www.mirovaweb.it/); Sentinel Hub Playground (URL: https://www.sentinel-hub.com/explore/sentinel-playground); Planet Labs, Inc. (URL: https://www.planet.com/).
Two ash plumes and small thermal anomalies during February-June 2020
Sangeang Api is a 13-km-wide island located off the NE coast of Sumbawa Island, part of Indonesia's Lesser Sunda Islands. Documentation of historical eruptions date back to 1512. The most recent eruptive episode began in July 2017 and included frequent Strombolian explosions, ash plumes, and block avalanches. The previous report (BGVN 45:02) described activity consisting of a new lava flow originating from the active Doro Api summit crater, short-lived explosions, and ash-and-gas emissions. This report updates information during February through July 2020 using information from the Darwin Volcanic Ash Advisory Center (VAAC) reports, Pusat Vulkanologi dan Mitigasi Bencana Geologi (PVMBG, or CVGHM) reports, and various satellite data.
Volcanism during this reporting period was relatively low compared to the previous reports (BGVN 44:05 and BGVN 45:02). A Darwin VAAC notice reported an ash plume rose 2.1 km altitude and drifted E on 10 May 2020. Another ash plume rose to a maximum of 3 km altitude drifting NE on 10 June, as seen in HIMAWARI-8 satellite imagery.
The MIROVA (Middle InfraRed Observation of Volcanic Activity) analysis of MODIS satellite data detected a total of 12 low power thermal anomalies within 5 km from the summit during February through May 2020 (figure 42). No thermal anomalies were recorded during June and July according to the MIROVA graph. Though the MODVOLC algorithm did not detect any thermal signatures between February to July, many small thermal hotspots within the summit crater could be seen in Sentinel-2 thermal satellite imagery (figure 43).
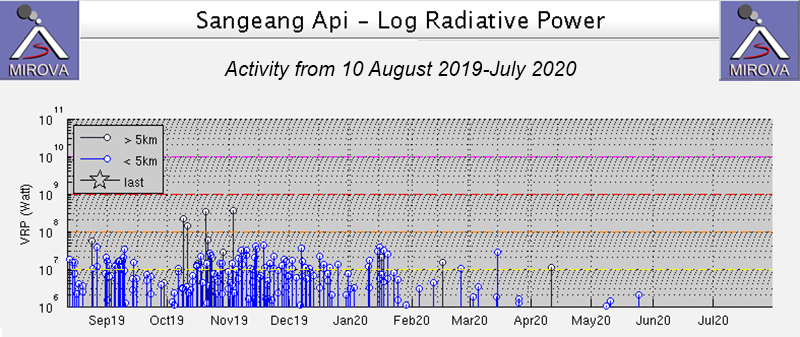 |
Figure 42. Thermal anomalies at Sangeang Api from 10 August 2019 through July 2020 recorded by the MIROVA system (Log Radiative Power) were infrequent and low power during February through May 2020. No thermal anomalies were detected during June and July. Courtesy of MIROVA. |
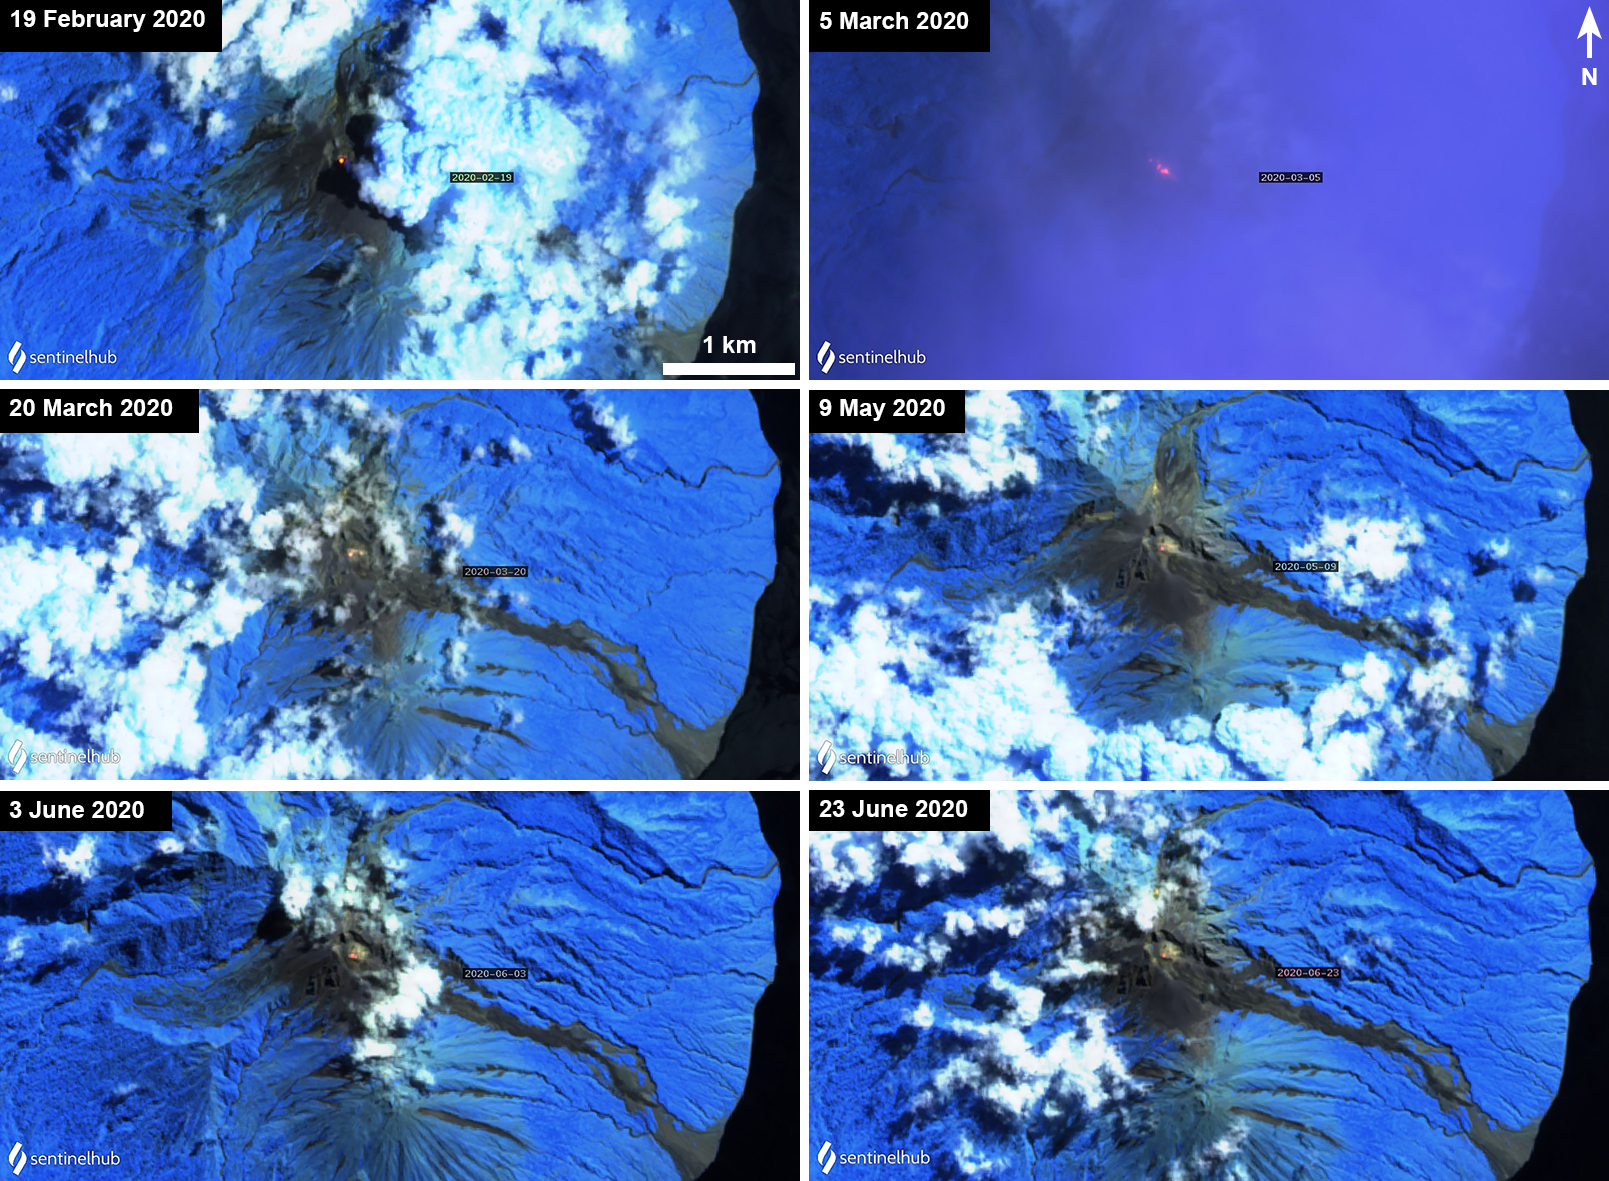 |
Figure 43. Sentinel-2 thermal satellite imagery using “Atmospheric penetration” (bands 12, 11, 8A) rendering showed small thermal hotspots (orange-yellow) at the summit of Sangeang Api during February through June 2020. Courtesy of Sentinel Hub Playground. |
Information Contacts: Pusat Vulkanologi dan Mitigasi Bencana Geologi (PVMBG, also known as Indonesian Center for Volcanology and Geological Hazard Mitigation, CVGHM), Jalan Diponegoro 57, Bandung 40122, Indonesia (URL: http://www.vsi.esdm.go.id/); Darwin Volcanic Ash Advisory Centre (VAAC), Bureau of Meteorology, Northern Territory Regional Office, PO Box 40050, Casuarina, NT 0811, Australia (URL: http://www.bom.gov.au/info/vaac/); MIROVA (Middle InfraRed Observation of Volcanic Activity), a collaborative project between the Universities of Turin and Florence (Italy) supported by the Centre for Volcanic Risk of the Italian Civil Protection Department (URL: http://www.mirovaweb.it/); Hawai'i Institute of Geophysics and Planetology (HIGP) - MODVOLC Thermal Alerts System, School of Ocean and Earth Science and Technology (SOEST), Univ. of Hawai'i, 2525 Correa Road, Honolulu, HI 96822, USA (URL: http://modis.higp.hawaii.edu/); Sentinel Hub Playground (URL: https://www.sentinel-hub.com/explore/sentinel-playground).
Small ash plume on 17 February 2022
Sangeang Api is a complex volcano on the small island of Sangeang in the Lesser Sunda Islands, Indonesia, consisting of two volcanic cones. After a major explosion in May 2014, activity continued until November 2015, with thermal anomalies indicating possible lava dome growth or lava flows (BGVN 39:02 and 41:10). Another eruptive period during July 2017 into June 2020 included occasional weak ash explosions with ash plumes and emissions, hot material discharged from the summit crater, periods of numerous thermal anomalies, summit incandescence, and infrequent Strombolian activity (BGVN 42:09, 43:11, 44:05, 45:02, and 45:08). The volcano is monitored by Pusat Vulkanologi dan Mitigasi Bencana Geologi (PVMBG, or CVGHM), the Darwin Volcanic Ash Advisory Center (VAAC), and by various satellites.
The only documented activity during August 2020-February 2022 was an ash plume on 17 February 2022 reported by the Darwin VAAC that rose to an altitude of 4-4.9 km (~3 km above the summit) and drifted SW and WSW. During August 2020-February 2022, Sentinel-2 satellite images during this time were usually obscured by weather clouds, but no thermal signals or volcanic activity were observed when there were clear views. During May 2021 through February 2022, the MIROVA (Middle InfraRed Observation of Volcanic Activity) volcano hotspot detection system recorded ten scattered hotspots within 5 km of the summit; the cause of the weak anomalies is unknown.
Information Contacts: Pusat Vulkanologi dan Mitigasi Bencana Geologi (PVMBG, also known as Indonesian Center for Volcanology and Geological Hazard Mitigation, CVGHM), Jalan Diponegoro 57, Bandung 40122, Indonesia (URL: http://www.vsi.esdm.go.id/); Darwin Volcanic Ash Advisory Centre (VAAC), Bureau of Meteorology, Northern Territory Regional Office, PO Box 40050, Casuarina, NT 0811, Australia (URL: http://www.bom.gov.au/info/vaac/); MIROVA (Middle InfraRed Observation of Volcanic Activity), a collaborative project between the Universities of Turin and Florence (Italy) supported by the Centre for Volcanic Risk of the Italian Civil Protection Department (URL: http://www.mirovaweb.it/); Sentinel Hub Playground (URL: https://www.sentinel-hub.com/explore/sentinel-playground).
|
|
||||||||||||||||||||||||||
There is data available for 20 confirmed eruptive periods.
2022 Feb 17 - 2022 Feb 17 Confirmed Eruption (Explosive / Effusive) VEI: 2
| Episode 1 | Eruption (Explosive / Effusive) | |||||||||||||||||||
|---|---|---|---|---|---|---|---|---|---|---|---|---|---|---|---|---|---|---|---|
| 2022 Feb 17 - 2022 Feb 17 | Evidence from Observations: Reported | ||||||||||||||||||
| On 17 February ash plumes rose to altitudes of 4-4.9 km (2-3 km above the summit) and drifted SW and WSW. | |||||||||||||||||||
|
List of 2 Events for Episode 1
|
|||||||||||||||||||
2017 Feb 25 - 2020 Jun 10 Confirmed Eruption (Explosive / Effusive) VEI: 2
| Episode 1 | Eruption (Explosive / Effusive) | Summit crater, Doro Api cone | |||||||||||||||||||||||||||||||||||||||||||||||||||||||||||||||||||||||||||||||||||||||||||||||||||||||||||||||||||||||||||||||||||||||||||||||||||||||||||||||||||||||||||||||||||||||||||||||||||||||||||||||||||||||||||||||||||||||||||||||||||||||||||||||||||||||||||||||||||||||||||||||||||||||||||||||||||||||||||||||||||||||||||||||||||||||||||||||||||||||||||||||||||||||||||||||||||||||||||||||||||||||||||||||||||||||||||||||||||||||||||||||||||||||||||||||||||||||||||||||||||||||||||||||||||||||||||||||||||||||||||||||||||||||||||||||||||||||||||||||||||||||||||||||||||||||||||||||||||||||||||||||||||||||||||||||||||||||||||||||||||||||||||||||||||||||||||||||||||||||||||||||||||||||||||||||||||||||||||||||||||||||||||||||||||||||||||||||||||||||||||||||||||||||||||||||||||||||||||||||||||||||||||||||||||||||||||||||||||||||||||||||||||||||||||||||||||||||||||||||||||||||||||||||||||||||||||||||||||||||||||||||||||||||||||||||||||||||||
|---|---|---|---|---|---|---|---|---|---|---|---|---|---|---|---|---|---|---|---|---|---|---|---|---|---|---|---|---|---|---|---|---|---|---|---|---|---|---|---|---|---|---|---|---|---|---|---|---|---|---|---|---|---|---|---|---|---|---|---|---|---|---|---|---|---|---|---|---|---|---|---|---|---|---|---|---|---|---|---|---|---|---|---|---|---|---|---|---|---|---|---|---|---|---|---|---|---|---|---|---|---|---|---|---|---|---|---|---|---|---|---|---|---|---|---|---|---|---|---|---|---|---|---|---|---|---|---|---|---|---|---|---|---|---|---|---|---|---|---|---|---|---|---|---|---|---|---|---|---|---|---|---|---|---|---|---|---|---|---|---|---|---|---|---|---|---|---|---|---|---|---|---|---|---|---|---|---|---|---|---|---|---|---|---|---|---|---|---|---|---|---|---|---|---|---|---|---|---|---|---|---|---|---|---|---|---|---|---|---|---|---|---|---|---|---|---|---|---|---|---|---|---|---|---|---|---|---|---|---|---|---|---|---|---|---|---|---|---|---|---|---|---|---|---|---|---|---|---|---|---|---|---|---|---|---|---|---|---|---|---|---|---|---|---|---|---|---|---|---|---|---|---|---|---|---|---|---|---|---|---|---|---|---|---|---|---|---|---|---|---|---|---|---|---|---|---|---|---|---|---|---|---|---|---|---|---|---|---|---|---|---|---|---|---|---|---|---|---|---|---|---|---|---|---|---|---|---|---|---|---|---|---|---|---|---|---|---|---|---|---|---|---|---|---|---|---|---|---|---|---|---|---|---|---|---|---|---|---|---|---|---|---|---|---|---|---|---|---|---|---|---|---|---|---|---|---|---|---|---|---|---|---|---|---|---|---|---|---|---|---|---|---|---|---|---|---|---|---|---|---|---|---|---|---|---|---|---|---|---|---|---|---|---|---|---|---|---|---|---|---|---|---|---|---|---|---|---|---|---|---|---|---|---|---|---|---|---|---|---|---|---|---|---|---|---|---|---|---|---|---|---|---|---|---|---|---|---|---|---|---|---|---|---|---|---|---|---|---|---|---|---|---|---|---|---|---|---|---|---|---|---|---|---|---|---|---|---|---|---|---|---|---|---|---|---|---|---|---|---|---|---|---|---|---|---|---|---|---|---|---|---|---|---|---|---|---|---|---|---|---|---|---|---|---|---|---|---|---|---|---|---|---|---|---|---|---|---|---|---|---|---|---|---|---|---|---|---|---|---|---|---|---|---|---|---|---|---|---|---|---|---|---|---|---|---|---|---|---|---|---|---|---|---|---|---|---|---|---|---|---|---|---|---|---|---|---|---|---|---|---|---|---|---|---|---|---|---|---|---|---|---|---|---|---|---|---|---|---|---|---|---|---|---|---|---|---|---|---|---|---|---|---|---|---|---|---|---|---|---|---|---|---|---|---|---|---|---|---|---|---|---|---|---|---|---|---|---|---|---|---|---|---|---|---|---|---|---|---|---|---|---|---|---|---|---|---|---|---|---|---|---|---|---|---|---|---|---|---|---|---|---|---|---|---|---|---|---|---|---|---|---|---|---|---|---|---|---|---|---|---|---|---|---|---|---|---|---|---|---|---|---|---|---|---|---|---|---|---|---|---|---|---|---|---|---|---|---|---|---|---|---|---|---|---|---|---|---|---|---|---|---|---|---|---|---|---|---|---|---|---|---|---|---|---|---|---|---|---|---|---|---|---|---|---|---|---|---|---|---|---|---|---|---|---|---|---|---|---|---|---|---|---|---|---|---|---|---|---|---|---|---|---|---|---|---|---|---|---|---|---|---|---|---|---|---|---|---|---|---|---|---|---|---|---|---|---|---|---|---|---|---|---|---|---|---|---|---|---|---|---|---|---|---|---|---|---|---|---|---|---|---|---|---|---|---|---|---|---|---|---|---|---|---|---|---|---|---|---|---|---|---|---|---|---|---|---|---|---|---|---|---|---|---|---|---|---|---|---|---|---|---|---|---|---|---|---|---|---|---|---|---|---|---|---|---|---|---|---|---|---|---|---|---|---|---|---|---|---|---|---|---|---|---|---|---|---|---|---|---|---|---|---|---|---|---|---|---|---|---|---|---|---|---|---|---|---|---|---|---|---|---|---|---|---|---|---|---|---|---|---|---|---|---|---|
| 2017 Feb 25 - 2020 Jun 10 | Evidence from Observations: Reported | |||||||||||||||||||||||||||||||||||||||||||||||||||||||||||||||||||||||||||||||||||||||||||||||||||||||||||||||||||||||||||||||||||||||||||||||||||||||||||||||||||||||||||||||||||||||||||||||||||||||||||||||||||||||||||||||||||||||||||||||||||||||||||||||||||||||||||||||||||||||||||||||||||||||||||||||||||||||||||||||||||||||||||||||||||||||||||||||||||||||||||||||||||||||||||||||||||||||||||||||||||||||||||||||||||||||||||||||||||||||||||||||||||||||||||||||||||||||||||||||||||||||||||||||||||||||||||||||||||||||||||||||||||||||||||||||||||||||||||||||||||||||||||||||||||||||||||||||||||||||||||||||||||||||||||||||||||||||||||||||||||||||||||||||||||||||||||||||||||||||||||||||||||||||||||||||||||||||||||||||||||||||||||||||||||||||||||||||||||||||||||||||||||||||||||||||||||||||||||||||||||||||||||||||||||||||||||||||||||||||||||||||||||||||||||||||||||||||||||||||||||||||||||||||||||||||||||||||||||||||||||||||||||||||||||||||||||||||||
|
List of 189 Events for Episode 1 at Summit crater, Doro Api cone
|
||||||||||||||||||||||||||||||||||||||||||||||||||||||||||||||||||||||||||||||||||||||||||||||||||||||||||||||||||||||||||||||||||||||||||||||||||||||||||||||||||||||||||||||||||||||||||||||||||||||||||||||||||||||||||||||||||||||||||||||||||||||||||||||||||||||||||||||||||||||||||||||||||||||||||||||||||||||||||||||||||||||||||||||||||||||||||||||||||||||||||||||||||||||||||||||||||||||||||||||||||||||||||||||||||||||||||||||||||||||||||||||||||||||||||||||||||||||||||||||||||||||||||||||||||||||||||||||||||||||||||||||||||||||||||||||||||||||||||||||||||||||||||||||||||||||||||||||||||||||||||||||||||||||||||||||||||||||||||||||||||||||||||||||||||||||||||||||||||||||||||||||||||||||||||||||||||||||||||||||||||||||||||||||||||||||||||||||||||||||||||||||||||||||||||||||||||||||||||||||||||||||||||||||||||||||||||||||||||||||||||||||||||||||||||||||||||||||||||||||||||||||||||||||||||||||||||||||||||||||||||||||||||||||||||||||||||||||||||
2014 May 30 - 2015 Nov 5 Confirmed Eruption (Explosive / Effusive) VEI: 4
| Episode 1 | Eruption (Explosive / Effusive) | Summit crater and east flank | |||||||||||||||||||||||||||||||||||||||||||||||||||||||||||||||||||||||||||||||||||||||||||||||||||||||||||||||||||||||||||||||||||||||||||||||||||||||||||||||||||
|---|---|---|---|---|---|---|---|---|---|---|---|---|---|---|---|---|---|---|---|---|---|---|---|---|---|---|---|---|---|---|---|---|---|---|---|---|---|---|---|---|---|---|---|---|---|---|---|---|---|---|---|---|---|---|---|---|---|---|---|---|---|---|---|---|---|---|---|---|---|---|---|---|---|---|---|---|---|---|---|---|---|---|---|---|---|---|---|---|---|---|---|---|---|---|---|---|---|---|---|---|---|---|---|---|---|---|---|---|---|---|---|---|---|---|---|---|---|---|---|---|---|---|---|---|---|---|---|---|---|---|---|---|---|---|---|---|---|---|---|---|---|---|---|---|---|---|---|---|---|---|---|---|---|---|---|---|---|---|---|---|---|---|---|---|
| 2014 May 30 - 2014 Dec 27 | Evidence from Observations: Reported | |||||||||||||||||||||||||||||||||||||||||||||||||||||||||||||||||||||||||||||||||||||||||||||||||||||||||||||||||||||||||||||||||||||||||||||||||||||||||||||||||||
|
List of 31 Events for Episode 1 at Summit crater and east flank
|
||||||||||||||||||||||||||||||||||||||||||||||||||||||||||||||||||||||||||||||||||||||||||||||||||||||||||||||||||||||||||||||||||||||||||||||||||||||||||||||||||||
| Episode 2 | Eruption (Explosive / Effusive) | Summit crater and east flank | ||||||||||||||||||||||||||||||||||||||||||||||||||||||||||||||||||||||||||||||||||||||||||||||||||||||||||||||||||||||||||||||||||||||||||
|---|---|---|---|---|---|---|---|---|---|---|---|---|---|---|---|---|---|---|---|---|---|---|---|---|---|---|---|---|---|---|---|---|---|---|---|---|---|---|---|---|---|---|---|---|---|---|---|---|---|---|---|---|---|---|---|---|---|---|---|---|---|---|---|---|---|---|---|---|---|---|---|---|---|---|---|---|---|---|---|---|---|---|---|---|---|---|---|---|---|---|---|---|---|---|---|---|---|---|---|---|---|---|---|---|---|---|---|---|---|---|---|---|---|---|---|---|---|---|---|---|---|---|---|---|---|---|---|---|---|---|---|---|---|---|---|---|---|---|---|
| 2015 Mar 17 - 2015 Nov 5 | Evidence from Observations: Satellite (infrared) | ||||||||||||||||||||||||||||||||||||||||||||||||||||||||||||||||||||||||||||||||||||||||||||||||||||||||||||||||||||||||||||||||||||||||||
|
List of 26 Events for Episode 2 at Summit crater and east flank
|
|||||||||||||||||||||||||||||||||||||||||||||||||||||||||||||||||||||||||||||||||||||||||||||||||||||||||||||||||||||||||||||||||||||||||||
[ 2009 May 1 - 2009 Jun 3 ] Uncertain Eruption
| Episode 1 | Eruption (Explosive / Effusive) | ||||||||||||||
|---|---|---|---|---|---|---|---|---|---|---|---|---|---|---|
| 2009 May 1 - 2009 Jun 3 | Evidence from Unknown | |||||||||||||
|
List of 1 Events for Episode 1
|
||||||||||||||
1997 Jul 2 ± 182 days - 1999 Jul 2 ± 182 days Confirmed Eruption (Explosive / Effusive) VEI: 2 (?)
| Episode 1 | Eruption (Explosive / Effusive) | |||||||||||||||||||||||||||||
|---|---|---|---|---|---|---|---|---|---|---|---|---|---|---|---|---|---|---|---|---|---|---|---|---|---|---|---|---|---|
| 1997 Jul 2 ± 182 days - 1999 Jul 2 ± 182 days | Evidence from Observations: Reported | ||||||||||||||||||||||||||||
|
List of 4 Events for Episode 1
|
|||||||||||||||||||||||||||||
1985 Jul 30 - 1988 Feb 16 ± 15 days Confirmed Eruption (Explosive / Effusive) VEI: 3
| Episode 1 | Eruption (Explosive / Effusive) | Doro Api | ||||||||||||||||||||||||||||||||||||||||||||||||||||||||||
|---|---|---|---|---|---|---|---|---|---|---|---|---|---|---|---|---|---|---|---|---|---|---|---|---|---|---|---|---|---|---|---|---|---|---|---|---|---|---|---|---|---|---|---|---|---|---|---|---|---|---|---|---|---|---|---|---|---|---|---|
| 1985 Jul 30 - 1988 Feb 16 ± 15 days | Evidence from Observations: Reported | ||||||||||||||||||||||||||||||||||||||||||||||||||||||||||
|
List of 10 Events for Episode 1 at Doro Api
|
|||||||||||||||||||||||||||||||||||||||||||||||||||||||||||
1966 Feb 28 - 1966 Nov 16 ± 15 days Confirmed Eruption (Explosive / Effusive) VEI: 2
| Episode 1 | Eruption (Explosive / Effusive) | |||||||||||||||||||
|---|---|---|---|---|---|---|---|---|---|---|---|---|---|---|---|---|---|---|---|
| 1966 Feb 28 - 1966 Nov 16 ± 15 days | Evidence from Observations: Reported | ||||||||||||||||||
|
List of 2 Events for Episode 1
|
|||||||||||||||||||
1964 Jan 29 - 1965 Dec 1 ± 30 days Confirmed Eruption (Explosive / Effusive) VEI: 2
| Episode 1 | Eruption (Explosive / Effusive) | Doro Api | ||||||||||||||||||||||||||||||||||||||||||||||||||||||||||
|---|---|---|---|---|---|---|---|---|---|---|---|---|---|---|---|---|---|---|---|---|---|---|---|---|---|---|---|---|---|---|---|---|---|---|---|---|---|---|---|---|---|---|---|---|---|---|---|---|---|---|---|---|---|---|---|---|---|---|---|
| 1964 Jan 29 - 1965 Dec 1 ± 30 days | Evidence from Observations: Reported | ||||||||||||||||||||||||||||||||||||||||||||||||||||||||||
|
List of 10 Events for Episode 1 at Doro Api
|
|||||||||||||||||||||||||||||||||||||||||||||||||||||||||||
1958 Jul 2 ± 182 days Confirmed Eruption (Explosive / Effusive) VEI: 1 (?)
| Episode 1 | Eruption (Explosive / Effusive) | ||||||||||||||||||||||||||||||||||
|---|---|---|---|---|---|---|---|---|---|---|---|---|---|---|---|---|---|---|---|---|---|---|---|---|---|---|---|---|---|---|---|---|---|---|
| 1958 Jul 2 ± 182 days - Unknown | Evidence from Observations: Reported | |||||||||||||||||||||||||||||||||
|
List of 5 Events for Episode 1
|
||||||||||||||||||||||||||||||||||
1957 Jul 2 ± 182 days Confirmed Eruption (Explosive / Effusive) VEI: 1
| Episode 1 | Eruption (Explosive / Effusive) | ||||||||||||||||||||||||
|---|---|---|---|---|---|---|---|---|---|---|---|---|---|---|---|---|---|---|---|---|---|---|---|---|
| 1957 Jul 2 ± 182 days - Unknown | Evidence from Observations: Reported | |||||||||||||||||||||||
|
List of 3 Events for Episode 1
|
||||||||||||||||||||||||
1956 Dec 16 ± 15 days Confirmed Eruption (Explosive / Effusive) VEI: 1
| Episode 1 | Eruption (Explosive / Effusive) | ||||||||||||||||||||||||
|---|---|---|---|---|---|---|---|---|---|---|---|---|---|---|---|---|---|---|---|---|---|---|---|---|
| 1956 Dec 16 ± 15 days - Unknown | Evidence from Observations: Reported | |||||||||||||||||||||||
|
List of 3 Events for Episode 1
|
||||||||||||||||||||||||
1955 Jul 2 ± 182 days Confirmed Eruption (Explosive / Effusive) VEI: 1
| Episode 1 | Eruption (Explosive / Effusive) | ||||||||||||||||||||||||
|---|---|---|---|---|---|---|---|---|---|---|---|---|---|---|---|---|---|---|---|---|---|---|---|---|
| 1955 Jul 2 ± 182 days - Unknown | Evidence from Observations: Reported | |||||||||||||||||||||||
|
List of 3 Events for Episode 1
|
||||||||||||||||||||||||
1954 Nov 4 Confirmed Eruption (Explosive / Effusive) VEI: 2
| Episode 1 | Eruption (Explosive / Effusive) | |||||||||||||||||||
|---|---|---|---|---|---|---|---|---|---|---|---|---|---|---|---|---|---|---|---|
| 1954 Nov 4 - Unknown | Evidence from Observations: Reported | ||||||||||||||||||
|
List of 2 Events for Episode 1
|
|||||||||||||||||||
1954 Apr 26 Confirmed Eruption (Explosive / Effusive) VEI: 2
| Episode 1 | Eruption (Explosive / Effusive) | |||||||||||||||||||
|---|---|---|---|---|---|---|---|---|---|---|---|---|---|---|---|---|---|---|---|
| 1954 Apr 26 - Unknown | Evidence from Observations: Reported | ||||||||||||||||||
|
List of 2 Events for Episode 1
|
|||||||||||||||||||
1953 Mar 19 - 1953 May 15 (on or after) Confirmed Eruption (Explosive / Effusive) VEI: 3
| Episode 1 | Eruption (Explosive / Effusive) | Doro Api | ||||||||||||||||||||||||||||||||||||||||||||||||||||||||||
|---|---|---|---|---|---|---|---|---|---|---|---|---|---|---|---|---|---|---|---|---|---|---|---|---|---|---|---|---|---|---|---|---|---|---|---|---|---|---|---|---|---|---|---|---|---|---|---|---|---|---|---|---|---|---|---|---|---|---|---|
| 1953 Mar 19 - 1953 May 15 (on or after) | Evidence from Observations: Reported | ||||||||||||||||||||||||||||||||||||||||||||||||||||||||||
|
List of 10 Events for Episode 1 at Doro Api
|
|||||||||||||||||||||||||||||||||||||||||||||||||||||||||||
1927 Confirmed Eruption (Explosive / Effusive) VEI: 2
| Episode 1 | Eruption (Explosive / Effusive) | |||||||||||||||||||
|---|---|---|---|---|---|---|---|---|---|---|---|---|---|---|---|---|---|---|---|
| 1927 - Unknown | Evidence from Observations: Reported | ||||||||||||||||||
|
List of 2 Events for Episode 1
|
|||||||||||||||||||
1912 Apr Confirmed Eruption (Explosive / Effusive) VEI: 2
| Episode 1 | Eruption (Explosive / Effusive) | |||||||||||||||||||
|---|---|---|---|---|---|---|---|---|---|---|---|---|---|---|---|---|---|---|---|
| 1912 Apr - Unknown | Evidence from Observations: Reported | ||||||||||||||||||
|
List of 2 Events for Episode 1
|
|||||||||||||||||||
1911 Feb 13 - 1911 Mar 2 Confirmed Eruption (Explosive / Effusive) VEI: 2
| Episode 1 | Eruption (Explosive / Effusive) | Doro Api | |||||||||||||||||||||||||||||||||
|---|---|---|---|---|---|---|---|---|---|---|---|---|---|---|---|---|---|---|---|---|---|---|---|---|---|---|---|---|---|---|---|---|---|---|
| 1911 Feb 13 - 1911 Mar 2 | Evidence from Observations: Reported | |||||||||||||||||||||||||||||||||
|
List of 5 Events for Episode 1 at Doro Api
|
||||||||||||||||||||||||||||||||||
1860 Sep 11 - 1860 Oct Confirmed Eruption (Explosive / Effusive) VEI: 2
| Episode 1 | Eruption (Explosive / Effusive) | |||||||||||||||||||
|---|---|---|---|---|---|---|---|---|---|---|---|---|---|---|---|---|---|---|---|
| 1860 Sep 11 - 1860 Oct | Evidence from Observations: Reported | ||||||||||||||||||
|
List of 2 Events for Episode 1
|
|||||||||||||||||||
1821 Mar 23 Confirmed Eruption (Explosive / Effusive) VEI: 2
| Episode 1 | Eruption (Explosive / Effusive) | |||||||||||||||||||
|---|---|---|---|---|---|---|---|---|---|---|---|---|---|---|---|---|---|---|---|
| 1821 Mar 23 - Unknown | Evidence from Observations: Reported | ||||||||||||||||||
|
List of 2 Events for Episode 1
|
|||||||||||||||||||
1715 Confirmed Eruption (Explosive / Effusive) VEI: 2
| Episode 1 | Eruption (Explosive / Effusive) | |||||||||||||||||||
|---|---|---|---|---|---|---|---|---|---|---|---|---|---|---|---|---|---|---|---|
| 1715 - Unknown | Evidence from Observations: Reported | ||||||||||||||||||
|
List of 2 Events for Episode 1
|
|||||||||||||||||||
[ 1512 ] Uncertain Eruption
| Episode 1 | Eruption (Explosive / Effusive) | |||||||||||||||||||
|---|---|---|---|---|---|---|---|---|---|---|---|---|---|---|---|---|---|---|---|
| 1512 - Unknown | Evidence from Observations: Reported | ||||||||||||||||||
|
List of 2 Events for Episode 1
|
|||||||||||||||||||
This compilation of synonyms and subsidiary features may not be comprehensive. Features are organized into four major categories: Cones, Craters, Domes, and Thermal Features. Synonyms of features appear indented below the primary name. In some cases additional feature type, elevation, or location details are provided.
Synonyms |
||||
| Sangean Api | Bima | ||||
Cones |
||||
| Feature Name | Feature Type | Elevation | Latitude | Longitude |
| Doro Api
Kalubu Crater |
Cone | 1912 m | 8° 11' 47.00" S | 119° 4' 11.00" E |
| Doro Mantai
Doro Mantoi |
Cone | 1733 m | 8° 12' 52.00" S | 119° 4' 29.00" E |
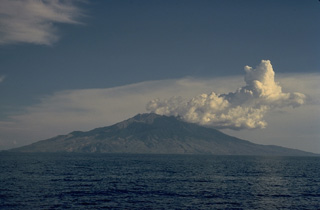 Cumulus clouds drift from the summit of the 13-km-wide island of Sangeang Api off the NE coast of Sumbawa. Sangeang Api volcano contains two large cones, Doro Api and Doro Montoi. Intermittent eruptions have been recorded since 1512.
 Sangeang Api is a small volcanic island off the NE coast of Sumbawa Island. Two large cones, Doro Api in the center and Doro Mantai on the right, were constructed within and on the south rim of a largely obscured caldera. Intermittent eruptions have been recorded since 1512 and it has been frequently active in the 20th century.
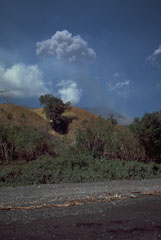 An ash plume rises above the Doro Api peak of Sangeang Api volcano on 25 August 1985. The eruption, which began on 30 July and lasted until February 1988, included explosive activity, pyroclastic flows, and a lava flow that traveled 4-5 km down the W flank.
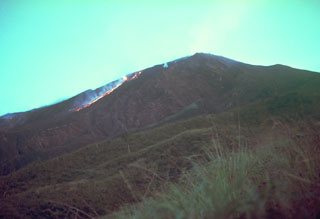 A lava flow descends the W flank of Doro Api at Sangeang Api volcano on 4 December 1985. The eruption began on 30 July and pyroclastic flows forced the evacuation of the island's 1,242 inhabitants. The lava flow eventually traveled 4-5 km before stopping in June 1986. Explosive activity continued until February 1988.
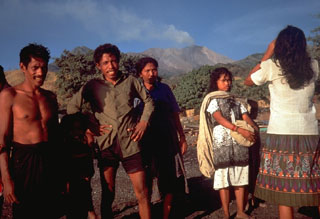 Islanders prepare to evacuate on 25 August 1985 as Sangeang Api volcano erupts in the background. The eruption began on 30 July and produced pyroclastic flows that eventually forced the evacuation of the island's entire 1,242 inhabitants.
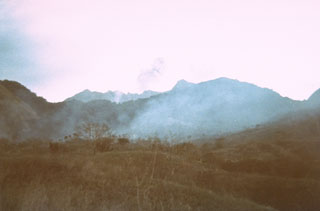 An eruption of Doro Api at Sangeang Api volcano is observed from the village of Doro Mewanga on 18 September 1964. The eruption began on 29 January 1964 and lasted until the end of 1965. During the eruption strong explosions took place from the summit crater and a lava flow traveled down to 750 m elevation.
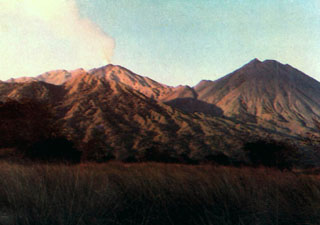 A plume rises above Doro Api, one of the two large post-caldera cones of Sangeang Api, in 1985. Doro Mantai appears at the right in this view from Sori Buntu on the S flank. An eruption that included both explosive activity and the effusion of lava flows down the W flank began in July 1985 and lasted until February 1988.
There are no samples for Sangeang Api in the Smithsonian's NMNH Department of Mineral Sciences Rock and Ore collection.
| Copernicus Browser | The Copernicus Browser replaced the Sentinel Hub Playground browser in 2023, to provide access to Earth observation archives from the Copernicus Data Space Ecosystem, the main distribution platform for data from the EU Copernicus missions. |
| MIROVA | Middle InfraRed Observation of Volcanic Activity (MIROVA) is a near real time volcanic hot-spot detection system based on the analysis of MODIS (Moderate Resolution Imaging Spectroradiometer) data. In particular, MIROVA uses the Middle InfraRed Radiation (MIR), measured over target volcanoes, in order to detect, locate and measure the heat radiation sourced from volcanic activity. |
| MODVOLC Thermal Alerts | Using infrared satellite Moderate Resolution Imaging Spectroradiometer (MODIS) data, scientists at the Hawai'i Institute of Geophysics and Planetology, University of Hawai'i, developed an automated system called MODVOLC to map thermal hot-spots in near real time. For each MODIS image, the algorithm automatically scans each 1 km pixel within it to check for high-temperature hot-spots. When one is found the date, time, location, and intensity are recorded. MODIS looks at every square km of the Earth every 48 hours, once during the day and once during the night, and the presence of two MODIS sensors in space allows at least four hot-spot observations every two days. Each day updated global maps are compiled to display the locations of all hot spots detected in the previous 24 hours. There is a drop-down list with volcano names which allow users to 'zoom-in' and examine the distribution of hot-spots at a variety of spatial scales. |
|
WOVOdat
Single Volcano View Temporal Evolution of Unrest Side by Side Volcanoes |
WOVOdat is a database of volcanic unrest; instrumentally and visually recorded changes in seismicity, ground deformation, gas emission, and other parameters from their normal baselines. It is sponsored by the World Organization of Volcano Observatories (WOVO) and presently hosted at the Earth Observatory of Singapore.
GVMID Data on Volcano Monitoring Infrastructure The Global Volcano Monitoring Infrastructure Database GVMID, is aimed at documenting and improving capabilities of volcano monitoring from the ground and space. GVMID should provide a snapshot and baseline view of the techniques and instrumentation that are in place at various volcanoes, which can be use by volcano observatories as reference to setup new monitoring system or improving networks at a specific volcano. These data will allow identification of what monitoring gaps exist, which can be then targeted by remote sensing infrastructure and future instrument deployments. |
| Volcanic Hazard Maps | The IAVCEI Commission on Volcanic Hazards and Risk has a Volcanic Hazard Maps database designed to serve as a resource for hazard mappers (or other interested parties) to explore how common issues in hazard map development have been addressed at different volcanoes, in different countries, for different hazards, and for different intended audiences. In addition to the comprehensive, searchable Volcanic Hazard Maps Database, this website contains information about diversity of volcanic hazard maps, illustrated using examples from the database. This site is for educational purposes related to volcanic hazard maps. Hazard maps found on this website should not be used for emergency purposes. For the most recent, official hazard map for a particular volcano, please seek out the proper institutional authorities on the matter. |
| IRIS seismic stations/networks | Incorporated Research Institutions for Seismology (IRIS) Data Services map showing the location of seismic stations from all available networks (permanent or temporary) within a radius of 0.18° (about 20 km at mid-latitudes) from the given location of Sangeang Api. Users can customize a variety of filters and options in the left panel. Note that if there are no stations are known the map will default to show the entire world with a "No data matched request" error notice. |
| UNAVCO GPS/GNSS stations | Geodetic Data Services map from UNAVCO showing the location of GPS/GNSS stations from all available networks (permanent or temporary) within a radius of 20 km from the given location of Sangeang Api. Users can customize the data search based on station or network names, location, and time window. Requires Adobe Flash Player. |
| DECADE Data | The DECADE portal, still in the developmental stage, serves as an example of the proposed interoperability between The Smithsonian Institution's Global Volcanism Program, the Mapping Gas Emissions (MaGa) Database, and the EarthChem Geochemical Portal. The Deep Earth Carbon Degassing (DECADE) initiative seeks to use new and established technologies to determine accurate global fluxes of volcanic CO2 to the atmosphere, but installing CO2 monitoring networks on 20 of the world's 150 most actively degassing volcanoes. The group uses related laboratory-based studies (direct gas sampling and analysis, melt inclusions) to provide new data for direct degassing of deep earth carbon to the atmosphere. |
| Large Eruptions of Sangeang Api | Information about large Quaternary eruptions (VEI >= 4) is cataloged in the Large Magnitude Explosive Volcanic Eruptions (LaMEVE) database of the Volcano Global Risk Identification and Analysis Project (VOGRIPA). |
| EarthChem | EarthChem develops and maintains databases, software, and services that support the preservation, discovery, access and analysis of geochemical data, and facilitate their integration with the broad array of other available earth science parameters. EarthChem is operated by a joint team of disciplinary scientists, data scientists, data managers and information technology developers who are part of the NSF-funded data facility Integrated Earth Data Applications (IEDA). IEDA is a collaborative effort of EarthChem and the Marine Geoscience Data System (MGDS). |

