
The Darwin VAAC reported that on 2 April an ash plume from Soputan was seen by a pilot drifting W at an altitude of 4.3 km (14,000 ft) a.s.l.
Source: Darwin Volcanic Ash Advisory Centre (VAAC)
Minor ash emissions during 23 March and 2 April 2020
Soputan is a stratovolcano located in the northern arm of Sulawesi Island, Indonesia. Previous eruptive periods were characterized by ash explosions, lava flows, and Strombolian eruptions. The most recent eruption occurred during October-December 2018, which consisted mostly of ash plumes and some summit incandescence (BGVN 44:01). This report updates information for January 2019-April 2020 characterized by two ash plumes and gas-and-steam emissions. The primary source of information come from the Pusat Vulkanologi dan Mitigasi Bencana Geologi (PVMBG) and the Darwin Volcanic Ash Advisory Center (VAAC).
Activity during January 2019-April 2020 was relatively low; three faint thermal anomalies were observed at the summit at Soputan in satellite imagery for a total of three days on 2 and 4 January, and 1 October 2019 (figure 17). The MIROVA (Middle InfraRed Observation of Volcanic Activity) based on analysis of MODIS data detected 12 distal hotspots and six low-power hotspots within 5 km of the summit during August to early October 2019. A single distal thermal hotspot was detected in early March 2020. In March, activity primarily consisted of white to gray gas-and-steam plumes that rose 20-100 m above the crater, according to PVMBG. The Darwin VAAC issued a notice on 23 March 2020 that reported an ash plume rose to 4.3 km altitude; minor ash emissions had been visible in a webcam image the previous day (figure 18). A second notice was issued on 2 April, where an ash plume was observed rising 2.1 km altitude and drifting W.
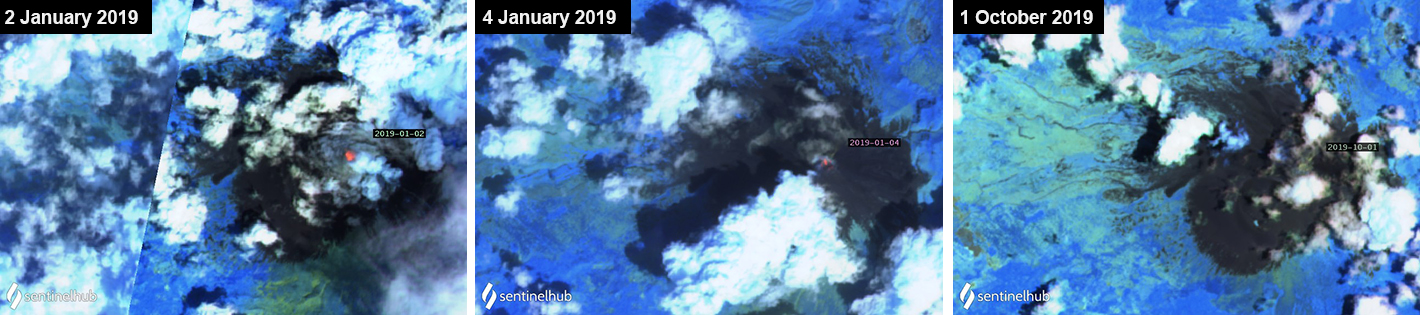 |
Figure 17. Sentinel-2 thermal satellite imagery detected a total of three thermal hotspots (bright yellow-orange) at the summit of Soputan on 2 and 4 January and 1 October 2019. Sentinel-2 atmospheric penetration (bands 12, 11, 8A) images courtesy of Sentinel Hub Playground. |
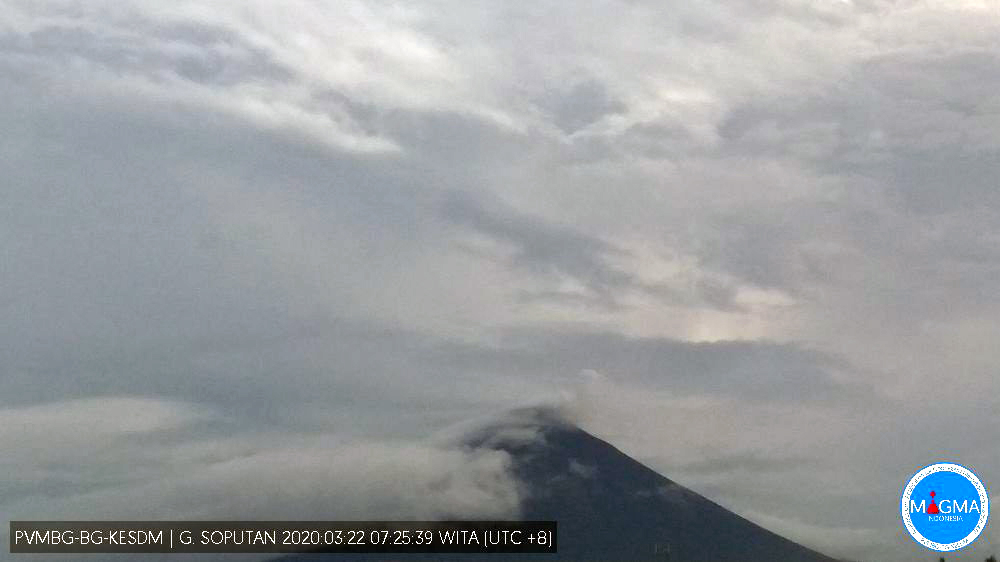 |
Figure 18. Minor ash emissions were seen rising from Soputan on 22 March 2020. Courtesy of MAGMA Indonesia. |
Information Contacts: Pusat Vulkanologi dan Mitigasi Bencana Geologi (PVMBG, also known as Indonesian Center for Volcanology and Geological Hazard Mitigation, CVGHM), Jalan Diponegoro 57, Bandung 40122, Indonesia (URL: http://www.vsi.esdm.go.id/); MAGMA Indonesia, Kementerian Energi dan Sumber Daya Mineral (URL: https://magma.vsi.esdm.go.id/); Darwin Volcanic Ash Advisory Centre (VAAC), Bureau of Meteorology, Northern Territory Regional Office, PO Box 40050, Casuarina, NT 0811, Australia (URL: http://www.bom.gov.au/info/vaac/); MIROVA (Middle InfraRed Observation of Volcanic Activity), a collaborative project between the Universities of Turin and Florence (Italy) supported by the Centre for Volcanic Risk of the Italian Civil Protection Department (URL: http://www.mirovaweb.it/); Sentinel Hub Playground (URL: https://www.sentinel-hub.com/explore/sentinel-playground).
2020: March
| April
2019: May
2018: September
| October
| December
2016: January
| February
| March
| April
2015: January
| February
| March
| May
| June
| July
| November
| December
2014: April
| August
| December
2013: April
| June
2012: May
| August
| September
| November
2011: June
| July
| August
| September
2008: June
| October
2007: June
| August
| October
2006: December
2005: April
| December
2004: October
| December
2003: July
| August
| September
The Darwin VAAC reported that on 2 April an ash plume from Soputan was seen by a pilot drifting W at an altitude of 4.3 km (14,000 ft) a.s.l.
Source: Darwin Volcanic Ash Advisory Centre (VAAC)
The Darwin VAAC reported that on 23 March an ash plume from Soputan was seen by a pilot rising to an altitude of 4.3 km (14,000 ft) a.s.l.
Source: Darwin Volcanic Ash Advisory Centre (VAAC)
PVMBG reported that during 22-28 May white plumes rose as high as 100 m above Soputan’s summit. On 27 May white-to-gray plumes rose 150 m high. The Alert Level remained at 3 (on a scale of 1-4). The public was advised not to approach the craters within a radius of 4 km, or 6.5 km on the WSW flank.
Source: Pusat Vulkanologi dan Mitigasi Bencana Geologi (PVMBG, also known as CVGHM)
PVMBG reported that seismic activity at Soputan rapidly and significantly increased at 1700 on 15 December. An eruption began at 0102 on 16 December though dark and foggy conditions prevented views of emissions. The event lasted for almost 10 minutes, and thunderous sounds were heard at the Soputan Volcano Observation Post located in Silian Raya (about 10 km SW). The conditions improved about two hours later, and a dense ash plume was visible rising 3 km above the summit and drifting SE. Incandescence from the summit was also visible. An event that began at 0540 produced dense gray-to-black ash plumes that rose as high as 7 km above the summit and drifted SE. The event lasted for 6 minutes and 10 seconds based on the seismic network. Ash plumes from events at 0743 and 0857 rose as high as 7.5 km and drifted SW. The Alert Level remained at 3 (on a scale of 1-4). Residents and tourists were advised not to approach the craters within a radius of 4 km, or 6.5 km on the WSW flank.
Source: Pusat Vulkanologi dan Mitigasi Bencana Geologi (PVMBG, also known as CVGHM)
On 16 October PVMBG issued a VONA noting only white emissions at Soputan; the Aviation Color Code was lowered to Yellow.
Source: Pusat Vulkanologi dan Mitigasi Bencana Geologi (PVMBG, also known as CVGHM)
Based on satellite images, information from PVMBG, and wind model data, the Darwin VAAC reported that on 4 October ash plumes from Soputan rose to 4.6 km (15,000 ft) a.s.l. and drifted W. The Alert Level remained at 3 (on a scale of 1-4); residents and tourists were advised not to approach the craters within a radius of 4 km, with an additional expansion to 6.5 km in WSW direction due to increased risk from a breach in the crater rim.
Sources: Pusat Vulkanologi dan Mitigasi Bencana Geologi (PVMBG, also known as CVGHM); Darwin Volcanic Ash Advisory Centre (VAAC)
PVMBG reported that increased seismicity at Soputan was notable on 2 October, characterized by an increased number of signals indicating emissions and avalanches (which began in September and mid-July, respectively), increased RSAM values, and a higher number of volcanic earthquakes (since September). Data from a thermal camera showed increased summit temperatures, indicating the presence of lava. The Alert Level was increased to 3 (on a scale of 1-4) on 3 October; residents and tourists were advised not to approach the craters within a radius of 4 km, with an additional expansion to 6.5 km in WSW direction due to increased risk from a breach in the crater rim. An eruption commenced at 0847 on 3 October, producing a dense ash plume that rose 4 km above the summit and drifted W and NW. Based on seismic data the event lasted six minutes. Events at 1044, 1112, and 1152 produced ash plumes that rose 2 km, 2.5 km , and 5 km above the crater rim, respectively. A thermal anomaly identified in satellite data significantly increased, and incandescent ejecta at the summit was clearly observed by residents. Avalanches of material traveled 2.5 km down the NE flank.
Sources: Pusat Vulkanologi dan Mitigasi Bencana Geologi (PVMBG, also known as CVGHM); Badan Nacional Penanggulangan Bencana (BNPB)
PVMBG reported that during 1-20 April diffuse white plumes from Soputan rose as high as 100 m above the crater and drifted E. The number of volcanic earthquakes and signals indicating avalanches declined. The Alert Level was lowered to 2 (on a scale of 1-4) on 21 April; residents and tourists were advised not to approach the craters within a radius of 4 km.
Source: Pusat Vulkanologi dan Mitigasi Bencana Geologi (PVMBG, also known as CVGHM)
PVMBG reported that during 4-11 April diffuse white plumes from Soputan rose as high as 100 m above the crater and drifted E. Seismicity was dominated by signals indicating avalanches and emissions; avalanche signals became less intense as compared to the previous week. A few volcanic and shallow volcanic earthquakes were detected during 6 and 9-10 April. The Alert Level was lowered to 2 (on a scale of 1-4); residents and tourists were advised not to approach the craters within a radius of 4 km. [Correction; the Alert Level remained at 3.]
Source: Pusat Vulkanologi dan Mitigasi Bencana Geologi (PVMBG, also known as CVGHM)
PVMBG reported that during 21-28 March diffuse white plumes from Soputan rose as high as 100 m above the crater and drifted E. Seismicity was dominated by signals indicating avalanches and emissions; shallow volcanic earthquakes were detected on 21 March. The Alert Level remained at 3 (on a scale of 1-4); residents and tourists were advised not to approach the craters within a radius of 6.5 km.
Source: Pusat Vulkanologi dan Mitigasi Bencana Geologi (PVMBG, also known as CVGHM)
PVMBG reported that during 22-29 February diffuse white plumes from Soputan rose as high as 75 m above the crater. Seismicity was dominated by signals indicating avalanches and emissions, though shallow volcanic and low-frequency earthquakes were also detected. The Alert Level remained at 3 (on a scale of 1-4); residents and tourists were advised not to approach the craters within a radius of 6.5 km.
Source: Pusat Vulkanologi dan Mitigasi Bencana Geologi (PVMBG, also known as CVGHM)
PVMBG reported that during 9-15 February diffuse white plumes from Soputan rose as high as 200 m above the crater. Seismicity was dominated by signals indicating avalanches and emissions, though volcanic and low-frequency earthquakes were also detected. The Alert Level remained at 3 (on a scale of 1-4); residents and tourists were advised not to approach the craters within a radius of 6.5 km.
Source: Pusat Vulkanologi dan Mitigasi Bencana Geologi (PVMBG, also known as CVGHM)
BNPB reported that explosions at Soputan were detected at 1300, 1437, and 2008 on 6 February; observers 10 km away saw dense reddish gray ash plumes rising 3 km above the crater. At 0106, 0204, 0311, and 0320 on 7 February Strombolian activity ejected tephra as high as 1 km above the crater. A pyroclastic flow traveled 2 km down the E flank. Thunderous sounds were reported, and dense ash plumes rose 2.5 km and drifted W. Constant tremor was detected. Ashfall was reported in multiple districts including Pasan (5 km SSE), Tombatu (16 km SSW), Belang (17 km SSE), and Ratatotok (20 km S). The Alert Level remained at 4 (on a scale of 1-4); residents and tourists were advised not to approach the craters within a radius of 4 km, or 6.5 km on the WSW flank. [Correction; the Alert Level remained at 3.]
Source: Badan Nacional Penanggulangan Bencana (BNPB)
On 6 January BNPB reported that several explosions had been detected since the Alert Level for Soputan was raised to 3 (on a scale of 1-4) on 4 January. Strombolian activity that began at 0350 on 5 January ejected incandescent material as high as 250 m above the crater. A booming sound at 0638 was followed by a pyroclastic flow that traveled 2.5 km down the ENE flank. Ash plumes rose 6.5 km above the crater and drifted W. Several villages in the districts of West Langowan (8 km E), Tompaso (11 km NE), and East Ratahan (14 km SE) reported ashfall. Residents and tourists were advised not to approach the craters within a radius of 4 km, or 6.5 km on the WSW flank.
Source: Badan Nacional Penanggulangan Bencana (BNPB)
PVMBG reported that during 28 December- 1 January white plumes rose 100 m above Soputan. Photos taken during 2-3 January showed that the plumes became denser and turned light gray, rising as high as 300 m. Thermal images revealed incandescence in Puncak Crater. Seismicity increased significantly on 4 January. At 1800 PVMBG raised the Alert Level to 3 (on a scale of 1-4). Residents and tourists were advised not to approach the craters within a radius of 4 km, or 6.5 km on the WSW flank. BNPB reported that at 2053 an explosion produced a dense gray ash plume that rose as high as 2 km and drifted SE. Lava flowed down the E flank and roaring was reported. Minor ashfall occurred in Langowan (8 km ENE).
Sources: Pusat Vulkanologi dan Mitigasi Bencana Geologi (PVMBG, also known as CVGHM); Badan Nacional Penanggulangan Bencana (BNPB)
PVMBG reported that during 3-18 November white plumes were observed rising as high as 200 m above Soputan even though inclement weather sometimes obscured crater views. Seismicity was dominated by emission and avalanche signals, but was also characterized by low-frequency signals and volcanic earthquakes. The Alert Level remained at 2 (on a scale of 1-4). Residents and tourists were advised not to approach the craters within a radius of 1.5 km, or 2.5 km on the WSW flank.
Source: Pusat Vulkanologi dan Mitigasi Bencana Geologi (PVMBG, also known as CVGHM)
PVMBG reported that during June-3 July white plumes were observed rising as high as 750 m above Soputan even though inclement weather sometimes obscured crater views. Seismicity during the previous three months had declined (specifically shallow volcanic earthquakes, volcanic earthquakes, and signals indicating emissions and avalanches) but remained higher than levels recorded prior to the elevated activity which lead to the Alert Level increase on 26 December 2014. Low-frequency harmonic tremor was occasionally detected. The Alert Level was lowered to 2 (on a scale of 1-4). Residents and tourists were advised not to approach the craters within a radius of 4 km, or 6.5 km on the WSW flank.
Source: Pusat Vulkanologi dan Mitigasi Bencana Geologi (PVMBG, also known as CVGHM)
PVMBG reported that during 10-17 June white plumes were observed rising as high as 500 m above Soputan even though inclement weather sometimes obscured crater views. Variable seismicity was dominated by volcanic earthquakes and signals indicating emissions and avalanches. Low-frequency harmonic tremor was occasionally detected. The Alert Level remained at 3 (on a scale of 1-4). Residents and tourists were advised not to approach the craters within a radius of 4 km, or 6.5 km on the WSW flank.
Source: Pusat Vulkanologi dan Mitigasi Bencana Geologi (PVMBG, also known as CVGHM)
PVMBG reported that during 20-27 May white plumes were observed rising as high as 100 m above Soputan even though inclement weather sometimes obscured crater views. Variable seismicity was dominated by volcanic earthquakes and signals indicating emissions and avalanches. Low-frequency harmonic tremor was occasionally detected. The Alert Level remained at 3 (on a scale of 1-4). Residents and tourists were advised not to approach the craters within a radius of 4 km, or 6.5 km on the WSW flank.
Source: Pusat Vulkanologi dan Mitigasi Bencana Geologi (PVMBG, also known as CVGHM)
PVMBG reported that during 6-13 May white plumes were observed rising as high as 100 m above Soputan even though inclement weather sometimes obscured crater views. Seismicity fluctuated; volcanic earthquakes continued to be recorded. The Alert Level remained at 3 (on a scale of 1-4). Residents and tourists were advised not to approach the craters within a radius of 4 km, or 6.5 km on the WSW flank.
Source: Pusat Vulkanologi dan Mitigasi Bencana Geologi (PVMBG, also known as CVGHM)
Based on information from PVMBG and weather models, the Darwin VAAC reported that on 7 March an eruption at Soputan generated ash plumes that rose to an altitude of 9.1 km (30,000 ft) a.s.l. and drifted 260 km SE and SW. A thermal anomaly was detected in satellite images. BNPB noted that the eruption occurred at 1709, and produced ash plumes that rose 4.5 km above the crater and drifted E. Pyroclastic flows traveled 2.5 km down the W flank. Minor ashfall was reported in the Silian Raya district, Touluaan, Tombatu, and party in the districts of Pasan and Rataha. The Alert Level remained at 3 (on a scale of 1-4). The next day the VAAC noted that an ash plume rose to an altitude of 3.7 km (12,000 ft) a.s.l. and drifted almost 95 km SE.
Sources: Badan Nacional Penanggulangan Bencana (BNPB); Darwin Volcanic Ash Advisory Centre (VAAC)
Based on information from PVMBG and weather models, the Darwin VAAC reported that during 11-12 February an eruption at Soputan generated ash plumes that rose to an altitude of 3.7 km (12,000 ft) a.s.l. and drifted almost 30 km SE. Ash was not identified in satellite images due to darkness and meteorological clouds.
Source: Darwin Volcanic Ash Advisory Centre (VAAC)
Based on satellite images and weather models, the Darwin VAAC reported that on 8 February an ash plume from Soputan rose to an altitude of 3 km (10,000 ft) a.s.l. and drifted 30 km SSE.
Source: Darwin Volcanic Ash Advisory Centre (VAAC)
Based on statements from PVMBG, the Darwin VAAC reported that on 2 February an ash plume from Soputan rose to an altitude of 6.1 km (20,000 ft) a.s.l. A thermal anomaly was visible in satellite images; ash was not visible at the reported altitude, but possible ash was detected to the N at 3 km (10,000 ft) a.s.l.
Source: Darwin Volcanic Ash Advisory Centre (VAAC)
Based on analyses of satellite imagery and wind data, the Darwin VAAC reported that on 21 January an ash plume from Soputan rose to an altitude of 3.7 km (12,000 ft) a.s.l. and drifted over 35 km SW.
Source: Darwin Volcanic Ash Advisory Centre (VAAC)
Based on a SIGMET, the Darwin VAAC reported that an ash plume from Soputan rose to an altitude of 5.5 km (18,000 ft) a.s.l. on 18 January. BNPB reported that an eruption at 1138 that same day generated an ash plume that rose 4 km and drifted SW; the report did not specify if 4 km was height above volcano or altitude a.s.l. Strombolian activity ejected material 500 m above the crater and incandescent avalanches of material traveled 500 m down the SW flank. The Alert Level was at 3 (on a scale of 1-4).
Sources: Badan Nacional Penanggulangan Bencana (BNPB); Darwin Volcanic Ash Advisory Centre (VAAC)
BNPB reported that an eruption at Soputan began at 1447 on 6 January. Observers at a nearby post reported a dense gray-to-black ash plume rising about 6.5 km above the summit and drifting ESE. Lava flows traveled 2 km down the WSW flank. The Alert Level remained at 3 (on a scale of 1-4). Based on ground reports from that same day, the Darwin VAAC reported that a significant eruption generated a plume that rose to an altitude of 8.2 km (27,000 ft) a.s.l. No ash was observed in satellite images due to weather clouds in the area.
Sources: Badan Nacional Penanggulangan Bencana (BNPB); Darwin Volcanic Ash Advisory Centre (VAAC)
PVMBG noted that the Alert Level for Soputan was lowered to 1 (on a scale of 1-4) on 8 August and recommended people not approach within 1.5 km of the summit or within 4 km of the summit on the W.
Source: Pusat Vulkanologi dan Mitigasi Bencana Geologi (PVMBG, also known as CVGHM)
PVMBG reported that during April diffuse white plumes from Soputan rose at most 100 m. During 30 April-1 May seismic activity significantly increased, characterized by signals indicating deep volcanic earthquakes and avalanches. On 1 May the Alert Level was raised to 3 (on a scale of 1-4). Residents and tourists were advised not to approach the craters within a radius of 6.5 km.
Source: Pusat Vulkanologi dan Mitigasi Bencana Geologi (PVMBG, also known as CVGHM)
On 14 June CVGHM reported that, after the Alert Level at Soputan was raised to 3 (on a scale of 1-4) on 19 April due to a trend of increased seismicity, the number of various types of earthquakes decreased, except for events signaling avalanches, which fluctuated during the period. No changes were observed in emissions; white plumes continued to rise at most 50 m above the crater. On 14 June the Alert Level was lowered to 2. Residents and tourists were advised not to approach the craters within a radius of 4 km.
Source: Pusat Vulkanologi dan Mitigasi Bencana Geologi (PVMBG, also known as CVGHM)
CVGHM reported that seismicity at Soputan increased during January-18 April and then significantly increased on 19 April. The Alert Level was raised to 3 (on a scale of 1-4) on 19 April. Visitors and residents were prohibited from going within a 6.5-km radius of the crater.
Source: Pusat Vulkanologi dan Mitigasi Bencana Geologi (PVMBG, also known as CVGHM)
CVGHM reported that seismicity at Soputan decreased during 1-26 November. The Alert Level was lowered to 2 (on a scale of 1-4) on 27 November.
Source: Pusat Vulkanologi dan Mitigasi Bencana Geologi (PVMBG, also known as CVGHM)
Based on information from the US Air Force Weather Agency (AFWA), the Support to Aviation Control Service (SACS), and CVGHM, the Darwin VAAC reported that an ash plume from Soputan rose to an altitude of 9.1 km (30,000 ft) a.s.l. on 19 September. Later that day an ash plume rose to an altitude of 2.4 km (8,000 ft) a.s.l.
Source: Darwin Volcanic Ash Advisory Centre (VAAC)
Based on information from US Air Force Weather Agency (AFWA), the Darwin VAAC reported that an ash plume from Soputan rose to an altitude of 9.1 km (30,000 ft) a.s.l. on 18 September. The VAAC also noted that a sulfur dioxide alert was issued by the Support to Aviation Control Service (SACS).
Source: Darwin Volcanic Ash Advisory Centre (VAAC)
CVGHM reported that the Alert Level for Soputan had been lowered to 2 (on a scale of 1-4) on 26 June. Seismicity increased during 8-22 August; on 23 August volcanic earthquakes and avalanches significantly increased. White plumes rose 50-150 m above the crater. An eruption at 1936 on 26 August ejected incandescent tephra 50 m above the crater and produced a plume that rose 1 km and drifted W. The Alert Level was raised to 3.
Based on information from CVGHM, NOAA, and analysis of satellite imagery, the Darwin VAAC reported that on 27 August an ash plume rose to an altitude of 12.1 km (40,000 ft) a.s.l. and drifted 150 km W. The eruption lasted four hours. Later, a plume detected in satellite imagery rose to an altitude of 6.1 km (20,000 ft) a.s.l. On 28 August an ash plume drifted 220 km SW at an altitude of 6.1 km (20,000 ft) a.s.l.
Sources: Darwin Volcanic Ash Advisory Centre (VAAC); Pusat Vulkanologi dan Mitigasi Bencana Geologi (PVMBG, also known as CVGHM)
According to NASA's Earth Observatory, a satellite image acquired on 8 August showed a small volcanic plume rising from Soputan.
Source: NASA Earth Observatory
CVGHM reported that observers in the village of Maliku noted that during 21-27 May white plumes rose 50-150 m above the crater of Soputan. Seismicity increased significantly on 25 May. CVGHM raised the Alert Level to 3 (on a scale of 1-4) on 28 May based on visual observations and increased seismicity.
Source: Pusat Vulkanologi dan Mitigasi Bencana Geologi (PVMBG, also known as CVGHM)
CVGHM reported that seismicity at Soputan significantly decreased after the eruption on 14 August until 7 September. White plumes rose at most 200 m above the crater during 14-18 August, up to 150 m above the crater during 19-28 August, and as high as 100 m above the crater during 29 August-7 September. The Alert Level was lowered to 2 (on a scale of 1-4) on 8 September. Visitors and residents were prohibited from going within a 4-km radius of the crater, a change from the 6-km restricted zone in place when the Alert level was at 3.
Source: Pusat Vulkanologi dan Mitigasi Bencana Geologi (PVMBG, also known as CVGHM)
CVGHM reported that during 19 July-13 August white plumes from Soputan's summit crater rose 50-150 m. Seismicity fluctuated, but declined overall until 10 August. On 14 August a gray-and-white eruption plume rose 1 km above the crater. Throughout the day, two more similar plumes rose 1.3 km above the crater. Based on analysis of satellite imagery, the Darwin VAAC reported that an ash plume drifted more than 100 km W. The Alert Level was raised to 3 (on a scale of 1-4). Visitors and residents were prohibited from going within a 6-km radius of the crater.
Sources: Pusat Vulkanologi dan Mitigasi Bencana Geologi (PVMBG, also known as CVGHM); Darwin Volcanic Ash Advisory Centre (VAAC)
CVGHM reported that on 3 July an explosion of incandescent material from Soputan was followed by a 6-km-high ash plume and a pyroclastic flow that traveled as far as 4 km W. Later that day a dense white plume rose 50 m above the crater. On 20 July CVGHM noted that since 4 July seismicity had decreased and only diffuse white plumes rose 75 m above the crater until 18 July. The Alert Level was lowered to 2 (on a scale of 1-4) on 19 July. Visitors and residents were prohibited from going within a 4-km radius of the crater.
Source: Pusat Vulkanologi dan Mitigasi Bencana Geologi (PVMBG, also known as CVGHM)
CVGHM reported that during June diffuse white plumes from Soputan rose 25-150 m. During 21 June-2 July seismicity increased, and on 2 July the Alert Level was raised to 3 (on a scale of 1-4). Visitors and residents were discouraged from going within a 6-km radius of the crater and climbing the volcano was prohibited. According to news articles, a CVGHM volcanologist reported that a Strombolian eruption that began on 3 July produced an ash plume that rose 6 km and drifted W. Ashfall impacted villages, trees, and vegetation downwind. Sam Ratulangi International airport in the capital of Manado was closed for three hours. Articles also stated that the Red Cross distributed about 31,000 masks to area residents.
Sources: Jakarta Globe; Pusat Vulkanologi dan Mitigasi Bencana Geologi (PVMBG, also known as CVGHM); VIVA News; Jakarta Globe
CVGHM reported that the Alert Level for Soputan was lowered from 3 to 2 (on a scale of 1-4) on 21 October. CVGHM reported additional information describing the eruption that prompted the Alert Level increase on 6 October. Gray plumes rose to an altitude of 2.8 km (9,200 ft) a.s.l. and were accompanied by Strombolian activity that ejected incandescent material 50-150 m above the crater. On 7 October, white plumes rose to altitudes of 2.3-3.3 km (7,500-10,800 ft) a.s.l. Incandescent material was again ejected 50-150 m from the crater. Incandescent rockfalls traveled 500 m W. The next day, plumes rose to an altitude of 2 km (6,600 ft) a.s.l.
Source: Pusat Vulkanologi dan Mitigasi Bencana Geologi (PVMBG, also known as CVGHM)
Based on visual observations, CVGHM reported that on 6 October a "smoke" plume from Soputan rose to an altitude of 2.8 km (9,200 ft) a.s.l. and incandescent material was ejected 25 m above the summit. The Alert level was raised from 2 to 3 (on a scale of 1-4). Residents and tourists were advised not go within a 6 km radius of the summit.
Analysis of satellite imagery by the Darwin VAAC indicated that on 6 October an ash plume rose to an altitude of 7.6 km (25,000 ft) a.s.l. and drifted W.
Sources: Pusat Vulkanologi dan Mitigasi Bencana Geologi (PVMBG, also known as CVGHM); Darwin Volcanic Ash Advisory Centre (VAAC)
CVGHM reported that the eruption of Soputan during 6-7 June caused part of the crater wall to collapse creating an opening to the W, and the diameter of the crater to increase. Ash plumes generated on 6 June drifted NW, W, SW, and as far as 60 km S. Ash deposits were about 4 cm thick in an area 5 km NW. A nearby coconut plantation reported damage to trees. During 7-18 June, seismicity decreased and white plumes at altitudes at or less than 1.8 km (5,900 ft) a.s.l. were spotted when clouds did not inhibit observations. On 18 June, the Alert Level was decreased to 2 (on a scale of 1-4).
Source: Pusat Vulkanologi dan Mitigasi Bencana Geologi (PVMBG, also known as CVGHM)
CVGHM reported that during May, deformation from Soputan was detected. During 1-6 June, seismicity increased. On 6 June, a pyroclastic flow possibly generated by a rockfall avalanche traveled about 1.5 km down the E flank. The Alert Level was raised to 3 (on a scale of 1-4). Residents and tourists were advised not go within a 6 km radius of the summit.
Based on observations of satellite imagery, the Darwin VAAC reported that an ash plume rose to an altitude of 13.7 km (45,000 ft) a.s.l. on 6 June and drifted SW.
Sources: Pusat Vulkanologi dan Mitigasi Bencana Geologi (PVMBG, also known as CVGHM); Darwin Volcanic Ash Advisory Centre (VAAC)
Based on visual observations during clear weather, CVGHM reported that on 25, 26, 30 and 31 October, white and gray plumes from Soputan rose to altitudes of 1.8-3.3 km (5,900-10,800 ft) a.s.l. and drifted W. A lava flow traveled between 500-600 m down the W flank on 25 October and was again spotted on 30 October. The Alert Level remained at 3 (on a scale of 1-4) and villagers and tourists were advised not go within a 6 km radius of the summit.
Based on visual observations during clear weather, CVGHM reported that on 25, 26, 30 and 31 October, white and gray plumes from Soputan rose to altitudes of 1.8-3.3 km (5,900-10,800 ft) a.s.l. and drifted W. A lava flow traveled between 500-600 m down the W flank on 25 October and was again spotted on 30 October. The Alert Level remained at 3 (on a scale of 1-4) and villagers and tourists were advised not go within a 6 km radius of the summit.
Sources: Pusat Vulkanologi dan Mitigasi Bencana Geologi (PVMBG, also known as CVGHM); Darwin Volcanic Ash Advisory Centre (VAAC)
According to news articles, an eruption from Soputan on 14 August produced ash plumes to an altitude of 3.3 km (10,800 ft) a.s.l. Lava and rock avalanches were also observed. On 15 August, seismic activity decreased. The Alert Level remained at 3 (on a scale of 1-4).
Sources: Reuters; Antara News; Associated Press
Based on visual observations, CVGHM reported that during 18-25 June diffuse ash plumes from Soputan rose to an altitude of 1.8 km (5,900 ft) a.s.l. The Alert Level remained at 3 (on a scale of 1-4).
Source: Pusat Vulkanologi dan Mitigasi Bencana Geologi (PVMBG, also known as CVGHM)
According to CVGHM, seismic signals from rockfalls increased at Soputan during 11-13 December. On 14 December, ash clouds rose to an altitude of 2 km (6,600 ft) a.s.l. and ash fell within a 15 km radius of the peak. The emissions were accompanied by thunderous noises that were heard 8 km from the peak. On 15 December the Alert Level was raised from 2 to 3 (on a scale of 1-4) due to this increase in activity.
Source: Pusat Vulkanologi dan Mitigasi Bencana Geologi (PVMBG, also known as CVGHM)
A phreatic eruption began at Soputan on 26 December around 1230 following heavy rain that contacted lava at the volcano's summit. On 27 December at 0400, a Strombolian eruption began that lasted ~50 minutes. Incandescent volcanic material was ejected ~35 m, and avalanches of volcanic material traveled as far as 750 m E. Around 0640 the avalanches became larger, as pyroclastic avalanches occurred from the edge of the lava. The avalanches extended 200 m E, and booming noises were heard as far as 5 km from the summit. The Darwin VAAC reported that an ash plume reached a height of ~5.8 km (~19,000 ft) a.s.l. and drifted SE.
As of 28 December, eruptive activity continued at Soputan, producing ash plumes to a height of ~1 km above the volcano (or 9,100 ft a.s.l.). Strombolian eruptions continued, ejecting incandescent volcanic material up to 200 m above the summit (or 6,500 ft a.s.l.). Pyroclastic avalanches traveled ~500 m E and SW. This was the fourth event at Soputan in 2005, with previous activity on 14 and 20 April, and on 12 September. The Alert Level remained at 2, since the volcano is about 11 km from the nearest settlement. Visitors are prohibited from climbing Soputan's summit and camping around Kawah Masem.
Sources: Pusat Vulkanologi dan Mitigasi Bencana Geologi (PVMBG, also known as CVGHM); Darwin Volcanic Ash Advisory Centre (VAAC)
Soputan began to erupt on 20 April at 0630, with a plume reaching ~1 km above the volcano's summit (~9,100 ft a.s.l.) and drifting SE. In addition, lava fountains rose ~200 m above the volcano (~6,500 ft a.s.l.). During 20 April at 1720 to 21 April at 0900, lava fountains rose 75-100 m above the volcano (6,100-6,200 ft a.s.l.). Rapid dome growth occurred and by 21 April the lava dome had spread about 250 m E and 200 m SW. On 22 April a "white ash plume" rose ~100 m above the volcano (~6,200 ft. a.s.l.) and on 23 April a "dark gray ash" plume rose to ~150 m (~6,300 ft a.s.l.) and drifted NE. Ash eruptions continued through 24 April, producing plumes to ~300 m above the volcano (~6,800 ft a.s.l.). Soputan was at Alert Level 2 (on a scale of 1-4).
Source: Pusat Vulkanologi dan Mitigasi Bencana Geologi (PVMBG, also known as CVGHM)
According to DVGHM, an eruption at Soputan on 12 December around 0050 produced an E-drifting ash cloud to ~1 km above the volcano. It was followed by a "hot cloud" that traveled about 200 m E and a lava flow that traveled SW. The eruption was preceded by an increase in tremor on 11 December and incandescence that was visible in the crater. DVGHM increased the Alert Level at Soputan to 2 (on a scale of 1-4). According to the Darwin VAAC an eruption cloud was visible on satellite imagery on 12 December at 0925 at a height of ~10.7 km a.s.l.
Sources: The Jakarta Post; Associated Press; Pusat Vulkanologi dan Mitigasi Bencana Geologi (PVMBG, also known as CVGHM); Darwin Volcanic Ash Advisory Centre (VAAC); Agence France-Presse (AFP)
According to DVGHM, volcanic tremor at Soputan began to increase to levels above normal on 18 October at 0930. In response, officials raised the Alert Level to Orange or 2 (on a scale of 1-4). Soputan erupted on 18 October at 1041, producing an E-drifting ash cloud to a height of ~600 m above the volcano's crater. At 1815 incandescence was visible reflecting 25-30 m above the crater's rim. Later that day, a "lava avalanche" traveled towards the S.
According to a news report, "ash and smoke" covered several parts of the nearby Minahasa regency and damaged hundreds of plantations along the mountain's slopes. Also, clouds of ash disrupted activities of residents in W Langowan district, where visibility fell to between 10 and 30 m. An official in the district said local homes were covered by up to 4 cm of ash. In the town of Palu, visibility decreased to 7 km. No evacuations were ordered.
Sources: The Jakarta Post; Pusat Vulkanologi dan Mitigasi Bencana Geologi (PVMBG, also known as CVGHM); Agence France-Presse (AFP)
An ash emission from Soputan on 4 September produced a cloud that rose to ~3 km a.s.l., extended ~75 km N of the summit, and was visible on satellite imagery. Soputan was at Alert Level 2 (on a scale of 1-4).
Source: Darwin Volcanic Ash Advisory Centre (VAAC)
On 2 September ash emissions from Soputan rose to ~2 km a.s.l. and drifted S and W. The Alert Level was raised from 2 to 3 (on a scale of 1-4).
Source: Darwin Volcanic Ash Advisory Centre (VAAC)
Activity decreased at Soputan after an eruption occurred on 18 July. During 21-25 July, incandescent lava on the volcano's W slope gradually cooled and on 22 July volcanic tremor stopped. Ash explosions sporadically occurred, but their density and maximum height decreased. Small-amplitude tremor was continuously recorded. As of 25 July the Alert Level at Soputan was at 2 (on a scale of 1-4).
Source: Pusat Vulkanologi dan Mitigasi Bencana Geologi (PVMBG, also known as CVGHM)
High levels of volcanic and seismic activity occurred at Soputan during mid-July. On 17 July at 1900 the Alert Level was raised to 2 (on a scale of 1-4) after incandescence was seen at the lava dome for about a day. Around 1150 the amplitude of volcanic tremor increased and at 1900 an increased level of incandescence was seen. On 18 July at 0630 incandescent lava avalanches suddenly occurred that were not proceeded by explosions or loud sounds. The avalanches were accompanied by a pyroclastic surge towards the WNW and an ash cloud that rose ~2 km above the summit. The cloud drifted N, depositing ash around the area of Tombasian, Tareran, Tompaso, Kawangkoan, Sonder, Tomohon, and Manado. The same day the Alert Level was raised to 3. On 19 July there were pyroclastic flows, ash explosions, Strombolian activity, and lava emission at the lava dome. Ash explosions continued through at least 21 July. According to news reports, some residents in villages near the volcano fled, including those in the villages of Kota Menara, Amurang, and Maliku around 10 km S of the volcano.
Sources: Pusat Vulkanologi dan Mitigasi Bencana Geologi (PVMBG, also known as CVGHM); Terra Daily News; Darwin Volcanic Ash Advisory Centre (VAAC); The Jakarta Post
Reports are organized chronologically and indexed below by Month/Year (Publication Volume:Number), and include a one-line summary. Click on the index link or scroll down to read the reports.
Explosions eject large plumes
An explosive eruption began 26 August at 1142. Ash rose to 3 km above the summit crater at 1300. Ash fell on a village 7 km SE of the volcano and lightning was observed at night. Detonations and roaring sounds followed the explosions. The 850 inhabitants of a village on the flanks of the volcano moved to nearby towns. Indonesian authorities issued a warning notice to aircraft.
An image returned by the GMS satellite at 1400 showed a fairly dense plume, ~120 km in diameter, emerging from Soputan. Four hours later, a Cathay Pacific Airlines pilot estimated that the top of the cloud was at ~15 km, well above his flight altitude. At 2000, a satellite image showed continued vigorous feeding of the plume, which extended ~700 km W from the volcano to 119°E, where it was ~350 km wide. On this image, the plume appeared to be rising to roughly the cirrus cloud level, in the upper troposphere. By midnight, feeding of the plume was weakening, and on the next image, at 0200 on 27 August, the plume was detached from the volcano.
Satellite imagery showed renewed activity shortly before 0800. A plume about the same size as the one ejected the previous day moved W. Light ashfall started at 0915 on a town about 40 km N of the volcano. Feeding of the plume continued until about 1400. An additional seismograph was installed 27 August at a site 5 km S of Soputan.
Antara radio reported a third, smaller, explosive episode 28 August. Hot ash, but no large tephra, was ejected from dawn to about midday, accompanied by thunderous sounds. Ash fell on 12 villages around the volcano, but there were no casualties. No additional explosions were reported until 16 September, when an eruption plume appeared on satellite imagery. Antara reported five explosions that day.
Geologists had visited the volcano two days before the eruption began but saw no increased surface activity. They measured fumarole temperatures of 76°, 79°, and 84°C. Soputan last erupted in 1973.
Information Contacts: A. Sudradjat, VSI; T. Baldwin, D. Haller, and M. Matson, NOAA; Antara News Agency, Jakarta.
Explosive activity continues
At 1700 on 16 September the GMS satellite showed a plume extending WSW from the volcano, at about the cirrus cloud level. By midnight, the plume was less dense, but feeding from the volcano appeared to be continuing. Antara radio reported that an explosion at 0120 on 17 September ejected hot ash, pebbles, and rocks 10-40 cm in diameter. Other explosions occurred at 1014, 1129, 1132, and 1715 the same day. Ejecta sometimes rose to 2 km above the summit. An ash cloud remained over the area for 18 hours. At 1100 on 18 September, a GMS image showed the cloud from a moderate to intense explosion that probably began about 1000 and ended around 1300-1400. No additional activity has been reported (table 1).
Table 1. Cloud-top temperatures for three plumes from Soputan determined by Michael Matson from NOAA 7 polar orbiting satellite images, with altitudes calculated from nearby radiosonde temperature/altitude profiles.
| Date | Time | Temperature | Altitude |
| 26 Aug 1982 | 1500 | -72°C | 15 km |
| 27 Aug 1982 | 1500 | -37°C | 10 km |
| 18 Sep 1982 | 1330 | -65°C | 14 km |
Information Contacts: M. Matson, D. Haller, and T. Baldwin, NOAA; Antara News Agency, Jakarta.
Strongest explosion since eruption began
VSI reported that explosive activity resumed at 2045 on 9 November. Ash rose to ~5 km altitude and was blown NW, falling in the city of Amurang, 20 km away. A light ashfall was also reported at the VSI's Kakaskasen Observatory, 30 km N of Soputan. Newspapers reported that ash fell 40 km from the volcano and that within hours streets near the volcano were covered by as much as 10 cm of ash, halting traffic in many areas. VSI reported that rumbling and detonations accompanied the activity, and lightning flashes were observed at 4 km altitude. The eruption ended at about 1800 on 10 November, and no rumbling was heard that night.
A VSI seismograph at Silian, 6 km S of the volcano, recorded tremors for 4 hours before the eruption. The Teledyne seismograph, set at a magnification of 2,000, indicated a maximum amplitude of 6 mm during the early morning of 10 November and 4 mm in the afternoon. Deep (tectonic) earthquakes and two shallow volcanic events also preceded the explosive activity.
The GMS satelliteshowed no activity from Soputan at 1700, but on the next image, at 2000, there was a plume extending ~150 km W from the volcano. From the plume's development and rate of drift, satellite specialists estimated that gas emission had begun shortly after 1700, or well before the first explosive activity noticed on the ground at 2045. By 0200 on 10 November, relatively diffuse, apparently low-level material was drifting N and NW, while higher-altitude ejecta formed a dense plume that moved almost directly W. Satellite data continued to show feeding of the cloud through 1400 on 10 November. On the next image, at 1700, the cloud had separated from the volcano. By 2000, a plume with dense and diffuse patches extended from about 3°N, 123°E to 4°S, 117°E, a length of more than 1,000 km, and had a maximum width of ~500 km, considerably larger than the August and September plumes.
Further Reference. Sawada, Y., 1983, Attempt on surveillance of volcanic activity by eruption cloud image from artificial satellite: Bulletin of the Volcanological Society of Japan, v. 28, p. 357-373.
Information Contacts: A. Sudradjat and Suratman, VSI; D. Haller and M. Matson, NOAA; Sinar Harapan, Jakarta; AFP.
Tephra eruption
Soputan erupted from 24 May at 2243 until 26 May at 0300. An ash column rose to 4 km and moved W. Ash and sand-sized tephra fell on the area W of the volcano, forming a deposit >10 cm thick over ~75 km and 1-10 cm thick over an additional 125 km. Although there were no people within the danger zone, ~3,000 were in the alert zone. About 350 spontaneously evacuated from the area, where the primary cultivation is of coconut palms. Manado and Gorontalo airports (~50 km NNE and ~200 km SW of Soputan) were closed 26 and 27 May.
As of 30 May, no volcanic earthquakes had been recorded, although two tectonic events were detected. No premonitory activity was observed.
Information Contacts: A. Sudradjat, VSI.
Ash eruption follows local seismicity
A 5-hour explosive eruption occurred at Soputan on 31 August, the first activity since the 24-26 May tephra ejection. VSI seismic instruments recorded a progressive increase in local seismicity beginning 6 August. On 14 August, a sequence of tremors appeared between 0400 and 0800, with amplitude increasing to 25 mm (at 2,000 magnification). VSI issued a warning to civil authorities and an alert was put into effect on the 14th. Seismicity continued 15-25 August with an irregular number of A-and B-type events, averaging 1-2/day. From 25 August until the time of the eruption, seismicity totally stopped, increasing suspicion among VSI scientists that an eruption was possible.
The eruption started at 0709 on 31 August and lasted until about noon. An ash column rose to ~6 km and moved NE. Authorities and area residents were well-prepared, and neither casualties nor an evacuation were reported. Press sources reported that the ash cloud could be seen from Manado, the provincial capital 5 km to the NNE. The ash cloud covered a large area and disrupted traffic on the trans-Sulawesi highway.
On 31 August at 1457, a visible-band image from the NOAA 7 polar orbiting satellite showed a plume extending ~450 km W from the volcano. The plume was quite dense and ~120 km wide.
Information Contacts: A. Sudradjat, VSI; M. Matson, NOAA; UPI.
Plumes from the May and August 1984 eruptions seen on satellite images
Yosihiro Sawada observed a series of plumes from the May and August 1984 eruptions of Soputan (table 2) on images from the GMS satellite. In 9:5, Adjat Sudradjat reported that Soputan erupted from 24 May at 2243 until 26 May at 0300, depositing tephra west of the volcano. A GMS infrared image 25 May at 2300 shows a nearly circular plume rising from the volcano. By the time of the next image, at 0500 the next day, a large eruption cloud was evident, but feeding from the volcano had ended 2 hours before. Six hours later, the plume was clearly detached from the volcano. A 5-hour explosive eruption of Soputan started 31 August at 0709 and lasted until about noon. A circular eruption column was evident less than an hour after the start of the activity (figure 1, left) and a large plume was visible 6 hours later, about 2 hours after the eruption ended (figure 1, right).
Table 2. Dimensions of plumes from Soputan determined from GMS images by Yosihiro Sawada.
| Date | Hour | Density | Width (km) | Length (km) | Movement direction | Minimum plume temperature |
| 25 May 1984 | 2300 | dense | 60 | 60 | circular | -79°C |
| 26 May 1984 | 0500 | dense | 190 | 240 | NW | -82°C |
| 26 May 1984 | 1100 | dense | 160 | 330 | NW | -70°C |
| 26 May 1984 | 1700 | diffuse | 460 | 440 | W | -- |
| 31 Aug 1984 | 0800 | dense | 30 | 40 | circular | -74°C |
| 31 Aug 1984 | 1400 | dense | 350 | 420 | W | -75°C |
| 31 Aug 1984 | 2000 | diffuse | 430 | 660 | W | -- |
| 01 Sep 1984 | 0200 | diffuse | 430 | 360 | W | -- |
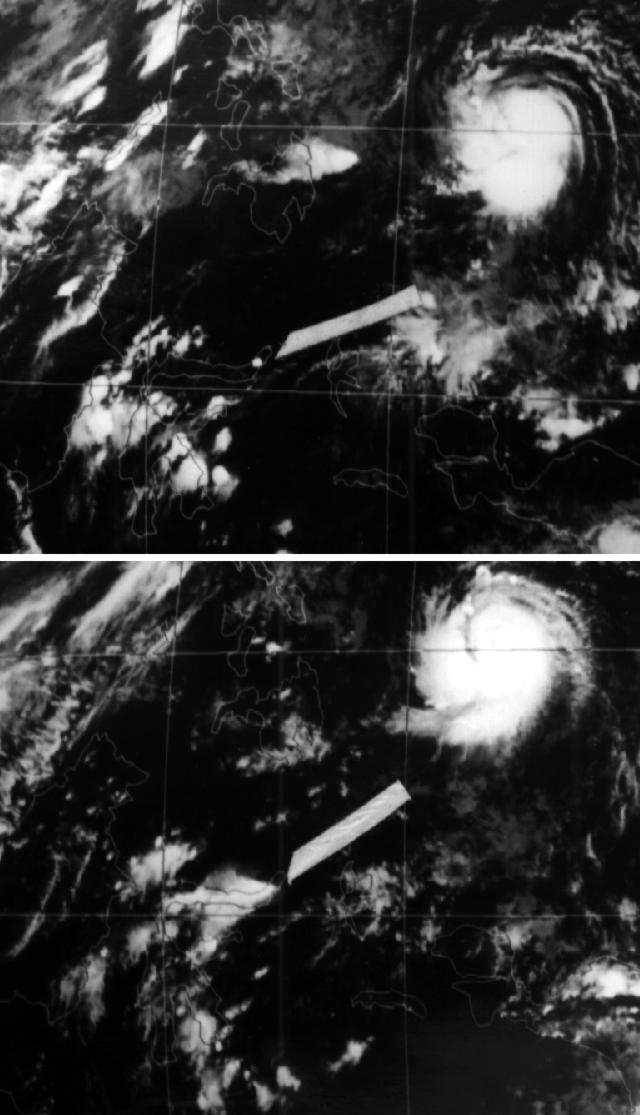 |
Figure 1. GMS infrared satellite images with arrows pointing to eruption clouds from Soputan 31 August 1984 at 0800 (top), and 1400 (bottom). Courtesy of Yosihiro Sawada. |
Information Contacts: Y. Sawada, MRI, Tsukuba.
Seven-hour tephra eruption; jumbo jet flies through plume
An ash eruption from Soputan's main crater occurred 19-20 May from 1815 to 0130. The eruption column rose to 4 km altitude, and ~2 cm of ash (fine to coarse) accumulated at villages (Kawangkoan, Langoan, Noongan, and Ratahan) 9-12 km from the crater. There were no casualties and no evacuations were necessary. The volcano has remained quiet since 22 May.
On 20 May at 0058, a jumbo jet en route from Hong Kong to Sydney, Australia, with 267 passengers and 16 crew members encountered the ash cloud ~80 km SSE of the volcano (approximately 0.5°N, 124.54°E). An orange glow discharged from the nose of the aircraft and orange sparks passed over the windshield. Engine inlets were illuminated by a white light. A light haze that smelled like burnt dust filled the cabin, and ash accumulated on flat surfaces. These effects continued for 7-8 minutes, while the aircraft remained on course at 0.85x the speed of sound, for a distance of roughly 120-135 km. The aircraft continued to Sydney, arriving 4 hours after exiting the ash cloud, and landed uneventfully. Because of damage caused by the ash cloud, it was necessary to replace all four of the aircraft's engines, other navigational components, and more than a dozen windows.
The TOMS instrument on the NIMBUS 7 polar orbiting satellite detected an area of SO2 enhancement SE of Soputan during its pass at local noon on 20 May. The area of enhancement extended from about 124.5°E to 126°E near the equator and from about 125°E to 127°E at 1.5°S with the maximum at about 1°S, 126°E.
Information Contacts: VSI; Boeing, Seattle, WA; A. Krueger, NASA/GSFC.
Ashfall damages houses and crops
On 22 April, Soputan erupted for the first time since May 1985 (10:05), sending ash and lapilli to 1,000-1,500 m above the summit. Newspapers, quoting VSI director Subroto Modjo, reported that the eruption consisted of three explosions (at 1027, 1535, and 1752), the second of which ejected most of the tephra. Earthquakes were recorded by a nearby seismograph and were felt 25 km away. As much as 15-20 cm of ash (carried E by the wind) fell nearby in parts of Tumaratas (11 km NE of Soputan) and Taraitak, and in Ampreng, Raringis, and Noongan. At least 500 houses were damaged and three classrooms collapsed [but see 14:5] in Noongan, a gathering hall collapsed in Paslaten Langowan (13 km ENE), and many trees, especially in the Gunung Potong forest area (7 km E) were knocked down. No ashfall was reported in Manado, 45 km NNE. Damage to buildings and crops was estimated at about $114,000. As a precaution, hazard warning maps were given to residents. . . . No casualties or additional explosions had been reported as of 26 April.
Information Contacts: OFDA; R. Austin, Englehard Engineering, USA.
Tephra eruption follows months of tremor
The 22 April eruption . . . was preceded by a significant increase in volcanic tremor, recorded since January. After the eruption's onset at 1027, tephra ejection continued for 45 minutes, followed by additional explosive episodes at 1535 and 1752. The eruption column rose 1-1.5 km, depositing 0.5-3 mm of lapilli and ash on the area 10-32 km E and N of Soputan. No casualties were reported, although ~50 houses and two schools were damaged. By 24 April, both eruptive activity and volcanic tremor had stopped. Volcanic tremor resumed on 6 June at 0745, but as of 9 June, surface activity was limited to weak emission of thin white fume to ~100 m above the crater.
Information Contacts: VSI.
Explosion sounds and incandescence; frequent seismicity
On 22-24 May... loud booming sounds and night glow were reported from the main crater. Up to 100 seismic events were recorded/6-hour period on 28 May.
Information Contacts: W. Modjo, VSI.
Ash and vapor ejected but glow ends in late May; 50 m of new lava on crater floor
Emissions of moderate to weak white-gray ash and vapor rose 100-300 m in June, but the weak red glow visible over the crater since 22 May, vanished on 29 May. During fieldwork on 18 June, the crater floor (50 m in diameter) was covered by ~50 m of lava (approximate volume 2.4 x 10⁶ m3). Seismographs recorded 101 tectonic and 97 explosion earthquakes weekly, but no volcanic earthquakes were detected. An M 5.6 earthquake occurred on 20 June at 1319 in the Sulawesi Sea ~200 km NW of the volcano at 1.15°N, 122°E. The shock was felt (MM III) near Soputan.
Information Contacts: W. Modjo, VSI.
Incandescent ejecta; tremor
Nine episodes of volcanic tremor, lasting ~2 minutes each, and two A-type earthquakes were recorded 26-27 November. Night glow suggested that lava had been newly extruded into the crater. Similar activity occurred on 12 October. The press reported incandescent tephra ejection and an apparent lava flow on 9 December.
Information Contacts: VSI; UPI.
Continued lava extrusion fills the main crater
[During a visit in June (VSI, 1993), continued lava extrusion had filled the main crater. The peak of the accumulated new lava reached ~80 m above the rim of the main crater. The total volume of lava was ~28.6 million cubic meters. Activity was continuing.]
Reference. Volcanogical Survey of Indonesia, 1993, Soputan volcano: Journal of Volcanic Activity in Indonesia, v. 1, no. 1 and 2 (January-June 1993).
Information Contacts:
Lava dome and fumarole descriptions
The EVS mounted an expedition to visit N Sulawesi volcanoes in July. They found that the morphology of Soputan's lava dome suggested continued endogenous growth. Some other parts of their Soputan report follow.
"Many fumaroles rose in different parts of the dome, mainly in its central part and in the space between the dome's foot and the crater wall. The summit area of the dome was strewn with chaotic blocks covered by white and yellow sulfur deposits. Two other fumarolic fields were located on the SW and W parts of the lava dome. Temperature measurements showed a maximum of 140°C; gases mainly consisted of H2S, SO2, and CO2."
Information Contacts: H. Gaudru, C. Pittet, M. Auber, C. Bopp, and O. Saudan, EVS, Switzerland.
Vapor emission and intense tremor; possible high ash
Activity in late 1995 consisted of whitish vapor emission to 25-100 m above the summit. During November occasional volcanic tremors were recorded with a maximum amplitude of 1.5 mm. Aviation reports on 7 November indicated increased eruptive activity with an ash cloud rising as high as 4.5 km altitude. Satellite imagery showed a possible ash cloud extending 90 km to the SW.
On 5 December, an increase in tremor amplitude up to 5 mm followed a tectonic earthquake felt throughout the Mimahassa Peninsula on Sulawesi. The same day maximum tremor amplitude reached 200 mm and glow was observed from three points on the lava dome. About an hour later tremor reached a maximum amplitude of 40 mm. On 6 December, tremor was still being recorded, but maximum amplitude had decreased to 2 mm.
Information Contacts: Wimpy S. Tjetjep (Director), Volcanological Survey of Indonesia (VSI), Jalan Diponegoro 57, Bandung, Indonesia; Bureau of Meteorology, Northern Territory Regional Office, P.O. Box 735, Darwin, NT 0801 Australia.
Small eruption on 15 March seen on satellite imagery
An ash cloud to 4.5 km altitude was reported in an aviation notice on 15 March. Imagery from the GMS-5 satellite confirmed the presence of an eruption plume during 0425-0632 GMT. A small plume can be seen on the 0425 image, but there was a definite plume with arms extending W and SW by 0532. The plume was still connected to the volcano at 0632, although it was starting to dissipate. On the 0732 image the plume was still visible, but appeared to have been disconnected from the volcano for some time.
Information Contacts: Bureau of Meteorology, P.O. Box 735, Darwin NT 0801, Australia; Ian Sprod, Code 921, NASA Goddard Space Flight Center, Greenbelt MD 20771, USA.
Pilots reported a 4.6-km-high plume
A Notice to Airmen (NOTAM) on 10 June indicated that an ash plume rose to 4,600 m above sea level. All aircraft were required to avoid the area.
Information Contacts: Bureau of Meteorology, Northern Territory Regional Office, P.O. Box 735, Darwin, NT 0801, Australia; NOAA/NESDIS Satellite Analysis Branch, Room 401, 5200 Auth Road, Camp Springs, MD 20746, USA.
Dome glow, lava flows, and concerns about rapid dome growth
On 24 September observers saw glow from the lower part of Soputan's lava dome. Lava flows directed to the S and SW reached ~500 m long by 29 September. Tremor of 2-mm amplitude occurred continually around this time. If rapid dome growth continues, lava avalanches could threaten the Teluk Amurang plantation and village, located 5 and 9 km downslope, respectively.
Information Contacts: Wimpy S. Tjetjep, Volcanological Survey of Indonesia, Jalan Diponegoro No. 57, Bandung 40122, Indonesia.
During May-July 2000, continued dome growth, lava flows, and several explosions
This report covers the period of 1 May to 3 July 2000. Tiltmeter readings from 1-3 May showed a decrease in both the x-axis (25 µrad) and y-axis (40 µrad on the SW side of the summit, indicating deformation due to magma rising towards the surface. Magma continued to rise, but there was no increase in earthquakes registered at the Soputan Post Observatory (SPO) in Maliku. Nevertheless, seismic data from both satellite-telemetered and SPO's instruments contained an increasing trend in cumulative energy that could have been the result of tectonic earthquakes. A 5 May MR 6.5 earthquake in Banggai, ~325 km SW of Soputan, is thought to have been a precursor to a 13 May eruption.
At 1250 on 13 May, an eruption began with the ejection of incandescent materials and the emission of a thick, black ash cloud that rose 1,000 m above the summit and drifted NE. There were reports of ashfall up to 2 cm thick in the towns of Malompar and Tombatu, ~9 km S of the summit.
In the weeks following this event, seismicity remained elevated, with tectonic earthquakes dominating activity. Sporadic emissions of thin, white ash-and-steam plumes rose up to 100 m, but no explosions were reported. By 22 June, scientists were reporting several small explosions and avalanches, as well as a significant increase in the number of volcanic tremors and avalanche earthquakes.
At 1200 on 1 July, continuous tremor earthquakes reached amplitudes of 20-50 mm. Later that day, at 2232, two loud booms were heard and at 2255, lava was seen flowing up to 200 m to the W of Soputan's summit, covering over 13-14 May lava flows. Lightning was also seen around the crater and the rising plume. At 0200 on 2 July, Strombolian lava fountains were seen spewing lava 10-50 m above the crater. Later in the day, a thick gray ash plume was seen as it reached ~1,000 m altitude and slowly changed color to a dark brown. The volcano continued to produce ash plumes and persistent booming that indicated explosions were taking place although they could not be seen. The number of earthquakes reached over 100 events per day, indicating that lava dome growth continued. Observations made at both SPO and the Lokon Post Observatory, ~30 km N in Tomohon, gave the government reason to have concern for inhabitants' safety and, on 3 July, the alert level was raised from 2 to 3 (on a scale of 4).
Information Contacts: Dali Ahmad, Volcanological Survey of Indonesia (VSI), Jalan Diponegoro No. 57, Bandung 40122, Indonesia (URL: http://www.vsi.esdm.go.id/).
Lava dome growth continues; Strombolian and ash eruptions from summit crater
This report covers the period of 1 July-31 October 2000. Activity increased and lava dome growth continued after the 13 May explosion (BGVN 25:06). By the end of June, an average of 100 earthquakes occurred per day, but the number of avalanche earthquakes decreased and fluctuated between 20 and 60 per day.
Soputan Post Observatory (SPO) at Maliku and Lokon Post Observatory (LPO) at Tomohon noted anomalous activity on 1 July. At 1200 strong tremor signals sent seismographs off-scale, but had estimated amplitudes of 20-50 mm. Visual observations at that time were hindered by haze. Workers at LPO heard a thundering sound twice at 2232, and during 2255-2303 more thundering occurred, this time accompanied by lava ejection. Lava flowed 200 m down the W flank of the volcano, and covered flows from the 13-14 May eruption.
A Strombolian eruption was observed at 0200 on 2 July with the lava fountain reaching 10-50 m above the summit. A thick white-gray ash emission reached 100 m above the summit crater and later changed to a brown color on the morning of 2 July. Further tremor earthquakes occurred with amplitudes of 30-50 mm. A dark-brown ash explosion, accompanied by a thundering sound, rose 200 m. The hazard status was set to 3 (on a scale of 1-4) on 3 July.
Reports resumed on 25-26 July, when a dense brown ash cloud rising ~1,500-3,500 m above the summit was observed along with lava fountaining to a height of 50 m. Observatory workers frequently heard rumblings from the volcano. At the end of July lava flows and lava avalanches moved down the sides of Soputan toward the SW to a distance of 400 m. Avalanche earthquakes and volcanic tremor dominated the seismic record, and an increase in deep volcanic (A-type) earthquakes took place.
Explosions issuing from the summit crater continued to be observed through the beginning of August. Ash emissions were brown-black in color, rose ~2,500 m, and were accompanied by rumbling. Lava avalanches reached distances of up to 2,000 m from the volcano, and pyroclastic flows traveled 700 m, both trending W. Seismicity remained similar to the previous week and maintained a high level. Soputan's hazard status was raised to 4 on 7 August.
Similar activity continued, and on 15 August at 2105 a dark-gray ash explosion occurred from the summit crater and rose 2,500 m. Ash from the explosion drifted SW. A Strombolian explosion followed and reached 150 m above the crater rim. The outburst was accompanied by a lava avalanche that flowed 200 m down the volcano's SW flank. Thundering that rattled windows in Maliku village 7 km away occurred coeval with the explosions. Volcanic ash advisories stated that the ash cloud from this event was carried to an altitude of 4,300 m.
Visual activity diminished until late September, but seismicity continued at similar levels until dropping in mid-September. A white, variable-density ash plume rose 25-200 m above the summit. Continuous volcanic tremor persisted until early September, and avalanche earthquakes also decreased significantly. During this period a white, variable-density ash cloud rose 50-200 m above Soputan's summit. Similar ash emissions continued until late September although cloud thickness decreased. Seismicity continued to decrease with avalanche earthquakes occurring nearly half as frequently and other earthquake types remaining similar in number.
In early October the hazard level for Soputan was decreased from 4 to 2. An ash plume continued to rise up to 200 m; in mid-October it decreased in height to 20 m above the summit crater. No further volcanic earthquakes occurred, and seismographs registered only avalanche and tectonic earthquakes for the rest of the month.
Information Contacts: Dali Ahmad, Volcanological Survey of Indonesia (VSI), Jalan Diponegoro No. 57, Bandung 40122, Indonesia (URL: http://www.vsi.esdm.go.id/); Darwin Volcanic Ash Advisory Centre (VAAC), Bureau of Meteorology, Northern Territory Regional Office, PO Box 40050, Casuarina, NT 0811, Australia (URL: http://www.bom.gov.au/info/vaac/).
Avalanche earthquakes, white plumes to 100 m through mid-July 2001
During 13 February through 15 July 2001, seismicity at Soputan was dominated by avalanche earthquakes (see table 3). Discontinuous tremor (0.5- 4 mm amplitude) was reported through most of the report period. Plumes, generally white and thin, were visible reaching 50-100 m above the summit. The Alert Level remained at 2 through at least mid-July 2001. No further reports were issued through February 2002.
Table 3. Earthquakes registered at Soputan during 13 February through 15 July 2001. No reports were issued for missing weeks. Courtesy of VSI.
| Date | Deep volcanic (A-type) | Shallow volcanic (B-type) | Avalanche | Tectonic |
| 13 Feb-19 Feb 2001 | 7 | -- | 57 | 8 |
| 20 Feb-26 Feb 2001 | 4 | 1 | 23 | 36 |
| 27 Feb-05 Mar 2001 | -- | 1 | 7 | -- |
| 06 Mar-12 Mar 2001 | 6 | -- | 30 | 12 |
| 12 Mar-18 Mar 2001 | 4 | -- | 30 | 15 |
| 19 Mar-23 Mar 2001 | 5 | 1 | 56 | 18 |
| 02 Apr-09 Apr 2001 | 4 | 1 | 73 | 51 |
| 09 Apr-15 Apr 2001 | 1 | 1 | 51 | 17 |
| 16 Apr-23 Apr 2001 | 9 | -- | 37 | 30 |
| 23 Apr-29 Apr 2001 | 1 | 17 | 36 | -- |
| 07 May-13 May 2001 | -- | 1 | 148 | 29 |
| 14 May-20 May 2001 | 1 | -- | 69 | 14 |
| 28 May-03 Jun 2001 | 6 | -- | 85 | 27 |
| 04 Jun-10 Jun 2001 | 5 | -- | 75 | 20 |
| 11 Jun-17 Jun 2001 | 0 | 0 | 86 | 18 |
| 18 Jun-24 Jun 2001 | 1 | -- | 59 | 14 |
| 25 Jun-01 Jul 2001 | 3 | -- | 146 | 18 |
| 02 Jul-08 Jul 2001 | 2 | -- | 123 | 34 |
| 09 Jul-15 Jul 2001 | 3 | -- | 201 | 48 |
Information Contacts: Dali Ahmad, Volcanological Survey of Indonesia (VSI) (URL: http://www.vsi.esdm.go.id/).
Lava avalanches and ash explosions during 18-22 July 2003
On 18 July 2003, large glowing lava avalanches resulted in a pyroclastic surge towards the W and NW. An ash column rose up to 2,000 m above the summit, and the Alert Level was raised to 3. Lava avalanches and ash explosions continued over the next few days, but by 21 July volcanic activity had started to decrease. Night observations showed that areas where glowing lava had illuminated the W slope on 18 and 19 July became dull and gradually disappeared over the three days following the eruption. Volcanic tremor due to fluid movement also ceased as of 22 July. Ash explosions continued sporadically, but were not as thick or as high as during previous observations. On 22 July between 20 of these minor ash explosions were recorded; another 50 ash explosions were reported after that time. No volcanic earthquakes were recorded, although small-amplitude tremor (0.25 mm) was recorded continuously. After 25 July the volcano was lowered to Alert Level 2.
During the week of 28 July-3 August, lava avalanches on the W slope continued, and emissions and avalanche earthquakes dominated seismic records. In addition, a white gas plume rose 50 m.
Information Contacts: Dali Ahmad, Volcanological Survey of Indonesia (VSI), Jalan Diponegoro No. 57, Bandung 40122, Indonesia (URL: http://www.vsi. esdm.go.id/).
Ash explosion and lava flows on 31 August
Increased activity during 18-22 July 2003 at Soputan consisted of frequent ash explosions and large glowing lava avalanches (BGVN 28:08). Seismicity from August through mid-October was dominated by avalanche events, with a few tectonic earthquakes (table 4). White gas emissions in this period were commonly seen rising 25-50 m above the crater, but were also reported as high as 1,000 m in late August and September. On 31 August there was ash explosion accompanied by ejection of incandescent material. The ash column reached 1,000 m above the summit. Lava flowed 750 m down the SW slope, and some descended to the N. Volcanic tremor that week (18-31 August) had an amplitude of 10-38 mm. The hazard status remained at Alert Level 2 (on a scale of 1-4) through 19 October.
Table 4. Seismicity at Soputan, 18 August-19 October 2003. Courtesy of VSI.
| Date | Avalanche Earthquakes | Tectonic Earthquakes |
| 18 Aug-31 Aug 2003 | 71 | -- |
| 29 Sep-05 Oct 2003 | 80 | 12 |
| 06 Oct-12 Oct 2003 | 30 | 8 |
| 13 Oct-19 Oct 2003 | 62 | 9 |
Information Contacts: Dali Ahmad, Hetty Triastuty, Nia Haerani, and Suswati, Volcanological Survey of Indonesia (VSI), Jalan Diponegoro No. 57, Bandung 40122, Indonesia (URL: http://www.vsi.esdm.go.id/).
Avalanche earthquakes and small white gas plumes
Seismic activity recorded at Soputan during November was dominated by avalanche earthquakes (table 5). Frequent ash explosions occurred during July and on 31 August, when a lava flow was also seen (BGVN 28:08). Only a white gas plume reaching heights of 25-50 m was observed during 27 October-30 November. The hazard status of the volcano remained at Alert Level 2 (on a scale of 1-4).
Table 5. Seismicity at Soputan, 27 October-30 November 2003. Courtesy of VSI.
| Date | Avalanche Earthquakes | Tectonic Earthquakes |
| 27 Oct-02 Nov 2003 | 51 | 5 |
| 03 Nov-09 Nov 2003 | 35 | 18 |
| 10 Nov-16 Nov 2003 | 24 | 17 |
| 17 Nov-23 Nov 2003 | 37 | 7 |
| 24 Nov-30 Nov 2003 | 66 | 10 |
Information Contacts: Dali Ahmad, Hetty Triastuty, Nia Haerani, and Suswati, Volcanological Survey of Indonesia (VSI), Jalan Diponegoro No. 57, Bandung 40122, Indonesia (URL: http://www.vsi.esdm.go.id/).
12 December eruption covered villages with ash up to 2 cm thick
Soputan erupted again on 12 December 2004. The Directorate of Volcanology and Geological Hazard Mitigation (DVGHM) noted that an eruption on 18 October 2004 sent a cloud ~ 600 meters above the crater. The previous eruptive episode occurred during July and August 2003 (BGVN 28:08, 28:10, and 28:11). A summary of ash plumes from mid-2003 through 12 December 2004 appears in table 6. Large discrepancies appeared in reported ash column heights; with the satellite estimates about 10 times larger than ground-based estimates.
Table 6. Reported ash plume altitudes recorded from Soputan, 18 July 2003-12 December 2004. Courtesy of DVGHM and Darwin VAAC.
| Date | Description | Source |
| 18 Jul 2003 | ~2 km above summit | DVGHM |
| 02 Sep 2003 | ~2 km altitude | Darwin VAAC |
| 04 Sep 2003 | ~3 km altitude (extending ~75 km N of the summit) | Satellite imagery, Darwin VAAC |
| 18 Oct 2004 | ~600 m above summit | DVGHM |
| 12 Dec 2004 | ~1 km above summit | DVGHM |
| 12 Dec 2004 | ~10.7 km altitude | Darwin VAAC |
The earliest details mentioned by DVGHM regarding the 2004 activity discussed 11 December 2004, a time when the tremor tended to rise, attaining peak-to-peak amplitudes of 0.5-3.0 mm. Observers also saw incandescence at the crater's rim.
At 0046 on 12 December tremor again registered with maximum peak-to-peak amplitudes of ~ 45 mm. At 0050 on 12 December Soputan erupted, sending an ash cloud up to 1 km. This was followed by discharge of a "hot cloud" (pyroclastic flow ?) to a distance of ~ 200 m E (from 'Aeseput,' a prominent NE-flank vent that formed in 1906). A lava flow spread W and S of Soputan. Observers could hear rumbling noise and thunder from their monitoring station ~ 11 km from the crater.
White-to-gray ash went E. At 0130 on 12 December a problem arose with the seismic sensors, perhaps because the solar panel was covered with ash. By 0600 the sensor was down. At 0500 that day a hot cloud occurred with a run out distance of ~ 150 m and a height of 200 m. Activity persisted until 1030. Soputan's summit then became visually obscured by clouds, but observers could still make out a white thin-to-medium plume to 70-80 m above the crater, and incandescence.
On the 13 December at 1752 observers felt an earthquake with a magnitude of MM I-II. The seismograph was then still inoperable.
News reports. A 13 December news report in The Daily Reform Voice stated that hundreds of hectares of paddy-fields and other agricultural land to the W of the Soputan was seriously impacted by tephra.
Thomas Dobat, a German expatriat living in Indonesia and concerned about the situation, sent Bulletin editors a translation of a 13 December 2004 article on Soputan taken from the Indonesian Journal Komentar. Similar to the above report, it also noted that hundreds of villages in 13 districts in Central Minahasa and in South Minahasa suffered from tephra fall emitted on 11-12 December. These eruptions of Soputan were accompanied by heavy thunder and lightning, which were heard in the town of Amurang.
Ash fell in nearly all of Central Minahasa and in parts of South Minahasa. The result was that in all areas of Central Minahasa, especially in the town of Tondano, houses, rice-fields, and roads were ash-covered up to 2 cm thick.
Information Contacts: Directorate of Volcanology and Geological Hazard Mitigation, Jalan Diponegoro 57, Bandung 40122, Indonesia (URL: http://www.vsi.esdm.go.id/); Darwin Volcanic Ash Advisory Centre, Australian Bureau of Meteorology (URL: http://www.bom.gov.au/info/vaac); The Daily Reform Voice; Komentar; Thomas Dobat, Lorong Jerman, Kauditan II, 95372, Sulawesi Utara, Indonesia.
Explosive eruption causes ash plume and avalanche on 18 October 2004
Activity at Soputan that began on 18 July 2003 (BGVN 28:08) continued with occasional ash explosions in August (BGVN 28:10 and 28:11) and through 4 September 2003 (BGVN 29:11). The report of the 12 December 2004 eruption (BGVN 29:11) also mentioned activity on 18 October. The following information from the Indonesian Directorate of Volcanology and Geological Hazard Mitigation describes that October 2004 activity in greater detail.
Volcanic tremor increased at 0930 on 18 October 2004 with amplitudes in the range of 10-40 mm. From 1026 to 1452 tremor amplitudes reached a maximum of 41 mm (over scale). At 1041 Soputan exploded, releasing a white to gray ash column as high as 600 m above the crater rim and drifting E. The explosion, along with rumbling sounds, was heard at the Post Observatory ~ 12 km from the summit. Based on increasing seismicity, the official hazard level was raised to Orange or II (on a scale of I-IV) at 1500 that day. At 1815 incandescence was visible, rising 25-30 m above the crater rim. Ash reached the Observatory at 2130, and a "lava avalanche" at 2135 traveled to the S. Tremor was recorded until 0712 on the following day, 19 October, with amplitudes of 0.5-2 mm.
A GOES-9 satellite loop of the 18 October 2004 eruption was compiled by the Darwin Volcanic Ash Advisory Centre (VAAC). Based on the dispersion patterns and infrared temperatures (minimum temperature of zero degrees), the cloud probably reached between 5,000 and 6,000 m altitude, where there was an atmospheric inversion that prevented further rise.
The Darwin VAAC also noted that a satellite image from the Terra MODIS instrument taken at 0210 UTC on 1 September 2003 showed an eruption plume during clear weather. The imaged eruption, described as a low-level cloud streaming to the SW that probably didn't rise much above the summit, occurred during a period of previously reported ash plumes and lava flow activity (BGVN 28:10).
Information Contacts: Directorate of Volcanology and Geological Hazard Mitigation, Jalan Diponegoro 57, Bandung 40122, Indonesia (URL: http://www.vsi.esdm.go.id/); Andrew Tupper, Darwin Volcanic Ash Advisory Centre (VAAC), Australian Bureau of Meteorology (URL: http://www.bom.gov.au/info/vaac/soputan.shtml).
Sporadic explosions into mid-2005; photo of 18 July pyroclastic flow
On 18 October 2004 Soputan exploded, releasing a column of white-to-gray ash floating as high as 600 m above the crater rim and drifting E (BGVN 29:12).
On 12 December an eruption around 0050 produced an E-drifting ash cloud to ~ 1 km above the volcano. It was followed by a "hot cloud" that traveled about 200 m E towards Aeseput and a lava flow that traveled SW. The eruption was preceded by increased tremor on 11 December and visible incandescence in the crater. The Directorate of Volcanology and Geological Hazard Mitigation increased the Alert Level to 2 (on a scale of 1-4). According to the Darwin Volcanic Ash Advisory Centre an eruption cloud was visible on satellite imagery on 12 December at 0925 at an altitude of ~ 10.7 km.
On 1 February 2005 white vapor rose 50-75 m above the summit. Soputan began to erupt again at 0630 on 20 April, with a plume reaching ~ 1 km above the summit and drifting SE. In addition, lava fountains rose ~ 200 m above the volcano. From 1720 on 20 April until 0900 on 21 April, lava fountains rose 75-100 m. Rapid dome growth occurred and by 21 April the lava dome had spread about 250 m E and 200 m SW. On 22 April a "white ash plume" rose ~ 100 m, and on 23 April a dark gray ash plume rose to ~ 150 m and drifted NE. Ash eruptions through 24 April produced plumes to ~ 300 m above the volcano.
On 9 May a plume of white vapor rose 75 m above the summit. Soputan remained at Alert Level 2 through 9 May.
Further activities came to light as a result of a photograph taken during a violent eruption (figure 2). According to Syamsul Rizal, the photo was taken from Soputan volcano observatory, Maliku, ~ 12 km NW, on 18 July 2005. The eruption initially vented at the usual source on the NE flank. The pyroclastic flow that resulted was described from visible observations as less dense than those from collapses at Merapi and similar to those from Karangetang.
 |
Figure 2. A photo of Soputan on 18 July 2005 showing the pyroclastic flow that occurred as a result of dome collapse. Photo courtesy of DVGHM and taken by Farid Bina. |
Information Contacts: Directorate of Volcanology and Geological Hazard Mitigation (DVGHM), Jalan Diponegoro 57, Bandung 40122, Indonesia (URL: http://www.vsi.esdm.go.id/); Andrew Tupper, Darwin Volcanic Ash Advisory Centre (VAAC), Bureau of Meteorology, Northern Territory Regional Office, PO Box 40050, Casuarina, Northern Territory 0811, Australia (URL: http://www.bom.gov.au/info/vaac/soputan.shtml).
Late 2005 phreatic and Strombolian eruptions; ash plume to ~ 5.8 km altitude
Our last report covered events through July 2005 (BGVN 30:08); this report includes activity that took place in late December 2005 and also presents a discussion of the wide discrepancy of cloud-height estimates between ground, aircraft, and satellite remote-sensing observations.
Activity during 21-27 December 2005. A phreatic eruption began at Soputan on 26 December 2005 around 1230 following heavy rain. Observers concluded that rainwater contacted lava at the volcano's summit. On 27 December at 0400, a Strombolian eruption began that lasted about 50 minutes. Incandescent material was ejected ~ 35 m, and avalanches spalling off the margins of the summit traveled as far as 750 m E. Booming noises were heard 5 km from the summit. The Darwin VAAC reported that an ash plume reached a height of ~ 5.8 km altitude and drifted SE.
As of 28 December, eruptive activity continued, producing ash plumes to a height of ~ 1 km above the volcano. Strombolian eruptions ejected incandescent material up to 200 m above the summit. Pyroclastic avalanches traveled ~ 500 m E and SW. This was Soputan's fourth event in 2005, with previous activity on 14 and 20 April, and on 12 September. The Alert Level remained at 2, since the volcano is about 11 km from the nearest settlement. Visitors were prohibited from climbing Soputan's summit and from camping around Kawah Masem.
October 2005 eruption plume height discussion. The Darwin Volcanic Ash Advisory Centre and the Cooperative Institute for Meteorological Satellite Studies (CIMSS) at the University of Wisconsin – Madison collaborated to compare various estimates for the height of the 27 December cloud (BGVN 30:08). The eruption height had been initially reported at less than 6 km altitude on the 27th by an airline pilot, and 1 km above the summit (~ 2.8 km altitude) by ground observers on the 28th. Darwin VAAC, on reviewing hourly MTSAT imagery on the 27th, estimated the plume top at 15 km altitude operationally and then 12.5 km altitude in post-analysis studies.
Michael Richards of CIMSS used an established remote-sensing technique known as "CO2 slicing" (Menzel et al., 1983, Richards et al., 2006), to obtain heights of the cloudscape around Soputan after the eruption. The technique takes advantage of the fact that the emissive infrared CO2 bands available on the MODIS satellite become more transmissive with decreasing wavelength, as the bands move away from the peak wavelength of CO2 absorption at 15 µm. There were two good MODIS images obtained over the eruption on the 27th, with the first, at 0210 UTC or 1010 local time. These images were taken at close to the time of the peak cloud height observed on MTSAT imagery, and the CO2 slicing technique appears to validate the post-analyzed VAAC height of ~ 12.5 km altitude.
The different results for the height of the eruption cloud illustrate the difficulty that observers would have had viewing the cloud from any angle. Weather clouds in the tropics typically extend up to 16 km or more altitude. Cirrus cloud from a storm complex can obscure the view of a satellite for hours. On the other hand, middle-level clouds, such as altostratus, will typically lie between aircraft cruising altitudes and the ground, meaning that pilots at cruising altitude may not associate any eruption cloud with a volcano on the ground, unless the cloud is obviously volcanic. Ground observers are completely unable to view the full height of the cloud if it is penetrating through the middle-level clouds.
The appearance of the cloud on true-color, near-infrared and infrared imagery is consistent with an ice-rich (glaciated) volcanic cloud, in-line with the CVGHM account of water interactions at the ground, and also with a high water loading in the atmosphere. The extensive areas of cloud in the area hindered satellite detection of the eruption until after the pilot report of the eruption had been received.
References. Menzel, W. P., Smith, W. L., and Stewart, T. R., 1983, Improved cloud motion wind vector and altitude assignment using VAS: Journal of Applied Meteorology, v. 22, p. 377-384.
Richards, M. S., Ackerman, S. A., Pavolonis, M. J., Feltz, W. F., and Tupper, A.C., 2006, Volcanic ash cloud heights using the MODIS CO2-slicing algorithm: AMS 12th, conference on aerospace and range meteorology, Atlanta, Georgia, USA (http://ams.confex.com/ams/pdfpapers/104055.pdf).
Information Contacts: Center of Volcanology and Geological Hazard Mitigation, Jalan Diponegoro 57, Bandung 40122, Indonesia (URL: http://www.vsi.esdm.go.id/); Andrew Tupper and Rebecca Patrick, Darwin Volcanic Ash Advisory Centre (VAAC), Australian Bureau of Meteorology (URL: http://www.bom.gov.au/info/vaac/soputan.shtml); Michael Richards and Wayne Feltz, Cooperative Institute for Meteorological Satellite Studies (CIMSS), University of Wisconsin, 1225 West Dayton Street, Madison, WI 53706, USA.
December 2006 lava dome still venting ash
Growth of the lava dome at Soputan began in 1991 (BGVN 16:06), eventually overtopping the crater rim and generating rockfalls to distances of 2-4 km downslope. Phreatic eruptions since that time have been triggered during the rainy season, and ash explosions have been frequent since 2000. An eruption and dome collapse in July 2005 sent a pyroclastic flow to a distance of 3 km from the summit. The nearest residents are at a distance of 8 km, so none of these events created hazards to the local population. Following pyroclastic avalanches and Strombolian activity in late December 2005 (BGVN 31:04), the Centre of Volcanology and Geological Hazard Mitigation (CVGHM) did not report further activity at Soputan until December 2006.
Lava dome volume in early December 2006 was reported to be 34 million cubic meters. Rockfall signals from the lava dome typically occur at a rate of about 75 per day, but the number of these events increased to 153 on 11 December, and remained high over the next two days: 120 on 12 December and 126 on the 13th. Volcanic tremor amplitude also increased on 11 December. Although thick fog hampered observations, "white smoke" was seen rising 25-30 m above the summit. At 1400 on 14 December a "thunderous" eruption was heard at the CVGHM observation post 8 km from the summit. Gray ash plumes rising 250 m above the summit caused ashfall within a 15-km radius. On 15 December the Alert Level was raised from 2 to 3 (on a scale of 1-4) due to this increase in activity.
A precautionary aviation advisory was issued by the Darwin VAAC on 18 December based on information from the CVGHM. A few hours later a plume was detected on an MTSAT image taken at 1933. The high-level eruption may have reached an altitude of 12 km altitude with the plume extending 37 km to the W.
Information Contacts: Center of Volcanology and Geological Hazard Mitigation (CVGHM), Diponegoro 57, Bandung, Jawa Barat 40122, Indonesia (URL: http://vsi.esdm.go.id/); Jenny Farlow, Darwin Volcanic Ash Advisory Centre, Bureau of Meteorology, Australia (URL: http://www.bom.gov.au/info/vaac/).
Ash plumes and seismic activity continue through November 2007
Our last report on Soputan (BGVN 32:01) indicated that Soputan's lava dome was still emitting gas and generating rockfalls and ash plumes to 12 km in altitude through December 2006. This report, which includes a map (figure 3), discusses activity through November 2007.
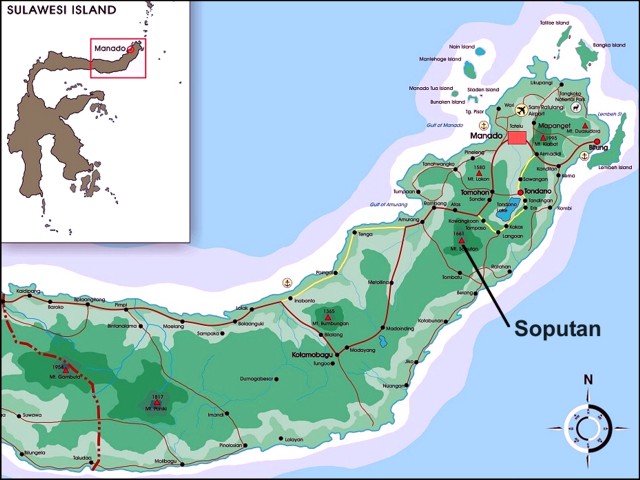 |
Figure 3. A map of northern Sulawesi island (Indonesia), with Soputan labeled. Inset shows entire island. Copyrighted map by pbi design (2002); graphic by Michael Wijaya. |
According to the Center of Volcanology and Geological Hazard Mitigation (CVGHM), diffuse ash plumes rose from Soputan to an altitude of 1.8 km during 20-25 June 2007. The Alert Level remained at 3 (on a scale of 1-4), where it had been since 15 December 2006. Between 11 June and 1 July 2007 the only seismicity recorded was caused by rockfalls, with 107 events during 11-17 June, 124 events during 18-24 June, and 78 events during 25 June-1 July.
News accounts reported that Soputan erupted on 14 August, producing ash plumes that, according to the Darwin Volcanic Ash Advisory Centre (VAAC), rose to 4.6 km altitude and drifted W. Lava and rock avalanches were also observed. According to Yahoo! Canada News, volcanologist Sandy Manengke indicated that no injuries or damage were reported, but that villages along Soputan's base were covered in volcanic dust, and many residents were wearing face masks. According to Reuters, Saut Simatupang, head of Indonesia's Volcanology Survey, told the news agency that no evacuation was ordered and the Alert Level was not raised to 4 (maximum) because Soputan was unlikely to erupt in a way that would threaten the nearest village, 11 km from its crater. On 15 August seismicity decreased.
Based on observations of satellite imagery and information from CVGHM, the Darwin VAAC reported that an ash plume rose to an altitude of 4.6 km and drifted W during 14-15 August. Visual observations were made on 24-25 October and 30-31 October 2007 of white and gray plumes that rose to altitudes of 1.8-3.3 km and drifted W. In addition, based upon pilot reports and satellite imagery, the Darwin VAAC reported that on 25-26 October, ash plumes rose to 13.7 km altitude and drifted WSW. On 25 October, lava flowed 500-600 m down the W flank and flowed again on 30 October. Villagers and tourists were warned not to travel within a 6 km radius of the summit.
MODVOLC data (which is MODIS satellite thermal infrared data processed to indicate possible volcanism) is sometimes helpful in assessing lava and dome emissions at volcanoes. Alerts for 2007 appeared in August (7 alerts), October (23 alerts), and November (2 alerts). During 2006, alerts took place in December (11 alerts) and October (5).
According to CVGHM, the Alert Status was lowered from 3 to 2 on 23 November, based on a decrease in the number of earthquakes and seismic intensity, deformation measurements, and visual observations.
Information Contacts: Center of Volcanology and Geological Hazard Mitigation (CVGHM), Diponegoro 57, Bandung, Jawa Barat 40122, Indonesia (URL: http://vsi.esdm.go.id/); Jenny Farlow, Darwin Volcanic Ash Advisory Centre, Bureau of Meteorology, Australia (URL: http://www.bom.gov.au/info/vaac/); Hawai'i Institute of Geophysics and Planetology (HIGP) Hot Spots System, University of Hawai'i, 2525 Correa Road, Honolulu, HI 96822, USA (URL: http://modis.higp.hawaii.edu/); Reuters (URL: http://www.reuters.com/); Yahoo! Canada News (URL: http://ca.news.yahoo.com/).
Eruptions with ash plumes in June and October 2008
Activity at Soputan stratovolcano was characterized in an October 2008 report by the Centre of Volcanology and Geological Hazard Mitigation (CVGHM) as ongoing growth of a lava dome since 1991. This growth has often been accompanied by ash eruptions.
Activity through 23 November 2007 included an eruption in August 2007 and several ash plumes, a lava flow, and rock avalanches (BGVN 32:11). Ash from an event in October remained in the area for about two days, affecting important flight routes. No further information was available until CVGHM reported deformation in May 2008.
According to the CVGHM, seismicity increased during 1-6 June. On 6 June, the volcano erupted, causing part of the crater wall to collapse, creating an opening to the W and increasing the diameter of the crater. A pyroclastic flow, possibly generated by a rockfall avalanche, traveled down the E flank about 1.5 km; a number of nearby villages were covered with tephra. Based on observations of satellite imagery, the Darwin Volcanic Ash Advisory Centre (VAAC) reported that an ash plume rose to an altitude of 13.7 km on 6 June and drifted SW. Ash deposits were about 4 cm thick in an area 5 km NW, and a nearby coconut plantation reported damage to trees. The Alert Level was raised to 3 (on a scale of 1-4). Residents and tourists were advised not go within a 6 km radius of the summit.
During 7-18 June, seismicity decreased and white plumes at altitudes at or less than 1.8 km were spotted when clouds did not inhibit observations. On 18 June, the Alert Level was decreased to 2.
The next episode of seismic activity was on 6 October. Loud noises were heard and observers noted Strombolian activity that ejected incandescent material 100-150 m from the crater. CVGHM noted that a thick gray ash plume rose 2.8 km in altitude. (According to the Darwin VAAC, analysis of satellite imagery suggested that the ash plume rose to the much greater altitude of 7.6 km and drifted W.)
Based on these visual observations and on earthquake and tiltmeter deformation data, the volcano alert level was raised from 2 to 3. Residents and tourists were again advised not go within a 6 km radius of the summit.
On 7 October 2008, CVGHM reported that white plumes rose to altitudes of 2.3-3.3 km. Incandescent material was ejected 50-150 m from the crater, and incandescent rockfalls traveled 500 m W. The following day, plumes rose to an altitude of 2 km.
After 9 October, seismic activity decreased. On 20 October 2008, white and gray smoke rose from the crater to a height of 200 m above the peak. On 21 October, the Alert level was lowered from 3 to 2.
Thermal anomalies. Coinciding with the observed eruptions, MODVOLC thermal alerts were measured during 6-20 October 2008 (table 7). The set begins with 24 pixels measured at 1355 UTC (2155 local) on 6 October 2008. (If each pixel represented an area of 1-2 km2, the resulting area of thermal sources, including lava flows or other material ejected from the volcano, and possible fires, would be on the order of 25-50 km2.) After a second set of 11 alerts measured 3 hours later on 6 October, the alerts dropped to 1-2 on several days through 20 October.
[The last thermal alert detected in 2008 was at 0130 on 2 November (local time).]
Table 7. MODIS/MODVOLC satellite thermal anomalies measured at Soputan during October 2008. No anomalies were measured from the beginning of the year 2008 to 5 October. Courtesy of HIGP Thermal Alerts System.
| Date | Time (UTC) | Pixels | Satellite |
| 06 Oct 2008 | 1355 | 24 | Terra |
| 06 Oct 2008 | 1655 | 11 | Aqua |
| 13 Oct 2008 | 1405 | 1 | Terra |
| 13 Oct 2008 | 1700 | 1 | Aqua |
| 16 Oct 2008 | 1435 | 1 | Terra |
| 16 Oct 2008 | 1730 | 2 | Aqua |
| 20 Oct 2008 | 1410 | 1 | Terra |
| 20 Oct 2008 | 1705 | 1 | Aqua |
Reference. International Civil Aviation Organization (ICAO), 2008, Twelfth Meeting of the Communications/Navigation/Surveillance and Meteorology Sub-Group of APANPIRG (CNS/MET/SG/12): VAAC Darwin Report July 2007-June 2008, Bangkok, Indonesia, 21-25 July 2008.
Information Contacts: Hawai'i Institute of Geophysics and Planetology (HIGP) Thermal Alerts System, School of Ocean and Earth Science and Technology (SOEST), Univ. of Hawai'i, 2525 Correa Road, Honolulu, HI 96822, USA (URL: http://modis.higp.hawaii.edu/); Center of Volcanology and Geological Hazard Mitigation (CVGHM), Diponegoro 57, Bandung, Jawa Barat 40122, Indonesia (URL: http://vsi.esdm.go.id/); Darwin Volcanic Ash Advisory Center (VAAC), Bureau of Meteorology, Northern Territory Regional Office, PO Box 40050, Casuarina, Northern Territory 0811, Australia (URL: http://www.bom.gov.au/info/vaac/).
Eruptions in July and August 2011
Soputan volcano, Sulawesi, Indonesia (figure 4) was relatively quiet for more than two years following our last report in September 2008 (BGVN 33:09). Thermal anomalies appeared in late May 2011 and in late June 2011, Soputan re-commenced eruptive activity. This report covers activity at Soputan during 2011 (through 2 October). Unless otherwise noted, data was reported by the Center for Volcanology and Geological Hazard Mitigation (CVGHM).
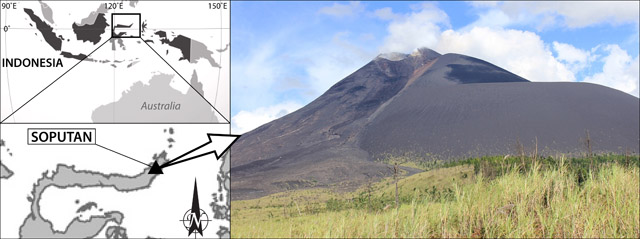 |
Figure 4. A photograph of Soputan volcano, taken 6 March 2011 by Flickr account user Akhal-Téké. Index maps at left show the location of Soputan volcano on the island of Sulawesi (close-up, bottom) in Indonesia (top). Index maps modified from MapsOf.net (top) and Ginkgo Maps (bottom). |
The first signs of the June-October eruption at Soputan occurred with some diffuse white plumes in June reaching 25-150 m above the crater. After an increase in seismicity during 21 June-2 July, CVGHM raised the Alert Level from 2 to 3 (on a scale from 1-4); climbing the slopes of the volcano was prohibited, and residents were discouraged from going within 6 km of Soputan's crater.
A Strombolian eruption, reported at 0603 on 3 July, generated an ash plume that rose 6 km altitude and drifted W. The eruption plume was captured in a NASA Earth Observatory satellite image (figure 5). A pyroclastic flow traveled up to 4 km W. A 10 pixel MODVOLC thermal alert was triggered at 0225 (UTC) on the same day (figure 5, table 8).
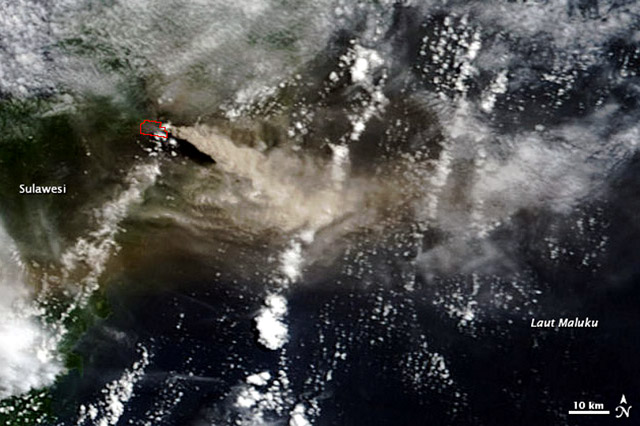 |
Figure 5. A natural color satellite image of the eruptive plume generated at Soputan on 3 July 2011. The plume is seen here drifting E over Laut Maluku (Molucca Sea); the brownish color of the plume indicates that it consisted of both gas and ash. The red outline highlights the area of the 10-pixel MODVOLC thermal alert (table 2) of the same day. Courtesy of NASA Earth Observatory. |
Table 8. MODVOLC thermal anomalies recorded at Soputan in 2011. A 58 pixel thermal anomaly was recorded on 2 October 2011, but was omitted due to the sun-glint angle being below 12°. The University of Hawaii states that "If a pixel has a sun-glint angle of less than 12° it is potentially contaminated by sunglint and should not be trusted." Courtesy of HIGP Thermal Alerts System, University of Hawaii. [Note that the 21 May 2011 pixel originally reported below (deleted) was actually located at some distance from the volcano in the ocean, and was most likely due to sunglint.]
| Date | Time (UTC) | Pixels | Satellite |
| 02 Jul 2011 | 1700 | 3 | Aqua |
| 03 Jul 2011 | 0225 | 10 | Terra |
| 03 Jul 2011 | 0520 | 2 | Aqua |
| 03 Jul 2011 | 1740 | 1 | Aqua |
| 09 Jul 2011 | 1705 | 2 | Aqua |
| 08 Aug 2011 | 1405 | 1 | Terra |
| 14 Aug 2011 | 1345 | 3 | Terra |
| 14 Aug 2011 | 1640 | 3 | Aqua |
| 15 Aug 2011 | 0205 | 2 | Terra |
| 15 Aug 2011 | 1725 | 3 | Aqua |
| 23 Aug 2011 | 0550 | 2 | Aqua |
The Jakarta Globe reported that, due to ash fall, the Indonesian Red Cross (Pa Merah Indonesia - PMI) distributed ~ 31,000 face masks to residents (figure 6). It also reported that Sutopo Purwo Nugroho, spokesman for the National Board for Disaster Managment (BNPB), said that "there is no need for evacuation because the nearest residents are living some 8 km from the mountain." Sam Ratui International Airport was closed for 3 hours (during 1200-1500) that afternoon, according to The Jakarta Globe. Following the eruption of 3 July, seismicity decreased, and the only reported activity was dense white plumes rising to 75 m above the crater on 18 July. The Alert Level was lowered to 2 on 19 July, allowing residents to come within 4 km of the crater.
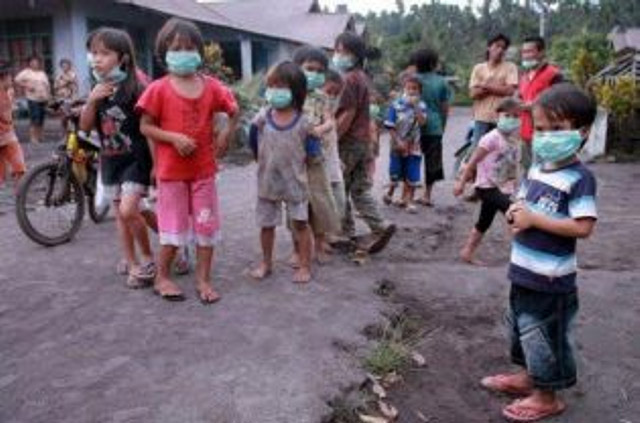 |
Figure 6. Residents near Soputan with face masks they received from the Indonesian Red Cross (Pa Merah Indonesia - PMI). Courtesy of the Jakarta Globe. |
Seismicity continued to decrease until 10 August. On 14 August, a plume containing ash rose to 1 km above the crater, and two other plumes rose to 1.3 km above the crater later in the day (figure 7). The Darwin Volcanic Ash Advisory Centre (VAAC) reported an ash plume that drifted more than 100 km W. The Alert Level was again raised to 3 on 14 August, once again prohibiting residents within 6 km of the crater.
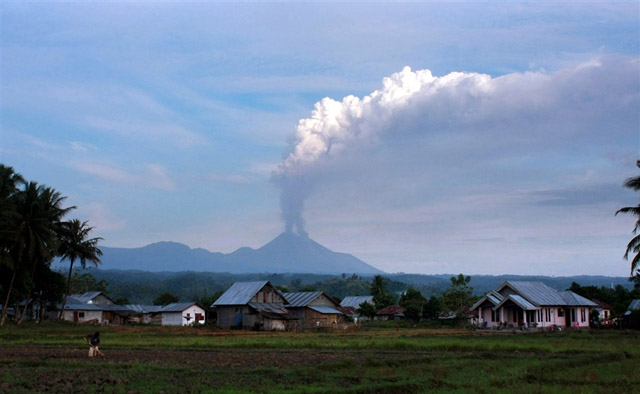 |
Figure 7. An ash plume from Soputan rising to greater than 1 km above the crater on 14 August 2011. In the foreground, a resident of one of the local towns is working in their field. Courtesy of Andreas/AFP-Getty Images. |
Following the eruptions of 14 August, seismicity decreased significantly, and small white plumes rose above the crater. The plumes steadily decreased from 200 m high above the crater (14-18 August) to, at most, 100 m above the crater (29 August-7 September). An early morning photograph captured an eruption on 15 August, showing a small plume and lava flows down the flank of Soputan (figure 8). On 8 September, the Alert Level was lowered to 2, allowing residents to come no closer than 4 km to the crater.
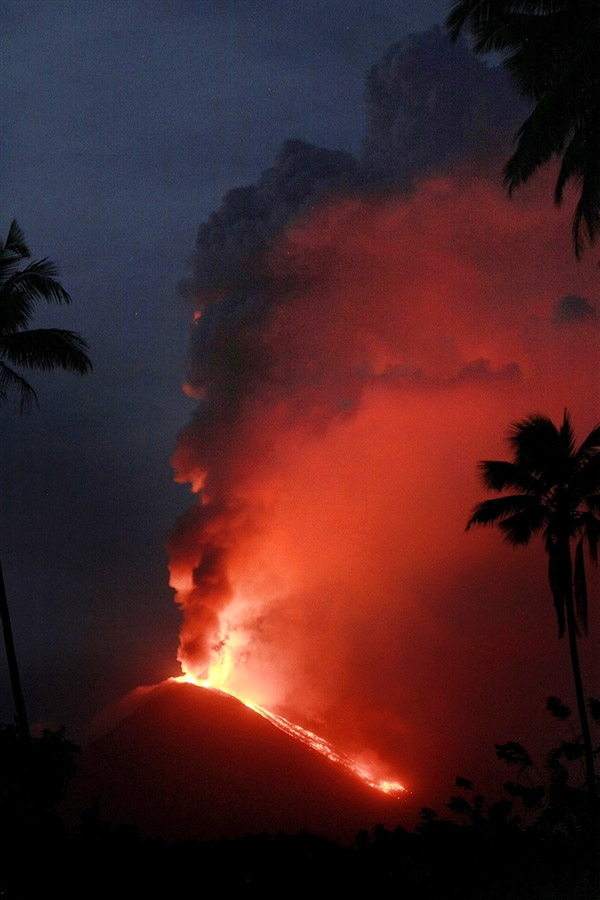 |
Figure 8. An early morning photograph of Soputan erupting on 15 August 2011. Lava flows down the flank of Soputan brightened the small eruptive plume billowing overhead. Courtesy of Andreas/AFP-Getty Images. |
Information Contacts: Center for Volcanology and Geological Hazard Mitigation (CVGHM) Diponegoro 57, Bandung, Jawa Barat 40122, Indonesia (URL: http://www.vsi.esdm.go.id/); Akhal-Téké, Flickr photostream (URL: http://www.flickr.com/photos/51873088@N04/); MapsOf.net (URL: http://mapsof.net/); Ginkgo Maps (URL: http://www.ginkgomaps.com/); NASA Earth Observatory (URL: http://earthobservatory.nasa.gov/); Hawai'i Institute of Geophysics and Planetology (HIGP) Thermal Alerts System, School of Ocean and Earth Science and Technology (SOEST), Univ. of Hawai'i, 2525 Correa Road, Honolulu, HI 96822, USA (URL: http://modis.higp.hawaii.edu/); The Jakarta Globe, Citra Graha Building 11th Floor, Suite 1102, Jakarta 12950, Indonesia (URL: http://www.thejakartaglobe.com/); Darwin Volcanic Ash Advisory Centre (VAAC), Bureau of Meteorology, Northern Territory Regional Office, PO Box 40050, Casuarina, Northern Territory 0811, Australia (URL: http://www.bom.gov.au/info/vaac/); Andreas/AFP - Getty Images (URL: http://www.gettyimages.com/).
Alert level raised in May 2012 based on increased seismic activity
Our previous report of Soputan volcano chronicled activity during July-September 2011 (BGVN 36:11). Table 9 gives a brief history of activity and highlights activity through early May 2012. The data sources are the Darwin Volcanic Ash Advisory Centre (VAAC) for satellite monitoring of ash plumes and the Indonesian Center of Volcanology and Geological Hazard Mitigation (CVGHM) for seismic monitoring and assignment of alert levels. According to a 28 May 2012 report by CVGHM, Soputan's activities are characterized by the growth of lava domes that have been accreting steadily since 1991. The accretion of these lava domes has been frequently accompanied by ash/cinder eruptions.
Table 9. Summary of volcanic ash observations and other activity at Soputan volcano from late June 2011 through mid-2012. 'VA' refers to volcanic ash. Courtesy of Darwin VAAC and CVGHM.
| Date | Observations | Remarks |
| 21 Jun-02 Jul 2011 | Seismic activity increased | -- |
| 02 Jul 2011 | -- | Alert Level 2 to 3 |
| 03 Jul-04 Jul 2011 | Explosive eruption of incandescent material with pyroclastic flow 4 km to W; VA plume to 4.6-14 km extending 407 km W | -- |
| 04 Jul 2011 | High-level eruption has ceased, dissipating | -- |
| 19 Jul 2011 | -- | Alert Level 3 to 2 |
| 14 Aug 2011 | Two eruptions; VA plume to 3.7 km extending 107 km W | Alert Level 2 to 3; VA not identifiable on satellite imagery |
| 14 Aug-07 Sep 2011 | Seismic Activity significantly decreased after eruption | -- |
| 08 Sep 2011 | Hot air blasts of smoke from the mass of the lava dome | Alert Level 3 to 2 |
| 28 May 2012 | Seismic activity significantly increased | Alert Level 2 to 3 |
On 28 May 2012, CVGHM raised the Alert Level of Soputan from 2 to 3 (on a scale of 1-4) following increasing sesimic activity. According to CVGHM, increasing activity had been observed from 21-27 May, when the volcano spewed out white smoke to heights of between 50 to 150 m above the summit. Seismicity increased significantly on 25 May.
CVGHM called on local residents to stay beyond a 6 km radius from the volcano's summit. It also warned residents of the threat of a lahar, urging people living near Ranowangko, Pentu, Lawian and Popang rivers to remain alert and aware.
MODVOLC Thermal Alerts. MODVOLC satellite thermal alerts were measured at Soputan on 2-3 July, 9 July, and 14-15 August 2011, all on the volcano's W flank. These were the first such measurements since the volcano's last eruption, during late October to early November 2008 (BGVN 33:09). Since 8 August 2011 to early March 2012, no alerts have been measured.
Information Contacts: Center of Volcanology and Geological Hazard Mitigation (CVGHM), Volcanological Survey of Indonesia (VSI), Jalan Diponegoro 57 Bandung, Jawa Barat 40122, Indonesia (URL: http://vsi.esdm.go.id/); Darwin Volcanic Ash Advisory Centre (VAAC), Bureau of Meteorology, Northern Territory Regional Office, PO Box 40050, Casuarina, Northern Territory 0811, Australia (URL: http://www.bom.gov.au/info/vaac); MODVOLC, Hawai'i Institute of Geophysics and Planetology (HIGP) Thermal Alerts System, School of Ocean and Earth Science and Technology (SOEST), Univ. of Hawai'i, 2525 Correa Road, Honolulu, HI 96822, USA (URL: http://modis.higp.hawaii.edu/); Jakarta Post (URL: http://www.thejakartapost.com).
High ash plume and lava in August-September 2012; multiple explosions, Strombolian activity, and lava flows in January-March 2015
The Soputan stratovolcano on the northern tip of Indonesia's island of Sulawesi has had historically observed eruptions since the 18th century, possibly earlier. During this time the locus of eruptions has included both the summit crater and Aeseput, a prominent NE-flank vent that formed in 1906 and was the source of intermittent major lava flows until 1924. Since the 1980's ongoing lava-dome growth has produced ash explosions, lava flows, and Strombolian eruptions every few years. The last activity with explosions, ash plumes to 6 km altitude, and a pyroclastic flow occurred between July and August 2011 (BGVN 36:11).
Monitoring is the responsibility of PVMBG (Pusat Vulkanologi dan Mitigasi Bencana Geologi) also known as CVGHM (Center for Volcanology and Geological Hazard Mitigation), and for the aviation community is within the Darwin VAAC (Volcanic Ash Advisory Center) region. This report covers two eruptive episodes; renewed seismic activity in May 2012 preceded a short eruption between August and September 2012, and repeated explosions with lava flows and incandescent material were recorded between January and March 2015.
The first eruptive episode began with an explosion on 26 August 2012 and a 12.2 km altitude ash plume. MODVOLC thermal anomalies were recorded on 26 and 28 August, and a significant SO2 anomaly was visible on 27 August. A second explosion on 18 September generated a plume to 9.1 km altitude, lava flows, and incandescent material; MODVOLC thermal anomalies persisted from 18 through 22 September 2012. Soputan was then quiet until January 2015 when it erupted repeatedly between 6 January and 8 March 2015 with ash plumes, lava flows, and Strombolian activity. Substantial MODVOLC thermal anomalies were recorded on 21 January, 2-3 and 12-13 February, and 7-9 March 2015. Seismicity remained elevated through July 2015.
Activity during 2012. During 21-27 May 2012 observers in the village of Maliku (12 km NW of Soputan) noted white steam plumes rising 50-150 m above the crater. A sharp increase in the number of seismic events began on 25 May, prompting CVGHM to increase the Alert Level to 3 on 28 May 2012. The Alert Level was lowered back to 2 on 26 June. During most of August, observers noted white steam plumes rising 50-200 m above the summit crater. Each week during 1-25 August there was an increase in the number of deep volcanic earthquakes and earthquakes indicating avalanches.
On 26 August 2012 at 1936 local time, CVGHM reported visual observation of a large eruption with an ash plume rising to 1,000 m above the summit and drifting W; they raised the Alert Level to 3. It was accompanied by a burst of incandescent material that rose 50 m above the summit. Darwin VAAC issued an ash advisory shortly after the eruption indicating that a large plume was observed in satellite imagery rising to 12.2 km altitude and extending 150 km W. They noted that the eruption continued for four hours, and the plume was moving W at around 80 km/hour. After 24 hours, the plume was still visible in satellite imagery, at 6.1 km altitude and extending around 220 km SW. MODVOLC thermal anomalies were recorded on 26 and 28 August. NASA's Global SO2 monitoring program at Goddard Space Flight Center (GSFC) captured a significant SO2 plume from Soputan on 27 August from the OMI instrument on the Aura satellite (figure 9).
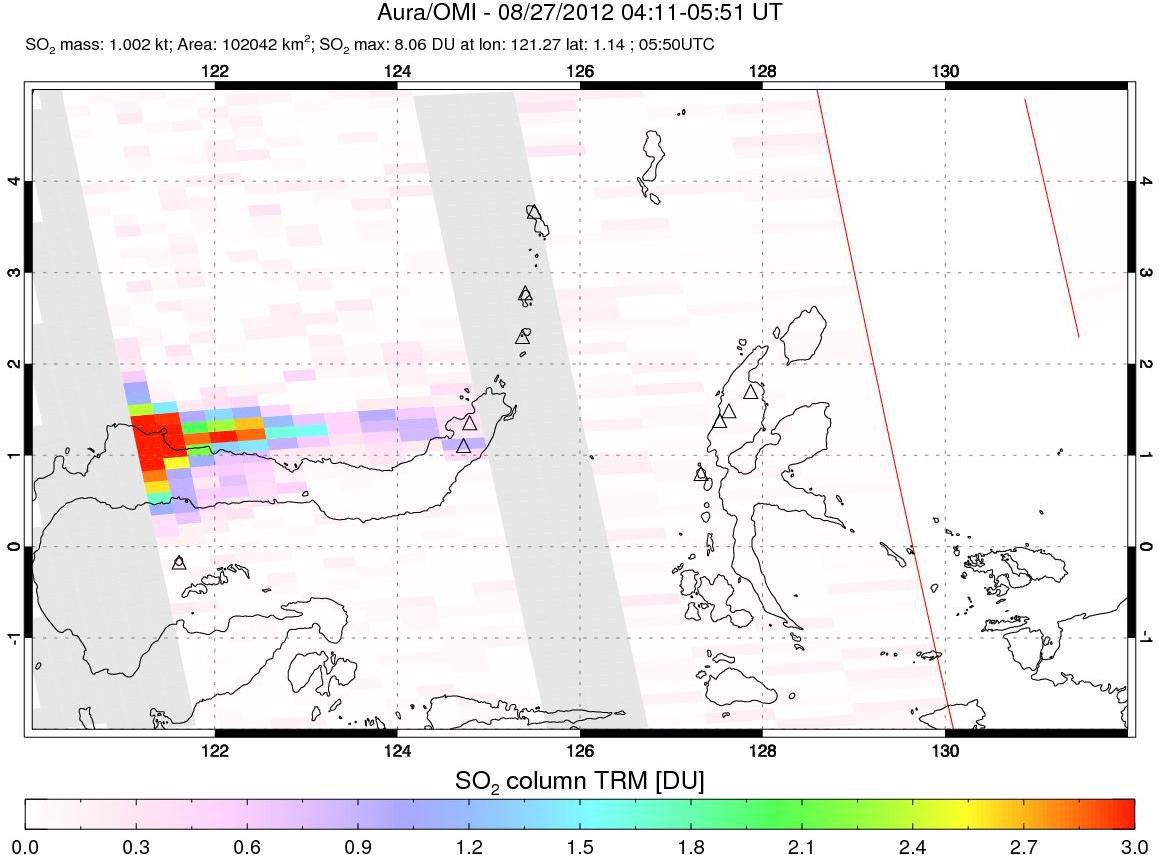 |
Figure 9. SO2 plume drifting W from Soputan on 27 August 2012, the day after an explosion that produced an ash plume to over 12 km altitude. Courtesy of NASA/GSFC. |
Another eruption during 18-19 September 2012 included an ash explosion, lava flows, and incandescent material, according to CVGHM. Based on information from the US Air Force Weather Agency (AFWA), the Darwin VAAC reported that an ash plume rose to an altitude of 9.1 km on 18 September. The ash cloud dispersed to the W between the summit elevation (1,785 m) and 3.7 km altitude, and to the NNE between 3.7 and 9.1 km altitude. Thermally anomalous pixels were recorded by the MODVOLC thermal alert system from 18 to 20 September, followed by a two-pixel anomaly on 22 September and a single-pixel anomaly on 27 September.
Activity during 2013 and 2014. Seismicity decreased in November 2012 to levels that allowed CVGHM to reduce the Alert Level from 3 to 2. From January through March 2013, the number of seismic events from avalanches increased significantly. On 19 April 2013 a sharp increase in the number of deep volcanic earthquake events caused CVGHM to raise the Alert Level again to 3. They also observed steam plumes rising to 400 m above the summit, higher than usual. No eruption occurred, and the steady decrease in seismicity in the following months caused CVGHM to lower the Alert Level back to 2 on 14 June 2013. On 1 May 2014 the Alert Level was again raised to 3 based on increases in seismicity, but it was lowered to 2 on 8 August 2014 after a steady decrease in seismicity and steam plumes rising less than 200 m from the summit. Thermally anomalous pixels detected by MODVOLC in October 2014 were located 5-10 km W of the summit and not likely related to volcanic activity. No explosions or other eruptive activity was reported by CVGHM during 2013 or 2014.
Activity during 2015. Observations in December 2014 indicated steam plumes rising less than 200 m above the summit. Low seismicity was detected until the third week of the month when there was a significant increase in the number of seismic events, prompting an increase in the Alert Level to 3 on 26 December 2014.
CVGHM reported to BNPB (Badan Nasional Penanggulangan Bencana, Indonesia's National Board for Disaster Management) that on 6 January 2015 an eruption occurred with an ash plume that rose 6.5 km above the summit and drifted ESE. A lava flow was also observed moving 2,000 m down the WSW flank of the volcano. A single MODVOLC thermal pixel was recorded on 7 January on the W flank. Based on ground reports from that same day, the Darwin VAAC noted a significant eruption that generated a plume to an altitude of 8.2 km, but ash was not confirmed in satellite images due to weather clouds in the area.
Seven more explosions were reported between 18 January and 7 March 2015. An explosion was witnessed on 18 January with a plume reported by CVGHM rising to 4 km and drifting SW. Strombolian explosions ejected incandescent material 500 m above the crater and down onto the flanks, and lava was seen flowing 500 m SW down the flanks. A single MODVOLC pixel was recorded on 18 January. On 20 January a plume rose to 3 km altitude and drifted 45 km SW as reported by Darwin VAAC. The explosion on 21 January generated a 3.7-km-altitude ash plume and was accompanied by a multi-pixel MODVOLC thermal anomaly.
A large 6.1-km-altitude plume on 1 February also coincided with a substantial MODVOLC thermal anomaly that persisted during 1-3 February. A smaller explosion on 8 February produced an ash plume that rose to 3 km and drifted 30 km SSE. CVGHM reported an eruption late on 10 February with an ash plume to 3.7 km that was observed on satellite imagery by Darwin VAAC early on 12 February. It also coincided with a significant multi-pixel MODVOLC thermal anomaly from 10-15 February.
Based on information from CVGHM and weather models, the Darwin VAAC reported that on 7 March an explosion generated large ash plumes that rose to an altitude of 9.1 km and drifted 260 km SE and SW. BNPB noted that pyroclastic flows traveled 2.5 km down the W flank and minor ashfall was reported in Silian Raya (10 km WSW), Touluaan (13 km SW), Tombatu (17 km SSW), and in the districts of Pasan (5 km SSW) and Ratahan (10 km SE). A substantial MODVOLC thermal anomaly first appeared on the N flanks on 7 March and lasted through 10 March (figure 10). The Alert Level remained at 3 (on a scale of 1-4). The next day, the VAAC noted that an ash plume rose to an altitude of 3.7 km and drifted almost 95 km SE before dissipating.
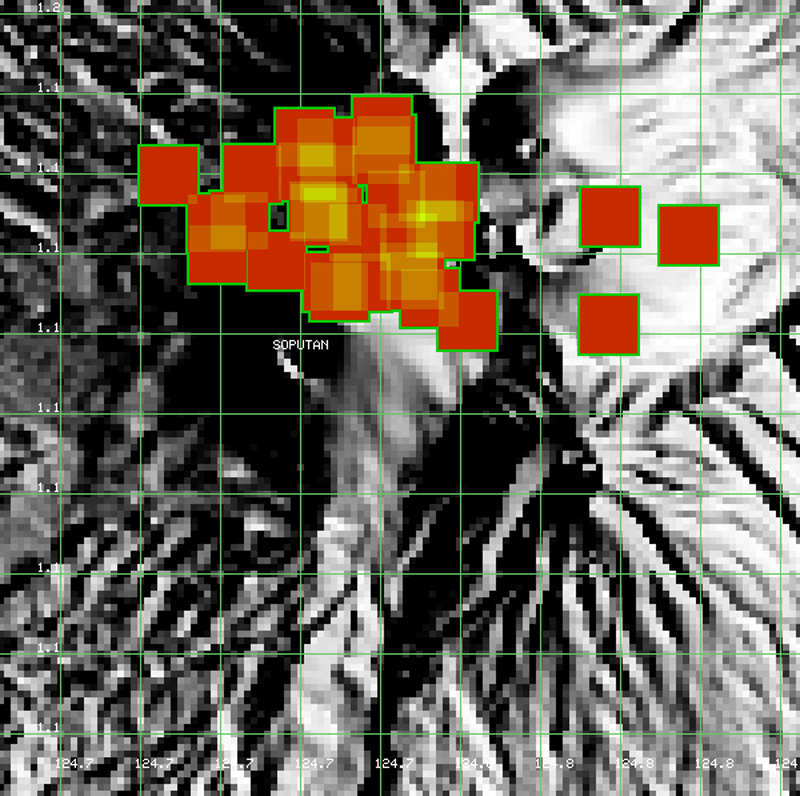 |
Figure 10. MODVOLC thermal anomalies at Soputan between 7 and 10 March 2015. Darwin VAAC reported a plume to 9.1 km on 7 March. CVGHM reported pyroclastic flows on the W flank and minor ashfall to the S and W on 7 March, followed by another ash emission on 8 March. The three separated pixels to the right (east) of Soputan may be agriculture related, but the others are likely related to the eruption. Green gridlines represent decimal latitude and longitude. Courtesy of MODVOLC. |
Seismicity continued to be variable through June 2015, with slowly declining frequency and magnitude of earthquakes (figure 11), and variable heights of steam plumes to 750 m. On 3 July 2015 CVGHM lowered the Alert Level to 2.
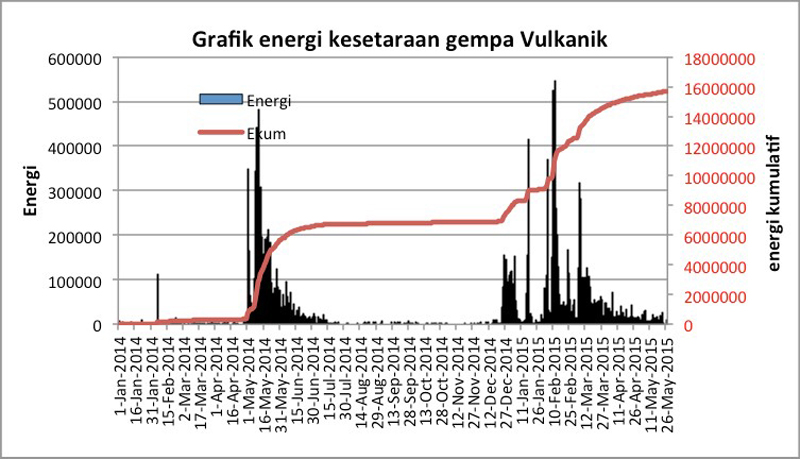 |
Figure 11. Volcanic earthquake energy equivalence chart for Soputan between 1 January 2014 and 26 May 2015. No ash explosions were reported between May and June 2014, during the first spike in energy release, but they were reported eight times between 6 January and 7 March 2015. Courtesy of CVGHM (Soputan Report, 29 May 2015). |
Information Contacts: Pusat Vulkanologi dan Mitigasi Bencana Geologi (PVMBG, also known as Indonesian Center for Volcanology and Geological Hazard Mitigation, CVGHM), Jalan Diponegoro 57, Bandung 40122, Indonesia (URL: http://www.vsi.esdm.go.id/); Darwin Volcanic Ash Advisory Centre (VAAC), Bureau of Meteorology, Northern Territory Regional Office, PO Box 40050, Casuarina, NT 0811, Australia (URL: http://www.bom.gov.au/info/vaac/); NASA Goddard Space Flight Center (NASA/GSFC), Global Sulfur Dioxide Monitoring Page, Atmospheric Chemistry and Dynamics Laboratory, Goddard, Maryland, USA (URL: https://so2.gsfc.nasa.gov/); U.S. Air Force Weather Agency (AFWA)/XOGM, Offutt Air Force Base, NE 68113, USA; Hawai'i Institute of Geophysics and Planetology (HIGP), MODVOLC Thermal Alerts System, School of Ocean and Earth Science and Technology (SOEST), Univ. of Hawai'i, 2525 Correa Road, Honolulu, HI 96822, USA (URL: http://modis.higp.hawaii.edu/, http://modis.higp.hawaii.edu/cgi-bin/modisnew.cgi); Badan Nasional Penanggulangan Bencana (BNPB), National Disaster Management Agency, Graha BNPB - Jl. Scout Kav.38, East Jakarta 13120, Indonesia (URL: http://www.bnpb.go.id/).
Ash plumes to over 12 km altitude, lava flows, pyroclastic flows, and Strombolian activity during January-February 2016
Soputan stratovolcano on the northern tip of Indonesia's island of Sulawesi has had historically observed eruptions since the 18th century, possibly earlier. The locus of eruptions has included both the summit crater and a NE-flank vent that was active during 1906-1924. Since the 1980's, continuing lava-dome growth has been punctuated by ash explosions, lava flows, and Strombolian eruptions every few years. When these events last occurred between January and March 2015, they were accompanied by strong thermal anomalies and elevated seismicity which continued into early July 2015 (BGVN 41:05). This report covers the period from July 2015 through September 2016.
Increased seismicity in November 2015 signaled the beginning of a new eruptive episode, with explosions in January and February 2016. Soputan is monitored by PVMBG (Pusat Vulkanologi dan Mitigasi Bencana Geologi), Badan Nasional Penanggulangan Bencana (BNPB) which is the Indonesian National Disaster Management Agency, and aviation alerts are managed by the Darwin VAAC (Volcanic Ash Advisory Center). Information is also provided by the University of Hawaii's MODVOLC Thermal Alert System and the MIROVA project, an Italian collaboration; both groups analyze the MODIS satellite data for thermal anomalies related to volcanoes.
Soputan erupted a significant ash plume to over 12 km altitude on 4 January 2016 after a few months of increasing seismicity. Lava flows, Strombolian eruptions, and a pyroclastic flow were observed the next day. Another large ash plume to 13 km altitude occurred on 14 January. A series of explosions beginning on 6 February resulted in more ash plumes, lava flows, and Strombolian eruptions for about 24 hours, after which activity decreased significantly. Several villages within 20 km reported ashfall from these events. The last reported activity was on 7 February 2016, although thermal anomaly data extended well into April. Seismicity had declined significantly by mid-April when the Alert Level was lowered.
Activity during July-November 2015. PVMBG lowered the Alert Level to II (second lowest on a four-level scale) on 3 July 2015, citing reduced harmonic tremor and stable RSAM (Real-time Seismic amplitude measurements) at background levels compared with the eruptive activity between January and March 2015. They did not issue another update until 3 November 2015.
MODVOLC thermal alert information from MODIS (Moderate Resolution Imaging Spectroradiometer) satellite data indicated anomalies in the vicinity of Soputan twice in September and four times in October 2015, but the locations were far enough from the volcano to suggest that they were not related to volcanic activity. This is corroborated with the MIROVA (Middle InfraRed Observation of Volcanic Activity) data from this same period which also recorded increases in Volcanic Radiative Power (VRP) in September and October. The locations indicated by MIROVA are mostly greater than 5 km from the summit, also suggesting a non-volcanic source (figure 12).
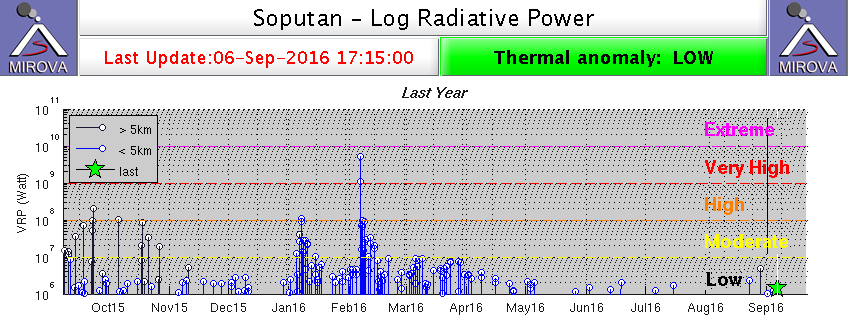 |
Figure 12. MIROVA analysis of MODIS data for 6 September 2015 through 6 September 2016 for Soputan. Moderate to High values in September and October 2015 are noted in black, indicating sources more than 5 km from the volcano and likely not related to eruptive activity. Low values in blue between 6 September and mid-December are from an unknown source within 5 km of the summit. The spikes on 4-6 January 2016 and 6-8 February correspond to observed ash plumes, lava flows, pyroclastic flows, and Strombolian eruptions reported by PVMBG. Courtesy of MIROVA. |
Additional thermal anomaly signals in the MIROVA data from mid-September through early December 2015 appear to be sourced within 5 km of the summit (figure 12), but their origin is unknown. PVMBG makes no mention of active eruptions or ash plumes during this time. PVMBG maintained the Level II alert status and documented clear skies with diffuse white steam plumes rising between 20 and 200 m from the summit crater during the last half of October and November, unchanged since July. They noted, however, that the frequency of several types of earthquakes began a gradual increase in the middle of October.
Activity during January-September 2016. Elevated seismicity continued until 4 January 2016. Photos taken on 3 and 4 January showed an increase in the density of the white-to-light-gray emissions rising to 300 m above the summit (figure 13).
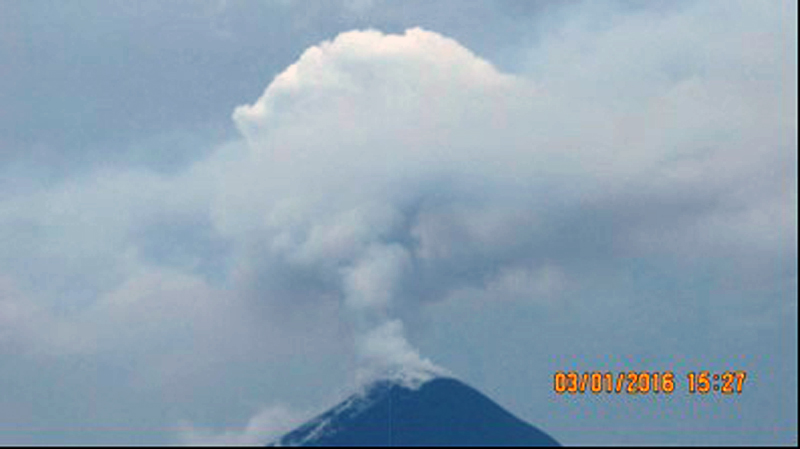 |
Figure 13. Emissions (white to light-gray) rise from Soputan on 3 January 2016, about 24 hours prior to a significant ash eruption (colors adjusted from original image). Courtesy of PVMBG (Soputan activity report through 4 January 2016). |
Dense reddish-white emissions rose 300 m above the summit early in the day on 4 January. A thermal image taken that day indicated that lava was present at the summit; PVMBG raised the Alert Level to III. Seismic amplitude (RSAM) values had also increased sharply in the preceding 12 hours, and tilt measurement data indicated significant inflation of the volcano. BNPB reported an ash eruption at 2053 local time, with a plume rising 2 km from the summit and drifting SE, and incandescent lava flowing down the E flank. Minor ashfall was reported in Langowan (12 km NE) in the Minahasa District. The Darwin VAAC raised the Aviation Color Code (ACC) to Red at 2230 local time and reported an ash plume at 12.8 km altitude drifting west 30 minutes later. This was followed in the next 24 hours by two more plumes that rose to 10.6 km and drifted NW to NE (figure 14). Continuous emissions rising to about 3.7 km were observed until early 7 January.
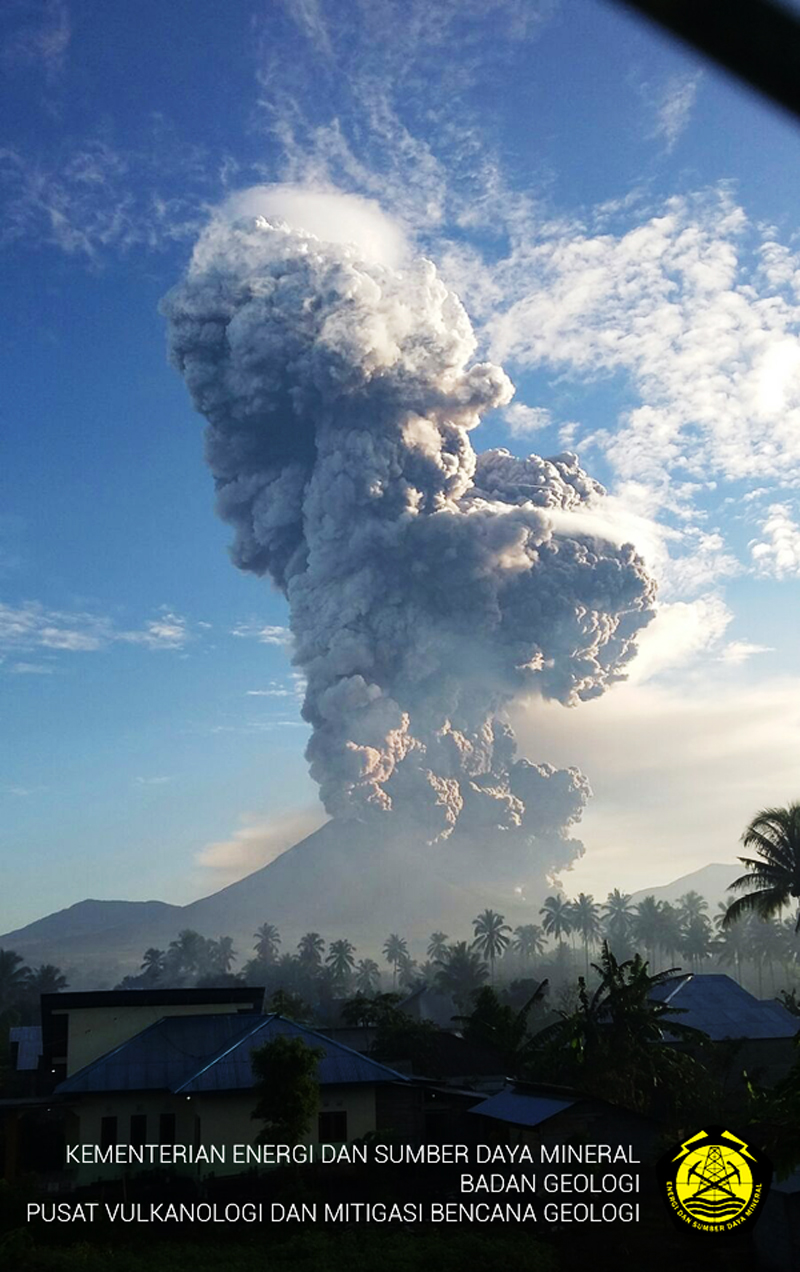 |
Figure 14. Soputan eruption during the morning hours of 5 January 2016 (local time). Photograph location uncertain but likely taken in the vicinity of Ronoketang, about 12 km S. Courtesy of PVMBG. |
A Strombolian phase early on 5 January lasted about 40 minutes and sent incandescent material 250 m high, according to BNPB. Sounds resembling thunder followed, and then a pyroclastic flow traveled 2.5 km down the ENE flank. An ash cloud rose 6.5 km above the summit crater rim (8.3 km altitude) and drifted W. Several villages in the districts of West Langowan (8 km E), Tompaso (11 km NE), and East Ratahan (14 km SE) reported ashfall.
MODVOLC thermal alert pixels likely associated with the eruption were reported during 6-8 January. A small cluster on 10 January located on the NE flank possibly indicated flowing or cooling lava. The Darwin VAAC reported another large ash plume on 14 January that rose to 13.7 km and drifted 45 km NE before dissipating.
A new series of explosions began on 6 February 2016. Ash plumes rose to 7 km altitude, later dropping to the range of 4.3-6 km, with continuous emissions drifting up to 75 km WSW through the next day. PVMBG reported lava flows on the N and E flanks; Strombolian explosions witnessed from the observation post in the village of Silian (about 10 km from the volcano) ejected material 300 m high. BNPB reported Strombolian activity on 7 February with ejected material as high as 1,000 m above the summit crater. Pyroclastic flows were also observed moving up to 2 km down the E flank. Seismic amplitudes remained high, indicating the active movement of magma within the volcano. Ashfall was reported in multiple districts including Pasan (5 km SSE), Tombatu (16 km SSW), Belang (17 km SSE), and Ratatotok (20 km S). The MODIS thermal anomaly data resulted in a very strong (32 pixel) MODVOLC thermal alert on 6 February. This corresponded with the Volcanic Radiative Power (VRP) spike presented in the MIROVA information for the same period (figure 12).
For the rest of February, only diffuse white steam plumes rose 75 m, except for a 700-m-high plume reported on 12 February by PVMBG; three MODVOLC thermal alert pixels were recorded on 11 and one on 13 February. Minor steam emissions rose to 100 m at the end of March, but the frequency of earthquakes associated with avalanches and low-frequency earthquakes were still elevated above background levels. The intensity of the avalanche-related earthquakes began to decline in the second week in April according to PVMBG. No incandescence was observed at the summit by the third week of April, and the decreasing frequency and amplitude of the earthquakes led PVMBG to lower the Alert Level to II on 21 April 2016. Between May and mid-September 2016, emissions from the volcano were characterized by white plumes of variable density ranging from 20 to 300 m above the crater and seismicity remained low (figure 15). The Alert Level remained at II.
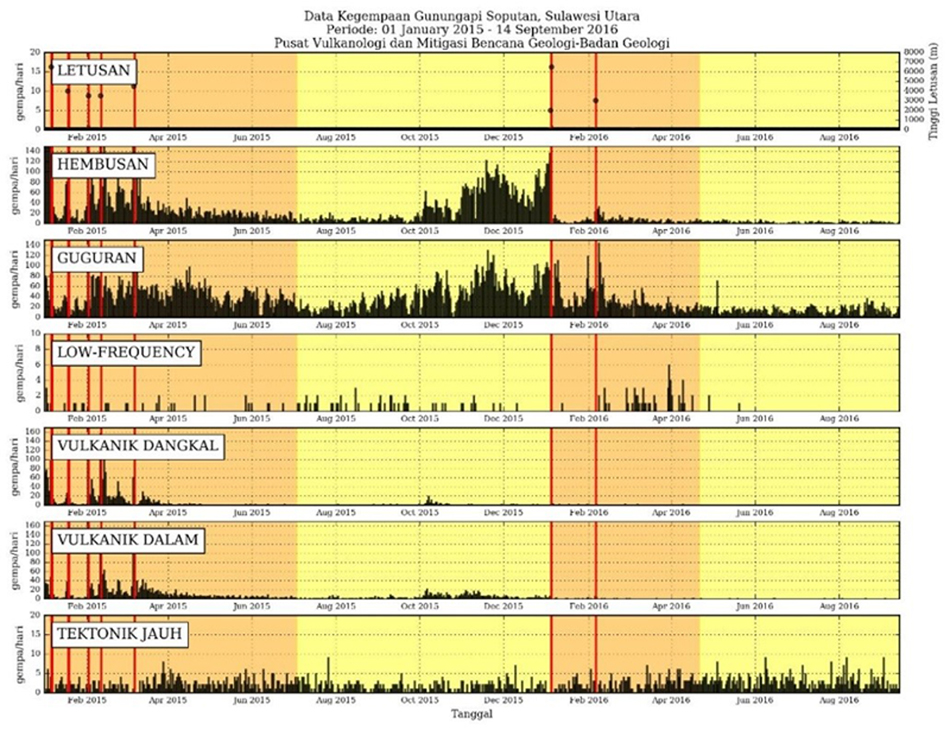 |
Figure 15. Seismicity at Soputan from 1 January 2015 through 14 September 2016. Dates of eruptive events are shown with red bars. Vertical axis on all graphs is daily frequency. LETUSAN is eruption, vertical axis on the right is height in meters above summit of ash plume observed by PVMBG; HEMBUSAN is emission related seismicity; GUGURAN is seismicity associated with rock avalanches; VULKANIK DANGKAL are shallow volcanic earthquakes; VULKANIK DALAM are deep volcanic earthquakes; TECTONIK JAUH are remote tectonic earthquakes. Courtesy of PVMBG (Soputan Report of activity through 14 September 2016). |
Information Contacts: Pusat Vulkanologi dan Mitigasi Bencana Geologi (PVMBG, also known as Indonesian Center for Volcanology and Geological Hazard Mitigation, CVGHM), Jalan Diponegoro 57, Bandung 40122, Indonesia (URL: http://www.vsi.esdm.go.id/); Badan Nasional Penanggulangan Bencana (BNPB), National Disaster Management Agency, Graha BNPB - Jl. Scout Kav.38 East Jakarta 13120 (URL: http://www.bnpb.go.id/); Darwin Volcanic Ash Advisory Centre (VAAC), Bureau of Meteorology, Northern Territory Regional Office, PO Box 40050, Casuarina, NT 0811, Australia (URL: http://www.bom.gov.au/info/vaac/); Hawai'i Institute of Geophysics and Planetology (HIGP), MODVOLC Thermal Alerts System, School of Ocean and Earth Science and Technology (SOEST), Univ. of Hawai'i, 2525 Correa Road, Honolulu, HI 96822, USA (URL: http://modis.higp.hawaii.edu/); MIROVA (Middle InfraRed Observation of Volcanic Activity), a collaborative project between the Universities of Turin and Florence (Italy) supported by the Centre for Volcanic Risk of the Italian Civil Protection Department (URL: http://www.mirovaweb.it/).
Ash explosions on 3-4 October and 16 December 2018
Soputan typically erupts every few years with ash explosions, lava flows, and Strombolian eruptions (SEAN 07:08, BGVN 42:03). After a short eruptive period during January-February 2016, the volcano quieted, with only occasional steam plumes and low seismicity. An ash explosion on 3 October 2018 marked the beginning of a new eruption. The volcano is monitored by the Pusat Vulkanologi dan Mitigasi Bencana Geologi (PVMBG). This report discusses activity during September through December 2018.
According to PVMBG, increased seismicity at Soputan was notable on 2 October 2018, characterized by an increased number of signals indicating emissions and avalanches (which began in September and mid-July, respectively), increased Real-time Seismic-Amplitude Measurement (RSAM) values, and a higher number of volcanic earthquakes (since September). Data from a thermal camera showed increased summit temperatures, interpreted as indicating the presence of lava. The Alert Level was increased to 3 (on a scale of 1-4) on 3 October; people were advised not to approach the craters within a radius of 4 km, with an additional expansion to 6.5 km on the WSW flank due to increased risk from a breach in the crater rim.
An eruption at 0847 on 3 October produced a dense ash plume that rose 4 km above the summit and drifted W and NW (figure 16). Based on seismic data the event lasted six minutes. Events at 1044, 1112, and 1152 produced ash plumes that rose 2, 2.5, and 5 km above the crater rim, respectively. A thermal anomaly identified in satellite data significantly increased, and incandescent ejecta at the summit was clearly observed by residents. Avalanches of material traveled 2.5 km down the NE flank.
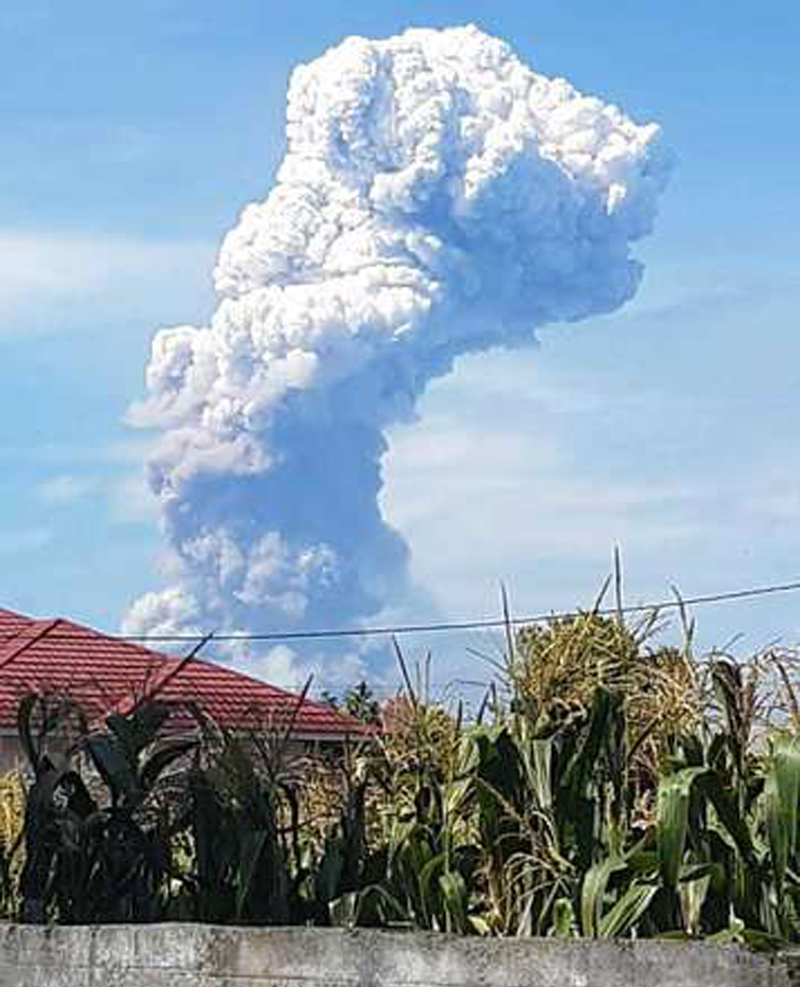 |
Figure 16. An ash plume from Soputan on 3 October 2018, as seen from Tomohon (25 km NNE). Courtesy of AP Photo/Hetty Andih. |
Based on satellite images, information from PVMBG, and wind model data, the Darwin Volcanic Ash Advisory Center (VAAC) reported that on 4 October ash plumes rose to an altitude of 4.6 km and drifted W. On 16 October, PVMBG issued a Volcano Observatory Notice for Aviation (VONA) that noted only white emissions; consequently, the Aviation Color Code was lowered to Yellow.
According to PVMBG, seismic activity rapidly and significantly increased at 1700 on 15 December. An eruption began at 0102 on 16 December, though dark and foggy conditions prevented views of emissions. The event lasted for almost 10 minutes, and thunderous sounds were heard at the Soputan Volcano Observation Post located in Silian Raya (about 10 km SW). The conditions improved about two hours later, and a dense ash plume was visible, rising 3 km above the summit and drifting SE. Incandescence from the summit was also visible. An event that began at 0540 produced dense gray-to-black ash plumes that rose as high as 7 km above the summit (summit elevation is 1,785 m) and drifted SE. The event lasted for 6 minutes and 10 seconds based on the seismic network. Ash plumes from events at 0743 and 0857 rose as high as 7.5 km and drifted SW.
Satellite data. Thermal anomalies, based on MODIS satellite instruments analyzed using the MODVOLC algorithm, were observed during two days in September (14 and 30 September), seven days in October, and lastly on 8 November 2018. Pixel numbers peaked during 3-7 October (six pixels on 3 October). The MIROVA (Middle InfraRed Observation of Volcanic Activity) volcano hotspot detection system, also based on analysis of MODIS data, detected numerous hotspots within 5 km of the volcano during the reporting period. Significant sulfur dioxide levels near the volcano were recorded by NASA's satellite-borne ozone instruments on or just after the 3 October and 16 December explosions.
Information Contacts: Pusat Vulkanologi dan Mitigasi Bencana Geologi (PVMBG, also known as Indonesian Center for Volcanology and Geological Hazard Mitigation, CVGHM), Jalan Diponegoro 57, Bandung 40122, Indonesia (URL: http://www.vsi.esdm.go.id/); Badan Nasional Penanggulangan Bencana (BNPB), National Disaster Management Agency, Graha BNPB - Jl. Scout Kav.38, East Jakarta 13120, Indonesia (URL: http://www.bnpb.go.id/); Darwin Volcanic Ash Advisory Centre (VAAC), Bureau of Meteorology, Northern Territory Regional Office, PO Box 40050, Casuarina, NT 0811, Australia (URL: http://www.bom.gov.au/info/vaac/); Hawai'i Institute of Geophysics and Planetology (HIGP) - MODVOLC Thermal Alerts System, School of Ocean and Earth Science and Technology (SOEST), Univ. of Hawai'i, 2525 Correa Road, Honolulu, HI 96822, USA (URL: http://modis.higp.hawaii.edu/); MIROVA (Middle InfraRed Observation of Volcanic Activity), a collaborative project between the Universities of Turin and Florence (Italy) supported by the Centre for Volcanic Risk of the Italian Civil Protection Department (URL: http://www.mirovaweb.it/); Global Sulfur Dioxide Monitoring Page, Atmospheric Chemistry and Dynamics Laboratory, NASA Goddard Space Flight Center (NASA/GSFC), 8800 Greenbelt Road, Goddard, Maryland, USA (URL: https://so2.gsfc.nasa.gov/); Associated Press (URL: http://www.ap.org/).
Minor ash emissions during 23 March and 2 April 2020
Soputan is a stratovolcano located in the northern arm of Sulawesi Island, Indonesia. Previous eruptive periods were characterized by ash explosions, lava flows, and Strombolian eruptions. The most recent eruption occurred during October-December 2018, which consisted mostly of ash plumes and some summit incandescence (BGVN 44:01). This report updates information for January 2019-April 2020 characterized by two ash plumes and gas-and-steam emissions. The primary source of information come from the Pusat Vulkanologi dan Mitigasi Bencana Geologi (PVMBG) and the Darwin Volcanic Ash Advisory Center (VAAC).
Activity during January 2019-April 2020 was relatively low; three faint thermal anomalies were observed at the summit at Soputan in satellite imagery for a total of three days on 2 and 4 January, and 1 October 2019 (figure 17). The MIROVA (Middle InfraRed Observation of Volcanic Activity) based on analysis of MODIS data detected 12 distal hotspots and six low-power hotspots within 5 km of the summit during August to early October 2019. A single distal thermal hotspot was detected in early March 2020. In March, activity primarily consisted of white to gray gas-and-steam plumes that rose 20-100 m above the crater, according to PVMBG. The Darwin VAAC issued a notice on 23 March 2020 that reported an ash plume rose to 4.3 km altitude; minor ash emissions had been visible in a webcam image the previous day (figure 18). A second notice was issued on 2 April, where an ash plume was observed rising 2.1 km altitude and drifting W.
|
Figure 17. Sentinel-2 thermal satellite imagery detected a total of three thermal hotspots (bright yellow-orange) at the summit of Soputan on 2 and 4 January and 1 October 2019. Sentinel-2 atmospheric penetration (bands 12, 11, 8A) images courtesy of Sentinel Hub Playground. |
|
Figure 18. Minor ash emissions were seen rising from Soputan on 22 March 2020. Courtesy of MAGMA Indonesia. |
Information Contacts: Pusat Vulkanologi dan Mitigasi Bencana Geologi (PVMBG, also known as Indonesian Center for Volcanology and Geological Hazard Mitigation, CVGHM), Jalan Diponegoro 57, Bandung 40122, Indonesia (URL: http://www.vsi.esdm.go.id/); MAGMA Indonesia, Kementerian Energi dan Sumber Daya Mineral (URL: https://magma.vsi.esdm.go.id/); Darwin Volcanic Ash Advisory Centre (VAAC), Bureau of Meteorology, Northern Territory Regional Office, PO Box 40050, Casuarina, NT 0811, Australia (URL: http://www.bom.gov.au/info/vaac/); MIROVA (Middle InfraRed Observation of Volcanic Activity), a collaborative project between the Universities of Turin and Florence (Italy) supported by the Centre for Volcanic Risk of the Italian Civil Protection Department (URL: http://www.mirovaweb.it/); Sentinel Hub Playground (URL: https://www.sentinel-hub.com/explore/sentinel-playground).
|
|
||||||||||||||||||||||||||
There is data available for 41 confirmed eruptive periods.
2020 Mar 23 - 2020 Apr 2 Confirmed Eruption (Explosive / Effusive) VEI: 2
| Episode 1 | Eruption (Explosive / Effusive) | ||||||||||||||
|---|---|---|---|---|---|---|---|---|---|---|---|---|---|---|
| 2020 Mar 23 - 2020 Apr 2 | Evidence from Observations: Reported | |||||||||||||
|
List of 1 Events for Episode 1
|
||||||||||||||
2018 Oct 2 - 2018 Dec 16 Confirmed Eruption (Explosive / Effusive) VEI: 3
| Episode 1 | Eruption (Explosive / Effusive) | Summit crater | ||||||||||||||||||||||||||||||||||||||||||||||||||||||||||||||||||||||||||||||||||||||||||||||||||
|---|---|---|---|---|---|---|---|---|---|---|---|---|---|---|---|---|---|---|---|---|---|---|---|---|---|---|---|---|---|---|---|---|---|---|---|---|---|---|---|---|---|---|---|---|---|---|---|---|---|---|---|---|---|---|---|---|---|---|---|---|---|---|---|---|---|---|---|---|---|---|---|---|---|---|---|---|---|---|---|---|---|---|---|---|---|---|---|---|---|---|---|---|---|---|---|---|---|---|---|
| 2018 Oct 2 - 2018 Dec 16 | Evidence from Observations: Reported | ||||||||||||||||||||||||||||||||||||||||||||||||||||||||||||||||||||||||||||||||||||||||||||||||||
| Increased seismicity was notable on 2 October 2018. Data from a thermal camera showed increased summit temperatures, indicating the presence of lava. An eruption began at 0847 on 3 October, producing a dense ash plume that rose 4 km above the summit. Events at 1044, 1112, and 1152 produced ash plumes that rose 2, 2.5, and 5 km above the crater rim, respectively. A thermal anomaly identified in satellite data significantly increased, and incandescent ejecta at the summit was clearly observed by residents. Avalanches of material traveled 2.5 km down the NE flank. On 4 October ash plumes rose to an altitude of 4.6 km and drifted W. Seismic activity rapidly increased at 1700 on 15 December. An eruption began at 0102 on 16 December, though dark and foggy conditions prevented views of emissions. The event lasted for almost 10 minutes, and thunderous sounds were heard about 10 km SW. The conditions improved about two hours later, and a dense ash plume was visible, rising 3 km above the summit and drifting SE. Incandescence from the summit was also visible. By 0540 dense gray-to-black ash plumes that rose as high as 7 km above the summit and drifted SE. The event lasted for 6 minutes and 10 seconds based on the seismic network. Ash plumes from events at 0743 and 0857 rose as high as 7.5 km and drifted SW. | |||||||||||||||||||||||||||||||||||||||||||||||||||||||||||||||||||||||||||||||||||||||||||||||||||
|
List of 18 Events for Episode 1 at Summit crater
|
|||||||||||||||||||||||||||||||||||||||||||||||||||||||||||||||||||||||||||||||||||||||||||||||||||
2016 Jan 2 - 2016 Feb 7 Confirmed Eruption (Explosive / Effusive) VEI: 3
| Episode 1 | Eruption (Explosive / Effusive) | Puncak Crater | |||||||||||||||||||||||||||||||||||||||||||||||||||||||||||||||||||||||||||||||||||||||||||||||||||||||||||||||||||||||||||||||||||||||||||||||||||||||||||||||||||||||||||||||||||||||||||||||||
|---|---|---|---|---|---|---|---|---|---|---|---|---|---|---|---|---|---|---|---|---|---|---|---|---|---|---|---|---|---|---|---|---|---|---|---|---|---|---|---|---|---|---|---|---|---|---|---|---|---|---|---|---|---|---|---|---|---|---|---|---|---|---|---|---|---|---|---|---|---|---|---|---|---|---|---|---|---|---|---|---|---|---|---|---|---|---|---|---|---|---|---|---|---|---|---|---|---|---|---|---|---|---|---|---|---|---|---|---|---|---|---|---|---|---|---|---|---|---|---|---|---|---|---|---|---|---|---|---|---|---|---|---|---|---|---|---|---|---|---|---|---|---|---|---|---|---|---|---|---|---|---|---|---|---|---|---|---|---|---|---|---|---|---|---|---|---|---|---|---|---|---|---|---|---|---|---|---|---|---|---|---|---|---|---|---|---|---|---|---|---|---|---|---|---|
| 2016 Jan 2 - 2016 Feb 7 | Evidence from Observations: Reported | |||||||||||||||||||||||||||||||||||||||||||||||||||||||||||||||||||||||||||||||||||||||||||||||||||||||||||||||||||||||||||||||||||||||||||||||||||||||||||||||||||||||||||||||||||||||||||||||||
|
List of 37 Events for Episode 1 at Puncak Crater
|
||||||||||||||||||||||||||||||||||||||||||||||||||||||||||||||||||||||||||||||||||||||||||||||||||||||||||||||||||||||||||||||||||||||||||||||||||||||||||||||||||||||||||||||||||||||||||||||||||
2015 Jan 6 - 2015 Mar 9 Confirmed Eruption (Explosive / Effusive) VEI: 3
| Episode 1 | Eruption (Explosive / Effusive) | Summit crater and WSW flank | ||||||||||||||||||||||||||||||||||||||||||||||||||||||||||||||||||||||||||||||||||||||||||||||||||||||||||||||||||||||||||||||||||||||||||
|---|---|---|---|---|---|---|---|---|---|---|---|---|---|---|---|---|---|---|---|---|---|---|---|---|---|---|---|---|---|---|---|---|---|---|---|---|---|---|---|---|---|---|---|---|---|---|---|---|---|---|---|---|---|---|---|---|---|---|---|---|---|---|---|---|---|---|---|---|---|---|---|---|---|---|---|---|---|---|---|---|---|---|---|---|---|---|---|---|---|---|---|---|---|---|---|---|---|---|---|---|---|---|---|---|---|---|---|---|---|---|---|---|---|---|---|---|---|---|---|---|---|---|---|---|---|---|---|---|---|---|---|---|---|---|---|---|---|---|---|
| 2015 Jan 6 - 2015 Mar 9 | Evidence from Observations: Reported | ||||||||||||||||||||||||||||||||||||||||||||||||||||||||||||||||||||||||||||||||||||||||||||||||||||||||||||||||||||||||||||||||||||||||||
|
List of 26 Events for Episode 1 at Summit crater and WSW flank
|
|||||||||||||||||||||||||||||||||||||||||||||||||||||||||||||||||||||||||||||||||||||||||||||||||||||||||||||||||||||||||||||||||||||||||||
2012 Aug 26 - 2012 Sep 19 Confirmed Eruption (Explosive / Effusive) VEI: 3
| Episode 1 | Eruption (Explosive / Effusive) | Summit crater | ||||||||||||||||||||||||||||||||||||||||||||||||||||||||||||||||||||||||||||||||||||||||
|---|---|---|---|---|---|---|---|---|---|---|---|---|---|---|---|---|---|---|---|---|---|---|---|---|---|---|---|---|---|---|---|---|---|---|---|---|---|---|---|---|---|---|---|---|---|---|---|---|---|---|---|---|---|---|---|---|---|---|---|---|---|---|---|---|---|---|---|---|---|---|---|---|---|---|---|---|---|---|---|---|---|---|---|---|---|---|---|---|---|
| 2012 Aug 26 - 2012 Sep 19 | Evidence from Observations: Reported | ||||||||||||||||||||||||||||||||||||||||||||||||||||||||||||||||||||||||||||||||||||||||
|
List of 16 Events for Episode 1 at Summit crater
|
|||||||||||||||||||||||||||||||||||||||||||||||||||||||||||||||||||||||||||||||||||||||||
2011 Jul 3 - 2011 Aug 15 Confirmed Eruption (Explosive / Effusive) VEI: 3
| Episode 1 | Eruption (Explosive / Effusive) | Summit crater and flank | ||||||||||||||||||||||||||||||||||||||||||||||||||||||||||||||||||||||||||||||
|---|---|---|---|---|---|---|---|---|---|---|---|---|---|---|---|---|---|---|---|---|---|---|---|---|---|---|---|---|---|---|---|---|---|---|---|---|---|---|---|---|---|---|---|---|---|---|---|---|---|---|---|---|---|---|---|---|---|---|---|---|---|---|---|---|---|---|---|---|---|---|---|---|---|---|---|---|---|---|---|
| 2011 Jul 3 - 2011 Aug 15 | Evidence from Observations: Reported | ||||||||||||||||||||||||||||||||||||||||||||||||||||||||||||||||||||||||||||||
|
List of 14 Events for Episode 1 at Summit crater and flank
|
|||||||||||||||||||||||||||||||||||||||||||||||||||||||||||||||||||||||||||||||
2008 Jun 6 - 2008 Nov 2 (?) Confirmed Eruption (Explosive / Effusive) VEI: 3 (?)
| Episode 1 | Eruption (Explosive / Effusive) | ||||||||||||||||||||||||||||||||||||||||||||||||||||||
|---|---|---|---|---|---|---|---|---|---|---|---|---|---|---|---|---|---|---|---|---|---|---|---|---|---|---|---|---|---|---|---|---|---|---|---|---|---|---|---|---|---|---|---|---|---|---|---|---|---|---|---|---|---|---|
| 2008 Jun 6 - 2008 Nov 2 (?) | Evidence from Observations: Reported | |||||||||||||||||||||||||||||||||||||||||||||||||||||
|
List of 9 Events for Episode 1
|
||||||||||||||||||||||||||||||||||||||||||||||||||||||
2007 Jun 16 (?) ± 15 days - 2007 Nov 9 (?) Confirmed Eruption (Explosive / Effusive) VEI: 3
| Episode 1 | Eruption (Explosive / Effusive) | |||||||||||||||||||||||||||||||||||||||
|---|---|---|---|---|---|---|---|---|---|---|---|---|---|---|---|---|---|---|---|---|---|---|---|---|---|---|---|---|---|---|---|---|---|---|---|---|---|---|---|
| 2007 Jun 16 (?) ± 15 days - 2007 Nov 9 (?) | Evidence from Observations: Reported | ||||||||||||||||||||||||||||||||||||||
|
List of 6 Events for Episode 1
|
|||||||||||||||||||||||||||||||||||||||
2006 Dec 14 - 2006 Dec 26 (?) Confirmed Eruption (Explosive / Effusive) VEI: 1
| Episode 1 | Eruption (Explosive / Effusive) | |||||||||||||||||||||||||||||
|---|---|---|---|---|---|---|---|---|---|---|---|---|---|---|---|---|---|---|---|---|---|---|---|---|---|---|---|---|---|
| 2006 Dec 14 - 2006 Dec 26 (?) | Evidence from Observations: Reported | ||||||||||||||||||||||||||||
|
List of 4 Events for Episode 1
|
|||||||||||||||||||||||||||||
2005 Dec 26 - 2006 Jan 24 (?) Confirmed Eruption (Explosive / Effusive) VEI: 1
| Episode 1 | Eruption (Explosive / Effusive) | ||||||||||||||||||||||||||||||||||
|---|---|---|---|---|---|---|---|---|---|---|---|---|---|---|---|---|---|---|---|---|---|---|---|---|---|---|---|---|---|---|---|---|---|---|
| 2005 Dec 26 - 2006 Jan 24 (?) | Evidence from Observations: Reported | |||||||||||||||||||||||||||||||||
|
List of 5 Events for Episode 1
|
||||||||||||||||||||||||||||||||||
2005 Apr 19 - 2005 Jul 18 (?) Confirmed Eruption (Explosive / Effusive) VEI: 2
| Episode 1 | Eruption (Explosive / Effusive) | |||||||||||||||||||||||||||||||||||||||
|---|---|---|---|---|---|---|---|---|---|---|---|---|---|---|---|---|---|---|---|---|---|---|---|---|---|---|---|---|---|---|---|---|---|---|---|---|---|---|---|
| 2005 Apr 19 - 2005 Jul 18 (?) | Evidence from Observations: Reported | ||||||||||||||||||||||||||||||||||||||
|
List of 6 Events for Episode 1
|
|||||||||||||||||||||||||||||||||||||||
2004 Oct 18 - 2004 Dec 27 (?) Confirmed Eruption (Explosive / Effusive) VEI: 3 (?)
| Episode 1 | Eruption (Explosive / Effusive) | ||||||||||||||||||||||||||||||||||||||||||||||||||||||||||||||||
|---|---|---|---|---|---|---|---|---|---|---|---|---|---|---|---|---|---|---|---|---|---|---|---|---|---|---|---|---|---|---|---|---|---|---|---|---|---|---|---|---|---|---|---|---|---|---|---|---|---|---|---|---|---|---|---|---|---|---|---|---|---|---|---|---|
| 2004 Oct 18 - 2004 Dec 27 (?) | Evidence from Observations: Reported | |||||||||||||||||||||||||||||||||||||||||||||||||||||||||||||||
|
List of 11 Events for Episode 1
|
||||||||||||||||||||||||||||||||||||||||||||||||||||||||||||||||
2000 May 13 - 2003 Sep 4 (?) Confirmed Eruption (Explosive / Effusive) VEI: 2
| Episode 1 | Eruption (Explosive / Effusive) | |||||||||||||||||||||||||||||||||||||||||||||||||||||||||||||||||||||
|---|---|---|---|---|---|---|---|---|---|---|---|---|---|---|---|---|---|---|---|---|---|---|---|---|---|---|---|---|---|---|---|---|---|---|---|---|---|---|---|---|---|---|---|---|---|---|---|---|---|---|---|---|---|---|---|---|---|---|---|---|---|---|---|---|---|---|---|---|---|
| 2000 May 13 - 2003 Sep 4 (?) | Evidence from Observations: Reported | ||||||||||||||||||||||||||||||||||||||||||||||||||||||||||||||||||||
|
List of 12 Events for Episode 1
|
|||||||||||||||||||||||||||||||||||||||||||||||||||||||||||||||||||||
1991 May 22 - 1996 Sep 29 (on or after) Confirmed Eruption (Explosive / Effusive) VEI: 2
| Episode 1 | Eruption (Explosive / Effusive) | |||||||||||||||||||||||||||||||||||||||||||||||||||||||||||
|---|---|---|---|---|---|---|---|---|---|---|---|---|---|---|---|---|---|---|---|---|---|---|---|---|---|---|---|---|---|---|---|---|---|---|---|---|---|---|---|---|---|---|---|---|---|---|---|---|---|---|---|---|---|---|---|---|---|---|---|
| 1991 May 22 - 1996 Sep 29 (on or after) | Evidence from Observations: Reported | ||||||||||||||||||||||||||||||||||||||||||||||||||||||||||
|
List of 10 Events for Episode 1
|
|||||||||||||||||||||||||||||||||||||||||||||||||||||||||||
1989 Apr 22 - 1989 Apr 23 Confirmed Eruption (Explosive / Effusive) VEI: 2
| Episode 1 | Eruption (Explosive / Effusive) | ||||||||||||||||||||||||||||||||||||||||||||
|---|---|---|---|---|---|---|---|---|---|---|---|---|---|---|---|---|---|---|---|---|---|---|---|---|---|---|---|---|---|---|---|---|---|---|---|---|---|---|---|---|---|---|---|---|
| 1989 Apr 22 - 1989 Apr 23 | Evidence from Observations: Reported | |||||||||||||||||||||||||||||||||||||||||||
|
List of 7 Events for Episode 1
|
||||||||||||||||||||||||||||||||||||||||||||
1985 May 19 - 1985 May 20 Confirmed Eruption (Explosive / Effusive) VEI: 2
| Episode 1 | Eruption (Explosive / Effusive) | |||||||||||||||||||||||||||||||||||||||||||||||||
|---|---|---|---|---|---|---|---|---|---|---|---|---|---|---|---|---|---|---|---|---|---|---|---|---|---|---|---|---|---|---|---|---|---|---|---|---|---|---|---|---|---|---|---|---|---|---|---|---|---|
| 1985 May 19 - 1985 May 20 | Evidence from Observations: Reported | ||||||||||||||||||||||||||||||||||||||||||||||||
|
List of 8 Events for Episode 1
|
|||||||||||||||||||||||||||||||||||||||||||||||||
1984 May 24 - 1984 Aug 31 Confirmed Eruption (Explosive / Effusive) VEI: 3
| Episode 1 | Eruption (Explosive / Effusive) | |||||||||||||||||||||||||||||||||||||||||||||||||||||||||||
|---|---|---|---|---|---|---|---|---|---|---|---|---|---|---|---|---|---|---|---|---|---|---|---|---|---|---|---|---|---|---|---|---|---|---|---|---|---|---|---|---|---|---|---|---|---|---|---|---|---|---|---|---|---|---|---|---|---|---|---|
| 1984 May 24 - 1984 Aug 31 | Evidence from Observations: Reported | ||||||||||||||||||||||||||||||||||||||||||||||||||||||||||
|
List of 10 Events for Episode 1
|
|||||||||||||||||||||||||||||||||||||||||||||||||||||||||||
1982 Aug 26 - 1982 Nov 10 Confirmed Eruption (Explosive / Effusive) VEI: 3
| Episode 1 | Eruption (Explosive / Effusive) | |||||||||||||||||||||||||||||||||||||||||||||||||
|---|---|---|---|---|---|---|---|---|---|---|---|---|---|---|---|---|---|---|---|---|---|---|---|---|---|---|---|---|---|---|---|---|---|---|---|---|---|---|---|---|---|---|---|---|---|---|---|---|---|
| 1982 Aug 26 - 1982 Nov 10 | Evidence from Observations: Reported | ||||||||||||||||||||||||||||||||||||||||||||||||
|
List of 8 Events for Episode 1
|
|||||||||||||||||||||||||||||||||||||||||||||||||
1973 Jan 6 - 1973 May 27 Confirmed Eruption (Explosive / Effusive) VEI: 2
| Episode 1 | Eruption (Explosive / Effusive) | ||||||||||||||||||||||||
|---|---|---|---|---|---|---|---|---|---|---|---|---|---|---|---|---|---|---|---|---|---|---|---|---|
| 1973 Jan 6 - 1973 May 27 | Evidence from Observations: Reported | |||||||||||||||||||||||
|
List of 3 Events for Episode 1
|
||||||||||||||||||||||||
1971 May 19 - 1971 May 19 Confirmed Eruption (Explosive / Effusive) VEI: 1
| Episode 1 | Eruption (Explosive / Effusive) | ||||||||||||||||||||||||
|---|---|---|---|---|---|---|---|---|---|---|---|---|---|---|---|---|---|---|---|---|---|---|---|---|
| 1971 May 19 - 1971 May 19 | Evidence from Observations: Reported | |||||||||||||||||||||||
|
List of 3 Events for Episode 1
|
||||||||||||||||||||||||
1970 Feb 16 ± 15 days - 1970 May 26 ± 5 days Confirmed Eruption (Explosive / Effusive) VEI: 2
| Episode 1 | Eruption (Explosive / Effusive) | ||||||||||||||||||||||||
|---|---|---|---|---|---|---|---|---|---|---|---|---|---|---|---|---|---|---|---|---|---|---|---|---|
| 1970 Feb 16 ± 15 days - 1970 May 26 ± 5 days | Evidence from Observations: Reported | |||||||||||||||||||||||
|
List of 3 Events for Episode 1
|
||||||||||||||||||||||||
1968 Jul 16 ± 15 days - 1968 Aug 16 ± 15 days Confirmed Eruption (Explosive / Effusive) VEI: 1
| Episode 1 | Eruption (Explosive / Effusive) | |||||||||||||||||||||||||||||
|---|---|---|---|---|---|---|---|---|---|---|---|---|---|---|---|---|---|---|---|---|---|---|---|---|---|---|---|---|---|
| 1968 Jul 16 ± 15 days - 1968 Aug 16 ± 15 days | Evidence from Observations: Reported | ||||||||||||||||||||||||||||
|
List of 4 Events for Episode 1
|
|||||||||||||||||||||||||||||
1966 May 21 - 1967 Nov 16 ± 15 days Confirmed Eruption (Explosive / Effusive) VEI: 3
| Episode 1 | Eruption (Explosive / Effusive) | Kawah Soputan | |||||||||||||||||||||||||||||||||||||||||||||||||||||
|---|---|---|---|---|---|---|---|---|---|---|---|---|---|---|---|---|---|---|---|---|---|---|---|---|---|---|---|---|---|---|---|---|---|---|---|---|---|---|---|---|---|---|---|---|---|---|---|---|---|---|---|---|---|---|
| 1966 May 21 - 1967 Nov 16 ± 15 days | Evidence from Observations: Reported | |||||||||||||||||||||||||||||||||||||||||||||||||||||
|
List of 9 Events for Episode 1 at Kawah Soputan
|
||||||||||||||||||||||||||||||||||||||||||||||||||||||
1953 Nov 16 ± 15 days Confirmed Eruption (Explosive / Effusive) VEI: 2
| Episode 1 | Eruption (Explosive / Effusive) | NE flank (Aeseput) | ||||||||||||||||||
|---|---|---|---|---|---|---|---|---|---|---|---|---|---|---|---|---|---|---|---|
| 1953 Nov 16 ± 15 days - Unknown | Evidence from Observations: Reported | ||||||||||||||||||
|
List of 2 Events for Episode 1 at NE flank (Aeseput)
|
|||||||||||||||||||
1947 Aug 22 - 1947 Aug 27 Confirmed Eruption (Explosive / Effusive) VEI: 2
| Episode 1 | Eruption (Explosive / Effusive) | NE flank (Aeseput) | ||||||||||||||||||
|---|---|---|---|---|---|---|---|---|---|---|---|---|---|---|---|---|---|---|---|
| 1947 Aug 22 - 1947 Aug 27 | Evidence from Observations: Reported | ||||||||||||||||||
|
List of 2 Events for Episode 1 at NE flank (Aeseput)
|
|||||||||||||||||||
1923 Nov 27 - 1924 Jan 18 Confirmed Eruption (Explosive / Effusive) VEI: 2
| Episode 1 | Eruption (Explosive / Effusive) | NE flank (Aeseput) | ||||||||||||||||||||||||||||||||||||||
|---|---|---|---|---|---|---|---|---|---|---|---|---|---|---|---|---|---|---|---|---|---|---|---|---|---|---|---|---|---|---|---|---|---|---|---|---|---|---|---|
| 1923 Nov 27 - 1924 Jan 18 | Evidence from Observations: Reported | ||||||||||||||||||||||||||||||||||||||
|
List of 6 Events for Episode 1 at NE flank (Aeseput)
|
|||||||||||||||||||||||||||||||||||||||
1917 Nov Confirmed Eruption (Explosive / Effusive) VEI: 2
| Episode 1 | Eruption (Explosive / Effusive) | NE flank (Aeseput) | ||||||||||||||||||
|---|---|---|---|---|---|---|---|---|---|---|---|---|---|---|---|---|---|---|---|
| 1917 Nov - Unknown | Evidence from Observations: Reported | ||||||||||||||||||
|
List of 2 Events for Episode 1 at NE flank (Aeseput)
|
|||||||||||||||||||
1915 Apr - 1915 Jun Confirmed Eruption (Explosive / Effusive) VEI: 2
| Episode 1 | Eruption (Explosive / Effusive) | NE flank (Aeseput Weru) | |||||||||||||||||||||||
|---|---|---|---|---|---|---|---|---|---|---|---|---|---|---|---|---|---|---|---|---|---|---|---|---|
| 1915 Apr - 1915 Jun | Evidence from Observations: Reported | |||||||||||||||||||||||
|
List of 3 Events for Episode 1 at NE flank (Aeseput Weru)
|
||||||||||||||||||||||||
1913 Apr - 1913 Jul Confirmed Eruption (Explosive / Effusive) VEI: 2
| Episode 1 | Eruption (Explosive / Effusive) | NE flank (Aeseput) | ||||||||||||||||||
|---|---|---|---|---|---|---|---|---|---|---|---|---|---|---|---|---|---|---|---|
| 1913 Apr - 1913 Jul | Evidence from Observations: Reported | ||||||||||||||||||
|
List of 2 Events for Episode 1 at NE flank (Aeseput)
|
|||||||||||||||||||
1911 Nov - 1912 Apr Confirmed Eruption (Explosive / Effusive) VEI: 2
| Episode 1 | Eruption (Explosive / Effusive) | NE flank (Aeseput) | |||||||||||||||||||||||
|---|---|---|---|---|---|---|---|---|---|---|---|---|---|---|---|---|---|---|---|---|---|---|---|---|
| 1911 Nov - 1912 Apr | Evidence from Observations: Reported | |||||||||||||||||||||||
|
List of 3 Events for Episode 1 at NE flank (Aeseput)
|
||||||||||||||||||||||||
1910 Nov 15 ± 45 days Confirmed Eruption (Explosive / Effusive) VEI: 2
| Episode 1 | Eruption (Explosive / Effusive) | NE flank (Aeseput) | |||||||||||||||||||||||
|---|---|---|---|---|---|---|---|---|---|---|---|---|---|---|---|---|---|---|---|---|---|---|---|---|
| 1910 Nov 15 ± 45 days - Unknown | Evidence from Observations: Reported | |||||||||||||||||||||||
|
List of 3 Events for Episode 1 at NE flank (Aeseput)
|
||||||||||||||||||||||||
1908 Jun - 1909 Jun Confirmed Eruption (Explosive / Effusive) VEI: 2
| Episode 1 | Eruption (Explosive / Effusive) | NE flank (Aeseput) | |||||||||||||||||||||||
|---|---|---|---|---|---|---|---|---|---|---|---|---|---|---|---|---|---|---|---|---|---|---|---|---|
| 1908 Jun - 1909 Jun | Evidence from Observations: Reported | |||||||||||||||||||||||
|
List of 3 Events for Episode 1 at NE flank (Aeseput)
|
||||||||||||||||||||||||
1907 Jun 5 - 1907 Jun 25 (?) Confirmed Eruption (Explosive / Effusive) VEI: 2
| Episode 1 | Eruption (Explosive / Effusive) | NE flank (Aeseput) | |||||||||||||||||||||||
|---|---|---|---|---|---|---|---|---|---|---|---|---|---|---|---|---|---|---|---|---|---|---|---|---|
| 1907 Jun 5 - 1907 Jun 25 (?) | Evidence from Observations: Reported | |||||||||||||||||||||||
|
List of 3 Events for Episode 1 at NE flank (Aeseput)
|
||||||||||||||||||||||||
1906 Jun 17 - 1906 Sep Confirmed Eruption (Explosive / Effusive) VEI: 2
| Episode 1 | Eruption (Explosive / Effusive) | NE flank (Aeseput) | ||||||||||||||||||||||||||||
|---|---|---|---|---|---|---|---|---|---|---|---|---|---|---|---|---|---|---|---|---|---|---|---|---|---|---|---|---|---|
| 1906 Jun 17 - 1906 Sep | Evidence from Observations: Reported | ||||||||||||||||||||||||||||
|
List of 4 Events for Episode 1 at NE flank (Aeseput)
|
|||||||||||||||||||||||||||||
1901 Feb 4 Confirmed Eruption (Explosive / Effusive) VEI: 2
| Episode 1 | Eruption (Explosive / Effusive) | |||||||||||||||||||||||||||||
|---|---|---|---|---|---|---|---|---|---|---|---|---|---|---|---|---|---|---|---|---|---|---|---|---|---|---|---|---|---|
| 1901 Feb 4 - Unknown | Evidence from Observations: Reported | ||||||||||||||||||||||||||||
|
List of 4 Events for Episode 1
|
|||||||||||||||||||||||||||||
1890 Confirmed Eruption (Explosive / Effusive) VEI: 2
| Episode 1 | Eruption (Explosive / Effusive) | |||||||||||||||||||
|---|---|---|---|---|---|---|---|---|---|---|---|---|---|---|---|---|---|---|---|
| 1890 - Unknown | Evidence from Observations: Reported | ||||||||||||||||||
|
List of 2 Events for Episode 1
|
|||||||||||||||||||
1845 Feb 8 Confirmed Eruption (Explosive / Effusive) VEI: 2
| Episode 1 | Eruption (Explosive / Effusive) | |||||||||||||||||||||||||||||
|---|---|---|---|---|---|---|---|---|---|---|---|---|---|---|---|---|---|---|---|---|---|---|---|---|---|---|---|---|---|
| 1845 Feb 8 - Unknown | Evidence from Observations: Reported | ||||||||||||||||||||||||||||
|
List of 4 Events for Episode 1
|
|||||||||||||||||||||||||||||
1833 (?) Confirmed Eruption (Explosive / Effusive) VEI: 2
| Episode 1 | Eruption (Explosive / Effusive) | |||||||||||||||||||
|---|---|---|---|---|---|---|---|---|---|---|---|---|---|---|---|---|---|---|---|
| 1833 (?) - Unknown | Evidence from Observations: Reported | ||||||||||||||||||
|
List of 2 Events for Episode 1
|
|||||||||||||||||||
1819 Confirmed Eruption (Explosive / Effusive) VEI: 2
| Episode 1 | Eruption (Explosive / Effusive) | |||||||||||||||||||
|---|---|---|---|---|---|---|---|---|---|---|---|---|---|---|---|---|---|---|---|
| 1819 - Unknown | Evidence from Observations: Reported | ||||||||||||||||||
|
List of 2 Events for Episode 1
|
|||||||||||||||||||
1785 Dec 31 ± 365 days Confirmed Eruption (Explosive / Effusive) VEI: 2
| Episode 1 | Eruption (Explosive / Effusive) | |||||||||||||||||||
|---|---|---|---|---|---|---|---|---|---|---|---|---|---|---|---|---|---|---|---|
| 1785 Dec 31 ± 365 days - Unknown | Evidence from Observations: Reported | ||||||||||||||||||
|
List of 2 Events for Episode 1
|
|||||||||||||||||||
1450 ± 10 years Confirmed Eruption (Explosive / Effusive) VEI: 3
| Episode 1 | Eruption (Explosive / Effusive) | |||||||||||||||||||
|---|---|---|---|---|---|---|---|---|---|---|---|---|---|---|---|---|---|---|---|
| 1450 ± 10 years - Unknown | Evidence from Observations: Reported | ||||||||||||||||||
|
List of 2 Events for Episode 1
|
|||||||||||||||||||
This compilation of synonyms and subsidiary features may not be comprehensive. Features are organized into four major categories: Cones, Craters, Domes, and Thermal Features. Synonyms of features appear indented below the primary name. In some cases additional feature type, elevation, or location details are provided.
Synonyms |
||||
| Sopoetan | ||||
Cones |
||||
| Feature Name | Feature Type | Elevation | Latitude | Longitude |
| Aeseput
Aisepoet |
Cone | 1557 m | 1° 7' 17.00" N | 124° 44' 32.00" E |
| Kelelondei | Cone - Crater | 1525 m | 1° 7' 22.00" N | 124° 45' 49.00" E |
| Manimporok | Stratovolcano | 1661 m | 1° 5' 54.00" N | 124° 45' 55.00" E |
| Toure | Cone | 1550 m | 1° 8' 15.00" N | 124° 45' 42.00" E |
Craters |
||||
| Feature Name | Feature Type | Elevation | Latitude | Longitude |
| Masem | Maar | 1328 m | 1° 8' 10.00" N | 124° 45' 4.00" E |
| Rindengan | Caldera | 1554 m | 1° 8' 41.00" N | 124° 44' 27.00" E |
| Sempu | Caldera | 1450 m | 1° 7' 48.00" N | 124° 45' 29.00" E |
Domes |
||||
| Feature Name | Feature Type | Elevation | Latitude | Longitude |
| Aeseput Wero | Dome | 1350 m | 1° 6' 54.00" N | 124° 44' 51.00" E |
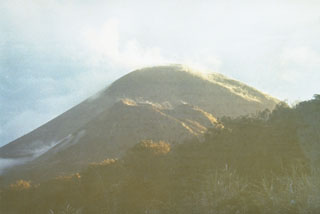 Soputan volcano, a small 580-m-high stratovolcano, seen here from Bukit Keledondei on the NE side, is a youthful, largely unvegetated volcano with a prominent flank cone, Aeseput, visible here in the center of the photo. Soputan is one of Sulawesi's most active volcanoes; both it and Aeseput, which was formed in 1906, have erupted frequently since the 18th century.
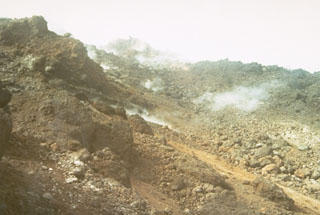 During an eruption in 1966-67, a lava dome was emplaced at the summit of Soputan, and a lava flow, seen steaming here in 1973, descended its flanks. The eruption began with a vulcanian explosion on May 21, and lava outflow began June 12-15, resumed again in November and continued until November of the following year.
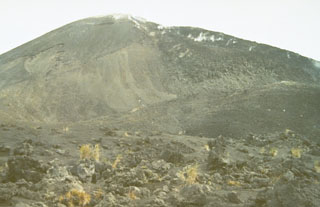 During an eruption in 1966-67, a lava dome was emplaced at the summit of Soputan. A blocky lava flow, seen here steaming along the right-hand skyline from the NE-flank cone of Aeseput, descended its flanks. The eruption began with a vulcanian explosion on May 21, and lava outflow began June 12-15, resumed again in November, and continued until November of the following year. An explosive eruption accompanied by pyroclastic flows took place on September 25, 1966.
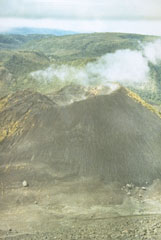 The broad 1549-m-high Sempu stratovolcano (background) is seen here from the summit of neighboring Soputan volcano. The prominent cone in the center is Aeseput, a 20th-century cone constructed on the NW flank of Soputan. Gunung Sempu volcano was constructed within a 3-km-wide caldera. Kawah Masem maar was formed in the SW part of the caldera and contains a crater lake and fumarolic areas that have been the site of sulfur extraction. No historical eruptions are known from Sempu.
 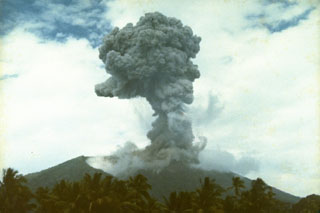 An eruption plume, viewed from the north, rises from the summit of Soputan volcano on September 13, 1982. The eruption began on August 26, when an eruption column rose 15 km, and lasted until November 10. The August 26 explosion prompted the evacuation of 850 inhabitants of a village on the flank of the volcano.
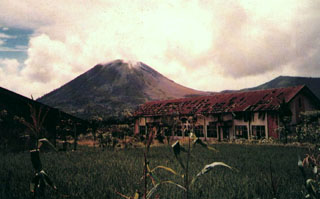 The small conical volcano of Soputan on the southern rim of the Quaternary Tondano caldera is one of Sulawesi's most active volcanoes. Gunung Soputan is seen here in profile from the east. During historical time eruptions have originated both from the summit crater and Aeseput (extreme right), a prominent NE flank vent that formed in 1906 and was the source of intermittent major lava flows until 1924.
 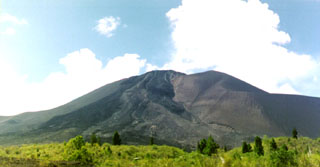 The small Soputan stratovolcano, seen here from the west, was constructed on the southern rim of the Quaternary Tondano caldera in northern Sulawesi Island. The youthful, largely unvegetated Soputan volcano is one of Sulawesi's most active volcanoes. During historical time the locus of eruptions has included both the summit crater and Aeseput, a prominent NE flank vent that formed in 1906 and was the source of intermittent major lava flows until 1924.
 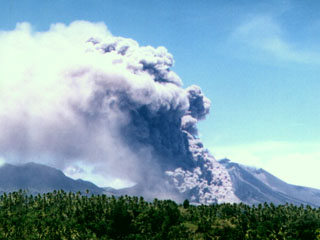 A pyroclastic flow produced by collapse of a growing lava dome descends the flank of Soputan on July 18, 2005. Soputan erupted on April 20, 2005, with a plume reaching ~ 1 km above the summit and lava fountains rising ~ 200 m above the volcano. MODIS thermal alerts had begun the night of the 19th. Rapid lava dome growth occurred in April, and by 21st the lava dome had spread about 250 m E and 200 m SW.
 There are no samples for Soputan in the Smithsonian's NMNH Department of Mineral Sciences Rock and Ore collection.
| Copernicus Browser | The Copernicus Browser replaced the Sentinel Hub Playground browser in 2023, to provide access to Earth observation archives from the Copernicus Data Space Ecosystem, the main distribution platform for data from the EU Copernicus missions. |
| MIROVA | Middle InfraRed Observation of Volcanic Activity (MIROVA) is a near real time volcanic hot-spot detection system based on the analysis of MODIS (Moderate Resolution Imaging Spectroradiometer) data. In particular, MIROVA uses the Middle InfraRed Radiation (MIR), measured over target volcanoes, in order to detect, locate and measure the heat radiation sourced from volcanic activity. |
| MODVOLC Thermal Alerts | Using infrared satellite Moderate Resolution Imaging Spectroradiometer (MODIS) data, scientists at the Hawai'i Institute of Geophysics and Planetology, University of Hawai'i, developed an automated system called MODVOLC to map thermal hot-spots in near real time. For each MODIS image, the algorithm automatically scans each 1 km pixel within it to check for high-temperature hot-spots. When one is found the date, time, location, and intensity are recorded. MODIS looks at every square km of the Earth every 48 hours, once during the day and once during the night, and the presence of two MODIS sensors in space allows at least four hot-spot observations every two days. Each day updated global maps are compiled to display the locations of all hot spots detected in the previous 24 hours. There is a drop-down list with volcano names which allow users to 'zoom-in' and examine the distribution of hot-spots at a variety of spatial scales. |
|
WOVOdat
Single Volcano View Temporal Evolution of Unrest Side by Side Volcanoes |
WOVOdat is a database of volcanic unrest; instrumentally and visually recorded changes in seismicity, ground deformation, gas emission, and other parameters from their normal baselines. It is sponsored by the World Organization of Volcano Observatories (WOVO) and presently hosted at the Earth Observatory of Singapore.
GVMID Data on Volcano Monitoring Infrastructure The Global Volcano Monitoring Infrastructure Database GVMID, is aimed at documenting and improving capabilities of volcano monitoring from the ground and space. GVMID should provide a snapshot and baseline view of the techniques and instrumentation that are in place at various volcanoes, which can be use by volcano observatories as reference to setup new monitoring system or improving networks at a specific volcano. These data will allow identification of what monitoring gaps exist, which can be then targeted by remote sensing infrastructure and future instrument deployments. |
| Volcanic Hazard Maps | The IAVCEI Commission on Volcanic Hazards and Risk has a Volcanic Hazard Maps database designed to serve as a resource for hazard mappers (or other interested parties) to explore how common issues in hazard map development have been addressed at different volcanoes, in different countries, for different hazards, and for different intended audiences. In addition to the comprehensive, searchable Volcanic Hazard Maps Database, this website contains information about diversity of volcanic hazard maps, illustrated using examples from the database. This site is for educational purposes related to volcanic hazard maps. Hazard maps found on this website should not be used for emergency purposes. For the most recent, official hazard map for a particular volcano, please seek out the proper institutional authorities on the matter. |
| IRIS seismic stations/networks | Incorporated Research Institutions for Seismology (IRIS) Data Services map showing the location of seismic stations from all available networks (permanent or temporary) within a radius of 0.18° (about 20 km at mid-latitudes) from the given location of Soputan. Users can customize a variety of filters and options in the left panel. Note that if there are no stations are known the map will default to show the entire world with a "No data matched request" error notice. |
| UNAVCO GPS/GNSS stations | Geodetic Data Services map from UNAVCO showing the location of GPS/GNSS stations from all available networks (permanent or temporary) within a radius of 20 km from the given location of Soputan. Users can customize the data search based on station or network names, location, and time window. Requires Adobe Flash Player. |
| DECADE Data | The DECADE portal, still in the developmental stage, serves as an example of the proposed interoperability between The Smithsonian Institution's Global Volcanism Program, the Mapping Gas Emissions (MaGa) Database, and the EarthChem Geochemical Portal. The Deep Earth Carbon Degassing (DECADE) initiative seeks to use new and established technologies to determine accurate global fluxes of volcanic CO2 to the atmosphere, but installing CO2 monitoring networks on 20 of the world's 150 most actively degassing volcanoes. The group uses related laboratory-based studies (direct gas sampling and analysis, melt inclusions) to provide new data for direct degassing of deep earth carbon to the atmosphere. |
| Large Eruptions of Soputan | Information about large Quaternary eruptions (VEI >= 4) is cataloged in the Large Magnitude Explosive Volcanic Eruptions (LaMEVE) database of the Volcano Global Risk Identification and Analysis Project (VOGRIPA). |
| EarthChem | EarthChem develops and maintains databases, software, and services that support the preservation, discovery, access and analysis of geochemical data, and facilitate their integration with the broad array of other available earth science parameters. EarthChem is operated by a joint team of disciplinary scientists, data scientists, data managers and information technology developers who are part of the NSF-funded data facility Integrated Earth Data Applications (IEDA). IEDA is a collaborative effort of EarthChem and the Marine Geoscience Data System (MGDS). |

