On 25 September PHIVOLCS warned of potential lahars around Pinatubo due to intense rains from a typhoon expected during 25-26 September. Significant deposits from 1991 pyroclastic density currents on the W flank may be remobilized, generating lahars down major drainages in that watershed. PHIVOLCS noted that the communities of San Marcelino, San Narciso, San Felipe, and Botolan, Zambales Province, and communities in Tarlac and Pampanga Provinces may be affected by lahars and flooding.
Source: Philippine Institute of Volcanology and Seismology (PHIVOLCS)
Phreatic explosion on 30 November 2021 sends steam plume above 13 km
A phreatic explosion from the summit crater lake at Pinatubo in November 2021 is the first notable volcanic activity since 1992-93 when there was dome growth and secondary phreatic explosions in the aftermath of the major 1991 eruption. The volcano is monitored by the Philippine Institute of Volcanology and Seismology (PHIVOLCS), Tokyo Volcanic Ash Advisory Center (VAAC), and satellites.
The PHIVOLCS volcano update on 30 November 2021 reported that a weak phreatic explosion was recorded during 1209-1213 that day. Because of the very low seismicity and CO2 flux during the previous few days, they suggested that the event was triggered by shallow hydrothermal processes. A plume mostly comprised of steam rose above weather clouds (figure 40). The Tokyo VAAC reported that the plume reached an altitude of 13.4 km and drifted W based on satellite data; it was also observed by a passing aircraft (figure 41). Immediately after the explosion PHIVOLCS warned the public not to venture close to the volcano and advised local governments to prohibit entry into Pinatubo’s crater, as shallow phreatic or hydrothermal explosions could occur without warning.
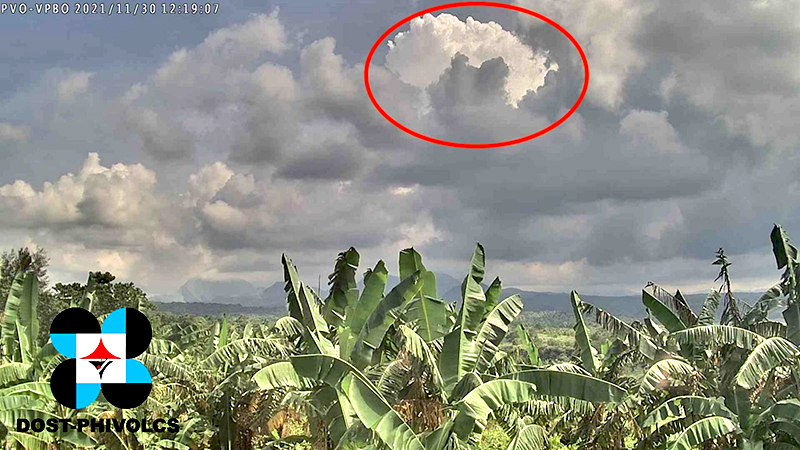 |
Figure 40. Image of 30 November 2021 plume taken 12 km NW of Pinatubo’s crater. The steam-dominated whitish top of the plume rose above the cloud cover over the volcano a few minutes after the explosion. Courtesy of PHIVOLCS via Twitter. |
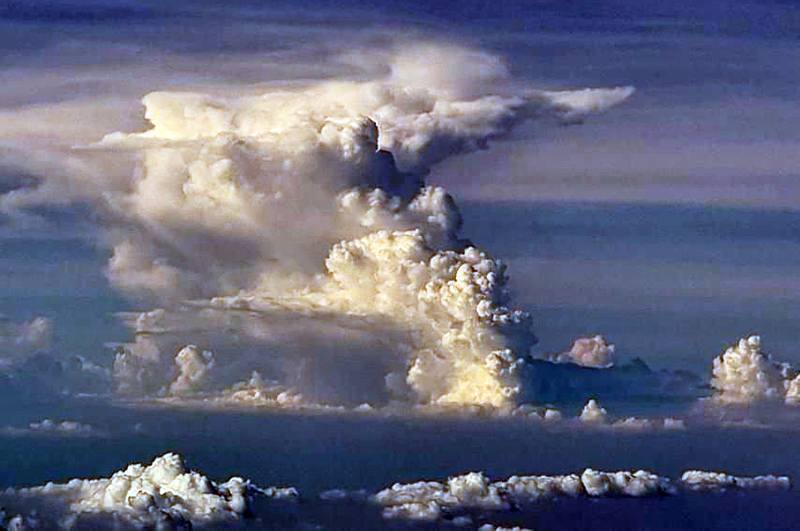 |
Figure 41. Aerial view of the 30 November 2021 explosion plume from Pinatubo. Photo by Capt. Aljess Lasmarias of Philippines AirAsia; courtesy of CNN Philippines. |
Numerous weak thermal anomalies were recorded by the MIROVA system around the time of the explosion. NASA recorded a high SO2 level above the volcano on 29-30 November, around the time of the explosion, with a plume drifting W and SW (figure 42).
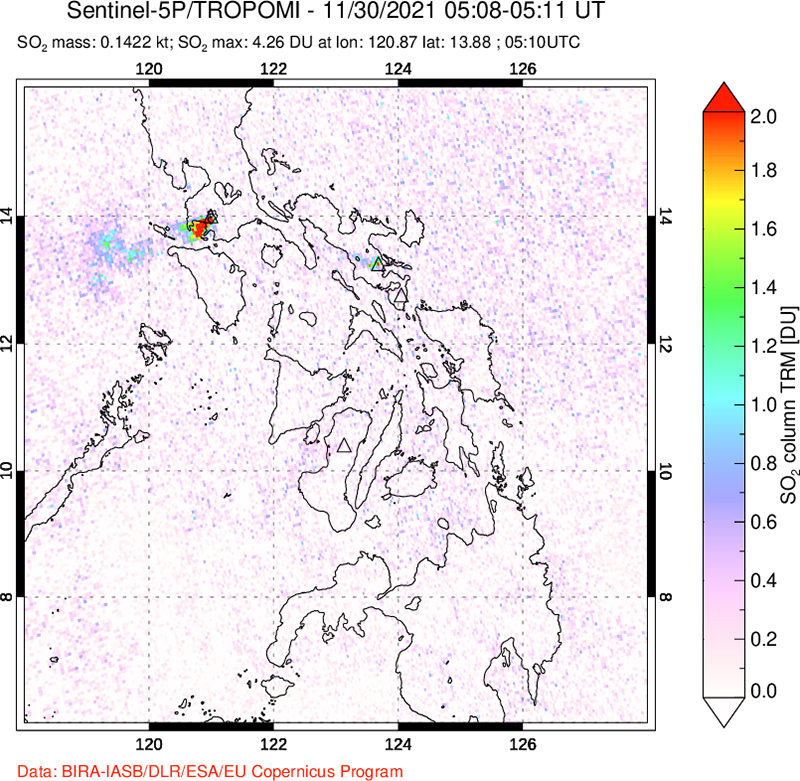 |
Figure 42. Satellite map showing a small SO2 plume drifting W and SW from Pinatubo on 30 November 2021, as detected by the TROPOMI instrument on the Copernicus Sentinel-5P satellite. Courtesy of NASA Global Sulfur Dioxide Monitoring Page. |
Information Contacts: Philippine Institute of Volcanology and Seismology (PHIVOLCS), Department of Science and Technology, University of the Philippines Campus, Diliman, Quezon City, Philippines (URL: http://www.phivolcs.dost.gov.ph/); Tokyo Volcanic Ash Advisory Center (VAAC), 1-3-4 Otemachi, Chiyoda-ku, Tokyo, Japan (URL: http://ds.data.jma.go.jp/svd/vaac/data/); MIROVA (Middle InfraRed Observation of Volcanic Activity), a collaborative project between the Universities of Turin and Florence (Italy) supported by the Centre for Volcanic Risk of the Italian Civil Protection Department (URL: http://www.mirovaweb.it/); NASA Global Sulfur Dioxide Monitoring Page, Atmospheric Chemistry and Dynamics Laboratory, NASA Goddard Space Flight Center (NASA/GSFC), 8800 Greenbelt Road, Goddard MD 20771, USA (URL: https://so2.gsfc.nasa.gov/); CNN Philippines (https://www.cnnphilippines.com/).
2022: September
2021: March
| November
2004: February
2002: August
2001: August
| September
On 25 September PHIVOLCS warned of potential lahars around Pinatubo due to intense rains from a typhoon expected during 25-26 September. Significant deposits from 1991 pyroclastic density currents on the W flank may be remobilized, generating lahars down major drainages in that watershed. PHIVOLCS noted that the communities of San Marcelino, San Narciso, San Felipe, and Botolan, Zambales Province, and communities in Tarlac and Pampanga Provinces may be affected by lahars and flooding.
Source: Philippine Institute of Volcanology and Seismology (PHIVOLCS)
PHIVOLCS reported that a weak phreatic explosion at Pinatubo was recorded during 1209-1213 on 30 November. The event was likely drive by shallow hydrothermal processes based on very low seismicity recorded during the previous few days, low diffuse carbon dioxide flux from the lake, and a notable infrasound signal. A plume mostly comprised of steam was seen rising above weather clouds within a few minutes of the end of the event. The Tokyo VAAC stated that the plume rose to 13.4 km (44,000 ft) a.s.l. and drifted W based on satellite data.
Sources: Philippine Institute of Volcanology and Seismology (PHIVOLCS); Tokyo Volcanic Ash Advisory Center (VAAC)
PHIVOLCS raised the Alert Level for Pinatubo to 1 (on a scale of 0-5) on 4 March noting elevated seismicity with a total of 1,722 earthquakes recorded in two swarms since 20 January. The first swarm was recorded during 20-26 January and was comprised of local M 1-2.5 events that occurred along the Sacobia Lineament fault at depths of 15-28 km. A more persistent swarm followed; it was comprised of local M 0.5-2.8 events at depths of 10-35 km along another fault system, with a few shallower earthquakes occurring at both ends of the swarm. Carbon dioxide flux at Pinatubo Crater lake was 378 tonnes per day in February, within background ranges that topped 1,000 tonnes per day during the last decade. Minor temperature increases were recorded at fumarolic vents.
Source: Philippine Institute of Volcanology and Seismology (PHIVOLCS)
According to a news article, on 22 January tourists noticed that the usually blue-to-green water in Pinatubo's crater lake was very dark brown. Scientists from the Pinatubo Volcano Observatory excluded renewed volcanism as the source of the discoloration due to the lack of increased seismicity, and an absence of new emissions in the crater or any increase in the water's temperature. They believed the change in water color was due to near-surface processes, such as biogenic activity or a steady supply of nutrient rich soil from landslides that have entered the crater since its formation after the June 1991 eruption. Visitors were warned against swimming in or consuming the water in the lake.
Source: ABS-CBN News
On 10 July the western wall of Pinatubo's crater collapsed, gradually releasing about 160 million m3 of water and sediments. The collapse occurred at the crater wall's lowest point leading to the Maraunot River in Botolan, Zambales. About a year earlier workers had removed a section of the crater wall in an effort to gradually release the rapidly rising water in the crater and prevent a larger crater-wall collapse. PHIVOLCS reported to Philstar news that if the notch had not been created at least 320 million m3 of water and sediment could have been released into inhabited areas.
Source: Philstar News
On 6 September workers began to partially drain Pinatubo's rapidly rising crater lake following the evacuation of ~40,000 NW-flank residents the previous day. Initially water flowed slowly at ~50 m3 per hour through the newly completed ~100-m-long spillway, but after workers increased the gradient at the canal's exit the flow rate increased to ~1,800 m3 per hour. According to news reports, over several days the draining aimed to release ~25% of the water in the crater towards the NW down the Bucao River to the South China Sea. Most residents were permitted to return to their homes on 7 September. According to reports on 10 September, the level of the crater lake continued to rise following the draining. Therefore, further preventative measures may be implemented.
Sources: Reuters; CNN; Associated Press; Reuters; Associated Press
Due to the threat of Pinatubo's crater lake overflowing during draining procedures, Philippine officials plan to evacuate ~40,000 residents of the town of Botolan 40 km NW of Pinatubo's crater to higher ground on 5 September. The crater lake is ~2.5 km wide, and contains ~210 million cubic meters of water. According to a Guardian news article, water in the crater rose to ~80 cm below the lowest point of the crater rim on 3 September. In comparison, water was 1.5 m below the rim on 31 August, and 4.5 m below it 5 weeks earlier. On 6 September workers plan to remove a 5-m-large portion of the crater's wall that will cause the water to be released towards the N.
Sources: The Guardian News; ABC News - Australian Broadcasting Corporation; Agence France-Presse (AFP)
Several news reports stated that rising water in Pinatubo's crater is now approaching dangerous levels. If the water exceeds the crater lip, it could cause the crater to partially collapse and water could inundate the town of Botolan. The town is 40 km NW of the volcano and has 46,000 residents. In recent weeks the water surface has risen from ~6.4 to 5 m below the crater lip. Scientists are worried that the intense rain during the current rainy season will cause the water level to continue to rise. In the next few weeks, with oversight by Philippine officials and geologists, local residents will dig a 5-m notch in the side of the crater that will drain the water away from inhabited areas.
Sources: Disaster Relief.org; Reuters; Associated Press; Philippine Institute of Volcanology and Seismology (PHIVOLCS)
Reports are organized chronologically and indexed below by Month/Year (Publication Volume:Number), and include a one-line summary. Click on the index link or scroll down to read the reports.
2,000 evacuated after explosion emits ash; new vents; increased seismicity and sulfurous odor
The press reported that an explosion on 2 April deposited ash over an area of about 10,000 m2, including part of one village, and that about 2,000 people were evacuated. No injuries or deaths were reported. PHIVOLCS confirmed the explosion, and later noted a SW-NE-trending line of new vents extending 0.5-1.0 km on the N side of the volcano. The vents continued to emit a gas plume 200-500 m high as of mid-April. Observers at Clark Air Force Base (~15 km E) reported sulfurous odors. A seismic net, installed following the 2 April explosion, recorded increasing seismicity, reaching 135 earthquakes on 15 April.
Pinatubo ([pre-eruption] summit elevation 1,745 m), 100 km NW of Manila (figure 1), is composed of a high-silica hornblende andesite-dacite dome complex, possibly located within a small caldera. The most recent eruption (635 ± 90 years ago: 14C) produced pumiceous pyroclastic flows that filled the Marella River valley, leading SW from the summit [and part of the E flank's Sacobia River valley]. Similar deposits of pyroclastic flows and mudflows from older eruptions fill other canyons around the volcano. Geothermal wells (drilled by the Philippine National Oil Company) just N of the summit a few years ago encountered highly acidic, Cl-rich fluid, with a temperature of 340°C at 2.5 km depth.
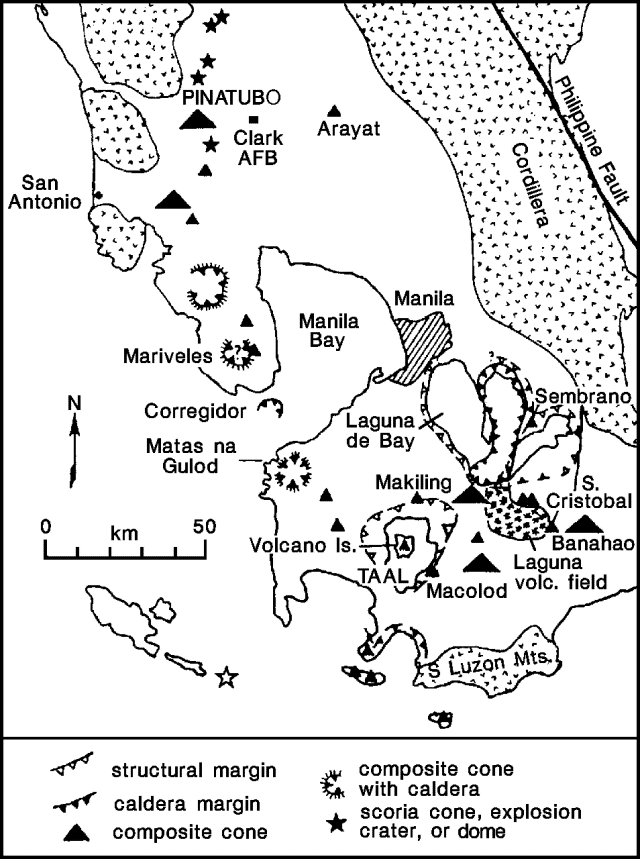 |
Figure 1. Map showing the location of Pinatubo, Taal, and other Neogene volcanoes of SW Luzon Island, Philippines. After Wolfe and Self, 1983. |
Reference. Wolfe, J.A., and Self, S., 1983, Structural lineaments and Neogene volcanism in southwestern Luzon, in Hayes, D.E., ed., The tectonic and geologic evolution of Southeast Asian seas and islands, part 2: American Geophysical Union Monograph 27, p. 157-172.
Information Contacts: R. Punongbayan, PHIVOLCS; Chris Newhall, USGS; Marc Defant and Juan Delfin, Univ of South Florida; AP; Reuters.
Phreatic explosion devastates 1 km2 forested area; seismicity and gas emission continue; 2,000 evacuated
The following includes a more detailed account of events reported in 16:3.
On 2 April, an explosion at the E end of Pinatubo's geothermal area (about 1.5 km NW of the summit and 2/3 of the way down the flank) ejected clouds of steam and minor quantities of ash to 500-800 m height. Ash fell 2 km away, primarily to the NW and SW, and covered an area of about 10,000 m2, including part of one village, from which about 2,000 people were evacuated. No injuries or deaths were reported. The ash was composed of sub-angular material, none of which was freshly vesiculated, with a mineralogy of plagioclase, hornblende, small amounts of biotite, and possible quartz. About 1 km2 of forested land was devastated by the explosion, extending about 500 m from the explosion site, and leaves and vegetation were stripped over several square kilometers. Downed trees were preferentially oriented N.
Following the explosion, an ENE-WSW-trending line (roughly 1 km long at 1,100-1,350 m elevation - summit elevation is 1,745 m) of new fumaroles with six main vents had developed. The most intense activity was located at the W end of the line, while the blast site, at the E end of the line, had ceased activity (figure 2). Vent emissions, voluminous and at extremely high pressure, consisted mainly of steam, with an H2S odor and an associated gray haze. Plumes (~200-500 m high in mid- to late-April, 100-300 m high in early May) were carried W by the prevailing wind, onto a zone of dead and dying vegetation. Respiratory and eye irritation forced about 5,000 W-flank residents to leave the area. Increased discharge from springs near the fumaroles caused rapid downward erosion in stream beds, and muddy water was reported in the N drainages.
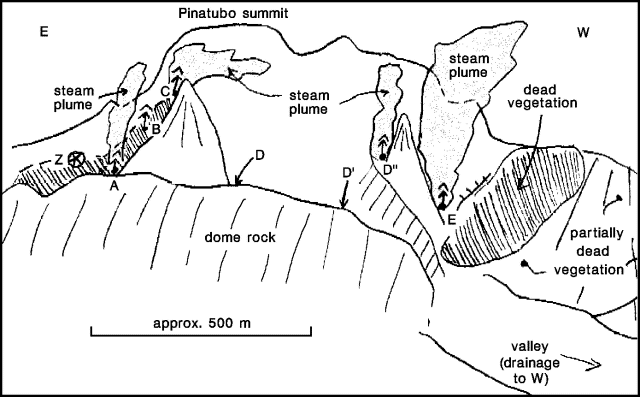 |
Figure 2. Sketch looking SSE at Pinatubo on 27 April 1991, from about 1 km distance (at geothermal well site PN-3, drilled in 1989 by PNOC). Fumaroles are labeled A-E, and the explosion site is labeled Z. Courtesy of David Sussman. |
A seismometer installed on 5 April recorded 223 high-frequency volcano-tectonic earthquakes over a 24-hour period (figure 3). Seismicity rapidly decreased, with 50-90 events recorded/day 8 April-10 May (the seismometer did not function 6-8 April). Earthquake location became possible on 6 May with the completion of a seismic network at the volcano. During the first few days of operation, earthquakes were centered [~4-8 km NW] of the summit at 3-6 km depth, and had magnitudes of 0.1-1.5 (averaging about M 1.0). The events all had the same first motions, suggesting that they had the same focal mechanisms. Seismicity increased on 10 May (167 recorded earthquakes/day) and remained high as of 12 May (120-150/day). No long-period events have been recorded.
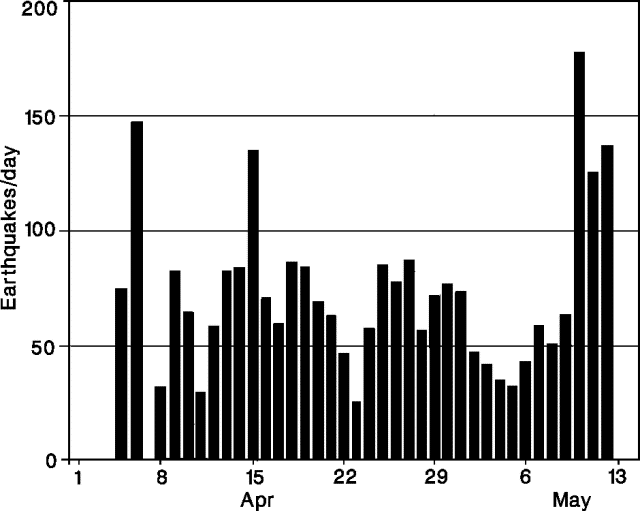 |
Figure 3. Daily number of recorded earthquakes at Pinatubo, 5 April-12 May 1991. Courtesy of PHIVOLCS. |
Deformation measurements on the NW slope have not shown evidence of inflation.
The center of the Pinatubo geothermal area, previously the site of several low-discharge acid-sulfate springs and three steaming sulfur-depositing fumaroles (>90°C), was located within a crater-like structure largely related to collapse. Geologists believe that some of the breccias in the structure's wall are probably of hydrothermally explosive origin. "Numerous alleged eruptive activities have been reported in the area."
Information Contacts: R. Punongbayan, PHIVOLCS; Chris Newhall, USGS Reston; John Ewert, CVO; David Sussman and Areberto Arevalo, Philippine Geothermal Inc., Manila.
Major stratospheric cloud, pyroclastic flows, and new summit caldera; >300 killed by eruption and typhoon
After more than 2 months of increasing seismicity, deformation, and emission of small plumes, a series of strong explosions culminated in one of the largest eruptions of this century. The 15-16 June climactic phase lasted more than 15 hours, sending tephra to 30 km altitude, generating voluminous pyroclastic flows, and leaving a small caldera in the former summit region. Ten days later, the aerosol cloud formed a nearly continuous band that stretched 11,000 km from Indonesia to Central Africa. Timely evacuations saved many lives, but the combined effects of the eruption and a typhoon killed more than 300 people.
 |
Figure 4. Map of southern Luzon Island, showing some towns and river valleys. |
Minor activity, April-May. Renewed activity was signaled by an explosion on 2 April, at the E end of Pinatubo's geothermal area, about 1.5 km NW of the summit (see 16:4). The explosion devastated about 1 km2 of forested land, stripped leaves and vegetation over several square kilometers, and ejected small steam/ash clouds, depositing ash 10 km away. About 2,000 people were evacuated from a zone of 10-km radius. After the explosion, a line of new fumaroles, roughly 1 km long with six main vents, had developed. Emissions, voluminous and at extremely high pressure, were carried W onto a zone of dead and dying vegetation. Respiratory and eye irritation forced about 5,000 W-flank residents to leave the area.
A seismometer installed on 5 April recorded 50-90 events/day through 10 May. Earthquakes (located beginning 6 May) were dominantly centered 4-8 km NW of the summit (figure 5) at 3-6 km depth, and had magnitudes of 0.1-1.5 (averaging about M 1.0).
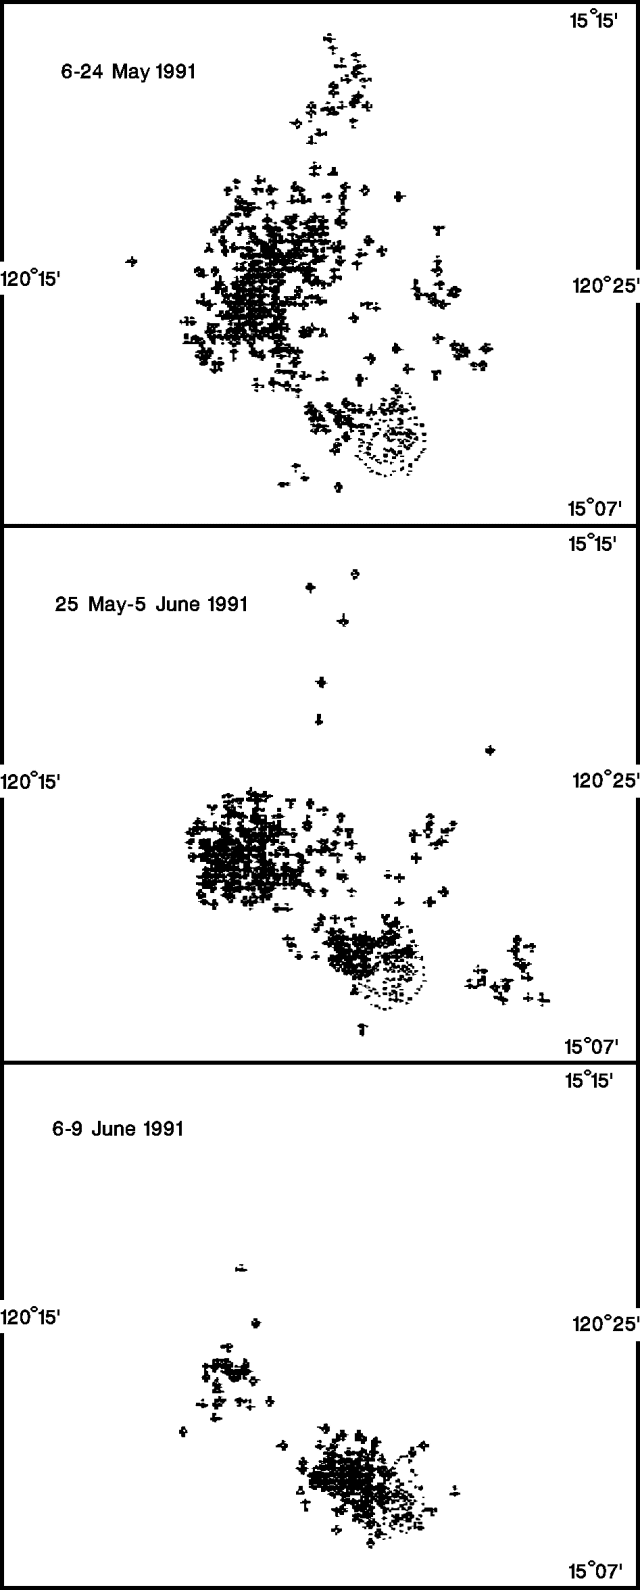 |
Figure 5. Epicenters of earthquakes (crosses) recorded near Pinatubo (dotted outline), 6-24 May (top), 25 May-5 June (middle), and 6-9 June (bottom) 1991. Courtesy of David Harlow. |
Increased activity, late May-early June. Emissions from the vents increased in volume, with two large pulses observed on 25 and 26 May. Some ash was reported. SO2 flux, measured by COSPEC, rose from 500 t/d on 13 May to 5,000 t/d on 28 May, but dropped again to 1,700 t/d on 30 May and 1,800 t/d on 3 June. Seismicity continued slightly NW of the fumaroles (at 2-6 km depth), and an increasing number of earthquakes were recorded directly beneath the fumaroles (at 0-2 km depth) at the end of May. A "blast event" during the evening of 3 June produced ash and was immediately followed by harmonic tremor lasting 30 minutes. A similar tremor event was recorded the next day at around 1200. The SO2 flux had dropped to 280 t/d by 4 June.
Increased earthquake amplitudes and more frequent tremor were noted in early June. PHIVOLCS issued an Alert Level 3 announcement (indicating a possible major pyroclastic eruption within 2 weeks) on 5 June. Geologists interpreted the shallow seismicity and harmonic tremor to be caused by the upward movement of magma, and the drop in gas flux to suggest a blockage of escaping gas and an accompanying pressure buildup.
Seismicity increased over the next few days, from about 1,000 to 2,000 recorded earthquakes/day, associated with 25 microradians of tilt recorded on the upper E flank. Most epicenters were just NW of the summit. An explosion at 1640 on 7 June from the main vent near the center of the line of fumaroles (at the head of the Maronut River) ejected ash to 8,000 m height. The explosion occurred about 40 minutes into an hour-long episode of harmonic tremor. At 1700, PHIVOLCS announced an increase to Alert Level 4 (eruption possible within 24 hours) and ordered the evacuation of an area up to 21 km from the summit. About 12,000 residents were evacuated (from Zambales, Tarlac, and Pampanga Provinces).
Ash emission continued the next day, producing plumes about 5,000 m high and depositing ash to 25 km W. Helicopter reconnaissance in the morning confirmed the extrusion of a lava dome (100 x 60 m, and 30 m high) near the main vent on the volcano's N flank. The press reported that ash emission was continuing on 9 June (table 1) from two craters, with ash falling as far as the South China Sea (~35 km W). Seismographs near the volcano recorded continuous harmonic tremor.
Table 1. Eruptive episodes from Pinatubo, 9-17 June 1991. Times of eruption onsets are from PHIVOLCS and the USGS; times of initial satellite observations of eruptive episodes are shown in the second column. Plume altitudes are from NOAA. Altitudes given in the text are generally ground-based, and often higher than the NOAA estimates. Satellite data were compiled by James Lynch, NOAA/NESDIS, based on analysis of visible/infrared weather satellite imagery. Data in this table are very preliminary and will change as analyses of ground and satellite observations continue.
| Date | Eruption Time | Detection Time | Maximum Plume Altitude | Direction of Movement | Horizontal Extent (time after eruption) |
| 09 Jun 1991 | -- | 0931 | 2 km | NW | less than 1 x 10⁴ km2 (2 hrs) |
| 11 Jun 1991 | -- | 1631 | 3.5 km | WSW | less than 1 x 10⁴ km2 (2 hrs) |
| 12 Jun 1991 | 0851 | 0931 | 17-19 km | WSW | 5.5 x 10⁴ km2 (8 hrs) |
| 12 Jun 1991 | 2250 | 2331 | 17-19 km | WSW | 1.1 x 10⁵ km2 (8 hrs) |
| 13 Jun 1991 | 0840 | 0931 | 17-19 km | WSW | 1 x 10⁵ km2 (6 hrs) |
| 14 Jun 1991 | 1309 | 1331 | 20-22 km | WSW | 5 x 10⁴ km2 (4 hrs) |
| 14 Jun 1991 | 1408 | 1431 | 20-22 km | WSW | 6 x 10⁴ km2 (5 hrs) |
| 14 Jun 1991 | 1853 | 1931 | 23-25 km | WSW | 7.5 x 10⁴ km2 (6 hrs) |
| 14 Jun 1991 | 2018 | Indistinguishable from 1853 eruption on satellite images. | |||
| 14 Jun 1991 | 2321 | 2331 | 23-25 km | WSW | 5 x 10⁴ km2 (3 hrs) |
| 15 Jun 1991 | 0114 | 0131 | 23-25 km | WSW | 1.5 x 10⁵ km2 (4 hrs) |
| 15 Jun 1991 | 0220 | Indistinguishable from 0114 eruption on satellite images. | |||
| 15 Jun 1991 | 0555 | 0631 | 20-22 km | WSW | 1.1 x 10⁵ km2 (3 hrs) |
| 15 Jun 1991 | 0611 | Indistinguishable from 0555 eruption on satellite images. | |||
| 15 Jun 1991 | 0809 | 0831 | 20-22 km | WSW | 1.1 x 10⁵ km2 (3 hrs) |
| 15 Jun 1991 | 0831 | Indistinguishable from 0809 eruption on satellite images. | |||
| 15 Jun 1991 | 1027 | 1031 | 35-40 km | WSW | 1 x 10⁶ km2 (12 hrs) |
| 15 Jun 1991 | 1027 | 1031 | 35-40 km | WSW | 1.5 x 10⁶ km2 (18 hrs) |
| 15 Jun 1991 | 1027 | 1031 | 35-40 km | WSW | 2.2 x 10⁶ km2 (24 hrs) |
| 15 Jun 1991 | 1027 | 1031 | 35-40 km | WSW | 2.7 x 10⁶ km2 (36 hrs) |
| Initial, strongest phase of the climactic eruption, apparent on infrared imagery until 2131; column over the volcano reached 35-40 km height; extensive ash plume at 25-30 km. Ash from this phase comprised >95% of the extensive plume. | |||||
| 15 Jun 1991 | 1117 | Indistinguishable from the 1027 eruption on satellite images. | |||
| 15 Jun 1991 | 1221 | Indistinguishable from the 1027 eruption on satellite images. | |||
| 15 Jun 1991 | 1252 | Indistinguishable from the 1027 eruption on satellite images. | |||
| 15 Jun 1991 | 1342 | Indistinguishable from the 1027 eruption on satellite images. | |||
| 15 Jun 1991 | 1342 | 2231 | 26-28 km | WSW | -- |
| The second phase of the climactic eruption continued until 0231 on 16 Jun, with a ball-shaped column over the volcano. | |||||
| 16 Jun 1991 | -- | 0331 | 23-25 km | WSW | -- |
| The third phase, smaller than the second,, was characterized by a wedge-shaped plume from the volcano; apparent on satellite imagery until 0731. | |||||
| 16 Jun 1991 | -- | 1031 | 5-6 km | WSW | 1.5 x 10⁴ km2 (3 hrs) |
| 16 Jun 1991 | -- | 1231 | 5-6 km | WSW | less than 1 x 10⁴ km2 (2 hrs) |
| 16 Jun 1991 | -- | 1431 | 5-6 km | WSW | 1.5 x 10⁴ km2 (3 hrs) |
| 16 Jun 1991 | -- | 2031 | 4-5 km | WSW | less than 1 x 10⁴ km2 (2 hrs) |
| 17 Jun 1991 | 1300 | 1300 | 3.5 km | WSW | less than 1 x 10⁴ km2 (2 hrs) |
The evacuation of Clark Air Base (~15 km E of the volcano) was ordered by the U.S. Air Force at 0500 on 10 June. Almost 14,500 servicemen and their families were moved to Subic Bay Naval Base (30 km SSW), while 1,500 personnel remained at Clark. Preliminary hazard maps placed Clark Air Base at the E edge of pyroclastic-flow hazard zones, and flanked by potential mudflow hazard zones. Voluminous ash-laden steam clouds were emitted on 11 June.
Initial strong explosions, 12-early 15 June. A tephra column rose to about 20 km on 12 June, as an explosive episode at 0851 signalled the start of a major pyroclastic phase. The explosions were preceded by around 12-16 hours of continuous tremor and several smaller explosions. Numerous shocks had been felt by scientists working on the volcano earlier in the morning. Pyroclastic flows advanced at least 5 km and perhaps as much as 15 km down the Maronut, O'Donnell, and Marella Rivers on the NW, N, and SW flanks of the volcano, respectively. Six hundred of the remaining 1,500 military personnel at Clark Air Base were evacuated and thousands of people fled adjacent Angeles (population 300,000). All residents within a 20-km radius of the volcano were warned to leave.
The press reported that a smaller explosion occurred at 1149, then explosive activity declined after a few hours. Prevailing winds carried the eruption plume WSW, depositing ash more than 30 km away, but ashfall also apparently occurred N of the volcano, reportedly covering an aerial gunnery range. A small rain-induced mudflow occurred in the Maronut River valley at about 1830 on 12 June.
Weather satellite images showed that the eruption plume had separated from the volcano by 1330, after reaching about 330 km length (figure 6). By 1830, winds had sheared the plume into three different layers; material at 15-18 km altitude traveling WSW at 100 km/hour; at 6-9 km altitude, W at 55 km/hour; and at 6-9 km altitude, WNW at 35 km/hour. The Nimbus-7 satellite's TOMS instrument detected a significant amount of SO2 during its pass over the area about 2.5 hours after the onset of the explosion. Aviation authorities warned aircraft to avoid the plumes and closed several air routes W of the volcano (A461, A583, B460, R77, R93, R468, and R471).
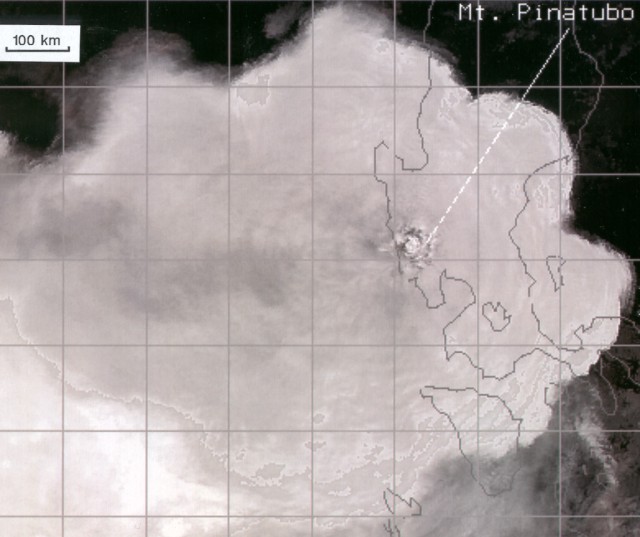 |
Figure 6. Infrared image from the NOAA 10 polar-orbiting weather satellite on 15 June at about 1830, showing the massive cloud from the climactic explosive phase. Temperature estimates suggest that the main body of the plume is at about 30 km altitude, with the eruption column directly over the volcano rising to 35-40 km. The apparent boundary between sections of the cloud is probably a sampling artifact. Material NE of the volcano is probably at a lower altitude than the bulk of the cloud to the W and SW. Numerous faint bands are evident within the plume in false-color versions of the image. Courtesy of NOAA/NESDIS. |
Another large explosive pulse occurred between 2250 and 2305 on 12 June, producing an eruption column that briefly rose to 25 km altitude before declining to a sustained elevation of about 20 km. Tephra fell to the W, NW, and SW, with pumice lapilli falling to 15 km distance, and coarse sand-sized tephra to more than 20 km from the volcano. A similar explosion at 0840 on 13 June lasted for 8 minutes and sent an ash column to 25 km altitude, following about an hour of long-period earthquakes. Satellite images showed large plumes extending [WSW] from the volcano after both explosions.
After a lull of about 28 hours, explosions resumed at 1309 on 14 June, ejecting tephra to 25 km altitude. Intermittent small pulses occurred at 1353 and 1408. Pyroclastic flows in the NW flank's Maronut valley extended 15 km to Sitio Ugik, site of an evacuation camp until increased shallow seismicity prompted additional warnings just before the start of the latest series of explosions. Ash fell to the S, SE, and SW. Another explosion at 1853 sent ash to 24 km altitude and additional pyroclastic flows to the NW. Strong rains during several of the explosive pulses generated mudflows in drainages where pyroclastic-flow deposits and airfall tephra had previously been emplaced.
By 14 June, 79,000 people had been evacuated, including about 15,000 from Clark Air Base. Civil Defense officials reported that four people had been killed, 24 injured, and four were missing in the series of explosions.
A small explosion at 2018 on 14 June sent an ash cloud to 6 km. A period of harmonic tremor preceded a strong explosion at 2321 that produced a column to >20 km [see also 16:6]. Ashfall was reported in San Marcelino (25 km SW) and San Narciso (30 km WSW). Explosions on 15 June at 0114 and about 0220 produced pyroclastic flows that moved down the SW flank.
Climactic explosions, 15-16 June. An explosion at 0555 on 15 June fed a 20-22 km-high ash column [see also 16:6], marking the onset of strong sustained activity that included the climactic explosions and lasted until early 16 June. Effects of the eruption were exacerbated by heavy rains and strong winds from typhoon Yunya. Much of the summit region was removed by explosions or collapse, leaving a caldera 2-3 km in diameter centered slightly north of the former summit.
Pyroclastic flows generated by the first 15 June explosion extended 8-10 km down the N, NNE, NNW flanks. Additional explosions were reported at 0611, 0809, and 0831. Before the strongest activity began, PHIVOLCS expanded the radius of the official danger zone from 30 to 40 km and expressed concern about the possibility of a caldera-forming eruption. The expanded danger zone included Clark Air Base, Subic Naval Base, and their neighboring cities of Angeles and Olongapo. Additional evacuees brought the total to about 200,000. Several thousand military dependents were sent back to the United States.
Satellite data suggested that the climactic phase began with an explosion detected by a nearby barograph at 1027, and continued with recorded explosions at 1117, 1221, and 1252, although ground reports indicated that the strongest activity started with an explosion at 1342 (table 1). A column remained fixed over the volcano through 2131, feeding a massive cloud (figure 7). Comparison of satellite-derived eruption column temperatures with atmospheric temperature profiles from nearby radiosondes yielded an altitude of 25-30 km as the cloud spread WSW toward mainland Asia, and elevations of 35-40 km for the eruption column over the volcano. The maximum altitude of a plume can be underestimated by this technique if its temperature has not fully equilibrated with that of the surrounding air, or if more diffuse material extends above the plume's densest region. Satellite data suggest that more than 95% of the cloud was produced by this 12-hour phase. Visible-band images showed ejection of very dark-colored material throughout the day (from 0631 until 1631), in contrast to the light-colored plumes generated by other phases of the eruption. Noticeably less violent activity, seen on images from 2231 on 15 June until 0231 on 16 June, sustained a ball-shaped cloud over Pinatubo at 26-28 km altitude. Activity had declined further during a third period, from 0331 through 0731, when a wedge-shaped plume extended from the volcano.
 |
Figure 7. Infrared image from the NOAA 10 polar orbiting weather satellite on 15 June at about 1830, showing the massive cloud from the climactic explosive phase. Temperature estimates suggest that the main body of the plume is at about 30 km altitude, with the eruption column directly over the volcano rising to 35-40 km. The apparent boundary between sections of the cloud is probably a sampling artifact. Material NE of the volcano is probably at lower altitude than the bulk of the cloud to the W and SW (figure 8). Numerous faint concentric bands are evident within the plume in false-color versions of the image. |
The bulk of the tephra fell to the SE, S, and SW, but airfall distribution was complicated by the typhoon's winds. Ash was carried by the typhoon to Palawan Island, 500 km SSW of the volcano. The press reported slight ashfall 150 km S (in Batangas Province) and clumps of mud fell on Clark Air Base, Angeles, and the volcano's W flank. Some falling pumice was reportedly apricot-sized. Pumice the size of marbles fell 33 km SSW (at Olongapo) where tephra fall reached 15-30 cm and more than 30 injuries and some deaths were reported. The cloud darkened Manila by 1545, 3 hours before its usual nightfall, although most ashfall amounts there were less than about 1 cm [see also 16:6].
The stratospheric cloud expanded rapidly WSW, and by 1030 the next day, its leading edge had reached the Bangkok area, more than 2,000 km away (figure 8). Preliminary Nimbus-7 satellite data showed very high concentrations of SO2 over a broad area (figure 9), with a total mass that appeared to be approximately double that of the 1982 injection from El Chichón. Light ashfalls were reported in southern Vietnam (from Da Nang to the Mekong Delta, 1,400 km W-1,800 km WSW), northern Borneo (Sabah and Sarawak, 1,000-2,000 km SW), and Singapore (2,500 km SW). By 23 June, a nearly continuous zone of enhanced SO2 as much as 30° wide extended from south of Indochina about 11,000 km to central Africa (figure 10). A small zone of apparent aerosol material had reached about 40°W. [See the Atmospheric Effects chapter for more information about the stratospheric cloud].
 |
Figure 8. Sketch of the major eruption cloud from Pinatubo as seen on satellite imagery on 16 June at about 1030, about 21 hours after the onset of strongest activity, and 1 hour before the SO2 data in figure 9. Courtesy of SAB. |
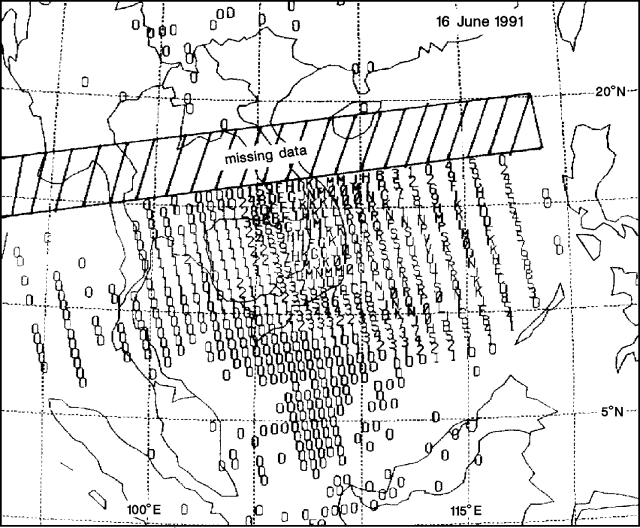 |
Figure 9. Preliminary SO2 data from the Total Ozone Mapping Spectrometer on the Nimbus-7 satellite, showing the major eruption cloud from Pinatubo on 16 June at about 1130, 22 hours after the start of the climactic explosions. Each number or letter represents the average SO2 value within an area 50 km across. 0 = 10-35 milliatmosphere-cm (100-350 ppm-m), 1 = 36-60 matm-cm, 2 = 61-85 matm-cm, etc.; 9 is followed by A, B, etc. Data were lost in the barred zone. Courtesy of Scott Doiron. |
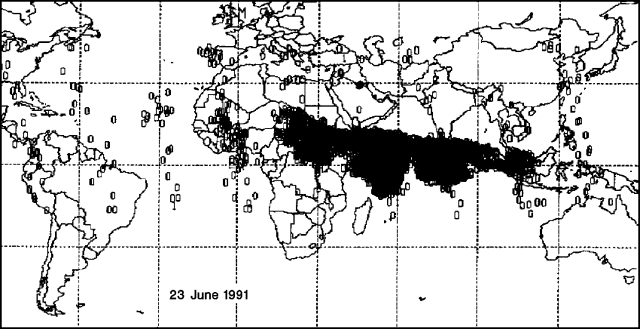 |
Figure 10. Preliminary SO2 data from the Total Ozone Mapping Spectrometer on the Nimbus-7 satellite, showing the major eruption cloud from Pinatubo on 23 June, eight days after the climactic phase. The main body of the cloud, 11,000 km long, has reached central Africa, but a smaller advance segment apparently extended over the eastern Atlantic Ocean, bisected by the 30°W meridian. Only values above 18 matm-cm are shown. Highest values within the dense cloud reached about 75 matm-cm (over Saudi Arabia). Courtesy of Scott Doiron. |
Smaller explosions continued during the next several days, but the strongest activity appeared to have ended, and people began to return to their homes. PHIVOLCS reported three periods of ash emission accompanied by tremor on 17 June. Satellite data revealed a small explosion at 1300 and a column to 5-6 km altitude was observed.The Worldwide Standardized Seismic Net detected shallow earthquakes near Pinatubo on 15 June at 1539 (M 4.9), 1831 (M 4.4), 1841 (M 5.4), 1911 (M 4.6), 1915 (M 5.5), and 2026 (M 4.7), on 16 June at 0349 (M 4.9), 0359 (M 4.8), 1008 (M 5.6), 1458 (M 4.9), 1751 (M 5.1), and 2127 (M 4.9), on 17 June at 0441 (M 5.3) and 2333 (M 4.6), and on 18 June at 1120 (M 4.6).
On 18 June geologists reported preliminary cumulative ashfall thicknesses of 15-30 cm at Clark Air Base, 15-30 cm in Olongapo, and an unconfirmed 35.5 cm in some parts of SW Luzon. At a site along the Abacan River, 37 km E of the summit, debris-flow deposits were sandwiched between a coarse basal layer and finer, sand-sized tephra. Several homes at this site had been inundated, and several others swept away by lateral stream erosion, with some resulting casualties. A similar situation was found at a second site along the Baluyot River, 34 km ESE of the summit. Several homes had been lost or buried by mud, but no deaths had occurred.
The leading edge of typhoon Yunya had reached the area by 14 June at about 2000, and strong storms began moving over the volcano at about 0500 on 15 June. The storm had weakened to light-moderate showers 24 hours later, but these persisted through the 16th. Heavy rains soaked the recently fallen tephra, adding substantially to its weight, and the wet tephra soon hardened to a concrete-like material, making it very difficult to remove. Numerous roof and building collapses resulted, and were responsible for many of the casualties from the combined effects of the eruption and typhoon. As of 19 June, the death toll had risen to more than 300.
The 15 June activity forced closure of Manila's international and domestic airports, which remained closed to arriving jet aircraft through 18 June. A limited number of outgoing flights were permitted beginning early 19 June, and propeller-driven aircraft, less vulnerable to the effects of ash clouds, offered limited air service to and from Manila. Preliminary reports indicate that [14] jets encountered ash during the eruption, most on 15 June (table 2). All landed safely, but some sustained engine and/or exterior damage.
Table 2. Preliminary summary of aircraft encounters with clouds from Pinatubo, 12-18 June 1991. Courtesy of T. Casadevall. [Including additional encounters reported in BGVN 16:07.]
| Date | Time | Duration | Location | Comments |
| 12 Jun 1991 | -- | 3 minutes | Descent into Manila | -- |
| 13 Jun 1991 | 0030 | 20 minutes | S China Sea | Electrostatic discharge on windscreen; no damage. |
| 14 Jun 1991 | early AM | 15 minutes | 750 km W of Pinatubo, 11 km altitude | No significant damage. |
| 14 or 15 Jun 1991 | -- | 29 minutes | -- | Two engines replaced; impact damage and ash buildup on engines. |
| 15 Jun 1991 | -- | 15-20 minutes | -- | Flew through "heavy ash;" cockpit and cabin contaminated by ash. |
| 15 Jun 1991 | early AM | -- | 1,100 km W, 9 km altitude | All four engines damaged. |
| 15 Jun 1991 | -- | 12 minutes | 10.5 km altitude | Temperatures of all four engines rose and fluctuated; sparks from windows; ash hit aircraft; no significant exterior or engine damage. |
| 15 Jun 1991 | 1600 | -- | Approach to Manila from S Vietnam | Much ash in engines; exterior abrasion. |
| 15 Jun 1991 | evening | -- | Leaving Manila | Black marks on exterior of left wing. |
| 15 Jun 1991 | 2347 | -- | Approach to Manila from S Vietnam | Ash, sulfur odor, electrostatic discharge, and blue-green light. No significant damage |
| 16 Jun 1991 | 0130 | 25 minutes | S China Sea | Electrostatic discharge on windscreen; no damage. |
| 16 Jun 1991 | 0310 | 30 minutes | S China Sea | Electrostatic discharge on windscreen; no damage. |
| 17 Jun 1991 | -- | -- | -- | Engine 3 shutdown; heavy ash buildup in engines. |
| 18 Jun 1991 | 0200 | -- | 11 km altitude | Engine 1 stalled, engine 4 lost power; descended to 9 km to restart. Engine 1 replaced. |
Further References. Pinatubo Volcano Observatory Team, 1991, Lessons from a major eruption: Mt. Pinatubo, Phillipines: EOS, v. 72, p. 545, 552-3, 555.
Woods, A. and Self, S., 1992, Thermal disequilibrium at the top of volcanic clouds and its effect on estimates of the column height: Nature, v. 355, p. 628-630.
Information Contacts: R. Punongbayan, PHIVOLCS; R. Janda and J. Ewert, CVO; SAB; Scott Doiron, GSFC; Chris Newhall and Ellen Limburg-Santistevan, USGS Reston; David Harlow, USGS Menlo Park; T. Casadevall, USGS Denver; Nicholas Krull, FAA; Tom Fox, ICAO; NEIC; AP; UPI; Reuters.
Continued ash emission with pulses to 15 km; typhoons trigger large lahars, leaving thousands homeless
As of 26 July, the volcano was still emitting ash continuously to 3-6 km height, with occasional pulses to 15-16 km. Typhoon rains triggered large debris flows down rivers on all sides of the volcano, inundating many of the towns in figure 11. Preliminary estimates of the eruption's size suggest that it is larger than those of Mt. St. Helens (1980) and El Chichón (1982), the largest eruptions of the last decade, but smaller than those of Cerro Azul/Quizapú (1932), Katmai/Novarupta (1912) and Santa María (1902), the largest of the century.
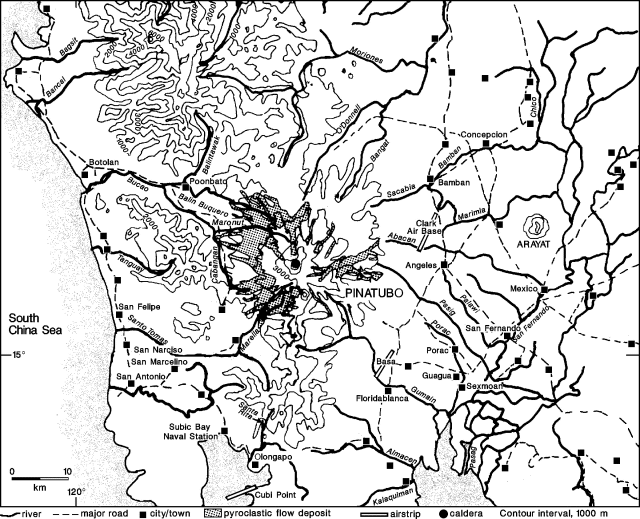 |
Figure 11. Map of Pinatubo and the surrounding area, showing towns, rivers, and roads. Preliminary pyroclastic-flow deposit distribution courtesy of Pinatubo Volcano Observatory. Contour interval is 1,000 m. |
Paroxysmal activity, products and deposits. Damage from the eruption made evaluation of its products slow and difficult. The following preliminary information has been compiled over several weeks from our correspondents' visual observations, fieldwork, and airphoto/satellite image interpretation. Data on the paroxysmal phase supplement the report in 16:5.
Infrared video taken from the Clark Air Base control tower on 14 June suggests that the summit began to fail at 2320 as a fissure propagated tangentially across the summit. An explosion and apparent lateral blast, at 0555 the next day, removed the summit and produced a 25-km ash column. This event marked the onset of strong sustained activity that lasted until early 16 June.
The eruption's most violent explosive phase began at 1342 on 15 June and continued for more than 15 hours at full strength, with 30-40-km columns feeding a massive cloud. Intense seismicity began at 1440 and was felt continuously (at Mt. Arayat ~40 km E) by 1700. This seismicity lasted until about 0000 on 16 June, and was probably associated with the explosions or collapse that formed a nearly circular caldera, 2 km in diameter. The caldera was offset slightly N of the former summit, and the new summit was 145 m lower than before the eruption. The caldera wall ranged in height from 150-200 m at the highest point to 0 m on the E side. In the caldera's NE corner, a cone-shaped feature, ~75 m in diameter and 10 m high, was observed on satellite images. By 20 June, this feature was no longer visible, and the floor of the caldera appeared deeply ash-covered and relatively smooth. A conical depression developed in the SE corner of the caldera, reaching 800 m in diameter by 8 July and continuing to grow. No dome had been identified as of 26 July. No vegetation remained within 1-2 km of the caldera and trees 6-7 km away were defoliated.
Tephra fell primarily to the SE, S, and SW, but airfall distribution was complicated by the typhoon's winds. Pumice to roughly 7 cm fell 25 km E (at Clark Air Base) and particles to roughly 1.5 cm fell 33 km SSW (at Olongapo). Within 3 km of the caldera rim, ash thicknesses averaged 1-2 m. Eruption volume estimates and detailed isopach information were not available as of 26 July. The pumices are porphyritic biotite-hornblende quartz latite, and preliminary analyses indicate 66% SiO2, and 1.6% K2O.
The quoted material below is from Pinatubo Volcano Observatory reports.
"Pyroclastic flows reached radial distances of 12-18 km from the vent (figure 11) and were accompanied by ash clouds whose deposits ranged in thickness from a few to tens of centimeters. Thick pyroclastic-flow deposits (locally in excess of 200 m) occur in main valleys at distances of 5-15 km from the caldera, and have caused surface-drainage diversions that may have severe consequences as the monsoon and typhoon season gets into full swing. Blockage of the Sacobia River on the NE flank has raised the level of that drainage about 12 m above the level of the Abacan River capture point, potentially tripling the source drainage area for the modified Abacan River.
"Such factors as high velocity, high mobility, and low density allowed pyroclastic flows to drain off proximal slopes, which are covered by only a thin, discontinuous veneer. The flows removed vegetation and, in many places, soil and colluvium. Rugged highlands to the NE and SE, which are incised by narrow, steep canyons that head on high ridges separated from Pinatubo, have pyroclastic-flow fills several meters to perhaps 20 m thick locally. These deposits have been eroded extensively and occur as small patches in relatively protected areas along the canyons. Their distribution in such isolated valleys attests further to the great mobility of the pyroclastic flows. Pyroclastic-flow deposits downstream from the major fills were apparently formed by relatively dense flows, because vegetation along the margins of many was only slightly scorched. Conspicuous features include secondary explosion craters, fumaroles, breakaway scarps, and small ponds in blocked tributaries." Satellite data indicated that several lakes, up to 4 km x 350 m, were formed about 7 km W and NW of the caldera. Pyroclastic flows down the Sacobia River valley reached 3 km NW of housing on Clark Air Base, but did not reach the base itself. Numerous houses were swept away or buried by pyroclastic flows, 2-3 km SW of the caldera.
Activity, 16 June-mid July. Following the paroxysmal explosions on 14-16 June, tephra emission decreased and seismicity dropped dramatically (figure 12). With the strongest activity apparently ended, the radius of the official danger zone was reduced to 20 km on 17 June. Ash was emitted continuously to 3-6 km height, with periods of more intense explosions to 10 km height typically lasting several hours but separated by 5-7 hours. On 28 June, explosions were observed pulsating every 5 minutes from different points on the crater floor. Explosions were most frequently observed in the S and SE parts of the caldera.
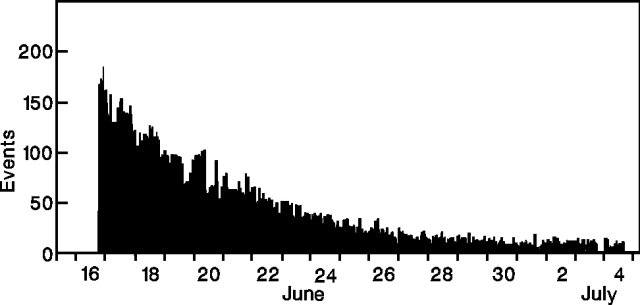 |
Figure 12. Hourly number of earthquakes at Pinatubo, 16 June-4 July 1991. No data are available for 15-late 16 June due to equipment saturation. Courtesy of PVO. |
Periods of sustained high-amplitude tremor and large long-period earthquakes (15-20/hour), represented as spikes on Realtime Seismic Amplitude Measurement (RSAM) plots, often coincided with higher ash ejection. A rough 7-hour periodicity was recognized for these spikes beginning about 7 July (figure 13). Ash emission during inter-eruptive periods (between spikes) gradually decreased and the repose period increased, before the pattern finally became irregular around noon on 11 July. This episode was accompanied by a coincident increase in seismic energy release (figure 14).
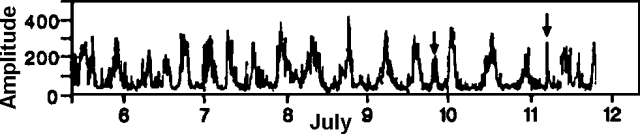 |
Figure 13. RSAM at Pinatubo, 5-11 July 1991. Arrows represent suspected lahar signals. Courtesy of PVO. |
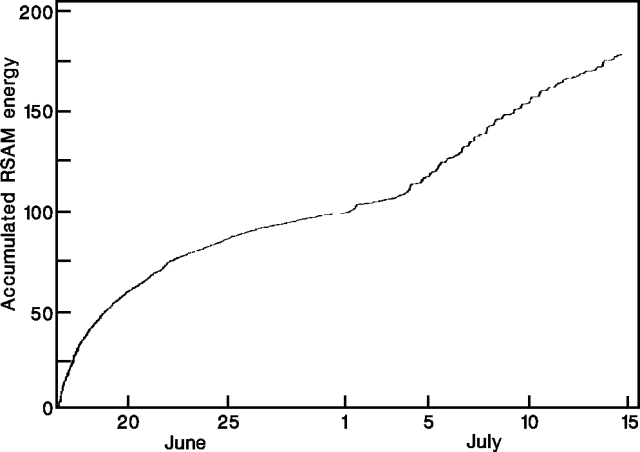 |
Figure 14. Accumulated RSAM energy at Pinatubo, 16 June-14 July 1991. Courtesy of PVO. |
Earthquakes were occasionally felt as far away as Manila. The largest of these (M 5.9) was at 1250 on 3 July, and was centered 6 km NE of the volcano at 6 km depth (in a previously near-aseismic location). Most earthquakes, however, were centered beneath the volcano, at depths ranging from 0 to >20 km, whereas focal depths before the cataclysmic activity did not exceed 8 km depth (figure 15).
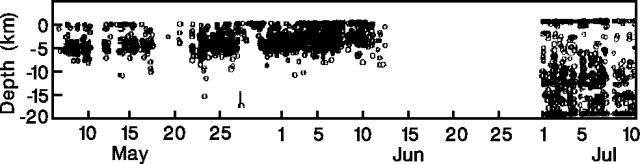 |
Figure 15. Depths of 2,080 earthquakes at Pinatubo, 6 May-9 July 1991. Data for 27-30 June are similar to those of early July. Courtesy of PVO. |
Rains triggered debris flows, ranging from landslides to hyperconcentrated flows, on all flanks of the volcano. Several of these flows were recorded seismically (figure13). On 23 June, at 2240-2330, a "hot" lahar was observed NW of the volcano on the Balintawak River near Poonbato. Hyperconcentrated flows were reported on the nearby Maronut River the next day, and to the SE (on the Pasig, Porac, and Gumain Rivers) on 30 June. Houses in Porac and Floridablanca (SE of Pinatubo) were buried up to roof level with volcanic debris. A lahar occurred on the Balintawak River the night of 30 June-1 July.
Large explosive episodes ejected ash clouds to 16 km height on 2 July, and explosive activity again intensified slightly on 7 July, ejecting ash clouds to 14-15 km height. Intense activity continued the next day and weather satellites observed clouds 14 km high at 0230-0250, >15 km high at 0700, 16 km high at 0800-0900, and about 15 km high at 1604. Eruption cloud heights of 15 and 16 km were measured on 7 and 8 July, respectively. Small, low-energy pyroclastic flows were observed billowing from within the caldera and travelling only a few hundred meters from the rim. Ash emission between explosive episodes was very low. SO2 fluxes, determined by COSPEC, were 5,190 t/d on 5 July, and 1,243 t/d on 9 July. Clear weather enabled the installation of several telemetered rain gauges. Observers reported hundreds of small ash avalanches off steep ridges into valleys. Periodic ash emissions to 15 km continued on the 17th, when the prevailing wind carried ash SE to Manila, closing the airport for two days.
Debris-flow activity, 7-10 July. Information about W-flank lahars in the next two sections is abstracted from a report by Kelvin Rodolfo.
In response to a 9 July warning of possible heavy rains, geologists were stationed at two W-flank sites to monitor rivers and warn downstream residents if lahars were detected. The next morning, an intense cloudburst in the headwaters of the Bucao River triggered a minor, dilute lahar. One team (10 km E of Botolan on the N bank of the Bucao River) heard a strong noise of rushing water and rolling boulders for 15 minutes before the head of the flow came into view at 0557. Approximately 25% of the channel was occupied by the flow. Velocities averaged 3.5 m/s (12.6 km/hour). Numerous boulders to 1.5 m were intermittently rolled and pushed by the flow at rates comparable to its velocity.
From a hazards perspective, geologists noted that the flow's most significant characteristic was its capacity to erode laterally. Along a straight stretch of channel, cutting rates from 1.6 to 6 minutes per meter of horizontal bank erosion were documented. Lateral erosion was by undercutting and slumping of blocks 1-6 m long, 1.5 m thick, and 0.3 to 1 m wide (average width, 0.5 m) that were continuously incorporated into the flow. Bank erosion rates were faster along an outer bend, ranging between 0.2 and 1.2 min/m, and averaging 0.9 min/m over 2 hours of observation and measurement. The lahar deposits behaved like quicksand, especially those with a high content of fine ash, and crossing them before they had some time to drain caused people and animals to sink knee-deep. Mayor Doble of Botolan reported that some trapped animals had died from starvation.
Mountain slopes partially cleansed of ash by runoff from moderate rain were green, as were portions of grasslands on the plains that escaped total burial. Farmers were impressed by the health of surviving plants.
East of the volcano, the press reported that lahars travelling down the Chico River (NE flank) deposited knee-deep mud in several villages on 10 July. At a village near Porac, flows broke through sandbags for the second time in 13 days, causing people to flee. The next day, debris flows traveled down the Pasig, Porac, and Gumain Rivers on the SE flank, causing extensive erosion in small tributaries.
A lahar observed on the Marimla River (ENE flank) on 15 July, was up to 50 m wide, 4 m deep, and highly erosive. Post-15 June wingwall and channelization efforts proved ineffective as the lahar breached the N levee downstream on the Bamban River (NE flank) in 3 places.
Typhoon-related debris-flow activity, 20-26 July. The first typhoon after the paroxysmal eruption passed N of Luzon 18-19 July. At 0900 on 18 July, in response to weather forecasts, geologists recommended that Lahar Alert 2 be issued for the W flank's Zambales region. Teams were sent to the Bucao and Santo Tomas rivers. A minor dilute lahar occurred from 2300 until 0630 the following morning, but was hardly noticeable at Botolan, and caused no damage.
After the typhoon, the threat of lahars persisted, with continued scattered thunderstorms around Pinatubo. Large lahars along various rivers E of Pinatubo buried sections of some towns (such as Guagua). W of Pinatubo, monitoring stations were established on the Bucao River east of Botolan, and at the junction of the Marella and Santo Tomas Rivers (threatening San Marcelino and nearby towns). Small, dilute lahars were observed on two evenings, but none was large enough either to escape its channels or to reach the sea.
Geologists cited three reasons for expecting strong rainfall to trigger serious flooding in all of coastal Zambales province. First, ash deposited on the steeper mountain slopes has been washed into creeks and rivers by the first rains, seriously reducing capacities of the drainages to hold water. Second, to clear the national highway, much of its ash cover was dumped by the roadside, choking many ditches. Third, during typhoons, large waves or tidal surges will effectively raise sea level, making it harder for rivers to enter the sea.
Installation of a USGS computer that receives telemetered rainfall data from instruments on Pinatubo's W flank will help warn people in Botolan, San Marcelino, and other towns threatened by lahars. Watchers at stations on the Bucao and Santo Tomas Rivers are equipped with two-way radios with which to contact threatened towns.
On the E side of the volcano, the press reported that large lahars on 20 July (related to typhoon Amy) destroyed more than 400 houses in Floridablanca, and buried more than 130 houses in Concepcion, forcing the evacuation of at least 1,200 people. This event brought the total number of houses damaged during the eruption to more than 80,000. Two days later, heavy rains from typhoon Brendan caused additional large lahars travelling 10 m/s at the slope breaks and 3 m/s at distal locations. Lahars to 3 m deep caused the evacuation of parts of 13 towns in Zambales (W flank), Tarlac, and Pampanga (E flank) provinces, with 2,000 initially fleeing from Santa Rita (just S of Concepcion) where 4,000 more were left stranded, unable to leave until the following morning. Evacuees from Pampanga province numbered about 10,000. Channel infilling and dike ruptures resulted in lahars up to 4 km wide on the Bamban River E of Concepcion, with similar activity along the O'Donnell, Abacan, Pasig, Porac, and Santo Tomas Rivers.
By 23 July, more than 60,000 people had fled their homes, with at least five killed during the previous two days. Mudflows, 5 m high, traveled through Concepcion at 8-11 m/s, sweeping several people away. Further lahars buried 11 villages near Sexmoan and damaged fish ponds, buried almost half of Santa Rita, and had completely silted up the Abacan River at the town of Mexico.
Debris flows continued to form on 25-26 July, with the onset of typhoon Caitlin. About 10,000 people evacuated Mexico and 308 houses were buried in 1.2 m of mud from flows down the Abacan River. A 30-m section was removed from the Mexico-Concepcion road. Swelling of the Santa Rita River caused 300 to flee Olongapo when houses were flooded waist deep. Flooding also occurred in Manila.
The press reported that by the 26th, 1.2 million people had either lost their homes or their livelihoods, 100,000 houses had been crushed or buried, and about 90,000 people remained in evacuation camps. Casualty reports ranged from 323 (with 40 missing), to more than 435.
Medical impact. The following is from Peter Baxter. The paroxysmal phase of the eruption caused the collapse of numerous buildings, and in some towns W of the volcano, destruction was complete. An estimated 250,000 people were evacuated, many moving to temporary camps. Efforts have been made to determine the medical hazards presented by the eruption, by characterizing ash composition and leachates, and measuring exposure to humans. Epidemiology teams from the U.S. Centers for Disease Control collected information on health and medical conditions at hospitals and evacuation camps, establishing programs to monitor food/water contamination and changing ash compositions. Preliminary information showed that ashfall was not yet a serious health problem. Heavy rains that coincided with the paroxysmal activity alleviated some ash problems by washing the suspended material out of the air. There had been no outbreaks of respiratory ailments, and surface water contamination was not a major problem since residents generally drink ground water. Concern was expressed that malaria, endemic on the W side of the volcano, might increase. There was additional concern for the mental health of people who have been forced to relocate several times and are now threatened by large mudflows.
Information Contacts: PVO, PHIVOLCS-USGS, Clark Air Base, Philippines; Kelvin Rodolfo, Univ of Illinois; Peter Baxter, Dept of Community Medicine, Fenner's, England; John Ewert, Edward Wolfe, and Richard Hoblitt, CVO; T. Casadevall, USGS Denver; Ellen Limburg-Santistevan, USGS Reston; Harvey Miller, Pearl Harbor CINCPACFLT, HI, USA; SAB; Manila Far East Broadcasting Company; AP; Reuters; UPI.
Ash emissions decreasing; typhoons trigger large lahars
Activity declined through the third week of August, although periodic explosions continued to eject material to >15 km height. Heavy rains triggered large mudflows that traveled down all major drainage systems, destroying houses and resulting in numerous casualties. The number of people killed by the eruption, mudflows, and disease (in evacuation camps) now exceeds 500. The stratospheric aerosol cloud produced by the paroxysmal activity on 15-16 June continued to disperse.
Continuing activity, to 20 August. Declining seismicity was interrupted by a M 4.5-5 volcano-tectonic earthquake at 1456 on 26 July and several felt aftershocks. Ash emission continued, often accompanied by tremor during periods of increased plume heights. Two pulses of emissions to >7.5 km at 0136 and 0203, and one to 16.4 km (as determined by radar at Clark Air Base) at 1212 on 27 July, were accompanied by low-amplitude tremor. Aviation officials were notified within 15 minutes of the onset of this more energetic activity. Relatively dry weather continued through early August.
Seismicity continued a gradual downward trend (figure 16), with a decrease in amplitude and number of long-period events, and a decrease in seismic energy released (figure 17). Small upsurges in amplitude (RSAM) corresponded to long-period earthquakes. Ash emissions were rare and did not exceed 8 km height during 8-10 August and had fewer accompanying long-period events. Occasional high-frequency earthquakes were felt at Clark Air Base with intensities up to II. Mudflow signals were seismically recorded on the 10th.
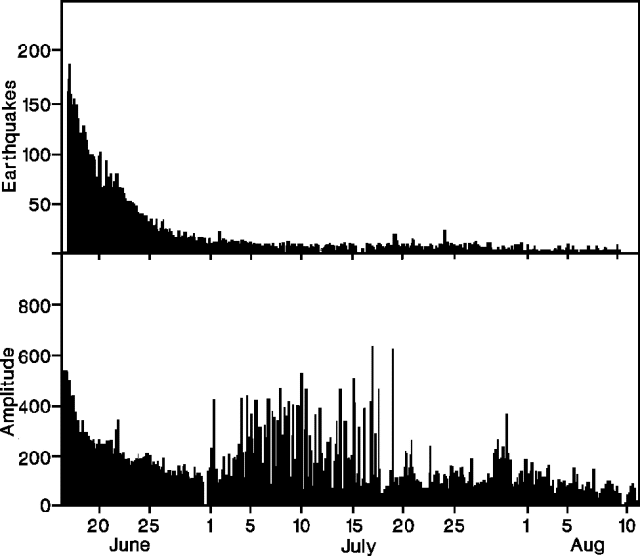 |
Figure 16. Number of earthquakes per 4 hours (top) and Realtime Seismic Amplitude Measurement (bottom) at Pinatubo, 16 June-11 August 1991. Courtesy of PHIVOLCS. |
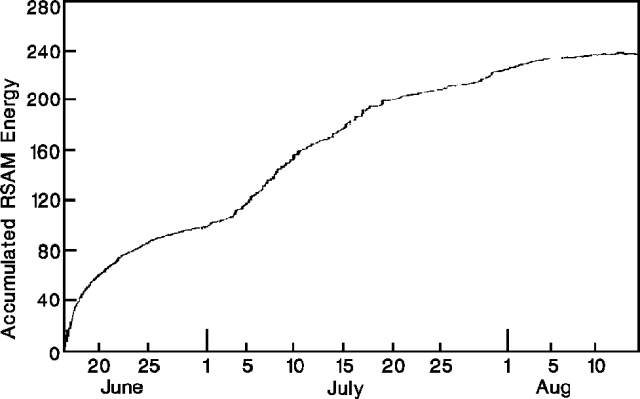 |
Figure 17. Accumulated RSAM energy at Pinatubo, 16 June-15 August 1991. Courtesy of PHIVOLCS. |
Heavy rain triggered large mudflows on 11 August. The press reported that more than 13,000 people fled their villages, and more than 1,000 houses were destroyed. The Gumain (SE flank) and Sacobia (E flank) Rivers rose an average 1.2 m, and 300 houses were damaged along the Abacan near Mexico (~45 km E of the summit). Five large ash emissions (average height 5 km) occurred on 12 August. United Airlines pilots reported an ash cloud to >15 km altitude at about 1300 on the 12th and to 12 km the following day at 1426.
High ash emissions (maximum plume height about 13 km) and mudflows were reported on 14 August. About 5,000 people evacuated Tabon in the Pampanga region (E flank), as 96 houses were washed away. The press reported debris to 3 m deep. Mudflows on the 18th prompted another large evacuation, with 3,000 fleeing 6 towns in the Pampanga and Tarlac regions (E flank).
On 20 August, the press reported that the largest mudflows since the start of the eruption killed 31 people (primarily in Santa Rita, ~40 km NE), bringing the number of mudflow-related deaths to over 100. Flows 5 m high reportedly traveled down ten rivers, damaging more than 9,000 houses and destroying three bridges. Up to 55,000 people evacuated their homes. Ash clouds rose to 12 km high.
The press reported that by 6 August, more than 46 people (mostly children and infants) had died of various illnesses (primarily diarrhea, measles, and broncho-pneumonia) in evacuation camps. This number had increased to nearly 200 (mostly Aeta tribesmen) by 18 August, and it was reported that almost 1,500 people in the camps were suffering from disease. By 20 August, more than 500 people had died since the start of the eruption according to press reports.
Field geology. Fieldwork and evaluation of the deposits from the paroxysmal activity of 15-16 June continued. A preliminary airfall isopach map was prepared by the PHIVOLCS MGB Lahar Task Force (figure 18), and the volume of material within the 10-cm isopach was estimated to be 0.47 km3. Ash leachates indicated chloride contents to almost 1,000 ppm, and fluoride contents under 10 ppm (table 3). Petrographic analysis of pumice samples revealed the presence of anhydrite micro-phenocrysts scattered in the matrix groundmass (Bernard, and others, 1991). Pyroclastic-flow deposit volumes were estimated to total roughly 7 km3. The following report by Alain Bernard describes one of the pyroclastic-flow deposits.
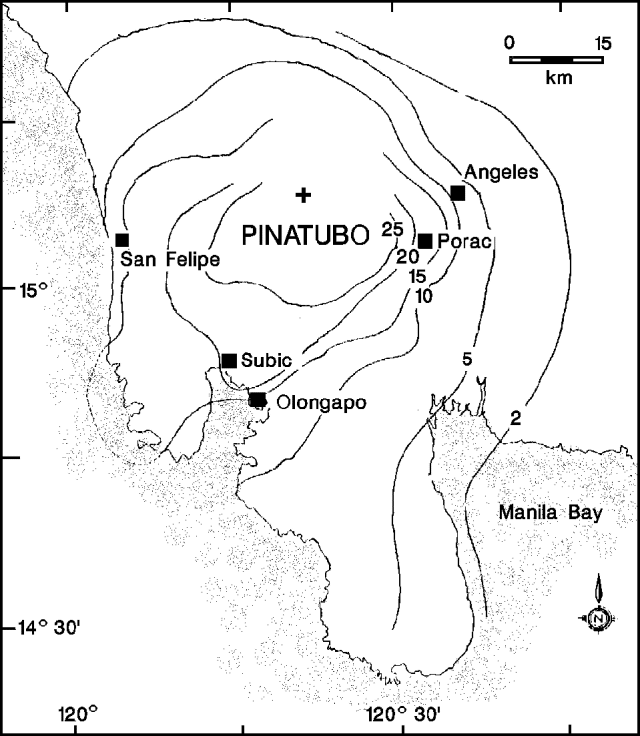 |
Figure 18. Preliminary isopach map of 12-16 June 1991 airfall deposits from Pinatubo. Isopachs are centimeters. Prepared by PHIVOLCS MGB Lahar Task Force. |
Table 3. Preliminary fluoride and chloride contents in Pinatubo ash leachates, 12 June-4 July 1991. Ash was washed for 12 hours in a 4:1 ratio of water (distilled-deionized water, pH 5.5) to ash. The 12, 15, and 22 June samples were collected by PHIVOLCS and reported "fresh fallen," the other samples were collected shortly after falling, during dry weather. Courtesy of Alain Bernard and PHIVOLCS.
| Date | Location | Distance from volcano | F- (ppm) | Cl- (ppm) | pH |
| 12 Jun 1991 | San Marcelino | 28 km | 0.3 | 212 | -- |
| 15 Jun 1991 | Bacoor-Cavite | 120 km | 9.8 | 208 | -- |
| 22 Jun 1991 | O'Donnell | 26.5 km | 0.4 | 475 | -- |
| 29 Jun 1991 | Binoclutan | 38 km | 1.6 | 991 | -- |
| 29 Jun 1991 | Mapanuepe | 19 km | 0.05 | 67 | 3.83 |
| 30 Jun 1991 | Botolan | 39.5 km | 0.4 | 803 | -- |
| 03 Jul 1991 | Iba | 44 km | 0.65 | 464 | -- |
| 03 Jul 1991 | Marella 1 | 10 km | 0.06 | 11 | 7.9 |
| 03 Jul 1991 | Marella 2 | 13 km | 0.1 | 50 | 7.2 |
| 03 Jul 1991 | Hot mudflow (on pyroclastic flow) | 8 km | 0.4 | 354 | 6.19 |
| 04 Jul 1991 | Poonbato | 23.5 km | 0.5 | 604 | -- |
| 03 Jul 1991 | Burgos-Ugik | 17 km | 0.6 | 699 | -- |
"A pyroclastic-flow deposit emplaced in the Marella River (reaching 15 km SW from the main crater) was visited on 3 July. It was still degassing, with numerous rootless fumaroles present even at low altitude at the end of the deposits. The gases emitted were mostly steam, but minor amounts of SO2 (and probably H2S) were present, since incrustations of native sulfur were observed at the mouths of these fumaroles. Strong odors of burned wood (charcoal) were also perceptible in some places, and associated with black-brown deposits at the surface of the pyroclastic-flow deposit resulting from some pyrolysis of wood buried at shallow depth beneath the deposit. Maximum temperatures of the fumarole were close to boiling, 98-99.5°C. The temperature inside of the pyroclastic-flow deposit measured at one location (~10 km from the crater) was 223°C at a depth of 70 cm.
"The surface of the deposit was a hard crust that was very easy to walk on. It looked like some recent pyroclastic-flow deposits observed on Augustine, with rounded pumice clasts (maximum size
"Numerous small cones (maximum diameter about 10 m, up to about 1-2 m high) were also present on the surface of the pyroclastic-flow deposit. These cones resulted from the activity of large steam fumaroles. At the time of the visit, two intermittent fumaroles were active in the upper portion of the deposit (~8 km from the crater) emitting a steam plume 3-4 m high mixed with fine-grained ash. A hot (88°C) stream of muddy water (65 cm wide), with the consistency of a mudflow, was also surging from the ground in the area close to these intermittent fumaroles. A water sample filtered from this stream showed a high chloride content compared to other streams and rivers travelling down the volcano (table 3). Many old tracks of other mudflows were observed on the surface of the pyroclastic flow deposit."
[Additional encounters between aircraft and ash clouds, frequent in the eruption's first days, were reported this month but included above in table 2.]
Reference. Bernard, A., Demaiffe, D., Mattielli, N., and Punongbayan, R.S., 1991, Anhydrite-bearing pumices from Mount Pinatubo: further evidence for the existence of sulphur-rich silicic magmas: Nature, v. 354, p. 139-140.
Information Contacts: R. Punongbayan, PHIVOLCS; A. Bernard, Univ Libre de Bruxelles, Belgium; T. Casadevall, USGS Denver; J. Lynch, SAB; Daily Inquirer, Manila, Philippines; AP; UPI; Reuters.
Secondary pyroclastic flows feed large ash columns; frequent mudflows; fewer explosions
Activity continued to decline through 15 September, with only three ash/steam emissions since about 25 August. Heavy monsoon rains triggered numerous mudflows and secondary explosions from the 15-16 June pyroclastic-flow deposits. Two large secondary pyroclastic flows occurred, producing associated ash clouds to 15 km height. The press reported continued fatalities from debris/mudflows and disease in evacuation camps, bringing the number of casualties attributed to the eruption to at least 740 by 20 September. Study of the June deposits has resulted in preliminary estimates of 7-11 km3 of material erupted.
5-11 August. Radar at Clark Air Base detected 13 ash/steam emissions rising to 4.5-13.5 km height; plumes were carried NE by the wind. Most RSAM peaks coincided with these emissions. The majority of seismicity was shallow (<=1 km depth), with magnitudes <1. Seven high-frequency earthquakes were felt at Clark Air Base.
12-18 August. Thirteen ash/steam emissions were detected, three with columns >15 km high (maximum 17.5 km). Wind carried the plumes ENE and NE, and ashfall was reported at Clark Air Base on 13 and 16 August. Ejection velocities ranged from about 300-900 m/min, similar to the ejection velocity on 25 June (estimated at about 450 m/min). A large secondary pyroclastic flow occurred sometime on 12-13 August, in the Marunot drainage on the NW flank. The flow was not observed, but satellite imagery was used to identify the deposits and estimate a deposit volume of 31 x 106 m3 (1.25 km2 areal coverage). The flow, ~10 km long, created a headwall scarp about 20 m high along a 240° arc in the primary pyroclastic-flow deposit source region. During aerial observations, the still-steaming secondary deposits could be differentiated from those of earlier pyroclastic flows by the absence of rills and dissected morphology.
Seismic energy release decreased notably from the previous week (figure 19), although the number of earthquakes remained about the same (102 recorded events/day compared to 95/day the week before). Several shocks were felt at Clark Air Base. RSAM peaks reflected high-frequency earthquakes generated by mudflows, and occasional long-period signals associated with ash/steam emissions from the caldera. Geologists suggested that small long-period events may also be related to secondary explosions from pyroclastic-flow deposits.
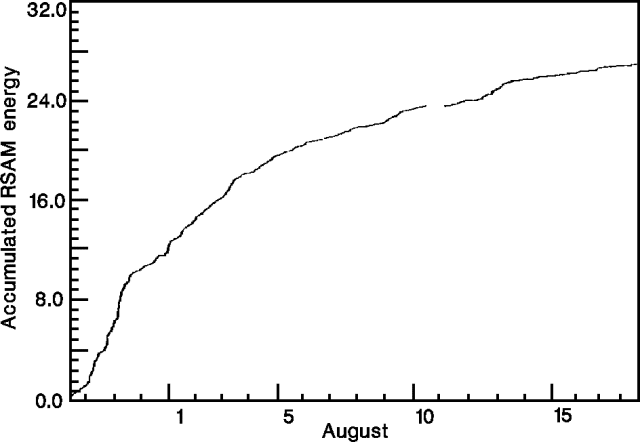 |
Figure 19. Accumulated RSAM energy at Pinatubo, 28 July-18 August 1991. Courtesy of PHIVOLCS. |
19-25 August. Ash/steam emissions averaging ~9.8 km high (maximum 15 km) were detected eight times during the week. Ash was carried E. Some may have originated from secondary explosions at the E flank (Sacobia valley) pyroclastic-flow deposits. Seismicity consisted mostly of high-frequency earthquakes (M < 1.0) centered below the caldera or ~3 km NW, at 0-18 km depths (figure 20). Four events (M 2-4) were felt at Clark Air Base, with intensities to IV (adapted Rossi-Forel scale). RSAM peaks coincided with the larger high-frequency earthquakes, and long-period events were associated with ash/steam emissions.
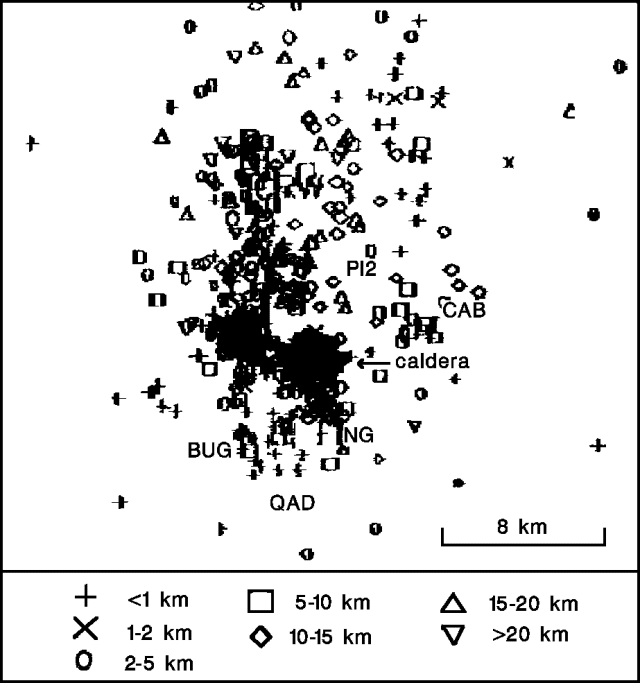 |
Figure 20. Epicenters of 648 earthquakes recorded near Pinatubo, 19-25 August 1991. Courtesy of PHIVOLCS. |
26 August-1 September. Only two ash/steam emissions were detected; plume heights ranged from about 10 to 16 km. Light ashfall occurred to 40 km SE (San Fernando) during secondary explosions that produced columns to 16 km. Ash related to these events caused poor visibility (300 m) on the highway between San Fernando and Angeles (25 km E of the volcano). The number of felt shocks (M < 4.2) increased to 17, with intensities to V (adapted Rossi-Forel scale). Multiple peaks in RSAM plots were due to mudflows, while single peaks were caused by long-period events associated with the two ash/steam emissions.
2-8 September. One ash/steam emission was detected (2 September), producing a 9-km plume that was carried W (highest portion) and NE (lower portion). Secondary explosions, three of which were recorded as low-amplitude, low-frequency earthquakes, generated ash clouds 2-4.5 km high. Geologists proposed that the heavy ashfall and 15-km-high ash column observed at 1400 on 4 September (figure 21) were from a secondary pyroclastic flow, whose fresh deposits were discovered two days later. The absence of a long-period earthquake coincident with the ash cloud suggested that it had not been generated by caldera explosions. The secondary pyroclastic-flow deposits about 3 km SSW of the caldera (in the upper Marella drainage) were estimated to be 1-2 km wide, and 4-6 km long, with a headwall scarp 15-25 m high. The deposit appeared very recent and seemed water-saturated. It was not known whether the ash cloud was generated purely by convection, or by phreatic explosions resulting from an encounter with water on the river bed. A helicopter overflight of the caldera on 6 September revealed no evidence of activity during the prior several days. Steaming was observed along the margins of the caldera and a bluish lake was present. No evidence of a lava dome was found.
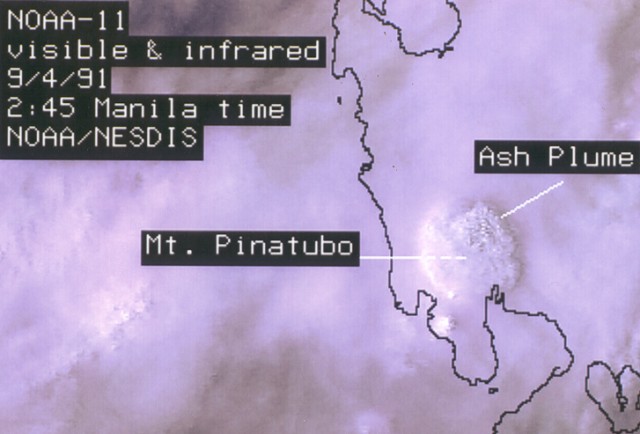 |
Figure 21. Visible and infrared image from the NOAA 11 polar-orbiting weather satellite on 4 September at about 1445, showing a large, 15-km-high ash cloud above Pinatubo believed to have been generated by a secondary pyroclastic flow. Courtesy of G. Stephens. |
Recorded earthquakes averaged 88/day, similar to 89/day the previous week. The majority were of high-frequency, and geologists believed that they were caused by tectonic readjustments. Most of the few low-frequency signals coincided with observed secondary explosions. Seismicity remained shallow (about 38% at less than 2 km depth), centered beneath or NW of the caldera. Long-duration, high-frequency earthquakes corresponding to mudflows created peaks in RSAM plots. A magnitude 5.1 earthquake at 0627 on 5 September, centered ~17 km NNW (15.53°N, 120.31°E) at 10 km depth, was felt at Clark Air Base (intensity RF V).
On 4 September, due to the continued decrease in caldera activity, the volcanic alert was reduced from Level 5 (eruption in progress) to Level 3 (numerous magma-related earthquakes, fumaroles, and gas emission), and the danger zone radius was reduced from 20 to 10 km. The principal remaining hazards and their probable durations were identified (table 4).
Table 4. Principal hazards associated with Pinatubo following the 15-16 June 1991 eruption (as of 4 September 1991). Courtesy of PHIVOLCS.
| Number | Hazard Description | Duration |
| 1 | Heavy rains may remobilize large volumes of loose pyroclastic materials on the upper slopes of Pinatubo, generating mudflows that will affect communities near drainage channels and in low-lying downstream areas. | 2-5 years...for as long as large volumes of loose sediments on slopes are subjected to heavy rain. |
| 2 | Moderate to heavy rainstorms that do not generate mudflows will still transport extraordinarily large volumes of sediments to lowland areas. This sediment will fill up river-channel storage capacity, resulting in more frequent and severe floods in lowland areas. | Years to decades. |
| 3 | Occasional phreatic explosions at the summit caldera can cause light to moderately heavy ashfall in downwind areas with possible damage to aircraft. Possible plume heights may vary from 5-20 km altitude. | Months and possibly years, but probably lessening in intensity, heights attained, and recurrence with time. |
| 4 | Groundwater that percolates into the hot interiors of pyroclastic-flow deposits can cause steam explosions. Ejected ash and ballistic fragments can be hazardous to distances of hundreds of meters. | Months to a year or more...until the interiors of pyroclastic flow deposits have sufficiently cooled. |
| 5 | As overall volcano-related seismicity decreases, earthquakes can still generate ground motions sufficiently strong to damage or destroy weak and/or unstable objects and structures. The distribution of these earthquakes probably will be broad and could cover the entire volcano and peripheral areas. | Several months to a year. |
| 6 | Thick pyroclastic deposits may locally remobilize as secondary pyroclastic flows and threaten areas as much as 10km downslope. Earthquakes, heavy rainfall, and secondary explosions may serve as triggering factors. | Weeks to months, dependng on the presence of metastable materials and the occurrence of triggering factors. |
9-15 September. Although no ash/steam emissions were detected, ash clouds 2-10 km high were produced by secondary explosions. Vigorous steam emission was noted from the S side of the caldera, and the blue crater lake was still present during observations on 10 September. The average number of earthquakes decreased to 54 recorded daily, most centered ~2 km NW or 2 km S of the caldera, at <2 km and 5-10 km depths. The majority of events were M <2. RSAM and accumulated energy both showed decreases corresponding to the drop in seismicity. Multiple RSAM peaks coincided with mudflows, while single peaks were caused by moderate-sized earthquakes.
Debris flows. All of Pinatubo's major drainage systems experienced debris flows, ranging from mudflows to hyperconcentrated flows and floods. Numerous flows also occurred in more distant drainages in which significant quantities of tephra were deposited. To help alleviate hazards and to aid in studying debris-flow processes, rain gauges were installed, observation posts were set up at strategic locations along rivers, and cross sections were monitored at bridges. Timely warnings and evacuations considerably reduced the number of injuries and casualties. High rainfall (to > 30 cm/day) and still-hot pyroclastic-flow deposits generated numerous hot mudflows that deposited as much as several meters of material.
On the SE flank's Pasig-Potrero River, pyroclastic-flow deposits had formed a dam behind which a 1,000 x 600 m lake had formed. The lake drained on 7 September, causing muddy flash floods that reached 1.2 m high in about 5-10 minutes at Bacolar (35 km SE of the volcano). Press reports indicated that 800 homes were destroyed and seven people were confirmed dead. By 15 September, continued flooding and mudflows resulted in the deaths of 12 more people at Bacolar, where 45,000 of the 68,000 residents had fled.
News reports placed the death toll from the eruption, mud flows, and disease at more than 740 by 20 September [see also 16:9]. Of the fatalities in evacuation camps, an estimated 95% were Aeta tribesmen and 75% were children. The Aeta reportedly refused most medical assistance such as vaccinations.
Fieldwork on June eruptive products. Preliminary estimates have been calculated for pyroclastic-flow deposits and airfall tephra from the paroxysmal June eruptive activity. The bulk of the material erupted was found in pyroclastic flow deposits (5-7 km3); several drainage systems included more than 1 km3. An estimated 0.48 km3 of airfall tephra was deposited within the 15-cm isopach (table 5); the total volume of tephra-fall material erupted, including that deposited in the South China Sea or lost to the atmosphere, was believed to be between 2 and 4 km3. The total volume, therefore, is estimated as 7-11 km3 (roughly 3-5 km3 dense rock equivalent).
Table 5. Preliminary volume calculations (±10% error) of June 1991 eruptive products from Pinatubo. Total tephra deposit volume: 0.48 km3. Total pyroclastic-flow volume: 7.0 km3. Courtesy of PHIVOLCS.
| Deposit Type | Location | Volume (km3) |
| Tephra | 50 cm isopach | 0.07 |
| Tephra | 40 cm isopach | 0.03 |
| Tephra | 30 cm isopach | 0.10 |
| Tephra | 25 cm isopach | 0.01 |
| Tephra | 20 cm isopach | 0.11 |
| Tephra | 15 cm isopach | 0.16 |
| Pyroclastic-flow | O'Donnell drainage | 1.0 |
| Pyroclastic-flow | Sacobia-Pasig-Abacan drainage | 1.6 |
| Pyroclastic-flow | Marella drainage | 1.3 |
| Pyroclastic-flow | Balin-Barquero-Maraunot-Bucao drainage | 3.1 |
Information Contacts: R. Punongbayan, PHIVOLCS; K. Rodolfo, Pinatubo Lahar Hazards Taskforce, Univ of Illinois; W. Scott, USGS CVO; G. Stephens, NOAA/NESDIS; NEIC; AP; Reuters; UPI.
Small secondary explosions from pyroclastic-flow deposits; fewer mudflows with less rain
Although no explosions have occurred in the caldera since 2 September (16:8), small secondary explosions continued through early October, at pyroclastic-flow deposits from the paroxysmal June eruption. Seismicity was at low levels, and a decrease in the number of mudflows reflected decreased rainfall.
16-22 September. Several secondary explosions were observed at pyroclastic-flow deposits in the Sacobia valley (NE flank). Ash was periodically reported falling at Clark Air Base (20 km E) and Angeles (25 km E), with 5 mm deposited on the morning of 18 September. No steam or ash emissions were recorded from the summit caldera.
Clusters of high-frequency earthquakes persisted near the caldera (figure 22), but noticeably fewer events have been recorded since June, especially at shallow depths (figure 23). A slight increase in seismicity was associated with a M 4.5 earthquake at 0151 on 17 September. The shock was felt at intensity V (modified Rossi-Forel scale) at Clark Air Base, with aftershocks of intensities I-IV. Occasional low-frequency, small-amplitude harmonic tremor of uncertain origin was recorded 21-22 September. Explosion-type low-frequency signals were periodically observed during and after heavy rainfall.
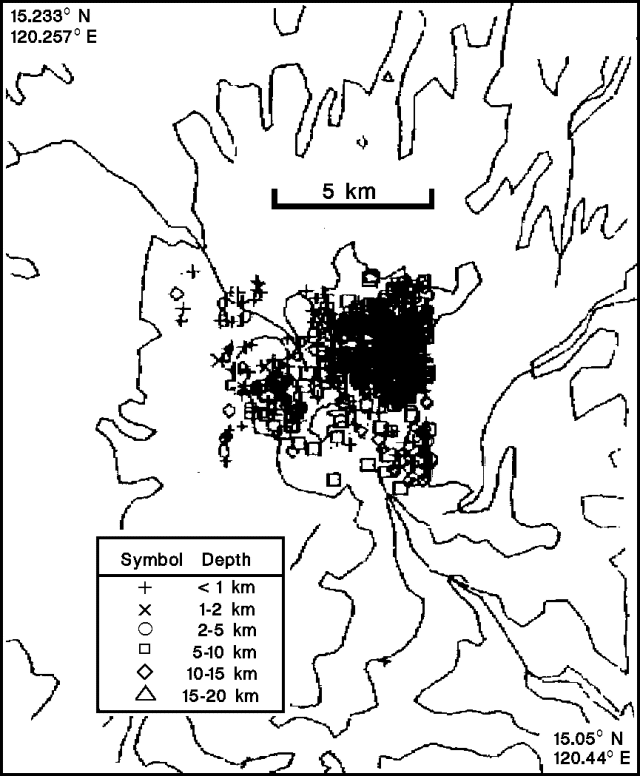 |
Figure 22. Epicenters of 619 earthquakes recorded near Pinatubo, 27 May-22 September 1991; 515 had magnitudes less than 1, 104 were of M 1-2. Contours are diagrammatic. Courtesy of PHIVOLCS. |
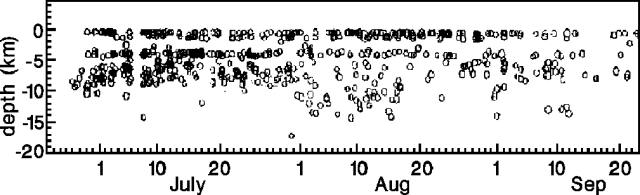 |
Figure 23. Depths of 619 earthquakes at Pinatubo, 27 June-22 September 1991. Courtesy of PHIVOLCS. |
A lake that had formed in the Mapanuepe River (SW flank), following damming by pyroclastic-flow deposits, continued to grow until heavy rain caused it to overflow on 21 September. The dam was quickly incised and partially breached, leading to flooding in San Narciso (~35 km SW) on 22 September.
23-29 September. No ashfall occurred at Clark Air Base, although several secondary explosions were observed. The number of high-frequency earthquakes (M < 3.6) decreased slightly from the previous week. Three shocks were felt (intensity I-II) on 28 September. Minimal rains occurred during the week, and no mudflows were detected. The caldera lake was turquoise-blue and steamed along its S wall during a 23 September helicopter overflight. Fresh landslides were noted on the steep-sided caldera walls.
30 September-6 October. Secondary explosions produced plumes to 4,500 m high, and ash fell on Angeles 3 October. SO2 flux from the caldera, measured by COSPEC, was only 18 t/d. Geologists noted that this flux represented SO2 rising from the caldera lake, and subaerial fumaroles; an unknown quantity of SO2 from fumaroles below the lake may be going into solution. The lake had a temperature of 40°C and a pH of 6.0 on 8 October.
Investigations of hydrologic changes caused by the thick pyroclastic-flow deposits and voluminous debris-flow deposits were not yet able to resolve whether the Abacan River (E flank) would be captured by the Sacobia River. Numerous catchment basins and dams were under construction in an attempt to constrain the Abacan River.
High-frequency seismicity decreased slightly, with a daily average of 63 recorded earthquakes, compared to 71 the preceding week. Events were centered at 2-10 km depths, shallower than the preceding week (5-15 km depths), and were distinctly clustered E of the caldera. Most of the earthquakes had magnitudes less than 2, although some reached M 3, and many were felt at Clark Air Base. Two mudflows were detected during the week.
Casualties and damages. The United Nations Development Programme reported on 15 October that the human death toll had reached 722. Of these, 358 deaths were attributed to disease, 281 to the initial eruption, and 83 to mudflows. An additional 184 people were injured, and 23 reported missing. More than 108,000 houses were partially or totally damaged, more than 100,000 people were still being fed at 143 evacuation centers, and an additional 70,000 were being fed near affected villages.
Information Contacts: R. Punongbayan, PHIVOLCS; J. Tomblin, UN Disaster Relief Organization, Switzerland.
Continued secondary explosions and mudflows; seismicity declines; fieldwork in new caldera
Although no explosions occurred within the caldera formed by the mid-June paroxysmal eruption, secondary explosions continued at pyroclastic-flow deposits through early November, causing ashfall, sulfur odors, and poor visibility. Seismicity and caldera steam emission continued to decline. Debris flows traveled down all major drainages during October, but observations suggested that the majority of the flows were more water-rich than in previous months.
7-13 October. Geologists entered the caldera for the first time on 8 October. The caldera rim elevation ranges from 1,100 m to about 1,000 m, with the lowest point on the NW side, and the caldera lake at roughly 800 m elevation. Strong steaming was observed on the S wall and along the lake shore, with numerous bubbles rising elsewhere in the lake. No ambient sulfur odor was detected when standing upwind of the fumaroles. Analyses of the caldera lake water revealed a temperature of 40°C and a pH of 6 (table 6), suggesting a primarily meteoric origin, although the plume's SO2 flux dropped from roughly 100 t/d to 10 t/d when the lake formed. Most of the 1991 deposits within the caldera are composed of old dome rock, with almost no pumice present. No distinct ring faults are apparent.
Table 6. Chemistry of Pinatubo caldera lake water, 8 October 1991. Analyses by M. Campita, L. Ringer, and L. Tansinsin, PHIVOLCS.
| Data Element | Value |
| Temperature | 40°C |
| pH | 6.01 |
| Na | 211 ppm |
| Ca | 481 ppm |
| K | 63.7 ppm |
| Cl | 1049.2 ppm |
| F | < 0.1 ppm |
| B | 39.6 ppm |
| H2S | 251.6 ppm |
| SO2 | 294.4 ppm |
| SO4 | 1431.13 ppm |
| Mg | 382.81 ppm |
| SiO2 | 54 ppm |
| Total acidity | 80 ppm |
| Mineral acid | 0 acidity |
| Total Dissolved Solids | 5133 |
Several small secondary explosions from the Sacobia valley pyroclastic-flow deposits (NE flank) were observed on 13 October; the largest, at 1247, produced a plume 2,000 m high. By about 1400, a sulfurous odor was detected, and moderate ashfall occurred at Clark Air Base. Secondary explosion signals were recorded seismically on 7 and 8 October but were not visually confirmed, while at other times during the week, small explosions were observed but not seismically recorded.
Seismicity continued to decline, with an average of 55 earthquakes recorded daily, compared to 63/day the previous week (figure 24). The earthquakes occurred at 2-10 km depth and most had magnitudes < 2. Two shocks of intensity I (modified Rossi-Forel scale) were felt at Clark Air Base.
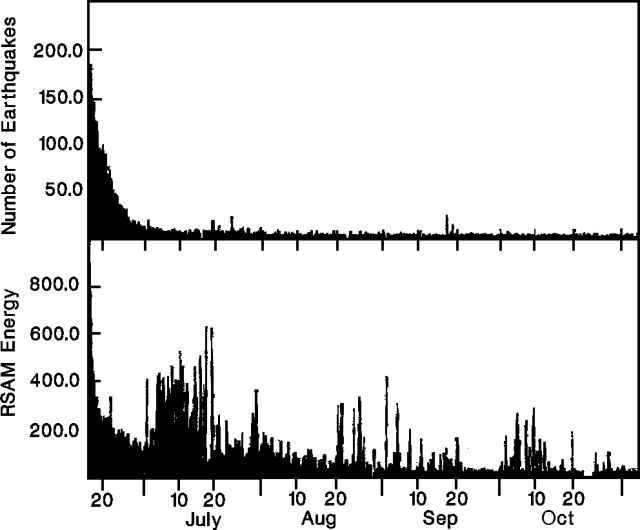 |
Figure 24. Number of earthquakes (top) and Real-time Seismic Amplitude Measurement (bottom) at Pinatubo, 16 June-3 November 1991. Courtesy of PHIVOLCS. |
Relatively small debris flows occurred in the NE, SE, and SW quadrants following heavy rainfall. Residents of Tarlac (45 km NE) noted that no large lahars had passed in the previous several weeks to months. Floods were reported along the E flank's Pasig-Potrero River (2/3 m deep) on 7 October, and the NE flank's Bamban River (waist-chest deep). Small flows occurred on the Pasig-Potrero River on 12 October, and the Sacobia, Abacan (both NE flank), and Pasig-Potrero Rivers on 13 October. The debris dam on the SE flank's Mapanuepe River began breaching again on 12 October.
14-20 October. Secondary explosions occurred in the upper Marella pyroclastic-flow deposits (SW flank) around midmorning on 14 October. One hour later, ashfall, accompanied by a sulfur odor and reduced visibility (500 m), were reported at Sitio Danalaon (18 km SW of the summit). By 1600, ash fell in Castillejos and San Marcelino (both ~30 km SW of the summit), and by 1800, ash fell in Subic (~35 km SSW). Additional explosions occurred in the upper Marella deposits on 16 and 18 October when a 500-m grayish ash cloud was produced. Ashfall from other secondary explosions was also reported in Angeles (25 km E) on 15 October.
Seismicity during the week declined to a daily average of 44 earthquakes, with most events at 5-10 km depths and M < 2. Earthquakes continued to occur in clusters. One large shock (M 3.4) on 15 October, centered about 4 km NE of the summit, was felt (intensity IV) at Clark Air Base. Other earthquakes were felt (intensities I-II) on 15, 16, 18, and 20 October.
Heavy rains on 16 October triggered small lahars on the NE, SW, and SE flanks. One large lahar, about 3 m high, traveled down the upper Pasig-Potrero River, transporting boulders up to 1 m in diameter. Small floods of muddy water were observed on the Marella River on the 14th.
21 October-3 November. An aerial survey of the caldera on 23 October showed that the lake level had risen, covering some large rocks that had been visible in August and September. Steam emissions on the S wall had decreased, and some had stopped. Some fresh talus extended into the lake. Observers 20 km SW (at Sitio Danalaon) reported pulsating weak to moderate steam emission from the caldera on 2 November.
Moderate-sized secondary explosions occurred in the Sacobia and Marella valley pyroclastic-flow deposits on 28 October, coincident with heavy rainfall. Near the Sacobia valley, sand-sized ashfall from secondary explosions was quite heavy during the early evening, and poor visibility caused drivers to stop their vehicles. Smaller explosions were observed in the Sacobia valley on 22 and 31 October, and in the Marella valley on 2 November when a dirty cloud 200 m high was produced.
The number of earthquakes averaged 37/day, at 5-10 km depths and mostly M < 2. The earthquakes occurred in clusters E, SSE, SW, N, and NW of the caldera (figure 25). Four shocks were felt at Clark Air Base, the largest (M 3.4) with intensity IV on 1 November, the other three (M 2.9-3.0, intensity I) on 25 and 31 October and 3 November.
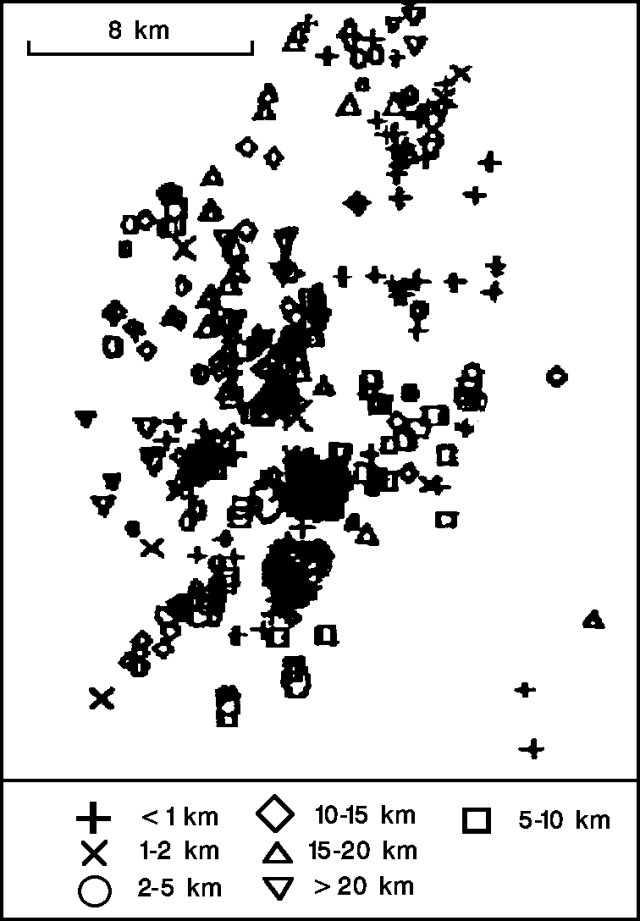 |
Figure 25. Epicenters of 515 earthquakes at Pinatubo, 21 October-3 November 1991. Courtesy of PHIVOLCS. |
Heavy rain from typhoon Ruth triggered lahars down most drainages on 28 October. On the SW flank, following 8 cm of rain in a 24-hour period, a hot lahar was observed travelling down the Marella River, a lahar up to 1 m high was observed on the Sto. Tomas River, and the debris dam on the Mapanuepe River was completely swept away. Lahars on the Pasig-Potrero River grew from ~0.5 m high at 1400, to a peak of 3 m high at 1654, and carried .5m-diameter pumice clasts and logs 3 m long and 30 cm in diameter. A lahar >1 m high was reported on the Porac River and a 65 cm hyperconcentrated flow was reported on the Gumain River (both SE flank). On the NE flank, lahars were reported on the Abacan and O'Donnell Rivers, and reached 3 m high on the Sacobia River. Flows were reported NW of the volcano, but they were more water-rich than previously, and there was no significant deposition. Small lahars occurred for several days following the 28th.
Information Contacts: R. Punongbayan, PHIVOLCS.
Steaming continues but seismicity declines; lahar threat persists
Seismic activity at Pinatubo has declined notably during the past few months. As of early January, seismicity was characterized by high-frequency earthquakes of small to moderate magnitude, perhaps related to adjustments along local faults or within the caldera area. The number of recorded volcanic earthquakes ranged from 10 to 17/day. The events were seldom felt. A six-station telemetered seismic network will continue to monitor the volcano. Ash emission from the caldera has not been observed for 4 months, and steaming has not intensified. Geologists noted the possibility of future dome growth.
Pinatubo's status was officially reduced to Alert Level 2 on 4 December. A danger zone with a radius of 10 km remains in effect because of the risk of secondary explosions from the still-hot pyroclastic materials. Lahars will continue to threaten low-lying areas susceptible to flooding, particularly those that have previously been affected.
Kelvin Rodolfo notes that several typhoons typically strike central Luzon Island annually, but none have passed near Pinatubo since the moderate storm (Yunya) during the eruption's paroxysmal phase. Yunya's center was only about 100 km ENE of the summit at 1100 on 15 June, causing wind shifts that brought significant ashfall to the area S of the volcano, where normal seasonal wind patterns would not have deposited ash. Beginning at about 0400 and continuing throughout the day, heavy rains associated with the leading edge of the storm triggered lahars, many of the debris-flow type, down all of Pinatubo's major valleys, destroying several bridges.
Rains carried by the NE trade winds were abnormally strong on Pinatubo's E side in June and July, generating frequent lahars on that flank. Lahars were rare on the W flank until the SW monsoonal rains, delayed for about 2 months, began in late July. Although >115 cm of monsoonal rain fell 12-26 August, a major typhoon can produce that much rain in 1-2 days. The 1991 lahars were primarily hyperconcentrated flows, whereas intense typhoon rain is more likely to generate debris flows. Most of the eruption debris remains in place.
Information Contacts: PHIVOLCS; Kelvin Rodolfo, Univ of Illinois.
Vapor emission and low-level seismicity; small lahars
Two small lahars took place as a result of light rain showers in the Sacobia River drainage in late February, and steam emission continued through early March from a linear trend of fumaroles along the S edge of the 1991 caldera floor. Discrete larger emission episodes were occasionally observed, but there have been no confirmed ash emissions. Weak seismicity has continued at the volcano, including low-amplitude, low-frequency events, at least one of which corresponded with an observed steam emission.
Information Contacts: R. Punongbayan, PHIVOLCS.
Lahar triggers secondary explosion on NE flank
On 4 April, rainfall triggered a lahar in a NE-flank drainage (Sacobia). The lahar disrupted a portion of the extensive June 1991 pyroclastic-flow deposits, producing a secondary explosion and reportedly a secondary pyroclastic flow. The press described an ash cloud that rose about 1,200 m, and darkened the Angeles area (25 km E of the summit). The lahar also destroyed two sabo dams that were being constructed to reduce future mudflow damage downslope, but no casualties or additional property damage were reported.
Information Contacts: R. Punongbayan, PHIVOLCS; Reuters.
Rains on 1991 deposits produce destructive mudflows
Increased steam emission from Pinatubo's summit caldera was periodically observed in 1992, often accompanied by low-frequency harmonic tremors believed to be associated with sudden release of pressurized gas and steam from shallow depth. However, seismicity at the volcano continued to decline. Felt shocks with intensities of I-V (Rossi-Forel scale) were reported until mid-May.
Numerous mudflows descended the volcano's flanks, as heavy local rainfall mobilized large quantities of unconsolidated material deposited during the June 1991 eruption (16:5-6). The more significant events occurred on 18-19 February, 5 April, 10 and 31 May, and 1 and 4 June, affecting low-lying areas NE, SE, and SW of the volcano. Dams along the Pasig-Potrero and Sacobia rivers (SE and E flank, respectively) were destroyed during these relatively minor mudflow events and residents of Angeles (25 km E) reported slight to moderate ashfall from secondary explosions in pyroclastic-flow deposits within the Sacobia Pyroclastic Fan (SPF). Civil authorities have attempted to limit damage from the mudflows in the three provinces surrounding the volcano (Tarlac, Pampanga, and Zambales) by constructing Sabo dams and catchment basins, and by dredging channels, at a cost of more than $300,000,000. More than 250 school buildings were prepared as evacuation centers and the government advised people living near river banks to move to safer ground.
On 4 April, a major secondary explosion occurred at the toe of the SPF (drained by the Sacobia-Bamban and Abacan rivers), producing a 1.2-km-high ash plume. The explosion triggered a landslide that developed into a secondary pyroclastic flow, travelling 3 km down the Sacobia River and 2 km down the Abacan River. Numerous explosions followed, minutes apart. The secondary flow deposit, 14 m thick 3 km from the explosion site, buried three Sabo dams along the Abacan and two along the Sacobia River. A moderate amount of ashfall (~4 mm) was reported by residents at Clark Air Base/Pinatubo Volcano Observatory and Angeles. The flow left a deep escarpment, cutting the Abacan River off from the SPF, its source of mudflow material. The upper reaches of the river have been captured, and now flow down to the Sacobia-Bamban River, with only a muddy trickle expected to reach the Abacan.
With the advent of the rainy season (June-November), larger mudflows, with accompanying flooding and siltation, were expected in low-lying areas along the major river channels draining the volcano. As of early June, about 70,000 of the roughly 250,000 people displaced during the 1991 eruption and subsequent mudflows remained in evacuation centers and resettlement areas.
Information Contacts: R. Punongbayan, Perla J. Delos Reyes, Renatu U. Solidum, and Ronnie C. Torres, PHIVOLCS; Reuters; UPI.
Lava dome extruded into caldera lake; small steam-and-ash ejections; lahars and secondary explosions
Increased seismicity preceded the emergence of a lava dome into the center of the caldera lake. Moderate steam-and-ash emission was associated with the lava extrusion.
Long-period earthquakes and tremor began to be recorded on 6 July. An aerial survey during the morning of 7 July showed no visible change in steaming from crater vents, although the caldera lake was convecting and somewhat muddier than normal. A small island was reported in the caldera lake early on 9 July. An overflight that day at 1500 revealed a mud cone about 100 m in diameter near the center of the lake, protruding about 5 m above the lake surface. Small phreatic explosions to about 100 m height occurred near the side of the island. PHIVOLCS raised the official alert level to 3, indicating the possibility of an eruption within weeks. The announcement described possible activity as quiet extrusion of a lava dome or moderately explosive phreatomagmatic eruptions. A danger zone of 10-km radius was being enforced.
The cone had reportedly reached 200-300 m in diameter by 12 July. A lava dome 100-150 m in diameter was visible near the center of the island during an aerial survey on 14 July at 0900-1000. The island had grown to around 250-300 m across and was 8-10 m above lake level. A continuous dirty white steam column that included some ash was emerging from the dome and drifting SW during the overflight. Ashfall was reported on two towns ~30 km SW of the summit (San Marcelino and Castillejos) at about 0600 and 1300. The alert level was raised to 5 (eruption in progress).
On the flanks of the volcano, monsoon rains triggered secondary explosions and lahars that forced the evacuation of thousands of people living along rivers. Two people were reported killed by lahars on 12 July. The Department of Social Welfare said that about 70,000 people remained in evacuation centers and resettlement sites in the aftermath of the June 1991 eruption.
Information Contacts: PHIVOLCS; UPI; Reuters; AP.
Continued dome growth; officials warn of possible explosive eruption
The lava dome in the center of the caldera lake was continuing to grow as of mid-August. Periods of increased seismicity and decreased gas emission prompted an official warning of possible renewed explosive activity, but none had occurred at press time. Rain-induced lahars and secondary explosions from the pyroclastic-flow deposits continued with the ongoing rainy season.
By late July, the lava dome was 250 m across and 75 m high in the center of the 600 x 800 m crater lake. Lake depth was estimated at < 5 m. COSPEC measurements on 21 July indicated an SO2 emission rate of 900 ± 200 metric tons/day (t/d). Secondary explosions from the 1991 pyroclastic-flow deposits occurred daily, producing columns that sometimes reached 7.5 km altitude. Secondary pyroclastic flows were triggered in the Pasig-Potrero and Marella drainages. Daily lahars were filling channels below 100 m elevation. Seismicity was dominated by high-frequency events, but long-period events and tremor occurred roughly once a day in episodes that lasted up to an hour. Maximum tremor amplitude was 4-5 mm peak-to-peak.
A systematic increase in low-frequency seismicity started at the beginning of August. Earthquake counts reached 125 low-frequency and 41 high-frequency events during the 24 hours ending at 0600 on 10 August. A newly installed seismic station near the N rim of the caldera detected numerous signals reminiscent of those recorded at a similar site 3-4 days before the onset of the 1991 explosive eruption. SO2 emission dropped from 830 t/d on 3 August to 250 t/d on 6 August, and remained at relatively low levels. A similar decrease had occurred several days before the 1991 explosions. Because of these changes, PHIVOLCS warned of the threat of another explosive eruption within a week or less, but noted that explosions comparable to those of 15 June 1991 were not anticipated. People were strongly urged to avoid the official danger zone that extends in a 10-km radius from the crater. No population centers are within the danger zone, but about 2,000 people living nearby sought refuge in government evacuation centers.
An aerial survey on 10 August revealed additional growth of the dome, to about 300 m in diameter and 100 m high. Uplift of some 2 m had produced a beach about 30 m wide against the dome's N flank. By the next day the beach front was 50 m from the edge of the dome, and it had advanced an additional 5 m outward by 12 August. Gas rose to several hundred meters above the crater rim. The rate of SO2 emission had declined to about 200 t/d by 7 August and was about the same on 11 August.
Information Contacts: PHIVOLCS; Reuters.
Lahars kill more than 60 people; large secondary explosions; continued lava-dome growth
Growth of the lava dome in the summit caldera continued. Poor weather limited observations, but the dome's dimensions were estimated at 300-320 m in diameter and 100 m high during an early-September overflight. Heavy rains continued to trigger large secondary explosions and numerous lahars from the 1991 pyroclastic-flow deposits. Despite construction of sabo dams and levees, lahars had filled the channels of most flank drainages, endangering the remaining residents of river valleys around the volcano; almost 400 villages were identified by PHIVOLCS to be at high risk from lahars. Lahars reportedly killed more than 60 people in late August, and forced several hundred thousand to evacuate.
Observations by a geologic team on the W flank revealed continued development of large lahar fans that included numerous partially buried carbonized trees. The lahars repeatedly damaged or destroyed containment dikes, and progressively buried a village near the observation site. Hyperconcentrated flows, composed of 50-75% volcanic debris, were dominant at the site (along the Bucao River) because of dilution by streams not carrying large sediment loads. Less common were laharic debris flows with water contents of 25% to as little as 15%. Along one zone where the channel was only 30-100 m wide, hyperconcentrated flows typically advanced at 10-15 km/hour, marked by antidune standing waves 5-12 m long and 1-2 m high. Debris flows were laminar, moving at up to 30 km/hour.
Several large secondary explosions were documented between mid-August and mid-September. Explosions on 20 August at 0940 and 21 August at 0740 produced plumes that were tracked to 9 km altitude by radar (at Cubi Point). The top of each plume moved NNW and mid-level material (near 5.5 km) was carried NE. A large secondary explosion from pyroclastic-flow deposits in the SW flank's Marella valley occurred at 1650 on 15 September. The cloud reached 18 km altitude and drifted SW, depositing 3 mm of ash about 30 km SW of the summit (at San Marcelino) and 2 mm about 35 km SSW of the summit (at Subic Bay). Additional large secondary explosions took place on 21 September at 0957 and 1758. The first plume rose to more than 12 km altitude, appearing initially on satellite imagery as a circular cloud about 100 km in diameter above heavy weather clouds. The second plume reached 9 km altitude and moved rapidly WSW, causing heavy ashfall and muddy rain.
Information Contacts: PHIVOLCS; SAB; Kelvin Rodolfo, Univ of Illinois.
Lava-dome growth; pyroclastic-flow deposits spawn destructive lahars and secondary explosions
The following is from a report by PHIVOLCS. The powerful explosive eruption of June 1991 deposited about 9 km3 of material, forming a caldera about 2 km in diameter and 650 m deep. Rain from the succeeding wet season partially filled the caldera, forming a shallow lake of about 1 km2 (figure 26).
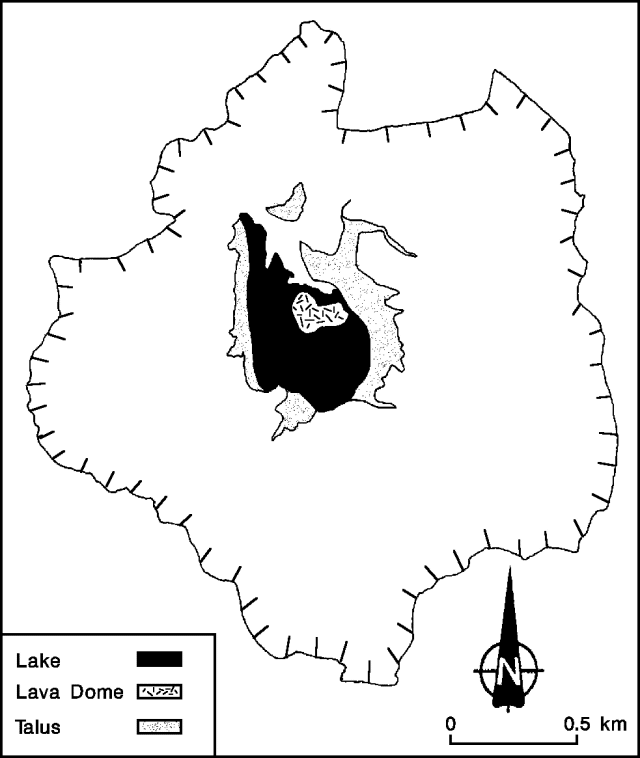 |
Figure 26. Sketch of the caldera at Pinatubo, 2 September 1992. The lava dome is shown near the center of the caldera lake. Talus from the walls encroaches on the lake shore. Courtesy of PHIVOLCS. |
Summit activity and seismicity, 1 July-15 October 1992. Pinatubo showed signs of renewed activity beginning in early July 1992, when low-frequency earthquakes and tremor, indicating movement of magma to shallower levels beneath the caldera, increased and began to dominate the seismic records. By 9 July, phreatic explosions near the center of the caldera lake had built an ash cone 100 m in diameter that extended 5 m above the lake surface. Lava extrusion then began, and by 14 July, a dome 100 m across and 10 m high had grown near the center of the ash cone, which had widened to around 200 m. COSPEC measurements during the 2nd week in July recorded SO2 emission rates of 150-600 t/d. By 22 July, the lava dome had grown to 200-250 m in diameter and 50 m high.
Another increase in the number of low-frequency earthquakes was recorded 6-9 August (figure 27), coinciding with a decrease in the SO2 emission rate to around 250 t/d, from 800-900 t/d during the last week in July and the beginning of August. Similar patterns were noted several days before the 1991 explosive eruptions (although the SO2 flux was about 3-5 times higher in 1991), probably because rising magma clogged the path of escaping volcanic gases. Because of these similarities, on 9 August PHIVOLCS announced the possibility that an explosive eruption might occur within a week. By 11 August, the dome had reached 300 m in N-S dimension and approximately 100 m height. Part of the crater floor on the N side of the dome was uplifted, possibly indicating that most of the dome-building activity was concentrated there. The activity did not lead to an explosive eruption, and the unrest seemed to subside 11-16 August as the number of earthquakes decreased. SO2 emission rates ranged from 650 to 1150 t/d 13-16 August, but decreased again to around 220 t/d by 23 August.
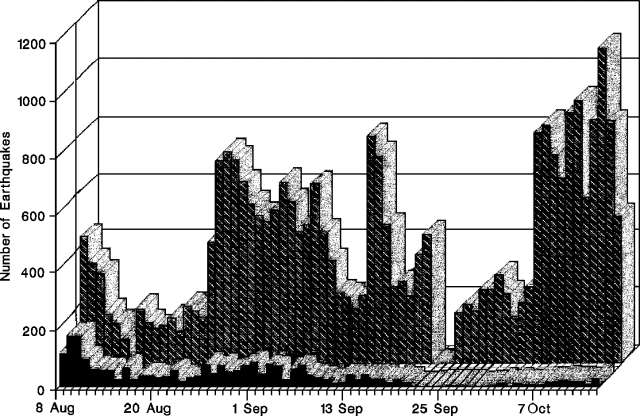 |
Figure 27. Number of earthquakes recorded at Pinatubo by a seismic station (CRAZ) on the caldera's N rim, 8 August-14 October, 1992. Courtesy of PHIVOLCS. |
Seismic activity increased again in late August, and has continued since then at a high level. The seismograph (CRAZ) installed on the caldera's N rim on 7 August has recorded at least 200 earthquakes/day, and daily counts reached as many as 1,100 (during the second week in October). Seismic records were dominated by low-frequency events. Because of the sustained high level of seismicity, the possibility of explosive eruptions persists.
Dome growth has occurred intermittently. By 26 August, the caldera floor on the E side of the dome was uplifted, and dome-building activity shifted to that side. The E-W dimension of the dome was about 340 m by 2 September. Talus deposition from heavy rains at the end of August has caused encroachment of the E shore of the lake toward the dome (figure 26). Continued rains during the first two weeks in September caused further encroachment of the E shoreline, filling the E part of the lake. The dome's size was estimated at 300 m N-S and 400 m E-W on 25 September. SO2 flux measured that day remained low at 290 t/d.
Lahars. Rains spawned by typhoons and the southwest monsoon triggered small to moderate lahars during June and July along channels of the following rivers: O'Donnel-Tarlac (NE flank); Sacobia-Bamban (E flank); Pasig-Potrero (SE flank); Marella-Santo Tomas (SW flank); and Bucao (NW flank) (figure 28). Almost all of the lahars along these rivers were confined within their channels and did not cause significant damage. No lahars flowed down the Abacan River (E flank) because it had been cut off from pyroclastic-flow deposits in its headwaters by the effects of a secondary explosion on 4 April.
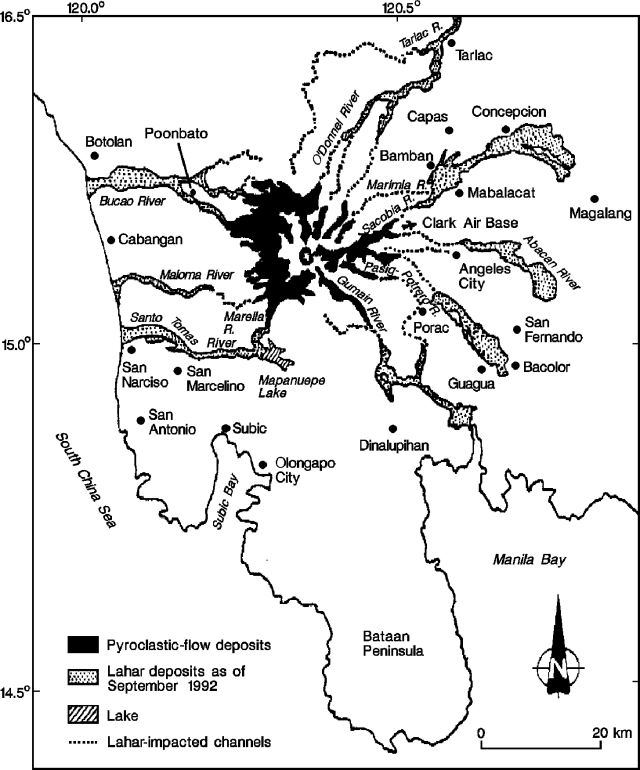 |
Figure 28. Sketch map showing Pinatubo's major drainages, and their pyroclastic-flow and lahar deposits as of September 1992. Courtesy of PHIVOLCS. |
Typhoons passing across N Luzon and normal monsoonal rainfall triggered larger lahar flows in August and September that caused casualties and damage in several barangays (communities). On the E side of the volcano (along the Sacobia-Bamban River), lahars buried the northern barangays of the Mabalacat area to 3-4 m depth and parts of the Bamban area to 1-3 m depth between 28 and 30 August. The section of the Bamban River channel near the bridge connecting the towns of Mabalacat and Bamban was aggraded by 4.5 km of lahar material, and the bridge's floor was covered by 0.5 m of lahar deposits. The town of Bamban was also affected by flooding caused by breaching of a natural dam in a tributary of the Bamban River (the Marimla), made by lahar deposits that had come down the Sacobia River. On 3-5 September, lahars in the Sacobia-Bamban drainage destroyed the NE-corner fence of Clark Air Base and inundated a barangay near Mabalacat (Dolores) to 2-4 m depth. The 29 August lahars along the Pasig-Potrero River were initially confined within the channel, bounded by earthen dikes. However, aggradation of the channel allowed succeeding lahars to escape and flow west, outside the channel. A barangay (Mitla) near Porac was buried by 3-4 m of lahar deposits. Subsequent lahars on 3-4 September again affected Mitla, and 3 other barangays in the Santa Rita area.
Only muddy streamflows occurred along the Porac and Gumain rivers (SE flank) during the 1992 rainy season. At the height of monsoon rains on 20 August, thick 1991 lahar deposits along the Gumain River caused the diversion of the majority of the muddy streamflow southward (toward the Caulaman River), eventually causing flooding in the Dinalupihan area.
On the W flank, significant lahar episodes occurred along the Marella-Santo Tomas River on 18-20 August, and 4 and 21 September. The 18-20 August lahar episodes caused a 7-m aggradation near the junction of the Marella and Mapanuepe Rivers. The 4 September lahars buried a barangay (Dalanawan), 0.5 km downstream from the river junction, to 4 m depth, and eroded the river's S bank by 15-20 m at a barangay (San Rafael) 7 km downstream. The 21 September lahar deposited an additional 1.5 m at Dalanawan. Along the Bucao River (NW flank), the most significant lahar episode, on 20 August, buried Poonbato to 4.5-5 m depth.
The Dept of Social Welfare and Development and the National Disaster Coordinating Council reported lahar casualties of 6 dead and 6 injured during the 1992 rainy season. Totals of 1,665 and 47 houses, respectively, were destroyed in Pampanga and Zambales provinces.
Secondary explosions. Rainfall onto still-hot pyroclastic-flow deposits triggered numerous secondary explosions, some of which produced light to heavy ashfall on areas surrounding the volcano, but did not cause any significant damage. The largest of these fed columns that rose more than 18 km (table 7).
Table 7. Summary of the largest secondary explosions from pyroclastic-flow deposits at Pinatubo, July-September 1992. Courtesy of PHIVOLCS.
| Date | Column Height | Location |
| 13 Jul 1992 | 4 km | Sacobia pyroclastic fan (NE flank). Secondary pyroclastic flow along the Pasig-Potrero River. |
| 19-20 Aug 1992 | 6.4, 7.6, and 5.4 km | Sacobia pyroclastic fan (NE flank). Ashfall at Clark Air Base (CAB). |
| 27-31 Aug 1992 | 4-13 km | Sacobia pyroclastic fan (NE flank) (7 episodes). Ashfall at Clark Air Base. |
| 02 Sep 1992 | 12 km | Sacobia pyroclastic fan (NE flank). Ashfall at Clark Air Base. |
| 04 Sep 1992 | 15 km | Near headwaters of O'Donnell and Bucao Rivers (N-NW flank). Ashfall to 45 km NE. |
| 15 Sep 1992 | 18 km | Marella pyroclastic fan (SW flank). Ashfall W and SW (affecting San Marcelino, San Narciso, San Antonio, and Subic). |
| 21 Sep 1992 | 18.2 km | Sacobia pyroclastic fan (NE flank). Ashfall to SW. SE, and NE, including 2 hours at Manila. |
| 25 Sep 1992 | 12.2 km | Sacobia pyroclastic fan (NE flank). Ashfall at Clark Air Base, San Marcelino, and Castillejos. |
Information Contacts: PHIVOLCS.
Seismic activity continues
Volcanic activity continues at Pinatubo. The following summarizes activity recorded in two 24-hour periods.
For the 24-hour period starting at 0600 on 02 March, a seismometer located 9 km SE of the crater recorded 17 high-frequency volcanic earthquakes. During the same period, a seismometer on the N rim recorded 18 high-frequency and 1 low-frequency volcanic earthquakes. The seismometer on the rim continued to record the small-amplitude low-frequency harmonic tremor that began 23 February. The tremor is similar to the tremor episodes associated with the volcano's dome building activity in July 1992, and indicates vertical movement of magma. During a 24-hour period beginning at 0600 on 19 March, 16 high-frequency and 2 low-frequency events were detected by the seismometer 9 km distant, while 12 high-frequency events and no low-frequency harmonic tremor were recorded. Weak to moderate emissions of white steam reaching heights 200-500 m above the caldera rim were observed from Clark Air Base on the morning of 19 March.
Steve O'Meara observed the caldera during an overflight on 8 March (figure 29). "The SW caldera floor was covered with a kidney-bean-shaped green lake, of which a portion is stained grayish black. The discoloration might have been from recent ash deposits or from runoff entering the lake from the caldera walls (though there does not appear to be any rivulets associated with that particular section of the lake). A striking black river with golden edges cuts through the talus SE of the dome. The N caldera floor was covered with what appeared to be a fresh layer of gray ash covering the talus, which was dappled with explosion pits. A steaming, black dome complex with at least three major lobes rose above the central floor. The dome's active portion had a tall spine. Several steaming cinder cones and remnant explosion pits were visible, and one of the pits contained a green pond. The smell of sulfur gases was intense above the cinder cones."
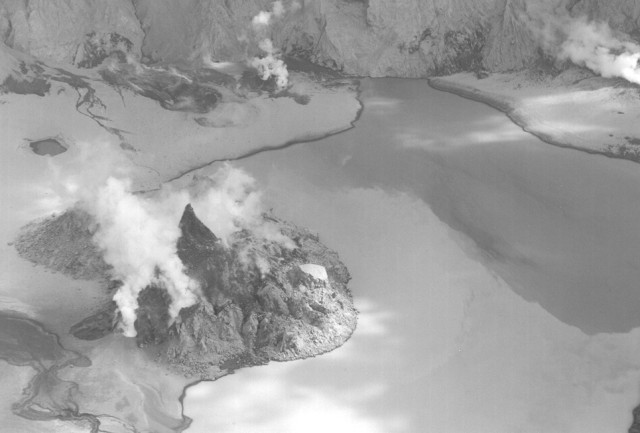 |
Figure 29. Photograph of the crater of Mount Pinatubo looking SE, 8 March 1993. Courtesy of Stephen O'Meara. |
Pinatubo erupted violently in June 1991, killing more than 700 people. The Philippine Institute of Volcanology and Seismology is maintaining Alert Level 3 at Pinatubo, warning that an explosive eruption is possible. Recommendations to avoid the 10-km radius "danger zone" around the volcano remain in effect.
Information Contacts: PHIVOLCS; Stephen O'Meara, Sky & Telescope, MA.
Rainy season causes renewed lahar activity and secondary explosions
Another monsoon season, with the renewed threat of secondary explosions and lahars from the slopes of Mt. Pinatubo, began in early June. Secondary explosions occur when rainwater percolates into hot deposits of ash and pyroclastic materials from the 1991 eruption; the rainfall and explosions often trigger lahars. Five major river drainages (figure 30) served as channels for lahars during the 1993 rainy season: O'Donnell-Tarlac (NNE), Sacobia-Bamban (NE), Pasig-Potrero (SE), Marella-Santo Tomas (SW), and Bucao-Balin Baquero (NW). No lahars flowed down the Abacan River (E) because it has remained cut off from the pyroclastic-flow source. Based on flow sensor records, the most active channels during this rainy season were the Sacobia-Bamban and the Bucao-Balin Baquero rivers, each with 26 lahars. The O'Donnell, Pasig-Potrero, and Marella-Santo Tomas rivers had 18, 15, and 14 lahar events, respectively.
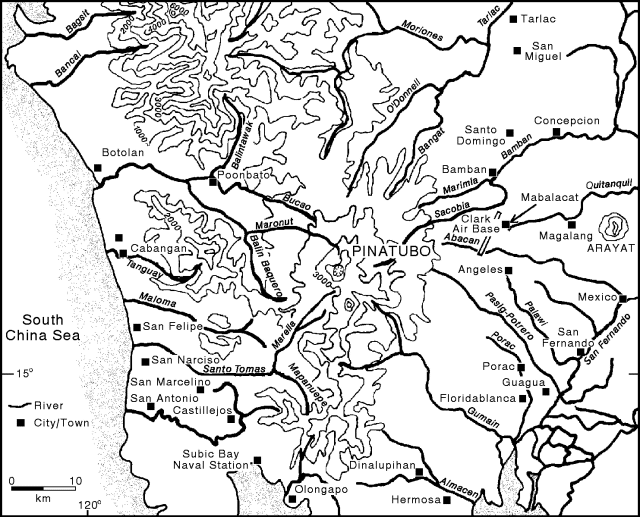 |
Figure 30. Map of Pinatubo and the surrounding area showing approximate locations of selected towns and rivers prior to the June 1991 eruption. Mapanuepe Lake has since replaced the Mapanuepe River. |
A thunderstorm on 5 June caused a secondary phreatic explosion that generated an ash plume to a height of about 1,500 m. Another storm on 7 June caused an explosion, and some sediment was observed in the Sacobia River. However, neither storm triggered significant mobilization of debris. On 26 June, typhoon-generated lahars along the Marella-Santo Tomas River caused 1-5 m of aggradation along some portions of the channel and buried parts of 3 barangays (communities) in San Marcelino (about 30 km SW of the summit) with 10-30 cm of debris. These moderate lahars on the W slope prompted precautionary evacuations in late June. Areas in Pampanga and Tarlac provinces were also evacuated because of flooding along the Sacobia River, which has been filled with lahar deposits over the past 2 years.
On 2 July, intense local rainshowers triggered lahars to the NE along the Sacobia-Bamban River, causing lateral erosion along villages N of the Clark Air Base perimeter fence, and destroying several houses. Farther downstream, 1-m-high dilute lahars deposited 50 cm of debris at a barangay 3 km E of Mabalacat. Along the Pasig-Potrero river (SE), the lahars were mostly channel-confined until escaping through an unfinished portion of the S dike (because of a right-of-way problem with the landowners) into the N barangays of Santa Rita, 5 km NW of Guagua and 9 km WSW of San Fernando, causing burial of some areas.
Lahar events during the first half of August were mostly small. Larger and almost continuous flows, triggered by SW monsoon rains, occurred on 18-19 August along the five major channels. Monsoonal rains also triggered significant flooding in low-lying areas around Pinatubo. On the SE flank along the Pasig-Potrero River, several barangays were affected when initially channel-confined lahars overtopped 3-4 m dikes. Lahars escaped at the N bank near the site of the former Mancatian Bridge in Porac and buried some parts of a barangay. The flow then overtopped the S bank, passed along a tributary, and buried areas on the S side of Mancatian (~8 km SW of Angeles) under 2-m-thick deposits. Lahars continued to flow into Santa Rita barangays, 9-11 km downstream of Mancatian; these had also been affected by lahars in 1992.
Along the Sacobia-Bamban River on the NE slopes, the 18-19 August lahars caused 100 m of lateral erosion along the S bank at Marcos and Macapagal villages. Lahars to the NNE along the O'Donnel-Tarlac River were channel-confined and left deposits near the upper reaches before entering inhabited areas. On the SW side of Pinatubo, along the Marella-Santo Tomas River, the 18-19 August lahars caused 3-4 m of aggradation along some parts of the channel and buried a barangay in San Marcelino located on the S bank, inside the protective dike built before the start of the rainy season. Lahars also breached a 1.5 km section of the dike near San Rafael (5 km E of San Marcelino) and buried the Western Luzon Agricultural College site with 0.5-1.5 m of debris. The breached portion became a passageway for a significant volume of water from Mapanuepe Lake. As a result, parts of San Marcelino, Castillejos, and San Antonio were flooded for several days. The floodwaters also destroyed a highway bridge between Castillejos and San Marcelino. Along the Bucao River (NW), lahars were channel-confined and dumped debris far from inhabited areas.
Secondary explosions from hot debris deposits sent ash to about 15 km altitude at about 1210 on 19 August and prompted Significant Meteorological Event (SIGMET) warnings to aircraft in the vicinity. A cold plume was detected on satellite imagery near the volcano at 1331. It drifted SSW through 1631 when it became indistinguishable from the large cloud canopy of a tropical storm.
The Zambales Lahar Scientific Monitoring Group noted that the 18-19 August lahars along the Marella-Santo Tomas and Bucao-Balin Baquero river systems have created at least partial isolation for all Zambales towns because of the destruction of highway bridges, and that additional bridge failures must be anticipated. In SW Zambales, the damage was severe and the full extent of the consequences is unknown. As of 21 August, heavy outflow from the lahar-dammed Mapaneuepe Lake was pouring from a major breach in a dike along the S margin of the Santo Tomas River, causing serious problems for the towns of San Marcelino, San Antonio, and to a lesser degree, Castillejos. The very small but significant relief of terrain downstream of the breached dike makes hazard assessment very difficult; irrigation ditches may be invaded, becoming efficient lahar channels, and small roads built above the plain could fail and cause sudden shifts in flow directions.
Based on a report by the Regional Disaster Coordinating Council of Central Luzon, 97 houses were destroyed and 43 houses were damaged by the 18-19 August lahar events in the Pampanga province, mostly in the barangays of Porac near the Pasig-Potrero River, though residents had been evacuated prior to the lahars. In the province of Zambales, 575 houses were destroyed and another 372 damaged. Most of this damage was caused by lahars and floods along the Santo Tomas River system. Four deaths from the flooding were reported. Lahars during the second half of August and first half of September were mostly small and channel-confined. A Notice to Airmen (NOTAM) was issued on 25 August advising pilots to expect secondary explosions and avoid overflights of the volcano when they are occurring. Lahars on 29-30 August along the Sacobia-Bamban River (NE) deposited 50 cm of debris in barangay Sapang Balen, ~4 km SE of Bamban. A Volcanic Ash Advisory was issued from Australia on 5 September that referred to a secondary explosion at about 1330 that sent a plume above 3 km. Satellite imagery showed a possible small plume at about that time which tracked SW before being hidden in weather clouds after 1830. An 11 September lahar along the Pasig-Potrero River again affected a barangay in Santa Rita.
Information Contacts: Philippine Institute of Volcanology and Seismology, Philippines; R. Alonso, K. Rodolfo, and R. Tamayo, Zambales Lahar Scientific Monitoring Group, a cooperative effort of: Univ of Illinois at Chicago Dept of Geological Sciences, Philippine Dept of Environmental & Natural Resources, and the Univ of the Philippines National Institute of Geological Sciences, ZLSMG Headquarters, M6, Subic Bay Free Port, c/o Mayors Office, Olongapo, Philippines; Jim Lynch, SAB; U.S. Embassy, Manila; AP.
Lahars produced by typhoon rains cause additional damage
Lahar activity that began in late June following the onset of the rainy season continued in early October. Intense rainfall triggered lahars from the slopes of Mount Pinatubo on 4-6 October 1993. Flow sensors along the O'Donnell-Tarlac River (NE) detected lahar events at 0400-1800 on 4 October. Lahars along the Pasig-Potrero (SE) and Sacobia-Bamban (E) rivers occurred from about 2130 on 4 October to 0600 on 5 October. All three drainages had a second episode of lahar activity between 1630 on 5 October and 0830 on 6 October. The first episode was generated during westward passage of a typhoon over Luzon Island towards the South China Sea; the second was triggered when the same typhoon turned back towards NE Luzon. Another typhoon crossed Luzon from the South China Sea on 7 October and caused smaller lahar events in the late afternoon (1550-1920). On 4-7 October about 145 mm of rainfall was measured in the middle of the Sacobia Pyroclastic Fan, drained by the Pasig-Potrero and Sacobia-Bamban rivers.
Along the Pasig-Potrero River, an early morning debris flow on 5 October deposited 4-5 m of sediment near Mancatian (~8 km SW of Angeles, see 18:8 for map) and buried Mancatian Bridge 2 (400 m W of the main Pasig-Potrero channel) and tens of houses. An active flow that afternoon nearly overtopped the earthen dike along the channel. Erosion caused by debris flows near Mancatian on 6 October re-exposed the bridge. Deposition occurred farther downstream during the second episode. Lahars on 6 October overtopped the earthen dike about 6 km from the bridge between the villages of Mitla and Balas, depositing 3 m of debris in some barangays (communities) E and NE of Santa Rita (9-11 km downstream of Mancatian), and burying hundreds of houses. Lahar deposits downstream of the Pasig-Potrero River were 2.5-3.0 m thick in Mitla (in-channel), 0.5-3.0 m in San Basilio, 2.0-3.0 m in Balas and San Isidro, and 1.5 m thick in San Jose.
Lahars along the Sacobia-Bamban River on 4-6 October resulted in 5 m of deposition at Macapagal village, shifting the active channel 100 m N. Scouring near the original highway in Mabalacat during the early part of the 5 October lahar flows damaged portions of the Mabalacat dike. Flows that afternoon and evening resulted in 2.0-2.5 m of in-channel deposition and eroded the approach of the road connecting Mabalacat and Bamban. Deposition along the side of the dike lessened the freeboard to 1.6 m in the stretch about 600-700 m E of the hill where the dike was anchored. Field investigations on 7 October revealed 2-3 m of deposition at a barangay in Mabalacat. Muddy to hyperconcentrated stream flows reached as far as barangay San Roque, Magalang. Earlier events on 5 October deposited 30-40 cm of debris below the San Roque Bridge; vertical clearance is now only about 1 m. Sediments up to 10 mm thick were observed in the vicinity of barangay San Roque. Strong discharge of muddy stream flow about 200 m from the San Francisco Bridge outside the S dike has partially damaged some portions of the Concepcion-Magalang Road. No significant lahars were noted along the main channel at the San Francisco Bridge.
An aerial survey of the O'Donnell River on 13 October revealed fresh deposits down to Santa Lucia, 12 km from the headwaters. Significant deposition was observed along the stretch from Crow Valley (2 km from the headwaters) down to Santa Juliana, 8 km away.
The Zambales Lahar Scientific Monitoring Group (ZLSMG) noted that heavy runoff from Mapanuepe Lake (Santo Tomas-Marella drainage, SW) began to overtop the Santo Tomas protective dike in two places on the evening of 4-5 October. Near the abandoned Western Luzon Agricultural College, the dike that had been breached on 19 August and temporarily repaired was breached again to the W on the evening of 5 October. An E overtopping caused flooding of the highway along Magsaysay and in several villages, including Barangay Magsaysay and the town of Castillejos. As of 7 October, all the heavy Mapanuepe flow was passing through the gap and fanning through most of San Marcelino, causing flooding to depths of 2-4 m. Tens of thousands of people have been isolated by damage to the National Highway, and are facing continuing threats from lahars and flash flooding, particularly in Castillejos and San Marcelino. Vehicular traffic between Castillejos and San Marcelino was badly hampered by the flooding, and was impossible from San Marcelino to San Antonio and San Narciso. The dikes N and S of the Santo Tomas River are in very precarious shape, and floodwaters and dilute lahars from the Marella and Upper Santo Tomas River threaten the municipalities of San Felipe and San Narciso.
Massive debris flows into Barangay Santa Fe, triggered by heavy rains from the afternoon of 4 October through 6 October, caused three confirmed deaths, according to the ZLSMG. At least 11 others were missing and presumed dead as of 7 October, including nine people who were working in the middle of the lahar field on a private contract to manipulate the Marella and Mapanuepe drainages.
Information Contacts: Philippine Institute of Volcanology and Seismology, Philippines; R. Alonso, K. Rodolfo, and R. Tamayo, Zambales Lahar Scientific Monitoring Group.
Seismicity increases for 10 days then declines
Seismic activity significantly increased starting on 8 February and peaked at >200 high-frequency volcanic earthquakes on 11 February. The number of explosion earthquakes and duration of low-frequency harmonic tremor also increased during this period. Swarms of shallow volcanic earthquakes were recorded at the CRAZ station on the N caldera rim. Some of these events were also detected by the FNGZ station located 9 km SE of the caldera. Aerial surveys on 25 January and 8 February revealed phreatic cones and explosion pits on the NW shore of the lake and on the caldera floor near the N wall. The W half of the caldera lake also appeared muddy, but there was no sign of dome growth. These events are similar to those seen before the dome-building activity in July 1992, and may represent a continuation of that activity.
PHIVOLCS interpreted these observations as indicative of renewed movement of magma beneath the volcano that could result in lava-dome growth and small to moderate eruptions with columns < 6 km high. Because of this possibility, the hazard status was raised to Alert Level 3, indicating that eruptive activity as described above could occur within a period of weeks. COSPEC measurements of SO2 flux were attempted on 15 February, but were unsuccessful because the steam plume dissipated before rising above the crater rim.
Starting on 18 February, seismicity began to decrease. Explosion earthquakes and tremor gradually dropped to 0-2 events/day by 21 February, with no shallow earthquakes recorded at the CRAZ station. On 22 February the CRAZ station recorded 10 high-frequency volcanic earthquakes; the FNGZ station recorded 4. Low-frequency harmonic tremor was also recorded for 77 minutes. Thick cloud cover at the summit prevented visual observations of steaming activity. If seismicity continues to decrease through the first week of March, the hazard status will be lowered back to Alert Level 2. As a precaution against possible secondary explosions from the still-hot 1991 pyroclastic-flow deposits, the public continues to be advised to observe the 10-km-radius danger zone.
Information Contacts: PHIVOLCS.
No plume observed, but seismicity remains above background
Clouds generally obscured the summit of Pinatubo on 13-14 March, but during cloud breaks no plume was visible. Even though no plume has substantiated an increase in the rate of degassing, above-background seismicity has led PHIVOLCS to maintain Alert Level 3 status.
Pinatubo seismic stations—CRAZ, located on the N rim of the caldera, and FNGZ, located 9 km SE from the caldera—both operated in mid-March. During a 24-hour period beginning at 0600 on 12 March, CRAZ and FNGZ recorded 17 and 6 high-frequency earthquakes respectively; in the next 24 hours CRAZ and FNGZ recorded 238 and 50 high-frequency earthquakes. During the second interval FNGZ also recorded 4 explosions with maximum duration of 4 minutes; one of these explosions initiated 24 minutes of harmonic tremor. Explosions and harmonic tremor may signify magmatic degassing beneath the caldera.
The alert status of Pinatubo volcano has remained at Level 3 since February, indicating that eruptive activity could occur within a period of weeks. The 10-km-radius danger zone remains in effect as a precaution against possible secondary explosions from the still-hot 1991 pyroclastic-flow deposits.
Information Contacts: PHIVOLCS.
Monsoon rains generate lahars and secondary explosions
Lahars from the upper slopes of Pinatubo began again in June 1994, induced by monsoon rains. This volcanic hazard has been frequent in the drainages of Pinatubo during every monsoon season following its June 1991 eruption. Tropical cyclones brought continuous rains on the Pinatubo area in June. Lahars developed in the major drainage channels of the O'Donnell (NE), Sacobia (E), Pasig-Potrero (SE), Marella-Santo Tomas (SW), and Bucao (NW) rivers. On the SE flank, the lahar crisis was more dramatic along the Pasig-Potrero River because it had captured the upper reaches of the Sacobia River in October 1993. The following report, from the Philippine Institute of Volcanology and Seismology, summarizes lahar activity during June-August 1994.
The first lahars were noted on 23 June. Other lahars on 10 July caused damage in downstream villages. They passed under Mancatian Bridge 2 and then curved to the left side of the Pasig-Potrero channel towards Bancal, in barangay Maliwalu (figure 31). These lahars resulted in 2-3 m of deposition on the Mancatian area (from the Angeles-Porac Road to ~2 km upstream) and at least 2 m of in-dike deposition, decreasing to 1-m-thick deposits near Bancal.
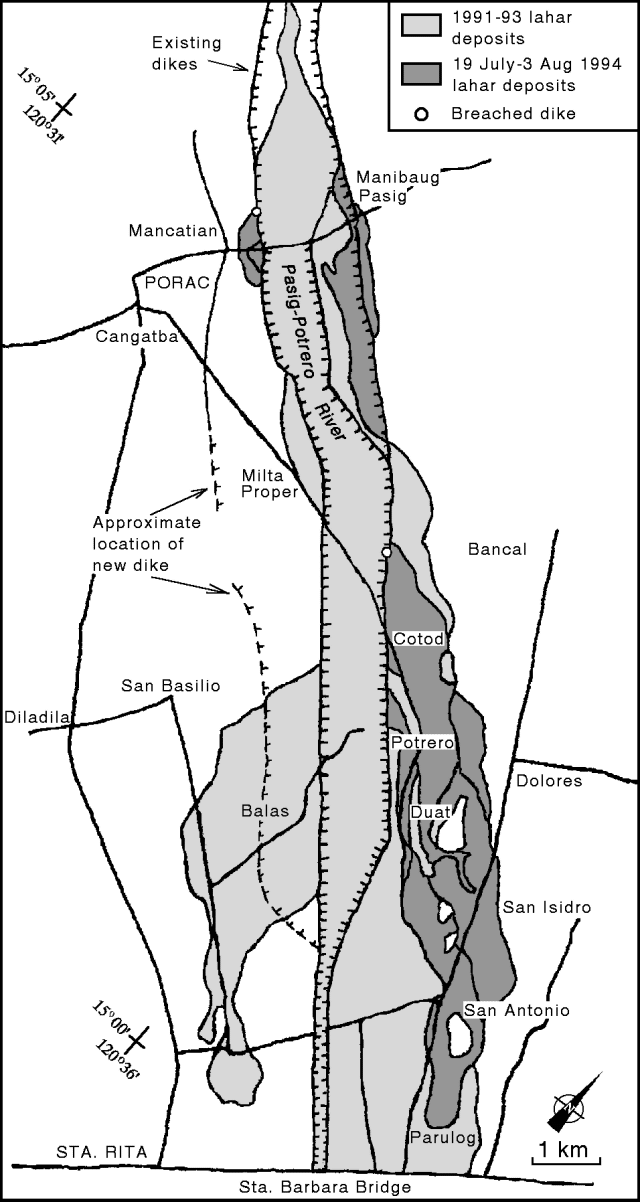 |
Figure 31. Pinatubo lahar deposit map along the Pasig-Potrero River between Mancatian and Santa Rita, 3 August 1994. Courtesy of PHIVOLCS. |
On 19 July, lahars cut through the Mancatian portion of the left dike and encroached on several houses at and near its outer base (figure 31). Aggradation on the left side of the channel forced the active channel to shift towards the right inner dike, so subsequent lahars (25 July) aggraded the right portion of the diked area. Average aggradation along the Mancatian area was ~3 m. Succeeding lahars (26 and 30-31 July) overtopped and breached the inner right dike ~600 m upstream from the road. The breach allowed the lahars to bury areas outside of the inner dike with 2 m of debris. Downstream, strong lahar flows (even as early as 19 July) breached the left dike at Bancal. The breach, ~100 m wide, allowed the lahars to be delivered as far as barangay San Antonio, Bacolor. The bulk of the lahars that passed through the breach were deposited at barangays Potrero and Cotod. Deposits in these areas were as thick as 4 m, especially very near the dike. Deposits in barangay San Antonio and Duat areas were 20-100 cm thick.
Significant deposition in the Mancatian area along the right side of the channel shifted the active flow back towards the left side of the channel so that by 1 August the lahars were again battering the left dike. The active channel maintained this course as of early September.
The passage of Typhoon Ritang on 6-7 August did not bring much rain over the Pinatubo area. However, the lahars generated filled the Pasig-Potrero River from the Delta 5 watchpoint (figure 32) to barangay Mancatian, and caused additional deposition at the alluvial fan area. In-channel aggradation left only a few meters of freeboard along some of the channel and lahars overflowed at the left bank, near the base of Delta 5. The overflowing lahar buried part of an old fan area between Pasig-Potrero River and Sapang Ebus (Taug River) with 0.2-2.0 m of debris. The overflow started on the afternoon of 6 August. The Typhoon Ritang lahars that were conveyed all the way down to the alluvial fan reaches had observed discharges of 60-300 m3/s upon reaching Mancatian. These laminar lahars further aggraded the Cotod and Potrero area by 50-100 cm.
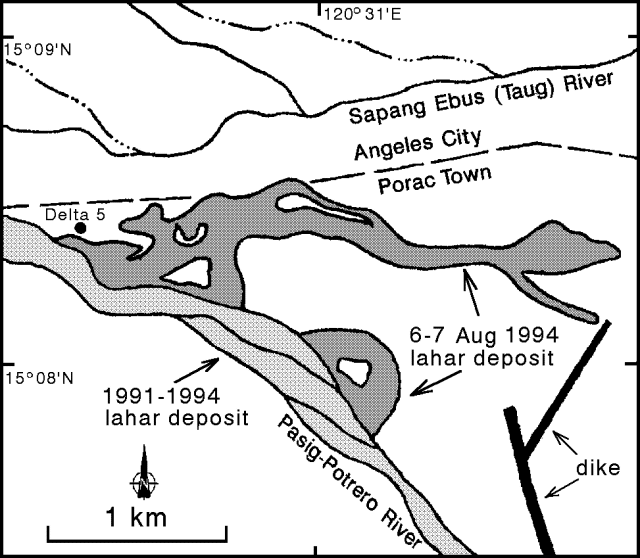 |
Figure 32. Pinatubo lahar deposit map between the Pasig-Potrero River and Sapang Ebus, 17 August 1994. Courtesy of PHIVOLCS. |
After Typhon Ritang and beginning on 8 August, lahars continuously flowed in the Pasig-Potrero River. These non-streaming hyperconcentrated streamflow lahars had an average discharge of 6 m3/s at Delta 5 and 3 m3/s at Mancatian. It is suspected that these lahars were triggered by the breaching of a lake, because no rainfall was recorded by the Upper Sacobia rain gage during 8-16 August. Lahars with the same characteristics were observed in 1991 and 1992 during the release of water from lakes formed on the pyroclastic-flow field by the damming of tributaries with lahar and secondary pyroclastic-flow deposits.
On 16 August, shortly after a large secondary explosion and possibly a secondary pyroclastic flow on the Sacobia pyroclastic-flow field, lahars in the Pasig-Potrero River suddenly ceased and the river became dry. Debris from the secondary pyroclastic flow might have temporarily dammed the river because continuous lahars resumed on 20 August. Aerial surveys on 19 and 30 August revealed several lakes, the biggest of which was in the same location as the 1992 lake. A breach on the outer left dike ~500 m downstream of the Angeles-Porac road allowed these continuous non-rainfall lahars to be delivered and deposited at the alluvial fan area outside of the dike. The accumulation of sediment caused extensive damage outside of the left dike from Barangay Manibaug-Pasig down to Barangay San Antonio in Bacolor, Pampanga.
Information Contacts: R. Arboleda and M. Matinez, PHIVOLCS.
Alert status raised following increased seismicity in early January
On 7 January an explosion-type earthquake with a duration of 6 minutes and 40 seconds was recorded, beginning around 0506. This event was followed about 30 minutes later by low-frequency harmonic tremor that continued through 16 January. Seven high-frequency volcanic earthquakes were also recorded. A total of 16 explosion-type events and nine episodes of low-frequency harmonic tremor indicates shallow magma activity beneath the crater. Three high-frequency volcanic earthquakes were recorded on 9 January. Because of this seismicity, the alert status was raised to Alert Level 2 (magma intrusion). Although a heightened alert status was declared, PHIVOLCS believed that explosions would likely be confined to the caldera and no enlargement of the danger zone was made at this time.
Again on 10 January two high-frequency volcanic earthquakes were recorded, followed by one the next day. During an overflight on 11 January a barely recognizable explosion pit was observed at the N side of the 1992 lava dome; it is probably the site of the small phreatic explosions on 7 January 1994. Only weak emission of white steam was observed along pre-existing vents formed after the 1991 eruption. The number of daily explosion-type earthquakes increased during the next few days (events in parentheses): on 12 (11), 13 (7), 14 (15), 15 (30), and 16 January (15). Low-frequency harmonic tremor persisted throughout this period.
Information Contacts: R. Punongbayan and E. Corpuz, PHIVOLCS.
Lahars and a secondary explosion reaching over 9 km in altitude
In the first half of July, a secondary explosion and several lahars occurred on Pinatubo's flanks. An 11 July secondary explosion vented from a still-hot pyroclastic-flow deposit in the Sacobia fan, escaping at a spot ~10 km NE of the active crater. The phreatic explosion was apparently triggered when recently introduced rainwater penetrated into the pyroclastic-flow deposit's interior and flashed into steam. The explosion, first noted by PHIVOLCS at 1506, subsided by 1624. The means of initial detection was unreported, but it was apparently not based on seismic signals.
The plume associated with the explosion reached 9-10 km in altitude. PHIVOLCS reported that ashfall was mainly toward the ENE. Light ash fell at the former Clark Air Force base (~25 km ENE) and nearby, but ash was absent at the town of Dinalupihan, 35 km SSE.Because the eruption did not issue from the volcano itself, PHIVOLCS did not change Pinatubo's hazard status or the 10-km-radius danger zone.
Cloud cover prevented analysts at the NOAA Synoptic Analysis Branch from sighting a plume on GMS satellite imagery. They could determine that winds at 7.6 km altitude blew at ~46 km/hr to the WSW. News of a plume to 9 km altitude from aviation sources prompted them to issue an abbreviated volcanic hazards alert, and the NOAA National Meteorological Center (NMC) to run the VAFTAD plume trajectory model (BGVN 19:06) for dissemination over weather distribution systems and display on the Internet. Both the hazards alert and the plume trajectory model served to alert pilots, air traffic controllers, and airline dispatchers of the potentially hazardous plume.
Besides using NMC forecast meteorology, the input parameters for the modelling run included Pinatubo's active crater coordinates, and an assumed hour-long sustained eruption to 9 km. In essence, the run suggested that after about 12 hours in the 0-6 km altitude range the ash plume was widely dispersed and included the area to the ENE where ash was found on the ground.
At higher altitudes (6-11 km), the model suggested a gradual drift of the ash plume, primarily toward the W and SW. Although this higher altitude result was not confirmed by ground observations, it suggests possible westward transport of suspended particulates that may have only fallen in amounts too small to detect with simple field techniques.
Lahars came down the SE-flank Pasig-Potrero river twice on 7 July, once on 9 July, and twice on 11 July. Some lahars reached 3-4 m in thickness, breaching inner dikes and thinning the line of defense for San Fernando, a settlement 40 km SE of Pinatubo (at the confluence of the Palawi and San Fernando rivers).
Lahars have followed these and other drainages (BGVN 18:08, 18:09, and 19:08) during every rainy season since the paroxysmal 15 June 1991 eruption. PHIVOLCS expects that both secondary phreatic explosions and lahars will recur as the monsoon season continues.
Information Contacts: Emmanuel G. Ramos, Deputy Director, Philippine Institute of Volcanology and Seismology (PHIVOLCS), 6th Floor, Hizon Building, 29 Quezon Avenue, Quezon City, Philippines; Grace Swanson and Jim Lynch, NOAA/NESDIS Synoptic Analysis Branch (SAB), Room 401, 5200 Auth Road, Camp Springs, MD 20746, USA; Nick Heffter, NOAA Air Resources Laboratory, SSMC3, Room 3151, 1315 East West Hwy, Silver Spring, MD 20910 USA.
Lahars force evacuations of 15,000 people
Continuous and intense rainfall during 28-30 July caused by the passage of a tropical storm triggered moderate to large lahars on the slopes of Mt. Pinatubo along the O'Donnell (NNE), Pasig-Potrero (SE), Santo Tomas-Marella (SW), and Bucao (NW) rivers. Minor lahar deposition along the middle and lower reaches of the O'Donnell, Santo Tomas-Marella, and Bucao river systems was confined to previous lahar-affected areas. Flooding along the inner-side of the secondary dike along the Santo Tomas River and potential isolation forced residents of Barangay Rabanes to move to a temporary evacuation center at Barangay Consuelo, both located in the town of San Marcelino, Zambales.
The greatest impact of the 28-30 July lahars was along the Pasig-Potrero river system. About 30 million cubic meters of lahar debris was deposited over a 12 km2 area (figure 33). About 25% of the sediment volume was derived from erosion of previously emplaced lahar deposits. Twenty three houses were buried under 1-4 m of debris, forcing >15,000 residents from the towns of Porac and Bacolor to evacuate. Lahars also disrupted traffic and resulted in temporary closure of the Angeles-Porac Road and the Olongapo-Gapan National Road. Geomorphologic changes along the Pasig-Potrero River included the incision of a 10-m-deep by 100-m-wide channel extending 5 km downstream from the Delta 5 watchpoint (15.5 km from Pinatubo), and net deposition starting 2 km upstream of the Angeles-Porac Road (20 km from Pinatubo) and extending 15 km downstream.
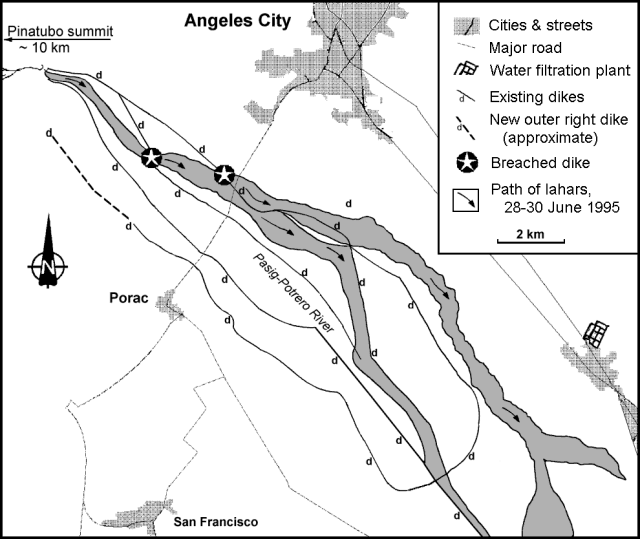 |
Figure 33. Map of the recent lahars at Pinatubo, 30 July 1995. Courtesy of PHIVOLCS. |
In a 2 August Deutsche Presse-Agentur news report, the director of PHIVOLCS stated that at least US $4 billion would be required to hold back the lahars. This figure was used by Ray Punongbayan to give the local residents a perspective of the total cost to build a properly engineered dike system to manage four active lahar channels. The estimate was based on costs to build concrete dikes in the United States and Japan, at US $1 billion per river system.
The June 1991 eruption left abundant unconsolidated ash deposits that have been mobilized as lahars in each subsequent monsoon season. Lahars occurred in the first half of July, and a secondary explosion 10 km from the crater on 11 July sent a plume to 9-10 km altitude (BGVN 20:06).
Information Contacts: J.V. Umbal, P.J. Delos Reyes, and N.M. Tungol, Philippine Institute of Volcanology and Seismology (PHIVOLCS), Department of Science and Technology (DOST), 5th & 6th Floors Hizon Building, 29 Quezon Avenue, Quezon City, Philippines; Deutsche Presse-Agentur.
Rainfall during October-November 1995 typhoons generates floods and lahars
Intense and prolonged rainfall, associated with the passage of two typhoons on 1 October and 3 November 1995, triggered lahars and floods along the Pasig-Potrero River.
On 1 October 1995, Typhoon Mameng delivered 337 mm of rain on the Sacobia pyroclastic fan triggering five distinct and fairly continuous lahar episodes over a 14-hour period. The largest episode had an estimated peak discharge of 400 m3/sec at Mancatian, Porac. Within each episode were discrete peak readings that could be generated by several causes: variations in rainfall intensity and duration, bank caving, repeated damming and breaching along channel constrictions, as well as any combination of these. Flows were described as steaming at observation point Delta 5 (15.5 km from Pinatubo), but progressive dilution through the incorporation of older materials cooled the flows to ambient temperature by the time they reached Bacolor.
The Typhoon Mameng deposit can be distinguished from earlier lahar deposits by the abundance of pebble to boulder-size clasts rip-ups of older, pre-1991, eruption materials scoured from the channel. The Mameng deposit was provisionally classified in two distinct debris flow units: a gray pumiceous, pebbly sand unit (A), and a brown, lithic-rich, coarse gravel unit (B). Unit A occurs as small overbank deposits at Mancatian, and as laterally extensive coalescing lobes from San Antonio, Bacolor down to the Gapan-San Fernando-Ologampo (GSO) road. Its occurrence as an overbank facies at Mancatian suggests that this unit correlates to the above mentioned peak flow episode. Unit B corresponds to subsequent flows and waning episodes: it occurred as in-channel, gravel terrace deposits from Delta 5 observation point downstream to the GSO road, and from thereon as an overbank facies where it overlaid unit A.
A total area of 25 km2 was buried beneath 0.5 to 6 m thick of sediment. An estimated sediment volume of 50 x 106 was deposited during these events, with roughly 40% consisting of either old, pre-1991 eruption deposits or post-1991 eruption lahar materials.
On 3 November 1995, 150 mm of rain fell on Mount Pinatubo with the passage of Typhoon Rosing. Lahars observed at Delta 5 watch point were relatively cold hyperconcentrated flows, based on the absence of steaming. Estimated peak discharge was about 120 m3/sec. Based on flow sensor data from the Pasig-Potrero river, the peak flow was channel-confined down to the GSO road and lasted ~2.6 hours. It eroded ~30 m of the left bank along the Porac-Angels Road. Sediments were mostly clayey remobilized Mameng deposits.
Former flows had already filled the stretch of the channel at a point 2 km upstream of the GSO road down to the S portion of Bacolor. When the peak flow reached the channel-filling stage, it caused flows to bifurcate and incise a new channel (figure 34) ~50 m W of the typhoon Mameng channel. Average in-channel deposition was 2 m thick; average overflow deposition, ~0.3-m thick. Overflow units were observed along the banks of the previous channel along the GSO road and leveled to a recently emplaced steel bridge. Flows reached farther downstream causing flooding and siltation near Mesalipit and Tinajeros. The other channel backflowed following considerable aggradation along the GSO road. The new channel delivered muddy flows that induced flooding and siltation in the W portion of San Fernando, particularly in the Barangays of St. Nino and St. Lucia.
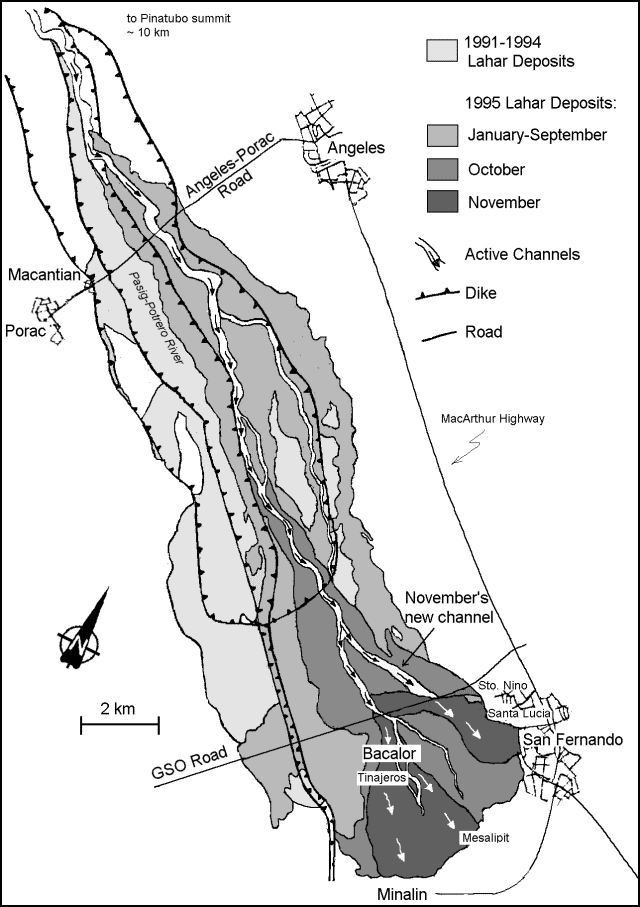 |
Figure 34. Map of the 1991-95 lahars at Pinatubo. Courtesy of PHIVOLCS. |
Lahars have occurred during every rainy season since the eruption of 15 June 1991. Pinatubo's last reported lahars were triggered by the heavy rainfalls of July 1995, when 30 x 106 m3 of debris, deposited over a 12 km2 area, forced mass evacuation of Porac and Bacalor (BGVN 20:07).
Information Contacts: Raymundo S. Punongbayan, director, Philippine Institute of Volcanology and Seismology (PHIVOLCS), Department of Science and Technology, (DOST), 5th & 6th Floors Hizon Building, 29 Quezon Avenue, Quezon City, Philippines.
Likely 2001 overflow controled by cross-rim trenching
Pinatubo's catastrophic 1991 eruption left the volcano with a 2.5-km-wide summit caldera that eventually came to contain a lake (table 8). During 2001 a crisis occurred as the lake's surface neared the low point on the caldera's rim. PHIVOLCS provided a detailed report on trenching and release of lake water to avoid catastrophic breakout of the crater lake. The report that is summarized here was authored and contributed by Ma. Antonia V. Bornas and the Quick Response Team. The brief version given here omits the lengthy list of Team members as well as several figures and the references.
Table 8. Pinatubo crater-lake-water surface level through time and computed monthly and average lake-rise increments. See the original report for data sources. Courtesy PHIVOLCS.
| Date | Elevation | Maraunot freeboard | Monthly average | Cumulative monthly average | Annual average |
| June 1991 | 780.0 | 180.00 | -- | -- | -- |
| June 1995 | 830.0 | 130.00 | 1.042 | -- | 12.50 |
| June 1997 | 855.0 | 105.00 | 1.042 | 2.083 | 12.50 |
| 07 May 1998 | 915.0 | 45.00 | 5.455 | 7.538 | 65.45 |
| 27 Apr 1999 | 933.0 | 27.00 | 1.589 | 9.127 | 19.06 |
| 10 May 2000 | 942.0 | 18.00 | 0.726 | 9.853 | 8.72 |
| 28 Jun 2000 | 944.0 | 16.00 | 1.250 | 11.103 | -- |
| 05 Aug 2000 | 945.7 | 14.30 | 1.339 | 12.442 | -- |
| 16 Aug 2000 | 945.9 | 14.10 | 0.541 | 12.982 | -- |
| 16 Sep 2000 | 948.4 | 11.60 | 2.500 | 15.482 | -- |
| 13 Oct 2000 | 948.7 | 11.35 | 0.278 | 15.760 | -- |
| 23 Nov 2000 | 949.2 | 10.78 | 0.432 | 16.192 | -- |
| 27 Dec 2000 | 949.7 | 10.33 | 0.500 | 16.692 | -- |
| 27 Jun 2001 | 953.5 | 6.50 | 0.638 | 17.330 | -- |
| 11 Jul 2001 | 955.0 | 5.00 | 1.327 | 18.657 | 15.17 |
| Average | -- | -- | 1.166 | -- | 13.23 |
Mount Pinatubo's summit caldera lake surface rose 40 m between May 1998 and July 2001. By July 2001 lake water approached the caldera rim's lowest point, the Maraunot Notch (~960 m elevation). Its surface then stood at 955 m elevation, 5 m below the notch.
The record of the crater lake's rise implied overtopping of Maraunot Notch in the last quarter of 2001. A breach at Maraunot could lead to rapid escape of lake water into an area of abundant unconsolidated pyroclastic deposits (figure 35). Such an event would threaten upriver towns as well as the larger Botolan, Zambales (population ~40,000).
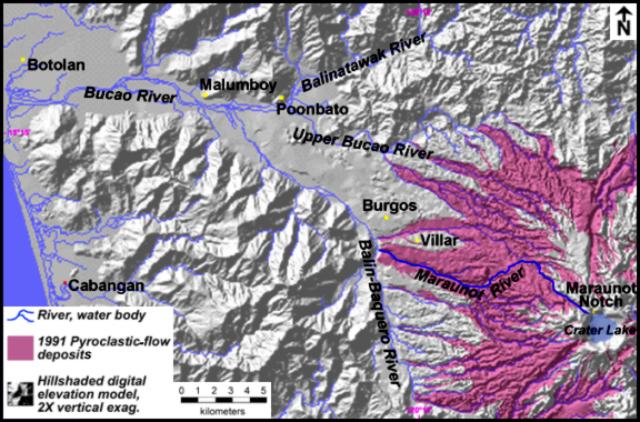 |
Figure 35. Digital terrain map of the NW Pinatubo quadrant, showing the Maraunot Notch and the contiguous Maraunot-Balin-Baquero-Bucau river system. Botolan town proper and upriver villages are shown. Digital elevations are from the PHIVOLCS-GIS lab. Sources include USGS (1991), Philippine Bureau of Mines (1983), and Fire and Mud (1996). Courtesy PHIVOLCS. |
The beheaded upper Maraunot river sits on the NW flank (figure 36) and flows 15 km NW into the Balin-Baquero river. Lahars have long threatened to inundate Botolan town proper. As with the 1991 pyroclastic flows, lahars obliterated villages in the Balin-Baquero and Bucao valleys (e.g. Villar, Burgos, and Poonbato).
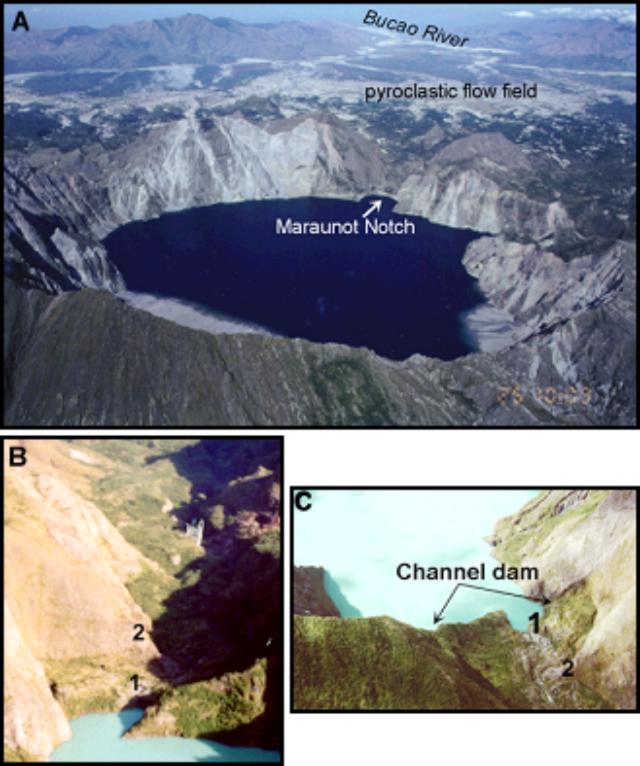 |
Figure 36. Oblique aerial photograph showing the Pinatubo crater, the Maraunot Notch, and the Maraunot-Bucao river system (looking NW) as seen in 2000. Photo courtesy of S. Suto, PHIVOLCS. |
Notch and dam characteristics. The valley of the Maraunot Notch contains 150-m-high walls composed of dome rocks and lithified block-and-ash deposits, cut by steep NW- and E-trending faults. Dome rocks also crop out within the first kilometer-long reach of the Maraunot channel and are inferred to form its bedrock. Less competent deposits fill the valley floor and edge off abruptly at the crater, damming the crater lake. This dam is approximately 85 m wide at the edge or crest but narrows as it slopes 8° down-valley to its toe at a prominence of dome rock 70 m away and 10 m below the crest (the nose).
Comprising the dam are a lower pre-1991 terrace of three boulder-rich breccia units and an upper sequence of 1991 deposits. Pre-1991 breccia units are poorly indurated and contain dense dacite-andesite clasts (median diameter, 10-15 cm) in coarse (B1) or fine (B2) ash or coarse sand (B3) matrix. Exposures of the dam in 1998 indicated that pre-1991 breccia may be as much as 14 m thick at the crest. The units also occur as in-channel terraces along the first 700-m reach of the Maraunot River. An overlying 1991 eruption sequence also occurs. It is unconsolidated and up to several meters thick, but has been gullied down to a meter thick along the channel thalweg, creating a 5 m-wide natural spillway at the dam's axis. Thus, unconsolidated 1991 eruption deposits at the dam's upper part left it vulnerable to rapid erosion and possible catastrophic breach.
A potential breach was expected on the occasion of intense rainfall. Dam failure was thought to be potentially initiated by erosion or headcutting of 1991 deposits where the valley narrows or "noses" and the channel drops. The removal of material would lead to increasing flow perimeter and head, which would increase discharge and weaken the dam. Discharge would escalate into a tremendous rush of water, accelerating erosion headward in a runaway process that culminated in dam failure. This same process has been documented in numerous cases of overtopped natural and man-made dams that have breached.
In the worst case, a 10- to 20-m-depth of the channel dam corresponding to the vertical gap between the crest and shallow channel bedrock could have been breached, releasing lake volumes of 28 x 106 to 55 x 106 m3. For a 10- to 20-m-deep breach, estimated peak discharges at the breach in such a circumstance are 3,000 and 11,000 m3/s. The breakout flow would be expected to erode and incorporate pyroclastic-flow and lahar sediments at the mid- to lower reaches of the Maraunot River, causing it to bulk up 3-6 times. Resulting large lahars could reach 3- to 7-fold larger distances than in previous typhoons (e.g. 1993). Faced with this hazard, PHIVOLCS proposed in early August 2001 to trench across the channel dam. This formed the core element of a rapid mitigation plan that included information drives, evacuation of risk areas, and lahar watches.
Trenching took place during 23 August-5 September 2001. The bulk of the trench was manually dug by an 80-man crew using pick axes and shovels and, later, by sluicing with a portable 50 m-long pressure hose. Excavation followed the channel thalweg or the natural spillway from crest to toe of the dam. The fully-excavated trench was 70 m long, 4 m wide, and nearly 3.5 m deep. It contained a 1-m-wide and 1.5-m-deep inner terrace that resulted from belated prioritization of depth over width (figures 37 and 38). Its bottom was originally graded ~2%. At the mouth it sloped steeply into 5 m-long plug that confined the lake until its release. In the end, about 700 m3 of material was excavated. On 4 September, observers were stationed at four sites. Evacuation of Botolan began the following day in anticipation of potential lahars.
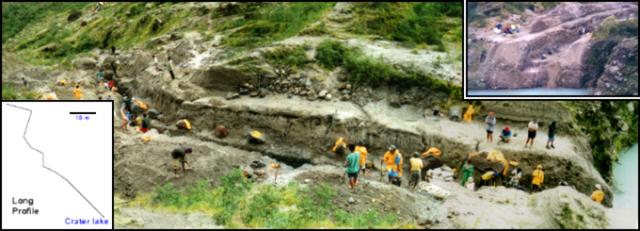 |
Figure 37. Oblique photo of Pinatubo's Maraunot Trench looking NE, taken the day before the channel was opened. Inset shows the mouth on 1 September 2001, ~ 2 m above the lake level; bottom lefthand inset is the profile of the trench. Courtesy PHIVOLCS. |
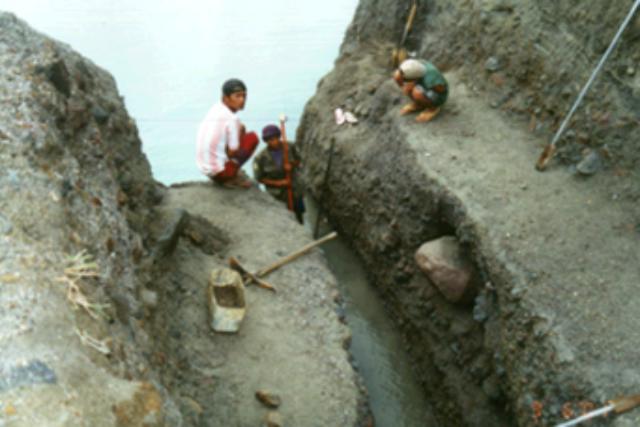 |
Figure 38. View showing of the mouth and the terraced inner geometry of the Pinatubo's Maraunot Trench, 6 September 2001. Courtesy PHIVOLCS. |
On 6 September, with a 10-cm-head of water, the plug was removed by sluicing. At 0653, after less than 1.25 hours of sluicing, lake water spill into the trench commenced, but discharge remained sluggish in the first four hours (~0.03 m3/s). Political developments led to the trench being left in a state that thwarted rapid, planned breaching.
Monitoring the newly opened trench. From 6 September to 5 November, local rainfall and outflow conditions and changes in configuration of the Maraunot trench were monitored. An estimated 4.4 x 10⁶ m3 (~86,000 m3/day) of rainwater entered the crater between 6 September and 5 November. In response, discharge across the trench fluctuated but rarely exceeded 1 m3/s under a lake head generally under 1 m. The total water output at the trench was roughly 3 x 10⁶ m3 (~59,000 m3/day) for the same period.
Time-series profiles of the trench floor revealed a total 1.5 m of downcutting in the period 8 September-21 October, an average of ~3.5 cm/day. As the terminus lowered close to bedrock and precipitation waned, however, the floor more or less stabilized, as did the trench's mouth-to-terminus elevation drop of 2.2 m. No substantial lateral erosion occurred at the 5-15 reach or in the first 30 m reach between 6 September and 5 November. Nevertheless, there was significant lateral erosion of as much as 2 m at the 55-65 m reaches and beyond. Erosion was attributed largely to the steeper channel and more turbulent flow at the trench's terminal reaches.
The pre-1991 breccia matrix eroded with vertical scour experienced uniformly across the entire floor and lateral scour (sidecutting) confined to the terminal reaches. Matrix erosion resulted in armoring of the trench floor with dense boulders. This partly accounted for restrained vertical scouring.
Trenching impacts to the lake breakout problem. Although the trench did not trigger a rapid breach as PHIVOLCS originally intended, the monitoring determined that the armoring provided by coarse pre-1991 breccia limited vertical scouring of the dam. Lateral matrix erosion and bank collapse were considered to deliver even further armor to the trench bed, as well as some sideways expansion of the channel.
Trenching by itself had significantly reduced the breakout hazard. The lake was averted from growing an extra 11 x 106 m3 and relieved of another 3 x 10⁶ m3 with a trench now draining it. This minimized the magnitude of lake breakout. Had natural overtopping been allowed to occur under sustained intense rainfall, initial outflow could have easily scoured a wider channel across the loose 1991 deposits, attaining discharge rates possibly too high for pre-1991 breccia to counteract with armoring.
Information Contacts: Ma. Antonia V. Bornas and theQuick Response Team, Geology and Geophysics Research and Development Division, Philippine Institute of Volcanology and Seismology, C.P. Garcia Ave., University of the Philippines Campus, Diliman 1101, Quezon City, Philippines.
Hardships and economic impact of the 1991 eruption
This report summarizes a news article by Lourdes Solidum-Montevirgen of the Philippines' Department of Science and Technology (Solidum-Montevirgen, 2011). The article noted that 20 years after one of the last century's biggest volcanic eruption (April-September 1991, BGVN 16:03-16:10), hunger and lahars continue to threaten Aeta communities around Pinatubo's foothills. The Aetas (an indigenous people who live in scattered, isolated mountainous parts of Luzon, Philippines) resided, in part, before the eruption in the towns of San Marcelino and Botolan, settlements almost destroyed by the 1991 eruption. The rainy season has resulted in lahar flows that continue to threaten these and nearby towns, displacing thousands of people. Agriculture continues to suffer badly, as hundreds of square kilometers of formerly arable land remain unproductive. Pinatubo is located NW of the capital of Manila (figure 39).
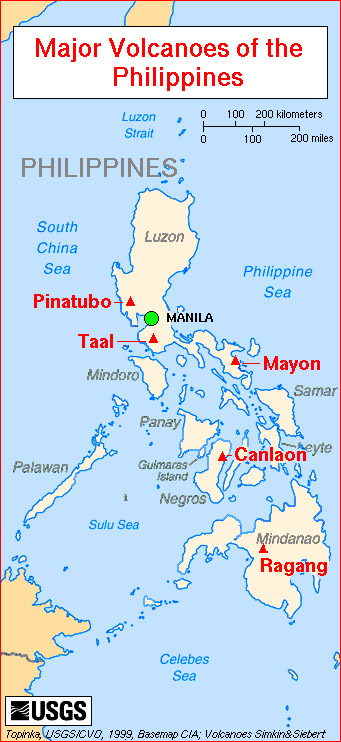 |
Figure 39. A map of major Philippine volcanoes, including Pinatubo. Courtesy of Lyn Topinka, US Geologic Survey. |
Aetas were hardest hit because they were both uprooted from their homes and their way of life. Many remain in government resettlement areas, huddled in makeshift homes, tents, and evacuation dwellings. Many of them are recent refugees after part of a protective dike along the Bucao River collapsed during Typhoon Kiko in August 2009, flooding Botolan and ten villages, resulting in death and hunger. Typhoons that followed two months later (October 2009) broke down an additional 1-km portion of the dike, causing lahars and floodwaters to rise more than 1.5 m, displacing over 20,000 people in nine villages. Over 9,000 of these recent refugees remained in evacuation centers as they awaited dike repair. They have joined thousands of evacuees still huddled in the ten evacuation centers inside three resettlement sites that were created following Pinatubo's eruption.
There is still widespread devastation in Botolan and nearby towns where several square kilometers of lakes and farm lands were "desertified". It is doubtful whether a new bridge and the dike, when repaired, will hold lahar floods because the Bucao river is heavily silted. Botolan (population 51,675), the largest town in Zambales and closest to Pinatubo, also has the largest Aeta population in the province. In 2010, 160 km2 (16,000 hectares) of the area nearest Pinatubo was declared as Aeta ancestral domain by the National Commission on Indigenous Peoples.
Farming has not yet resumed in many rice paddies and vegetable farms damaged by flash floods and lahars. Farm lands were covered with thick ash and reworked tephra, irrigation equipment ruined, roads and bridges destroyed, properties lost, trade and business centers collapsed. Overall, 364 communities and 2.1 million people were affected by the eruption, and more than 80,000 houses were lost. Roads and communications were damaged by pyroclastic flows and lahars. Some 800 km2 of rice lands and almost 800,000 farm animals were lost. The cost to agriculture was estimated at P1.5 billion (~ $25 million US) and the cost of repairs to damaged infrastructure was P3.8 billion (~ $62 million US).
Reference. Solidum-Montevirgen, L., 2011, Hunger, lahar haunt homeless Aetas 20 years after Pinatubo, Malay Business Insight, 29 July.
Information Contacts: Lourdes Solidum-Montevirgen, Industrial Technology Development Institute-Food Processing Division, Department of Science and Technology, Phillippines; Malaya Business Insight (URL: http://www.malaya.com.ph).
Phreatic explosion on 30 November 2021 sends steam plume above 13 km
A phreatic explosion from the summit crater lake at Pinatubo in November 2021 is the first notable volcanic activity since 1992-93 when there was dome growth and secondary phreatic explosions in the aftermath of the major 1991 eruption. The volcano is monitored by the Philippine Institute of Volcanology and Seismology (PHIVOLCS), Tokyo Volcanic Ash Advisory Center (VAAC), and satellites.
The PHIVOLCS volcano update on 30 November 2021 reported that a weak phreatic explosion was recorded during 1209-1213 that day. Because of the very low seismicity and CO2 flux during the previous few days, they suggested that the event was triggered by shallow hydrothermal processes. A plume mostly comprised of steam rose above weather clouds (figure 40). The Tokyo VAAC reported that the plume reached an altitude of 13.4 km and drifted W based on satellite data; it was also observed by a passing aircraft (figure 41). Immediately after the explosion PHIVOLCS warned the public not to venture close to the volcano and advised local governments to prohibit entry into Pinatubo’s crater, as shallow phreatic or hydrothermal explosions could occur without warning.
|
Figure 40. Image of 30 November 2021 plume taken 12 km NW of Pinatubo’s crater. The steam-dominated whitish top of the plume rose above the cloud cover over the volcano a few minutes after the explosion. Courtesy of PHIVOLCS via Twitter. |
|
Figure 41. Aerial view of the 30 November 2021 explosion plume from Pinatubo. Photo by Capt. Aljess Lasmarias of Philippines AirAsia; courtesy of CNN Philippines. |
Numerous weak thermal anomalies were recorded by the MIROVA system around the time of the explosion. NASA recorded a high SO2 level above the volcano on 29-30 November, around the time of the explosion, with a plume drifting W and SW (figure 42).
|
Figure 42. Satellite map showing a small SO2 plume drifting W and SW from Pinatubo on 30 November 2021, as detected by the TROPOMI instrument on the Copernicus Sentinel-5P satellite. Courtesy of NASA Global Sulfur Dioxide Monitoring Page. |
Information Contacts: Philippine Institute of Volcanology and Seismology (PHIVOLCS), Department of Science and Technology, University of the Philippines Campus, Diliman, Quezon City, Philippines (URL: http://www.phivolcs.dost.gov.ph/); Tokyo Volcanic Ash Advisory Center (VAAC), 1-3-4 Otemachi, Chiyoda-ku, Tokyo, Japan (URL: http://ds.data.jma.go.jp/svd/vaac/data/); MIROVA (Middle InfraRed Observation of Volcanic Activity), a collaborative project between the Universities of Turin and Florence (Italy) supported by the Centre for Volcanic Risk of the Italian Civil Protection Department (URL: http://www.mirovaweb.it/); NASA Global Sulfur Dioxide Monitoring Page, Atmospheric Chemistry and Dynamics Laboratory, NASA Goddard Space Flight Center (NASA/GSFC), 8800 Greenbelt Road, Goddard MD 20771, USA (URL: https://so2.gsfc.nasa.gov/); CNN Philippines (https://www.cnnphilippines.com/).
|
|
||||||||||||||||||||||||||||
There is data available for 9 confirmed eruptive periods.
2021 Nov 30 - 2021 Nov 30 Confirmed Eruption (Phreatic) VEI: 1
| Episode 1 | Eruption (Phreatic) | |||||||||||||||||||
|---|---|---|---|---|---|---|---|---|---|---|---|---|---|---|---|---|---|---|---|
| 2021 Nov 30 - 2021 Nov 30 | Evidence from Observations: Reported | ||||||||||||||||||
| A weak phreatic explosion was recorded during 1209-1213 on 30 November. A plume mostly comprised of steam was seen rising above weather clouds within a few minutes of the end of the event. The Tokyo VAAC stated that the plume rose to 13.4 km altitude and drifted W based on satellite data. | |||||||||||||||||||
|
List of 2 Events for Episode 1
|
|||||||||||||||||||
1993 Feb 16 ± 15 days - 1993 Jul 16 (?) ± 15 days Confirmed Eruption (Explosive / Effusive) VEI: 1
| Episode 1 | Eruption (Explosive / Effusive) | Caldera floor | |||||||||||||||||||||||||||||||||||||||||||
|---|---|---|---|---|---|---|---|---|---|---|---|---|---|---|---|---|---|---|---|---|---|---|---|---|---|---|---|---|---|---|---|---|---|---|---|---|---|---|---|---|---|---|---|---|
| 1993 Feb 16 ± 15 days - 1993 Jul 16 (?) ± 15 days | Evidence from Observations: Reported | |||||||||||||||||||||||||||||||||||||||||||
|
List of 7 Events for Episode 1 at Caldera floor
|
||||||||||||||||||||||||||||||||||||||||||||
1992 Jul 9 (on or before) - 1992 Oct 30 Confirmed Eruption (Explosive / Effusive) VEI: 1
| Episode 1 | Eruption (Explosive / Effusive) | Center of caldera lake | |||||||||||||||||||||||||||||||||||||||||||||||||||||
|---|---|---|---|---|---|---|---|---|---|---|---|---|---|---|---|---|---|---|---|---|---|---|---|---|---|---|---|---|---|---|---|---|---|---|---|---|---|---|---|---|---|---|---|---|---|---|---|---|---|---|---|---|---|---|
| 1992 Jul 9 (on or before) - 1992 Oct 30 | Evidence from Observations: Reported | |||||||||||||||||||||||||||||||||||||||||||||||||||||
|
List of 9 Events for Episode 1 at Center of caldera lake
|
||||||||||||||||||||||||||||||||||||||||||||||||||||||
1991 Apr 2 - 1991 Sep 2 Confirmed Eruption (Explosive / Effusive) VEI: 6
| Episode 1 | Eruption (Explosive / Effusive) | Lower north flank and summit | |||||||||||||||||||||||||||||||||||||||||||||||||||||||||||||||||||||||||||||||||||||||||||||||||||||||
|---|---|---|---|---|---|---|---|---|---|---|---|---|---|---|---|---|---|---|---|---|---|---|---|---|---|---|---|---|---|---|---|---|---|---|---|---|---|---|---|---|---|---|---|---|---|---|---|---|---|---|---|---|---|---|---|---|---|---|---|---|---|---|---|---|---|---|---|---|---|---|---|---|---|---|---|---|---|---|---|---|---|---|---|---|---|---|---|---|---|---|---|---|---|---|---|---|---|---|---|---|---|---|---|---|
| 1991 Apr 2 - 1991 Sep 2 | Evidence from Observations: Reported | |||||||||||||||||||||||||||||||||||||||||||||||||||||||||||||||||||||||||||||||||||||||||||||||||||||||
|
List of 19 Events for Episode 1 at Lower north flank and summit
|
||||||||||||||||||||||||||||||||||||||||||||||||||||||||||||||||||||||||||||||||||||||||||||||||||||||||
1450 ± 50 years Confirmed Eruption (Explosive / Effusive) VEI: 5 (?)
| Episode 1 | Eruption (Explosive / Effusive) | |||||||||||||||||||||||||||||||||||||||
|---|---|---|---|---|---|---|---|---|---|---|---|---|---|---|---|---|---|---|---|---|---|---|---|---|---|---|---|---|---|---|---|---|---|---|---|---|---|---|---|
| 1450 ± 50 years - Unknown | Evidence from Isotopic: 14C (calibrated) | ||||||||||||||||||||||||||||||||||||||
|
List of 6 Events for Episode 1
|
|||||||||||||||||||||||||||||||||||||||
1050 BCE ± 500 years Confirmed Eruption (Explosive / Effusive) VEI: 6
| Episode 1 | Eruption (Explosive / Effusive) | |||||||||||||||||||||||||||||
|---|---|---|---|---|---|---|---|---|---|---|---|---|---|---|---|---|---|---|---|---|---|---|---|---|---|---|---|---|---|
| 1050 BCE ± 500 years - Unknown | Evidence from Isotopic: 14C (calibrated) | ||||||||||||||||||||||||||||
|
List of 4 Events for Episode 1
|
|||||||||||||||||||||||||||||
3550 BCE (?) Confirmed Eruption (Explosive / Effusive) VEI: 6
| Episode 1 | Eruption (Explosive / Effusive) | ||||||||||||||||||||||||||||||||||
|---|---|---|---|---|---|---|---|---|---|---|---|---|---|---|---|---|---|---|---|---|---|---|---|---|---|---|---|---|---|---|---|---|---|---|
| 3550 BCE (?) - Unknown | Evidence from Isotopic: 14C (calibrated) | |||||||||||||||||||||||||||||||||
|
List of 5 Events for Episode 1
|
||||||||||||||||||||||||||||||||||
7030 BCE ± 300 years Confirmed Eruption (Explosive / Effusive)
| Episode 1 | Eruption (Explosive / Effusive) | |||||||||||||||||||
|---|---|---|---|---|---|---|---|---|---|---|---|---|---|---|---|---|---|---|---|
| 7030 BCE ± 300 years - Unknown | Evidence from Isotopic: 14C (calibrated) | ||||||||||||||||||
|
List of 2 Events for Episode 1
|
|||||||||||||||||||
7460 BCE ± 150 years Confirmed Eruption (Explosive / Effusive) VEI: 6 (?)
| Episode 1 | Eruption (Explosive / Effusive) | Tayawan caldera | |||||||||||||||||||||||
|---|---|---|---|---|---|---|---|---|---|---|---|---|---|---|---|---|---|---|---|---|---|---|---|---|
| 7460 BCE ± 150 years - Unknown | Evidence from Isotopic: 14C (calibrated) | |||||||||||||||||||||||
|
List of 3 Events for Episode 1 at Tayawan caldera
|
||||||||||||||||||||||||
This compilation of synonyms and subsidiary features may not be comprehensive. Features are organized into four major categories: Cones, Craters, Domes, and Thermal Features. Synonyms of features appear indented below the primary name. In some cases additional feature type, elevation, or location details are provided.
Craters |
||||
| Feature Name | Feature Type | Elevation | Latitude | Longitude |
| Tayawan | Pleistocene caldera | |||
Domes |
||||
| Feature Name | Feature Type | Elevation | Latitude | Longitude |
| Bituin | Dome | 15° 12' 0.00" N | 120° 24' 0.00" E | |
| Cuadrado, Mount | Dome | 1324 m | 15° 2' 0.00" N | 120° 21' 0.00" E |
| Mataba | Dome | 15° 12' 0.00" N | 120° 26' 0.00" E | |
| Negron, Mount | Dome | 1583 m | 15° 6' 0.00" N | 120° 22' 0.00" E |
| Tapungho | Dome | 15° 1' 0.00" N | 120° 19' 0.00" E | |
Thermal |
||||
| Feature Name | Feature Type | Elevation | Latitude | Longitude |
| Asin | Thermal | 295 m | 15° 3' 20.00" N | 120° 24' 27.00" E |
| Crater SE Springs | Hot Spring | 15° 9' 0.00" N | 120° 22' 0.00" E | |
| Cuyucut | Thermal | 380 m | 15° 5' 20.00" N | 120° 25' 10.00" E |
| Dagsa | Thermal | 300 m | 15° 6' 0.00" N | 120° 24' 40.00" E |
| Dangey | Thermal | 965 m | 15° 9' 50.00" N | 120° 22' 20.00" E |
| Kalawangan | Thermal | 675 m | 15° 8' 46.00" N | 120° 24' 40.00" E |
| Lower Maruanot | Thermal | 900 m | 15° 9' 36.00" N | 120° 21' 45.00" E |
| Mamot | Thermal | 900 m | 15° 7' 55.00" N | 120° 21' 48.00" E |
| Nacolcol | Thermal | 220 m | 15° 15' 15.00" N | 120° 18' 20.00" E |
| Pajo | Thermal | 518 m | 15° 11' 40.00" N | 120° 20' 22.00" E |
| Pula | Thermal | 600 m | 15° 9' 53.00" N | 120° 20' 40.00" E |
| Solfatara Pool | Thermal | 1180 m | 15° 9' 30.00" N | 120° 22' 3.00" E |
| Upper Maruanot | Thermal | 1075 m | 15° 9' 25.00" N | 120° 22' 6.00" E |
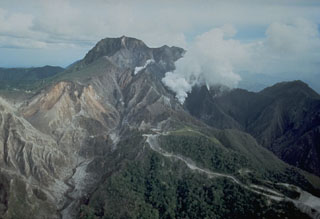 An aerial view of the north flank of Pinatubo shows the area devastated by explosions on 2 April 1991. This eruption was the first in a progressively intensifying series of eruptions that led to caldera formation on 15 June. The road in the foreground provided access to a geothermal drill station.
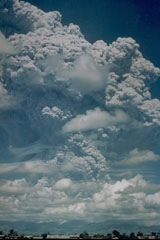 A large Plinian ash plume towers above Pinatubo in the Philippines on 12 June 1991, reaching an altitude of 19 km. This was the first in a series of powerful eruptions that culminated on 15 June with major pyroclastic flows that traveled down all sides of the volcano. Collapse of the summit then created a 2.5-km-wide caldera. This photo was taken from Clark Air Base, about 25 km ENE of Pinatubo.
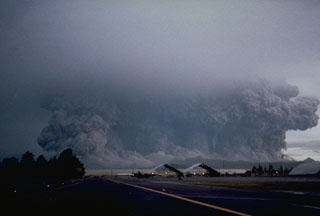 A powerful eruption of Pinatubo that began at 0555 on 15 June 1991 viewed from Clark Air Base ENE of the volcano. The broad ash column, which appears to be as wide as the volcano, is a result of pyroclastic flows that are sweeping radially down the volcano's flanks. Eruptions producing pyroclastic flows began on 12 June and continued intermittently until the climactic eruption that began at 1342 on the 15th and resulted in caldera collapse during sustained eruptions that lasted more than 6 hours.
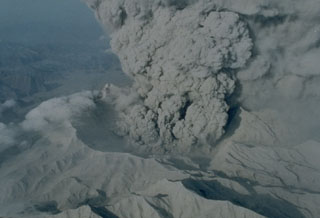 An ash plume rises from the new caldera of Pinatubo volcano on 22 June 1991. The 2.5-km-wide caldera, seen here from the N, was formed by collapse of the summit following a Plinian eruption on 15 June. Ash plumes continued for about a month before becoming intermittent prior to the end of the eruption on 2 September. Light-colored ash deposits cover the flanks of the formerly forest-covered volcano.
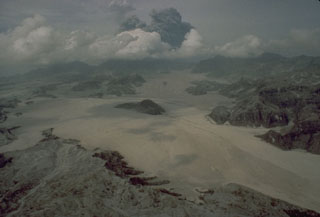 Voluminous pyroclastic flows on 15 June 1991 descended all sides of Mount Pinatubo in the Philippines. The flat, light-colored areas in the foreground are pyroclastic flow deposits that filled the Marella River valley on Pinatubo's SW flank to a depth of 200 m. The dark hill at the center was completely surrounded by pyroclastic flows that traveled 14 km down this valley.
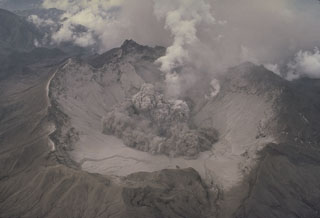 The beginning of a small explosion within the new summit caldera of Pinatubo is seen from the NE on 1 August 1991. After the 2.5-km-wide caldera formed during the 15 June climactic eruption, frequent ash emission lasted through much of July. The caldera floor became visible for the first time when activity changed to intermittent explosions. By September 1991 a lake began to form from the accumulation of rainwater and groundwater from within the volcano; it eventually expanded to cover the caldera floor.
 Volcanic ash is composed of heavy pulverized rock. Ashfall from the 15 June 1991 eruption of Pinatubo in the Philippines accumulated on this this World Airways DC-10, shifting the center of gravity and causing the nose to tip up. About 4 km3 of ash was erupted on 15 June. It accumulated to depths of 10-15 cm at this airfield at the Cubi Point Naval Air Station, 40 km SSW of Pinatubo.
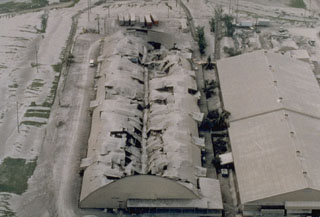 Heavy ashfall from the 15 June 1991 eruption of Pinatubo volcano caused the roof of this warehouse at Clark Air Base to collapse. The base had been evacuated prior to the major explosion on the 15th.
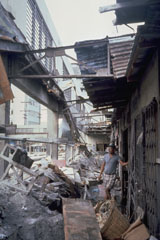 Heavy ashfall from the 15 June 1991 eruption of Pinatubo caused collapse of the roof of this public market in Olapango City near Subic Bay Naval Air Station. About 10-15 cm of ash fell at this location, 35 km S of the volcano.
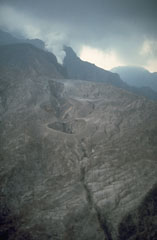 The 1991 eruption of Pinatubo began on 2 April with a small phreatic eruption on the upper NW flank. The eruptions formed several craters along a 1.5-km-long, E-W-trending alignment. Steam rises from a vent at the SW end of the fissure. Activity continued at two of these vents through April-May and increased prior to extrusion of a small lava dome at a NW-flank vent on 7 June.
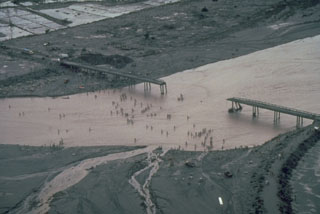 Residents in this July 1991 photo had to cross the shallow Santo Tomás River, SW of Pinatubo, on foot after lahars (volcanic mudflows) destroyed the bridge between the villages of San Rafael and Santa Fe. Devastating lahars affected broad lowland areas on all sides of Pinatubo in the years following the 1991 eruption.
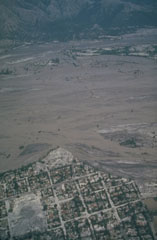 Lahars from Pinatubo fill the broad Santo Tomás River valley SW of the volcano. Erosion along the south bank of the river has cut into the town of San Rafael. This photo was taken a month after the end of the 1991 eruption. Lahars produced by the redistribution of thick deposits of ashfall and pyroclastic flows caused extensive long-term economic devastation which continued for years after the eruption ended.
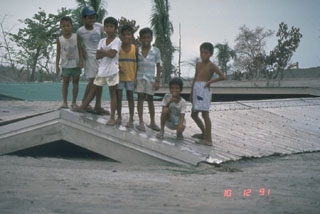 Children stand on top of a school building buried to its roof on 12 October 1991. The school was initially partially buried by lahars from Pinatubo along the Bambam River on 24 August. Successive lahars along this NE-flank valley had traveled 50 km by the end of 1991.
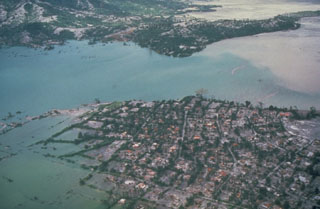 Floodwaters back up over the villages of Aglao and Dalanawan on the SW flank of Pinatubo volcano in the Philippines. Lake Mapanuepe was formed when lahars from the 1991 eruption traveled down the Marella River and dammed its tributary; several villages were submerged by the rising water. The lake was stabilized in late 1992 at about this level after excavation of a trench through bedrock, seen in the background. This prevented catastrophic rapid draining of the lake.
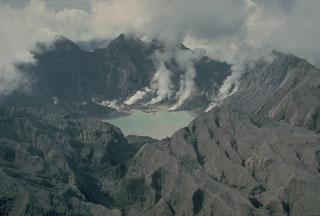 The major explosive eruption on 15 June 1991 created a 2.5-km-wide caldera at the summit of Pinatubo. The elevation of the caldera floor is more than 900 m below that of the pre-eruption summit. Plumes rise from fumaroles on the caldera floor in this 4 October 1991 photo taken from the N. The outer flanks of the caldera are stripped of vegetation and covered with ash and pyroclastic surge deposits.
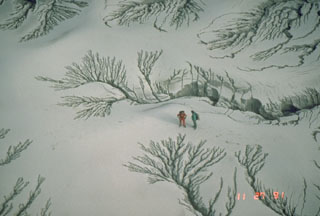 The unconsolidated pyroclastic flow and ash deposits emplaced during the June 1991 eruption of Pinatubo were remobilized by rain water as lahars for years after activity ceased. This photo shows erosion patterns in the deposits along the Maraunot River valley NW of Pinatubo on 27 November 1991.
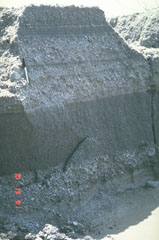 These relatively fine-grained layers are lahar deposits produced by successive overflows of dikes along the Bambam River, about 35 km NE of Pinatubo volcano in the Philippines. The photo was taken on 13 October 1991, a little more than a month after the end of the devastating 1991 eruption. Note the pen at the upper left for scale. By the end of 1991, rainfall-induced lahars had traveled 50 km down the Bambam River.
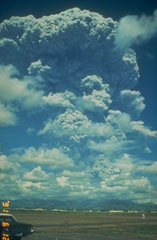 A large Plinian ash plume from Pinatubo towers above Clark Air Base on 12 June 1991. The eruption column reached an altitude of 19 km. This was the first in a series of powerful eruptions that reached a climax on 15 June. The eruption that day produced a series of large pyroclastic flows that covered all sides of the volcano and resulted in collapse of the summit, creating a 2.5-km-wide caldera.
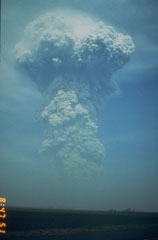 A large ash plume rises above the NW flank of Pinatubo at 0841 on 13 June 1991. Weather radar indicated that the plume reached an altitude of at least 24 km. Pyroclastic flows from this eruption extended 4-5 km down the Maraunot drainage on the NW flank. At the end of this eruption the NW-flank lava dome that had begun growing on 7 June was still intact.
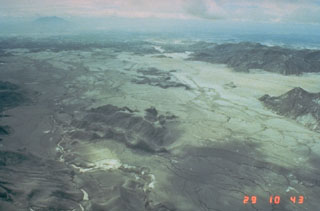 The broad light-colored areas are thick pyroclastic flow deposits from the 15 June 1991 Pinatubo eruption. This 29 June photo taken two weeks after the eruption is looking towards the east with Clark Air Base just beyond the margin of the pyroclastic flow fan. Debris flows or lahars have remobilized significant volumes of the unconsolidated pumice and ash since 1991. Mount Arayat is visible at the upper left.
 The 1991 eruption of Pinatubo in the Philippines created a new caldera with an average diameter of 2.5 km. Caldera collapse occurred following the ejection of around 5 km3 of material in one of the world's largest eruptions of the 20th century and lowered the height of the volcano by about 300 m. This 1994 view from the NW shows a lake within the caldera and two small islands from a partially submerged lava dome that was erupted in 1992.
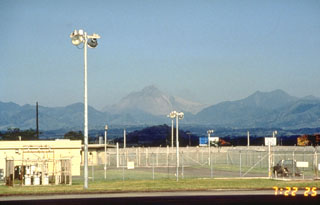 Pinatubo is seen here from Clark Air Base on the ENE the day before the catastrophic 14 June 1991 eruption that formed a caldera. The evacuation of Clark Air Base was completed on 10 June. The peak in the center is the former 1,745 m summit, which is covered with ash from activity that had begun on 2 April and intensified strongly on 12 June. The high dark ridge to the right is the NE rim of the 4 x 5 km Tayawan caldera of ancestral Pinatubo volcano.
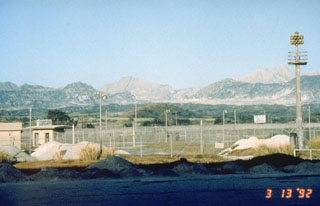 The summit of Pinatubo is seen from the E at Clark Air Base in 1992. The unvegetated peak near the center is the southern rim of the new caldera and summit. The northern caldera rim lies about 2/3 of the distance between the summit and the unvegetated peak to the right, which is the relict caldera rim of ancestral Pinatubo volcano.
 This ash-covered newsstand on Clark Air Base holds a newspaper with the headline “Mt. Pinatubo showers Clark.” Powerful eruptions of Pinatubo volcano in June 1991 forced closure of the base.
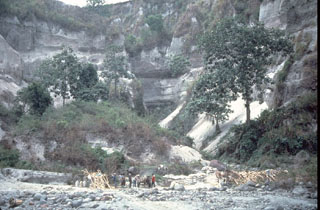 A thick stack of pre-1991 pyroclastic flow and lahar deposits outside Clark Air Base is testimony to the long history of explosive eruptions at Pinatubo. Six major eruptive periods took place in the past 35,000 years, each separated by long periods of quiescence. Most of the previous eruptive periods produced explosions that were even larger than the 1991 eruption. The last major eruption prior to 1991 occurred about 500 years ago.
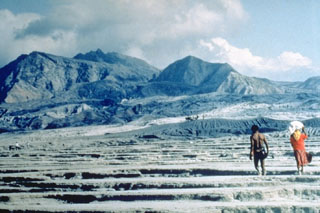 An Aeta couple returns to inspect their land along the Maraunot River on the NW flank of Pinatubo following the catastrophic eruption of 15 June 1991. At least 10,000 members of the nomadic Aeta peoples, whose native lands were on the slopes of Pinatubo, were displaced by the eruption.
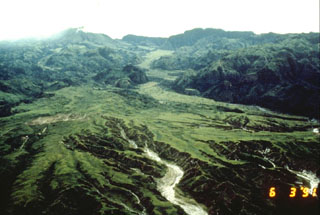 The flat, lighter-green, vegetated deposit that winds down the valley at the top center of the photo is a pyroclastic flow fan from the last major eruption of Pinatubo prior to 1991, about 500 years ago. This photo, taken on 3 June 1991, shows the pre-eruption profile of the upper Marella River valley.
 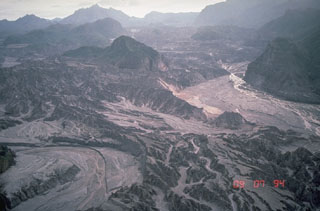 Thick pyroclastic flow deposits from the 1991 eruption of Pinatubo were rapidly eroded in the years following the eruption. This 7 September 1994 view of the upper Marella River valley from the SW, with the caldera rim on the skyline, shows the effects of the erosion of well over 100 m of pyroclastic flow deposits. Light-colored deposits in the channels at the middle right and lower left are post-1991 lahar deposits.
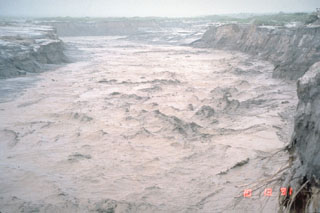 A lahar, or volcanic mudflow, fills the banks of the Pasig-Potrero River on the east side of Pinatubo volcano in the Philippines on 13 October 1991. The lahar moved at a velocity of 3-5 m/s and carried a few meter-sized boulders. This lahar was not directly produced by an eruption, but was triggered by minor rainfall that remobilized thick deposits of ash and pumice that blanketed the landscape. Devastating lahars occurred at Pinatubo for years after the catastrophic 1991 eruption.
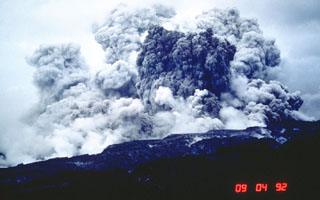 An ash plume rises several kilometers above the west flank of Pinatubo on 4 September 1992. This was not the result of an eruption, but of secondary explosions produced when water contacted still-hot pyroclastic flow deposits of the 1991 eruption. This can occur either when channel banks eroded into the deposits collapse into streams, or when groundwater invades hot deposits along buried stream channels. Ash plumes as high as 18 km were produced by these events, as well as pyroclastic flows.
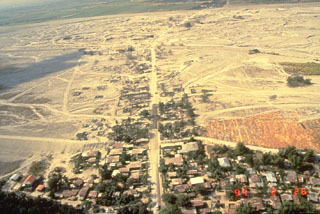 Lahars produced devastating social and economic disruption for many years after the 1991 eruption of Pinatubo in the Philippines. The towns of Barangay Manibaug Pasig in the foreground of this 26 February 1994 view, and Mancatian in the distance, were progressively buried over several years. Construction of lahar levees provided only temporary protection from the massive downstream redistribution of ash and pumice from the 1991 eruption.
 Residents of the city of Bacolor in the Philippines, 38 km SE of Pinatubo, persevere in the face of widespread devastation from lahars. They are walking on the surface of a solidified 5-m-deep deposit of volcanic debris next to wires that are the original electrical power lines formerly high above the street level. Houses and businesses in the background of this September 1995 photo are buried to 2nd-floor levels.
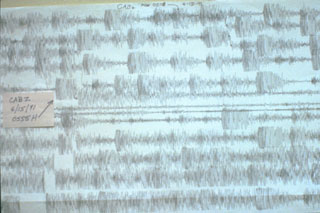 The seismogram for 15 June 1991 shows the intense seismicity accompanying the catastrophic eruption of Mount Pinatubo in the Philippines. This seismic record shows earthquakes over a two-hour period beginning at 0508 hours. The arrow points to the earthquake accompanying a major explosion at 0555, which was preceded by long-period earthquakes. At about 0640 continuous overlapping long-period earthquakes or tremor began, and much of the following record was saturated so that individual earthquakes could not be distinguished.
 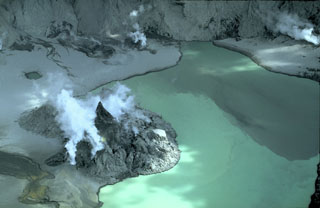 An eruption that began on 9 July 1992 produced a small tuff cone on the floor of the Pinatubo caldera. On 14 July a new lava dome was sighted, which by the end of the eruption on 30 October had grown to a height of more than 100 m and covered an area of 300 x 400 m. This view from the S shows the dome on 8 March 1993. Subsequent rise of the lake level covered much of the dome by 1994, leaving two small islands in the caldera lake.
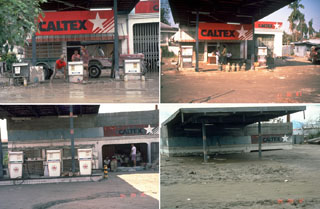 Owners of a service station in the city of Bacolor, 38 km SE of Pinatubo in the Philippines, adapted to ongoing lahars over many years; note the garage door opening at right and the height of the canopy in each photo. On 12 September 1991 (upper left), 10 days after the end of the 1991 eruption, they dug out gas pumps buried by 1-m-thick lahar deposits. By 30 November 1991 (upper right) they had raised the pumps to the new ground level. Three years later, in September 1994 (bottom left), the pumps had again been raised, to a ground surface now half the height of the original garage opening. A year later (bottom right) a 5-m-high lahar deposit filled the garage, and the station had been abandoned.
The following 32 samples associated with this volcano can be found in the Smithsonian's NMNH Department of Mineral Sciences collections, and may be availble for research (contact the Rock and Ore Collections Manager). Catalog number links will open a window with more information.
| Catalog Number | Sample Description | Lava Source | Collection Date |
|---|---|---|---|
| NMNH 116534-1 | Pumice | -- | -- |
| NMNH 116534-2 | Pumice | -- | -- |
| NMNH 116557-1 | Pumice | -- | -- |
| NMNH 116557-2 | Pumice | -- | -- |
| NMNH 116559-1 | Pumice | -- | -- |
| NMNH 116559-2 | Pumice | -- | -- |
| NMNH 116563-1 | Pumice | -- | -- |
| NMNH 116563-1 | Pumice | -- | -- |
| NMNH 116563-2 | Pumice | -- | -- |
| NMNH 117219 | Charcoal | -- | -- |
| NMNH 117638-1 | Ash | -- | -- |
| NMNH 117638-10 | Pumice | -- | -- |
| NMNH 117638-11 | Ash | -- | -- |
| NMNH 117638-12 | Pumice | -- | -- |
| NMNH 117638-13 | Pumice | -- | -- |
| NMNH 117638-14 | Ash | -- | -- |
| NMNH 117638-15 | Pumice | -- | -- |
| NMNH 117638-16 | Ash | -- | -- |
| NMNH 117638-17 | Ash | -- | -- |
| NMNH 117638-18 | Ash | -- | -- |
| NMNH 117638-19 | Ash | -- | -- |
| NMNH 117638-2 | Pumice | -- | -- |
| NMNH 117638-20 | Ash | -- | -- |
| NMNH 117638-21 | Ash | -- | -- |
| NMNH 117638-22 | Basalt | -- | -- |
| NMNH 117638-3 | Basalt | -- | -- |
| NMNH 117638-4 | Pumice | -- | -- |
| NMNH 117638-5 | Pumice | -- | -- |
| NMNH 117638-6 | Pumice | -- | -- |
| NMNH 117638-7 | Ash | -- | -- |
| NMNH 117638-8 | Pumice | -- | -- |
| NMNH 117638-9 | Ash | -- | -- |
| Copernicus Browser | The Copernicus Browser replaced the Sentinel Hub Playground browser in 2023, to provide access to Earth observation archives from the Copernicus Data Space Ecosystem, the main distribution platform for data from the EU Copernicus missions. |
| MIROVA | Middle InfraRed Observation of Volcanic Activity (MIROVA) is a near real time volcanic hot-spot detection system based on the analysis of MODIS (Moderate Resolution Imaging Spectroradiometer) data. In particular, MIROVA uses the Middle InfraRed Radiation (MIR), measured over target volcanoes, in order to detect, locate and measure the heat radiation sourced from volcanic activity. |
| MODVOLC Thermal Alerts | Using infrared satellite Moderate Resolution Imaging Spectroradiometer (MODIS) data, scientists at the Hawai'i Institute of Geophysics and Planetology, University of Hawai'i, developed an automated system called MODVOLC to map thermal hot-spots in near real time. For each MODIS image, the algorithm automatically scans each 1 km pixel within it to check for high-temperature hot-spots. When one is found the date, time, location, and intensity are recorded. MODIS looks at every square km of the Earth every 48 hours, once during the day and once during the night, and the presence of two MODIS sensors in space allows at least four hot-spot observations every two days. Each day updated global maps are compiled to display the locations of all hot spots detected in the previous 24 hours. There is a drop-down list with volcano names which allow users to 'zoom-in' and examine the distribution of hot-spots at a variety of spatial scales. |
|
WOVOdat
Single Volcano View Temporal Evolution of Unrest Side by Side Volcanoes |
WOVOdat is a database of volcanic unrest; instrumentally and visually recorded changes in seismicity, ground deformation, gas emission, and other parameters from their normal baselines. It is sponsored by the World Organization of Volcano Observatories (WOVO) and presently hosted at the Earth Observatory of Singapore.
GVMID Data on Volcano Monitoring Infrastructure The Global Volcano Monitoring Infrastructure Database GVMID, is aimed at documenting and improving capabilities of volcano monitoring from the ground and space. GVMID should provide a snapshot and baseline view of the techniques and instrumentation that are in place at various volcanoes, which can be use by volcano observatories as reference to setup new monitoring system or improving networks at a specific volcano. These data will allow identification of what monitoring gaps exist, which can be then targeted by remote sensing infrastructure and future instrument deployments. |
| Volcanic Hazard Maps | The IAVCEI Commission on Volcanic Hazards and Risk has a Volcanic Hazard Maps database designed to serve as a resource for hazard mappers (or other interested parties) to explore how common issues in hazard map development have been addressed at different volcanoes, in different countries, for different hazards, and for different intended audiences. In addition to the comprehensive, searchable Volcanic Hazard Maps Database, this website contains information about diversity of volcanic hazard maps, illustrated using examples from the database. This site is for educational purposes related to volcanic hazard maps. Hazard maps found on this website should not be used for emergency purposes. For the most recent, official hazard map for a particular volcano, please seek out the proper institutional authorities on the matter. |
| IRIS seismic stations/networks | Incorporated Research Institutions for Seismology (IRIS) Data Services map showing the location of seismic stations from all available networks (permanent or temporary) within a radius of 0.18° (about 20 km at mid-latitudes) from the given location of Pinatubo. Users can customize a variety of filters and options in the left panel. Note that if there are no stations are known the map will default to show the entire world with a "No data matched request" error notice. |
| UNAVCO GPS/GNSS stations | Geodetic Data Services map from UNAVCO showing the location of GPS/GNSS stations from all available networks (permanent or temporary) within a radius of 20 km from the given location of Pinatubo. Users can customize the data search based on station or network names, location, and time window. Requires Adobe Flash Player. |
| DECADE Data | The DECADE portal, still in the developmental stage, serves as an example of the proposed interoperability between The Smithsonian Institution's Global Volcanism Program, the Mapping Gas Emissions (MaGa) Database, and the EarthChem Geochemical Portal. The Deep Earth Carbon Degassing (DECADE) initiative seeks to use new and established technologies to determine accurate global fluxes of volcanic CO2 to the atmosphere, but installing CO2 monitoring networks on 20 of the world's 150 most actively degassing volcanoes. The group uses related laboratory-based studies (direct gas sampling and analysis, melt inclusions) to provide new data for direct degassing of deep earth carbon to the atmosphere. |
| Large Eruptions of Pinatubo | Information about large Quaternary eruptions (VEI >= 4) is cataloged in the Large Magnitude Explosive Volcanic Eruptions (LaMEVE) database of the Volcano Global Risk Identification and Analysis Project (VOGRIPA). |
| EarthChem | EarthChem develops and maintains databases, software, and services that support the preservation, discovery, access and analysis of geochemical data, and facilitate their integration with the broad array of other available earth science parameters. EarthChem is operated by a joint team of disciplinary scientists, data scientists, data managers and information technology developers who are part of the NSF-funded data facility Integrated Earth Data Applications (IEDA). IEDA is a collaborative effort of EarthChem and the Marine Geoscience Data System (MGDS). |

