MVO reported that a very small increase in activity at Soufrière Hills during 1-8 September was characterized by small rockfalls coincident with volcano-tectonic earthquake activity and occasional small, low-frequency, volcanic earthquakes. The seismic network recorded 27 volcano-tectonic earthquakes spilt between two swarms recorded on 6 and 8 September. Minor rockfall activity and volcano-tectonic seismicity began at about 2100 on 7 September and was ongoing. Rockfalls took place on the lava dome based on seismic data, though their locations could not be visually confirmed. The swarm on 8 September was followed by a long-period earthquake at 0742, and a few additional smaller events. Access to the Upper Belham valley and Plymouth were suspended for the day out of an abundance of caution. Sulfur dioxide emissions averaged 436 tonnes per day on 1 September (measured from a boat) and 367 tonnes per day on 6 September (measured by helicopter). The Hazard Level remained at 1 (on a scale of 1-5).
Source: Montserrat Volcano Observatory (MVO)
By March 2014, an over 50-month-long decline in extrusion (Pause 5)
A partial dome collapse took place at Soufrière Hills on 11 February 2010 (BGVN 35:03), an event followed by a lack of easily measured dome growth during an interval that continued into at least April 2014. Despite a lack of significant extrusion into the dome, pyroclastic flows continued, as did rockfalls and volcano-tectonic (VT) earthquakes. MVO describes intervals of this nature as extrusive pauses or more simply pauses. Pauses have been diagnosed as a prevalent behavior since they began following an extrusive phase starting in mid-1995. Our last issue (BGVN 36:08) covered part of the still-ongoing pause.
The various phases of activity at Soufrière Hills Volcano (SHV) during 1 January 1992 to 30 April 2013 are summarized in table 72. The table comes from a Montserrat Volcano Observatory (MVO) report providing a synthesis of activity during ~6 months ending in April 2013, and making authoritative and instructive comparisons to the overall eruption (table 72).
Table 72. Inventory of behavioral phases observed at SHV between 1 January 1992 and 30 April 2013. Pause 5 continued into at least April 2014. Taken from the MVO Scientific Report for Volcanic Activity between 13 October 2012 and 30 April 2013.
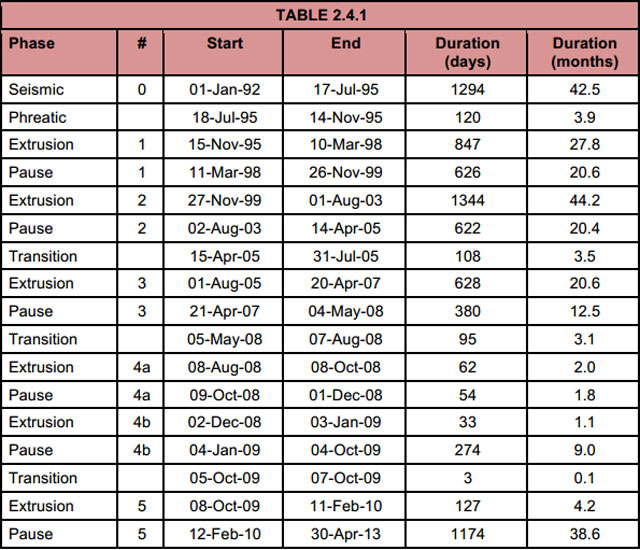 |
In brief, table 72 documents that an increase in seismicity occurred from 1992 to 1995, followed by a phreatic eruptive phase starting in mid-1995. That episode was followed by intervals of extrusion, transition, and pause. Extrusive phases included dome growth and frequent pyroclastic flows. During transition phases, dome growth slowed, but the risk to areas near the volcano continued.
As noted above, pauses are characterized by much slower dome growth (if at all), yet residual activity. The current pause is the longest yet recorded since the eruption began in 1995. Pause 5 began on 12 February 2010, and as of March 2014 was over 50 months long.
MVO established three criteria that indicate the potential for future activity. These criteria include low frequency seismic swarms and tremors, daily SO2 fluxes above 50 tons/day, and significant ground deformation. Most of the data reported in this Bulletin came from MVO Scientific Reports from 1 November 2011 to 30 April 2012, 1 May 2012 to 12 October 2012, and 13 October 2012 to 30 April 2013.
Short, intense swarms of VT earthquakes have occurred at Soufrière Hills since late 2007. The smaller swarms are often described by MVO as strings.
The most notable activity since September 2011 included intense Volcanic Tectonic (VT) earthquake swarms during 22-23 March 2012. Two small strings of VT events occurred in early August 2012, a brief VT string occurred on 24 December 2012, and a few VT strings of earthquakes took place during 4-6 February 2013.
The seismic events of 22-23 March 2012 and August 2012 were followed by ash venting. The venting in March resulted in the formation of two new craters. One developed inside the 11 February 2010 dome collapse scar; the other was outside the collapse scar to the (figure 91).
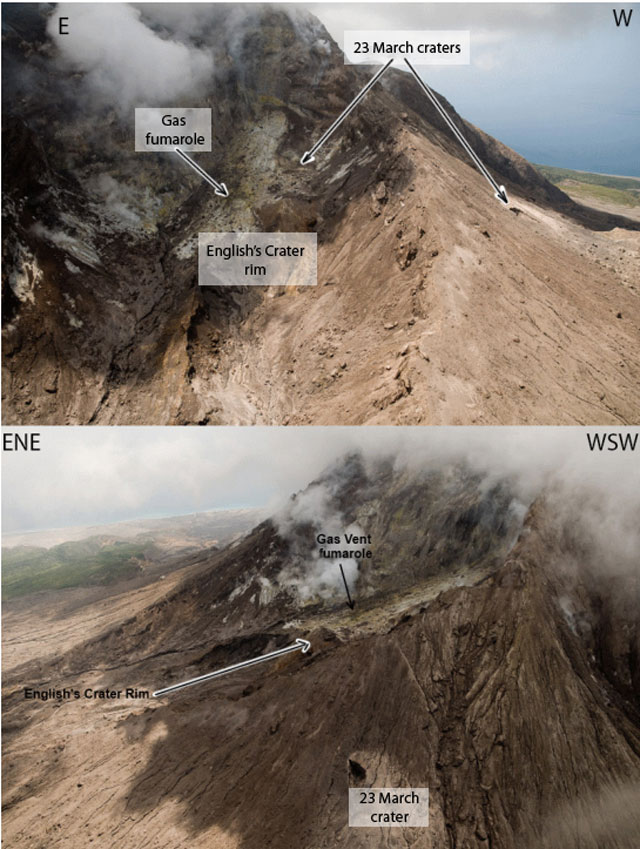 |
Figure 91. The craters at Soufrière Hills that formed following the intense VT earthquake swarms during 22-23 March 2012 are labeled in the above aerial photographs, taken by the Montserrat Volcano Observatory (MVO). The upper photo looks S into the 11 February 2010 collapse scar, and the lower photo looks E from above Gage's Mountain. Courtesy of MVO. |
On 20 November 2012, images of the S flank of the dome revealed a pervasively fractured area below the S rim of the explosion crater. That area was considered a potential source for large rockfalls or pyroclastic flows.
During the increased fumarole activity on 4-5 February 2013, a new crater was excavated around a gas vent on the floor of the 11 February 2010 collapse scar. This crater was 15 to 20 m across and 5 to 10 m deep.
The Hazard Level remained at 2, indicating daytime (0800 to 1600) access to Zone C and daytime-transit-only in maritime zone W (located W of the volcano; boats may sail through the zone but must not stop). A map of the zones on the island appeared in BGVN (22:05) and is found as figure 22 above.
Activity during 1 November 2011 to 30 April 2012. Throughout the entire reporting period, seismicity remained comparable to previous pauses in lava extrusion. Four strings of VT events, in this case referred to as "spasmodic bursts," occurred in the course of the interval 1 November 2011 to 30 April 2012. In early December 2011, 10 events were recorded in a 3 minute span; the largest in terms of local magnitude (ML, discussed further below) was 3.2. The 10 events were interpreted as a sequence of triggered events.
Two intense VT swarms occurred on 23 March 2012, with almost 50 VT earthquakes in each swarm. The largest VT earthquake ever recorded at Soufrière Hills, with ML of 3.9, was recorded during these swarms. The second more intense swarm was followed by mild ash venting, seven hybrid earthquakes, and three long-period (LP) earthquakes. Topics such as ML are discussed in a subsection below on seismicity.
On 30 March 2012, MVO detected unusually low-level VT seismicity sustained over several hours. This was atypical activity, as seismicity at Soufrière Hills is normally characterized by the occasional appearance of short bursts of VT strings.
November-December 2012. Seven lahars were seismically detected in the Belham Valley region during 1 November 2011 to 30 April 2012. Five took place during November-December 2011. They were associated with rainfall above 10 mm/hr.
A pyroclastic flow occurred in Gages Valley on 9 March 2012. The flow originated close to the summit of Chance's Peak and traveled 1.5 km down the W flank into Spring Ghaut. Although direct volume measurements couldn't be made, an empirical relationship between runout and flow volume suggested the pyroclastic flow deposit volume to be 104 m3.
A slight increase in rockfall activity occurred before the VT swarms of 23 March 2012. There were minor rockfalls on the steep N, E, SW and W sectors of the dome, averaging to less than one rockfall per day. The SW side of the dome above Gingoe's Ghaut was unstable with noticeable rockfall activity.
SO2 flux averaged 420 tons/day, a value below the multi-year eruption's average. Following the March VT swarms, a daily flux of 4,600 tons was observed, the third highest recorded by the optical spectrometer (DOAS) since its installation in 2002. After 2010, SO2 cycle fluctuations were dominated by variation with timescales on the order of weeks to months.
On 17 February 2012, a fumarole at the E base of the 2006-2007 dome was observed for the first time by MVO staff. An area with yellow and white sulfur deposits was also discovered on this cliff. Around January 2012, this site had temperatures near 60°C, but temperatures in February ranged from 90° to 275°C.
Ground deformation recorded by a GPS network continued to show a trend of ongoing inflation, a behavior similar to previous pauses.
Activity from 1 May 2012 to 12 October 2012. Among 21 bursts of small earthquakes, the most notable occurred on 11 September 2012. Over the course of 13 hours, a low amplitude VT swarm resulted in 17 events, with the maximum ML around 1.3. Eight rockfalls and two hybrid earthquakes were noted alongside typical seismic activity.
On 13 and 14 October 2012, tropical storm Rafael triggered eight seismically detected lahars in this region. The most noteworthy were those in the Belham Valley. Also, the SO2 flux was slightly decreased from the previous reporting period, with an average of 280 tons/day.
As of October 2012, the E and W flanks had been determined to be the most unstable areas of the edifice, based on the presence of fresh rockfall deposits and pyroclastic flows. A large pyroclastic flow from the W flank could travel into Plymouth, the former capital destroyed by previous pyroclastic flows.
On 29 August 2012, a large pyroclastic flow originated at the 2006-2007 dome. This has been the largest pyroclastic flow in Tar River since the end of Phase 5 extrusion. Another pyroclastic flow occurred on 19 September 2012 in Gage's Valley. It originated from the steep slope adjacent to Chance's Peak and traveled about 1 kilometer. The sources of these pyroclastic flows can be viewed in figure 92.
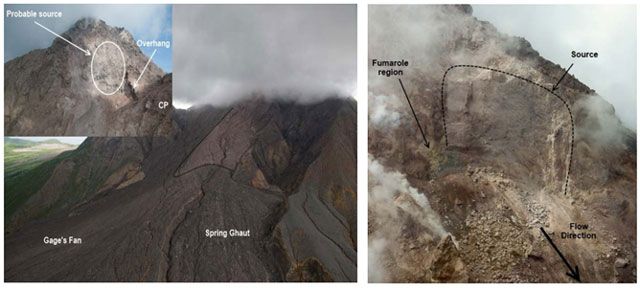 |
Figure 92. Two photographs showing features at Soufrière Hills. The photograph on the left shows the source of the 19 September 2012 pyroclastic flow. The photograph on the right shows the source and flow direction of the 29 August pyroclastic flow. Courtesy of MVO. |
A 10-minute exposure photo taken on 6 September 2012 determined no changes in location and number of incandescent areas on the N flank. However, the large fumarole in the floor of the 11 February 2010 collapse scar reached temperatures of ~300°C, and was the source of weak ash venting on 8 August 2012. Thermal IR camera imaging, showed the brightest point of incandescence, which reached temperatures over 400°C, originated from a hole in the rear of the collapse scar.
It should be noted that from August 2012 to November 2012, measurements at three local continuous GPS (cGPS) stations, AIRS, SPRI, and MVO1, had slight shortening of the radial distance between stations and vents, which may indicate short-term reversal of the long term inflation trend. Conclusions remain speculative without testing with more data.
Activity from 13 October 2012 to 30 April 2013. The largest of seven VT strings occurred on 30 November 2012. That swarm had a total of 23 earthquakes, with ML of 2.1 or less. As mentioned in the introduction, a brief VT swarm occurred on 24 December 2012, but the four swarms of main interest followed on 3-5 February 2013. The most intense, with a total of 36 events in 27 minutes, occurred on 4 February, with a maximum ML of 2.6. As a result, there was an increase in temperature of fumaroles residing on the 11 February 2010 collapse scar. This escalation continued until later in the evening, and at 1750 loud roaring sounds were heard, accompanied by minor ash venting. Activity and temperature returned to background levels the next day. This activity was noticeably similar to the events of 23 March 2012. Both were preceded by smaller VT strings, about 11 hours earlier, and the most intense phase had a 10-minute duration. There followed a VT string on 5 February associated with minor ash venting from the main gas vent in the floor of the 11 February 2010 collapse scar, as shown in figure 93.
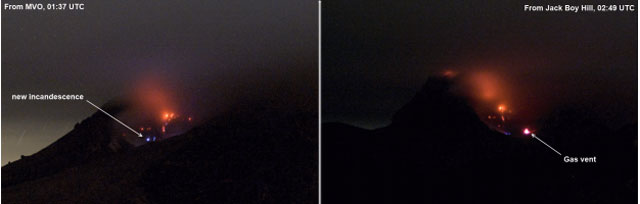 |
Figure 93. Two thermal images, viewed from MVO and Jack Boy Hill, show the source of the ash venting on 5 February 2013, as well as a newly observed incandescence. Courtesy of MVO. |
The next prominent seismic activity occurred on 15 and 19 April 2013. The earthquakes had ML of 3.0 and 2.9, respectively, and neither were part of a VT string. The last time isolated VT earthquakes occurred was 28 June and 9 October 2011. Beside VT strings, 15 low-frequency earthquakes, which encompassed long-period and hybrid events, were observed during the October 2012 to April 2013 recording period. As of April 2013, 51 VT strings have occurred, and 13 have directly preceded surface activity.
Heavy rainfall on 28 and 30 March 2013 generated large lahars, lasting several hours, in various valleys around Soufrière Hills, including Belham Valley. The average daily SO2 flux, as of April 2013, was 511 metric tons/day, with a high of 2,381 tons on 6 February 2013. This was the highest value observed since the ash venting of 23 March 2012. The connection between SO2 flux and VT activity is still not thoroughly understood, but there seems to be an increase of SO2 a few days before seismic events at Soufrière Hills.
Pyroclastic flow activity had followed the trends of previous pauses. On 28 March 2013, a pyroclastic flow traveled 1.5 km E through Tar River Valley. This pyroclastic flow began at a peeled-away slab of lava on the near-vertical E face of the dome. This was one of the largest pyroclastic flows since the start of Pause 5, and it removed a large portion of the lava slab on the 2006-2007 dome. This flank became heavily fractured as a result of weather and erosion, continued cooling, and contraction of the E flank of the dome above Tar River. Consequently, the Tar River side of the dome will likely be the source of future pyroclastic flow activity. Rockfall activity has been at its lowest since 10 February 2010, consistent with the stabilization of the dome over the past three years.
After 5 February 2013, temperatures in the collapse scar were ~100°C higher than previously recorded. That increase may be due to MVO's use of a new more sensitive IR camera (a FLIR T650sc), replacing their old (Mikron) camera. The new camera records temperatures that are corrected for atmospheric conditions.
Figure 94 emphasizes the difference in sensitivity between the two cameras. However, the distance at which these images were captured, about 5.7 km from the dome, results in unreliable temperature readings. This is because infrared light is absorbed, scattered, and refracted by dust, air, and water (in solid, liquid, or gaseous states). Variables such as solar reflection, heat from direct sunlight, condensates, and high concentrations of SO2 in the atmosphere can also result in errors in image readings.
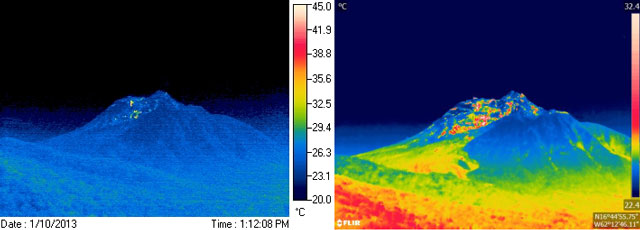 |
Figure 94. For Soufrière Hills, a juxtaposition of thermal images to highlight the difference in resolution and displays between the old infrared-detecting (IR) camera (left) and the more sensitive and accurate new one (right). Although there are temperature scales to the right of each image (22.4-32.4 on the scale at right), they are not applicable in this instance owing to multiple factors (see text). Even at this distance, IR images give scientists greater clarity on dome behavior. Despite the loss of the temperature scale, the images serve as an important tool for monitoring the state of the dome. Both IR photos taken during early 2013. Courtesy of MVO. |
According to Adam J. Stinton, a volcanologist at MVO, the new camera produces images twice the size of the older camera due to a larger internal sensor, and therefore the right-hand image was scaled down to a comparable size. Thermal imaging technology works by recording the intensity of radiation in the infrared part of the electromagnetic spectrum and converting it to a radiometric image, with every pixel in the image conveying a temperature measurement.
Using the FLIR camera, a strong fumarole on the summit of the 2006-2007 dome was recorded on 15 March 2013, the first time this fumarole was ever imaged. Its temperature was between 250 and 260°C. No other new thermal features or incandescence had been recorded during this period.
As of April 2013, the trend of long-term edifice inflation continued. This suggested that the magmatic system is still actively deforming surficial areas. MVO observed similar deformation signals during previous pauses in extrusion.
Activity during April 2013 to March 2014. On 14 January 2014, a helicopter assessment of several groups of fumaroles revealed temperatures of 140-340°C within the summit crater. These fumaroles were observed for the first time since 2011. Aside from this detection, there has been a low level of activity at Soufrière Hills, including occasional rockfalls and seismic activity.
Background on seismicity. According to Druitt and Kokelaar (2002), hybrid earthquakes are long-period earthquakes located at (shallow) depths of less than 2 km. LP earthquakes, on the other hand, are widely interpreted as earthquakes associated with the movement of pressurized fluids (eg., BGVN 20:08).
According to MVO, using ML offers possible advantages when calculating cumulative VT energy. The Gutenberg-Richter magnitude-energy relationship portrays an earthquake's size based on the amplitude of the resulting waves recorded on a seismogram. The concept is that the wave amplitude portrays the earthquake's size once the amplitudes are corrected for the decrease in magnitude with distance owing to geometric spreading and attenuation (Stein and Wysession, 2003). Local magnitude (often also termed Richter magnitude or the Richter scale). MVO employs the following (base 10) logarithmic equation, which associates ML to cumulative VT energy, E, as follows: Log E = 1.5 × ML + 11.8
MVO notes that this equation is a reliable calculation of cumulative energy, as opposed to amplitude measurements at a single station. Amplitude measurement data are easily affected by variables such as data gaps. As further background, magnitudes can be negative for very small displacements (eg. a small rockfall). Stein and Wysession (2003, p. 263) make the point that seismic magnitude scales are logarithmic, ". . . so an increase from magnitude "5" to "6," indicates a ten-fold increase in seismic wave amplitude. Measured displacements range more than 10 units because the displacements measured by seismometers span more than a factor of 1010." In practice, the amplitude is measured in microns of displacement after the effects of the seismometer are removed. Different magnitude scales (eg., ML, mb, Ms, Mw, etc.) yield different values (Stein and Wysession, 2003).
References: Cole, P., Bass, V., Christopher, T., Melander, S., Pascal, K., Smith, P., Stewart, R., Stinton, A., and Syers, R., undated, MVO Scientific Report for Volcanic Activity Between 1 May 2012 and 12 October 2012, Open File Report OFR 12-02; Montserrat Volcano Observatory, 47 pp. (URL: http://www.mvo.ms/pub/Open_File_Reports/MVO_OFR_12_02-MVO_Scientific_Report.pdf)
Cole, P., Bass, V., Christopher, Odhert, H., Smith, P., Stewart, R., Stinton, A., Syers, R., and Williams, P., undated, MVO Scientific Report for Volcanic Activity Between 1 November 2011 and 30 April 2012. Montserrat Volcano Observatory, (URL: http://www.mvo.ms/pub/Open_File_Reports/MVO_OFR_12_01-MVO_Scientific_Report.pdf)
Druitt, T. and Kokelaar, B., 2002, The Eruption of Soufriere Hills Volcano, Montserrat, form 1995 to 1999, Issue 21. Geological Society Memoir No. 21. UK: The Geological Society Publishing House, 2002.
Stein, S. and Wysession, M., 2003, An Introduction to Seismology, Earthquakes and Earth Structure, 2003, Blackwell Publishing, Oxford, 498 pp. [ISBN 0-86542- 078-5]
Stewart, R., Bass, V., Christopher, T., Cole, P., Dondin, F., Higgins, M., Joseph, E., Pascal, K., Smith, P., Stinton, A., Syers, R., and Williams, P., (27 May) 2013, MVO Scientific Report for Volcanic Activity Between 13 October 2012 and 30 April 2013, Open File Report, OFR 13-06. Montserrat Volcano Observatory. (URL: http://www.mvo.ms/pub/Open_File_Reports/MVO_OFR_13_06-Six_monthly_report.pdf )
Information Contacts: Montserrat Volcano Observatory (MVO), Fleming, Montserrat, West Indies (URL: http://www.mvo.ms/); Washington Volcanic Ash Advisory Center (VAAC); and Adam Stinton, MVO.
2023: September
2022: January
2015: September
2013: February
| March
| April
| May
2012: January
| February
| March
| April
| May
| July
| August
| September
2011: January
| February
| March
| April
| May
| June
| September
| November
2010: January
| February
| March
| April
| May
| June
| July
| August
| September
| October
| November
| December
2009: January
| February
| March
| April
| May
| June
| September
| October
| November
| December
2008: January
| February
| March
| April
| May
| June
| July
| August
| September
| October
| November
| December
2007: January
| February
| March
| April
| May
| June
| July
| August
| September
| October
| November
| December
2006: January
| February
| March
| April
| May
| June
| July
| August
| September
| October
| November
| December
2005: January
| February
| March
| April
| May
| June
| July
| August
| September
| October
| November
| December
2004: January
| February
| March
| April
| May
| June
| July
| August
| September
| October
| November
| December
2003: January
| February
| March
| April
| May
| June
| July
| August
| September
| October
| November
| December
2002: January
| February
| March
| April
| May
| June
| July
| August
| September
| October
| November
| December
2001: January
| February
| March
| April
| May
| June
| July
| August
| September
| October
| November
| December
2000: November
| December
MVO reported that a very small increase in activity at Soufrière Hills during 1-8 September was characterized by small rockfalls coincident with volcano-tectonic earthquake activity and occasional small, low-frequency, volcanic earthquakes. The seismic network recorded 27 volcano-tectonic earthquakes spilt between two swarms recorded on 6 and 8 September. Minor rockfall activity and volcano-tectonic seismicity began at about 2100 on 7 September and was ongoing. Rockfalls took place on the lava dome based on seismic data, though their locations could not be visually confirmed. The swarm on 8 September was followed by a long-period earthquake at 0742, and a few additional smaller events. Access to the Upper Belham valley and Plymouth were suspended for the day out of an abundance of caution. Sulfur dioxide emissions averaged 436 tonnes per day on 1 September (measured from a boat) and 367 tonnes per day on 6 September (measured by helicopter). The Hazard Level remained at 1 (on a scale of 1-5).
Source: Montserrat Volcano Observatory (MVO)
MVO issued a statement about Soufrière Hills on 28 January explaining overall trends observed in monitoring data since lava extrusion ended in 2010. They noted that although activity at the volcano had been low when analyzed on a week-to-week basis, subtle trends have emerged in the data in recent months that indicate an overall but small increase in unrest. The number of volcano-tectonic earthquakes were low, averaging one per day since the last eruption ended, though during 2018-2021 the average increased from 0.4 to 1.2 per day. Fumarolic temperatures which initially showed a cooling trend during 2013-2017 began to rise in 2018. The increase was most notable at one specific fumarole that had a temperature increase from 200 to 500 degrees Celsius; the high temperature was similar to those last recorded in 2013. Sulfur dioxide gas flux during 2020-2021 averaged 100-200 tonnes per day higher than the fluxes recorded 2018-2019, though remained below 2012-2013 levels. Slow inflation of the whole island had continued since 2010, with no changes to the patterns of deformation; changes associated with volcano-tectonic swarms were only observed in areas close to the dome. An increase in rockfall activity was also noted. MVO reiterated that these changes since about 2018 were minor and did not merit an increase in the Hazard Level, which remained at 1 (on a scale of 1-5).
Source: Montserrat Volcano Observatory (MVO)
Based on satellite image analyses and wind data, the Washington VAAC reported that on 19 September possible re-suspended ash from Soufrière Hills drifted WNW at an altitude of 1 km (3,000 ft) a.s.l.
Source: Washington Volcanic Ash Advisory Center (VAAC)
MVO reported that during 26 April-3 May activity at the Soufrière Hills lava dome was at a low level. During 1-2 May the wind direction shifted to the N and NE, blowing the plume over inhabited areas where residents occasionally reported volcanic-gas odors. The Hazard Level remained at 2 (on a scale of 1-5).
Source: Montserrat Volcano Observatory (MVO)
MVO reported that during 19-26 April activity at the Soufrière Hills lava dome was at a low level. There had been no good views of the lava dome for over a month, but reports from helicopter pilots suggested that the most of the large slab that was on the E side of the lava dome was gone, likely removed during the pyroclastic flow on 28 March. The Hazard Level remained at 2 (on a scale of 1-5).
Source: Montserrat Volcano Observatory (MVO)
MVO reported that during 22-29 March activity at the Soufrière Hills lava dome was at a low level. A pyroclastic flow traveled down the Tar River Valley (E) at about 0500 on 28 March. The flow was not observed directly, but the deposits indicated that it traveled halfway down the valley, 1-1.5 km from the dome. There were no reports of ashfall; any ash was probably blown over Plymouth and out to sea. The source of the flow was not known due to cloud cover, but was likely from the failure a large slab that had been slowing moving away from the dome. Heavy rainfall during the evening of 28 March generated large lahars in several valleys around the volcano, including in the Belham Valley (NW). These started at about 1900 and lasted for several hours. The Hazard Level remained at 2 (on a scale of 1-5).
Source: Montserrat Volcano Observatory (MVO)
MVO reported that during 8-15 March activity at the Soufrière Hills lava dome was at a low level. During a helicopter overflight on 8 March, scientists observed a large fissure in the cliff on the E side of the lava dome, part of which had existed since 2007. This fissure was the result of slow cooling and erosion of the dome. It was parallel to the cliff face and estimated to be 2 m wide, suggesting that a large slab was slowing moving away from the dome. The Hazard Level remained at 2 (on a scale of 1-5).
Source: Montserrat Volcano Observatory (MVO)
MVO reported that during 15-22 February activity at the Soufrière Hills lava dome was at a low level and sulfur dioxide gas flux returned to baseline levels, similar to the levels measured before the activity that occurred between 3 and 6 February. The Hazard Level remained at 2 (on a scale of 1-5).
Source: Montserrat Volcano Observatory (MVO)
MVO reported that during 8-15 February activity at the Soufrière Hills lava dome was at a low level, although sulfur dioxide gas flux remained elevated following the activity during 3-6 February. The seismic network recorded one rockfall and one volcano-tectonic earthquake. The Hazard Level remained at 2 (on a scale of 1-5).
Source: Montserrat Volcano Observatory (MVO)
MVO reported that during 1-8 February activity at the Soufrière Hills lava dome was at a low level, although there was a slight increase during 3-6 February characterized by volcano-tectonic earthquakes, elevated gas flux, and possible light ash venting. The volcano-tectonic earthquakes occurred in four brief swarms: at 2220 on 3 February, at 0915 and 0950 on 4 February, and at 0620 on 5 February. The second swarm was the most intense, and was followed by a hybrid seismic event. Another hybrid event was not associated with a swarm.
After the second, and largest, volcano-tectonic swarm on 4 February, there were increases in the temperatures of several fumaroles inside the 11 February 2010 collapse scar, as observed using a handheld thermal infra-red camera at MVO, 5.7 km away. There was a further increase, as well as some loud roaring sounds, around the time of the third swarm. The activity likely included minor ash venting from a large fumarole in the floor of the collapse scar because fresh ash deposits were observed adjacent to this fumarole on the morning of 5 February. All fumaroles had returned to background levels of activity and temperature by later that day.
Sulfur dioxide measurements showed an average flux of 929 tonnes/day during the week, with a maximum of 2,381 tonnes/day and a minimum of 273. The flux was not steady, with peaks of 962, 1,266 and 2,381 on 1, 4 and 6 February, respectively. The last measurement is the highest daily value since the ash-venting episode that occurred during 23-25 March 2012. The Hazard Level remained at 2 (on a scale of 1-5).
Source: Montserrat Volcano Observatory (MVO)
MVO reported that during 14-21 September activity at the Soufrière Hills lava dome was at a low level, although multiple rockfalls originated from the W side of the lava dome. The largest event generated a pyroclastic flow that traveled 1 km. Overhanging areas on both on the E and W faces of the dome were observed. The Hazard Level remained at 2 (on a scale of 1-5).
Source: Montserrat Volcano Observatory (MVO)
MVO reported that during 31 August-7 September activity at the Soufrière Hills lava dome was at a low level, although seismicity remained slightly elevated. Clear views of parts of the dome showed very little change, apart from some modification to the steep eastern face from the formation of the pyroclastic flow on 29 August. The Hazard Level remained at 2 (on a scale of 1-5).
Source: Montserrat Volcano Observatory (MVO)
MVO reported that during 24-31 August activity at the Soufrière Hills lava dome was at a low level, although seismicity remained slightly elevated. At 1545 on 29 August a small pyroclastic flow traveled 1-1.5 km E down the Tar River Valley. The flow lasted 75 seconds, generated an ash cloud that rose 900-1,200 m and drifted W over Plymouth, and had an extensive fine-grained surge component. The Hazard Level remained at 2 (on a scale of 1-5).
Source: Montserrat Volcano Observatory (MVO)
MVO reported that during 13-20 July activity at the Soufrière Hills lava dome was generally at a low level. Seismicity had slightly increased, and was at the highest level since the ash-venting episode in March, but remained consistent with a pause in lava extrusion. The Hazard Level remained at 2 (on a scale of 1-5).
Source: Montserrat Volcano Observatory (MVO)
MVO reported that during 3-10 August activity at the Soufrière Hills lava dome was mostly at a low level. The seismic network detected two small swarms of volcano-tectonic earthquakes on 7 and 8 August. Scientists at MVO observed a period of ash venting that began at 1700 on 8 August, less than two hours after the second swarm. Roaring sounds were heard at the same time. The ash plume drifted W over Plymouth at an altitude of about 1 km (3,280 ft) a.s.l., and a small amount of ashfall was reported by a fisherman offshore. The source of the venting appeared to be the gas vent in the floor of the 11 February 2010 collapse scar, and not the crater created on 23 March 2012.
On 9 August the inside of the collapse scar was partially visible during a helicopter flight. Fumarolic activity in the 23 March crater had increased compared to two weeks ago, and some other fumaroles were also more active. A change in wind direction shifted the volcanic plume N for much of the day and the odor of volcanic gas was noticeable in some inhabited areas. The Hazard Level remained at 2 (on a scale of 1-5).
Source: Montserrat Volcano Observatory (MVO)
MVO reported that during 13-20 July activity at the Soufrière Hills lava dome was at a low level. Heavy rain on the morning of 19 July generated lahars in several valleys on the W flank of the volcano. Lahars in the Belham valley (NW) were small and restricted to the upper reaches of the valley. The Hazard Level remained at 2 (on a scale of 1-5).
Source: Montserrat Volcano Observatory (MVO)
MVO reported that during 6-13 July activity at the Soufrière Hills lava dome was at a low level. Mild roaring was heard in nearby locations. A few small pyroclastic flows occurred on the E side of the lava dome, at the head of the Tar River Valley, and traveled less than 1 km. The Hazard Level remained at 2 (on a scale of 1-5).
Source: Montserrat Volcano Observatory (MVO)
MVO reported that during 4-11 May activity at the Soufrière Hills lava dome was at a low level. Multiple areas of incandescence on the lava dome, at temperatures greater that 500 degrees Celsius, were visible on 5 May. Heavy rains on 10 May generated a small lahar in the Belham Valley (NW). The Hazard Level remained at 2 (on a scale of 1-5).
Source: Montserrat Volcano Observatory (MVO)
MVO reported that the cloud cover which often obscures views of the Soufrière Hills lava dome cleared for a short period on 5 May, revealing multiple areas of incandescence, the same ones first observed on 11 November 2011. Some of the areas were visible to the naked eye while more were visible in a long-exposure photograph. Many of the bright areas were related to fumaroles. The Hazard Level remained at 2 (on a scale of 1-5).
Source: Montserrat Volcano Observatory (MVO)
MVO reported that during 20-27 April activity at the Soufrière Hills lava dome was at a low level. Observations on 24 April revealed fresh rockfall and pyroclastic flow deposits SW, at the head of Gingoe's Ghaut. The Hazard Level remained at 2.
Source: Montserrat Volcano Observatory (MVO)
MVO reported that during 30 March-6 April activity at the Soufrière Hills lava dome was generally at a low level and no ash-venting episodes had been detected since 23 March. The average sulfur dioxide emission rate measured during the week was 529 tonnes per day with a minimum of 200 and a maximum of 1,033. Scientists aboard a helicopter overflight on 4 April observed a new vent which had formed on 23 March; it was 30-50 m across and on the W side of the crater floor. The Hazard Level remained at 2.
Source: Montserrat Volcano Observatory (MVO)
MVO reported that during 24-30 March activity at the Soufrière Hills lava dome was generally at a low level and no ash-venting episodes had been detected since 23 March. The average sulfur dioxide emission rate measured during the week was 1,320 tonnes per day with a minimum of 264 and a maximum of 4,594, which was the third-highest value recorded in the last ten years. High values occurred between 24 and 26 March, averaging 2,550 tonnes per day over the three days. The average for the rest of the week was around 400 tonnes per day. The Hazard Level remained at 2.
Source: Montserrat Volcano Observatory (MVO)
MVO reported that during 16-23 March activity at the Soufrière Hills lava dome was at a low level, although seismicity increased. Two swarms of volcano-tectonic earthquakes occurred, the first between 1604 and 1651 on 22 March (49 events) and the second between 0310 and 0527 on 23 March (54 events). Earthquakes in the second swarm were markedly larger than those in the first. Several changes on the volcano were observed on 23 March; fumarolic activity had increased and a new fumarole had appeared on the NW face of the lava dome behind Gages Mountain. In addition a vent producing pulsing steam emissions with a small amount of ash had formed in the back of the February 2010 collapse scar. Ash plumes rose 1.8 km (6,000 ft) a.s.l. and very light ashfall occurred on the W flank of the volcano. Audible roaring associated with the venting was heard intermittently from MVO, 5.75 km NW of the volcano. The Hazard Level remained at 2.
Based on a METAR weather report and analyses of satellite imagery, the Washington VAAC reported that on 24 March a gas-and-ash plume drifted 65 km WSW. Later that day the VAAC reported a detached area of ash drifting NW and a second small emission of ash drifting WNW. The next day haze and vog W of Soufrière Hills was detected in satellite imagery and a pilot reported ash at altitudes of 1.5-3 km (5,000-10,000 ft) a.s.l. drifting NW.
On 26 March MVO noted that activity returned to a low level following the ash-venting on 23 March. The report noted that Zone C on the volcanic risk map, which was temporarily closed the previous week due to an increase in volcano-tectonic earthquakes below Soufrière Hills, re-opened for day-time entrance on 27 March. Zone C is to the WNW of Soufrière Hills and includes Cork Hill, Weekes, Foxes Bay, Richmond Hill, and Delvins, and extends 500 m out to sea.
Sources: Montserrat Volcano Observatory (MVO); Washington Volcanic Ash Advisory Center (VAAC)
MVO reported that on 9 March at 1720 a small pyroclastic flow from the Soufrière Hills lava dome traveled about 1.75 km W down Spring Ghaut and produced a small ash cloud that rose 1.2 km and drifted W. During 9-16 March activity was at a low level. The Hazard Level remained at 2.
Source: Montserrat Volcano Observatory (MVO)
MVO reported that during 27 January-3 February activity at the Soufrière Hills lava dome was at a low level. On 28 January a pyroclastic flow from the W side of the lava dome traveled 300 m. The Hazard Level remained at 2.
Source: Montserrat Volcano Observatory (MVO)
MVO reported that during 20-27 January activity at the Soufrière Hills lava dome was at a low level. Small areas of incandescence emanated from the lava dome at night, similar to observations noted in recent months. On 27 January a small lahar descended from the W side of the lava dome. The Hazard Level remained at 2.
Source: Montserrat Volcano Observatory (MVO)
MVO reported that during 28 October-4 November activity at the Soufrière Hills lava dome was at a low level. On 4 November the Hazard Level was lowered to 2 because of a considerable reduction in the number of spontaneous pyroclastic flows from the remaining lava dome over approximately the last year. The reduction in Hazard Level allowed people to have daytime access to Zone C to the W of the lava dome, including Cork Hill, Weekes, Richmond Hill, Delvins, and Foxes Bay. Other minor changes to hazard zone borders were also implemented.
Source: Montserrat Volcano Observatory (MVO)
MVO reported that during 16-23 September activity at the Soufrière Hills lava dome was at a low level. On 19 September a pyroclastic flow occurred from the W side of the lava dome. The Hazard Level remained at 3.
Source: Montserrat Volcano Observatory (MVO)
MVO reported that during 3-10 June activity at the Soufrière Hills lava dome was at a low level. Unusual wind directions caused a sulfur odor in inhabited areas multiple times during the reporting period. On 9 June a pyroclastic flow traveled down the S flank, the first to go S in more than a year. The pyroclastic flow generated an ash cloud that drifted N and caused light ashfall in NW Montserrat. The Hazard Level remained at 3.
Source: Montserrat Volcano Observatory (MVO)
MVO reported that during 13-20 May activity at the Soufrière Hills lava dome was at a low level. On 15 May a pyroclastic flow that occurred in the February 2010 collapse scar caused light ashfall in inhabited areas. The Hazard Level remained at 3.
Source: Montserrat Volcano Observatory (MVO)
MVO reported that during 6-13 May activity at the Soufrière Hills lava dome was at a low level. On 11 May a pyroclastic flow that occurred in the February 2010 collapse scar traveled about 1 km. An ash cloud rose 1.8 km and drifted NNE, causing light ashfall in Lookout village. The Hazard Level remained at 3.
Source: Montserrat Volcano Observatory (MVO)
MVO reported that during 8-15 April activity at the Soufrière Hills lava dome was at a low level. On 11 April a piece of the E side of the lava dome broke off and generated a small pyroclastic flow that traveled at most 1.5 km down the Tar River valley to the E. A resulting ash plume drifted W over uninhabited areas. The Hazard Level remained at 3.
Source: Montserrat Volcano Observatory (MVO)
MVO reported that during 25 March-1 April activity at the Soufrière Hills lava dome was at a low level. A swarm of 36 earthquakes occurred within an hour on 28 March, the largest volcano-tectonic swarm since February 2010. The Hazard Level remained at 3.
Source: Montserrat Volcano Observatory (MVO)
MVO reported that during 18-25 March activity at the Soufrière Hills lava dome was at a low level. A small lahar occurred in the Belham valley (NW) on 19 March. A relatively large pyroclastic flow traveled likely in excess of 2 km down the Tar River valley to the E and a resulting ash plume drifted W over uninhabited areas. The pyroclastic flow was related to the degradation of the lava dome on the E side as recent observations noted undercutting and overhanging areas on that side. The Hazard Level remained at 3.
Source: Montserrat Volcano Observatory (MVO)
MVO reported that during 25 February-4 March activity at the Soufrière Hills lava dome was at a low level. Clear views from a helicopter on 3 March revealed modest changes in the lava dome; continued degradation of the W face was evident and the E face showed undercutting with overhanging areas. Small areas of incandescence were visible on the N face of the dome during clear evenings. The Hazard Level remained at 3.
Source: Montserrat Volcano Observatory (MVO)
MVO reported that during 18-25 February activity from the Soufrière Hills lava dome was at a low level. Of 31 volcano-tectonic earthquakes detected by the seismic network, 18 occurred in a small swarm on 23 February. On 24 February a pyroclastic flow that traveled less than 1.5 km on the N flank originated from one of the highest parts of the dome, and traveled down the collapse scar formed on 11 February. The event produced an extensive pyroclastic surge and a relatively strong ash plume that rose to an altitude of about 1.5 km (5,000 ft) a.s.l. The Hazard Level remained at 3.
Source: Montserrat Volcano Observatory (MVO)
MVO reported that on 15 February clear views of the Soufrière Hills lava dome allowed scientists to conduct a thermal survey, the first since 2 December 2010, and compare the results to identify changes. A warmer area on the W side of the lava dome (Gages) had moved upslope. This area had been the source of a number of pyroclastic flows and rockfalls since February 2010. The second difference was the apparent increase in the number of fumaroles inside the collapse scar and around the 2006-2007 dome. One of the most obvious areas of increase was on the NE side of the lava dome.
MVO also reported that in total 18 volcano-tectonic earthquakes from Soufrière Hills were detected in two swarms that occurred on 12 and 16 February. Brief clear views of the lava dome revealed no significant morphological changes. Fresh pyroclastic-flow deposits on the E side of the dome at the head of the Tar River valley were noted. The Hazard Level remained at 3.
Source: Montserrat Volcano Observatory (MVO)
MVO reported that during 4-11 February activity from the Soufrière Hills lava dome was at a low level. Helicopter observations revealed fresh pyroclastic-flow deposits about 1.5 km long in the Tar River valley to the E that formed on 10 February. The pyroclastic flow had an extensive surge component that inundated the lower flanks of Roaches Mountain. Clouds prevented observations of the lava dome. The Hazard Level remained at 3.
Source: Montserrat Volcano Observatory (MVO)
MVO reported that during 7-14 January activity from the Soufrière Hills lava dome was at a low level. Helicopter observations revealed fresh pyroclastic-flow deposits less than 1 km long on the E side of the lava dome. A small pyroclastic flow occurred at the head of the Tar River valley to the E on 6 January. The Hazard Level remained at 3.
Source: Montserrat Volcano Observatory (MVO)
MVO reported that during 31 December 2010-7 January 2011 activity from the Soufrière Hills lava dome was at a low level. A small lahar descended the Belham valley (NW) on 5 January. Gas measurements on 6 January indicated that the ratio of hydrochloric acid to sulfur dioxide was 0.29, a ratio similar to those measured over the last few months and consistent with no lava extrusion. Helicopter observations that same day showed marked acid rain damage in the Spring (W) and Gingoes (SW) ghaut areas, up to 3 km from the lava dome. Cloudy weather prevented observations of the lava dome. The Hazard Level remained at 3.
Source: Montserrat Volcano Observatory (MVO)
MVO reported that during 24-31 December activity from the Soufrière Hills lava dome was at a low level. Rockfalls or small pyroclastic flows detected by the seismic network occurred in the 11 February collapse scar on the N side of the volcano. Clouds prevented clear views of the lava dome. Lahars associated with heavy rains descended multiple drainages on 30 December. The Hazard Level remained at 3.
Source: Montserrat Volcano Observatory (MVO)
MVO reported that during 17-24 December activity from the Soufrière Hills lava dome was at a low level. A small pyroclastic flow traveled 1.5 km down the Gages valley to the W on 19 December. The Hazard Level remained at 3.
Source: Montserrat Volcano Observatory (MVO)
MVO reported that during 10-17 December activity from the Soufrière Hills lava dome was at a low level. Several small pyroclastic flows descended gages valley to the W. The largest pyroclastic flow occurred on 15 December and traveled about 1.5 km. A small number of rockfalls occurred in the 11 February collapse scar. The Hazard Level remained at 3.
Source: Montserrat Volcano Observatory (MVO)
MVO reported that during 3-10 December activity from the Soufrière Hills lava dome was at a low level. Observations from helicopter revealed fresh rockfall and pyroclastic flow deposits in the Tar River valley (E) that originated from the E face of the lava dome. On 6 December a small pyroclastic flow occurred in the 11 February collapse scar. The next day a small lahar occurred in the upper part of the Belham valley to the NW. The Hazard Level remained at 3.
Source: Montserrat Volcano Observatory (MVO)
MVO reported that during 26 November-3 December activity from the Soufrière Hills lava dome was at a low level. Part of the large unstable overhanging area on the W side of the lava dome collapsed on 29 November, generating pyroclastic flows that traveled about 2 km W. Small pyroclastic flows also occurred on the E side of the dome. On 2 December, small areas of incandescence were visible on the back wall of the 11 February collapse scar. The Hazard Level remained at 3.
Source: Montserrat Volcano Observatory (MVO)
MVO reported that during 5-12 November activity from the Soufrière Hills lava dome was at a low level. Photographs from 11 November showed areas of nighttime incandescence from the lava dome, indicating that although extrusion stopped nine months earlier, the lava dome remained hot. Small pyroclastic flows occurred in the Tar River valley to the E on 6 November and from the N side of the dome on 9 November. Light ashfall associated with the 9 November event occurred in inhabited areas of N Montserrat. Helicopter observations revealed that the overhanging part of the dome on the W side, immediately E of Chances Peak, was more pronounced by further undercutting of rockfalls and pyroclastic flows. The Hazard Level remained at 3.
Source: Montserrat Volcano Observatory (MVO)
MVO reported that during 29 October-5 November activity from the Soufrière Hills lava dome was at a low level. The largest pyroclastic flow occurred on 5 November and traveled 1.5 km W down Gages valley. The Hazard Level remained at 3.
Source: Montserrat Volcano Observatory (MVO)
MVO reported that during 8-15 October activity from the Soufrière Hills lava dome was at a low level. Light ashfall generated by rockfalls and pyroclastic flows occurred in inhabited areas of Montserrat mainly during 8-10 October. A pyroclastic flow originating from an unstable area on the W side of the lava dome traveled 2 km on 9 October. The Hazard Level remained at 3.
Source: Montserrat Volcano Observatory (MVO)
MVO reported that during 1-8 October activity from the Soufrière Hills lava dome was at a low level. A pyroclastic flow traveled W down Gages Valley and into Spring Ghaut on 2 October. Several lahars flowed down the Belham valley to the NW. According to the Washington VAAC, MVO reported that an ash plume rose to an altitude of 2.1 km (7,000 ft) a.s.l. and drifted W. The next day an ash plume seen in satellite imagery drifted 55 km WNW and NW. A few hours later an area of ash at an altitude of 2.1 km (7,000 ft) a.s.l. was seen 140 km WNW. On 11 October a diffuse steam-and-gas plume drifted NNW. The Hazard Level remained at 3.
Sources: Washington Volcanic Ash Advisory Center (VAAC); Montserrat Volcano Observatory (MVO)
MVO reported that during 24 September-1 October activity from the Soufrière Hills lava dome was at a low level. Several pyroclastic flows originating from the W side of the lava dome moved W down Gages Valley and into Spring Ghaut. The largest pyroclastic flow traveled approximately 2 km. The Hazard Level remained at 3.
Source: Montserrat Volcano Observatory (MVO)
MVO reported that during 17-24 September activity from the Soufrière Hills lava dome was at a low level. Heavy rains caused lahars during 19-20 September in the Belham valley to the NW. One pyroclastic flow traveled 1.5 km E down the Tar River valley on 21 September. The Hazard Level remained at 3.
Source: Montserrat Volcano Observatory (MVO)
MVO reported that several small-to-moderate sized pyroclastic flows from Soufrière Hills during 3-10 September removed parts of the cold dome carapace, resulting in the thermal camera displaying several hotter regions on the lava dome. The largest pyroclastic flow traveled 2.5 km down the Gages valley to the W on 9 September. The Hazard Level remained at 3.
Source: Montserrat Volcano Observatory (MVO)
MVO reported that most of the rockfalls and pyroclastic flows detected during 20-27 August originated from a vertical face on the SE side of the lava dome and traveled W down Gages valley and E down the Tar River valley. The pyroclastic flows traveled no longer than 1.5 km and produced weakly convecting ash clouds that rose a few hundred meters. The Hazard Level remained at 3.
Source: Montserrat Volcano Observatory (MVO)
MVO reported most of the rockfalls and pyroclastic flows detected during 13-20 August originated from the W side of the lava dome and traveled W down Gages valley. The pyroclastic flows traveled no longer than 2 km and produced weakly convecting ash clouds. A small lahar descended the Belham valley to the NW on 19 August. The Hazard Level remained at 3.
Source: Montserrat Volcano Observatory (MVO)
MVO reported that mild ash-and-steam venting from Soufrière Hills as well as rockfalls were seen during 6-13 August. Most of the activity was focused in the collapse scar and above the Gages valley to the W. On 6 August a small ash plume rose 1 km above the lava dome, and on 8 August a pyroclastic flow descended Gages valley. The Hazard Level remained at 3.
Source: Montserrat Volcano Observatory (MVO)
Based on a METAR weather report and analyses of satellite imagery, the Washington VAAC reported that on 10 August a narrow plume from Soufrière Hills drifted more than 100 km WNW.
Source: Washington Volcanic Ash Advisory Center (VAAC)
MVO reported that activity at Soufrière Hills was low during 16-23 July and inclement weather prevented clear observations of the lava dome. Heavy rains generated a few lahars in the Belham valley to the NW. The largest occurred on 20 July and lasted about 40 minutes. The Hazard Level remained at 3.
Source: Montserrat Volcano Observatory (MVO)
MVO reported that activity at Soufrière Hills was low during 9-16 July. Helicopter observations on 15 July revealed no major changes to the lava dome, although there were some fresh rockfall and small pyroclastic-flow deposits at the head of the Gages valley to the W. The next day, heavy rainfall generated a few lahars in the Belham valley to the NW. The Hazard Level remained at 3.
Source: Montserrat Volcano Observatory (MVO)
MVO reported that small swarms of volcano-tectonic earthquakes from Soufrière Hills on 23 and 25 June were coincident with ash venting beginning on 25 June. Ash venting diminished on 28 June. A second period of ash venting took place on 2 July and was preceded by two volcano-tectonic and two long-period earthquakes. An emission of ash, with accompanying rumbling noises, formed a plume that drifted WNW and caused ashfall in uninhabited areas of Gages, Plymouth, and the Foxes Bay region. During 2-9 July, roaring was often heard. The Hazard Level remained at 3.
Source: Montserrat Volcano Observatory (MVO)
On 28 June, MVO reported that for the first time since February 2010 ash venting from the Soufrière Hills lava dome was observed and caused light ashfall in several areas across Montserrat. Ash venting began on 25 June and was coincident with small swarms of volcano-tectonic earthquakes on 23 and 25 June, although with no other discernable associated seismicity. Observations initially from MVO staff and during a later overflight indicated that the ash venting occurred from inside the collapse scar (near the N rim of English's crater) and from the S part of the summit crater that had formed on 11 February. On the nights of 25 and 26 June audible roaring was heard from several locations on the island. Ash venting diminished on 28 June. The Hazard Level remained at 3.
Source: Montserrat Volcano Observatory (MVO)
MVO reported that pyroclastic flows from the Soufrière Hills lava dome occurred during 11-18 June. One of the largest pyroclastic flows traveled W down Gages Valley; others originated from within the collapse scar. A thermal camera showed several hot areas on the lava dome, likely exposed from rockfall and pyroclastic flow activity. On 28 June a small lahar descended the Belham Valley, to the NW. The Hazard Level remained at 3.
Source: Montserrat Volcano Observatory (MVO)
MVO reported that rockfalls and pyroclastic flows from the Soufrière Hills lava dome occurred during 4-11 June. The largest pyroclastic flow originated in the collapse scar and traveled 1 km N. The Hazard Level remained at 3.
Source: Montserrat Volcano Observatory (MVO)
MVO reported that activity at Soufrière Hills was low during 7-14 May. A pyroclastic flow traveled as far as 2 km W down Gages Valley on 10 May. The Hazard Level remained at 3.
Source: Montserrat Volcano Observatory (MVO)
MVO reported that activity at Soufrière Hills was low during 30 April-7 May. A pyroclastic flow traveled down the Tar River Valley on 3 May, stopping about 1 km before reaching the sea. The Hazard Level remained at 3.
Source: Montserrat Volcano Observatory (MVO)
MVO reported that during 9-16 April activity at Soufrière Hills remained low. Several rockfalls occurred on the W side of the lava dome on 15 April, and a small pyroclastic flow occurred on the Gages fan on 16 April; both were probably caused by heavy rainfall. The rain also generated lahars (mudflows) on several flanks. On the afternoon of 13 April large lahars occurred in the Belham valley, creating two large fans at the coast. Many of the lahars were hot with abundant associated steam and geysering.
Source: Montserrat Volcano Observatory (MVO)
MVO reported that during 2-9 April activity from the Soufrière Hills lava dome was at a low level. Rockfalls occurred sporadically from several areas of the lava dome. Multiple small areas of incandescence on the dome were visible several nights during the reporting period. Heavy rains on 2 April caused lahars in the Farm River and Trants area (NNE). The Hazard Level remained at 3.
Source: Montserrat Volcano Observatory (MVO)
MVO reported that during 26 March-2 April activity from the Soufrière Hills lava dome was at a low level. Rockfalls and pyroclastic flows occurred sporadically on the W and S flanks. The Hazard Level remained at 3.
Source: Montserrat Volcano Observatory (MVO)
MVO reported that during 19-26 March activity from the Soufrière Hills lava dome was at a low level. Small-to-moderate-sized pyroclastic flows on the W and S flanks occurred sporadically. The largest pyroclastic flow traveled 2 km W down Spring Ghaut on 25 March. The Hazard Level remained at 3.
Source: Montserrat Volcano Observatory (MVO)
MVO reported that during 12-19 March activity from the Soufrière Hills lava dome was at a low level. Small incandescent areas on the dome were visually observed on 14 March. Occasional small pyroclastic flows and rockfalls occurred from the W and S parts of the dome. The Hazard Level remained at 3.
Source: Montserrat Volcano Observatory (MVO)
MVO reported that heavy rains during 5-12 March caused vigorous steaming from hot deposits emplaced after part of the Soufrière Hills lava dome collapsed on 11 February. Geysers were visible at Trants near the old Bramble airport, about 5 km NE, along with ash and steam ejections. Lahars descended multiple drainages around the volcano. Cooled lava shed from the dome on 8 and 9 March due to the heavy rains caused a series of pyroclastic flows to travel W down Gages Valley on 9 March, as far as 2 km. Ashfall from the pyroclastic flows was noted in NE Montserrat. There was no evidence of fresh lava extrusion. The Hazard Level remained at 3.
Source: Montserrat Volcano Observatory (MVO)
MVO reported that during 26 February-5 March activity from the Soufrière Hills lava dome was at a low level. A swarm of seven relatively large hybrid earthquakes was detected early on 4 March. Later that morning, two small pyroclastic flows descended the Tar River valley and caused ashfall in Salem and Olveston, 6-8 km NW. The Hazard Level remained at 3.
Source: Montserrat Volcano Observatory (MVO)
MVO reported that during 19-26 February activity from the Soufrière Hills lava dome was at a low level. A few rockfalls originated from the inner walls of the collapse scar on the N flank, formed during the 11 February event. Small areas of incandescence on the dome were noted. Gas emission ratios were consistent with slow lava extrusion, but growth was unconfirmed. On 26 February scientists first saw the crater at the summit of the lava dome formed by explosions on 11 February. The crater was 200 m in diameter and 50-100 m deep. The Hazard Level was lowered to 3.
Source: Montserrat Volcano Observatory (MVO)
MVO reported that during 12-19 February activity from the Soufrière Hills lava dome was at a low level. Rockfalls originated from the inner walls of the 300-m-wide collapse scar on the N flank, formed from the 11 February event, and from the dome summit. Gas measurements on 17 February and seismicity were consistent with lava-dome growth, but growth was unconfirmed.
Inspection of the deposits from the 11 February collapse event revealed that the NE coastline had extended into the sea an additional 650 m. Pyroclastic flows razed many buildings in both Harris (3 km N) and Streatham (2 km NNW), and destroyed trees in the Gun Hill area (2 km NNW). Pyroclastic-flow deposits were approximately 15 m thick in the Trants region of the coast (near the old Bramble airport, about 5 km NE). A deep crater, similar in diameter to the collapse scar, was seen in the summit of the lava dome. The Hazard Level remained at 4.
Source: Montserrat Volcano Observatory (MVO)
MVO reported that during 5-12 February activity from the Soufrière Hills lava dome increased significantly. Activity was concentrated on the W side of the lava dome during the first part of the week then shifted to the N side on 9 February.
On 11 February part of the lava dome collapsed leaving a large collapse scar on the NE flank. Pyroclastic flows traveled NE and then, along with pyroclastic surges, across the sea at several places on the E side of Montserrat. Pyroclastic flow deposits covered several hundred meters of the coastline near the old Bramble airport, about 5 km NE. Pyroclastic flows also traveled NW into Tyers Ghaut and down the Belham valley as far a Cork Hill, 4 km NW. An ash plume rose to an altitude of 15.2 km (50,000 ft) a.s.l. and drifted E and then SE. Ashfall occurred in NE Montserrat, SW Antigua (50 km NW), Guadeloupe (65 km SE), and Dominica (145 km SE). According to news articles, flights in and out of the region were temporarily suspended due to the ash plumes.
Sources: Montserrat Volcano Observatory (MVO); Agence France-Presse (AFP)
MVO reported that during 29 January-5 February activity from the Soufrière Hills lava dome was variable as the lava dome continued to grow. Cycles of vigorous ash venting, rockfalls, and pyroclastic flows occurred every seven to twelve hours. Pyroclastic flows traveled mostly W down Gages into Spring Ghaut, as far as 3 km, but also occurred in Whites Ghaut to the NE. Rockfall activity was abundant on the N flank. On 4 February, ash fell across NW Montserrat. Observations the next day revealed that the central W part of the lava dome had grown and was 1,070 m a.s.l.
Pyroclastic flows following a Vulcanian explosion on 5 February traveled W, reaching Plymouth and spreading 500 m across the sea. Pyroclastic flows also traveled as far as 2 km NW down Tyers Ghaut and NE down Whites Ghaut. An ash plume rose to an altitude of 6.4 km (21,000 ft) a.s.l. A small Vulcanian explosion on 8 February generated pyroclastic flows that mostly traveled W down Gages Valley. Small pyroclastic surges observed using a thermal camera descended the N flanks. An ash plume rose to an altitude of 4.6 km (15,000 ft) a.s.l. and drifted E and ENE. Ashfall was reported in NW Montserrat and in SW Antigua, 50 km NW. The Hazard Level remained at 4.
Source: Montserrat Volcano Observatory (MVO)
MVO reported that during 22-29 January activity from the Soufrière Hills lava dome was variable as the lava dome continued to grow. Cycles of vigorous ash venting, rockfalls, and pyroclastic flows occurred every five to seven hours. Pyroclastic flows traveled down multiple valleys, including Whites Ghaut to the NE, and W down Gages into Spring Ghaut. The increasing number of pyroclastic flows that traveled E down the Tar River Valley, frequently reaching the sea, were attributed to new lava-dome growth in the SE part of the lava dome. Ash fell across most of Montserrat on 23 January. Vigorous steaming from hot pyroclastic flows emplaced in the Belham Valley on 8 January was caused by heavy rains on 25 January. Small steam explosions generated steam plumes that sometimes contained ash. The Hazard Level remained at 4.
Source: Montserrat Volcano Observatory (MVO)
MVO reported that during 15-22 January activity from the Soufrière Hills lava dome was variable as dome growth continued. Cycles of vigorous ash venting, rockfalls, and pyroclastic flows occurred every six to eight hours. Light ashfall occasionally occurred in NW Montserrat. On 18 January, a small lava-dome collapse from the W side of the volcano generated a large pyroclastic flow that traveled 4 km down Gages Valley into Spring Ghaut, and into Aymer's Ghaut, reaching the sea at Kinsale to the S of Plymouth. Ash clouds associated with the pyroclastic flows rose to an altitude of 3 km (10,000 ft) a.s.l. Several houses in Kinsale seen from a helicopter on 22 January had been buried or were burning. The Hazard Level remained at 4.
Source: Montserrat Volcano Observatory (MVO)
MVO reported that during 8-15 January activity from the Soufrière Hills lava dome increased significantly. One explosion on 8 January and two on 10 January generated ash plumes that rose to altitudes of 5.5-7.6 km (18,000-25,000 ft) a.s.l. Ash fell in occupied areas to the NW, along with lapilli fall on 10 January. The explosions occurred from an area on the NE side of the volcano. Pyroclastic flows from column collapses moved rapidly NE (down Whites Bottom and Tuitts Ghaut), NW (down Tyers Ghaut and Belham Valley), W (down Gages Ghaut), and the SE (down the Tar River Valley). After the explosions activity decreased until 12 January, when cycles of increased numbers of rockfalls, pyroclastic flows, and ash venting were noted.
Observations during 8-15 January revealed that lava-dome growth resumed at the top, central part of the dome. On 18 January, a partial lava-dome collapse generated a pyroclastic flow that traveled W down Gages Valley, into Spring Ghaut, and then WSW down Aymers Ghaut, reaching the sea. Ash plumes rose to an altitude of 3 km (10,000 ft) a.s.l. and drifted W. Smoke from burning houses in Kinsale was visible after the event. The Hazard Level remained at 4.
Source: Montserrat Volcano Observatory (MVO)
MVO reported that during 31 December-8 January pyroclastic flows from the Soufrière Hills lava dome continued to travel predominantly down areas to the N including Whites Ghaut (NE), Farrells plain (N), and Tyers Ghaut (NW). Observations on 2 January showed that a 40-m-high, 150-m-wide lobe of lava had been extruded northwards onto the N summit of the dome. This lobe was the main source of rockfall and pyroclastic flow activity. On 3 and 4 January ash plumes rose to an altitude of 4.6 km (15,000 ft) a.s.l. and drifted NW. Ashfall occurred in areas to the NW several times during the reporting period.
On 8 January, a large pyroclastic flow event occurred after a collapsing fountain of tephra was observed on the NE side of the volcano. Pyroclastic flows traveled NE down Whites Bottom Ghaut to the sea and down Tuitts Ghaut to within a few hundred meters of the sea. Pyroclastic flows also traveled NW down Tyers Ghaut and into the Belham Valley, W towards Plymouth, and E down the Tar River valley. The event lasted about 11 minutes and seismicity returned to background levels quickly. There was no precursory seismicity associated with the event. Ashfall was reported in inhabited areas in the NW.
Seismic signals indicated that another explosion occurred on 10 January. Pyroclastic flows descended the NE, NW, and W flanks, and ashfall was reported in areas to the NW. Another explosion later that day also caused ashfall in inhabited areas. The Hazard Level remained at 4.
Source: Montserrat Volcano Observatory (MVO)
MVO reported that during 24-31 December activity from the Soufrière Hills lava dome continued at a high level. Cycles of increased activity associated with vigorous ash venting and pyroclastic flows occurred every six to eight hours. Audible rockfalls, roaring, and occasional thunder were noted during the most intense events. Frequent pyroclastic flows traveled N down Whites Ghaut, Farrells plain, and Tyers Ghaut. Pyroclastic flows also traveled W down Gages Valley into Spring Ghaut, and occasionally to the S in Gingoes Ghaut. On 29 December several pyroclastic flows traveled 2.5 km, reaching Dyers village. A comparison of photographs from 30 December and 2 January revealed that the lava dome morphology had changed rapidly, with a significant addition of lava on the N side. The additional area of growth was approximately 60 m high and 100 m wide. The Hazard Level remained at 4.
Source: Montserrat Volcano Observatory (MVO)
MVO reported that during 11-19 December activity from the Soufrière Hills lava dome continued at a high level. Observations with a high-resolution thermal camera revealed multiple rockfall channels on the W, NW, N, and NE flanks of the lava dome. Frequent pyroclastic flows were noted on the northern flank; pyroclastic flows traveled 3 km W down Gages Valley into Spring Ghaut, as far as 4 km NE down the White River valley, and as far as 2 km in Tyers Ghaut (NW). Occasional pyroclastic flows descended Gingoes Ghaut (S) and Tar River valley (E). Heavy ashfall was reported in many inhabited areas of Montserrat. Ashfall also occurred on many other Caribbean islands, as far as Puerto Rico (400 km ENE). The Hazard Level remained at 4. According to a news article on 29 December, about 45 commercial flights scheduled to arrive at or depart from Puerto Rico were cancelled due to ash in the area.
Sources: Montserrat Volcano Observatory (MVO); Associated Press
MVO reported that during 11-19 December activity from the Soufrière Hills lava dome continued at a high level. Night-time incandescence and observations with a high resolution thermal camera showed that activity was concentrated on the NW flank. Pyroclastic flows and semi-continuous rockfalls traveled down the NE, N, and NW flanks, channelling NE directly into Whites Ghaut and continuing into Whites Bottom Ghaut. Pyroclastic flows also traveled as far as 2 km NW down Tyers Ghaut multiple times a day, occasionally as far as 2 km W down Gages valley, and rarely E down Tar River valley. Fresh deposits from small pyroclastic flows moving S were seen at the head of the White River and Gingoes Ghaut. On 19 December heavy ashfall occurred in several areas in NW Montserrat. The Hazard Level remained at 4.
Source: Montserrat Volcano Observatory (MVO)
MVO reported that during 4-11 December activity from the Soufrière Hills lava dome continued at a high level and pyroclastic flow activity was concentrated on the N side. Pyroclastic flows traveled as far as 2 km NW into Tyers Ghaut and NE in abundance down Tuitt's Ghaut, and sometimes Whites Bottom Ghaut, continuing onto Farrell's plain. A few small pyroclastic flows also descended the Tar River valley to the E. On 10 December, a large seismic signal was associated with a relatively large pyroclastic flow in Tyers Ghaut that traveled 3.5 km, stopping just beyond the W end of Lee's village. The event prompted the National Disaster Preparedness and Response Advisory Committee (NDPRAC) to raise the Hazard Level to 4, restricting the hours residents can enter certain pre-designated hazard areas.
Source: Montserrat Volcano Observatory (MVO)
MVO reported that during 27 November-4 December activity from the Soufrière Hills lava dome continued at a high level. Pyroclastic flow activity was concentrated to the NE and W. The largest pyroclastic flows traveled NE down Tuitt's Ghaut on 27 November and 2 December, reaching within 200 m of the sea. Associated ash plumes rose to altitudes of 4.6-6.1 km (15,000-20,000 ft) a.s.l. Pyroclastic flows also traveled W down Gages Valley, S down the White River valley and Gingoes Ghaut, and into the upper reaches of Tyers Ghaut (NW). One descended the Tar River valley to the E. Rockfalls cascaded directly from the summit of the lava dome into Tyers Ghaut. Ash venting from the S part of the lava dome was noted several times. Ashfall containing accretionary lapilli, reported from Salem, Old Towne, and parts of Olveston on the evening of 27 November, was associated with a pyroclastic flow down Tuitt's and White Bottom Ghaut. The Hazard Level remained at 3.
Source: Montserrat Volcano Observatory (MVO)
MVO reported that during 20-27 November activity from the Soufrière Hills lava dome continued at a high level. Activity increased on 21 November and periods of tremor were detected on 23 November. Lava extrusion during this period shifted from the W side of the lava dome to the summit region. As a result, abundant pyroclastic flows traveled NE down Tuitt's Ghaut on 23 November for the first time in several weeks. On 24 November there was a period of 120 minutes of continuous pyroclastic flow activity, followed by 90 minutes of semi-continuous activity. The pyroclastic flows traveled W down Gages Valley and into Spring Ghaut, and NE down Tuitt's Ghaut and Whites Bottom Ghaut reaching Tuitt's village. Associated ash plumes rose to an altitude of 6.1 km (20,000 ft) a.s.l. On 26 November, a pyroclastic flow that descended the Tar River valley was caused by collapse of part of the old, pre-2009 lava dome. Ashfall occurred in Old Towne and parts of Olveston. Incandescent material seen in a photograph taken at night on 29 November traveled down the flanks of the lava dome in several areas. The Hazard Level remained at 3.
Source: Montserrat Volcano Observatory (MVO)
MVO reported that during 13-20 November activity from the Soufrière Hills lava dome consisted of ash venting along with semi-continuous rockfalls and pyroclastic flows that were concentrated on the W flank. Ashfall occurred across many areas of the island. Views of the lava dome on 16 November showed that the dome height had decreased because of collapses and that a deep channel had developed NE of Chances Peak. Pyroclastic flows in the Gages Valley (W) continued down Spring Ghaut and Aymer's Ghaut, and spread onto the alluvial fan below St. Georges Hill. On 19 November, heavy ashfall occurred to the NW between Old Towne and Brades. The Hazard Level remained at 3.
Source: Montserrat Volcano Observatory (MVO)
MVO reported that during 6-13 November activity from the Soufrière Hills lava dome continued at a high level. Pyroclastic flows mainly occurred towards the W down Gages Valley and SW down Gingoes Ghaut. Good views of the lava dome on 9 and 10 November revealed that recent lava-dome growth was concentrated on the WSW side, immediately NE of Chances Peak; intense incandescence and rockfalls were noted at night. Ash fell across the Montserrat on 11 November, and about 6-8 km NW in Salem, Old Towne, Olveston, and Woodlands on 12 November. The largest pyroclastic flow during the reporting period, on 12 November, traveled WSW, nearly reaching the sea at Kinsale village. The Hazard Level remained at 3.
Source: Montserrat Volcano Observatory (MVO)
MVO reported that during 30 October-6 November activity from the Soufrière Hills lava dome was at a high level; hybrid earthquakes were recorded for the first time since the renewal of activity in early October. Numerous pyroclastic flows occurred in most of the major drainage valleys. On 4 November, pyroclastic flows were seen from a helicopter traveling SW down Gingoes Ghaut to within 200 m of the sea. The frequency of pyroclastic flows increased on 5 November and particularly vigorous flows occurred in Tuitt's Ghaut to the NE. Ash fell in inhabited areas on a few occasions. Lahars descended the Belham Valley to the W several times. The Hazard Level remained at 3.
Source: Montserrat Volcano Observatory (MVO)
MVO reported that during 23-30 October seismic activity from the Soufrière Hills lava dome was at a slightly lower level that the previous week. Numerous pyroclastic flows occurred in most of the major drainage valleys and rockfalls were concentrated in the S. Heavy rainfall caused lahars in the Belham Valley to the W. On 28 October, two pyroclastic flows traveled 2 km W down Gages Valley. On 29 October, a 40-m-high spine was seen protruding from the summit. Changes in lava-dome morphology seen on 30 October, and occurrences of pyroclastic flows traveling NE, indicated that growth was concentrated in the central part of the lava dome. The Hazard Level remained at 3.
Source: Montserrat Volcano Observatory (MVO)
MVO reported that during 16-25 October activity from the Soufrière Hills lava dome was at a high level; a new lava dome first reported on 9 October continued to grow in the summit region on the W side. The new dome was considerably higher than the older lava dome that is to the E. Seismicity was high and cycles of low-level tremor occurred at regular intervals. Several pyroclastic flows descended the White River to the S and reached the sea. Small pyroclastic flows traveled NE down Tuitts Ghaut and W down Gages valley, but seldom to the N down Tyers Ghaut or E down the Tar River valley. Rockfalls occurred on the S and SE flanks of the lava dome. Multiple ashfalls were reported in inhabited areas, and lahars traveled NW down the Belham valley. During 23-25 October, seismicity decreased and ash plumes generated by pyroclastic flows drifted W. The Hazard Level remained at 3.
Source: Montserrat Volcano Observatory (MVO)
MVO reported that during 9-16 October activity from the Soufrière Hills lava dome was at a high level; a new lava dome first reported on 9 October continued to grow. Over 1,200 rockfalls were detected by the seismic network. Pyroclastic flows traveled down every major drainage valley except the Tar River valley to the E. Brief views of the lava dome revealed that the new lava dome summit was about 60 m above the old dome structure. Heavy rainfall caused a lahar in the Belham Valley to the NW on 14 October. On 16 October, several large pyroclastic flows descended the White River to the S and reached the sea. Moderate-sized pyroclastic flows traveled 3 km NE down Tuitts Ghaut and White Bottom Ghaut, and a few smaller pyroclastic flows descended Tyers Ghaut to the N. Extensive ash clouds rose to an altitude of 6.1 km (20,000 ft) a.s.l. and drifted WNW, resulting in minor ashfall in inhabited areas. During 18-19 October, rockfalls and small pyroclastic flows continued to be detected.
Source: Montserrat Volcano Observatory (MVO)
MVO reported that ash-venting events from Soufrière Hills lava dome, which had begun on 4 October, ceased in the early hours of 7 October; there were a total of thirteen events. The last three were associated with small pyroclastic flows that traveled about 500 m down Tyers Ghaut to the NNW. Observations on 7 October revealed tongues of rockfall and small pyroclastic-flow deposits at the heads of Tyers Ghaut to the NNW, Tar River valley to the E, White River to the S, and Gages to the W. A small area of incandescence from the N flank of the lava dome was seen during 7-8 October.
Source: Montserrat Volcano Observatory (MVO)
MVO reported that a short volcano-tectonic earthquake swarm from Soufrière Hills lava dome was detected at 2100 on 4 October. A period of tremor and vigorous ash venting followed about an hour later. The resulting ash plume drifted WNW across the island and out to sea, causing ashfall in Old Towne and Olveston. The seismic signals indicated no explosive activity or pyroclastic flows, but only two rockfalls after the ash-venting event. During midnight to 0600 on 5 October, intermittent ash venting produced ash plumes that drifted WNW. Two more "ash venting" events occurred at 1035 and 1325, without precursory seismicity, producing ash plumes that rose to altitudes of 3-4.6 km (10,000-15,000 ft) a.s.l. Ash fell S of inhabited areas. Based on information from MVO and analyses of satellite imagery, the Washington VAAC reported that on 6 October several ash clouds rose to altitudes of 3.7-5.5 km (12,000-18,000 ft) a.s.l. and drifted W.
Sources: Montserrat Volcano Observatory (MVO); Washington Volcanic Ash Advisory Center (VAAC)
MVO reported that during 19-26 June activity from the Soufrière Hills lava dome was at a low level. On 20 June, a small pyroclastic flow that traveled E down the Tar River valley produced a small ash cloud that drifted W. The Hazard Level remained at 3.
Source: Montserrat Volcano Observatory (MVO)
MVO reported that during 22-29 May activity from the Soufrière Hills lava dome was at a low level. On 23 May, a rockfall was detected by the seismic network and contained some low-frequency energy at the onset that may have indicated a small explosion. A small pyroclastic flow on 24 May traveled 1 km E towards the Tar River valley; a resultant ash plume drifted W over Gages Mountain and Plymouth. The Hazard Level remained at 3.
Source: Montserrat Volcano Observatory (MVO)
MVO reported that during 15-22 May activity from the Soufrière Hills lava dome had increased slightly, but remained overall at a low level. Seismic activity increased slightly; tectonic earthquakes were noted on 16, 18, 20, and 21 May at depths less than 3 km beneath the lava dome. Lahars traveled down multiple river valleys on 18 May. Two possible explosions were detected on 21 May. The second and larger signal was followed by an ash plume that was seen drifting to the W over Gages Mountain. During 21-22 May, a strong smell of sulfur dioxide was noted from Salem (6 km NW) to Woodlands (1 km N of Salem).The Hazard Level remained at 3.
Source: Montserrat Volcano Observatory (MVO)
MVO reported that during 8-15 May activity from the Soufrière Hills lava dome was generally at a low level. Multiple lahars traveled down several ravines during 12-15 May. Heavy rainfall caused erosion of the lava dome and pyroclastic flow deposits that were still hot; steam plumes occasionally laden with ash occurred periodically from the base of Tyre's ghaut and were visible from MVO. The Hazard Level remained at 3.
Source: Montserrat Volcano Observatory (MVO)
MVO reported that during 17-24 April activity from the Soufrière Hills lava dome was at a low level. On 24 April, a small pyroclastic flow traveled E down the Tar River Valley. The Hazard Level remained at 3.
Source: Montserrat Volcano Observatory (MVO)
MVO reported that during 3-10 April activity from the Soufrière Hills lava dome was at a low level. Heavy rainfall during 8-9 April caused lahars in multiple river valleys. The Hazard Level remained at 3.
Source: Montserrat Volcano Observatory (MVO)
MVO reported that during 27 March-3 April activity from the Soufrière Hills lava dome was at a low level. On 1 April, a small pyroclastic flow traveled E down the Tar River Valley. The Hazard Level remained at 3. On 6 April, the Washington VAAC reported that an ash plume drifting at altitudes of 2.7-4.9 km (9,000-16,000 ft) a.s.l. was seen by a pilot flying from Antigua to Beef Island, 200-300 km NW. Ash was not seen on satellite imagery.
Sources: Montserrat Volcano Observatory (MVO); Washington Volcanic Ash Advisory Center (VAAC)
MVO reported that observations during an overflight of the Soufrière Hills lava dome on 18 March confirmed that a seismic signal recorded earlier that day was from a pyroclastic flow; the flow traveled E down the Tar River Valley, almost reaching the sea.
Source: Montserrat Volcano Observatory (MVO)
MVO reported that during 27 February-6 March activity from the Soufrière Hills lava dome was at a low level. On 6 March, a pyroclastic flow traveled E down the Tar River Valley to the sea. The Hazard Level remained at 3.
Source: Montserrat Volcano Observatory (MVO)
MVO reported that during 20-27 February activity from the Soufrière Hills lava dome was at a low level. On 24 February, a pyroclastic flow traveled E as far as the previous Tar River Valley coastline. The next day, a pyroclastic flow that traveled halfway down Tyre's Ghaut produced a small ash plume that drifted W. The Hazard Level remained at 3.
Source: Montserrat Volcano Observatory (MVO)
MVO reported that during 13-20 February activity from the Soufrière Hills lava dome was at a low level. Four rockfalls were detected and seismicity had increased slightly compared to previous weeks. On 16 February, heavy rainfall triggered a small pyroclastic flow on the N side of the lava dome and a substantial lahar NW in the Belham River. A thermal camera showed a large amount of steaming in the Dyer's area (NW) during this period, and occasionally for a few days after. The Hazard Level was lowered to 3 on 19 February.
Source: Montserrat Volcano Observatory (MVO)
MVO reported that during 6-13 February activity from the Soufrière Hills lava dome was at a low level. Two rockfalls were detected and seismicity was low. On 13 February, one small pyroclastic flow that originated in a gully on the N side of the lava dome traveled less than 1 km. The Hazard Level remained at 4.
Source: Montserrat Volcano Observatory (MVO)
MVO reported that during 30 January-6 February activity from the Soufrière Hills lava dome increased slightly, although seismic activity was low. Three rockfalls were detected. On 5 February, one small pyroclastic flow that originated in a gully on the N side of the lava dome traveled less than 1 km and stopped in Tyre's Ghaut (NW). The Hazard Level remained at 4.
Source: Montserrat Volcano Observatory (MVO)
MVO reported that during 23-30 January activity from the Soufrière Hills lava dome was at a low level; seismicity was low, rockfalls were minimal, and lava-dome incandescence at night was absent. The Hazard Level remained at 4.
Source: Montserrat Volcano Observatory (MVO)
MVO reported that during 16-23 January activity from the Soufrière Hills lava dome was at a low level; seismicity was low, rockfalls were minimal, and lava-dome incandescence at night was absent. The Hazard Level remained at 4.
Source: Montserrat Volcano Observatory (MVO)
MVO reported that during 9-16 January activity from the Soufrière Hills lava dome was at a low level; seismicity was low, rockfalls were minimal, and lava-dome incandescence at night was absent. The Hazard Level remained at 4.
Source: Montserrat Volcano Observatory (MVO)
MVO reported that during 2-3 January activity from the Soufrière Hills lava dome increased drastically. On 2 January, an energetic pyroclastic flow and associated surge traveled down Tyers Ghaut (NW) and reached the upper part of Belham River. On 3 January, after a period of elevated seismicity, two explosions produced ash plumes to altitudes greater than 10.7 km (35,000 ft) a.s.l. Ashfall affected most of the island at elevations of 1.2 km (4,000 ft) a.s.l. and above. The explosions had significant "jet components" to at least 500 m above the dome. In-column collapses resulted in pyroclastic flows that traveled W and reached Plymouth (about 5 km W). After the second explosion, the level of activity decreased dramatically and remained low through 9 January. The Hazard Level remained at 4.
Source: Montserrat Volcano Observatory (MVO)
MVO reported that during 26 December-2 January activity from Soufrière Hills lava dome was characterized by significantly increased lava extrusion, ash emissions, and pyroclastic flows. Lava extrusion on the top, N, W, and SW sides of the dome continued, and incandescence on the dome was visible at night when weather was favorable. Pyroclastic flows regularly reached the bottom of Tyers Ghaut (NW); surges associated with the larger flows spilled into the next valley to the W. Deposits filling Tyers Ghaut caused the flows to travel farther, into the upper part of the Belham River. Pyroclastic flows were also noted in valleys to the W. Ash emissions from the top of the lava dome increased; although most pyroclastic flows originated from rockfalls, some originated at the vent. Ashfall was reported in areas 6-7 km NW. Large incandescent blocks, deposited by rockfalls and pyroclastic flows, were visible on multiple occasions at night in the lower parts of Tyers Ghaut. Fires triggered by surges were visible in the neighboring valley. The Hazard Level remained at 4.
Based on analysis of satellite imagery and information from MVO, the Washington VAAC reported large eruptions on 3 January. Ash plumes drifted NE at an altitude of 7.6 km (25,000 ft) a.s.l., E at an altitude of 10.7 km (35,000 ft) a.s.l., S at an altitude of 6.1 km (20,000 ft) a.s.l., and W at an altitude of 2.4 km (8,000 ft) a.s.l. A thermal anomaly was detected. According to news articles, about 70 people were evacuated from Area B, about 6-8 km NW. The next day, steam-and-gas plumes possibly containing ash drifted W and WSW.
Sources: Montserrat Volcano Observatory (MVO); Antigua Sun [Original URL no longer exists 1/2017]; Washington Volcanic Ash Advisory Center (VAAC)
MVO reported that during 19-26 December activity from Soufrière Hills lava dome was characterized by increased lava extrusion, rockfalls, and pyroclastic flows. Lava extrusion on the N, W, and SW sides of the dome continued and incandescence on the dome was visible at night when weather was favorable. Rockfall events increased by 80 percent compared to the previous week. Pyroclastic flows began to enter Tyers Ghaut (NW) on 20 December and likely reached the bottom of the ghaut (ravine) on 21, 23, and 25 December. On 22 December, the Hazard Level was increased to 4 due to the repeated occurrences of pyroclastic flows in the lower part of Tyers Ghaut. On 24 December, a large pyroclastic flow that reached Plymouth (about 5 km W), and possibly the sea, generated an ash plume to an altitude of 3 km (10,000 ft) a.s.l. Large incandescent blocks, deposited by rockfalls and pyroclastic flows, were visible on multiple occasions at night in the upper and middle parts of Tyers Ghaut.
Based on analysis of satellite imagery, the Washington VAAC reported that during 26-30 December ash plumes drifted W, WSW, SW, and S. Intermittent thermal anomalies were detected on satellite imagery on 27 December. Plumes rose to altitudes of 2.1-4.9 km (7,000-16,000 ft) a.s.l. on 28 and 30 December.
Sources: Montserrat Volcano Observatory (MVO); Washington Volcanic Ash Advisory Center (VAAC)
MVO reported that during 12-19 December activity from Soufrière Hills lava dome was characterized by increased lava extrusion, ash venting, rockfalls, and pyroclastic flows. Frequent pulses of ash rose from multiple places on the NW face of the lava dome and from a low on the dome behind Gages Mountain (as seen from Salem). On 13 December a pyroclastic flow traveled E down the Tar River Valley and reached the sea. Nighttime incandescence from the NW face was present during 16-19 December. Frequent rockfalls and several small pyroclastic flows descended Gages Valley. The largest pyroclastic flow, on 17 December, produced an ash cloud that rose to an altitude of 3 km (10,000 ft) a.s.l. On 18 December, observations of the lava dome confirmed significant growth on the SW flank. Photographs showed that most of the growth had taken place since 8 December; lava was filling in the area between the lava dome and Chance's Peak. Initial calculations suggested that the dome grew at a rate of 1 cubic meter per second during this time. Two small pyroclastic flows descended Galway's Valley on 19 December.
Based on analysis of satellite imagery and information from MVO, the Washington VAAC reported that during 19-23 December ash plumes drifted W, WSW, SW, and S. Thermal anomalies were detected on satellite imagery on 19 and 21 December. A pilot observed an ash plume at an altitude of 4.3 km (14,000 ft) a.s.l. on 20 December.
Sources: Montserrat Volcano Observatory (MVO); Washington Volcanic Ash Advisory Center (VAAC)
MVO reported that seismicity from Soufrière Hills lava dome remained elevated during 6-10 December. On 10 December, seven pyroclastic flows traveled W down Gages Valley, at least two reached Plymouth (about 5 km W). A few small pyroclastic flows were detected during 11-12 December. Monitoring data indicated that the volcano continued to inflate.
Based on analysis of satellite imagery and information from MVO, the Washington VAAC reported that on 14 December an ash plume drifted W at an altitude of 1.8 km (6,000 ft) a.s.l. A diffuse gas-and-steam plume possibly containing ash drifted W the next day. On 13 December, a pilot reported that an ash plume rose to altitudes of 4.6-5.2 km (15,000-17,000 ft) a.s.l. On 15 December, ash plumes at altitudes of 2.4-3 km (8,000-10,000 ft) a.s.l. drifted SW. The next day an ash plume drifted S and a thermal anomaly was detected on satellite imagery.
Sources: Montserrat Volcano Observatory (MVO); Washington Volcanic Ash Advisory Center (VAAC)
MVO reported a total of four explosive events from the Soufrière Hills lava dome during 2-5 December. The first event was triggered by a small dome collapse on 2 December, occurred without precursory seismicity, and was followed by a pyroclastic flow on the W flank. Resultant ash plumes, accompanied by lightning strikes, rose to an altitude of 12.2 km (40,000 ft) a.s.l. and drifted W. Explosions ejected incandescent blocks up to 1.6 km away from the dome that landed on Gages Mountain (about 1 km WNW), leaving impact craters. The pyroclastic flow also generated multiple pyroclastic surges that traveled S and N, setting fire to trees and bushes.
On 3 December another explosion scattered incandescent blocks all over the NW side of Gages Mountain. The third eruptive event, forceful emissions of ash on 4 December, resulted in ash plumes that rose to an altitude of 4.6 km (15,000 ft) a.s.l. The fourth explosive event occurred on 5 December and ejected incandescent blocks that were deposited on the NW side of Gages Mountain. A pyroclastic flow traveled to the W down Gages valley into Plymouth (about 5 km W) and an ash plume drifted NW.
On 3, 4, and 5 December small, relatively slow moving pyroclastic flows traveled no more than 3.2 km down the Gages valley. In periods between the events, near-continuous emissions of ash-laden steam were noted. The Hazard Level remained at 3.
According to the Washington VAAC, MVO reported eruptions on 6 December. Ash was seen on satellite imagery expanding in multiple directions, then to the E, SE, and W.
Sources: Montserrat Volcano Observatory (MVO); Washington Volcanic Ash Advisory Center (VAAC)
MVO reported that during 21-28 November the activity level at the Soufrière Hills lava dome remained low, and there was no evidence of lava extrusion. Rockfalls were detected by the seismic network. The lava dome continued to emit steam vigorously from multiple places, including new fumarolic areas on the W and S sides. Long-exposure photographs revealed several hot spots on the dome. The vertical cliff face on the W side of the dome was cracked in several places and erosion was evident at the base.
At approximately 2135 on 2 December, an explosion occurred on the W side of the lava dome without any precursory seismicity. Large blocks were ejected up to 1 km from the dome and incandescent blocks were scattered over the NW side of Gages Mountain (about 1 km WNW). A pyroclastic flow traveled to the W down Gages valley into Plymouth (about 5 km W), and further to the sea. Buildings in Plymouth caught fire and could be seen burning from Salem (about 4 km N of Plymouth) for several hours afterwards. Ash plumes were accompanied by lightning strikes and drifted W. The Hazard Level remained at 3.
Based on analysis of satellite imagery, the Washington VAAC reported that on 28 November a puff of ash and steam drifted SW and S.
Sources: Montserrat Volcano Observatory (MVO); Washington Volcanic Ash Advisory Center (VAAC)
MVO reported that during 14-21 November the activity level at the Soufrière Hills lava dome remained low, and there was no evidence of lava extrusion. Rockfalls were detected by the seismic network. Visual observations were hindered by clouds and vigorous steaming from the dome. Weak ash venting possibly occurred briefly during the reporting period, including on 20 November. The Hazard Level remained at 3.
Source: Montserrat Volcano Observatory (MVO)
MVO reported that during 7-14 November the activity level at the Soufrière Hills lava dome increased slightly, but remained low, and there was no evidence of lava extrusion. Rockfalls were detected by the seismic network. Visual observations were hindered by clouds and vigorous steaming from the dome. Weak ash venting possibly occurred briefly on 13 November. The Hazard Level remained at 3.
Source: Montserrat Volcano Observatory (MVO)
MVO reported that during 31 October-7 November the activity level at the Soufrière Hills lava dome was low and there was no evidence of lava extrusion. Photographs taken during an aerial inspection of the dome confirmed that the SE side was a very high (150-200 m) free-standing cliff not supported by talus. Erosion continued on the NE side and at the E and SE bases of the dome, further deepening the moat in the talus around the dome. The morphology of the top of the dome was complex and highly irregular with multiple steep lava protrusions separated by areas of lower elevation. Several spines and a bulbous shear lobe were visible. The Hazard Level remained at 3.
Source: Montserrat Volcano Observatory (MVO)
MVO reported that during 24-31 October the activity level at the Soufrière Hills lava dome was low. There was no evidence of lava extrusion. On 26 October, observers aboard a fixed-wing aircraft confirmed that a few small pyroclastic flows traveled about 1.5 km down the Tar River Valley. Erosion down several V-shaped chutes continued at the E and SE bases of the dome further deepened the moat in the talus around the dome. Ongoing erosion of the talus pile on the W flank resulted in a well-incised network of gullies leading into the White River. On 27 October, a small pyroclastic flow seen from MVO traveled about 1 km down the Tar River Valley and generated a small ash plume that drifted over unpopulated areas to the W and SW, towards Plymouth. The Hazard Level remained at 3.
Source: Montserrat Volcano Observatory (MVO)
MVO reported that during 17-24 October the activity level at the Soufrière Hills lava dome was slightly higher than the previous week and consisted mainly of volcanic seismicity. There was no evidence of lava extrusion. On the evening of 17 October several points of incandescence from locations previously glowing on 8 October were observed through binoculars. On 20 October three pyroclastic flows descended the Tar River Valley. They generated small ash plumes that drifted over unpopulated areas to the W and SW, towards Plymouth. The Hazard Level remained at 3.
Source: Montserrat Volcano Observatory (MVO)
MVO reported that during 10-17 October, the activity level at the Soufrière Hills lava dome was low and consisted mainly of mudflows. Mudflows were particularly numerous during 15-16 October due to the passage of hurricane Omar to the N. Erosion of the talus slope on the E side of the lava dome also significantly increased and as a result, a large gap in the talus was created that exposed the core of the dome. During an overflight on 17 October, the lava dome was seen vigorous steaming and thermal imagery revealed that the hottest temperatures were associated with the new Gages vent formed in August. The Hazard Level remained at 3.
Based on analysis of satellite imagery and information from MVO, the Washington VAAC reported that on 20 October a pyroclastic flow or a rockfall generated a plume that drifted about 45 km W and was detaching from the island.
Sources: Montserrat Volcano Observatory (MVO); Washington Volcanic Ash Advisory Center (VAAC)
MVO reported that during 3-10 October, the activity level at the Soufrière Hills lava dome was slightly higher than the previous week and consisted mainly of rockfalls and mudflows. As a result of slow and continuous erosion of the lower part of the dome, rockfalls occurred on both the W side in the gully over Gages Wall and on the E side in the Tar River Valley. The rate of lava extrusion had declined significantly. Thermal imagery captured during an overflight on 8 October revealed that a major E-W oriented fracture in the dome, aligned with the Gages Valley and extending vertically over a few tens of meters, was associated with very elevated temperatures. Several other very hot areas were also detected. These areas were visible using binoculars from MVO later that night. The Hazard Level remained at 3.
Source: Montserrat Volcano Observatory (MVO)
MVO reported that during 27 September-3 October, the W side of the Soufrière Hills lava dome continued to grow. Rockfalls were detected by the seismic network. The Hazard Level remained at 3.
Source: Montserrat Volcano Observatory (MVO)
MVO reported that during 20-26 September, the W side of the Soufrière Hills lava dome continued to grow. Rockfalls were detected by the seismic network. The Hazard Level remained at 3.
Source: Montserrat Volcano Observatory (MVO)
MVO reported that during 13-19 September, data suggested that the W side of the Soufrière Hills lava dome continued to grow. Rockfalls continued to descend the W side of the dome. The Hazard Level remained at 3.
Source: Montserrat Volcano Observatory (MVO)
MVO reported that during 6-12 September, visual observations and other data suggested that the W side of the Soufrière Hills lava dome continued to grow. Rockfalls descended the W side of the dome and the smell of volcanic gases was occasionally noticed when the wind blew N and NE. The Hazard Level remained at 3.
Source: Montserrat Volcano Observatory (MVO)
MVO reported that during 29 August-5 September, data suggested that the W side of the Soufrière Hills lava dome continued to grow. Lahars and rockfalls dominated the activity. Lahars likely descended the Tar River valley on 29 and 31 August. On 1 September, a lahar descended the Belham River valley to the NW; the event lasted approximately 50 minutes. A new vent on the NW part of the lava dome, a little further N of the previous Gages vent, was observed during an overflight on 4 September. The smell of volcanic gases was occasionally noticed when the wind blew N and NE. The Hazard Level remained at 3.
Source: Montserrat Volcano Observatory (MVO)
MVO reported that during 22-29 August, observations suggested that the W side of the Soufrière Hills lava dome continued to grow. Lahars descended numerous river valleys during 25-27 August. Incandescence originating from a scar on lava dome created by the 28 July explosion, and then further expanded by a pyroclastic flow on 25 August, was observed on clear nights. Incandescence was also observed from an area N of the scar. Rockfalls descended the W side of the dome. The Hazard Level remained at 3.
Source: Montserrat Volcano Observatory (MVO)
MVO reported that during 15-22 August, evidence suggested that the W side of the Soufrière Hills lava dome continued to grow. Cloud cover prevented visual observations. Rockfalls and long-period seismicity increased. Most of the rockfalls occurred on the W side of the lava dome in a new channel that developed below Gages Wall. Ash plumes occasionally generated by the rockfalls were most noticeable on 16 and 17 August. On 19 August a pyroclastic flow descended the Tar River Valley. According to news reports, on 25 August a rainfall-induced pyroclastic flow occurred on the W flank, split into two parts, and caused ashfall and a strong scent of gases in areas N. The event enlarged and steepened the rockfall gully below Gages Wall. The Hazard Level remained at 3.
Sources: Montserrat Volcano Observatory (MVO); Caribbean Net News
MVO reported that new lava extrusion from Soufrière Hills started from the W side of the lava dome sometime between the 28 July lava-dome collapse event and 8 August, when a new channel of fresh rockfall material was seen below Gages Wall. Cloud cover often prevented visual observations. During 8-15 August, seismicity and the rate of lava extrusion were generally low and sulfur dioxide emissions were elevated. On 14 August the W side of the dome was visible and the explosion crater that was generated on 28 July was almost completely filled with new lava. Lava spilled over the lower and W side of the crater and generated rockfalls below Gages Wall that were observed and heard from St. George's Hill. During 14-15 August, the scent of volcanic gases was noticeable at times in inhabited areas of Montserrat. The Hazard Level was 3.
Source: Montserrat Volcano Observatory (MVO)
MVO reported that seismic levels from Soufrière Hills were relatively low during 1-8 August. Sulfur dioxide emissions (tons per day) were significantly higher than emissions prior to the partial lava-dome collapse on 28 July. Unconfirmed reports indicated the presence of an ash plume on 3 August. A small ash cloud was seen on 7 August.
Further investigation of the 28 July event revealed that the total amount of material that collapsed from the dome was about 200,000-300,000 cubic meters. Satellite radar images indicated that the vent above Gages wall was enlarged by the explosion to about 150 x 60 meters, elongated E-W. Precautionary access restrictions for areas in and around Belham valley were lifted because evidence suggested that the dome had not been destabilized due to the event.
A new Hazard Level System, designed by MVO and Disaster Management Coordination Agency (DMCA) in consultation with the Government of Montserrat and community groups, was implemented on 8 August. The system divides the southern two-thirds of the island into six zones, and includes two Maritime Exclusion Zones. The Hazard Level ranges from 1-5 and is set by the National Disaster Preparedness, Response, and Advisory Committee (NDPRAC) with advice from MVO. The Hazard Level restricts access into each of the zones depending on the number assigned and is unrelated to the Alert Level. The current Hazard Level was 3.
Source: Montserrat Volcano Observatory (MVO)
MVO reported no evidence of lava-dome growth at Soufrière Hills during 18-26 July. At least six eruptive events occurred during 20-22 July, each producing ash plumes that rose to altitudes of 2 km (6,000 ft) a.s.l. or lower. The ash plumes drifted W; ashfall was reported in Old Towne. Rumbling noises were heard in nearby areas and lightning strikes were observed. Small pyroclastic flows during 20-21 July traveled E down the Tar River valley with the largest one reaching within 500 m of the ocean. The Alert Level remained elevated at 4 (on a scale of 0-5).
On 26 July, seismicity increased significantly and then decreased. Seismicity increased again at approximately 0100 on 27 July and continued at a high level until about 0935 when a short series of eruptive events started. The first and largest ash-venting event of this series produced an ash plume that rose to an altitude of 2.5 km (8,000 ft) a.s.l. and drifted W and NW. Ashfall was reported in Plymouth and St George's Hill. Two events that followed produced ash plumes to an altitude of 1.5 km (5,000 ft) a.s.l.
A partial lava-dome collapse began at 1127 on 28 July without any precursory activity. Part of the dome's W flank collapsed and generated pyroclastic flows that reached Plymouth and the sea. A few explosions during the collapse produced ash plumes; the largest ash plume rose to an altitude of 12 km (40,000 ft) a.s.l.
Source: Montserrat Volcano Observatory (MVO)
MVO reported no evidence of lava-dome growth at Soufrière Hills during 11-18 July. Seismic activity remained low. The E talus slope continued to erode, producing minor rockfalls that descended into the Tar River Valley. Following a small swarm of volcano-tectonic earthquakes on 20 July, four eruptive events each produced ash plumes that rose to altitudes of 2 km (6,000 ft) a.s.l. and drifted W. The first two events generated plumes above the Tar River Valley possibly from small pyroclastic flows. Ashfall was reported in Old Towne. Rumbling noises were heard in nearby areas and lightning strikes were observed. The Alert Level remained elevated at 4 (on a scale of 0-5).
Source: Montserrat Volcano Observatory (MVO)
MVO reported no evidence of lava-dome growth at Soufrière Hills during 28 June-4 July. Seismic activity remained low. The E talus slope continued to erode, producing minor rockfalls that descended into the Tar River Valley. The Alert Level remained elevated at 4 (on a scale of 0-5).
Source: Montserrat Volcano Observatory (MVO)
MVO reported no evidence of lava-dome growth at Soufrière Hills during 21-27 June. Seismic activity remained low. Heavy rainfall resulted in minor mudflows down the Belham River. The E talus slope continued to erode, producing minor rockfalls that descended into the Tar River Valley. The Alert Level remained elevated at 4 (on a scale of 0-5).
Source: Montserrat Volcano Observatory (MVO)
MVO reported no evidence of lava-dome growth at Soufrière Hills during 14-20 June. Seismic activity remained low. On 19 June, mild ash venting from the Gages vent (to the W) resulted in an ash plume that rose to an altitude less than 1.2 km (4,000 ft) a.s.l. and drifted E. The E talus slope continued to erode, producing minor rockfalls that descended into the Tar River Valley. The Alert Level remained elevated at 4 (on a scale of 0-5).
Source: Montserrat Volcano Observatory (MVO)
MVO reported no evidence of lava-dome growth at Soufrière Hills during 7-13 June. Seismic activity remained low. The E talus slope continued to erode, producing minor rockfalls that descended into the Tar River Valley. The Alert Level remained elevated at 4 (on a scale of 0-5).
Source: Montserrat Volcano Observatory (MVO)
MVO reported no evidence of lava-dome growth at Soufrière Hills during 31 May-6 June. Seismic activity remained low. The Alert Level remained elevated at 4 (on a scale of 0-5).
Source: Montserrat Volcano Observatory (MVO)
MVO reported that an explosion at Soufrière Hills on 29 May produced an ash plume to an altitude of 3 km (10,000 ft) a.s.l. which drifted SW and generated a pyroclastic flow. The explosion had no precursory seismicity and was heard in multiple areas to the NW. The pyroclastic flow descended a few hundred meters to the W. Observations during an overflight the following day suggested that the explosion and pyroclastic flow originated from the Gages vent.
Source: Montserrat Volcano Observatory (MVO)
MVO reported that activity at Soufrière Hills decreased slightly during 17-23 May. On 23 May, several pulses of ash venting from Gages vent to the W produced ash plumes to an altitude of approximately 1.8 km (5,900 ft) a.s.l. and drifted E.
Based on pilot reports, information from MVO, and observations of satellite imagery, the Washington VAAC reported that during 23-27 May steam plumes with small amounts of ash or possible ash rose to altitudes of 1.2-1.4 km (4,000-4,500 ft) a.s.l. and drifted W and NW.
Sources: Montserrat Volcano Observatory (MVO); Washington Volcanic Ash Advisory Center (VAAC)
MVO reported that activity at Soufrière Hills increased during 9-19 May. The seismic network recorded 17 rockfalls. An eruptive event on 13 May produced an ash plume to an altitude of 3 km (10,000 ft) a.s.l. and was accompanied by a single long-period earthquake. A blue sulfur dioxide plume was also noted. Ash emissions from two areas in the Gages vent to the W were observed on 15 May, but may have started on 14 May. The resultant ash plume rose about 200 m above the lava dome and drifted W. A small rockfall was noted and gentle roaring noises were reported. A new fumarolic area was seen on the SE side of Chances Peak. Ash emissions from Gages vent continued on 16 May. The Alert Level remained elevated at 4 (on a scale of 0-5).
Based on information from MVO and observations of satellite imagery, the Washington VAAC reported that steam plumes with small amounts of ash continued during 17-19 May and drifted N and WNW.
Sources: Montserrat Volcano Observatory (MVO); Washington Volcanic Ash Advisory Center (VAAC)
MVO reported that during 2-9 May the lava dome at Soufrière Hills changed very little, based on measurable parameters. A small pyroclastic flow descended the E flank on 5 May. Light ashfall was reported in the Old Town area about 9 km NW. Ash deposits were also evident in the Corkhill (NW) and St. Georges Hill (N) areas. Heavy rainfall generated lahars. The Alert Level remained elevated at 4 (on a scale of 0-5).
Based on information from MVO and observations of satellite imagery, the Washington VAAC reported that an ash plume rose to an altitude of 3 km (10,000 ft) a.s.l. and drifted NW on 13 May.
Sources: Montserrat Volcano Observatory (MVO); Washington Volcanic Ash Advisory Center (VAAC)
MVO reported that during 25 April-2 May the level of volcano-tectonic earthquakes at Soufrière Hills increased and was the highest since February 2006. Degassing from a vent above Gages Wall was audible in the St. George's Hill area to the NW. Steaming from the area above Tyre's Ghaut to the NW was visible. The Alert Level remained elevated at 4 (on a scale of 0-5).
Source: Montserrat Volcano Observatory (MVO)
MVO reported that during 4-18 April the lava dome at Soufrière Hills changed very little, based on measurable parameters. Overflights on 9 and 16 April revealed that the E side of the lava dome continued to erode and exposed more resistant solid material below. A small pyroclastic flow traveled 500 m down the E flank on 10 April and generated a small ash plume that quickly dissipated to the W. Two more pyroclastic flows were observed on 16 April. The larger flow traveled 1 km down the E flank and was followed by relatively strong degassing. The Alert Level remained elevated at 4 (on a scale of 0-5).
Source: Montserrat Volcano Observatory (MVO)
MVO reported that during 1-4 April the lava dome at Soufrière Hills changed very little, based on measurable parameters. Seismic activity was very low and one rockfall signal was recorded. The Alert Level remained elevated at 4 (on a scale of 0-5).
Source: Montserrat Volcano Observatory (MVO)
MVO reported that during 25-31 March the lava dome at Soufrière Hills changed very little, based on visual observations and other measurable parameters. Fumarolic activity was concentrated on the NW and SE flanks, and at the head of Gages Valley to the W where the emissions were bluish. The Alert Level remained elevated at 4 (on a scale of 0-5).
Source: Montserrat Volcano Observatory (MVO)
MVO reported that that during 19-25 March the lava dome at Soufrière Hills changed very little, based on visual observations and other measurable parameters. Fumarolic activity was concentrated on the NW and SE flanks where abundant sulfur deposits were noted, and at the head of Gages Valley to the W. The Alert Level remained elevated at 4 (on a scale of 0-5).
Source: Montserrat Volcano Observatory (MVO)
MVO reported that that during 11-18 March the lava dome at Soufrière Hills changed very little, based on visual observations on 12 March and other measurable parameters. The E side of the lava dome continued to erode, with material accumulating in the Tar River Valley. Fumarolic activity was concentrated on the NW and SE flanks and at the head of Gages Valley to the W. The Alert Level remained elevated at 4 (on a scale of 0-5).
Source: Montserrat Volcano Observatory (MVO)
MVO reported that that during 4-11 March the lava dome at Soufrière Hills changed very little, based on visual observations during an overflight on 6 March. The E talus slope continued to erode, with both fresh and older material accumulating in the Tar River Valley. Fumaroles around the lava dome were active, but less vigorous W in the Gages Wall area on 7 March. The Alert Level remained elevated at 4 (on a scale of 0-5).
Source: Montserrat Volcano Observatory (MVO)
MVO reported that that during 27 February-4 March the lava dome at Soufrière Hills changed very little, based on limited visual observations during an overflight on 29 February and from ground locations. The E talus slope continued to erode, with both fresh and older material accumulating in the Tar River Valley. Active fumaroles around the lava dome were observed during breaks in cloud cover. The Alert Level remained elevated at 4 (on a scale of 0-5).
Source: Montserrat Volcano Observatory (MVO)
MVO reported that that during 20-26 February the lava dome at Soufrière Hills changed very little, based on limited visual observations during an over flight on 21 February and from ground locations. The E talus slope continued to erode, with both fresh and older material accumulating in the Tar River Valley. Active fumaroles around the lava dome were observed during the overflight. Seismic activity was very low and low-level rockfall activity continued. The Alert Level remained elevated at 4 (on a scale of 0-5).
Source: Montserrat Volcano Observatory (MVO)
MVO reported that that during 13-19 February the lava dome at Soufrière Hills changed very little, based on visual observations. Seismic activity was very low and low-level rockfall activity continued. Fumarolic activity on the N and E flanks continued. Active fumaroles were also noted in the Galway's area to the S of the dome. Clouds obscured views to the W in the Gages Wall area. Heavy rainfall triggered lahars in multiple drainages. On 13 February, the lower Belham river valley to the W was impassable for a short time due to lahars. The Alert Level remained elevated at 4 (on a scale of 0-5).
Source: Montserrat Volcano Observatory (MVO)
MVO reported that that during 5-12 February the lava dome at Soufrière Hills changed very little, based on limited observations (due to inclement weather) during overflights. Seismic activity was very low and low-level rockfall activity continued. Fumarolic activity on the N and E flanks continued. Active fumaroles were also noted in the Galway's area to the S of the dome. Clouds obscured views to the W in the Gages Wall area. The Alert Level remained elevated at 4 (on a scale of 0-5).
Source: Montserrat Volcano Observatory (MVO)
MVO reported that that during 30 January-5 February the lava dome at Soufrière Hills changed very little, based on visual observations during an over flight on 30 January and from multiple locations. Seismic activity was very low and low-level rockfall activity continued. Fumarolic activity on the N and E flanks continued. Active fumaroles were also noted in the Galway's area to the S of the dome and W in the Gages Wall area. The Alert Level remained elevated at 4 (on a scale of 0-5).
Source: Montserrat Volcano Observatory (MVO)
MVO reported that the lava dome at Soufrière Hills changed very little, based on visual observations during an over flight on 23 January. Visual observations were limited during 22-28 January. Seismic activity was very low and low-level rockfall activity continued. Fumarolic activity on the N and E flanks continued. Active fumaroles were also noted in the Galway's area to the S of the dome and W in the Gages Wall area. The Alert Level remained elevated at 4 (on a scale of 0-5).
Source: Montserrat Volcano Observatory (MVO)
MVO reported that the lava dome at Soufrière Hills had changed very little, based on visual observations during an over flight on 23 January. Visual observations were limited during 22-29 January. Seismic activity was very low and low-level rockfall activity continued. Fumarolic activity on the N and E flanks also continued, along with active fumaroles in the Galway's area to the S of the dome and W in the Gages Wall area. The Alert Level remained elevated at 4 (on a scale of 0-5).
Source: Montserrat Volcano Observatory (MVO)
MVO reported that fumarolic activity on the N and E flanks of the Soufrière Hills lava dome continued during 28 December-15 January. Active fumaroles were also noted in the Galway's area to the S of the dome and W in the Gages Wall area. Occasional rockfalls occurred; one produced a small ash plume on 7 January. Observations during an overflight on 9 January confirmed that the lava dome morphology had not changed since 3 January. The Alert Level remained elevated at 4 (on a scale of 0-5).
Based on pilot reports, information from MVO, and observations of satellite imagery, the Washington VAAC reported that a steam-and-gas plume with light ash content drifted S and SW on 10 January.
Sources: Montserrat Volcano Observatory (MVO); Washington Volcanic Ash Advisory Center (VAAC)
MVO reported that fumarolic activity on the N and E flanks of the Soufrière Hills lava dome continued during 28 December-8 January. Active fumaroles were also noted in the Galway's area to the S of the dome and W in the Gages Wall area. Occasional rockfalls were restricted to the Tar River valley. Observations during an overflight on 3 January confirmed that the lava dome morphology had not changed since the previous reporting period. The Alert Level remained elevated at 4 (on a scale of 0-5).
Source: Montserrat Volcano Observatory (MVO)
MVO reported that during 24-28 December the lava dome at Soufrière Hills changed very little, based on visual observations. Seismic activity was very low and low-level rockfall activity occurred in the Tar River valley. Fumarolic activity on the N and E flanks of the dome and W in the Gages Wall area continued. The Alert Level remained elevated at 4 (on a scale of 0-5).
Source: Montserrat Volcano Observatory (MVO)
MVO reported that during 17-24 December the lava dome at Soufrière Hills changed very little, based on visual observations. Seismic activity was very low and low-level rockfall activity continued. Fumarolic activity on the N and E flanks of the dome continued. The Alert Level remained elevated at 4 (on a scale of 0-5).
Source: Montserrat Volcano Observatory (MVO)
MVO reported that during 7-17 December the lava dome at Soufrière Hills changed very little, based on visual observations. Seismic activity was very low and low-level rockfall activity continued. Fumarolic activity on the N and E flanks of the dome continued. The Alert Level remained elevated at 4 (on a scale of 0-5).
Source: Montserrat Volcano Observatory (MVO)
MVO reported that during 3-7 December the lava dome at Soufrière Hills changed very little, based on visual observations. Seismic activity was very low and low-level rockfall activity continued. Fumarolic activity on the N and E flanks of the dome continued. The Alert Level remained elevated at 4 (on a scale of 0-5).
Source: Montserrat Volcano Observatory (MVO)
MVO reported that during 23 November-3 December the lava dome at Soufrière Hills changed very little, based on visual observations. Seismic activity was very low and low-level rockfall and pyroclastic flow activity continued. Fumarolic activity on the N and E flanks of the dome were observed. On 29 November, a regional M 7.4 earthquake occurred at 1500. A few minutes later, a small pyroclastic flow traveled down the E flank. At 1530, three more pyroclastic flows traveled E down the Tar River Valley. The Alert Level remained elevated at 4 (on a scale of 0-5).
Source: Montserrat Volcano Observatory (MVO)
MVO reported that during 31 October-5 November the lava dome at Soufrière Hills changed very little, based on limited visual observations due to cloud cover. Seismic activity was very low and low-level rockfall and pyroclastic flow activity continued. The Alert Level remained elevated at 4 (on a scale of 0-5).
Source: Montserrat Volcano Observatory (MVO)
MVO reported that during 24-30 October the lava dome at Soufrière Hills changed very little, based on visual observations. Seismic activity was very low and low-level rockfall and pyroclastic flow activity continued. During 25-26 October, vigorous lahar activity was noted, especially to the E, including the Tar River valley. Ashfall was subsequently visible over much of N Montserrat, possibly due to rockfall activity and steam venting. On 30 October a small pyroclastic flow was observed in the Tar River valley. The Alert Level remained elevated at 4 (on a scale of 0-5).
Source: Montserrat Volcano Observatory (MVO)
MVO reported that during 17-23 October the lava dome at Soufrière Hills changed very little, based on visual observations. Seismic activity was very low and low-level rockfall activity continued. On 12 October, a small pyroclastic flow descended about 2 km E down the Tar River valley. A resultant ash plume drifted W. On 23 October, lahars descended down drainages on all sides of the volcano. The Alert Level remained elevated at 4 (on a scale of 0-5).
Source: Montserrat Volcano Observatory (MVO)
MVO reported that during 10-16 October the lava dome at Soufrière Hills changed very little, based on visual observations. Seismic activity was very low and low-level rockfall activity continued. The Alert Level remained elevated at 4 (on a scale of 0-5).
Source: Montserrat Volcano Observatory (MVO)
MVO reported that during 3-9 October the lava dome at Soufrière Hills changed very little, based on visual observations. Seismic activity was very low and low-level rockfall activity continued. On 3 October, lahars were noted in several drainages, including the Belham river valley to the NW. Steam venting was noted in the upper parts of Belham Valley and in Tyres Ghaut to the NW. The Alert Level remained elevated at 4 (on a scale of 0-5).
Source: Montserrat Volcano Observatory (MVO)
MVO reported that during 26 September-2 October the lava dome at Soufrière Hills changed very little, based on visual observations. Seismic activity was very low and low-level rockfall activity continued. On 26 September, lahars were noted in several drainages, including the Belham river valley to the NW. The Alert Level remained elevated at 4 (on a scale of 0-5).
Source: Montserrat Volcano Observatory (MVO)
MVO reported that during 19-25 September the lava dome at Soufrière Hills changed very little, based on visual observations. Seismic activity was very low and low-level rockfall activity continued. The Alert Level remained elevated at 4 (on a scale of 0-5).
Source: Montserrat Volcano Observatory (MVO)
MVO reported that during 11-18 September the lava dome at Soufrière Hills changed very little, based on visual observations. Seismic activity was very low and low-level rockfall activity continued. Based on satellite imagery, the Washington VAAC reported that an ash plume drifted SW on 16 September. On 17 September, a lahar traveled down the Belham river valley to the NW. The Alert Level remained elevated at 4 (on a scale of 0-5).
Source: Montserrat Volcano Observatory (MVO)
MVO reported that during 3-11 September the lava dome at Soufrière Hills changed very little, based on visual observations. Seismic activity was very low and low-level rockfall activity continued. The Alert Level remained elevated at 4 (on a scale of 0-5).
Source: Montserrat Volcano Observatory (MVO)
MVO reported that during 28 August-3 September the lava dome at Soufrière Hills changed very little, based on visual observations. Seismic activity was very low and low-level rockfall activity continued. The Alert Level remained elevated at 4 (on a scale of 0-5).
Source: Montserrat Volcano Observatory (MVO)
MVO reported that during 21-28 August the lava dome at Soufrière Hills changed very little, based on visual observations. Seismic activity was very low and low-level rockfall activity continued. On 23 August, heavy rainfall triggered small rockfalls and four pyroclastic flows to the E down the Tar River Valley. Ash and steam emissions from the dome produced a plume that drifted W. A lahar occurred in the Belham river valley to the NW. The Alert Level remained elevated at 4 (on a scale of 0-5).
Source: Montserrat Volcano Observatory (MVO)
MVO reported that during 13-21 August the lava dome at Soufrière Hills changed very little, based on visual observations. Seismic activity was very low and low-level rockfall activity continued. The Alert Level remained elevated at 4 (on a scale of 0-5).
Source: Montserrat Volcano Observatory (MVO)
MVO reported that during 3-13 August the lava dome at Soufrière Hills changed very little, based on visual observations. Seismic activity was very low and low-level rockfall activity continued. On 10 August, lahars were detected in all drainages due to heavy rainfall. The Alert Level remained elevated at 4 (on a scale of 0-5).
Source: Montserrat Volcano Observatory (MVO)
MVO reported that during 27 July-3 August, the lava dome at Soufrière Hills changed very little, based on visual observations. Seismic activity was very low and low-level rockfall activity affected all sides of the dome. On 30 July, three pyroclastic flows traveled about 1.5 km down the N side of the Tar River Valley. The Alert Level remained elevated at 4 (on a scale of 0-5).
Source: Montserrat Volcano Observatory (MVO)
MVO reported that based on visual observations, the lava dome at Soufrière Hills changed very little during 25-26 July. Seismic activity was very low and low-level rockfall activity continued. The Alert Level remained elevated at 4 (on a scale of 0-5).
Source: Montserrat Volcano Observatory (MVO)
MVO reported that during 13-24 July, the lava dome at Soufrière Hills changed very little, based on visual observations. Seismic activity was very low and low-level rockfall activity continued. Heavy rainfall generated lahars in E drainages on 19 July. The Alert Level remained elevated at 4 (on a scale of 0-5).
Source: Montserrat Volcano Observatory (MVO)
MVO reported that during 6-13 July the lava dome at Soufrière Hills changed very little based on visual observations, and seismic activity was very low. Low-level rockfall activity continued. The Alert Level remained elevated at 4 (on a scale of 0-5).
Source: Montserrat Volcano Observatory (MVO)
MVO reported that during 29 June-10 July the lava dome at Soufrière Hills changed very little based on visual observations, and seismic activity was very low. Low-level rockfall activity continued, however, and predominantly affected the Tar River Valley to the E. Heavy rainfall generated lahars in E drainages during 4-6 July. The Alert Level remained at 4 (on a scale of 0-5).
Source: Montserrat Volcano Observatory (MVO)
MVO reported that during 22-29 June the lava dome at Soufrière Hills changed very little based on visual observations, and seismic activity was very low. Low-level rockfall and pyroclastic flow activity continued, however, and predominantly affected the Tar River Valley to the E. The volume of the dome was an estimated 208 million cubic meters. The Alert Level remained at 4 (on a scale of 0-5).
Source: Montserrat Volcano Observatory (MVO)
MVO reported that during 20-25 June the lava dome at Soufrière Hills changed very little based on visual observations, and seismic activity was very low. Low-level rockfall and pyroclastic flow activity continued, however, and predominantly affected the Tar River Valley to the E. The Alert Level remained at 4 (on a scale of 0-5).
Source: Montserrat Volcano Observatory (MVO)
MVO reported that during 8-18 June the lava dome at Soufrière Hills changed very little based on visual observations, and seismic activity was very low. Low-level rockfall and pyroclastic flow activity continued. The Alert Level remained at 4 (on a scale of 0-5).
Source: Montserrat Volcano Observatory (MVO)
MVO reported that during 1-12 June the lava dome at Soufrière Hills changed very little based on visual observations from a helicopter and seismic activity was very low. Low-level rockfall and pyroclastic flow activity continued during 1-12 June. On 8 June, a small pyroclastic flow was observed in the upper parts of Farrell's Plain to the N. Fresh pyroclastic deposits were also observed to the E in the Tar River Valley and on the S side of the lava dome. On 11 June, heavy rains generated lahars in all drainages. Two pyroclastic flows occurred. The Washington VAAC reported that on 11 June, an ash plume was visible on satellite imagery drifting NW. The plume may have reached an altitude of 3.7 km (12,000 ft) a.s.l. The Alert Level remained at 4 (on a scale of 0-5).
Sources: Montserrat Volcano Observatory (MVO); Washington Volcanic Ash Advisory Center (VAAC)
MVO reported that during 25 May-1 June the lava dome at Soufrière Hills changed very little based on visual observations and seismic activity was very low. Low-level rockfall and pyroclastic flow activity continued. On 31 May, pyroclastic flows traveled approximately 1 km E in the Tar River Valley. The Alert Level remained at 4 (on a scale of 0-5).
Source: Montserrat Volcano Observatory (MVO)
Based on visual observations, MVO reported that during 18-25 May lava-dome growth at Soufrière Hills likely ceased and the overall structure of the dome changed very little. Seismic activity was very low. The Alert Level remained at 4 (on a scale of 0-5).
Source: Montserrat Volcano Observatory (MVO)
Based on visual observations, MVO reported that during 11-21 May lava-dome growth at Soufrière Hills likely ceased and the overall structure of the dome changed very little. Low-level rockfall and pyroclastic flow activity continued. Seismic activity was very low. The Alert Level remained at 4 (on a scale of 0-5).
Source: Montserrat Volcano Observatory (MVO)
Based on visual observations, MVO reported that during 4-11 May lava-dome growth at Soufrière Hills likely ceased and the overall structure of the dome changed very little. Rockfall activity continued. The Alert Level remained at 4 (on a scale of 0-5).
Source: Montserrat Volcano Observatory (MVO)
During 25 April-1 May, lava-dome growth at Soufrière Hills continued at a reduced rate. Rockfalls and pyroclastic flows occasionally occurred. On 30 April, two pyroclastic flows were observed to the NE in Tuitt's Ghaut.
Source: Montserrat Volcano Observatory (MVO)
During 13-20 April, visual observations suggested that lava-dome growth at Soufrière Hills continued at a reduced rate. Material originating from the lava dome's growing E-facing shear lobe was shed down the Tar River Valley. Heavy rains resulted in lahars in several drainages 16-17 April. During 18-20 April, a gas plume drifted N and NE and a bluish haze containing sulfur dioxide was observed flowing down the N flanks due to light winds coming from the S.
Source: Montserrat Volcano Observatory (MVO)
Based on visual observations, lava-dome growth at Soufrière Hills continued at a reduced rate during 6-13 April. Material originating from the E-facing shear lobe was shed down the Tar River Valley. Minor rockfalls and pyroclastic flows were noted. On 17 April, a small pyroclastic flow was observed to the NW in the upper part of Tyres Ghaut. The lava-dome volume was an estimated 208 million cubic meters.
Source: Montserrat Volcano Observatory (MVO)
During 30 March-9 April, lava-dome growth at Soufrière Hills remained reduced or had possibly ceased. Small, intermittent pyroclastic flows originating from the E-facing shear lobe occurred in the Tar River Valley. Fumarolic activity was observed around the SE and NW regions of a collapse scar at the head of Tyres Ghaut, and to the W, above Gages Valley. Incandescent rockfalls from the E side of the dome were seen at night during 5-9 April.
Source: Montserrat Volcano Observatory (MVO)
During 23 March-3 April, lava-dome growth at Soufrière Hills was reduced or possibly paused. Small, intermittent pyroclastic flows occurred in the Tar River Valley. Fumarolic activity was observed around the region of a collapse scar at the head of Tyres Ghaut and was audible during 28-29 March. The Washington VAAC reported that a SW-drifting, diffuse plume and a hotspot were visible on satellite imagery on 2 April.
Source: Montserrat Volcano Observatory (MVO)
During 16-26 March, lava-dome growth at Soufrière Hills continued and was concentrated on the NE side. Pyroclastic flows mainly affected the sector from the ENE to the NW of the dome and traveled intermittently E down the Tar River Valley. Small flows (<500 m in length) occurred NW in Tyres Ghaut, and one flow was observed at the top of Farrell's Plain. On 18 March, steam venting following heavy rains was observed NW on Cork Hill.
Source: Montserrat Volcano Observatory (MVO)
During 9-16 March, lava-dome growth at Soufrière Hills continued and was concentrated on the NE side. Intermittent pyroclastic flows, possibly originating from the large blocky spine on the edge of the E lobe, traveled E down the Tar River Valley and produced large ash plumes. One of the plumes on 12 March rose to an altitude of 3 km (10,000 ft) a.s.l. and drifted NW. On 13 March, a steam-rich plume rose to 2.4 km (8,000 ft) a.s.l. and drifted W. By 14 March, the spine was completely shed. On 15 March, heavy rains caused mudflow activity in several drainages. Pyroclastic flows were observed NW in Tyre's Ghaut and ashfall was reported from the Salem /Old Towne areas. On 16 March, pyroclastic flows were observed in Tyre's Ghaut and in the Tar River Valley. A resultant ash plume drifted WNW. Based on satellite imagery, the Washington VAAC reported that diffuse ash plumes drifted NW during 17-18 March.
Sources: Montserrat Volcano Observatory (MVO); Washington Volcanic Ash Advisory Center (VAAC)
During 2-9 March, lava-dome growth at Soufrière Hills continued and was concentrated on an E-facing lobe topped with blocky, spine-like protrusions. Rockfalls affected the E and NE flanks. Pyroclastic flows traveled 2 km and were confined E in the Tar River Valley. Heightened pyroclastic activity on 7 March resulted in an ash plume that rose to an estimated 2.4 km (8,000 ft) a.s.l. and drifted W. On 11 March, a pyroclastic flow traveled down the NE flank into White's Ghaut. On 12 March, a large, blocky spine leaned steeply towards the NE.
Based on satellite imagery, San Juan Weather Forecast Agency (WFO), and pilot reports, the Washington VAAC reported light ash and haze over several Caribbean islands during 7-10 March. Based on news articles, the presence of ash and dust from the Sahara Desert prompted some airlines in Puerto Rico to delay and cancel flights on 10 March.
Sources: Associated Press; Montserrat Volcano Observatory (MVO); Washington Volcanic Ash Advisory Center (VAAC)
During 28 February-2 March, lava-dome growth at Soufrière Hills continued and was concentrated on the E and N sides. Ash venting and roaring noises originated from the W side of the dome, above Gages Wall. On 2 March, two small pyroclastic flows traveled down Tyres Ghaut to the NW.
Based on satellite data and pilot reports the Washington VAAC reported continuous ash emissions during 28 February-4 March. Resultant plumes rose to altitudes of 2.1 km (7,000 ft) a.s.l. and drifted mainly W. A thermal anomaly was detected in the crater on satellite imagery. On 6 March, an ash plume rose to altitudes between 1.8-2.7 km (6,000-9,000 ft) a.s.l. and drifted W and NW.
Sources: Montserrat Volcano Observatory (MVO); Washington Volcanic Ash Advisory Center (VAAC)
During 16-23 February, lava-dome growth at Soufrière Hills continued and was concentrated on the E and N sides. Small pyroclastic flows traveled down the Tar River Valley to the E, Gages to the W, and Tyres Ghaut to the NW. Ash venting and roaring noises originated from an area above Gages to the SW, where a new blocky lobe was visible. Moderately-sized pyroclastic flows traveled E down the Tar River Valley during 24-25 and 27 February. Bright incandescence at the dome was observed during the reporting period.
Based on satellite data, pilot reports, and information from the MVO, the Washington VAAC reported continuous ash emissions during 21-27 February. Resultant plumes rose to altitudes of 2.1-6.1 km (7,000-20,000 ft) a.s.l. and drifted mainly NE, NW, and W. A thermal anomaly was detected in the crater on satellite imagery.
Sources: Montserrat Volcano Observatory (MVO); Washington Volcanic Ash Advisory Center (VAAC)
During 9-16 February, seismic activity at Soufrière Hills was slightly elevated as compared to previous weeks. The lava-dome volume was estimated at 200 million cubic meters based on recent measurements from LIDAR data. Previous measurements over-estimated the lava-dome volume due to the perceived location of the dome and the lack of data from inside the crater. The height of the dome was about 1060 m a.s.l. During 17-18 February, rockfalls and small pyroclastic flows traveled W down Gages Valley and E down Tar River Valley. Incandescence was seen from the E and N sides of the dome. Rockfalls continued on 19 and 20 February.
Based on satellite data and information from the MVO, the Washington VAAC reported continuous emissions during 14-20 February. Resultant plumes rose to altitudes of km (5,000-8,000 ft) a.s.l. and drifted mainly NW, W, and S. A thermal anomaly in the crater was detected on satellite imagery.
Sources: Montserrat Volcano Observatory (MVO); Washington Volcanic Ash Advisory Center (VAAC)
During 7-13 February, growth of the Soufrière Hills lava dome continued on the W side. A small lobe was observed on 7 February growing to the SW. On 8 February, three pyroclastic flows traveled a maximum distance of a few kilometers E down the Tar River Valley. At least one of the pyroclastic flows was the result of a small collapse from the S or SW part of the dome. Small pyroclastic flows traveled NW down Tyres Ghaut on 9 February and down the northern flanks onto Farrell's Plain on 12 and 13 February. Based on satellite imagery, information from MVO, and pilot reports, the Washington VAAC reported that ash-and-gas and steam plumes drifted predominantly NW during 10-13 February. Plumes reached a maximum altitude of 2.7 km (9,000 ft) a.s.l. on 13 February
Based on a news article on 13 February, the lava-dome volume was approximately 250 million cubic meters, surpassing the previous record size of 240 million cubic meters in 2003.
Sources: Caribbean Net News; Montserrat Volcano Observatory (MVO); Washington Volcanic Ash Advisory Center (VAAC)
During 27 April-8 May, visual observations suggested that lava-dome growth at Soufrière Hills continued at a reduced rate or ceased. Fresh deposits were evident at the head of Tyres Ghaut to the NW, the upper parts of Farrell's Plain and Tuitt's Ghaut to the N, and the upper parts of the Tar River Valley to the E. Pyroclastic activity was ongoing on the E and NE sides of the dome during 27 April-4 May and pyroclastic flows were observed in the Tar River Valley and on Farrell's plain, into Tuitt's Ghaut.
Source: Montserrat Volcano Observatory (MVO)
Based on satellite imagery, the MVO, and pilot reports, the Washington VAAC reported that a diffuse plume from Soufrière Hills rose to an altitude of 1.5 km (5,000 ft) a.s.l. and drifted WNW on 31 January. Measurable activity was low and visual observations were limited due to cloud cover. On 6 January, a photograph taken from a helicopter showed that the dome had continued to grow towards the W side of the crater.
Sources: Montserrat Volcano Observatory (MVO); Washington Volcanic Ash Advisory Center (VAAC)
During 24-30 January, measurable activity at Soufrière Hills remained low. Based on satellite imagery, information from MVO, and a pilot report, the Washington VAAC reported that ash plumes were visible during 26-27 January. The plumes were likely a result of rockfall activity. On 28 January, a large pyroclastic flow traveled down the Tar River Valley and reached the sea.
Sources: Montserrat Volcano Observatory (MVO); Washington Volcanic Ash Advisory Center (VAAC)
During 17-23 January, measurable activity at Soufrière Hills was low and visual observations were limited due to cloud cover. Gas and ash venting that originated from the W side of the dome continued throughout the reporting period. A clear view on 22 January revealed that the collapse scar from the 8 January event was filled in. The NW sector vigorously degassed and a small spine was noted on the W side. On 23 January, a large pyroclastic flow traveled W down Gages Valley.
Source: Montserrat Volcano Observatory (MVO)
During 10-16 January, lava-dome growth at Soufrière Hills continued and was focused on the entire NW quadrant of the dome. During 10-11 January, one pyroclastic flow was observed to the W in Gages Valley and one to the NW in Tyres Ghaut. On 15 January, a relatively large pyroclastic flow traveled S down the Tar River Valley and produced a cloud that drifted W. Gas and ash venting originated from the W side of the dome and seismicity remained at very low levels.
Source: Montserrat Volcano Observatory (MVO)
Activity including rapid lava-dome growth, pyroclastic flows, and ash venting increased at Soufrière Hills during 3-9 January. Dome growth was concentrated in the NW quadrant which was the highest part of the dome. Pyroclastic flows, originating from the NW, were observed in Tyres Ghaut (NW), Gages Valley (W), and N, behind Gages Mountain and accompanied by ash venting. On 4 January, a notable event resulted in simultaneous pyroclastic flows in Tyres Ghaut and Gages Valley, and a resultant ash cloud reached an altitude of 2.5 km (8,200 ft) a.s.l. The maximum distance for the Gages Valley flow was 4 km. During 6-7 January, distances of pyroclastic flows increased in Tyres Ghaut and possibly exceeded 1.5 km.
Activity including rapid lava-dome growth, pyroclastic flows, and ash venting increased at Soufrière Hills during 3-9 January. Dome growth was concentrated in the NW quadrant which was the highest part of the dome. Pyroclastic flows, originating from the NW, were observed in Tyres Ghaut (NW), Gages Valley (W), and N, behind Gages Mountain and accompanied by ash venting. On 4 January, a notable event resulted in simultaneous pyroclastic flows in Tyres Ghaut and Gages Valley, and a resultant ash cloud reached an altitude of 2.5 km (8,200 ft) a.s.l. The maximum distance for the Gages Valley flow was 4 km. During 6-7 January, distances of pyroclastic flows increased in Tyres Ghaut and possibly exceeded 1.5 km.
Sources: Montserrat Volcano Observatory (MVO); Washington Volcanic Ash Advisory Center (VAAC)
During 22-29 December, the rate of lava-dome growth at Soufrière Hills increased and was focused on the W, where gas-and-ash venting occurred. A high whaleback lobe directed towards the SW was observed on 26 December. On 28 December, a small pyroclastic flow traveled W toward Gages valley. The Washington VAAC reported on-going steam and ash emissions that were visible on satellite imagery during 27 December-2 January.
Sources: Montserrat Volcano Observatory (MVO); Washington Volcanic Ash Advisory Center (VAAC)
During 15-22 December, moderate lava-dome growth at Soufrière Hills continued and was focused on the SW part of the dome. Rockfalls and pyroclastic flows occurred on the S side of the dome and in the upper parts of both White's and Tuitt's Ghauts. Based on satellite imagery and pilot reports, the Washington VAAC reported that steam emissions with variable amounts of ash drifted W on 23 and 24 December. A pilot reported that an ash plume rose to an altitude of 3 km (10,000 ft) a.s.l. and drifted W on 24 December. The MVO reported that the emissions originated from a vent on the W side of the dome. A small pyroclastic flow was visible NW in the upper reaches of Tyre's Ghaut and venting became more energetic. The alert level was raised to 4 (on a scale of 0-5). At night, incandescent rockfalls were visible from the NW and W.
Sources: Montserrat Volcano Observatory (MVO); Washington Volcanic Ash Advisory Center (VAAC)
During 8-15 December, moderate lava-dome growth at Soufrière Hills continued and was focused on the SW part of the dome. Most of the dome surface in a sector from the S to the NW was below 100°C based on thermal images and moisture along with sulfur deposits accumulated along the SE edge. The dome overtopped the NE crater wall and fresh rock and boulder deposits were observed in that region.
Source: Montserrat Volcano Observatory (MVO)
During 1-8 December, the MVO reported that observations of Soufrière Hills were limited due to cloud cover. On 2 December, the lava dome was visible and growth was concentrated on the NE. Based on information from the MVO, satellite imagery, and pilot reports, the Washington VAAC reported a small explosion on 8 December. The resulting ash plume rose to an altitude of 2.4 km (8,000 ft) a.s.l. and drifted W.
Sources: Montserrat Volcano Observatory (MVO); Washington Volcanic Ash Advisory Center (VAAC)
During 24 November-1 December, lava-dome growth at Soufrière Hills continued and was concentrated on the NE part of the edifice. The two cracks in the curved back of the shear E-facing lobe on the summit have propagated downward and divided the lobe into three blocks. Rockfalls and small pyroclastic flows traveled down the sector between the SE and NE flanks and are also affecting the N part of the dome at the back of the lobe. Pyroclastic flows reached the upper region of Tuitts Ghaut on 27 November.
Source: Montserrat Volcano Observatory (MVO)
During 17-24 November, lava-dome growth at Soufrière Hills continued and was concentrated on the NE part of the edifice. Ash venting originated from the westernmost of two cracks in the curved back of the shear E-facing lobe on the summit. Rockfalls and small pyroclastic flows traveled down the SW and NE flanks. Pyroclastic flows reached both the upper region of Tuitts Ghaut (N) and the sea via the Tar River Valley (E) on 23 November. An explosion produced an ash plume that rose to altitudes of 1.5-1.7 km (4,900-5,600 ft) a.s.l.
Source: Montserrat Volcano Observatory (MVO)
During 3-10 November, lava-dome growth at Soufrière Hills continued and was concentrated on the E part of the edifice. Rockfalls and small pyroclastic flows originating from a large active lobe on the NE sector of the dome traveled down the SW and NE flanks. High-temperature rockfalls from the NNE sector were deposited on a ridge between Tuitt's and White's Ghauts. Sulfur dioxide measurements were higher than previous weeks, but still within the long-term average range.
Based on information from the MVO, satellite imagery, and pilot reports, the Washington VAAC reported continuous ash-and-gas emissions during 8-14 November. Resulting plumes drifted mainly W and S. A hotspot was detected on satellite imagery during 9-13 November.
Sources: Montserrat Volcano Observatory (MVO); Washington Volcanic Ash Advisory Center (VAAC)
During 27 October-3 November, lava-dome growth at Soufrière Hills continued and was concentrated on the E and NE part of the edifice. Rockfalls and small pyroclastic flows originating from the active lobe traveled down the NE flank. Aerial observation confirmed the existence of a large, shear, E-facing lobe on the NE side of the dome. Ash-and-steam venting continued.
Based on information from the MVO, satellite imagery, and the Piarco MWO, the Washington VAAC reported that ash and gas emissions during 1-6 November produced mainly diffuse plumes that drifted NW, W, and SW. Plumes reached altitudes of 2.7 km (9,000 ft) a.s.l. on 3 November. A hotspot was detected on satellite imagery on 3 and 5 November.
Sources: Montserrat Volcano Observatory (MVO); Washington Volcanic Ash Advisory Center (VAAC)
During 20-27 October, lava-dome growth at Soufrière Hills continued and was concentrated on the NE part of the edifice. Rockfalls and small pyroclastic flows originating from the active lobe traveled down the NE flank. Several small stubby spine-like structures were observed on the SE summit region of the dome.
Based on information from the MVO, satellite imagery, and the Piarco MWO, the Washington VAAC reported that continuous ash and gas emissions during 25-31 October produced plumes that drifted NW and W. Plumes reached altitudes of 2.1 km (7,000 ft) a.s.l. A hotspot was detected on satellite imagery during 25-27 October and 29 October.
Sources: Montserrat Volcano Observatory (MVO); Washington Volcanic Ash Advisory Center (VAAC)
During 13-20 October, lava-dome growth at Soufrière Hills continued and was concentrated on the NE part of the edifice. A new E-facing shear lobe with a smooth, curved back enlarged during the reporting period. Rockfalls and small pyroclastic flows originating from the active lobe affected the NE flank. On a few occasions, pyroclastic flows from the N flank spilled over Farrel's wall (the crater rim). The vent above Gage's wall was less active compared to the previous reporting period. A vent S of the active lobe periodically produced both ash and gas. Ash fell in northern areas of the island. Heavy rainfall resulted in mudflow activity in all drainage systems.
Based on information from the MVO, pilot reports, and the Piarco MWO, the Washington VAAC reported that continuous ash and gas emissions on 18, 20, and 22-23 October produced plumes that drifted W, NW, and NE. Plumes reached altitudes of 2.7 km (9,000 ft) a.s.l. A hotspot was detected on satellite imagery.
Sources: Montserrat Volcano Observatory (MVO); Washington Volcanic Ash Advisory Center (VAAC)
During 6-13 October, lava-dome growth at Soufrière Hills continued and was concentrated on the NE part of the edifice. The vents just inside Gage's wall and on the summit of the dome periodically produced both ash and gas. Heavy rainfall on 9 and 11-12 October resulted in mudflow activity in all drainage systems. Ash fell in the N part of the island.
Based on information from the MVO, pilot reports, and the Piarco MWO, the Washington VAAC reported that continuous ash and gas emissions during 10-17 October produced plumes that drifted NW, N, and NE. Plumes reached altitudes of 2.1-4.6 km (7,000-15,000 ft) a.s.l. A minor pyroclastic flow on 16 October produced an ash plume that drifted NNE. A hotspot was detected on satellite imagery from 12 to 17 October.
Sources: Montserrat Volcano Observatory (MVO); Washington Volcanic Ash Advisory Center (VAAC)
MVO reported that during 29 September-6 October the lava dome at Soufrière Hills continued to grow at a moderate rate. Rockfalls were concentrated on the N and NE sectors. The vents just inside Gage's wall and on the summit of the dome periodically produced both ash and gases. The lava-dome volume was estimated at 90 million cubic meters.
Based on information from the MVO, pilot reports, and the Piarco MWO, the Washington VAAC reported ongoing emissions during 5-10 October. Plumes reached altitudes of 2.4 km (8,000 ft) a.s.l. and drifted W.
Sources: Montserrat Volcano Observatory (MVO); Washington Volcanic Ash Advisory Center (VAAC)
Visual observations of Soufrière Hills during 22-29 September showed that the dome continued to grow at a moderate rate. Growth appeared to have occurred predominantly on the domes summit area, and on its eastern side, with a prominent lobe growing in this location. The vents just inside Gage's wall and on the summit of the dome periodically produced both ash and gases. There were also a number of pyroclastic flows during the period, some of which appear to have had explosive onsets in the seismic record. Northerly winds during 28 and 29 September resulted in minor ashfall in inhabited areas. The sulfur dioxide flux for the reporting period averaged around 450 tonnes/day, varying between 850 tonnes/day on 22 September and 190 tonnes/day on 26 September. Aviation ash advisories on 2-3 October described continuous ash emissions reaching 2.4 km (8,000 ft) a.s.l. that eventually extended 140 km W.
Sources: Montserrat Volcano Observatory (MVO); Washington Volcanic Ash Advisory Center (VAAC)
MVO reported that during 15-22 September the lava dome at Soufrière Hills continued to grow at a moderate rate, slower than earlier in the month. Growth appears to have occurred predominantly in the summit area and on the S and E sides of the dome. The vent situated in the Gages Wall is still active, with minor explosive activity seen during an observation flight on 19 September. An intense 30-minute episode of volcanic tremor on 19 September was accompanied by rockfall activity that caused minor pyroclastic flows down the N and NE flanks of the lava dome. On 22 September the volume of the dome was about 80 million cubic meters. Seismicity was dominated by rockfalls with a significant drop in earthquake activity relative to the previous reporting period. The alert level was reduced to 3 (on a scale of 0-5) on 21 September. Aviation ash advisories during this period noted continuous ash emissions.
Sources: Montserrat Volcano Observatory (MVO); Washington Volcanic Ash Advisory Center (VAAC)
MVO reported that during 8-15 September, the lava dome at Soufrière Hills continued to grow at a high rate. On 9 and 10 September, ash venting from the Gages wall was vigorous and accompanied by small explosions producing black jets up to 100 m above the vent. Pyroclastic flows from fountain collapse occurred on all sides of the dome and notably reached 1 km W down Gages valley. On 11 September, the collapse of an over-hanging lava lobe produced pyroclastic flows NE down the Tar River valley. On 13 September, one pyroclastic flow in the same area reached the sea. On 14 September, vigorous ash venting resumed.
Based on information from the MVO, pilot reports, and the Piarco MWO, the Washington VAAC reported that continuous ash and gas emissions during 13-19 September produced plumes that reached altitudes of 2.4-3.7 km (8,000-12,000 ft) a.s.l. and drifted predominantly NW, W, and SW. A hotspot was visible on satellite imagery.
Sources: Montserrat Volcano Observatory (MVO); Washington Volcanic Ash Advisory Center (VAAC)
During 6-12 September, lava-dome growth at Soufrière Hills was substantial and concentrated on the W part of the edifice. A vent that had opened above Gage's Wall on 31 August vigorously emitted plumes of hot gases. A second vent near the summit of the dome emitted ash-and-steam plumes.
Based on information from the MVO, pilot reports, and the Piarco MWO, the Washington VAAC reported that ash, gas, and steam emissions on 6 and 7 September produced diffuse plumes that drifted WNW. On 10, 11, and 12 September, ash-and-gas plumes reached altitudes of 3 km (10,000 ft) a.s.l. and drifted E and SW. A hotspot was detected on satellite imagery on 6, 7, and 10-12 September.
Sources: Montserrat Volcano Observatory (MVO); Washington Volcanic Ash Advisory Center (VAAC)
Based on satellite imagery and reports from the MVO, the Washington VAAC reported that the Soufrière Hills lava dome collapsed at 1740 on 29 August. Ash venting was seen on satellite imagery prior to the collapse at 0615 and 1245. The plumes reached altitudes of 2.4 km (8,000 ft) a.s.l., drifted N, and then shifted to the W and SW. According to the Antigua Aircraft Tower, the dome collapse produced a plume that rose to an altitude of about 9 km (30,000 ft) a.s.l. The upper portion of the cloud drifted E and the lower portion possibly drifted N and W. Pyroclastic flows reached the sea down the Tar River Valley.
On 30 August, small pyroclastic flows were visible on the NE and S flanks of the lava dome. On 31 August, two vigorous ash-and-steam vents opened on the W and N flanks accompanied by tremor. A pilot reported an ash plume at an altitude of 4.6 km (15,000 ft) a.s.l. drifting W. The Alert Level was raised to 4 (on a scale of 0-5). The Washington VAAC reported continuous gas and ash emissions during 1-4 September; plumes reached altitudes of 3 km (10,000 ft) a.s.l. and drifted W.
Sources: Montserrat Volcano Observatory (MVO); Washington Volcanic Ash Advisory Center (VAAC)
During 18-25 August, the Soufrière Hills lava dome continued to grow. A marked increase of long-period and hybrid earthquakes was noted from 18 to 20 August. Based on satellite imagery and reports from the MVO, the Washington VAAC reported that continuous emissions of ash and steam produced plumes that reached altitudes of 1.5 km (5,000 ft) a.s.l. on 28 August.
Sources: Montserrat Volcano Observatory (MVO); Washington Volcanic Ash Advisory Center (VAAC)
Lava dome growth continued at Soufrière Hills during 11-18 August. The activity was concentrated in the N half of the dome. Based on information from the MVO, pilot reports, and the Piarco MWO, the Washington VAAC reported continuous ash emissions on 18 and 19 August. The plumes reached altitudes of 2.4 km (8,000 ft) a.s.l. and drifted W.
Sources: Montserrat Volcano Observatory (MVO); Washington Volcanic Ash Advisory Center (VAAC)
During 4-11 August, the Soufrière Hills lava dome continued to grow. The sulfur-dioxide flux averaged 230 metric tons per day. The Alert Level remained at 3 (on a scale of 0-5).
Source: Montserrat Volcano Observatory (MVO)
During 29 July-4 August, the Soufrière Hills lava dome continued to grow, mainly to the E. The loss of prominent spines made the dome appear more symmetrical. On 2 August, a small pyroclastic flow occurred and was associated with light ash fall to the N of the island. The Alert Level remained at 3 (on a scale of 0-5).
Source: Montserrat Volcano Observatory (MVO)
Lava dome growth continued at Soufrière Hills during 21-28 July. On 27 July, the blocky spine first observed on 21 July was seen leaning to the E, and many new spines had formed along the S-N-trending crest of the lava dome. Seismic activity decreased during the reporting period. On 30 July, a thermal anomaly was visible on satellite imagery.
Sources: Montserrat Volcano Observatory (MVO); Washington Volcanic Ash Advisory Center (VAAC)
During 14-21 July, the Soufrière Hills lava dome grew noticeably. A blocky spine was observed on the NE side, where growth had been focused. On 18 July, the spine height was estimated at 895 m. The Alert Level remained at 3 (on a scale of 0-5).
Source: Montserrat Volcano Observatory (MVO)
According to the Washington VAAC, the Montserrat Volcano Observatory reported a pyroclastic flow from Soufrière Hills on 13 July that reached the sea and produced an ash plume to an altitude of 2.4 km (8,000 ft) a.s.l.
Source: Washington Volcanic Ash Advisory Center (VAAC)
The Montserrat Volcano Observatory estimated that the Soufrière Hills lava dome volume was 27 million cubic meters on 27 June, prior to the 30 June partial lava-dome collapse, which means the growth rate during the month of June averaged about 8 cubic meters per second. On 7 July, the Alert Level was lowered to 3 (on a scale of 0-5).
Source: Montserrat Volcano Observatory (MVO)
Due to increased seismic activity at Soufrière Hills during approximately 24-29 June, the Alert Level was raised to 4 (on a scale of 0-5). On 30 June around 1300, the lava dome partially collapsed and produced pyroclastic flows to the E. According to the Washington VAAC, a pilot reported that an ash plume reached an altitude of 3 km (10,000 ft) a.s.l. and drifted NW. The VAAC also reported that the Montserrat Volcano Observatory indicated a second dome collapse occurred at 1830 on 30 June that also generated ash plumes to altitudes of 3 km (10,000 ft) a.s.l.
Sources: Associated Press; Montserrat Volcano Observatory (MVO); Antigua Sun [Original URL no longer exists 1/2017]; Radio Jamaica; Washington Volcanic Ash Advisory Center (VAAC)
During 16-23 June, only brief observations of the Soufrière Hills lava dome were possible due to inclement weather. The lava dome filled the base of the crater, which suggested a high rate of growth. On 17 June, lahars reached the Belham and other valleys on the lower flanks. Wet ash accumulated NW in the Salem and Olveston areas.
Source: Montserrat Volcano Observatory (MVO)
During 9-16 June, the Soufrière Hills lava dome continued to grow, but at a slower rate than during the 2-9 June reporting period. Vigorous ash-and-gas venting occurred from a vent to the N of the lava dome.
Source: Montserrat Volcano Observatory (MVO)
During 2-9 June, the Soufrière Hills lava dome continued to grow at a high rate of 10 cubic meters per second on average (average growth rate during January-April was 6 cubic meters per second). Vigorous ash-and-gas venting occurred from a vent to the W of the lava dome. According to a pilot report and MVO, the Washington VAAC reported on 9 June that a steam plume with little ash content reached an altitude of 1.5 km (5,000 ft) a.s.l. Weak incandescence was observed on satellite imagery on 10 June.
Sources: Montserrat Volcano Observatory (MVO); Washington Volcanic Ash Advisory Center (VAAC)
During 26 May to 2 June, the Soufrière Hills lava dome continued to grow at a high rate of 10 cubic meters per second (average growth rate during January-April was 6 cubic meters per second). Numerous rockfalls and vigorous ash venting occurred from a vent to the W of the lava dome. A pilot reported that a small ash plume extended NW on 31 May. Ash plumes extending W and NW were visible on satellite imagery during 1-5 June and reached a maximum altitude of 2.7 km (9,000 ft) a.s.l. on 3 and 5 June. An ash plume on 4 June extended N of Puerto Rico.
According to the Washington VAAC, ash-plume emissions continued during 24-30 May. On 24 May, emission of small volumes of gas and thin ash plumes continued and drifted W and SW. A pilot near St. Croix (NW) reported that the ash/haze layer reached an altitude of 1.5 km (5,000 ft) a.s.l. Ashfall was reported at San Juan (NW) airport. During 25-30 May, ash plumes reached an altitude of 4.6 km (15,000 ft) a.s.l. and drifted W and NW. On 24-26 May, a hot spot was visible on infrared satellite imagery.
Sources: Montserrat Volcano Observatory (MVO); Washington Volcanic Ash Advisory Center (VAAC)
During 24-30 May, lava-dome growth continued at Soufrière Hills. On 23 May, the new lava dome was observed for the first time since the 20 May dome collapse. The new lava dome was darker than the previous lava dome and on 25 May, reached a height of 767 m. Rockfalls were observed on the NE and SW sectors of the new lava dome. The largest of several active vents were on the W side of the dome and were responsible for ash-venting episodes.
According to the Washington VAAC, ash-plume emissions continued during 24-30 May. On 24 May, emission of small volumes of gas and thin ash plumes continued and drifted W and SW. A pilot near St. Croix (NW) reported that the ash/haze layer reached an altitude of 1.5 km (5,000 ft) a.s.l. Ashfall was reported at San Juan (NW) airport. During 25-30 May, ash plumes reached an altitude of 4.6 km (15,000 ft) a.s.l. and drifted W and NW. On 24-26 May, a hot spot was visible on infrared satellite imagery.
Sources: Montserrat Volcano Observatory (MVO); Washington Volcanic Ash Advisory Center (VAAC)
MVO reported that on the morning of 20 May a major lava-dome collapse at Soufriére Hills occurred over a time period of less than three hours. Approximately 90 million cubic meters of the lava dome material was shed from the summit leaving a broad, deep, eastward-sloping crater. Pyroclastic flows traveled E down the Tar River Valley and were estimated to extend out to 3 km over the sea. Lahars due to excessive rain were produced NW in the Belham River Valley, N in the Trants area, and to the NE. An ash cloud reached 16.8 km (55,000 ft) a.s.l. by 0740, the highest reported ash cloud during the 10 years of the eruption, and traveled NW. Lithics (average size of 3.5 cm across) fell NW of the volcano. On 21 May, ash and mud fell on the northern parts of the island. Prior to the lava-dome collapse, during 12 May and 19 May, lava extrusion had continued.
The Washington VAAC reported that the ash plume from the 20 May dome collapse initiated at approximately 0700. On 21 May, the remnant ash cloud from 20 May was at a height of ~11.3 km (37,000 ft) a.s.l. along the northern coast of South America and the Southern Caribbean. An ash cloud at a height of ~7 km (23,000 ft) a.s.l. extended S of Puerto Rico and the Dominican Republic. According to news reports, the ash cloud on 20 May forced the suspension of some international flights in areas of the Caribbean through 21 May. On 22 May, multi-spectral imagery indicated that an ash plume at a height of ~3 km (10,000 ft) a.s.l. extended over the islands of Anguilla, St. Martin, and St. Kitts. On 23 May, a thin ash plume was visible on satellite imagery and moved WNW.
Sources: Associated Press; Montserrat Volcano Observatory (MVO); Washington Volcanic Ash Advisory Center (VAAC)
During 5-12 May, the new lobe of the lava dome at Soufrière Hills that developed towards the S produced rockfalls that predominantly extended from the W to the SE. On the 12th, the lava dome volume was approximately 80 million cubic meters, having grown at an average rate of 8 cubic meters per second through April. Seismicity typical of this current growth phase was dominated by rockfall activity during the report period. The average sulfur-dioxide flux during the week was 702 metric tons per day.
Sources: Montserrat Volcano Observatory (MVO); Washington Volcanic Ash Advisory Center (VAAC)
Observations of Soufrière Hills during 21-28 April revealed that lava extrusion continued. Dome growth occurred over a sector extending SW to NE. The eastward facing lobe continued to grow on the NE side of the dome and a central spine was observed on 28 April. Small rockfalls and pyroclastic flows continued to initiate from the active E flank of the dome, adding to the talus in the upper reaches of the Tar River Valley. Rockfalls were accompanied by minor ash venting. Thermal images taken on 27 April indicated some very hot (in excess of 400°C) areas on the E flank of the dome. During the report period seismicity was dominated by rockfalls, as has been the case throughout the on-going phase of dome growth. The sulfur-dioxide flux averaged 520 metric tons per day, close to the long-term average for the entire eruption.
Sources: Montserrat Volcano Observatory (MVO); Washington Volcanic Ash Advisory Center (VAAC)
Observations of Soufrière Hills' lava dome during 14-21 April suggested that lava extrusion continued. Growth occurred over a sector extending E to N, and on 18 April observers noted a smooth area of the dome resembling a whale's back. Numerous small rockfalls continued from the active eastern flanks of the lava dome, adding to the talus in the upper reaches of the Tar River Valley. Rockfalls were accompanied by minor ash venting. Due to unusual wind conditions, plumes were predominately transported N and NW, shifting to the E on 20 April. As a result of this process, light ashfall occurred over much of Montserrat.
Sources: Montserrat Volcano Observatory (MVO); Washington Volcanic Ash Advisory Center (VAAC)
Observations of the lava dome at Soufrière Hills suggested that lava extrusion continued during 7-14 April. Growth occurred over a sector extending E to N, and an eastward-facing lobe developed on the NE side of the dome. Numerous small rockfalls continued from the active eastern flanks of the dome, adding to the talus in the upper reaches of the Tar River valley. Rockfalls were accompanied by minor ash venting. Due to the wind coming from the S in contrast to the normal prevailing wind direction (from the E) during the second half of the report period, ash fell over many parts of Montserrat: notably after a minor pyroclastic flow occurred at 0645 on 14 April. During the report period, the sulfur-dioxide flux averaged 540 metric tons per day. The hydrogen chloride to sulfur dioxide ratio on 12 April was 3.75, higher than 2.64 measured the previous week.
Sources: Montserrat Volcano Observatory (MVO); Washington Volcanic Ash Advisory Center (VAAC)
Low extrusion rates occurred at Soufrière Hills' lava dome at the beginning of the interval 31 March to 7 April. Continued lava-dome growth was focused E, with a lava lobe growing in that direction and the majority of rockfalls and pyroclastic flows occurring in the SE to NE sector. Photographs taken on 6 April clearly showed slightly elevated extrusion rates with lobe development on the E side of the dome. One moderate-sized pyroclastic flow occurred around 1030 on 2 April, resulting in minor ashfall to the W of the island. During the report period, the sulfur-dioxide flux averaged 578 metric tons per day. The hydrogen chloride to sulfur dioxide ratio was 2.3 and 2.6 on 4 and 5 April, respectively.
Sources: Montserrat Volcano Observatory (MVO); Washington Volcanic Ash Advisory Center (VAAC)
During 24-31 March, lava-dome growth at Soufrière Hills was focused towards the E, with a lava lobe growing in that direction and the majority of rockfalls and pyroclastic flows occurring in the SE and NE sectors of the volcano. The largest pyroclastic flows traveled as far as 2 km NE down Tar River Valley. The sulfur-dioxide flux averaged 523 metric tons per day.
Sources: Montserrat Volcano Observatory (MVO); Washington Volcanic Ash Advisory Center (VAAC)
Observations of Soufrière Hills during 17-24 March revealed that lava-dome growth was focused in the summit area and towards the E and NE. The N side of the lava dome showed little change. Rockfalls and pyroclastic flows were restricted to the Tar River Valley and they were particularly numerous on 19-20 March. The largest pyroclastic flows traveled as far as 2 km down Tar River Valley. There was an increase in gas emission during the report period. The sulfur-dioxide flux averaged 1,034 metric tons per day, with high gas emissions occurring on days of elevated pyroclastic-flow activity. The hydrogen chloride to sulfur dioxide ratio was 2.8 on 22 March. The ground-deformation network continued to indicate deflation across the volcano.
Sources: Montserrat Volcano Observatory (MVO); Washington Volcanic Ash Advisory Center (VAAC)
Cloudy conditions during 10-17 March limited visual observations of Soufrière Hills, however, lava-dome growth continued to be focused towards the E, NE, and NW as was evidenced by the production of large numbers of rockfalls and small pyroclastic flows. The ground deformation network showed a continuing trend of line shortening across the volcano. The sulfur-dioxide flux averaged 480 metric tons per day. The hydrogen chloride to sulphur dioxide ratio ranged between 1.1. and 2.1.
Sources: Montserrat Volcano Observatory (MVO); Washington Volcanic Ash Advisory Center (VAAC)
During 3-10 March, lava-dome growth continued at Soufrière Hills in a northerly direction and the dome reached a height of ~950 m. The active lava lobe shed rockfalls and small pyroclastic flows to the W, N, and E. A very vigorous gas vent was seen on the W side of the lava dome on 8 March, above Gages valley. Small fumaroles were visible at the top of Gages valley and below the lava dome remnant that stands at the top of Gages Valley. The shortening monitored by Electronic Distance Measurement (EDM) on the NE flank of the volcano between Jack Boy Hill and Hermitage Estate since mid-February appeared to have eased. Recently processed Global Positioning System (GPS) baseline data suggested continued deflation, with the distance between Mongo Hill and South Soufrière Hill (N/S baseline) reducing, and E/W baselines remaining largely unchanged. The sulfur-dioxide flux varied greatly, but produced an overall average of 454 metric tons per day for the week.
Sources: Montserrat Volcano Observatory (MVO); Washington Volcanic Ash Advisory Center (VAAC)
On 26 February, rapid vertical growth of the lava dome at Soufrière Hills was visible on camera images, and by 27 February a large spine about 30 m wide and at least 30 m high had developed at the dome's summit. By 28 February this spine had split into two parts and was leaning precariously to the NE. At about 2115 on 28 February the overhanging parts of the spine disintegrated and generated pyroclastic flows that traveled down the Tar River Valley almost as far as the coast. A low-level ash cloud drifted W. There were further changes to the shape of the spines and the upper NE flank of the volcano in the following days as they disintegrated further. Rockfalls were visible on the N, NE, and E flanks of the volcano. Some fumaroles were observed on the upper outside part of Gages Wall (W of the lava dome) on 27 February suggesting movement of fluids in this area.
The sulfur-dioxide flux was low, with an average of 388 metric tons measured daily. Electronic Distance Measurement surveys showed a shortening of the distance between Jack Boy Hill and Hermitage on the NE flank of the volcano of 6 mm since 10 February. Similarly, the distance between Windy Hill and a reflector on Farrell's on the N flank of the volcano shortened by 6 mm in the same period. The last significant detected change in these measurements was in response to the onset of lava-dome growth in August 2005.
Sources: Montserrat Volcano Observatory (MVO); Washington Volcanic Ash Advisory Center (VAAC)
Photographs of Soufrière Hills taken during 17-24 February confirmed ongoing lava-dome growth. The newest lobe, which appeared on the dome's NW side on 10 February, continued to grow on all sides. It appeared to have filled in the gap between the lava dome and the N and W crater walls. It also grew significantly to the E, overtopping the older lobe by the end of the report period. After 22 February, incandescent rockfalls were visible at night, coursing down the N,E, and SW sides of the dome and into the Tar River Valley. The sulfur-dioxide flux was low, with an average of 286 metric tons per day.
Sources: Montserrat Volcano Observatory (MVO); Washington Volcanic Ash Advisory Center (VAAC)
MVO reported that during vigorous ash-and-steam venting at Soufrière Hills on 10 February, a small dark lobe of lava was observed on the western side of the lava dome in the crater. By early on 11 February this lobe had advanced rapidly towards the NE side of the dome and was visible as a steep-sided plateau of lava from inhabited areas around Salem. Photographs from fixed cameras showed continued changes to this lava lobe over the next few days, and the NE margin could be seen glowing at night and shedding rockfalls into the NE part of the crater. The initial growth rate of this lobe was well over 5 cubic meters per second, but the rate declined around 17 February. The new lava lobe began to fill the gap between the lava dome and the northern and western crater walls, raising the possibility that small rockfalls could spill over those areas in coming weeks.
The sulfur-dioxide flux averaged 568 metric tons per day. Data from Fourier Transform Infra Red spectrometry measurements indicated an increase in the hydrogen chloride/sulfur dioxide mass ratio in the gas plume from 2.0 in the last reporting period to an average of 2.5 on 13 February.
Sources: Montserrat Volcano Observatory (MVO); Washington Volcanic Ash Advisory Center (VAAC)
MVO reported to the Washington VAAC that increased activity began at Soufrière Hills on 10 February. That day, satellite imagery showed a prominent hotspot at the volcano and a NW-drifting ash plume at a height of ~3 km (10,000 ft) a.s.l. Ash-and-gas emissions continued through 15 February, producing plumes to a height of ~2.7 km (9,000 ft) a.s.l. MVO reported that on 15 February, there was markedly less volcanic activity, with steam and a small amount of ash emitted to ~1.4 km (4,450 ft) a.s.l.
Source: Washington Volcanic Ash Advisory Center (VAAC)
Volcanic and seismic activity at Soufrière Hills were at elevated levels during 27 January to 3 February. Images taken by a remote camera at the beginning of the report period indicated that the lava dome continued to grow over a broad sector extending from the SW around to the NE. A pair of spines was observed on the SE side of the dome on 29 January, although both these and the fin-like structures (relatively thin, vertical planar spines) on the SE flank of the dome collapsed during the report period. Numerous small rockfalls were observed emanating from the S,E, and NE flanks of the lava dome, adding to the talus in the upper reaches of the Tar River Valley. Continued lava-dome growth was observed, particularly at the southern end, which was higher than the northern end of the dome. The sulfur-dioxide flux averaged 594 metric tons per day.
Source: Montserrat Volcano Observatory (MVO)
Activity at Soufrière Hills remained elevated during 20-27 January. Images taken by a remote camera showed that the lava dome continued to grow over a broad sector extending from the SW around to the NE. On 22 January, two new fin-like structures (relatively thin, vertical planar spines) were seen on the southeastern flank of the lava dome. Numerous small rockfalls were observed falling from the S, E, and NE flanks of the dome, adding to the talus in the upper reaches of the Tar River valley. Helicopter observations indicated continued dome growth, particularly in the SE.
Source: Montserrat Volcano Observatory (MVO)
Activity at Soufrière Hills remained elevated during 13-20 January 2006. The seismic network recorded 61 rockfall signals, 17 long-period earthquakes, and 15 long-period rockfall signals. Measured sulfur dioxide fluxes ranged between 350 and 1,160 metric tons/day (t/d); the weekly average was 767 t/d. Images taken by the remote camera on Perches Mountain show that the dome continued to grow over a broad sector extending from the SW around to the NE. A central spine was first observed on 17 January when cloud cleared briefly from the. Continuing small rockfalls from the S, E, and NE flanks of the dome are visible at, and are adding to the talus in the upper reaches of the Tar River valley.
Source: Montserrat Volcano Observatory (MVO)
Activity at Soufrière Hills remained at elevated levels during 6-13 January. Photographs revealed that the lava dome continued to grow throughout the report period over a broad sector extending from the E around to the N. Numerous small rockfalls continued from the E and NE flanks of the lava dome, adding talus in the upper reaches of the Tar River valley. The sulfur-dioxide flux averaged 724 metric tons per day.
Source: Montserrat Volcano Observatory (MVO)
Activity at Soufrière Hills remained at elevated levels during 30 December to 6 January. Photographs revealed that the lava dome continued to grow throughout the report period over a broad sector extending from the SW around to the NE. Numerous small rockfalls continued from the S, E, and NE flanks of the lava dome, adding talus in the upper reaches of the Tar River valley to the NE. The sulfur-dioxide flux averaged 522 metric tons per day.
Source: Montserrat Volcano Observatory (MVO)
Volcanic and seismic activity at Soufrière Hills remained at elevated levels during 23-30 December. Images indicated that the lava dome continued to grow over a broad sector extending from the SW around to the NE. Numerous small rockfalls continued on the S, W, and NE sides of the lava dome, adding to the talus in the upper reaches of the Tar River Valley to the NE. The sulfur-dioxide flux averaged 510 metric tons per day.
Source: Montserrat Volcano Observatory (MVO)
Volcanic and seismic activity at Soufrière Hills remained elevated during 16-23 December. Images revealed that the lava dome continued to grow during the report period. Growth occurred over a broad sector extending from the SW around to the NE. Vertical growth was focused to the S and SW, with lateral growth in the E and SE sectors. Numerous small rockfalls traveled down the S, E, and NE flanks of the lava dome, adding to the talus in the upper reaches of the Tar River Valley to the NE. The sulfur-dioxide flux averaged 415 metric tons per day.
Source: Montserrat Volcano Observatory (MVO)
During 9-16 December, seismic and volcanic activity remained at elevated levels at Soufrière Hills. Images taken during the report period showed that the lava dome continued to grow. Growth occurred over a broad sector extending from the SW around to the NE, but was mostly focused towards the S and SW. Numerous small rockfalls traveled down the S, E, and NE flanks of the lava dome, adding to the talus in the upper reaches of the Tar River valley. The sulfur-dioxide flux averaged 489 metric tons per day.
Source: Montserrat Volcano Observatory (MVO)
Activity at Soufrière Hills remained at elevated levels during 2-9 December. Camera images of the lava dome indicated that extrusion rates were slightly lower than during previous report periods. The height of the lava dome only slightly increased. Most growth was focused towards the SE where the flank had been pushed out laterally. Incandescence was visible in this area. Numerous small rockfalls occurred on the SE flank, adding to the talus apron in the upper reaches of the Tar River valley. The sulfur-dioxide flux averaged 1,114 metric tons per day.
Source: Montserrat Volcano Observatory (MVO)
Activity at Soufrière Hills remained elevated during 25 November-2 December 2005. The seismic network recorded 158 rockfall signals, one volcano-tectonic earthquake, 93 long-period earthquakes, two hybrid earthquakes, and 17 long-period rockfall signals during the reporting period. Measured sulfur dioxide fluxes varied between 600 metric tons per day (t/d) measured on 30 November and 830 t/d on 26 November, with a weekly average of 690 t/d. Dome growth continued on all flanks, although activity was most intense on the S and E; incandescence was observed at night on the SE and E flanks throughout the reporting period. Large rockfalls and small pyroclastic flows collapsed off the E flank of the dome during this period and entered the upper reaches of the Tar River Valley.
Source: Montserrat Volcano Observatory (MVO)
Activity at Soufrière Hills increased during 18-25 November in comparison to the previous week. Growth of the volcano's lava dome was focused towards the E and S, with minor activity to the S and W. Continuous incandescence was observed at night on the SE and E sides of the lava dome. A pyroclastic flow was seen in the upper reaches of the Tar River Valley on 22 November. Minor ash emissions occurred from the volcano, including one on the afternoon of 24 November that sent an ash cloud several hundred meters above the volcano's summit. Measurements of sulfur-dioxide emissions were only possible on 2 days due to the wind direction. An average of 1,055 metric tons of sulfur dioxide was measured daily.
Source: Montserrat Volcano Observatory (MVO)
Seismic and volcanic activity at Soufrière Hills remained at elevated levels during 11-18 November. Clear observations of the lava dome on the morning of 18 November indicated that it continued to grow and was shedding rockfalls to the E, S, W, and NW. A pyroclastic flow was observed in the Tar River valley on 15 November and reached to within a kilometer of the sea. The ash cloud associated with this event rose to ~2.1 km (~7,000 ft) a.s.l. The sulfur-dioxide flux averaged 650 metric tons per day.
Source: Montserrat Volcano Observatory (MVO)
Volcanic and seismic activity at Soufrière Hills remained elevated during 4-11 November. Images showed incandescence at the lava dome at night, and growth of the E, S, and SE sectors. Radar imaging of the lava dome indicated that its volume was about 6.5 million cubic meters, suggesting a growth rate over the past 2 weeks between 1.3 and 1.8 cubic meters per second. The sulfur-dioxide flux averaged 445 metric tons per day.
Source: Montserrat Volcano Observatory (MVO)
Volcanic and seismic activity remained elevated at Soufrière Hills during 28 October to 4 November. Observations on 4 November confirmed that lava-dome growth continued, predominantly above the volcano's S flank.
Source: Montserrat Volcano Observatory (MVO)
Volcanic and seismic activity at Soufrière Hills remained at elevated levels during 21-28 October. On 26 October around 2400, a pyroclastic flow traveled ~2 km down the volcano's NE flank. The pyroclastic flow was confined to the Tar River Valley. During the report week, the lava dome continued to grow and incandescence was visible at night. The sulfur-dioxide flux averaged 420 metric tons per day (t/d), below the long-term eruption average of 500 t/d. The hydrogen-chloride to sulfur-dioxide ratio measured on 26 October was at 1.3. According to the Washington VAAC, a pilot reported observing a thin layer of ash at a height of ~2.4 km (8,000 ft) a.s.l. above St. Croix on 28 October at 1010.
Sources: Montserrat Volcano Observatory (MVO); Washington Volcanic Ash Advisory Center (VAAC)
During 14-21 October, elevated seismic and volcanic activity continued at Soufrière Hills. A majority of the volcano-tectonic earthquakes recorded during the week occurred during a 36-hour period over 17-18 October when a lobe on the S part of the lava dome was developing. At this time there were also a large number of rockfalls, which continued until 20 October. The daily sulfur-dioxide flux averaged 658 metric tons per day (t/d), above the long-term eruption average of 500 t/d. The hydrogen-chloride versus sulphur-dioxide ratio increased to about 1.15. Limited camera observations suggested that the lava dome was growing at a rate of less than 2 cubic meters per second.
Source: Montserrat Volcano Observatory (MVO)
Volcanic and seismic activity at Soufrière Hills remained at elevated levels during 7-14 October. Lava-dome growth mostly occurred on the W side of the dome, which was largely obscured by clouds and steam. Observations suggested that the lava-dome growth rate increased, with preliminary calculations suggesting a rate of at least 2 cubic meters per second. Incandescence was visible at the lava dome on a video camera at night. The sulfur-dioxide flux averaged 580 metric tons per day (t/d), above the long-term eruption average of 500 t/d. The hydrogen-chloride versus sulfur-dioxide ratio increased to about 1.
Source: Montserrat Volcano Observatory (MVO)
Volcanic and seismic activity at Soufrière Hills remained at elevated levels during 23-30 September. Slow lava-dome growth continued at the volcano. The daily sulfur-dioxide flux averaged 950 metric tons per day (t/d), above the long-term eruption average of 500 t/d.
Source: Montserrat Volcano Observatory (MVO)
Volcanic and seismic activity at Soufrière Hills remained at elevated levels during 16-23 September. Observations on 20 September suggested that slow lava-dome growth continued. The daily sulfur-dioxide flux averaged 680 metric tons per day (t/d), above the long-term eruption average of 500 t/d.
Source: Montserrat Volcano Observatory (MVO)
Activity at Soufrière Hills remained at elevated levels during 9-16 September. Observations made during the week suggested that slow lava-dome growth continued on the dome's eastern side, but the western side was obscured by steam. The sulfur-dioxide flux averaged 533 metric tons per day (t/d), slightly above the long-term eruption average of 500 t/d.
Source: Montserrat Volcano Observatory (MVO)
Activity at Soufrière Hills remained at elevated levels during 2-9 September. Observations made on 5 September suggested that slow lava-dome growth continued. The sulfur-dioxide flux averaged 410 metric tons per day (t/d), below the long-term eruption average of 500 t/d.
Source: Montserrat Volcano Observatory (MVO)
Volcanic and seismic activity at Soufrière Hills remained at elevated levels during 19-26 August. During the report week, there was little ash venting and the daily sulfur-dioxide flux averaged 900 metric tons per day (t/d), above the long-term eruption average of 500 t/d.
Source: Montserrat Volcano Observatory (MVO)
Volcanic and seismic activity remained at elevated levels at Soufrière Hills during 12-19 August. Periodic ash venting continued, with a vigorous episode occurring on 18 August at 1800. On 16 August, the presence of a small blocky lava dome with talus slopes was confirmed. There was some ash venting from the dome, but no significant rockfalls were seen. The daily recorded sulfur-dioxide flux averaged 570 metric tons per day (t/d), above the long-term eruption average of 500 t/d.
Source: Montserrat Volcano Observatory (MVO)
Volcanic and seismic activity at Soufrière Hills remained at elevated levels during 5-12 August. The volcano's seismic network recorded three volcano-tectonic, three hybrid, and five long-period earthquakes. It also recorded 14 rockfall signals. Periodic ash venting continued during the report period, with a vigorous episode on 6 August sending a plume to ~1.8 km above the volcano (or ~9,400 ft. a.s.l.). Evidence of uplift and fracturing were observed on the crater floor, and an area of blocky lava resembling a small lava dome was observed. Due to poor visibility further observations will be necessary to determine if the feature is a new dome or was caused by the collapse, or uplift, of old dome rock.
Source: Montserrat Volcano Observatory (MVO)
Seismic activity at Soufrière Hills remained elevated from 3 to 9 August. Analysis of the ash from the 28 June explosion showed no evidence for the involvement of fresh magma.The daily recorded sulfur dioxide flux varied from 300 metric tons/day (t/d) on 4 August to 2,200 t/d on 2 August, with an average of 986 t/d for the week. This is above the long-term average for the eruption of 500 t/d.
Source: Montserrat Volcano Observatory (MVO)
Seismic and volcanic activity at Soufrière Hills remained at elevated levels during 22-29 July. The seismic network recorded 29 volcano-tectonic, four hybrid, and five long-period earthquakes. It also recorded one explosion and 23 rockfalls. An explosion on 27 July at 0114 deposited ash between Plymouth on the island's W side, and Brades on the island's NW side. The explosion was similar to, but smaller than, an explosion on 18 July. Occasional ash venting also occurred during the report week. The daily recorded sulfur-dioxide flux averaged 510 metric tons per day (t/d), slightly above the long-term average of 500 t/d.
Source: Montserrat Volcano Observatory (MVO)
Seismic and volcanic activity remained at elevated levels at Soufrière Hills during 15-22 July. The seismic network recorded 19 volcano-tectonic, 16 hybrid, and 13 long-period earthquakes. It also recorded 11 rockfalls and one explosion. The explosion occurred on 18 July at 0301 and deposited ash between Fogarty Hill in the NW of the island and Brodericks Yard in the SW. The deepest ash deposits were recorded at Weekes. An ash plume rose to at least 6.1 km (20,000 ft). The explosion was similar to, but slightly larger than, an explosion on 3 July. Analysis of ash from an explosion on 28 June showed no evidence for the involvement of fresh magma. The sulfur-dioxide flux reached an average of 608 metric tons per day during the report period.
Source: Montserrat Volcano Observatory (MVO)
Volcanic and seismic activity at Soufrière Hills remained at elevated levels during 8-15 July. The seismic network recorded 10 hybrid and two volcano-tectonic earthquakes during the report period. Also, several ash-venting events occurred and there was an explosion on 9 July at 2000. The average daily sulfur-dioxide flux remained above the average for the eruption. FTIR measurements of the hydrogen chloride to sulfur dioxide ratio on 12 July were consistent with values measured since the current eruptive pause began in July 2003.
Source: Montserrat Volcano Observatory (MVO)
During 1-8 July, seismic and volcanic activity at Soufrière Hills remained at elevated levels. The seismic network recorded 15 hybrid earthquakes, 11 long-period earthquakes, 9 volcano-tectonic earthquakes, and 11 rockfalls. Periodic ash venting continued and an explosion occurred on 3 July at 0130, which was similar to an explosion on 28 June. The reversal of deformation to an inflationary trend that began in mid-July continued during the report period. The daily recorded sulfur-dioxide flux varied from 241 metric tons per day (t/d) on 4 July to 1700 t/d on 1 July, with an average of 767 t/d for the week. This was above the long-term average for the eruption of 500 t/d.
Source: Montserrat Volcano Observatory (MVO)
During 24 June to 1 July, seismic and volcanic activity at Soufrière Hills was elevated in comparison to the previous week. Periodic episodes of intense ash venting continued during the report period, culminating in an explosive event beginning on 28 June at 1306. During the event, ballistics were ejected onto the Farrell's plain (to the NW) and a column collapse produced pyroclastic flows. The pyroclastic flows reached the sea at the Tar River delta (to the NE) and a smaller volume of material flowed into the top of Tyre's Ghaut (to the N). Ash analyses from a venting episode on 13 June did not indicate the presence of fresh magma.
Preliminary analysis of recent ground deformation data from the GPS network at the volcano showed that deflation during April to mid June 2005 had later reversed, and the volcano appeared to be inflating. The daily recorded sulfur-dioxide flux varied from 300 metric tons per day (t/d) on 28 June to 700 t/d on 29 June, with an average of 470 t/d for the week.
Source: Montserrat Volcano Observatory (MVO)
Seismic and volcanic activity at Soufrière Hills were at elevated levels during 17-24 June. The seismic network at the volcano recorded 8 hybrid earthquakes, 5 long-period earthquakes, 4 volcano-tectonic earthquakes, and 3 rockfalls. On 27 June a steam and ash cloud at ~3 km (9,800 ft) a.s.l. was reported to be drifting W. The daily recorded sulphur dioxide flux varied from a low of 430 metric tons per day (t/d) on 20 June, to a maximum of 1150 t/d on 23 June, with an average of 627 t/d for the week. By 28 June satellite imagery shows a plume of ash and steam at ~1.8 km (5,900 ft) a.s.l. extending NW of the volcano.
Sources: Montserrat Volcano Observatory (MVO); Washington Volcanic Ash Advisory Center (VAAC)
Seismic and volcanic activity at Soufrière Hills were at elevated levels during 10-17 June. The seismic network at the volcano recorded 17 hybrid earthquakes, 20 long period earthquakes, 46 volcano-tectonic earthquakes, and 7 rockfalls. A period of ash venting that began on 13 June at 0600 declined in intensity during the report week. The ash venting was caused by the rapid release of steam and other volcanic gases, possibly triggered by intense rainfall on the night of 12 June. The daily recorded sulfur-dioxide flux varied from 170 metric tons per day (t/d) on 10 June, to a maximum of 750 t/d on 14 June, with an average of 460 t/d for the week.
Source: Montserrat Volcano Observatory (MVO)
On 13 June at 0600 there was an increase in volcanic and seismic activity at Soufrière Hills. A series of volcano-tectonic earthquakes was accompanied by low-level tremor and a period of ash venting. An ash plume reached a height of ~2.4 km (7,900 ft) a.s.l and drifted NE, depositing light ash in Lookout, Geralds, and St. Peters. Activity decreased significantly after 0900.
Prior to the activity increase, during 3-10 June, the seismic network at Soufrière Hills recorded 17 volcano-tectonic earthquakes and one rockfall. Steam venting continued on the NW side of the crater. The daily recorded sulfur-dioxide flux varied from a low of 142 metric tons per day (t/d) on 4 June to a maximum of 671 t/d on 7 June, with an average of 399 t/d for the week. This was below the eruption's long-term average of 500 t/d.
Source: Montserrat Volcano Observatory (MVO)
The seismic network at Soufrière Hills recorded 8 volcano-tectonic earthquakes during 27 May to 3 June. Steam venting continued on the NW side of the crater. The daily recorded sulfur-dioxide flux ranged from a low of 167 metric tons per day (t/d) on 2 June to a maximum of 392 t/d on 30 May, with an average of 261 t/d for the week. This was below the long-term eruption average of 500 t/d.
Source: Montserrat Volcano Observatory (MVO)
During 20-27 May, the seismic network at Soufrière Hills recorded 67 volcano-tectonic earthquakes (mostly during 20-21 May) and steam venting continued on the NW side of the crater. A sulfur-dioxide flux of 880 metric tons was recorded on 26 May, above the long-term average of 500 metric tons per day.
Source: Montserrat Volcano Observatory (MVO)
During 13-20 May, the seismic network at Soufrière Hills recorded 18 volcano-tectonic earthquakes (most occurred on 17 May) and 3 hybrid earthquakes. Steam venting that began on the NW side of the crater on 15 April continued. The daily recorded sulfur-dioxide flux varied from a low of 222 metric tons per day (t/d) on 16 May to a maximum of 363 t/d on 14 May, with an average of 286 t/d. This was below the eruption's long-term average of 500 t/d.
Source: Montserrat Volcano Observatory (MVO)
The seismic network recorded 38 volcano-tectonic (VT) earthquakes, one hybrid earthquake and one rockfall during 6-13 May. Steam venting on the NW side of the crater continued. The daily recorded sulfur dioxide flux varied from a low of 221 metric tons per day (t/d) on 11 May to a maximum of 537 t/d on the 9th. The average of the six measurements during the week was 398 t/d, below the long-term eruption average of 500 t/d.
Source: Montserrat Volcano Observatory (MVO)
Steam venting continued during the week of 29 April-6 May from the NW side of the crater. Sulfur dioxide flux measurements were made every day, resulting in an average of 439 metric tons/day, below the long-term average for the eruption (500 tons/day).
Source: Montserrat Volcano Observatory (MVO)
Steam venting that began at the NW side of Soufrière Hills' crater on 15 April continued during 22-29 April. An average sulfur-dioxide flux of 304 metric tons per day was measured during 4 days in the report week. This value was below the long-term eruption average of 500 metric tons per day.
Source: Montserrat Volcano Observatory (MVO)
Beginning on 15 April, vigorous steam-and-ash venting occurred on the NW side of Soufrière Hills crater. It was accompanied by tremor, which decreased during the following days and stopped on 18 April. Rainfall on 21 April caused a small mudflow in the Belham River Valley to the NE of the volcano. There was light ashfall W of the volcano during 23-24 April. An average of 365 metric tons of sulfur dioxide was measured daily, below the long-term average for the eruption of 500 metric tons per day.
Source: Montserrat Volcano Observatory (MVO)
Seismic activity at Soufrière Hills remained at low levels during 11-18 March. The seismic network recorded six volcano-tectonic earthquakes and one rockfall. The sulfur-dioxide flux ranged between 235 and 630 metric tons per day, with an average of 425 metric tons per day. This was below the long-term average for the eruption of 500 metric tons per day.
Source: Montserrat Volcano Observatory (MVO)
Seismicity remained at low levels at Soufrière Hills during 4-11 March. The sulfur-dioxide flux remained around the same level as the previous week, with an average of 695 metric tons recorded daily. During the week, a strong sulfurous smell was noticed across the northern part of Montserrat. MVO attributed this to a deviation from the normal prevailing wind direction.
Source: Montserrat Volcano Observatory (MVO)
MVO reported that during 25 February to 4 March, seismic activity at Soufrière Hills remained at low levels. The sulfur-dioxide flux remained fairly stable, averaging 672 metric tons per day. FTIR (Fourier-Transform Infrared Spectroscopy) measurements on 3 March yielded a hydrogen chloride to sulphur dioxide mass ratio of 0.35, showing no significant change since the last measurement in February. Views of the entire summit on 3 March revealed that there were no surficial changes at the volcano. There was still a small pond in the 3 March 2004 explosion pit.
A news article reported that hazy skies over St. Martin (NE of Soufrière Hills) and the surrounding islands on 6 March were the result of increased activity at Soufriere Hills. Several people in the eastern section of St. Martin reported a thin film of "dust" on their homes and vehicles. According to the Washington VAAC, a very faint area of possible ash was visible on satellite imagery on 6 March extending NE.
Sources: Montserrat Volcano Observatory (MVO); The Daily Herald; Washington Volcanic Ash Advisory Center (VAAC)
During 28 January- 4 February, seven long-period, one volcano-tectonic, and two hybrid earthquakes were recorded at Soufrière Hills. On 28 January, the daily sulfur-dioxide flux was 410 metric tons. No significant morphological changes were observed at the volcano's edifice during a flight on 1 February.
Source: Montserrat Volcano Observatory (MVO)
During 14-21 January, at Soufrière Hills two hybrid earthquakes and two rockfalls were recorded by the seismic network. Sulfur-dioxide flux rates of 300 and 380 metric tons per day were recorded on 15 and 16 January, respectively. No significant change in the morphology of the volcanic edifice was seen during an observational flight on 19 January.
Source: Montserrat Volcano Observatory (MVO)
During 24-31 December, one long-period, six hybrid, and two volcano-tectonic earthquakes were recorded at Soufrière Hills. The sulfur-dioxide flux averaged 410 metric tons per day and ranged between 300 and 550 metric tons per day.
Source: Montserrat Volcano Observatory (MVO)
During 17-24 December, six hybrid earthquakes and one volcano-tectonic earthquake were recorded by the seismic network at Soufrière Hills. Sulfur-dioxide flux ranged 200-500 metric tons per day, with an average of 325 metric tons per day. An observation flight revealed the continued existence of an explosion-pit pond and no lava-dome growth.
Source: Montserrat Volcano Observatory (MVO)
During 10-17 December, at Soufrière Hills six hybrid earthquakes and seven volcano-tectonic earthquakes were recorded by the seismic network. The sulfur-dioxide flux ranged 290-450 metric tons per day, averaging 360 tons per day. During the late afternoon of 15 December, heavy rain caused a mudflow in the Belham Valley.
Source: Montserrat Volcano Observatory (MVO)
During 19-26 November, the seismic network at Soufrière Hills recorded 25 hybrid earthquakes, five volcano-tectonic earthquakes, three rockfalls, and one long-period earthquake. The sulfur-dioxide flux was between 125 and 330 metric tons per day, averaging 195 metric tons per day during the report period.
Source: Montserrat Volcano Observatory (MVO)
During 8-15 November, volcanic and seismic activity at Soufrière Hills remained elevated. The seismic network recorded one rockfall and nine hybrid earthquakes. Weather conditions limited measurements of sulfur dioxide emissions during 8-15 November. Reliable data were only available for two days when the plume blew over the sensors, yielding SO2-flux estimates of 141 and 501 metric tons per day. Circumstances prevented visual status reports on the crater.
Source: Montserrat Volcano Observatory (MVO)
During 29 October to 5 November, volcanic and seismic activity at Soufrière Hills remained elevated. The seismic network recorded one rockfall, 33 hybrid earthquakes, and 39 volcano-tectonic earthquakes. The increased hybrid and volcano-tectonic activity was thought to be related to rainfall. In association with the rainfall, minor mudflow activity was recorded on 1 and 3 November. The sulfur-dioxide flux averaged about 290 metric tons per day, with a high of 440 metric tons on 30 October. An observation flight over the volcano on 4 November revealed the continued existence of standing water in the explosion pit produced by the 3 March 2004 event and no evidence of a re-start of lava-dome growth.
Source: Montserrat Volcano Observatory (MVO)
Volcanic and seismic activity at Soufrière Hills continued to be at elevated levels during 22-29 October. The seismic network recorded one volcano-tectonic and 40 hybrid earthquakes. Like the previous week, the increased hybrid earthquake activity was thought to be related to heavy rainfall during the report period. In association with the heavy rainfall, minor mudflow activity was recorded and observed in the Belham River. An observation flight over the volcano on 28 October revealed the continued existence of standing water in the explosion pit produced by the 3 March 2004 event and no evidence of a re-start of lava-dome growth.
Source: Montserrat Volcano Observatory (MVO)
Seismic activity at Soufrière Hills was at elevated levels during 15-22 October in comparison to previous weeks. The seismic network recorded four rockfall events and 49 hybrid earthquakes, and one volcano-tectonic earthquake. MVO scientists thought that increased hybrid earthquake activity was related to heavy rainfall during the week. The sulfur dioxide gas flux varied from 250 to 1,100 metric tons per day during the report period. Mudflows were recorded during 15, 19, and 21 October.
Source: Montserrat Volcano Observatory (MVO)
Volcanic and seismic activity at Soufrière Hills remained at slightly elevated levels during 8-15 October, as they have since mid-September 2004. The seismic network recorded one rockfall and nine hybrid earthquakes. Sulfur-dioxide flux measurements were only possible on 2 days; 156 and 553 metric tons per day were recorded.
Source: Montserrat Volcano Observatory (MVO)
Volcanic and seismic activity at Soufrière Hills remained at slightly elevated levels during 1-8 October. The seismic network recorded one rockfall, two long-period earthquakes, and eight hybrid earthquakes. The sulfur-dioxide flux ranged between 187 and 1,144 metric tons per day, with a weekly average of 462 metric tons per day.
Source: Montserrat Volcano Observatory (MVO)
Volcanic and seismic activity at Soufrière Hills during 24 September to 1 October remained slightly elevated, as has been the case for several weeks. The seismic network recorded three rockfalls, one long-period earthquake, and eight hybrid earthquakes. Sulfur-dioxide flux ranged between 200 and 540 metric tons per day, with a weekly average of 340 metric tons.
Source: Montserrat Volcano Observatory (MVO)
Volcanic and seismic activity at Soufrière Hills remained slightly elevated throughout 17-24 September. The seismic network recorded two rockfalls, two long-period earthquakes, and eight hybrid earthquakes. The sulfur-dioxide flux averaged 312 metric tons per day, reaching a maximum of 454 metric tons on 18 September. An unusual wind direction occasionally brought the volcanic plume across inhabited areas, causing people in the area to experience the plume's characteristic sulfur smell.
Source: Montserrat Volcano Observatory (MVO)
Activity at Soufrière Hills during 10-17 September was slightly elevated. The seismic network recorded one rockfall, one long-period, and 14 hybrid earthquakes. The weekly average for daily sulfur dioxide emissions was 180 metric tons. Unusual winds brought the volcanic plume across inhabited areas from time to time, causing people to experience its characteristic sulfurous smell. Mudflows, due to heavy rain, were recorded on 14 and 16 September.
Source: Montserrat Volcano Observatory (MVO)
Volcanic and seismic activity at Soufrière Hills remained at low levels during 3-10 September. The seismic network recorded two rockfalls and one volcano-tectonic earthquake. Sulfur-dioxide flux ranged between 175 and 405 metric tons per day, averaging 270 metric tons daily. A small pond, first observed during the week of 27 August, was still visible in the explosion pit formed on 3 March 2004.
Source: Montserrat Volcano Observatory (MVO)
Volcanic and seismic activity at Soufrière Hills remained at low levels during 27 August to 3 September. The seismic network recorded two hybrid earthquakes. The sulfur-dioxide flux ranged between 240 and 456 metric tons per day. A small pond was observed on the volcano for the first time since the beginning of the eruption. The water in the pond pooled in the explosion pit formed on 3 March 2004.
Source: Montserrat Volcano Observatory (MVO)
Seismic and volcanic activity at Soufrière Hills remained at low levels during 20-27 August. The seismic network recorded one hybrid earthquake and one rockfall. Sulfur-dioxide flux ranged between 175 and 310 metric tons per day.
Source: Montserrat Volcano Observatory (MVO)
Volcanic and seismic activity at Soufrière Hills remained at low levels during 13-20 August. The seismic network recorded one hybrid earthquake, one volcano-tectonic earthquake, and one rockfall. Sulfur-dioxide flux measurements were generally around 200 metric tons per day.
Source: Montserrat Volcano Observatory (MVO)
Volcanic and seismic activity at Soufrière Hills remained at low levels during 6-13 August. The seismic network recorded one hybrid earthquake and three rockfalls. The sulfur-dioxide flux varied between about 125 and 300 metric tons per day, averaging 200 metric tons. Ground deformation data from July suggested a reversal in trend from shortening between stations across the volcano to slight extension.
Source: Montserrat Volcano Observatory (MVO)
Volcanic and seismic activity at Soufrière Hills remained at low levels during 30 July to 6 August. The seismic network recorded one hybrid earthquake and eight rockfalls. The sulfur-dioxide flux varied between 90 and 280 metric tons per day, which was lower than the long-term eruption average of ~500 metric tons per day.
Source: Montserrat Volcano Observatory (MVO)
Volcanic and seismic activity remained at low levels at Soufrière Hills during 23-30 July. The seismic network recorded two hybrid earthquakes and eight rockfalls. The sulfur-dioxide flux ranged between 175 and 300 metric tons per day, which is lower than the long-term eruption average of ~500 metric tons per day.
Source: Montserrat Volcano Observatory (MVO)
Volcanic and seismic activity at Soufrière Hills remained at low levels during 16-23 July. The seismic network recorded seven hybrid earthquakes and seven rockfalls. No long-period events or volcano-tectonic earthquakes were recorded. The sulfur-dioxide flux on 16 and 23 July was 170 and 400 metric tons per day, respectively.
Source: Montserrat Volcano Observatory (MVO)
During 2-9 July, low-level activity continued at Soufrière Hills. MVO reported 4 volcano-tectonic earthquakes, 8 hybrid earthquakes, and 10 rockfalls. Emission rates of sulphur dioxide gas (120 to 160 tonnes per day) reached the lowest levels since the collapse event of 12-13 July 2003.
Source: Montserrat Volcano Observatory (MVO)
Volcanic and seismic activity at Soufrière Hills were at low levels during 25 June to 2 July. The seismic network recorded 2 long-period earthquakes, 6 volcano-tectonic earthquakes, 5 hybrid earthquakes, and 8 rockfalls. A peak sulfur-dioxide flux of ~365 metric tons was measured on 27 June.
Source: Montserrat Volcano Observatory (MVO)
Activity at Soufrière Hills remained at low levels during 18-25 June. Most seismic activity occurred during 18-20 June, with extremely low seismicity during the remainder of the report period. The upper portions of the lava-dome complex within the crater were visible for the first time since 7 May 2004, revealing that parts of the dome had been lost. This explained the rockfall signals recorded during the previous weeks. Technical problems prevented measurements of the sulfur-dioxide flux.
Source: Montserrat Volcano Observatory (MVO)
Activity at Soufrière Hills remained at low levels during 11-18 June. The seismic network recorded five hybrid earthquakes and 20 rockfalls. The sulfur-dioxide flux was low during the majority of the report period, reaching a peak of ~480 metric tons on 14 June.
Source: Montserrat Volcano Observatory (MVO)
Activity at Soufrière Hills remained at low levels during 4-11 June. The seismic network recorded three hybrid earthquakes and nine "mixed events," which were thought to have originated at shallow depths within the remnants of the lava dome and around the top of the conduit. The sulfur-dioxide flux peaked at ~790 tons on 7 June and decreased sharply to ~170 tons per day by the end of the report period.
Source: Montserrat Volcano Observatory (MVO)
During 28 May to 4 June, activity at Soufrière Hills remained low with four hybrid and 16 mixed earthquakes recorded. Sulfur-dioxide emissions fluctuated but remained low.
Sources: Montserrat Volcano Observatory (MVO); Washington Volcanic Ash Advisory Center (VAAC)
Volcanic and seismic activity at Soufrière Hills remained at low levels during 21-28 May. Seismicity was dominated by signals from mudflows associated with the heavy rain of 21 May. The mudflows occurred during about 1420-1636 and were followed by a swarm of 44 small earthquakes. The sulfur-dioxide flux varied, reaching values between about 225 and 920 tons per day.
Source: Montserrat Volcano Observatory (MVO)
Volcanic and seismic activity at Soufrière Hills during 14-21 May remained at low levels. On 21 May intense rainfall produced large mudflows in the Belham Valley. At the peak of the activity, the entire width of the valley floor at Belham Bridge was flooded and standing waves up to 2 m high were observed. The sulfur-dioxide flux was low for most of the report period.
Source: Montserrat Volcano Observatory (MVO)
Volcanic and seismic activity at Soufrière Hills remained at low levels during 7-14 May. Spasmodic tremor ceased on 7 May, ending a protracted period of low-to-moderate amplitude tremor that began on 15 March. The sulfur-dioxide flux was at low-to-moderate levels, reaching the lowest recorded value on 13 May (146 metric tons per day) since the major explosions and collapse event during 12-15 July 2003.
Source: Montserrat Volcano Observatory (MVO)
Volcanic and seismic activity at Soufrière Hills remained at low levels during 30 April to 7 May. Seismicity during the report period was dominated by low-level tremor, switching to spasmodic tremor during the early hours of 6 May. A small amount of ash venting from the volcano's summit occurred on 2 May around 1815. The sulfur-dioxide flux was low (200-300 metric tons per day) for most of the report period before increasing sharply to ~670 metric tons on 6 May.
Source: Montserrat Volcano Observatory (MVO)
Volcanic activity at Soufrière Hills was at low levels during 23-30 April. Seismicity included low-level tremor, spasmodic tremor, and small numbers of long-period and hybrid earthquakes. A large hybrid earthquake on 29 April at 1540 resulted in a small amount of ash venting from the summit. The sulfur-dioxide flux was low throughout the report period.
Source: Montserrat Volcano Observatory (MVO)
Volcanic and seismic activity at Soufrière Hills were at low levels during 16-23 April. Seismicity was characterized by periods of continuous and spasmodic tremor punctuated by long-period hybrid earthquakes. Continuous low-level tremor occurred on 16 April with a second episode during 18-19 April. The sulfur-dioxide flux varied during the report period, reaching a peak of 1,030 metric tons per day on 16 April.
Source: Montserrat Volcano Observatory (MVO)
During 10-16 April, activity at Soufrière Hills remained low with only one long-period earthquake recorded. Nearly continuous low-level tremor and moderate sulfur-dioxide emissions occurred throughout the reporting week.
Source: Montserrat Volcano Observatory (MVO)
During 2-9 April, seismic and volcanic activity at Soufrière Hills was at low-to-moderate levels. Seismicity was dominated by near-continuous low-to-moderate level tremor. The sulfur-dioxide flux was low during most of the report period.
Sources: Montserrat Volcano Observatory (MVO); Washington Volcanic Ash Advisory Center (VAAC)
Seismic and volcanic activity were at moderate levels at Soufrière Hills during 26 March to 2 April. Seismicity was dominated by near-continuous low-to-moderate tremor. Vigorous steam venting was visible from several areas of the crater, but no new lava-dome growth occurred. The sulfur-dioxide flux remained at moderate levels.
Sources: Montserrat Volcano Observatory (MVO); Washington Volcanic Ash Advisory Center (VAAC)
During 19-26 March, activity remained elevated at Soufrière Hills. The seismic network recorded four long-period and seven hybrid earthquakes. Continuous low-level tremor was interrupted by several periods of moderate-level tremor lasting from less than 1 hour to 12 hours. Sulfur-dioxide flux ranged between 550 and 700 metric tons per day. On 29 March at 0745, the Washington VAAC reported that a ~9-km-wide ash plume was observed at a height of ~1 km a.s.l. The plume initially drifted SW until about 1015 the same day when it was observed in satellite imagery drifting NE. On 30 March an ash plume was observed that reached a height of ~2 km and drifted NE.
Sources: Montserrat Volcano Observatory (MVO); Washington Volcanic Ash Advisory Center (VAAC)
Seismic and volcanic activity at Soufrière Hills during 12-19 March increased in comparison to the previous week. Seismicity was dominated by moderate-to-strong tremor beginning around 0300 on 15 March, with five episodes of moderate tremor. The tremor was accompanied by gas-and-ash venting. At 1622 on 15 March an increase in the energy level of the tremor was recorded and a convecting ash cloud rose to ~2 km above the volcano. At 1745 emergent pulsating ash clouds were observed, although no eruption column was established. Ash drifted WSW away from populated areas over Plymouth, Amersham, and areas farther S. Tremor remained at elevated levels throughout the night peaking around 2245, coincident with a vigorous venting episode that produced an ash cloud to ~4.5 km above the volcano accompanied by lightning. Vigorous gas-and-ash venting continued through 16 March. The amount of ash in the gas plume decreased during 17 March and ash venting had all but ceased by the end of the day. The sulfur-dioxide flux remained at moderate levels during the report period.
Sources: Montserrat Volcano Observatory (MVO); Washington Volcanic Ash Advisory Center (VAAC)
Following a lava-dome collapse at Soufrière Hills on 3 March, activity was relatively lower during 5-12 March. Around 0330 on 10 March a short period of elevated seismic activity lasting around 10-20 minutes occurred. Later that day fresh pyroclastic-flow deposits were observed toward the NE in the upper reaches of the Tar River Valley. Several short periods of ash-and-steam venting were observed during 9-12 March, with ash deposited as far N as St. Georges Hill. The sulfur-dioxide flux peaked at 1,250 metric tons on 9 March.
Sources: Montserrat Volcano Observatory (MVO); Washington Volcanic Ash Advisory Center (VAAC)
Volcanic and seismic activity increased significantly at Soufrière Hills during 27 February to 5 March, with a lava-dome collapse on 3 March. Low-level tremor occurred from around 1900 on 2 March until 1444 on 3 March when seismicity increased significantly and an explosion and lava-dome collapse event lasting about 10 minutes occurred. According to the Washington VAAC, the ash cloud produced by the explosion reached a height of ~6 km a.s.l. During 1445-1500, pyroclastic flows swept NE down the Tar River, reaching the sea at the Tar River Fan at least twice. By 1525 seismicity had returned to background levels, although vigorous ash venting continued until around 0700 on 4 March. Low-level tremor began soon after the main event, lasting ~18 hours. Several hybrid earthquakes occurred during the evening of 3 March.
No ash fell in populated areas, rather it drifted SW over the southern parts of Plymouth, Amersham, and areas farther S. Visual observations suggested that the explosion removed the small lava dome that had grown in the collapse scar in late July 2003. A portion of the north-western remnant of the 1995-1998 lava dome also collapsed during the event. A small explosion on 5 March at 1009 was followed by ash venting. During the report period, the sulfur-dioxide flux reached a maximum value of 820 metric tons around 1 March, before falling to 540 metric tons on 2 March. As of 5 March seismic and volcanic activity remained at elevated levels.
Sources: Montserrat Volcano Observatory (MVO); Associated Press; Washington Volcanic Ash Advisory Center (VAAC)
Volcanic and seismic activity remained at low levels at Soufrière Hills during 20-27 February. A period of low-level tremor began on 21 February around 0600 that continued for ~36 hours and consisted of many small long-period earthquakes. On 24 February around 0915 mudflows swept down the Belham valley (NW of the volcano) for ~40 minutes during intense rainfall. Signs of mudflows were also seen in the city of Plymouth (SW of the volcano). The sulfur-dioxide flux reached a peak daily value of 920 metric tons on 23 February.
Source: Montserrat Volcano Observatory (MVO)
During 13-20 February, volcanic and seismic activity remained low at Soufrière Hills. The seismic network recorded one rockfall and three hybrid earthquakes. Sulfur-dioxide flux was at moderate levels, reaching between 350 and 650 metric tons per day.
Source: Montserrat Volcano Observatory (MVO)
Volcanic and seismic activity at Soufrière Hills remained at low levels during 6-13 February. The seismic network recorded one volcano-tectonic earthquake and three hybrid earthquakes. Sulfur-dioxide flux was low and relatively constant at 350-450 metric tons per day.
Source: Montserrat Volcano Observatory (MVO)
Volcanic and seismic activity at Soufrière Hills during 30 January to 6 February increased slightly in comparison to the previous week. The seismic network recorded 15 rockfalls, 1 volcano-tectonic earthquake, 7 long-period earthquakes, and 9 hybrid earthquakes. In addition, a weak long-period earthquake swarm began on 30 January. The swarm was comprised of ~1,000 separate events occurring over a ~30-hour period, although only four events were large enough to trigger the seismic-event detection systems. The sulfur-dioxide flux peaked on 1 February at 1,017 tons per day before decreasing to 439 tons on 5 February.
Source: Montserrat Volcano Observatory (MVO)
Volcanism at Soufrière Hills remained at very low levels during 23-30 January. The seismic network recorded 8 rockfalls, 10 hybrid earthquakes, 1 volcano-tectonic earthquake, and 1 long-period earthquake. Sulfur-dioxide emissions were between 500 and 700 tons per day (no measurements were possible on 24 and 25 January).
Source: Montserrat Volcano Observatory (MVO)
Activity at Soufrière Hills remained at low levels during 16-23 January, although there was a slight increase in seismic activity. The seismic network recorded 1 rockfall, 1 volcano-tectonic earthquake, and 38 long-period and 9 hybrid earthquakes. An unusual seismic event began on 18 January around 0600, consisting of a low-amplitude swarm of long-period earthquakes. The swarm continued for 36 hours and was comprised of ~1,000 separate events every ~2 minutes, although only 37 were large enough to trigger the seismic-event detection systems.
Source: Montserrat Volcano Observatory (MVO)
Volcanic activity at Soufrière Hills remained at low levels during 9-16 January. The seismic network recorded 5 rockfalls and 1 long-period and 18 hybrid earthquakes. The sulfur-dioxide flux from the volcano was low at the beginning of the report period (less than 200 tons per day), increasing to around 350 tons per day after a minor ash-venting event on 9 January.
Source: Montserrat Volcano Observatory (MVO)
Volcanic activity at Soufrière Hills remained low during 2-9 January, with low counts of all seismic signals. The seismic network recorded 2 rockfalls and 2 hybrid earthquakes. Sulfur-dioxide fluxes were also low and stable at around 300 tons per day.
Source: Montserrat Volcano Observatory (MVO)
Volcanic activity at Soufrière Hills was low during 26 December to 2 January, with low counts of all seismic signals. The seismic network recorded 2 rockfalls, 9 hybrid earthquakes, and a swarm of small hybrid earthquakes during 31 December to 2 January. A sulfur-dioxide flux rate of 500 tons per day was measured at the beginning of the report period, but instrument problems and unfavorable wind directions hampered measurements during the rest of the week.
Source: Montserrat Volcano Observatory (MVO)
Volcanic activity at Soufrière Hills remained low during 19-26 December, with low counts of all seismic signals. The seismic network recorded 1 rockfall and 2 hybrid earthquakes until 24 December.
Source: Montserrat Volcano Observatory (MVO)
During 12-19 December, volcanic activity at Soufrière Hills was low, with few counts of all types of seismic signals. Only 2 rockfalls and 12 hybrid earthquakes were recorded. Sulfur-dioxide emissions remained fairly stable at around 500 tons per day during most of the week, but there was a significant increase to 3,600 tons on 18 December.
Source: Montserrat Volcano Observatory (MVO)
Volcanic activity at Soufrière Hills was at low levels during 5-12 December, with low counts of all types of seismic signals. Visual observations confirmed that no new lava-dome growth occurred in the crater since July 2003, although some old lava-dome material from the crater walls had slumped and wall rocks had degraded due to steaming. Sulfur-dioxide flux measurements varied during the week from 800-900 tons per day at the beginning of the report period to 300-500 tons per day towards the end of the week.
Source: Montserrat Volcano Observatory (MVO)
Volcanic activity at Soufrière Hills was lower during 21-28 November than during the previous week, with fewer hybrid earthquakes and low counts of other types of seismic signals. The seismic network recorded five rockfalls, one long-period earthquake, one volcano-tectonic earthquake, and 50 hybrid earthquakes. Around 500 tons of sulfur dioxide were recorded during the 2 days weather conditions were appropriate for measurements.
Source: Montserrat Volcano Observatory (MVO)
During 7-14 November, volcanic activity at Soufrière Hills remained at low levels. The seismic network recorded three rockfall signals, one long-period earthquake, one long-period rockfall, and 36 hybrid earthquakes. Sulfur-dioxide emissions generally decreased from ~800 to ~200 tons per day during the report period.
Sources: Montserrat Volcano Observatory (MVO); Washington Volcanic Ash Advisory Center (VAAC)
Volcanic activity at Soufrière Hills during 24-31 October remained at low levels. No morphological changes were seen at the volcano's summit and no new lava was observed in the vent area. According to the Washington VAAC, on 1 November a low-level plume of re-suspended ash was visible on satellite imagery.
Sources: Montserrat Volcano Observatory (MVO); Washington Volcanic Ash Advisory Center (VAAC)
Volcanic activity at Soufrière Hills remained at low levels during 17-24 October. The lava dome was visible on 23 October when a volume survey was carried out. The small lava dome that extruded in July had not grown further, appearing to be stagnant with alteration and degradation causing it to break apart. The pit crater associated with the July 2003 explosions widened slightly, although MVO believes this is due to passive slumping of material rather than volcanic activity. Sulfur-dioxide emission rates remained high during the report week. Low-level ash clouds were sometimes visible on satellite imagery.
Sources: Montserrat Volcano Observatory (MVO); Washington Volcanic Ash Advisory Center (VAAC)
Activity at Soufrière Hills during 10-17 October remained at low levels. Seismicity indicated that 12 rockfalls occurred as well as nine hybrid earthquakes. Lahars were also noted during periods of heavy rainfall. Sulfur-dioxide emissions increased from 600-900 tons per day at the beginning of the week to a peak of 1,900 tons on 13 October, and descended to 720 tons on 16 October. Low-level ash plumes were occasionally seen on satellite imagery.
Sources: Montserrat Volcano Observatory (MVO); Washington Volcanic Ash Advisory Center (VAAC)
Volcanic activity at Soufrière Hills during 3-10 October was at a lower level than during the previous week. A period of low-amplitude tremor was recorded during 3-8 October that coincided with light ash venting. No direct views of the summit were possible due to poor visibility. Sulfur-dioxide emission rates were high during the week. Ash plumes were visible on satellite imagery.
Sources: Montserrat Volcano Observatory (MVO); Washington Volcanic Ash Advisory Center (VAAC)
Volcanic activity at Soufrière Hills during 26 September to 3 October was slightly higher than during the previous week. During 30 September to 1 October, tremor coincided with vigorous ash venting that produced clouds to between 2 and 2.5 km a.s.l. The ash clouds drifted W over the town of Plymouth. No new lava-dome growth was seen during the report week and sulfur-dioxide emission rates were generally at moderate-to-high levels.
Sources: Montserrat Volcano Observatory (MVO); Washington Volcanic Ash Advisory Center (VAAC)
Volcanic activity at Soufrière Hills remained at low levels during 19-26 September. Sulfur-dioxide emission rates were slightly lower than the previous week, ranging between 500 and 600 tons per day. According to the Washington VAAC, MVO reported that ash emissions on 30 September rose to a height of ~2.4 km a.s.l. and drifted W.
Sources: Montserrat Volcano Observatory (MVO); Washington Volcanic Ash Advisory Center (VAAC)
Volcanic activity at Soufrière Hills remained at low levels during 5-12 September. No new lava-dome growth occurred, although there were several ash-venting episodes that were accompanied by a few small earthquakes. Sulfur-dioxide emission rates were relatively low during the report week.
Source: Montserrat Volcano Observatory (MVO)
Activity at Soufrière Hills remained at low levels during 29 August to 5 September. No growth occurred at the new lava dome. During the later part of the week gas emission rates could not be measured because the plume was blown out of reach of the spectrometer in unusual wind directions caused by Hurricane Fabian.
Source: Montserrat Volcano Observatory (MVO)
Activity at Soufrière Hills remained at low levels during 22-29 August. No changes or growth occurred at the lava dome. Small changes occurred in the 12 July collapse scar, with new fumaroles opening to the SE of the main explosion crater towards the upper Tar River Valley. Blue haze visible N of the volcano on 25 August and a strong sulfur smell were caused by the passage of a weather system and did not reflect an activity increase.
Source: Montserrat Volcano Observatory (MVO)
Volcanic and seismic activity at Soufrière Hills remained at relatively low levels during 15-22 August. Views of the lava dome inside the explosion crater showed that no further growth had occurred. Some very small rockfalls were produced from the interior of the 12 July collapse scar, and in several places large fumaroles formed. Sulphur-dioxide emissions ranged from 400 to 900 tonnes per day, with the maximum being recorded on 18 August.
Source: Montserrat Volcano Observatory (MVO)
Volcanic activity at Soufrière Hills was at low levels during 8-15 August. Views of the new lava dome indicated that no further growth had taken place; it remained a small lobe over 100 m across. Several small slumps occurred from the interior wall of the 12 July scar, producing rockfalls and a small amount of ash in the plume. Sulfur-dioxide emissions were generally high during the week, with maximum emission rates on 11-12 August.
Source: Montserrat Volcano Observatory (MVO)
During 25 July to 1 August, volcanic activity at Soufrière Hills was low, with only a few seismic events triggering the network. Activity increased at the end of the report week, on 1 August, with episodes of powerful ash venting from the explosion crater. There were many strong bursts of gas and jets of ash; an ash plume rose to over 3 km. During 1-8 August, activity fluctuated, with a period of relative quiet separating episodes of intense degassing and hybrid-earthquake activity. Occasional rockfalls and hybrid earthquakes occurred during most of the report week. The lava dome was visible on 5 August; there was a small southerly-directed lobe in the dome that was growing extremely slowly, if at all. Sulfur-dioxide emission rates were high for most of the report week.
Source: Washington Volcanic Ash Advisory Center (VAAC)
As of 1 August, ash emissions were continuing from Soufrière Hills. Low-level ash clouds were visible on satellite imagery.
Source: Washington Volcanic Ash Advisory Center (VAAC)
During 18-25 July, volcanic and seismic activity at Soufrière Hills were at very low levels, with only a few events triggering the seismic network. The pattern of earthquakes during the week indicated that lava-dome growth within the explosion crater had probably restarted, although this could not be confirmed because Soufrière Hills was obscured by low-level meteorological clouds. Sulfur-dioxide flux declined somewhat in comparison to the previous week.
Source: Montserrat Volcano Observatory (MVO)
After a lava-dome collapse at Soufrière Hills on 12 July volcanic activity was at relatively high levels until 13 July when it slowly subsided. On the 13th activity had declined to very low levels, then the following morning a sudden vulcanian explosion occurred at the lava dome. Two more explosions occurred during the next 2 days. Pumice from these explosions reached 15 cm in size at Richmond Hill, declining to 4 cm in Olveston. Heavy ashfall from the collapse occurred over all the inhabited parts of Montserrat. The greatest ash thickness was recorded at the Vue Pointe Hotel, where it exceeded 15 cm in depth. After an explosion on 15 July, volcanic and seismic activity were relatively low, with only a few hybrid earthquakes and rockfalls each day. Scientists saw an open explosion crater in the collapse scar, with no new lava extruded. The bulk of the lava-dome structure was removed during the collapse. Pyroclastic flows impacted the area between Tar River Valley and Spanish Point.
Sources: Montserrat Volcano Observatory (MVO); Washington Volcanic Ash Advisory Center (VAAC)
High levels of pyroclastic-flow activity began at Soufriere Hills on 12 July. A hybrid earthquake swarm that began on 9 July merged at 0700 on 12 July into a continuous tremor signal. Prolonged and heavy rainfall occurred on the 12th during 0600-0900, causing mudflows into the Belham Valley. Pyroclastic flows began to travel into the Tar River Valley, with a moderate-sized flow occurring at 0653. A series of similar-sized pyroclastic flows traveled in the Tar River Valley throughout the morning. The first pyroclastic flow reached the sea at 1045. Pyroclastic-flow activity increased slowly through the afternoon until it became almost continuous. Flows also occurred into Tuitt's and White's ghauts. The activity picked up markedly at 1827, with more energetic pyroclastic flows. The level of activity fluctuated thereafter, with several smaller pyroclastic flows into the Tar River Valley, before escalating again at 2005 with another phase of near-continuous pyroclastic flows. The flows increased in size and several surges traveled 2 km over the sea at the mouth of the Tar River Valley. Pyroclastic flows also reached the sea in White's Ghaut and the Spanish Point area. These flows resulted in heavy ashfall and accretionary lapilli, particularly between Salem and Woodlands. A number of explosive events took place during this collapse, with the largest occurring between 2300 and 2400. The Washington VAAC reported that ash clouds rose to a maximum height of ~15 km a.s.l.
Heavy falls of ash and rock fragments occurred over all of the inhabited parts of Montserrat. The ashfall deposit was 115 mm thick at Lime Kiln Bay. The ash burden resulted in the collapse of several wooden buildings in the Salem area. Vegetation damage was extensive with downed trees and branches broken from many others. Many birds were killed by the ash or trapped alive in it. Ashfall from this event was reported on the islands of Nevis, St Kitts, Anguilla, and St Maarten, and resulted in the closure of several airports. At 0910 on 13 July an explosive eruption occurred, following 2 hours of very low seismic activity. The Washington VAAC estimated a cloud height of ~12 km a.s.l.
During a helicopter reconnaissance flight on the morning of 14 July, a large collapse scar was seen in the lava dome directed down the Tar River Valley. The Tar River Valley was extensively modified and eroded with a deep canyon gouged by the pyroclastic flows. The fan had been extended eastwards into the sea and northwards along the coast. The area north of the Tar River Valley extending to Killyhawk Ghaut was devastated.
Sources: Montserrat Volcano Observatory (MVO); Associated Press; Reuters; Washington Volcanic Ash Advisory Center (VAAC)
During 27 June- 4 July, activity at Soufrière Hills increased in comparison to the previous week. Pyroclastic flows and rockfalls mainly traveled down the lava dome's N flank, mostly into Tuitt's Ghaut and to a lesser extent into Tyre's and White's ghauts. Sporadic pyroclastic flows also traveled W to the Gages area. The sulfur-dioxide emission rate was relatively low during the week.
Source: Montserrat Volcano Observatory (MVO)
Volcanic and seismic activity at Soufrière Hills remained at low levels during 20-26 June, but increased on 27 June. There were no apparent changes at the summit region since it was last observed several weeks previously. During 20-25 June, rockfalls and sporadic pyroclastic flows occurred on the lava dome's E and N flanks and traveled into the Tar River Valley, and White's, Tuitt's, and Tyre's ghauts. Hybrid earthquake activity developed into a diffuse swarm on 22 and 23 June. Some of the larger hybrid earthquakes were located at depths of about 3 km beneath the lava dome. On 27 June activity was mainly confined to the northern flanks with numerous small pyroclastic flows into Tuitt's and Tyre's ghauts.
Source: Montserrat Volcano Observatory (MVO)
Volcanic and seismic activity remained at low levels during 13-20 June. Small rockfalls and sporadic pyroclastic flows traveled down the E and N flanks of the lava dome into the Tar River Valley, White's Ghaut, and the top of Tuitt's Ghaut. Sulfur-dioxide emission rates were relatively low during the first half of the report period, increasing slightly during the middle of the week.
Source: Montserrat Volcano Observatory (MVO)
Volcanic activity at Soufrière Hills decreased to low levels during 6-13 June, with sporadic rockfalls and pyroclastic flows traveling down the volcano's E and NE flanks to the Tar River Valley, and White's and Tuitt's ghauts. Several energetic pyroclastic flows occurred in the Tar River Valley in the early hours of 11 June and again on the morning of 13 June.
Source: Montserrat Volcano Observatory (MVO)
Volcanic activity at Soufrière Hills generally declined to moderate-to-low levels during 30 May to 6 June. Most activity was focused on the E and NE flanks of the lava dome, producing rockfalls and numerous pyroclastic flows in the Tar River Valley and occasionally in White's and Tuitt's ghauts. On the morning of 3 June activity briefly increased on the lava dome's NW flank, when numerous rockfalls and three pyroclastic flows entered Tyre's Ghaut. Sulfur-dioxide emission rates in the volcanic plume were moderate, averaging 540 tons per day, which is very similar to the long-term average for the entire eruption. Low-level ash plumes were sometimes visible on satellite imagery.
Sources: Montserrat Volcano Observatory (MVO); Washington Volcanic Ash Advisory Center (VAAC)
Volcanic activity at Soufrière Hills decreased slightly during 23-30 May. Most activity was focused on the lava dome's ENE flank, producing rockfalls and numerous pyroclastic flows along the N side of the Tar River Valley and occasionally in White's and Tuitt's ghauts. Rockfalls and small pyroclastic flows also spilled off the lava dome's northern flanks onto Farrell's Plain. The lava dome began to grow more centrally, building vertically upwards and accumulating debris on the summit region. The sulfur dioxide emission rate was approximately average at the beginning of the week, but increased towards the middle of the week. Small low-level ash plumes were occasionally visible on satellite imagery.
Sources: Montserrat Volcano Observatory (MVO); Washington Volcanic Ash Advisory Center (VAAC)
Volcanic activity at Soufrière Hills was generally at high levels during 16-23 May, although there was a slight decrease in intensity on 19 and 20 May. Most activity was focused on the lava dome's NE flank, producing rockfalls and numerous pyroclastic flows along the northern side of Tar River Valley. During the last 3 days of the report period, activity increased on the N flank, with pyroclastic flows traveling into the top of Farrell's Plain and entering the top of Tyre's and Tuitt's ghauts. Pulses of vigorous ash venting were observed from the dome's summit. Intense glow was seen on the summit and NE flank on the evenings of 20 and 21 May. Low-level ash plumes were sometimes visible on satellite imagery.
Sources: Montserrat Volcano Observatory (MVO); Washington Volcanic Ash Advisory Center (VAAC)
Activity at Soufrière Hills remained high during 9-16 May. The direction of lava-dome growth switched to the NE during the report period. Rockfalls and pyroclastic flows traveled NE along the N side of the Tar River Valley and occasionally occurred in White's Ghaut. On 12 and 13 May several flows were observed on the lava dome's N and NW flanks in the area of Farrell's Plain and in the upper portions of Tyre's Ghaut. Pulses of vigorous ash venting were observed. SO2 emission rates fluctuated from moderate-to-high levels. The Washington VAAC reported that low-level ash plumes were sometimes visible on satellite imagery.
Sources: Montserrat Volcano Observatory (MVO); Washington Volcanic Ash Advisory Center (VAAC)
During 25 April to about 6 May, volcanic activity was at moderate levels at Soufrière Hills, with pyroclastic flows and rockfalls mainly traveling NE. During about 6-9 May there was a general increase in the size of pyroclastic flows, some of which were among the largest and most energetic seen for several months. Most flowed along the N side of the Tar River Valley, and a few also flowed into White's and Tuitt's ghauts. Sulfur-dioxide emission rates were low during about the first week of the report period, then fluctuated from moderate to high levels. The Washington VAAC reported that low-level ash plumes were sometimes visible on satellite imagery.
Sources: Montserrat Volcano Observatory (MVO); Washington Volcanic Ash Advisory Center (VAAC)
During 16-22 April, dome extrusion continued at Soufrière Hills. Poor visibility prevailed for parts of the week, but seismicity and SO2 fluxes remained significant. Numerous rockfalls and pyroclastic flows have occurred on the eastern flanks of the dome in the Tar River Valley. An observation flight indicated that rockfalls were beginning to spill southwards into the head of the White River. Observers noted that a very large spine had extruded on the dome=s summit. Despite frequent cloud cover during the week, satellite infrared sensors sometimes detected the thermal radiation from the dome, and other sensors continued to detect plumes from the volcano, typically tens of kilometers in length and blowing W.
Sources: Montserrat Volcano Observatory (MVO); Washington Volcanic Ash Advisory Center (VAAC)
Activity at Soufrière Hills was generally at moderate levels during 4-11 April, although there were short periods of more elevated activity. Rockfalls and pyroclastic flows mainly occurred on the E side of the lava dome in the Tar River Valley. Pyroclastic flows were also observed on the NE flank in White's and Tuitt's ghauts. Torrential rainfall late in the evening of 10 April produced mudflows in the Belham River and triggered pyroclastic flows on the E, N, and NW flanks of the lava dome. The Washington VAAC reported that low-level ash plumes were sometimes visible on satellite imagery.
Sources: Montserrat Volcano Observatory (MVO); Washington Volcanic Ash Advisory Center (VAAC)
Volcanic activity at Soufrière Hills increased slightly during 28 March to 4 April and for the last 2 days of the report period activity was at moderately high levels. A prominent extrusion lobe was established on the E and SE sides of the lava dome's summit. A large vertical spine was extruded at the back of this lobe during the night of 1-2 April. During the report week, activity was dominated by rockfalls and pyroclastic flows mainly in the Tar River Valley. Rockfall activity also continued on the dome's S side. Some pyroclastic flows also occurred on the NE flanks in White's Ghaut and Tuitt's Ghaut, and on most days rockfalls and small pyroclastic flows initiated on the NW flanks, often moving into the upper reaches of Tyre's Ghaut. Sulfur dioxide emission rates fluctuated during the report period. The Washington VAAC reported that low-level ash plumes were sometimes visible on satellite imagery.
Sources: Montserrat Volcano Observatory (MVO); Washington Volcanic Ash Advisory Center (VAAC)
Activity at Soufrière Hills during 21-28 March remained at moderate levels. A lava dome continued to grow centrally from its summit region. Activity was dominated by rockfalls and pyroclastic flows that spilled off the active summit in a broad arc extending from the S and around the E flanks to the NW. Most activity was towards the NW, with pyroclastic flows occurring in the Tar River Valley. Small pyroclastic flows also traveled down the dome's N flank into White's Ghaut, Tuitt's Ghaut, the upper reaches of Tyre's Ghaut, and on Farrell's Plain. After a brief, intense rainstorm there was a 4- to 5-hour-long period of increased pyroclastic-flow and rockfall activity. Observations on 27 and 28 March revealed that rockfalls and small pyroclastic flows had begun to spill off the dome's S flank and a large vertical spine had extruded on the S side of the summit. Sulfur dioxide emission rates fluctuated considerably during the report week. The Washington VAAC reported that low-level ash plumes were visible on satellite imagery.
Sources: Montserrat Volcano Observatory (MVO); Washington Volcanic Ash Advisory Center (VAAC)
Volcanic and seismic activity at Soufrière Hills remained at moderate levels, as they have for several weeks. Lava-dome growth continued near the center of the dome complex, where a series of spines and ridges formed. The dome's summit reached a height of 1,098 m, the highest measured thus far. Activity was dominated by rockfalls and pyroclastic flows originating from the NE/central region of the dome that mainly traveled to the Tar River Valley. Also, several small pyroclastic flows occurred in White's and Tuitt's Ghauts, and one was observed in the upper part of Tyre's Ghaut on 20 March. Ash venting continued from the active part of the lava dome. The Washington VAAC reported that low-level ash plumes were visible on satellite imagery.
Sources: Montserrat Volcano Observatory (MVO); Washington Volcanic Ash Advisory Center (VAAC)
During 7-14 March, volcanic and seismic activity at Soufrière Hills were at moderate levels that were similar to those of the previous 2 weeks. The lava dome continued to grow, but was not focused in any particular direction. Lava extruded into the center of the summit-dome complex, increasing the dome height to just over 1,100 m. Rockfalls and pyroclastic flows occurred down all of the volcano's flanks. Spectacular incandescence was visible at night in the Tar River Valley, NW in Tuitt's Ghaut, and on the N talus slopes. Small rockfalls and pyroclastic flows infrequently descended the volcano's W flank, to the top of Gage's Valley. Ash vented continuously in the dome summit area and sulfur dioxide emission rates were relatively low during the week. The Washington VAAC reported that several low-level ash plumes were visible on satellite imagery.
Sources: Montserrat Volcano Observatory (MVO); Washington Volcanic Ash Advisory Center (VAAC)
During 28 February to 7 March, volcanic activity at Soufrière Hills remained at similar levels to the previous few weeks, with continued lava-dome growth and moderate pyroclastic-flow activity. Lava extrusion was accompanied by rockfalls and pyroclastic flows to the NE and N talus slopes and valleys. Pyroclastic flows occurred most frequently in Tuitt's Ghaut, and a few on Farrell's Plain, with run-out distances up to 1 km. Sulfur dioxide emission rates were variable. The Washington VAAC stated that several low-level ash plumes were visible on satellite imagery.
Sources: Montserrat Volcano Observatory (MVO); Washington Volcanic Ash Advisory Center (VAAC)
Activity at Soufrière Hills increased slightly during 21-28 February in comparison to the previous week. During an observation flight on 27 February, scientists saw that lava-dome growth was concentrated towards the NE. Pyroclastic flows and rockfalls traveled down the lava dome's E and NE flanks via the Tar River Valley and Tuitt's Ghaut. There were also several periods of activity on the N flank, with pyroclastic flows at the top of Farrell's Plain. SO2 emission rates were moderate for much of the report period, with the exception of 22-23 February, when rates increased. The Washington VAAC stated that several low-level ash plumes were visible on satellite imagery.
Sources: Montserrat Volcano Observatory (MVO); Washington Volcanic Ash Advisory Center (VAAC)
Activity at Soufrière Hills remained at moderate levels during 14-21 February. Remote camera footage indicated continued lava-dome growth on the NE lobe. Pyroclastic flows and rockfalls were concentrated more on the E flank of the lava dome and in the Tar River Valley than in recent weeks, although there were several periods of activity on the N flank, with pyroclastic flows in Tuitt's Ghaut and at the top of Farrell's Plain. SO2 emission rates were at low-to-moderate levels. The Washington VAAC stated that several low-level ash plumes were visible on satellite imagery.
Sources: Montserrat Volcano Observatory (MVO); Washington Volcanic Ash Advisory Center (VAAC)
Activity at Soufrière Hills was at moderate levels during 7-14 February. Lava-dome growth was focused towards the NNE and produced pyroclastic flows and rockfalls in Tuitt's Ghaut, White's Ghaut, and along the N side of the Tar River Valley. Rockfalls and small pyroclastic flows also occurred off the N flank of the dome onto the area of Riley's Estate. The Washington VAAC stated that several low-level ash plumes were visible on satellite imagery.
Sources: Montserrat Volcano Observatory (MVO); Washington Volcanic Ash Advisory Center (VAAC)
Activity at Soufrière Hills remained at moderate levels during 31 January to 7 February. Growth of the lava dome was focused on a large, steep lobe directed to the NE. Continuous growth and failure of the lobe produced pyroclastic flows and rockfalls in Tuitt's Ghaut, White's Ghaut, and along the N side of the Tar River Valley. A small amount of rockfall material was directed W towards Fort Ghaut. SO2 emission rates were slightly lower than the previous week. The Washington VAAC stated that several low-level ash plumes were visible on satellite imagery.
Sources: Montserrat Volcano Observatory (MVO); Washington Volcanic Ash Advisory Center (VAAC)
Activity at Soufrière Hills was at moderate levels at the beginning of the report period (24-31 January), but increased late in the evening of 25 January and remained high for the remainder of the week. Growth of the active extrusion lobe continued on the N side of the lava dome. The direction of growth was generally towards the NNE, although the focus of rockfall and pyroclastic-flow activity varied from day to day. Numerous small-to-moderate pyroclastic flows occurred in White's Ghaut, the Tar River Valley, and Tuitt's Ghaut. A pulse of activity occurred at midday on 30 January, during which pyroclastic flows simultaneously descended several flanks of the lava dome traveling to the Tar River Valley, White's Ghaut, Tuitt's Ghaut and W to Fort Ghaut. SO2 emission rates fluctuated throughout the week. The Washington VAAC stated that several low-level ash plumes were visible on satellite imagery.
Sources: Montserrat Volcano Observatory (MVO); Washington Volcanic Ash Advisory Center (VAAC)
Volcanic and seismic activity were at moderate levels at Soufrière Hills during 17-24 January. Lava extrusion occurred NE of the lava-dome complex that was associated with rockfalls and small pyroclastic flows down Tar River Valley, White's Ghaut, Tuitt's Ghaut, and on the northern talus slopes. On 18, 20, and 24 January small pyroclastic flows traveled ~ 1 km down Tyer's Ghaut. SO2 emission rates were moderate throughout the week. The Washington VAAC stated that several low-level ash plumes were visible on satellite imagery.
Sources: Montserrat Volcano Observatory (MVO); Washington Volcanic Ash Advisory Center (VAAC)
The level of activity at Soufrière Hills fluctuated during 10-17 January, but generally declined from high to moderate levels. The active extrusive lobe on the lava dome's N side continued to grow, producing pyroclastic flows and rockfalls during the first days of the report period down White's Ghaut and the Tar River Valley, and to a lesser extent to Tuitt's Ghaut and the top of Tyre's Ghaut and Farrell's Plain. During 15-17 January almost all pyroclastic flows occurred in the Tar River Valley, with only minor rockfalls traveling down the dome's NE and N sides. SO2 emission rates were variable, with periods of heightened emission lasting a few hours followed by very low levels of emission. The Washington VAAC stated that several low-level ash plumes were visible on satellite imagery.
Sources: Montserrat Volcano Observatory (MVO); Washington Volcanic Ash Advisory Center (VAAC)
Activity at Soufrière Hills during 3-10 January remained at high levels. The active extruded lobe on the lava dome continued to grow mainly towards the NNE, although some growth also occurred on the N side of the summit region. Rockfalls and small-to-moderate pyroclastic flows spilled off of the active lobe mostly into White's Ghaut and to a lesser extent into Tuitt's Ghaut and the Tar River Valley. Pyroclastic flows and rockfalls also spilled off the domes's N and NW flanks onto Farrell's Plain and into Tyre's Ghaut. During the report week, the Washington VAAC stated that several low-level ash plumes were visible on satellite imagery.
Sources: Montserrat Volcano Observatory (MVO); Washington Volcanic Ash Advisory Center (VAAC)
Activity at Soufrière Hills was at high-to-very-high levels during most of 27 December to 3 January, but decreased during 3 January. Activity escalated to very high levels on the night of the 27th. For the first 5 days of the report period continuous rockfalls and numerous pyroclastic flows spalled off the active extruded lobe on the NNE side of the lava dome. Most of the pyroclastic flows occurred in White's Ghaut and the Tar River Valley, and to a lesser extent in Tuitt's Ghaut. Small flows and rockfalls also spilled off the N and NW flanks of the dome onto Farrell's Plain and into Tyre's Ghaut. Activity decreased considerably on the night of 2 January to moderate levels on the 3rd, with rockfalls and small pyroclastic flows confined to the NNE and to a lesser extent the N flanks of the dome. The large spine that grew on the summit at the end of the previous week was observed on several days at the beginning of the current reporting period, but was not present when the summit was next seen on 2 January.
Sources: Montserrat Volcano Observatory (MVO); Washington Volcanic Ash Advisory Center (VAAC)
Activity at Soufrière Hills during 20-27 December remained at high levels. The active extruded lobe on the N side of the lava dome continued to grow, giving rise to rockfalls and small-to-moderate pyroclastic flows across a broad sector of the NE and N flanks. Spectacular incandescence was observed on most nights. Growth was focused mainly towards the NNE, producing pyroclastic flows in White's Ghaut, the Tar River Valley, and Tuitt's Ghaut. Extrusion also occurred on the N side of the summit and occasionally on the NW. A large spine was pushed up at the back of the active extruded lobe during the night of 26-27 December. The Washington VAAC reported that on 28 December around 1130 a 3-km-high ash cloud generated from pyroclastic flows drifted over the islands of St. Kitts and Nevis.
Sources: Montserrat Volcano Observatory (MVO); Washington Volcanic Ash Advisory Center (VAAC)
Volcanic activity at Soufrière Hills increased to a high level during 13-20 December. Activity generally remained at moderate levels during the first half of the report period, but increased to a high level over the last 3 days. Spectacular incandescence of the dome was observed on most nights. The active extruded lobe on the dome's N side continued to grow, producing numerous rockfalls and small-to-moderate pyroclastic flows. Most of the activity was concentrated on the NNE and N flanks, producing numerous pyroclastic flows in White's Ghaut, the Tar River Valley and Tuitt's Ghaut. Pyroclastic flows and rockfalls also traveled down the W and NW flanks. On 19 December mudflows occurred in White River, Tar River Valley and Fort Ghaut.
Sources: Montserrat Volcano Observatory (MVO); Washington Volcanic Ash Advisory Center (VAAC)
Reports of activity at Soufrière Hills covered the interval 6-13 December. Activity increased during the first 3 days of this interval, peaking in a dome-collapse event on the night of 8 December. Following this event, activity returned to moderate levels for the remainder of the week.
On 6 and 7 December most activity occurred on the N and NE flanks of the active extruded lobe, producing numerous pyroclastic flows in Tuitt's and White's ghauts, and the Tar River Valley. On 8 December, activity was focused NNE, producing numerous small-to-moderate pyroclastic flows in White's Ghaut. A sustained dome collapse began on 8 December at 2045, producing energetic pyroclastic flows down White's Ghaut to the sea at Spanish Point. Ash clouds rose to ~3 km a.s.l. and drifted WNW. In Plymouth and Richmond Hill 4 mm of ash was deposited. Seismic activity returned to background levels on 9 December by 0045 and several days of weak tremor occurred.
The collapse scar formed on the dome's NNE flank was estimated to have had a volume of 4-5 million cubic meters. This was being filled rapidly with freshly extruded lava. Observations on 13 December revealed a large amount of fragmental lava extruded in a northerly direction on the summit. A large spine was also extruded on the NW side of the summit.
SO2 emission rates were generally low during the first 3 days of the report period (280 metric tons per day on average), but following the dome-collapse event, on 9 December, they reached an average of 2,350 tons per day. On 10 December emission rates decreased to an average of 620 tons per day.
Sources: Montserrat Volcano Observatory (MVO); Washington Volcanic Ash Advisory Center (VAAC)
Activity at Soufrière Hills during 29 November to 6 December remained at moderate levels. Growth of the active lava dome in the N part of the dome complex continued. A number of small, short-lived spines formed at the base of this lobe, shedding material E into White's Ghaut and the Tar River Valley. Lava blocks continued to spall off the front of the lobe, shedding material NE into Tuitt's Ghaut and onto the northern talus slope. An average of one moderate-sized pyroclastic flow occurred per day during the report week. They traveled no farther than 1-1.5 km from the lava dome into Tuitt's and White's ghauts and into the Tar River Valley. During 5-6 December, rockfalls and small pyroclastic flows occurred more frequently on the northern talus slope and on the NW, at the top of Tyer's Ghaut.
Sources: Montserrat Volcano Observatory (MVO); Washington Volcanic Ash Advisory Center (VAAC)
Volcanic and seismic activity at Soufrière Hills remained at moderate levels during 22-29 November. Growth of the active extruded lobe on the N side of the lava dome continued to produce rockfalls and small-to-moderate pyroclastic flows. Pyroclastic-flow activity was confined mainly to Tuitt's and White's Bottom ghauts, and also along the N edge of the Tar River Valley. On 29 November the active lobe had a broad whaleback-shaped upper surface, which was oriented towards the NNE. SO2 emission rates were generally high.
Sources: Montserrat Volcano Observatory (MVO); Washington Volcanic Ash Advisory Center (VAAC)
Activity at Soufrière Hills remained moderate during 15-22 November. The lava dome was not visible during the week due to cloudy conditions. Rockfalls and small pyroclastic flows were concentrated on the volcano's E and NE flanks. During the 15th to 19th, small pyroclastic flows traveled 1-1.5 km from the dome every few hours in Tuitt's Ghaut to the NE and in the Tar River Valley to the E. On 9 November small pyroclastic flows traveled down the Tar River Valley. Rockfalls continued to occur on the NW flank of the lava dome throughout the report period. SO2 emission rates were relatively low.
Sources: Montserrat Volcano Observatory (MVO); Washington Volcanic Ash Advisory Center (VAAC)
Activity at Soufrière Hills increased slightly during 8-15 November. On the 8th and 9th pyroclastic flows traveled 900-1,000 m NW into Tyer's Ghaut at the headwaters of the Belham Valley. From the 10th to 15th, lava-dome growth and ash venting were concentrated to the NE at the base of the NW lava lobe. Rockfall and pyroclastic-flow debris were shed predominantly NE down Tar River Valley and Tuitt's Ghaut and occasionally down the NW flank. During the last 3 days of the report period, the size and energy of the pyroclastic flows increased slightly. SO2 emission rates were higher than the previous week, with a mean emission rate of 520-560 tons per day.
Sources: Montserrat Volcano Observatory (MVO); Washington Volcanic Ash Advisory Center (VAAC)
Volcanic activity at Soufrière Hills during 1-8 November was at similar levels to the past few weeks. Lava-dome growth on the N part of the dome continued through the report period, although it was less directed, with rockfalls dispersed over the summit and flanks. The lobe shed rockfall debris predominately down Tuitt's Ghaut and Tar River Valley, although also onto the NW flank and into the top of Gage's Valley. SO2 emission rates were generally low throughout the week, with a peak on 4 November. According to the Washington VAAC, on the 8th strong pyroclastic flows produced ash-and-gas clouds to a height of ~1.5 km.
Sources: Montserrat Volcano Observatory (MVO); Washington Volcanic Ash Advisory Center (VAAC)
Activity at Soufrière Hills during 25 October to 1 November generally increased in comparison to the previous week. The volcano was observed using a remote camera and during a flight on 31 October. The active extruded lobe in the NW continued to steadily grow, bulking out on the N and W sides. Rockfalls and pyroclastic flows traveled down the E and N flanks, particularly within Tuitt's Ghaut and the Tar River Valley. A considerable amount of debris also spalled off the W flank of the active extruded lobe and accumulated in the upper parts of Fort Ghaut. SO2 emission rates were low throughout the week.
Sources: Montserrat Volcano Observatory (MVO); Washington Volcanic Ash Advisory Center (VAAC)
Volcanic and seismic activity at Soufrière Hills remained at a similar level during 18-25 October to that of the previous week. Occasional clear views of the lava dome revealed that the active extrusion lobe in the NW continued to grow steadily, increasing in height and bulging out on the N and W sides. The most notable event of the week occurred on the afternoon of 22 October when intense rainfall at midday produced large mudflows NW in the Belham Valley where residents had recently been evacuated. At the peak of flow, the entire width of the valley floor at Belham Bridge was flooded and standing waves up to 2.5 m high were observed. By 1430, pyroclastic-flow activity began. For several hours, pyroclastic flows were generated off of the N flank of the dome and were channeled northeastwards into the upper parts of Tuitt's Ghaut, from where they crossed over into White's Bottom Ghaut. Flows also occurred on the dome's E flank in the Tar River Valley. SO2 emission rates were low at the beginning of the report period and increased towards the end of the week.
Sources: Montserrat Volcano Observatory (MVO); Associated Press
Volcanic and seismic activity at Soufrière Hills remained at moderate levels during 11-18 October. Signals associated with rockfalls and pyroclastic flows continued to dominate the seismicity. The NW extrusion lobe of the lava dome continued to grow steadily. Growth remained centralized and there was noticeable bulking up of the lobe's summit area. Rockfalls and small pyroclastic flows traveled mainly down the northern flanks of the volcano, although some also traveled E into the incised channel on the N side of the Tar River Valley, and W into the upper portions of Fort Ghaut. Talus continued to accumulate behind the NW buttress and in the head of Tyre's Ghaut. SO2 emission rates varied considerably during the report period.
Sources: Montserrat Volcano Observatory (MVO); Washington Volcanic Ash Advisory Center (VAAC)
During 4-11 October, volcanic and seismic activity at Soufrière Hills remained at moderate levels. The NW extrusion lobe of the lava dome continued to grow steadily; early in the report period it grew to the NW, but later growth was more centralized. There was a noticeable bulking up of the summit area of the lobe. Rockfalls and small pyroclastic flows were shed into the upper portions of Fort Ghaut and Tuitt's Ghaut. Minor mudflow activity occurred during the evening of the 9th. The growth of the lava dome towards the NW increased the probability of pyroclastic flows entering the Belham River system. In order to reduce the level of risk this poses, populated areas along the fringes of the lower part of the Belham Valley (~300 people) were evacuated on 8 and 9 October, and were declared part of the Exclusion Zone. A relatively small pyroclastic flow traveled NNE down the flanks of the volcano on the 13th.
Sources: Montserrat Volcano Observatory (MVO); Associated Press; Washington Volcanic Ash Advisory Center (VAAC)
Volcanic and seismic activity at Soufrière Hills increased significantly during 26 September to 4 October following the previous week's major switch in lava-dome extrusion direction. On the 27th a 4-hour-period of heightened activity occurred in the afternoon and evening, with small semi-continuous pyroclastic flows traveling down the N flanks and eastwards into the upper portions of Tuitts Ghaut and then into Whites Bottom Ghaut. A newly extruded lobe was visible on the 28th almost directly to the NW with a broad headwall over the N, NW, and W flanks. On the evening of the 29th there was another period of heightened activity on the northern flanks that lasted 1.5 hours, with pyroclastic flows just reaching the sea along Whites Bottom Ghaut. It was estimated that during this small event only 2-3 million m3 of the N edge of the active NW lobe was shed. Observations on 1 October revealed that re-growth of the collapsed area had occurred. A brief period of heavy rain on the 2nd triggered a moderate-sized mudflow down the Belham Valley. Analysis of seismic data suggested that pyroclastic-flow activity on the 2nd began at 13:10 and sustained dome collapse continued for 6 hours. Low-energy pyroclastic flows were observed reaching the sea on the Tar River's flanks throughout the collapse, and ash clouds were produced that drifted to the NW. Heavy ashfall occurred in the residential areas of Salem, Old Towne, and Olveston, with deposits up to 9 mm thick. Subsequent observations revealed that this collapse was confined to the volcano's eastern flanks, and that this was again a relatively small event (less than 5 million m3 of material was shed off of the eastern side of the dome complex).
According to the Washington VAAC, after daybreak on 3 October there were several reports of ashfall in Puerto Rico, and visible satellite imagery at 1115 confirmed that an ash cloud at a height of around 2.4 km a.s.l. covered most of the island. At 1615 the area of very thin ash was not visible on satellite imagery. By the next day, ash from the previous day's emissions had drifted W and around 0902 it was located over southern Puerto Rico nearest to the city of Ponce. A thin plume of ash also extended SSW of St. Croix island.
Sources: Montserrat Volcano Observatory (MVO); Washington Volcanic Ash Advisory Center (VAAC)
During 20-27 September, activity at Soufrière Hills' dome complex increased in comparison to the previous week, with a major change in direction of extrusion following a hybrid earthquake swarm the previous week. Growth of the previously active NE lobe stagnated during the 21st to 22nd. A near vertical spine was extruded in the central area around the 21st, possibly indicating a switch in growth direction. Observations on the 26th revealed a large new lobe that had extruded towards the W in the area previously known as Gages Wall. Material spalling off of this lobe produced rockfalls and small pyroclastic flows down Gages Valley for up to 1 km. The most notable events were pyroclastic flows on the evening of the 25th and the morning of the 27th. Growth and rockfall activity then changed towards the northern flanks, suggesting a possible stagnation of the recently extruded western lobe. Spectacular incandescence and semi-continuous rockfall activity were observed on the NE and N flanks of the dome on the night of the 26th and the early hours of the 27th. The Washington VAAC reported that a low-level ash cloud from an emission on the 29th at 1510 was visible over E Puerto Rico on satellite imagery through the following day. On the 30th a light dusting of white ash fell in E Puerto Rico at Roosevelt Roads Naval Air Station.
Sources: Montserrat Volcano Observatory (MVO); Washington Volcanic Ash Advisory Center (VAAC)
During 13-20 September, activity at Soufrière Hills increased in comparison to the previous week. Lava-dome growth was directed to the NE, with frequent rockfalls and small pyroclastic flows sending material to a sector extending from the central Tar Valley on the E flank to the NE flanks above Tuitt's Ghaut. Some material tumbled down a notch onto the northern flank. SO2 flux remained at low-to-moderate levels when recorded during the beginning of the report week. Low-level ash-and-steam clouds were sometimes visible on satellite imagery.
Sources: Montserrat Volcano Observatory (MVO); Washington Volcanic Ash Advisory Center (VAAC)
During 6-13 September, activity at Soufrière Hills remained at moderate levels. Growth on the lava-dome complex remained centralized on the E flank, with frequent rockfalls and small pyroclastic flows. At the beginning of the week most of these spilled eastward along the N side of the Tar River Valley, but later in the week activity appeared to refocus northward onto Tuitt's Ghaut. SO2 flux remained at moderate levels. On 11 September a faint ash plume was visible on satellite imagery.
Sources: Montserrat Volcano Observatory (MVO); Washington Volcanic Ash Advisory Center (VAAC)
Volcanic and seismic activity remained at moderate levels at Soufrière Hills during 30 August-6 September, although there was an increase in activity in comparison to the previous week. Lava-dome growth continued to be focussed on the N side of the dome complex although it became more centralized. The summit height exceeded 1,050 m. Frequent rockfalls and small pyroclastic flows traveled down the volcano's NE flank. Most were channeled into the upper portions of Tuitt's Ghaut, although some spilled eastward along the northern side of the Tar River Valley. SO2 flux remained at low-to-moderate levels.
Source: Montserrat Volcano Observatory (MVO)
During 23-30 August, volcanic and seismic activity at Soufrière Hills remained at moderate levels. Small pyroclastic flows traveled mainly down the NE flank where they were channeled into the upper portions of Tuitt's Ghaut, although some spilled eastwards along the northern side of the Tar River Valley. Talus also continued to accumulate in the notch in the NW sector of the old lava dome, which leads towards Tyre's Ghaut. SO2 flux remained at moderate levels.
Source: Montserrat Volcano Observatory (MVO)
Volcanic and seismic activity at Soufrière Hills were at moderate levels during 16-23 August. Lava-dome growth continued to be focused on the N side of the dome complex and rockfall talus continued to accumulate to the N in the upper reaches of Tuitt's Ghaut. In addition, there were overspills of talus from the northern side of the Tar River Valley into the two tributaries of White's Ghaut. Talus also slowly accumulated in the notch in the NW sector of the old dome that leads towards Tyre's Ghaut. During intense rainfall in the early hours of Wednesday morning, a small collapse occurred in the Tar River Valley. SO2 flux remained at moderate levels.
Source: Montserrat Volcano Observatory (MVO)
Volcanic and seismic activity at Soufrière Hills remained at high levels during 9-16 August. Lava-dome growth remained focused on the N side of the dome complex. Rockfall talus accumulated in the upper portions of Tuitt's Ghaut, and small pyroclastic flows occurred to the N in both Tuitt's and White's ghauts. The active lobe also shed rockfall talus into the notch in the north-western sector of the old dome which leads towards Tyre's Ghaut. SO2 fluxes remained at moderate levels.
Source: Montserrat Volcano Observatory (MVO)
During 2-9 August, activity at Soufrière Hills continued at a high level. Lava-dome growth remained focussed on the N side of the dome complex, with the development of a massive curved lobe of lava. During the early part of the week, the lobe repeatedly crumbled, producing rockfalls and small pyroclastic flows that reached the upper portion of Tuitt's Ghaut. Limited activity occurred on the NW part of the dome, although one small pyroclastic flow occurred in the notch between the central and north-western buttresses. Over the last 3 days of the report period, rockfall activity decreased substantially. This was due to the lobe becoming more coherent and not collapsing, not due to the activity stagnating. During the report week SO2 mass flux increased.
Source: Montserrat Volcano Observatory (MVO)
Volcanic and seismic activity at Soufrière Hills during 26 July-2 August continued at an elevated level. The swarm of low-amplitude long-period earthquakes that began on 19 July continued, but decreased during the last 3 days of the report period. A flight on 1 August revealed that the new extrusion lobe on the N side of the summit had a broad whaleback form. Growth of the lobe was directed toward the N, giving rise to rockfalls and small pyroclastic flows in the upper parts of Tuitt's Ghaut and White's Ghaut. Torrential rainfall produced mudflows in the Belham Valley in the early hours of 28 August. SO2flux remained low.
Source: Montserrat Volcano Observatory (MVO)
Volcanic and seismic activity at Soufrière Hills during 19-26 July increased significantly in comparison to the previous week. A swarm of low-amplitude long-period earthquakes began on 19 July and increased in strength over the following 4 days. Observations of the lava dome on 21 July indicated that significant growth had recommenced, with the extrusion of a new lobe on the NE side of the summit region. Growth of the new lobe gave rise to rockfalls and small pyroclastic flows off the dome's NE flank. A notable event occurred on the morning of 23 July, when a minor collapse produced small but continuous pyroclastic flows for about an hour. These mainly flowed into the upper parts of Tuitt's Ghaut and down White's Ghaut for about half the distance to the coast. A few also flowed into the upper part of the Tar River Valley. A similar event, lasting for about 20 minutes, occurred in the early hours of the morning of 26 July. Sulphur dioxide flux was low at the beginning of the report period, but increased from 22 July onwards.
Sources: Montserrat Volcano Observatory (MVO); Washington Volcanic Ash Advisory Center (VAAC)
Activity at Soufrière Hills increased slightly during 12-19 July, but remained at relatively low levels. Observations of the lava dome on 15 July suggested that dome growth had continued at a very slow rate on the SE side of the dome. The level of rockfall activity from this active lobe increased slightly on 15 July, with a small pyroclastic flow traveling down the Tar River Valley at 0800. SO2 flux remained low.
Source: Montserrat Volcano Observatory (MVO)
Volcanic and seismic activity at Soufrière Hills were at low levels during 5-12 July. No change in lava-dome morphology occurred. The level of rockfall activity increased slightly between the 6th and 8th, before decreasing to very low levels for the remainder of the week. SO2 fluxes remained low, but increased slightly over the last 3 days of the report period.
Source: Montserrat Volcano Observatory (MVO)
During 28 June-5 July, volcanic and seismic activity were at very low levels at Soufrière Hills in comparison to the previous week. No change in lava dome morphology was observed during the report period. Heavy rain on the evening of 2 July generated substantial mudflows in Plymouth. The level of rockfall activity on the dome increased slightly on the morning of 3 July and a small, low ash cloud drifted over Plymouth around 1000. SO2 flux remained consistently low.
Source: Montserrat Volcano Observatory (MVO)
Volcanic and seismic activity were at low levels during 21-28 June at Soufrière Hills. Growth of the extruded lobe on the SE side of the lava dome appeared to have stagnated. The number of rockfalls decreased abruptly on the afternoon of 22 June, remained at low levels for the rest of the week, and declined to very low levels during the last 3 days of the report period. SO2 emission rates also decreased to very low levels by the end of the report period.
Sources: Montserrat Volcano Observatory (MVO); Washington Volcanic Ash Advisory Center (VAAC)
Volcanic activity at Soufrière Hills during 14-21 June was slightly higher than it had been the previous week. Rockfall activity increased abruptly on the night of 14 June and remained at moderately high levels until the 18th, when it declined. The active lobe on the SE side of the lava dome continued to grow and was topped by a small, low-angle spine extruded towards the SE. Rockfalls and small pyroclastic flows traveled towards the E, and several small pyroclastic flows traveled down the volcano's NE flank.
Sources: Montserrat Volcano Observatory (MVO); Washington Volcanic Ash Advisory Center (VAAC)
Volcanic and seismic activity remained at low levels at Soufrière Hills during 7-14 June. The massive extrusive lobe on the SE side of the lava dome continued to grow steadily throughout the week, although there was a low level of rockfall and seismic activity. Minor rockfall activity occurred on the E flank of the dome, increasing slightly during the latter half of the week.
Sources: Montserrat Volcano Observatory (MVO); Washington Volcanic Ash Advisory Center (VAAC)
The level of volcanism at Soufrière Hills was low during 31 May-7 June. During 31 May-4 June, the lava dome was seen clearly for the first time in several months. Since early April a large lobe had been extruded on the SE side of the dome's summit. This lobe is 150 m wide and rises to 1,023 m a.s.l. Its upper surface is spiny and slab-like. A small lobe-like protrusion also developed on the W side of the summit. Minor rockfalls traveled down the E flank of the dome and the W flank of the summit.
Sources: Montserrat Volcano Observatory (MVO); Washington Volcanic Ash Advisory Center (VAAC)
During 24-31 May, the level of volcanism at Soufrière Hills decreased in comparison to the previous week. The summit region of the active lava dome was broad and blocky in appearance. Lava-dome growth appeared to have become concentrated on the SE, leading to rockfalls and small pyroclastic flows down the flank. There was little activity on the NE flank of the dome.
Sources: Montserrat Volcano Observatory (MVO); Washington Volcanic Ash Advisory Center (VAAC)
During 17-24 May, the level of volcanism at Soufrière Hills remained similar to that in the previous week. Cloudy conditions obscured visual observations, but lava-dome growth appeared to be concentrated on the volcano's E flank. Numerous rockfalls and small pyroclastic flows traveled to the upper portions of the Tar River Valley. The number of rockfalls increased slightly on the 21st, but declined again on the 23rd.
Sources: Montserrat Volcano Observatory (MVO); Washington Volcanic Ash Advisory Center (VAAC)
During 10-17 May, volcanic activity was generally higher than it had been the previous week. Lava-dome growth continued to be concentrated on the E flank. Rockfall, pyroclastic-flow, and long-period earthquake activity was relatively high during the first half of the report period, but declined slightly during 15-17 May.
Sources: Montserrat Volcano Observatory (MVO); Washington Volcanic Ash Advisory Center (VAAC)
During 3-10 May, the level of volcanism at Soufrière Hills was generally lower at the beginning of the report period than it had been the previous week, but it increased during the 8th to 10th. Growth of the lava dome to the E continued to produce rockfalls and small pyroclastic flows down the E flank. Beginning on 8 May, activity increased and rockfalls and pyroclastic flows were concentrated on the dome's NE flank. Incandescence was visible several nights during the report period.
Sources: Montserrat Volcano Observatory (MVO); Washington Volcanic Ash Advisory Center (VAAC)
Volcanism at Soufrière Hills during 26 April-3 May remained at high levels. The lava dome continued to grow on the E side of the dome complex. Numerous rockfalls and small pyroclastic flows occurred at the E face of the dome as a result of material spalling off of the active extrusion lobe. Pyroclastic-flow activity was confined mainly to the upper part of the Tar River Valley, although several flows reached the pyroclastic fan at the mouth of the valley, where it disgorged into the sea. SO2 emission rates decreased slightly during the report week.
Sources: Montserrat Volcano Observatory (MVO); Washington Volcanic Ash Advisory Center (VAAC)
Volcanic activity at Soufrière Hills was at high levels during 19-26 April. The direction of lava-dome growth switched during the earlier part of the week, becoming focussed on the southeastern part of the dome complex. Rockfalls traveled down the SE flank of the dome almost continuously. The lobe on the SE portion of the dome reached 1,041 m a.s.l. and the NE lobe, which had been highly active the previous two weeks, stagnated at a height of 1,020 m a.s.l. Fluctuations in SO2 emission rates appeared to reflect variations in the intensity of rockfall activity.
Sources: Montserrat Volcano Observatory (MVO); Washington Volcanic Ash Advisory Center (VAAC)
During 12-19 April, the level of volcanism at Soufrière Hills slightly decreased in comparison to the previous week. Lava-dome growth was concentrated on the SE area of the dome complex, although small rockfalls occurred in other areas. The lava dome evolved from a large striated lobe at the beginning of the week, to a series of small spines by week's end. Small, low-level ash clouds were occasionally visible on satellite imagery.
Sources: Montserrat Volcano Observatory (MVO); Washington Volcanic Ash Advisory Center (VAAC)
During 5-12 April, volcanism slightly decreased at Soufrière Hills in comparison to the previous week. Lava-dome growth over the entire summit region produced rockfalls that traveled predominately to the SE, E, and NE. Several pyroclastic flows traveled E for ~2 km down the Tar River Valley, reaching the sea. At the beginning of the report week, ash from ongoing rockfalls and venting of the dome fell to the NW and N of Montserrat.
Sources: Montserrat Volcano Observatory (MVO); Washington Volcanic Ash Advisory Center (VAAC)
During 29 March-5 April, volcanism slightly decreased at Soufrière Hills in comparison to the previous week. Lava-dome growth over the entire summit region produced rockfalls that traveled predominately to the SE, E, and NE. Several pyroclastic flows traveled E ~2 km down the Tar River Valley, reaching the sea. At the beginning of the report week, ash from ongoing rockfalls and venting of the dome fell to the NW and N of Montserrat.
Sources: Montserrat Volcano Observatory (MVO); Washington Volcanic Ash Advisory Center (VAAC)
During 23-29 March, the level of volcanism remained high at Soufrière Hills. Lava-dome growth continued to be focused to the E of the summit region, producing numerous rockfalls and small pyroclastic flows into the upper portions of the Tar River Valley. Minor amounts of rockfall debris from the NE flank of the dome spilled into the head of Tuit's Ghaut. During the first half of the report period, ash from venting, rockfalls, and pyroclastic flows drifted W over Plymouth and the Richmond Hill area. Later in the week, ash drifted to the NW and N and was deposited in populated areas. SO2 emission rates remained high (1,110-1,200 metric tons per day).
Sources: Montserrat Volcano Observatory (MVO); Washington Volcanic Ash Advisory Center (VAAC)
The level of volcanic activity at Soufrière Hills remained high during 15-22 March. Lava-dome growth continued to be focused on the E side of the summit region. Throughout the report period large (50-70 m high), fast-growing, spines developed on the dome's summit. These spines periodically collapsed, producing pyroclastic flows down the volcano's E flank that sometimes reached the Tar River fan. Small ash clouds produced from these events reached ~1 km above the volcano and drifted westward over Plymouth and Richmond Hill. Ash predominately fell into the sea. SO2 emission rates remained high. Theodolite measurements of the dome taken on 20 March yielded a dome height of 1,039 m.
Sources: Montserrat Volcano Observatory (MVO); Washington Volcanic Ash Advisory Center (VAAC)
During 8-15 March, the level of volcanic activity at Soufrière Hills was higher than during the previous week. Activity began to increase on the 8th, remaining at elevated levels for the remainder of the report period. Lava-dome growth continued to be concentrated towards the E, sending rockfalls and small pyroclastic flows to the upper portions of the Tar River Valley. The summit of the dome had a generally spiny appearance and minor episodes of ash venting occurred from it. Incandescence was visible at the summit during the night. SO2 emission rates were higher than average during the week (430 to 860 metric tons per day).
Sources: Montserrat Volcano Observatory (MVO); Washington Volcanic Ash Advisory Center (VAAC)
During 1-8 March, volcanism decreased at Soufrière Hills in comparison to the previous week. Lava-dome growth continued to be concentrated towards the E, sending rockfalls and small pyroclastic flows to the upper portions of the Tar River Valley. Incandescence was visible on the upper parts of the dome during the night. Minor episodes of ash venting occurred from the summit of the dome. SO2 emission rates decreased dramatically during the first half of the report period.
Sources: Montserrat Volcano Observatory (MVO); Washington Volcanic Ash Advisory Center (VAAC)
The level of volcanism at Soufrière Hills during 22 February-1 March was higher than it had been in previous weeks. The continued growth of the lava dome towards the E led to almost continuous rockfalls and small pyroclastic flows that traveled to the upper portion of the Tar River Valley. During the week a large, steeply inclined spine was extruded on the summit of the dome. By 26 February the spine was 90 m tall, making the volcano's summit 1,080 m a.s.l. This is the highest the summit has been during the entire eruption to date. Minor episodes of ash venting occurred from the summit throughout the report period.
Sources: Montserrat Volcano Observatory (MVO); Washington Volcanic Ash Advisory Center (VAAC)
During 15-22 February, volcanism was generally high at Soufrière Hills. Lava-dome growth continued to be focused on the E sector. Activity increased during the second half of the report period; near-continuous rockfalls and minor pyroclastic flows traveled down the volcano's E flank. Minor rockfalls were also observed on the N flank of the active lava dome. Minor episodes of ash venting occurred from the summit of the dome, and on a number of evenings large parts of the summit were incandescent. SO2emission rates decreased during the report period; on 16 February 600-780 metric tons were measured, while on 19 February 90-130 metric tons were measured.
Sources: Montserrat Volcano Observatory (MVO); Washington Volcanic Ash Advisory Center (VAAC)
During 8-15 February volcanism at Soufrière Hills decreased slightly in comparison to the previous week. Lava-dome growth continued to be focussed towards the E and NE, producing numerous rockfalls and small pyroclastic flows in the upper portions of the Tar River Valley. Minor rockfalls of old inactive dome material traveled W to the upper portion of the Gages region. Minor episodes of ash venting occurred throughout the report period and SO2 emissions were slightly lower than the previous week.
Source: Montserrat Volcano Observatory (MVO)
During 1-8 February volcanism slightly increased at Soufrière Hills in comparison to the previous week. Lava-dome growth continued to be focused on the E and NE sides of the dome. The summit of the dome was blocky and massive, rather than covered with spines like it was during the previous week. New pyroclastic-flow deposits were seen in Tar River to the E of the volcano and in White River to the SW.
Sources: Washington Volcanic Ash Advisory Center (VAAC); Montserrat Volcano Observatory (MVO)
During 25 January-1 February, the level of activity at Soufrière Hills was similar to the previous week. Lava-dome growth continued on the E side of the dome, producing numerous rockfalls and small pyroclastic flows to the upper portion of the Tar River Valley. These events were of similar size and energy to those of the previous week. Minor episodes of ash venting occurred throughout the report period. Ash clouds rose to a maximum height of ~2.5 km a.s.l.
Sources: Washington Volcanic Ash Advisory Center (VAAC); Montserrat Volcano Observatory (MVO)
During 18-25 January, volcanic activity remained high at Soufrière Hills. Continued growth on the E side of the lava dome produced numerous rockfalls and small pyroclastic flows down the volcano's E flank. On the 21st the dome was crowned by a large 40- to 50-m tall spine inclined steeply upwards towards the E. While the number of rockfalls gradually decreased over the previous 3 weeks, their size and duration significantly increased during the report period, exceeding total energy rates during the past few months.
Source: Montserrat Volcano Observatory (MVO)
During 11-18 January volcanic activity was slightly lower at Soufrière Hills compared to the previous week. Growth appeared to be concentrated on the lava dome's E flank, where intense rockfall activity and small pyroclastic flows continued. On 12 January a long-period earthquake was accompanied by an ash plume that rose to ~2.5 km above the dome. This event was followed by a series of pyroclastic flows that traveled down the Tar River Valley to the sea. A large steam plume was generated when the pyroclastic flows entered the sea. The steam plume and a dense ash cloud drifted W over the Plymouth, Richmond Hill, and Fox's Bay area. Minor mudflows occurred in the Belham Valley on the morning of 18 January.
Source: Montserrat Volcano Observatory (MVO)
During 4-11 January volcanic activity remained high at Soufrière Hills. Observations on 10 January revealed that the summit region had increased in volume considerably over the past several weeks and that the lava dome was broad with several spines sticking out from it. The highest spine reached 1,015 m a.s.l. on the 12th. The western side of the zone appeared to be inactive. A large extrusion lobe was active on the upper E flank of the dome, just below the summit. The E flank of the dome was very active, producing numerous rockfalls and pyroclastic flows. On 5 January a series of pyroclastic flows traveled down the Tar River Valley to the sea. This event was accompanied by vigorous venting of ash from the summit, producing a pulsating ash-laden plume that drifted to the W. Seismicity remained at a similar level in comparison to the previous week. SO2 and HCl emissions were high; 898 and 1,122 metric tons of SO2 were measured on 1 and 10 January, respectively. Low-level ash emissions occurred throughout the week.
Sources: Montserrat Volcano Observatory (MVO); Washington Volcanic Ash Advisory Center (VAAC)
During 28 December-4 January volcanic activity at Soufrière Hills remained high, with vigorous rockfalls travelling down the volcano's E flank. The most notable event during the week was the collapse of several million cubic meters of volcanic material down the volcano's NE flank on 28 December. The collapse, during about 1330-1500, continuously generated pyroclastic flows down the Tar River Valley to the sea. A dense W-drifting ash plume was generated that deposited up to a centimeter of ash in the vicinity of the town of Plymouth. The average flux of SO2 in the volcanic plume was ~460 metric tons on 3 January, in comparison to 851 metric tons measured on 27 December. A 30-minute-long sustained event began on 5 January around 1640 and produced an ash cloud to a height of ~2.4 km a.s.l.
Sources: Montserrat Volcano Observatory (MVO); Washington Volcanic Ash Advisory Center (VAAC)
During 21-28 December volcanic activity increased at Soufrière Hills, with a large number of rockfalls, an increase in SO2 flux, and periods of continuous ash emission. Most lava-dome growth was concentrated on the E side of the dome, where spectacular incandescent rockfalls were seen on the nights of 26 and 27 December. Rockfall seismicity increased throughout the week. There was a large increase in SO2 flux; an average emission rate of 851 metric tons was measured on 27 December in comparison to 181 metric tons on 19 December. The increase in SO2 flux coincided with an increase in rockfalls. According to the Washington VAAC, continuous ash-and-steam venting beginning on 27 December at 0315 produced an ash plume that remained below ~3 km a.s.l. A large area of dense ash below 3 km a.s.l. was observed on satellite imagery from an emission that began on 28 December at 1330. On 1 January a high number of rockfalls generated low-level ash clouds (up to 1.5 km).
Sources: Montserrat Volcano Observatory (MVO); Washington Volcanic Ash Advisory Center (VAAC)
During 14-21 December, volcanic activity at Soufrière Hills remained high. Observations of the lava dome on 16 December revealed that it had increased in volume since it was last seen in late November. The top of the dome was broadly rounded and had a blocky appearance. Most of the growth appeared to occur on the W side of the dome, but rockfalls and small pyroclastic flows also occurred on the E and S flanks. Periods of weak, but sustained ash-venting occurred on most days and seismicity was dominated by rockfall signals. Intense rainfall on the morning of 21 December produced large mudflows NW of the volcano in Belham Valley.
Sources: Montserrat Volcano Observatory (MVO); Washington Volcanic Ash Advisory Center (VAAC)
High levels of volcanic and seismic activity continued at Soufrière Hills during 7-14 December. Seismicity was dominated by signals attributed to rockfalls, which gradually increased throughout the week. Continuous, weak tremor recorded on 13 December was associated with ash venting, and produced columns that rose to at least 4 km.
Sources: Montserrat Volcano Observatory (MVO); Washington Volcanic Ash Advisory Center (VAAC)
Volcanic activity at Soufriere Hills remained at a high level, similar to the previous week. Elevated activity on 2 December produced pyroclastic flows in the Tar River Valley that reached the sea. The flows originated in several places along the E face of the new lava dome. Two small pyroclastic flows also occurred in the upper reaches of White River, originating from the old dome material closest to Chances Peak. Short periods of pyroclastic-flow activity occurred in both valleys on 4 and 6 December. On 8 December a low-level plume of ash (~1.8 km a.s.l.) was visible extending ~140 km to the W of the volcano.
Sources: Washington Volcanic Ash Advisory Center (VAAC); Montserrat Volcano Observatory (MVO)
Volcanic activity at Soufrière Hills remained at a high level, similar to the previous week. Lava dome growth on the western side of the dome complex produced rockfalls to the W that were confined by the collapse scar formed on 29 July 2001. The dome complex consists of the stagnant E lobe (870 m a.s.l.), an inactive central lobe (930 m a.s.l.), and the active W lobe (960 m a.s.l. on 27 November). The hybrid and long-period earthquake swarm, which began on the 14th of November, continued without intensifying. Low-level ash emissions occurred on 3 December.
Sources: Washington Volcanic Ash Advisory Center (VAAC); Montserrat Volcano Observatory (MVO)
The level of volcanic activity at Soufrière Hills increased during 16-23 November in comparison to the previous week. Morphological changes were observed at the volcano's summit; lava-dome growth shifted from the E to the W and the summit area was crowned by spines with an average elevation of 940 m a.s.l. Rockfall activity was relatively low, but intensified towards the end of the report week. Rockfalls were mainly concentrated on the W side of the active area, rather than the E as in previous weeks. Incandescent material was visible at night on the E and W sides of dome. A hybrid and long-period earthquake swarm began on 14 November, reaching a peak on 21 November before slightly declining.
Source: Montserrat Volcano Observatory (MVO)
Volcanic activity at Soufrière Hills during 9-16 November was generally diminished compared to the previous week. The lava dome continued to grow mainly towards the E and its highest point was measured on 9 November to reach 876 m a.s.l. Small pyroclastic flows and rockfalls were generated by material avalanching off the flanks of the dome. The largest of these events was a pyroclastic flow on the night of 14 November, which traveled E and reached the lower parts of the Tar River Valley. The seismicity cycles, which had been a dominant feature since early August, appeared to have stopped. Rockfall seismicity was most intense on 9 and 10 November, but then declined significantly and remained low after 12 November. The Washington VAAC reported that ash was visible in satellite imagery on 17 November at 0845 below 6.1 km a.s.l. and on 18 November at 0845 below 3 km a.s.l., extending ~42 km NE towards Antigua. The satellite imagery showed that a thin portion of the ash cloud may have reached Antigua.
Sources: Montserrat Volcano Observatory (MVO); Washington Volcanic Ash Advisory Center (VAAC)
Activity at Soufrière Hills increased slightly during 2-7 November, and intensified on the 8th and 9th. The lava dome continued to grow mainly towards the E and at night parts of it were incandescent. Small pyroclastic flows and numerous rockfalls were generated by material avalanching off the flanks of the dome; they traveled mainly down the volcano's eastern flank, and to a lesser extent down the NE flank. On 8 November observations from a helicopter revealed that a shallow, circular depression was located over the summit area of the dome, with ash vigorously venting from it. On several days a low-level plume, with small amounts of ash, drifted to the W or N. Cycles of weak and sporadic seismicity occurred, with periods of more intense seismicity characterized by increased rockfall activity and hybrid earthquakes. Mudflows occurred in the Belham Valley on the morning of 9 November during a period of heavy rainfall.
Sources: Washington Volcanic Ash Advisory Center (VAAC); Montserrat Volcano Observatory (MVO)
Beginning on 26 October, seismicity at Soufrière Hills was at low levels until it increased on 1 November. Clear weather conditions allowed observations of the lava dome on 31 October and 1 November. The active lava dome had grown substantially and appeared to switch growth direction from the NE to the E, where a massive, near-vertical headwall had developed. Several small pyroclastic flows were generated by material avalanching off the eastern flank of the dome. Cycles of mostly hybrid earthquakes, with a coincident increase in rockfalls, were weak until they strengthened on 1 November. Mudflows occurred in the Belham Valley during several days with periods of torrential rainfall.
Source: Montserrat Volcano Observatory (MVO)
During 19-26 October there was a general reduction in volcanic activity at Soufrière Hills in comparison with the previous week, while seismicity remained at a similar level. The active lava dome continued to grow at a moderate rate, producing rockfalls and small pyroclastic flows in the upper reaches of the Tar River Valley. Cycles of mostly hybrid earthquakes, with a coincident increase in rockfalls, recommenced after weakening for about a week. Mudflows occurred in the Belham Valley during several days with periods of torrential rainfall.
Sources: Washington Volcanic Ash Advisory Center (VAAC); Montserrat Volcano Observatory (MVO)
During 12-19 October activity at Soufrière Hills remained at an elevated level, although there was a reduction in seismicity compared with the previous few weeks. The cyclical nature of the seismic activity, which had been a dominant feature over recent months, also weakened. The active lava dome continued to grow at a moderate rate, producing pyroclastic flows on most days into the upper reaches of the Tar River Valley. Two significant collapse events occurred during the reporting period involving residual material from the dome that formed prior to the 29 July dome. On 14 October, after a day of torrential rainfall, several million cubic meters of unconsolidated talus was destabalized on the SE flank of the pre-July 29 dome. This material produced sustained pyroclastic flows E down the Tar River Valley, reaching the sea. Seismic data suggested that the event began at about 1715, peaked at 2245, and ended at about 2300. Ash from the event drifted to the NW and fell in residential areas between Iles Bay and St Peter's. On the morning of 16 October a collapse occurred on the S flank of the dome complex, producing numerous pyroclastic flows W down the White River approximately two-thirds of the distance to the sea. Mudflows occurred in the Belham Valley during several days with periods of torrential rainfall.
Sources: Montserrat Volcano Observatory (MVO); Washington Volcanic Ash Advisory Center (VAAC)
During 5-12 October volcanic activity at Soufrière Hills remained at elevated levels, although there was a marked reduction in the number of hybrid earthquakes compared with the previous few weeks. Numerous pyroclastic flows were produced by material avalanching off of the lava dome, which continued to grow in the summit crater at a moderate rate. The flows were relatively small, but energetic, and were confined to the upper and middle reaches of the Tar River Valley to the E of the volcano. Associated ash clouds drifted to the W and NW, occasionally depositing small amounts of ash on inhabited areas on the N part of the island. According to the Washington VAAC, ash clouds did not rise over ~2 km a.s.l. Avalanching talus on the S flank of the previous lava dome produced a pyroclastic flow that traveled SW down the White River approximately two-thirds of the distance to the sea. Mudflows occurred in the Belham Valley during several days with periods of torrential rainfall. The daytime entry zone was reopened on 11 October, following its temporary closure the previous week.
Sources: Washington Volcanic Ash Advisory Center (VAAC); Montserrat Volcano Observatory (MVO)
During 28 September to 5 October volcanic activity at Soufrière Hills increased in comparison to the previous week. Numerous pyroclastic flows were produced by material avalanching off the lava dome, which continued to grow in the summit crater at a moderate rate. Most of the pyroclastic flows during the report period were small and confined to the upper reaches of the Tar River Valley E of the volcano, but larger flows occurred on 4 and 5 October. On 4 October a small-scale lava-dome collapse (consisting of 10-15% of the dome's volume) on the N side of the dome produced sustained pyroclastic-flow activity between 0745 and 0915, with at least three flows reaching the sea. Similar activity occurred on 5 October at 0845 until at least midday. Dense ash clouds generated during both periods of elevated pyroclastic-flow activity were visible on satellite imagery rising to ~1.8 km a.s.l. and drifting to the W. Seismicity continued to be dominated by bands of hybrid earthquakes and rockfalls.
Sources: Montserrat Volcano Observatory (MVO); Washington Volcanic Ash Advisory Center (VAAC)
Volcanic activity at Soufrière Hills during 21-28 September was similar to the previous week, except for a slight reduction in the number of hybrid earthquakes. Seismicity continued to be dominated by bands of hybrid earthquake swarms and increased rockfall activity with periodicities of approximately 11 to 13 hours. The active lava dome continued to grow at a moderate rate, producing rockfalls and small but energetic pyroclastic flows that traveled E to the upper reaches of the Tar River Valley. Periods of vigorous ash venting were associated with the hybrid-earthquake swarms. Steam-and-ash clouds were visible on satellite imagery rising to ~500 m above the volcano.
Sources: Washington Volcanic Ash Advisory Center (VAAC); Montserrat Volcano Observatory (MVO)
There was a moderate increase in volcanic activity at Soufrière Hills in comparison to the previous week. A marked increase in hybrid earthquake events was recorded and banded tremor events were slightly more intense. In addition, the number and strength of hybrid events associated with the banded tremor increased. The active lava dome continued to grow at a moderate rate, producing rockfalls and small pyroclastic flows that traveled E to the upper reaches of the Tar River Valley. The dome's volume was estimated to be 12 million cubic meters, therefore, the average growth rate has been ~2.6 cubic meters per second since the partial dome collapse on 29 July. Episodes of vigorous ash venting and increased rockfall activity occurred during periods of tremor. Low-level ash plumes from this activity were visible in satellite imagery.
Sources: Montserrat Volcano Observatory (MVO); Washington Volcanic Ash Advisory Center (VAAC)
Activity at Soufrière Hills remained at levels similar to the previous week. Bands of tremor, associated with rockfalls and ash venting, occurred at irregular intervals. On 12 September continuous low-amplitude tremor began and persisted until at least 14 September. The tremor accompanied rockfalls. The active lava dome continued to produce rockfalls and small pyroclastic flows that descended into the upper reaches of the Tar River Valley. Ash clouds produced from rockfalls rose slightly above the summit and were visible in satellite imagery.
Sources: Washington Volcanic Ash Advisory Center (VAAC); Montserrat Volcano Observatory (MVO)
Activity at Soufrière Hills remained at similar levels as during the previous week. Bands of tremor, associated with rockfalls and ash venting, occurred at irregular intervals. The active lava dome appeared to be growing rapidly and was well-formed, with steep sides and a rugged summit area. Rockfalls and small pyroclastic flows that originated from the new dome were observed in the upper reaches of the Tar River Valley. On the night of 3 September incandescence was visible at the dome. According to the Washington VAAC, rockfalls generated ash clouds that did not rise above ~1.5 km a.s.l.
Source: Montserrat Volcano Observatory (MVO)
Activity at Soufrière Hills remained at similar levels as during the previous weeks. Following the partial dome collapse on 29 July bands of tremor, which indicate rapid magma ascent, occurred at 13-27 hour intervals. During these banded-tremor events rockfall activity and ash venting increased, sending ash up to ~2 km above the volcano, drifting to the W. A weak swarm of volcano-tectonic earthquakes (less than M 1) began on 29 August. Observations revealed that the new lava dome had a well-formed dome-like morphology and appeared to have rapidly grown in the scar produced by the 29 July collapse. Rockfalls and small pyroclastic flows that originated from the new dome were observed in the upper reaches of the Tar River Valley. The daytime entry zone was re-opened on 29 August.
Source: Montserrat Volcano Observatory (MVO)
Volcanic activity at Soufrière Hills remained at a similar level as the previous week, except for an increase in hybrid seismic events. Rockfalls and pyroclastic flows observed in the upper reaches of the Tar River Valley appeared to originate from the new dome, which was obscured by meteorological clouds. After 22 August, banded tremor that had increased the previous week declined to low levels. The Washington VAAC reported that an ash emission occurred on 26 August at 1215, rose to ~2 km, and drifted to the SW.
Sources: Washington Volcanic Ash Advisory Center (VAAC); Montserrat Volcano Observatory (MVO)
Volcanic activity remained low during 10-17 August. Weak banded tremor began on 14 August and continued throughout the week. The new lava dome continued to grow within the scar produced from the 29 July partial dome collapse. Deposits in the upper reaches of the Tar River Valley indicated that the new dome had produced several small pyroclastic flows.
Source: Montserrat Volcano Observatory (MVO)
During the week volcanic activity was low at Soufrière Hills. Small-scale rockfalls and minor pyroclastic flows occurred mainly off of the sides of the scar left after the partial dome collapse on 29 July. Like the previous week, a new dome was seen growing within the scar.
Source: Montserrat Volcano Observatory (MVO)
Volcanic activity rapidly declined after the lava dome at Soufrière Hills partially collapsed on 29 July. Observation flights after the collapse revealed that the general summit region had been lowered by about 150 m. There was also a complex amphitheater-shaped scar several hundred meters deep incised into the core of the dome at the head of the Tar River Valley. A new dome was growing within the scar. The Washington VAAC reported that a minor eruption occurred on 4 August at 0300. The eruption produced ash that traveled in two different directions; the first ash cloud rose to ~4.6 km a.s.l. and drifted NW; the second cloud rose to ~9.7 km a.s.l. and drifted NE.
Sources: Washington Volcanic Ash Advisory Center (VAAC); Associated Press; Reuters; Montserrat Volcano Observatory (MVO)
On 29 July ash from Soufrière Hills drifted W, leaving deposits as far away as San Juan, Puerto Rico, 450 km to the WNW. The Washington VAAC issued an advisory on 27 July stating that a steady stream of ash was emitted from the volcano through the evening, rising to 800 m. There was also a persistent, strong hot spot over the volcano's summit visible in satellite imagery. According to MVO, the amount of ash emitted from the volcano increased during 27 July through 29 July, and seismic activity rose on 29 July. Beginning at 1500 on 29 July heavy rainfall mixed with ash deposits and generated lahars that flowed NW down the Belham River. The lava dome that had been growing in the summit region of the volcano during recent years partially collapsed, generating pyroclastic flows that traveled down the E flank of the volcano and entered the sea. Shortly after 1700 observers reported seeing pyroclastic flows and a continuous dense plume of ash that drifted to the W. Dense meteorological clouds, associated with a tropical wave, crossed the island and prohibited ash cloud detection in satellite imagery or ground confirmation of the height of the ash cloud. MVO reported that the large amount of ash that was being vented from the volcano rose to below 6 km. By midnight seismic and pyroclastic flow activity returned to low levels. The next day AVHRR imagery showed possible ash in an area W of Montserrat and SE of Puerto Rico. The position of the cloud correlated with ground observations of ash and haze from Christiansted, St. Croix.
There were reports of substantial ashfall and sporadic falling of "stones" in the Montserrat residential areas of Salem and Olveston in the N part of the island. Ash also fell in the US and British Virgin Islands, Roosevelt Roads (Puerto Rico), Christiansted (St. Croix), and as far as 450 km away from the volcano in San Juan (Puerto Rico). The ashfall in San Juan and the surrounding area led to the closing of the San Juan International Airport on 30 July. The airport reopened the next day.
Sources: Montserrat Volcano Observatory (MVO); Associated Press; Reuters; Washington Volcanic Ash Advisory Center (VAAC)
The number of rockfalls increased (719) during 13-20 July in comparison to the previous week (297), although most of them were very small. Near-continuous rockfalls occurred on the S side of the lava dome, where dome growth was concentrated. Numerous pyroclastic flows originated from the S flank of the dome and moved eastward down the Tar River Valley. Several pyroclastic flows also originated from the W side of the dome and traveled short distances into the upper part of the Gages area. On 23 July at 1145 a pilot reported spotting an ash cloud approximately 800 m above the volcano. Satellite imagery at that time detected a faint ash-and-steam plume and an occasional hot spot.
Sources: Washington Volcanic Ash Advisory Center (VAAC); Montserrat Volcano Observatory (MVO)
During 6 to 13 July volcanic activity at Soufrière Hills remained similar to the previous week. Lava dome growth appeared to still be concentrated on the S side of the dome where near-continuous rockfalls occurred. According to the Washington VAAC, the rockfalls produced ash plumes that did not rise above 3 km a.s.l. and drifted to the W or WNW. An occasional hot spot was visible on satellite imagery.
Sources: Washington Volcanic Ash Advisory Center (VAAC); Montserrat Volcano Observatory (MVO)
During 29 June to 6 July volcanic activity at Soufrière Hills remained similar to the previous week. Lava dome growth appeared to still be concentrated on the S side of the dome above the White River. On 30 June a large number of rockfalls traveled down the N side of the talus apron in the Tar River. On 4 July two small pyroclastic flows traveled down the volcano's W flank in the Amersham area. The Washington VAAC reported that on 4 July an ash cloud rose ~3 km a.s.l. and drifted to the WNW. Also, on 10 July numerous rockfalls produced W-drifting ash plumes that did not exceed ~3 km a.s.l. in height.
Sources: Washington Volcanic Ash Advisory Center (VAAC); Montserrat Volcano Observatory (MVO)
During 15-22 June volcanic activity remained at about the same level as the previous week. The number of rockfalls increased in comparison to the previous week, while other types of seismic events generally decreased. Towards the end of the week the number of rockfalls also decreased slightly. Growth was still concentrated in the S sector of the lava dome above the town of Galway's. Small, near-continuous rockfalls occurred in the upper part of White River. Sulfur dioxide flux decreased slightly.
Source: Montserrat Volcano Observatory (MVO)
From 12 June to at least 15 June volcanic activity increased at Soufrière Hills in comparison to the previous week. There was a larger number of rockfalls, and hybrid and long-period earthquakes. Sulfur dioxide flux markedly increased (770 metric tons on 11 June and 1410 metric tons on 14 June). New growth was substantial in the southern sector of the lava dome and there was a large accumulation of new dome material SW of the dome in the upper reaches of the White River. The daytime entry zone was open for limited periods during the week. The Washington VAAC reported that at 0510 on 14 June a small ash cloud rose 3-4.5 km a.s.l. and drifted to the W and that low-level ash was emitted throughout the week. In addition, moderate rockfall activity produced ash to ~2 km a.s.l. and a hot spot was occasionally visible on satellite imagery.
Sources: Montserrat Volcano Observatory (MVO); Washington Volcanic Ash Advisory Center (VAAC)
Earthquake activity decreased through the week of 1-8 June. Good views of the lava dome were hampered by clouds, but observations of rockfall activity confirmed that the main growth area was still concentrated in the southern sector of the dome. Sulfur dioxide fluxes were higher on 4 June than 1 June, with an average daily flux of 320 tons per day, compared to only 130 tons per day on 1 June. The daytime entry zone remained closed.
Source: Montserrat Volcano Observatory (MVO)
MVO reported that during 25 May-1 June volcanic activity remained at high levels. There was a significant increase in long-period earthquakes, although most were small. MVO personnel observed an area of new growth in the S sector of the lava dome. Sulfur dioxide flux varied, but was generally lower than the previous week. The daytime entry zone remained closed.
Source: Montserrat Volcano Observatory (MVO)
MVO reported that during 18-25 May volcanic activity increased in comparison to the previous week. The main increase in activity occurred during 19 to 21 May when many large long-period and hybrid earthquakes were recorded. Low-level convective ash clouds generated during this increase in activity rose less than 2 km a.s.l. Observations confirmed that the main growth area was still concentrated in the S sector of the lava dome. A large volume of new talus had built out above the White River, to the S of the volcano, and on 24 May near-continuous rockfalls and small pyroclastic flows were observed. Sulfur dioxide flux increased, with an average of 700 metric tons per day measured on 21 May, considerably higher than the average flux during previous weeks of 100 to 200 tons per day. Due to the increase in activity the daytime entry zone was closed beginning on 21 May.
Source: Montserrat Volcano Observatory (MVO)
MVO reported that during 11-18 May volcanic activity increased, with about twice the number of rockfalls than the previous week. Most of the rockfalls were small and were observed to the SW of the summit, N of the town of Galway's. Growth of the lava dome was concentrated in the S sector of the volcano above White River. A new lobe of lava was observed in the area, although the rate of growth appeared to be low. Sulfur dioxide flux remained low. Most of Montserrat received very light ashfall throughout the week as a result of changeable winds.
Source: Montserrat Volcano Observatory (MVO)
MVO reported that during 4-11 May volcanic activity increased slightly, with more rockfalls and seismic activity recorded than the previous week and a small pyroclastic flow on 9 May. The pyroclastic flow traveled ~2.5 km S of the dome down the White River. There still appeared to be a very small amount of growth in the S side of the lava dome, and observation flights confirmed that most rockfall activity occurred in the dome's S sector. Sulfur dioxide flux remained low.
Source: Montserrat Volcano Observatory (MVO)
MVO reported that during 27 April- 4 May volcanic activity at Soufrière Hills remained low, although there was a slight increase during 28 and 29 April. An increase in rockfall activity occurred from 28 April to 1 May; there were 16 rockfalls on 29 April, 34 on 30 April, and 15 on 1 May. For the previous six weeks there had usually been less than 10 rockfalls per day. The increase in activity may have been due to heavy rain on 29 and 30 April. A very small amount of growth occurred on the S side of the lava dome, which was accompanied by occasional ash venting. Sulfur dioxide flux remained low. MVO warned that although activity is low, dangerous conditions can develop quickly and in the event of heavy rain the Belham Valley to the NE of the volcano should be avoided due to the possibility of mudflows.
Source: Montserrat Volcano Observatory (MVO)
MVO reported that during 20-27 April volcanic activity at Soufrière Hills remained low, with few rockfalls and little seismicity. A very small amount of growth occurred on the S side of the lava dome, which was accompanied by occasional ash venting. Sulfur dioxide flux also remained low.
Source: Montserrat Volcano Observatory (MVO)
MVO reported that during 13-20 April volcanic activity at Soufrière Hills remained low, with few rockfalls and little seismicity. A swarm of hybrid earthquakes occurred primarily during 0419 to 0741 on 20 April. A very small amount of growth occurred on the S side of the lava dome, which was accompanied by occasional ash venting. Sulfur dioxide flux also remained low.
Source: Montserrat Volcano Observatory (MVO)
MVO reported that during 6-13 April volcanic activity at Soufrière Hills remained low. Seismic and rockfall activity were low and there was a small amount of growth on the S side of the lava dome. Sulfur dioxide flux also remained low. MVO warned that although activity is low, dangerous conditions can develop quickly and in the event of heavy rain the Belham Valley to the NE of the volcano should be avoided due to the possibility of mudflows.
Source: Montserrat Volcano Observatory (MVO)
The MVO reported that during 30 March- 6 April volcanic activity at Soufrière Hills remained low. Like last week, seismic and rockfall activity were low and there was a small amount of growth in the S of the lava dome. Sulpher dioxide fluxes also remained low. The MVO warned that though activity is low, dangerous conditions can develop quickly and in the event of heavy rain the Belham Valley to the NE of the volcano should be avoided due to the possibility of mudflows.
Source: Montserrat Volcano Observatory (MVO)
The MVO reported that during 23-30 March volcanic activity at Soufriere Hills volcano was extremely low. Seismic and rockfall activity were low and there was a small amount of growth in the S of the lava dome. The MVO warned that though activity is low, dangerous conditions can develop quickly and in the event of heavy rain the Belham Valley to the NE of the volcano should be avoided due to the possibility of mudflows.
Source: Montserrat Volcano Observatory (MVO)
The MVO reported that during 16-23 March activity at Soufrière Hills remained at low levels. Most of the 84 detected rockfalls were small events and occurred on the eastern and southern faces of the lava dome. There has been a small amount of growth in the south part of the dome. Sulfur dioxide fluxes have also been low this week. Traverse measurements under the plume gave fluxes ranging between 120 and 190 metric tons per day for the three days of measurements.
Source: Montserrat Volcano Observatory (MVO)
The MVO reported that during 9-16 March activity decreased at Soufrière Hills volcano in comparison to the previous week, with the lava dome continuing to steadily grow. Seismic activity significantly decreased relative to the previous few weeks. Observations confirmed that most rockfall activity occurred to the S down the White River, with occasional rockfalls towards the E down Tar River Valley.
Source: Montserrat Volcano Observatory (MVO)
The MVO reported that during 2-9 March activity decreased at Soufrière Hills volcano in comparison to the previous week, with the lava dome returning to a steady growth rate. Early in the report week the banded tremor recorded the previous week died away, as did the associated hybrid earthquakes. Rockfall activity increased during the middle of the week, returning to more usual levels. The volcano appeared to have resumed steady dome growth by the end of the week. Observations confirmed that the main area of lava-dome growth had switched to the S of the dome on 25 February, which led to a concentration of rockfall activity in the upper portions of the White River Valley. Light ashfall from activity during the week was blown over the N of the island, although by the end of the week the wind switched back to the more usual direction towards the W. The Washington VAAC reported that throughout the week low-level ash clouds (up to ~3 km a.s.l.), presumably produced by rockfalls, and periodic hot-spot activity were visible on GOES-8 imagery.
Sources: Washington Volcanic Ash Advisory Center (VAAC); Montserrat Volcano Observatory (MVO)
The MVO reported that during 23 February to 2 March activity at the Soufrière Hills volcano increased with a marked change in the character of the seismicity, a change in the direction of lava dome growth, and moderate levels of pyroclastic flow activity. An unusually large number of hybrid earthquakes (388) were recorded during the week. On 24 February dome growth was concentrated on the NE side of the lava dome, but the next day the area of growth changed to the S side of the dome. After the change in activity, a small collapse occurred towards the SW down the White River Valley and produced small pyroclastic flows that stopped just short of the sea and started fires in Shooters Hill. Throughout the rest of the week rockfalls and small pyroclastic flows traveled to the top of the White River Valley, with only occasional ones traveling in other directions. This activity was accompanied by banded tremor and weak hybrid earthquakes. The Washington VAAC reported that throughout the week low-level ash clouds (up to ~3 km a.s.l.), presumably produced by rockfalls, and periodic hot-spot activity were visible on GOES-8 imagery.
Sources: Washington Volcanic Ash Advisory Center (VAAC); Montserrat Volcano Observatory (MVO)
The MVO reported that during 16 to 23 February activity at the Soufrière Hills volcano was similar to the previous week, as lava dome growth continued. The level of seismic activity was also comparable to last week. A large stubby spine was visible in the S part of the summit area on 22 February. The top of the spine was measured as 1,068 m a.s.l. and the main summit area was about 1,030 m a.s.l. New pyroclastic-flow deposits were emplaced towards the E, down Tar River as far as the old coastline, and to the S in the White River Valley as far as 50 m short of the coast on the new pyroclastic delta. Many rockfalls descended the NE flank of the dome into the upper reaches of Tuitt's Ghaut. The Washington VAAC reported that throughout the week low-level ash clouds (up to ~3.4 km a.s.l.), presumably produced by rockfalls, and periodic hot-spot activity were visible on GOES-8 imagery.
Sources: Montserrat Volcano Observatory (MVO); Washington Volcanic Ash Advisory Center (VAAC)
The MVO reported that during 9 to 16 February activity at the Soufrière Hills volcano fluctuated markedly, as lava dome growth continued. The level of seismic activity varied considerably, with a pronounced peak in activity during 10 and 11 February, which was followed by a gradual decrease in rockfall activity. Observations revealed that the two large spines that were visible on the volcano's summit the previous week had collapsed, and a large lobe had formed on the eastern face of the dome above Tar River. New pyroclastic-flow deposits were observed down the Tar River extending to the old coastline. Small-volume deposits were observed down White River to the S and in Tuitt's Ghaut to the NE. The Washington VAAC reported that throughout the week low-level ash clouds (up to ~2.1 km a.s.l.), presumably produced by rockfalls, were visible on GOES-8 imagery.
Sources: Montserrat Volcano Observatory (MVO); Washington Volcanic Ash Advisory Center (VAAC)
The MVO reported that during 2 to 9 February activity at the Soufrière Hills volcano was slightly higher than during the previous week as lava dome growth continued. Seismic activity remained similar to the previous week, although it increased towards the end of the report week. Rockfall activity was low during the beginning of the week, but significantly increased beginning on 6 February; only 9 rockfalls were recorded on 5 February, while 70 were recorded on 6 February. Brief observations revealed that volcanic activity remained concentrated on the E side of the lava dome and that two large near-vertical spines stood on the dome's summit. By 8 February new pyroclastic-flow deposits were emplaced at the head of Tuitt's Ghaut ~300 m to the N of the dome. The Washington VAAC reported that throughout the week low-level (up to ~2.1 km a.s.l.) ash clouds, presumably produced by rockfalls, and periodic hot-spot activity were visible on GOES-8 imagery.
Sources: Montserrat Volcano Observatory (MVO); Washington Volcanic Ash Advisory Center (VAAC)
The MVO reported that activity at the Soufrière Hills Volcano was lower than during the previous week, although the lava dome continued to grow. The level of seismicity was also generally lower. During the morning of 29 January a very low-energy swarm of 20 volcano-tectonic earthquakes occurred to the NE of the volcano. During the week, brief observations revealed that volcanic activity remained concentrated on the SE side of the dome. On 1 February, a small pyroclastic flow was observed in the White River Valley. It traveled ~1 km to the SE and produced a small ash cloud that rose to a maximum height of ~1.5 km a.s.l.
Source: Montserrat Volcano Observatory (MVO)
Activity at the Soufrière Hills volcano during 19-26 January was lower than the previous week, although the lava dome exhibited continued growth. Compared to last week, seismic activity was reduced and the number of rockfalls more than halved. Activity continued to be concentrated on the SE side of the lava dome, with a large slabby lobe extruded above the Tar River Valley, which is to the E of the volcano.
Source: Montserrat Volcano Observatory (MVO)
Activity at the Soufrière Hills volcano during 12-19 January was similar to the previous week, with continued growth of the summit lava dome and high levels of mostly low-energy rockfalls. The overall level of seismic activity remained high. Activity was concentrated on the SE side of the lava dome, although some new pyroclastic-flow deposits were seen to the NE of the volcano. The Washington VAAC reported that low level ash, presumably produced from rockfalls, was occasionally visible on GOES-8 imagery. Less ash fell across the N portion of Montserrat than during the previous week.
Sources: Montserrat Volcano Observatory (MVO); Washington Volcanic Ash Advisory Center (VAAC)
Activity at Soufrière Hills during 5-12 January remained elevated with continued growth of the lava dome and rockfalls. The broadband seismic network recorded 1,076 rockfall signals during the reporting period. Growth continued in the summit area with a large amount of debris being shed down the E face of the dome, although the focus of activity seemed to be on the SE side of the dome later in the week. A small amount of rockfall activity occurred down the S side, entering the upper reaches of the White River Valley. The results from a recent dome survey revealed that about 64 million cubic meters of lava have been extruded since 20 March 2000, an extrusion rate for March-December 2000 of about 3 m3/s. On 10 January, a series of static COSPEC scans of the volcanic plume gave SO2-flux values of 400-700 metric tons per day. On 11 January, measurements from a helicopter averaged 640 metric tons per day.
GOES-8 visible infrared and multispectral imagery interpreted by the Washington VAAC showed a low-level plume on the late afternoon to early evening of 9 January that was 9 km wide and extended 41 km WNW. An occasional hot spot was also detected on the 10th.
Sources: Montserrat Volcano Observatory (MVO); Washington Volcanic Ash Advisory Center (VAAC)
Activity at the Soufrière Hills volcano during 29 December to 5 January was similar to the previous week, with continued growth of the summit lava dome and high levels of rockfall activity. The overall level of seismic activity remained high. In addition, at 0406 on 5 January a regional earthquake was felt on Montserrat. According to the volcano observatories on Martinique and Guadeloupe, the earthquake's epicenter was about 40 km E of the island of Marie Galante, and had a provisional magnitude of 4.6. Marie Galante lies ~200 km SE of Montserrat. Lava dome growth continued, producing rockfalls predominately to the E, and to a lesser extent, to the S and W areas of the new growth. The spine growing atop the lava dome reached a maximum height of 1,052 m a.s.l. by the end of the report week. The Washington VAAC reported that throughout the week low-level (up to ~3 km a.s.l.) ash clouds, presumably produced by rockfalls, and periodic hot-spot activity were visible on GOES-8 imagery. Winds blew small amounts of ash to inhabited areas in the N and W of the island.
Sources: Montserrat Volcano Observatory (MVO); Washington Volcanic Ash Advisory Center (VAAC)
Activity at the Soufrière Hills volcano remained at an elevated level during 22-29 December, with continued growth of the lava dome and high levels of rockfall activity. The overall level of seismic activity remained high. Rockfall signals were often immediately preceded by long-period events, indicative of explosive onsets. This was confirmed by visual observations of vigorous ash venting prior to and during rockfall activity. Lava dome growth continued at the summit, producing rockfalls predominately to the E, and to a lesser extent, to the S and W area of the new growth. The spine that was growing on top of the lava dome reached a maximum height of 1,071 m a.s.l. The Washington VAAC reported that throughout the week low-level (below 2.4 km a.s.l.) ash clouds that were produced by rockfalls, and periodic hot spot activity were visible on GOES-8 imagery. Wind conditions during the week resulted in a small amount of ash being deposited in inhabited areas in the N and W of the island.
Sources: Washington Volcanic Ash Advisory Center (VAAC); Montserrat Volcano Observatory (MVO)
The Washington VAAC reported that throughout the week low-level (up to ~2 km) ash clouds that were produced by rockfalls, and periodic hot spot activity were visible on GOES-8 imagery.
Sources: Montserrat Volcano Observatory (MVO); Washington Volcanic Ash Advisory Center (VAAC)
Activity at the Soufrière Hills volcano remained at an elevated level during 8-15 December, with continued growth of the lava dome. Seismic activity was comparable to last week and the main focus of volcanic activity remained on the E flank. Near-continuous rockfalls and ash venting occurred from the summit area, producing ash clouds that traveled to the W of the volcano. GOES-8 imagery showed that the clouds did not rise above 3 km and that hotspots were occasionally visible. SO2 values were significantly lower than values measured over the previous 2 months.
Sources: Washington Volcanic Ash Advisory Center (VAAC); Montserrat Volcano Observatory (MVO)
The MVO reported that during 1-8 December volcanism continued at an elevated level, with continued growth of the lava dome. Seismic activity was comparable to the previous week. The main focus of activity remained on the volcano's eastern flanks, although some small rockfalls were observed on the western side of the new growth. Rockfalls and small pyroclastic flows regularly traveled to the NE down the upper reaches of Tuitt's Ghaut. The dome was observed intensely glowing. Spines continuously grew and collapsed on the summit of the dome, with the highest spine reaching 1,060 m a.s.l. Strong hot spots, and low-level ash clouds (<2 km a.s.l.) associated with the numerous rockfalls and pyroclastic flows were visible on GOES-8 imagery.
Sources: Montserrat Volcano Observatory (MVO); Washington Volcanic Ash Advisory Center (VAAC)
The MVO reported that during 24 November-1 December volcanism continued at an elevated level, with continued growth of the lava dome. Seismic activity was comparable to the previous week. Rockfalls were observed cascading down the E and S faces of the dome and new rockfall deposits were seen on the E side of the volcano in the upper portion of Tar River Valley. The crest of the lava dome was still dominated by a lava spine as it has been for several months.
Source: Montserrat Volcano Observatory (MVO)
The MVO reported that during 17-24 November volcanism continued at an elevated level, with the continued growth of the lava dome and a significant increase in the number of detected rockfall signals. The latter parameter more than doubled relative to the previous week. On the other hand, the number and energy of long-period earthquakes decreased. The lava spine that was growing on top of the lava dome was estimated at over 1,085 m a.s.l. on 17 November, but partially collapsed sometime during 18-19 November. Rockfalls and small pyroclastic flows traveled down the notch between the NE and N lobes of the 1995-98 dome. Ash clouds associated with this activity reached no higher than 3 km a.s.l. Towards the end of the week rockfall activity down the E flank decreased. The Washington VAAC reported low-level ash clouds visible during the week; these traveled to the NW and WNW.
Sources: Montserrat Volcano Observatory (MVO); Washington Volcanic Ash Advisory Center (VAAC)
The MVO reported that during 10-17 November, volcanism continued at an elevated level, with the continued growth of the lava dome on the eastern side of the summit region. The level of seismicity was higher than in the previous week, with a marked increase in the number of long-period earthquakes. The lava dome was still dominated by the extrusion of a large lava spine that had an altitude of 1,059 m a.s.l. on 12 November, and 1,077 m a.s.l. by 13 November, which was the greatest height that had been measured throughout the eruption. The spine appeared to be even taller on 17 November, but a direct measurement was not possible. The number of rockfalls and pyroclastic flows increased towards the end of the week. On 15 November a small pyroclastic flow traveled ~1 km to the NW down Tyre's Ghaut. On 17 November pyroclastic-flow deposits were noted in the upper reaches of Tuitt's and White Ghauts on the NE side of the volcano. This represented the first new dome material to have traveled down the notch between the NE and N lobes of the 1995-98 dome. Most rockfall activity occurred across the E face of the dome above Tar River. Ash clouds produced from pyroclastic flows and rockfalls did not exceed 3 km a.s.l and mostly traveled to the W across the exclusion zone. Many of the low-level ash clouds were visible in GOES-8 imagery during the week.
Sources: Montserrat Volcano Observatory (MVO); Washington Volcanic Ash Advisory Center (VAAC)
The MVO reported that during 3-10 November, volcanism continued at an elevated level and seismicity was slightly higher than the previous week. Dome growth continued and rockfalls occurred on the E side of the crater. Heavy rainfall on 4 and 8 November produced mudflows that traveled to the NW down the Belham River. During the 8 November rainfall, continuous rockfalls and low-energy pyroclastic flows traveled to the E down the Tar River valley. The pyroclastic flows generated ash clouds that rose to ~2 km a.s.l. and were blown to the N. On 13 November the Washington VAAC reported that a low-level (~1.5 km a.s.l.) ash plume that was blown to the N was visible in GOES-8 imagery.
Source: Montserrat Volcano Observatory (MVO)
The MVO reported that during 27 October-3 November, volcanism continued at an elevated level at Soufriere Hills and seismicity was slightly lower than it had been the previous week. Observations revealed that the lava dome within the summit crater continued to grow only on the E side of the crater. Toppled fragments of a spine that grew on top of the dome had a maximum elevation of 1,013 m a.s.l. Rockfalls, which were restricted to the E side of the dome, produced small ash clouds that drifted to the NW and deposited very light ash in populated areas of Montserrat.
Source: Montserrat Volcano Observatory (MVO)
Reports are organized chronologically and indexed below by Month/Year (Publication Volume:Number), and include a one-line summary. Click on the index link or scroll down to read the reports.
Small phreatic eruptions - the first in recorded history
The following is based on information as of 24 July from the Seismic Research Unit (SRU) team at the University of the West Indies and Volcanic Alert News Releases from the Montserrat Emergency Operations Center. The SRU maintains a seismic network on Montserrat (figure 1), currently composed of seven instruments.
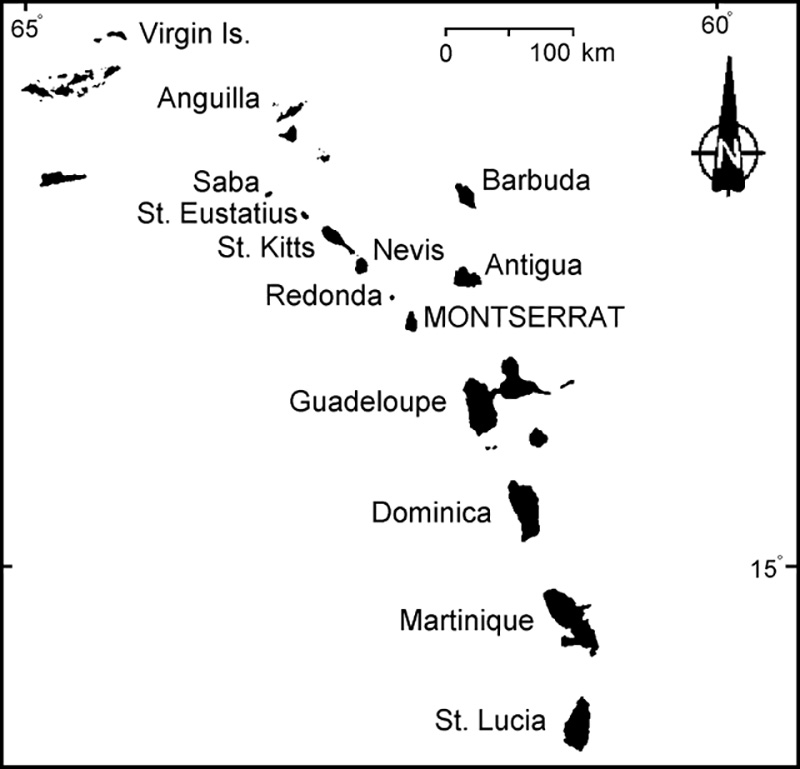 |
Figure 1. Index map showing Montserrat, the island where Soufriere Hills is located. |
On 18 July, villagers around Soufriere Hills volcano reported unusually loud rumbling noises coming from the fumarolic areas, light ashfall, and a strong sulfur odor. Following confirmation of these reports, an Emergency Operations Center, located in the capital city of Plymouth (on the coast ~4 km W of the summit), was activated and fully operational by 1830 that night. The Emergency Operations Center identified two schools as potential refugee centers, but no evacuation was ordered.
As of the morning of 19 July, based on conversations with Montserrat residents, SRU inferred that the initial explosion was small, phreatic, and only spread minor ashfall around the island. In accord with a small explosion size, the Synoptic Analysis Branch of NOAA saw no evidence of a plume on satellite imagery. Seismicity has been elevated since August 1992, and an earthquake swarm began on 14 July. However, no additional increase in seismicity was associated with the 18 July explosions.
An explosion earthquake at 0924 on 19 July was centered close to the top of Chance's Peak, the summit located on the W side of the crater rim. A field team led by Lloyd Lynch (SRU) trekked in from the N to make an initial inspection just after 1300. They reported minor explosions from an area SW of Tar River Soufriere (a fumarolic area ~1.5 km NE of the summit), explosions discharging from a vent within the summit crater between Chance's Peak and the Tar River area. The explosions took place at intervals of ~20 minutes, sending ash and steam ~40 m high. Based on these observations, no evacuations were recommended. Explosions continued that afternoon (figure 2).
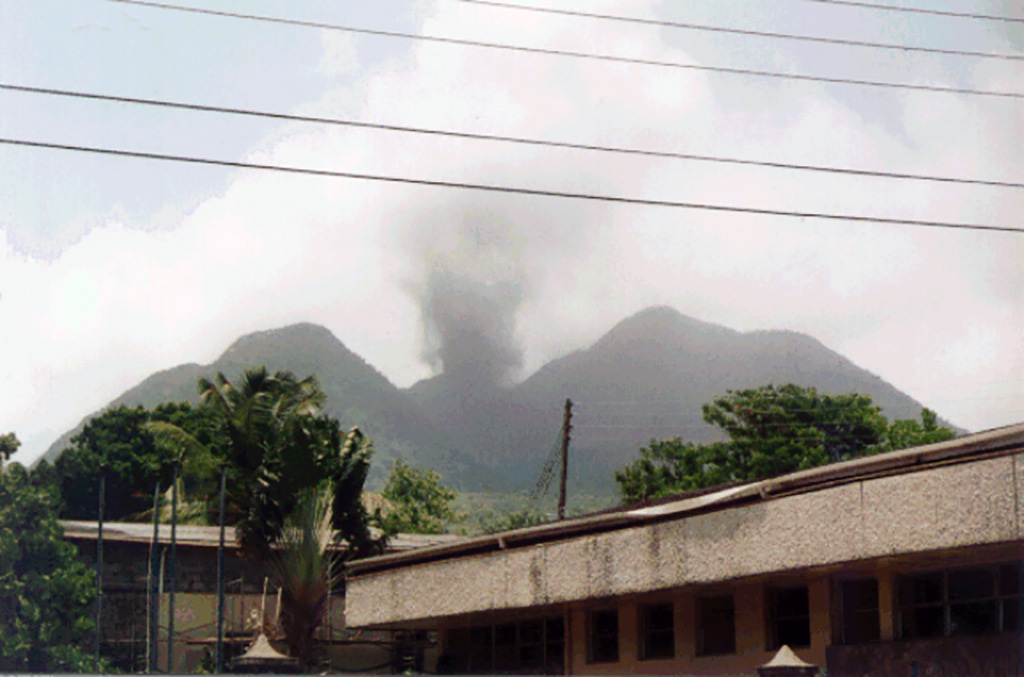 |
Figure 2. Photograph of Soufriere Hills volcano after a phreatic explosion between 1400 and 1500 on 19 July. View is from the center of Plymouth, ~4 km SW of the summit. Courtesy of Nicole and Adam Dennis. |
William Ambeh (SRU) led another observation team on the morning of 20 July to the Paradise Estate area (~2 km N of the summit), and additional monitoring equipment was installed in the Long Ground area (~2.5 km NE of the summit). Reconnaissance photographs taken from a Royal Air Force aircraft confirmed the early field reports. Later photographs taken from a Royal Navy helicopter indicated no increased activity in the Long Ground area.
The shallow earthquake swarm that began on 14 July ended on the 21st; depths were 2-4 km, and the largest event was M 3.5. Volcanic earthquakes were concentrated along the ENE and WSW areas of Lang's Soufriere. Phreatic activity continued on 22 July. Early morning ashfall was reported in Plymouth (~4 km W of the summit) and the SW-sector villages of Gages, Parsons, and Amersham. A small steam-and-ash eruption around 0800 lasted ~ 10 minutes. As of 1030 on 23 July, there was no new volcanic activity.
At the request of Montserrat, France sent two scientists (arriving on 25 July) to provide the SRU with technical assistance and additional equipment. They were joined on 26 July by five geologists from the U.S. Geological Survey's Volcanic Crisis Assistance Team.
Information Contacts: R. Robertson, UWI; Montserrat EOC; A. Dennis, Washington DC, USA.
Steam and ash emissions from two vents in the summit crater
Soufriere Hills volcano (figures 3 & 4) began erupting on 18 July from a fissure vent (Vent 1) within the summit crater (20:6). The initial small phreatic eruption spread minor ash around the island. The next day the airport on Montserrat issued a NOTAM after a reconnaissance flight at 0745 reported flying through volcanic ash. Seismicity and minor phreatic explosions continued in the following days (20:6).
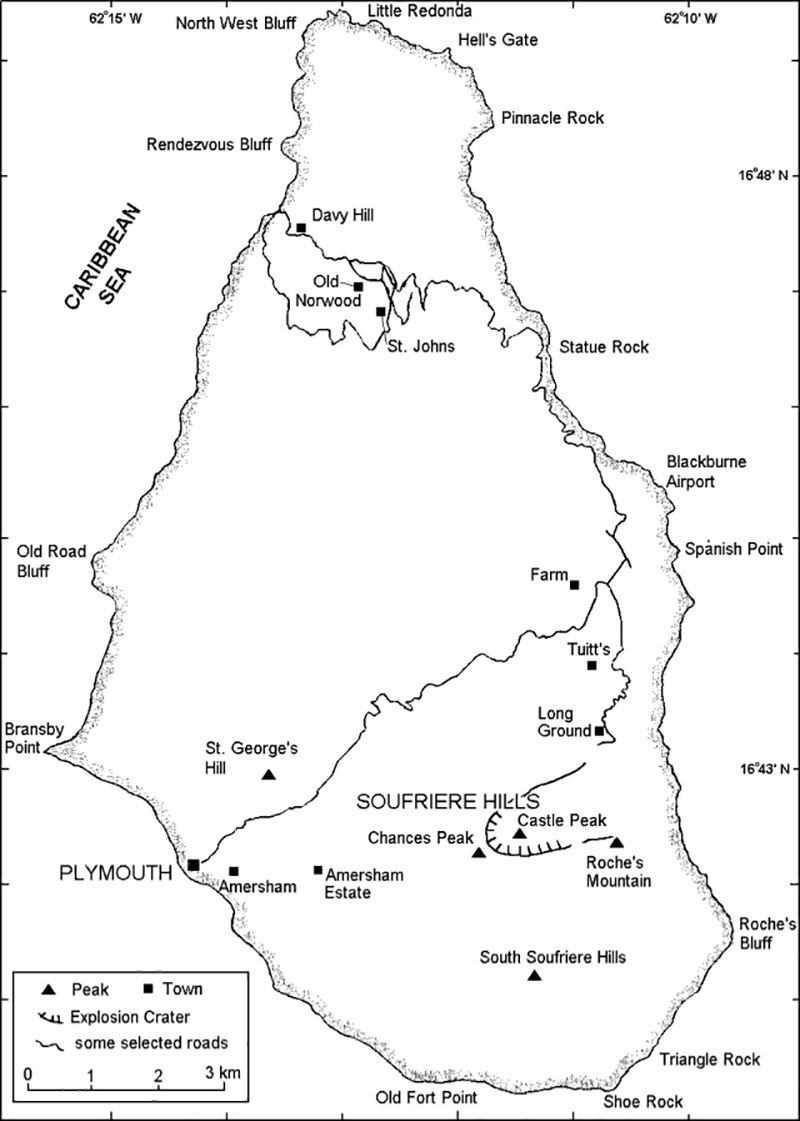 |
Figure 3. Map of Montserrat showing selected towns and features. |
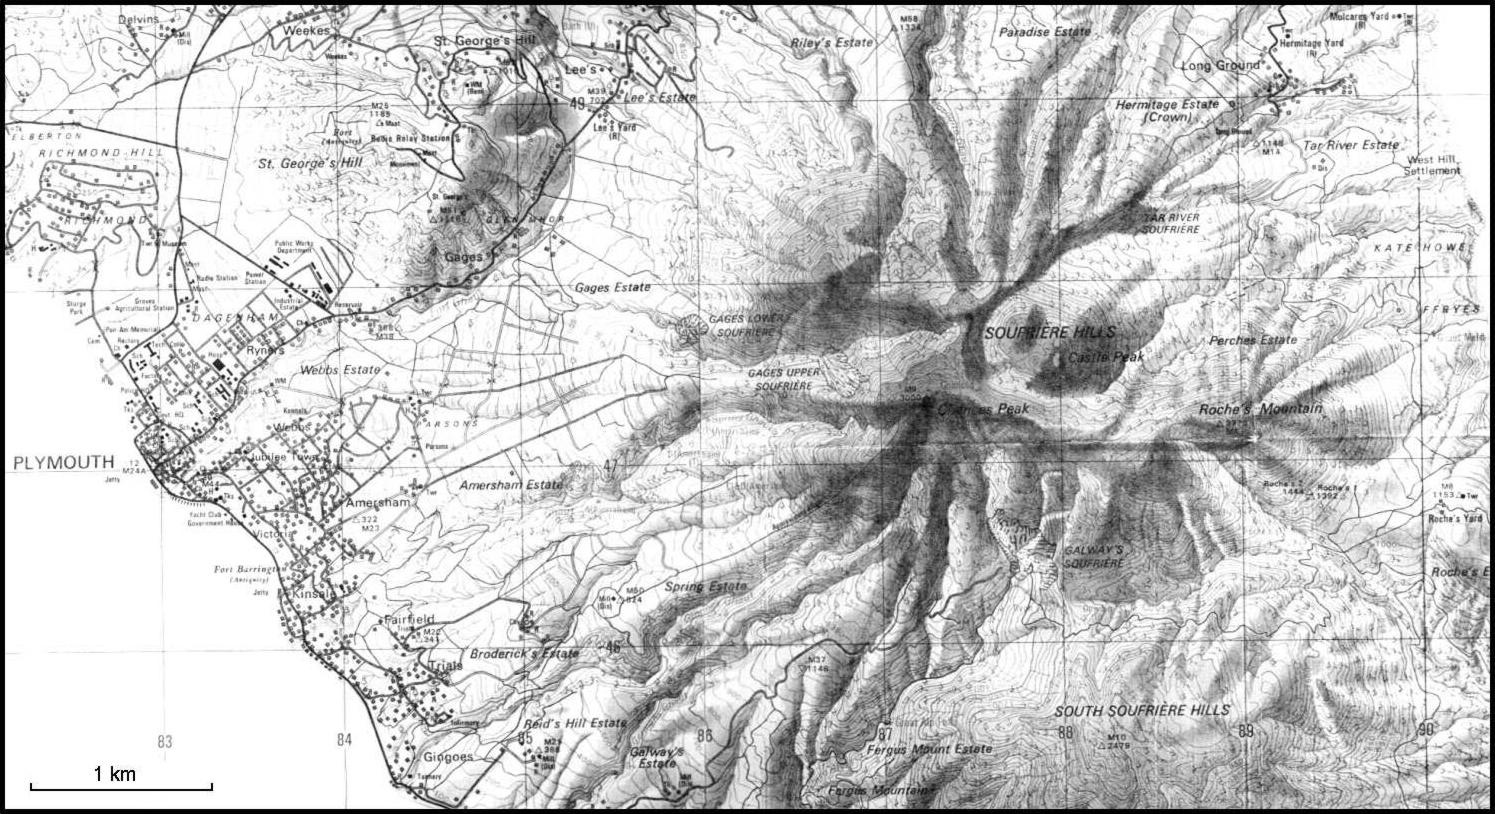 |
Figure 4. Shaded topographic map of Soufriere Hills volcano and the city of Plymouth. The summit is located on the SW crater rim at Chances Peak. Modified from the "Tourist Map of Montserrat" and reprinted with the permission of Lands & Survey Department, Plymouth, Montserrat. |
Another NOTAM on 26 July renewed the warning to aircraft and reported sporadic ash emissions. A second vent formed on 28 July (figure 5), and a third on 20 August. Gas samples taken in late July from fumaroles at Tar River and Galway's were unchanged from 1989. Samples of ash showed no juvenile components through at least 30 July. Seismicity in late July remained at about the same level as previously. A distinct odor of hydrogen sulfide (H2S) was detected in Plymouth . . . during late July, but sulfur dioxide (SO2) was not detected until 30 July.
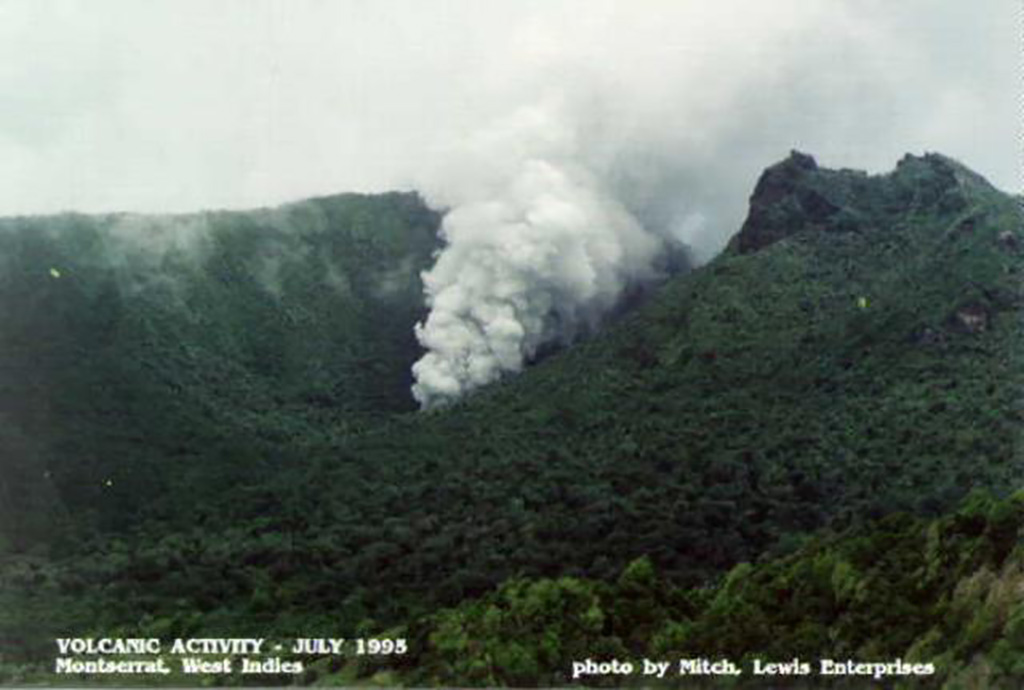 |
Figure 5. Photograph showing Vent 2 within the summit crater of Soufriere Hills volcano, 28 July 1995. View is to the WSW; the S wall of English's Crater is left of the vent. Castle Peak, to the right of the vent, is the youngest dome of the volcano. Courtesy of Mitch Lewis Enterprises and Tom Casadevall, USGS. |
Monitoring efforts. Monitoring of the eruptive activity and scientific advice to the Government of Montserrat are being provided by an international team of volcanologists. The first response to the crisis was provided by the Seismic Research Unit (SRU) at the University of the West Indies in Trinidad, which had maintained a seismic network on the island. Their team was later supplemented, at the request of Montserrat, by scientists from the U.S. Geological Survey (USGS), the Guadeloupe Volcano Observatory, and the United Kingdom. French scientists arrived on 25 July to sample gases. The USGS arrived on 26-27 July with additional seismometers, tiltmeters, and a correlation spectrometer (COSPEC).
The USGS team set up a seismic data analysis system to automatically locate earthquakes in near real-time, and made improvements to the existing seismic network. By 30 July, volcanologists were monitoring 10 channels of component signals from eight seismic stations; another station was added soon after. New telemetered tiltmeters at Spring Estate (2.5 km SW of the vents), Amersham (3.7 km WSW), and near Long Ground (2 km NE), were operational by 2 August.
Formation of Vent 2 on 28 July. A volcano-tectonic (VT) earthquake swarm that began at 0854 on 28 July lasted for >2 hours; instruments detected ~ 50 events of M >1. Coincident with this seismicity, a new vent opened SW of Castle Peak (Vent 2), along-strike with the fissure vent that had been intermittently active since 18 July. Vigorous jetting from the new vent at 1814 on 29 July, associated with ~ 22 minutes of tremor and earthquakes, occurred during heavy rainfall and was accompanied by a small mudflow. Following this episode, Vent 2 was estimated to be 1-2 m in diameter and was jetting steam and a small amount of fine ash ~ 100 m high with a loud roaring sound. During an overflight on 30 July Vent 1 was producing only wisps of steam, while Vent 2 continued to jet a large amount of steam and fine ash.
Because of increased steam emissions, on 28 July local authorities ordered an evacuation of the Long Ground area (figure 4). The evacuees returned to their homes the next morning. Two episodes of increased seismicity on 29-30 July caused no observable changes at the vent area. Small (mostly M
Low-level activity in early August. During 1-3 August there were fewer high-frequency, VT earthquakes, plus some long-period (LP) earthquakes. Preliminary locations for the LP events were at depths of 5-6 km, slightly deeper than the VT events. Emergent "cigar-shaped" signals, that probably correspond to vigorous steam venting, occurred a few times each day. Heavy rainfall on 3 August triggered a small, non-destructive mudflow during the night in a stream valley that runs through Plymouth. Normal infiltration of rain water may have been reduced by the relatively impermeable layer of fine ash that had accumulated on the upper slopes of the volcano.
Following 12 hours of unusually low seismicity, vigorous steam and ash emission began at 0852 on 4 August. This phreatic eruption lasted ~10 minutes, producing a dark, ash-laden column visible from most of the island. Seismicity associated with the eruption included several LP events. An aerial inspection revealed that the eruption had enlarged Vent 1 to ~10 m across and 10 m deep.
Concern was heightened after the phreatic eruption on 4 August and the increasing seismicity. As a precautionary measure, the elderly and infirm from the villages of Long Ground, Bramble Village, Bethel, Farms, and Trants were resettled on the N part of the island on 6 August. Aged and infirm in areas from Harris to Gages and N and S of the immediate area around Fort Ghaut in Plymouth, were also relocated to the N. Able-bodied residents of Long Ground were advised to move to shelters at night. Further restrictions may have been enforced during the next week.
Vent 2 was full of water on 5 August, apparently ground water forced from the volcano, and muddy water flowed from it through the Hot River drainage. On 6 August a large steam plume with minor ash rose from the vent area. By 7 August Vent 2 had grown ~ 20 m to the NW, in the direction of the 18 July fissure, the muddy water was gone, and jetting of steam and varying amounts of fine ash continued. The abscence of water emissions from the vent area after 7 August suggested that the volcano may have been "drying out," possibly due to increased heatflow.
Eighteen locatable earthquakes (M
Ground tilt recorded at Long Ground appeared to reverse on 5 August from steady deflation (down toward the vent area) since the station was installed, to apparent inflation (up toward the vent area). Vigorous venting on 6 August caused several microradians of tilt at two tiltmeters. Tiltmeters recorded small tilt events through 7 August, some of which seemed to correlate with periods of strong seismicity. However, there was no consistent pattern, suggesting that any deformation was relatively minor. A small tilt event occurred coincident with the 6-7 August seismic swarm.
Earthquakes declined on 9 August, but tremor caused by steam venting continued. At about 0715-0745 there was a relatively large steam venting episode. Vigorous steaming continued from Vent 2 on 10 August, but tremor intensity decreased and the number of small VT earthquakes increased to 1-2/hour. Most of the earthquakes were centered 2-5 km beneath the vent area. Seismicity was slightly lower during 10-11 August, with seven VT earthquakes, two individual low-frequency events, and three of four periods of continuous tremor lasting ~2 hours. On 10 August tilt appeared stable as measured by titlmeters and along a short leveling line near Broderick's Estate, ~3 km SW of the vent area, that was last measured ~10 years ago.
Reactivation of Vent 1. Vent 1 reactivated on 11 August and seemed to be emitting steam on the 12th. Steady steam emissions continued from both vents through 13 August. Seismicity was slightly lower on 11-12 August, with five small VT earthquakes and two periods of continuous tremor (~2 hours total). Increased gas venting around 1621 on 12 August triggered a swarm of VT events that continued into the next afternoon. The swarm consisted of >134 earthquakes, of which 38 were felt, the largest at around 0221 on 13 August (M ~3.5). Epicenters clustered 2-6 km beneath St. George's Hill (3 km WNW of the summit).
A mudflow from Vent 2 along the Hot River early on 12 August blocked the road for ~1 km between Tar River and Perche's Estates. Steady steam output from Vent 2 continued throughout 14 August. Steam emissions from Vent 1 were intermittent and occasionally changed composition. On 14-15 August there were three VT earthquakes, three B-type events, two low-frequency events, and five degassing episodes followed by tremor.
After three days of consistently lower activity (as of 11 August), daytime occupancy was recommended for able-bodied residents of the evacuated villages. However, the sick and bedridden were to remain at shelters. The reactivation of Vent 1 caused additional evacuations during 12-14 August from the previously mentioned villages, but able-bodied residents returned again on 15 August.
The seismographs recorded sustained low-frequency tremor from noon on 16 August through noon the next day. Degassing from Vent 2 continued at nominal to vigorous rates with occasional increases in acoustic intensity and changes in color of the output. Six of the 13 locatable VT earthquakes on 16-17 August were beneath Soufriere Hills; the others, including one felt strongly in Plymouth at 0143, were scattered within 4 km NE to NW of St. George's Hill. Vent 2 exhibited loud roars and intense venting coincident with heavy rainfall. The morning of 18 August was very overcast and inspection of the vents was not possible, but tremor continued, and there were six locatable VT earthquakes. During 18-19 August there was continuous low-frequency tremor and moderate emissions from Vent 2. Vent 1 was obscured for most of the period, but venting noise was generally low. Several low-amplitude extremely short-duration VT earthquakes on the Gages seismograph were buried within the background tremor signal, locatable events were generally 2-3 km beneath Soufriere Hills.
Tiltmeter observations remained within background noise level between 7 and 19 August. COSPEC measurements of SO2 flux taken from a helicopter after 30 July averaged 300 metric tons/day (t/d) until the morning of 6 August (table 1). After reaching a high of ~1,200 t/d on 6 August, values decreased and stabilized below an average of 200 t/d through 18 August.
Table 1. Summary of SO2 measurements at Soufriere Hills determined by COSPEC, 30 July-18 August 1995. Courtesy of the USGS.
| Date | COSPEC SO2 (t/d) | Comments |
| 30 Jul-03 Aug 1995 | 200-600 (average 300) | First flight on 30 July. Determined that the only plausible source is a degassing magma body. |
| 04 Aug 1995 | ~550 | Measurements spanned an episode of vigorous venting. |
| 06 Aug 1995 | ~1,200 | Morning measurement. |
| 06 Aug 1995 | ~250-300 | Later in the day. |
| 07-09 Aug 1995 | ~200 | -- |
| 10 Aug 1995 | ~245 ± 25 | -- |
| 11 Aug 1995 | ~190 ± 30 | -- |
| 12 Aug 1995 | -- | Wind not adequate for measurement |
| 14 Aug 1995 | ~150 ± 20 | -- |
| 16 Aug 1995 | ~163 ± 25 | -- |
| 17 Aug 1995 | ~111 ± 35 | -- |
| 18 Aug 1995 | ~180 ± 30 | -- |
An ash explosion on the morning of 20 August formed a third vent in the summit crater and prompted evacuations of up to 5,000 people. The observatory location was moved as a result, delaying the daily reports. Because this occurred near our deadline, details will be provided next month.
Information Contacts: VDAP, USGS; Seismic Research Unit, UWI; Montserrat EOC.
Two additional vents open in late August; steam-and-ash emissions
Eruptive activity . . . began with a phreatic explosion on 18 July that caused ashfall around the island (20:6). Formation of a second vent in the summit crater on 28 July and increased steam-and-ash emissions prompted evacuations from communities near the summit (20:7). Activity was variable but generally low in early August, with small mudflows and continued steaming. Vent 1 reactivated on 11 August, and some earthquakes were centered beneath St. George's Hill, 3 km WNW of the summit. Relatively heavy cloud cover and bad weather prevented observations on many days in late August.
Moderate emissions continued from both vents through 19 August (20:7). An ash-and-steam eruption from Vent 1 at 1220 on 19 August was similar in size to the two previous events that caused ashfall in Plymouth. The eruption lasted for ~35 minutes, during which a 10-minute-long phase of more vigorous activity deposited ~1 mm of ash in areas NW of the vent. Ashfall along the road between Lees and Gages has caused reduced traction; police were advising motorists to drive slower on the slippery surface.
Another small phreatic episode at 1657 on 20 August produced minor ashfall. Since the disappearance of continuous tremor on 19 August, seismicity consisted of low-intensity spasmodic tremor and occasional small volcano-tectonic (VT) earthquakes attributed to very shallow activities under the summit area.
Formation of Vent 3 on 22 August. Seismicity generally increased in frequency and amplitude until the largest single phreatic eruption episode to date at 0803 on 21 August produced a column to a height of ~2 km. Ash blown down the W flank engulfed Plymouth within eight minutes, caused darkness for ~25 minutes, and deposited an estimated 2 mm of ash. An analysis of the new ash showed that it consisted only of old altered material. Other reported phenomenon were projectiles in the Long Ground area and a density current in Gages. Over 70 locatable VT earthquakes were recorded between noon on 20 August through noon the next day; most of these events occurred before the 21 August eruption and were very shallow.
Following a contingency plan, the volcano observatory was relocated to the Vue Pointe Hotel in Old Towne (~ 4.5 km N of Plymouth) at approximately 1600 on the 21st; by 1730 all of the seismic instruments were back on-line. Seismicity was less frequent and vigorous through noon on 22 August, with only four eruption signals of smaller intensity and duration than the previous episodes. Over 5,000 residents were evacuated from the capital city of Plymouth to camps on the N part of the island. Day use was permitted, but restricted. Government offices were also relocated.
Six phreatic eruptions occurred between noon on 22 August and noon the next day. The largest, at 1551 on 22 August, produced ashfall ~3-3.5 km to the SW. This event was followed by three long-period (LP) earthquakes (events associated with the movement of pressurized fluids). When the crater area was visited on the afternoon of 22 August it was discovered that a new vent (Vent 3) had opened along the inside of English's Crater rim. Only 24 earthquakes were located during 21-23 August, all very shallow. Seismicity was comparable or slightly lower during the next twenty-four hours. There were six episodes of increased gas venting, some of which were followed by small VT events. Fifteen earthquakes, including two LP events, were located beneath Soufriere Hills at depths ranging from near-surface to ~5 km.
Aerial reconnaissance on the afternoon of 24 August showed a NNW-SSE trending line of several small explosion craters in the summit crater, with Vent 1 at the N end and Vent 3 at the S; Vent 2 was offset to the SE. The rate of steam emission from Vent 2 was very low, while slightly more steam was being emitted from Vent 3. No gas emission was observed from Vent 1. Seismicity continued to be relatively low, with seven earthquakes distributed beneath St. George's Hill and Soufriere Hills at depths of 0-4 km. Three episodes of increased gas venting and 30 minutes of broadband tremor also occurred. A small mudflow originating from Gages Upper Soufriere during heavy rains on the afternoon of 24 August flowed through Fort Ghaut. Seismicity remained low until a swarm of VT earthquakes that lasted from 2157 on 25 August until 0230 the next day. Located earthquakes consisted of 22 VT events at depths of 0-5 km beneath the N flank. Five episodes of gas venting during 25-26 August had repose intervals of ~4 hours.
Formation of Vent 4 on 27 August. On 27 August there was one episode of broadband tremor that lasted ~20 minutes and a small mudflow in Fort Ghaut that began around 0820. From 26 to 28 August, fourteen small VT earthquakes were located beneath Soufriere Hills and St. Georges Hill at depths of <5 km. During this same period there were twelve episodes of increased gas venting. One episode at 1443 on 26 August ejected ash that could be seen from the Vue Pointe Hotel; other emissions caused light ashfall in the Tar River area. Observations on the morning of 28 August confirmed the presence of a fourth vent that had probably opened the day before. Located on the NNE flank of Castle Peak dome, it was vigorously emitting steam and ash through mid-day on 28 August; emissions from the other vents were low. Eight VT earthquakes were located beneath Soufriere Hills at depths of 0-4 km. Five episodes of increased gas venting occurred.
Vent 4 was still emitting mainly steam at a reduced rate on 29-30 August. Another nine episodes of increased gas venting were detected, and five small shallow earthquakes were located beneath and to the N of the Soufriere Hills during 29-30 August. Unusually good visibility allowed Castle Peak dome to be inspected at around 0900 on 30 August. Steam emissions from all vents were low and there was no ash. The main vent system (a linear chain of vents extending from Vent 1 on the NW margin of the dome SE to the S margin of the dome) had enlarged since 24 August. Mud or muddy water was locally present in the bottom of the main vent system. Several pools of standing water were located atop Castle Peak, and the moat pond on the NW side of the dome still existed. A recent mudflow from the W side of the dome southward down the Tar River had buried Vent 2, on the S side of the dome.
In terms of earthquake activity, the 24-hour period beginning at 1400 on 30 August was probably the most active since the 21 August phreatic eruption. Thirty-four shallow earthquakes were located WNW of Soufriere Hills. A few earthquakes were also located beneath Windy Hill (3.5 km NNW) and in the area between Windy Hill and Soufriere Hills. Seismicity decreased the next day, when only ten shallow earthquakes were located WNW of Soufriere Hills; two were also located beneath Windy Hill. In addition, four LP earthquakes occurred at shallow depths beneath the NW edge of Soufriere Hills. During these two days, thirteen episodes of increased gas venting were detected, but steam and ash emissions from all vents remained low.
Deformation and SO2 measurements. A review of the Brodrick's dry-tilt data completed on 23 August indicated that some deformation of the volcano may have occurred between January and 9 August, confirming that magma may be at a shallow depth (as suggested by the earthquake data). Tiltmeter readings in late August were generally within background noise levels; no tilt related to volcanism was observed. EDM reflectors were deployed on 30 August in Gages Upper Soufriere and on Castle Peak dome.
COSPEC gas measurements taken on the afternoon of 20 August indicated that the rate of SO2 emission was just above the detection level, ~50 metric tons/day (t/d). Additional measurements taken during favorable conditions on the next afternoon and morning of 22 August did not detect any SO2. This lack of SO2 was thought to be a result either of the system running out of gases or a sealing off of the fluid access path to the surface. A COSPEC flight on the afternoon of 23 August detected a slight trace of SO2 (~ 40 t/d) while a flight the next morning showed none. The flux rate on the morning of 26 August was ~50 t/d, and on 28 August was ~85 t/d. Further COSPEC measurements on 29, 30, and 31 August showed no detectable SO2.
Information Contacts: VDAP, USGS; Seismic Research Unit, UWI; Montserrat EOC.
Phreatic eruptions continue; new lava dome in summit crater
Following the formation of Vent 3 and significant ashfall on 22 August (20:8), more than 6,000 residents of southern Montserrat were evacuated to safe areas in the N part of the island. Press sources estimated that by late August ~3,000 people had left for neighboring islands. Vent 4 opened on 27 August and produced mainly steam emissions with some minor ash through 30 August. Although seismicity was high from 30 August through 1 September, steam and ash emissions remained low (20:8).
From 0500 on 1 September through 0500 on the 3rd, only 19 shallow earthquakes occurred beneath the volcano. During that same period, 17 episodes of gas venting were recorded; at least six of those episodes produced some ash, and the two events on 2 September each decayed into a long-period signal of ~10 minutes duration. Venting continued to enlarge vents 2 and 3, but emissions from Vent 4 remained low. A helicopter observation flight on the afternoon of 2 September was in progress when an emission episode began at 1606 with increased steaming that developed rapidly into a small steam-and-ash plume. The emission occurred from a narrow part of the main group of vents that extend SE from Vent 1. Mud on the floor of the vent was expelled during the episode, forming a small mudflow that moved down the S side of the moat and over the area of Vent 2. A gas-and-ash emission at 1912 on 2 September, similar in size and duration to emissions in recent days, was widely observed because of clear conditions. Lightning associated with this activity lasted ~1.5 hours, and an SO2 odor was detected. Installation of a hardened EDM (electronic distance meter) station in the Tar River area was completed on 2 September.
During 3-4 September there were four gas-venting episodes, twelve volcano-tectonic (VT) earthquakes, and four long-period earthquakes. Aerial observations on the morning of 3 September revealed that the area around the S end of the main group of vents had been enlarged. The moat pond in the NW corner was still present, and fragmental material had collapsed into Vent 1. Afternoon observations showed no new mudflows, and the S moat appeared dry.
On the afternoon of 3 September, scientists at the volcano observatory completed an assessment of the current volcanism since 21 August and prospects for future activity. The rate of eruption signals increased slightly after 21 August, but the size of the eruptions did not. No change in the style of eruptions was anticipated, but areas downwind could be subject to ashfall and temporary darkness. Eruptions were thought likely to be concentrated along the linear vent chain on the W side of Castle Peak dome. The amount of shallow seismicity decreased below that prior to 21 August. SO2 flux remained near detection limits since 21 August. The rate of long-period seismic events showed no clear pattern, although a slight decrease may have occurred. Initial EDM results indicated no movement of the SE flank of Castle Peak dome or at a site in Upper Gages. Electronic tiltmeters have detected no large-scale deformation since they stabilized on 5 August. Ash samples analyzed through 27 August revealed no juvenile material.
The scientists concluded the following: ". . . eruptions to date have been entirely phreatic, with no direct evidence of magmatic involvement. So long as this behavior pattern persists, it only constitutes a significant hazard to areas within 1.5 km of Castle Peak dome and the areas S of White's Bottom ghaut. All ghauts [ephemeral watercourses] that originate on the flanks of the Soufriere Hills volcano are subject to flooding and should be avoided." Based on this advice, the government approved re-occupation of the areas immediately S of the Belham Valley River from which residents were evacuated on 23 August. All other residents from areas closer to the crater, evacuated since 21 August, were required to stay in the northern third of the island. Controlled entry restrictions were relaxed in most areas to allow residents to prepare for an approaching hurricane. Following passage of the hurricane, on 6 September the remaining evacuation orders were lifted.
Activity during 4-8 September was consistent at a low and generally declining level. At about 1530 on 8 September there was a significant steam explosion. Two hours later, at about 1730, two large ash eruptions produced a vertical plume that formed a mushroom cloud, which drifted to St. Peters (~30 km NNW) and to the N. Soufriere Hills continued to have intermittent swarms of earthquakes from the summit and nearby areas, including three events felt in Woodlands on 11 September. Occasional steam eruptions produced falls of fine ash in communities around the volcano, and morphological changes were continuing in the summit area. These developments suggested to volcanologists that magma was close to the surface under the volcano and that a magmatic eruption was still a possibility.
Two weeks later, on 25 September, a lava dome began growing in the W part of the moat near the linear chain of vents. An explosion between 1100 and 1200 on 27 September caused ashfall on the S part of the island, with minor ashfall also reported in the St. Georges area. Minor explosive activity continued through the end of September.
Information Contacts: Soufriere Hills Volcano Observatory, Plymouth; Seismic Research Unit, UWI; UNDHA; AP; Caribbean News Agency (CANA), Barbados.
Small ash explosions continue; three new vents form; September dome grows
The observatory was moved on 1 October from the Vue Pointe Hotel to Eifel House on Bishop View Road in Old Towne. A phreatic eruption that day deposited ash across a large area, including the capital city of Plymouth. This eruption was followed by a volcano-tectonic (VT) earthquake swarm, with 70 events located beneath the volcano at depths of 1-6 km. Two of the earthquakes, at 2257 and 2319, had magnitudes of ~2.5 and were felt at the observatory; several were felt in the Long Ground area. After about 0500 on 2 October, the number of located earthquakes dropped to ~5/day. Two episodes of low-amplitude broadband tremor recorded during 1-3 October were related to steam emission. Electronic tiltmeter and EDM observations during that time revealed no significant deformation.
EDM measurements at Tar River completed on 3-4 October continued to show a shortening trend, signaling minor inflation. Shallow VT (12 located events) and long-period (2 events) seismicity continued. Moderate levels of seismicity prevailed during 4-8 October, with 30-40 shallow (< 6 km depth) VT earthquakes each day, rare felt events (M 2-2.5), and a few long-period events. No deformation was detected by electronic tiltmeter.
An explosion around 2355 on 5 October caused heavy ashfall in Plymouth and in the SW part of the island. On 5 October the government announced that over the next two days they would evacuate Plymouth's home for elderly people and the hospital, sending residents to the N part of the island.
Two eruption signals were recorded at 0235 and 0347 on 8 October, and the EDM line at Tar River continued to show minor inflation. Seismicity began decreasing on 8-9 October, when 24 earthquakes were located beneath the volcano, with a few in the Centre Hills area. A small eruption at 1356 on 9 October generated light ashfall in Amersham and Upper Gages. Vent 2 was emitting a small amount of steam again during 7-9 October. Several episodes of broadband tremor may have been caused by increased steam emission. There were only 6 located earthquakes during 9-10 October, but several episodes of broadband tremor. Another minor eruption around 0012 on 10 October caused light ashfall in Plymouth. Visual helicopter inspection of the crater revealed significant steam emission and an increase in the size of the 25 September dome (20:9).
Formation of Vent 5 on 11 October. An ash eruption at 0021 on 11 October came from a new vent on the Tar River side of the Castle Peak dome, and damaged the EDM reflector at Tar River. A small earthquake swarm accompanied this vent formation. There were two more small ash eruptions later that day at 1540 and 1700. Although no significant changes to the dome were noted, steaming continued from its top; Vent 1 was also steaming, and appeared to be larger and deeper. Scientists noted that steam emissions from the crater had generally increased.
Three more ash eruptions occurred on 12 October, at 0901, 0955, and 1114. Continuous steam emission came from several areas in the crater and Vent 5. Two episodes of broadband tremor during 12-13 October were attributed to increased steam emission. Seismicity was low, with only 22 events during 11-13 October. No deformation was detected following this latest series of explosions.
Formation of Vent 6 on 14 October. An eruption at 0708 on 14 October created another vent on the NE flank of Castle Peak dome, generated a significant amount of ash, and ejected blocks as far as the edge of Long Ground, ~1 km E of the vent. A pilot reported that the plume may have reached ~2 km altitude. Another eruption at 1058 caused no reported ashfall. Two gas venting episodes at 2200 and 2345 on the 14th were associated with a small earthquake swarm and broadband tremor episodes. Vent 2 again emitted moderate amounts of steam, accompanied by a loud roaring sound, and Vent 5 continued to emit small amounts of steam. Seismicity decreased from 18 events on 13-14 October to five events accompanied by broadband tremor on 15-16 October.
Seismicity increased again on 16-17 October with 22 events clustered in two areas: one beneath the volcano and the other just E of Windy Hill. Steam-and-ash eruptions were recorded by the seismic network at 1757 and 2245 on 16 October, and at 1150 and 1522 on the 17th. There were also several episodes of broadband tremor and ~30 minutes of low-frequency harmonic tremor starting around 0414 on 17 October. Later that morning an aerial inspection of the crater showed no significant changes and little steaming. During a second flight at 1145, a large mudflow originating within the crater moat beyond Vent 2 was seen running rapidly down the Hot River and reaching the sea. This was probably the largest mudflow (in terms of volume of material) since the current activity began.
During 17-18 October there were 12 scattered earthquakes, several periods of broadband tremor, and some intermediate-frequency tremor. Ash eruptions were recorded at 1739 on the 17th and at 0530 on the 18th. The dome area continued to emit steam, but did not increase in size.
Formation of Vent 7 on 18 October. The 31 earthquakes during 18-19 October were clustered beneath the volcano. Several broadband tremor episodes and one period of low-frequency tremor were also detected. An eruption at 1621 on the 18th was associated with the formation of a new vent within the moat area of English's Crater, just SW of Vent 1. Another eruption was recorded at 2207 on the 18th. An explosive event around 1516 on 19 October generated a mudflow down the Hot River. During 19-20 October there were 28 earthquakes located; the events were scattered throughout S Montserrat, with some clustered beneath Soufriere Hills and St. Georges Hill.
There were 15 VT earthquakes on 20-21 October concentrated around the Long Ground/Soufriere Hills area. Several eruption episodes on 21 October resulted in ashfall that affected villages in the E. Ash fell at the airport for the first time, closing it briefly. No deformation was detected at the Tar River EDM or Long Ground tilt stations. Helicopter observations revealed that Vent 1 had extended E and was responsible for the previous ashfall. There was a small mud flow down the Tar River.
An average of 35 earthquakes/day occurred during 21-23 October. They were scattered throughout S Montserrat with some concentrations in the Long Ground-Tar River area and beneath the volcano. Some broadband tremor was also recorded. Visual observation of English's Crater both from helicopter and Tar River on 22 October revealed light steam emission from vents 2 and 5. When observed on the morning of 23 October, the September dome continued to steam, and was covered with sulfur deposits; it may also have grown since last observed on 20 October. Only one other small area SE of the dome was steaming. An eruption at 1337 on 23 October produced ash deposits within the summit crater and at Tar River. Steam emission increased after this eruption.
Seismicity decreased following this eruption to 10-14 events/day through 29 October, except for 22 events on the 27th. Locations were mainly beneath the volcano, although some were centered in the Windy Hill area and other parts of S Montserrat. An eruption at 1325 on 25 October caused ashfall in the Tar River area. Eruption signals were again recorded at 2314, 2321, and 2347 on 25 October, and at 0447 on the 26th; no ashfall was reported. Several episodes of low-amplitude broadband tremor were recorded during 25-26 October. EDM measurements at Tar River on 26 October indicated a continuation of the minor inflation observed during the past several weeks.
A steam-and-ash eruption at 1317 on 27 October from Vent 1 was followed by more than 30 minutes of low-frequency tremor. Eruption signals were recorded at 0855 and 2018 on 28 October, but no ashfall was reported. Steam emission from Vent 2 was observed that afternoon. Eruptions occurred again at 0326 and 0857 on the 29th, both followed by broadband tremor. An ash-and-steam plume was seen from the observatory following the 0857 event. Steam was seen coming from Vent 1 during a helicopter flight, but no major changes were noted.
Seismicity increased on 29-30 October to 55 events; most were clustered in a region just W of Windy Hill, with some scattered in the Centre Hills and Soufriere Hills areas. Eruption signals were recorded at 2110 on the 29th, and at 0244 and 1310 on the 30th. Two small long-period events were recorded after the first eruption. Ash from the first two of these eruptions was observed in English's Crater by helicopter. The third eruption, witnessed by scientists at the Tar River EDM site, produced a high column that caused ashfall over a wide area. This ashfall was the most significant since 21 August, and was accompanied by a density current of ash in the Gages valley. The morning of 31 October visual observations revealed a significant increase in Vent 1's size, but the 25 September dome appeared unchanged.
Seismicity decreased again the next day to 23 events, but they were located in clusters in the Tar River-Long Ground area and W of Windy Hill. There were also four long-period events and several episodes of broadband tremor. One eruption at 1118 on 31 October had no reported associated ashfall. EDM measurements at Tar River again showed a slight shortening, associated with continued slow inflation of the upper part of the volcanic edifice.
Only 14 seismic events were recorded during 31 October-1 November; most were located beneath the volcano with a few in the Windy Hill and Fox's Bay area. There were three long-period events and several episodes of broadband tremor. A small eruption at 1129 on 1 November caused ashfall within the summit crater.
Information Contacts: Montserrat Volcano Observatory (MVO), Olde Towne.
Dome building, minor ash eruptions
Although there was relative quiet during October (20:10), during the first 10 days of November three large phreatic eruptions occurred. Each of these eruptions blanketed Plymouth, 4.5 km W of the active vent, with ~2 mm of ash (table 2). Dome growth within the crater started on 16 November, the estimated date when juvenile material first reached the surface, and continued through at least December. Estimates of the dome's rate of growth from 16 November to 6 December were on the order of 0.5 m3/sec.
Table 2. Summary of the daily behavior of Soufriere Hills, 1 November through 11 December 1995. The table omits most geophysical and geodedic observations, however, "eruption signal" refers to seismically determined eruptions, and "mudflow signal" refers to seismically determined mudflows. Courtesy of MVO.
| Date | Events and Comments (local time) |
| 01 Nov 1995 | Ashfall (1129). |
| 02 Nov 1995 | Ashfall in Trails, Brodericks, and surrounding areas (0118). Explosions accompanied by light ashfall in Upper Gages and Chances Peak (1923). |
| 03 Nov 1995 | Mudflow (0254); Steam-and-ash emissions resulting in light ashfall in Parson's-Amersham and Plymouth (1122). Continued enlargement of Vent 1. Steam-and- ash emission (1122). No major changes in Castle Peak. |
| 04 Nov 1995 | Eruption signal (0247), no reported ashfall. Eruption signal; one eruption generated an ash plume reaching 2.5-km high; several millimeters of ash fell in Amersham-Plymouth and S of Plymouth (1725). |
| 05 Nov 1995 | Eruption signal (0139), no reported ashfall. Mudflow toward Fort Ghaut (0214). Minor eruption without visible ash or steam (1307). Eruption signal (2030). |
| 06 Nov 1995 | Minor mudflow (0410). Increase in the size of Vent 1. Ashfall, light (0347) in crater area and steam plume, 1.5-km high. Eruption signals (1044, 1809), no ashfall. |
| 07 Nov 1995 | Eruption signal (0123), no ashfall. Ashfall (0815). Eruption signals (2018, 2358). |
| 08 Nov 1995 | Eruption signal (0935). |
| 09 Nov 1995 | Ashfall, several millimeters accumulated in areas to the W and SW of the vent (Kinsale, Amersham, Plymouth, and Richmond) (0419). |
| 10 Nov 1995 | Eruption signals (0145, 0420, 1348). Plume of ash and steam (1535), 1.5-km high, blown SW. |
| 11 Nov 1995 | Mudflows in Gages-Fort Ghaut areas (0548, 0743). Eruption signal (0733), no ash emission. |
| 12 Nov 1995 | Eruption signal (0247), no ash emission. Steam emission from several new vents SW of main activity area. Old vent reopened S of Vent 1. |
| 13 Nov 1995 | Eruption signal (0600). Minor ash and steam (1603), blown N. |
| 14 Nov 1995 | Minor ash-and-steam emission (1610). Continued steam emissions from vents first observed on 12 November. Vent closest to Castle Peak greatly increased in size, surrounded by fresh ash. |
| 15 Nov 1995 | Minor ash-and-steam emission (0900-1000). Noise of breaking rocks, small landslides, venting heard from crater. |
| 16 Nov 1995 | Poor visibility but felt earthquakes, loud venting, rock-impact sounds, and light ashfall at Chances Peak (1500), with some drifting SW into the Broderick's area. |
| 17 Nov 1995 | Episodes of light ashfall in Amersham. Landslides had partially filled the Vent 1 crater. The September dome grew in height and extended toward Chance's Peak. Vigorous steaming at the two vents between Castle Peak and the dome. |
| 18 Nov 1995 | Occasional landslides at the edge of Vent 1. |
| 23 Nov 1995 | Noises heard from crater (rock breaking and small landslides). CO2 detected in the summit area for the first time. |
| 24 Nov 1995 | Noises heard from crater (as above). |
| 26 Nov 1995 | Confirmed emergence of a new spine adjacent to the September spine and close to Castle Peak. |
| 28 Nov 1995 | Sound of breaking rocks heard from crater. |
| 29 Nov 1995 | Sound of breaking rocks heard from crater. |
| 30 Nov 1995 | Confirmed lava dome within Vent 1. |
| 01 Dec 1995 | Dome slowly growing in Vent 1 crater; attendant ash emission and rock avalanches. A second area of dome growth identified NW of September spine. Two small ash clouds drifted towards Plymouth. |
| 05 Dec 1995 | Rapid increase in the size of and the number of cracks within the new (26 November) spine. Increased emission of steam and light ash of reddish color. |
| 06 Dec 1995 | Lava dome glowing, visible from the airport. |
| 07 Dec 1995 | Reddish ashfall (0929) accompanied a small explosion. Continued slow growth of lava dome. |
| 08 Dec 1995 | Lava dome had broken along cracks. Deformation continued in the area around the September and November domes. Ash cloud (1025). |
| 09 Dec 1995 | About 20 minutes of mudflow signal recorded at Gages seismic station (0434). Explosion with light ashfall (1419, 1520). Dome growth rate slowed. |
| 10 Dec 1995 | Mudflow signal recorded at Gages seismic station (2240). |
| 11 Dec 1995 | Rusty brown ash eruptions, ashfall W of crater (0910, 1455, 1530, 1604). No major dome growth detected. Steam emitted with variable intensity at a vent close to Castle Peak. |
Small rockfalls from the flanks of the new, locally incandescent dome were witnessed on several occasions. During early December, debris from a larger rock avalanche was seen in the moat of English's Crater. As of early January, neither local avalanches nor material liberated during the failure of spines escaped the crater area. The limited mobility of the rock avalanches suggested they were not propelled by gas explosions with great overpressures. Although floods and dilute mudflows were distinguished seismically, no significant debris avalanches or pyroclastic flows occurred.
Heavy rainfall after 11 December may have triggered several small ash emissions, depositing red-brown ash on the upper W-flanks. The ash presumably consisted of non-juvenile material, from rock avalanches sloughing off the new dome, and some hot juvenile ejecta from small explosions vented in or around the new dome.
Although quantitative SO2 flux measurements were lacking, as of early December related damage to vegetation extended ~3 km downwind and 1.5 km laterally. Tree damage was severe on the upper W flank. Gases sampled at three of the established fumaroles (soufrieres) around the volcano showed no change in composition. Although gas and acid aerosol production had been at enhanced levels from mid-November to early December, air sampled in Plymouth during early December contained very little SO2.
Dome growth.Beginning on 30 November, good visibility allowed observers to watch a single dome develop from two smaller bodies (figure 6). One body was NW of the September cryptodome (an intrusion that produces a surficial bulging), and the other at Vent 1. The evolving dome had a rough blocky carapace that initially had some small (
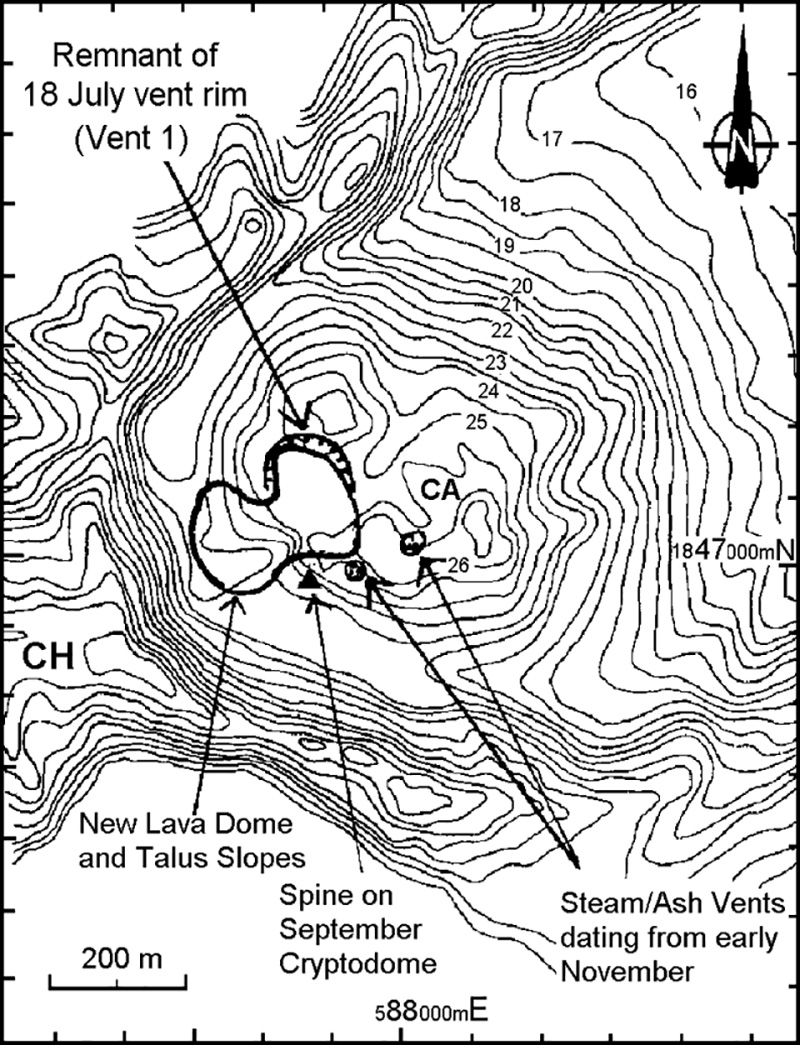 |
Figure 6. Topographic map of the crater area at Soufriere Hills showing pre-eruption morphology (thin lines) and new features (bold lines) as of 10 December 1995. Contour interval is 50 feet, values shown are feet x 100 (3.28 feet = 1 m); coordinates shown are UTM. CH indicates Chances Peak; CA indicates Castle Peak. Courtesy of MVO. |
A prominent spine on the new dome's E side grew in height until 7 December when it began to collapse. The spine's maximum vertical growth rate was estimated to be 5-8 m/day. Further dome growth at a slower rate occurred until 9-10 December, and slower growth, or a possible halt, continued as late as 13 December. On 13 December a small, radial crack on the N side of the new dome emitted steam and ash for most of the day. At least two columns reached in excess of 500 m above the crater rim.
A new batch of extruded material reached the surface on 15 December. On the 17th, in addition to widespread incandescence radiating from the new dome, observers saw a new ~ 40-m-tall spine. Between the 17th and 20th the spine grew vertically at 7 m/day, and the adjacent dome also rose, but at a slightly slower rate. The spine's growth rate during some undisclosed intervals reached up to 20 m/day. On 17 December observers also saw a narrow crack in the dome within Vent 1 that emitted glowing ejecta. Many small ash releases sent columns up to ~1.1 km above the summit.
During the week ending 27 December, several spines grew 5-10 m/day then subsequently collapsed. One spine had grown to ~15 m higher than Castle Peak (summit elevation ~910 m) prior to failing late on 25 December.
Explosions on 21 December produced a mildly convecting ash cloud that rose ~1.5 km above the volcano. Ash fell to the N, reaching the N portion of the island. Although apparently phreatic events took place in early- to mid-November, this was the most vigorous explosion since then and it may have been driven magmatically. Steam production remained constant during 21-27 December, feeding a plume that sometimes carried small amounts of ash. From 28 December to 3 January there was relative quiet and slow dome growth. Only 3 m of dome growth took place during the week, and for a least a few days after about 1 January, the dome may have ceased growing.
Deformation. Data from two electronic tiltmeters showed no significant changes during the crisis. Despite their stability, around 10 November deformation in the upper part of the volcanic edifice was recorded by EDM and GPS measurements at Castle Peak Dome and Chances Peak. Four days of significant deformation were followed on 15 November by intense seismic activity (see below). These were followed on 17 and 18 November by an upward extension of the dome that formed in September. The dome also appeared to have extended slightly towards Chance's Peak. Although visibility was poor for the next 10 days, glimpses through steam and cloud cover suggested further doming and rock avalanching. These processes influenced a wide area on the NW side of Castle Peak Dome, including the edge of Vent 1.
From mid-November until about mid-December, the rate of deformation remained very low, with daily shortening on the order of a few millimeters along most lines, even those aimed at the presumably less stable upper flanks.
The EDM data for 10-12 December showed lengthening of the lines to Castle Peak—a deflation of the edifice. Around this time, a longer interval of GPS data also showed their lines had lengthened by >1 cm overall (with some shorter-term variability). This rate was equal to or greater than the average rate during the month of October. Late December deformation measurements using GPS and EDM techniques suggested either a return to slight inflation (14-20 December) or stability (21-27 December).
Seismicity. Montserrat seismic activity falls into four categories: 1) tremor, 2) long-period events, 3) volcano-tectonic earthquakes, and 4) regional earthquakes.
After 15 November, elevated seismicity prevailed with relatively few quiet periods. The pattern appeared very similar to that seen in late September associated with the formation of a cryptodome and possibly associated with the later extrusion of a spine. The elevated seismicity was inferred to be due to a high-level magmatic intrusion.
After 27 November there was a loss of discreet, locatable events. Low-amplitude tremor became intermixed with intervals of intense, low-amplitude, long-period events; these arrived at rates of up to 5/minute but were recorded only on the closest seismic station (MGAT, Upper Gages, figure 7). In early December tremor increased somewhat at other stations farther from the crater (MLGT, Long Ground, and MBCT, Bethel); at this time amplitudes of events at Gages also increased and the RSAM seismic index rose as high as it has been since 15 November.
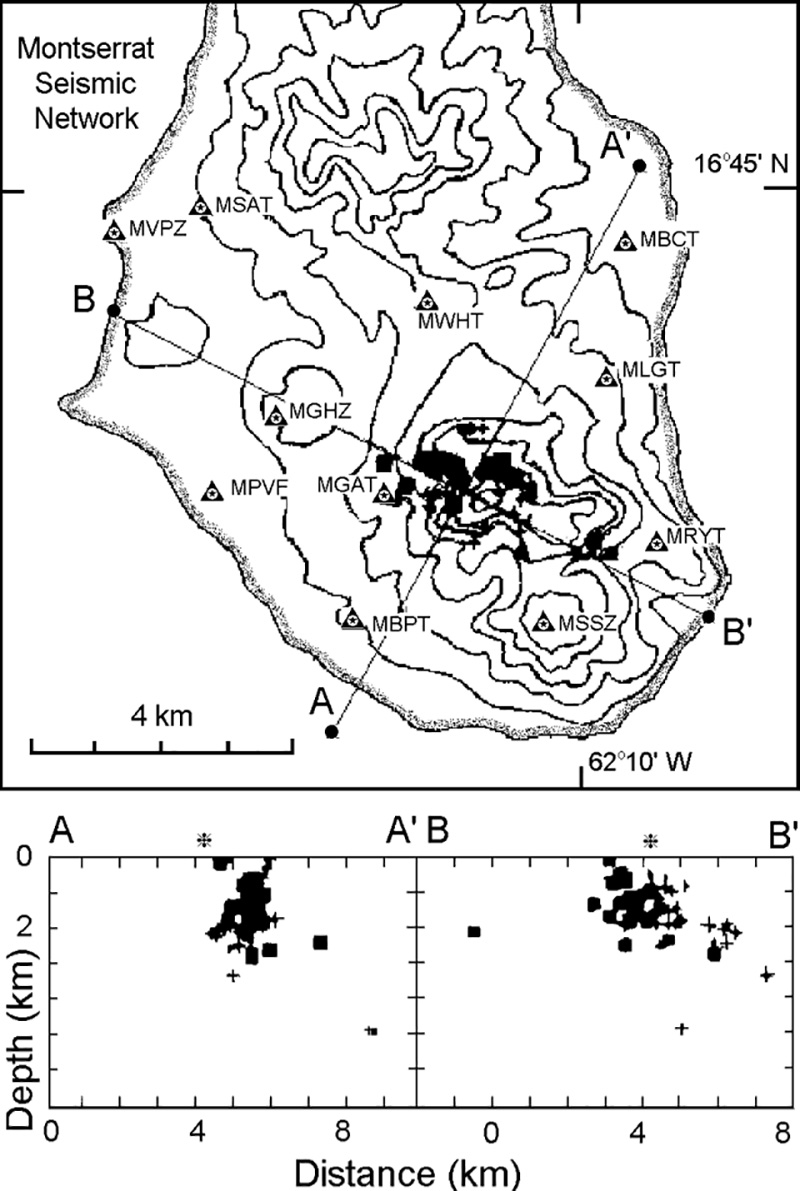 |
Figure 7. Montserrat seismic stations and epicenters shown in map and cross-section views, 10 December 1995. The intersection of the two cross sections is indicated by an asterisk. Epicenters are shown with two symbols, indicating variations in data quality (square, A and B quality; cross, C and D quality). Stations MSAT and MPVF were off line; MVPZ and MSSZ were 3-component stations. Courtesy of MVO. |
Until 9 December there were also small, frequent, long-period earthquakes. These were accompanied by low-to-variable amplitude tremor at the Gages station, but tremor disappeared from all other stations by 8 December. The number of locatable earthquakes dropped to 1-2/day, the lowest observed during this crisis. Located earthquakes were mostly volcano-tectonic and at slightly greater depths (0-5 km) than the long-period and hybrid-type earthquakes that had dominated since 24 November. High-amplitude, high-frequency tremor was recorded at station MGAT for several hours during 10-11 December; this was probably due to an increase in steam venting from several areas on Castle Peak.
The dome grew during the week ending on 13 December, with few accompanying earthquakes early on 6 December. In contrast, during 14-20 September there were 2-20 locatable earthquakes/day, many with epicenters along the N flanks at depths of 0-6 km. During the week ending on 20 December all stations registered earthquakes with emergent onsets and a dominant frequency of 2.2 Hz; these took place 5-15 times/day. Some of the earthquakes corresponded to small explosions. Heavy rains on 16-19 December triggered floods and dilute mudflows who's acoustic signals were detected by the seismic network.
Information Contacts: MVO, Plymouth; Seismic Research Unit, UWI.
Dome growth continues
The dome continued to extrude in the breached summit crater. During January, subtle to dramatic variations occurred in the location, style, and rate of growth (with some areas undergoing up to 1-m vertical rise per day). Numerous spines grew, fell, and shattered. Besides obtaining the first samples of the new dome, fieldworkers established that the emplacement of the old dome (Castle Peak) was accompanied by one or more pyroclastic flows and lahars. The total seismic energy release for the last week of January was the highest since early December. Cumulative deformation measurements suggested inflation of the edifice.
Dome growth and visible observations. On 28-30 December 1995, the dome's E side grew 3 m upwards. Local avalanches accompanied this growth, but by 1 January both the growth and avalanches in this area temporarily slowed to a stop. Adjacent Castle Peak, on the new dome's S side where a small spine had formed on 26 December, volume increased without vertical growth in the week ending on 3 January. During that same week, significant steam escaped near the N part of the dome; the nearly continuous steam plume was sometimes charged with small amounts of ash.
Although dome growth appeared slow during part of the week ending on 10 January, it did not cease. Observers noted local avalanches (off both the dome's N and E sides) coupled with suggested swelling and new lava extrusions in the dome's central region. During this same week, the September spine appeared to move and tilt, and in the subsequent week the spine was pushed S by new dome growth. A new spine was identified on 10 January in the dome's center; this spine grew relatively rapidly until it fell down on 13 or 14 January. Other spines on the new dome also appeared to undergo a growth spurt.
Another spine appeared just after 14 January in the N dome area. Large parts of this spine had fallen by 18 January, possibly contributing to airborne ash seen on two occasions that day; the next day large blocks of the broken spine lay on the talus slope. Yet another spine appeared around 18 January along the S edge of the dome; it grew for two days prior to fall and breakup. Spalling material created a substantial talus pile in the S moat. On 20-21 January another spine grew in roughly the same spot. During the next two days this spine reached 25 m in height and 15 m in basal diameter prior to its partial collapse (an event correlated with significant ash emission on 23 January). Late in the week ending on 24 January, growth of the dome's S edge included growth of spines, spalling debris, slow swelling, and vertical growth.
Steam emissions were generally high during mid-January, and observers first saw new dome material piling up against the crater's W wall at the base of Chances Peak. The other side of the new dome extended a formidable distance up Castle Peak.
The most pronounced dome growth in the final week of January took the form of swelling on the dome's steeply sloping N margin. Although early in the week mass wasting repeatedly sent debris into the adjacent moat, later in the week this took place less frequently. On 26 January a spine was again noted in the dome's S area, but growth there on 28 January was manifested as swelling. Beginning on about 29 January on the N and S ends of the new dome observers saw two elongate ridges trending NE-SW. These appeared as rough mirror images of each other, their forms resembling whale backs.
Lofted ash and mass wasting. Airborne ash seen during January was mainly attributed to mass wasting. For example, a small amount of ash fell in Plymouth early on 4 January; the source was thought to have been a crater-confined rock avalanche off the dome. Minor ash fell in Plymouth four times on 12 January, and one time on both 15 and 16 January. Four ash emission events on 24 January were all associated with major rock-fall events on the lava dome. In some cases very minor ash emissions also issued directly from the dome and some of the material involved in mass wasting may have been dislodged by small explosions.
Visual observations into the crater have enabled good correlation between seismic signals and rock-fall events. During the week ending on 24 January, heat production from the dome appeared somewhat higher than in the past. During January dome incandescence was reported and some material within the rock falls was hot. Rockfalls and avalanches remained confined within the crater area, although the moat continued to gradually fill with debris.
Field studies. Good conditions on 8 January enabled the collection of a sample from the part of the new dome located within the 18 July vent, an area thought to have been extruded in late November. The crystal-rich sample contained dominant plagioclase, subordinate pyroxene and hornblende; parts of the sample were sent to four labs for further analysis.
Around the same time, other fieldwork in flanking drainages (Hot River and Fort Ghaut) found new exposures and established that several charcoal-bearing pyroclastic units (including at least one pyroclastic flow unit) were erupted during the growth of Castle Peak dome. These were also found adjacent to deposits having the character of lahars.
Deformation. EDM lines composed a network consisting of four surveyed triangles around the volcano. The lines continued to be measured routinely. Dry-tilt sites at Amersham and Brodericks on the volcano's W side were re-occupied during the early part of the week ending 10 January; neither showed any change since their last occupation in October. During January, the Spring Hill tiltmeter failed and was moved to a new site, but the Long Ground tiltmeter continued to indicate angular stability.
Looked at in the short term, EDM measurements taken during the first half of January did not show any changes in slant distance (above the error of the method); however, during the week ending 17 January it was reported that a slow shortening had occurred on many of the lines towards the volcano. The shortening indicated swelling of the edifice.
In the week ending on 24 January, it was reported that slant line distance in the NE sector (Tar River to Castle Peak area) underwent a 2.5-cm shortening over the period of a month. During the shorter interval of the final week of January, no changes above the error of the method were detected in slant distance measurements on two deformation triangles in the volcano's S to SW and NE sectors (the Galways-Chance's Peak-O Garra's and Long Ground-White's Yard-Castle Peak triangles).
Seismicity. During January, broadband tremor commonly registered on the Gages station. Tremor was generally absent at the other stations, although the Long Ground station also registered some tremor in mid-January. The number of daily earthquakes typically measured in the thousands (eg. 5,000 to 6,000 events at the closest station on 27 January), too numerous to count on a real-time basis. Instead, MVO often quantified seismicity for rapid dissemination by using located events. These are events for which a hypocenter (the earthquake focus, the point at which the first motion originates) was calculated based on one S-wave and the records from four stations.
An MVO report on 3 January stated that long-period events recorded at most seismic stations had been occurring at a rate of 10-15/day. The hypocenters for these events could not be found but they were thought to be at very shallow depths in the crater area. Later reports in January did not quantify the rate of occurrence for long-period events.
Late on 5 January, broadband tremor picked up slightly in amplitude at Gages station. Then, small long-period events occurred for about the next 12 hours. This was followed by an 8-hour swarm of >300 hybrid events with virtually identical waveforms <3 km beneath the volcano. Lower amplitude, regular hybrid events occurred every 1-2 minutes until 8 January. A smaller series of similar hybrid events took place on 12-15 January. Some initially small hybrid events that first appeared on 23 January grew in amplitude and rate of occurrence (to 6-7/minute) and continued until at least 31 January. During the last week of January these hybrid events formed the dominant seismic activity. repeated shallow hybrid events in early January within the crater preceded new dome growth by a few days. This had happened on at least two previous occassions.
During the first week of January, shallow (0-7 km depth) volcano-tectonic earthquakes with epicenters scattered around the volcano continued at a rate of 2-3/day. An exception was 1 January, when a cluster of 17 volcano-tectonic earthquakes took place just N of the active crater at 1-3 km depths. They occurred in an eight-hour period following an M 5.0 earthquake that struck at a depth of 25 km, centered ~55 km N of Port of Spain, Trinidad. This larger earthquake may have been the trigger for the 1 January seismicity.
Three small, 1-3 km deep, volcano-tectonic earthquakes struck SW of the island during mid-January. Very occasional, small, long-period earthquakes started to appear on the evening of 28 January and a solitary volcano-tectonic earthquake took place early on the 29th. This M 2-2.5 earthquake was located beneath the crater area at a depth of 2.8 km; it was felt by Long Ground area residents.
Crisis management. The eruption driving the current crisis began on 18 July 1995 (BGVN 20:06). According to the Montserrat Government Information Unit (on 13 February 1996), during the crisis there has been no official off-island evacuation. However, a phased relocation of 6,000 residents from the southern half of the island to the northern half immediately followed a large phreatic eruption on the morning of 21 August 1995. Ash from that eruption's cloud, and from a density current that flowed down the flanks of the volcano, caused darkness in the capital (Plymouth) and surrounding areas, and ultimately deposited several millimeters of ash there. The relocation order was partially lifted on 3 September, a day before the passage of Hurricane Luis.
A change in eruptive style in mid-November ultimately lead to the extrusion of lava at the surface. On 1 December 1995 a second relocation of 4,000 residents took place. The relocation lasted a month for residents on the island's SW side and about a month-and-a-half for those on the island's SE side. Some preparatory steps for future emergencies included the continued relocation of Glendon Hospital and newly acquired school buses to move residents.
Information Contacts: Montserrat Volcano Observatory (MVO), c/o Chief Minister's Office, PO Box 292, Plymouth, Montserrat.
Increasingly rapid dome growth
As reported in Montserrat Volcano Observatory (MVO) Scientific Reports, during February the growing dome became higher than Castle Peak and was visible on the volcano's W margins. Based on qualitative estimates, during the third week of February and early March the dome's growth probably reached the highest rates seen since extrusion began around 16 November 1995 (BGVN 20:11/12).
Dome growth and visible observations. As the dome enlarged, the focus of its growth migrated. During 1-7 February the dome's N side grew upward, and the S side grew outward. The dome's N side first became visible from the volcano's W margins beginning on 31 January. Under clear conditions on 2 February it was confirmed that this side of the dome had grown higher than Castle Peak. On 4 February this side of the dome reached a height equal to adjacent parts of the crater wall; talus from the dome's N side filled the adjacent moat and began piling up against the crater wall.
Although low cloud cover generally hampered visibility during the week of 8-14 February, observations around 9 February indicated slowed growth on the N and S coupled with a shift in the focus of activity to the dome's W side. On 11 February a spine was seen in the dome's central sector; its height then was equal to the dome's N side. That day, talus made contact with the crater wall around much of the dome. On 12 February a late morning helicopter flight allowed observers to see a small pyroclastic flow created as debris from the central dome avalanched S. Later in the week, growth took place on the dome's SE side and, in the form of two new protrusions, on the dome's W side.
A second consecutive week of low cloud cover occurred, 15-21 February, and by the end of this interval it was learned that the dome's SE side included a large whaleback-shaped lobe. This new lobe grew to reach the size of the southern whaleback, a lobe emplaced around 19 January (figure 8). The new lobe (not shown on figure 8) was the source of comparatively few rockfalls, and therefore was considered to be relatively massive and coherent. In contrast, frequent rockfalls fell down off the dome's central region and NW side and by the end of the week this area became the focus of growth. The moat's W margin, at the base of Gage's wall (figure 8), received considerable debris. Previously, this area had been the last part of the moat's W margin without appreciable debris.
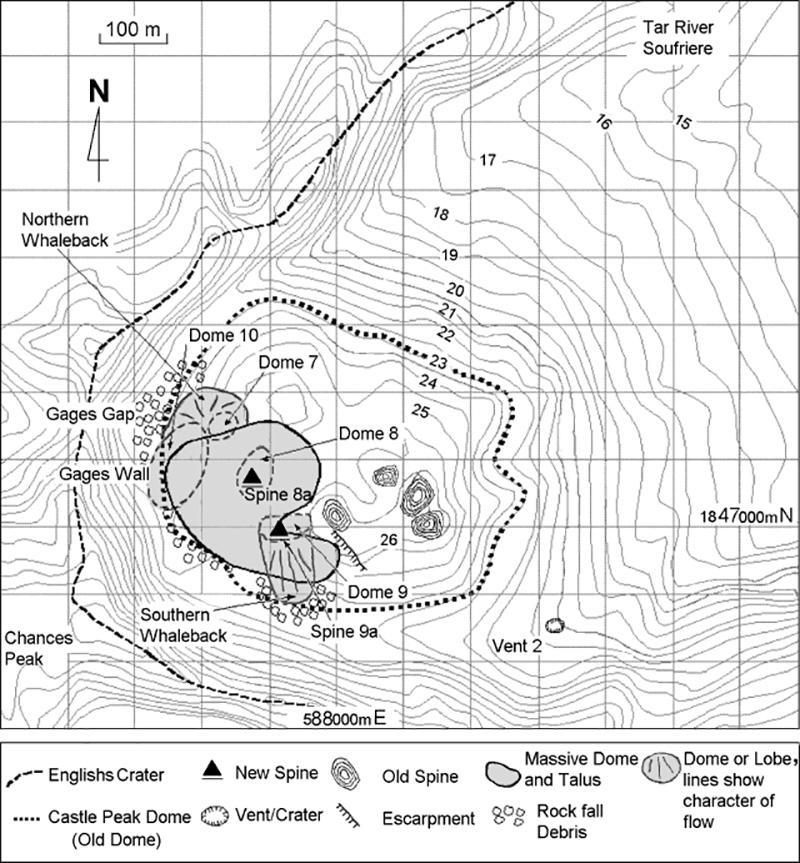 |
Figure 8. Soufriere Hills dome map for 25 December 1995 through 31 January 1996. Contour interval is 50 feet; values shown are in hundreds of feet (100 feet = 30.48 m). Although contours are unavailable for areas on the new dome, during February it had reached higher than the old Castle Peak dome and was visible through Gages Gap on from the W slope. Courtesy of MVO. |
During the week of 22-28 February, the dome growth rate, which was estimated qualitatively, may have been the highest since extrusion began. High steam and gas fluxes also prevailed. Although the resulting plumes thwarted aerial photo-documentation, the dome grew in both vertical and horizontal directions. Semi-continuous rockfalls from specific zones indicated growth in a pattern similar to the previous week. Specifically, most 22-28 February rockfalls came from the dome's central region, as well as its NW, and to a lesser extent, SE sides. A gas sampling visit on 27 February revealed extensive gas escaping from areas on and surrounding the dome, but the primary vent identified was still the 18 July one (see map, BGVN 20:11/12). At this vent escaping gases were 720°C and red-hot rock was seen ~2 m below the surface.
During the week of 29 February-6 March rockfalls from the new dome were abundant, especially from the SW and NW sides; qualitative estimates suggested the highest rate of growth yet seen. Similar to the previous several months, during February and March ash clouds were produced by rock avalanches. A large avalanche on 1 February detached from the dome's S side resulting in a small convective cloud that deposited fine-grained ash on Chances Peak.
Higher than normal amounts of acidic aerosols were noted in the upper Gages valley and through the first 3 weeks of February. During the last week of February, however, the plume rose higher so there was typically less volcanic fog near the ground. During the first week the largest steam emissions came from the dome's top central region. As a result, brown acid burns on vegetation reached as far as Plymouth and Richmond Hill (~5 km W) and some residents suffered irritations.
Rain water sampled during 1-8 February in the Gages valley had a pH of 2.5 and contained sulfates, <3 mg/l; fluorides, 1.5 mg/l; and chlorides, 106 mg/l. The pH has ranged from 2.5 to 3.5 in weekly rainwater tests made beneath the plume on the volcano's W flanks (Upper Amersham). In contrast, the local source springs used for drinking water, also on the W flank, had consistently shown little or no geochemical perturbation. During February it was reported that gases from both the dome and three fumaroles (soufrieres) around the volcano appeared to have changed little during the course of the increased activity.
Results obtained on 27-28 February suggested that neither the Castle Peak nor Gages Wall reflectors showed any greater movement than the reflectors farther from the area of dome extrusion. This was taken to indicate a lack of local deformation at these two sites on the edifice.
Seismicity. During the first week of February, tremor was rare. The chief exceptions were a 4-hour interval of low-amplitude tremor and an 18-hour interval of low- to moderate-amplitude tremor. Throughout much of February, and particularly between the 8th and 14th, intermittent episodes of low- to moderate-amplitude tremor were recorded. Increased tremor amplitude was seen on 17, 19, and 20 February; another episode that started on the 25th lasted ~12 hours.
Small (M 0.0-0.5) hybrid events fluctuated in amplitude but occurred often during February. In a particularly intense episode between 23 January and 6 February, they took place 5-6 times/minute. These hybrid events generally took place less frequently, particularly in late February.
Early in February, long-period earthquakes of M <=2.5 were located. During the most intense interval they took place at a rate of 34/day. Late in February, instrumental locations were obtained for many of the larger (M 1.0-1.8) long-period earthquakes. They all occurred <=3 km beneath the volcano. In addition to thedaily seismic events diagnostic of rockfalls, on 7 February a 10-minute-long signal was received exclusively at Gages station. This signal was probably caused by a mudflow down a nearby drainage (Gages Ghaut).
Information Contacts: Montserrat Volcano Observatory (MVO), c/o Chief Minister's Office, PO Box 292, Plymouth, Montserrat.
Escalating dome growth spawns pyroclastic flows and another evacuation
During March ash plumes continued to blow over the Capital and environs, and the rate of dome extrusion escalated. Later, on 3 April, explosions at the dome and pyroclastic flows down the Tar River prompted an evacuation of the southern part of the island.
Seismicity during March from both rockfalls and deeper sources continued in a manner consistent with dome growth. Tremor was repeatedly recorded at Gages station. Although there were exceptions, deformation mainly continued as a shortening of line lengths equivalent to ~1 mm/day (similar to trends seen since mid-November). The chief exception was on the W flank (Amersham to Chances Steps line), which on March 11 showed a surprising 3 cm lengthening since last measured on February 19. This is a reversal of the shortening that occurred from October to late December on this line.
Numerous rockfalls and avalanches from the dome in early March chiefly appeared on the dome's SW and NW sides. Next, they were repeatedly seen on the NW but some also started in the dome's central area (week 2). Rockfalls then shifted from the dome's NW margin to the E margin (week 3). Later rockfalls descended the NW, W, and E margins (week 4).
Rapidly growing spines continued to be common during much of March. They were noted on the dome's SW (weeks 1 and 2) and NW (week 4). On the NW, one spine achieved the greatest absolute height of any yet seen. It extruded rapidly, rising 10 m over an interval of about one day on 26-27 March. Over a 24-hour interval beginning at 1600 on 21 March, another spine's vertical growth measured ~7 m.
The dome's topography was mapped during week 2 from Farrell's lookout (on the WNW). The resulting map allowed workers to estimate the dome's mid-March volume as ~6.7 x 10⁶ m3, a value comparable to previous, cruder estimates made in the field. It appeared that the dome's growth rate increased 7- to 10-fold in the last few months. Specifically, the late-November and December rate was ~0.2-0.3 m3/second whereas the March rate was closer to 2 m3/sec. On 3 and 12 March the growing dome's summit elevations were 845 and 875 m, a 30 m rise in ~9 days. Later, on 20 March, a visit to Gages Wall revealed that, even though this sector had few rockfalls around the time of the visit, the dome's talus apron had grown to within ~15 m of the wall's top.
During week 2, fine ash carried from some larger rock falls was deposited on the upper W flanks. On 17 March, viewers on Farrell's lookout were enveloped in a warm ash cloud following a rockfall that occurred without a noticeable explosive component. That same day an explosion may have helped drive an ash column to 2,300 m.
Other relatively large ash clouds appeared repeatedly during late March and early April. On 27 March there were ash clouds generated at 0642, 0700, 0848, and 1725. The 0642 event produced an ash column that reached a height of 2,000-2,300 m and blew W blanketing areas in vicinity of the Capital. The 0642 event accompanied a seismic signal comprised of seven pulses in a 14-minute interval; the 0700 event generated a smaller ash column accompanied by three seismic pulses. Except for these intervals of unusual seismicity and frequent signals from large rockfalls, seismicity during the 24-hour interval prior to the 27 March events had been generally quiet. Helicopter observations shortly after the 0700 event disclosed that ash had been channeled to the E down a drainage called the Hot River Ghaut. Hot ash had traveled for ~1 km from the dome, igniting dead trees along its path. Observers witnessed the 0848 event, but it was much smaller and areally restricted.
Several other plumes on 31 March led to a nearly one-hour interval late that day when unusually intense seismicity registered at all the stations. The seismicity was correlated with ash plumes that blew W. On 1 April a helicopter flight confirmed the largest block-and-ash flows yet seen. Although runout distances were similar to those seen on 27 March (on the order of 1 km from the base of the Castle Peak dome), those on 1 April entrained bigger blocks and had a more widely dispersed dilute component that burned a broader swath of trees and foliage around the Tar River Soufriere (~1 km NE of Castle Peak's summit).
Until a small explosive event at 0652 on 3 April, the majority of the airborne ash was thought to have come from rockfalls and avalanches off the dome. This explosion, and several other significant ones the same day, discharged from a fissure on the dome's E flank, a spot that also appeared as the source of recent rockfalls. At various times on 3 April, continuous ash emissions came from the crater area. The activity continued to build during the day, with many small explosive seismic signals and continuous tremor recorded at the closest seismic station on Chances Peak.
At 1518, a pyroclastic flow occurred in the Tar River area. It traveled ~1.9 km down this drainage and burned vegetation and set fire to sulfur at the Tar River Soufriere. It also extended 1.9 km down the Hot River Valley (to where the road crosses the river), stopping ~400 m upslope of the Tar River Estate house. Although no inhabited areas were affected by the pyroclastic flow, the settlement of Long Ground lies ~2 km NE of Castle Peak's summit. The flow generated an ash plume that rose to ~6,700 m. Much of the ash blew N in light and variable winds. Other pyroclastic flows occurred at 1808 and 1818. These events, some of which were captured on NASA GOES satellite images, prompted scientists to note the possibility of further explosive eruptions during the next few days and to urge residents to move to the island's N end. The 3 April evacuation continued through at least 30 April.
Information Contacts: Montserrat Volcano Observatory (MVO), c/o Chief Minister's Office, PO Box 292, Plymouth, Montserrat (URL: http://www.mvo.ms/); NOAA/NESDIS Synoptic Analysis Branch (SAB), Room 401, 5200 Auth Road, Camp Springs, MD 20746, USA.
Significant explosions and pyroclastic flows; vigorous dome growth
Volcanic activity in the summit crater was very high during early April, but explosions decreased in the second half of the month. Dome growth, most conspicuously in the form of spines, remained vigorous. Activity late in the month was dominated by small to moderate-sized rockfalls with associated ash clouds. Steam production was almost continuous, along with SO2 emission, throughout the month. Episodes of low-amplitude broadband tremor, usually <1 hour duration, were also recorded, but there were few long-period or shallow volcano-tectonic earthquakes. No major deformation events were detected.
Eruptive activity on 3 April began at 0652 with a small explosion (BGVN 21:03). Near-continuous seismic activity afterwards was a result of more small explosions and ash emission from the dome. After a reassessment of the situation by the Montserrat Volcano Observatory at 1300, the civil authorities began an evacuation of the S part of the island. At 1518, an eruption generated a significant pyroclastic flow in the Tar River valley area and an ash plume that rose to ~6 km altitude. Further pyroclastic flows in the same area were generated at 1808 and 1818. These pyroclastic flows slightly overtopped the N embankment of the Tar River valley but caused no destruction to property in Long Ground, ~2 km NE of the dome. Fires started by the pyroclastic flows continued for several days in the Tar River area.
Several smaller explosions and rockfalls during 4-5 April generated clouds that deposited ash in Plymouth and environs. The most significant of these was a moderately strong explosive eruption at about 1253 on 5 April that produced a column to ~1,500 m altitude and a small pyroclastic flow into the Tar River valley. A series of eruptions starting at 0839 on 6 April generated ash plumes up to ~3 km high and sent at least six small pyroclastic flows into the Tar River area. After 1337 the activity level increased again, with continuous ash emission and several ash plumes. At 1445, a significant explosive eruption began and continued for about an hour. It consisted of two main pulses that sent ash to ~9 km altitude and generated a relatively large pyroclastic flow. Several small-to-moderate eruptions produced ash columns and possibly small pyroclastic flows in the Tar River valley again that afternoon.
A new spine observed close to the center of the dome on the morning of 4 April was ~828 m above sea level at mid-morning the next day. By 6 April it had grown to ~906 m elevation and was visible from many points around the island; by 7 April the spine was taller than Chance's Peak (the highest topographic feature on Montserrat at 915 m). A moderate explosion at 0659 on 7 April was heard at the Bramble Airport ~6 km NE of English's Crater and fed an eruptive column that deposited ash to the NW. During the night of 7 April the top half of the spine broke off but the remnant continued to grow from the base throughout 8 April so that once again it became higher than Chance's Peak; this spine was the largest seen so far. On 8 April there was another series of eruptions, including two large explosions at 1354 and 1357. During this period, near-continuous pyroclastic flows moved into the Tar River valley, and several large ash clouds drifted out to sea. The pyroclastic flows did not reach as far as those on 3 April, but some trees in the Tar River valley were set on fire.
Activity in the crater area during 11-17 April was dominated by rockfalls and explosions creating small ash clouds. The spine that began rising on 5 April collapsed on 12 April towards the SW. A pyroclastic flow from this event was observed at 1559 on 12 April, but remained confined to the upper part of the Tar River valley away from inhabited areas. A twenty-five minute period of explosions and rockfalls began at 2037 on 13 April. On 15 April a new spine was growing to the E of the remnant of the last spine. Break-up of this feature and further break-up of the remnant spine occurred on 17 April.
Seismicity in early April was dominated by rockfalls, but beginning on 7 April hybrid earthquakes centered beneath English's Crater at shallow depths (<2 km) increased in frequency. These events occurred at rates varying from a minimum of 1-2 every 5 minutes (12-24/hour) to a maximum of ~5/minute (300/hour). This intense hybrid type of seismicity, thought to result from dome growth, continued through 17 April. RSAM data showed a steady increase in energy release up to the evening of 15 April when it dropped to low levels. By 17 April the hybrid events were occurring every 2 minutes (30/hour).
A new spine, which had grown over a period of no more than 36 hours, was seen on 18 April. The top of the spine was measured at ~911 m elevation, 30 m above the top of the dome. A smaller spine was observed on the morning of 19 April, with a height of ~20 m. The large spine appeared to fracture on 20 April and the debris fell to the base of the NE part of the old dome. Another small spine was seen in the same location on 24 April. Rockfalls were observed throughout the week, with the largest ones producing significant ash clouds at 1237 on 18 April, 1511 on 21 April, and 0635 on 22 April. The 21 April event generated an ash cloud to 1,700-2,000 m above sea level and sent a small pyroclastic flow ~300 m down the Tar River valley, producing an ash cloud to ~1,300 m altitude.
The number of hybrid earthquakes quadrupled on 18 April, to ~2 events/minute (120/hour). Seismicity then declined gradually back to ~30/hour by 24 April. The longest period of broadband tremor was 8 hours, between 1700 on 23 April and 0100 on 24 April. Volcano-tectonic earthquakes were recorded on 20, 22, and 23 April. The first two were located N of the crater, beneath Farrells Mountain at 0.25 and 4 km depth. During the last week of April, the small repetitive hybrid earthquakes occurred every 2-3 minutes (20-30/hour) but with reduced amplitude. A few volcano-tectonic earthquakes were located, one at a depth of 2 km SE of the South Soufriere Hills. Several very small earthquakes were recorded by the Gages seismic station during this period. Similar swarms have been identified in records from that station, especially during July and August 1995.
Throughout April, measurements to the EDM reflector on the upper flank of Castle Peak dome from both Long Ground and White's Yard continued to show the slow shortening trend of ~1 mm/day observed since late November 1995. The reflector on Gage's Wall was obscured by ash. Occupation of the Dagenham-Amersham-Upper Amersham-Chance's Steps EDM network showed that the very small changes (on the order of 0.3 mm/day) are continuing from December 1995. Two GPS base networks were established in late April. The first is a relatively large-scale network with line lengths of ~7 km. The second is a denser network of 18 stations on the flanks, with an average inter-station spacing of 2 km. This covers most of the volcano, except for the SE sector. No changes have yet been detected above the 1-cm precision of the technique.
Accurate angular measurements of features on the dome have been combined with measurements made from photographs to build a topographic model. This has been compared with a digital terrain model of the old English's Crater and gives a dome volume on 18 April of 9.5 ± 0.5 x 10⁶ m3. This volume gives a mean extrusion rate of ~70,000 m3/day since 30 November 1995.
There has been uncertainty as to whether or not some of the larger ash columns were generated by explosions. The recent ash deposits are uniformly fine-grained, with no clasts above ash-size getting outside the crater. This is inconsistent with an explosive model, where larger ballistic clasts and deposition of lapilli might be expected. A video of one of the smaller pyroclastic flows showed a sizeable thermally convective column being generated when the flow hit the crater wall. Thus the evidence so far indicates that the ash columns are generated from the pyroclastic flows and rockfalls and not from explosions.
Soufriere Hills volcano sits on the N flank of the older South Soufriere Hills volcano, located at the S end of Montserrat Island (13 x 8 km). The summit area consists primarily of a series of ESE-trending lava domes. Block-and-ash flow and surge units associated with dome growth predominate in flank deposits. Pyroclastic-flow deposits associated with the formation of English's Crater have been dated at around 19,000 years BP (before present). A series of eruptions dated at 16,000-24,000 years BP pre-dates the Castle Peak dome in the crater by an unknown period of time. English's Crater is breached to the E. Periods of increased seismicity below Soufriere Hills were reported in 1897-98, 1933-37, and again in 1966-67. There were no reported historical eruptions, but some deposits and features have a young appearance. A radiocarbon date of ~320 ± 54 years BP from a NE-flank pyroclastic-flow deposit is significantly younger than other radiocarbon dates from the volcano, and could have resulted from the latest activity of Castle Peak.
Information Contacts: Montserrat Volcano Observatory (MVO), c/o Chief Minister's Office, PO Box 292, Plymouth, Montserrat (URL: http://www.mvo.ms/).
Dome growth and evacuation continue in May
During May the dome's growth continued, accompanied by small intermittent pyroclastic flows and minor ashfalls that were mostly thought to be generated by rockfalls. Although activity during the first week of May appeared similar to the final week of April, visibility became poor after 5 May. When visible, the dome's new growth was manifested in rapid increases of summit elevation (on 19 April, 865 m; on 30 April, 896 m; on 2 May, 898 m; on 3 May, 909 m). This was followed by an apparent 2-m decrease (i.e. on 4 May, 907 m). Many rockfalls took place on the dome's NE and E flanks. Throughout early May small ash clouds repeatedly blew W depositing very small amounts of ash in the Upper Gages and Amersham areas.
Activity was characterized as slightly less elevated during the second week of May. However, visual observations on 11 May indicated that a small pyroclastic flow had traveled 300 m E of the base of old Castle Peak dome (into the Upper Tar River Valley passing just S of the path of the 3 April pyroclastic flows). Although this flow had set fire to some trees, no significant changes were observed, and small ash clouds again blew W depositing minor ash in the Upper Gages, Amersham, and Fort Barrington areas.
On 12 May the dome area discharged abnormally large ash clouds associated with at least three pyroclastic flows E of the crater down the Tar River. Relatively large ashfalls also took place in the WNW-NW sector at least as far as the coastal area (Fox's Bay). In some places the ashfall reached a maximum thickness of 3 mm. These ashfalls were reported in parts of southern and central Montserrat (including the settlements of Farrell's, Rileys, Windy Hill, Gages, Lees, St. George's Hill, Fox's Bay, Richmond Hill, Garibaldi Hill, Ile Bay, Old Towne, and Salem). Areas affected also included some settlements in the designated safe zone in the N part of the 13-km-long island (including Cork Hill, Weekes', Olveston, and Barzey's) and small amounts of ash fell in the volcano's E sector (Tar River, Long Ground, and Whites).
The 12 May episode began at about 0630 when near-continuous rockfalls took place on the dome's E flank lasting until about 0720. From 0720 to 0945 the rockfalls became intermittent and small but they still produced ash clouds. A further increase in activity produced pyroclastic flows that were seen in the Tar River Valley at around 0945, 0952, 1105 and 1153. The ones at 0945 and 1105 advanced more than 30 m over the sea; the one at 1153 stopped just short of the sea. Activity declined after about 1220 but small-to-moderate rockfalls continued intermittently.
The 12 May pyroclastic flows did not damage any structures but trees were set ablaze in the Tar River Valley area. Excellent views were obtained of the pyroclastic flows.
On 13 May, light ashfalls blew across the volcano's W and SW sectors. On 15 May small ash clouds again blew W; views then suggested that most of the rockfalls producing the ash came from the NE flank of the dome. In addition, on 15 May moderate amounts of steam escaped from the base of the dome's N side; at other times during the second week of May steam mainly escaped from the SW moat.
Rockfalls were especially abundant on 16 and 22 May. In addition, one on 19 May generated an ash plume that reportedly reached an altitude of about 1.2 km. Another on 20 May was associated with a small pyroclastic flow that traveled ~2 km NE of Chances Peak down the Upper Tar River Valley (as far as Hermitage).
Visibility was generally poor for most of the third week of May allowing only brief views into the crater to establish the dome's main areas of growth on the N and NE flanks. When visibility improved on 20 May, nine days after the previous observation on 11 May, the dome contained several smaller spines and a large broad spine at the top. The large spine rose ~20 m and leaned slightly NE. Observers saw no morphological clues for the source of the 12 May pyroclastic flows, possibly because any topographic signs may have been erased by mass wasting during the intervening week. During brief observations from a helicopter, rockfalls mainly cascaded down the dome's N and NE flanks; fewer came down the vigorously steaming SE flank. Very poor visibility returned on 21 and 22 May.
During the week ending on 29 May, visibility gradually improved allowing remote measurement of 200-250°C dome surface temperatures. Observers on 24 May saw at least three spines on top of the dome (none more than 15 m high) and vigorous steaming from both the NW moat and several areas of the dome. A mudflow that descended the Upper Tar River Valley had apparently formed due to heavy rainfall on the previous night (23-24 May). Also noted was a clear scar on the dome's lower NE flank. About a meter deep and perhaps 5- to 10-m wide, the scar provided a path for ongoing rockfalls.
Observations on 26 May indicated dome growth focused on the dome's E, NE, S, and W parts. Also during the week ending on 29 May, the absence of strong wind allowed the development of near vertical ash plumes, some of which ascended up to 2-km altitude. On 29 May observers saw several small pyroclastic flows that started near the upper dome and flowed E down the Tar River Valley, stopping no farther than the Tar River Soufriere.
Seismicity during May is summarized in table 3. Intense hybrid seismicity took place on 2-3 May; otherwise seismic activity for late April through May was dominated by near-continuous broadband tremor, in some cases lasting up to several days. Tremor duration remained qualitative because it was saved on analog recorders; the gains and filters on these recorders were periodically changed in order to look at other types of seismicity, leaving no consistent record for quantitative analysis. In addition to tremor, rockfall signals were also common.
Table 3. Seismic data from Soufriere Hills, May 1996. Courtesy of MVO.
| Date | Volcano-tectonic | Long-period | Hybrid | Rockfall | Amount of tremor |
| 02 May 1996 | 0 | 32 | 52 | 46 | Intermediate |
| 03 May 1996 | 1 | 2 | 345 | 50 | Intermediate to high |
| 04 May 1996 | 0 | 5 | 11 | 27 | Intermediate |
| 05 May 1996 | 0 | 11 | 1 | 67 | Intermediate to high |
| 06 May 1996 | 0 | 2 | 6 | 55 | Intermediate |
| 07 May 1996 | 0 | 7 | 5 | 50 | Low |
| 08 May 1996 | 0 | 21 | 5 | 64 | Low |
| 09 May 1996 | 0 | 21 | 0 | 73 | Low |
| 10 May 1996 | 1 | 16 | 0 | 97 | Low |
| 11 May 1996 | 1 | 4 | 0 | 62 | Low |
| 12 May 1996 | 0 | 6 | 0 | 109 | Low |
| 13 May 1996 | 0 | 15 | 0 | 127 | None |
| 14 May 1996 | 0 | 18 | 0 | 147 | None |
| 15 May 1996 | 2 | 50 | 67 | 103 | None |
| 16 May 1996 | 0 | 2 | 12 | 80 | Low to intermediate |
| 17 May 1996 | 0 | 4 | 8 | 33 | Low to intermediate |
| 18 May 1996 | 1 | 12 | 2 | 25 | Low |
| 19 May 1996 | 1 | 9 | 13 | 34 | Low to intermediate |
| 20 May 1996 | 0 | 7 | 8 | 43 | Intermediate |
| 21 May 1996 | 0 | 4 | 0 | 32 | Intermediate to high |
| 22 May 1996 | 0 | 7 | 0 | 60 | Intermediate to high |
| 23 May 1996 | 0 | 12 | 0 | 64 | Intermediate to high |
| 24 May 1996 | 0 | 19 | 0 | 50 | Low |
| 25 May 1996 | 0 | 17 | 1 | 104 | Low |
| 26 May 1996 | 0 | 12 | 8 | 114 | Intermediate |
| 27 May 1996 | 1 | 13 | 5 | 85 | Intermediate |
| 28 May 1996 | 1 | 13 | 4 | 86 | Intermediate to high |
| 29 May 1996 | 0 | 12 | 3 | 83 | Low to intermediate |
| 30 May 1996 | 1 | 5 | 0 | 17 | Low to intermediate |
| 31 May 1996 | 1 | 14 | 96 | 97 | Intermediate to high |
Some of the deformation measurements made during May were taken on the E and S triangles on 26 May. The line lengths on the southern triangle had shortened by 8 to 9 mm since 21 April, while the eastern triangle had shortened by ~1 cm since 20 May. These data obtained by the EDM technique were consistent with recent GPS measurements conducted by the Alan Smith and colleagues from the University of Puerto Rico.
The bulk of the SO2 flux measurements were made with a car-mounted COSPEC driven under the plume (between Cork Hill and St. Patrick's) at ~20 km/hr (table 4). Wind speeds were measured with a hand-held annemometer before and after each day's runs at Windy Hill (3.4 km N of Chances Peak), the windiest spot accessible by road. Typical SO2 fluxes were in the range of 25-205 metric tons/day (t/d). An exception was the 13 May measurement of 357 t/d.
Table 4. Correlation spectrometer (COSPEC) SO2 flux measurements at Soufriere Hills, 28 April-22 May 1996. Courtesy of MVO.
| Date | Number of measurements | Mean (t/d) | Sigma |
| 28 Apr 1996 | 4 | 26 | 5 |
| 29 Apr 1996 | 3 | 86 | 10 |
| 01 May 1996 | 5 | 97 | 29 |
| 02 May 1996 | 3 | 177 | 29 |
| 03 May 1996 | 5 | 89 | 11 |
| 04 May 1996 | 5 | 76 | 17 |
| 05 May 1996 | 3 | 54 | 10 |
| 09 May 1996 | 4 | 138 | 11 |
| 10 May 1996 | 5 | 123 | 46 |
| 11 May 1996 | 4 | 96 | 30 |
| 13 May 1996 | 3 | 357 | 119 |
| 17 May 1996 | 5 | 130 | 29 |
| 18 May 1996 | 5 | 129 | 39 |
| 19 May 1996 | 5 | 203 | 54 |
| 20 May 1996 | 4 | 164 | 31 |
| 21 May 1996 | 5 | 205 | 56 |
| 22 May 1996 | -- | 130 | -- |
Resettlement. Since 3 April shelters have housed 1,381 residents. About another 3,000 people rented or shared accommodations in the homes of friends and relatives. The W. H. Bramble airport remained open. Pre-fabricated buildings were erected and church and school buildings were converted to temporary shelters; in addition, the government prepared an ancillary hospital and a power station in the safe area; it made road repairs, upgraded fuel storage, relocated livestock on farms, and established programs for sport, culture, counselling, and guidance.
As of 24 April no plan for mass off-island evacuation for the island's 10,000 inhabitants had been implemented; instead the British and CARICOM governments favored voluntary evacuation. Some residents could remain on Montserrat at the N end of the island, in the area considered comparatively safe by Wadge and Isaacs (1988) and by scientists at MVO. Participants who go to the U.K. could be eligible for employment, income support, housing, and the enrollment of children in British schools for two years.
Reference. Wadge, G., and Isaacs, M.C., 1988, Mapping the volcanic hazards from Soufriere Hills Volcano, Montserrat, West Indies using an image processor: Journal of the Geological Society of London, v. 145, no. 4, p. 541-551.
Information Contacts: Montserrat Volcano Observatory (MVO), c/o Chief Minister's Office, PO Box 292, Plymouth, Montserrat (URL: http://www.mvo.ms/); Alan L. Smith, Univ. Puerto Rico, Dept. of Geology, Mayaguez, PR 00680 USA.
Dome growth continues
The current eruption, which began on 18 July 1995 (BGVN 20:06), started extruding a lava dome on about 16 November 1995 (BGVN 20:11/12). What follows condenses Montserrat Volcano Observatory (MVO) Scientific Reports for the weeks ending 5 and 12 June and Daily Reports for the rest of June.
On 31 May, and 1 and 15 June, pyroclastic flows progressed several kilometers E; one to within 300 m of the sea. Associated plumes reached up to 3 km altitude. Persistent dome growth continued in June. Its talus filled the W moat, allowing rockfalls to begin escaping the crater, but none reached farther than 100 m beyond the rim. Summaries are included for visual observations, seismic observations, daily seismic event counts, and SO2 flux (tables 5, 6, 7, and 8).
Table 5. Chronology of visual observations at Soufriere Hills, Montserrat, late May through early June 1996. Poor weather conditions often prevented observations. Dated events after 12 June refer to 24-hour intervals beginning at 1600 the previous day. Courtesy of MVO.
| Date | Visual Observations |
| 30 May 1996 | Rockfalls concentrated on N and NE; vigorous steaming from many parts of the dome. |
| 31 May 1996 | Rockfalls mainly concentrated on N and E, but some traveled into the S moat. Two pyroclastic flows down the Tar River; the first progressed to within 300 m of the sea; the second, to well past the Tar River Soufriere. Associated ash clouds rose to 2-3 km and were blown NW. A large S-directed rockfall escaped the S crater but progressed less than another 100 m. |
| 01 Jun 1996 | Rockfalls concentrated on the dome's NE, E, and S. Small pyroclastic flow to the E (into the upper Tar River Valley); the associated plume rose to ~2 km. |
| 02 Jun 1996 | Small "whale back" extruded on the dome's E flank, just N of Castle Peak. |
| 04 Jun 1996 | Although the E dome was quiet, growth was indicated on the S and W sides. No spines were observed; instead the dome's top appeared comparatively rounded. |
| 09 Jun 1996 | Intense incandescent spots coincided with the source areas for rockfalls. New spines in the W summit area. Night incandescence and associated rockfalls; rockfalls on the dome's NE flank to its W flank. |
| 10 Jun 1996 | One of the spines seen on 9 June had fallen over. The dome overtopped the W crater rim at Gages Wall and debris began to travel into the uppermost reaches of Fort Ghaut. Dome growth indicated on the NE. |
| 11 Jun 1996 | Dome growth indicated on the NW side. |
| 12 Jun 1996 | Estimated height of the new dome's summit was 943 m. |
| 13 Jun 1996 | Having filled the moat to ~25-m depth, talus spilled out of the partly buried crater for ~100 m into the upper Gages Valley. |
| 14 Jun 1996 | During heavy rainfall, ash erupted and fell NW of the volcano (in the St George's Hill, Cork Hill, and Old Towne areas). Rockfalls were abundant; one ash emission during the afternoon was semi-continuous and lasted about an hour. |
| 15 Jun 1996 | A small (~300-m-long) pyroclastic flow S of Castle Peak; fresh deposits from two others in the upper Tar River valley (on the dome's E and NE flanks). |
| 16 Jun 1996 | Rockfalls on the dome's NE, N, SE, and W sides. On the W it was unclear how much new material escaped the crater along the upper Fort Ghaut. |
| 17 Jun 1996 | Very little new material had traveled down the upper W slopes into the upper Fort Ghaut. Talus on the dome's N side had built up to ~15 m below the rim of Farells wall. A projection along the new dome's summit measured 942 m elevation. |
| 26 Jun 1996 | Dome appeared wet and issued heavy steam from the SE flank. A stubby spine was on the NE summit. |
| 30 Jun 1996 | Dome rockfalls relatively rare but considerable new material had been deposited on the dome's E sector, in the Tar river's upper S fork. The dome's most rapid growth appeared to be on the S. Little new mass wasting on the W (down Fort Ghaut); however, steam production was concentrated in the W moat area. |
| 04 Jul 1996 | Viewed a large slab of extruded lava at the top of the SE dome. A few blocks of fresh dome lava lay in the dome's new W drainage (the upper Fort Ghaut). |
Table 6. Chronology of seismically derived observations of volcanic activity at Soufriere Hills, Montserrat, 30 May through July 1996. Dated events after 12 June refer to 24-hour intervals beginning at 1600 the previous day. Courtesy of MVO.
| Date | Seismic Observations |
| 30 May-03 Jun 1996 | Swarm of small hybrid earthquakes of variable amplitude, occurring at the rate of 0.5-2 events/minute. |
| 30 May 1996 | Volcano-tectonic earthquake 750 m beneath the crater. |
| 31 May-03 Jun 1996 | Somewhat elevated tremor; volcano-tectonic earthquake 1.5 km beneath the crater. |
| 01 Jun 1996 | Volcano-tectonic earthquake 2 km beneath the crater. |
| 03 Jun 1996 | One ~2-hour continuous tremor episode and a second 5-hour episode running into 4 June. |
| 05 Jun 1996 | Interpreted small, local mudflow in upper Fort Ghaut. |
| 06 Jun 1996 | Sediment-laden flood towards the W (Plymouth) down Fort Ghaut. |
| 09 Jun 1996 | Areas of incandescence seen associated with rockfalls. |
| 13 Jun 1996 | Very early in the morning the Gages and Chances Peak seismic stations started to record a few small repetitive hybrid events; these slowly increased in number and were occurring at a rate of ~1 every two minutes by the end of the reporting period. |
| 15 Jun 1996 | During sustained heavy rainfall, small hybrid events appeared prior to abundant rockfalls. These hybrid events grew from ~1/minute to 5/minute and their amplitudes doubled before they decreased in number and size. Larger rockfall signals looked similar to signals from small pyroclastic flows. |
Table 7. Daily counts of seismic events at Soufriere Hills, Montserrat, 30 May-1 July 1996. The amount of tremor is described qualitatively (high-low) or using analysis from the Daily Reports (particularly after 12 June). Dated events after 12 June refer to 24-hour intervals beginning at 1600 the previous day. Courtesy of MVO.
| Date | Volcano-tectonic | Long-period | Hybrid | Rockfall | Amount of Tremor |
| 30 May 1996 | 1 | 5 | 0 | 17 | Low to intermediate (3 hours of continuous tremor) |
| 31 May 1996 | 1 | 14 | 96 | 97 | Intermediate to high |
| 01 Jun 1996 | 1 | 0 | 307 | 116 | Intermediate to high |
| 02 Jun 1996 | 0 | 0 | 132 | 83 | Intermediate to high |
| 03 Jun 1996 | 0 | 1 | 19 | 32 | Intermediate to high |
| 04 Jun 1996 | 0 | 5 | 18 | 51 | Low to intermediate |
| 05 Jun 1996 | 0 | 17 | 8 | 57 | Low to intermediate |
| 06 Jun 1996 | 0 | 13 | 4 | 49 | Low to intermediate |
| 07 Jun 1996 | 0 | 0 | 1 | 13 | Low to intermediate |
| 08 Jun 1996 | 0 | 0 | 1 | 51 | Low to intermediate |
| 09 Jun 1996 | 0 | 3 | 1 | 54 | Low to intermediate |
| 10 Jun 1996 | 1 | 15 | 2 | 54 | Low to intermediate |
| 11 Jun 1996 | 0 | 12 | 5 | 87 | Low to intermediate |
| 12 Jun 1996 | 0 | 2 | 1 | 59 | Intermediate |
| 13 Jun 1996 | 1 | 2 | (tab 4) | 39 | 5.5 hours |
| 14 Jun 1996 | -- | 12 | 25 | 34 | -- |
| 15 Jun 1996 | -- | -- | (tab 4) | 198 | -- |
| 16 Jun 1996 | -- | 15 | 21 | 149 | 1 hour |
| 17 Jun 1996 | -- | 16 | 2 | 49 | 12 hours |
| 18 Jun 1996 | 1 | 13 | 0 | 81 | -- |
| 19 Jun 1996 | -- | 7 | 8 | 92 | -- |
| 20 Jun 1996 | -- | 1 | 7 | 63 | -- |
| 21 Jun 1996 | -- | 3 | 5 | 53 | 6.6 hours |
| 22 Jun 1996 | -- | 5 | 0 | 28 | Low |
| 23 Jun 1996 | -- | 1 | 4 | 60 | 7 hours |
| 24 Jun 1996 | -- | 29 | 3 | 62 | Very low |
| 25 Jun 1996 | -- | 7 | 2 | 37 | Low |
| 26 Jun 1996 | -- | 4 | 6 | 37 | -- |
| 27 Jun 1996 | -- | 6 | 7 | 59 | -- |
| 28 Jun 1996 | 2 | 14 | 11 | 66 | -- |
| 29 Jun 1996 | 1 | 4 | 4 | 55 | -- |
| 30 Jun 1996 | -- | -- | ~55 | -- | -- |
| 01 Jul 1996 | 2 | 11 | 12 | 57 | 4 hours |
Table 8. COSPEC measurements of SO2 flux at Soufriere Hills. Courtesy of MVO.
| Date | Number of measurements | SO2 flux (metric tons/day) |
| 30 May 1996 | 2 | 224 |
| 31 May 1996 | 2 | 88 |
| 01 Jun 1996 | 3 | 52 |
| 02 Jun 1996 | 6 | 193 |
| 03 Jun 1996 | 3 | 192 |
| 04 Jun 1996 | 4 | 240 |
| 05 Jun 1996 | 7 | 194 |
| 07 Jun 1996 | 3 | 84 |
| 08 Jun 1996 | 5 | 269 |
| 09 Jun 1996 | 4 | 126 |
| 10 Jun 1996 | 5 | 59 |
| 12 Jun 1996 | 5 | 168 |
| 15 Jun 1996 | -- | 135 |
| 17 Jun 1996 | 6 | 125 |
| 19 Jun 1996 | -- | 170 |
| 24 Jun 1996 | -- | 76 |
| 28 Jun 1996 | -- | 160 |
During the week ending 5 June gas measurements using a Fourier Transform Infrared Spectrometer showed substantial errors (50-100%), but did establish that at ground level on the lower slopes of the volcano (excluding Upper Amersham), the ambient concentrations of HCl and SO2 in the air were well below 100 ppb. The SO2:HCl ratio was generally well below 1.0. The only exception to this, on 24 May, was when the measurement errors were large. The SO2:HCl ratios could be used to make an argument about status of the magma chamber. Assuming that this ground-level SO2:HCl ratio was the same as in the plume, then the low ratios measured would indicate a moderately degassed magma chamber.
During 6-12 June, ash generation was generally low and few ash clouds emerged from the crater area; seismically detected rockfalls decreased with respect to the previous week and although no swarm of hybrid earthquakes occurred as in the previous week, the abundance of long-period earthquakes did appear similar to the previous few weeks.
EDM deformation measurements often detected an overall shortening rate along survey lines of ~1 mm/day during the interval from the beginning of December through the end of April. During 1 May-4 June there was a shortening rate of 2.4 and 2.1 mm/day in the volcano's N region (White's and Long Ground respectively); however, the shortening rate subsequently returned to ~1 mm/day.
On 12 June it was noted that during the previous 7-day interval, a ~12 mm/day shortening rate occurred on the N line (Long Ground to Castle Peak). In contrast, during this interval the W and N triangles continued to show no changes in line length above the error of the method.
On 13 June the E triangle was remeasured; its previous measurement was on 11 June: the Long Ground to Castle Peak line shortened by 9 mm and the Whites to Castle Peak line shortened by 6 mm. On 15 June it was reported that the W triangle's line lengths had recently shortened by ~1 mm/day. On 19 June it was found that NE sector (White's and Long Ground to Castle Peak) line lengths shortened by 2.5 cm over 5 days; this result extended a 3-week trend of 3-5 mm/day shortening here. Despite these larger than typical deformations in the NE sector during June, during the same month it was reported that the tiltmeters at Long Ground had remained stable for the past 10 months.
Scientists also noted that by June considerable new dome lava and talus had piled against the crater's W wall. Still, the June EDM surveys failed to show corresponding movement in this portion of the older edifice.
Information Contacts: Montserrat Volcano Observatory (MVO), c/o Chief Minister's Office, PO Box 292, Plymouth, Montserrat (URL: http://www.mvo.ms/).
Dome growth continues, rockfalls and pyroclastic flows increase
The following condenses daily Scientific Reports of the Montserrat Volcano Observatory (MVO) for the period 1 July-1 August. Seismic and other significant events of this month are also summarized in table 9.
Table 9. Chronology of seismicity and other major events at Soufriere Hills, Montserrat, 1 July through 1 August. The observation period is a 24-hour interval beginning at 1600 the previous day. Courtesy of MVO.
| Date | Volcano-tectonic | Long-period | Hybrid | Rockfall | Tremor Intensity | Visual Observations |
| 01 Jul 1996 | 2 | 11 | 12 | 57 | Low | -- |
| 02 Jul 1996 | 1 | 1 | 18 | 64 | Low | -- |
| 03 Jul 1996 | -- | 5 | -- | 59 | Low | -- |
| 04 Jul 1996 | -- | 5 | 25 | 52 | Low | One small ash cloud. |
| 05 Jul 1996 | -- | 6 | 22 | 27 | Low | -- |
| 06 Jul 1996 | -- | 9 | 6 | 11 | High | -- |
| 07 Jul 1996 | 2 | 12 | 6 | 22 | High | -- |
| 08 Jul 1996 | 1 | 3? | 3? | 3? | High | Hurricane Bertha. |
| 09 Jul 1996 | 1 | 1 | 5 | 9 | Low | -- |
| 10 Jul 1996 | 1 | 4 | 2 | 22 | Low | Two light ash clouds drifted W. |
| 11 Jul 1996 | 2 | 4 | 2 | 32 | Low and High | Flash flooding in Upper Fort Ghaut and Tar River Valley. Few very small pyroclastic flows. Light ash fall N of Plymouth. |
| 12 Jul 1996 | 4 | 10 | 11 | 9 | Low | -- |
| 13 Jul 1996 | -- | 9 | 22 | 14 | Low-to-Moderate | -- |
| 14 Jul 1996 | 4 | 22 | 5 | 18 | Low-to-Moderate | -- |
| 15 Jul 1996 | 2 | 13 | 11 | 14 | Low-to-Moderate | One small ash cloud. |
| 16 Jul 1996 | 2 | 14 | 13 | 15 | Low-to-Moderate | One small ashfall in Brodericks. |
| 17 Jul 1996 | -- | 8 | 14 | 24 | Low | Two small ash clouds drifted W. |
| 18 Jul 1996 | -- | 12 | 17 | 16 | Low | One small ash cloud. |
| 19 Jul 1996 | 4 | 12 | 11 | 20 | Low | Four small ash clouds drifted W. |
| 20 Jul 1996 | -- | 4 | 4 | 21 | Low-to-Moderate | One small ash cloud drifted W. |
| 21 Jul 1996 | 560 | 19 | 44 | 58 | Low-to-Moderate | Some small ash clouds. Few small pyroclastic flows. |
| 22 Jul 1996 | 82 | 105 | 114 | 94 | Low-to-Moderate | Some small ash clouds. Seven small pyroclastic flows. |
| 23 Jul 1996 | 15 | 24 | 101 | 150+ | Low-to-Moderate | Continuous ash clouds production. |
| 24 Jul 1996 | 15 | 1 | 9 | ~160 | Low-to-Moderate | One ash cloud. |
| 25 Jul 1996 | 106 | 9 | 35 | ~100 | Low-to-Moderate | One ash cloud drifted NW. |
| 26 Jul 1996 | 98 | 5 | 15 | 102 | Low-to-Moderate | Some very small ash clouds. |
| 27 Jul 1996 | 15 | 5 | 36 | ~100 | Low-to-Moderate | Some small ash clouds produced light ashfall toward W. |
| 28 Jul 1996 | 5 | -- | -- | -- | Low-to-Moderate | Continuous ash cloud production resulted in heavy ashfall toward W. Several small pyroclastic flows. |
| 29 Jul 1996 | -- | -- | -- | -- | Low-to-Moderate | Moderate-sized ash cloud caused ashfall toward WNW. |
| 30 Jul 1996 | 20 | 6 | clusters | 89 | Low-to-Moderate | One small ash cloud. Few small pyroclastic flows. |
| 31 Jul 1996 | 88 | -- | 178 | 93 | High | Large number of pyroclastic flows produced continuous ash clouds and heavy ashfall. |
| 01 Aug 1996 | 20 | 36 | 215 | 117 | Low | Ashfall continued from the day before. |
Activity during 1-20 July. During the first 10 days of July activity remained at a low level, similar to the last week of June (BGVN 21:06). The most significant events were small-to-moderate size rockfalls from the growing S flank of the lava dome. The largest rockfalls produced small ash clouds that drifted with the prevailing winds, principally to the W of the volcano, toward Upper Gages, Amersham, and Plymouth.
Most of the time visibility was poor because of bad weather conditions. On 4 July a brief period of excellent viewing conditions confirmed that the dome was growing mainly in the S section of the crater. A huge slab extruded at the top SE part of the lava dome had a vertical crack down the middle; activity was concentrated around its base. Several large loose boulders were seen on the slopes of the dome. A small quantity of fresh dome material, mainly blocks, was observed in the upper reaches of Fort Ghaut. Moderate steaming and gas production were occurring from several areas.
Seismicity remained low, with volcano-tectonic events concentrated under English's Crater at depths of <2 km. Daily episodes of intermittent low-amplitude broadband tremor lasted from a few minutes to several hours. On 6 and 7 July periods of high-amplitude tremor were associated with heavy rainfall and an increase in steam venting at the summit.
On 7 July a brief period of good visibility revealed a second peak on the dome, and the accumulation of material behind Galways Wall. Intense fumarolic activity was occurring in the saddle between the two peaks. That day the elevation at the top of the dome was measured as 939 m. MVO estimated that the rate of dome growth had not changed significantly since early May.
On 10 July the seismic signals became longer and stronger. That same day a brief view of the dome showed that rockfall activity was spreading to other areas within the active SE section. More fresh material had accumulated down the S side of Castle Peak, while vigorous steaming was observed behind it. Fumaroles were active on the summit of the SE peak and in the saddle area between the two peaks inside English's Crater.
On 11 July, heavy rainfall caused flash floods in Fort Ghaut and possibly Tar River. A fine ashfall was reported in areas N of Plymouth and out to sea. Some small pyroclastic flows went into the Upper Tar River area. Helicopter inspections found that a significant amount of material had come down the N and S sides of Castle Peak and the fresh deposits were still steaming. Several erosion scars were observed on the NE flank of the dome, which was probably the source of the flows.
On 12 July the activity level decreased and it remained low throughout 20 July. However, the broadband tremor increased in amplitude, which was interpreted as a sign of increased steam emission; brief glimpses of the dome eventually revealed vigorous steaming, at times tainted with bluish vapor. That same day rockfall deposits were reported on the S and NE sides of the dome. The wet material on the NE side, around the whaleback feature, had dried out in places and two well-formed erosion chutes were present. Dome elevation was measured at 941 m.
On 17 July more new material was seen over Gages Wall and against Galways Wall. Observers on Perche's Mountain noted that most of the rockfall activity was on the SW flank of the dome.They also reported a small block-and-ash flow down the E flank of the dome around noon. On 19 July a field party working at Farrell's heard frequent rockfall activity and observed one rockfall descending the NE flank of the dome.
Activity during 21 July-1 August.On 21 July, the occurrence of 560 volcano-tectonic earthquakes marked a sharp increase in activity that lasted until August. These events originated from a shallow source beneath the crater, or just slightly NNE at <3 km. Long-period earthquakes were of moderate size whereas hybrid events were always small and occurred in a near-repetitive pattern at times so frequently to resemble continuous tremor. This type of activity had previously been associated with increased dome growth.
When weather conditions allowed, views of the dome revealed very vigorous steam emission from behind the old Castle Peak spine. On 25 July a large spine at the summit of the N peak of the dome was seen from Hermitage.
The rockfall activity, mainly on the NE flank of the dome, increased daily. Periods of near-continuous rockfalls were reported after 27 July. Most of the rockfalls were channeled down the NE-flank gully; none reached as far as the Tar River Soufriere. Small pyroclastic flows from the E and NE parts of the dome occurred daily into the Tar River Valley until they filled the entire valley area. Most of the local vegetation was set on fire by these flows. Associated ash clouds caused light to moderate ashfalls on 27, 28, and 29 July. One eyewitness reported on an electronic forum that during the ashfall of 28 July visibility in Plymouth was reduced to the less than one-half of a city block.
The dominating event on 31 July was a sequence of pyroclastic flows in the Tar River valley. It started at 1150 hours with a series of small- to moderate-sized rockfalls, which gradually led to the pyroclastic flow. Four flows occurred within a period of four minutes, with the last three eventually reaching the sea. A helicopter inspection confirmed that the pyroclastic flows were confined to the Tar River Valley. Light steam emission was observed from the area where the pyroclastic flows entered the sea and from the Tar River Valley.
The ash cloud generated by the pyroclastic flows attained a height of 6.4 km above sea level, according to Bramble Airport Control Tower. The ash cloud produced significant ashfalls in most areas of central Montserrat (Lees, Gages, St. George's Hill, Cork hill, Garibaldi Hill and Fox's Bay) and a far N as Woodlands. Lighter ashfalls were reported in Amersham and Plymouth. An eyewitness posted to an electronic forum that during the 31 July ashfall there was ". . . total darkness, the electricity had gone off . . . then it started to rain. The windows . . . facing the mountain became almost solid black. All the rest were covered with some mud . . . . When I got up to [my pickup the] windows, top, and hood were covered with ~1.5 inches [~3.8 cm] of mud."
That same day five episodes of high-amplitude, low-frequency, harmonic tremor were recorded at intervals of ~4 hours. After each period the signal decayed first into smaller hybrids and then to background noise. These signals could be related to movement of magma at shallow depth as the process of dome growth continued.
GPS, EDM, and COSPEC measurements. The poor weather conditions in July prevented most of these measurements. COSPEC data collected during an all-day experiment on 30 June showed no systematic variation in the SO2 production; on 10 July ~88 tons/day were measured.
A GPS survey carried out on the E side of the volcano on 7 July showed that no significant movement had taken place there since 18 June. Data collected on 10 July from Tar River, Harry's, O'Hara's, and Dagenham showed changes <5 mm in all lines since the survey started on 11 April.
EDM measurements showed an increase in the shortening rate from a few millimeters/day at the beginning of the month up to 1.5 cm/day toward the end of the month for the lines of the E triangle (Whites-Castle Peak-Long Ground) (table 10). Lengthening (1 and 2.3 cm) was measured on 30 July, when the dome elevation was found to be 923 m.
Table 10. EDM data from Soufriere Hills, Montserrat, 1 July through 1 August 1996. Courtesy of MVO.
| Date | Shortening (-) or lengthening (+)/day(s) | Line or triangle |
| 01 Jul 1996 | -0 | Amersham-Dagenham-Chances |
| 12 Jul 1996 | -few mm | Whites-Chances Peak-Long Ground |
| 18 Jul 1996 | -1.5 cm/2 days | Whites-Chances Peak |
| 18 Jul 1996 | -1.5 cm/2 days | Long Ground-Chances Peak |
| 24 Jul 1996 | -8 cm/4 days | Whites-Chances Peak |
| 24 Jul 1996 | -8 cm/4 days | Long Ground-Chances Peak |
| 26 Jul 1996 | -3 cm/2 days | Whites-Chances Peak |
| 26 Jul 1996 | -3 cm/2 days | Long Ground-Chances Peak |
| 29 Jul 1996 | -3 cm/3 days | Whites-Chances Peak |
| 29 Jul 1996 | -1.3 cm/3 days | Long Ground-Chances Peak |
| 29 Jul 1996 | -17.5 cm/14 days | Tar River-Chances Peak |
| 30 Jul 1996 | +1 cm/day | Whites-Chances Peak |
| 30 Jul 1996 | +2.3 cm/day | Long Ground-Chances Peak |
| 01 Aug 1996 | -4 cm/day | Whites-Chances Peak |
Information Contacts: Montserrat Volcano Observatory (MVO), c/o Chief Minister's Office, PO Box 292, Plymouth, Montserrat (URL: http://www.mvo.ms/).
Dome growth continues, activity level increases
The following condenses daily reports of the Montserrat Volcano Observatory (MVO) for the period 1 August-1 September. Seismicity and other significant events are summarized in tables 11 and 12. In a comment in the journal Nature, Peter Francis (1996) noted how Soufriere Hills' magma appeared depleted in volatiles with a low SO2/HCl ratio.
Though not discussed in this report, the largest and most destructive eruption of the 1-year-old eruption began at 2345 on 17 September. No casualties were reported but towns and villages on the NW side of the volcano were evacuated. The resulting plume covered a substantial part of the Caribbean.
Table 11. Chronology of seismicity and other major events at Soufriere Hills, Montserrat, 1 August through 1 September. The observation period is a 24-hour interval beginning at 1600 the previous day. Courtesy of MVO.
| Date | Volcano-tectonic | Long-period | Hybrid | Rockfall | Tremor Intensity | Visual Observations |
| 01 Aug 1996 | 20 | 36 | 215 | 117 | Low | -- |
| 02 Aug 1996 | 24 | 6 | 250 | 49 | Low-to-high | -- |
| 03 Aug 1996 | 43 | 340 | 58 | -- | Low-to-high | -- |
| 04 Aug 1996 | -- | -- | -- | -- | High | Ash clouds up to 3.3 km; small pyroclastic flows |
| 05 Aug 1996 | 71 | 0 | 373 | 64 | High | Small ash cloud |
| 06 Aug 1996 | 22 | 3 | 556 | 48 | High | Small ash clouds and minor pyroclastic flows |
| 07 Aug 1996 | 36 | 2 | 427 | 32 | High | Small ash cloud |
| 08 Aug 1996 | 47 | 3 | 310 | 47 | High | Small ash clouds rose to 2.3 km; small pyroclastic flows |
| 09 Aug 1996 | 97 | 4 | 147 | 67 | Low-to-high | Ash clouds at 1.3-3.1 km; small pyroclastic flows |
| 10 Aug 1996 | 74 | 0 | 137 | 153 | -- | Ash clouds at 2.6 km; small pyroclastic flows |
| 11 Aug 1996 | 37+ | 0 | 29+ | 182+ | -- | Ash cloud reported between 10-13 km; significant ashfall; intense pyroclastic flow activity |
| 12 Aug 1996 | 7 | 0 | 56 | 82 | Low | Ash cloud reported at 10 km; one large pyroclastic flow and several minor ones |
| 13 Aug 1996 | 0 | 39 | 42 | 117 | Low | Small ash cloud; pyroclastic flows; one flash flood |
| 14 Aug 1996 | 37 | 4 | 31 | 82 | -- | Ash cloud at 3.3 km; pyroclastic flows traveled 100 m to the sea |
| 15 Aug 1996 | 14 | 1 | 14 | 61 | -- | Ash clouds up to 1.6 km; small pyroclastic flows |
| 16 Aug 1996 | 28 | 0 | 34 | 67 | Low | Several small ash clouds and pyroclastic flows; flash floods |
| 17 Aug 1996 | 13 | 0 | 35 | 118 | Low-to-moderate | Ash cloud rose to 2 km; few pyroclastic flows; flash floods |
| 18 Aug 1996 | 5 | 4 | 21 | 70 | Low | Ash cloud up to 2 km; few small flows |
| 19 Aug 1996 | 32 | 1 | 22 | 103 | Low | Ash clouds to 3.3 km; some pyroclastic flows |
| 20 Aug 1996 | 30 | 1 | 33 | 161 | -- | Ash clouds at 1.6-4 km; small pyroclastic flows |
| 21 Aug 1996 | 1 | 2 | 36 | 131 | Low | Ash clouds at 5 km; significant ashfall; near continuous pyroclastic flows |
| 22 Aug 1996 | 20 | 1 | 34 | 118 | Low | Ash cloud at 2.6 km; two large pyroclastic flows reached the new delta |
| 23 Aug 1996 | 0 | 0 | 7 | 51 | Low | Small ash clouds and ashfalls |
| 24 Aug 1996 | 2 | 0 | 1 | 26 | Low-to-moderate | Ash at 1.6 km |
| 25 Aug 1996 | 3 | 0 | 0 | 62 | Low-to-Moderate | One very small ash cloud |
| 26 Aug 1996 | 17 | 0 | 8 | 82 | Low | Some very small ash clouds |
| 27 Aug 1996 | 30 | 10 | 7 | 115 | Low | Small ash clouds; one small pyroclastic flow |
| 28 Aug 1996 | 0 | 8 | 12 | 49 | Low | Small ash cloud |
| 29 Aug 1996 | -- | several | -- | -- | -- | -- |
| 30 Aug 1996 | 146 | 2 | 24 | 55 | Low | Ash cloud rose to 1.1 km |
| 31 Aug 1996 | -- | several | -- | -- | -- | -- |
| 01 Sep 1996 | 107 | 21 | 4 | 92 | Low | Ash clouds |
Overview. Activity in August continued at a higher level than last month (BGVN 21:07) but small- to moderate-sized rockfalls and small pyroclastic flows continued to be restricted to the Tar River Valley on the E flanks of the growing lava dome. Occasionally the flows traveled as far as the sea, building a new delta that extended 400 m offshore (figure 9). Daily emissions resulted in variable ashfalls to the WNW.
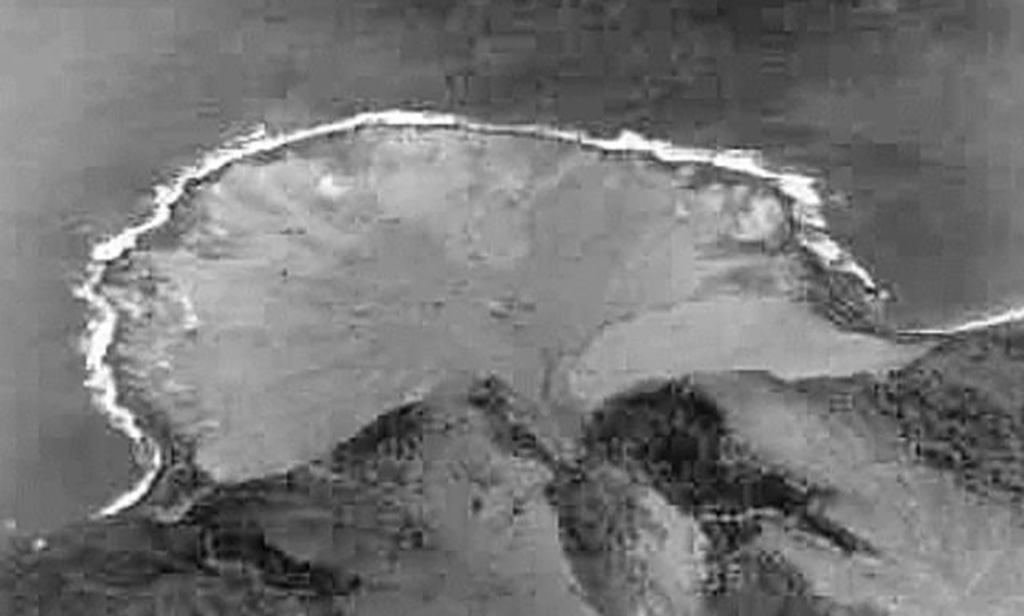 |
Figure 9. The new delta created by the pyroclastic flows of late July down the Tar River Valley. By 4 August the delta had extended 400 m into the sea and was ~550 m wide at its base. Courtesy of Glenn Lewis. |
Seismicity included larger numbers of hybrid earthquakes compared to July and the occurrence of volcano-tectonic earthquakes in swarms at depths of <2 km beneath English's Crater. Ash-rich steam frequently escaped from a collapse structure on the upper dome. These emissions were vigorous and associated with intermittent low-amplitude tremor, suggesting magma-groundwater interaction.
Significant ashfalls occurred in Plymouth, Richmond Hill, and Fox's Bay. Lighter ashfalls were reported from St. George's Hill, Cork Hill, and Garibaldi Hill. The ash fall of 12 August had the following measured thicknesses: 2 cm in Lovers Lane, 3 cm at Plymouth Police Headquarters, 6 mm in Trials, 2 mm in Gingoes, 19 mm on Fort Ghaut bridge, 3 mm in Fox's Bay, and 2 mm in Weekes.
The highest point on the dome was measured from Chance's Peak on 16 August and yielded an elevation of ~963 m. On 17 August, good visibility showed that the E part of the dome was very unstable and the observed rockfalls generally originated from this area. Within the crater, an eroded gully N of Castle Peak channeled debris from the E dome down the upper reaches of the Tar River valley, almost filling it. On 19 August a large pyroclastic flow reached the new delta but did not enter the sea. On 21 August another flow traveled a distance of ~1.5 km and produced an ash cloud that reached a maximum altitude of ~4.6 km. Near-continuous rockfalls resulted in several ash clouds that caused significant ashfalls in Plymouth and surroundings.
Good visibility on 22 August allowed scientists to conclude that the most recent pyroclastic flows were produced by the loss of material from the lower section of the new dome grown in the collapse structure produced by events of 29 and 31 July 1996. At this time the gully N of Castle Peak was almost empty.
Activity during 23 August-1 September.On 23 August the lowest activity of the month occurred, after which activity remained at a level lower than the previous three weeks. Reports during this interval mentioned small- to moderate-sized rockfalls, very few small pyroclastic flows, ash columns below 1.5 km, and an occasional sprinkling of ash on some central and N areas. On 26 August observers noted that the gully just N of Castle Peak was again filled with debris. On 30 August, brief glimpses of the dome from Bramble Airport Control Tower suggested that two extruded features (possibly spines) existed in the central part of the E dome. Light ash clouds associated with some larger rockfalls and/or small pyroclastic flows were occasionally seen drifting SSE at 1.1 km above sea level. On 1 September the runout of rockfalls and small pyroclastic flows along Tar Valley was generally <1 km.
At the end of the month an increase in volcano-tectonic earthquakes was interpreted as the continuous movement of magma from shallow depths to the surface as the process of dome growth continued.
EDM and COSPEC measurements. EDM measurements (table 12) showed a continuous, though somewhat variable shortening trend. This was especially prominent on the E triangle (Whites-Castle Peak-Long Ground). COSPEC measurements of SO2 in the volcanic plume gave the following results: 8 August, ~326 metric tons/day (t/d); 12 August, 1, 195 t/d; 13 August, 626 t/d; and 24 August, 258 t/d.
Table 12. EDM data from Soufriere Hills, Montserrat, 1 August through 1 September 1996. Courtesy of MVO.
| Date | Shortening (-) or lengthening (+)/day(s) | Line or triangle |
| 01 Aug 1996 | -4 mm | Whites-Castle Peak |
| 02 Aug 1996 | -12 mm/3 days | Whites-Castle Peak-Long Ground |
| 03 Aug 1996 | -2 mm/1 day | Whites-Castle Peak |
| 03 Aug 1996 | -9 mm/1 day | Long Ground-Castle Peak |
| 06 Aug 1996 | -3 mm/2 days | Whites-Castle Peak |
| 06 Aug 1996 | -2 mm/3 days | Long Ground-Castle Peak |
| 07 Aug 1996 | -8 mm/1 day | Whites-Castle Peak |
| 07 Aug 1996 | -8 mm/1 day | Long Ground-Castle Peak |
| 09 Aug 1996 | -25 mm/2 days | Whites-Castle Peak |
| 09 Aug 1996 | -31 mm/2 days | Long Ground-Castle Peak |
| 10 Aug 1996 | -1 mm/1 day | Whites-Castle Peak |
| 10 Aug 1996 | -16 mm/1 day | Long Ground-Castle Peak |
| 12 Aug 1996 | +24 mm/28 days | Amersham-Amersham slope |
| 12 Aug 1996 | -28 mm/28 days | Amersham-Chances Peak |
| 16 Aug 1996 | -11 mm/2 days | Whites-Castle Peak |
| 16 Aug 1996 | 0 | Long Ground-Castle Peak |
| 18 Aug 1996 | +4 mm/2 days | Whites-Castle Peak |
| 18 Aug 1996 | +1 mm/2 days | Long Ground-Castle Peak |
| 19 Aug 1996 | -16 mm/55 days | Galways-Chances Peak |
| 19 Aug 1996 | -12 mm/55 days | Ogarras-Chances Peak |
| 22 Aug 1996 | -16 mm/16 days | Windy Hill-Farrell |
| 23 Aug 1996 | 0 | Amersham-Amersham slope |
| 23 Aug 1996 | +29 mm/11 days | Amersham-Chances Peak |
| 25 Aug 1996 | -14 mm/7 days | Whites-Castle Peak |
| 25 Aug 1996 | -7 mm/7 days | Long Ground-Castle Peak |
| 25 Aug 1996 | -4 mm/6 days | Galways-Chances Peak |
| 25 Aug 1996 | -5 mm/6 days | Ogarras-Chances Peak |
| 26 Aug 1996 | -1 mm/1 day | Whites-Castle Peak |
| 26 Aug 1996 | -1 mm/1 day | Long Ground-Castle Peak |
| 27 Aug 1996 | -14 mm/1 day | Whites-Castle Peak |
| 27 Aug 1996 | -1 mm/1 day | Long Ground-Castle Peak |
Reference. Francis, P., 1996, Volcanoes - danger and dependency: News and Views, Nature, v. 383 (5 Sept.), p. 28.
Information Contacts: Montserrat Volcano Observatory (MVO), c/o Chief Minister's Office, PO Box 292, Plymouth, Montserrat (URL: http://www.mvo.ms/); NOAA/NESDIS Satellite Analysis Branch (SAB), Room 401, 5200 Auth Road, Camp Springs, MD 20746, USA; Susan and Eddie Edgecombe, and Betty Dix, Tradewinds Real Estate, Box 365, Plymouth, Montserrat; Glenn Lewis, c/o Doug, Deb, and Paul Darby, 6 Satinwood Road, Rocky Point, NY 11778 USA.
Large destructive explosion 17 September
The following condenses the weekly Scientific Reports of the Montserrat Volcano Observatory (MVO) and stated sources for the period 1 September-1 October.
Observations during 1-14 September. The early days of the month were characterized by several periods of intense rockfalls and pyroclastic flows from the E flank of the lava dome. The steepening of the dome's active flank caused a partial gravitational collapse on 2 and 3 September. The resulting pyroclastic flows were generally confined to the S part of the Tar River valley although they came from N of Castle Peak (figure 10). The pyroclastic flows caused significant erosion in the middle part of the valley and deposition in the lower part and at the mouth of the Tar River, on the pyroclastic-flow delta built up since late July. Excavation of a deep (>10 m) channel from the base of the new dome through the upper part of the talus fan confined the flows giving them greater run-out potential. The scar left on the E flank was soon refilled by continuous rockfall activity and new dome growth. Samples of the pyroclastic-flow deposits on the delta contained less vesicular material than other deposits since late July, and were typically ash-rich, very poorly sorted, and contained juvenile lava blocks to at least 50 cm diameter.
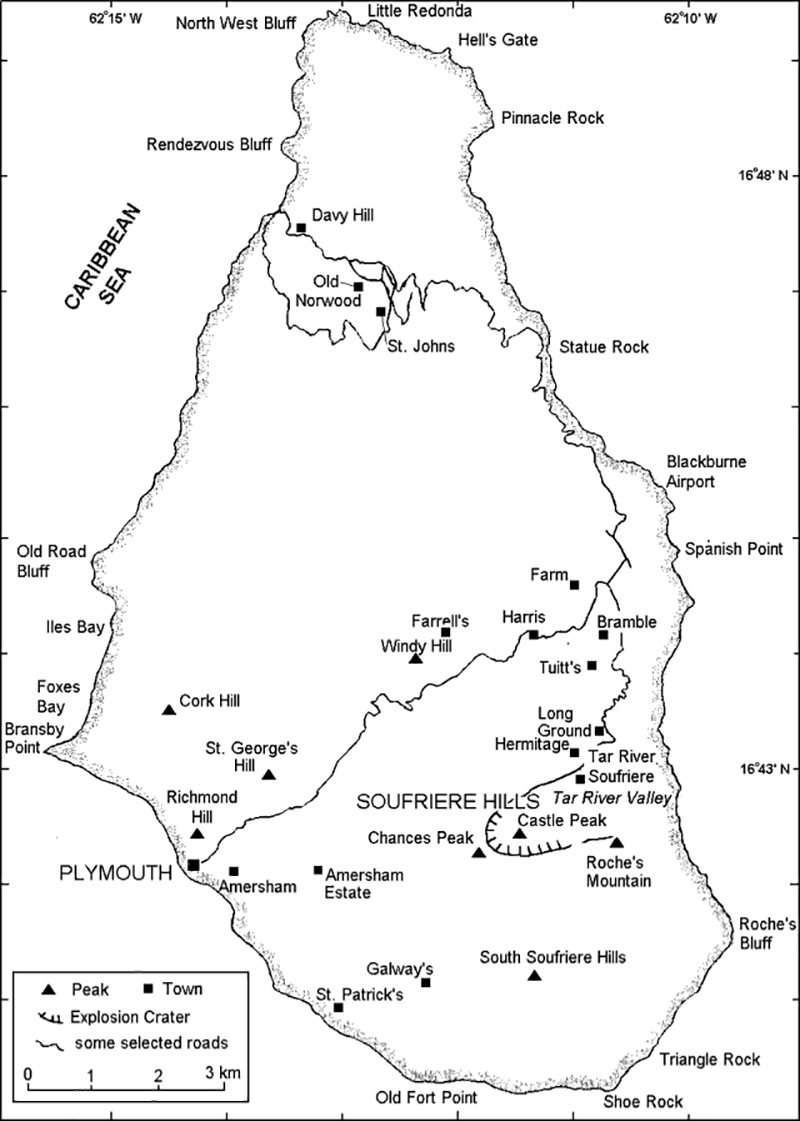 |
Figure 10. Map of Montserrat showing selected towns and features. |
The pyroclastic flows of 2 and 3 September produced ash clouds that rose 6 km, but there was no evidence of vertical columns from the summit of the dome. The ash clouds deposited 1-2 cm of ash in the Cork Hill area, and >5 mm farther N in the Old Towne area. MVO estimated the volume of ash deposited on 2 and 3 September to be equivalent to a rock volume of 7 x 10⁴ m3. In addition to this description from MVO, a local newspaper, The Montserrat Reporter, said these events caused ash to fall on nearly every part of the island from St. Patrick's in the SW, to St. John's in the N, and from Plymouth in the W to Long Ground in the NE, including Bramble Airport. For the remainder of the period, rockfall and associated pyroclastic-flow activity was confined almost exclusively to the E flank. After the major ash falls of 2 and 3 September more moderate amounts were deposited W of the volcano.
Signals from rockfalls and pyroclastic flows dominated the seismic records during this observation period. Long-period and hybrid events remained at background levels and tremor was generally low. Volcano-tectonic earthquakes occurred exclusively in short swarms lasting 1-6 hours. The volcano-tectonic earthquakes were all located <2 km below sea level beneath the crater.
The passage of a hurricane caused several days of strong winds and heavy rain making visual observation of the dome difficult, and causing flash floods that deposited ~60 cm of sediment in Fort Ghaut's lower reaches.
Observations during 15-21 September. Several small pyroclastic flows occurred on 15 September, the largest reaching beyond the Tar River Soufriere. Ash clouds from rockfalls and flows were generally blown NW. Intense ash and steam venting during 1250-1320 on 15 September came from the highest part of the dome W of the active area.
Near-continuous rockfalls started late on the morning of 16 September and by mid-afternoon, numerous pyroclastic flows were being produced by gravitational collapse from the lava dome. Many of these pyroclastic flows reached the sea, extending considerably the depositional fan at the mouth of the Tar River valley. Continuous ash production from the flows fed into a convective column that reached heights of 2-3 km and deposited ash on areas W of the volcano. Activity slowed somewhat in the middle of the evening as pyroclastic flow generation stopped.
Activity restarted at 2342 on 17 September with a small explosive eruption. A laterally directed explosion projected ballistic clasts toward the E (over the Hermitage area and into Long Ground village) and an eruption column was briefly sustained. More than half of the houses in Long Ground were damaged by blocks falling through roofs, doors, and windows. Eight buildings, including the Pentecostal Church, were burnt in Long Ground, all from extremely hot rocks falling on them. The Tar River Estate House was partially demolished by a pyroclastic surge. Gravel-sized material of both pumiceous and dense nature was deposited at Cork Hill, Richmond Hill, and Fox's Bay from the eruption column. The Montserrat Reporter noted that many vehicles had lost their windscreens from "falling pebble rocks". On the other hand, MVO data suggested that the number of windscreen breakages was actually quite low and that ash loading contributed substantially to breakages. All ash erupted during the night was blown W over Plymouth and Richmond Hill and both of these areas received heavy ashfall.
In an electronic forum, Douglas Darby, an eyewitness, reported: "From Iles Bay, you could hear something coming from the direction of the volcano, at about [2345 on 17 September]. It sounded like a low roar, the first time ever in Iles Bay that you could hear any noise from the volcano. Immediately after, thunder and lightning began and it was obvious that this was not anything experienced before . . . And then the rain of stones began . . . Visually you could not really see much at that time but we thought we could see a low level of glowing all across the area where we know is Tar River, from the direction of the pyroclastic flows."
Reports from the NOAA Satellite Analysis Branch indicated that the ash column attained a height of at least 12 km and caused the closure of the airport in Guadeloupe on the morning of 18 September. Pilot and NOAA reports and personal communication with Tom Casadevall indicated that an Air Canada flight inadvertently entered the ash plume on 17 September. Dave Schneider of MTU collected and processed two AVHRR scenes of the ash plume from 18 September: at 0544 the plume was 175 km long E-W and 75 km wide N-S, at 1018 the cloud became very diffuse as it extended 550 km E and 85 km N-S (figure 11).
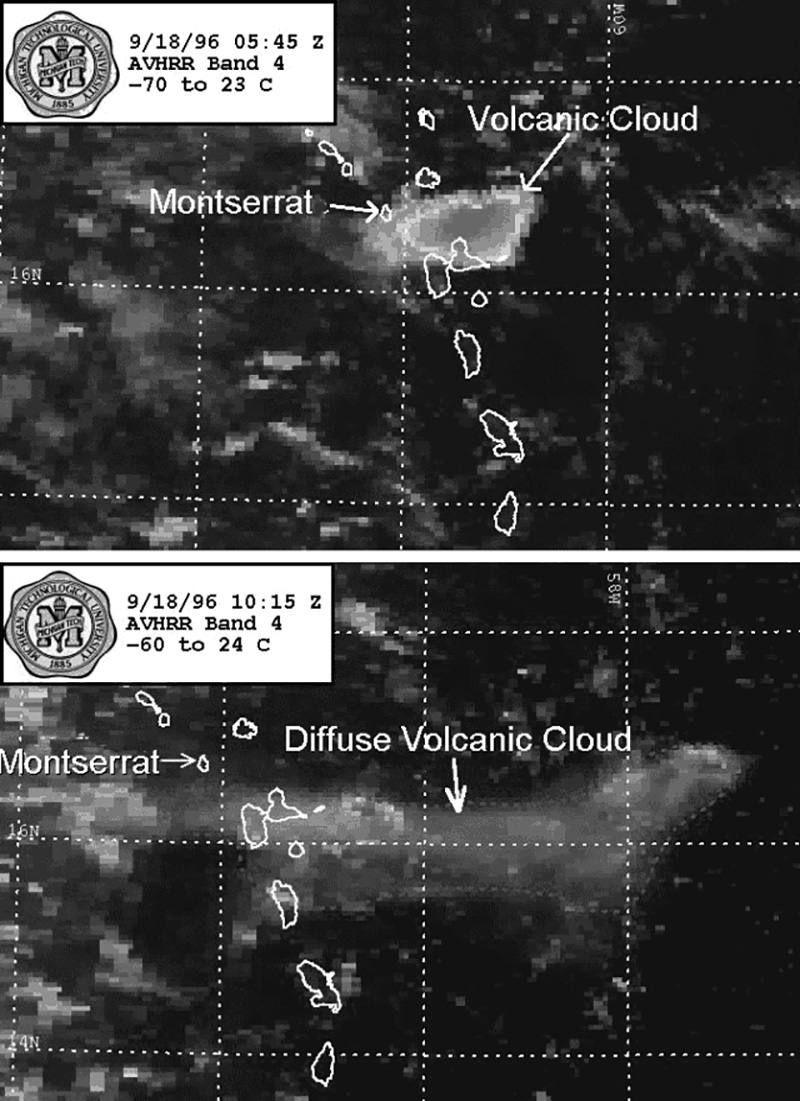 |
Figure 11. AVHRR images of the 18 September ash cloud from Soufriere Hills. Courtesy of Dave Schneider, MTU. |
A major collapse scar cut deeply into the new dome's E flank. Some material was eroded from Castle Peak and a large volume was deposited in the Tar River Valley. The delta at the mouth of the Tar River Valley was enlarged and the vegetation was completely destroyed. MVO estimates stated that perhaps 25-30% of the new dome was removed.
Several small rockfalls from the inner steep-sided walls of the scar, particularly on the N and NW, generated small ash clouds and deposited new debris at the base of the valley. On 19 September field workers found pumice clasts of up to 95 g at 3 km and clasts up to 3.5 g at 6 km. On 22 September a sampling expedition to the Tar River area obtained a temperature of 373°C at a depth of 45 cm in the pyroclastic-flow deposits close to the Tar River Estate House.
Seismicity during this period was characterized by brief swarms of volcano-tectonic earthquakes from a shallow source. These swarms occurred immediately before the most intense rockfalls and increased in frequency and duration preceding the 17-18 September explosion. After 18 September the frequency of volcano-tectonic earthquakes decreased from 2-3 swarms/day to single isolated events at the end of the observation period. Long-period and hybrid events remained low, averaging <11 events/day; low-amplitude tremor was recorded on the Gages seismometer.
Observations during 24-30 September. Activity kept decreasing in intensity during the last part of the month. On 24 September visual observations of the scar's interior showed no signs of new material apart from debris derived from rockfalls off the side walls. Abundant steaming and sulfur deposits were observed at the base of the scar. Rockfalls were very small, mainly concentrated within the scar and associated with continued stabilization of the inner walls of the scar. The lack of large rockfalls suggests that any new dome growth was limited to the interior of the dome, probably at the base of the scar feature caused by the 17 September explosion. On 26 September some red-hot rock and high-temperature gases were seen in the bottom of the scar, suggesting that fresh magma was getting close to the surface again; however material falling from the scar walls covered any new dome growth. Light ashfall, possibly associated with small rockfalls into the scar, was observed by a field team near Chances Peak on 28 September.
On 30 September some areas to the SW and along the base of the scar showed light swelling. This may be due to new dome growth beneath the blocky deposits that line the base of the scar. The N part of the scar had a vertical cliff face with a nearly horizontal, bowl-shaped base, grading downward and outward to the Tar River Valley. Several unstable blocks were observed on the top inner parts of the NE sides of the scar.
Small rockfalls were the most dominant type of seismic signal recorded during this period, but hybrid and volcano-tectonic activity became more prominent during the latter part of the week. Volcano-tectonic earthquakes reappeared from 26 September onwards. They were transitional to hybrid events with a short high-frequency onset and low-frequency coda. The levels of long-period and hybrid events remained comparatively low throughout this period, averaging <11 events/day. Hybrid activity increased somewhat during the latter part of the week in tandem with the increase in volcano-tectonic activity. Tremor levels were high during the earlier parts of the week due to heavy rains. In Fort Ghaut, mudflows resulted from remobilization of thick ash deposits from the 17-18 September explosion.
EDM measurements. Measurements taken on 11 September from White's Yard to Castle Peak showed a 1 cm/day shortening trend, slightly higher than the trend established since mid-July. The Galway's to Chances Peak line was measured on 13 September, but it continued to show inconsistent changes, although shortening was predominant.
On 16 September a shortening of 2.8 cm on the St. George Hill-Farrell's line (N triangle) was measured since 22 August, whereas the two other lines in this triangle -- Windy Hill-Farrell's and St. George's Hill-Windy Hill -- did not change. Between 16 and 21 September the lines St. George's Hill-Farrell's and Windy Hill-Farrell's lengthened by 4 and 9 mm, respectively. These changes, however, are not considered to be related to the 17-18 September explosion. On 25 September the N triangle showed shortening on the St. George Hill-Farrell's and Windy Hill-Farrell's lines of 4 and 11 mm, respectively. Although little consistency is found in the changes of this triangle, a slight overall trend of shortening is observed.
Line lengths between Lower-Upper Amersham and Lower Amersham-Chances Peak showed changes of +48 mm and -1 mm, respectively, during 20-26 September. On 30 September the Galloways-Chances Peak line was found to have lengthened 13 mm during the previous 16 days.
Information Contacts: Montserrat Volcano Observatory (MVO), c/o Chief Minister's Office, PO Box 292, Plymouth, Montserrat (URL: http://www.mvo.ms/); NOAA/NESDIS Satellite Analysis Branch (SAB), Room 401, 5200 Auth Road, Camp Springs, MD 20746, USA; Bennette Roach, The Montserrat Reporter, v. XII nos. 33 and 35, Tom Casadevall, U.S. Geological Survey, Menlo Park, CA 90210 USA; Dave Schneider, Michigan Technological University, Houghton MI 49931, USA; Doug Darby, 6 Satinwood Road, Rocky Point, NY 11778 USA.
The new dome, first observed on 1 October, continues to grow
The following condenses the weekly Scientific Reports of the Montserrat Volcano Observatory (MVO) for the period 1 October-2 November.
As this isue was being finalized in late November, observations of cracks on Galway's Wall caused concern that failure of the crater wall could lead to a catastrophic event.On the afternoon of 26 November the area SW of the volcano was upgraded to risk zone A. This zone extends from S of O'Garra's to Gingoes Gaut. The alert level was also raised to Amber. Additional details will be provided next month.
Visual observations. Clear weather from 1 to 4 October allowed excellent views of a new lava dome (figure 12) growing in the scar left by the 17-18 September explosion (BGVN 21:09). This new dome was light gray in color with a blocky texture and without spines. It developed a flat-topped, steep-sided, solid cap, apparently raised up intact by later endogenous growth. As it grew from 782 to 793 m during 1-2 October, it's base expanded southward to fill the bottom of the scar.
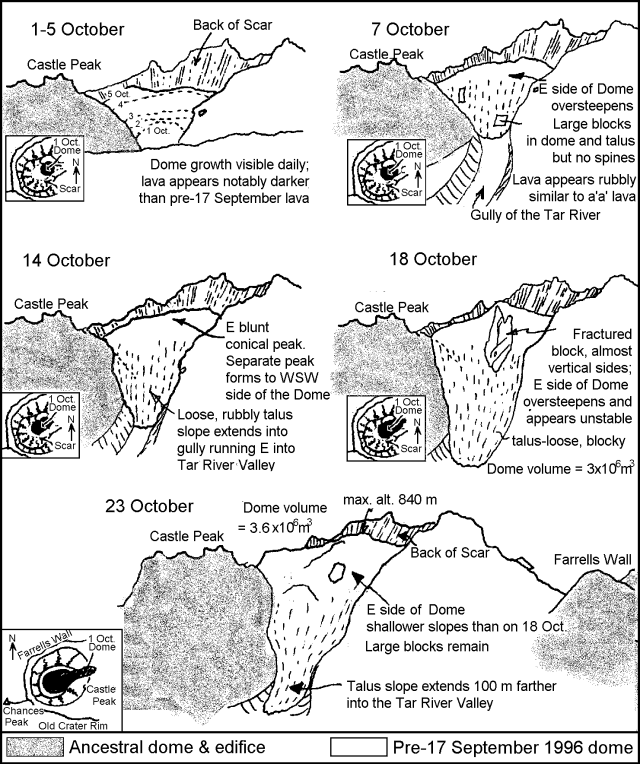 |
Figure 12. Growth of the new lava dome at Soufriere Hills during 1-23 October 1996. View is from the ENE. Courtesy of MVO. |
On 7 October the dome was ~75% of the height of Castle Peak dome and appeared to be growing as a single cohesive mass. By 8 October the SE side of the new dome was quite steep and several rockfalls were originating from the base of the E face. On 10 October the new dome was higher than the top of Castle Peak. It had expanded laterally, filling ~25% of the large scar. The dome was a chocolate-brown color, had an even surface, and a nearly rounded conical shape. Several small rockfalls from the flanks and vigorous steaming from all around the base were also observed.
Observations on 11 October revealed regular small cascades of incandescent material from both shoulders of the E face of the dome. During the daytime rockfalls were visible from the coast at the mouth of the Tar River. On 14 October peaks were observed on both the dome's SW and E sides, giving it a blocky morphology, more similar in appearance to previous domes. A small stubby spine was noted on 15 October, but it disappeared by the following day.
After mid-October there was an increase in the number of reported ash clouds. Although these ash clouds were small, reaching no more than 650 m above the crater area, their occurrence suggested a less stable dome surface. A bathymetric survey of the delta, carried out by boat on 16 October, revealed a steep termination, reaching depths of 20 m within a short distance of the shore.
On 18 October it was seen that the dome had grown rapidly on its N side and expanded toward the W, covering most of the scar floor. The E face was quite steep, with several unstable-looking blocks at the top of the slope; small rockfalls were observed from it whenever the clouds lifted.
The height of the dome had increased to 829 m by 22 October (from 808 m on 18 October). Rockfalls were occurring from the N side of the scar and vigorous steaming was observed from the S of the dome. On 23 October some moderate-sized rockfalls produced small ash clouds; the collapse of a small spine was observed and new growth was seen on the S side of the E face of the dome (figure 12).
On the morning of 29 October several rockfalls from the E face of the dome occurred during and after a thunderstorm, and produced small ash clouds. The deposits from these rockfalls went farther down the Tar River valley than any previous rockfalls since the 17-18 September explosion. On 1 November, new deposits suggested that some parts of the E face had collapsed. Other changes to the dome were limited to a general increase in the height, and the appearance of a small stubby spine on its top. On 2 November a new area of activity was observed NW of the new dome, on the edge of the scar. This area was steaming and degassing vigorously, and seemed to be deformed, suggesting a new intrusion was taking place.
Seismicity. Seismicity remained low, a pattern established following the explosion of 17-18 September. Rockfall signals were the dominant events for the first half of the month, whereas volcano-tectonic and long-period earthquakes became more frequent after mid-October. The long-period signals were often associated with observed rockfalls, but were possibly due to some internal dome process (gas expansion?) associated with collapse of the dome. These signals were similar to isolated tremor episodes observed during dome growth at Unzen in Japan.
The first volcano-tectonic swarms occurred from 2200 on 17 October to 0430 on 18 October, and from 1300 on 18 October to 0130 on 19 October. Most locations were shallower than 1 km, and the signals showed extended long-period codas at some stations, consistent with very shallow hypocenters. The two deepest earthquakes were located respectively at ~6 km under Roaches Yard, and at ~15 km, 4 km E of the crater. From 21 October the volcano-tectonic earthquakes occurred in swarms of variable duration and return times. Only a few volcano-tectonic earthquakes were recorded outside of the swarm episodes: one event on 22 October was located at a depth of 5 km to the N of the crater and two events were ~2 km beneath St Georges Hill.
The largest volcano-tectonic swarm (in terms of total numbers of events and duration) recorded since the start of dome growth occurred on 1 November and lasted until 2031 on 02 November (413 events) (figure 13). Many of these events were large enough to be located, and mostly occurred at shallow depths (>2 km). This swarm included a set of deeper events at 3-4 km beneath the crater. Similar swarms occurred in the weeks prior to the 17-18 September explosion, although they were of shorter duration, occurred more frequently, and lacked deeper earthquakes.
 |
Figure 13. Time and depth of volcano-tectonic events at Soufriere Hills as recorded during 27 October-2 November. Courtesy of MVO. |
The level of tremor was low; Gages station continued to record intermittent tremor. Higher tremor levels were often associated with increased steam venting and as a result of heavy rainfall.
EDM, COSPEC, dome volume, and other measurements. EDM measurements on the lines of the E triangle had the following results: Whites-Castle Peak line shortened by 8 mm (7-8 October), lengthened by 6 mm (8-10 October), and shortened by 2.5 cm (10-19 October); Long Ground-Castle Peak shortened by 3.4 cm (10- 19 October). All the E triangle's lines shortened by 3-4 mm (19-22 October) and by 9 cm ( 23 October-2 November). This was consistent with the long-term trend of line shortening at a rate of 1 cm/day, maintained since mid-July 1996.
For the S triangle, the Galways-Castle Peak line lengthened by 1.8 cm (6-19 October) in its second successive lengthening. For the N triangle, the St George's Hill-Farrells and Windy Hill-Farrells lines lengthened by 3 and 5 mm, respectively, on 21 October, and by 12.5 and 3 mm during 21-26 October. These lines have been quite erratic, but show long-term trends of little or no change. Measurements were also made between the Tar River Estate House and Castle Peak on 28 October, the first time this line was measured since 25 August. The original reflector was destroyed during the 17-18 September explosion, and so the line length could not be compared to previous measurements. Radial W-flank lines were measured on 1 November, between Upper and Lower Amersham, and Dagenham and Chances Steps. Most of these lines were stable, except for the line between Upper and Lower Amersham, which showed an irregular ± 5 cm variation, with no consistent change.
COSPEC measurements were carried out on 10 days in October (13, 15, 17, 21, 23, 24, 26, 27, 28, 31) and on 2 November. All the COSPEC measurements were made by running traverses beneath the volcanic plume along the W coast road. The average flux readings were 550, 650, 1110, 580, 449, 1519, 290, 434, 498, 311, and 267 metric tons/day, respectively. The values over 1,000 t/d obtained on 17 and 24 October were the highest recorded since the beginning of the volcanic crisis.
Three GPS surveys revealed that changes in slope length have not been significant at the 95% confidence level, with all variations within two sigma of the measurement error. This indicates the absence of a widespread deformation field associated with the eruption.
Range-finding binoculars and GPS equipment enabled investigators to estimate the dome's recent effusion rate as 1.8 m3/s. The estimated volumes were the following: 2.0 x 10⁵ m3 (2 October); 4.7 x 10⁵ m3 (3 October); 1 x 10⁶ m3 (10 October); 3 x 10⁶ m3 (18 October); and 3.7 x 10⁶ m3 (23 October).
Results of gas analysis of the Galways Soufriere carried out on 4 July were received from the Volcano Observatory in Guadeloupe. There were no significant changes in gas composition compared with earlier samples; the gas was dominated by CO2 (60%) and H2S (39%).
Information Contacts: Montserrat Volcano Observatory (MVO), c/o Chief Minister's Office, PO Box 292, Plymouth, Montserrat (URL: http://www.mvo.ms/).
Cracks and landslides on SW wall cause major concern
The following condenses the weekly Scientific Reports of the Montserrat Volcano Observatory (MVO) for the period 2 November-8 December 1996.
Visual observations. At the beginning of November growth concentrated in the central W part of the 1 October dome, which lies in Englishs crater N and adjacent to Castle Peak, an ancestral dome. The new dome's height was measured at 880 m on 5 November; the same day a new spine was noted on its SW side. Rainfall and a lack of vegetation contributed to a 6 November landslide on the S flank of the crater, above Galway's Soufriere (figure 14). On 7 November incandescent material was seen on the top and N edge of the 1 October dome. The spine first seen on 2 November increased in height and partially collapsed by 9 November. On that day, large amounts of steam were observed over the dome complex especially in the S part at the contact with the Castle Peak dome; several small gullies from recent rockfalls were also seen on the N part of the 1 October dome.
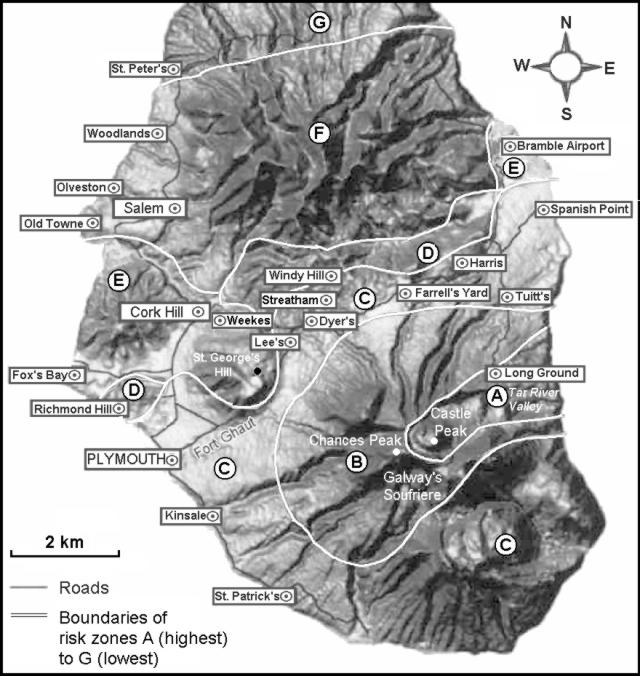 |
Figure 14. Volcanic risk map of Montserrat, 1 October 1996. English's Crater contains Castle Peak (an old dome) and new domes from this eruption; Chances Peak is the high point on the crater rim, and other sections of the crater wall are named for adjacent geographic features (Galway's Wall, Farrells Wall, etc.). Modified from a map provided courtesy of the Montserrat Reporter. |
Throughout the second week of the month there was intense steaming from the area around Castle Peak. On the ediface's SW side, heavy rains caused more rock slides on the SW face of Galway's Wall and its upper reaches appeared thin and unstable. On 14 November blocky light gray lava extruded on the dome's N flank, and on its S side it bulged.
On 17 November there were two rockfalls from the N side of the dome and the subsequent small pyroclastic flows were channeled down the canyon's E side. For the first time since the start of the 1 October dome growth, these rockfalls extended ~500 m from the dome, beyond the slope's break at the base of Castle Peak.
Late on 21 November, the new growth areas on the 1 October dome were clearly distinguishable as zones of continuous glow and occasional falls of glowing material mainly from the N and NE faces of the dome, and at times from the NW. Many of the rockfalls emanated from close to the top of the dome, just below several new small spines. On 22 November, the 1 October dome was seen clearly from the NW of the volcano for the first time. The dome was pale gray in color and blocky, in contrast with its scoriaceous, smoother, chocolate-brown appearance in October. Steam escaped at both the SW rim of the September 17-18 explosion scar, and to the W of the active dome.
On 23 November, several vertical cracks on Galway's Wall (SW section of the crater wall) appeared longer than before, extending down much of the face. The lava dome and talus had piled up behind this wall to a depth of ~120 m, with only ~30 m of wall remaining above it.
Growth during the last two weeks of November was predominantly in the N and SW sectors of the 1 October dome, resulting in flattening of the top of the dome into a broader plateau with no change in height. The volume of the 1 October dome was estimated as 4.47 x 10⁶ m3 (dense rock equivalent: DRE) on 24 November and 4.65 x 10⁶ m3 (DRE) by 1 December. This is equivalent to a mean extrusion rate of 47,500 m3/day, significantly less than the 86,250 m3/day estimated for the period 7-24 November. The active NE face of the dome fed two erosive chutes. About 180,000 m3 (DRE) of material was added to the developing talus fans associated with the new dome.
On 26 November, Galway's Wall showed signs of considerable weakening with a series of fractures visible on the wall surface, and talus from small rock avalanches on the inner and outer portions of the wall. The wall was largely composed of interbedded lithified talus and block-and-ash deposits from prehistoric eruptions, cross-cut by ~2-m-wide lateral sills and an anastomosing dike (~3 m wide). The base of the wall largely consisted of relatively thinly bedded tuffs dipping toward the center of English's Crater.
On the morning of 27 November, a large rockfall from Galway's Wall dislodged ~150,000 m3 of material. This avalanche traveled as far as the break in slope, ~300 m from the crest of the wall. Some small pyroclastic flows were also generated on 27 November; they reached a maximum runout of 800 m. Overnight on 27 November, heavy rainfall swept up old pyroclastic-flow material in the Tar River valley and landslide material in the White River and generated lahars. In the meantime, collapses from the 1 October dome caused small pyroclastic flows. Extremely limited dome growth took place in late November.
On 29 November a new series of NW-SE fractures dipping steeply E was observed on Galway's Wall. On 1 December two vertical fractures, trending ~60°, were seen E of Chances Peak near the intersection with Galway's Wall. These large fractures were >50 cm wide and extended at least a few meters below the surface of the wall.
Rockfall activity from Galway's Wall (both on the inner and outer walls) accelerated in association with an intense volcano-tectonic earthquake swarm from 30 November to 8 December. As a result, at least two more avalanches similar to that of 27 November occurred, along with many smaller events. Coarser rockfalls were associated with avalanching from the central portion of the wall.
Seismicity. A swarm of volcano-tectonic earthquakes on 1-2 November marked the most intense period of activity since dome growth began in November 1995 (BGVN20:10); it was also the only swarm during the current activity with hypocenters deeper than 3 km. All the other earthquakes in the November swarms were <2 km beneath the crater. The week of 2-9 November was also dominated by a swarm of volcano-tectonic earthquakes (389 events). Another swarm (212 events) began on 9 November and lasted until 12 November. Shorter swarms of volcano-tectonic earthquakes occurred on 14 November (40 events), and on 19-20 November (53 events). Apart from these swarms, volcano-tectonic activity was limited to occasional single earthquakes during the rest of November.
The number of rockfall signals increased during 20-24 November, but the level of activity was still much lower than that in the months prior to the September 17-18 explosion. Rockfall activity returned to a low level by 26 November.
A strong inverse correlation between dome rockfalls and the shallow volcano-tectonic swarm activity was observed. Dome rockfalls were not completely absent during seismic swarms, but some may have been due to strong shaking of the unstable dome. On 28 November strong, continuous seismic signals were recorded at most stations in the seismic network. The signals were caused by pyroclastic flows in the Tar River Valley and debris flows along Tar River, White River, and Fort Ghaut.
A correlation between Galway's Wall landslides and seismic signals enabled retrospective identification of previous large landslides: the strong shaking caused by volcano tectonic events triggered landslides on Galway's Wall. Using this criterion, rock avalanches from the Galway's Wall were found to have occurred since at least as early as 24 October, but the largest of these by far occurred on 4 November. No landslides were recorded during the intense seismicity on 1 and 2 November.
The largest volcano-tectonic earthquake swarm recorded since [the start of the eruption] began on 30 November and ended abruptly on 8 December (figure 15). In that time, 1,671 earthquakes were recorded. Figure 14 shows data on the volcano-tectonic activity between 23 November and 8 December as well as the amplitudes of individual events at the Gages seismic station, which was closest to the activity. The plot of amplitude logarithm (proportional to the magnitude) shows that the size of the largest events slowly increased during this swarm. Some of the larger events (M ~3) were felt by residents of Weekes, the closest occupied area, on the NW side of St. Georges Hill (figure 14). A bimodal pattern to the magnitudes was observed, with small earthquakes (M ~1) dominating. During the increase of activity up until 5 December, the number of small earthquakes increased with time, while the number of large ones remained almost constant. This meant that the b-value of the earthquake distribution increased, although these earthquakes clearly did not follow a classical magnitude-frequency relationship.
 |
Figure 15. Volcano-tectonic earthquake activity recorded by the broad-band seismic network at Soufriere Hills. Courtesy of MVO. |
MVO scientists postulated that the volcano-tectonic earthquakes were caused by pressurized magma at shallow depths. When the magma outlet becomes periodically blocked, a slow down of the dome growth and reduction in rockfalls occur. In the meantime the high-pressure build-up causes rock fracturing around the magma body. If the magma behaves as a non-Newtonian fluid it requires a certain pressure to yield and flow. The correlation between Galway's Wall landslides and the volcano-tectonic swarms suggests that magma pressurization is increasing the stress on the base of the wall. The occurrence of deeper earthquakes at the start of this phase of activity (mid-October) and during the increased activity of 2 November, suggests that the current phase is a response to some deeper volcanic activity, possibly injection of fresh magma.
Ground deformation. EDM measurements made on the E triangle (Long Ground-White's-Castle Peak) between 4 and 8 November were consistent with the recently established shortening trend of ~6 mm/day. The shortening trend on the E triangle continued during the second week of the month, although its rate slowed to ~5 mm/day. Between 18 and 30 November, the lines shortened ~6 mm/day. The last measurement on 4 December showed 3.8 cm shortening over a four-day period, a significant rate increase.
The N triangle (Upper Farrell's-St. Georges Hill-Windy Hill) was measured on 5 November. The lines from Windy Hill and St Georges Hill to Upper Farrell's shortened by 3 mm and 8 mm, respectively, since these were last measured on 27 October. These lines are quite erratic, and show long-term trends of little or no change. The Galway's-Castle Peak line (S triangle) was remeasured on 2 December, following replacement of the EDM reflector on Chances Peak. A line shortening of 2.6 cm since 19 October was recorded, a rate higher than the previous trend on this line.
EDM measurements on the W flank of the volcano on 7 November showed that the line lengths between Upper and Lower Amersham (near Plymouth) shortened by 1 mm since November 1, whereas those between Lower Amersham and Chances Peak lengthened by 5 mm during the same period, without following any particular trend.
Deformation data suggested that movements are confined to the upper flanks and are thought to be due to loading of the upper part of the edifice by the new dome, and localized thermal expansion and pressurization of the magma conduit at shallow depths.
GPS measurements on 3, 6, 16, 23, 25, 26, and 27 November and 5 and 7 December indicated that all line lengths and station heights did not undergo major changes and remained within the 95% confidence level of their long-term means. Only radial lines to the Farrell's benchmark high on the N flank of the volcano showed signs of movement, although within formal errors.
A dome-volume survey was made on 7 November using GPS equipment and range-finding binoculars. The volume estimate was, within error, the same as that obtained from the previous survey on 23 October (BGVN 21:10).
Gas, ash, and rainwater measurements. COSPEC measurements were carried out on nine days in November (3, 5, 10, 11, 13, 14, 16, 18, and 19). All COSPEC measurements were made by running traverses beneath the plume along the W coast road. The average flux readings were 371, 155, 240, 227, 178, 243, 176, 363, and 250 metric tons/day, respectively. These values are similar to recent measurements, indicating that only low amounts of sulfur dioxide are emitted from the volcano during periods of dome growth. Daily fluctuations do not suggest any strong link between SO2 production and earthquake swarms. Analysis of SO2 diffusion tubes at five sites W of the volcano showed that the averaged concentrations of SO2 correlated with the COSPEC measurements.
Rainwater samples collected on 4 November from Upper Amersham, the site closest to the volcano, showed the lowest pH (3.3) recorded. Rainwater collected N and W of the volcano on 10 and 14 November showed continuation of the highly acidic rainfall, particularly W of the volcano. A sample from a pond in the upper Amersham area showed very high levels of chloride. Rainwater samples analyzed for the period 14 to 17 November had low pH values (3.0 to 3.6), with the exception of Weekes, which was neutral.
Hazard assessment. The alert level was raised from Amber to Orange early in the morning of 28 November because of the increased instability of Galway's Wall and fears that catastrophic collapse of the wall might cause a lateral blast. The risk map in effect during October (figure 14) was modified on 26 November because of the increased risk to St. Patricks and surrounding areas on the volcano's SW side. On 3 December, complete closure of zones A to D was recommended as a temporary measure, because the scientific team thought that a larger collapse was possible. Such an event would involve more of the S part of the crater wall, potentially causing major dome instability and pyroclastic flows in any direction. This change was formalized on 5 December with a temporary revision of the risk map, which included all of the S of the island, from Foxes Bay across to Spanish Point, within zone A/B.
Information Contacts: Montserrat Volcano Observatory (MVO), c/o Chief Minister's Office, PO Box 292, Plymouth, Montserrat (URL: http://www.mvo.ms/); The Montserrat Reporter, Plymouth, Montserrat (URL: http://www.tiac.net/users/wcwdaj/reporter/reporter.htm).
Dramatic fracturing on SW wall as dome growth continues
The following condenses the daily Scientific Reports of the Montserrat Volcano Observatory (MVO) for the period 9 December 1996-10 January 1997.
Visual observations during 9-31 December On 9 December it was noted that a crack on Galway's wall had opened 33 cm in five days. One side of the crack had moved by 7 cm, consistent with the wall being pushed outwards. Helicopter inspections on 10 December detected 20-m-deep cracks along and on top of this wall, making it very unstable. On 11 December a new dome appeared to the S of the 1 October dome, between Castle Peak and Galway's Wall (see map in BGVN 21:11). New fractures 100 m long and 1 m wide were seen at the E end of Galway's Wall.
On 14 December the new dome volume was estimated at 500,000 m3 ; having grown over a period of 2-3 days, its extrusion was comparable to the initial rates for the 1 October dome. On 15 December the new dome's top was at 910 m, higher than the October 1 dome at that time; growth had occurred along a linear structure oriented ESE. By 16 December the top of the dome was estimated at 920 m. Observations that day showed that the dome had nearly filled the scar left by the explosion in September and that a new spine had grown from its top.
On 17 December the new dome started to overflow the September explosion scar; this caused several moderate-sized rockfalls and small pyroclastic flows into the Tar River that traveled ~250 m from the dome. That day the new dome was 909 m high, its surface rubbly with coarse blocks, and its shape conical with a flat top and two spines. Comparison of recent dome surveys with previous results showed that older material near the new dome rose 80 m, a volume change of perhaps 7 x 10⁶ m3 since the beginning of December. On 17 December several large steam clouds ascended above the volcano, probably caused by steam venting from the new dome.
On 19 December the new dome's E face was near-vertical and appeared very unstable. Discrete pulses of rockfalls and small pyroclastic flows from the dome occurred only a few minutes apart; these descended as far as 1 km along the gully on the S side of Castle Peak creating many small ash clouds that rose 300 m above the crater and drifted slowly W. A dome survey carried out using laser-ranging binoculars estimated the new dome's volume at approximately 800,000 m3, yielding an extrusion rate of 0.5 m3/s. That evening both the E side of the new dome and part of the pre-September dome failed, causing moderately large pyroclastic flows. These flows traveled down the Tar River and over its fan reaching to within 40 m of the sea; ash clouds rose 3 km and were carried SW. As the flows were generated observations from the airport suggested that fresh lava emerged into the dome nearly as quickly as it was lost in the flows. The next day, ground and helicopter observations indicated a reactivation of the 1 October dome growth. Many small rockfalls descended the 1 October dome's N side, fewer from its S side. Small pyroclastic flows generated ash clouds characterized by little convection, possibly suggesting that colder material was involved. This was confirmed by observations during the night using an infrared imaging system. This imaging system also showed that the entire 1 October dome was active.
During the following days, rockfalls and pyroclastic flows caused many more ash clouds which deposited ash in Plymouth; associated clouds displayed robust convection, suggesting that hot, fresh material was involved. A helicopter inspection on 22 December confirmed that the activity was restricted to the 1 October dome and that there was no sign of activity on the 11 December dome.
On 23 December heavy rain caused mudflows in Fort Ghaut that carried half-meter diameter boulders into the sea. On 25 December some uplift was observed on the N flank of the October 1 dome, perhaps due to an injection of fresh lava. On 26 December satellite imagery showed ash ~100 km WSW at a height of 1-2 km.
Ground and helicopter observations on 26 December showed a significant amount of new material on the top of the dome, darker in color and smoother than the older material. On 29 December, glowing all over the NE flank and avalanching of incandescent blocks were observed. Incandescence in daylight suggested that this dome lava may have been hotter than previous dome lavas. A considerable amount of material was observed on 31 December falling down the N flank of the pre-September dome towards Farrell's Wall. The new material at the top of the dome had changed texture, and looked more slabby than before.
Visual observations during 1-10 January 1997. The first seven days of January were characterized by numerous rockfalls and small pyroclastic flows from the 1 October dome, mainly down its NE and E sides. Much of this activity was channeled into the Tar River valley by way of either an erosion chute cutting across the top of Castle Peak or one to its N. At times of peak activity the pyroclastic flows occurred every few minutes and the largest traveled ~300 m past the Tar River Soufriere. Many of the rockfalls and flows generated ash clouds that drifted W and SW, forming a semi-continuous ash plume observed at altitudes of 1.3-1.6 km. On 3 January the plume was reported at 2 km altitude, and on 4 January satellite observations detected the plume 360 km W of Montserrat.
Theodolite measurements of the dome on 5 January showed that although the height had remained relatively constant at ~900 m since 1 January, a new lobe of lava at the top of the dome was ~50 m thick. It was calculated that 4.6 x 10⁶ m3 of material was added between 25 December and 5 January, an extrusion rate of 4.4 m3/s. This was the highest sustained extrusion rate yet measured during this eruption. A helicopter inspection on 5 January revealed material slowly accumulating against the N crater wall; only 7 m of ridge remained above the divide to Tuitt's Ghaut. On 6 January the glowing dome appeared less steep in its upper part.
On 8 January several pyroclastic flows originating from behind Castle Peak moved down the Tar River Valley to reach beyond the Tar River Estate House; at least one pyroclastic flow reached the sea. Further growth was observed on the NW side of the 1 October dome, but was still contained inside the 17-18 September scar. Several new glowing channels eroded by the pyroclastic flows on the E side of the dome were visible. On 10 January a new, unstable-looking extrusion was observed in the middle of the heavily eroded chute crossing Castle Peak. This new extrusion was butterfly shaped and composed of slabs of fresh lava.
Seismicity and seismically detected mass wasting. Seismic activity during 9-11 December was characterized by swarms of shallow volcano-tectonic earthquakes, at times large enough to be felt close to the volcano. A few rockfalls from the dome and some landslides from the Galway's Wall were also detected by the seismic network, indicating that the wall became increasingly unstable during intense earthquake activity. However, a lack of seismicity on 12 December was accompanied by more landslides on Galway's Wall. During the following days rockfalls occurred sporadically, but their number slightly increased after 16 December, as the 11 December dome kept growing. Also, a few landslides from Galway's Wall suggested continued slow deformation. Seismicity increased on 20 December with a shallow volcano-tectonic earthquake swarm that reached the level of intensity of the early December swarms, although maximum magnitudes were not as large as before. Several rockfalls were also detected, mostly from the 1 October dome.
On 22 December the volcano-tectonic seismicity died out, rockfall signals continued, and hybrid seismicity reached April levels. This and increases in the quantity of ash and pyroclastic flows were taken as an indication that the dome growth rate had increased, but poor visibility prevented dome observations. By 24 December hybrid events and continuous tremor dominated the records, but by 27 December banded tremor reached a maximum. Banded tremor, which was last seen between late July and mid-September, had taken place associated with large pyroclastic flows and the 17-18 September explosion.
On 28 December large hybrid events and rockfall signals dominated, but regularly spaced bands of continuous seismic tremor returned on 30 December. Lower in amplitude than before, the banded tremor occurred at ~10-hour intervals. By 31 December the activity was again dominated by banded tremor episodes ~5 hours apart, and by hybrid earthquakes and rockfall signals. This pattern of seismicity continued during the first seven days of January. Volcano-tectonic earthquakes returned on 4 January with signals similar to the November and December events, but possibly from slightly greater depths (2-3 km). From 8 to 10 January, in correspondence with increased dome activity, the seismicity became dominated by rockfall and pyroclastic-flow signals.
COSPEC, EDM, and other measurements. COSPEC measurements were made on 27 and 28 December. The data from 27 December averaged 350 metric tons/day (t/d) but reached ~400 t/d shortly after one of the peaks in seismic tremor. The average fluxes on 28 December, and on 1, 4, 9, and 10 January were 325, 300, 400, 1,130, and 390 t/d, respectively. The increase in emission of SO2 measured on 9 January was probably due to a partial collapse of the dome.
EDM measurements carried out on the E triangle on 10 and 13 December suggested a continuation of the shortening trend started several weeks earlier. On 16 December, the S triangle had been unchanged since 4 December; on 18 December the lines N of the volcano had also not changed significantly since 5 November. The average shortening on the lines to Castle Peak during 20-22 December was 6 cm; such high rates of deformation had occasionally been seen in the past. In contrast, the shortening seen there during 26-28 December was small (2.4 mm). This drop in the deformation rate roughly coincided with the appearance of new material at the surface on the 1 October dome.
Gravity measurements on the E flank on 22 December showed no significant changes since July 1996. Changes at stations on the upper slope were consistent with the mass added to the dome.
Information Contacts: Montserrat Volcano Observatory (MVO), c/o Chief Minister's Office, PO Box 292, Plymouth, Montserrat (URL: http://www.mvo.ms/).
Ongoing dome growth, pyroclastic flows, and crack dilation
The following condenses the daily Scientific Reports of the Montserrat Volcano Observatory (MVO) for the period 12 January-8 February 1997. This interval was marked by noteworthy pyroclastic flows and visible dome destruction and growth. Galway's Wall, on the volcano SW side, underwent sufficient erosion to allow escape of some dome talus. A photo (figure 16) taken on 28 January, and associated sketch (figure 17), shows the dome within the breached English's Crater.
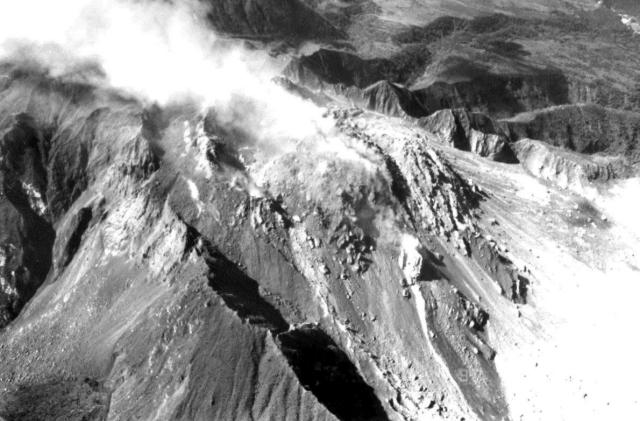 |
Figure 16. View of the Soufriere Hills crater taken from the SE on 28 January. The steaming area coincides with the new dome growth in the scar left by the 20 January collapse and pyroclastic flows. The new extrusion was first seen on 22 January, and by the 28th had almost filled the scar. Pyroclastic flows went down to the E (right). To the left of the new extrusion, the light-colored rock is the outside of Galway's Wall, the S part of the crater rim. Courtesy of MVO. |
 |
Figure 17. Sketch map of the Soufriere Hills crater based on a photograph taken from the SE on 28 January. Courtesy of MVO. |
Visual observations. On 13 January (between 1130-1300 and 2215-2305) two very large pyroclastic flows originated from the SE part of the 1 October dome at a spot close to the 11 December dome. The pyroclastic flows traveled down the S side of the Tar River valley to the sea. These flows eroded a chute to the S of Castle Peak, and created a scar in the 1 October dome. This scar became the site of rapid dome growth from the next day (14 January), when incandescence, small rockfalls and steaming and ash venting from the dome were reported. A helicopter flight on 14 January disclosed new talus deposits along the E and W margins of Galway's Wall.
On the morning of 16 January (between 0530 and 0630) the largest single pyroclastic flow in this eruption occurred. Reports from the airport described a rumbling of rocks and ash accompanying a glowing cloud down to the sea. The entire fan was covered by new material that included blocks 1-2 m in diameter (up to 5 m diameter at the head of the fan). The deposit was quite narrow in the upper reaches of the Tar River valley. The S chute cut back deeply into the dome to the S of Castle Peak, creating a large amphitheater into the mass of the 1 October dome ("Santa lobe") and the 11 December dome. Smaller pyroclastic flows occurred later that day; finally a prominent scar estimated to be ~8 m deep and running NE-SW was noted across the dome. The ash cloud from this activity rose to 6.1 km. The low-level ash was carried SW, causing heavy ashfall in Plymouth. At higher levels, the winds blew the ash S and E, and light ashfall was reported from Guadeloupe, 120 km SE.
On 19 and 20 January observers at Whites saw new extrusions growing rapidly within the scars formed by collapses of the SE flank of the composite October-December dome.
Pyroclastic flows began at 1830 on 20 January and lasted for about one hour. They originated from the SE part of the October-December composite dome, traveled down the S Tar River, and ignited some trees on the lower slopes of Perches Mountain before reaching the sea. A scoop-shaped excavation was carved into the SE flank of the composite dome, in the same place as the 16 January excavation, but larger in size.
The ash cloud from the 20 January pyroclastic flow rose to ~10 km. Low-altitude winds blew ash SW. Higher altitude winds blew ash NE, where it mixed with rain and fell as wet ash over most of N Montserrat. It was suggested that the higher amount of ash production on 20 January, compared with 16 January, was due to the higher lava temperature.
On 22 January, about 40 hours after the activity began, observers noted new growth and a large flower-shaped extrusion within the scar. During the first week of growth, this extrusion was contained within the scar, and only a few rockfalls entered the Tar River valley.
The largest rockfall on 26 January reached only to the foot of the dome. On 28 and 29 January, rockfalls were more common to both the N and S of Castle Peak, and occasional small pyroclastic flows were observed. The dome's vertical growth slowed, as it expanded laterally to the E and NW.
Evidence of further landslides from the Galway's Wall, on the S part of the crater rim, was seen on 26, 27, and 28 January. By 29 January, the central part of the wall's top was flush with the talus of the pre-September dome, and a small amount of dome material had fallen over the wall, leaving a minor scoop in the dome.
From late January through 8 February frequent small pyroclastic flows occurred, often during episodes of tremor. On 1 February a pyroclastic flow caused an ash cloud that drifted NW, depositing ash in Corkhill, Salem, and Old Towne. On 2 February, small pyroclastic flows accompanied by fountains of ash were reported from the area above Castle Peak. On 1 and 2 February heavy rain caused destructive flash flooding in Fort Ghaut. Much of the vegetation on the W slopes of the volcano was destroyed by months of heavy ashfall and acidic rain.
By 3 February, the remains of Castle Peak had either been completely buried or removed by pyroclastic flow activity. On 6 February a pyroclastic flow reached the sea; two flows on 7 February reached about half-way across the delta. The second flow was observed from the air and from Whites. During that event a collapse at the dome's SE face caused four pulses of small-scale decompression, resulting in ash jetting and release of small projectiles.
The most significant development at Galway's Wall during this period occurred sometime around 1-2 February, perhaps associated with heavy rains. A notch was cut through the upper wall at the western end, along one of the near-vertical zones of weakness in the wall. Dome material funneled through the wall, and fell on top of the landslide deposits in the upper Galway's area. The notch was first seen on 4 February, and the volume of material involved did not seem to increase significantly during the rest of the week.
Dome volume measurements. Volume measurements were made of the 20 January dome on 26 and 28 January, giving volumes of 1.46 and 1.52 x 10⁶ m3, respectively. It was also estimated that an accumulation of 150,000 m3 of talus blocks developed at the base of the new extrusion. A survey on 6 February indicated that around 2.3 x 10⁶ m3 of material were produced in nine days, giving an extrusion rate between the 28 January and 6 February of 2.9 m3/s. The average extrusion rate for the 20 January dome up to 6 February was 2.7 m3/s.
Helicopter surveys of the Tar River delta on 5 and 7 February showed that the total volume of the deposits was 14.9 x 10⁶ m3, of which 7.4 x 10⁶ m3 lay above sea level. The previous measurement on 27 September 1996 gave a volume of 11.6 x 10⁶ m3 with a sub-aerial volume of 4.9 x 10⁶ m3. The delta was also measured 600 m offshore, where it was 1.3 km across at its widest point. Even though the delta had not extended significantly since late September, it widened by 150 m and gained 10 m in height at the central point.
Seismicity. Rockfalls, pyroclastic flow signals, and volcano-tectonic events dominated the seismicity during this observation period. Swarms of volcano-tectonic earthquakes were as usual located at shallow depths beneath the crater. All of the major pyroclastic flows were preceded by earthquake swarms, suggesting that the earthquakes may be caused by pulses of magma moving to the surface, with these pulses then causing dome collapses a short time later. Out of nine earthquake swarms, three were followed by pyroclastic flows in the subsequent 27 to 66 minutes. Low-amplitude banded tremor was also observed during this reporting period. The typical tremor duration was about two hours, and the tremor episodes were ~8 hours apart. The amplitude of the tremor increased slightly during 15 January, prior to the collapse early on 16 January. Another tremor episode started before midnight on 16 January, and continued at regular intervals until the end of the period.
In general, after 21 January, volcano-tectonic swarms became fairly regular, occurring twice per day at ~12-hour intervals. This pattern was similar to that observed in the two weeks prior to the explosion of 17 September 1996, when the time interval between the swarms gradually decreased to 4 hours immediately prior to the explosion. At the end, almost all the swarms were accompanied by 2-5 long-period earthquakes (dominant frequencies, ~1 Hz or lower). Again, during 26 January-1 February the volcano-tectonic swarms were regularly spaced, with ~12 hours between each swarm, apart from a gap on 28 January. The duration of the swarms was variable, but generally 1-2 hours. The swarms started at or just after the peak in the theoretical solid-earth tide.
From 2 February, there was an increase in amplitude and duration of tremor episodes that lasted for 40-140 minutes; a gradual increase in amplitude was followed by an abrupt decay. At first the tremor built up gradually from background noise levels, but in the latter part of the observation period the tremor started as individual hybrid earthquakes that grew in number until they formed a continuous signal. During about half of these episodes, pyroclastic flows occurred at or shortly after the peak in tremor.
The time between the earthquake swarms gradually increased between 2 and 7 February. Maximum tremor amplitude also increased, with the highest amplitude recorded on 6 February. Thereafter the maximum tremor amplitude decayed, and no tremor was detected following a swarm on 8 February. Tremor was generally non-harmonic, with frequency in the 1-2.5 Hz range. However, harmonic tremor was recorded during a short interval close to the peak intensity of a tremor episode on 6 February, and may have been present for short periods during other episodes. The dominant frequency of this tremor was 1.25 Hz.
COSPEC and other measurements. On 16 January correlation spectrometer measurements from a boat along lines off the SW coast yielded average SO2 values of 344 metric tons/day (t/d) at 5.5 km from the dome and 233 t/d at 8.5 km. Measurements were made on the same day along the SW road within a few hours of dome collapse, but due to the wind direction, it was only possible to measure for half of the plume, which yielded a value of 1,017 t/d. On 21 January, 1,260 t/d were measured, a value typical of recent measurements immediately after dome collapses. Daily averages on 24, 29, and 31 January, and 4, 6, and 7 February were 590, 796, 495, 323, 446, and 652 t/d, respectively. During the 7 February traverse, the SO2 flux maxima (up to 871 t/d) was coincident with tremor and pyroclastic flow activity.
Scientists measured net movement along two prominent cracks on Chances Peak, located at the N intersection of Galway's Wall and Chances Peak. From 12 to 22 January, Crack 1, the most southerly of the two cracks, was oriented NE-SW and showed an extension of 0.69 cm/day and shear of 0.31 cm/day . From 22 to 26 January extension increased to 1.6 cm/day and shear to 0.7 cm/day. From 26 to 28 January extension increased to 1.75 cm/day and shear remained at 0.7 cm/day. Measurements at Crack 2 (22-26 January) showed a steady movement of 0.7 cm/day. Between 26 and 28 January shear increased slightly from 0.06 cm/day to 0.25 cm/day.
SO2 diffusion tubes downwind of the volcano showed a gradual decrease in this gas species throughout the period 1 October to 30 December, a drop similar to the one prior to the September 1996 explosion event. Dust samples collected in Plymouth in early October had high numbers of particles <0.7 µm in size.
Water samples showed high acidity levels (pH 2-3) in the Amersham area, as a result of acid rain forming in the plume; this effect decayed with distance. Rain water samples collected from various locations around the volcano showed that the rainwater directly W of the volcano continues to be highly acidic and has revealed concentrations of sulfites, chloride, and fluorides.
On 1 February, a Nettlton gravity profile across Whites Ghaut yielded a density of 2.1 g/cm3. On 30 January and 4 February, GPS networks showed that all slope lengths were within two standard deviations of the long-term means since June 1996.
Information Contacts: Montserrat Volcano Observatory (MVO), c/o Chief Minister's Office, PO Box 292, Plymouth, Montserrat (URL: http://www.mvo.ms/).
Dome growth and pyroclastic flows continue; alert status downgraded
The following condenses the daily and weekly Scientific Reports of the Montserrat Volcano Observatory (MVO) for the period 9 February-8 March 1997. This interval was characterized by continued dome growth on the crater's E side; late in the interval the NE side of the dome became increasingly unstable. Seismic activity was dominated by repetitive swarms of volcano-tectonic and hybrid earthquakes, with a few episodes of tremor. Also, on 17 February the alert stage at the volcano was reduced from Orange to Amber (table 13).
Table 13. Alert status codes used for Soufriere Hills volcano. Courtesy of MVO.
| Alert Code | Alert Color | Observed Phenomena |
| 0 | White | Background seismicity, no new surface manifestation of volcanic activity. |
| 1 | Yellow | Enhanced local seismic activity, ground deformation and mild phreatic activity. |
| 2 | Amber | Dome-forming eruption in progress, periodic gravitationally induced collapses including pyroclastic-flow and rockfall generation. |
| 3 | Orange | Change in style of activity anticipated within a few days. Increasing rockfall and minor pyroclastic-flow activity with associated light ashfall. |
| 4 | Red | Dome collapse under way, pyroclastic flows in valleys adjacent to area of collapse and ash to the W and NW. Explosive event distinct possibility if activity continues. |
| 5 | Purple | Ongoing explosive eruption with heavy ashfall. |
The results from a dome survey, undertaken between 18 February and 1 March, show that there was ~42 m of vertical dome growth. The highest point on the dome was measured at 942 m elevation.
Visual and satellite observations. On 10 February, near-continuous rockfalls traveled down the steep face of the dome that began extruding on 20 January (hereafter, "20 January dome"; see BGVN 20:01). Lava extruded from the E side of the dome and moved downhill as fast as it was emitted. Also, two clearly defined chutes cut into the dome's E face at rate that appeared to be equal to the extrusion rate.
Galway's Wall eroded further as dome material continued to fall over the crater wall's top and into the upper reaches of the White River. The dome material generally followed two clearly defined gullies cut into the steep face of the wall. Fresh rockfalls extended to ~50 m above the road at Galway's Soufriere (<1 km S of the dome).
A GOES-8 satellite image, acquired at 1215 on 10 February, revealed an eruption plume that extended 65 km WSW. The plume's maximum width was 10 km. Upper-air analysis suggested the plume rose to ~3,000 m. Another GOES-8 image, acquired at 1415 the same day, showed the plume extending ~120 km WSW. Analysis indicated that the plume remained below 3,000 m.
On the morning of 12 February, a large pyroclastic flow down the Tar River reached about halfway across the delta. Another flow on the evening of 14 February reached as far as the Tar River Estate House (~2 km NE of the dome).
A rockfall deposit in the White River Valley was also observed on 13 February. The deposit did not extend as far as that of 10 February, however it was more voluminous close to the base of Galway's Wall. The deposit had a lobate morphology with well-defined, gravelly levees. Several small, slow-moving, dust-generating rockfalls originated from three well-defined gullies in the top of the wall. By 15 February, the eastern side of the dome had steepened and had a flower-shaped structure with radiating pinnacles at the top of the face. On 15 February a rockfall over Galway's Wall generated a small ash cloud.
During the week of 17 February large blocks fell off the dome's face and moved slowly outwards following deep gullies. At night, incandescence emanating from the dome's face was strongest within these gullies. Galway's wall continued to degrade slowly with the three gullies in the top of the wall becoming more pronounced.
A fresh rockfall deposit observed on 17 February extended as far as the previous longest flows (~1 km from the dome). Several small pyroclastic flows were also observed during the week; most originated from the SE part of the dome and flowed into the Tar River valley. The longest pyroclastic flows reached 1.5 km on the night of 17 February.
On 18 February, the NE part of the dome showed increased activity, with several small pyroclastic flows traveling N towards Farrell's Wall. During 18-27 February the dome mainly grew vertically, rather than the outward growth of the E face that had characterized the previous weeks. On 27 February, observations revealed a small spine at the summit of the January dome. The SE flank of the dome was modified by avalanche; two large blocks, observed on the talus slope on 23 February, were no longer visible, and the deep gullies in the E face were less pronounced. Small rockfalls and pyroclastic flows continued from the N and SE flanks of the dome. One of the pyroclastic flows from the N flank sent ash over Plymouth at 1515.
During a period of increased seismicity on 28 February, several rockfalls occurred on the SE, E, and N faces of the dome. Many of the rockfalls were composed of hot material and resulted in small convective ash clouds. Slow crumbling of Galway's Wall continued, and by 1 March a fourth gully, E of the previous gullies, developed in the top of the wall. Small rockfalls continued to fall over the wall.
Between 1 and 7 March, slow upward growth of the 20 January dome continued, but at a slower rate than the previous few weeks. The NE face of the dome began to show signs of activity as rockfall gullies developed and the entire face began to crumble. Small rockfalls from the active faces of the January and October domes were nearly continuous. Some of these falls generated small pyroclastic flows with accompaning ash clouds that drifted W. Incandescence was observed at night from the active areas of the 20 January dome and gullies in the October dome. Areas of incandescence shifted throughout the week moving from the E to the N and NE faces of the dome.
Dome volume measurements. Between 20 January and 22 February dome growth was confined to the SE area of the dome within the 20 January scar. Extrusion rates varied from 2.7 to 3.2 m3/s, slightly above rates seen since June 1996.
On 1 March a survey concentrating on the 20 January dome indicated that growth since 18 February continued to be confined within the 20 January scar; extrusion was primarily vertical and the dome's height increased 38 m. Talus lying E of the dome's high point had thickened 40 m. Dome profiles from White's (figure 18) showed an increased progradation of the talus slope to the E and also indicated that lateral spreading of the dome, established in the last few weeks, continued. A wedge of the October dome, adjacent to the contact of the October and January domes, appeared to have been thrust up ~ 10 m by the recent extrusion from the 20 January dome.
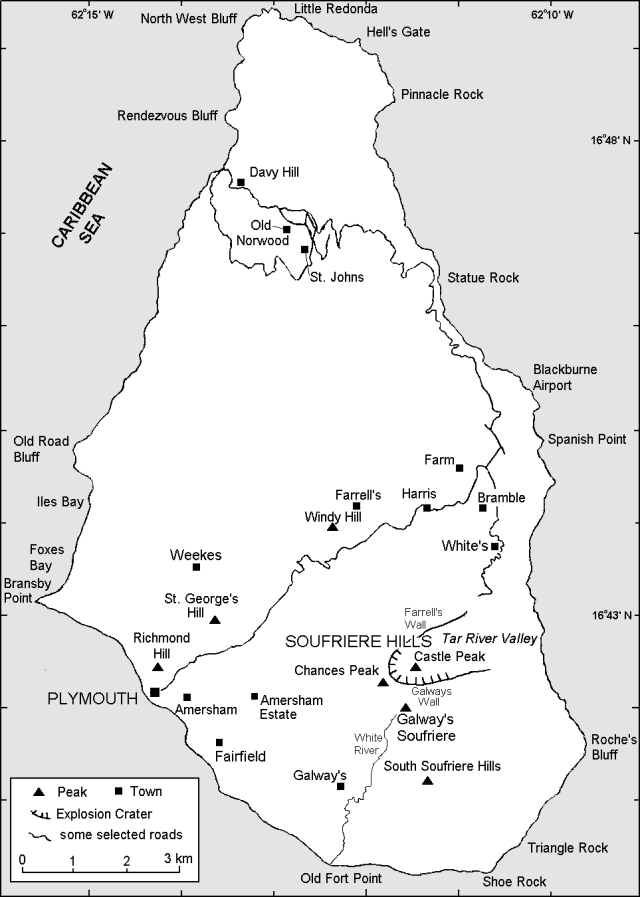 |
Figure 18. Map of Montserrat showing selected towns and features. |
The volume increase between 18 February and 1 March totalled 3.42 x 10⁶ m3. Added to the previous total amount of dome extrusion, the new total volume was 43.7 x 10⁶ m3. In terms of dense rock equivalence, the total volume of erupted magma, including pyroclastic-flow deposits, was estimated at 72 x 106 m3. The average extrusion rate for the 11-day study period was 4.37 m3/s.
Seismicity. Although seismicity was generally low, signals were predominantly attributed to rockfalls, small pyroclastic flows, volcano-tectonic and hybrid earthquakes, and occasional episodes of continuous tremor.
Earthquake swarms often began as volcano-tectonic events and led into hybrid events during the swarm' second half. Particularly towards the end of the swarms, hybrid earthquakes generally occurred every 1-2 minutes. These swarms did not culminate in periods of continuous tremor, unlike some of the swarms observed in previous weeks (BGVN 22:01). However, occasionally the hybrids joined to form short periods of high-amplitude tremor. Between 26 and 28 February three short episodes of continuous tremor were recorded, each lasting 1-2 hours.
The seismometer at Gages continued to record high-frequency tremor, previously referred to as broadband tremor (frequencies >3 Hz). This type of event has been observed throughout the eruption but has yet to be correlated to any visual phenomena.
COSPEC and other measurements. SO2 flux measurements were made on 25 January, 1- 3 March, and 5 March. The results were 217, 165, 106, 174, and 159 metric tons/day (t/d), respectively. These values are lower than the last values recorded at the beginning of February (300-700 t/d; BGVN 20:01).
SO2 diffusion-tube samples, representing the period between 29 December 1996 and 9 February, were analyzed and showed that levels of the gas remain low. This follows a trend that began during the period 1 October-29 December 1996.
Water samples showed that the rainwater directly W of the volcano continued to be acidic and contained high concentrations of certain anions (table 14). Throughout the period, pH levels at individual sample sites fluctuated only slightly. The sample collected from the overflow of the water storage tank at Fairfield (Trials Reservoir) contained anion concentrations and pH levels well within World Health Organization guidelines for drinking water.
Table 14. Rain and surface water geochemistry at Soufriere Hills, 2 March 1997. Courtesy of MVO.
| Location | pH | Conductivity (mS/cm) | Total Dissolved Solids (g/l) | Sulfates (mg/l) | Chlorides (mg/l) | Fluorides (mg/l) |
| Upper Amersham | 2.60 | 0.448 | 0.224 | 24 | 118 | >1.5 |
| Lower Amersham | 2.85 | 0.911 | 0.456 | 3 | 52 | 1.4 |
| Police HQ, Plymouth | 3.31 | 0.237 | 0.118 | 3 | 53 | 0.8 |
| Weekes | 6.20 | 0.402 | 0.201 | 3 | 44 | 0.65 |
| Trials Reservoir | 7.68 | 0.618 | 0.309 | 38 | 90 | 0.35 |
Scientists continued to monitor the two widening cracks on Chances Peak. On 11 February, Crack 1, the more easterly of the two cracks, had widened by 44 cm (2.75 cm/day average) and exhibited a dextral shear displacement of 23 cm since the last measurement on 28 January. The original crack had also developed several bifurcations and smaller subparallel cracks. Due to safety precautions, no further measurements will be made on this crack.
Crack 2, ~100 m from the hut on top of Chances Peak, had widened by 2.6 cm with a shear displacement of 6 cm. Before failing on 24 February due to ashfall, an extensometer across the crack transmitted real-time data. Much of the time the crack had opened at an average rate of 0.5 mm/day. Five periods of increased deformation also occurred, coincident with volcano-tectonic swarms (figure 19). The maximum deformation rate was 8 mm in less than 4 hours. During 28 January to 24 February, the total shear displacement along the crack was 18 cm.
 |
Figure 19. Comparison of earthquakes and the widening of Crack 2, a discontinuity near the top of Chances Peak (Soufriere Hills), 16-23 February. Crack widening is depicted on the plot as crack width (top); amount of extension (middle); the hourly number of located volcano-tectonic (VT) earthquakes (bottom). Courtesy of MVO. |
EDM measurements were made to the Chances Peak reflector on 17 February. The line from Galway's Plantation to Chances Peak had shortened by 18 mm since the last measurement on 2 December, a reduction in the rate of shortening. Measurements were also made on 19 February on the line from Amersham to Chances Steps. Results there continued to show no significant deformation.
GPS surveys of the WESTNET and EASTNET networks were carried out on 5 and 6 March, respectively. There were no significant changes in baseline length, station position, or station height, indicating an absence of a widespread strain field associated with the eruption.
On the other hand, GPS measurements at one site (FT3), 80 m NW of the dome have shown large movements. The baseline to Harris (M18) shortened by 6.5 cm between 18 January and 3 March. The station had moved radially away from the dome (to the NW) by 12.9 cm (on 3 March) and 14.5 cm (on 8 March). Since 18 January, the station height has remained stable with all occupations yielding values within 1.6 cm of one another.
Information Contacts: Montserrat Volcano Observatory (MVO), c/o Chief Minister's Office, PO Box 292, Plymouth, Montserrat (URL: http://www.mvo.ms/).
Pyroclastic flows advance over Galway's Wall on 29 March
The following summarizes the weekly Scientific Reports of the Montserrat Volcano Observatory for the period 9 March-5 April 1997.
Visual observations. During the first 20 days of March several ash clouds drifted W on the prevailing wind, small pyroclastic flows issued from the E and S areas of the dome, and small-scale rockfalls were confined to the area SE to NE of the dome complex.
Small, relatively cool, pyroclastic flows with a maximum run-out distance of ~1 km were almost continuous from the pre-17 September dome to the N of Galway's Wall (see map in BGVN 22:02). An erosional chute was formed in the pyroclastic-flow deposit leading out from the crater wall. Small landslides occurred from areas E and W of the point on the wall over which the flows traveled. On 18 March fresh deposits with well-developed levee structures reached beyond 1 km from the crater wall to the SW. On 20 March new fractures 100-150 m long and trending SSE were observed running through the S buttress of Galway's Wall, in the area adjacent to Perches Mountain.
Growth continued in the uppermost areas of the 20 January dome: during 13-21 March new spines appeared on the summit area and afterwards moved up toward the E side of the dome. Eventually extrusion in the summit region overgrew the original January scar and overall the shape of the dome changed from flat topped to a more conical geometry.
During the week of 22-29 March a large block tilting to the SSW appeared in the SW region of the dome complex. Two distinct peaks began to develop in the summit area of the dome, the highest being on the S side of the dome overlooking the Galway's Wall. A cleft formed between the two peaks, with material being extruded upwards and to the SW. The dome grew so much above Galway's Wall that there was no barrier left between the new material and the wall itself. Fresh cracks were observed running through the E shoulder of the Galway's Wall on 25 March. Fresh landslide scars and cracks were observed in the Gages Wall on 26 and 28 March, but no fresh activity was noted in the dome behind and above it.
At 1630 on 29 March a large pyroclastic flow occurred over the Galway's Wall into the White River valley. The flow traveled ~400 m farther than previous flows in this region and produced a dark ash cloud that rapidly convected to ~1,500 m. Activity increased at around 1330 on 30 March when another pyroclastic flow occurred over Galway's Wall from the SE summit. Observations from the helicopter of the Galway's Soufriere region revealed that the pyroclastic material was cascading over the Galway's Wall almost contiguously, with the higher velocity flows surging through the smaller, slower-moving flows. Vigorously convecting, co-ignimbrite-type ash clouds rose to heights of 3.5 km. Pyroclastic-flow activity waned at around 1630 after flows traveled 3.6 km down the White River and caused some burning of vegetation. Trees in the distal portion of the flows remained standing, suggesting sluggish movement of flows in the lower part of the valley.
The intense pyroclastic flow activity on 31 March sent material only ~50 m farther down the White River than the previous day. Pyroclastic flows observed from a helicopter on 31 March were valley-confined; on the W side of Galway's Soufriere there were fine-grained deposits and tree flattening associated with pyroclastic surges. Considerable ponding of pyroclastic-flow deposits had occurred, and the Great Alps Falls in the White river were reduced to only ~10 m high from the original 50 m. Finally it was observed that the pyroclastic flows had cut a gully 80 m deep and 50 m wide into Galway's Wall.
The "Easter scar"— the collapse scar formed in the dome complex — was composed of two scallops, one in the 20 January dome with a near vertical head wall, and the second cut into the pre-September dome. Growth of the dome since collapse, and rockfall debris, have rapidly begun to fill the scar.
At around 1500 and 1515 on 31 March two major pyroclastic flows from the NE summit of the dome occurred in the Tar River to the E. The first flow reached ~200 m past the first break in slope, the second flow reached to within ~50 m of the fan. Temperature patches positioned down the track leading into the Tar River valley were engulfed by the surge clouds of the latter flow, and indicated temperatures of 99-149°C for lateral distances of 60 m inside the pyroclastic surge.
Several relatively large pyroclastic flows occurred over the Galway's Wall starting from 1230 on 1 April, but none of them reached as far as those on the 30 and 31 March although considerably more tree flattening occurred in the area directly W of the Galway's Soufriere. This indicated that these flows had a large surge component, probably due to the earlier valley filling.
Large ash clouds associated with the flows rose to 4.3 km and drifted NW producing ash fall over large part of the island as far N as St Peters and St Johns. On 2 April more pyroclastic flows over Galway's Wall generated ash clouds to ~3.3 km of altitude.
Dome growth since the collapse was confined to the Easter scar with upward and southward growth of the steep head wall. The actively growing area had a smooth, scabby, arcuate upper surface with local fractures and N-S running striations indicative of extrusion. Vigorous brown gas jets were seen emerging from cracks in the upper surface. Rockfall debris began to fill the chute carved by the pyroclastic flows into the Galway's wall toward the end of the reporting period. Mudflows during the nights of 3 and 4 April in Fort Ghaut and Aymer's Ghaut left debris on roads and close to houses.
Seismicity. During 8-21 March there were swarms of mainly hybrid events interspersed with periods of relative quiescence. The foci were located at 1-3 km depth below the crater area. Rockfall activity was mainly concentrated in periods between the earthquake swarms, although some of the larger events during a swarm were followed by rockfall and pyroclastic signals from material cascading over the Galway's Wall.
After 22 March the seismicity decreased. The swarms became shorter and less intense, whereas there was a slight increase in the level of rockfall activity and in the number of long-period earthquakes. Occasionally long- period events were present for a few days to weeks, with a maximum of 40 events/day, mostly very small. About 50% of the long-period earthquakes were immediately followed by rockfall signals, as in October and December 1996. It is possible that the long-period events are caused by some dome process, such as gas venting or a sudden growth spurt that leads to partial collapse.
During 30 March-2 April, the dominant seismicity was related to dome collapse, with many rockfall and pyroclastic-flow signals. The level of rockfall and long-period activity decreased abruptly on 3 April, when a swarm of volcano-tectonic events followed by hybrid earth a very slow trend of shortening, respectively. EDM measurements on the N triangle (Windy Hill-Farrells-St. George's Hill) showed an overall stable trend. On 29 March a very slow shortening trend was recorded for the line Windy Hill-St. George's Hill: the total shortening over the past 15 months was ~15 mm.
GPS occupations on 10-11 March with a base station at Harris showed that Hermitage station had moved by 2.5 cm to the NNE since 18 January and had risen by ~9 cm. A GPS occupation of the Eastnet on 15 March recorded a total movement of 2.5 cm to the NNE for Farrells station, ~700 m from the N edge of the dome, since 13 June 1996. During 22-29 March GPS occupations with a base at Harris showed that Station FT3 (Farrells Crater Wall) , had moved 17.6 cm to the NW since 18 January (2.7 mm/day), Hermitage had no significant movement since 17 March, and Perches recorded a 1.6 cm movement to the N since 18 January.
A new crack on the shoulder of Galway's Mountain was measured for the first time on 25 March, with nails hammered into trees on either side of the crack. One array of nails was placed on the steep flank of the mountain at ~ 50 m from the crater wall; the second array was 90 m to the S in a flatter area. All the lines measured on 28 March showed no significant changes in length.
The GPS occupation of Eastnet on 30-31 March and 4 April revealed that the Farrells site had moved ~4 cm to the N since June 1996 at an increasing rate of movement.
Both the GPS and EDM techniques showed the ongoing slow deformation of the N crater wall in the Farrells area; deformation rate drops rapidly with distance from the dome. Neither technique was able to detect any significant deformation around the volcano.
Dome volume measurements. A survey completed on 14 March using the fixed location photographic method showed 1.34 x 10⁶ m3 added to the dome since 1 March, at an average extrusion rate of 1.08 m3/s.
A GPS survey of the talus at the base of the dome combined with the fixed-location photographic method and the GPS/range-finding binocular method resulted in an estimate of 0.8 x 10⁶ m3 material added to the dome from 14 to 19 March. From the photographic profiles it became apparent that the summit dome had grown by 15 m during the same period.
Evidence was found that the pre-September scar material, surrounding the dome on the NW, W, and SW sides, was pushed outward by the growing dome. The amount of movement was 3.9 m during 23 November to 8 January (80 mm/day), and 9.1 m during 8 January-19 March 1997 (13 mm/day).
A GPS bathymetry survey around the pyroclastic fan at the foot of the Tar River Valley on 21 March, combined with a survey of the fan surface on 12 February resulted in a total fan volume estimate of 15.5 x 10⁶ m3.
The results of a 27 March GPS survey indicated that since 19 March the dome volume had increased by 0.98 x 10⁶ m3, at a rate of 1.26 m3/s. This gave a total dome volume of 49.7 x 10⁶ m3 (44.7 x 10⁶ m3 DRE). Digital elevation models created from this survey indicated that growth was focused on the S peak of the dome and the rest of the dome remained relatively unchanged. A GPS dome survey on 2-3 April indicated that the last collapse removed ~1.6 x 10⁶ m3 of material, of which roughly 40% was preSeptember 1996 scar material and 60% new dome material.
Environmental monitoring. Measurements of sulfur dioxide flux were made using the MiniCOSPEC on 10, 14, 15, 17, 24, 28 March, and 4 April and results were as follows: 700, 213, 341, 317, 198, 160, and 573 t/d respectively. The high values on 10 March and 4 April were associated with the recurrence of earthquake swarms and an increase in activity, respectively.
Results for SO2 diffusion tubes collected during the period 9-23 February showed values similar to those measured over the last few months and are presented in table 15.
Table 15. Sulfur dioxide diffusion tube results at Soufriere Hills for the period between 9 February and 23 February 1997. Courtesy of MVO.
| Location | SO2 (ppb) |
| Upper Amersham | 47.70 |
| Lower Amersham | 17.30 |
| Airport | 0.80 |
| Police HQ, Plymouth | 9.00 |
| Weekes | 9.00 |
| Control | 0.00 |
Results from rain water samples collected at 4 locations around the volcano on 9, 16, 23, and 31 March, showed that the rainwater directly W of the volcano was still highly acidic and had high concentrations of certain anions (table 16). One sample collected from the overflow of Trials reservoir in Fairfield was within World Health Organization levels for all measured components.
Table 16. Rain and surface water geochemistry at Montserrat. Courtesy of MVO.
| Date | Location | pH | Conductivity (mS/cm) | Total Dissolved Solids (g/l) | Sulfates (mg/l) | Chlorides (mg/l) | Fluorides (mg/l) |
| 09 Mar 1997 | Upper Amersham | 2.39 | 2.120 | 1.050 | 25 | 250 | 1.5 |
| 09 Mar 1997 | Lower Amersham | 2.55 | 1.162 | 0.582 | 16 | 115 | 1.5 |
| 09 Mar 1997 | Police HQ, Plymouth | 2.57 | 0.926 | 0.464 | -- | 97 | 1.5 |
| 09 Mar 1997 | Weekes | 6.49 | 0.172 | 0.086 | -- | 27 | 0.3 |
| 16 Mar 1997 | Upper Amersham | 2.39 | 1.883 | 0.942 | 34 | 232 | 1.35 |
| 16 Mar 1997 | Lower Amersham | 2.70 | 0.731 | 0.366 | 8 | 100 | 1.5 |
| 16 Mar 1997 | Police HQ, Plymouth | 2.81 | 0.571 | 0.285 | 3 | 68 | 1.4 |
| 16 Mar 1997 | Weekes | 6.11 | 0.070 | 0.035 | -- | 14.4 | 0.1 |
| 16 Mar 1997 | Trials Reservoir | 7.55 | 0.659 | 0.330 | 40 | 83 | 0.55 |
| 23 Mar 1997 | Upper Amersham | 2.28 | 2.41 | 1.20 | 36 | 211 | 1.45 |
| 23 Mar 1997 | Trials Reservoir | 7.63 | 0.675 | 0.388 | 39 | 76 | 0.40 |
The maximum thickness of ash collected on 31 March in Plymouth was 16 mm, at the American University of the Caribbean, and the total erupted airborne ash volume on 30-31 March was calculated to be 0.1 x 10⁶ m3, dense rock equivalent (DRE).
Information Contacts: Montserrat Volcano Observatory (MVO), c/o Chief Minister's Office, PO Box 292, Plymouth, Montserrat (URL: http://www.mvo.ms/).
Pyroclastic flows over Galway's Wall reach 500 m from the shore
The following summarizes the visual observations of Stephen O'Meara on 2 April, NOAA/NESDIS satellite observation reports for April, and the weekly Scientific Reports of the Montserrat Volcano Observatory for the period 6 April-10 May 1997. For a map showing the locations of the places mentioned in this report see this BGVN 22:02. An article on the ongoing activity in Montserrat was published in April on Science magazine.
Visual observations. On 2 April O'Meara flew over Montserrat in a small chartered aircraft at an altitude of ~ 3 km. As he approached from the NE around 1050, with good views of the new delta (figures 20 and 21), the volcano was sending light-gray ash-and-steam clouds up to 4 km. Light-brown material covered much of the pyroclastic deposits in the Tar River Valley, while the delta itself retained a weak mantle of grayish ash. Light veils of ash originating from near Farrell's Wall fell to the N, discoloring a kilometer-long channel. Despite ash and clouds covering most of the summit (except for the E section of the dome), boulders could be seen falling down the NE, E, and SE sides, leaving trails of grayish dust.
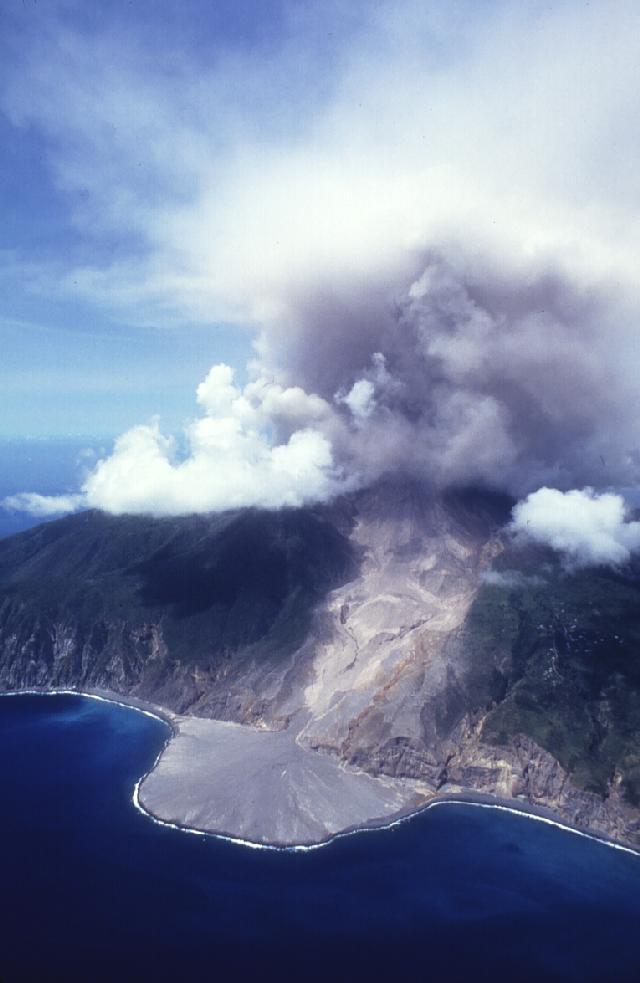 |
Figure 20. View of Soufriere Hills from ENE of the Tar River fan and delta, 2 April 1997. Courtesy of S. O'Meara. |
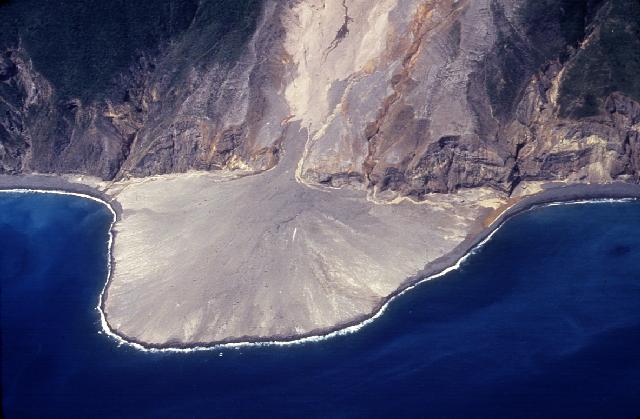 |
Figure 21. Closer view of the delta at Soufriere Hills volcano, 2 April 1997. Courtesy of S. O'Meara. |
A reddish-gray ash that obscured about two-thirds of SW Montserrat was slowly blown toward Plymouth. By the time the aircraft started circling the island again, activity had picked up substantially. A vent on the E side of the dome shot tall columns of ash and steam at a 45° angle to the N, and another vent in the direction of Galway's Wall sent a similarly angled plume of ash and steam to the SW. Within 10 minutes a pyroclastic flow originating in the breach at Galway's Wall went down the White River valley. The comparatively slow moving flow had a curved front trailed by tall convecting ash clouds.
On 6 April MVO reported that coarse rockfall debris had completely filled the chute carved by pyroclastic flows during the Easter collapse. The debris resembled a talus slope ~100 m wide and dipping at 50°. In the center of the scarp between the two peaks, observers saw vigorous degassing and milky, ash-laden steam jets.
A survey of the dome on the same day using both GPS and laser range finding binocular showed that the steep headwall representing the active face of the new lobe was then 100 m high, 150 wide, and dipping 60° (i.e. 10 m higher and 30 m wider, but 20° less steep than on 3 April). In a 3-day period the dome's elevation decreased from 968 m to 950 m and at the headwall the dome had also advanced S by about 20 m toward the top of the chute. In contrast, the N peak of the January dome remained at ~965 m elevation, but it appeared more fractured.
A dome collapse on 11 April sent pyroclastic flows ~500 m farther than any previous flows down the White River valley on the volcano's S flank. The flows stopped ~500 m before reaching the seashore at O'Garra's. The deposits in the valley completely buried the Great Alp Falls. Two distinct flow paths developed in the area around the Galway's Soufriere: 1) a main channel in the White River valley itself, and 2) a path over flat ground W of the main valley and then back into the main valley at a point half way along it. In the upper half of the valley surge clouds covered the topography with deposits.
Observations after 11 April revealed that collapses had eaten away another 100 m of pre-September material on the dome's SW side. The lobe built up again, rapidly replacing the material lost.
Satellite imagery on 12 April indicated a low-level (3 km) ash plume reaching as far as 75 km W of the volcano. Maximum width of the visible plume was 15 km at 40 km from the summit. The day after the plume was still extended 95 km WNW from the volcano. A maximum width of 25 km was measured at 75 km from the summit.
A GPS/laser binocular survey conducted on 15 April showed that the S dome's summit, then at 947 m, continued to slowly decrease in elevation. The maximum size of the lobe was calculated at ~ 0.9 x 10⁶ m3, but no change was detected for the N summit. The most noticeable change in the S region was an increase in the width of the lobe to ~180 m. Most of this expansion had occurred on its W side, and fresh material was encroaching on the remains of the September scar. To the E, the edge of the lobe was now against the Easter collapse scar. Shortly after 15 April the smooth surface of the lobe became increasingly fractured, allowing gas to be emitted from it. Gas and ashy steam was also emitted from the saddle between the dome's summits. Until the end of April the chute over the Galway's Wall continued to widen and fill slowly. The material eroded from the base of the chute by the 11 April collapse was being replaced by short-runout rockfalls and small pyroclastic flows. The soufriere area also continued to be filled by pyroclastic-flow deposits that didn't progress much farther.
Volume estimates in the White River area showed that that the rockfall and pyroclastic-flow activity had deposited 2.3 x 10⁶ m3 of material on 2 April and 2.1 x 10⁶ m3 more by 15 April (values given as Dense Rock Equivalents). These values have helped to constrain the magma extrusion rate at 4.6 m3 /s after the 11 April collapse, in agreement with other field observations.
Ash clouds from pyroclastic flows and rockfalls were detected both in visible and infrared imagery from 24 to 27 April, drifting NW and WSW at ~1 km altitude.
During brief breaks in the weather on 2, 3 and 5 May there was evidence of continued pyroclastic flows and dome growth above Galway's Wall, S of the dome. Most of the dome was visible from the Tar River Estate House on 8 May. Rockfalls were heard from the S side of the Tar River valley, and several large blocks bounced toward Perches Mountain.
No major changes were seen on the E face of the dome during the entire observation period. Several fumaroles were present but only very small rockfalls were noted from the N and E flanks of the dome.
Seismicity. Seismic activity was low until the dome collapse on 11 April. The collapse began with sustained low-amplitude signals. Two pulses of high-intensity activity were recorded at 1107 and 1155, respectively; the second one lasted 15 minutes. A short, high-amplitude signal was recorded as a pyroclastic flow traveled down the lower reaches of the White River valley. Fifteen hours after the end of the pyroclastic-flow activity a short-lived hybrid earthquake swarm took place. During 23-26 April, rockfall activity reached the highest event counts recorded since the beginning of the year. The largest signals were associated with small pyroclastic flows over the Galway's Wall. For the remainder of the month most of the seismicity dropped to a low level, dominated by rockfalls and long-period earthquakes. The number of long-period earthquakes remained high, though, and on a daily basis 40 to 100% of them triggered rockfalls.
A swarm of 28 shallow (2.4-3.6 km below the crater) volcano-tectonic earthquakes occurred on 7-8 May. During the swarm, the level of rockfall and long-period earthquake activity dropped, only to rise to previous levels when the swarm ended. This anti-correlation pattern between hybrid or volcano-tectonic swarms and rockfalls was observed many times before at this volcano, but had been absent since the explosion in September 1996.
Ground deformation. Survey measurements of the W triangle (Lower Amersham Upper Amersham Chance's Peak) continued to show a very slow shortening of the slant distances. There was indication of very slow subsidence of the two target sites relative to the instrument site at Lower Amersham. This trend was also detected during earlier occupations and seemed to reflect the removal of magma at depth below the volcano.
A long GPS occupation of the sites at Harris Lookout (M18) and the site on the crater rim above Farrell's Yard (FT3) was performed on 6 April. The recent outward movement of the FT3 site (BGVN 22:03) away from the dome appeared to have stopped. However an occupation of the Long Ground-Whites-M18 and Harris Lookout-Windy Hill-Farrell's triangles on 16 April using both the GPS and EDM techniques detected slow movement of the Farrell's site away from the crater toward the NNW. The baseline to Harris had shortened by 4 cm since last June. Further occupations at sites on the crater wall close to the dome with a fixed point at M18 Harris Lookout recorded significant movement of the crater rim close to the lava dome complex. These movements, radially outward from the dome, diminished with distance.
An EDM occupation of the N triangle (Windy Hill Farrell's St. George's Hill) on 15 April showed a 40-mm shortening of the Windy Hill Farrell's slant distance since 2 April. This apparent major change, however, was likely affected by atmospheric conditions. A subsequent occupation on 18 April indicated that the Windy Hill Farrell's slant distance had increased by 22 mm in three days. Later occupations during this report period confirmed slow continuous outward and downward movement of the Farrell's target.
Measurements of the cracks on Chance's Peak and on the E side of the Galway's Wall were carried out on 28 April and 3 May, respectively. The Chance's Peak crack recorded 6 mm of extension and 7 mm of dextral shear since 6 April. The crack on the E side of Galway's Wall opened a few millimeters and underwent a total 25 mm of sinistral shear since late March. These measurements suggested that the area between the cracks, which contains the remains of Galways, wall was moving slowly to the SSW, away from the dome.
COSPEC and other measurements. SO2 values recorded on 7 and 11 April were 223 and 1524 t/d, respectively. The latter value, measured immediately after the collapse over the Galway's Wall, was one of the highest ever measured at the Soufriere Hills Volcano. Results from SO2 diffusion tubes collected on 23 March and 6 April (table 17) showed a return to the levels of the past few months, within the recommended limits for occupation or habitation in these areas. The Whites Landfill site on the NE side of the volcano had no detectable sulfur dioxide.
Table 17. Sulfur dioxide diffusion tube results at Soufriere Hills for 23 March and 6 April 1997. Concentrations are in ppb.
| Location | 23 Mar 1997 | 06 Apr 1997 |
| Upper Amersham | 45.10 | 31.05 |
| Lower Amersham | 17.70 | 11.90 |
| White Landfill | 0.00 | 1.4 |
| Police HQ, Plymouth | 8.05 | 5.1 |
| Weekes | 0.00 | 0.00 |
| Control | 0.00 | 0.00 |
Some analyses of rain water samples collected at various locations from 31 March to 11 May appear in table 18. The rainwater continues to be highly acidic and certain anions are present in high concentrations, but well within World Health Organization guidelines.
Table 18. Rain and surface water geochemistry at Soufriere Hills for 31 March, 12 and 29 April, and 11 May 1997. Courtesy of MVO.
| Date | Location | pH | Conductivity (mS/cm) | Total Dissolved Solids (g/l) | Sulfates (mg/l) | Chlorides (mg/l) | Fluorides (mg/l) |
| 31 Mar 1997 | Upper Amersham | -- | 1.566 | 0.784 | 39 | 16.2 | 1.5 |
| 31 Mar 1997 | Lower Amersham | -- | 1.394 | 0.698 | 50 | 158 | 1.4 |
| 31 Mar 1997 | Police HQ, Plymouth | -- | 1.553 | 0.727 | 20 | 16.6 | >1.5 |
| 31 Mar 1997 | Weekes | -- | 0.058 | 0.028 | -- | 10.3 | 0.2 |
| 12 Apr 1997 | Upper Amersham | -- | 0.235 | 0.117 | 20 | 135.5 | 1.4 |
| 12 Apr 1997 | Lower Amersham | -- | 0.300 | 0.150 | 32 | 64.0 | >1.5 |
| 12 Apr 1997 | Police HQ, Plymouth | -- | 0.243 | 0.121 | -- | 28.5 | >1.5 |
| 12 Apr 1997 | Weekes | -- | 0.112 | 0.055 | 3 | 20.0 | 0.55 |
| 29 Apr 1997 | Upper Amersham | 2.60 | 1.902 | 0.953 | 0.60 | -- | -- |
| 29 Apr 1997 | Lower Amersham | 2.90 | 1.166 | 0.584 | >1.5 | -- | -- |
| 29 Apr 1997 | Police HQ, Plymouth | 3.26 | 0.622 | 0.311 | 1.25 | -- | -- |
| 29 Apr 1997 | Weekes | 5.21 | 0.223 | 0.111 | 1.20 | 54 | 8 |
| 11 May 1997 | Upper Amersham | 2.69 | 1.525 | 0.764 | 0.85 | 166 | 37 |
| 11 May 1997 | Police HQ, Plymouth | 2.98 | -- | -- | -- | -- | -- |
| 11 May 1997 | Weekes | 5.56 | 0.051 | 0.025 | 0.25 | 11.8 | 3 |
| 11 May 1997 | Trials overflow | 7.78 | 0.776 | 0.388 | 0.4 | 103 | 38 |
Further Reference. Montserrat Volcano Observatory Team, 1997, The ongoing eruption in Montserrat: Science, v. 276 (5311), p. 371.
Information Contacts: Montserrat Volcano Observatory (MVO), c/o Chief Minister's Office, PO Box 292, Plymouth, Montserrat (URL: http://www.mvo.ms/); Stephen and Donna O'Meara Nature Stock, PO Box 218, Volcano, HI 96785, USA.
Pyroclastic flows no longer confined by the crater's N wall
On 25 June, unusually large pyroclastic flows swept down drainages on the volcano's NNE side reaching almost as far as the airport. Settlements along their path sustained serious damage. Amid rescue efforts on 27 June, MVO reported at least nine people dead, six injured, and 14 missing. Additional information will be provided in next month's Bulletin.
The following summarizes weekly Scientific Reports of the Montserrat Volcano Observatory for the period 11 May-7 June 1997 and NOAA/NESDIS satellite observations during 12 May-6 June. Many of the places mentioned in this report appear on available maps (e.g. BGVN 22:02; Williams, 1997).
A new risk map was released on 6 June (figure 22). Zone A was expanded from the crater to the N as far as Harris, Bramble, and Bethel villages. Areas designated as Zone B included Tuitt's and Spanish Point on the E and Streatham and Farrell's on the W. Bramble Airport, ~5 km NE of the volcano, was moved into zone C.
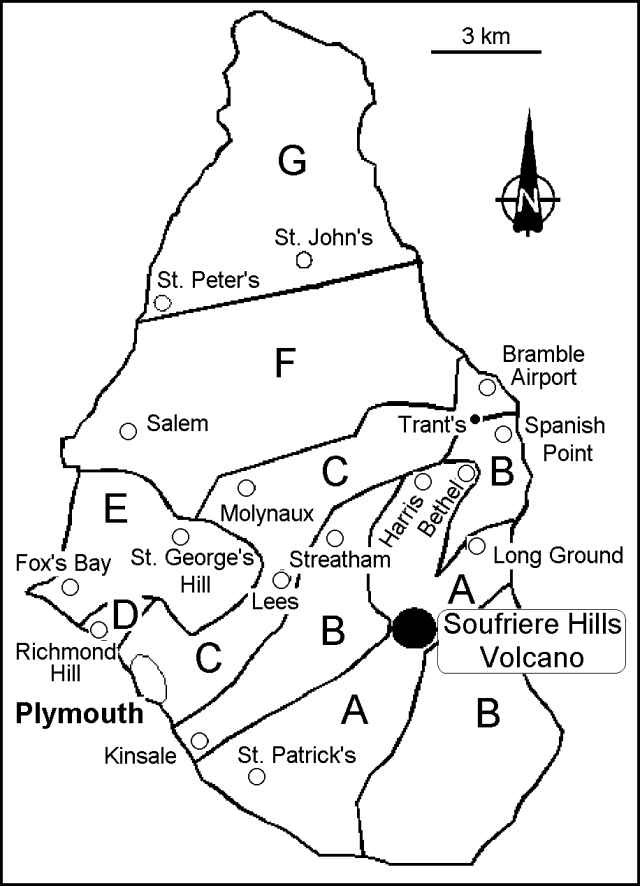 |
Figure 22. Map showing the volcanic risk zones for Soufriere Hills Volcano, updated on 6 June 1997. |
At the beginning of this reporting period, dome growth (estimated at 2 m3/s) was concentrated on the crater's S side, above the Galway's area. Rockfalls and a few small pyroclastic flows were shed into both the White River and down the S side of the Tar River valley. After 12 May loud roaring sounds caused by vigorous venting of ash and gas from the dome were heard at Whites, Harris, and Farrell's. These were taken to indicate increased gas pressures within the dome. Furthermore, on 12 May an airplane pilot reported ash between 1,830 and 2,440 m altitude.
On 13 May at 0755 a moderate-size pyroclastic flow from the summit region eroded a narrow channel on the E flank of the dome, a spot underlain by the ancestral Castle Peak. The flow went down the Tar River valley, splitting into two branches that traveled down either side of the upper break in slope, and eventually reached the delta at the coast. The ash cloud from this flow reached 3.3 km altitude and later formed a plume conspicuous in visible satellite imagery for 220 km WNW of the summit.
On 14 and 15 May, small, nearly continuous rockfalls and some small pyroclastic flows occurred on the NE and SE flanks of the dome; these traveled either towards the E (Tar River valley) or S (down Galway's side). Beginning at about 2040 on 15 May a 70-minute-long outburst generated moderate-size pyroclastic flows down the E side, creating a small scar ~40 m N of the one formed on 13 May.
Events on 16 May included small-to-moderate pyroclastic flows from the dome's summit. These traveled down the dome's N and NW sides, towards Farrell's wall, which deflected them E toward the Tar River valley. In addition erosion occurred on the dome's N face: talus continued piling up against the N and NNE crater rim.
During the following days activity was concentrated on the N and E flanks of the dome, with three major rockfall chutes developed on the dome's E, NE, and N sides. At the base of one of these chutes rockfall material piled up against the crater's N wall (Farrell's). Several small rockfalls were also heard on the crater's S side (Galway's wall), where new, relatively fine-grained rockfall deposits had blanketed the entire talus slopes.
On 18 May at 0820 the largest pyroclastic flow of this reporting period occurred. First, a large long-period earthquake took place; observers at Whites reported that the entire dome was being shaken just before the flow started. This pyroclastic flow traveled from the summit down both the 15 May chute and the NE chute. Then it passed down the N side of the Tar River valley to stop a few hundred meters from the delta. During that night intense glows were observed over the dome's entire NW face. There were also some incandescent rockfalls and small pyroclastic flows.
Clear visibility on 19 May revealed a new dark extrusion at the top of the NW dome. This area discharged ash and steam and ejected 5- to 20-cm diameter fragments up to ~60 m above the dome. The source of continuous rockfalls with small pyroclastic flows extended from the 15 May chute on the E to the margin of the September 1996 scar on the NW. The remnant wall of the scar prevented material from reaching the rim of Gages wall. The N side of the crater had filled up, with small amounts of dome material falling into the top of Tuitt's Ghaut, the N- flank drainage.
On 21 and 22 May a few small spines toppled, sending rockfalls down the E, NE, and NW flanks. On 22 May at 1300, after a rockfall on the N flank, some blocks reached ~100 m down the N flank (Tuitt's Ghaut). At 1430 a pyroclastic flow on the same flank produced an almost continuous ash plume; lapilli up to 4 mm in diameter were collected at Dyers and ash fragments ~1 mm in size were reported at Farrell's and from Salem up to St. John's.
Observations on 23 May from Chances Peak revealed several small spines and large blocks in the summit area with vigorous venting and gas emissions in the growth area; there was also a cleft in the middle separating the S lobe from the new extrusion in the N.
On 27 May, a large pyroclastic flow generated high on the E side of the dome traveled down the Tar River valley at a speed of 230 km/h , the fastest flow yet documented during the eruption. In the lower part of the valley the flow slowed considerably, and it stopped ~150 m from the sea. That same day, for the first time, moderate-size pyroclastic flows reached Tuitt's Ghaut; later on 29 May discernible material was deposited 400 m down this drainage.
By 31 May, talus slopes over the dome's E and NE flanks had covered the chutes formed by mid-May pyroclastic flows. The upper part of the dome's E face looked more blocky and relatively inactive. When visibility was good, the presence of ash below ~1,600 m was reported almost daily in satellite imagery.
Small pyroclastic flows down Tuitt's Ghaut on 2 June left fresh deposits ~1 km from the crater rim. By 3 June they reached 1.4 km, and by 4 June, 1.8 km. At 1207 on 5 June a pyroclastic flow extended ~2.9 km from the crater rim; a shorter flow followed to ~2 km. All of these pyroclastic flows were confined to the narrow valley and comparatively slow moving, taking about three minutes to descend it. In the first 500 m of the upland portion of the valley all vegetation was stripped from the valley walls. Farther down, some trees were left standing within the deposits. In the upper 1 km of the deposits there was evidence of several small, lobate flows. In general the thermal effects remained confined to 10 m from the deposit's edge, but on bends it rode up the banks of the ghaut (the so- called "bobsled" effect). The front of the flow was marked by a pile of burned logs and coarse debris, and a finer-grained surge had traveled ~100-200 m farther down the ghaut. A pyroclastic flow at 1845 on 6 June traveled ~2 km down from the crater rim; its front carried particularly large boulders. The flow significantly widened the notch in the crater wall through which it traveled; by this time the domes talus created a smooth slope down the ghaut.
NOAA reported ash clouds on 3, 4, and 5 June in visible satellite imagery up to 2,150 m altitude and crossing over the Virgin Islands, 400 km NW.
Seismicity. The shifting focus of dome growth and rising vigor of emission were reflected in a general decline in the number of long-period earthquakes and an increase in the number of hybrid earthquake swarms. Each swarm lasted for a few hours; some intense swarms during 19-21 May reached up to 35 events/hour. Rockfalls remained common and were concentrated during periods of minor dome collapse. The ratio of maximum rockfall amplitudes measured at Galway's Estate Station and Long Ground station served to differentiate between Tar River and White River pyroclastic flows.
Toward the end of May there was a significant reduction in the number of hybrid and long-period earthquakes, and rockfalls. The hybrid earthquake swarms continued until 27 May; although less frequent, they lasted longer.
The number of long-period earthquakes dropped to the normal background (0-4 events/day), the lowest levels since mid-March. The number of rockfalls increased from 1 June, and for the rest of the period were concentrated on the N and E sides of the dome. Periods of enhanced rockfall and pyroclastic-flow activity occurred every 16-20 hours and lasted ~4 hours. In the lulls, rockfalls continued at greatly reduced levels.
After 4 June the number of both long-period and hybrid earthquakes increased again. Over 50% of these shocks triggered rockfalls.
Ground deformation. GPS measurements at station FT3 (Farrell's wall) on 12 May showed continued movement to the NW, consistent with the total 20 cm of displacement noted since January 1997. Data were somewhat equivocal on 17 and 21 May. A GPS occupation at Chances Peak on 23 May suggested that it had moved 3.5 cm WNW since 28 April. Prior to that date, the movement was toward the NW. The change in direction was thought to reflect the dome's northward shift in activity.
Telemetered electronic tiltmeters installed at Chances Peak on 18 and 21 May (stations CP2 and CP3, W and E of the summit, respectively) registered cycles of inflation and deflation, each lasting ~12-18 hours. Progressive intervals and magnitudes of inflation were greater than those of deflation. Inflation occurred with hybrid earthquake swarms, and deflation correlated with peak rockfall/pyroclastic-flow events. RSAM patterns showed a strong correlation with tilt, with the higher spikes reflecting rockfalls, and the lower intensity patterns reflecting the sum of hybrid events and lesser rockfall activity. Thus tilt and RSAM combined provided a predictive capability. Accordingly, when it was possible, missions to close-in areas were scheduled during early inflation, when the likelihood of pyroclastic flows was considered minimal.
Crack 2, which developed into a zone of broad fracture on Chances Peak, was measured on 23 May, and on 4 and 8 June. The shear along the crack was dextral (E block moving S relative to W block) and reached 6 cm. The shear during 23 May-4 June was 2.5 cm. On 23 May a telemetered extensometer installed across part of Crack 2 that day showed almost 5 mm of diurnal change.
Dome volume, COSPEC, and other measurements. Using a combination of theodolite, GPS, and ranging binoculars, scientists on 19 May estimated the summit at 991 m elevation. One major change since the previous survey (15 April) was the inflation of the highest part of the dome above Galway's wall. Another change was the growth of the new extrusion in the N summit area and the talus accumulation in a 300-m-wide zone against the back of Farrell's wall, due to the activity on the N and NE faces. The volume of the dome from this survey was estimated at 60.1 x 10⁶ m3; this established an average extrusion rate during 15 April-19 May of 2.7 x 10⁵ m3/day (3.1 m3/s).
Later dome-volume surveys were severely hampered by poor visibility; however, brief clear windows allowed photos to be taken for both 31 May and 1 June, documenting continued growth of the dome's N side and summit. On the basis of these photos, the dome's volume was 64.6 x 10⁶ m3, a mean growth rate of 3.5 m3/s during 19 May-1 June. As with the last survey this represented a rate considerably above the mean extrusion rate of 2.1 m3/s.
Mini-COSPEC runs that were completed daily, often both in the morning and afternoon, gave results substantially higher than the usual background flux of 200-300 t/d. May and June SO2 fluxes were as follows: 24 May, 950 metric tons per day (t/d); 26 May, 940 t/d; 27 May, 971 t/d; 28 May, 616 t/d; 29 May, 770 t/d; 30 May, 510 t/d; 2 and 3 June, 475 t/d; 4 June, 2,129 t/d; 5 June, 2,242 t/d; 6 June, 642 t/d; and 7 June, 505 t/d. The high values on 4-5 June correlated with increased pyroclastic flow activity during 4-6 June. Sulfur diffusion tubes collected on 20 April and 4 May mainly showed values similar to those of previous weeks (table 19). The results from Upper Amersham on 17 May presumably increased because of the increase in the level of eruptive activity.
Table 19. SO2 concentrations in part per billion (ppb) from diffusion tubes at sites around the volcano. Recommended action level is 100 ppb. Courtesy of MVO.
| Location | 20 Apr 1997 | 04 May 1997 | 17 May 1997 |
| Plymouth Police HQ | 7.3 | 7.8 | 17.1 |
| Upper Amersham | 45.0 | 53.2 | 81.1 |
| Lower Amersham | 12.1 | 16.9 | 32.0 |
| Weekes | 0.0 | 0.0 | 4.3 |
| Whites landfill | 0.8 | 1.2 | 1.2 |
Rainwater collected W and NW of the volcano on 17 May was more acidic than samples from the previous week and chlorides and sulfates were present at substantially higher levels (table 20). After heavy rainfall and continued winds from the S and SE, a rainwater sample collected on 28 May from Lawyers, 2 km north of Salem, had a pH of 3.3. On those same days, new sites to the N of the volcano were also monitored and showed very low pH values. During this period the fluoride content of the rainwater was also elevated. The pH and fluoride returned to normal values when the wind direction changed to WNW at the end of May. Piped ground water had remained unaffected by the low pH of the rainwater.
Table 20. Rainwater geochemistry from 17 May to 1 June. For comparison, WHO guideline values are as follows: pH, 6.5- 8.5; TDS, 1.0 g/l; fluorides, 1.5 mg/l; chlorides, 250 mg/l; sulfates, 250 mg/l. Courtesy of MVO.
| Date | Location | pH | Conductivity (mS/cm) | Total Dissolved Solids (g/l) | Sulfates (mg/l) | Chlorides (mg/l) | Fluorides (mg/l) |
| 17 May 1997 | Weekes | 3.8 | 0.272 | 0.136 | 37 | 50 | 0.65 |
| 17 May 1997 | Plymouth Police HQ | 2.7 | 3.51 | 1.75 | 560 | 710 | -- |
| 17 May 1997 | Upper Amersham | 2.4 | 2.45 | 1.22 | 107 | 315 | -- |
| 17 May 1997 | Lower Amersham | 2.8 | 4.26 | 2.13 | 97 | 760 | -- |
| 25 May 1997 | Weekes | 2.6 | 1.286 | 0.644 | 5 | 133 | 1.50 |
| 25 May 1997 | Upper Amersham | 2.0 | 7.24 | 3.62 | 93 | 1000 | 0.20 |
| 25 May 1997 | Am. cattle trough | 7.72 | 0.335 | 0.168 | -- | 56 | 0.55 |
| 25 May 1997 | Trial's reservoir | 7.9 | 0.827 | 0.414 | 42 | 112 | 0.35 |
| 27 May 1997 | Hope | 2.8 | 0.789 | 0.37 | -- | 70 | 1.50 |
| 28 May 1997 | Weekes | 2.5 | 1.557 | 0.778 | -- | 126 | 1.50 |
| 28 May 1997 | Molyneux | 2.6 | 1.312 | 0.657 | 7 | 94 | 1.50 |
| 28 May 1997 | Dyer's | 2.8 | 0.702 | 0.351 | 3 | 80 | 1.40 |
| 28 May 1997 | Lawyer's | 3.0 | 0.46 | 0.23 | -- | 52 | 1.25 |
| 28 May 1997 | M.V.O. | 2.8 | 0.863 | 0.432 | -- | 80 | 1.50 |
| 31 Jun 1997 | Weekes | 3.4 | 0.257 | 0.128 | 3 | -- | 1.20 |
| 31 Jun 1997 | M.V.O. | 5.3 | 0.066 | 0.033 | -- | -- | 0.35 |
| 31 Jun 1997 | Dyer's | 6.7 | 0.092 | 0.046 | 3 | -- | 0.20 |
| 31 Jun 1997 | Upper Amersham | 2.8 | 0.914 | 0.458 | 12 | -- | 1.50 |
| 31 Jun 1997 | Lower Amersham | 3.1 | 0.533 | 0.267 | 18 | -- | 1.15 |
| 31 Jun 1997 | Am. cattle trough | 8.89 | 0.32 | 0.16 | -- | -- | 0.35 |
| 31 Jun 1997 | Trial's res. Overflow(from the tap) | 7.8 | 0.845 | 0.423 | 38 | -- | 0.30 |
Ash was collected on 17 May following several days of increased volcanic activity. The ash was at least 6 mm thick at Upper Amersham, and 4 mm at Lower Amersham, the Plymouth Police Headquarters, and Dagenham. Ash collected on 1 June was noticeably fine and widely distributed from Brodericks to Dyers with the thickest ash fall (2 mm) at Upper Amersham, Dagenham, and Plymouth Police HQ.
Reference. Williams, A.R., 1997, Montserrat, under the Volcano: National Geographic, v. 192, no. 1 (July 1997), p. 58-77.
Information Contacts: Montserrat Volcano Observatory (MVO), c/o Chief Minister's Office, PO Box 292, Plymouth, Montserrat (URL: http://www.mvo.ms/); NOAA/NESDIS Satellite Analysis Branch (SAB), Room 401, 5200 Auth Road, Camp Spring, MD 20746, USA.
Deadly N-directed pyroclastic flows on 25 June; cyclical eruptive behavior
The following condenses reports from the Montserrat Volcano Observatory (MVO) and stated sources for the period ending 30 June. Although N-flank pyroclastic flows became increasingly common during late May-June (figure 23), the most lethal and destructive eruption in the volcano's historical record traveled N on 25 June (figure 24). That eruption, discussed in MVO Special Report 03 (29 June 1997 draft), sent a plume to ~10-km altitude and produced pyroclastic flows that overran both vacated and partly inhabited NE-flank settlements in the officially evacuated zone. Some flows stopped near the edge of Bramble airport; it has remained closed since that time. Risk associated with repeated pyroclastic flows to the N and W led to a new risk map (figure 25). Early August pyroclastic flows destroyed structures in central Plymouth; details will be provided next month.
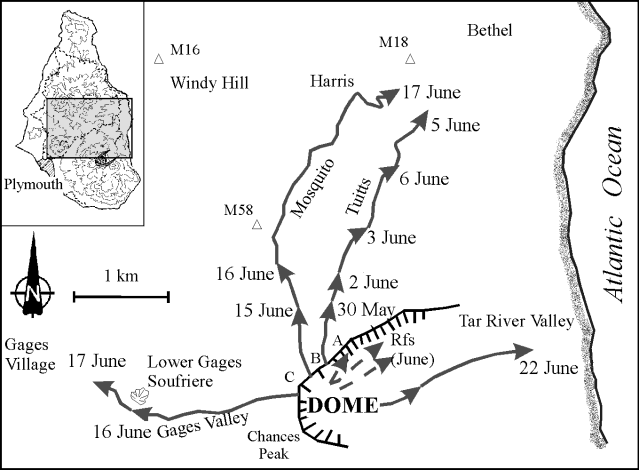 |
Figure 23. Soufriere Hills map showing the runouts of pyroclastic flows during 30 May-25 June 1997. Labels "A," "B," and "C" designate peaks with the same names. Modified from MVO Special Report 03 (29 June 1997). |
 |
Figure 24. Sketch map of the pyroclastic flow and surge deposits laid down at Soufriere Hills on 25 June. Note the arrows showing transport directions and the narrow band of deposits spreading W into the Belham Valley. Modified from MVO Special Report 03 (29 June 1997). |
 |
Figure 25. Risk map for Montserrat as of 4 July 1997. Arrows show distal ends of small pyroclastic flows that occurred through 25 June. Modified from MVO Special Report 03 (29 June 1997). |
During June NOAA's Satellite Analysis Branch repeatedly noted light plumes from the volcano. The plumes were typically "cigar-shaped" and attached to the source; in GOES-8 satellite imagery they frequently remained discernible 50-100 km W to WNW. Two days after the [25] June outburst, an ash cloud to over 10 km moved N-NW to ~200 km from the volcano.
Key events. Table 21 summarizes events during 14 May-25 June 1997. The 14 May rockfalls followed about two-and-a-half months of relative stability; by 19 May the intensity of rockfalls increased and they spilled N into Tuitt's Ghaut. On 29 May, Tuitt's Ghaut was also the scene of a minor pyroclastic flow. Subsequent pyroclastic flows increased during early June; during mid-June they reached into Mosquito Ghaut and Gages Valley (figure 23).
Table 21. Time line summary for Soufriere Hills leading up to the destructive 25 June 1997 outburst. Where unspecified, pyroclastic flow runout distances are measured from the crater. Modified from MVO Special Report 03 (29 June 1997).
| Date | Description of Activity |
| 14 May 1997 | Beginning of rock falls on dome's N face. |
| 19 May 1997 | First rockfall spills N into Tuitt's Ghaut. |
| 29 May 1997 | First pyroclastic flows enter northern ghauts. |
| 02 Jun 1997 | Pyroclastic flow down Tuitt's Ghaut travels 1 km from the crater. |
| 03 Jun 1997 | Pyroclastic flow in Tuitt's Ghaut travels 1.4 km. |
| 04 Jun 1997 | Pyroclastic flow in Tuitt's Ghaut travels 1.8 km. |
| 05 Jun 1997 | Pyroclastic flow in Tuitt's Ghaut travels 2.9 km, 250 m from intersection with the Paradise River. |
| 07-14 Jun 1997 | Rockfalls and pyroclastic flows concentrated in Tuitt's Ghaut. |
| 15 Jun 1997 | Pyroclastic flow material advanced 500 m down Mosquito Ghaut. Gage's Valley was the scene of a small rockfall. |
| 16 Jun 1997 | Pyroclastic flows in Gage's Valley travel 1.6 km from the crater rim. Smaller pyroclastic flows in Mosquito and Tuitt's Ghaut. |
| 17 Jun 1997 | Strong deflation on tiltmeters preceded a dome collapse at 2330; pyroclastic flows traveled 2 km down Gages Valley (200 m further than previous ones) and 3.5 km down Mosquito Ghaut. Many of the rock samples collected from the pyroclastic flow into Mosquito Ghaut were moderately vesicular and were therefore interpreted as juvenile (not dome material). |
| 22 Jun 1997 | Inflation and subsequent deflation were pronounced and rapid; the latter coincided with pyroclastic flows that traveled ~1 km E down the Tar River Valley. After this event, inflation-deflation cycles shortened and their amplitudes increased. The pyroclastic flows were also followed by a short volcano-tectonic earthquake swarm and the return of hybrid swarms. |
| 24 Jun 1997 | For the first time since 17 June, small pyroclastic flows moved down Mosquito Ghaut; they reached 1 km from the crater rim. Dome growth seen at the top of Mosquito Ghaut. |
Limited visibility during June led to the poorly defined, but relatively high extrusion rate of ~3.5 m3/s. The dome's additional bulk furnished less-impeded access to the volcano's N slopes.
Eruption of 25 June. During 1255 to 1320 on 25 June pyroclastic flows sweeping over the volcano's N flanks followed paths down Mosquito Ghaut and the Paradise River almost to the sea (figure 24). Pyroclastic flows and associated surge clouds damaged or destroyed 100-150 houses (severely affecting the villages of Streatham, Dyers, Harris, Bethel, Bramble, Trants, Farm, and Spanish Point). A mid-July official statement confirmed ten people dead and another nine missing and presumed dead. An earlier report mentioned five people who suffered serious burns.
The pyroclastic flows were the largest since the eruption began in 1995; the eruption's intensity exceeded that of the explosion of 17 September 1996. An estimated 4-7 million cubic meters of the lava dome was unloaded during the event, and the resulting flow and surge deposits covered 4 km2 (figure 24). The ash fell over W and NW Montserrat. Maximum accumulations reached 2 mm. The event left a steeply-dipping, circular scar ~200 m across in the dome's NNW face.
Table 22 and figures 26, 27, and 28 summarize events on a variety of time scales, the latter two covering intervals just before and during the 25 June outburst. The previously mentioned hybrid earthquake swarm at 0300 had up to 4-5 events/minute, similar to swarms seen during the previous four days. Earthquakes were of moderate amplitude; they caused saturations on the Gages and Windy Hill drum records.
Table 22. Timeline for the destructive 25 June 1997 outburst at Soufriere Hills. Modified from MVO Special Report 03 (29 June 1997).
| Date | Time | Event |
| 25 Jun 1997 | 0300 | Start of hybrid earthquake swarm |
| 25 Jun 1997 | 0600-0800 | Deflation accompanied by small pyroclastic flows in Mosquito Ghaut |
| 25 Jun 1997 | 1050 | Start of hybrid earthquake swarm |
| 25 Jun 1997 | 1200 | Crater inflation peaked |
| 25 Jun 1997 | 1245 | Volcanic tremor; steam and ash production |
| 25 Jun 1997 | 1255 | Start of pyroclastic flow activity |
| 25 Jun 1997 | 1257 | First seismic pulse |
| 25 Jun 1997 | 1300 | Second seismic pulse |
| 25 Jun 1997 | 1300 | First pyroclastic flow observed in Mosquito Ghaut from MVO |
| 25 Jun 1997 | 1302 | First flow seen from airport |
| 25 Jun 1997 | 1303 | Loss of seismic signals from eastern stations |
| 25 Jun 1997 | 1308 | Third seismic pulse |
| 25 Jun 1997 | 1315 | Second flow seen from airport |
| 25 Jun 1997 | 1320 | End of seismic activity |
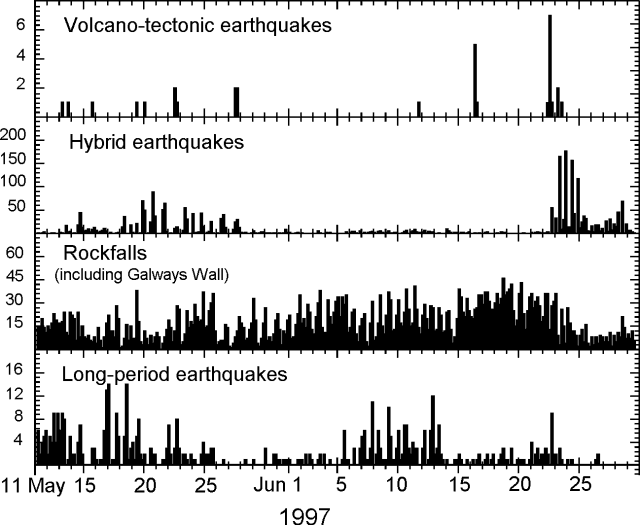 |
Figure 26. Seismicity at Soufriere Hills during 11-29 May 1997. The term "rockfalls" refers to seismically detected rockfalls. Modified from MVO Special Report 03 (29 June 1997). |
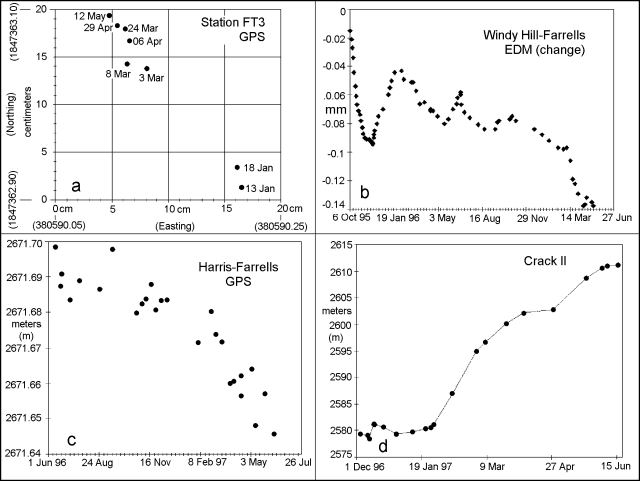 |
Figure 27. Four studies of Soufriere Hills deformation for stated dates. Modified from MVO Special Report 03 (29 June 1997). A) (top left) Map view showing the relative location of GPS site FT3 on the crater wall, January-May 1997; values in parentheses are local map coordinates and directions. Site FT3 lies near the "C" in figure 23. B) (top right) Plot of the change in EDM baseline length, 6 October 1995-27 June 1997; Y-axis lengths (in meters) correspond to the change in distances between Windy Hill and Farrells. The points were plotted using a 5-point moving average. C) (bottom left) Plot of GPS baseline length, 1 June 1996-26 July 1997; Y-axis lengths correspond to the (absolute) distances measured between Harris and Farrells. D) (bottom right) Shear length of Chances Peak crack II illustrating progressive offset, 1 December 1996-15 June 1997. |
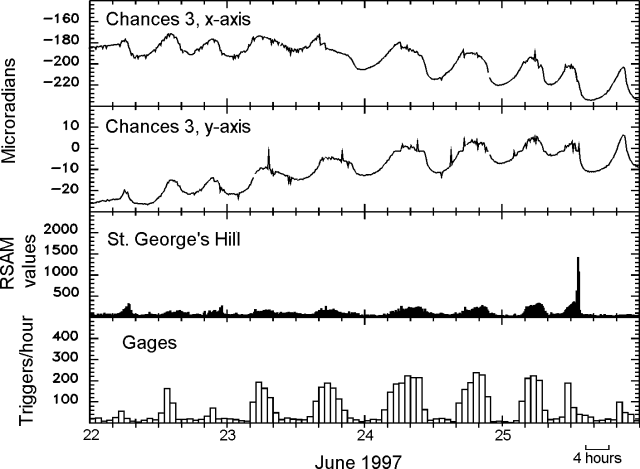 |
Figure 28. Tilt (upper plots) and seismicity (lower plots) at Soufriere Hills during 22-25 June 1997 showed a high degree of in-phase cyclical behavior. The tilt at Chances Peak was acquired along two orthogonal axes: "x" refers to an axis oriented nearly E-W (099-degree bearing) and "y", to an axis nearly N-S (009-degree bearing). St. George's Hill and Gages seismic data (lower two plots) include the amplitude of all detected earthquakes. At Gages, "triggers" refer to the number of events above an unstated threshold. The tick marks above stated dates indicate the start of indicated day (0000 hours); time between adjacent tick marks is 4 hours. Modified from MVO Special Report 03 (29 June 1997). |
Tilt peaked at 0520 and the volcano started to deflate at about 0610 (figure 28). The hybrid earthquake swarm diminished gradually after about 0615. At 0705 the earthquakes gave way to low tremor. Rock falls and minor pyroclastic flows commenced, fitting the established pattern. Between 0600 and 0800 semi-continuous pyroclastic flows ran down Mosquito Ghaut to ~1 km. There were also simultaneous rockfalls and small pyroclastic flows from the dome's SE and E faces. Re-inflation of the dome area began at approximately 0900 and a second hybrid swarm started at 1050 and escalated rapidly, reaching ~6 events/minute between 1130 and 1230. The earthquake amplitudes were uniform, and similar to those in the earlier swarm. At 1200 the inflation trend peaked. By 1245 the seismic record was dominated by tremor, and hybrid earthquakes were barely discernible. A dilute steam and ash cloud blew W at the altitude of ~1.5 km.
Between 1240 and 1250 the tiltmeter registered the start of a sharp deflation. At 1255 a strong seismic signal began and at 1257 and 1300 intense pulses occurred. The latter pulse was roughly coincident with eruption of a dense, dark ash cloud that rose vertically from the N flank of dome above Mosquito Ghaut. This was considered the main event, and sent an ash cloud to 10 km in minutes.
At 1303 the eastern stations of the seismic network stopped transmitting data due to the destruction of either the telephone exchange or the line across the central corridor by a pyroclastic flow down Mosquito Ghaut. Available stations registered a third seismic pulse at 1308.
MVO staff positioned N of the airport witnessed the front of the flow coming around the bend at Pea Ghaut, just up-slope of Trant's village (figure 24). At 1315 MVO observers flying over the airport found that the initial pulse had overrun the lower parts of local settlements (Harris, Farm, and Trant's), and came to within 50 m of the sea. They also reported a final pulse coming down Paradise Ghaut and surges continuing to spread slowly westward in the Spanish Point area. The final pulse advanced at ~30 m/s across flat land near Trants; this was captured on film by a time-lapse video recorder at the airport control tower.
Deposits and destruction. In Mosquito Ghaut, the main part of the flow caused intense scouring to the top (but not over) the steep valley walls; scouring was particularly intense on the outside of bends. The deposits, not extensive in the upper part, generally thickened towards the lower end where Mosquito meets Paradise Ghaut.
Flow deposits completely filled Pea Ghaut and formed a thick, broad fan emerging NW from Paradise Ghaut just N of Bethel (figure 24). Houses 200 m from the edge of the fan were completely buried. A separate lobe of coarse material ran over the lip of Paradise Ghaut immediately W of Bethel. Blocks within this lobe were up to 5 m in size and caused widespread destruction to houses in Bethel village. This was the only area where a high concentration of coarse material spilled from the main ghauts.
As the pyroclastic flows emerged from between peaks B and C (figure 23) and progressed into Mosquito Ghaut, fine-grained pyroclastic surges spread laterally onto the ridges on either side. These surges extended as far E as Paradise Estate, went northward to within 250 m of Windy Hill, inundated the entire village of Streatham, and spread W as far as Gun Hill. They broke and flattened trees on the ridges in the Farrell's and Paradise area. The surges did not spill into Tuitt's Ghaut to the E, but at one or two points they drained into the unnamed ghaut to the W. In Streatham, charring of trees and telegraph poles was limited to the E-SE sides. The orientation of charring, shadow zones behind a few of the houses, and the transport of a water tank indicated that surge movement in this area was WNW.
In the Farrell's area, blocks above 1 m across were rare; occasional blocks ~0.5 m across were present on Farrell's road. The deposits indicated that drainage of flow material into the Dyers river occurred largely in the narrow area S of Gun Hill and W of Riley's Yard. Samples collected in the Farm River area and Spanish Point included both dense and moderately vesicular lithologies.
Pyroclastic flows extended into the Belham valley as far as the last of the tight bends before Cork Hill. The flow-front was marked by a pile of logs aligned cross-valley; still, most trees remained standing, even near the base of the valley. Deposits along the whole length of the Belham valley were fine-grained with a near absence of coarse blocks. In addition, two small concrete bridges were left intact at the base of the valley. The fine grained deposits were interpreted as originating from pyroclastic surges that diverged NW from the main flow in Mosquito Ghaut.
Elevated seismic signals persisted until 1318, and the large deflation recorded by the tiltmeter bottomed out at 1430. Low amplitude tremor with hybrid earthquakes continued until 1500, at which time the seismicity dropped to background levels. The RSAM peak for the event, which lasted for 30 minutes, indicated shorter but more intense activity relative to the explosion of 17 September 1996.
Seismicity overview. Hybrid earthquake swarms occurred during 13 to 27 May (~100 earthquakes/day, figure 26). Rockfalls immediately followed each swarm of earthquakes, and in addition, after the earthquake swarms ended, the rockfall events continued (figure 26).
On the morning of 22 June, after a moderate pyroclastic flow and associated deformation, hybrid earthquakes suddenly restarted (table 23, figure 26). A small swarm of volcano-tectonic earthquakes also appeared; such earthquakes had been rare in recent months, usually occurring in single swarms. Between 22 and 25 June MVO noted seven hybrid swarms; both the duration and number of component events in these swarms increased (figure 26). Within a given swarm, the earthquakes generally had similar magnitudes and the few larger earthquakes were of relatively small magnitude; much larger ones had been recorded previously. Nevertheless, the swarms on 24 and 25 June increased in intensity, reaching a state where repetitive events merged into continuous tremor that was difficult to distinguish from rockfall signals on the drum records.
Long-period earthquakes became more numerous following the 5 June pyroclastic flows (table 23). The number of these earthquakes remained low, not exceeding 40/day, and returned to normal levels after 13 June.
Deformation studies. Figure 27 shows examples of monitored deformation, which includes both Total Station (combined electronic distance measurement (EDM) and theodolite) and global positioning system (GPS) techniques. Cracks in the crater walls were monitored by frequent measurements between fixed points across them. Telemetry links to two tiltmeters and one extensometer at Chances Peak and one tiltmeter at Long Ground.
In early March 1997 GPS surveys detected deformation of the northern crater walls (figure 27a). GPS station FT3 was installed on the crater wall adjacent to Peak C (figure 23); during 13 January-3 March it had moved ~15 cm NW; it continued moving NW with a total displacement by 12 May of 21.5 cm (after which the site was considered too dangerous to visit). Since July 1996, GPS on Chances Peak showed sustained motion away from the dome. By 29 June this site had a total displacement of 16 cm.
In the eruption's early stages, an EDM/GPS station on the N-flank (at Farrells) moved slowly N, away from the dome complex. Thus, by 30 November 1995 a shortening of 9 cm occurred. Although two cycles of lengthening and shortening occurred during 1996, since December 1996 only sustained shortening occurred along certain baselines (Windy Hill and Harris). This shortening continued at an increasing rate until the last measurement on 10 June.
Prior to 16 June, the Chances Peak tiltmeter showed a cyclical pattern of inflation and deflation, centered at the dome, with 12- to 16-hour periods and 16- to 18-µrad amplitudes. During 16-17 June the inflation-deflation cycle flattened to 5- to 10-µrad amplitudes.
At approximately 1600 on 17 June inflation increased steeply, peaking at 2100; rapid deflation followed. This deflation preceded a dome collapse at 2330 that sent pyroclastic flows down Gages and Mosquito drainages. For the next day and a half there was a return of the pronounced inflation-deflation pattern seen prior to 16 June.
In contrast, during 19 June until the early morning of 22 June there prevailed a flattened inflation-deflation pattern. Then, at 0530 on 22 June, a rapid inflation occurred; subsequent sharp deflation at 0630 was coincident with sustained pyroclastic flows.
This event marked the beginning of inflation-deflation cycles with periods shortened to 8 hours and amplitudes increased to ~40 µrad. As previously mentioned, the change was accompanied by a short volcano-tectonic earthquake swarm that preceded the hybrid earthquakes. The number of hybrid earthquakes varied in-phase with the inflation-deflation cycle (i.e. the maximum number of hybrid earthquakes occurred at peak inflation, figure 28).
Following the 25 June pyroclastic flows, the inflation-deflation cycle continued with the same period and amplitude that began 22 June. Prior to 25 June, tiltmeters indicated inflation on the N flank (or deflation on the S); after 25 June, tiltmeters indicated inflation at the dome's center.
Post-event activity and interpretations. After the episode of pyroclastic flows, seismicity remained low for several hours. However, starting at 2000 more inflation was accompanied by a small swarm of hybrid earthquakes. In subsequent days, the inflation and deflation pattern continued, earthquake swarms became more intense, and there were pyroclastic flows in Mosquito Ghaut and Gages valley.
Two small explosions on 27 June caused concern that the activity was still escalating, and the chance of significant explosive activity was judged to have increased. Brief views of the dome on 28 June indicated that a large part had been removed during the pyroclastic flows and rapid growth was occurring within the scar.
The large event was not a surprise because in the weeks prior to 25 June repetitive hybrid earthquake swarms and inflation-deflation cycles suggested that the rate of dome growth and conduit pressure were elevated. The effects of the pyroclastic flow were largely anticipated by the hazard zonation and warnings issued in MVO reports throughout June. The surge into Dyer's Ghaut and the Belham River valley was remarkable in that a relatively fine-grained flow traveled a significant distance off the main flow path.
In the days after 25 June, high activity levels and inflation at the Chances Peak tiltmeter prevailed. Earlier in the eruption significant events were normally followed by a respite in activity and a change in the eruption pattern. This was taken as a sign of further intense activity.
Risk map. During June 1997 MVO published four successive risk maps. With the advent of each map, the A-B zone (with no access) gradually increased in size to cover most of the S part of the island. Seven zones and six possible alert levels produced 42 different options; a new map could simplify the previous system.
The new map in early July (figure 25) contained three zones: the northern, central, and exclusion zones, and only one alert level, "volcanic alert." To decide where the boundaries between risk zones should lie, the distal margins of pyroclastic flows and surges through June 1997 were indicated. There was potential for flows to reach much of the S of Montserrat; thus MVO decided that an exclusion zone should include these areas. The line across the island's center was controlled primarily by topography.
North of the exclusion zone MVO considered that the risk of pyroclastic flows and surges was low enough to allow people to live and work as normal; however, in the case of increased activity it was thought that people in the area directly N of the exclusion should be ready to move at short notice. Therefore, a central zone was designated in which people should be on increased alert. The further that people moved away from the exclusion zone, the safer. Thus, the northern boundary of the central zone was marked as a dotted line. During an increase in alert level, citizens were advised to move uphill and away from the Belham River Valley. To announce an evacuation of the central zone the plan included deployment of wailing sirens and maroons (explosive fireworks).
Information Contacts: Montserrat Volcano Observatory (MVO), c/o Chief Minister's Office, PO Box 292, Plymouth, Montserrat (URL: http://www.mvo.ms/); NOAA/NESDIS Satellite Analysis Branch (SAB), Room 401, 5200 Auth Road, Camp Springs, MD 20746, USA.
Activity increased to high levels on 31 July
The following condenses reports from the Montserrat Volcano Observatory (MVO) for July 1997. Activity decreased during the month and the dome appeared to be growing at a lower rate than immediately after the energetic and destructive 25 June pyroclastic flow. Starting on 31 July, however, activity increased.
Visual observations. During 1-5 July several pyroclastic flows traveled down Mosquito, Gages, and Fort Ghauts, the largest ones reaching 3 km downstream. Many of these flows started with resounding explosions and ash columns that rose as high as 11 km at measured rates of 9-17 m/s. Plumes were visible from the Space Shuttle (figure 29).
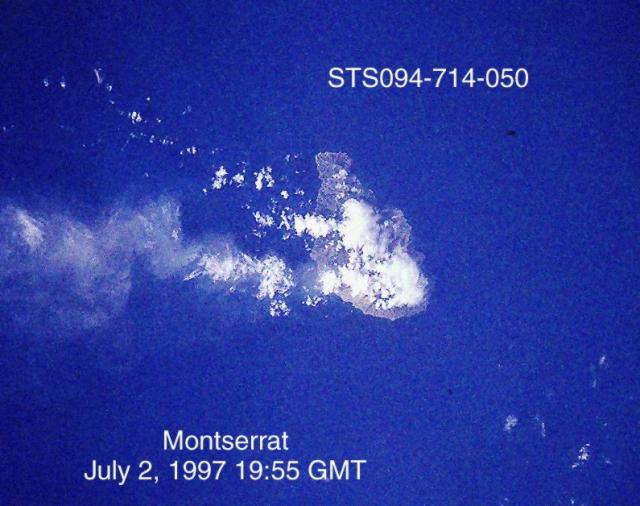 |
Figure 29. Photograph of Montserrat showing a plume from Soufriere Hills volcano taken from the Space Shuttle, 2 July 1997 at 1955 GMT (photo STS094-714-050). North is towards the top; the island measures about 8 x 13 km. Courtesy of NASA. |
The two weeks following 5 July were relatively quiet. During this interval rockfalls traveled as far as 500 m down the W and N faces of the dome. A brief glimpse of the dome on the night of 6 July revealed incandescent rockfalls above Mosquito Ghaut and Gages Valley. A partial view during the morning of 7 July showed a new steep-sided post-25 June dome above Mosquito Ghaut and Gages Valley with a broad, relatively flat summit area.
From 8 to 13 July there were fairly frequent emissions of diluted ash, often coinciding with the peak of the tilt cycle, and at times preceding small pyroclastic flows. The ash columns, reaching heights of ~ 3 km before dissipating, appeared to emanate from the W side of the post-25 June dome above Gages Valley. Theodolite measurements on 13 July gave an altitude of 950 m for the old dome and 941 m for the new growth in the 25 June scar. There was a steep 50-m-high protrusion on the new dome above Gages Valley. On 17 July the high point on the old dome (NE) measured 946 m, and the high point on the post-25 June dome 957 m. The spine above Gages valley observed on 13 July was no longer present.
On 21 July a field party at Trant's probing to a depth of 2 m inside the deposits at the end of the 25 June flow found a temperature of 640°C. A helicopter survey on 24 July showed fresh deposits in all of the ghauts around the volcano except Tuitt's. Another surveillance flight on 26 July indicated that most the rockfall activity was confined to Mosquito Ghaut and Gages Valley on the NE, and to the Galways area to the S. Vigorous steaming was coming from the flank of the dome in the Tar River area.
On 29 July between 0600 and 0830 there was more intense activity with several pulses of pyroclastic flows moving down Gages Valley as far as Gages Lower Soufriere. This activity was not preceded by earthquakes or a perceptible increase in rockfall activity. Other small pyroclastic flows occurred throughout the day.
Despite overcast conditions on 30 July, dilute ash plumes were visible from the Observatory during periods of heightened rockfall activity. A late-evening observation flight revealed that pyroclastic-flow deposits from 29 July extended just below the lower soufriere in Gages Valley. Several small pyroclastic-flow deposits from earlier that day (30 July) were noted on the N flank (top of Tuitts Ghaut) and NE flank (Tar River Valley and Galways area).
After 0300 on 31 July there were several periods of intense volcanic activity. A helicopter inspection showed very few new deposits in Gages valley (as far as Gages village) and some small flow lobes in Tuitt's Ghaut (to ~ 2 km from the dome). Many ash plumes were produced throughout the day and the most vigorously convecting clouds reached altitudes above 5 km. It appeared that most of the ash originated from near the top of Gages wall and was not necessarily associated with pyroclastic flows. The ash clouds drifted to the N and NW in light winds, but later in the day they traveled mostly to the W.
Seismicity. After 25 June swarms of hybrid earthquakes typically changed to tremor before the emission of pyroclastic flows. After 8 July hybrid swarms ceased, leaving seismicity dominated by rockfall signals of steady amplitude. A few long-period and hybrid events were recorded, but such activity remained at a very low level.
The number of rockfalls in the upper parts of Mosquito Ghaut and the Gages valley started increasing after 25 July. However, until 30 July the only other seismic signals recorded were a few long-period events. Starting at about 0300 on 31 July the activity became once again very elevated, peaking between 1230 and 1430, when the new Lees Yard seismometer recorded ~2 hours of nearly maximum amplitude signal. During this interval only one moderate- size pyroclastic flow was observed. Still the seismometers registered a significant increase of long-period earthquakes in addition to high-amplitude tremor that continued for much of the day, associated with ash clouds convecting to 6 km.
During the month several periods of low- to moderate-amplitude tremors appeared on both the St. George's Hill and St. Patrick's seismometer (e.g. 28-30 July); they were caused by heavy rains moving recent deposits. The largest volcano-tectonic events of the month occurred at shallow depths beneath English's crater on 24 July.
Ground deformation and volume measurements. EDM measurements showed that in general the inflation-deflation cycle that began on 22 June continued until 5 July with the same period (8 hours) and amplitude. However, after 25 June the trend showed deflation toward the center of the dome. Prior to 25 June inflation occurred to the N and deflation to the S. A survey of EASTNET stations at Harris, Windy Hill, Whites, and Long Ground on 16 July showed that the line to Whites had shortened by 16 mm since last measured on 24 June and by 31 mm from its long term mean. The line to Long Ground showed continued shortening and the line between Long Ground and Windy Hill showed slight lengthening. All the changes were consistent with their current trends although at slightly higher rates.
During 5-19 July the tilt cycles were characterized by lower amplitudes and longer (30-hour) periods; Chances Peak tiltmeter showed a gradual decrease in the rate of subsidence of the x-axis oriented SW. Superimposed on this trend were periods of cyclical inflation and deflation, often associated with hybrid swarms.
Measurements on the EDM line from Waterworks to Lees Yard on 20 and 27 July showed no major changes, although it had consistently shortened since first measured on 12 July 1997. No significant changes were observed on 26 and 27 July on either the new NW triangle (MVO-Garibaldi Hill-Lees Yard) or on the Waterworks-Lees Yard radial line. Finally, 30 July EDM measurements on the NW triangle confirmed the absence of a consistent trend.
A GPS survey on 5 July allowed an estimate of the total volume of deposits in several areas. The 25- June pyroclastic flow area was estimated at 4.61 x 10⁶ m3 and the volume of the flow that propagated into the Belham Valley was 90 x 103 m3. The combined volume of Mosquito, Paradise, Farms, and Farrell's deposits totalled 9.24 x 10⁶ m3, and the Gages Valley deposit was 3 x 10⁶ m3.
A dome volume of 77 x 106 m3 was calculated based on photographs from 17 July. Cumulative pyroclastic flow deposits were estimated to be 55.05 x 10⁶ m3 (DRE). The previous dome volume estimate on 31 May was 64.6 x 10⁶ m3, and the pyroclastic-flow deposit volume was 43.0 x 10⁶ m3. The average growth rate between 31 May and 17 July was 5.2 m3/s (DRE); visual observations suggested that after 25 June the growth rate was significantly higher.
Environmental monitoring. Rain water and trough water samples were collected from sites around the volcano on 10 and 22 June and 9 July. These values were nearly all within World Health Organization standards for drinking water, but the samples from Upper and Lower Amersham were extremely acidic and had high concentrations of total dissolved solids. All samples collected on 9 July to the N of the volcano had very low pH, probably because of the northerly wind direction on 8 July during heavy rain. Residents in the N of the island reported unusual sulfurous smells and light ashfall at this time.
A miniCOSPEC was used to measure SO2 flux from the volcano (table 23). Fluxes increased before 25 June and remained comparatively high through 24 June. Since 25 June no measurements were possible along the roads of the central corridor or through Plymouth because of the extreme risk in these areas, thus the value for 17 July were measured by static scanning of the plume from Garibaldi Hill an average of 10 scans.
Table 23. Daily average SO2 flux at Soufriere Hills using miniCOSPEC (metric tons/day). Courtesy of MVO.
| Date | SO2 flux (metric tons/day) |
| 10 Jun 1997 | 842 |
| 11 Jun 1997 | 839 |
| 12 Jun 1997 | 363 |
| 14 Jun 1997 | 442 |
| 15 Jun 1997 | 634 |
| 16 Jun 1997 | 409 |
| 17 Jun 1997 | 450 |
| 19 Jun 1997 | 618 |
| 20 Jun 1997 | 1171 |
| 21 Jun 1997 | 921 |
| 22 Jun 1997 | 438 |
| 23 Jun 1997 | 1157 |
| 24 Jun 1997 | 1933 |
| 17 Jul 1997 | 200 |
Workers collecting ash on 9 June found that small accretionary lapilli were common at the Plymouth sites. The same ash fell over a region including Brodericks and Dyers and it was thickest (2.5 mm) at Upper Amersham. On 17-18 June workers found a similar amount of ash had accumulated although in this deposit they recognized a significantly coarse grained component: it reached up to 5 mm in diameter close to the volcano. After a small explosive event on 27 June, coarse lapilli (up to 10 mm in diameter) were collected from Dagenham and Richmond Hill.
Information Contacts: Montserrat Volcano Observatory (MVO), c/o Chief Minister's Office, PO Box 292, Plymouth, Montserrat (URL: http://www.mvo.ms/); NOAA/NESDIS Satellite Analysis Branch (SAB), Room 401, 5200 Auth Road, Camp Spring, MD 20746, USA; Cindy Evans, Space Shuttle Earth Observations Office, Mail Code C102, Lockheed Engineering & Sciences, P.O. Box 58561, Houston, TX 77258 USA.
Vigorous dome growth continues in August
Most of the following condenses reports from the Montserrat Volcano Observatory (MVO) for August 1997. Vigorous dome growth continued during August and exhibited cyclical patterns of tilt and seismicity, rockfalls, the growing dome's extruding and falling spines, and abundant pyroclastic flows. In addition, NOAA's Satellite Analysis Branch (SAB) reported numerous ash clouds commonly blowing W to NW for tens to hundreds of kilometers. The clouds appeared in GOES satellite images, which are increasingly accessible on the world-wide web. Sketches of a few of these plume images during mid-1997 appear in figure 30. Given the persisting crisis, it is worth noting that the SAB also broadcasts forecasts of the plume's predicted trajectory after energetic eruptions for the benefit of aviators.
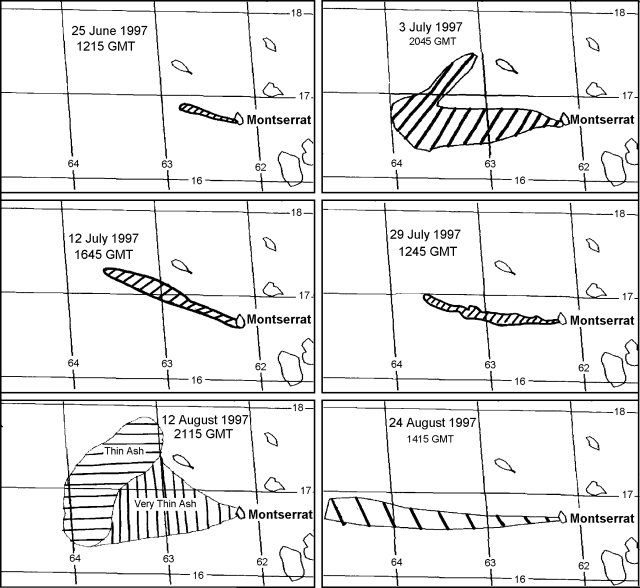 |
Figure 30. Examples of ash plumes from Soufriere Hills documented during mid-1997. Courtesy of SAB. |
Tilt and seismicity. The period 31 July to 20 August was characterized by elevated levels of seismic activity. During 1-6 August tiltmeter readings revealed a cyclic pattern with a 10- to 14-hour periodicity. During this time, regular deflation and inflation of the volcano corresponded with earthquake swarms and continuous pyroclastic flows, respectively. Continuous and near-continuous tremor of varying frequency was noted during several swarms in this period. This pattern is similar to those reported in BGVN 22:06. In addition, on 2 August several very large hybrid events occurred during a hybrid earthquake swarm; at 0900 the hybrid earthquakes peaked at ~3 events/minute with continuous moderate tremor between events.
The 10- to 14-hour cycle continued until 9 August when the pattern was broken with an explosion at 2051. An eruption comprised of several intense bursts caused heavy ash and pumice fall in Old Towne (Plymouth). A new pattern then emerged during 10 to 16 August in which cyclic activity was dominated by hybrid earthquakes and dome growth. Hybrid earthquakes appeared in swarms that were thought to be associated with extrusion of new dome material; the high level of seismic activity suggested a rapid extrusion rate. By 17 August this pattern had become less regular with longer intervals and higher intensity tremors at the end of swarms. After a 17 August swarm, tremor lasting 90 minutes was followed by 6 minutes of well-defined monochromatic seismicity. During 18- 20 August the cycle of alternating hybrid swarms and dome growth developed an 8-hour period.
Seismicity diminished during 21 to 29 August, an interval when rockfall and pyroclastic flow signals were dominant. The chief cyclical pattern noted during this interval took place during 23-26 August: enhanced seismicity at intervals of 12-15 hours. The cycle's peak coincided with modest ash emissions and rockfalls. On 30 and 31 August, activity was reported to be increasing and a 10-hour cycle had become evident.
Pyroclastic flows and ash plumes. During 1-4 August several new pyroclastic flows were reported on the NW flank in the Gages Valley. At 1800 on 3 August a major N-flank flow reached Gages Village and Port Plymouth, causing fires and damage to buildings. The flow was associated with strongly convecting ash plumes that rose up to ~4.6 km altitude and heavy W-flank ashfalls.
On the afternoon of 4 August a dark gray jet was seen projecting from the N flank at 60 degrees to the horizontal, and extending to a height of 600 m. This was followed by pyroclastic flows into the Gages, Mosquito, and Tar River valleys. A vertical ash cloud rose to over ~7.6 km and fragments of rock and pumice up to 11.5 cm diameter fell at the observatory.
On 5 August two periods of intense activity were followed by violent explosions and energetic pyroclastic flows. MVO field teams saw pyroclastic flows enter the sea at the mouth of the Tar River; they covered ~80% of the delta. Researchers investigated submerged portions of the Tar River fan on 25 August. Many of the 5 August pyroclastic flows were subsequently described as rich in pumice, and in addition to the Tar, they also followed the Tuitts, Mosquito, and Gages valleys. Falling pumice reached 8 cm in length; meter-sized impact craters formed up to 1.5 km S of the dome. After the pyroclastic flows there followed a succession of explosive pulses emitting ash at 20- to 30-second intervals; these pulses coincided with elevated 1-Hz harmonic tremor lasting up to 40 minutes.
From 6 to 9 August there were several explosions followed by ash clouds to altitudes of ~5-7 km. Pumice fall and pyroclastic flows were also reported after the explosions. On 7 August field teams saw an ash plume ascend to 1 km at a maximum rate of 47 m/s. From 11 to 31 August, numerous smaller explosions and flows were reported. Throughout the month ash plumes rose up to ~2.4 km, enhanced steaming was coincident with elevated seismicity, and there were small diffuse pyroclastic flows.
Crater observations and measurement. Although high activity occurred during the first week of August, it was not until 7 August that the summit was visible for the first time since July. On 7 August the dome's top contained a bowl-shaped crater oriented with its lower edge facing Gages Mountain. Also, the Gages Valley had become deeply incised. A deep, oval-shaped scar formed from the several small explosions during 6-9 August; on 10 August observers saw new dome material refilling the scar.
On 11 August, the MVO reported theodolite measurements of the new crater taken during clear conditions around 9 August. The crater's volume was 5-7 million cubic meters; the highest point on the dome was measured at 995 m elevation. EDM measurements were also taken on the line from Lee's Yard to Waterworks on several occasions in August; these revealed slow shortening.
A GPS survey conducted on 12 August indicated that a deformation event has occurred in the last 3 months, shifting sites at Whites and Long Ground by about 3 cm N and NE. The results of the survey also suggested that by the end of the interval this movement had slowed or ceased.
On 12 August, a very large spine was observed in the crater, but by the next day it had broken into thirds. A view on 14 August revealed a new cluster of spines above a steep chute at the head of Gages Valley. By 19 August, an area 150 m in diameter perched above Gages wall. It was composed of a series of tall spines; the top of one measured at 969 m. Six days later, on 25 August, it was noted that the mass of spines above Gages wall was breaking up and pyroclastic flows funneled down the Gages valley.
On 27 August fumaroles, rockfalls, and incandescence were noted on the dome's SE flank, an area that had been lacking in recent activity. A secondary phreatic explosion occurred on 30 August after pyroclastic flows had buried a small pond. By 31 August a deep gully had eroded into the deposits below the dome.
Cronan and others (1997) studied Montserrat's hydrothermal discharges in 1995 at spots a few kilometers N of Plymouth near the coast, both on and offshore. The chemical composition of offshore discharges varied the most; for iron, the extreme example, the offshore compositional variation was 300-fold. Temperature also varied at the offshore springs. The authors made a case for monitoring submarine hydrothermal discharges as a means to help predict future eruptions.
Many news reports in the month of August focused on either the ongoing destruction of Plymouth or the lives of people dislocated by the eruption. Press coverage was further heightened when residents made mid-month protests appealing for more governmental support.
For those readers interested in the history of Soufriere Hills, work by Jaggar (1937a, 1937b) and Perret (1939) dealt with the 1933-37 seismic crisis centered at Gages Soufriere. The crisis included abnormal fumarolic activity, earthquakes centered at Gages, and earthquake counts reaching thousands of events per month. Yet, the crisis did not lead to eruptions. Both reports contained an interesting array of experiments and then-new technologies.
References. Cronan, D.S., Johnson, A.G., and Hodkinson, R.A., 1997, Hydrothermal fluids may offer clues about impending volcanic eruptions: Eos, Transactions, American Geophysical Union, p. 341 and 345.
Perret, F.A., 1939, The volcano-seismic crisis at Montserrat, 1933-1937: Washington, D.C., Carnegie Institution of Washington, 76 p.
Jaggar, T.A., 1937A, Adventures and methods in studying West Indian volcanoes, in The Volcano Letter, no. 437 (July 1936, p. 6-7), compiled and reprinted in 1987, edited by Fiske, R.S. and others: Washington, D.C. [ISSN 0890-1996], Smithsonian Institution Press.
Jaggar, T.A., 1937b, Work of F.A. Perret on Montserrat, in The Volcano Letter, no. 449 (July 1937, p. 1-7), compiled and reprinted in 1987, edited by Fiske, R.S. and others: Washington, D.C. [ISSN 0890- 1996], Smithsonian Institution Press.
Information Contacts: Montserrat Volcano Observatory (MVO), c/o Chief Minister's Office, PO Box 292, Plymouth, Montserrat (URL: http://www.mvo.ms/); NOAA/NESDIS Satellite Analysis Branch (SAB), Room 401, 5200 Auth Road, Camp Spring, MD 20746, USA.
Repeated pyroclastic flows during 31 August-13 September
The following condenses both Daily Reports and Scientific Report 73 of the Montserrat Volcano Observatory (MVO) for the interval 31 August-13 September 1997. Throughout this two-week period repeated pyroclastic flows left the upper part of Mosquito Ghaut (the drainage directly N of Chances Peak) completely filled. Electronic surveys (EDM) indicated sites in the volcano's NW quadrant (Lee's Yard quadrangle) moved very slowly. Very preliminary analysis of the dome and pyroclastic flow deposits suggested that around early September the extrusion rate was ~6-7 m3/s. Although provisional, this was the highest sustained extrusion rate since the eruption began.
Revisions to the previous hazard map (BGVN 22:06) yielded a new map on the MVO website in September (figure 31). The new map contains two boundaries that had shifted northward compared to the previous one; these boundaries identify three hazard zones described in the figure caption. Chances Peak, the old summit, lies on the W-central side of the volcano's summit area.
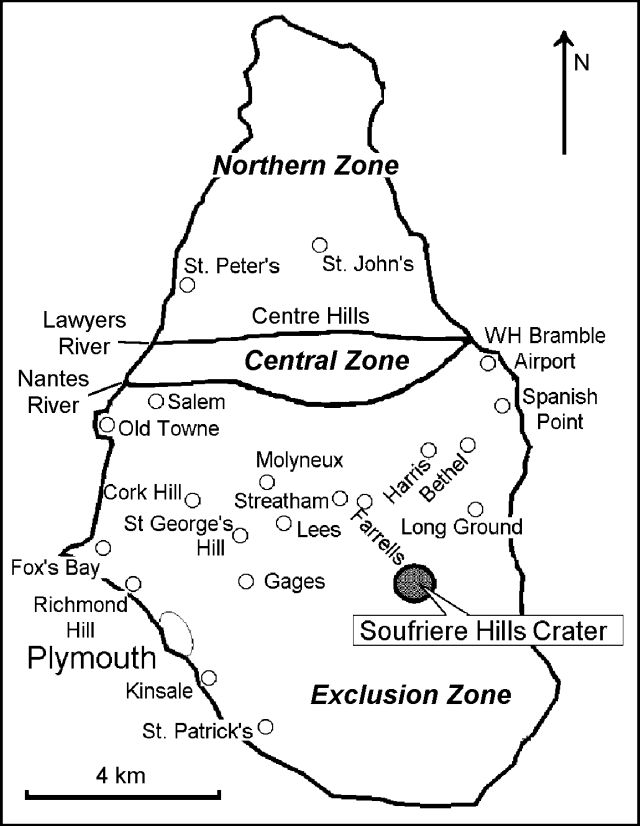 |
Figure 31. September 1997 Montserrat volcano risk map showing three main risk zones. The Exclusion Zone was designated "No admittance except for scientific monitoring and National Security Matters." The Central Zone was designated "Residential area only, all resident[s] on heightened state of alert. All resident[s] to have rapid means of exit 24 hours per day. [In the] hard hat area, all residents to have hard hats and dust masks." The Northern Zone was designated as "Area with significantly lower risk, suitable for residential and commercial occupation." Courtesy of MVO. |
31 August-13 September. On 31 August activity remained high and cyclic patterns were evident in the seismic data. After 31 August, pyroclastic flows decreased and generally remained low until 4 September when the level again increased slightly. On 4 September, several hours of pronounced rockfalls were noted; then, at 1540, two detonation sounds were heard associated with a rapidly rising ash cloud and a pyroclastic flow. In the evening, the volcano's upper flanks were unobscured allowing viewers to see a concentration of activity on the dome's N side above Mosquito Ghaut. As had been the case during the last two days of August, rockfall and pyroclastic flow activity continued to show a ~12-hour cyclicity during these first few days of September. This did not continue after 4 September and activity for the rest of the period showed no clear long-lasting pattern although there were a number of earthquake swarms tabulated in MVO's reports.
On 5 and 6 September volcanic activity was generally relatively low. Views of the dome were very clear during the night of 5 September disclosing semi-continuous rockfalls down Mosquito Ghaut and more restricted activity on the upper W flank. Activity increased for about an hour on the morning of 8 September, when a series of moderate pyroclastic flows descended the N flank. Wholly unconstrained by Mosquito Ghaut, these flows spread W (over Farrell's plain) moving ~2 km NNW of Chances Peak (around Riley's Estate) and then progressing towards the W following the Belham drainage system. These flows all moved relatively slowly but reached ~3 km NW of Chances Peak (Dyer's River immediately south of Molyneux). They left the first substantial block-and-ashflows yet deposited in the Belham Valley during the current crisis. In contrast, the pyroclastic flow in the Belham Valley on 25 June deposited a dense ashflow and explosions during August deposited thin pumice flows.
The report for 7 September noted two episodes with intense pyroclastic flow activity due to collapse of hot dome lava. Both of these episodes lasted about an hour-and-a-half and sent material onto the N flank (Tuitt's Ghaut and Farrell's plain). As measured from Chances Peak the pyroclastic flows progressed to distances ~3 km NNE and ~2.6 km NW (to below Harris Lookout on the E and to the to the upper parts of the Belham Valley as far as Dyer's Bridge on the W). After these pyroclastic flows, Farrell's plain was left covered with big boulders. On 7 September, lofted ash blew in an unusual direction, NE. As a consequence ash fell on the neighboring island of Antigua affecting the V.C. Bird International Airport there.
Heightened activity was again noted on 8-9 September. On the latter day there were two main episodes that produced N-directed pyroclastic flows due to dome collapse: the first episode lasted between 0230 and 0430 and was preceded by a hybrid earthquake swarm, the second episode was more intense and lasted from 1005 until 1407 with several discrete pulses. The second episode peaked at 1300 when a series of vigorously convecting pyroclastic flows were observed from MVO's observatory site in Old Towne (7 km NW of Chances Peak). At least two of the flows deposited material on the volcano's northwestern flanks (into an unnamed ghaut in the headwaters of the Belham drainage system). Seismic signals during the venting of the pyroclastic flows and dome collapses had long- period precursors, signals previously associated with gas venting and explosions.
On 9-10 September MVO moved its observatory to a spot along the island's main axis lying ~8 km N and ~1.25 km W of Chances Peak. This spot is called "Mongo Hill" (labeled as Mango Hill on some maps).
The daily report discussing 9-10 September described two hybrid earthquake swarms, each lasting about 2 hours. The first was clearly associated with increased volcanic activity. On 11 September the volcano remained shrouded in cloud for much of the day.
The daily report for the 24-hour period ending at 1600 on 13 September 1997 noted especially vigorous pyroclastic flow activity. The summit of the volcano was shrouded in cloud for much of the day; however, good visual observations were possible because of ash plumes rising above the clouds and of pyroclastic flows descending the N flank. The most vigorous activity in the middle of the afternoon produced pyroclastic flows funneling NW into the uppermost part of the Belham valley in the Dyer's area and also at least one audible explosion from the dome. Ash clouds rose typically to 1.5 km, being generated both from pyroclastic flows and from continuous summit venting. New pyroclastic flows were also noted on the volcano's NNE and NE-E (in Tuitt's and the Tar River drainages), and provisionally to its SW (in the White River).
Information Contacts: Montserrat Volcano Observatory (MVO), c/o Chief Minister's Office, PO Box 292, Plymouth, Montserrat (URL: http://www.mvo.ms/); NOAA/NESDIS Satellite Analysis Branch (SAB), Room 401, 5200 Auth Road, Camp Spring, MD 20746, USA.
Dome collapse and explosions
The following condenses Scientific Reports of the Montserrat Volcano Observatory (MVO) for 14 September-12 October. The volcano maintained an extremely high level of activity during this period. During the first week, rockfall and pyroclastic flow activity was concentrated in Tuitt's Ghaut. The flows typically traveled ~3 km and filled the upper reaches of the ghaut. Seismic activity was dominated by pyroclastic-flow and rockfall signals; however, a hybrid swarm preceded a 14 September flow, and there were a large number of long-period events. A major dome collapse on the morning of 21 September generated pyroclastic flows and surges over the NE flank. A phase of explosive activity began on 22 September during which Vulcanian explosions occurred every several hours. The explosions produced vertical eruption columns and collapsed fountains of material that fed pyroclastic flows. The pumice-rich flows traveled down all the ghauts around the volcano, reaching the sea at Tar River valley (figure 32), White River valley, and Spanish Point. After a large explosion on 11 October, a pyroclastic flow in White River valley destroyed a bridge and the Radio Antilles installation. Ash and pumice fall affected N and W Montserrat; Antigua also received occasional light ashfall.
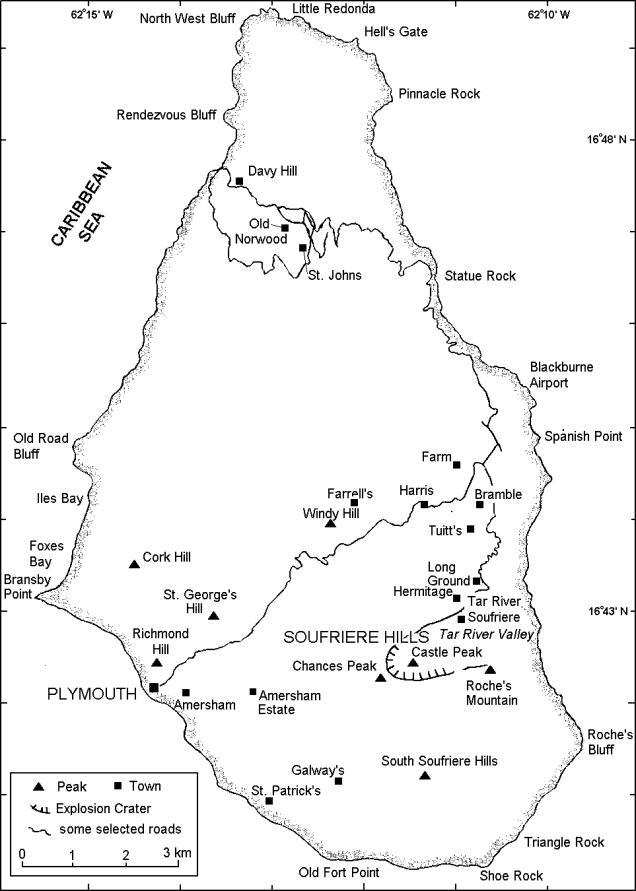 |
Figure 32. Map of Montserrat showing selected towns and features. |
Visual observations. Activity was very high during 14-21 September with moderate-sized pyroclastic flows moving down Tuitt's Ghaut and over Farrell's plain. In the upper reaches of Mosquito Ghaut, material overflowed into Tuitt's Ghaut and created a small debris fan . The largest individual pyroclastic flow in Tuitt's Ghaut occurred on the morning of 17 September, depositing material 200 m beyond the confluence of Tuitt's and Mosquito Ghaut. The dome's SE side continued to degrade, generating rockfall debris and small pyroclastic flows in Tar River.
At 0354 on 21 September a large collapse occurred on the NE flank of the dome. Pyroclastic flows down Tuitt's Ghaut devastated the area from Trant's Yard to White's Yard. The airport terminal building was destroyed as well as most properties in Spanish Point, Bramble, and Tuitt's; in addition, Bethel village was buried. Small fans developed at the mouths of Farm River and White's Ghaut.
Most deposition from the 21 September flows occurred around Trant's Yard and Farm Estate and greatly extended the fan formed on 25 June (BGVN 22:06). A lobe detached from the main Tuitt's Ghaut flow (500 m S of the Mosquito Ghaut confluence) and spread ENE across Bramble village. The deposit was similar to that of the Bethel lobe emplaced on 25 June, consisting of a thin, ashy unit with abundant large blocks sized from one to several meters. Material also spilled from Tuitt's Ghaut into White's Ghaut at a low point in the valley wall. Pyroclastic flows that reached the sea were generated in White's Ghaut; extensive surges traveled over Tuitt's Estate, Bethel Estate, and White's Yard. The collapse generated ~8 x 10⁶ m3 of deposits, a considerably larger volume than on 25 June.
Following the 21 September collapse, a series of Vulcanian explosions began at 0055 on 22 September. During 22-28 September, 15 explosions occurred with an average periodicity of 9.7 hours. The explosions were similar to those of early August (BGVN 22:08); they began with dark-gray explosion clouds comprised of radiating spears. The clouds quickly rose 600-1,000 m above the dome and developed into convecting columns. A rapidly building roar was heard and ballistics were projected up to 1.5 km from the dome during the explosions. Pyroclastic flows were generated during most explosions and traveled down all the six major ghauts (Tar River, Tuitt's, Mosquito, Tyre's, Gages, and White River). The explosion columns rose up to 7,600 m; after each explosion, vigorous pulses of ash venting were observed for up to 1 hour and low rumbling sounds were heard for up to 30 minutes. At night the explosions resembled a large fireball above the volcano; showers of incandescent ballistics occurred over Farrell's plain, Gages Mountain, and Chances Peak. Incandescent surges were seen on several occasions traveling over Farrell's plain and down Tuitt's Ghaut. At the onset of one explosion, observers at Jack Boy Hill saw high levels of gas venting from fumaroles on the dome's E flank.
Thin, pumiceous pyroclastic-flow deposits were generated by the explosions during 22-28 September. They were generated by fountain collapse; a veneer of pumice was left over the area between Gages and Peak 'C', over Chances Peak, over the Galways area, and over much of the dome's surface. The flows were generated soon after the onset of the explosions. Maximum runout distances were ~4.5 km in Tuitt's Ghaut, 2.25 km in Tyre's Ghaut, 4 km in White River, 2.6 km down Gages Valley, and 2.5 km down Farrell's Plain; flows reached the sea at Tar River. In unconfined areas such as the Tar River Fan, the Farrell's Plain, and the Trant's Farm Fan, the flows left long, thin, tongue-like deposits and rarely spread into thin sheets. Flows confined to narrow ghauts were thicker, narrower, and had steeper termini.
Fallout from the 22-28 September explosions varied. Most of N and W Montserrat had moderate ash falls including pumice fragments. Pumice fragments were recorded at the Observatory on Mango Hill and at Little Bay (2 cm), at Cudjoehead and Olveston (3 cm), and on Davy Hill (5 cm). A 6-cm pumice was reported in Woodlands.
During 14-28 September, observations of the dome showed that the scar above Tuitt's Ghaut extended 300 m into the dome; it opened into an explosion crater ~300 m diameter. A bank of pumice and talus separated the crater and the scar; depth of the crater below the bank was ~150 m. Much of the dome's surface and the upper area of Chances Peak were covered by fresh pumice deposits. Two of the three peaks on the northern crater wall (Peaks 'B' and 'C') had severely eroded; they were nearly covered by the dome talus and pumice deposits.
A total of 32 explosions occurred during 28 September-12 October with an average periodicity of ~10 hours, although the intervals varied in duration from 4.9 to 33.7 hours. Explosions after shorter intervals were weaker, produced paler, less vigorous plumes, and were accompanied by smaller pyroclastic flows.
Pyroclastic flows during 28 September-12 October were concentrated in Tuitt's Ghaut and the Tar River Valley, although regular activity also occurred in the White River, Fort Ghaut, and over the Farrell's Plain. Many of the Tuitt's Ghaut flows traveled 4-4.5 km, building a 300-m-wide fan around the Farms and Trants area. The flows over-spilled the ghaut walls in several locations and spread over a wide area, traveling ENE and passing through Spanish Point where they reached the sea. Many pyroclastic flows in the Tar River area reached the sea by traveling down the S side of the valley and down two chutes on the dome's E face. The surface of the fan was almost entirely covered by new pyroclastic-flow deposits; a pronounced hump along the fan's central axis developed. Pyroclastic flow activity in White's River was more limited with only a few flows reaching the area where Great Alps Falls had been. However, pyroclastic flows from an explosion at 0105 on 2 October covered the bridge at O'Garra's, reaching the sea at the mouth of the White River.
A large explosion at 1757 on 11 October covered the field at O'Garra's with pyroclastic-flow deposits, destroyed the Radio Antilles installation, and completely buried a bridge. Incandescent blocks and a glowing cloud were seen from Antigua during the event. Flows in Fort Ghaut spread NW around the Gages fan, W around Upper Amersham and into Plymouth. The Plymouth flows spread through Dagenham and reached within 300 m of the sea. Occasional pyroclastic flows have occurred in Tyer's Ghaut, although the longest runouts were only ~2 km.
Plume heights from the 28 September-12 October explosions varied from 3.6 to 7.6 km. Pumice fallout in inhabited areas only occurred on 1 and 2 October, although heavy ashfall occurred many times on the rest of the island. Antigua received light ashfall on three occasions.
Very good views of the dome were obtained during 28 September-12 October. At the base of the scar above Tuitt's Ghaut, the bank of pumice and talus was steep and appeared consolidated. The lowest point on the bank was 860 m above sea level; behind it was the circular explosion crater, 300 m in diameter. The crater rim had a fairly constant elevation of ~950 m. The highest point on the dome was a spine on the rim above Galways with an elevation of 975 m. Glimpses down into the explosion crater suggested its base was 100-150 m below the level of the pumice and talus bank, probably close to the level of the original English's Crater basement. The crater and scar have both been enlarged slightly by rockfalls from the inner walls, by erosion, and by shaking during the explosions. Chutes were developing along both sides of a large consolidated area of the dome above Galways and the SE flank in the Tar River Valley was degrading slowly.
Much erosion occurred around the margins of the dome on the old crater wall. Peak B on the N crater wall was lowered by 30 m due to the passage of pyroclastic flows this summer. A 90-m-wide chute was cut down the Gages Valley face of the dome immediately S of the original Gages Wall against Chances Peak. This chute was up to 50 m deep and cut at least 30 m into the original basement in places.
Seismicity. During 14-20 September, seismicity was dominated by rockfall and pyroclastic-flow signals. There were few earthquakes, although the pyroclastic flow on 14 September was preceded by a hybrid swarm that included some large events. The hybrids had amplitudes as high as any recorded since the installation of the broadband network in October 1996 at the Windy Hill station. An unusually high number of long-period earthquakes occurred before, rather than after, pyroclastic flows. On 16 September, a "bang" related to a long-period earthquake was heard.
The night of 20-21 September showed a marked change in seismicity. A hybrid swarm occurred before a big pyroclastic flow at 0354, but the hybrids did not decrease very much after the event. Then at 0055 on 22 September, the first in a sequence of explosive events took place that occurred at intervals of 6-10 hours during 22-28 September. As in August, each explosion was recorded on seismometers as a pyroclastic-flow signal preceded by a ~1 Hz signal whose amplitude varied with the associated pyroclastic-flow amplitude. The long- period energy continued throughout the pyroclastic-flow signal and afterwards as low-amplitude tremor. A few explosions were preceded by hybrid swarms, but most had very little precursory seismicity. When swarms occurred, they continued for a short time after the explosion. All of the explosions were followed by between 20 minutes and 3 hours of tremor. The tremor was less harmonic than in August but had two or three well-defined spectral peaks. As in August there was good visual confirmation that the tremor correlated with ash venting. Volcano-tectonic earthquakes during 22-28 September were centered 2-4 km below the dome.
Seismicity was low during 28 September-12 October, except during explosions and subsequent tremor, which on occasion lasted several hours. The explosions, as in August (BGVN 22:08), had a distinctive seismic signal, with an initial low-frequency phase followed by a high-frequency phase and low- frequency tremor. The high-frequency phases are assumed to be caused by pyroclastic flows observed after each explosion. Low-frequency tremor at the start of the signals preceded observed activity in the crater by several seconds. It is assumed to continue throughout the pyroclastic flow signal and become the post-explosion tremor. Both the low frequency phase and the tremor have the same peaked spectrum with the main peaks at 1.2 and 1.7 Hz.
Ground deformation. On 20 September, GPS observations taken at Harris, White's, Long Ground, and Hermitage confirmed the shortening noted in recent reports on the Harris-White's and Harris-Long Ground lines. The length of shortening was ~3.5 cm on these lines due to N movement of White's and Long Ground. The movement did not appear to be accelerating. The Hermitage site was not occupied due to the activity on the NE side since 21 May. The line to Harris showed a further 1-cm shortening (NE movement of Hermitage) consistent with its movement in May. The White's site was affected the following morning by pyroclastic surges. The activity also damaged the permanent GPS site at White's.
No EDM measurements were made during 14-28 September. Ash from pyroclastic flows and explosions obscured the target at Lee's Yard and it was unsafe to enter the area to clean the reflector. No GPS observations were made during 28 September-12 October. The amount of ash on the N, E, and W flanks prevented the helicopter from landing at all but two sites. The O'Garra's GPS site (M46) was destroyed by pyroclastic flows on 11 October. EDM measurements to the Lees reflector were not possible due to ash cover and airborne ash.
Volume measurements. No dome or deposit volume measurements were made during 14- 28 September; however, photographs were obtained from the ground at Whites and from a hover position close to Windy Hill.
A series of accuracy tests were carried out with GPS-laser binoculars from a helicopter to assess their suitability for dome mapping. The working range for this instrument has typically been 400 m.
Several clear days during early October allowed a detailed survey and map of the dome to be completed. Theodolite measurements were made from Jack Boy Hill, Flemings, Garibaldi Hill, and the old observatory in Old Towne. Photographs were taken from White's, Harris, and Jack Boy Hill. A series of photographs at different angles around the dome were taken from the helicopter; the position of the camera was determined with the GPS.
The dome volume was 68 x 106 m3 during early October. The volume has decreased since the last measurement on 28 August when it was 78.1 x 10⁶ m3, at which time the extrusion rate was 8.7 m3/s (average 17 July-28 August). The difference in these volumes represents the volume of the 21 September collapse as well as a substantial amount of pyroclastic flow activity over Farrell's plain and in Tuitt's Ghaut prior to the collapse.
Environmental monitoring. Dust Trak sampling carried out at several sites around the island to evaluate the atmospheric particulate load showed comparatively high values in the N and E area and high values in the Salem area. The central area also showed elevated values. The high levels were the result of fallout from explosive activity.
On 12 September, sulfur dioxide diffusion tubes were collected from four sites to the N of the volcano, at MVO (south), Lawyers, Fogarthy, and Geralds. The diffusion tubes measured the average background level of SO2 during the exposure period. As in previous sampling periods, SO2 gas was not present in measurable quantities. On 4 October, sulfur diffusion tubes were left at Weekes and at St George's Hill in the evacuated zone to be collected after two weeks. Under normal prevailing wind conditions (to the W or NW) the sites lie under the plume. Sulfur diffusion tubes at four sites in the inhabited area of the island were being left for four weeks. Until early October there was no detectable SO2 in the inhabited area.
A mini-COSPEC was deployed on 20 September from a police launch. A series of traverses were made under the plume at different distances from the volcano. The average SO2 flux was 600 metric tons/day. The launch broke down the next day and was out of action for over a month.
Rainwater collected at three sites on 21 September showed low pH. One site also showed substantially elevated chloride content. High acidity levels persisted during late September.
Information Contacts: Montserrat Volcano Observatory (MVO), c/o Chief Minister's Office, PO Box 292, Plymouth, Montserrat (URL: http://www.mvo.ms/).
Explosions and dome growth
The following summarizes Scientific Reports of the Montserrat Volcano Observatory (MVO) during 12 October-23 November 1997.
General. During September, activity was dominated by collapses with simultaneous pyroclastic flows down ghauts (BGVN 22:10). Particular events differed in magnitude, column height, or pyroclastic runout, possibly due to time elapsed between events. During 12-21 October, 29 explosions were recorded for a total of 61 since the latest episode began on 28 September. After the last explosion on 21 October, a new dome was seen in the crater, extruding at a rate of up to 8 m3/s. The new dome grew during the following week on the S side, weakening the crater wall on the Galway's side (figure 33) and creating two large vertical cracks on the outside of the wall by 2 November. Further growth in the weakened area led to a 4 November collapse, which removed much of the pre-explosion dome complex material. A subsequent collapse on the 6th removed a significant portion of the new dome and old material. Pyroclastic flows from these collapses reached the sea and a fan deposit at the mouth of White River was significantly extended. Dome growth coincided with large swarms of hybrid earthquakes. After the 6 November collapse, the swarms subsided yet seismicity remained relatively high. Low levels of eruptive activity prevailed for the rest of November. Although bad weather limited observation of the dome, the lobe in the Galway's area was seen as the focus of growth during 9-23 November but at a slower rate. Seismicity included rockfall signals and small-amplitude hybrid earthquakes.
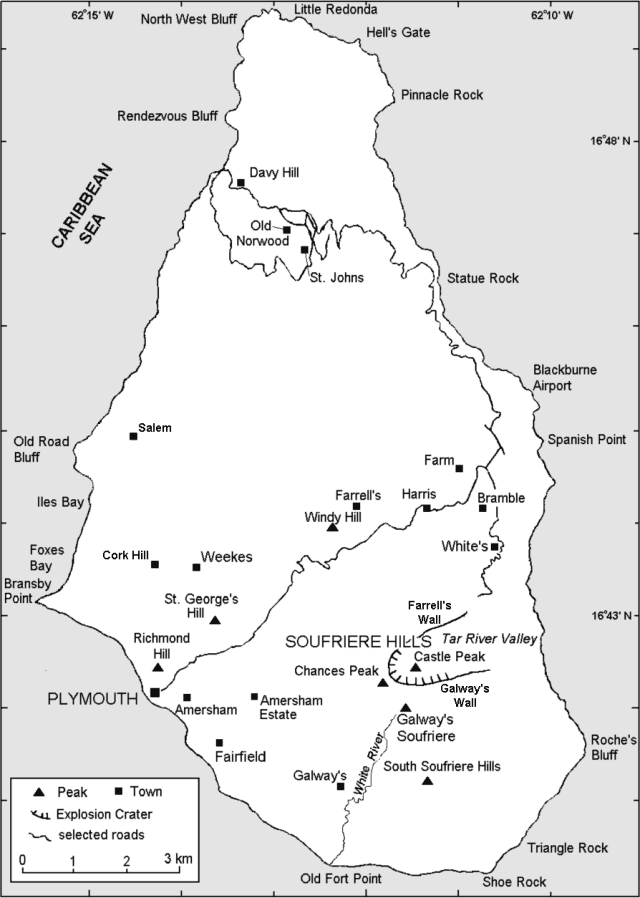 |
Figure 33. Map of Montserrat showing selected towns and features around the Soufriere Hills volcano. |
Visual observations. Vulcanian explosions up to 21 October resulted in pyroclastic flows into surrounding ghauts. Intervals between explosions averaged 8.5 hours with a range of 2.75 to 20.5 hours. During 14-16 October, 12 explosions occurred; intervals between single events lengthened towards the end of the period. Three vigorous explosions on 20-21 October sent plumes to 9,100 m, pumice to Salem and Olveston, and ash to the N. Pumice from Cork's Hill measured up to 10 cm in diameter and ballistics fell 2 km N from the vent. Pyroclastic flows were generally radial for larger explosions; however, the N ghauts were preferred routes because the crater is open to the N. Some flows had relatively small runouts (<1 km) in only one or two ghauts. Pyroclastic flows over the past month have left thin (0.3-1 m) deposits on all flanks, accumulating and infilling the topography. Fort Ghaut in Plymouth and Mosquito Ghaut were completely filled, and Tuitt's and White's Ghauts were partially filled, resulting in fans advancing into towns. Gage's Soufriere was significantly filled with material stacked in front of St. George's hill.
A new dome was first recorded as an incandescence inside the scar during the evening of 22 October. The next day, fresh lava overspilled the tephra rampart between the scar and crater and, by 25 October, occupied a substantial portion of the scar. The lava appeared to be blocky, coarse material, which, due to oxidation at the top of the conduit, is darker than normal (similar to last October; BGVN 21:10). By 25 October the dome's peak had risen to 910 m, 40 m below the crater rim. Growth to the N and vertical infilling of the scar caused rockfalls that traveled a few hundred meters down Tuitt's Ghaut; however, rockfalls were few in number considering the rate and blockiness of the extrusion as well as the steepness of the ghaut. Dome growth continued over the next few weeks with vigorous ash-and-steam venting. Rockfalls from the new dome and old crater coincided with hybrid earthquake swarms.
An overflight on 2 November revealed two large vertical cracks on the Galway's side of the crater; by the next day, these had evolved to deep gullies. Rockfalls on the dome's S side occurred on the morning of 4 November. At 1206 on 4 November, a wide section of the crater in the Galway's area collapsed and caused an hour of pyroclastic flows. Some of the flows reached the sea at O'Garra's and formed a delta. Ash clouds rose to 3000 m. The collapse removed a large part of the old dome but left the 22 October dome mostly intact. Observations on 6 November included two distinct lobes of the new dome separated by a small crater venting ash; the N lobe remained at its 2 November height of 937 m while the S lobe grew. Following 18 hours of high- amplitude tremor a second collapse in the Galway's area began at 1430 on 6 November and lasted 35 minutes. More material was removed than in the previous collapse, rockfalls occurred in Tar River valley and Gage's areas, and an ash plume reaching 4,500 m drifted W.
After a few days of poor visibility, growth of the new dome in the collapse area was revealed. A fin-shaped lobe had grown almost vertically in the old crater wall position; it had a coarse, blocky outer face but a smooth appearance on the inner surface where it extruded out of a cleft in the dome center that exhibited vigorous degassing and venting of ash. The distinct N and S lobes divided by a central cleft or vent were similar to earlier structures (BGVN 21:08 and 22:05), although in this case the N lobe extruded first to reach a certain size then relaxed while growth shifted to the S lobe; this in turn lead to a catastrophic collapse of the old crater wall. Overflight observation on 11 November showed that the S lobe had doubled in size in 3 days to fill the collapse scar of 4-6 November; however, it was extruding at a slower rate. Ash and steam continued to vent from the central cleft. Ash clouds rose to 1800 m drifting W and fell out over Plymouth. Rockfall spalling off the S lobe eroded chutes S of the dome and accumulated in thick deposits in Galway's Soufriere.
Seismicity. Figures 34, 35, and 36 show seismicity during 12 October-23 November. The sequence that began on 22 September (BGVN 22:10) continued until 21 October. Seventy-six explosions at intervals of 3-34 hours were recorded. The explosions appeared as 1-Hz signals of varying relative amplitude and were followed by pyroclastic-flow signals; long-period energy continued through the flow duration and persisted as lower-amplitude tremor of 0.5 to 3 hours duration. Signals coincided with ash venting but there was little or no precursor activity.
 |
Figure 34. Daily events at Soufriere Hills triggering the broadband network system, 12 October-23 November 1997. Event counts are from 1600 on the previous day to 1600 on the date indicated. Data courtesy of MVO. |
 |
Figure 35. Seismic swarms at Soufriere Hills during 20 October-13 November 1997. Data courtesy of MVO. |
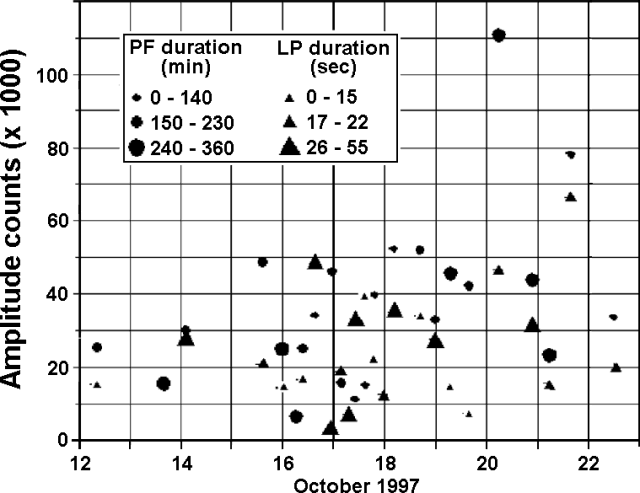 |
Figure 36. Explosions from Soufriere Hills measured at the Windy Hill broadband station during 12-23 October 1997. Amplitudes are peak-to-peak in counts. Data courtesy of MVO. |
The second explosion of 20 October and the first of 21 October were accompanied by swarms of hybrid and volcano-tectonic earthquakes. The second explosion of 21 October initiated 24 hours of hybrid and volcano- tectonic earthquakes and rockfalls down Tuitt's ghaut before ending in a long, sparse swarm on 23 October, although a high level of long-period earthquakes lingered thereafter. Volcano-tectonic earthquakes typically occurred 2-4 km from the top of the dome.
During late October and early November, intense swarms sometimes merged with tremor having frequencies similar to individual hybrids. Hybrid swarms during 1-2 November produced the highest amplitudes since 24 June, reported from stations in Antigua, Dominica, and Nevis. Large pyroclastic-flow signals were recorded on 4 and 6 November. During 6-8 November, particularly high levels of tremor occurred. Individual hybrids were detected on paper but not on the networks due to high background noise; thus low numbers of events did not reflect low activity. Tremor and hybrids were associated with ash venting at the dome. Small pyroclastic flows were recorded on 9 November, but otherwise hybrid earthquakes did not generate external activity. Amplitudes became progressively smaller later in November; from 14 November to the end of the month, rockfall signals dominated, although a significant number of low-amplitude hybrids not grouped in swarms occurred but were not detected by the network.
Ground deformation. On 20 October, a GPS survey was taken; however, the only sites accessible were White's, Harris, and Windy Hill due to thick ash cover. Measurement from Harris to White's showed a 2-cm increase since 20 September, closer to the pre-June 1997 level. Although less than two standard deviations below the mean, this single measurement did not indicate an acceleration in deformation. The line from Harris to Windy Hill showed slight shortening since 12 August. EDM measurements to Lee's Yard from MVO on 14 October revealed an increase of 1 cm since July.
Volume measurements. Gross morphology of the pre-21 September dome was unchanged since the collapse on that day (BGVN 22:10) until 22 October with some exceptions (see Visual observations). The volume of the 22 October dome was measured by geometric calculation until a survey was taken. Assuming the dome completely filled the explosion crater by 23 October (when overspilling was observed), the volume was approximately 1.7 x 10⁶ m3 resulting in an extrusion rate of 8-10 m3/s, depending on the time of first appearance. A detailed survey was made on 6 November, before the collapse, from several points; theodolite points from Jackboy Hill, Center Hills, and Flemings, a GPS point at Center Hills (to be used in future surveys as an additional static photo point), and helicopter survey photographs of most areas around the dome except the Galway's side. Good coverage of the N lobe of the 22 October dome was obtained. Since this area had not changed since 3 November, the volume was calculated at 5 x 10⁶ m3. Collapse volumes were calculated separately for an average extrusion rate of 5 m3/s over the first 11 days of the "22 October" dome growth. Visual observation revealed that the 4 November collapse involved less material than the 6 November collapse. The latest estimates of collapse volumes were 1.8 x 10⁶ m3 from 4 November and 3.4 x 10⁶ m3 from 6 November. The bulk of the collapse material was deposited in fans at the end of valleys that will be surveyed when the ash subsides. A 17 November survey of the White River valley fan revealed total deposits of 13.6 x 10⁶ m3, an increase of 5.5 x 10⁶ m3 since 15 May, resulting mostly from the 4 and 6 November collapses. The survey did not include recent deposits in the upper valley still covered in ash.
Environmental monitoring. Dust Trak sampling to measure airborne particulates was carried out at four fixed sites. The values at the fixed sites were low (3) during 12 October-23 November, except for the Catholic school site, which sometimes recorded elevated levels (0.05-0.1 mg/m3). This effect is caused by the large amount of human activity at this site and its location near a main road. Towards the end of this reporting period the three sites (not including the school) all had remarkably similar average concentrations each day. A new Dust Trak site was established at Mango Drive in Woodlands on 16 November to replace the Runaway site.
Information Contacts: Montserrat Volcano Observatory (MVO), c/o Chief Minister's Office, PO Box 292, Plymouth, Montserrat (URL: http://www.mvo.ms/).
Collapse of dome and Galway's wall on 26 December
The following condenses Scientific Reports of the Montserrat Volcano Observatory (MVO) from 23 November 1997 to 4 January 1998.
Overview. Activity during 23 November-21 December was at a relatively low level, although the 22 October dome (BGVN 22:11) continued to grow on the S side in the Galway's area while the N flanks remained quiet. Seismicity was dominated by rockfall and long-period events, with two periods of pyroclastic flow on 27 November and 1 December. During 21 December-4 January, volcanic activity increased to a high level with a large hybrid earthquake swarm on 25 December followed by a debris avalanche and dome collapse down the White River early on 26 December. A series of very large pyroclastic flows destroyed a wide area SW of the volcano and created a surge cloud that may have been associated with a lateral blast.
Visual observations. Good observations of the dome were possible during 23 November-21 December. A small dome collapse occurred on 27 November at 1445 and continued until after 1800. Although some of the flows reached the sea, most of the collapse was comprised of continuous but relatively small flows that traveled less than 2 km. Further pyroclastic flow activity occurred on 1 December starting around 2000 preceded by 2 hours of elevated rockfall activity. Only the largest of these pulses reached as far as the delta. While the flows occurred, glow was observed in the sky above the Galway's area. Neither period of activity produced ash clouds above 3 km or involved significant volumes of material.
On 4 December observers noticed that the dome's talus apron in the Galway's area had significantly increased in height and width. Continued growth of the 22 October dome had begun to encroach on Chances Peak and the Tar River to the E. The height of the active growth center was estimated at ~980 m, well above the height of the explosion crater rim. Around this time, theodolite surveys confirmed that the N lobe of the 22 October dome had not grown recently. Occasional minor rockfalls occurred on the N and E faces in the Tar River valley as old surfaces of the dome gradually degraded.
Near-continuous rockfalls started to cut into the S margin of Chance's Peak during 7-21 December. The talus slope above the Galway's Soufriere area extended significantly SE and the summit area of Galways Mountain degraded slightly. The growing talus apron extended over the remnants of the Galways wall, depositing a large volume of material outside the old crater margins. The remnants of the pre-September 1997 explosion crater above Gages and Tar River eroded, spilling a small amount of material down the Tar River. Theodolite measurements from Jack Boy Hill indicated no movement on the N flanks. A few small rockfalls occurred down Tuitts Ghaut on 10 December.
The low-level activity that had prevailed for 6 weeks was broken at about 0300 on 26 December. Reports from the police checkpoint in Salem indicated explosions at 0315 and 0325. At 0400, observers on Garibaldi Hill reported light ashfall and burning buildings S of Plymouth. A pilot saw an ash plume heading S at ~11 km altitude. Helicopter flights later in the morning revealed extensive damage in the area of Aymer's Ghaut, S of Kinsale, to the N flanks of South Soufriere Hills. Deposits from a large debris avalanche traveled down the White River to the sea and added considerable material to the pyroclastic fan.
Pyroclastic flows and surges covered from Kinsale almost to the summit of South Soufriere Hills. The area closest to the White River, including St. Patrick's and Morris's, was completely destroyed. A small pyroclastic flow traveled down Dry Ghaut towards Sweeney's Well to within 300 m of the SE coast. Brief views of a void at the top of White River indicated the loss of a large amount of material from the area around the Galway's Soufriere and of a portion of Galway's wall. The new talus apron and S lobe above Galways wall had been excavated. Later flights and visits allowed measurement of the deposit's thickness and temperature (table 24).
Table 24. Thicknesses and temperatures of deposits from the 26 December explosion at Soufriere Hills. Courtesy of MVO.
| Date | Site | Type of deposit | Thickness | Temperature (°C) |
| 30 Dec 1997 | Dry Ghaut (end of flow) | Pyroclastic flow | 30 cm | 48.7 at 20 cm depth |
| 30 Dec 1997 | Dry Ghaut (3 m from end) | Pyroclastic flow | 40 cm | 138.0 at 25 cm depth |
| 30 Dec 1997 | Dry Ghaut (10 m from end) | Pyroclastic flow | 40 cm | 122.4 at 35 cm depth |
| 01 Jan 1998 | S White River Delta | Surge | 70 cm | not measured |
| 01 Jan 1998 | O'Garra's Quarry | Surge | 10 cm | not measured |
| 01 Jan 1998 | O'Garra's Quarry | Co-ignimbrite ash | 7 cm | not measured |
Observations from Old Road Bay indicated that a large wave came ashore there immediately after the eruption. At about 0300, an observer in the vicinity of the bay's N end reported that the sea was "sucked backwards" before coming onto land near the jetty. Measurements of detritus on the shore revealed that the wave must have been ~1 m higher than the road, but there was little evidence of substantial waves elsewhere along the coast. This wave probably resulted from a debris avalanche entering the sea; the wave was most likely focused in the Old Road Bay area because of the shape of the bay.
On 1 January increased activity included at least one large pyroclastic flow that traveled down the White River to within 1 km of the sea and much rockfall activity from above Galway's Wall. A new talus apron started to accumulate at the base of the remains of Galway's Wall and some large wall-parallel cracks were observed in the Chance's Peak side. Until 4 January, rockfalls created diffuse ash clouds that generally drifted W over Plymouth.
Seismicity. During 23 November-7 December, the decrease in seismic activity that began around 14 November continued (figure 37). However, the lack of hybrid earthquakes in the second week despite a constant number of rockfalls was unusual. The frequency content of the rockfall signals changed slightly towards longer periods probably due to the attenuation of higher frequencies. This indicated a possible change of ground coupling between rockfalls or pyroclastic flows and unconsolidated deposits.
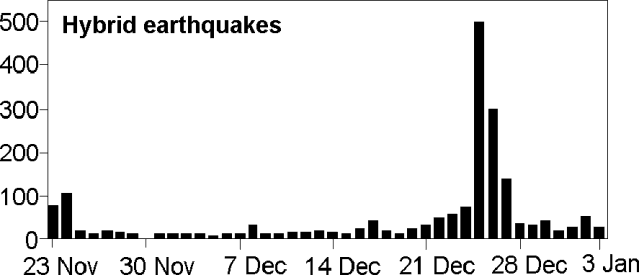 |
Figure 37. Daily hybrid earthquake counts at Soufriere Hills during 23 November 1997-3 January 1998. Courtesy of MVO. |
During 7-21 December seismicity was dominated by rockfall signals and long-period earthquakes. In many cases it was difficult to distinguish between the two event types. A number of the events classified as long-period earthquakes resembled short bursts of harmonic tremor that lasted up to a few tens of seconds and were nearly monochromatic at ~2 Hz, although there were often a few wavelengths at 1 Hz present at the start of an event. Almost all the signals classified as rockfall had a dominant frequency of ~2 Hz, even those clearly correlated visually with rockfalls at the dome. Events were thus classified by the relative importance of the dominant peak, creating a gray area between the types. The rockfall signals may also have included ash venting or degassing; this was supported by a signal recorded during ash venting after an explosion with a corresponding monochromatic seismic signal near 2 Hz.
During 21-24 December seismicity remained relatively quiet. Slightly more hybrids and noticeably fewer rockfall signals occurred than in preceding weeks but it was not indicative of any great changes. The quiet period ended on 24 December when a hybrid swarm began, leading to the large collapse on 26 December (figure 37).
The swarm, which began at 1420 on 24 December, started out sparsely with events every 20 minutes and slowly increased in intensity until about 2000 on 25 December. Individual events also generally increased in amplitude as the swarm progressed, but even the largest were relatively small in amplitude, an order of magnitude smaller than those recorded in early November, for example. At 2000 the hybrids occurred too frequently to trigger the networks and the signal was effectively a tremor signal. The tremor's amplitude increased until about 2300 and then declined until the collapse at 0300 the next day.
At about 0300 a continuous high-amplitude signal lasted ~16 minutes and included several pulses. The signal then continued at reduced amplitude for 9 minutes, during which a roaring sound similar to but louder than that heard after explosions and associated with ash venting. Intervals of monochromatic seismicity at 1.9 Hz were recorded during this time, as was also the case after explosions. The combination of the roaring noise and monochromatic seismicity indicated vigorous degassing after the main pyroclastic flows had finished, suggesting that the conduit was exposed.
After the collapse, seismicity settled into a cyclical pattern with peaks in RSAM every 6-8 hours. Hybrid earthquakes occurred during the periods of raised background amplitude but in most cases there were not enough in any given cycle to constitute a swarm. Two days after the collapse the number of hybrids decreased to previous levels but the cycles in RSAM continued until 4 January.
Ground deformation. GPS surveys of the BIGNET (Harris, Whites, Windy Hill and Broderick's) and LEESNET (Old Towne, WaterWorks, St George's Hill and Lees Yard) networks were taken during 23 November-28 December. During 23 November-7 December the Harris-Whites baseline had recovered half of the shortening that occurred over the last five months; the line was ~2 cm shorter than its pre-June mean. The data suggested a slow rise of the Broderick's site. No clear trends were identified in the data collected on LEESNET.
An 18 December survey of EASTNET (Harris, Whites, Long Ground, Windy Hill, and Hermitage) indicated a 4.5 cm shortening of the Harris-Whites baseline during April-September 1997. Since September the line has returned to within 2 cm of its pre-April mean. It appeared to be stable and the last three baseline measurements were within 4 mm of one another. Hermitage continued to move NE. It has moved 10.7 cm since mid-January 1997; 6.2 cm of this in the last three months, a marked rate increase.
Volume measurements. On 28 November surveys between Mosquito Ghaut in the N and White's Ghaut in the E found that the total volume of material had increased by 24 x 106 m3 since 13 August 1997. The increase included materials from the 21 September collapse, column-collapse flows during explosive activity, and pyroclastic flow activity on the N flank from mid-August to 21 September.
As of 7 December, the volume of erupted material was then estimated at 203 x 106 m3 including the dome, pyroclastic flow material, and estimates of the eruption column material. A previous dome survey measured an extrusion rate of 5 m3/s, down from summer 1997, but the overall trend for the average extrusion rate was still increasing.
A volume survey of the dome on 8 December revealed that the W, N, and E flanks remained mostly unchanged. The S lobe continued its active growth over the whole face. Growth appeared to be caused by the extrusion of large slabs and blocks from the central cleft between the N and S lobes. The talus apron at the base of the S lobe had extended significantly since the last survey, increasing by 26 x 106 m3. Most of the new material accumulated in the Galway's Soufriere region on the S side of the remnants of Galway's wall. Deposits in this area were over 140 m thick. The dome volume was 102 x 106 m3 with the total erupted volume for the entire eruption was estimated at 232 x 106 m3.
A volume survey of the White River valley fan taken on 4 January showed that it had not yet extended into the sea significantly. On the other hand, the steep underwater shelf in this area caused most material that reached the sea to slump off the edge of the fan into deep water where it could not be surveyed. A survey of the material in White River valley was hampered due to unsafe, ashy conditions; however, rough estimates of the amount of material ponded in the valley were 20-30 x 106 m3. Due to poor visibility, the size of the scars in the dome were hard to determine. Estimates for the amount of material lost during the 26 December event were 30-60 x 106 m3, including old Galway's Wall material.
Environmental monitoring. Ambient dust sampling was conducted using a Dust Trak (PM10) instrument at four fixed sites. Each value is an average of the concentration measured over approximately 24 hours. The values at the fixed sites were low from 23 November 1997 to 4 January 1998 except for values at the Catholic school, which sometimes recorded raised levels. The dust concentration was judged to be higher due to proximity of the main road and the large amount of human activity there.
Sulfur dioxide diffusion tubes were re-sited as a result of volcanic activity but showed that in the N of the island there were no significant concentrations of SO2. On 17 December, scorching of leaves and grass in the Woodlands area resulted from light ashfall.
Information Contacts: Montserrat Volcano Observatory (MVO), c/o Chief Minister's Office, P. O. Box 292, Plymouth, Montserrat (URL: http://www.mvo.ms/).
Continued dome growth; low volcanic and seismic activity
The following condenses a scientific report of the Montserrat Volcano Observatory (MVO) for 4-18 January when low volcanic and seismic activity prevailed but dome growth continued.
Visual observations. Activity was dominated by small rockfalls and pyroclastic flows from the new dome growing in the scar left after the 26 December 1997 collapse (BGVN 22:12). Rockfalls were generally located in the upper part of the White River, but some were seen in the Tar River valley; talus accumulated in a depression near the remains of Galway's Wall. The rockfalls produced dilute ash clouds that generally drifted W.
Heavy rain on 11 January generated hot mudflows on the NW flank (Belham River valley). Logs up to 6 m long and rocks up to 60 cm in diameter were transported in the muddy water. The water temperature ~1 hour after the peak in activity was 27.4°C, only about 9°C above air temperature; however, rocks from the main flow on the golf course were still steaming and hot to the touch. Small ash clouds were produced near Molyneaux as recent deposits on the sides of the river valley collapsed.
A helicopter flight around the SW flank on 12 January allowed observation of the 26 December collapse scar, where a new dome with a steep front face and extensive talus slope had grown. Clear weather on 12 and 13 January revealed continuous ash and steam venting; the ash columns rose 2.4-3.0 km.
Seismicity. During 4-18 January seismicity was relatively low and dominated by rockfall signals. Occasional isolated hybrid swarms and one small volcano-tectonic earthquake swarm occurred, but they were not followed by any noticeable increase in surface activity. Short intervals of increased seismic amplitude 6-24 hours apart were recorded on all stations even when no events were being recorded; however, most rockfall signals were recorded during these intervals.
Ground deformation. The GPS network BIGNET (Harris, Whites, Long Ground, Windy Hill, and Broderick's) continued to show slow movements at Long Ground and Whites to the NE and N, respectively. The Harris-Windy Hill baseline has had two lengthening-shortening cycles since measurements began in June 1996. The first cycle, which ended in mid-May 1997, involved a lengthening and shortening of 2 cm. The second cycle involved lengthening and shortening by almost 4 cm; the line was close to its May 1997 length during 4-18 January. Long occupations of the stations at Hermitage and Tar River were made while running a base station at Harris. Hermitage showed continued movement NNE at ~0.3 cm/week. Since 6 March 1997 the Tar River station had moved 5 cm NNE. No clear trends were found in the data for LEESNET (Old Towne, Waterworks, St Georges Hill, and Lees Yard).
26 December 1997 deposits. Inspection of the 26 December deposits were reported in the MVO Special Scientific Report 6. The 26 December dome collapse severely damaged the settlements of Trials and Fairfield (~2 km SW of the summit). In Trials, most buildings had collapsed roofs or fire damage, but remained standing. In Fairfield, some houses had collapsed roofs due to heavy ashfall, but there was little fire damage, indicating that the pyroclastic surge probably did not reach this area. The villages of St. Patrick's and Morris' were almost completely destroyed with only a few foundations remaining.
The 26 December deposits were of three main types: debris avalanche, pyroclastic flow, and ash cloud including co-ignimbrite ash, and blast deposits. There was also considerable erosion of some surfaces, particularly due to the surge. The relationships between these deposits, emplaced in ~15 minutes, were not simple, but it appeared that a sector collapse occurred first.
The edifice that supported the dome complex was fractured, weak, and hydrothermally altered in places. The sector collapse involved slippage of material from around Galway's Soufriere and part of Galway's Wall, and incorporated both new talus and dome rock. This triggered a comparatively large dome collapse with associated pyroclastic flows and ash-cloud surges, and culminated in an energetic lateral blast.
Survey of the 26 December deposits in the upper reaches of the White River Valley on 4 and 17 January revealed a total volume of 46 x 106 m3. Included in this total is the surge component which covered an area of 9.1 km2 and consisted of an estimated 1.8-3.2 x 10⁶ m3. The DRE equivalent volume was 44.5 x 10⁶ m3.
Two scars were formed during the Boxing Day collapse. Scar volumes were estimated using data generated from cross-sections, assuming relatively simple geometries. Material lost during the collapse of 26 December comprised 20 x 106 m3 of hydrothermally altered Galway's Soufriere rock, 5 x 10⁶ m3 of Galways wall material, 26 x 106 m3 of the November lava dome, and 26 x 106 m3 of dome talus. Thus, the estimated scar volumes total about 77 x 106 m3. The DRE equivalent volume for collapsed material was 64 x 106 m3. This suggests that about 20 x 106 m3of material came to rest in the sea, a volume consistent with the size of the tsunami that was generated as a result of the collapse.
Thus, the conservative volume of the 26 December collapse deposits (a DRE of 44 x 106 m3 of dome material) is 4-5x larger than previous events. The largest single prior event, on 21 September 1997 (BGVN 22:10), contained of 9 x 10⁶ m3 of material. In an earlier overview Young and others (1997) summarized the extrusive history from 1 November 1995 through early 1997; they provided an annotated plot of volume versus time. Because they show both total extruded volume and dome volume their plot clearly illustrates the pattern of ongoing extrusion and the effect of dome collapses.
Reference. Young, S., Sparks, S., Robertson, R., Lynch, L., and Aspinal, W., 1997, Eruption of Soufriere Hills volcano in Montserrat continues: Eos, Transactions, American Geophysical Union, v. 78, no. 38 (23 September 1997), p. 401.
Information Contacts: Montserrat Volcano Observatory (MVO), c/o Chief Minister's Office, P. O. Box 292, Plymouth, Montserrat (URL: http://www.mvo.ms/).
Dome growth continues; discussion of the 26 December dome collapse
The following summarizes a scientific report of the Montserrat Volcano Observatory (MVO) for 18 January-1 February, a time period when seismic and volcanic activity were low but dome growth continued. In addition, this report condenses MVO's Special Report 6 on the 26 December 1997 dome collapse, perhaps the most intense outburst yet recorded during the current crisis.
Visual observations. Few views of the dome complex were obtained due to poor visibility until the end of January, when observers saw active growth in the crater left by the 26 December 1997 dome collapse in the volcano's SW sector (BGVN 22:12). Also reported were occasional rockfalls, ash venting, steaming, and a dilute steam-and-ash plume that drifted WNW. Ash venting and rockfall activity became slightly more vigorous at the end of January, when a shift in prevailing winds sent light ashfall to the N part of the island.
Seismicity. Rockfall signals dominated seismicity; most coincided with a seismic-amplitude cycle with a periodicity of ~12 hours. This regular, slight increase in seismicity despite any major events has continued since the 26 December collapse and has been interpreted to indicate cyclical degassing as the dome grew.
Ground deformation. Displacement vectors for the interval April/May 1997 to January 1998 for sites around the volcano (table 25) revealed that areas NE, E, and SE of the volcano had been significantly displaced. The sector between Whites, Hermitage, and Roches Yard had moved ~6 cm NNE. Similar measurements at Long Ground, Tar River, and Perches suggested that these sites were displaced as a homogenous unit with little deformation. The Hermitage site showed considerably more movement than the others. Because of its proximity to the dome, it may have been more strongly influenced by local pressure or loading effects. Distant sites on the volcano's W and N flanks (Dagenham, Old Towne and Windy Hill) showed less displacement.
Table 25. Displacement vectors during April 1997-January 1998 for sites around Soufriere Hills. The site at Harris is the baseline. The Tar River vector reflects readings beginning in March 1997; the Roches Yard vector, beginning in October 1996. Courtesy of MVO.
| Site | Displacement (mm) | Vector (degrees from grid north) |
| Whites | 25 | 353 |
| Long Ground | 66 | 033 |
| Hermitage | 100 | 026 |
| Tar River | 57 | 030 |
| Perches | 59 | 049 |
| Roches Yard | 66 | 342 |
| Windy Hill | 15 | 283 |
| Dagenham | 16 | 077 |
| Old Towne (M27) | 19 | 084 |
New GPS sites were established on the summit of Gages Mountain and in the N part of the island at Drummond's and Blakes. A triple-prism EDM reflector was installed on the remnant of Peak B, a piece of the crater wall between Tuitt's and Mosquito Ghauts. The reflector was installed less than 100 m from the dome's N limit and, along with the new GPS sites, will monitor the N flanks.
Environmental monitoring. Results from diffusion tubes revealed slightly elevated SO2 levels (11.5 ppb) at St. George's Hill. On 24 January new tubes were placed at various sites on the W side of island. Geochemical sampling showed that all samples had3) at the CPS site (~7 km NNW of the volcano), presumably due to human activity in this area.
Report on the 26 December dome collapse. The collapse occurred early on 26 December 1997 after the very rapid dome growth that followed the explosive phase of September-22 October 1997 (BGVN 22:09-22:11). Dome growth within the explosion crater and large lobes extruding N and S formed a large dome over the Galway's Wall attaining a summit elevation of 1,020 m (figure 38), the greatest dome height since the eruption began. Seismic activity was generally low but a hybrid swarm beginning at 1430 on 24 December merged to continuous tremor a few hours before the collapse.
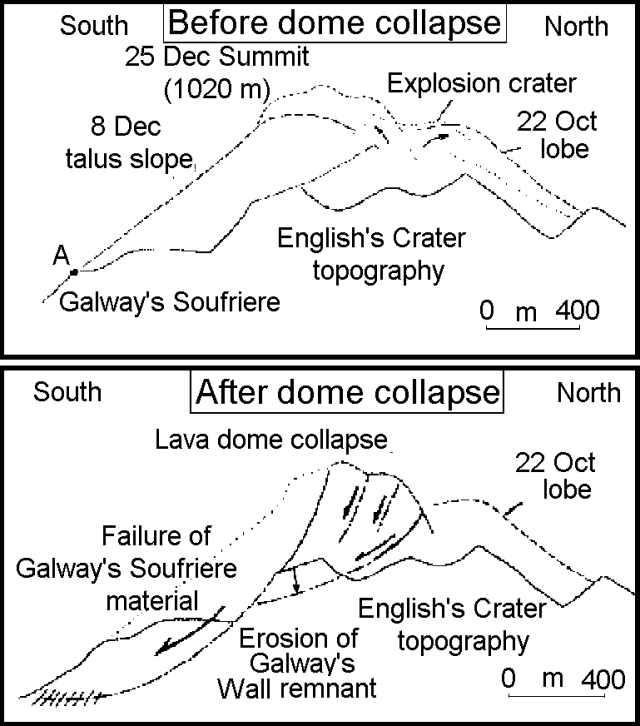 |
Figure 38. Cross-section of the Galway's Wall area prior to and after the 26 December dome collapse. "A" is presented as a reference point on figure 39. "Before" information is based on survey data from 23 November and 8 December as well as from video and photographs. "After" is based on information from video and photographs. Courtesy of MVO. |
The slope failure and dome collapse occurred at about 0300 and lasted ~15 minutes. Seismic evidence provided information on the duration of the event and the timing of specific phenomena, but reconstruction of the event has been done chiefly by evaluating deposits, changes in dome and flank morphology, and changes due to material transportation processes.
The event included a debris avalanche from the Galway's Wall and Galway's Soufriere areas and the consequent collapse of a destabilized portion of the lava dome (figures 38 and 39). The debris avalanche moved down the SW flank following the White River, leaving deposits through much of the valley; these deposits were later blanketed by pyroclastic-flow deposits. A portion of the material may have reached the ocean, generating a small tsunami (BGVN 22:12). The dome collapse produced pyroclastic flows and ash-cloud surges within the White River valley; a considerable volume of this material may have also reached the sea.
 |
Figure 39. Maps of the Galway's Wall area prior to and after the 26 December dome collapse. Both maps have the same scale and orientation. "A" is presented as a reference point on figure 37. "Before" information is based on survey data from 23 November and 8 December as well as video and photographs. "After" map is based on information from video and photographs. Courtesy of MVO. |
Very intense pyroclastic surges occurred during the collapse, causing widespread devastation in the area S of Gingoes Ghaut. Some surges were associated with the main flows, but others may have been caused by explosions in the collapsing dome. A convective ash cloud generated by the pyroclastic flows and surges rose ~14.3 km and deposited fine ash over SW Montserrat.
Deposits. Five main depositional units from the 26 December event were identified (figure 40): debris-avalanche deposits, block-and-ash flow deposits, pyroclastic-surge deposits, co- ignimbrite fallout, and a possible blast deposit.
 |
Figure 40. Map of deposits from the 26 December dome collapse. Arrows indicate orientation of trees that were blown down. Courtesy of MVO. |
A ~500 m wide, 25-70 m thick debris-avalanche deposit covered the central delta and lower reaches of the White River valley. The hummocky, orange-brown debris was poorly sorted, coarse, and blocky with an irregular bulbous ~25 m-high front. The deposit resulted from a slope failure of hydrothermally altered rocks in the Galway's Soufriere area, the lower outward flank of the Galway's Wall, and the overlying apron of fresh dome talus. Much of the material had a smoothed, heavily scoured upper surface with discontinuous remnants of pre- existing hydrothermally altered stratigraphy preserved within the deposit.
Block-and-ash deposits left by pyroclastic flows were similar to previous dome collapse flows at Soufriere Hills. They comprised dense to slightly vesicular (friable-textured) blocks in a poorly sorted, ash-rich matrix with little internal organization. The pyroclastic flows were largely confined to the White River valley, although some material spilled out at the river bend (~1.7 km from the coast) and traveled towards Morris'. The flows produced erosion features over the area between the White River valley and Morris' village. The block-and- ash deposits ponded behind and on top of the debris-avalanche deposits, filling the remainder of the White River valley to a maximum depth of 50-70 m. Block-and-ash deposits on the river delta were relatively thin (50-70 cm), broad, and flat-lying. They were poorly sorted with blocks reaching a maximum size of about 1 m (blocks >0.1 m formed ~10% of the surface).
Surge deposits associated with the collapse covered 9.1 km2 around the volcano's S flanks. Quite variable, some deposits differed markedly from previous surge deposits associated with pyroclastic-flow emplacement at Soufriere Hills. Conventional ash-cloud-surge deposits were found E of the White River valley on the delta and in the Trials area. These deposits were composed of a fine grained, ash-rich, and sandy layer (6-10 cm thick) with an underlying thin (0.5-2 cm) fines-depleted coarse sand layer. The surge deposits between the White River valley and German's Ghaut varied but the dominant facies was a 15-40 cm-thick, coarse sand/gravel fines- depleted unit. In some areas this deposit was overlain by a second fine-grained surge deposit. The coarse surge deposits largely comprised sub-angular dense dome rock and crystals with little pumiceous or friable component.
Small secondary pyroclastic-flow deposits with abundant charcoal occurred in the deep ghauts that drain the area covered by the surge deposits. One of these flows drained towards the E side of Soufriere Hills down Dry Ghaut. The thin, highly mobile flow was confined to the bottom of the ghaut (average width of 2-4 m) and extended to within 300 m of the sea. The deposit was poorly sorted and 50-70 cm thick, consisting predominantly of fine ash-rich sand.
A possible blast deposit was found on the volcano's SW flank between Gingoes Ghaut and the White River. The deposit comprised angular to sub-angular lithic clasts scattered on the surface, some up to 70 cm in diameter. The surface of the deposit was very subtly corrugated in the flow direction, suggesting a highly energetic emplacement mechanism.. This deposit was distinctly different from thinly spread 'normal' facies block- and-ash flows as it was locally only one clast thick and was completely fines depleted. Dense, fresh, angular dome rock made up most of the deposit, with small amounts of altered dome rock and sub-rounded, semi-vesicular, steely blue-gray dome rock. There was a marked lack of impact craters, bread crust-textured clast, or any ballistic blocks.
Co-ignimbrite ash covered most of the SW part of Montserrat and draped all the 26 December deposits, although heavy rains in early January altered the deposit. Near the coast in the Trials area the co- ignimbrite ash fell as accretionary lapilli, caused by incorporation of steam generated by hot material entering the ocean. The accretionary lapilli were up to 8 mm in diameter and formed a layer up to 4 cm thick. The fine-grained, crystal- rich ash was typical of ash generated from pyroclastic flows sourced from dome collapse. The co-ignimbrite ash plume reached an altitude of ~14 km and light ash fall was reported from Guadeloupe (60 km SSW), as well as St. Vincent and Bequia (both ~400 km SSW).
Temperatures determined from the various deposits several days after the eruption had values up to 293°C (table 26). The debris-avalanche deposit was mainly emplaced cold, although parts of the Galway's Soufriere and dome talus debris would have been warm at the time of incorporation into the avalanche.
Table 26. Temperature measurements for deposits from the 26 December collapse. 'PF' refers to pyroclastic flow; 'DAD', to the debris-avalanche deposit. Courtesy of MVO.
| Deposit type | Location | Measurement depth (cm) | Days after event | Temp (°C) |
| Secondary PF | Dry Ghaut | 20 | 4 | 48 |
| Secondary PF | Dry Ghaut | 25 | 4 | 138 |
| Secondary PF | Dry Ghaut | 35 | 4 | 122 |
| Surge | White River delta | 30 | 9 | 155 |
| Surge | White River delta | 60 | 9 | 216 |
| Surge | White River delta | 30 | 9 | 228 |
| Surge | White River delta | 30 | 9 | 83 |
| Surge | White River delta | 50 | 9 | 93 |
| Fumarole | White River delta | 30 | 9 | 68 |
| Surge/PF | over DAD | 20 | 13 | 157 |
| Surge/PF | over DAD | 25 | 13 | 103 |
| Surge/PF | over DAD | 60 | 13 | 293 |
Information Contacts: Montserrat Volcano Observatory (MVO), c/o Chief Minister's Office, P. O. Box 292, Plymouth, Montserrat (URL: http://www.mvo.ms/).
Heavy ashfalls and rapid dome growth in February
This report condenses Scientific Reports of the Montserrat Volcano Observatory (MVO) covering February. During 1-14 February, seismic activity increased, heavy ashfalls reached the N part of the island, and dome growth continued. Activity during 15-28 February was dominated by rapid dome growth and elevated seismicity.
Visual observations. Low clouds during the first two weeks of February often hampered dome observations. However, on 6 February observers on a police boat reported continued growth in the 26 December collapse scar above the White River. By 10 February the growing dome almost completely filled the 26 December scar, approaching the volume prior to the collapse. In addition, two spines were observed on the dome's S side, and the talus slope below the growth area had grown considerably. Steam-and-ash venting continued and was vigorous during periods of elevated seismicity and rockfall.
Rockfalls and small pyroclastic flows occurred mainly on the Galways side of the dome, but a few small rockfalls were observed in the upper part of Tuitt's Ghaut. Fresh pyroclastic-flow deposits in the upper part of the White River were probably emplaced during the elevated activity of 5-6 February.
On 15 February several rockfalls and small pyroclastic flows traveled down the White River valley. Visibility was poor until 25 February when vigorous ash venting, rockfalls in the White River valley, and several stubby spines atop the dome were observed.
Seismicity. Earthquake activity during 1-14 February mainly consisted of rockfalls and hybrid earthquakes with some tremor. Most swarm events, including 21 locatable volcano-tectonic earthquakes, were concentrated below the dome complex's N sector and had shallow focal depths (2-4 km below the summit). During 15-28 February fewer rockfalls but comparatively more earthquakes and seismic swarms (table 27) occurred than in preceding weeks. The swarms were not followed by surface activity.
Table 27. Number of hybrid, long-period (LP), and volcano-tectonic (VT) events detected during earthquake swarms at Soufriere Hills during February 1998. Courtesy of MVO.
| Date | Start time | Duration (hours) | Hybrid | Long-period | Volcano-tectonic |
| 10 Feb 1998 | 1154 | 2.40 | 21 | 3 | 12 |
| 11 Feb 1998 | 1402 | 2.93 | 15 | 3 | 13 |
| 11 Feb 1998 | 2319 | 0.40 | 1 | -- | 7 |
| 17 Feb 1998 | 0452 | 2.42 | 10 | 0 | 4 |
| 21 Feb 1998 | 1853 | 6.48 | 31 | 3 | 8 |
| 23 Feb 1998 | 0823 | 3.90 | 11 | 5 | 9 |
| 23 Feb 1998 | 1350 | 1.78 | 14 | 1 | 1 |
| 24 Feb 1998 | 2138 | 1.87 | 13 | 2 | 1 |
| 25 Feb 1998 | 1059 | 2.95 | 17 | 3 | 0 |
| 26 Feb 1998 | 0536 | 5.36 | 82 | 2 | 33 |
| 27 Feb 1998 | 1312 | 13.12 | 24 | 0 | 0 |
| 28 Feb 1998 | 1033 | 10.33 | 28 | 0 | 1 |
| 28 Feb 1998 | 1457 | 14.57 | 48 | 0 | 4 |
At the beginning of February, seismicity displayed a cyclic pattern with peak amplitudes occurring every 6-8 hours; by 14 February, the cycle had lengthened to 8-12 hours. By 22 February, the cycle was ~14 hours long. Peak amplitudes increased during 1-14 February; these peaks generally coincided with elevated rockfall activity. Towards the end of February, the peaks were dominated by hybrid earthquakes and tremor.
Ground deformation. Two GPS occupations of LEESNET (includes sites at Old Towne, Waterworks, St. Georges Hill, and Lees Yard) were made during 1-14 February. No movement within this network was detected. Meanwhile, GPS surveys at Harris, Hermitage, Lees Yard, Perches, St. Georges Hill, Old Towne, Blakes, and Lookout Yard North confirmed that the Hermitage and Perches sites continued to move NNE. Sites on the volcano's N and NW flanks remained relatively stable.
Electronic tiltmeters were installed at Hermitage and on Gages Mountain to provide data on deformation of the volcano's NE flank. The EDM reflector on the N crater wall (Peak B) was shot from Windy Hill during 15-28 February. During 25 January-late February a 5-cm shortening occurred on this line. Lines between the Lees Yard reflector and sites at MVO south and the Waterworks Estate did not show any movement.
Volume measurements. A 10 February theodolite survey of the dome from Garibaldi Hill and the Delta petrol station revealed that the dome's highest point was 970 m. On 27 February, theodolite measurements from Garibaldi Hill and the old observatory in Old Towne showed that the highest point on the dome had reached 997 m. More theodolite measurements on 1 March from South Soufriere Hills and Perches Mountain gave a height of 1011 m, revealing 14 m of vertical growth in only 2 days.
Environmental monitoring. Sulfur dioxide diffusion tube measurements during 1-14 February showed raised (10-12 ppb) SO2 levels in Plymouth and at St. Georges Hill and low (0-0.6 ppb) levels at Weekes, MVO south, and Lawyers. During 15-28 February SO2 levels at Plymouth, MVO south, and Lawyers were higher than earlier in the month, but levels at St. Georges Hill were reduced by half. The site in Plymouth showed very high values (30.2 ppb) because it was surrounded by ~30-cm-thick tephra deposits and redeposited debris from nearby pyroclastic-flow deposits.
The mass of fine ash deposited in N Montserrat during several 28 January-7 February ashfalls was calculated using an array of ash collection trays. The mass totaled more than 1 kg/m2; most of this ash was produced during episodes of ash venting and rockfall activity. At most locations the ash collected during 3-5 February accounted for more than 50% of the local monthly ash accumulation.
Dust Trak monitoring at four fixed sites to measure airborne particles revealed elevated values (0.05-0.38 mg/m3) during ashfalls on 4-5 February. Levels were even higher (0.11-0.43 mg/m3) on 7 February due to resuspension of the ash. Sites in the S part of the island showed higher concentrations than in the N. During 15-28 February, no major ash fall occurred and levels were low (3) at all sites; however, a diffuse volcanic plume was occasionally blown N, causing light ash fall and hazy conditions.
Information Contacts: Montserrat Volcano Observatory (MVO), c/o Chief Minister's Office, P. O. Box 292, Plymouth, Montserrat (URL: http://www.mvo.ms/).
Low seismic and volcanic activity during March-early April
The following report condenses scientific reports of the Montserrat Volcano Observatory (MVO) for 1 March-12 April 1998. In February there was rapid dome growth and elevated seismicity (BGVN 23:03). However, during 1-15 March volcanic and seismic activity declined. Although spines grew in the summit area early in the month, there was no sign of dome growth after 9 March. During 15 March-12 April activity remained low.
Visual observations. The dome's summit area on 1 March was blocky with a small number of stumpy spines. The summit's highest point was measured at 1,011 m. On 8 March two prominent spines were seen; one broad-based spine's peak was 1,027 m in elevation when measured the next day. No dome or spine growth was observed during 9 March-12 April. During 15-28 March a slight degradation of the upper flanks was the only change in the dome.
Low-level rockfall activity occurred during early March-12 April. During March new rockfall chutes developed on the dome's SW and E sides above the Tar River valley; some large rockfalls reached the base of the talus slope on both sides of the dome. During 29 March-12 April very small rockfalls occurred down the upper flanks over Gages wall and on the upper flanks of the new dome in the SW sector.
During 15-28 March the disintegration of a steep, rocky buttress in the dome complex above the Tar River valley produced several small pyroclastic flows. A field team at Windy Hill observed the largest of these flows traveling down a narrow ravine and reaching the Tar River Estate house. The team also observed small rockfall deposits below the fumarolic area on the dome's E flanks. During 29 March-12 April continued degradation of the buttress sent rockfalls down gullies between the E face and the N flanks or down an incised central chute on the E flanks.
During 1-15 March fumarolic activity was mainly confined to a V-shaped cleft in the pre-explosion dome complex on the dome's E side. No fumarolic activity or ash venting was reported during 15-28 March. During 29 March-12 April moderate fumarolic activity was concentrated within an incised central chute on the E flanks and around a trench between the 26 December collapse scar and fresh dome material on the dome's SW sector.
Pyroclastic-flow deposits in the upper part of Tuitt's Ghaut seen on 28 February were studied in March; the deposits were composed of older material originating from the base and sides of the 22 October 1997 dome (BGVN 22:11). The remnants of this dome formed a large dark mass on the N side of the dome complex. Temperature measurements of pyroclastic-flow deposits produced in a 21 September 1997 dome collapse (BGVN 22:10) were made on 15 March. The maximum temperature found was 590°C at a depth of 1.5 m. During 29 March-12 April, a field team again visited these deposits. Using a thermocouple probe, they measured a maximum temperature of 357°C at a depth of 2 m.
Seismicity. During 1 March-12 April seismicity was low, with small numbers of earthquakes, no swarms, and low rockfall activity. Epicenter locations for all events were in the dome area. During 29 March-12 April, activity consisted principally of volcano-tectonic earthquakes that occurred at irregular intervals. The cycle of seismic amplitudes observed in February (BGVN 23:03) ceased during early March, when the period lengthened and the amplitude decayed so that discrete peaks were not apparent.
During 29 March-12 April, upgrades were completed on the broadband seismic network. Two new stations were installed at South Soufriere Hills and at Mongo Hill, providing increased azimuthal coverage. Both stations use single vertical component seismometers with corner frequencies of 1 Hz. The network now consists of seven stations.
Ground deformation. During 1-15 March GPS occupations at Whites, Long Ground, Windy Hill, Perches, Old Towne, Lees Yard, and Blakes revealed continued NE movement of the Hermitage site and slow movement of the Whites, Long Ground, and Perches sites. The line from the EDM reflector on the remains of the N crater wall (Peak B) to Windy Hill continued to shorten; shortening of 8 cm has occurred on this line since 25 January. Measurements suggested that the shortening rate may have slowed slightly.
During 15-28 March GPS occupations of Blakes, Drummonds, Old Towne, and Dagenham showed that the sites were stable with respect to Harris. Data from the station at Hermitage showed that the site was still moving NE.
During 29 March-12 April GPS occupations at Whites, Gages, Old Towne, Dagenham, Blakes, and Drummonds indicated >3 cm of WNW movement of Gages Mountain's summit had occurred since January. This radial movement away from the dome was almost identical to the movement direction of the pole to the tilt plane on the Gages Mountain summit tiltmeter. The station at Hermitage showed continued NE movement at the highest rate since September 1997. Since March 1997, this site has moved 15 cm.
Volume measurements. A kinematic dome survey consisting of photos and laser range finding binocular measurements was carried out on 10 March. Heights correlated well with previous theodolite measurements. The volume of the dome complex on 10 March was 113 x 106 m3. This figure included 29 x 106 m3 for the talus slope and 84 x 106 m3 for the dome. The volume of the dome just before the 26 December 1997 events was estimated at 115 x 106 m3.
On 30 March, a survey of the dome talus and of deposits in the top of the White River Valley was undertaken. This returned a talus volume of 36 x 106 m3, thus increasing the total dome volume to 120 x 106 m3. The deposits had accrued 8.99 x 10⁶ m3 since a previous survey on 17 January 1997. The volume of erupted material since November 1995, including the dome and deposits, totaled 300 x 106 m3.
Theodolite measurements on 5 April revealed that the dome's highest point was the top of a large, 50-m-tall spine perched near the top of fresh material in the SW sector. The elevation of the spine's top was 1,031 m.
Environmental monitoring. No ashfall was reported on the inhabited sections of the island during 1-15 March. During 15 March-12 April, aerosol levels were low due to low volcanic activity and occasional rains. Comparatively higher aerosol concentrations on 24 March coincided with a small increase in volcanic seismicity during 2200 on 23 March to 0400 on 24 March. Slightly higher aerosol levels recorded on 7 and 8 April and may have been due to Saharan dust in the atmosphere. The Davy Hill area, affected by traffic jams at the time, showed the highest levels.
Information Contacts: Montserrat Volcano Observatory (MVO), c/o Chief Minister's Office, P. O. Box 292, Plymouth, Montserrat (URL: http://www.mvo.ms/).
Low activity; deformation and volume measurements
The following condenses scientific reports from Montserrat Volcano Observatory (MVO) for 12 April-10 May 1998.
Summary. Activity during the reporting period continued at low levels: there were no changes in dome morphology and only a few pyroclastic flows occurred. Seismicity was generally low, with occasional volcano-tectonic (VT) earthquakes being the predominant signals recorded by the seismic network. Rockfall activity was particularly low but showed an increase after heavy rains. Several mudflows were generated during the reporting period, most of them moving down Dyers River into the Belham River valley.
Visual observations. Fresh pyroclastic-flow deposits were seen along the N side of the Tar River Valley on 14 April. A small pyroclastic flow occurred during the morning of 19 April and was seen by the remote video camera at MVO as it traveled down the Tar River as far as the site of the Tar River Estate House. Another small pyroclastic flow coursed down the Tar River on the morning of 25 April, but could not be seen from MVO due to low clouds. Three more small pyroclastic flows traveled halfway down the Tar River Valley during 26 April and the morning of 27 April. All of these flows were believed to have originated on the steep upper flanks to the E of the old dome. Each event lasted 2 minutes and generated small ash clouds.
Rockfall activity was minor with small rockfalls occurring down the E and SW flanks. Some of these events are gradually carving deeper chutes on the Tar River side and S flank of the new Galway's dome. Minor rockfall activity also began near the top of the dome over Galway's wall and traveled down a chute on the S flank of Chances Peak.
During a brief clearing in the weather around the dome early on 6 May observers on a reconnaissance flight saw no evidence of new growth, suggesting a lack of significant extrusion since the growth of the summit spine around 10 March (BGVN 23:04). They did see moderate fumarolic activity coming from a point in the main chute on the upper E flank, and in several areas within the trench located between the scar of 26 December (BGVN 22:12) and the fresh growth within it. They also noted that the summit area appeared blanketed by over 5 m of tephra including both fine ash and blocks of glassy dome rock (up to 1 m diameter).
The temperatures of the pyroclastic flows deposited at Trant's during the 21 September collapse (BGVN 22:10) were measured on 28 April. A maximum temperature of 348°C was obtained at a depth of 2 m. They showed only very minor changes since they were last measured 2 weeks ago.
Seismicity. Over the reporting period, seismicity remained low. Volcano-tectonic (VT) earthquake activity continued to be dominate (table 28). VT earthquakes mainly occurred in groups too few in number to constitute swarms, but exceptions to this are shown in table 29, including a swarm of hybrids on 6 May. These were the first hybrids of high amplitude seen for many weeks, but were not followed by others of similar type.
Table 28. Earthquake counts at Soufriere Hills listed by type (based on signal character), 12 April-9 May 1998. These counts were of events that triggered the broadband network's event-recording system between 0000 and 0000 each day. The type "Dome RF" denotes a dome rockfall. The type "Long-period / Rockfall" signifies a Long-period earthquake followed by rockfall signal. "Hybrid / Rockfall" is a hybrid earthquake followed by rockfall signal. Courtesy of MVO.
| Date | Volcano-tectonic | Hybrid | Long-period | Dome Rockfall | Long-period / Rockfall | Hybrid / Rockfall |
| 12 Apr 1998 | 15 | 1 | -- | -- | 10 | -- |
| 13 Apr 1998 | 15 | -- | -- | -- | 6 | -- |
| 14 Apr 1998 | 1 | -- | -- | -- | -- | -- |
| 15 Apr 1998 | 2 | 1 | -- | -- | -- | -- |
| 16 Apr 1998 | 4 | -- | -- | -- | -- | -- |
| 17 Apr 1998 | 4 | -- | -- | -- | -- | -- |
| 18 Apr 1998 | 1 | -- | -- | -- | -- | -- |
| 19 Apr 1998 | 5 | -- | -- | 1 | 4 | 1 |
| 20 Apr 1998 | 14 | -- | -- | 2 | 5 | -- |
| 21 Apr 1998 | 8 | 1 | -- | -- | 1 | -- |
| 22 Apr 1998 | -- | -- | -- | -- | 1 | -- |
| 23 Apr 1998 | -- | -- | -- | -- | 4 | -- |
| 24 Apr 1998 | 1 | -- | -- | 1 | 4 | -- |
| 25 Apr 1998 | 3 | 1 | -- | -- | 2 | -- |
| 26 Apr 1998 | 17 | -- | -- | 1 | 2 | -- |
| 27 Apr 1998 | 7 | -- | -- | -- | 2 | -- |
| 28 Apr 1998 | 8 | -- | -- | -- | 6 | -- |
| 29 Apr 1998 | 2 | -- | -- | -- | -- | -- |
| 30 Apr 1998 | 3 | -- | -- | -- | -- | -- |
| 01 May 1998 | 7 | -- | -- | -- | -- | -- |
| 02 May 1998 | 10 | -- | -- | -- | 3 | -- |
| 03 May 1998 | 2 | 2 | -- | -- | 7 | -- |
| 04 May 1998 | 4 | -- | -- | -- | 4 | -- |
| 05 May 1998 | 6 | 2 | -- | -- | 3 | -- |
| 06 May 1998 | 5 | 12 | -- | -- | -- | -- |
| 07 May 1998 | 6 | -- | -- | -- | -- | -- |
| 08 May 1998 | 25 | -- | -- | -- | 2 | -- |
Table 29. Swarms registered at Soufriere Hills during 12 April-10 May 1998. Courtesy of MVO.
| Date | Local Time | Duration (minutes) | Hybrid | Long-period | Volcano-tectonic |
| 26 Apr 1998 | 2247 | 1.45 | 0 | 0 | 9 |
| 06 May 1998 | 0445 | 1.40 | 11 | 0 | -- |
| 27 May 1998 | 2257 | 5.75 | 0 | 0 | 1 |
| 18 May 1998 | 0841 | 8.32 | 0 | 0 | 15 |
Epicenters were located on the E of the volcano at focal depths tightly clustered from 2.5 to 3.5 km below the summit. Fault-plane solutions were calculated using P-wave first-motions detected by the 7 broadband stations along with first motions from the Lee's Yard and Jack Boy Hill stations of the short-period network. The calculated fault-plane solutions are consistent with a strike-slip fault mechanism. The number of recorded rockfall signals was very low. However, in many cases there was a correlation between occurrence of the rockfalls and periods of heavy rainfall.
Ground deformation. With respect to the Harris GPS measuring station, the stations at Dagenham, Old Towne, Lookout Yard, and Windy Hill showed height increases of 5, 5.5, 6, and 4 cm respectively since December 1996. These values are preliminary, as the height component is the least well constrained by GPS. It was judged more likely that the reference at Harris was actually sinking. Height differences between Harris and sites on the E (Long Ground, Tar River and Perches) all showed continued slow movement to the NE of around 7 cm in the last year; Whites and Roches have moved slightly less and in different directions.
A survey from Windy Hill measured the distance to the N crater wall reflector and found it had shortened by only 1 cm since the middle of March. The line to Windy Hill from Harris is stable, as confirmed by repeated measurements since December 1997 that gave site positions lying within a box 3 mm by 7 mm. In contrast, the survey point at Brodericks had shown accelerated movement: 3 cm to the N between November 1997 and January 1998. This coincided with the period of rapid extrusion in the S area of the dome during December, 1997. Subsequently Brodericks appeared to stabilize in its new position.
A new permanent GPS site was installed in the South Soufriere Hills. Telemetry equipment used by the station was installed by the University of Puerto Rico on Antigua and in the Centre Hills.
Volume measurements. A new theodolite site known as Fergus Ridge was set up on the high ridge of the W flank of South Soufriere Hills, to the N of Fergus Mountain, overlooking the White River Valley. Measurements from this site triangulated with measurements from Perches Mountain were obtained on 16 April. In conjunction with the combined photo and GPS data collected on 6 April, a revised total dome volume was calculated to be 113 x 106 m3. This figure differed from the initial estimate of 120 x 106 m3; however, the revised figure incorporated a greater number of theodolite, photo, and GPS points that improved constraints on both the summit area and the new dome on the SW sector of the complex.
Environmental monitoring. Generally, low volcanic activity and the number of rain showers kept aerosol levels low through the reporting period. Extremely wet weather, 14-15 April, produced the lowest aerosol levels since the heavy ash fall at the beginning of February. Rain also prevented the ash produced by the small pyroclastic flow of 19 April from being transported N by wind to any of the sites that were being monitored.
The volcano's small ash output left inhabited N island areas comparatively ash free. Each disturbance of ash by moving vehicles seemed to help the wind and rain remove more ash.
The three pyroclastic flows that occurred on 26-27 April had no effect on the measured levels of airborne ash and dust. On 1 May observers saw a very small venting of ash escape at the top of the Tar River Valley. Scientists working in the SW of the island over the next few days noticed a strong smell of rotten eggs (hydrogen sulfide). Following the hybrid swarm on 6 May dust levels remained low, but aerosol levels doubled. Heavy rain two days later once more reduced levels. Aerosol levels continued low later in this period despite drier weather, except in Salem, an area likely affected by ash blown W from the pyroclastic flows.
Information Contacts: Montserrat Volcano Observatory (MVO), c/o Chief Minister's Office, PO Box 292, Plymouth, Montserrat (URL: http://www.mvo.ms/).
Very low levels of activity in late May
The following condenses the Monserrat Volcano Observatory's (MVO) Scientific Report for 24 May-1 June 1998. Volcanic activity remained at very low levels during the reporting period. No significant changes in dome morphology occurred and seismic activity was limited to small numbers of volcano-tectonic earthquakes.
Visual observations. There were no pyroclastic flows and only occasional small rockfalls down the upper flanks on the E side of the dome complex. Some small rockfalls originated from the summit area of Galway's dome; they traveled down the SW flanks of the complex.
The temperatures of pyroclastic flow deposits that formed during the 21 September collapse were re-measured on 31 May. At a 2-m depth, maximum temperatures reached 355°C, suggesting that the deposits had not cooled significantly since previously measured on 13 May.
Poor weather conditions hindered visual observations; however, no significant changes are believed to have occurred around the dome complex.
Seismicity. Seismicity was generally low. Intervals of scattered volcano-tectonic earthquakes alternated with intervals of almost complete quiet. One exception was a swarm on 25 May. This swarm consisted of many small signals, most of which did not trigger the networks. The signals were originally considered volcano-tectonic earthquakes because of their frequency content, but they were generally emergent and often had 2-3 velocity maxima. In this sense they differed from the simple rise and decay of most volcano-tectonic earthquakes.
The most striking feature of these signals was the difference in arrival times at different stations (often over 10 seconds). Also the order of arrival at different stations changed from event to event. These observations indicated that the signals were propagated as air-waves and that the source was different each time. Crude time-distance calculations, assuming a velocity of 330 m/s, showed that many of the sources were in the Farms and Upper Gages areas. Thus, it was later concluded that these signals were not volcano-tectonic but presumably caused by small phreatic explosions as water reacted with hot pyroclastic deposits. This conclusion was borne out by comparison with data from July 1995, a time when phreatic activity prevailed and the record showed many seismic events with similar emergent starts and large differences in inter-station arrival times.
Ground deformation. Some of the GPS equipment was on loan to the Seismic Research Unit (Trinidad) who conducted surveys on St. Vincent during this period; thus surveys at Montserrat were reduced. Available data indicated that the motion of the Hermitage site was clearly slowing.
Environmental monitoring. Low volcanic activity kept aerosol levels low, with heavy, typically early morning downpours maintaining some of the lowest airborne dust and ash levels over the last month. A sulfurous haze was visible from, and was occasionally smelled at, the MVO-south station. The haze descended to the W over Fort Ghaut, Gages fan, and Plymouth.
Information Contacts: Montserrat Volcano Observatory (MVO), c/o Chief Minister's Office, PO Box 292, Plymouth, Montserrat (URL: http://www.mvo.ms/).
Relatively large pyroclastic flows on 3 July; ash venting
On 3 July, after several months of reduced activity, a 2.5-hour sequence of large pyroclastic flows took place at Soufriere Hills. Ash clouds reached heights of 9-12 km before drifting N and depositing fine ash over the inhabited part of the island. New deposits extended the Tar River delta significantly, adding ~0.25 km2 to its area, but not extending it seaward. Winds carried the cloud N, disturbing previously unaffected houses in the Long Ground area. The new materials were typical block-and-ash deposits, associated with fine surge deposits and ash-cloud deposits.
The 3 July pyroclastic flows marked the first major event at Soufriere Hills since dome growth ended in mid-March (BGVN 23:04). The dome had reached a volume of 120 x 106 m3 (the maximum observed throughout the eruption) and a summit height of 1,031 m. The minor pyroclastic flows of previous months (BGVN 23:04 and 23:05) were consistent with mechanical collapse of the very large and unstable dome and were therefore of no great significance. Given the duration of low levels of activity, it was conjectured that the current volcanic crisis might be waning, with important implications for the residents of the island and its administration. Because the 3 July pyroclastic flows apparently represented a re-escalation of activity, the Montserrat Volcano Observatory (MVO) has examined the events and deposits to investigate their significance.
Precursor events. There were no obvious precursors to the eruption. However, possibly related factors included a felt earthquake at 1704 on 25 June centered under Barbuda, and a series of small-to-moderate pyroclastic flows commencing at 1229 on 30 June and lasting 30-40 minutes. It may be significant that the events of 3 July coincided with the passage of a tropical wave, a period of bad weather and heavy rain.
Observations. Abrupt onset of activity was detected by the MVO seismic network at 0302 on 3 July, so opportunities for visual observations were limited. During the first half hour, there were reports from several localities in the W and N of the island of 'stones' and ash falling. At 0400 NOAA satellites detected a large ash column reaching altitudes of 9-12 km moving ENE. As a result of wind shear, the lower part of the plume was blown NW, which resulted in significant ashfall over the N of the island. Light ashfall was also recorded on Nevis and St. Kitts.
At 0422 an observer at Jack Boy Hill reported pyroclastic flows descending the Tar River valley, with abundant lightning and with an ash cloud drifting and rising over the center of the island. Reporters on the W of the island recorded heavy ashfall in the Belham Valley (figure 41), at Salem, and at Woodlands. Thunder and lightning were observed at the front of the ash plume as it headed W over the sea. At 0450 pyroclastic flows were observed at the Tar River delta; the deposits were steaming strongly at 0518. Winds from the S deposited 0.5-1 mm of ash over the entire N end of the island.
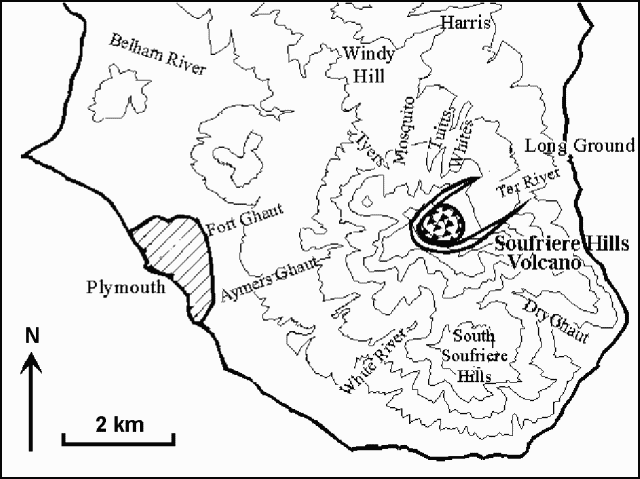 |
Figure 41. Map of the southern part of Montserrat indicating some areas referred to in the text. Courtesy of MVO. |
Although residents reported falling 'stones,' examination of the deposits revealed no pumice clasts. A maximum 2-mm-thick layer of fine ash was recorded in Salem with lithics and crystals up to 3 mm in size from MVO to the S. Most of the ash fell as accretionary lapilli all over the island, reaching diameters of up to 4 mm. These large lapilli may account for the reports of 'stones'. Heavy rain following the event precluded detailed studies of the deposits.
A helicopter flight at 0700 confirmed that pyroclastic flows had reached the Tar River delta and entered the sea. In the upper Tar River valley, flows were channeled down its S side; lower down they spread out over both sides of the valley. The N slopes of Roche's Mountain and Perche's Estate were eroded and there were indications that small amounts of material, including some ballistics, had overtopped the ridge causing impact scars on steep slopes and starting small fires. Surges associated with the passage of the pyroclastic flow left significant deposits of fine ash in the area of the Tar River estate house, and for the first time since the onset of the crisis the southern parts of Long Ground village were affected. Trees and shrubs were scorched, but no houses caught fire, nor was there any evidence of high velocities associated with the surges. Surge deposits extended to about 400 m N of the Tar River delta.
Small rockfall deposits were observed on the White River flanks of the dome, but there was no activity in Tuitt's, Mosquito, or Tyer's ghauts. Ash continued to drift W during the morning. A smaller event at about 1407 produced a dark cloud about 3 km high, depositing further ash on the Woodlands, Salem, Old Towne, and Olveston areas, but not farther N. This may have been a weak explosion or a small pyroclastic flow. A further 1 mm of fine ash accumulated in the Woodlands and Salem areas.
An observation flight at 1500 on 3 July revealed a large scar on the SE flanks of the dome, with chutes leading down against the N scarp of Perche's mountain and the S edge of the Tar River valley. A large volume had been lost from the dome (later estimated visually to be 15% of total dome volume). The prominent 50-m-high spine at Galway's dome was not visible due to steam and ash in the summit region, but craggy peaks were observed on the S and NE rims of the scar left by the collapse event. There was no evidence of changes on the other flanks of the dome. Strong fumarolic activity was observed along a clearly defined NE-trending, linear fracture 50-100 m in length within the new scar. Several distinct vents along this fracture gave off white steam; one appeared to be tinged with yellow elemental sulfur. To the W of this a dark mass was intermittently visible through the steam: its dark color may have resulted from steam condensation.
An observation flight on 10 July in clear conditions showed that the collapse scar had the shape of an extremely steep sided, long canyon extending deep back into the dome: it was not possible to determine its westernmost limit, but it must have cut through most of the dome. There was no evidence of renewed dome growth.
Associated seismicity. Beginning at 1229 on 30 June signals indicating a moderate-sized pyroclastic flow lasted ~40 minutes. After this event daily rockfall signals increased from an average of 2/day for June (including 11 on 30 June) continuing with 13 and 8 signal on 1 and 2 July.
On 3 July another, much larger pyroclastic-flow signal started at 0302 and lasted ~2.5 hours. The maximum amplitude of this signal was attained immediately after the onset and lasted for 30 seconds. It was greater than that for the flow on 30 June and several times greater than the last big flows down the Tar River valley in May 1997 (BGVN 22:05).
Spectral analysis of the high amplitude signal at the onset suggests that it was not generated by an explosive event similar to those seen during August and September 1997 (BGVN 22:08). It has been suggested, however, that a phreatic explosion may have been involved.
Deposits. New block-and-ash deposits from the 3 July event covered the entire Tar River delta, and new surge deposits extended over the N of the valley into Long Ground (figure 42). Comparisons between aerial photos of the deposit taken on 24 June, 3, 4, and 6 July show a significant increase in area on the N and S of the delta, but no significant increase in the E. The N side of the delta may have extended by up to 250 m; the S side, by only 30-50 m. The maximum width of the delta (along its base) is now ~1.9 km, tapering to 1 km seaward, extending 700 m off shore. This indicates a total area for the delta of 1 km2, an increase of about 0.25 km2.
 |
Figure 42. Diagramatic map showing the deposits produced by the 3 July 1998 dome collapse and some vertical sections of the delta. North is to the right; heavy solid line is pre-eruption shoreline. Stratigraphic abbreviations are as follows: "BAF," block-and-ash flow; "Accr. ash," the layer of ash rich in accretionary structures probably produced by a secondary explosion when the hot mobile material reached the sea; "Alter." (in section 5), the red alteration probably due to interaction with the sea; and "Ground surge," the often reverse-graded layer of very fine ash found at the base of the block-and-ash flow. The white area on the fan corresponded to old block-and-ash flow deposits. Courtesy of MVO. |
An observation flight on 3 July showed intense white and brownish steaming on the N delta and much weaker white steaming on the S. A number of different lobes of various tones and textures were interpreted as successive pulses from different parts of the dome. Overall, the S area appeared light gray and the N appeared brownish.
Deposits along the beach lines of the delta were later visited. Dry material was extremely hot, steaming from small vents locally. The upper layers consisted of very fine grained, dusty surge deposits reaching up to ~0.5 m in thickness, lacking large clasts. This material was very mobile and small jets fountained when disturbed for sampling. Bubbling mud/ash vents up to 0.4 m in diameter were also distributed irregularly over the front of the delta. Underlying the fine surge deposits was a typical block-and-ash deposit of indeterminate thickness, with clasts typically of a few centimeters diameter, though some meter-sized boulders were visible on the surface of the deposit nearby.
Sampling carried out on the delta showed a prevalence of blocks from the dome, associated with a small proportion of pumices of varying density and vessiculation. A few blocks exhibiting bread-crust structure were found in the S delta. The differences in color seen from the air were conspicuous on the ground. The N part appears much finer than the S.
Hydrothermal alteration was observed in both areas. The top of the surge deposit showed some evidence of alteration, forming a slightly more resistant crust, perhaps as a result of steam from below. In the S this alteration crust is much harder. Part of this alteration is the result of a post-depositional process (as evidenced by yellow, white, and red staining on the surface); part may be due to pre-depositional processes, evidenced by individual discolored blocks of different size located on non-altered areas.
Exploratory sections made on 9 July through the delta deposit showed that the S area consists of a new block-and-ash flow deposit ~10 cm thick on top of deposits from an older block-and-ash flow. Close to the sea a significant layer of alteration (about 6 of 13 cm) is also evident in the deposit. The N of the delta shows a surge layer ~10 cm thick on top of the new block-and-ash flow deposit of up to 50 cm. Sections 1 and 2 (close to the original coast line) also hosted a layer of accretionary ash, probably due to secondary explosions when the flow reached the sea. This is consistent with the brownish steam seen to the N of the delta a few hours after the collapse. Section 2, the most complete section observed, shows the presence of a 15 cm thick layer of very fine ash at the base. The new deposits are probably thickest in the central part of the delta, but it was not possible to obtain thickness data there. Temperatures of the deposits were taken at several places (table 30).
Table 30. Temperature measurements in 3 July 1998 deposits at Soufriere Hills. Courtesy of MVO.
| Measurement Date | Time | Delta Area | Location | Depth (cm) | Temperature (°C) |
| 06 Jul 1998 | 1445 | Northern | 5 m from deposit edge | 4 | 100 |
| 06 Jul 1998 | 1445 | Northern | 5 m from deposit edge | 50 | 300 |
| 06 Jul 1998 | 1445 | Northern | 6 m from edge, inside fluidized area | 80 | 298 |
| 06 Jul 1998 | 1445 | Northern | 8 m from deposit edge | 4 | 100 |
| 06 Jul 1998 | 1445 | Northern | 8 m from deposit edge | 50 | 255 |
| 07 Jul 1998 | 1400 | Northern | 5 m from deposit edge | 4 | 65 |
| 07 Jul 1998 | 1400 | Northern | 5 m from deposit edge | 50 | 195 |
| 07 Jul 1998 | 1400 | Northern | 5 m from deposit edge | 100 | 319 |
| 07 Jul 1998 | 1400 | Northern | 20 m from deposit edge | 4 | 76 |
| 07 Jul 1998 | 1400 | Northern | 20 m from deposit edge | 50 | 193 |
| 07 Jul 1998 | 1400 | Northern | 20 m from deposit edge | 70 | 238 |
| 06 Jul 1998 | 1445 | Southern | 5 m from deposit edge | 4 | 132 |
| 06 Jul 1998 | 1445 | Southern | 5 m from deposit edge | 50 | 360 |
| 06 Jul 1998 | 1445 | Southern | 10 m from edge | 4 | 120 |
| 06 Jul 1998 | 1445 | Southern | 10 m from edge | 50 | 375 |
| 07 Jul 1998 | 1400 | Southern | 5 m from deposit edge | 4 | 117 |
| 07 Jul 1998 | 1400 | Southern | 5 m from deposit edge | 50 | 337 |
| 07 Jul 1998 | 1400 | Southern | 5 m from deposit edge | 70 | 391 |
| 07 Jul 1998 | 1400 | Southern | 10 m from deposit edge | 4 | 115 |
| 07 Jul 1998 | 1400 | Southern | 10 m from deposit edge | 50 | 360 |
| 07 Jul 1998 | 1400 | Southern | 10 m from deposit edge | 70 | 238 |
Subsequent events. The pyroclastic flows of 3 July were followed by heightened rock-fall and volcano-tectonic earthquakes until 1407, when there was further high-amplitude seismic signal. This time the signal lasted only 10 minutes and the maximum amplitude was similar to that of the flow on 30 June. Analysis of the most recent event shows that the first 30 seconds were dominated by a 2.4-Hz harmonic signal. This, combined with observations of the color and ascent rate of the ash cloud, suggested an explosive component, which produced a low, dark ash cloud that drifted NW depositing ash on Salem and Woodlands.
On 5 July there were three episodes of ash venting, which produced weak ash plumes to about 3 km that drifted W over Plymouth. The first two occurred at about 0330 and 0500 lasting about 30 minutes each. The third event at 1030 was observed from Salem and lasted 1.75 hours with new, dense pulses of dark gray ash every 5 minutes.
The following week, there continued to be elevated numbers of rock-fall signals, volcano-tectonic earthquakes, and intervals of tremor associated with ash venting from the scar left by the large collapse.
COSPEC observations. COSPEC observations resumed on 5 July. Although the long interval since the last observations (BGVN 22:10) makes comparisons difficult, SO2 emission rates were clearly elevated, measuring 1,500-3,000 metric tons/day between 5 and 11 July. Although the high flux after the event may have been due to the effects of scattering by fine dust and aerosols in the plume (increasing the effective optical-path length), fluxes one week after the collapse were still significantly higher than during comparable periods earlier in the eruption. This may indicate a change in the magmatic source of the gas, or a change in the degassing regime caused by the depressurizing of a large part of the dome and associated changes in the underlying hydrothermal system. Reports of strong H2S odors from the volcano over previous months may also be related to a cooler, wetter hydrothermal system.
Interpretations and conclusions. Because the dome had stopped growing in mid-March, and in the absence of any clear seismic or other precursors, the 3 July event was initially interpreted as a large mechanical dome collapse- not triggered by fresh dome growth. Given the continued low level of activity, this may still be the correct interpretation. Seismic records suggested a sudden initial collapse followed by continued erosion of the scar. This inference is supported by the very long, deep collapse scar, which extends across much of the dome. Although there are no close parallels from Montserrat itself, it is possible that the high- amplitude seismic signal at the onset of the event was due to a phreatic explosion.
There is little evidence to indicate renewed dome growth. The high SO2 fluxes are problematical in the absence of fluxes taken immediately prior to the collapse. There may have been a change in the hydrothermal system, which brought about the conditions leading to collapse.
The difference in temperature, texture, and color between the new deposits in N and S areas of the delta suggests that they have been affected by different processes: the N area was affected by block-and-ash flows and surges; the S area, only by block-and-ash flows. It is likely that the large area affected by surges on the N flanks of the valley, including parts of Long Ground village, was the result of S winds during the emplacement of the pyroclastic flows.
Acknowledgments. The following scientists contributed to these studies: Costanza Bonadonna and Rob Watts, Department of Geology, University of Bristol; Peter Francis, Department of Earth Sciences, Open University; Richard Luckett and Colin Walker, Montserrat Volcano Observatory; Gill Norton and K. Rowley, British Geological Survey; Richard Robertson, Seismic Research Unit, University of the West Indies.
Information Contacts: Montserrat Volcano Observatory (MVO), c/o Chief Minister's Office, PO Box 292, Plymouth, Montserrat, West Indies (URL: http://www.mvo.ms/).
Continuing decrease in activity; hazards reassessed
The following summarizes the Montserrat Volcano Observatory's (MVO) scientific reports for July and August, except information concerning the 3 July pyroclastic flows, which was reported in BGVN 23:07.
Summary. In the weeks following the 3 July pyroclastic flows, no fresh magma reached the surface; however, vesicular ballistic blocks were recovered from craters on Perches Mountain suggesting that there may have been a small Vulcanian explosion. SO2-flux levels declined steadily throughout July to an average of 1,000 metric tons/day (t/d). Vigorous steam-and-ash venting continued from the dome-collapse scar until the end of July. Activity in August was dominated by several small dome-collapse events and a period of enhanced steam-and-ash venting in the middle of the month. The dome-collapse events were caused by the gravitational collapse of weakened dome rock. The ash venting was intense one day but waned over following days to normal levels. MiniCOSPEC results showed a peak that coincided with the enhanced venting, but there was an overall decline from ~1,000 t/d at the beginning of the month to ~500 t/d at the end of the month.
Visual observations. Ash-and-steam venting immediately after the 3 July event was vigorous. Significant pulses of steam-and-ash continued for 2-3 weeks and fumarolic activity was evident on the S and N flanks of the dome.
A steep buttress overhanging the 3 July scar collapsed on 16 August generating pyroclastic flows that reached the Tar River delta. Large fragments of the buttress were left in the area of the scar's mouth. On 19 August fumarolic activity in the scar increased in intensity: fumaroles on the back wall and at the base of the scar discharged copious quantities of steam and ash in jets. The next day activity decreased in intensity and the fumaroles were generally issuing steam only. Some of the fumaroles were temporarily buried following a rockfall within the scar on 20 August. The fumarolic activity declined steadily, and by 22 August activity had declined to levels observed in the first week of August.
Mudflows continued to be a problem in July. Mudflow deposits built up beneath the Belham Bridge until there was a clearance of only about 30 cm.
Seismicity. After 5 July, seismicity returned to levels similar to the previous month, with the exception of a swarm of volcano-tectonic earthquakes on 25 July (figure 43). This swarm had no outward manifestation at the volcano and activity returned to low levels by the next day.
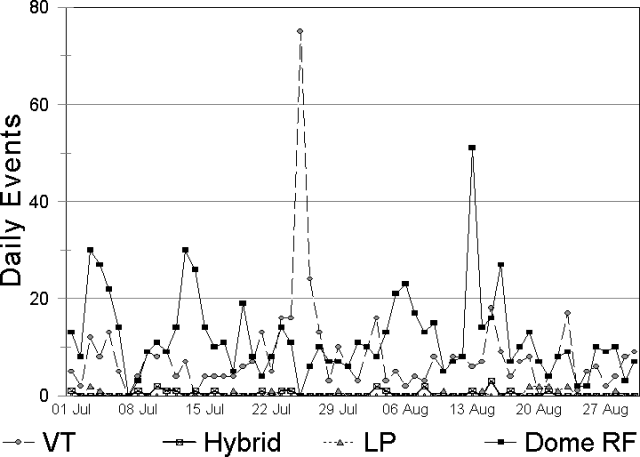 |
Figure 43. Seismicity recorded at Soufriere Hills by type during July and August 1998. Data courtesy of MVO. |
Seismicity during August was generally low. Activity was dominated by small volcano-tectonic earthquakes located ~3 km below the dome, with occasional rockfalls and pyroclastic-flow signals. On 13 August there were two episodes (at 0519 and 1455) of pyroclastic flow in the White River valley. These flows traveled 1.8 km from the dome and were caused by the collapse of weakened dome rock. Active fumaroles on the Galways side of the dome near Chances Peak undermined part of the dome. A scar immediately above the fumarolic area is believed to be the source of the pyroclastic flows. Each episode was followed by about an hour of continuous rockfall activity. On 19 August a rockfall signal was followed by tremor, which corresponded to vigorous ash venting. The signal lasted two days and varied in amplitude. At times of highest amplitude the tremor was nearly monochromatic at 4 Hz.
Ground deformation. Measurements from GPS survey sites on the flanks of the volcano and in the N of the island indicated widespread major reductions in movement during July. The Hermitage site indicated continued slow movement NE at rate of ~0.5 cm/month. The GPS site at Perches was destroyed in the 3 July event; ballistics were scattered over Perches Mountain and the GPS site was later found at the edge of a 3.4 m diameter impact crater. The rates of movement of sites in August were within the instrumental error. The GPS kit was used for one week by volcanologists from the University of Rhode Island who were conducting a bathymetric survey of the fans at the mouths of the Tar River and White Rivers valleys.
The EDM reflector on Peak B was measured from Windy Hill. The increase in distance of 5 cm during the period May-July may have been caused partially by release associated with the 3 July collapse. The line had shortened by 9 cm between 25 January and 13 May, but between May and August the distance lengthened by a total 8 cm (within 1 cm of its original length) possibly indicating a relaxation in the confining pressure.
Volume measurements. A kinematic GPS survey of the Tar River fan was completed in July. The total volume of the fan was estimated to be 22.1 x 10⁶ m3. A previous survey in August 1997 gave a volume of 15.7 x 10⁶ m3. Much of the increase resulted from the 3 July collapse, which extended the fan 350 m N, although a small part of the increase was due to the accumulation of pyroclastic-flow deposits during the September-October 1997 explosion sequence (BGVN 22:10 and 22:11). The E limit of the fan, defined by a steep shelf extending into the sea, was unchanged. A small deposit was left on the S side of the fan, although above the established shoreline there was only a thin layer of pyroclastic-flow deposits.
No volume measurements were made in August. Attempts to survey the 3 July collapse scar were foiled by deteriorating weather conditions and a lack of helicopter fuel.
Environmental monitoring. MiniCOSPEC observations recommenced on 5 July. In early July SO2 flux was generally between 1,000 and 2,500 metric tons/day (t/d). On 13 July SO2 flux measured 4,150 t/d, the highest ever recorded at Montserrat. Throughout the remainder of July there was a gradual decline in SO2 flux to an average of 1,000 t/d at the end of the month. The cause of the relatively high gas flux in the apparent absence of magmatic activity was being investigated, but may relate to perturbations in the hydrothermal system caused by the dome collapse on 3 July 1998.
MiniCOSPEC measurements in early August showed a consistent SO2 flux of ~500-1000 t/d. On 19 August levels rose to 1,400 t/d as a result of enhanced venting. Towards the end of the month poor weather limited the number of COSPEC measurements, but there appeared to be a slight decrease to an average of ~500 t/d. Throughout late August the wind direction was variable due to tropical storms in the area. On occasions when the wind blew to the N or NW a strong smell of sulfurous gases was detected in the inhabited area of Montserrat.
Sulfur dioxide diffusion tubes exposed between 29 June and 13 July clearly reflect the high emissions in early July (table 31). The Plymouth area in particular was subjected to very high concentrations of gas. In the second half of July SO2 concentrations in Plymouth were reduced by half. Populated areas N of the Belham River valley were, as usual, only subjected to very low SO2 levels in July. In August there was a general decline of SO2 in the atmosphere. An additional monitoring site in the N of the island was installed to assess SO2 during shifts in wind direction.
Table 31. Sulfur dioxide diffusion-tube results, 29 June-11 August 1998. Levels are in parts per billion (ppb). Courtesy of MVO.
| Station | 29 Jun-13 Jul 1998 | 13 Jul-27 Jul 1998 | 27 Jul-11 Aug 1998 |
| Police HQ, Plymouth | 207.9 | 116.5 | 131.5 |
| St. George's Hill | 22.05 | 8.55 | 9.55 |
| Weekes | 5.75 | 4.1 | 2.85 |
| MVO south | 4.3 | 3.85 | -- |
| Lawyers | 2.2 | 0 | 3.8 |
| Vue Pointe Hotel | -- | -- | 3.25 |
Hazard assessment. A meeting was held 14-16 July at McChesney's Estate to assess the current hazards and risks associated with Soufriere Hills Volcano. The meeting brought together many of the senior scientists who have worked at MVO during the three-year volcanic crisis. Those who took part were Richie Robertson, Lloyd Lynch and John Shepherd from the Seismic Research Unit in Trinidad; Simon Young, Sue Loughlin, Tony Reedman, and Gill Norton from the British Geological Survey; and many other senior scientists from around the world including Steve Sparks from Bristol University, Peter Baxter from Cambridge University, Barry Voight from Penn State University, Joe Devine from Brown University, Peter Francis from the Open University, Keith Rowley, and Willy Aspinall. Richard Luckett and Richard Herd from MVO provided up-to-date information about the current status of Soufriere Hills volcano.
Discussion was held on various aspects of the activity over the previous six months, including the event on 3 July. Related issues, including the safety of Bramble airport, were also addressed. An assessment of the level of risk associated with the volcano was undertaken. A report was presented to the government of Montserrat and the U.K. on 29 July after which the findings were made public.
According to the report, MVO judged it likely that the volcano has entered a period of repose, with the probability of no further magmatic eruptions in the next 6 months set at about 95%. MVO was confident that renewed magma ascent and escalation to dangerous levels of activity could be identified, although they cautioned that escalation might take place in a very short period of time (e.g. a matter of hours). Most of the island was perceived to be under reduced risk, but areas S of the Belham River Valley remain vulnerable to serious volcanic hazards including pyroclastic flows related to the collapse of the dome, mud flows, and exposure to fine ash. Further dome collapses were deemed likely and could affect all flanks of the volcano, especially the Tar River, Gages Valley, Plymouth area, Galways, and the NE slopes. There is potential for a variety of events to take place, including steam explosions, mud flows, and ash falls, for many years to come but the risks will decline with time. Health risk analysis showed that if magmatic activity does not resume, the potential for harmful exposure to ash will be limited and the risk of developing silicosis will be low in Zones 1 to 3. The same would apply to Population Zone 4 north of the Belham Valley after a clean-up operation has been safely completed. A public education program on the health risks of ash was recommended, including guidance on protection measures during the clean up. Certain groups could be at risk from much higher exposure (e.g. outdoor workers and asthma sufferers) and there may be unknown long-term health risks to young children.
The Volcanic Executive Group (VEG), chaired by Governor Tony Abbott, met to consider the Scientific Review. A statement from the Governor's Office following the meeting rescinded the recommendation that residents leave the Central Zone. Also, there was no longer any objection to commercial organizations operating within the Central Zone. The clean up of Friths, Salem, and Old Towne, which commenced some weeks ago, was intensified. The VEG sought advice on how to ensure that the Zone will be cleaned so that children and those with respiratory problems will not be affected on reoccupation.
Information Contacts: Montserrat Volcano Observatory (MVO), c/o Chief Minister's Office, PO Box 292, Plymouth, Montserrat, West Indies (URL: http://www.mvo.ms/); Richard Aspin, Information & Education Unit, Emergency Dept., St Johns Village, Montserrat, Leeward Islands, West Indies.
Small dome collapses, pyroclastic flows, and ash venting
There was a slight increase in activity in October according to reports from the Montserrat Volcano Observatory (MVO). Five small collapse events occurred on the dome, each producing significant deposits of ash up to 3 km away. Pyroclastic flows occurred along most of the volcano's main drainage. Ash fell predominantly W and NW of the volcano, light ash fell in the N of the island. Dome collapses were commonly followed by periods of volcanic tremor and ash venting, and sometimes swarms of volcano-tectonic earthquakes occurred shortly after the collapse events. The dome gradually eroded, leaving some large fractures in the carapace that could lead to larger collapses in the future.
Visual observations. Intermittent small pyroclastic flows originated from all flanks of the dome. The first significant event, at 0801 on 13 October, produced pyroclastic flows in Tuitt's Ghaut and Tyer's Ghaut. Volcanic tremor after the collapse correlated with ash venting from high on the dome's N flank, the ash cloud rapidly reached 7,500 m. The cloud drifted NW, depositing ash on parts of the island.
At 0916 on 18 October, there was another collapse, the ash cloud rose to around 2,000 m and moved W, although the exact direction was uncertain because a low cloud hampered observation. Subsequent volcanic tremor lasted for several hours.
Another small dome collapse occurred at 2241 on 20 October. The ash cloud from this event rose to an estimated 2,500 m, drifting slowly to the W and NW. Observations the following morning revealed that the pyroclastic flows from this event had traveled towards Plymouth as far as Upper Parsons (2.5 km W of the summit). Fallout included some coarse lithic fragments 4 to 5 mm in diameter.
At 0051 on 26 October, a fourth small collapse occurred. The seismic signal lasted for about 12 minutes followed by an extended period of tremor. Reports were received of thunder from the resultant ash cloud, and there was subsequent wet ashfall as far as 7 km N. Information received from NOAA satellite images indicated that the ash cloud reached to between 6,000 and 7,500 m. Observations during the early hours of the morning suggested that there were two ash cloud lobes, one S of Belham Valley and one over the Salem-Old Towne area. The deepest measured ashfall was 25 mm; 4 mm or more fell in other areas. The ash was fine grained, with common accretionary lapilli. During an observation flight on the 27th, steaming could be seen at the edge of the delta, indicating that the pyroclastic flows had traveled into the sea. The flows also reached NE as the Tar River Estate House (3 km from the summit). On the SW side, down the White River, a thin deposit of ash from the pyroclastic flows could be seen as far as about 700 m from the old coastline at O'Garras; when these deposits were emplaced is unknown.
A fifth small dome collapse occurred at 0418 on 31 October; an ash plume first drifted W, and thenN and NE depositing some ash in occupied areas at the island's N end. An observation flight later that day revealed new deposits: a pyroclastic-flow deposit in the White River reaching Galways Soufriere, and another in the Gages valley that did not extend beyond the top of the Gages fan. The White River deposit had numerous large angular blocks resting on its surface.
A large fissure within the dome extended from its base, where it rests against Chances Peak, to its top in the Galways area (S). At the foot of this crack a triangular-shaped opening had developed and appeared to have been the source of the White River pyroclastic-flow.
Unusual wind directions during the latter part of October directed the plume to the N. As a result, residents in N Montserrat smelled strong sulfurous odors.
On 27 October, probing into the pyroclastic deposits in the area of the Farm River in Trant's yielded these depth-temperature relations: 1.0 m and 86°C; 1.4 m and 146°C; and 2.25 m and 239°C. Unusually clear conditions in the early evening of 27 October enabled observers in Old Towne and Salem to see three small glowing areas on the dome; these areas were thought to reveal the dome's incandescent interior exposed during the recent collapse events.
Seismicity, deformation, and environmental monitoring. Over the reporting period seismicity was generally low; however, small dome collapses triggered volcanic tremor and swarms of volcano-tectonic earthquakes. As in the previous month, tremor correlated with intensified ash-and-steam venting from the N flanks of the dome.
Five small collapses occurred between 13 and 31 October. These were marked by pyroclastic-flow signals that lasted several minutes. The collapse on the 13th was preceded by a swarm of small volcano-tectonic earthquakes. Several much larger volcano-tectonic earthquakes occurred during the collapse, the first approximately 30 seconds after the start of the collapse; hypocenters for these events were tightly clustered directly under the lava dome.
The collapse on the 18th was accompanied by a more intense swarm of earthquakes (table 32). The first earthquake occurred about 40 seconds after the beginning of the collapse and was one of the largest earthquakes recorded since the installation of the broadband network; it was felt in the Woodlands area. This earthquake was much richer in low frequencies than typical volcano-tectonic earthquakes on Montserrat, possibly suggesting a larger source dimension. Hypocenters for the largest earthquakes were located S of the volcano. At the start of the swarm, hypocenters were directly under Roaches Mountain; as the swarm progressed, hypocenters migrated to S of Chances Peak. Preliminary calculations showed that the largest events were consistent with oblique-normal faulting in a NE-SW direction.
Table 32. October 1998 earthquake swarms at Soufriere Hills. Courtesy of MVO.
| Date | Start Time | Duration (hours) | Hybrid | Long-period | Volcano-tectonic |
| 13 Oct 1998 | 0249 | 5.10 | 0 | 0 | 11 |
| 18 Oct 1998 | 0916 | 6.73 | 0 | 0 | 51 |
| 25 Oct 1998 | 0614 | 11.32 | 0 | 0 | 24 |
All GPS sites on the volcano and in the N of the island appear stable and there were no significant changes since last month. The EDM reflector on the northern flank was shot from Windy Hill. The line continues to shorten slowly. The site was later destroyed by a pyroclastic flow.
SO2 flux, measured using the miniCOSPEC instrument, was (in metric tons/day) 1,300 on 9 October, 340 on 21 October, and 280 on 30 October. These results are similar to those measured in recent months, although an apparent decrease occurred late in the month. Sulfur dioxide was also measured at ground level using diffusion tubes around the island. SO2 in Plymouth (at Police Headquarters) remained high; elsewhere the average levels were very low.
Information Contacts: Montserrat Volcano Observatory (MVO), c/o Chief Minister's Office, PO Box 292, Plymouth, Montserrat, West Indies (URL: http://www.mvo.ms/).
Continuing dome collapses and ash deposition in November
Activity during November was dominated by small-volume pyroclastic flows down the Gages, White River, and Tar River valleys. The pyroclastic flows reached the sea and left a narrow, deep cleft in the dome. Ash was deposited over the whole island, but heavy rains cleared the dust from inhabited areas. Seismicity was dominated by rockfalls and volcano-tectonic earthquakes, the latter occasionally occurring in swarms. Some of the larger seismic events were felt throughout the island.
Visual observations. As in October (BGVN 23:10), volcanic activity during November was dominated by intermittent, small pyroclastic flows from all of the dome flanks. On 2 November several small rockfall events were recorded, some followed by low-amplitude tremor.
At 0821 on 3 November a larger dome collapse sent pyroclastic flows down the Tar River as far as the sea and down the White River valley as far as Galway's Soufriere. The ash cloud from this event reached >3,100 m and drifted W. Most of the ash fell S of the Belham valley.
A major dome collapse occurred at 2117 on 5 November. The pyroclastic flows from this collapse traveled down the White River valley to the sea, depositing two blocky lobes on the White River delta. The surge cloud climbed halfway up the N slope of Fergus Mountain. A small, fresh, and predominantly fine-grained pyroclastic-flow deposit was also observed in Ginkgoes Ghaut near Reids Estate. The ash cloud from this event drifted W and reached a height of ~6,200 m. The pyroclastic flows originated from a deep gully between Chances Peak and the dome above Galway's.
Two small pyroclastic flows occurred at 0920 on 8 November and at 0847 on 9 November. These traveled down the White River and the associated ash clouds reached heights of ~1,800 and 3,100 m.
At 0607 on 12 November, the largest dome collapse in the current series occurred, followed by vigorous ash venting. Pyroclastic flows traveled down Gages, Tar River, and White River valleys. The ash cloud reached a height of ~7,700 m; ashfall covered the island but mainly affected the Richmond Hill area. The pyroclastic flows that traveled down Gages valley almost reached the sea at Plymouth; some burning was observed near the port buildings. For the first time, pyroclastic flows reached the War Memorial and the Post Office. Lobes of material reached into the Amersham area and a large water tower was transported into the upper parts of Parsons. Pyroclastic flows also reached the sea at the Tar River delta and the old coastline at the bottom of the White River valley. In the weeks following this collapse there were a few small pyroclastic flows and periods of low-amplitude seismic tremor coupled with ash venting.
Activity during November cut a deep channel into the dome. The channel is ~150 m deep and 30 m wide and bisects the dome between the head of the Tar River and the top of Gages valley. The channel sides are extremely steep and overhanging in places. Several large cracks formed in various sectors of the dome, including in the area above White River and Tyer's Ghaut.
On 16 November, deposits near the War Memorial showed a temperature of 386°C at a depth of 1 m. During 28-29 November, heavy rain caused mudflows down all flanks. New material was deposited on the Belham Bridge (1 m depth), in Plymouth, and on the airport runway.
Seismicity, deformation, and environmental monitoring. A swarm of volcano-tectonic (VT) earthquakes occurred on 1 November (42 events within about 3 minutes); the largest was felt throughout the island. The hypocenters were located SW of the volcano under Chances Peak. Rockfall signals and pyroclastic flows dominated seismicity (70% of recorded events). VT earthquakes (28% of recorded events) beneath the dome often followed rapidly after the larger collapse events. There was a second swarm of VT earthquakes on 25 November with 42 events within about 5 minutes; a pyroclastic flow occurred shortly after the swarm started.
GPS measurements made during the latter part of the month in collaboration with University of Puerto Rico staff determined that Long Ground has moved ~4 cm E since March 1998.
The miniCOSPEC measured an SO2 flux of 740 metric tons per day on 2 November, similar to the flux measured the previous 2 months. Sulfur dioxide also was measured at ground level using diffusion tubes around the island. SO2 levels varied depending on the prevailing winds, but overall were lower during November than in previous months.
Information Contacts: Montserrat Volcano Observatory (MVO), c/o Chief Minister's Office, PO Box 292, Plymouth, Montserrat, West Indies (URL: http://www. geo.mtu.edu/volcanoes/west.indies/soufriere/govt).
Ash venting and numerous pyroclastic flows in December 1998 and January 1999
Several small dome collapses, some that were initially explosive, generated pyroclastic flows in December. Episodes of ash venting occurred almost daily and seismicity was dominated by volcano-tectonic earthquakes and rockfalls. The number of volcano-tectonic earthquakes declined toward the end of December but the number of long-period signals, corresponding to ash venting, increased slightly. Some explosive eruptions during early- to mid-January generated substantial ash clouds. Brief episodes of ash venting, correlating with seismic tremor, became shorter and weaker toward the end of January. Small-volume pyroclastic flows were generated by dome collapse, but some flows may have been generated by fountain collapse during small explosive eruptions. The average SO2 flux was elevated throughout December and January. Eastward movement of the Long Ground and Tar River GPS sites continued.
Visual observations.Daily periods of volcanic tremor during December coincided with steam-and-ash venting. On 8 December mudflows occurred all around the volcano.
A pyroclastic flow generated by dome collapse on 14 December reached the sea at the Tar River delta. Deposits were fluidized, fine-grained material with very few blocks. A large ash cloud was generated that rose rapidly to ~6,100 m. Ash fell W and NW of the volcano, attaining a thickness of 2 mm in Salem and containing accretionary lapilli up to 2 mm in diameter. On 19 December a pyroclastic flow reached the Tar River delta in less than five minutes. Powerful black jets of ash and rock burst from the dome at the onset of the event but it is unclear if this explosive activity preceded or followed the dome collapse. The small deposit was almost entirely confined to the incised channel in the Tar River valley on top of the 14 December deposits. On 21 December, at the onset of a sudden large seismic signal, dense black jets of ash and vigorously convecting ash clouds escaped from the main vent in the 3 July scar. Ballistic blocks rose 80 m above the vent. Very vigorous ash venting continued for more than 30 minutes after the initial explosion. A minor dome collapse on 27 December resulted in a small-volume pyroclastic flow reaching the Tar River delta. Poor visibility hampered observations, but a significant ash cloud was generated.
Minor ash venting took place on 1 and 5 January. At 0358 on 7 January, a large long-period seismic signal immediately preceded a 30-minute episode of tremor (usually associated with vigorous ash venting). Later the same day, a small dome collapse generated a pyroclastic flow that traveled half-way down the Tar River valley and a low-level ash cloud that moved W over Plymouth. On 13 January an explosive event generated an ash cloud to 6,100 m and a pyroclastic flow. The onset of the seismic signal had a long-period component, and a pressure wave was recorded at Long Ground. A booming sound was reported by many. The pyroclastic-flow deposit in the Tar River valley was small in volume but its extent suggested that the flow had been very mobile. Narrow small-volume pyroclastic-flow deposits were observed S of the dome as far as the former position of Galway's Soufriere. Two small dome-collapse pyroclastic flows occurred on 14 January. At 0827 on 15 January a small explosive event generated an ash cloud that rose to 4,600 m. The cloud moved NW and light ashfall affected Salem and Old Towne. Ash venting continued in pulses for 15 minutes. Another small explosion on 16 January generated an ash cloud to 3,000 m. Rockfalls were triggered on the inner walls of the 3 July scar and on the outer SE and NE flanks of the dome. A minor dome-collapse pyroclastic flow on 20 January almost reached the sea at the Tar River delta. The resulting steam-rich plume dissipated rapidly. Several brief (20 minute) episodes of tremor preceded by a rockfall corresponded to weak ash venting on 24 January. Further short episodes of ash venting occurred on 25 and 27 January.
Clear conditions on 26 and 27 January enabled MVO staff to survey the dome (figure 44). The canyon, which had been incised through the dome, was clearly visible. It bisected the dome in a NW-SE direction from the top of Tar River Valley to the top of Gages Valley. The inner walls of the canyon were vertical and surfaces looked fresh because of repeated small rockfalls.
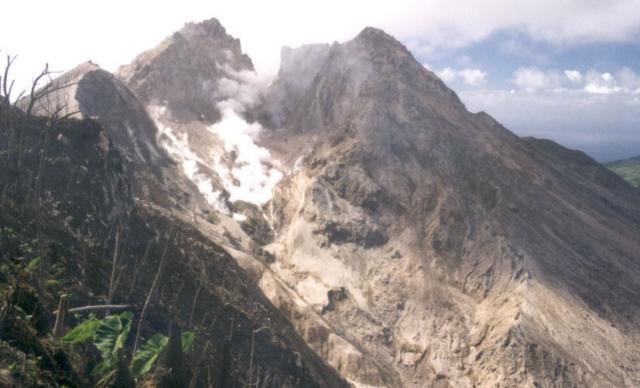 |
Figure 44. Photograph of the dome area at Soufriere Hills taken in late January 1999. This was used to calculate the dome volume and shows an exceptionally clear view of the gully running through the dome. Courtesy MVO; photograph by Richard Herd and Chloe Harford. |
Seismicity. Seismicity in December consisted chiefly of volcano-tectonic earthquakes and rockfall signals. Many of the latter were associated with small pyroclastic flows or venting. Small clusters of earthquakes were located under George's Hill to the NW of the dome, under Roaches Yard to the SE, and under Hermitage Estate to the NE.
Overall, January was quiet seismically. Pyroclastic-flow signals had low-frequency precursors. These events were associated with booming noises and were followed by periods of vigorous ash venting, suggesting the collapses were caused by violent degassing of the dome.
Ground deformation. The only area where significant deformation took place in December was on the E flank. The vectors for Long Ground showed eastward movement of these two sites amounting to 5 cm since lava stopped erupting. Most of this movement occurred during the last three months (a time of increased surface activity). The differential movement between Whites and Long Ground since June 1996 is more than 10 cm. The two sites are 733 m apart and the movement between them cannot be fit elastically. A ground inspection on 30 December revealed a possible fault between the two sites. The only surface expression is a linear break in the road and it is not currently known whether this is related to volcanic deformation or to surficial movements. The Tar River GPS pin has followed a similar movement to Long Ground throughout the eruption. The Perches site, until it was destroyed in July, followed a similar path. One possible interpretation is that a sector of the volcano including Long Ground, Perches, and Tar River is moving as a block along faults in a NE direction.
Eastward movement of Long Ground and Tar River continued in January but at a reduced rate. A local EDM network of five pins was set up on 27 January to learn whether the surface feature is a fault.
Environmental monitoring. The miniCOSPEC was used several times in December. The SO2 flux was elevated and on 22 December and reached a peak average flux of 1,700 metric tons per day (figure 45). Sulfur-dioxide flux decreased throughout January, but generally remained elevated. Concentrations were also measured at ground level by using diffusion tubes around the island.
 |
Figure 45. Average daily SO2 fluxes at Soufriere Hills measured by miniCOSPEC, December 1998-January 1999. The lines connecting measured points are guidelines only; the actual measured levels varied. The measurements made on 19 January showed a very low flux: observations suggested that at least part of the plume was at a very low altitude and may have been found partly below the elevation of the traversing helicopter. Data courtesy of MVO. |
Ash and rainwater collection continued throughout January. Ash samples from the small explosive events tended to very coarse, with lithic and crystal fragments up to 6 mm in size in the Richmond Hill-St. Georges area. In contrast, ash generated by dome-collapse pyroclastic flows was very fine-grained.
Volume measurements. A detailed photographic and theodolite survey was conducted from twelve sites around the volcano at the end of January. A photographic survey was also conducted from the helicopter with the GPS onboard. The information has been processed to produce a detailed dome map and volume measurement. The dome had a volume of 76.8 x 10⁶ m3 and its highest point was 977 m at the top of the White River Valley. The dome was split deeply by the collapse on 3 July 1998 and by subsequent events. The N part of the dome, which comprises three main buttresses above Gages, the N flank, and Tar River, contains two-thirds of the total dome volume. The scar cuts up to 100 m into the pre-1995 crater floor and has removed a minimum of 5.4 x 10⁶ m3 of old rock from this area.
Information Contacts: Montserrat Volcano Observatory (MVO), Mongo Hill, Montserrat, West Indies (URL: http://www.mvo.ms/).
Sporadic explosive eruptions and pyroclastic flows during January-March
January, February, and March were characterized by sporadic low-intensity events and little seismic activity. In early- to mid-January (7, 13, 14, 15, and 16) there was a series of small explosive eruptions, some generating substantial ash clouds. These events were followed by episodes of ash venting and correlated with seismic tremors. There were occasional small-volume pyroclastic flows (mostly generated by dome collapse, but some perhaps due to fountain collapse during earlier eruptions). Several pyroclastic-flow signals (for example, 7 January) had low-frequency precursors and observers heard associated booming noises in the S of the island. Subsequent vigorous ash venting suggested that the collapses came from violent degassing of the dome. SO2 levels generally decreased during January, although they remained elevated. Ash samples were coarse with lithic and crystal fragments up to 6 mm in size in the Richmond Hills and St. Georges area; those from the dome-collapse pyroclastic flows were very fine-grained.
At the end of January the observatory conducted an extensive photographic and theodolite survey at 12 sites; they also used a GPS-equipped helicopter. The information was used to produce a detailed dome map. The researchers gauged the dome's volume at 76.8 x 10⁶ m3 and measured its highest point (at the top of the White River Valley) at 977 m. Also noted was a deep split in the dome from the 3 July 1998 collapse and subsequent events. The N part of the split comprised two-thirds of the total dome volume (including the three main buttresses above Gages, the N flank, and the Tar River). The scar cuts 100 m into the older English's Crater and has removed a minimum of 5.4 x 10⁶ m3 of old rock.
February activity consisted of a short period of ash venting and pyroclastic flows, and two small mudflows. There was reduced deformation, and the SO2 flux continued to decline.
Activity in March was dominated by 23 small explosive and ash-venting episodes on 1, 7, 12, 26, and 30 March. The largest produced a 7-km-tall ash cloud, ashfall as far as Salem and Runaway Ghaut, lightning, and pyroclastic flows reaching the Tar River delta. Deformation rates decreased, gas emissions were moderate, and SO2 fluxes dropped. Seismicity was dominated by signals from ash venting. Events had impulsive origins with gradual declines in amplitude toward the signal's end.
Information Contacts: Montserrat Volcano Observatory (MVO), Mongo Hill, Montserrat, West Indies (URL: http://www.mvo.ms/).
Dome collapses, pyroclastic flows, and ash eruptions in April-June
Small explosive blasts with ash venting occurred with regularity during April to July, sending some plumes as high as 5 km, sometimes accompanied by thunder and small pyroclastic flows down the Tar River valley. Vigorous fumarolic activity was observed frequently in the dome above the Tar River as was steaming on the N flanks of the dome. Measurements of SO2 flux typically ranged from ~200 to 500 tons/day, all substantially lower than the peak levels of ~2,000 tons/day.
During April-July there were frequent volcano-tectonic (VT) earthquakes and occasional long period (LP) events. The VT events typically ranged from ~10 to 70/ week; the LP events took place up to 9/week.
Activity increased in May and several events of greater intensity occurred in June and July, the latter with large pyroclastic flows and ash plumes rising to heights of 10 km. Explosions lasting as long as 10 minutes occurred on 10 May and again on 20 May. These were accompanied by ash plumes that rose to altitudes of several kilometers above the summit. Pyroclastic flows were seen traveling down the Tar and Gages rivers and in Tyers Ghaut after the event on 10 May. Observations of the dome on 13 May indicated that a large slab of rock had collapsed from the Galways lobe into the gully between the top of Gages and Tar river valleys.
A distinct increase of activity occurred on 22 May when a VT earthquake swarm was recorded, the first since December 1998. The swarm comprised 141 VT events and lasted ~10 hours. A large pyroclastic flow occurred the next morning, mainly traveling down the E flanks of the volcano before reaching the sea at the Tar River delta. Activity increased on the evening of 5 June when a portion of the dome on the NE flank above Tuitt Ghaut collapsed. About 1.5 x 10⁶ m3 of material were removed from the dome, forming pyroclastic flows that traveled down the Tuitt Ghaut to about 1.5 km from the dome; down the White Ghaut to about 2 km from the dome; and down the Tar River to the sea. A large, dark ash cloud that reached an altitude of ~4 km moved W and NW from the volcano, traveling as far N as Salem with associated thunder and lightning. There was complete darkness in Salem for a short period as ash started to fall. Up to 1 cm of ash was deposited in Salem, Old Towne, and areas S of Belham. Heavy rains on 9 June produced mud flows down all flanks of the volcano depositing new material in the Belham valley.
During the rest of June and most of July, a continuing sequence of small collapse events occurred each week, some with pyroclastic flows that traveled down the Tar River and other valleys. Ash clouds reached 3 km above the summit, causing additional ash deposition in Salem and Old Towne. A 17 June collapse produced a pyroclastic flow that reached the sea at the Tar river delta.
On 20 July a major collapse occurred without any precursory signals; the resulting large pyroclastic flow traveled down the Tar River valley and covered the entire fan. On the N face of Roches Mountain the pyroclastic surge stripped off the remaining vegetation, and the event generated a mobile surge cloud that swept over the mountain and collapsed on its S side forming a secondary flow in the valley leading into Dry Ghaut. Ballistic rocks were thrown over Roches Mountain setting fire to vegetation on its E side. Subsequent visual observations confirmed the large magnitude of the collapse.
On both 25 and 26 July there occurred earthquake swarms, each of 2-hour duration and composed of 22 and 26 events, respectively. Most of the earthquakes were of small magnitude, located at depths of ~1 to 3 km directly beneath the volcano. The first and largest of three explosions that week occurred ~2.5 hours after the second swarm. Heavy meteorological cloud cover precluded visual observation of the effects of these explosions throughout the remainder of the month. However, prolonged steam venting and ash emission, roaring sounds, lightning, and thunder were associated with all three explosions.
Measurements of the volcano deformation rate during the period indicated that it remained low, fluctuating in response to changes in internal pressure. The most recent period of rapid deformation occurred during April and May, coincident with the increase in activity during that time. Electronic distance meter (EDM) measurements reported in late June indicated that the line between Chances Peak Steps and Lower Amersham showed a shortening of 18 cm over the 2-year period since the last measurement, an average rate of about 2 mm/week.
Montserrat Volcano Observatory (MVO) reported that events of the type and size recently observed can occur at any time without any build-up in activity beforehand. MVO warned that the flanks of the volcano remain extremely dangerous and advised residents to keep listening to local radio for updates on the state of the volcano.
Information Contacts: Montserrat Volcano Observatory (MVO), Mongo Hill, Montserrat, West Indies (URL: http://www.mvo.ms/).
Still-vigorous, potentially destructive eruptions during July-November 1999
This report covers a six-and-one-half month period, starting from the major dome collapse on 20 July 1999 (BGVN 24:07) and extending to 4 February 2000. Tremor, explosions, ash venting, and pyroclastic flows occurred frequently during the period from the 20 July dome collapse through late November. Dome growth continued through the end of the interval. Ash clouds were frequent during this period, some rising to above 3 km and several with maximum heights exceeding 6 km. The volcano continued seismic and volcanic activity including rockfalls and abundant earthquakes of several types. The number and intensity of these have varied, but events of all types have been reasonably contiguous throughout the ensuing period. Visibility of the dome area was obscured until early November when the crater was visible for the first time during the early reporting period. Subsequent observations in late November revealed new dome material within the 3 July 1998 dome scarp, the first growth observed since March 1998. This new lava dome continued to grow. Episodes of tremor also began in November (see below).
Figure 46 shows a photo of the dome in December 1999. Early in that month it was estimated to be ~200 m long by 80 m wide and ~70 m high as its widest point. The two small spines at the top were ~8 m high.
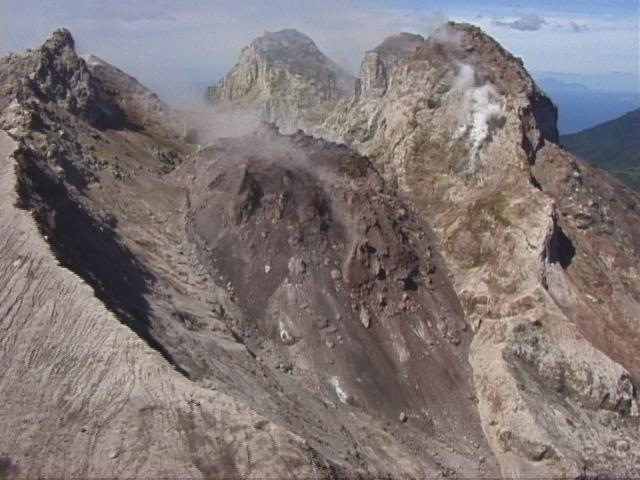 |
Figure 46. Soufriere Hills breached crater and growing dome in December 1999 as seen from the SE side. Courtesy of MVO. |
Dome growth continued through February; in the last week of January clear weather permitted sufficient measurements and photographs to estimate the dome's volume. Growth rates were above ~3 m3/s for December and early January. This appears consistent with increases in seismicity witnessed during 28 January to 4 February 2000. The first pyroclastic flow from the dome during the reporting interval occurred on 2 February; resulting deposits were seen on 3 February in the S part of the Tar River valley and most of the way across the delta.
During the more than six-month period since the collapse seen on 20 July 1999, rockfalls took place at rates of over 100/week (326 during the last week of January) to as few as 16/week. Weekly earthquake events also varied as shown in table 33. Small earthquake swarms (e.g., 20 events) occurred at numerous times, but were usually of low intensity. A swarm of 213 recorded events occurred during the period 3-8 November; those that could be located occurred at estimated depths between 1.5 and 2 km.
Table 33. A summary of Soufriere Hill's weekly earthquakes during 20 July 1999 through 4 February 2000 emphasizing the maximum and minimum number of events each week. Courtesy of MVO.
| Earthquake type | Maximum | Minimum |
| Volcano-tectonic | 129 | 16 |
| Hybrid | 142 | 6 |
| Long-period | 23 | 2 |
On 23 November 1999, cyclic bands of tremor began. They were continuing as of the end of this reporting period. Overall, more than 100 tremor episodes occurred during the reporting period. On average, a cycle included 5 hours and 40 minutes of seismic quiescence followed by 3 hours of tremor. These tremor bands were associated with periods of dome growth, with an increasing amplitude of the seismic peak within each cycle. The slow increase in background long-period seismicity suggested that the dome growth rate was increasing.
Average daily SO2 flux estimates were made when weather conditions permitted measurement. The results typically varied from about 200 to 600 tons/day, with some peak values exceeding 1,500 tons/day.
Background. A recent reprint volume has been compiled to provide a single source of scientific information on the Montserrat eruption up to late 1997 (Young and others, 1998). In addition, Rozdilsky (1998) discusses some social impacts of the ongoing crisis. The destructive events that began in July 1995 led to the evacuation of ~70% of the population of 11,000 people under emergency conditions. In other words, 7,243 people from 22 settlement areas were evacuated. The settlements were subsequently damaged or destroyed; however, due to the evacuations less than 25 deaths were attributed to the dome collapse.
During 1999, extensive planning for redevelopment of the safer, northern portion of the island was undertaken by the governments of Montserrat (a British Overseas Territory) and the United Kingdom. As a future target, 10,000 persons (approximately the island's population prior to the volcanic crisis) could be relocated at seven new activity centers in N Montserrat.
References. Rozdilsky, J.L., 1999, Disaster recovery in an on-going hazard situation on Montserrat: the July 20, 1999 volcanic dome collapse (preliminary abstract): Ph.D. dissertation, Dept. of Resource Development and Interdepartmental Urban Affairs, Michigan State University.
Young, S. R., Voight, B., Sparks, R.S.J., Rowley, K., Robertson, R.E.A., Lynch, L.L., and W. P. Aspinal (conveners), 1998, Selected papers on the eruption of the Soufriere Hills Volcano, Montserrat: reprints from the Geophysical Research Letters, v. 25, nos. 218 and 219, published by the American Geophysical Union (1998), 3387-3700 p. (ISBN-0-87590-919-1).
Information Contacts: Montserrat Volcano Observatory (MVO), Mongo Hill, Montserrat, West Indies (URL: http://www.mvomrat.com/).
Dome growth continues through May; Vulcanian eruption 20 March
Volcanism at Soufriere Hills volcano between 5 February and 26 May 2000 consisted of tremor, continuous dome growth, dome collapses, several pyroclastic flows, and a Vulcanian eruption.
Dome growth that began in November 1999 (BGVN 25:01) continued this report period with growth concentrated in the NE and E portion of the dome through February 2000. On 7 March a switch in the focus of dome growth was marked by a small swarm of earthquakes recorded from 1530 to 1730. The swarm consisted of a mixture of volcano-tectonic, long-period, and hybrid earthquakes with a total of 25 recorded events. Between 2342 on 7 March and 0349 on 8 March a second swarm of different types of earthquakes occurred. The appearance of spiny material in the summit area on 7 March suggested that some growth occurred to the W of the new dome towards Gages wall. Further observations on 9 and 10 March showed a large spine, ~30 m high in the S part of the new dome.
A magmatic explosion occurred at 1530 on 20 March, which was the largest event of this report period. According to MVO, a series of pyroclastic-flow signals started shortly after 1530. These were probably triggered by heavy rainfall and gradually built up in size. Between 1800 and 1900, there were several large pulses of activity with each pulse successively larger. At about 1915, a very large pyroclastic flow traveled out across the sea. This was followed by at least one, and probably more, vulcanian explosions from the volcano's summit. Lightning was seen, and near-continuous thunder was heard during this eruption. Satellite imagery suggested that the ash cloud reached over 9 km and mostly traveled E and SE. However, all of Montserrat received some light ashfall as part of the ash cloud spread to the N. Reports of ashfall in Guadeloupe and Antigua were also received. The following night, heavy rain washed away most of the ash in Montserrat. Observations of the lava dome after the explosion showed that virtually all of the new dome, growing since November 1999, had collapsed and some of the interior of the old dome had been eroded.
On 24 March observations of the scar confirmed that a new spine of lava had been extruded over the vent area. In addition, excellent views of the lava dome on 31 March showed blocky growth in the base of the scar with abundant steaming from around the dome. The new dome was estimated to be 150 m wide and about 100 m high; three small spiny lobes could be seen on top of the new growth. By 20 April the dome's volume was estimated to be 12 to 15 million m3. The average growth rate was 5-6 m3/s, which was higher than the rate in December and July (above ~3 m3/s: BGVN 25:01). Two areas of active growth were noted; one on the dome's S side, and another on its E side. The highest point on the new lava dome was measured at 848 m above sea level, which means the new lava dome had a total height of ~120 m.
Between 28 April and 5 May there was a significant increase in both hybrid and long-period earthquakes. About half of the long-period earthquakes recorded immediately preceded rockfalls, and visual observations confirmed that these events comprised powerful, vertical ash emissions immediately prior to the start of the rockfall. The nature of the seismicity indicated increased levels of pressure within the upper conduit and lava dome. The main dome growth area was on the dome's NE flank. The increased activity culminated on 6 May when there was a moderate collapse of several million m3 of rock from the dome's NE flank. The pyroclastic flows generated from the collapse traveled down Tar River Valley and the longest flows just reached the sea. Observations on 12 May revealed refilling of the small scar created by the 6 May collapse. As of 26 May growth was concentrated in the dome's NE side, with indications that it may move towards the SE. Also, between 19 and 26 May a continuous, low-level ash plume visible in GOES 8 imagery emanated from the volcano.
Information Contacts: Montserrat Volcano Observatory (MVO), Mongo Hill, Montserrat, West Indies (URL: http://www.mvomrat.com/).
Dome growth continues, reaches 950 m high during May-July 2000
This report covers activity from 26 May to 21 July 2000. During this interval, the lava dome continued to grow; however, between 26 May and 2 June, the direction of the dome's growth changed. Although it continued to grow vertically, the majority of growth appears to have redirected from the E and NE to the S and possibly the W.
Visual observations were severely limited due to clouds throughout the early part of this period. However, during the week of 23-30 June a "rough, spiny area" appeared high on the E face of the dome at the top of the Tar River Valley. The week of 9-16 June, the dome grew to about 914 m. By 25 June, the dome had surpassed the height attained prior to the 20 March 2000 collapse. During this event, instruments for measuring dome volume were damaged. Observations from 30 June through 7 July showed that the area of dome growth had changed to a more slab-like appearance. A new area of spiny growth was first seen on 10 July. This growth appeared on the NE flank at 940 m elevation, which was thought to be the highest point on the dome. On 17 July, a large area of new growth was reported on the S and W sectors of the dome, attaining a height of 950 m.
Pyroclastic flows were reported to the ENE in the Tar River, between 9 and 16 June. The following week, pyroclastic flows were reported in the Gages valley to the W. Additional pyroclastic flows during the week of 7 July went NE into the upper Tar valley; some, if not all, of the flow material originated from the remains of the 1995-98 dome. On 21 July at 0620, there was a small pyroclastic flow with an explosive start. During an observation flight later that day, evidence of pyroclastic flows was observed to the SW in the upper region of the White River valley.
Rockfalls occurred throughout the reporting period (table 34). However, the week of 23 to 30 June was characterized by nearly constant rockfalls and small pyroclastic flows. These rockfalls were concentrated on the E side of the dome and talus accumulated much more slowly to the S above the White River. Prior to this, during the week of 9 to 16 June, the rockfalls occurred almost exclusively in the Tar River valley. During 30 June to 14 July, rockfalls occurring to the E of the dome were infrequent despite the presence of large blocks at the top of the steep E slope. The majority of the rockfall events at this point were occurring to the S and to the W of the dome.
Table 34. Seismic data for Soufriere Hills during 26 May-21 July 2000. Courtesy of MVO.
| Week | Rockfall signals | Hybrid | Volcano-tectonic | Long-period | Total |
| 26 May-02 Jun 2000 | 131 | 54 | 3 | 2 | 190 |
| 02 Jun-09 Jun 2000 | 243 | 172 | 1 | 78 | 494 |
| 09 Jun-16 Jun 2000 | 326 | 49 | 1 | 76 | 452 |
| 16 Jun-23 Jun 2000 | 147 | 11 | 1 | 77 | 236 |
| 23 Jun-30 Jun 2000 | 315 | 4 | 4 | 157 | 480 |
| 30 Jun-07 Jul 2000 | 264 | 47 | 1 | 114 | 426 |
| 07 Jul-14 Jul 2000 | 131 | 103 | 5 | 68 | 307 |
| 14 Jul-21 Jul 2000 | 189 | 24 | 4 | 15 | 232 |
Seismic records (table 1) revealed a sharp increase in the number of long-period (LP) earthquakes after 2 June. The frequency of LP events continued to increase until its peak during 23-30 June. This same week marked the low point in the number of hybrid earthquakes. The number of volcano-tectonic earthquakes increased towards the end of the reporting period.
A steady production of ash during the week of 9-16 June maintained a dilute ash plume that moved W towards Plymouth and off the coast. Neither this ash plume nor the smaller ash clouds produced by rockfalls during the preceding weeks affected the inhabited parts of the island. During the week of 30 June to 7 July, abundant steaming was observed on the W flanks of the dome. The following week, steaming occurred on the N side between the main masses of the old dome. During this same week, ash venting was also observed from the S side of the dome.
The sharp increase in the number of LP and hybrid earthquakes after 2 June was taken to indicate increasing pressure in the dome. In addition, the dome's filling in of the crater on all sides suggests that rockfalls and pyroclastic flows will increase in the future. These events are expected to affect not only the Tar River valley, but also several other surrounding valleys, particularly Tuitt's Ghaut, White River valley, and Gages valley. These observations also lead to increased concern over the possibility of a substantial dome collapse in the near future.
Information Contacts: Montserrat Volcano Observatory (MVO), Mongo Hill, Montserrat, West Indies (URL: http://www.mvomrat.com/).
Rockfalls and pyroclastic flows, dome growth rate increases
Dome growth continued throughout 21 July-6 October 2000 largely on the S and E flanks of the volcano. Poor weather hampered observations in late July, but during the week of 4-11 August a large ~30-m-high spine was visible on top of a conical mound of new lava. The top of the spine was at ~980 m elevation, substantially higher than the remnants of the 1995-98 dome. By 19 August, the top attained a peak elevation of 1,043 m. When observed again on 20 September, the spine was no longer steeply inclined but was gently inclined to the E. On 24 September a large new spine with near-vertical inclination was seen. A smaller spine on 27 September had an elevation of 1,032 m, and on 28 September a very large, near-vertical spine was seen on the E side of the summit. The latter dominated the E part of the summit during the following week, changing its size and shape throughout that period. By 30 September the top had an elevation of 1,054 m, the highest measurement taken on the dome to date.
The level of seismicity increased substantially after 4 August (table 35) with rockfalls and long-period earthquakes being dominant. Rockfalls were concentrated on the E and S sides of the dome and were almost continuous at times. Subsequent to the increased seismicity, rockfalls caused small ash clouds, reaching up to 3,000 m in height and drifting W. Following the passage of a tropical storm on 21-22 August, unusual wind directions blew some ash to the N of the island. A mudflow down the Belham valley during the early afternoon of 22 August followed two main paths in the lower reaches of the valley, N and S of the golf course. Debris was deposited on the Belham bridge, and the beach at Old Rod Bay was extended further out to sea.
Table 35. Seismic and gas data for Soufriere Hills during 21 July to 6 October 2000. The HCL/SO2 ratio was determined from FTIR data; SO2 flux (metric tons/day) is from COSPEC (* indicates data from specific days of the indicated week). Courtesy of MVO.
| Week | Rockfall | Hybrid | Volcano-tectonic | Long-period | Total | Ratio HCl/SO2 | Avg. Daily SO2 (tons/day) |
| 21 Jul-28 Jul 2000 | 217 | 45 | 5 | 17 | 284 | -- | -- |
| 28 Jul-04 Aug 2000 | 220 | 44 | 2 | 14 | 280 | -- | -- |
| 04 Aug-11 Aug 2000 | 296 | 24 | 2 | 42 | 364 | 1.5-2.5 | ~400 |
| 11 Aug-18 Aug 2000 | 257 | 41 | 19 | 119 | 436 | -- | -- |
| 18 Aug-25 Aug 2000 | 277 | 39 | 4 | 63 | 383 | -- | ~280 |
| 25 Aug-01 Sep 2000 | 390 | 71 | 1 | 55 | 517 | -- | 1460-2240* |
| 01 Sep-08 Sep 2000 | 872 | 106 | 43 | 110 | 1131 | -- | 1390-2570* |
| 08 Sep-15 Sep 2000 | 411 | 21 | 7 | 44 | 483 | -- | 541-890* |
| 15 Sep-22 Sep 2000 | 386 | 50 | 5 | 50 | 491 | 2.37 | 446-630* |
| 22 Sep-29 Sep 2000 | 665 | 28 | -- | 66 | 759 | -- | 369* |
| 29 Sep-06 Oct 2000 | 169 | 29 | 16 | 25 | 239 | -- | 790-948* |
Small pyroclastic flows were reported on 27 July, 6-7 August, and during the weeks of 15-22 September and 29 September-6 October. The resulting deposits were mostly confined to the Tar River Valley on the E flank, although minor new deposits were seen in the upper reaches of the White River valley. Several small explosions also occurred during the week of 15-22 September. On 19 August a small burst of incandescent gas was observed near the summit of the dome followed by glowing rocks that tumbled down the E face. On 8 and 14 September, a near-continuous rockfall of incandescent material was observed going down the E face of the dome above the Tar River valley; this activity continued to be observed through early October.
Gas monitoring resumed during the week of 4 August using the Cambridge FTIR instrument to measure the ratios of gases in the volcanic plume (table 35). The measured ratio of HCl to SO2, between 1.5 and 2.5, was about twice the values measured earlier in the year. This is indicative of an increase in extrusion rate since January 2000 and corroborates evidence from visual observations suggesting an increase in the dome growth rate. Gas monitoring also resumed on 24 August with the COSPEC on loan from the Geological Survey of Canada.
Information Contacts: Montserrat Volcano Observatory (MVO), Mongo Hill, Montserrat, West Indies (URL: http://www.mvomrat.com/).
Dome growth, rockfalls, and pyroclastic flow continue through March 2001
Dome growth continued from 7 October 2000 through 9 March 2001. Until the end of February 2001, the growth occurred predominantly on the E side of the volcano. However, on 25 February, the direction of the growth and the character of the seismicity changed markedly; the dome growth shifted towards the S, and the weekly number of hybrid earthquakes increased by more than an order of magnitude. During this entire period, residents were advised of the potential dangers associated with pyroclastic flows and advised to avoid the Belham valley during periods of heavy rain. Access to Plymouth, Bramble airport, and beyond was prohibited, and a maritime exclusion zone was declared around the S part of the island extending 3.3 km beyond the coastline. Since November 1999, the dome has grown at an average rate of nearly 3 m3/sec and is now at its largest size since the eruption began in 1995, with a total volume of over 120 x 106 m3 and an elevation greater than 1,000 m.
Recent MVO assessment. A summary assessment of the volcano's activity, status, and related risks covering the period from April 2000 through January 2001 was published recently by MVO. A significant finding from this assessment was: "While one prognosis is for at least a few more years of such eruptive activity, an eruption duration measured in decades has to be contemplated." Other extracts from the report are presented below.
"The period July 1995 to March 1998 was the first phase of the present eruption. A lava dome grew . . . accompanied by several hazardous phenomena.... There was then a second phase... from March 1998 to November 1999. In this phase, no significant dome growth was detected, but hazardous activity continued . . . . Dome growth resumed in November 1999... [and] represents a third phase of the eruption."
"The seismic monitoring detected relatively intense periods of rockfall and long-period (LP) activity... from August to October [2000]... and from mid-November 2000 [to January 2001].... There appears to be an underlying 14-week cycle to this type of seismic activity.... However, hybrid swarms have been rare and weak by comparison with 1997 activity. Although their generation mechanisms are still poorly understood, hybrid earthquakes may be related to fracturing of plugs that form in the conduit, and their absence suggests that conduit conditions may now be subtly different from previous stages...."
"Based on the seismic evidence, the growth of the latest... dome seems to have been different in some respects.... The only current prognostic feature in the observable seismicity is the weak 14-week cycle."
"Volcanic gases continue to be routinely monitored. The flux of sulphur dioxide over the last ten months has maintained quite high levels.... Occasional measurements of chlorine flux indicate that the flux of chlorine relative to sulphur dioxide increases... when the dome is growing."
"Two key changes have affected the morphology of the volcano since 1998... which have important implications for hazards.... Two remnants of the 1995-1998 dome remain adjacent to the northern wall of English's Crater. Over the last year, a narrow gap between the two remnants has gradually widened and deepened.... This deep gully is expected to provide a path for potential collapses on that side of the dome. Since 1997, Mosquito Ghaut has been in-filled by pyroclastic-flow and rockfall deposits and no longer exists as a pathway to channel future pyroclastic flows away to the [NE]. Thus, collapses moving down the outlet gully will run in a generally northerly direction, and these topographic changes mean that pyroclastic flows towards the north are now much more likely to be channeled into the Belham Valley...."
"The group considered the possibility of tsunami hazards that might affect other Caribbean islands. Based on modeling studies carried out by French colleagues a collapse of the current dome... into the sea is not expected to generate a tsunami sufficiently large to affect other islands. However, new data... show that there have been several very large edifice failures of the Soufriere Hills Volcano in its geological past. Another collapse of such size would cause a significant regional tsunami hazard. Thus, any precursory signs of a major edifice failure should continue to be watched for in the monitoring [program]."
"The duration of the eruption of the Soufriere Hills Volcano now exceeds about 85% of all documented dome eruptions worldwide. Most dome eruptions last only a few years, but some have durations measured in decades. Examples of the latter kind of dome eruption include the Bezymianny volcano in Kamchatka, Russia, which started to erupt in 1956 and is still active, and the Santiaguito dome in Guatemala, which started to erupt in 1923 and is also still active."
"There is currently a lack of clarity about the legal responsibilities and obligations of the MVO... [and other official organizations] in relation to providing warnings of detected ash injections to civil aviation authorities. The group recommends that HMG [Her Majesty's Government] investigate as a matter of urgency where responsibility lies and what [organization] should issue such warnings."
Activity since 6 October 2000. Until the end of 2000 the summit was dominated by a broad lava spine inclined at a steep angle towards the E. On 25 October the spine had a peak elevation of 1,030 m and by 13 November had grown to 1,077 m, the greatest height measured throughout the eruption. On 5 December the top of the spine was at 1,060 m, while the flat top of the main dome was between 1,020 and 1,030 m. By the end of December the spine had grown back to 1,071 m. Two large near-vertical spines were observed on 4 February 2001, but both had collapsed by the following week. A large stubby spine visible in the S part of the summit area on 22 February rose to 1,068 m.
Rockfalls took place throughout the period. Until 25 February 2001, these traveled predominantly down the E or NE side of the dome, and occurred typically in numbers of hundreds per week (table 36). Some of these glowed and occasionally produced small ash clouds, but none reached altitudes greater than 3,000 m. These rockfalls contributed to an accumulating talus fan in the upper reaches of the Tar River valley. The talus began to bury the remnant buttress of older dome material on the NE flank that formed during the 1995-98 growth phase. Rockfalls that occurred after 25 February traveled predominantly S of the dome, mainly in the upper reaches of the White River valley. (N.B. The White River is sometimes confused with White's Ghaut, which lies to the N of the dome.)
Table 36. Seismic and gas data from the Soufriere Hills during 20 October 2000 to 9 March 2001; not every week had reported data. Courtesy of MVO.
| Week | Rockfall | Hybrid | Volcano-tectonic | Long-period | Range of Average Daily SO2 (tons/day) |
| 20 Oct-27 Oct 2000 | 214 | 9 | 4 | 35 | 235-2252 |
| 27 Oct-03 Nov 2000 | 146 | 20 | 3 | 19 | -- |
| 10 Nov-17 Nov 2000 | 207 | 33 | 7 | 144 | -- |
| 24 Nov-01 Dec 2000 | 491 | 13 | -- | 69 | 1020 (28 Nov) |
| 01 Dec-08 Dec 2000 | 547 | 15 | 1 | 72 | -- |
| 15 Dec-22 Dec 2000 | 423 | 12 | 1 | 74 | 400 (20 Dec) |
| 22 Dec-29 Dec 2000 | 708 | 10 | 2 | 53 | 745-1100 |
| 12 Jan-19 Jan 2001 | 943 | -- | -- | 54 | 345 (18 Jan) |
| 19 Jan-26 Jan 2001 | 417 | 1 | -- | 55 | 330-350 |
| 26 Jan-02 Feb 2001 | 313 | 8 | 21 | 45 | 105-360 |
| 02 Feb-09 Feb 2001 | 409 | 5 | 1 | 40 | 180-500 |
| 09 Feb-16 Feb 2001 | 500 | 2 | 1 | 15 | 80-670 |
| 16 Feb-23 Feb 2001 | 486 | 18 | 6 | 53 | 210-720 |
| 23 Feb-02 Mar 2001 | 729 | 388 | 3 | 58 | 180-1400 |
| 02 Mar-09 Mar 2001 | 629 | 280 | 4 | 45 | 100-1230 |
Pyroclastic flows were also produced throughout the period. A small one on 15 November 2000 traveled N from the summit, entered the upper reaches of Tyre's Ghaut, and reached ~1 km away from the dome. On 17 November pyroclastic-flow deposits were noted in the upper reaches of Tuitt's Ghaut and White's Ghaut on the volcano's NE side; this was the first new dome material to have traveled down the notch between the N and NE lobes from the 1995-98 dome. By 8 December 2000 the notch between the central and NE buttresses of the 1995-98 dome was 60 m wide. Another small flow occurred down the White River valley on 1 February 2001 and traveled about 1 km from the dome. On 8 February 2001 new pyroclastic-flow deposits had formed in the upper portion of Tuitt's Ghaut up to ~300 m from the dome. By mid-February new pyroclastic-flow deposits had also formed down the Tar River on the E flank, and, by 23 February, had reached as far as the old coastline. New deposits were also seen by 23 February in the S White River valley just 50 m short of the coastline.
On 25 February 2001 a pyroclastic flow spread over the N and central parts of the White River fan. A hybrid earthquake swarm occurred after this collapse (table 36). Subsequently, small pyroclastic flows traveled into the upper portion of the White River valley and were accompanied by banded tremor and weak hybrid earthquakes. By 9 March steady dome growth appeared to have resumed.
Seismicity and COSPEC measurements of SO2 are presented in table 36. The SO2 data are in the range of average daily values (in metric tons/day) measured during the report week and include the range of data obtained from both helicopter and static mounted sensors.
Information Contacts: Montserrat Volcano Observatory (MVO), Mongo Hill, Montserrat, West Indies (URL: http://www.mvomrat.com/).
29 July dome collapse and rockfalls
This report covers the interval from 9 March to 17 August 2001 and chronicles ongoing dome growth, including a vigorous episode of dome collapse and mass wasting on 28-29 July. As reported in BGVN 26:02, on 25 February 2001, the direction of the continuing dome growth changed markedly, shifting its predominant growth from the volcano's E side towards the S side. Then, as also reported in the Bulletin, the character of the seismicity changed dramatically in early March with the number of hybrid earthquakes exceeding 300/week (table 37). However, by mid-March, seismic activity had decreased significantly. Dome growth with attendant rockfalls, pyroclastic flows, and ash clouds continued at low levels until early-May. A small pyroclastic flow occurred on 9 May and traveled ~2.5 km down the White River to the S of the dome. The number of rockfalls increased substantially in the following week and remained at higher levels until early August. Observations during the week of 11-18 May indicated that the main dome growth was still concentrated in the S sector of the dome, and a lobe of new lava was observed over Galway. Reports from the week of 8-15 June noted that the summit over Galway appeared to contain the highest point on the dome.
Table 37. Seismic and SO2 data from Soufriere Hills during 16 February to 17 August 2001. Courtesy of MVO.
| Week | Rockfall | Hybrid | Volcano-tectonic | Long-period | Range of Average Daily SO2 (tons/day) |
| 16 Feb-23 Feb 2001 | 486 | 18 | 6 | 53 | 210-720 |
| 23 Feb-02 Mar 2001 | 729 | 388 | 3 | 58 | 180-1400 |
| 02 Mar-09 Mar 2001 | 629 | 280 | 4 | 45 | 100-1230 |
| 09 Mar-16 Mar 2001 | 294 | 4 | 0 | 23 | 360-460 |
| 16 Mar-23 Mar 2001 | 84 | 5 | 2 | 8 | 120-190 |
| 23 Mar-30 Mar 2001 | 33 | 5 | 3 | 1 | 200-275 |
| 30 Mar-06 Apr 2001 | 62 | 18 | 1 | 1 | 200-370 |
| 06 Apr-13 Apr 2001 | 52 | 9 | 6 | 3 | 40-520 |
| 13 Apr-20 Apr 2001 | 54 | 48 | 1 | 9 | 20-70 |
| 20 Apr-27 Apr 2001 | 31 | 10 | 1 | 2 | 100-250 |
| 27 Apr-04 May 2001 | 98 | 10 | 3 | 7 | 130-220 |
| 04 May-11 May 2001 | 104 | 34 | 6 | 22 | 80-180 |
| 11 May-18 May 2001 | 240 | 17 | 1 | 31 | 170 |
| 18 May-25 May 2001 | 237 | 26 | 0 | 109 | 700 |
| 25 May-01 Jun 2001 | 266 | 36 | 3 | 383 | 90-370 |
| 01 Jun-08 Jun 2001 | 224 | 25 | 6 | 164 | 130-320 |
| 08 Jun-15 Jun 2001 | 373 | 71 | 0 | 169 | 770-1410 |
| 15 Jun-22 Jun 2001 | 462 | 11 | 1 | 77 | 460-630 |
| 22 Jun-29 Jun 2001 | 299 | 1 | 0 | 26 | 860 |
| 29 Jun-06 Jul 2001 | 295 | 4 | 1 | 28 | 120 |
| 06 Jul-13 Jul 2001 | 297 | 7 | 0 | 38 | 347 |
| 13 Jul-20 Jul 2001 | 719 | 5 | 2 | 57 | 709-943 |
| 20 Jul-27 Jul 2001 | 706 | 8 | 1 | 30 | 339-854 |
| 27 Jul-03 Aug 2001 | 453 | 15 | 0 | 67 | -- |
| 03 Aug-10 Aug 2001 | 258 | 13 | 2 | 13 | 680-950 |
| 10 Aug-17 Aug 2001 | 186 | 6 | 3 | 3 | -- |
Two notable events occurred during the week of 29 June-6 July. First, on the morning of 30 June, there were prolonged rockfalls that involved ~0.5 x 10⁶ m3 of material transported down the N side of the talus apron in the Tar River valley. Second, on the evening of 4 July, two small pyroclastic flows passed down the W flank of the volcano in the Amersham area, stopping ~1 km short of the sea. Following the pyroclastic flows in the Amersham area, the daytime entry zone (DETZ) was closed until further notice and has remained that way through at least 17 August.
Lava dome collapse. Shortly after 1700 on 29 July, a large pyroclastic flow passed down the Tar River valley on the volcano's E flank and a continuous, dense plume of ash developed and blew W. Pyroclastic-flow output increased gradually over the next three hours, with many of the flows reaching the sea. The downwind plume deposited substantial amounts of wet ash with accretionary lapilli over the residential areas of Salem, Isles Bay, and Olveston.
Pyroclastic-flow activity peaked at ~1950, when surge clouds associated with the largest flow moved out over the sea, followed by rock fragments falling over a wide area in the NW of the island in the sector between Salem and St. Peters. Some fragments were pumiceous, although the majority consisted of angular, dense lithic fragments generally less than a few centimeters in size, but with maximum dimensions of 6 cm. A second peak in pyroclastic-flow output took place shortly after 2200, when another large flow entered the sea and extended out from the shore for 0.5 km or more and rock fragments fell in the Salem area again. After about 0200 on 30 July seismic signals indicated that this dome collapse had largely finished, and the activity level declined rapidly. The ash plume from the collapse dispersed for considerable distances to the NW. Ash was deposited as far away as Puerto Rico and the Virgin Islands.
Observation flights indicated that a large portion of the dome had collapsed. The general summit region dropped ~150 m and there was a complex, amphitheater-shaped scar several hundred meters deep incised into the core of the dome at the head of the Tar River valley. Within this scar, a new dome began extruding. Observations indicated that minor pyroclastic flows also occurred in the upper reaches of White's, Tuitt's, and Gages ghauts, and also on the southern flanks of the dome in the upper reaches of White River. The main pyroclastic flows in the Tar River were highly erosive; they incised a deep canyon extending across the delta region to the shore and split the delta into two distinct lobes. Analysis of seismic data indicated that the two most intensive periods of pyroclastic-flow activity were associated with explosive events related to the collapse of the largest fragments of the dome.
Reports after 3 August noted that activity at Soufriere Hills was at a low level, and it continued that way to the end of the reporting period (17 August). Small-scale rockfalls and minor pyroclastic flows occurred, but clear views of the upper parts of the volcano were hampered by clouds. Occasional views of the dome noted that it was continuing to grow in the scar produced by the 29 July collapse.
Information Contacts: Montserrat Volcano Observatory (MVO), Mongo Hill, Montserrat, West Indies (URL: http://www.mvo.ms/).
Small-scale dome collapses and pyroclastic flows through February 2002
The Montserrat Volcano Observatory (MVO) reported that during 17 August 2001 through at least 1 February 2002 at Soufriere Hills, a new lava dome continued to grow within the scar produced from the 29 July 2001 partial dome collapse (BGVN 26:07). Activity generally increased at Soufriere Hills during mid-September through November 2001, and remained at a high level through at least 1 February 2002 (table 38).
Table 38. Seismic and SO2-flux data from Soufriere Hills during 17 August 2001 to 1 February 2002. Courtesy of MVO.
| Date | Rockfall | Long-period / Rockfall | Long-period | Hybrid | Volcano-tectonic | SO2 flux (metric tons/day) |
| 17 Aug-24 Aug 2001 | 189 | 1 | 36 | 149 | 0 | Not Reported |
| 24 Aug-31 Aug 2001 | 200 | 1 | 6 | 19 | 11 | 25 Aug: 68; 28 Aug: 151 |
| 31 Aug-07 Sep 2001 | 218 | 2 | 31 | 8 | 4 | 31 Aug: 242; 01 Sep: 86 |
| 07 Sep-14 Sep 2001 | 228 | 0 | 28 | 65 | 1 | 13 Sep: 543 |
| 14 Sep-21 Sep 2001 | 211 | 4 | 36 | 522 | 3 | avg 200-2000 |
| 21 Sep-28 Sep 2001 | 297 | 7 | 16 | 326 | 12 | 100-600; avg 250 |
| 28 Sep-05 Oct 2001 | 202 | 2 | 26 | 451 | 0 | 01 Oct: 418 |
| 05 Oct-12 Oct 2001 | 285 | 7 | 34 | 20 | 1 | 10 Oct: 388 |
| 12 Oct-19 Oct 2001 | 207 | 2 | 6 | 9 | 1 | 18 Oct: 320 |
| 19 Oct-26 Oct 2001 | 208 | 2 | 3 | 46 | 0 | 22 Oct: 574; 23 Oct: 48424 Oct: 292; 25 Oct: 200 |
| 26 Oct-02 Nov 2001 | 284 | -- | 8 | 46 | 2 | 77-385; avg 233; 26 Oct: 611 |
| 02 Nov-09 Nov 2001 | 314 | 8 | 5 | 174 | 4 | 05 Nov: 134 |
| 09 Nov-16 Nov 2001 | 149 | 4 | 20 | 116 | 2 | 13 Nov: 521; 15 Nov: 450 |
| 16 Nov-23 Nov 2001 | 251 | 45 | 115 | 413 | -- | 19 Nov: 140; 20 Nov: 119 |
| 23 Nov-30 Nov 2001 | 435 | 82 | 145 | 193 | -- | <100 avg |
| 30 Nov-07 Dec 2001 | 363 | 37 | 58 | 128 | -- | Not Reported |
| 07 Dec-14 Dec 2001 | 551 | 97 | 95 | 80 | -- | 11 Dec: 158 |
| 14 Dec-21 Dec 2001 | 858 | 42 | 57 | 25 | -- | 19 Dec: 181 |
| 21 Dec-28 Dec 2001 | 1012 | 45 | 75 | 75 | -- | 27 Dec: 851 |
| 28 Dec-04 Jan 2002 | 911 | 69 | 103 | 21 | -- | 250-1000, avg 457 |
| 04 Jan-11 Jan 2002 | 939 | 81 | 87 | 24 | -- | 08 Jan: 898; 10 Jan: 1122 |
| 11 Jan-18 Jan 2002 | 741 | 29 | 52 | 7 | -- | Not Reported |
| 18 Jan-25 Jan 2002 | 471 | 68 | 70 | 9 | -- | 22 Jan: 700 |
| 25 Jan-01 Feb 2002 | 610 | 67 | 140 | 8 | -- | Not Reported |
Throughout the report period, the new dome produced pyroclastic flows and rockfalls that traveled E to the upper and middle reaches of the Tar River Valley. Small-scale lava dome collapses generated pyroclastic flows almost continuously, with flows entering the sea on 4, 5, and 14 October, 2 and 28 December 2001, and 5 and 12 January 2002. Dense ash plumes associated with sea entry and ash venting from the summit generally drifted W and reached up to 3.0 km altitude (table 39). During mid-October ash clouds drifted to the W and NW and occasionally deposited small amounts of ash on inhabited areas to the N of the island. A new event began on 28 December at 1330 that produced a large area of dense ash observed on satellite imagery below ~3 km a.s.l. Incandescence was observed at the dome on 3 September, during 2-9 and 16-23 November, and on the E and W sides of dome on 26 and 27 December. Mudflows occurred in the Belham Valley on several days during periods of torrential rainfall.
Table 39. Summary of ash emissions at Soufriere Hills seen on satellite imagery during 26 August 2001- 5 February 2002. Courtesy of Washington VAAC.
| Date | Altitude (km) | Direction | Size |
| 26 Aug 2001 | ~2.1 | SW | 28 km long, 9 km wide |
| 05 Sep 2001 | ~1 | W | 160 km long, 28 km wide |
| 07 Sep 2001 | ~summit level | S | -- |
| 16 Sep 2001 | ~summit level | -- | -- |
| 21 Sep 2001 | <1 | WNW | -- |
| 22 Sep 2001 | <1.2 | WNW | 115 km long |
| 24 Sep 2001 | ~1.5 | W | -- |
| 25 Sep 2001 | ~1.5 | W | -- |
| 26 Sep 2001 | ~1.5 | WSW | -- |
| 30 Sep 2001 | <3.0 | W | -- |
| 03 Oct 2001 | ~summit level | WSW | -- |
| 04 Oct 2001 | <1.5 | W | 36 km long, 23 km wide |
| 04 Oct 2001 | <2.4 | WNW | 28 km wide |
| 05 Oct 2001 | <1.5 | -- | -- |
| 06 Oct 2001 | <1.8 | W | 168 km long, 17 km wide |
| 07 Oct 2001 | <1.8 | -- | -- |
| 10 Oct 2001 | ~1.8 | vertically, possibly E | -- |
| 11 Oct 2001 | <1.8 | W | -- |
| 11 Oct 2001 | >2.1 | NW | -- |
| 12 Oct 2001 | <1.8 | W | -- |
| 14 Oct 2001 | ~1.8 | -- | -- |
| 26 Oct 2001 | <2.1 | W | -- |
| 07 Nov 2001 | <1.8 | NW | 32 km long, 7 km wide |
| 07 Nov 2001 | <6.0 | ENE | -- |
| 17 Nov 2001 | <5.2 | NE | -- |
| 18 Nov 2001 | <3.0 | NE | 42 km long, 11 km wide |
| 03 Dec 2001 | ~2.4 | W | -- |
| 08 Dec 2001 | ~1.8 | W | 139 km long |
| 13 Dec 2001 | ~4.0 | WSW | 60 km long, 13 km wide |
| 14 Dec 2001 | -- | WSW | -- |
| 21 Dec 2001 | <2.4 | W | 28 km long, 7 km wide |
| 27 Dec 2001 | 2.1-3.0 | SSE | 22 km wide |
| 27 Dec 2001 | <3.0 | SW | -- |
| 28 Dec 2001 | <3.0 | WNW | 47 km long, 11 km wide |
| 29 Dec 2001 | ~3.0 | WNW | 70 km wide |
| 29 Dec 2001 | <3.0 | W | 129 km long, 16 km wide |
| 01 Jan 2002 | <1.5 | W | 133 km long, 10-24 km wide |
| 02 Jan 2002 | <1.5 | WNW | 125 km long, 10 km wide |
| 05 Jan 2002 | <2.4 | W | -- |
| 08 Jan 2002 | ~1.5, bursts to 2.4 | W | 140 km long |
| 11 Jan 2002 | -- | W | 41 km long, 9 km wide |
| 12 Jan 2002 | <3.0 | WNW | -- |
| 13 Jan 2002 | <2.4 | W | 149 km long |
| 29 Jan 2002 | ~2.4 | W | -- |
| 05 Feb 2002 | 2.4-3.0 | W | -- |
| 05 Feb 2002 | 1.5 | NW | 23 km wide |
| 05 Feb 2002 | 3.0 | W | 17 km wide |
The daytime entry zone (DTEZ), closed after 4 July when two small pyroclastic flows passed down the W flank of the volcano in the Amersham area, reopened on 29 August. However, the Montserrat Volcano Observatory (MVO) warned that activity could still increase quite suddenly, with a dangerous situation developing very quickly. Ash masks were to be worn in ashy conditions, and the Belham Valley was to be avoided during and after heavy rainfall due to the possibility of mudflows. The DTEZ was closed again during 4-11 October due to increased activity.
Morphology of the new lava dome. Observations during August 2001 revealed that the new dome appeared to be growing rapidly and had steep sides and a rugged summit area. During mid-September, MVO reported that the volume of the dome was estimated to be approximately 12 x 106 m3, indicating an average growth rate of ~2.6 m3 per second since the partial dome collapse on 29 July.
On 31 October and 1 November observations revealed that the active lava dome had grown substantially and appeared to switch growth direction from the NE to the E, where a massive, near-vertical headwall had developed. Observations from a helicopter on 8 November revealed that a shallow, circular depression was located over the summit area of the dome, with ash vigorously venting from it. The lava dome's highest point during mid-November was measured on 9 November at 876 m elevation.
During mid-November, lava-dome growth shifted from the E to the W, and the summit area was crowned by spines with an average elevation of 940 m. An elevation of 968 meters was measured on one spine, although one other stood higher. By the end of November, MVO reported these elevations: the dome complex consisting of the stagnant E lobe (870 m), an inactive central lobe (930 m), and the active W lobe (960 m on 27 November). The W lobe had produced several small spines, which collapsed and were replaced by new spines.
Observations of the lava dome on 16 December revealed that although it had not increased noticeably in height, it had increased in volume since November. The top of the dome had developed a broadly rounded and blocky appearance. Most of the growth appeared to occur on the W side of the dome, but rockfalls and small pyroclastic flows also occurred on the E and S flanks.
Observations on 10 January revealed that the summit dome had increased in volume considerably during the previous several weeks and that it was broad with several spines projecting upward. The highest spine reached 1,015 m elevation on 12 January. A large lobe was again active on the upper E flank of the dome, just below the summit level. The W side of the dome appeared to have been inactive for some time, judging from the general weathered appearance and deposits of sulphur. Survey measurements also indicated that the saddle area between the NE and central buttresses lowered by about 20 m during the previous weeks due to rockfall and pyroclastic-flow activity.
On 21 January the dome was crowned by a large 40- to 50-m tall spine inclined steeply upwards towards the E. Although the number of rockfalls gradually decreased over the previous 3 weeks, their size and duration significantly increased during 18-25 January. Rockfalls during that interval yielded seismic signals whose total energy rates exceeded those seen during the previous few months.
Activity of the new lava dome. Lava-dome collapses consisting of 10-15% of the dome's volume occurred on the N side of the dome on 4 and 5 October. On 14 October, after a day of torrential rainfall, several million cubic meters of unconsolidated talus was destabilized on the SE flank of the pre-July 29 dome. Seismic data suggested that the event began at about 1715, peaked at 2245, and ended at about 2300. Ash from the event fell in residential areas on Montserrat to the NW.
On the morning of 16 October a collapse occurred on the S flank of the dome complex, producing numerous pyroclastic flows that traveled W down the White River and reached about two-thirds of the distance to the sea. This collapse involved a substantial amount of unconsolidated talus flanking the pre-July 29 dome; but the actual volume was unknown because clouds prevented observation of the summit region. Small pyroclastic flows also occurred on 2, 4, and 6 December in the upper reaches of White River, originating from the old dome material closest to Chances Peak.
On 31 October and 1 November several small pyroclastic flows were generated by material avalanching off the E flank of the dome. By mid-November, activity had shifted to be mainly concentrated on the W side of the active area. On 2 December pyroclastic flows again originated in several places along the E face of the new lava dome.
A large pyroclastic flow occurred on the night of 14 November; it traveled E and reached the lower parts of the Tar River Valley, stopping a few hundred meters short of the delta. During 1330-1500 on 28 December, several million cubic meters of volcanic material collapsed down the volcano's NE flank, generating a dense W-drifting ash plume that deposited up to a centimeter of ash in the vicinity of Plymouth (~4 km W of the summit).
Seismicity. Weak banded tremor, which indicates rapid magma ascent, began in the early hours of 14 August and continued to strengthen through 22 August. Bands of tremor continued at irregular intervals through mid-November, appearing with periodicities generally ranging between 10 and 27 hours. During these banded-tremor events, rockfall activity and ash venting increased. On 26 August, a particularly vigorous period of ash venting lasted for ~1 hour and sent W-drifting ash up to ~2 km above the volcano. A weak swarm of volcano-tectonic earthquakes (less than M 1) occurred during 29-31 August. During mid-September the bands of tremor occurred about every 13 hours and were slightly more intense when compared with those of the previous week. In addition, the number and strength of hybrid events associated with these tremor episodes increased, which is a pattern consistent with the moderate rate of dome-growth and periods of vigorous degassing.
Continuous low-amplitude tremor was accompanied by increased rockfall activity during 12-14 September. Ash clouds produced from rockfalls rose slightly above the summit and were visible in satellite imagery. Rockfall signals were intense on 9 and 10 November, but then declined significantly and remained low after 12 November. A swarm of hybrid and long-period earthquakes began on 14 November and reached a peak on 21 November, before declining slightly, although the swarm continued to be moderately energetic through the end of the month. An M 3.6 earthquake located just off the NW coast of Montserrat occurred on 29 November at 1248 and was felt throughout the island.
Rockfalls continued through December, and many were preceded by a few seconds of long-period earthquakes. Continuous, weak tremor recorded on 13 December was associated with ash venting, and produced columns that rose to at least 4 km. Periods of intense cyclical rockfalls occurred on 27 December and coincided with weak swarms of hybrid earthquakes. These hybrids were too small to trigger the seismic-event-detection system, and are therefore not included in the count of hybrid earthquakes given in table 39.
Information Contacts: Montserrat Volcano Observatory (MVO), Mongo Hill, Montserrat, West Indies (URL: http://www.mvo.ms/); Washington Volcanic Ash Advisory Center (VAAC), Satellite Analysis Branch (SAB), NOAA/NESDIS E/SP23, NOAA Science Center Room 401, 5200 Auth Road, Camp Springs, MD 20746, USA (URL: http://www.ospo.noaa.gov/Products/atmosphere/vaac/).
Rockfalls and pyroclastic flows originate from growing lava dome
During mid-August 2001 through February 2002 at a new lava dome continued to grow at Soufriere Hills. Small-scale dome collapses generated pyroclastic flows almost continuously, with some reaching and entering the sea on several occasions. Dense ash plumes associated with sea entry and ash venting from the summit generally drifted W and reached up to 3 km altitude. Mudflows occurred in the Belham Valley on several days during periods of torrential rainfall (BGVN 27:01). The lava dome continued to grow during February through at least mid-May 2002. Minor episodes of ash venting occurred from the summit of the dome, and at times incandescence was visible. The dome produced numerous rockfalls and small pyroclastic flows in the upper reaches of the Tar River Valley. SO2 flux rates reached up to 1,200 metric tons per day (table 40).
Table 40. Seismic and SO2-flux data from Soufriere Hills during 1 February-10 May 2002. Courtesy of MVO.
| Date | Rockfall | Long-period / Rockfall | Long-period | Hybrid | Volcano-tectonic | SO2 flux (metric tons/day) |
| 01 Feb-08 Feb 2002 | 897 | 64 | 85 | 16 | -- | 06 Feb: 160-380; 07 Feb: 665-790 |
| 08 Feb-15 Feb 2002 | 734 | 69 | 83 | 17 | 1 | 09-12 Feb: 150-420; 14 Feb: 350-650 |
| 15 Feb-22 Feb 2002 | 786 | 75 | 74 | 17 | -- | 16 Feb: 600-780; 19 Feb: 90-130 |
| 22 Feb-01 Mar 2002 | 1013 | 124 | 101 | 5 | -- | -- |
| 01 Mar-08 Mar 2002 | 415 | 49 | 56 | 10 | -- | 60-130 |
| 08 Mar-15 Mar 2002 | 779 | 67 | 92 | 6 | -- | 40-860 |
| 15 Mar-22 Mar 2002 | 1002 | 108 | 162 | 3 | 2 | 395-1035 |
| 22 Mar-29 Mar 2002 | 935 | 80 | 123 | 3 | -- | 1100-1200 |
| 12 Apr-19 Apr 2002 | 841 | 52 | 65 | 6 | -- | ~1200 |
| 19 Apr-26 Apr 2002 | 990 | 66 | 114 | 31 | 1 | ~1200 |
| 26 Apr-03 May 2002 | 741 | 33 | 76 | 42 | 2 | ~600 |
| 03 May-10 May 2002 | 557 | 40 | 82 | 13 | -- | -- |
During flights on 4, 5, and 6 February new pyroclastic-flow deposits were observed in the Tar River to the E (with some flows reaching the sea) and in the White River to the S, derived from the collapse of remnant talus material from the pre-29 July 2001 dome (BGVN 26:07). An observation flight on 14 February revealed minor rockfalls of old, inactive dome material in the upper part of the Gages region. Near-continuous rockfalls and minor pyroclastic flows occurred on the E flank. Minor rockfalls on the N flank of the active dome cascaded between the NE and central buttresses of the older inactive dome.
Activity increased beginning on the evening of 8 March. Small ash clouds (reaching ~2.1 km) arising from small collapses drifted to the W over the Plymouth and Richmond Hill area, although most of the ash fallout occurred over the sea. For a couple days during late March weak winds dispersed the ash towards the NW and N, depositing it over the main populated areas. Large spines on the dome during mid-March periodically collapsed, producing pyroclastic flows down the E flank, some of which reached the Tar River Fan. By late March minor amounts of rockfall debris from the NE flank of the dome had begun to spill into the head of Tuit's Ghaut. Ash venting appeared to have been from a pit-like depression on the summit of the dome.
Increased rockfall and pyroclastic-flow activity over the E flank of the dome coincided with periods of tremor during late April. Small, low-level ash clouds were occasionally visible on satellite imagery. Rockfalls traveled down the SE flank of the dome almost continuously. By early May rockfall talus had begun to spill over the rim of the 29 July 2001 collapse-scar in the extreme SE at the foot of Roches Mountain. Pyroclastic flows on the mornings of 1 and 2 May were the most energetic seismic events recorded for over a month. Activity increased beginning on 8 May, and rockfalls and pyroclastic flows were concentrated on the dome's NE flank.
MVO reported that weather permitting, the daytime entry zone (DTEZ) would remain open. The observatory warned that activity could increase quite suddenly, with a dangerous situation developing in the DTEZ very quickly, and that ash masks should be worn in ashy conditions. The Belham Valley was to be avoided during and after heavy rainfall due to the possibility of mudflows. Access to Plymouth, Bramble airport, and beyond was prohibited. In addition, a maritime exclusion zone around the S part of the island extends two miles beyond the coastline from Trant's Bay in the E to Garibaldi Hill on the W coast.
Seismicity and SO2 flux. Since 4 February SO2 measurements were carried out using a remote, telemetered Differential Optical Absorption Spectrometer (DOAS) that scans through the plume, yielding over 600 measurements of SO2 emission rates per day. The highest SO2 fluxes were measured after pyroclastic flows. SO2 emission rates decreased dramatically during early March (table 40).
A swarm of hybrid earthquakes on 22 April was followed by increased numbers of long-period events and a surge in the number of rockfalls over the next four days. Banded tremor also followed the swarm. Weak periods of tremor occurred approximately every 20 hours during 26 April-3 May, and each lasted a few hours. Fluctuations in SO2 emission rates in late April appeared to reflect variations in the intensity of rockfall activity.
Morphology of the lava dome. During early February the lava dome continued to grow primarily on the E and NE sides, and by late February growth was focused on the E side. The summit of the dome was blocky and massive, in contrast to the spines of previous weeks. On 19 February the dome was crowned by a large spine inclined steeply up towards the SE. The spine changed in size and shape, as it periodically collapsed or disintegrated and grew again as fresh material was extruded. On 26 February the spine had a height of 90 m above the general level of the summit area. At this stage the top of the spine had an elevation of 1,080 m, the highest point measured during the eruption to date.
Observations in early March revealed that the summit of the dome had a generally spiny appearance and on several occasions was crowned by a large spine directed upwards at a high angle towards the E. During mid-March the summit of the dome was dominated by fast-growing large spines (50-70 m high). Theodolite measurements of the dome taken on 20 March yielded a dome height of 1,039 m.
During mid-April, dome growth shifted to the SE area of the dome complex, although small rockfalls occurred in other areas. The summit area had evolved from a large striated lobe to a series of small spines. By late April the lobe on the SE portion of the dome had reached 1,041 m elevation and the NE lobe, which had been highly active during the previous two weeks, stagnated at a height of 1,020 m elevation. Lava dome growth continued on the E side of the dome complex during early May.
The closest GPS station to the dome showed sustained outward movement of ~0.5 cm per month. During periods of dome building, slow subsidence took place at the closest sites at Hermitage, Whites, and Harris. Since January, the EDM reflector on the N flank showed a 5-cm movement away from the lava dome.
Hazard assessment. On 11 March 2002 the Montserrat Volcano Observatory (MVO) issued the following preliminary statement concerning the history and hazard assessment of the current eruption: "The Soufrière Hills Volcano continues its second phase of sustained dome growth, which began in November 1999. Since September 2001, the dome has grown at an average rate of about 2 m3/s (or 400,000 metric tons per day). The summit region of the dome has now reached an altitude of ~990 m, having filled most of the depression formed by the large dome collapse of 29 July 2001. The dome has mainly grown towards the E, although there was a period during late November and early December 2001 when growth was directed W.
"During [September 2001 to March 2002] there have been fluctuations in activity as recorded in seismicity and gas emissions. Pyroclastic flows and almost continuous rockfalls have occurred, mostly directed down the Tar River Valley. For prolonged periods in the last six months, there have been cyclical patterns of enhanced seismicity lasting for a few hours to about a day, during which rockfall and pyroclastic-flow activity has been more intense.
"Continued growth of the dome over this period has meant that hazard levels close to the volcano have increased slightly compared with . . . September 2001. Risk levels will fluctuate as the configuration of the dome changes. In an extreme scenario, a switch in the direction of growth to the N or NW could result in more hazardous conditions along the margins of the Exclusion Zone. Consequently, increased levels of risk might develop in the populated areas bordering the Belham River. Across the remainder of the island, however, it is considered that the general level of risk to the population from volcanic activity is unchanged.
"The main hazards remain pyroclastic flows, explosions, falls of ash and small stones, and volcanic mudflows. The increasing knowledge of the volcano acquired by the experienced observatory staff allows patterns of eruption behavior to be recognized and some forms of activity to be anticipated. During a large dome collapse or explosion, heavy ashfall and the fall of small rock fragments can be expected in the populated areas if the wind is in an unfavorable direction. However, a detailed study of the hazard due to fall of rock fragments has recently been completed, and this indicates that outside the Exclusion Zone significant falls of rock fragments large enough to cause serious injury are unlikely.
"At the moment there is no sign of the volcanic activity diminishing. It is most likely that the eruption will continue for a number of years, although the volcano may be evolving into a persistently active state with the eruption continuing for even longer periods, either continuously or intermittently."
General References. Baker, P.E., 1985, Volcanic hazards on St. Kitts and Montserrat, West Indies: Journal of the Geological Society, London, v. 142, p. 279-295.
Shepherd, J.B, Tomblin, J.F., and Woo, D.A., 1971, Volcano-seismic crisis in Montserrat, West Indies, 1966-67: Bulletin of Volcanology, v. 35, p. 143-163.
Wadge, G., and Isaacs, M.C., 1988, Mapping the volcanic hazards from Soufriere Hills volcano, Montserrat, West Indies using an image processor: Journal of the Geological Society, London, v. 145, p. 541-551.
Information Contacts: Montserrat Volcano Observatory (MVO), Mongo Hill, Montserrat, West Indies (URL: http://www.mvo.ms/); Washington Volcanic Ash Advisory Center (VAAC), Satellite Analysis Branch (SAB), NOAA/NESDIS E/SP23, NOAA Science Center Room 401, 5200 Auth Road, Camp Springs, MD 20746, USA (URL: http://www.ospo.noaa.gov/Products/atmosphere/vaac/).
During 19-29 February large spines and plumes occurred at tidal maxima
Stephen O'Meara and four Volcano Watch International (VWI) team members (Robert Benward, Tippy D'Auria, Scott Ireland, and Larry Mitchell) visually monitored Soufrière Hills for 10 days beginning on 19 February 2002. The observations took place on Jack Boy Hill, a spot at ~180 m elevation 6 km N of the volcano. In addition, for 3 hours on the night of 25 February, the group joined Montserrat Volcano Observatory (MVO) scientists Peter Dunkley and Richard Herd on the runway at Bramble Airport. Except for a storm on 20 February, the weather facilitated exceptionally clear views of the dome during both day and night. The team employed a variety of telescopes and other optical equipment and had an interest in astronomy as well as the volcano (O'Meara, 2002).
Benward brought along a homemade night-vision scope (near-infrared image intensifier) that captured images of the dome, even through local atmospheric conditions where visible light was weakened or scattered. The intensifier was coupled to camera lenses. It could be used visually or attached to a video camera (figure 47). The camera's phosphor viewing screen yielded green-colored images of the hot portions of the dome.
 |
Figure 47. The night-vision scope (image intensifier) put together by Robert Benward and used to obtain images of Soufriere Hills' growing dome. In this configuration the intensifier lies between two other components: a telephoto camera lens (left) and a video camera (right). Courtesy of Steve O'Meara, Robert Benward, and Sky and Telescope magazine. |
One purpose of the VWI team's visit to Montserrat was to chronicle changes in the volcano's visible behavior with approach to the time of the full Moon and its perigee (when the Moon is closest to the Earth). The idea was that the tidal influence associated with the full Moon and its perigee might lead to enhanced activity. With approach of the full Moon, there did seem to be a rise in visible indicators, particularly plume height, a strong pulse of extruded spines, and less-substantial increases in the numbers of rockfalls and pyroclastic flows.
As background on tidal forces, the paths of both the Moon around the Earth, and Earth around the Sun are elliptical throughout the lunar cycle (29.53 days) and solar cycle (the year), meaning that the separations and resulting gravitational forces vary with time. The Earth-Moon separations change by ~50,000 km; when they are smallest (perigee) and largest (apogee) the respective tidal forces are higher or lower than usual. In addition, the gravitational attractions of Moon and Sun on the Earth may act along a common line or at changing angles relative to each other. Particularly large tides affect the Earth's crust and oceans when the Sun and the Moon are lined up with the Earth; this occurs at the new and full phases of the Moon. These orientations lead to what are called spring tides (a name not associated with the season of Spring, but which implies a "welling up"). The amount of tidal enhancement is roughly the same whether the Sun and Moon are lined up on opposite sides of the Earth (full Moon) or on the same side of the Earth (new Moon). In contrast, when the Moon is at first quarter or last quarter (meaning that it is located at right angles to the Earth-Sun line), the Sun and Moon produce tidal bulges called neap tides. These are generally weaker than the above-described spring tides.
A two-month record of seismicity and tides at the volcanically active Axial seamount on the Juan de Fuca ridge during 1994 found both bi-weekly and diurnal patterns in earthquakes and volcanic tremor (Tolstoy and others, 2002). The authors concluded that microearthquakes took place at tidal minima.
Montserrat, Moon, and magma. The full Moon occurred at 0518 on 27 February; perigee, ~11 hours later, at 1630. The team's 10-day stay was too short to see more than a partial lunar cycle, but soon after full Moon and perigee, the numbers for the observed visible indicators appeared to drop considerably.
After an initial study of dome activity on 19 February and a storm on 20 February, the group began taking regular visible observations on 21 February. At that time, activity appeared to be on the increase and a high-level of activity was sustained throughout the observation period. According to MVO: "The level of volcanism at Soufrière Hills during 22 February-1 March was higher than it had been in previous weeks." The growing dome was quite active, displaying near continuous rockfall and small pyroclastic flows, most of which traveled E to the Tar River Valley, though some activity was directed to the S and W. During the 10-day observation interval, the dome also rapidly extruded very large spines.
By midnight on 27 February the team had recorded and tabulated 440 observations of notable rockfalls and pyroclastic flows. On the whole during this interval, the number of these events per hour stood well below 10, typically ranging from ~4 to ~8. One low, late on 23 February, only reached 1 event per hour. The average number of these events per hour reached a low of ~5 during 21-23 February rising to ~8 on 27 February. The highest hourly total recorded during the observing period occurred on 27 February with 13 of these events during 0000-0100 and 10 during 1120-1320. These times fall on either side of the full Moon; the second total lies at the midpoint between the full Moon and lunar perigee.
Visible activity decreased sharply on 28 February. The team, which departed on 3 March, made sporadic observations until 1 March. Their observations on and after 28 February suggested dome activity had remained substantially lower than during 21-27 February.
During their interval of observation the team found a direct correlation between the number of large visible events and the size of the dome's emerging and collapsing spines. The mass of each spine also increased during the observation period; the largest spine was observed on 26 February, the day before the full Moon and perigee.
Each of the spines collapsed in less than a day, only to regrow rapidly. The largest (shown on figures 48-53) reached 90 m tall; it enabled the summit to attain 1,080-m elevation, the highest the summit has been during the entire eruption to date (according to the MVO weekly update). It grew rapidly; specifically, it was not present from 1830 to 2100 on the evening of 25 February, but was fully grown by 0600 the following morning. When seen at 0330 on 26 February the new spine appeared as an incandescent obelisk about one-fifth its maximum size. The majority of this massive spine then grew to its record height in 3 hours.
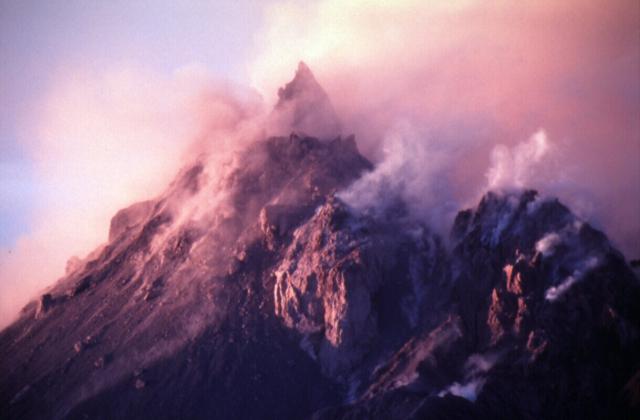 |
Figure 48. A S-view taken from Jack Boy Hill of Soufrière Hills dome shown with the yet-highest-reaching spine seen to date, which was photographed shortly after sunrise on 26 February 2002. The spine appears as a triangular peak at the summit; it soon began to collapse. Courtesy of Steve and Donna O'Meara, Volcano Watch International. |
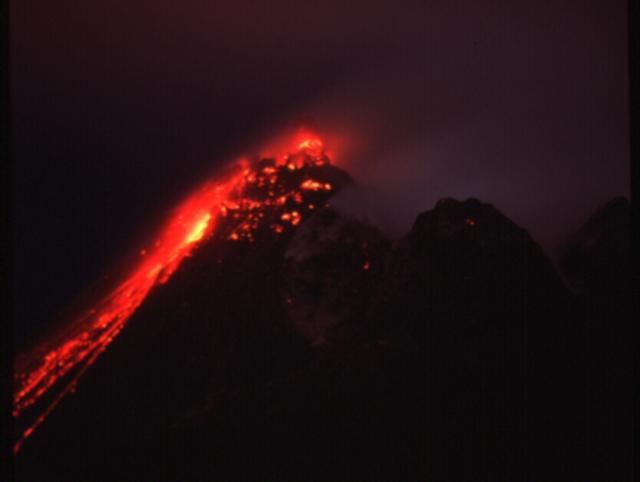 |
Figure 49. A S-looking night shot taken from Jack Boy Hill at 0300 on 26 February that depicts Soufriere Hills in a highly incandescent state, with a large and growing spine extruding out of the top of the dome. Disrupted and displaced dome materials, including falling blocks, incandescent rockfalls, and pyroclastic flows, have left a conspicuous apron of hot material on the dome's left (W) side. Surprisingly little ash and steam appear to be present. Courtesy of Steve and Donna O'Meara, Volcano Watch International. |
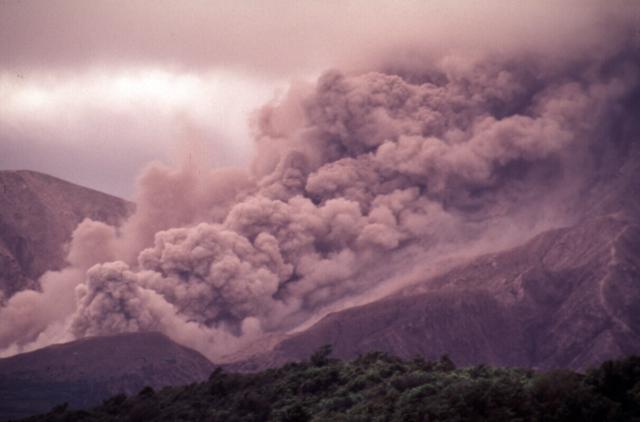 |
Figure 50. A daytime shot taken from Jack Boy Hill showing part of a comparatively large pyroclastic flow at Soufriere Hills on 24 February 2002. Courtesy of Steve and Donna O'Meara, Volcano Watch International. |
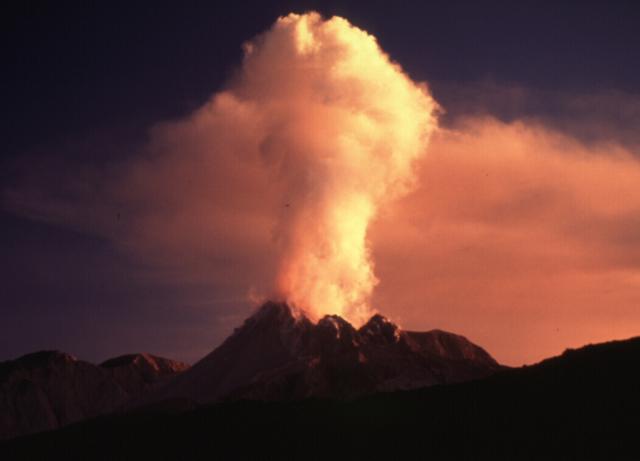 |
Figure 51. The ragged summit of the dome at Soufriere Hills as it lies beneath a small plume at sunset. Taken from Jack Boy Hill looking S on 25 February 2002. Courtesy of Steve and Donna O'Meara, Volcano Watch International. |
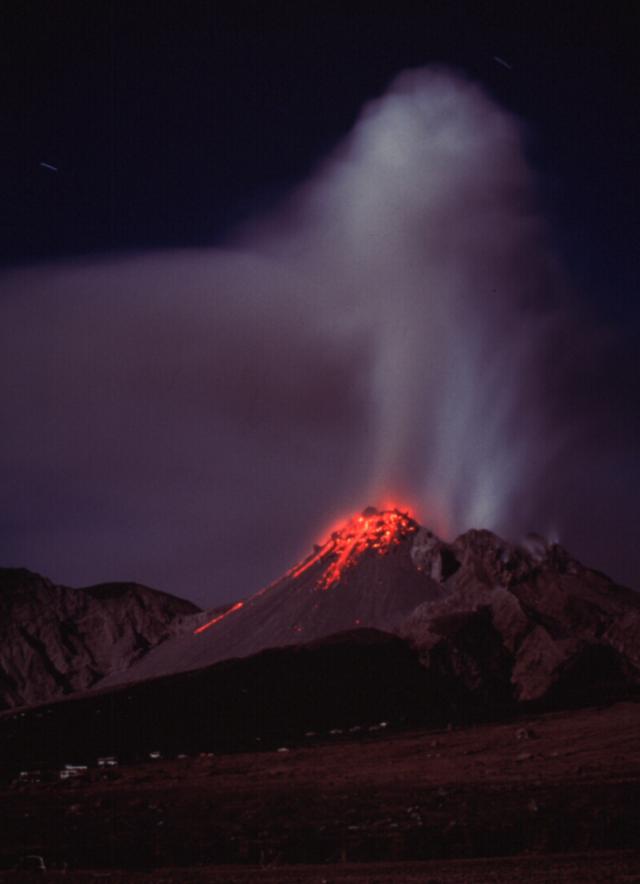 |
Figure 52. A night shot of the dome at Soufriere Hills showing the summit dome that was soon to extrude a large spine (not yet visible). This photo was taken from the airport (several kilometers NE of the dome) in conditions of moonlight on 25 February at about 2100. Courtesy of Steve and Donna O'Meara, Volcano Watch International. |
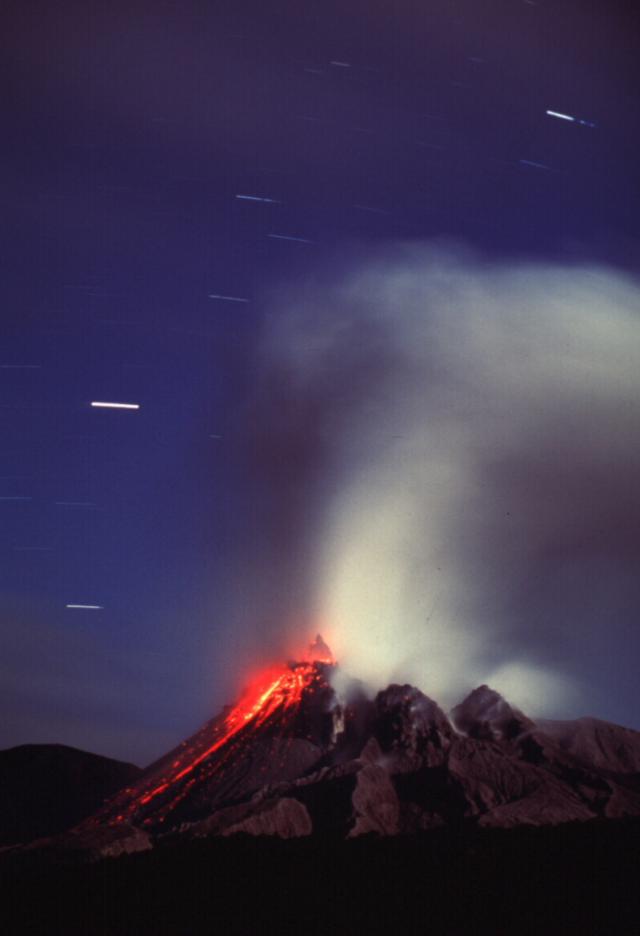 |
Figure 53. Soufriere Hills' glowing dome showing triangular spine in the moonlight with stars in the night sky. Taken from the airport (several kilometers NE of the dome). Courtesy of Steve and Donna O'Meara, Volcano Watch International. |
Figure 54 is one of several plots constructed to illustrate the results. It was made by omitting the smaller events, which the team judged from small to medium using a qualitative visual scale that ran from S1 to S3 and continued upwards from M1 to M3 (where event sizes are abbreviated as S for "small" and M for "medium" and termed as S-class or M-class, respectively). Thus, the largest events seen were M3 (i.e., they saw no events in these time periods that they classified as "large"). On their scale, events of size S3 and M1 were judged to be of very similar magnitude. Figure 54 shows the increase in larger event size seen during 21-26 February, culminating in the highest numbers late on 26 February to early on 27 February.
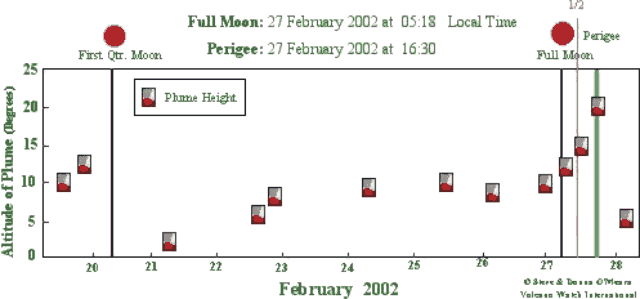 |
Figure 54. A plot of the number of larger observed rockfall and pyroclastic-flow events seen at Soufrière Hills during 21-27 February 2002. The events counted in this plot excluded the smallest two categories (S1 and S2 classes, see text). High tides were shown (thin vertical lines) for those cases where they occurred during an interval in which observations were conducted; otherwise they are absent. The symbols along the top of the plot indicate processes described in the key. The symbol sizes were increased or reduced for events judged to be of larger or smaller size. For example, the largest spine grew on 26 February (large dark triangle). Courtesy of Steve and Donna O'Meara, Volcano Watch International. |
Figure 54 shows six high tides that occurred at times when observations were conducted (on 21, 22, 24, 26 and 27 February). Five of the six of these tides coincided with observation intervals with the day's highest number of the largest events (the M-class events).
Plume height. As shown on figure 55, an increase in plume height took place around the time of first quarter Moon followed by a decrease, then a gradual rise in plume height, until it reached a maximum at the time of perigee on 27 February. Although atmospheric conditions could clearly affect the extent and height of a plume, the team found the pattern of the plotted data compelling. The plot may disclose tidal effects.
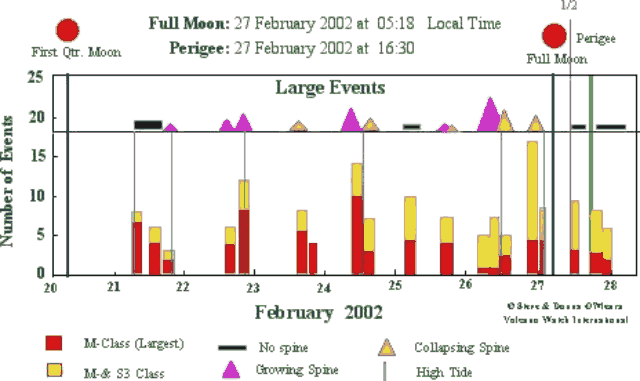 |
Figure 55. Plume heights (in degrees above a reference horizon) at Soufriere Hills plotted against time as observed during 19-28 February 2002. Courtesy of Steve and Donna O'Meara, Volcano Watch International. |
References. O'Meara, S., 2002, Firelight nights: Stargazing from the Caribbean's Emerald Isle; A group of American amateur astronomers helps residents of Montserrat and its neighboring island explore the universe: Sky & Telescope, August 2002, p. 79-83.
Tolstoy, M., Vernon, F.L., Orcutt, J.A., and Wyatt, F.K., 2002, Breathing of the seafloor, tidal correlations of seismicity at Axial Volcano: Geological Society of America (GSA), Geology, v. 30, no. 6, p. 503-506.
Information Contacts: Steve and Donna O'Meara, Robert Benward, Tippy D'Auria, Scott Ireland, and Larry Mitchell, Volcano Watch International, PO Box 218, Volcano, Hawaii 96785.
Mid-to-late 2002 dome growth and the start of NE-traveling pyroclastic flows
The Montserrat Volcano Observatory (MVO) reported that during mid-May through mid-September 2002, seismicity at Soufrière Hills was dominated by rockfall signals. Four volcano-tectonic (VT) earthquakes were reported during the first week of June and nine during the week of 9-16 August. SO2 emission rates were measured using Differential Optical Absorption Spectrometers (DOAS). SO2 fluxes generally remained at moderate levels. High fluxes occurred at times, such as during rockfall activity on 12 August (up to 690 t/day). On 6 September SO2 emissions were low at 42-170 t/day, although levels increased to 170-518 t/day through 13 September (table 41).
Table 41. Seismicity at Soufrière Hills during 10 May-13 September 2002. "--" indicates that the information was not reported. Courtesy MVO.
| Date | Rockfall | Long-period | Long-period / Rockfall | Hybrid | SO2 flux (metric tons/day) |
| 10 May-17 May 2002 | 553 | 127 | 99 | 5 | -- |
| 17 May-24 May 2002 | 532 | 77 | 111 | 1 | -- |
| 24 May-31 May 2002 | 497 | 57 | 93 | 6 | -- |
| 31 May-07 Jun 2002 | 129 | 20 | 4 | 6 | -- |
| 07 Jun-14 Jun 2002 | 135 | 20 | 3 | 12 | 247-955 |
| 14 Jun-21 Jun 2002 | 226 | 14 | 10 | 17 | 14-15 Jun: ~170-520; 16-17 Jun: ~90-350; 19 Jun: ~600-690; 20-21 Jun: ~90-350 |
| 21 Jun-28 Jun 2002 | 102 | 6 | 2 | 19 | 22-23 Jun: ~170-520; 24 Jun: ~90-260; 25-26 Jun: ~170-350; 26-28 Jun: ~90-170 |
| 28 Jun-05 Jul 2002 | 42 | 6 | 5 | 11 | -- |
| 05 Jul-12 Jul 2002 | 108 | 6 | 2 | 17 | 10-12 Jul: ~90-260 |
| 12 Jul-19 Jul 2002 | 151 | 3 | 4 | 8 | 13-14 Jul: 90; 15-19 Jul: ~130-220 |
| 19 Jul-26 Jul 2002 | 250 | 92 | 28 | 15 | 22-26 Jul: 175-250 |
| 26 Jul-02 Aug 2002 | 260 | 118 | 32 | 3 | ~90-270 |
| 02 Aug-09 Aug 2002 | 313 | 138 | 52 | 23 | Max: 690; avg: 380 |
| 09 Aug-16 Aug 2002 | 209 | 87 | 8 | 5 | 86-430; 12 Aug: ~690 during rockfall activity |
| 16 Aug-23 Aug 2002 | 231 | 44 | 5 | 1 | 16-18 Aug: 170-340; 19-23 Aug: 170-600 |
| 23 Aug-30 Aug 2002 | 287 | 31 | 9 | 0 | 170-340 |
| 30 Aug-06 Sep 2002 | 453 | 63 | 9 | 1 | 170-432 |
| 06 Sep-13 Sep 2002 | 308 | 63 | 2 | 0 | 6 Sep: 42-170; 7-13 Sep: 170-518 |
During mid-May, growth of the summit lava dome continued to be concentrated on the E flank, giving rise to numerous rockfalls and small pyroclastic flows in the upper reached of the Tar River Valley. Pyroclastic flows were observed moving NE in the uppermost part of Tuitt's Ghaut during an observation flight on the morning of May 13. This was the first indication that pyroclastic flows generated on the NE flank of the active dome were able to flow into this drainage system. This new direction of flow was possible after the 29 July collapse scar had become largely buried on this side of the dome. The summit region of the active dome was visible briefly on several occasions during late May. It had a broad blocky appearance, and growth seemed to have become concentrated on the SE, giving rise to rockfalls and small pyroclastic flows on the SE flank of the dome. There was little activity on the NE flank of the dome during the last week of May.
Very clear conditions during 31 May-3 June provided the first good views of the summit region for several months, revealing that since early April a large lobe had been extruded on the dome's upper SE side. The lobe was ~150 m across and reached 1,023 m altitude. The upper surface of the lobe had a spiny though slab-like appearance. Since the dome was last seen, it had developed a small lobe-like protrusion on the summit's W side. Minor June rockfalls occurred on the dome's E and W sectors.
During mid-June, although the dome was mostly covered by clouds, photos of the summit area were captured on many days by the remote digital camera at White's Yard. Despite the low level of rockfall and seismic activity, the massive extrusion lobe on the SE side of the dome continued to grow steadily. Most of the upper surface of the active lobe had the smooth form of a whale's back; it also contained a low-angle spine directed upwards towards the SE. The free face at the front of the lobe on the SE side was steep and blocky in appearance. A theodolite survey of the dome taken during a brief period of clear weather on 11 June measured these altitudes: the general summit area of the active lobe stood at 1,025-1,030 m, and the top of the spine, at 1,048 m.
Rockfall activity increased abruptly on the night of 14 June and remained moderately high until the 18th, when it declined once more. Rockfalls and small pyroclastic flows were produced by material collapsing off the E face of the dome. Several small pyroclastic flows were also produced on the NE flank and were observed flowing into the upper part of Tuitt's Ghaut. By late June, growth of the extrusion lobe on the SE side of the dome appeared to have stagnated. Rockfall activity decreased abruptly on the afternoon of 22 June and declined to very low levels during 25-28 June.
No change in dome morphology occurred during early to mid-July. Rockfall activity on the dome increased slightly on the morning of 3 July, and a small, low ash cloud drifted over Plymouth around 1000. This followed several hours of heavy rain during the night, which was associated with substantial mudflows in the center of Plymouth. Rockfalls increased slightly during 6-8 July, before decreasing to very low levels through 12 July.
Observations of the dome on 15 July suggested that dome growth was continuing at a very low rate. Growth was concentrated on the SE part of the dome, at the lobe that was active during mid- to late June. The level of rockfall activity from this active lobe increased slightly on 15 July, with a small pyroclastic flow at 0800 directed down the Tar River Valley.
A swarm of low-amplitude long-period (LP) earthquakes began on 19 July and increased in strength during the following four days. The swarm continued at an elevated level until it began to decrease slightly during 31 July-2 August.
Observations of the dome on 21 July indicated that significant growth had recommenced, with the extrusion of a new lobe on the NE side of the summit region. Growth of the new extrusion lobe gave rise to rockfalls and small pyroclastic flows off the NE flank of the dome. On the morning of 23 July a minor collapse produced small but continuous pyroclastic flows for about an hour. These mainly flowed into the upper parts of Tuitt's Ghaut and down White's Ghaut for about half the distance to the coast. A few also flowed into the upper part of the Tar River Valley. A similar event, lasting for ~20 minutes, occurred in the early hours on the morning of 26 July.
On the morning of 1 August observations revealed that the new extrusion lobe on the N side of the summit had a broad whaleback form. Growth of this lobe was directed N and, around 2-4 August, the lobe crumbled repeatedly, producing rockfalls and small pyroclastic flows in Tuitt's Ghaut. Limited activity occurred on the NW part of the dome, although one small pyroclastic flow descended the notch between the central and NW buttresses. Individual rocks also reached upper Tyre's Ghaut (behind Gage's Mountain). During 6-9 August, rockfall activity declined substantially due to the lobe becoming more coherent and not collapsing. By mid-August, talus had accumulated in the upper reaches of Tuitt's Ghaut and small pyroclastic flows occurred in both Tuitt's and White's Ghauts. The active lobe also shed more talus into the notch in the NW sector of the old dome, which leads towards Tyre's Ghaut.
Rockfall talus continued to accumulate in the upper reaches of Tuitt's Ghaut during 16-23 August, and there were overspills of talus from the N side of the Tar River Valley into the two tributaries of White's Ghaut. The NE buttress, a remnant of the old dome complex from mid-1997, was now completely buried. Erosion of the E edge of the central buttress continued. Talus continued to slowly accumulate in the notch in the NW sector of the old dome, which leads towards Tyre's Ghaut. During intense rainfall early on 21 August, a small collapse occurred in the Tar River Valley of the talus that had accumulated on the SE sector of the dome during April-May 2002.
During late August, small pyroclastic flows were mainly concentrated on the NE flank where they had been channeled into the upper reaches of Tuitt's Ghaut; although some had spilled eastwards along the N side of the Tar River Valley. Talus also continued to accumulate in the notch in the NW sector of the old dome, which leads towards Tyre's Ghaut. Torrential rainfall produced mudflows in the Belham Valley in the early hours of 28 August.
During early September, growth continued to be focused on the N side of the dome complex although it had become more centralized and the summit height now exceeded 1,050 m. Otherwise the focus of activity remained concentrated on the NE flank, with frequent rockfalls and small pyroclastic flows. Most of these were channeled into the upper reaches of Tuitt's Ghaut; although some had spilled eastwards along the N side of the Tar River Valley.
During mid-September, dome growth remained centralized, and the summit height exceeded 1,050 m. Otherwise the focus of activity remained concentrated on the E flank, with frequent rockfalls and small pyroclastic flows. Around 6-8 September most of these spilled eastwards along the N side of the Tar River Valley, although by 12-13 September activity appears to have refocused northwards onto Tuitt's Ghaut, with subordinate amounts continuing to spill eastwards into the Tar River Valley.
During the reporting interval, the daytime entry zone (DTEZ) remained open, weather permitting. MVO warned that activity could increase suddenly, with dangerous situations developing quickly. Protective masks were to be worn in ashy conditions and the Belham Valley was to be avoided during and after heavy rainfall due to the possibility of mudflows. Access was prohibited to Plymouth, Bramble airport, and points closer to the volcano; including a marine exclusion zone around the southern part of the island ~3 km beyond the coastline, extending from Trant's Bay in the E to Garibaldi Hill on the W.
Information Contacts: Montserrat Volcano Observatory (MVO), Mongo Hill, Montserrat, West Indies (URL: http://www.mvo.ms/); Washington Volcanic Ash Advisory Center (VAAC), Satellite Analysis Branch (SAB), NOAA/NESDIS E/SP23, NOAA Science Center Room 401, 5200 Auth Road, Camp Springs, MD 20746, USA (URL: http://www.ssd.noaa.gov/).
Continued dome growth, rockfalls, and pyroclastic flows
During mid-September 2002 through February 2003 at Soufrière Hills, the dome continued to grow, producing numerous rockfalls and small-to-moderate pyroclastic flows. Most of the activity was concentrated on the NE and N flanks, producing numerous pyroclastic flows in White's Ghaut, the Tar River Valley, and Tuitt's Ghaut. Pyroclastic flows and rockfalls also traveled down the W and NW flanks. Ashfall affected surrounding areas, accumulating in thicknesses up to 9 mm. The Washington VAAC issued notices to the aviation community almost daily. Seismicity was dominated by rockfalls (table 42).
Table 42. Seismicity at Soufrière Hills during 13 September 2002-28 February 2003. *During some weeks, the number of seismic events was under-represented because of problems with the seismic stations. Courtesy MVO.
| Date | Rockfall | Hybrid | Long-period | Long-period / Rockfall | Volcano-tectonic |
| 13 Sep-20 Sep 2002 | 689 | 67 | 162 | 41 | 1 |
| 20 Sep-27 Sep 2002 | 680 | 36 | 260 | 55 | 0 |
| 27 Sep-04 Oct 2002 | 811 | 15 | 223 | 51 | 2 |
| 04 Oct-11 Oct 2002* | 468 | 3 | 77 | 42 | 0 |
| 11 Oct-18 Oct 2002* | 650 | 2 | 98 | 80 | 1 |
| 18 Oct-25 Oct 2002 | 536 | 6 | 120 | 27 | 1 |
| 25 Oct-01 Nov 2002 | 670 | 9 | 148 | 72 | 0 |
| 01 Nov-08 Nov 2002 | 694 | 3 | 60 | 38 | 0 |
| 08 Nov-15 Nov 2002* | 409 | 0 | 29 | 8 | 1 |
| 15 Nov-22 Nov 2002 | 592 | 2 | 88 | 37 | 1 |
| 22 Nov-29 Nov 2002 | 586 | 0 | 44 | 32 | 0 |
| 29 Nov-06 Dec 2002 | 354 | 0 | 33 | 43 | 0 |
| 06 Dec-13 Dec 2002 | 427 | 6 | 47 | 30 | 0 |
| 13 Dec-20 Dec 2002 | 742 | 2 | 50 | 50 | 0 |
| 20 Dec-27 Dec 2002 | 760 | 5 | 45 | 30 | 0 |
| 27 Dec-03 Jan 2003 | 863 | 3 | 86 | 41 | 1 |
| 03 Jan-10 Jan 2003 | 789 | 0 | 120 | 54 | 0 |
| 10 Jan-17 Jan 2003 | 606 | 7 | 67 | 42 | 2 |
| 17 Jan-24 Jan 2003 | 566 | 0 | 58 | 24 | 1 |
| 24 Jan-31 Jan 2003 | 745 | 2 | 177 | 62 | 1 |
| 31 Jan-07 Feb 2003 | 882 | 6 | 148 | 114 | 0 |
| 07 Feb-14 Feb 2003 | 840 | 3 | 117 | 78 | 1 |
| 14 Feb-21 Feb 2003 | 905 | 8 | 87 | 80 | 1 |
| 21 Feb-28 Feb 2003 | 1078 | 1 | 92 | 85 | 0 |
Activity during September 2002. Lava-dome growth was directed to the NE during 13-20 September, with frequent rockfalls and small pyroclastic flows sending material to a sector extending from the central Tar River Valley on the E flank to the NE flanks above Tuitt's Ghaut. Some material tumbled through a notch onto the N flank. A major change in direction of extrusion followed a hybrid earthquake swarm between 0703 and 1515 on 19 September. Growth of the previously active NE lobe stagnated during 21-22 September. A near-vertical spine was extruded in the central area around the 21st, possibly indicating a switch in growth direction. On 26 September a swarm of 36 hybrid events occurred between 0330 and 1112. The same day observations revealed a large new dome lobe that had extruded towards the W in the area previously known as Gages Wall. Material spalling off of this lobe produced rockfalls and small pyroclastic flows down Gages Valley that reached up to 1 km.
Notable pyroclastic flows occurred on the evening of 25 September and the morning of the 27th. Growth and rockfall activity then changed towards the N flanks, suggesting a possible stagnation of the recently extruded western lobe. Spectacular incandescence and semi-continuous rockfall activity were observed on the NE and N flanks of the dome on the night of 26-27 September.
On 27 September a 4-hour-period of heightened activity occurred in the afternoon and evening, with small semi-continuous pyroclastic flows traveling down the N flanks and eastwards into the upper portions of Tuitt's Ghaut and then into White's Bottom Ghaut. A newly extruded lobe was visible on 28 September almost directly to the NW with a broad headwall over the N, NW, and W flanks. On the evening of 29 September there was another period of heightened activity on the N flanks that lasted 1.5 hours, with pyroclastic flows just reaching the sea along White's Bottom Ghaut. It was estimated that during this event only 2-3 x 10⁶ m3 of the N edge of the active NW lobe was shed.
The Washington VAAC reported that a low-level ash cloud from an emission at 1510 on 29 September was visible over eastern Puerto Rico on satellite imagery through the following day. On 30 September a light dusting of white ash fell in eastern Puerto Rico at Roosevelt Roads Naval Air Station.
Activity during October 2002. Observations on 1 October revealed that re-growth of the collapsed area had occurred. A brief period of heavy rain on 2 October triggered a moderate-sized mudflow down the Belham Valley. Analysis of seismic data suggested that pyroclastic-flow activity on 2 October began at 1310, and sustained dome collapse continued for 6 hours. Low-energy pyroclastic flows were observed reaching the sea on the Tar River's flanks throughout the collapse, and ash clouds were produced that drifted to the NW. Heavy ashfall occurred in the residential areas of Salem, Old Towne, and Olveston, with deposits up to 9 mm thick. Subsequent observations revealed that this collapse was confined to the E flanks, and that this was again a relatively small event (less than 5 x 10⁶m3 of material was shed off of the E side of the dome complex).
According to the Washington VAAC, after daybreak on 3 October there were several reports of ashfall in Puerto Rico, and visible satellite imagery at 1115 confirmed that an ash cloud around 2.4 km altitude covered most of the island. At 1615 the area of very thin ash was not visible on satellite imagery. By the next day, ash from the previous day's emissions had drifted W, and around 0902 it was located over southern Puerto Rico. A thin plume of ash also extended SSW of St. Croix island.
Early in October the NW extrusion lobe of the lava dome grew to the NW, but later growth remained more centralized and there was noticeable bulking up of the lobe's summit area. Talus continued to accumulate behind the NW buttress and in the head of Tyre's Ghaut. Minor mudflow activity occurred on 9 October. The growth of the lava dome towards the NW prompted the evacuation of populated areas along the fringes of the lower part of the Belham Valley (~300 people) on 8 and 9 October, and the area was declared part of the Exclusion Zone. A relatively small pyroclastic flow traveled NNE down the flanks on 13 October.
On the afternoon of 22 October intense rainfall at midday produced large mudflows NW in the Belham Valley. At the peak of flow, the entire width of the valley floor at Belham Bridge was flooded and standing waves up to 2.5 m high were observed. By 1430, pyroclastic-flow activity began. For several hours, pyroclastic flows from the N flank of the dome were channeled NE into the upper parts of Tuitt's Ghaut, from where they crossed over into White's Bottom Ghaut. Flows also occurred on the dome's E flank in the Tar River Valley.
The volcano was observed using a remote camera and during a flight on 31 October. The active extruded lobe in the NW continued to steadily grow, bulking out on the N and W sides. Rockfalls and pyroclastic flows traveled down the E and N flanks, particularly within Tuitt's Ghaut and the Tar River Valley. A considerable amount of debris also spalled off the W flank of the active extruded lobe and accumulated in the upper parts of Fort Ghaut.
Activity during November 2002. During early November lava-dome growth on the N part of the dome was less directed, with rockfalls dispersed over the summit and flanks. The lobe shed rockfall debris predominately down Tuitt's Ghaut and Tar River Valley, although also onto the NW flank and into the top of Gage's Valley. According to the Washington VAAC, on 8 November strong pyroclastic flows produced ash-and-gas clouds to a height of ~1.5 km.
On 8 and 9 November pyroclastic flows traveled 900-1,000 m NW into Tyer's Ghaut at the headwaters of the Belham Valley. During 12-15 November, the size and energy of the pyroclastic flows increased slightly. During 15-19 November, small pyroclastic flows traveled 1-1.5 km from the dome every few hours in Tuitt's Ghaut to the NE and in the Tar River Valley to the E. On 29 November the active lobe had a broad whaleback-shaped upper surface, which was oriented towards the NNE.
During 29 November-6 December a number of small, short-lived spines formed at the base of the active lobe in the N part of the dome complex, shedding material E into White's Ghaut and the Tar River Valley. Lava blocks continued to spall off the front of the lobe, shedding material NE into Tuitt's Ghaut and onto the northern talus slope. An average of one moderate-sized pyroclastic flow occurred per day and traveled no farther than 1-1.5 km from the lava dome into Tuitt's and White's ghauts and into the Tar River Valley. During 5-6 December, rockfalls and small pyroclastic flows occurred more frequently on the northern talus slope and on the NW, at the top of Tyer's Ghaut.
Activity during December 2002. A sustained dome collapse began on 8 December at 2045, producing energetic pyroclastic flows down White's Ghaut to the sea at Spanish Point. Ash clouds rose to ~3 km altitude and drifted WNW. In Plymouth and Richmond Hill 4 mm of ash was deposited. Seismicity returned to background levels on 9 December by 0045, and several days of weak tremor occurred.
The collapse scar on the dome's NNE flank, estimated to have had a volume of 4-5 x 10⁶ m3, was being filled rapidly with freshly extruded lava. Observations on 13 December revealed a large amount of fragmental lava extruded in a northerly direction on the summit. A large spine was also extruded on the NW side of the summit.
During late December spectacular incandescence of the dome was observed on most nights. Activity increased during 18-20 December, and on 19 December mudflows occurred in White River, Tar River Valley, and Fort Ghaut. During 20-27 December extrusion occurred on the N, and occassionally NW, sides of the summit. A large spine was pushed up at the back of the active extruded lobe during the night of 26-27 December, but was not visible by 2 January. The Washington VAAC reported that on 28 December around 1130 a 3-km-high ash cloud generated from pyroclastic flows drifted over the islands of St. Kitts and Nevis.
Activity during January-February 2003. Activity escalated to very high levels on the night of 27 December. During 27 December-10 January continuous rockfalls and numerous pyroclastic flows spalled off the active extruded lobe on the NNE side of the lava dome. Activity decreased on the night of 2 January to moderate levels on the 3rd.
During mid-January, activity generally declined to a moderate level. During 15-17 January almost all pyroclastic flows occurred in the Tar River Valley, with only minor rockfalls traveling down the dome's NE and N sides. Lava extrusion occurred NE of the lava-dome complex that was associated with rockfalls and small pyroclastic flows down Tar River Valley, White's Ghaut, Tuitt's Ghaut, and on the northern talus slopes. On 18, 20, and 24 January small pyroclastic flows traveled ~1 km down Tyer's Ghaut.
Activity increased during late January. Growth of the active extrusion lobe continued on the N side of the lava dome. The direction of growth was generally towards the NNE, although the focus of rockfall and pyroclastic-flow activity varied from day to day. A pulse of activity occurred at midday on 30 January, during which pyroclastic flows simultaneously descended several flanks of the lava dome traveling to the Tar River Valley, White's Ghaut, Tuitt's Ghaut, and W to Fort Ghaut.
During 31 January-14 February activity remained moderate. Growth of the lava dome was focused on a large, steep lobe directed to the NE. A small amount of rockfall material was directed W towards Fort Ghaut. Rockfalls and small pyroclastic flows also occurred off the N flank of the dome onto the area of Riley's Estate.
During 19-25 February pyroclastic flows and rockfalls were concentrated more on the E flank of the lava dome and in the Tar River Valley, although there were several periods of activity on the N flank, with pyroclastic flows in Tuitt's Ghaut and at the top of Farrell's Plain.
Activity increased slightly during 21-28 February. During an observation flight on 27 February lava-dome growth was concentrated towards the NE. Pyroclastic flows and rockfalls traveled down the lava dome's E and NE flanks via the Tar River Valley and Tuitt's Ghaut. There were also several periods of activity on the N flank, with pyroclastic flows at the top of Farrell's Plain.
SO2 emission rates varied throughout the report period (table 43), and were especially high following the dome-collapse event on 9 December (2,350 tons per day average).
Table 43. SO2 emission rates at Soufrière Hills during 13 September 2002 through 28 February 2003. Courtesy MVO.
| Date | SO2 emissions (tons/day) |
| 13 Sep-20 Sep 2002 | 85-518 |
| 11 Oct-12 Oct 2002 | 260-520, average of 302 |
| 13 Oct 2002 | 430-860, average of 691 |
| 16 Oct 2002 | 43-173 |
| 17 Oct-18 Oct 2002 | 346-518 |
| 19 Oct-21 Oct 2002 | 85-300 |
| 23 Oct-25 Oct 2002 | 430-500, peak of 1000 |
| 25 Oct-27 Oct 2002 | 45-260 |
| 27 Oct 2002 | 520 |
| 27 Oct-01 Nov 2002 | 25-260 |
| 01 Nov 2002 | 240 |
| 02 Nov 2002 | 208 |
| 03 Nov 2002 | 200 |
| 04 Nov 2002 | 508 |
| 06 Nov-07 Nov 2002 | 220 |
| 08 Nov-15 Nov 2002 | 520-560 |
| 15 Nov 2002 | 160 |
| 16 Nov 2002 | 340 |
| 17 Nov 2002 | 380 |
| 18 Nov 2002 | 180 |
| 19 Nov 2002 | 173 |
| 22 Nov-29 Nov 2002 | 520-1040 |
| 24 Nov 2002 | 170-350 |
| 29 Nov-06 Dec 2002 | Average 400 |
| 29 Nov-01 Dec 2002 | Average 280 |
| 06 Dec-08 Dec 2002 | 280 |
| 09 Dec 2002 | Average 2,350 |
| 10 Dec 2002 | 620 |
| 06 Jan 2003 | 130 |
| 07 Jan 2003 | 200 |
| 09 Jan 2003 | 430 |
| 10-17 Jan 2003 | ~86-1209 |
| 10 Jan 2003 | ~170-520, average ~260 |
| 11 Jan 2003 | Emissions of ~430 were recorded until mid-morning, but then decreased to ~86 for several hours. In the afternoon they reached ~860-1210 before dropping to ~430-518 |
| 12 Jan 2003 | ~345-605, average ~354 |
| 13 Jan 2003 | ~430-780, average ~490 |
| 15 Jan 2003 | ~430-605, average ~527 |
| 18 Jan 2003 | 300 |
| 19 Jan 2003 | 165 |
| 20 Jan 2003 | 700 |
| 21 Jan-24 Jan 2003 | 270 |
| 24 Jan 2003 | 480 |
| 25 Jan-28 Jan 2003 | 290 |
| 29 Jan 2003 | 560 |
| 30 Jan 2003 | 620 |
| 31 Jan-07 Feb 2003 | 90-170 |
| 14 Feb-21 Feb 2003 | 170-350 |
| 21 Feb-28 Feb 2003 | 400-460 |
| 22 Feb 2003 | 840 |
| 23 Feb 2003 | 1120 |
Information Contacts: Montserrat Volcano Observatory (MVO), Mongo Hill, Montserrat, West Indies (URL: http://www.mvo.ms/); Washington Volcanic Ash Advisory Center (VAAC), Satellite Analysis Branch (SAB), NOAA/NESDIS E/SP23, NOAA Science Center Room 401, 5200 Auth Road, Camp Springs, MD 20746, USA (URL: http://www.ospo.noaa.gov/Products/atmosphere/vaac/); Associated Press.
Continued dome growth, rockfalls, and pyroclastic flows
During 1 March through 2 May 2003, the dome continued to grow, producing numerous rockfalls and moderate pyroclastic flows. Most activity was concentrated on the northern flanks, producing numerous pyroclastic flows in White's Ghaut, the Tar River Valley, and Tuitt's Ghaut. Pyroclastic flows and rockfalls traveled down all flanks of the dome at some time during the period. On 20 March, the greatest dome height recorded to date was measured, 1,098 m. A prominent extrusive lobe was established on the E and SE sides of the summit at the beginning of April. On 22 April, a large spine, inclined to the E, was observed on the summit, the top of which was at an elevation of 1,163 m.
The Washington VAAC issued notices daily to the aviation community regarding ash clouds emanating from the summit. Seismicity during the report period was dominated by rockfalls (table 44). Average daily SO2 emission rates varied throughout the report period (table 45) with a low of 31 tons/day on 25 March to a maximum of 1,550 tons/day on 1 May.
Table 44. Summary of weekly seismicity at Soufrière Hills during 28 February 2003-2 May 2003. Courtesy MVO.
| Date | Rockfall | Hybrid | Long-period | Long-period / Rockfall | Volcano-tectonic |
| 28 Feb-07 Mar 2003 | 997 | 0 | 79 | 71 | 4 |
| 07 Mar-14 Mar 2003 | 1050 | 5 | 87 | 108 | 0 |
| 14 Mar-21 Mar 2003 | 1050 | 2 | 93 | 152 | 2 |
| 21 Mar-28 Mar 2003 | 1097 | 16 | 99 | 138 | 7 |
| 28 Mar-04 Apr 2003 | 754 | 7 | 74 | 101 | 2 |
| 04 Apr-11 Apr 2003 | 332 | 1 | 66 | 77 | -- |
| 11 Apr-18 Apr 2003 | 393 | 7 | 72 | 56 | -- |
| 18 Apr-25 Apr 2003 | 966 | 4 | 83 | 88 | 1 |
| 26 Apr-02 May 2003 | 813 | 4 | 168 | 121 | 1 |
Table 45. Average daily SO2 emission rates at Soufrière Hills during 28 February 2003-2 May 2003. Courtesy MVO.
| Date | SO2 emissions (tons/day) |
| 28 Feb 2003 | 1020 |
| 28 Feb-07 Mar 2003 | 500-1020 |
| 07 Mar-14 Mar 2003 | 220-355 |
| 14 Mar-21 Mar 2003 | 285-380 |
| 21 Mar-28 Mar 2003 | 31-497 |
| 25 Mar 2003 | 31 |
| 28 Mar-04 Apr 2003 | 230-770 |
| 04 Apr-11 Apr 2003 | 151-780 |
| 06 Apr 2003 | 151 |
| 11 Apr-18 Apr 2003 | 220-550 |
| 18 Apr-25 Apr 2003 | 450-550 |
| 25 Apr-02 May 2003 | 390-1550 |
| 01 May 2003 | 1550 |
Throughout the period, access to all areas S of the Belham Valley, to Waterworks, Happy Hill, Lower Friths and Old Towne, and to Bramble airport and beyond was prohibited and a maritime exclusion zone around the S part of the island extended 3.7 km beyond the coastline from Trant's Bay in the E to Lime Kiln Bay on the W coast.
Activity during March 2003. Activity remained at levels similar to that of the previous few weeks (BGVN 28:02), with continued dome growth and moderate pyroclastic-flow activity. Lava extrusion was accompanied by rockfall activity and pyroclastic flows that were focused, during 1-7 March, on the NE and N slopes and valleys. Pyroclastic flows occurred most frequently in Tuitt's Ghaut with a few on Farrell's Plain with run-out distances up to 1 km.
During 8-14 March, rockfalls and pyroclastic flows occurred down all flanks. Dome growth continued and lava extruding into the center of the summit dome complex continued to increase the dome height. Dome glow at night was spectacular in the Tar River Valley and on the NW in Tuitt's Ghaut and the N talus slopes. Small rockfalls and pyroclastic flows occurred infrequently on the W flank and at the top of Gage's Valley. Ash venting was continuous in the summit area.
Lava extrusion during 15-21 March formed a series of spines and ridges. Theodolite measurements on 20 March indicated a dome height of 1,098 m, the highest recorded to date. Activity was dominated by rockfalls and pyroclastic flows mainly in the Tar River Valley, with several small pyroclastic flows in White's and Tuitt's Ghaut and one observed in the upper part of Tyre's Ghaut on 20 March. Ash venting continued.
Dome growth continued through the end of the month. Rockfalls and pyroclastic flows spilled off the active summit in a broad arc extending from the S around the E flanks to the NW. Most activity was towards the NE, with pyroclastic flows in the Tar River Valley and small flows on the N flanks of the dome in White's Ghaut, Tuitt's Ghaut, the upper reaches of Tyre's Ghaut and on Farrell's Plain. Most volcano-tectonic earthquakes (see table 44) occurred in a small swarm late in the evening of 25 March. On the same day, following a brief, intense rainstorm, a 4-5 hour period of increased pyroclastic-flow and rockfall activity occurred on the N and NW flanks of the dome. Observation flights on 27-28 March indicated that rockfalls and small pyroclastic flows were spilling onto the S flanks of the dome.
Activity during April 2003. A prominent extrusive lobe was established on the E and SE sides of the summit at the beginning of April and a large vertical spine, extruded at the back of this lobe on the night of 1-2 April, was the highest point on the dome. During 1-12 April, rockfalls and pyroclastic flows occurred mainly on the E side of the dome in the Tar River Valley. Rockfall activity also continued on the S side of the dome and some pyroclastic flows occurred on the NE flanks in White's Ghaut and Tuitt's Ghaut, and on the NW flank; several of the latter flowed into the upper reaches of Tyre's Ghaut. On 10 April torrential rainfall produced mudflows in the Belham River and triggered pyroclastic flows on the E, N, and NW flanks of the dome.
Helicopter observations during 15 April indicated that the lobe extrusion continued on the ESE side of the dome summit above the Tar River Valley. Vigorous gas venting also was observed on the S side of the summit during this flight. Rockfall and pyroclastic-flow activity occurred throughout the week of 12-18 April on the E and SE sides of the dome with some rockfall activity on the N flanks. On 15 April a small pyroclastic flow occurred in the upper part of Tyre's Ghaut.
On 22 April a large spine was observed on the dome summit, positioned slightly S of the center and inclined at a high angle towards the E. The top of the spine was at an elevation of 1,163 m as compared to the ~1,090 m height of the general summit region of the dome. During 19-25 April, most of the rockfall and pyroclastic-flow activity occurred on the E and SE flank of the dome in the Tar River Valley. A few flows occurred to the NE in White's Ghaut and Tuitt's Ghaut, and to the N and NW onto Farrell's Plain and into the top of Tyre's Ghaut. Observations on 22 April indicated that rockfall debris was starting to spill S into the White River area. On 23 April several large rockfalls were observed on the W side of the dome in the Gages area.
During the last week of April, the prominent spine seen on the summit of the dome the previous week had partly disintegrated. Most of the rockfalls and pyroclastic flows into the Tar River Valley began along the face of the well-developed extrusion lobe present on the ESE side of the summit region. Rockfall debris spilled off the S side of the lobe into the upper reaches of White River, and some flows occurred towards the NE in White's Ghaut and Tuitt's Ghaut, and towards the N and NW on the top of Farrell's Plain and in the top of Tyre's Ghaut. Vigorous pulses of ash-venting occurred on the summit throughout this week.
Information Contacts: Montserrat Volcano Observatory (MVO), Mongo Hill, Montserrat, West Indies (URL: http://www.mvo.ms/); Washington Volcanic Ash Advisory Center (VAAC), Satellite Analysis Branch (SAB), NOAA/NESDIS E/SP23, NOAA Science Center Room 401, 5200 Auth Road, Camp Springs, MD 20746, USA (URL: http://www.ssd.noaa.gov/).
Dome growth, pyroclastic flows, and rockfalls through June
Seismic activity at Soufrière Hills during May-June 2003 was moderate to high, especially during May, and dominated by rockfalls. Most activity was focused on the N and NE flanks of the dome, with rockfalls and pyroclastic flows entering the Tar River Valley and occasionally White's Ghaut. During most of June activity remained, but was at substantially decreased levels. Brief views of the summit in June revealed that the extrusive lobe on the E side persisted.
The Washington VAAC issued daily notices to the aviation community regarding ash clouds that rose to low levels above the summit. Seismicity during the report period was dominated by rockfalls (table 46), particularly during May. Average daily SO2 emission rates varied throughout the report period (table 47) from 240 to 860 metric tons/day.
Table 46. Summary of weekly seismicity at Soufrière Hills during 2 May-4 July 2003. Courtesy MVO.
| Date | Rockfall | Hybrid | Long-period | Long-period / Rockfall | Volcano-tectonic |
| 02 May-09 May 2003 | 767 | 7 | 138 | 88 | 2 |
| 09 May-16 May 2003 | 580 | 7 | 65 | 55 | -- |
| 16 May-23 May 2003 | 774 | 8 | 81 | 75 | 2 |
| 23 May-30 May 2003 | 404 | 1 | 41 | 45 | -- |
| 30 May-06 Jun 2003 | 445 | 5 | 40 | 34 | 1 |
| 06 Jun-13 Jun 2003 | 79 | 6 | 16 | 8 | 2 |
| 13 Jun-20 Jun 2003 | 48 | 55 | -- | 10 | -- |
| 20 Jun-27 Jun 2003 | 54 | 135 | 2 | 4 | 1 |
| 27 Jun-04 Jul 2003 | 193 | 37 | 7 | 61 | -- |
Table 47. Range of average daily SO2 emission rates measured at Soufrière Hills during 2 May-4 July 2003. Courtesy MVO.
| Date | SO2 emissions (tons/day) |
| 02 May-09 May 2003 | 440-850 |
| 09 May-16 May 2003 | 484-820 |
| 16 May-23 May 2003 | 300-730 |
| 23 May-30 May 2003 | 480-860 |
| 30 May-06 Jun 2003 | 390-560 |
| 05 Jun 2003 | Fourier transform infrared spectrometer measurements show HCl:SO2 mass ratio = 2.80 in the plume. |
| 06 Jun-13 Jun 2003 | 350-520 |
| 13 Jun-20 Jun 2003 | 295-457 |
| 20 Jun-27 Jun 2003 | 215-505 |
| 27 Jun-04 Jul 2003 | 240-840 |
Throughout the report period, authorities prohibited access to all areas S of the Belham Valley, to Waterworks, Happy Hill, Lower Friths, Old Towne, and to Bramble airport and beyond. A maritime exclusion zone around the S part of the island extended 3.7 km beyond the coastline from Trant's Bay in the E to Lime Kiln Bay on the W coast.
Activity during May 2003. Most of the activity in May was focused on the NE flank of the dome, producing rockfalls and pyroclastic flows in the Tar River Valley and occasionally in White's Ghaut. Brief views of the summit dome on 12 May indicated that the direction of growth had switched towards the NE. On 12-13 May several pyroclastic flows were observed on the N and NW flanks of the dome in the area of Farrell's Plain and in the upper reaches of Tyre's Ghaut. During 16-23 May, rockfalls and pyroclastic flows continued along the N side of the Tar River Valley and White's Ghaut with a number of pyroclastic flows reaching the tops of Farrell's Plain, Tyre's Ghaut, and Tuitt's Ghaut. Pulses of vigorous ash-venting were observed on the summit during clear periods, and intense glow was seen on the summit and NE flanks during the nights of 20-21 May. Clear views of the summit region during an observation flight on 29 May showed that the NE lobe, which had developed over the previous few weeks, was broken up and the summit was irregular and blocky. Lava-dome growth was more centralized, building vertically and accumulating debris in the summit region.
Activity during June 2003. The dome's E and NE flanks continued producing rockfalls and pyroclastic flows into the Tar River Valley, and occasionally White's Ghaut or Tuitt's Ghaut. On the morning of 3 June, a period of increased activity on the NW flank of the dome produced many rockfalls; three pyroclastic flows entered Tyre's Ghaut. Clear views of the summit on 5 June revealed that the active lobe had a well-developed whale-back shape inclined gently upwards towards the E from the summit center. Activity decreased to low levels during the week of 6-13 June and remained low until the last week of the month. Brief views of the summit revealed that the well-developed extrusion lobe on the E side persisted. The focus of activity continued to be on the E and NE flanks of the dome, producing sporadic rockfalls and a few pyroclastic flows in the Tar River Valley, White's Ghaut, and Tuitt's Ghaut. Hybrid earthquakes developed into a diffuse swarm on 22-23 June, with some of the larger events at depths of ~3 km beneath the lava dome. During the last week of June pyroclastic flow and rockfall activity was focused on the N flank with most flows entering Tuitt's Ghaut, and to a lesser extent, Tyre's and White's ghauts. Sporadic flows also occurred in the Gages area on the W side of the dome.
Information Contacts: Montserrat Volcano Observatory (MVO), Mongo Hill, Montserrat, West Indies (URL: http://www. mvo.ms/); Washington Volcanic Ash Advisory Center (VAAC), Satellite Analysis Branch (SAB), NOAA/NESDIS E/SP23, NOAA Science Center Room 401, 5200 Auth Road, Camp Springs, MD 20746, USA (URL: http://www.ospo.noaa.gov/Products/atmosphere/vaac/).
Changes in activity style and dome growth since February 2002
Although detailed reports about the activity and monitoring of Soufrière Hills are provided on a regular basis by the Montserrat Volcano Observatory, this report contains observations made by visitors Stephen O'Meara and Robert Benward. They monitored Soufrière Hills visually and, using some novel electronics, collected data and images for 12 days beginning on 7 February 2003. This visit was similar to one in February 2002 (BGVN 27:06).
The visual observations took place primarily on Jack Boy Hill, 6 km N of the volcano. At the new Montserrat Volcano Observatory, Benward set up a black and white CCD video camera that took a frame every eight (8) seconds and relayed it to a digital video recorder. The camera's low-light sensitivity provided round-the-clock surveillance of dome activity. However, orographic and rain clouds caused problems, and much of the volcanic activity was away from the camera view.
Since the visit in 2002, the dome had increased significantly in size (figure 56). The rockfalls and pyroclastic flows that dominated the activity in February 2002 were concentrated in the E portions of the dome and the Tar River Valley. In 2003, activity occurred in a broader arc that extended from Tar River in the E to Farrell's Plain in the N. Several pyroclastic flows traveled into Tuitt's Ghaut and the upper reaches of Tyre's Ghaut, and onto Farrell's Plain. These events were captured on the surveillance camera and in higher-definition color video taken from Jack Boy Hill.
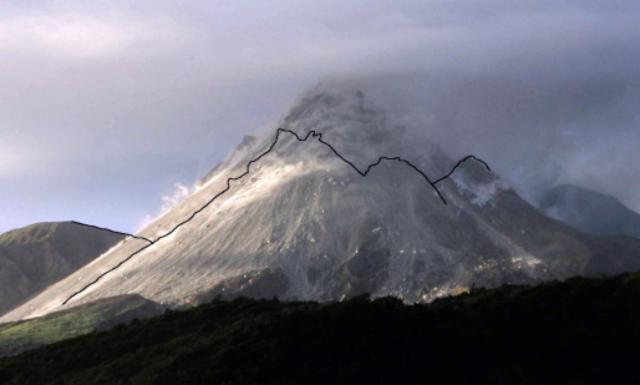 |
Figure 56. Illustration of dome growth at Soufriere Hills between February 2002 and February 2003. The outline of the volcano's profile in February 2002 is superimposed on a photograph taken at the same location in February 2003. Courtesy of Robert Benward, Volcano Watch International. |
The dome was impressive at night. The summit was often crowned with thick, blocky spines and sharp pinnacles. An array of spiny ridges (speckled with incandescence) that lined the upper portions of the dome helped channelize many of the rockfalls and pyroclastic flows, the flow channels remaining incandescent. The glow was strong throughout the observation period, but especially during 13-19 February, when episodes of prolonged activity made the dome appear to be melting like candle wax. The glowing dome could be seen from the northernmost reaches of the island at night. Its light was so intense that a homemade spectrograph (attached to a 3-inch telescope brought by Benward) revealed a continuous spectrum.
O'Meara visually observed the dome through a 60 power, 60 mm refractor scope and noticed two curious phenomena. At one point, a mass of viscous, but mobile, lava pushed out of the downslope edge of an incandescent ridge. It slumped onto the dome and formed a pad of molten material that quickly cooled and solidified into linear veins. The behavior was similar to that of a budding toe of pahoehoe lava where internal pressure forces fluid lava through its cooling skin. O'Meara also observed what appeared to be a tiny lateral explosion from the downslope edge of an incandescent ridge which shot out glowing gas and rock fragments like buckshot from a gun.
A significant difference in the style of eruption from that reported in 2002 was the periodic mass dumping of dome material. During these episodes, dome material calved off the highest portions of the dome, creating a wide avalanche of incandescent material which flowed down much of the dome's visible face in a matter of seconds. These episodes differed from the classical pyroclastic flows in that they produced comparatively little ash, being comprised principally of extremely massive and widespread rock and block fall.
A dramatic episode of rockfall and pyroclastic-flow activity occurred during 1745-2000 on 13 February. Massive movement of large, house-sized blocks, many of which self-destructed during their descent, preceded the pyroclastic flows. The subsequent pyroclastic flow activity was accompanied by roiling steel-gray ash clouds that drifted N. One particularly strong pyroclastic flow created an incandescent channel in Tuitt's Ghaut that glowed long into the night. Smaller pyroclastic flows followed this channel downslope, while larger ones overflowed the channel's levees or changed course. Often, when one flow slowed, another would push through it. At times pieces of incandescent rocks appeared to be sliding down the dome in the flow with no detectable rolling motion. At other times, linear threads of glowing gases appeared to advance like the treads of a tank. Another series of pyroclastic flows during 0614-0730 on 14 February were directed N, and spread out across Farrell's Plain. As in February 2002, the night activity was most spectacular when viewed and videotaped in the near-IR using Benward's homemade nightscope.
One purpose of the visit was to chronicle changes in visible behavior when the full Moon approached Earth and at perigee. With the approach of the full Moon, the team reported an apparent rise in the number of visible indicators, particularly an increase in the number of large and prolonged rockfalls and pyroclastic flows, and in the average number of events per hour. There was an impressive episode of spine growth in the 24 hours near the time of full Moon, similar to that in 2002. The limited duration of the observations, however, thwart conclusions about the relationships between lunar positions and volcanism. Convincing theories require baseline data over a considerably longer time period.
Information Contacts: Steve and Donna O'Meara, and Robert Benward, Volcano Watch International, PO Box 218, Volcano, HI 96785, USA.
Major dome collapse and explosive activity during 12-13 July
Activity at Soufriere Hills has been high over recent months, culminating in the collapse of a major dome and explosive activity during 12-13 July 2003. A summary of reports by the Montserrat Volcano Observatory (MVO) from 27 June to 12 September 2003 is provided below, with sulphur dioxide emissions and activity data (table 48).
Table 48. Summary of activity at Soufriere Hills, 2 May-12 September 2003. Activity occurred as summarized above, with the addition of three explosion signals during 11-18 August. Courtesy of the Montserrat Volcano Observatory.
| Date | Rockfall | Long-period / Rockfall | Long-period | Hybrid | Volcano-tectonic |
| 02 May-09 May 2003 | 767 | 88 | 138 | 7 | 2 |
| 09 May-16 May 2003 | 580 | 65 | 55 | 7 | -- |
| 16 May-23 May 2003 | 774 | 75 | 81 | 8 | 2 |
| 30 May-06 Jun 2003 | 445 | 34 | 40 | 5 | 1 |
| 06 Jun-13 Jun 2003 | 79 | 8 | 16 | 6 | 2 |
| 13 Jun-20 Jun 2003 | 48 | 10 | -- | 55 | -- |
| 20 Jun-27 Jun 2003 | 54 | 4 | 2 | 135 | 1 |
| 27 Jun-04 Jul 2003 | 193 | 61 | 7 | 37 | -- |
| 04 Jul-11 Jul 2003 | 156 | 12 | 38 | 9 | -- |
| 11 Jul-18 Jul 2003 | 58 | 3 | 24 | 84 | 1 |
| 18 Jul-25 Jul 2003 | -- | 6 | 5 | 21 | -- |
| 25 Jul-01 Aug 2003 | 34 | -- | 5 | 30 | -- |
| 01 Aug-08 Aug 2003 | 25 | -- | 5 | 35 | -- |
| 08 Aug-15 Aug 2003 | 12 | -- | 7 | 38 | 2 |
| 15 Aug-22 Aug 2003 | 5 | 1 | 6 | 39 | -- |
| 22 Aug-29 Aug 2003 | 7 | -- | 2 | 26 | -- |
| 29 Aug-05 Sep 2003 | 4 | -- | -- | 18 | -- |
| 05 Sep-12 Sep 2003 | 2 | -- | 3 | 27 | -- |
Activity was generally at a moderate level in early May, increasing over 7-9 May and remaining high through 23 May. Activity mainly focused towards the NE, with rockfalls and numerous pyroclastic flows along the N side of the Tar River and in the Tar River Valley. On 12 and 13 May, flows were seen on the N and NW flanks in the area of Farrell's Plain and the upper reaches of Tyre's Ghaut. During 21-23 May there was increased activity on the N flanks, with a number of pyroclastic flows into the top of Farrell's Plain, Tyre's Ghaut, and Tuitt's Ghaut. Pulses of vigorous ash venting were observed at the summit, and intense glow on the summit and NE flanks was seen on the nights of 20 and 21 May. Sulfur emissions varied during May, with a high of 744 metric tons/day (t/d) (8.6 kg/s) on 14 May and a low of 300 t/d (3.4 kg/s) on 18 May. Extreme highs of 850 t/d (9.9 kg/s) and 820 t/d (9.5 kg/s) occurred on 4 and 9 May, respectively.
During the first week of June, activity was variable, generally declining to a moderately low level. Most activity through 6 June was focused on the E and NE flank, producing rockfalls and numerous pyroclastic flows in the Tar River Valley and occasionally in White's Ghaut and Tuitt's Ghaut. Activity during the week ending 13 June decreased to a low level, and remained low through 27 June, increasing over 26-27 June on the N flanks. Hybrid earthquake activity developed into a diffuse swarm on 22-23 June, some events at depths of 3 km below the lava dome. SO2 emissions were relatively stable in June, varying between 240 t/d (2.8 kg/s) and 540 t/d (6.3 kg/s).
Sulfur emissions varied between 260 t/d (3 kg/s) and 585 t/d (6.8 kg/s) in July, but jumped to 840 t/d (9.7 kg/s) on 2 July. This could be related to increased activity during the first week of July, with pyroclastic flow and rockfall activity focused on the N flanks of the dome. Most flows occurred in Tuitt's Ghaut, with some in Tyre's Ghaut and White's Ghaut. Sporadic flows also occurred on the W side of the dome in the Gages area.
Activity remained high over the week ending 11 July, with a swarm of several thousand small hybrid earthquakes, at a rate of 1-2 per minute, commencing in the early hours of 9 July. While the size of these earthquakes increased slowly, individual events were below the normal recording threshold. The swarm of hybrid earthquakes intensified slightly over the night of 11 July, with events becoming larger and more closely spaced. Glimpses of the N part of the dome complex on 10 and 11 July confirmed that dome growth switched to the N, as was also shown by the northerly focus to the rockfalls and pyroclastic flows. Pyroclastic flows occurred most frequently in White's Ghaut, Tar River Valley, and Tuitt's Ghaut, with several small flows in Tyre's Ghaut earlier in the week.
By the morning of 12 July, events in the earthquake swarm merged into a continuous tremor signal. A period of prolonged and heavy rainfall between 0600 and 0900 caused mudflows in the Belham Valley. Small pyroclastic flows, the first of which were pale and weakly convective, occurred in the Tar River Valley. Flow activity built slowly through the afternoon until it was almost continuous. There were marked increases in the intensity of the activity at 1827 and again at 2007. Some flows traveled more than 2 km over the surface of the sea at the mouth of the Tar River Valley. Pyroclastic flows also reached the sea in White's Ghaut and the Spanish Point area. These flows resulted in the extremely heavy fallout of ash and accretionary lapilli over the island, particularly S of Woodlands.
A number of explosive events took place towards the end of the dome collapse of 12 July, with the largest occurring between 2300 and midnight. Showers of rock fragments fell on the island, with dense rocks up to 60 mm in diameter recorded. The Washington Volcanic Ash Advisory Center (VAAC) provided a column height of around 16 km for this event. The activity persisted at a high level until around 0200 on 13 July. It began subsiding slowly, declining to very low levels by the following morning, when a sudden Vulcanian explosion occurred from the lava dome. Two more explosions occurred in the next two days, producing pumice that reached 15 cm in size at Richmond Hill (~5 km W) and 4 cm in Olveston. Heavy ashfall from the collapse was experienced over all the inhabited parts of Montserrat, with the greatest thickness (over 15 cm) recorded at Vue Pointe Hotel. North of St Peter's the thickness was less than 1 cm.
The bulk of the dome structure was removed in the collapse, and pyroclastic flows impacted the area between Tar River Valley and Spanish Point. The activity destroyed GPS sites at White's Yard and Hermitage, and a camera site at White's Yard. Solar panels were smashed by falling rocks at Spring Estate GPS site and at Garibaldi Hill. After the collapse, sulfur-dioxide emissions jumped to highs between 1,030 t/d (12 kg/s) and 1,720 t/d (20 kg/s), much higher than any other readings over the past several weeks.
Activity was extremely low through 1 August with only a few events triggering the seismic network. The restrictions of the October 2002 exclusion zone were lifted on 1 August. The pattern of earthquakes through the week of 25 July indicated that dome growth within the explosion crater probably restarted, although it was not possible to confirm this visually due to low clouds. Intense activity began at 0608 on 1 August with an episode of powerful ash venting. There were many strong bursts of gas release and jets of ash; the plume rose to over 3.2 km. This activity declined to very low levels about 0730. Another episode of gas venting began at 0834.
Over the next week activity fluctuated, with periods of relative quiet separating episodes of intense degassing and hybrid earthquake activity. At the beginning of the week the volcano was extremely active with intense ash venting from the explosion crater. It was then fairly quiet with occasional rockfalls and hybrid earthquakes. A good view of the new dome was obtained from the air on 5 August, showing a small southerly directed lobe growing extremely slowly, if at all. Earthquake activity increased on the evening of 7 August with eight large hybrid events occurring overnight.
Through 22 August activity was at low levels; the dome remained a small lobe just over 100 m across. Several small slumps from the interior wall of the 12 July collapse scar produced small rockfalls, light ash in the plume, and the formation of some large fumaroles. By 29 August new fumaroles opened SE of the main explosion crater, towards the upper parts of the Tar River Valley. A strong sulphurous smell and blue haze N of the volcano did not reflect increased activity. SO2 emissions in August were again variable, with a low of 450 t/d (5.4 kg/s) on 6 August and highs approaching 2,500 t/d (29 kg/s) the following week.
Through the latter part of the week ending 5 September, the gas plume was out of reach of the spectrometer network due to winds from Hurricane Fabian. Activity remained low through 12 September, but several episodes of ash venting occurred with a few small earthquakes.
Information Contacts: Richard Herd, Montserrat Volcano Observatory, Fleming, Montserrat, West Indies (URL: http://www.mvo.ms/).
Low-level seismicity; ash venting 30 September-1 October
Activity at Soufriére Hills remained at a relatively low level from mid-September into early November 2003. Seismicity consisted mostly of hybrid earthquakes and rockfall signals (table 49). Access continues to be prohibited to some areas after the major dome collapse and explosive activity of 12-13 July 2003 (BGVN 28:08), and there is a maritime exclusion zone around the S part of the island extending 3.7 km beyond the coastline from Trant's Bay in the E to Isles Bay on the W coast.
Table 49. Summary of seismic activity at Soufriére Hills, 5 September-7 November 2003. No volcano-tectonic earthquakes were recorded during this period, but one long-period rockfall event occurred 23-31 October. Courtesy of the Montserrat Volcano Observatory.
| Date | Rockfall | Long-period | Hybrid |
| 05 Sep-12 Sep 2003 | 2 | 3 | 27 |
| 12 Sep-19 Sep 2003 | 9 | 4 | 20 |
| 19 Sep-26 Sep 2003 | 13 | 1 | 20 |
| 26 Sep-03 Oct 2003 | 4 | -- | 241 |
| 03 Oct-10 Oct 2003 | 1 | -- | 15 |
| 10 Oct-17 Oct 2003 | 12 | -- | 9 |
| 17 Oct-24 Oct 2003 | 8 | 2 | 12 |
| 24 Oct-31 Oct 2003 | 11 | 2 | 19 |
| 31 Oct-07 Nov 2003 | 8 | -- | 16 |
During the week of 12-19 September, no growth of the new lava dome was observed. Activity was at a slightly higher level during the week of 26 September-3 October, especially hybrid earthquakes, most of which occurred in a swarm between 1100 and 2100 on 27 September. Some of the hybrids could be located at 2-4 km depth. A period of low-amplitude tremor was also recorded between 0800 on 30 September and 0400 on 1 October coincident with vigorous ash venting, which resulted in ash clouds reaching 2,000-2,500 m altitude and drifting W over Plymouth. Observations on 30 September and 3 October suggested that no new dome growth had occurred.
From 3 October to 7 November, activity returned to a low level. A period of low-amplitude tremor was recorded between 3 and 8 October, and some mudflow signals were also recorded during periods of heavy rain. The tremor coincided with light ash venting. Visibility was poor during this period, so no direct observations of the summit area were possible. The dome was observed clearly on 23 October and a volume survey was carried out from Galways and Perches Mountains. The small dome that extruded in July 2003 had not grown further and appeared to be stagnant, with alteration and degradation occurring such that it appears to be breaking up. The pit crater associated with the explosions of July 2003 had widened slightly, although this was thought to be due to passive slumping of material. Sulfur dioxide and hydrogen chloride emission rates were high during several days around 13-15 October and on 22 October (table 50). An observation flight on 28 October yielded clear views of the scar area and the W scar wall. No changes were observed in the morphology of the scar and no new lava was observed in the vent area.
Table 50. Gas emissions at Soufriere Hills, 5 September-7 November 2003. Hydrogen chloride emissions are calculated from hydrogen chloride to sulfur dioxide mass ratios measured in the volcanic plume using Fourier transform infrared. Values are in metric tons/day. Courtesy of the Montserrat Volcano Observatory.
| Date | SO2 emissions (tons/day) | HCI emissions (tons/day) |
| 12 Sep-19 Sep 2003 | 700-900 | 230-300 |
| 19 Sep-26 Sep 2003 | 500-600 | -- |
| 26 Sep-28 Sep 2003 | 400-500 | -- |
| 28 Sep-01 Oct 2003 | 900-1,200 | -- |
| 04 Oct 2003 | 3,100 | -- |
| 05 Oct 2003 | 1,900 | -- |
| 06 Oct-08 Oct 2003 | 800-1,200 | -- |
| 04 and 07 Oct 2003 | -- | 600-1,000 |
| 10 Oct-12 Oct 2003 | 600-800 | -- |
| 13 Oct 2003 | 1,900 | -- |
| 16 Oct 2003 | 720 | -- |
| 17 Oct-24 Oct 2003 | 950-1,200 | -- |
| 22 Oct 2003 | 1,850 | 1,500 |
| 24 Oct-27 Oct 2003 | 800-900 | -- |
| 28 Oct-31 Oct 2003 | 400-600 | -- |
| 31 Oct-07 Nov 2003 | 800-1,350 | -- |
According to the Washington VAAC, on 1 November resuspended ash was seen in satellite imagery. The ash was moving N to NNW at ~10 km/hour from Montserrat between Nevis and Antigua, and the resuspended ash was concentrated in a narrow plume.
Information Contacts: Montserrat Volcano Observatory (MVO), Mongo Hill, Montserrat, West Indies (URL: http://www.mvo.ms/); Washington Volcanic Ash Advisory Center (VAAC), Satellite Analysis Branch (SAB), NOAA/NESDIS E/SP23, NOAA Science Center Room 401, 5200 Auth Road, Camp Springs, MD 20746, USA (URL: http://www.ospo.noaa.gov/Products/atmosphere/vaac/).
Dome growth ceased after July 2003 and remained absent 6 months later
Weekly summaries of seismic activity at Soufrière Hills for the period 7 November 2003 to 16 January 2004 are given in table 51. During the week of 14 to 21 November a prominent swarm of hybrid earthquakes lasted for three days. Good views and surveys of the dome during this week confirmed that no growth or changes took place. On 9 December and on 31 December 2003 swarms of small hybrid earthquakes were observed on the drum records, but most of the events were too small to be recorded on the network. Visual observations confirmed that no new dome growth has occurred in the crater since July 2003, although there has been some slumping of old dome material from the crater walls, and degradation of the wall rocks by steam activity.
Table 51. Summary of seismicity recorded at Soufrière Hills, 7 November 2003 to 15 January 2004. Courtesy of Montserrat Volcano Observatory.
| Date | Rockfall | Long-period / Rockfall | Long-period | Hybrid | Volcano-tectonic |
| 07 Nov-13 Nov 2003 | 1 | 3 | 1 | 36 | -- |
| 14 Nov-20 Nov 2003 | 7 | -- | 13 | 287 | 4 |
| 21 Nov-27 Nov 2003 | 5 | -- | 1 | 50 | 1 |
| 28 Nov-04 Dec 2003 | 1 | -- | -- | 12 | 0 |
| 05 Dec-11 Dec 2003 | -- | -- | 4 | 13 | -- |
| 12 Dec-18 Dec 2003 | 2 | -- | -- | 12 | -- |
| 19 Dec-25 Dec 2003 | 1 | -- | -- | 2 | -- |
| 26 Dec-01 Jan 2004 | 2 | -- | -- | 9 | -- |
| 02 Jan-08 Jan 2004 | 2 | -- | -- | 2 | -- |
| 09 Jan-15 Jan 2004 | 5 | -- | 1 | 18 | -- |
Table 52 shows a summary of the gas emissions (mainly sulfur dioxide, but one HCl estimate for 18 December). Instrument problems or unfavorable wind directions disrupted measurements for a number of days during the report interval (dashed lines).
Table 52. Summary of gas emissions recorded at Soufrière Hills, 7 November 2003 to 16 January 2004. The HCl data listed were collected on 18 December. Courtesy of Montserrat Volcano Observatory.
| Date | SO2 emissions (tons/day) | HCI emissions (tons/day) |
| 07 Nov-13 Nov 2003 | 200-800 | -- |
| 14 Nov-21 Nov 2003 | 260-450 | -- |
| 21 Nov-27 Nov 2003 | 500 | -- |
| 28 Nov-04 Dec 2003 | 300-600 | -- |
| 05 Dec-11 Dec 2003 | 300-900 | -- |
| 12 Dec-18 Dec 2003 | 500-3,600 | 1,260 (HCl:SO2 = 0.35) |
| 19 Dec-25 Dec 2003 | -- | -- |
| 26 Dec-01 Jan 2004 | 500 | -- |
| 02 Jan-08 Jan 2004 | 300 | -- |
| 09 Jan-15 Jan 2004 | 200-590 | -- |
Information Contacts: Gill Norton, Montserrat Volcano Observatory (MVO), Mongo Hill, Montserrat, West Indies (URL: http://www.mvo.ms/).
Ash to 7 km altitude on 3 March 2004; pyroclastic flows reached the sea
The Soufrière Hills volcano was quiet for the last few months of 2003, following activity in May and July that included significant dome growth (BGVN 28:10 and 28:12). Light ash-venting had last occurred during a period of low-amplitude tremor 3-8 October. A seismic event in mid-January 2004 and a period of tremor and mudflow activity in late February 2004 were followed by renewed eruptive activity on 3 March 2004.
Between 1 October and 18 December 2003 no dome growth was observed, and only a few earthquakes per week were recorded. Beginning 18 December 2003, SO2 emissions increased markedly from the previous month's average of 500 tons/day (t/d), reaching 3,600 t/d (see table 53). On 18 January 2004, a swarm of low-amplitude long-period (LP) earthquakes began, with ~1,000 separate events over an interval of 36 hours. Fewer than 40 of these earthquakes triggered the automatic seismic-detection systems. Another swarm occurred on 30 January, this time lasting about 30 hours. Again, instruments recorded ~1,000 separate events; these, however, were much weaker and only four triggered the detection systems.
Table 53. Summary of SO2 emissions recorded at Soufrière Hills, 5 December 2003 to 12 March 2004, using an array of three scanning UV spectrometers. Courtesy of Montserrat Volcano Observatory.
| Date | SO2 emissions (metric tons/day) |
| 05 Dec-11 Dec 2003 | 300-900 |
| 12 Dec-18 Dec 2003 | 500-3,600 |
| 19 Dec-25 Dec 2003 | -- |
| 26 Dec-01 Jan 2004 | 500 |
| 02 Jan-08 Jan 2004 | 300 |
| 09 Jan-15 Jan 2004 | 200-590 |
| 16 Jan-22 Jan 2004 | 440 on 22 January (equipment servicing on other days) |
| 23 Jan-29 Jan 2004 | 500-700 |
| 30 Jan-05 Feb 2004 | 439-1017 |
| 06 Feb-12 Feb 2004 | 350-450 |
| 13 Feb-19 Feb 2004 | 350-650 |
| 20 Feb-26 Feb 2004 | 496-920 |
| 27 Feb-04 Mar 2004 | 480-820 |
| 05 Mar-12 Mar 2004 | 340-1250 |
A period of low-level tremor, consisting of many small LP earthquakes, lasted for about 36 hours beginning 21 February. On 24 February heavy rainfall (10 mm in 2.5 hours) resulted in mudflow activity in the Belham valley; signs of mudflows were also observed in Plymouth.
Beginning the week of 27 February, activity increased significantly. On 2 March, a period of low-level tremor included some small hybrid earthquakes. The tremor continued until afternoon on 3 March, when, at around 1444, seismicity greatly increased and an explosion and collapse event occurred. According to reports from the Montserrat Volcano Observatory (MVO) this was the most significant event since the collapse event of 12-13 July 2003.
The event on 3 March 2004 produced ash clouds that reached altitudes of about 7 km above sea level, and pyroclastic flows were observed in the Tar River, with at least two incidents of flows reaching the sea. Seismicity returned to close to background levels by 1525, but vigorous ash venting continued until the following morning. Low-level tremor accompanied by hybrid earthquakes continued for the next 18 hours, including a series of hybrid earthquakes during the evening of 3 March.
Visual observations first suggested that the 3 March explosion removed the small dome that had grown in the collapse scar in late July 2003. Photographs taken on 28 February and 5 March showed the 3 March collapse to have also removed part of the NW dome remnant originally built up during 1995-1998.
After 3 March, activity remained elevated for several days. A period of low-level tremor occurred on 4 March, beginning at around 1300 and lasting three hours. On 5 March a small explosion was recorded at 1009, followed by a period of ash venting. Between 5 and 12 March activity returned to lower levels, with 1 LP and 15 hybrid earthquakes recorded. On 10 March, however, there was a short (10-20 minutes) period of elevated seismicity early in the morning; later in the day fresh pyroclastic-flow deposits were observed in the upper reaches of the Tar River Valley. During the second half of the week, short episodes of ash and steam venting were periodically observed, and ash fallout occurred as far N as St. Georges Hill.
On 15 March, the Washington VAAC reported a plume of ash extending to the W from the summit. The following day MVO reported a plume extending 250 km (135 nautical miles) W of the volcano. SO2 emissions fluctuated during February and the first two weeks of March, peaking at 1017 t/d on 1 February and 1250 t/d on 9 March (table 2).
A beautifully illustrated look at the eruption from 1995 to present is now available (Kokelaar, 2002; Druitt and Kokellar, 2002).
References. Kokelaar, B.P., 2002, Setting, chronology and consequences of the eruption of Soufrière Hills Volcano, Montserrat (1995-1999), in Druitt, T.H. and Kokelaar, B.P., eds., 2002: The eruption of the Soufrière Hills Volcano, Montserrat from 1995 to 1999. Geological Society London, Memoir No. 21, p. 1-43.
Druitt, T.H. and Kokelaar, B.P., eds., 2002: The eruption of the Soufrière Hills Volcano, Montserrat from 1995 to 1999. Geological Society London.
Information Contacts: Montserrat Volcano Observatory (MVO), Fleming, Montserrat, West Indies (URL: http://www.mvo.ms/); Washington Volcanic Ash Advisory Center (VAAC), Satellite Analysis Branch (SAB), NOAA/NESDIS E/SP23, NOAA Science Center Room 401, 5200 Auth Rd, Camp Springs, MD 20746, USA (URL: http://www.ssd.noaa.gov).
Seismicity generally low except for one dome-disrupting explosion
Although seismicity and volcanism were generally low during this reporting interval, mid-January to early June 2004, several episodes of elevated activity occurred. Weekly summaries for the early part of 2004 are presented in tables 54 and 55. The tables include a summary of seismicity, SO2 emissions, and forward-looking infrared (FLIR) measurements of the HCl/SO2 ratio.
Table 54. Summary of seismicity recorded at Soufrière Hills, 16 January to 4 June 2004. Courtesy of Montserrat Volcano Observatory.
| Date | Activity Level | Rockfall | Long-period | Hybrid | Volcano-tectonic |
| 16 Jan-23 Jan 2004 | Low | 1 | 38 | 9 | 1 |
| 23 Jan-30 Jan 2004 | Very low | 8 | 1 | 10 | 1 |
| 30 Jan-06 Feb 2004 | Low | 15 | 7 | 9 | 1 |
| 06 Feb-13 Feb 2004 | Low | -- | -- | 3 | 1 |
| 13 Feb-20 Feb 2004 | Low | 1 | -- | 3 | -- |
| 20 Feb-27 Feb 2004 | Low | 3 | 2 | 5 | -- |
| 27 Feb-05 Mar 2004 | Increased | 4 | 1 | 38 | -- |
| 05 Mar-12 Mar 2004 | Low | -- | 1 | 15 | -- |
| 12 Mar-19 Mar 2004 | Increased | 1 | 4 | 6 | 6 |
| 19 Mar-26 Mar 2004 | Elevated | -- | 4 | 7 | -- |
| 26 Mar-02 Apr 2004 | Moderate | 1 | 1 | 1 | -- |
| 02 Apr-09 Apr 2004 | Low to moderate | 5 | 1 | -- | -- |
| 09 Apr-16 Apr 2004 | Low | 1 | 1 | -- | -- |
| 16 Apr-23 Apr 2004 | Low | -- | 5 | 14 | -- |
| 23 Apr-30 Apr 2004 | Low | -- | 3 | 5 | -- |
| 30 Apr-07 May 2004 | Low | -- | -- | 1 | -- |
| 07 May-14 May 2004 | Low | -- | -- | 1 | -- |
| 14 May-21 May 2004 | Low | -- | -- | 1 | -- |
| 21 May-28 May 2004 | Low | -- | -- | 7 (and 44 'mixed') | -- |
| 28 May-04 Jun 2004 | Low | -- | -- | 4 (and 16 'mixed') | -- |
On 18 January a low-amplitude swarm of long-period (LP) earthquakes comprised of 1000 separate events began and continued for ~36 hours. A similar swarm occurred on 30 January, lasting for ~30 hours. On 21 February a period of low-level tremor, including many small LP earthquakes, began at ~0600 and continued for ~36 hours.
A period of low-level tremor began on 2 March and continued until 1444 on 3 March when seismic activity increased significantly and an explosion and collapse event occurred. According to the Washington Volcanic Ash Advisory Center (VAAC), the ash clouds associated with the explosion reached an altitude of ~7 km. During 1445-1500 pyroclastic flows were observed in the Tar River, reaching the sea at the Tar River fan on at least two occasions. Seismicity returned to near background levels by 1525, but vigorous ash venting continued until ~0700 on 4 March. Visual observations reported that the explosion removed the small dome that had grown in the collapse scar in late July 2003, as well as a portion of the NW remnant of the 1995-1998 dome.
[A small amount of ash venting from the volcano's summit occurred on 2 May around 1815.] Episodes of tremor . . . continued until 7 May. During this period, tremor amplitude varied from low to moderate, and tremor duration varied from several days (continuous background) to a few seconds. Tremor peak frequencies were in the 1-10 Hz range. Subsequently, the activity level was low (table 54). The SO2 flux level dropped to 146 metric tons/day on 13 May (table 55), the lowest value recorded since before the collapse event of 12-15 July 2003. For the remainder of the report period, activity remained at a low level. The seismic network recorded several hybrid earthquakes but also a number of 'mixed' events, characterized by emergent onsets and relatively short durations (~30 seconds) with broad frequency spectra (1-10 Hz), peaking at ~10 Hz.
Table 55. Summary of SO2 emissions and the HCl/SO2 ratio recorded at SoufriPre Hills, 16 January to 4 June 2004. Courtesy of Montserrat Volcano Observatory.
| Date | SO2 (metric tons/day) | HCI / SO2 ratio |
| 16 Jan-23 Jan 2004 | 440 | 0.36-0.41 |
| 23 Jan-30 Jan 2004 | 500-700 | 0.33-0.37 |
| 30 Jan-06 Feb 2004 | 439-726 | -- |
| 06 Feb-13 Feb 2004 | 350-450 | 0.32 |
| 13 Feb-20 Feb 2004 | -- | -- |
| 20 Feb-27 Feb 2004 | 496-920 | -- |
| 27 Feb-05 Mar 2004 | 480-820 | -- |
| 05 Mar-12 Mar 2004 | 330-1250 | 0.47 |
| 12 Mar-19 Mar 2004 | 470-755 | -- |
| 19 Mar-26 Mar 2004 | 370-550 | 0.53-0.66 |
| 26 Mar-02 Apr 2004 | 440-480 | -- |
| 02 Apr-09 Apr 2004 | 150-720 | -- |
| 09 Apr-16 Apr 2004 | 540-870 | -- |
| 16 Apr-23 Apr 2004 | 1030 | -- |
| 23 Apr-30 Apr 2004 | 155-290 | 0.49 |
| 30 Apr-07 May 2004 | 200-672 | 0.30 |
| 07 May-14 May 2004 | 146-695 | -- |
| 14 May-21 May 2004 | 182-428 | -- |
| 21 May-28 May 2004 | 255-922 | 0.60 |
| 28 May-04 Jun 2004 | 179-496 | -- |
Information Contacts: Gill Norton, Montserrat Volcano Observatory (MVO), Mongo Hill, Montserrat, West Indies (URL: http://www.mvo.ms/).
Generally low activity; small lake forms in summit crater
According to reports issued by the Montserrat Volcano Observatory (MVO), activity at Soufrière Hills volcano remained low during 21 May-10 September 2004, becoming slightly elevated from 10 September-15 October 2004. Minor events during this period included mudflows, rockfalls, and several small, shallow earthquakes originating at upper regions of the lava dome and conduit.
On 21 May 2004, heavy rainfall caused large mudflows for about two hours (1420 to 1636). The mudflows traveled into the Belham Valley, an area within the exclusion zone on the volcano's NW side, flooding the entire width of the valley floor at Belham bridge. Scientists from MVO noted that at the peak of flow, standing waves of mud reached 2 m high. Intense rains on 25 July, 14 September, and 16 September again caused up-slope erosion and mudflows descended into the Belham Valley.
Surface water from the intense rain of 21 May percolated into the subsurface of the hot dome and vent complex, converting into steam. Steam venting may have initiated the 44 mixed earthquakes recorded the week of 21-28 May (table 56). The earthquakes were short in duration (~ 30 seconds each), and their amplitude decay characteristics suggested that they originated at shallow depths within the remnant dome and at the top of the conduit. The term 'remnant dome' refers to the fact that the late May 2004 dome was considerably reduced in size compared to the dome of about a year before, in large part because of major collapse events on 12 July 2003 and 3 March 2004.
Table 56. Seismicity recorded at Soufrière Hills, 21 May to 15 October 2004. Courtesy of Montserrat Volcano Observatory.
| Date | Activity Level | Hybrid | Mixed | Volcano-tectonic | Long-period | Rockfall |
| 21 May-28 May 2004 | Low | 7 | 44 | -- | -- | -- |
| 28 May-04 Jun 2004 | Low | 4 | 16 | -- | -- | -- |
| 04 Jun-11 Jun 2004 | Low | 3 | 9 | -- | -- | -- |
| 11 Jun-18 Jun 2004 | Low | 5 | -- | -- | -- | 10 |
| 18 Jun-25 Jun 2004 | Low | 5 | -- | 6 | -- | 15 |
| 25 Jun-02 Jul 2004 | Low | 5 | -- | 6 | 2 | 8 |
| 02 Jul-09 Jul 2004 | Low | 8 | -- | 4 | -- | 10 |
| 09 Jul-16 Aug 2004 | Low | 6 | -- | 1 | 1 | 5 |
| 16 Jul-23 Jul 2004 | Low | 7 | -- | -- | -- | 7 |
| 23 Jul-30 Jul 2004 | Low | 2 | -- | -- | -- | 8 |
| 30 Jul-06 Aug 2004 | Low | 1 | -- | -- | -- | 8 |
| 06 Aug-13 Aug 2004 | Low | 1 | -- | -- | -- | 3 |
| 13 Aug-20 Aug 2004 | Low | 1 | -- | 1 | -- | 1 |
| 20 Aug-27 Aug 2004 | Low | 1 | -- | -- | -- | 1 |
| 27 Aug-03 Sep 2004 | Low | 2 | -- | -- | -- | -- |
| 03 Sep-10 Sep 2004 | Low | -- | -- | 1 | -- | 2 |
| 10 Sep-17 Sep 2004 | slightly elevated | 14 | -- | -- | 1 | 1 |
| 17 Sep-24 Sep 2004 | slightly elevated | 8 | -- | -- | 2 | 2 |
| 24 Sep-01 Oct 2004 | slightly elevated | 8 | -- | -- | 1 | 3 |
During 18-25 June, winds blew the volcanic plume NE, and the clouds over the volcano's summit lifted, making the tallest remnants of the dome complex visible for the first time since 7 May. Observers noted a loss of material from the upper regions of the dome due to rockfalls.
Later, on 30 August, MVO personnel on an observation flight discovered a small brown pond within the dome complex (figure 5). This pond was the first seen on the volcano since the beginning of its eruption in 1995. The pond lies in a small crater formed by an explosion and dome collapse on 3 March 2004 (figure 57). It probably developed following the cooling of deposits within the crater, and after recent heavy rainfall.
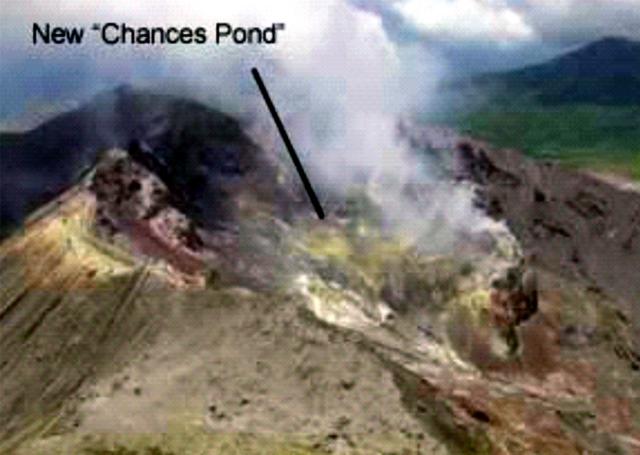 |
Figure 57. A view looking NW into English's crater during the week of 27 August 2004. Water collected in an explosion pit formed on 3 March 2004. The small brown water body became known as 'Chances pond.' Photo courtesy of Montserrat Volcano Observatory. |
Sulfur dioxide (SO2) emissions typically remained low throughout the period. Measured fluxes ranged between about 90 and 1,100 metric tons per day (table 57). Moderate fluctuations occurred during 21-24 May (225-922 metric tons/day) and 7-11 June (169-788 metric tons/day). During 2-9 July, SO2 emissions dropped to the lowest levels since the collapse event of 12-13 July 2003, and fell even lower during the weeks of 30 July and 17 September.
Table 57. SO2 gas flux estimates made at Soufrière Hills, 21 May to 15 October 2004. Courtesy of Montserrat Volcano Observatory.
| Date | SO2 emissions (tons/day) |
| 21 May-28 May 2004 | 225-922 |
| 28 May-04 Jun 2004 | 179-496 |
| 04 Jun-11 Jun 2004 | 169-788 |
| 11 Jun-18 Jun 2004 | 240-477 |
| 18 Jun-25 Jun 2004 | -- |
| 25 Jun-02 Jul 2004 | 177-364 |
| 02 Jul-09 Jul 2004 | 120-160 |
| 09 Jul-16 Aug 2004 | 222-243 |
| 16 Jul-23 Jul 2004 | 170-400 |
| 23 Jul-30 Jul 2004 | 175-300 |
| 30 Jul-06 Aug 2004 | 90-280 |
| 06 Aug-13 Aug 2004 | 126-296 |
| 13 Aug-20 Aug 2004 | 200-622 |
| 20 Aug-27 Aug 2004 | 175-311 |
| 27 Aug-03 Sep 2004 | 240-456 |
| 03 Sep-10 Sep 2004 | 175-405 |
| 10 Sep-17 Sep 2004 | 130-250 |
| 17 Sep-24 Sep 2004 | 87-454 |
| 24 Sep-01 Oct 2004 | 200-540 |
| 01 Oct-08 Oct 2004 | 187-1144 |
| 08 Oct-15 Oct 2004 | 156-553 |
Measurements of expansion made by dilatometers embedded on either side of the Soufriere Hills edifice suggested that in July, the volcano changed from contraction to slight expansion.
Information Contacts: Montserrat Volcano Observatory (MVO), Fleming, Montserrat, West Indies (URL: http://www.mvo.ms/).
Heavy rains cause frequent mudflows and increased seismicity
Table 58, taken from reports of the Monserrat Volcano Observatory (MVO), summarizes activity at Soufrière Hills between 1 October and 26 November. The activity level remained elevated during much of this time period due to increases in seismicity, gas emission, rainfall, and mudflows.
Table 58. Activity recorded at Soufrière Hills, 1 October to 26 November 2004. One of the gas-monitoring sites only functioned on 18 November. Courtesy of Montserrat Volcano Observatory (MVO).
| Date | Activity Level | Hybrid EQ's | Mixed EQ's | Volcano-tectonic EQ's | Long-period EQ's | SO2 emissions (tons/day) | Rockfalls |
| 01 Oct-08 Oct 2004 | elevated | 8 | -- | -- | 2 | 187-1144 | 1 |
| 08 Oct-15 Oct 2004 | elevated | 9 | -- | -- | -- | 156- 553 | 1 |
| 15 Oct-22 Oct 2004 | elevated | 49 | -- | 1 | -- | 250-1100 | 4 |
| 22 Oct-29 Oct 2004 | elevated | 40 | -- | 1 | -- | 320-370 | -- |
| 29 Oct-05 Nov 2004 | elevated | 33 | -- | 39 | -- | 140- 440 | 1 |
| 05 Nov-12 Nov 2004 | -- | 21 | -- | 14 | -- | 147- 225 | 3 |
| 12 Nov-19 Nov 2004 | -- | 12 | -- | 40 | 5 | 1111 | 3 |
| 19 Nov-26 Nov 2004 | -- | 25 | -- | 5 | 1 | 125-330 | 3 |
Heavy rains during the first six weeks of the reporting period led to steam venting, which triggered an increase in hybrid and volcanic-tectonic earthquakes. A large number of hybrid and volcano-tectonic (VT) earthquakes was recorded during most of October and early November. The most intense seismicity occurred during 2106-2216 on 12 November and 1335-1436 on 14 November.
Following the rains of 5-12 November, several fumaroles developed along the former Tuitt's Bottom and Pea Ghauts, but by 12 November, drier conditions prevailed and fumaroles diminished. Sulfur dioxide emissions remained low throughout most of the reporting period, however two surges in SO2 flux occurred during the weeks of 1 October and 15 October. Mudflows occurred since May. As heavy rainfall continued during October and November, more mudflows occurred. Nine separate mudflow events were recorded for this reporting period. The flows of 15, 19, 21, 22-29 October and 1, 3, 9, and 11 November were minor, though one of the flows, which traveled down the NW flank, reached the Belham River. A much heavier flow began around 0620 on 19 November, with a pulse occurring at 1138.
One MVO scientist deemed mudflows the "ongoing legacy of this [the 1995] eruption." Montserrat's rainy season typically continues until December, and more mudflows may occur in coming months. Mudflows have proven to be destructive, whether they have arisen from short, intense downpours or from a buildup over several rains. The example was given of mudflows after two hours of heavy rain on the afternoon of 21 May, which led to burial of the gateway to the Radio Antilles' offices.
MVO personnel made two observation flights during the reporting period (on 28 October and 4 November). Both flights confirmed the presence of the pond seen 30 August in the pit formed by the 3 March dome collapse. Looking into the crater, MVO scientists found no evidence of ongoing dome-building.
Information Contacts: Montserrat Volcano Observatory (MVO), Fleming, Montserrat, West Indies (URL: http://www.mvo.ms/).
Comparative quiet during 26 November 2004 to 4 March 2005
This report covers the period 26 November 2004 to 4 March 2005. Soufrière Hills volcano remained quiet after late November, with seismic signals, gas emissions, and rockfalls all decreasing (table 59 and BGVN 29:10).
Table 59. Geophysical and geochemical data recorded at Soufrière Hills, 26 November 2004 to 4 March 2005. Wind directions or trouble with gas-monitoring equipment prevented measurement of SO2 fluxes on some days. Courtesy of MVO.
| Date | Seismicity Level | Hybrid EQ's | Mixed EQ's | Volcano-tectonic EQ's | Long-period EQ's | SO2 flux (tons/day) | Rockfalls |
| 26 Nov-03 Dec 2004 | -- | 9 | -- | 7 | -- | 130-590 | 4 |
| 03 Dec-10 Dec 2004 | -- | 7 | -- | -- | -- | 250-370 | 1 |
| 10 Dec-17 Dec 2004 | -- | 6 | -- | 7 | -- | 290-450 | -- |
| 17 Dec-24 Dec 2004 | -- | 6 | -- | 1 | -- | 200-500 | -- |
| 24 Dec-31 Dec 2004 | -- | 6 | -- | 2 | 1 | 300-550 | -- |
| 31 Dec-07 Jan 2005 | -- | 4 | -- | -- | -- | 310-400 | -- |
| 07 Jan-14 Jan 2005 | -- | 5 | -- | 5 | -- | 180-511 | -- |
| 14 Jan-21 Jan 2005 | -- | 2 | -- | -- | -- | 300-3801 | 2 |
| 21 Jan-28 Jan 2005 | -- | 5 | -- | -- | 1 | 350-6701 | -- |
| 28 Jan-04 Feb 2005 | -- | 2 | -- | 1 | 7 | 4101 | -- |
| 04 Feb-11 Feb 2005 | low | -- | -- | -- | -- | -- | -- |
| 11 Feb-18 Feb 2005 | low | -- | -- | -- | -- | -- | -- |
| 18 Feb-25 Feb 2005 | low | -- | -- | -- | -- | 280-9801 | -- |
| 25 Feb-04 Mar 2005 | low | 6 | -- | 3 | -- | 6721 | 2 |
While volcanic-tectonic and hybrid earthquakes (as many as 40/week) shook SHV from mid-October to late November, few were recorded between late November and early March (table 1). During the week of 25 February, winds shifted and carried the smell of sulfur to northern parts of the island. However, SO2 emissions remained low and stable throughout December, January, and February. The average for this reporting period was ~ 400 tons/day, which is below the long-term average of 500 tons/day.
Rain and mudflows have also subsided. A mudflow in the Belham Valley on 15 December was the only event recorded for this reporting period.
An exceptionally clear day enabled scientists to obtain unusually clear photos on 1 February 2005 (figures 58, 59, and 60). Flights were made during November, December, and January as well. During the November-February interval, scientists saw relatively few changes in the surface morphology. Chances Pond, the pool of brownish water sitting in the explosion pit formed on 3 March 2004, still remained. MVO scientists noted around 26 November 2004 that the pond had changed from brownish to milky.
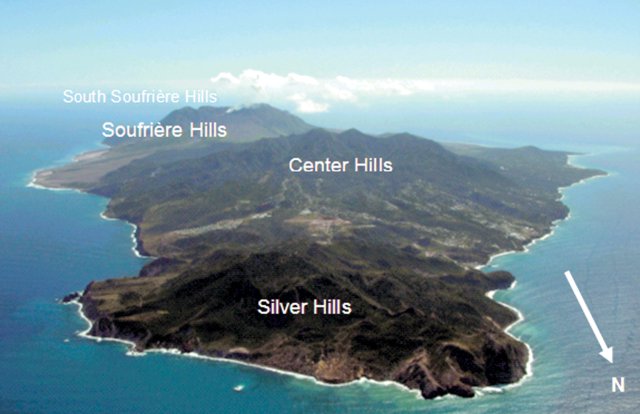 |
Figure 58. Montserrat from the NNE at an altitude of ~ 1,500 m, clearly showing the island's three main volcanic centers: the oldest and extinct Silver Hills (more than a million years old) in the foreground; the highest, densely foliated Centre Hills (also extinct, 0.5-1 million years old), and the steaming Soufrière Hills (220,000 years old), furthest away. Courtesy of MVO. |
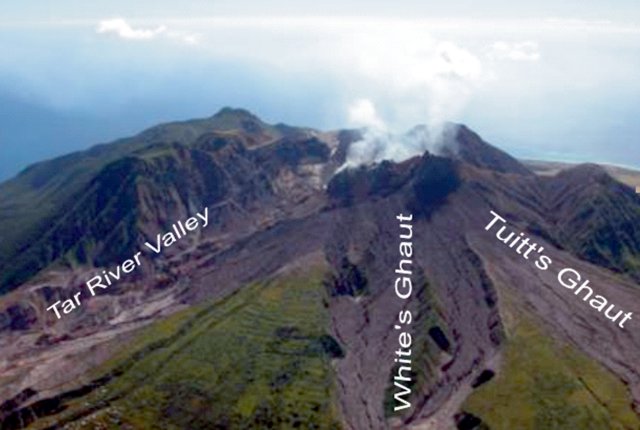 |
Figure 59. A photo of Soufrière Hills volcano taken from the NE showing the dome within the breached summit crater, and the SW-flank morphology. Much of the steam discharging was attributed to fumaroles. Photographed on 1 February 2005. Courtesy of MVO. |
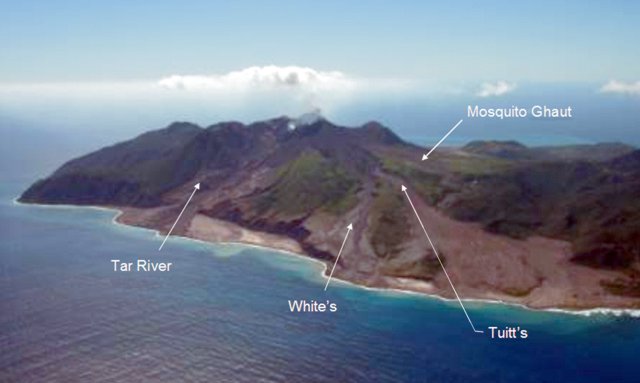 |
Figure 60. Recent deposits on the SW flank of Soufrière Hills as viewed from the NE on 1 February 2005. Prominent deltas appear at the mouths of the drainages shown, particularly at the mouth of the Tar River Valley. Courtesy of MVO. |
On 3 March 2005, scientists took a Fourier Transform Infrared spectrometer (FTIR) reading of the gas escaping from the crater vent at the summit (figure 59). The gas plume contained a ratio of hydrogen chloride to sulfur dioxide by mass of 0.35. This ratio showed no change since February.
In September 2004, the Scientific Advisory Committee on Montserrat Volcanic Activity (SAC) joined MVO staff at the Montserrat Volcano Observatory to discuss recent activity (SAC, 2004). "Few signs of surface activity" was their appraisal of the period since March 2004. There had been little gas venting, ash venting, or tremor in six months, and no lava extrusion in 15 months. This pause in activity, the SAC predicted, will last ~ 26 months, but could last as long as 170 months. SAC estimated risks for a variety of circumstances.
Readers can access full reports issued by the SAC at the MVO website. The main report summarizes conclusions drawn from the meeting, while the technical report includes long-term monitoring data and risk assessments.
Reference. Scientific Advisory Committee on Montserrat Volcanic Activity (SAC), 2004, Assessment of the hazards and risks associted with the Soufriere Hills volcano, Montserrat: Second Report of the Scientific Advisory Committee on Montserrat Volcanic Activity, parts I (Main Report, 24 p.) and II (Technical Report, 26 p.).
Information Contacts: Montserrat Volcano Observatory (MVO), Fleming, Montserrat, West Indies (URL: http://www.mvo.ms/).
Abundant ash-laden plumes, pyroclastic flows, and local ashfall
Soufrière Hills was last reported on in BGVN 30:03, covering November 2004 to March 2005, during which time the volcano remained quiet, with seismic signals, gas emissions and rockfalls all decreasing. This report, from Montserrat Volcano Observatory (MVO), covers the period from late March 2005 to July 2005. The volcano continued to be relatively quiet through April and early May, with activity increasing somewhat through June and several explosive events in late June and in July. Table 60 summarizes the seismicity and SO2 emissions during the period of this report.
Table 60. Geophysical and geochemical data recorded at Soufrière Hills, 25 March 2005 to 15 July 2005. * Only measurement during report period. **12-hour system failure may have caused events to be missed. Courtesy of MVO.
| Date | Seismicity Level | Hybrid EQ's | Volcano-tectonic EQ's | Long-period EQ's | Rockfalls | SO2 Range (tons/day) | SO2 Daily Avg (tons/day) |
| 25 Mar-01 Apr 2005 | low | 1 | 5 | 1 | -- | 186-369 | 290 |
| 01 Apr-08 Apr 2005 | low | 1 | 7 | 1 | -- | 280-650 | 400 |
| 08 Apr-15 Apr 2005 | low | -- | 19 | -- | -- | 261-1877 | 619 |
| 15 Apr-22 Apr 2005 | -- | 7 | 37 | -- | 1 | 122-957 | 365 |
| 22 Apr-29 Apr 2005 | -- | 7 | 31 | -- | -- | 112-330 | 304 |
| 29 Apr-06 May 2005 | -- | 1 | 4 | -- | 1 | 276-644 | 439 |
| 06 May-13 May 2005 | -- | 1 | 38 | -- | 1 | 221-537 | 398 |
| 13 May-20 May 2005 | -- | 3 | 18 | -- | -- | 222-363 | 286 |
| 20 May-27 May 2005 | -- | -- | 67 | -- | -- | 880* | -- |
| 27 May-03 Jun 2005 | -- | -- | 8** | -- | -- | 167-392 | 261 |
| 03 Jun-10 Jun 2005 | -- | -- | 17 | -- | 1 | 142-671 | 399 |
| 10 Jun-17 Jun 2005 | elevated | 17 | 46 | 20 | 7 | 170-750 | 460 |
| 17 Jun-24 Jun 2005 | elevated | 8 | 4 | 5 | 3 | 430-1150 | 627 |
| 24 Jun-01 Jul 2005 | elevated | 19 | 15 | 5 | -- | 300-700 | 470 |
| 01 Jul-08 Jul 2005 | elevated | 15 | 9 | 11 | 11 | 241-1700 | 767 |
Seismic activity at Soufrière Hills remained at low levels throughout March and most of April 2005. Beginning on 15 April, vigorous steam-and-ash venting occurred on the NW side of Soufrière Hills crater and continued throughout the period of this report. Average daily SO2 emissions were generally lower than the long-term eruption average of 500 tons/day, but increased in July to above the average.
On 13 June at 0600 an ash plume reached a height of ~ 2.4 km altitude and drifted NE, depositing light ash in Lookout, Geralds, and St. Peters.
Starting around 10 June, seismic and volcanic activity were at elevated levels. The ash venting that began on 13 June declined in intensity during the following week. The ash venting was caused by the rapid release of steam and other volcanic gases, possibly triggered by intense rainfall on the night of 12 June. Ash analyses from this episode did not indicate fresh magma.
On 27 June a steam and ash cloud at ~ 3 km altitude was reported to be drifting W. By 28 June satellite imagery showed a plume of ash and steam at ~ 1.8 km altitude extending NW. Periodic episodes of intense ash venting continued, culminating in an explosive event on 28 June at 1306. During the event, ballistics were ejected onto the Farrell's plain (to the NW), and a column collapse produced pyroclastic flows. The pyroclastic flows reached the sea at the Tar River delta (to the NE), and a smaller volume of material flowed into the top of Tyre's Ghaut (to the N). Ash showed no evidence of fresh magma.
Preliminary analysis of recent ground deformation data from the GPS network at the volcano showed that deflation during April to mid June 2005 had later reversed, and the volcano appeared to be inflating. Periodic ash venting continued and an explosion occurred on 3 July at 0130, which was similar to the explosion on 28 June.
An explosive event at 0301 on 18 July caused widespread ash fallout between Fogarty Hill on the island's NW and Brodericks Yard on the island's SW and almost certainly led to pyroclastic flows to the sea in Tar River. This explosion was similar to, but slightly bigger than, the explosion on 3 July, and ash venting and pyroclastic flows combined to cause dramatic ash clouds which reached to at least 6 km. Winds blew the ash plume in a NW direction causing significant ash fall in Old Towne, Iles Bay, Salem, Olveston, Woodlands and St Peters. The maximum depth of ash measured by scientists in inhabited areas was 1.5 to 2.0 mm; the deepest ash was recorded at Weekes. Activity subsequently returned to background levels.
The MVO collected ash samples from the affected areas to determine whether it was new material from depth or older material from the dome. Ash collected after the 28 June and 3 July 2005 events showed no evidence of new magmatic material.
On 28 July 2005, the Moderate Resolution Imaging Spectroradiometer (MODIS) flying onboard the Aqua satellite acquired an image of a plume of volcanic ash drifting westward in a slightly curving shape as it departs Soufriere Hills (in the middle of the image, figure 61).
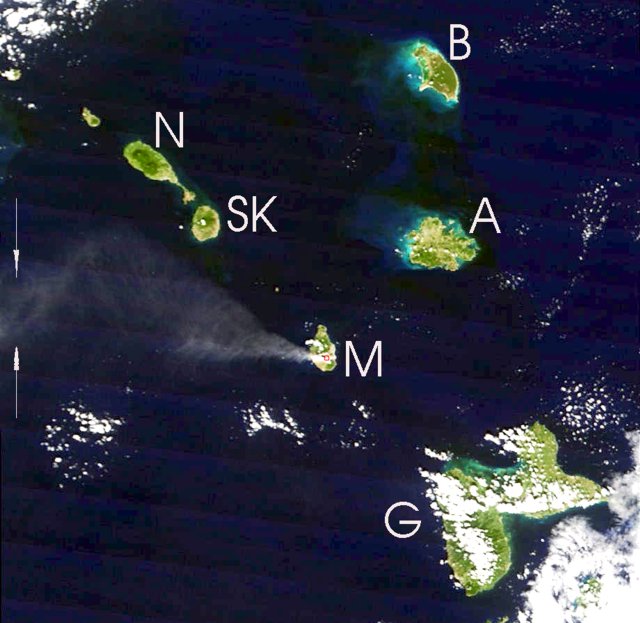 |
Figure 61. A MODIS image of an ash plume from Soufrière Hills acquired on 28 July 2005. N is towards the top. The plume was visible for over 100 km, but conspicuous portions of the plume continued beyond the W (left) side of this image between the arrows. A Washington VAAC report from that day suggested a plume to ~ 5 km altitude and 70-300 km long, blown W. Several islands neighboring Montserrat (M) are labeled: A, Antigua; B, Barbuda; G, Guadeloupe; N, Nevis; and SK, St. Kitts. For scale, the distance between the centers of the islands of Montserrat and Antigua is ~ 55 km. Some islands are ringed in bright blue-green, the possible result of coral reefs in shallow water, sediment, phytoplankton, or some combination of these conditions. Image and some elements of the caption courtesy of Jeff Schmaltz, MODIS Rapid Response Team, NASA. |
Information Contacts: Montserrat Volcano Observatory (MVO), Fleming, Montserrat, West Indies (URL: http://www.mvo.ms/).
Through at least 5 September 2005, the lava dome continued to grow
Soufrière Hills was relatively quiet through April and early May 2005, with activity increasing somewhat through June and several explosive events in late June and in July (BGVN 30:06). Table 61 summarizes activity during 8 July thorough 26 August 2005. Further text brings this report through 5 September, with the comment that slow dome growth continued.
Table 61. A summary of the weekly number of earthquakes (EQs), rockfalls, and averaged spot measurements of SO2 flux at Soufriere Hills during July and August 2005. Cases of "mixed earthquakes" were unreported during the reporting interval. Date ranges go from noon on the starting day to noon on the end day. Courtesy of MVO.
| Date | Hybrid EQ's | Volcano-tectonic EQ's | Long-period EQ's | Rockfalls | SO2 Flux (metric tons/day) |
| 08 Jul-15 Jul 2005 | 10 | 2 | -- | -- | 660 |
| 15 Jul-22 Jul 2005 | 16 | 19 | 13 | 11 | 608 |
| 22 Jul-29 Jul 2005 | 4 | 29 | 5 | 23 | 510 |
| 29 Jul-05 Aug 2005 | 4 | 8 | 9 | 33 | 986 |
| 05 Aug-12 Aug 2005 | 3 | 3 | 5 | 14 | 770 |
| 12 Aug-19 Aug 2005 | 8 | 5 | 13 | 12 | 570 |
| 19 Aug-26 Aug 2005 | 6 | 5 | 13 | 15 | 900 |
On 6 August a vigorous eruption sent a plume to ~ 1.8 km above the volcano. Evidence of uplift and fracturing were observed on the crater floor, and an area of blocky lava resembling a small lava dome was observed. Due to poor visibility further observations will be necessary to determine if the feature is a new dome or was caused by the collapse, or uplift, of old dome rock.
Volcanic and seismic activity remained at elevated levels at Soufrière Hills during 12-19 August. Periodic ash venting continued, with a vigorous episode occurring on 18 August at 1800. On 16 August, the presence of a small blocky lava dome with talus slopes was confirmed. There was some ash venting from the dome, but no significant rockfalls were seen. Activity at Soufrière Hills remained at elevated levels during 2-9 September, the end of this reporting period. Observations made on 5 September suggested that slow lava-dome growth continued.
Information Contacts: Montserrat Volcano Observatory (MVO), Fleming, Montserrat, West Indies (URL: http://www.mvo.ms/).
Slow lava dome growth continued
Activity at Soufrière Hills remained elevated during the latter half of 2005 (table 62). Since 5 September slow lava dome growth continued. During the week of 30 September through 7 October dome growth increased on the western side. On 26 October a pyroclastic flow with a runout of 2 km was reported around 2400. The pyroclastic flow was confined to the Tar River Valley.
Table 62. Soufrière Hills seismicity during 26 August to 30 December 2005. Courtesy of MVO.
| Date | Hybrid EQ's | Volcano-tectonic EQ's | Long-period EQ's |
| 26 Aug-02 Sep 2005 | 10 | 3 | 9 |
| 02 Sep-09 Sep 2005 | 5 | 6 | -- |
| 09 Sep-16 Sep 2005 | 13 | 70 | 5 |
| 16 Sep-23 Sep 2005 | 3 | 6 | 5 |
| 23 Sep-30 Sep 2005 | -- | 42 | 3 |
| 30 Sep-07 Oct 2005 | -- | 50 | 2 |
| 07 Oct-14 Oct 2005 | -- | 183 | -- |
| 14 Oct-21 Oct 2005 | 1 | 359 | 15 |
| 21 Oct-28 Oct 2005 | -- | 53 | 2 |
| 28 Oct-04 Nov 2005 | -- | 19 | 2 |
| 04 Nov-11 Nov 2005 | 2 | 14 | 6 |
| 11 Nov-18 Nov 2005 | -- | 3 | 8 |
| 18 Nov-25 Nov 2005 | 7 | 21 | 176 |
| 25 Nov-02 Dec 2005 | 2 | 1 | 93 |
| 09 Dec-16 Dec 2005 | -- | -- | 31 |
| 16 Dec-23 Dec 2005 | 2 | 1 | 40 |
| 23 Dec-30 Dec 2005 | 19 | 9 | 63 |
On 4 November dome growth on the southern flank was observed. The following week, growth was reported on the E, S, and SE flanks. Radar imaging of the dome indicated a dome volume of about 6.5 million cubic meters, suggesting a growth rate over the past two weeks of between 1.3 and 1.8 cubic meters per second with incandescence visible at night. Observations on the morning of 18 November indicated the dome continued to grow and sent rockfalls in all directions. A pyroclastic flow was observed in the Tar River valley on 15 November and reached to within 1km of the sea. The ash cloud associated with this event rose to ~2.1 km.
A pyroclastic flow was observed in the upper reaches of the Tar River valley on 22 November (figure 62). Minor venting of ash occurred, with one event taking place on the afternoon of 24 November, which produced an ash cloud that rose ~1 km above the summit (figure 63).
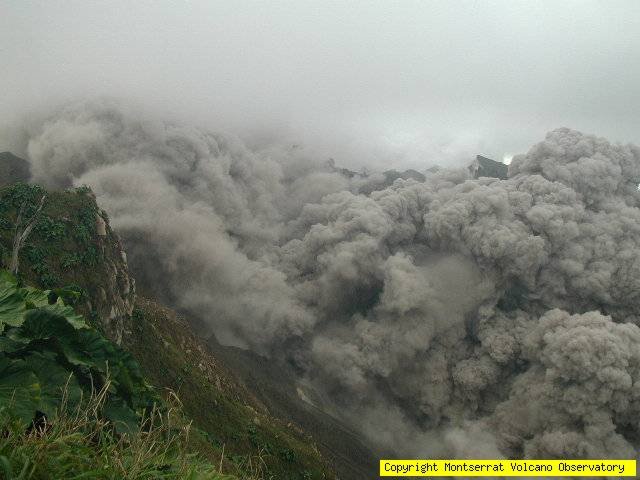 |
Figure 62. A photo showing a Soufriere Hills pyroclastic flow as seen from the NE on 22 November 2005. Photo courtesy of MVO. |
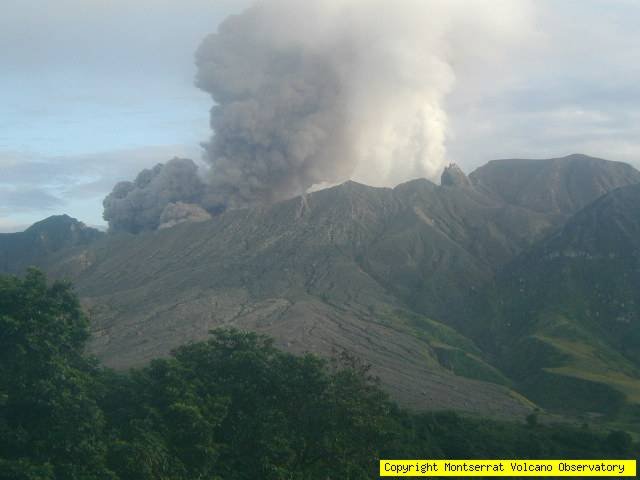 |
Figure 63. A photo showing a Soufriere Hills ash cloud as seen from the SE on 24 November 2005. Photo courtesy of MVO. |
During the month of December, dome growth continued on all flanks although more intense on the S and E flanks. More rockfalls and smaller pyroclastic flows have been reported with incandescence observed at night along the SE and E flanks.
Information Contacts: Montserrat Volcano Observatory (MVO), Fleming, Montserrat, West Indies (URL: http://www.mvo.ms/).
Big dome collapse and tall plume on 20 May 2006 leave a W-leaning crater
Activity at Soufrière Hills remained at elevated levels (table 63), similar to that previously reported (BGVN 30:12), a state that culminated with a dome collapse on 20 May 2006. Although that event took away considerable portions of the dome (and caused a small tsunami), photographs revealed post-collapse dome growth focused over a broad SE sector extending from the SW around to the NE. Numerous rockfalls continued from the S, E, and NE flanks of the lava dome. The NE-side rockfalls added talus to the upper reaches of the Tar River valley and were visible at night.
Table 63. Soufrière Hills seismicity during 28 December 2005 to 12 May 2006. * Due to weather conditions, gas measurements were not made. ** As a result of the collapse, instrumentation was lost and gas measurements were not able to be measured. Courtesy of MVO.
| Date | Hybrid EQ's | Volcano-tectonic EQ's | Long-period EQ's | Rockfall signals | SO2 flux (metric tons/day) |
| 28 Dec-06 Jan 2006 | -- | -- | 11 | 37 | 522 |
| 06 Jan-13 Jan 2006 | -- | 1 | 30 | 116 | 724 |
| 13 Jan-20 Jan 2006 | -- | -- | 17 | 61 | 767 |
| 20 Jan-27 Jan 2006 | -- | -- | 11 | 60 | 470 |
| 27 Jan-03 Feb 2006 | 1 | 3 | 11 | 92 | 594 |
| 03 Feb-10 Feb 2006 | 2 | 39 | 61 | 84 | 465 |
| 10 Feb-17 Feb 2006 | 2 | 9 | 121 | 10 | 568 |
| 17 Feb-24 Feb 2006 | 1 | 3 | 26 | 30 | 286 |
| 22 Feb-03 Mar 2006 | 1 | 7 | 157 | 18 | 388 |
| 03 Mar-10 Mar 2006 | 2 | 2 | 148 | 282 | 454 |
| 10 Mar-17 Mar 2006 | -- | 4 | 115 | 319 | 480 |
| 17 Mar-24 Mar 2006 | 13 | 3 | 231 | 336 | 1,034 |
| 24 Mar-31 Mar 2006 | 12 | 1 | 230 | 316 | 523 |
| 31 Mar-07 Apr 2006 | -- | 3 | 38 | 507 | 578 |
| 07 Apr-14 Apr 2006 | -- | 3 | 99 | 620 | 540 |
| 14 Apr-21 Apr 2006 | 3 | -- | 80 | 100 | * |
| 21 Apr-28 Apr 2006 | -- | -- | 30 | 589 | 521 |
| 28 Apr-05 May 2006 | -- | -- | 109 | 279 | 310 |
| 05 May-12 May 2006 | -- | -- | 74 | 571 | 702 |
| 12 May-19 May 2006 | 7 | 1 | 130 | 753 | 674 |
| 19 May-26 May 2006 | 89 | 11 | 229 | 373 | ** |
| 26 May-02 Jun 2006 | 62 | 4 | 172 | 195 | ** |
| 02 Jun-09 Jun 2006 | 20 | -- | 28 | 163 | ** |
A central spine was first observed on 17 January 2006 when clouds briefly cleared from the dome. On 22 January, two new relatively thin, vertical planar spines were seen on the SE flank of the lava dome and collapsed on 29 January. Helicopter and field observations indicated continued dome growth, particularly in the SE (figure 64).
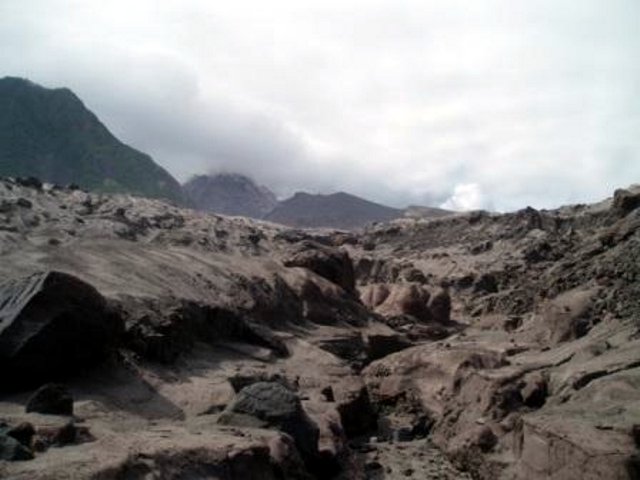 |
Figure 64. A photo showing the growing dome on SoufriPre Hills as viewed from Tar River at the seaward (E) end of the delta. Photo taken 23 January 2006 along the SW coastline. Courtesy of Montserrat Volcano Observatory (MVO). |
On 10 February, MVO reported increased activity to the Washington VAAC. Satellite imagery showed a prominent hotspot at the volcano and a NW-drifting ash plume at an altitude of ~3 km. A small dark lobe of lava was observed on the western side of the lava dome in the crater. Steaming and venting were observed throughout the day. A photo appears as figure 65.
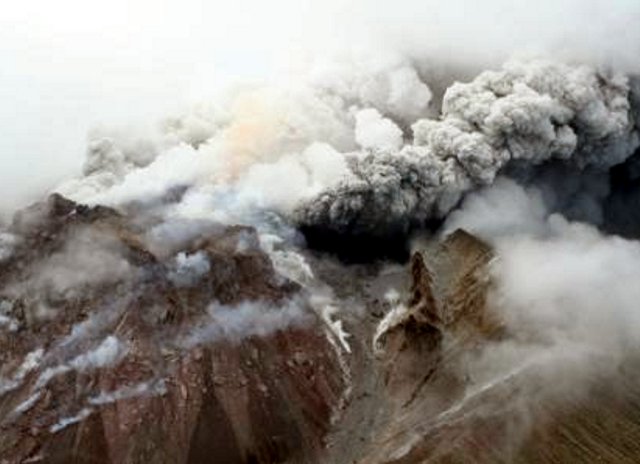 |
Figure 65. A 10 February 2006 photo taken at Soufriere Hills showing ash and steam venting from the dome. This view is from the SE; the ash cloud drifted N. Courtesy of MVO. Courtesy of MVO. |
By early 11 February, this lobe had advanced rapidly towards the NE side of the dome and was visible as a steep-sided plateau of lava from inhabited areas around Salem. Photographs from fixed cameras showed continued changes to this lava lobe over the next few days, and the NE margin could be seen glowing at night and shedding rockfalls into the NE part of the crater. Ash-and-gas emissions continued through 15 February, producing plumes to an altitude of ~2.7 km. The initial growth rate of this lobe surpassed 5 cubic meters per second, but the rate declined around 17 February. The new lava lobe began to fill the gap between the lava dome and the N and W crater walls, raising the possibility that small rockfalls could spill over those areas in coming weeks. After 22 February, incandescent rockfalls were visible at night, coursing down the N, E, and SW sides of the dome and into the Tar River Valley (figure 66).
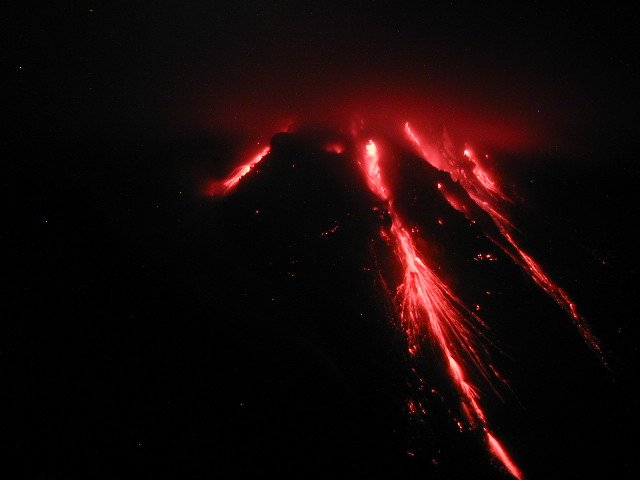 |
Figure 66. A Soufriere Hills photo showing the incandescent rockfalls at night taken from Perches Mountain, SE of the volcano. This photo was taken on 22 February 2006. Courtesy of MVO. |
On 26 February, rapid vertical growth of the lava dome at Soufrière Hills was visible on camera images, and by 27 February a large spine about 30 m wide and at least 30 m high had developed at the dome's summit. By 28 February this spine had split into two parts and was leaning precariously to the NE. At about 2115 on 28 February the overhanging parts of the spine disintegrated and generated pyroclastic flows that traveled down the Tar River Valley almost as far as the coast. A low-level ash cloud drifted W. Additional changes to the shape of the spines and the upper NE flank of the volcano were noted in the following days as they disintegrated further. Rockfalls were visible on the N, NE, and E flanks of the volcano. Some fumaroles were observed on the upper outside part of Gages Wall (W of the lava dome) on 27 February, suggesting movement of fluids in this area.
During 3-17 March, lava-dome growth continued and the dome reached an altitude of ~950 m. The active lava lobe shed rockfalls and small pyroclastic flows to the W, N, and E. A vigorous gas vent was seen on the W side of the lava dome on 8 March, above Gages valley. Small fumaroles were visible at the top of Gages valley and below the lava dome remnant that stands at the top of Gages Valley.
Observations during 17 March-7 April revealed that lava-dome growth was focused in the summit area and towards the E and NE (figure 67). The N side of the lava dome showed little change. Rockfalls and pyroclastic flows were restricted to the Tar River Valley and were numerous on 19-20 March. The largest pyroclastic flows traveled as far as 2 km.
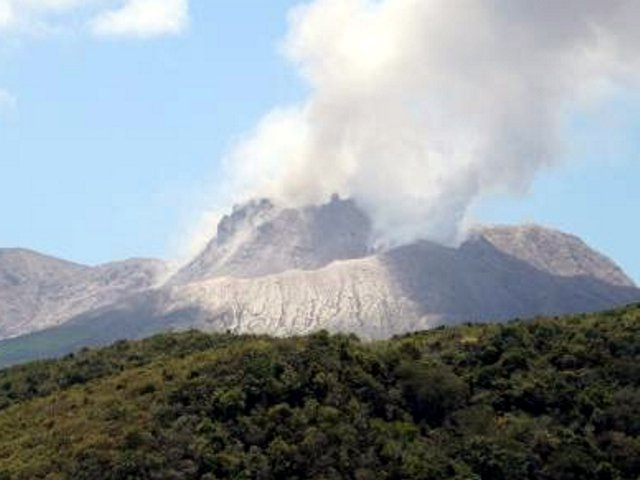 |
Figure 67. A Soufriere Hills photo of the growing lava dome taken on 30 March 2006. The photographer stood on Jack Boy Hill and looked NE. Courtesy of MVO. |
Lava extrusion continued during 7-21 April. Growth occurred to the E and N, and an eastward-facing lobe developed on the NE side of the dome. Numerous small rockfalls continued from the active eastern flanks of the dome, adding to the talus in the upper reaches of the Tar River valley. Rockfalls were accompanied by minor ash venting. Due to unusual wind conditions, plumes were predominately transported N and NW, shifting to the E on 20 April. As a result of this process, light ashfall occurred over much of Montserrat. Thermal images taken on 27 April indicated some very hot areas on the E flank of the dome.
Deposits from a series of pyroclastic flows occurring on 4 May extended as far as the Tar River delta. Northerly directed winds during the reporting period resulted in light ashfall in areas north of the Belham valley. The dome volume was approximately 80 million cubic meters and the average growth rate through April was about 8 cubic meters per second.
On 18 May, a survey conducted on the southern half of the dome was carried out using a terrestrial laser scanner and showed that the summit of the dome had reached a height of 1,006 m, this is 83 m higher than Chance's Peak (figure 68).
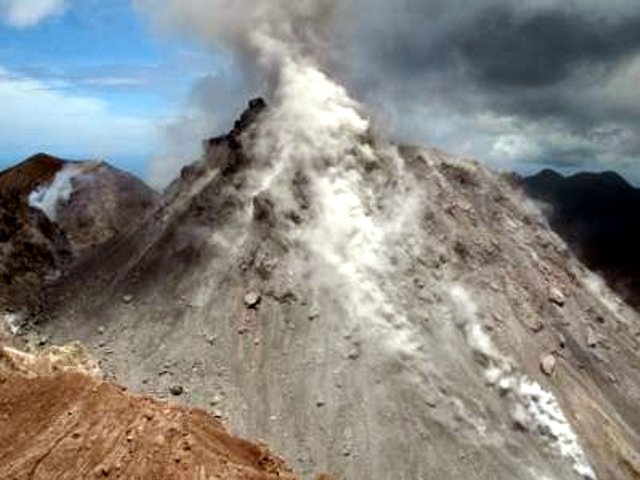 |
Figure 68. The SE side of the Soufriere Hills lava dome as viewed from Galways Mountain on 11 May 2006. A new shear lobe forms the highest point of the dome and is growing toward the S. Chance's Peak is in the back left and Centre Hills in the back right. Courtesy of MVO. |
20 May collapse. A major lava dome collapse took place on the morning of 20 May (figure 69). A helicopter flight in the afternoon confirmed that most of the lava dome had gone, together with some remnants of the 2003 lava dome, leaving a broad, deep, eastward-sloping crater at the summit of the volcano. The volume of the lava dome was believed to be about 90 million cubic meters and most of this collapsed over a period of less than three hours. Views of the W part of the crater where ash venting is continuing were not possible but it is unlikely that there is significant dome material remaining there.
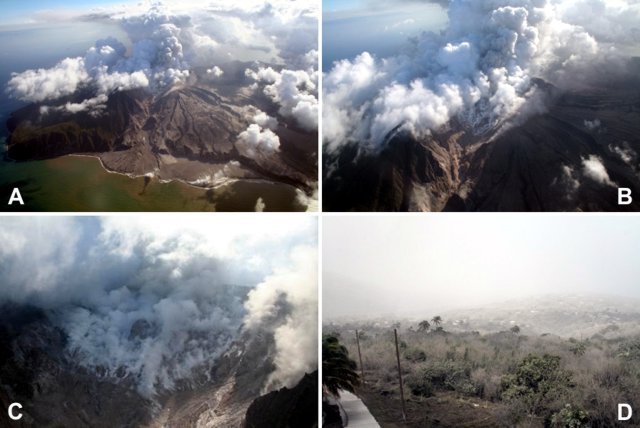 |
Figure 69. A set of photos taken 1600 on 20 May 2006 after the lava dome collapse. (A) A shot taken from the E showing an overview of the delta, Tar River Valley, and dome complex. (B) The crater as viewed from the NE above the Tar River Valley. Ash emission continued from a vent on the W side of the crater and rose to an altitude of 1.8 km. (C) A photo taken from E of the steaming summit crater showing most of the lava dome, including parts of the remaining 2003 dome. (D) A photo shot from MVO showing the towns of Flemings, Hope, and Salem in the early afternoon as the ash-and-gas cloud dissipated. Belham River Valley, Old Towne, and Garibaldi Hill remained obscured by the cloud of ash and gas. Courtesy of MVO. |
At 0222 on 20 May there was a single precursor, a long-period seismic event located 3 km below the dome. A brief episode of heightened seismic amplitude corresponding to ash venting occurred during 0300-0330. During heavy rain, another episode of increased seismic amplitude, interpreted as ash venting, began at 0552, and it developed into a high-amplitude seismic signal. The heavy rain caused mudflows in Belham River valley. By 0632 low-level ash clouds were drifting to the NW of the volcano from the crater area and a steam plume was rising to 6,000 ft (~1800 m). Unconfirmed reports suggested that pyroclastic flows first reached the sea at about 0645. Regular pulses of pyroclastic flows were reaching the sea down the Tar River valley by 0720 with major pulses recorded in seismic amplitude at 0736, 0743, and between 0801 and 0804. Also between 0730 and 0810 a number of long-period seismic events were detected. At 0740 an ash cloud was reported at nearly 17 km, altitude the highest reported ash cloud during the ten years of the eruption. At 0743, pyroclastic surges were observed spreading across the NE flanks of the volcano reaching the Spanish Point area. It was also estimated at this time that surges had spread 3 km offshore from Tar River valley, across the surface of the ocean.
By 0750, lithics were falling in areas NW of the volcano; most were less than 3.5 cm across, and the largest found in the inhabited area was 6 cm across. Six car windscreens were reported broken. The deepest ash fall in inhabited areas was about 3 cm. Activity began to reduce in intensity after 0815 and a high-amplitude seismic signal remained until 0900. At this time, residents in the Old Towne and Salem area were subjected to high levels of volcanic gases particularly hydrogen chloride causing some to move N (figure 69). Widespread and noisy mudflows were reported in the Trants area to the NE of the volcano. Ash venting from the W of the crater continued until about 1700 when it began to decline.
A 1-m-high tsunami was reported from Deshaies beach in Guadeloupe and swells were detected in Little Bay, Montserrat, and at Jolly and English Harbour, Antigua. Relatively light but continuous ash-and-steam venting followed the collapse.
The weeks after the 20 May collapse. Wind direction shifted towards the N late on 21 May causing ash fall and raining mud in most parts of the island. Scientists remained alert to the possibility of further explosive activity but seismic activity was at low levels after the event on 20 May.
Since the May collapse, the lava dome continued to grow. As of 9 June it was approximately 20 million cubic meters in size. This is similar to the size of the dome in early January 2006. The average growth rate since the dome collapsed on 20 May was close to 10 cubic meters per second, well above the average growth rate of 6 cubic meters per second noted between January and April 2006.
By the end of the report period the dome was broad and flat-topped with a growing talus slope extending E. The lava on the summit of the dome is blocky, which is typical of lava extruded at a high rate. Vigorous ash and gas emitted by a vent W of the lava dome occurred during the week of 2 June. The venting is accompanied by a roaring sound that is sometimes audible in the Salem area. Prevailing winds have taken most of this ash and gas to the west over Plymouth. Satellite imagery on 4 June showed a thin area of ash out to St. Croix. In addition, there were multiple SFC and pilot reports of ash over the E portion of Puerto Rico and the Virgin Islands. Mudflows were reported on the 11 and 13 June during heavy rainfall.
Information Contacts: Montserrat Volcano Observatory (MVO), Fleming, Montserrat, West Indies (URL: http://www.mvo.ms/).
Extrusive dome dynamics during May-September 2006
Since the 20 May 2006 dome collapse, the lava dome at Soufrière Hills has continued to grow. Only weeks after the collapse, the alert level was raised to 4 as a result of increased seismic activity. At approximately 1300 on 30 June, the lava dome partially collapsed again, producing pyroclastic flows that traveled E. According to the Washington VAAC, a pilot reported an ash plume that reached ~ 3 km altitude and drifted NW. At 1830 on 30 June, Montserrat Volcano Observatory (MVO) indicated a second dome collapse that also generated ash plumes to an altitude of 3.0-3.5 km (figure 70). According to MVO, on 27 June (prior to the collapse on 30 June) the lava dome had an estimated volume of 27 million cubic meters.
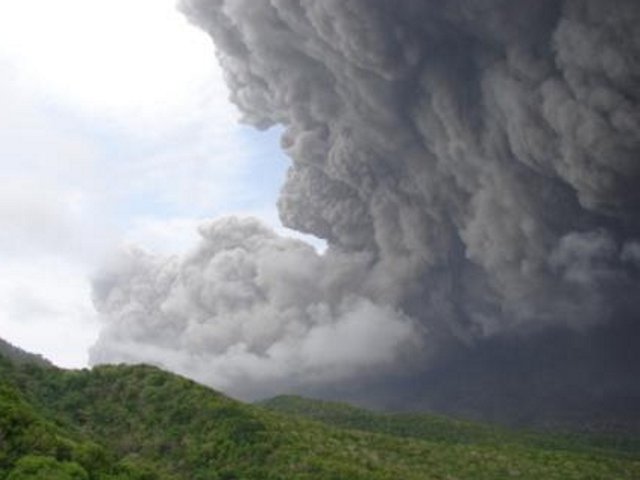 |
Figure 70. A photo taken on 30 June 2006 of Soufrière Hills as viewed from the Montserrat Volcano Observatory showing the first partial dome collapse of the day. The partial collapse began just before 1300 local time and lasted ~ 20 minutes, generating ash clouds to an altitude of ~ 3.5 km that drifted WNW. Pyroclastic flows (left side of picture) were confined to the Tar River valley and ultimately reached the sea. Most of the lava dome remained intact. Photo courtesy of MVO. |
On 7 July, the alert level was lowered from 4 to 3. Increased rockfall activity and dome growth to the NE were observed on 21 July, and the post-collapse dome developed an asymmetric profile owing to a blocky spine on the NE. On 18 July the spine's summit stood at ~ 895 m elevation. As the dome continued to grow during July (figure 71), visual observations revealed that the still intact blocky spine began leaning E.
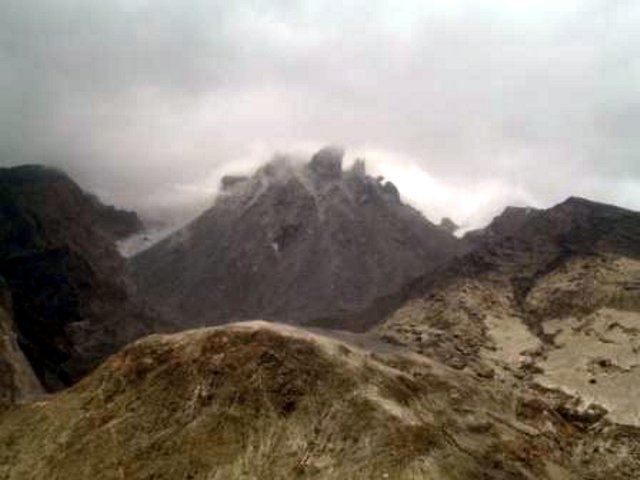 |
Figure 71. A photo of Soufrière Hills taken on 25 July showing spines at the summit of the lava dome as viewed from the NE. Photo courtesy Greg Scott of Caribbean Helicopters. |
During August the dome lost spines from its crest, giving it a more symmetrical profile as it continued to grow E. Heightened activity during the last week of August included an increase in seismicity and pyroclastic flows. On 29 August, pyroclastic flows reached the Tar River valley and generated a steam-and-ash cloud that reached an altitude of ~ 9 km. Heavy rainfall produced mudflows around the base of the volcano.
At 0300 on 31 August, two vigorous ash-and-steam vents opened on the W and N flanks of the dome (figure 72). The venting episode was audible at times from the town of Salem and the surrounding areas. MVO noted the continued dome growth and the opening of these vents when on 31 August they raised the alert level to 4.
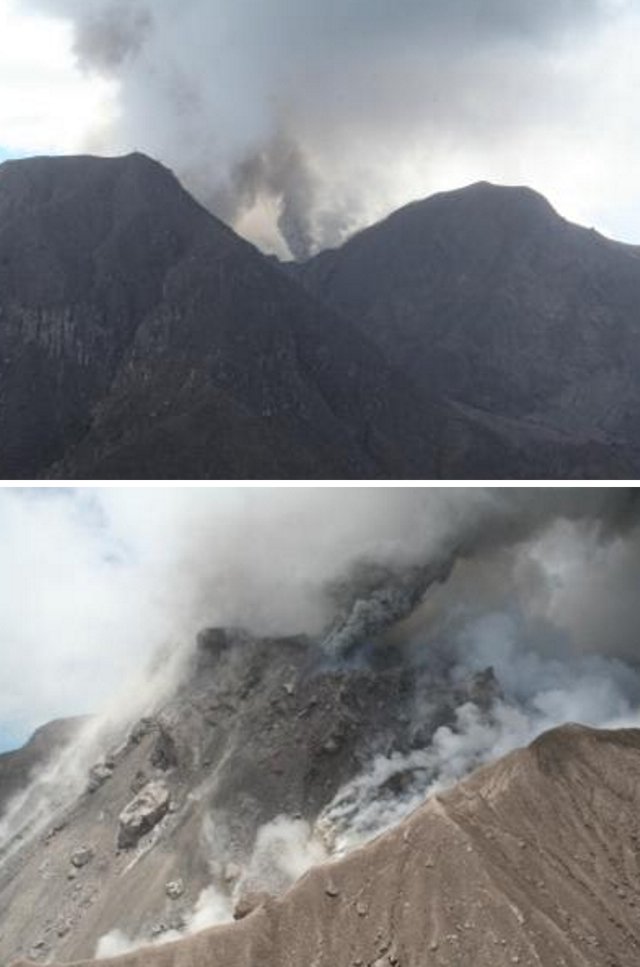 |
Figure 72. Photos showing activity at Soufrière Hills on 31 August 2006. (top) Emissions from the vigorous new vent inside Gages wall (Gages Mountain to the left of the vent and Chances Peak to the right). (bottom) N-looking photo showing the N crater wall, lava dome, and the new vigorous ash vent on the N side of the lava dome. Courtesy of MVO. |
Heightened activity continued in September. The dome continued to develop substantially with a majority of growth on the W side. The vents that opened on 31 August remained active, with the vent above Gage's wall emitting a plume of hot gases and the N vent on the dome producing mainly ash-and-steam (figure 73). The opening of these vents coincided with high lava extrusion rates and consequent dome growth.
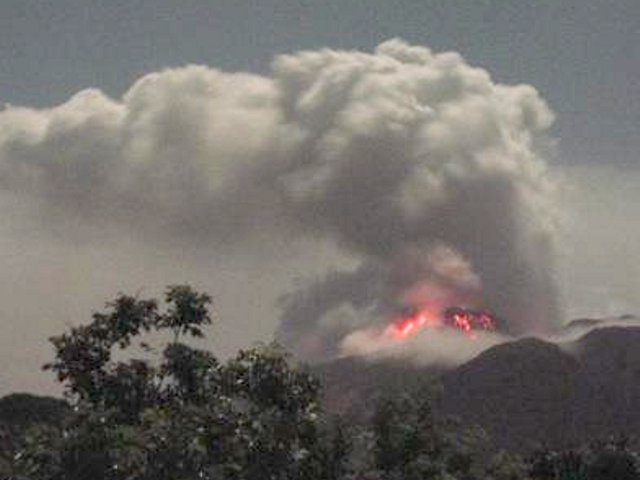 |
Figure 73. A photo showing lava-dome glow viewed from the S at MVO at 2200 on 7 September 2006. Incandescent rocks can be seen tumbling down all flanks of the lava dome on this clear night. A faint glow is visible from the very hot and active gas vent just inside the Gages wall (just right of the dome in the picture). Photo courtesy of MVO. |
At 0100 on 10 September, the vent above Gage's wall became more vigorous throughout the day, broadening the vent and generating a wide vertical ash column. By 1300 the venting there became violent and explosive with black jets of ash rising ~ 100 m. Pyroclastic flows traveled down the Gages valley for ~ 1 km (figure 74). The vent formed a crater in the Gages wall, reducing its height compared to that of Chances Peak by 30-50 m. By 11 September, pyroclastic flows from vent emissions had ceased, but vigorous ash venting continued. At 0830 an overhanging lava lobe that developed on the NE collapsed sending a pyroclastic flow almost to the sea at the end of the Tar River valley.
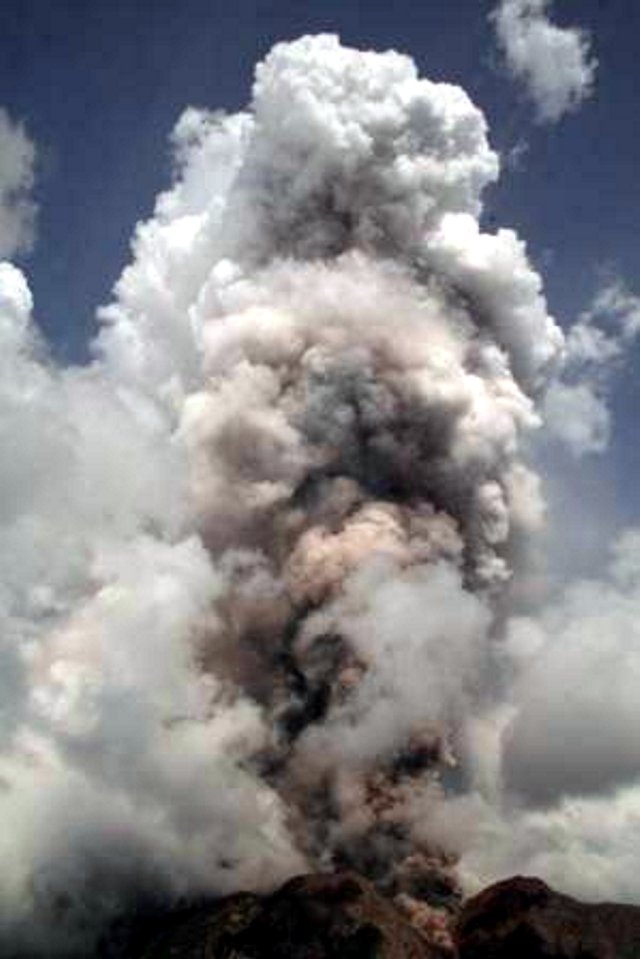 |
Figure 74. A photo showing explosive ash venting from a spot above Gages valley at 1530 on 10 September. Pyroclastic flows can be seen advancing into Gages valley in the foreground. Photo courtesy of MVO. |
Although volcanic tremor ended early on 16 September, an intense episode of volcanic tremor lasting just half an hour started at 1400 on 19 September. It was accompanied by intense rockfall activity giving rise to minor pyroclastic flows down the N and NE flanks of the lava dome. On 21 September the alert level was reduced to 3.
Information Contacts: Montserrat Volcano Observatory (MVO), Fleming, Montserrat, West Indies (URL: http://www.mvo.ms/).
Seismic activity continues at a reduced level through 1 June
Activity returned to normal levels following the strong explosive episode of 10 September 2006 (BGVN 31:09). Activity after September included an occasional minor explosions, rockfalls, minor pyroclastic flows, venting of ash and gases and steam with emissions reaching up to 3 km altitude, minor ashfalls, and mudflows during heavy rains. In September and October, the minor pyroclastic flows primarily moved down the N and NE flanks of the dome. In January, pyroclastic flows traveled down the Gages Valley, Tyres Ghaut, Belham Valley, Tuits Ghaut, Farrells Plain, and especially the lower Tar River Valley E of the volcano.
Lava-dome growth slowed in March, and by the end of April it appeared to have ceased. On 1 June Montserrat Volcano Observatory (MVO) (figure 75) warned that, while the lava extrusion had ceased and the dome may not be actively growing, it remains as a large mass of partially molten lava capable of collapsing or exploding. According to MVO, the amount of material above Tyres Ghaut to the NW was sufficient to generate pyroclastic flows and surges capable of affecting the lower Belham Valley and other areas.
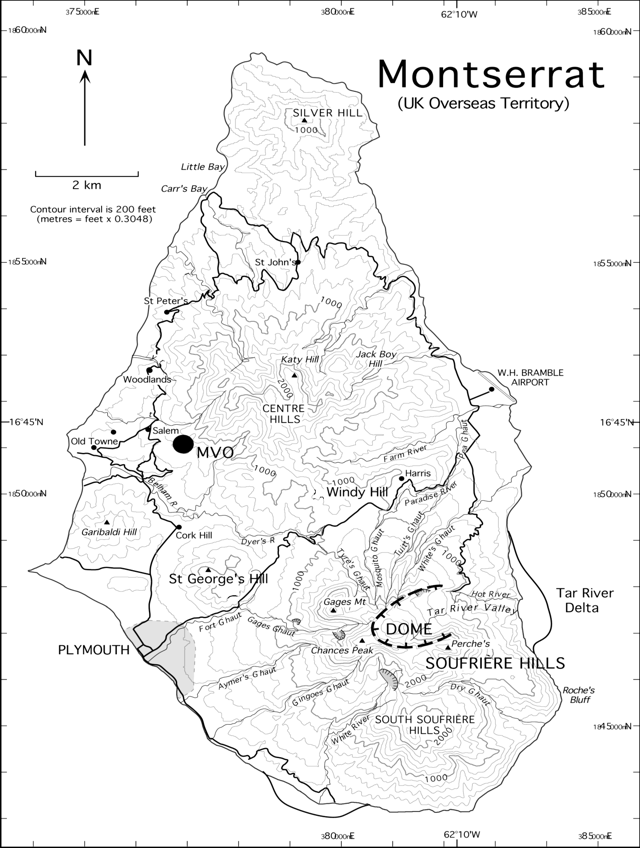 |
Figure 75. Map of Montserrat showing the pre-eruption topography of Soufrière Hills. The black circle shows the location of the MVO. The approximate outline of the Tar River delta in July 2004 is shown. Courtesy of Wadge and others (2005). |
Data provided by MVO (table 64) shows the elevated seismicity (hybrid earthquakes and rockfall signals) related to the increased activity in late August and early September (BGVN 31:09). The high number of long-period earthquakes in late June reflects the dome collapse at that time (BGVN 31:05). The dramatic decrease in long-period events and rockfalls in mid-March corresponds to the observed reduction in dome growth.
Table 64. Seismicity at Soufrière Hills between 16 June 2006 and 25 May 2007. * Data for the first 4 days only. VT: volcanic tectonic; LP: long-period. Courtesy of MVO.
| Date | Hybrid EQ's | Volcano-tectonic EQ's | Long-period EQ's | Rockfall signals | SO2 flux (metric tons/day) |
| 16 Jun-23 Jun 2006 | -- | -- | 32 | 51 | -- |
| 23 Jun-30 Jun 2006 | 54 | 4 | 1236 | 100 | -- |
| 30 Jun-07 Jul 2006 | 17 | 6 | 448 | 194 | 593 |
| 07 Jul-14 Jul 2006 | 2 | 1 | 49 | 61 | 468 |
| 14 Jul-21 Jul 2006 | 9 | -- | 341 | 293 | 523 |
| 21 Jul-28 Jul 2006 | 12 | -- | 190 | 144 | -- |
| 28 Jul-04 Aug 2006 | -- | 2 | 162 | 166 | 120 |
| 04 Aug-11 Aug 2006 | 5 | 1 | 100 | 165 | 230 |
| 11 Aug-18 Aug 2006 | 8 | 1 | 69 | 253 | 222 |
| 18 Aug-25 Aug 2006 | 142 | -- | 124 | 280 | 150 |
| 25 Aug-01 Sep 2006 | 30 | 12 | 61 | 588 | 351 |
| 01 Sep-08 Sep 2006 | 154 | 1 | 39 | 366 | 160 |
| 08 Sep-15 Sep 2006 | 210 | 5 | 38 | 413 | 405 |
| 15 Sep-22 Sep 2006 | 17 | 1 | 11 | 279 | 232 |
| 22 Sep-29 Sep 2006 | 1 | -- | 21 | 383 | 450 |
| 29 Sep-06 Oct 2006 | -- | 3 | 83 | 616 | 144 |
| 06 Oct-13 Oct 2006 | -- | 1 | 107 | 585 | 150 |
| 13 Oct-20 Oct 2006 | -- | 2 | 107 | 807 | -- |
| 20 Oct-27 Oct 2006 | 2 | 2 | 88 | 732 | 356 |
| 27 Oct-03 Nov 2006 | 1 | -- | 110 | 487 | 420 |
| 03 Nov-10 Nov 2006 | 1 | -- | 162 | 346 | 520 |
| 10 Nov-17 Nov 2006 | -- | 1 | 209 | 565 | 332 |
| 17 Nov-24 Nov 2006 | 1 | 1 | 124 | 452 | 845 |
| 24 Nov-01 Dec 2006 | -- | 2 | 101 | 298 | 465 |
| 01 Dec-08 Dec 2006 | -- | -- | 81 | 121 | 524 |
| 08 Dec-15 Dec 2006 | -- | -- | 9 | 100 | 574 |
| 15 Dec-22 Dec 2006 | -- | -- | 29 | 257 | -- |
| 22 Dec-29 Dec 2006 | 3 | 6 | 163 | 396 | 200 |
| 29 Dec-05 Jan 2007 | 3 | 3 | 22 | 231 | 152 |
| 05 Jan-12 Jan 2007 | -- | 2 | 24 | 348 | 159 |
| 12 Jan-19 Jan 2007 | 1 | 1 | 2 | 52 | 156 |
| 19 Jan-26 Jan 2007 | -- | 7 | 22 | 53 | 204 |
| 26 Jan-02 Feb 2007 | -- | 2 | 101 | 57 | 213 |
| 02 Feb-09 Feb 2007 | -- | 3 | 69 | 108 | 153 |
| 09 Feb-16 Feb 2007 | -- | 3 | 127 | 370 | -- |
| 16 Feb-23 Feb 2007 | -- | 2 | 219 | 353 | 271 |
| 23 Feb-02 Mar 2007 | 1 | 1 | 189 | 608 | 157 |
| 02 Mar-09 Mar 2007 | -- | -- | 141 | 594 | 150 |
| 09 Mar-16 Mar 2007 | -- | 3 | 61 | 383 | 157 |
| 16 Mar-23 Mar 2007 | 1 | 3 | 1 | 124 | 135 |
| 23 Mar-30 Mar 2007 | -- | 8 | 5 | 16 | 158 |
| 30 Mar-05 Apr 2007 | -- | 17 | 1 | 45 | 1035 |
| 06 Apr-13 Apr 2007 | -- | -- | 1 | 8 | 3114 |
| 13 Apr-20 Apr 2007 | -- | -- | 3 | 8 | 203* |
| 20 Apr-27 Apr 2007 | -- | -- | 1 | 3 | 476 |
| 27 Apr-04 May 2007 | -- | -- | -- | 9 | 223 |
| 04 May-11 May 2007 | -- | -- | -- | 4 | 125 |
| 11 May-18 May 2007 | -- | -- | -- | 2 | 143 |
| 18 May-25 May 2007 | -- | 1 | -- | 1 | 216 |
Strong activity during mid-September 2006. On 9 and 10 September, vigorous ash venting from the Gages Wall was accompanied by small explosions. Pyroclastic flows from fountain collapse occurred on all sides of the dome and reached 1 km W down Gages valley. On 11 September, the collapse of an overhanging lava lobe produced pyroclastic flows NE down the Tar River valley. One pyroclastic flow in the same area on 13 September reached the sea. On 14 September, vigorous ash venting resumed. Continuous ash and gas emissions during 13-19 September produced plumes that reached altitudes of 2.4-3.7 km. The Gages Wall vent continued to produce ash and gas emissions into mid-October.
Activity during September-December 2006. During 15 September-6 October the lava dome continued to grow at a moderate rate in the summit area and on the S and E sides of the dome. On 22 September the volume of the dome was about 80 million cubic meters. Lava-dome growth was concentrated on the NE part of the edifice from 6 October until 15 December, when growth moved to the SW part of the dome. A new E-facing shear lobe with a smooth, curved back enlarged during 13-20 October.
During 24 November-1 December, the two cracks in the curved back of the shear E-facing lobe on the summit propagated downward and divided the lobe into three blocks. The dome overtopped the NE crater wall and fresh rock and boulder deposits were observed in that region. During 22-29 December, lava-dome growth was focused on the W, where gas-and-ash venting occurred. A high whaleback lobe directed SW was observed on 26 December.
Aviation notices reported continuous ash and gas emissions almost every day from 15 September through 14 November, with plumes rising above 2 km to a maximum of 4.6 km altitude. Plumes extended 140 km W on 2-3 October. During 17-24 November, ash venting originated from the westernmost of two cracks in the curved back of the shear E-facing lobe on the summit. An explosion produced an ash plume that rose to altitudes of 1.5-1.7 km.
Pyroclastic flows occurred regularly as collapses from the dome sent material in all directions. Pyroclastic flows reached both the upper region of Tuitts Ghaut (N) and the sea via the Tar River Valley (E) on 23 November.
Activity during January-March 2007. Rapid lava-dome growth, pyroclastic flows, and ash venting increased during 3-9 January. Dome growth was concentrated in the NW, the highest part of the dome. Pyroclastic flows were observed in Tyres Ghaut (NW), Gages Valley (W), and N, behind Gages Mountain and accompanied by ash venting. On 4 January, simultaneous pyroclastic flows descended Tyres Ghaut and Gages Valley, and a resultant ash cloud reached an altitude of 2.5 km. The maximum distance for the Gages Valley flow was 4 km. During 6-9 January, distances of pyroclastic flows increased in Tyres Ghaut and possibly exceeded 1.5 km.
During 10-16 January, lava-dome growth was focused on the NW quadrant. During 10-11 January, one pyroclastic flow was observed to the W in Gages Valley and one to the NW in Tyres Ghaut. On 15 January, a relatively large pyroclastic flow traveled E down the Tar River Valley. After 15 January, measurable activity was low. Gas and ash venting that originated from the W side of the dome continued. A clear view on 22 January revealed that the collapse scar from the 8 January event was filled in. A small spine was noted on the W side. On 23 January, a large pyroclastic flow traveled down Gages Valley. The Washington VAAC reported that ash plumes were visible during 26-27 January. On 28 January, a large pyroclastic flow traveled down the Tar River Valley and reached the sea. A diffuse plume rose to an altitude of 1.5 km on 31 January.
During 7-13 February, growth of the lava dome continued on the W side, then was concentrated on the E and N sides for the rest of the month. The lava-dome volume in mid-February was estimated at 200 million cubic meters based on LIDAR data. Previous measurements over-estimated the lava-dome volume due to the perceived location of the dome and the lack of data from inside the crater. Small pyroclastic traveled in multiple directions throughout February. Moderate pyroclastic flows traveled down the Tar River Valley during 24-25 and 27 February. Continuous ash emissions were reported during 14 February-6 March, with plumes to altitudes of 2.1-6.1 km.
Lava-dome growth during 2-9 March was concentrated on an E-facing lobe topped with blocky, spine-like protrusions. Rockfalls affected the E and NE flanks. Pyroclastic flows traveled 2 km in the Tar River Valley. Heightened pyroclastic activity on 7 March resulted in an ash plume that rose to an estimated 2.4 km. On 11 March, a pyroclastic flow traveled down the NE flank into White's Ghaut.
During 9-26 March, lava-dome growth was concentrated on the NE side. Intermittent pyroclastic flows traveled E down the Tar River valley and produced ash plumes. One plume on 12 March rose to 3 km altitude. Pyroclastic flows were observed NW in Tyre's Ghaut and ashfall was reported from the Salem /Old Towne areas. During 23 March-3 April, dome growth apparently stopped.
MODIS thermal data indicated hot pixels at the dome and from pyroclastic flows on 24 March. Another thermal anomaly from a pyroclastic flow Tar River was detected on 29 March. No futher anomalies had been recorded by the HIGP Hotspot system through May. However, the Washington VAAC reported that a SW-drifting, diffuse plume and a hotspot were visible on satellite imagery on 2 April.
During 30 March-13 April, small, intermittent pyroclastic flows from the E-facing shear lobe occurred in the Tar River valley (figure 76). Incandescent rockfalls were seen at night during 5-9 April. On 17 April, a small pyroclastic flow was observed to the NW in the upper part of Tyres Ghaut. In mid-April MVO estimated that the lava-dome volume was about 208 million cubic meters.
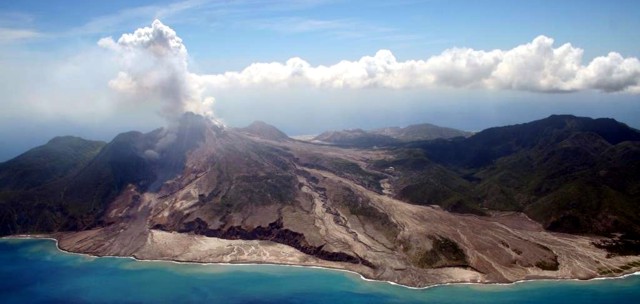 |
Figure 76. Photograph taken 4 April 2007 of southern Montserrat and Soufrière Hills from the NE, showing from left the Tar River Delta and the debris fans spilling from Tuitts and Whites Ghauts. Courtesy MVO. |
The sulfur dioxide (SO2) flux rate during 6-13 April was high, with an average value of 3,114 metric tons per day (t/d), well above the long-term average for the eruption. The previous week averaged 1,035 t/d, from a low of 71 to a high of 3,818 t/d. The three days from 8 to 10 April showed markedly elevated emissions: 3,550, 7,396 peaking at 7,471 t/d, whereas the remaining days' emissions were extremely low, some below 100 t/d.
During 13-20 April, material originating from the lava dome's E-facing shear lobe was shed down the Tar River Valley. A bluish haze containing sulfur dioxide was observed flowing down the N flanks on 18-20 April. Pyroclastic activity was ongoing on the E and NE sides of the dome during 27 April-4 May. After 4 May the overall structure of the dome changed very little. Low-level rockfall and pyroclastic-flow activity continued into late May.
Reference. Wadge, G., Macfarlane, D.G., Robertson, D.A., Hale, A.J., Pinkerton, H., Burrell, R.V., Norton, G.E., and James, M.R., 2005, AVTIS: a novel millimetre-wave ground based instrument for volcano remote sensing: J. Volcanology and Geothermal Research, v. 146, no. 4, p. 307-318.
Information Contacts: Montserrat Volcano Observatory (MVO), Fleming, Montserrat, West Indies (URL: http://www.mvo.ms/); Washington Volcanic Ash Advisory Center (VAAC), Satellite Analysis Branch (SAB), NOAA/NESDIS E/SP23, NOAA Science Center Room 401, 5200 Auth Road, Camp Springs, MD 20746, USA (URL: http://www.ospo.noaa.gov/Products/atmosphere/vaac/); Hawai'i Institute of Geophysics and Planetology, MODIS Thermal Alert System, School of Ocean and Earth Sciences and Technology (SOEST), University of Hawai'i, 2525 Correa Road, Honolulu, HI, USA (URL: http://modis.higp.hawaii.edu/).
Halt in dome growth during March 2007-May 2008
Our previous report on Soufrière Hills characterized the eruptive behavior and monitoring between 16 June 2006 and 25 May 2007 (BGVN 32:04). The current report describes activity between the end of May 2007 through May 2008.
Summary report. A report of a 14 and 16 April 2008 meeting by an advisory committee provides a convenient summary of recent behavior (SAC10, 2008). With minor stylistic changes, important paragraphs are quoted below.
The report indicated that by about mid-March 2007 the volcano stopped extruding dome lava. The authors said that since about October 2007 volcanism at the surface of the volcano has been at a very low level. Further, they noted, "Whilst there have been no major collapses of the dome, or explosions, rockfalls and minor pyroclastic flows [traveling E] into the Tar River Valley have occurred that have eroded the eastern side of the dome. However, the main mass of the 2006-2007 lava dome remains intact, and whilst it remains so it is capable of generating major pyroclastic flows for years to come. Also, the flow of gas continues to stream through the dome from the magma deep in the Earth, forming the visible plume.
"A lidar survey of the shape of the dome undertaken in March 2008 gave an estimate of 195 million cubic meters for the volume of the dome. This figure is within the bounds of uncertainty of the volume estimate of 203 million cubic meters derived from photogrammetry in April 2007.
"The three distinct lobes of lava at the summit of the dome, present at the end of lava extrusion in April 2007, remain. There have been a number of rockfalls and a few minor pyroclastic flows from the dome into the Tar River Valley. As a result of these, the uppermost part of the talus has been removed on the eastern side exposing a steep band of core lava below which a chute channels material to lower levels. Similarly, erosion of talus has begun to re-expose the buried northern crater rim.
"Gases escape from the dome in several areas. On the southern and northern talus slopes multiple gas vents release mainly water-rich gas. Sulphur deposits are evident around the southern vents. These locations have been a common feature for much of the eruption. On the western side of the upper dome, just inside the buried Gage's Wall, is a vent releasing a large flux of gas with a pale blue tint, indicative of sulphur dioxide. This vent formed in February 2006 and has been the source of weak ash generation in the past, roaring noises, and the cause of minor erosion of the Gage's Wall (September 2006).
"The low levels of rockfall seismicity seen in 2007 declined even further during 2008. There were two minor swarms of long-period earthquakes on 23 November 2007 and 28 January 2008, the latter being co-incident with roaring from the Gage's Wall vent. Volcano-tectonic earthquakes occurred between the surface and 4 km below the dome. These may be caused by stress changes around the conduit.
"The reference GPS line between the South Soufrière (SOUF) and old MVO (MVO1) receivers continued the same extensional trend that began when extrusion stopped in April 2007. This extension is slower than the equivalent contracting trend seen during lava extrusion, but is comparable to the extension measured during the first year of the last pause in activity. This pattern is confirmed by most of the other GPS stations and the EDM lines on the northern side of the volcano. This extension is consistent with an island-wide pattern of surface inflation due to the magma reservoir re-charging at depth. Any deformation due to the effects of surface loading by the dome dies away over a much shorter distance from the volcano than that being monitored between MVO1 and SOUF.
"The lack of any fresh, degassing andesite magma high in the conduit was confirmed by low measured HCl/SO2 ratios. Sulphur dioxide was emitted at a rate above the long-term average (about 500 tonnes/day). Because several instruments in the measurement network have failed, there are some doubts about the absolute values, but a gradually increasing long-term trend seems real. This indicates not only that basalt degassing is ongoing, but also that the system may be becoming more permeable to deep gas loss or that gas production has increased. High values of sulphur dioxide measured by ground-based diffusion tubes to the west of the volcano have been recorded, as was also seen during the previous pause in 2005.
"Ongoing retrospective petrological analysis of the lava erupted over the last few years indicates that the amount of the basalt magma incorporated into the andesite lava that appears at the surface may be greater than previously appreciated. Understanding the mass balance of this interchange and being able to monitor it through time would help to understand the dynamics of the magma chamber.
"The current pause is 13 months long. Previous pauses have lasted 20 months (March 1998?November 1999) and 24 months (July 2003?August 2005). Despite the presence of a large dome, the "residual" surface activity now is far less than was the case during the first pause, when there was also a dome, and is much more like the second pause when there was no dome. The main difference between the first year of this pause and the first year of the second pause is the increasing trend of sulphur dioxide output in 2007-8. A few months prior to the ends of both previous pauses, the level of seismicity, and particularly long period seismicity, increased and there was a resumption of steam-rich explosions."
MVO and other reports. In accord with the summary above, the Montserrat Volcano Observatory (MVO) noted very low seismicity since May 2007. However, at the end of this reporting interval (May 2008), monitoring suggested that volcanic activity seemed headed for an upturn.
Despite the lack of dome growth (or dome destruction) during the entire period of this report the Alert Level remained at 4 (on a scale of 0-5). Authorities prohibited access to many areas near the volcano, including some areas ranging from 2 to 4 km offshore.
The Washington Volcanic Ash Advisory Center (W-VAAC) noted several ash plumes during mid-May 2007 through December 2007 (11 June, 22-28 August, 16 September, 12 October, 15-19 November) and 2008 (7 and 10 January, 10 April, 5 May, 13 -19, 23 and 29 May). Some of the plumes resulted from rockfalls (19 November, and 7 January).
Plumes on 11 June and 15-16 November may have reached 3.7 km altitude. Those on 13 and 29 May rose to 3 km altitude.
Pyroclastic flows were indicated in MVO reports for the May-December 2007 part of the reporting interval on at least 16 days. Particularly noteworthy were days with multiple pyroclastic flows, including 11 June (2), 23 August (4), and 29 November (4). The latter sequence of pyroclastic flows followed minutes after a regional M 7.4 earthquake. A 30 July pyroclastic flow traveled N for a 1.5 km runout distance.
Pyroclastic flows during January-May 2008 occurred on at least five days, and on one of those days, two occurred. One on 15 January had a 2 km runout distance. A pyroclastic flow on 29 May 2008 descended a few hundred meters to the W of the dome and was associated with the above-mentioned ash plume rising to 3 km altitude. An overflight the next day suggested that the explosion and pyroclastic flow originated from the Gages vent.
Lahars were indicated in MVO reports, often one or more per month and sometimes one or more per week, during the 2007-8 reporting interval, typically associated with heavy rains and fresh deposition. Lahars were numerous on 23 October 2007 (descending all drainages), vigorous around 25-26 October 2007, abundant the week of 13-19 February 2008, and noteworthy on 5 May 2008.
A photo shows the little-changing dome as it appeared on 7 January 2008 (figure 77). The photo emphasizes the dome's steep sides and craggy summit, as well as wide areas with emerging plumes. SAC (2008) noted that, although seemingly static, the dome is far from stable and large pyroclastic flows are possible from dome disruptions in the future. In the past, many of the pyroclastic flows traveled E. SAC (2008) noted the possibility (and discussed probabilities) for their transit from the dome towards the WNW along various areas just N of Plymouth.
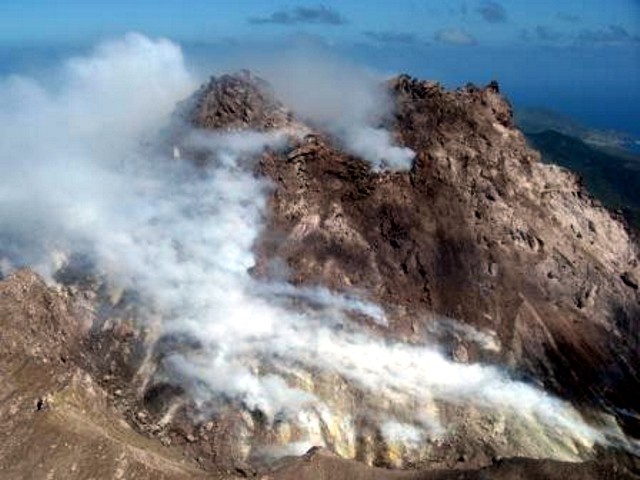 |
Figure 77. Photo of the Soufrière Hills lava dome taken on 7 January 2008 from the S with the crater rim in the foreground. Courtesy of Greg Scott, Caribbean Helicopters (from MVO website). |
According to MVO, the level of volcano-tectonic (VT) earthquakes at Soufrière Hills increased during the week of 25 April-2 May 2008, and was the highest since February 2006. During this week, degassing from a vent above Gages Wall was audible in the St. George's Hill area to the NW, and steaming from the area above Tyre's Ghaut to the NW was visible. Light ashfall was reported in the Old Town area about 9 km NW, and in other nearby areas.
During 9-19 May 2008, activity increased. On 13 May a single long-period earthquake occurred, accompanied by a blue sulfur-dioxide plume. An ash plume that rose to an altitude of 3 km drifted NW (dropping ash over much of Iles Bay, Belham, Old Town, and Olveston). Ash emissions from two areas in the Gages vent to the W were observed on 15 May, but may have started the previous day. The resultant ash plume rose about 200 m above the lava dome and drifted W. Both a small rockfall and gentle roaring noises were reported. A new fumarolic area was seen on the SE side of Chances Peak. Ash emissions from Gages vent continued on 16 May. During the week of 17-23 May, activity decreased slightly.
A weekly summary of seismicity and SO2 fluxes between 25 May 2007 and 30 May 2008 is indicated in table 65. In addition to the rockfall data in the table, there was one long-period rockfall event during each of the weeks of 23-30 November, 4-11 January, and 11-18 January. The long-term SO2 average is 550 tons/day.
Table 65. Soufrière Hills seismicity and sulfur dioxide flux between 25 May 2007 and 30 May 2008. Courtesy of MVO.
| Date | Hybrid EQ's | Volcano-tectonic EQ's | Long-period EQ's | Rockfall signals | SO2 flux (metric tons/day) |
| 25 May-01 Jun 2007 | 1 | 1 | -- | 5 | 230 |
| 01 Jun-08 Jun 2007 | -- | 1 | 1 | 5 | 175 |
| 08 Jun-15 Jun 2007 | -- | 1 | -- | 10 | 288 |
| 15 Jun-22 Jun 2007 | -- | 1 | 1 | 10 | 165 |
| 22 Jun-29 Jun 2007 | -- | 1 | -- | 3 | 203 |
| 29 Jun-06 Jul 2007 | -- | 1 | 1 | 10 | 200 |
| 06 Jul-13 Jul 2007 | -- | 1 | -- | 4 | -- |
| 13 Jul-20 Jul 2007 | -- | 1 | 1 | 6 | 300 |
| 20 Jul-27 Jul 2007 | -- | 3 | -- | 5 | -- |
| 27 Jul-03 Aug 2007 | -- | 2 | 2 | 11 | 639 |
| 03 Aug-10 Aug 2007 | -- | 2 | -- | 5 | -- |
| 10 Aug-17 Aug 2007 | -- | 2 | -- | 4 | 818 |
| 17 Aug-24 Aug 2007 | -- | 4 | -- | 4 | 509 |
| 24 Aug-31 Aug 2007 | -- | 13 | 1 | 17 | 740 |
| 31 Aug-07 Sep 2007 | -- | 1 | 1 | 7 | 575 |
| 07 Sep-14 Sep 2007 | -- | 5 | -- | 6 | 688 |
| 14 Sep-21 Sep 2007 | -- | 12 | -- | 8 | -- |
| 21 Sep-28 Sep 2007 | -- | 4 | -- | 9 | 300 |
| 28 Sep-05 Oct 2007 | -- | 1 | 2 | 3 | 384 |
| 05 Oct-12 Oct 2007 | -- | -- | -- | 10 | 508 |
| 12 Oct-19 Oct 2007 | -- | 5 | -- | 3 | 691 |
| 19 Oct-26 Oct 2007 | -- | -- | 1 | 9 | 518 |
| 26 Oct-02 Nov 2007 | -- | -- | -- | 9 | 618 |
| 02 Nov-09 Nov 2007 | -- | 12 | -- | 16 | 596 |
| 09 Nov-16 Nov 2007 | -- | 2 | -- | 11 | 698 |
| 16 Nov-23 Nov 2007 | -- | -- | 20 | 7 | 685 |
| 23 Nov-30 Nov 2007 | -- | -- | 46 | 4 | 868 |
| 30 Nov-07 Dec 2007 | -- | -- | -- | 4 | 405 |
| 07 Dec-14 Dec 2007 | -- | 1 | -- | 2 | 811 |
| 14 Dec-21 Dec 2007 | -- | 9 | -- | 2 | 865 |
| 21 Dec-28 Dec 2007 | -- | 4 | -- | 8 | 861 |
| 28 Dec-04 Jan 2008 | -- | 1 | -- | 2 | 615 |
| 04 Jan-11 Jan 2008 | -- | 8 | 1 | 2 | 513 |
| 11 Jan-18 Jan 2008 | -- | 13 | 2 | 3 | 568 |
| 18 Jan-25 Jan 2008 | -- | -- | -- | 2 | 734 |
| 25 Jan-01 Feb 2008 | -- | 3 | 25 | -- | 468 |
| 01 Feb-08 Feb 2008 | 1 | 3 | -- | 2 | 881 |
| 08 Feb-15 Feb 2008 | 1 | -- | -- | 1 | 1,004 |
| 15 Feb-22 Feb 2008 | 1 | -- | 1 | 1 | 872 |
| 22 Feb-29 Feb 2008 | 4 | -- | -- | -- | 972 |
| 29 Feb-07 Mar 2008 | 1 | 1 | -- | -- | 824 |
| 07 Mar-14 Mar 2008 | -- | 4 | -- | 3 | 766 |
| 14 Mar-21 Mar 2008 | 2 | 2 | -- | 3 | 1,070 |
| 21 Mar-25 Apr 2008 | -- | -- | -- | -- | -- |
| 25 Apr-02 May 2008 | -- | 48 | 3 | 1 | 574 |
| 02 May-09 May 2008 | -- | 10 | 5 | 5 | 630 |
| 09 May-16 May 2008 | -- | 25 | 1 | 17 | 506 |
| 16 May-23 May 2008 | -- | 3 | 2 | 11 | 653 |
| 23 May-30 May 2008 | -- | 8 | 2 | 10 | -- |
Since 2002, MVO has been monitoring the SO2 emission rate in real-time, with spectra telemetered back to the observatory from an array of three fixed, scanning UV spectrometers. MVO has also calculated the HCl:SO2 ratio by measuring the HCl emission rates indirectly using an open-path Fourier Transform Infrared spectrometer (FTIR). These ratios may be used to evaluate changes in the eruption rate and dome growth. Such mass ratios determined since August 2007 ranged from 0.28 to 0.46, with one ratio at 0.67 (during 9-16 November 2007).
MVO's weekly report for the third week of May states "observations show continuing unrest ... with a gradual increase over the last few weeks. The events of this week suggest that fresh magma is rising beneath the dome. There is now a distinct possibility that lava extrusion will start from the Gages vent without any warning. If this happens, it will probably not be long before there are small pyroclastic flows to the W. Even if lava extrusion does not restart, the dome is still a very large mass of very hot material which is capable of collapsing or exploding at any time."
Seismic signals. Five main seismic signal types have been recognized at many volcanoes, including Soufrière Hills. These include volcano-tectonic (VT) earthquakes, long-period (LP) earthquakes, hybrid earthquakes, rockfall or pyroclastic flow signals, and explosion signals. McNutt (2000) presents illustrations of characteristic seismic traces.
MVO defines a VT earthquake as having an impulsive (i.e., large amplitude) start and then rapidly decreasing in amplitude. These earthquakes often appear in swarms and are predominantly high-frequency signals (over 2 Hz). They are interpreted as due to rock fracturing.
An LP earthquake, as defined by MVO, has a more emergent start (i.e., amplitude growing with time) and generally low, narrow-band frequency content (1-2 Hz). These are interpreted as the result of signal resonance due to gas or magma inside the volcanic conduit.
MVO defines a hybrid (HB) earthquake as a mixture between VTs and LPs; hence they tend to have impulsive starts but contain significant amount of low-frequency signal. They are thought to represent magma forcing its way to the surface. These signals are often associated with periods of rapid dome growth, and are sometimes precursors to major dome collapses or switches in the direction of lava extrusion at the surface. These signals often merge into continuous tremor, which sometimes occurs in bands spaced 4-24 hours apart.
According to MVO, rockfall or pyroclastic flow signals have often been a dominant type of seismic signal recorded here (e.g., table 65). They have an emergent start and a gradual tapering towards the end of the signal and a wide frequency range. They are interpreted as being due to material falling off the dome and traveling down the flanks. Pyroclastic flow signals are similar to those of rockfalls but are generally of longer duration and higher amplitude.
Pyroclastic deposits in the ocean. Trofimovs and others (2006) reported that more than 90% of the pyroclastic material erupted at Soufrière Hills has been deposited in the ocean. The authors describe the characteristics of the deposits at different distances from shore. The coarse material forms steep-sided, near-linear ridges that intercalate to form a submarine fan. The finer materials form turbidity currents that flow to distances greater than 30 km from the shore.
MVO management. For almost 10 years the British Geological Survey (BGS) managed MVO. Beginning 1 April 2008, this service shifted to the Eastern Caribbean's two major geo-hazard organizations, the Seismic Research Unit (SRU) of the University of the West Indies, Trinidad and Tobago and the Institut de Physique du Globe de Paris (IPGP), France. The SRU carried out long-term monitoring prior to the 1995 eruption episode. They were assisted by others as the eruption began. A statement on the new situation included the following paragraph.
"The SRU monitors earthquakes and volcanoes for most of the English-speaking Eastern Caribbean countries. The IPGP has volcano observatories on Martinique and Guadeloupe, i.e. the main French-speaking Antilles. Island arcs such as the Lesser Antilles are regions where complex real-life hazards exist, not only the better known volcanic eruptions, but also the generation of a tsunami by a submarine earthquake or a volcanic landslide. The linking of these two research institutions will provide greater opportunities for studying volcanism and earthquake activity at arc-scale rather than the scale of individual islands, a logical and innovative step towards disaster risk reduction regionally and globally."
Reference. McNutt, S.R., 2000, Volcanic seismicity, in H. Sigurdsson (ed), Encyclopedia of Volcanoes, Academic Press, San Diego, p. 1015-1033.
Trofimovs, J., Amy, L., Boudon, G., Deplus, C., Doyle, E., Fournier, N., Hart, M.B., Komorowski, J.C., Le Friant, A., Lock, E.J., Pudsey, C., Ryan, G., Sparks, R.S.J., and Talling, P.J., 2006, Submarine pyroclastic deposits formed at the Soufrière Hills volcano, Montserrat (1995-2003): What happens when pyroclastic flows enter the ocean?: Geology, v. 34, no. 7, p. 549-552.
SAC10, 13 May 2008, Assessment of the hazards and risks associated with the Soufriere Hills volcano, Montserrat, Tenth Report of the Scientific Advisory Committee on Montserrat, Volcanic Activity, based on a meeting held between 14 and 16 April 2008 at the Montserrat Volcano Observatory, Montserrat (Part I: Main Report), 23 pp. (URL: http://www.mvo.ms/).
Information Contacts: Montserrat Volcano Observatory (MVO), Fleming, Montserrat, West Indies (URL: http://www.mvo.ms/); Washington Volcanic Ash Advisory Center, Satellite Analysis Branch (SAB), NOAA/NESDIS E/SP23, NOAA Science Center Room 401, 5200 Auth Road, Camp Springs, MD 20746, USA (URL: http://www.ssd.noaa.gov/).
Dome collapse and eruption on 28 July, followed by renewed dome growth
Our previous report on Soufrière Hills (BGVN 33:04), characterized the eruptive behavior and monitoring of dome growth during March 2007-May 2008. The current report describes activity from the end of May 2008 through 4 December 2008.
Through the end of May, the Montserrat Volcano Observatory (MVO) generally reported continued pause in dome growth and low seismicity. An explosion on 29 May produced an ash plume that rose to an altitude of ~ 3 km and drifted SW; a pyroclastic flow descended a few hundred meters to the W. Aerial observation the following day suggested that the activity originated from the Gages vent. The explosion, which had no precursory seismicity, was heard in multiple areas to the NW.
Throughout June and the first three weeks of July, the background activity, while low, indicated continuing unrest. The pause in dome growth continued, but MVO emphasized that despite the lack of substantial lava extrusion, the dome remained hot and hazardous.
Mild ash was ejected from the Gages vent on 19 June. The event lasted for ~ 2 hours, and included several pulses. Due to strong E winds at low altitudes, the ash plume remained below ~ 1,200 m altitude and left Old Towne and Olveston untouched.
During mid- and late June, sporadic heavy rainfalls triggered minor mudflows down the Belham River. Access was accordingly prohibited. Also, a Maritime Exclusion Zone kept boats away from the island's S shore.
On 21 July, four mild eruptions occurred, typically venting ash or pyroclastic flows. The previous day there had been a large swarm of shallow volcano-tectonic earthquakes beneath the volcano and seismicity proceeded continuously throughout each of the first three eruptions. The first three eruptions lasted for about 50, 40, and 75 minutes, respectively. The third one generated the largest seismic signals, the fourth event was much smaller. Volcano-tectonic and hybrid seismic activity continued for the rest of the week without significant reduction. Small pyroclastic flows from collapses in the eroded chute on the dome's SE and E flanks traveled down the Tar River valley, with the largest reaching to within 500 m of the sea.
All four events generated ash columns rising more than 2 km. The first two events also generated ash clouds above the upper Tar River valley, probably caused by small pyroclastic flows. Ash clouds drifted W over Plymouth and St George's Hill; the source of the ash was probably the vent at Gages. Light ashfall occurred in parts of Old Towne. Rumbling, continuous at times, was heard in Salem, Old Towne and Olveston during each of the first three events. Lightning strikes could also be heard and sometimes seen. These events were most probably caused by ash venting from the lava dome, accompanied by small collapses on the E flank of the dome; however, there was no apparent change in the lava dome's shape.
After 20-25 July, seismicity increased significantly. On 26 July, a series of hybrid earthquakes slowly increased in both numbers and magnitude, eventually reaching about 15 events per hour. Seismicity decreased for a few hours, then increased again. Hybrid earthquakes with a few long-period events peaked at a rate of more than one per minute.
On the morning of 27 July, a short series of eruptions occurred. The first eruption generated a non-energetic ash column that rose ~ 2.5 km; the source of ash could not be seen due to cloud cover, but was probably the Gages vent. The ash cloud was blown to the W and NW, and there was ashfall in Plymouth and St George's Hill; pyroclastic flows were absent. Two other eruptions during the next 45 minutes were much smaller, with ash clouds below 1.5 km altitude. Seismicity continued at a slightly reduced level following these eruptions.
28 July dome collapse. On 28 July the seismic signals built up gradually over a few minutes, signals interpreted as consistent with a dome collapse rather than an explosion. Seismicity then displayed a series of sharp peaks consistent with explosive activity, but this activity stopped within about an hour. Next, there was a partial collapse on the dome's W side. A few explosions issued from the dome during the collapse. An infrasound sensor on St Georges Hill, which records low frequency sound waves, recorded a clear explosion signal that coincided with the largest peak recorded in the seismic signals.
The collapse generated three pyroclastic flows that traveled down the flanks. The largest, from the Gages area, split into two and traveled to Lee's Yard and Plymouth. A pyroclastic flow in Plymouth also split into two as it diverted around Round Hill, with a pyroclastic surge traveling over the top of the hill.
The two lobes of this W-traveling pyroclastic flow traveled almost to the sea, with one reaching the old Police headquarters and the other reaching the Pentecostal Church and the old Government House. This pyroclastic flow set fire to trees and vegetation on Gages Mountain, the lower flank of St George's Hill, and some buildings in Plymouth.
Another pyroclastic flow emerged from the channel created by erosion on the dome's SE flank. It descended E into the Tar River valley and traveled as far as the old Montserrat coastline. A much smaller flow followed a gully cut in volcanic material choking the upper White River; this flow only reached ~ 2 km or less from the dome.
Post-eruption examination of the deposits found that the pyroclastic flows at the Tar River appeared to contain significant amounts of old dome material, which would reflect the partial dome collapse. In contrast, the pyroclastic flows at both Plymouth and White River contained mainly juvenile pumice, material thought to have risen some distance in a plume.
The material collapsed from the dome on the 28th occupied a volume of ~ 200,000-300,000 cubic meters. Satellite radar images indicated that the vent above Gages wall was enlarged by the explosion to ~ 150 x 60 m, elongated E-W. MVO interpreted the 28 July eruption as caused by input of new magma, possibly triggered by the partial collapse of existing dome material.
MVO stated that the 28 July eruption generated a large ash column and the fallout of airborne pumice in nearby communities. The ash column reached a maximum altitude of ~ 12 km and drifted primarily NW. While almost no ash fell on inhabited areas near the volcano, there were reports of ashfall from St Croix, Puerto Rico, and Guadeloupe. Satellite sensors indicated the release of at least 2,000-3,000 tons of sulfur dioxide (table 66). Two minor eruptions on 29 July generated small ash clouds. During the period of this activity, the Washington VAAC published numerous advisories for aviation (table 67).
Table 66. Sulfur dioxide emissions were almost continuous during June-October 2008, and appear here as weekly averages and minimum/maximum values. Values are in metric tons/day. Courtesy of MVO.
| Date | AveraGE SO2 | Minimum SO2 | Maximum SO2 | Remarks |
| 31 May-06 Jun 2008 | 206 | -- | -- | -- |
| 07 Jun-13 Jun 2008 | 228 | 161 | 294 | -- |
| 14 Jun-20 Jun 2008 | 254 | 201 | 347 | -- |
| 21 Jun-27 Jun 2008 | 323 | 256 | 472 | -- |
| 28 Jun-04 Jul 2008 | 329 | 276 | 440 | -- |
| 05 Jul-11 Jul 2008 | 339 | 242 | 564 | -- |
| 11 Jul-18 Jul 2008 | 414 | 243 | 561 | -- |
| 18 Jul-24 Jul 2008 | 378 | 216 | 794 | -- |
| 25 Jul-01 Aug 2008 | -- | -- | -- | 2-3,000 tons SO2 released during the eruption on 28 July |
| 01 Aug-08 Aug 2008 | 1,121 | 671 | 2,069 | -- |
| 09 Aug-15 Aug 2008 | 1,016 | 364 | 1,791 | -- |
| 16 Aug-22 Aug 2008 | 1,122 | 274 | 2,033 | -- |
| 23 Aug-29 Aug 2008 | 466 | 239 | 758 | Data for 3 days |
| 30 Aug-05 Sep 2008 | -- | -- | -- | -- |
| 06 Sep-12 Sep 2008 | 1,422 | 562 | 4,599 | -- |
| 13 Sep-19 Sep 2008 | 989 | 657 | 1,217 | -- |
| 20 Sep-26 Sep 2008 | 1,239 | -- | -- | Data for 2 days |
| 26 Sep-03 Oct 2008 | 840 | 463 | 1,523 | -- |
| 03 Oct-10 Oct 2008 | 522 | 201 | 968 | -- |
| 10 Oct-17 Oct 2008 | -- | -- | -- | -- |
| 17 Oct-24 Oct 2008 | 531 | 277 | 668 | -- |
| 25 Oct-30 Oct 2008 | 1,283 | 689 | 2,540 | -- |
Table 67. Washington VAAC advisories as a result of ash plumes from Soufrière Hills during 21 July 2008-20 October 2008. All reports were based on GOES-12 satellite source information.
| Date | Time (UTC) | Altitude | Drift | Remarks |
| 21 Jul 2008 | 1145 | ~1.8 km | W | -- |
| 21 Jul 2008 | 1315 | ~1.8 km | -- | Plume to ~2 km; 16 km wide. |
| 21 Jul 2008 | 1915 | ~1.8 km | W, S | -- |
| 22 Jul 2008 | 0108 | -- | -- | Ongoing emissions. |
| 22 Jul 2008 | 0708 | ~1.8 km | W | Intermittent low level ash emissions. |
| 22 Jul 2008 | 1245 | ~1.8 km | W | Reduced seismicity. |
| 22 Jul 2008 | 1845 | ~1.8 km | W | -- |
| 27 Jul 2008 | 1345 | ~2.4 km | W | Small bursts of venting gases and ash; seismic signals increased. |
| 27 Jul 2008 | 1945 | ~2.4 km | W | Dome collapse event began. |
| 29 Jul 2008 | 0415 | ~12 km | W | Partial dome collapse on dome's W flank, accompanied by several explosions that generated ash plumes. Highest ash level noted at about 0340 UTC moving ESE. |
| 29 Jul 2008 | 0340 | ~12 km | SE | Weak hotspot in multi-spectral satellite data. |
| 29 Jul 2008 | 1215 | ~7.6 km | NW | Partial dome collapse 0327 UTC. |
| 29 Jul 2008 | 1815 | ~7.6 km | NW | -- |
| 30 Jul 2008 | 0615 | ~2.7 km | SW | Low-level emissions. |
| 30 Jul 2008 | 1215 | ~2.7 km | NW | Thin low level plume. |
| 30 Jul 2008 | 2345 | ~7.6 km | W | Residual ash and ongoing summit emissions. |
| 20 Oct 2008 | 1415 | ~5.5 km | NW | Ash associated with a pyroclastic flow. |
Monitoring dome shape and finding new rockfall material. The 6 August MVO report noted that the only significant change in the past few months occurred in the area of the Gage's Wall vent. That area was the source of ash and mild explosive activity in the last few months. During the first weeks of August seismicity was relatively low.
X-band radar images of the dome (figure 78) taken from different sides allow comparisons between 9 October 2007 and 1 August 2008. Images such as these help MVO interpret changes in topography and other features such as the surface texture of pyroclastic flows. Radar images provide data not available using optical techniques such as aerial photography or satellite imagery. For example, this image illustrates an effect called layover, where topography appears to lean. The images are also quite sensitive to the moisture content (affecting conductivity) and roughness of the ground surface (which scatters the radar energy).
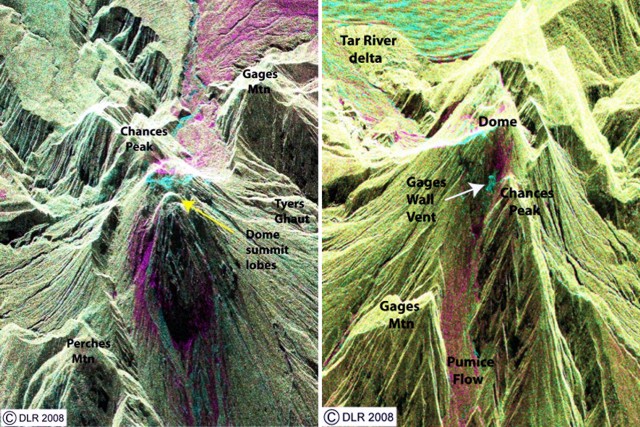 |
Figure 78. False-color satellite images with 2-3 m resolution showing Soufriere Hills from the E (left) and W (right) made to compare 9 October 2007 and 1 August 2008. These images used radar (TerraSAR-X, ~ 3 cm wavelength) data and provided views of such features as the 28 July 2008 pyroclastic flow deposits. In colored versions of these images, those 28 July deposits appear as magenta areas (rougher in 2007 than 2008). Similarly, the enlarged Gages Wall vent, which is best seen in the W view, is cyan-colored (rougher in 2008 than 2007). The image was made available to MVO thanks to the United Nations' International Charter, Geoff Wadge, and the German TerraSAR-X satellite. Courtesy of MVO. |
In the radar images color channels represent different points or intervals of time: red, 9 October 2007; green, 1 August 2008; and blue, the difference between those two dates. The result is that yellow areas depict terrain unchanged between those times. Areas of magenta had rougher surfaces in 2007 than 2008; areas that are cyan had rougher surfaces in 2008 than in 2007.
A new lava extrusion started from the W side of the lava dome sometime between the 28 July dome collapse event and 8 August when a new channel of fresh rockfall material was seen below Gages Wall.
On 14 August the dome's W side was visible and observers noted that the explosion crater of 28 July was almost filled with new lava and lava had spilled over the lower and W side of the crater and generated rockfalls.
On 8 August, the Government of Montserrat instituted a new Hazard Level System, which replaces the Alert Level system. The system divides the southern two-thirds of the island into six zones, and includes two Maritime Exclusion Zones. Access into each of the zones is restricted depending on the Hazard Level assigned (1-5); the current level has been set at 3.
During the week of 15-22 August, MVO found evidence of increased growth of the dome's W side. Earthquakes and rockfalls increased. Rockfalls occurred on the dome's W side in a new channel below Gages Wall. Ash plumes occasionally generated by the rockfalls were most noticeable on 16 and 17 August. On 19 August a pyroclastic flow again descended the Tar River Valley. According to news reports, on 25 August a rainfall-induced pyroclastic flow on the W flank split into two parts and caused ashfall to the N. The event enlarged and steepened the rockfall gully below Gages Wall. Lahars likely descended the Tar River Valley on 29 and 31 August.
On 1 September, a lahar descended the Belham River valley to the NW; the event lasted ~ 50 minutes. A new vent was observed on the NW part of the lava dome, a little further N of the Gages vent. Incandescence was also observed at a scar on the lava dome and in an area N of the scar. Rockfalls descended the W side of the dome. MVO reported that seismicity continued at a low level and dome growth continued throughout September.
During October, slow growth on the W side of the dome was accompanied by mudflows. As a result of slow and continuous erosion of the lower part of the dome, occasional rockfalls occurred on both the W side in the gully over Gages Wall and on the E side in the Tar River Valley.
One notable volcano-tectonic event occurred on 5 October in coincidence with the arrival of seismic waves from a M 6.6 earthquake in central Asia. Although the rate of lava extrusion had declined significantly, thermal imagery captured during an overflight on 8 October revealed that a major E-W oriented fracture in the dome, aligned with Gages valley and extending vertically over a few tens of meters, was associated with very elevated temperatures. Several other very hot areas on the dome were visible as points of incandescence that night. Also on 8 October, mobile, hot lahars were observed in Plymouth near the Pentecostal Church. This indicated that the 28 July pumice flows were still very hot.
Toward the middle of October, activity was low and consisted mainly of mudflows spurred by tropical storms that evolved to become hurricane Omar. Strong headward erosion affected the dome's talus slope on the Tar River side. A large gap developed in the talus, exposing the dome's core and forming a large vertical cliff.
Between 10-17 October, instrumentation recorded five long-period, five hybrid, and one volcano-tectonic earthquakes and only two rockfalls. By the third week of October, activity had increased slightly. Seismicity for the week consisted of 22 long-period, eight hybrid, and eight volcano-tectonic earthquakes, and two rockfalls. Incandescence was again observed from MVO on 17 October. On 20 October, three small pyroclastic flows descended to the Tar River Valley, generating small ash clouds that drifted over unpopulated areas to the W and SW. These pyroclastic flows were probably caused by the slightly increased seismic activity and continued interaction of the hot dome with water from the intense rainfall following passage of hurricane Omar. As of 24 October, there was no evidence of ongoing lava extrusion. Through the end of October, activity was at a low level. MVO recorded only four rockfalls, two long-period rockfalls, and one volcano-tectonic event. Several mudflow signals were also recorded during periods of heavy rainfall. Limited observations on 26 October confirmed that a few small pyroclastic flows traveled ~1.5 km E on the Tar River side.
Headward erosion continued along several V-shaped chutes at the base of the dome on both the dome's Tar River and SE sides. A small pyroclastic flow descended the Tar River (runout of ~ 1 km) on 27 October; it generated small ash clouds that drifted over unpopulated areas to the W, and to the SW. On the dome's W flanks, the talus pile on the Galways side developed a well-incised network of gullies leading into the White River.
On 2-5 December a series of explosions took place without clear seismic precursors. The first was the largest; MVO reported that incandescent blocks were ejected to 1 km from the dome's Gages vent. Pyroclastic flows began within 15 seconds of the first explosion's start at 0935 local time. They soon set vegetation and a few buildings into flames at Plymouth, and some of the fires continued for hours, one into the next day. The flows appeared devoid of pumice and were thought to be composed mainly of hot dome material. The event was judged smaller than the one on 28 July 2008, although the plume rose to over 10 km. The accompanying ash columns became the path for lightning strikes. Inhabited areas remained free of ash, which blew W. As of early December scientists had not assessed the impact of the 2 December events to the dome.
Information Contacts: Montserrat Volcano Observatory (MVO), Fleming, Montserrat, West Indies (URL: http://www.mvo.ms/); Washington Volcanic Ash Advisory Center, Satellite Analysis Branch (SAB), NOAA/NESDIS E/SP23, NOAA Science Center Room 401, 5200 Auth Road, Camp Springs, MD 20746, USA (URL: http://www.ssd.noaa.gov/); Caribbean Net News (URL: http://www.caribbeannetnews.com/).
A lull during late 2008 and intermittent high activity during late 2009
Dome collapse at Soufrière Hills (figure 79) and an eruption on 28 July 2008 was followed by dome regrowth (BGVN 33:10). During October through 4 December 2008, low-level activity included occasional earthquakes and explosion, lahars, and small pyroclastic flows. The current report describes activity from 5 December 2008 through 10 December 2009, primarily based on information provided by the Montserrat Volcano Observatory (MVO). Activity was intermittent during 2009 (table 68), with high-level activity resuming in November and continuing through at least 11 December.
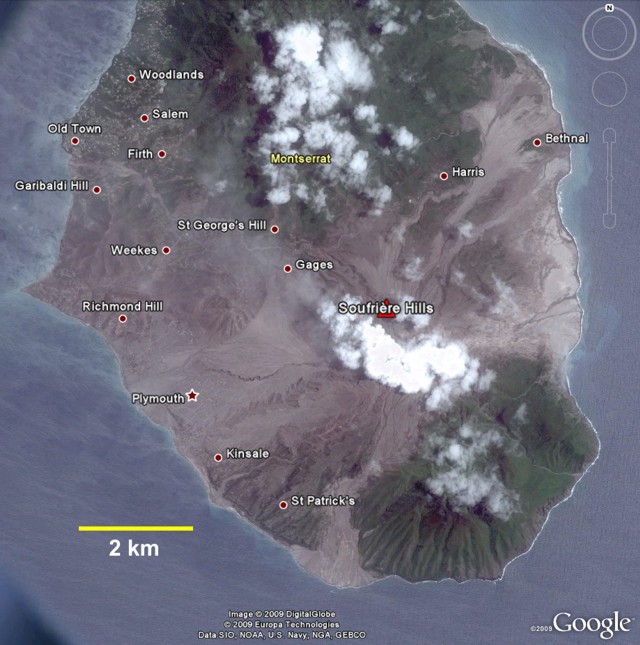 |
Figure 79. Visible satellite imagery showing Soufrière Hills and the southern part of Montserrat on 24 June 2006. Courtesy of Google Earth, with data provided by Europa Technologies and DigitalGlobe. |
Table 68. Ash plumes or plumes that may have contained ash from Soufrière Hills between 5 December 2008 and 2 December 2009. Courtesy Washington Volcanic Ash Advisory Center (VAAC), based on analysis of satellite imagery, information from MVO, and pilot reports.
| Date | Ash plume height, flow direction | Remarks |
| 13 Dec 2008 | 4.6-5.2 km | -- |
| 14 Dec 2008 | 1.8 km, W | -- |
| 15 Dec 2008 | 2.4-3 km, SW | -- |
| 16 Dec 2008 | S | Thermal anomaly |
| 19-23 Dec 2008 | 4.3 km, various | Thermal anomalies on 19 and 21 Dec |
| 24 Dec 2008 | 3 km | Caused by pyroclastic flow |
| 26-30 Dec 2008 | 2.1-4.9 km, various (28 and 30 Dec) | Thermal anomalies on 27 Dec |
| 03 Jan 2009 | 2.4-10.7 km, various | -- |
| 04 Jan 2009 | W, WSW | -- |
| 25 Feb 2009 | W | Caused by pyroclastic flow |
| 06 Apr 2009 | 2.7-4.9 km, NW | -- |
| 24 May 2009 | -- | Caused by pyroclastic flow |
| 04-06 Oct 2009 | 3.4-5.5 km, W, WNW | -- |
| 23-25 Oct 2009 | W | Caused by pyroclastic flows |
| 24 Nov 2009 | 6.1 km | Caused by pyroclastic flows |
| 02 Dec 2009 | 4.6-6.1 km | Caused by pyroclastic flows |
Activity during December 2008. Subsequent to the four explosions between 2-5 December 2008, the MVO reported that seismicity from the lava dome remained elevated. The volcano continued to inflate and discharge lava and ash during December 2008. Frequent pulses of ash rose from multiple places on the NW face of the lava dome and from a low on the dome behind Gages Mountain (as seen from Salem). A series of pyroclastic flows and rockfalls descended the Gages Valley and other valleys during December 2008, at least two reaching Plymouth (~ 5 km W). Significant lava dome growth on the SW flank was observed. Photographs showed that most of the growth had taken place since 8 December; lava was filling in the area between the lava dome and Chance's Peak. Initial calculations suggested that the dome grew at a rate of 1 m3/s during this time.
During the last two weeks of December 2008, the lava dome was characterized by increased lava extrusion, rockfalls, and pyroclastic flows. Lava extrusion on the N, W, and SW sides of the dome continued and incandescence on the dome was visible at night when weather was favorable. On 22 December, the Hazard Level was increased to 4 (on a scale 1-5) due to the repeated occurrences of pyroclastic flows in the lower part of Tyers Ghaut.
On 24 December, a large pyroclastic flow that reached Plymouth, and possibly the sea, generated an ash plume that rose to an altitude of 3 km. Ashfall was reported in areas 6-7 km NW. Large incandescent blocks, deposited by rockfalls and pyroclastic flows, were visible on multiple occasions at night in the lower parts of Tyers Ghaut. Fires triggered by surges were visible in the neighboring valley.
Activity during January-May 2009. On 2-3 January 2009, activity from the lava dome increased drastically. On 2 January, an energetic pyroclastic flow and associated surge traveled down Tyers Ghaut (NW) and reached the upper part of Belham River. On 3 January, after a period of elevated seismicity, two explosions produced large ash plumes that rose to altitudes greater than 10.7 km. Ashfall affected most of the island at elevations of 1.2 km and above. The explosions had significant "jet components" that rose to at least 500 m above the dome. In-column collapses resulted in pyroclastic flows that traveled W and reached Plymouth (~ 5 km W). According to news articles, about 70 people were evacuated from an area about 6-8 km NW.
According to MVO, the level of seismic activity decreased dramatically after 3 January. It increased slightly in early February, with occasional rockfalls, and several small pyroclastic flows. On 19 February 2009, the Hazard Level was lowered to 3. Seismic activity remained low during March through May. Occasionally, lahars caused by heavy rainfall descended through multiple river valleys. Thermal images of a pyroclastic flow on 25 February 2009, and other videos, can be viewed on the MVO YouTube channel (http://www.youtube.com/user/montserratvolcanoobs).
In mid-May 2009, activity from the Soufrière Hills lava dome increased slightly, but generally remained at a low level. Tectonic earthquakes were noted on 16, 18, 20, and 21 May at depths less than 3 km beneath the lava dome. Two possible explosions were detected on 21 May. The second and larger signal was followed by an ash plume that drifted W over Gages Mountain. During 21-22 May, a strong smell of sulfur dioxide was noted from Salem (6 km NW) to Woodlands (1 km N of Salem). Heavy rainfall caused erosion of the lava dome and hot pyroclastic flow deposits; steam plumes occasionally laden with ash occurred periodically from the base of Tyre's ghaut. Lahars traveled down multiple river valleys on 18 May.
Activity during May-December 2009. Between the latter part of May and 4 October 2009, activity remained low with only periodic rockfalls and small pyroclastic flows. On 4 October 2009, a short volcano-tectonic earthquake swarm from the Soufrière Hills lava dome was detected. A period of tremor and vigorous ash venting followed about an hour later. The resulting ash plume drifted WNW across the island and out to sea, causing ashfall in Old Towne and Olveston. The seismic signals indicated no explosive activity or pyroclastic flows, but only two rockfalls after the ash-venting event. On 5 October, intermittent ash venting continued (figure 80), and ash fell S of inhabited areas. Early on 7 October, the ash-venting events from the lava dome ceased after a total of 13 had occurred. The last three were associated with small pyroclastic flows that traveled about 500 m down Tyers Ghaut to the NNW.
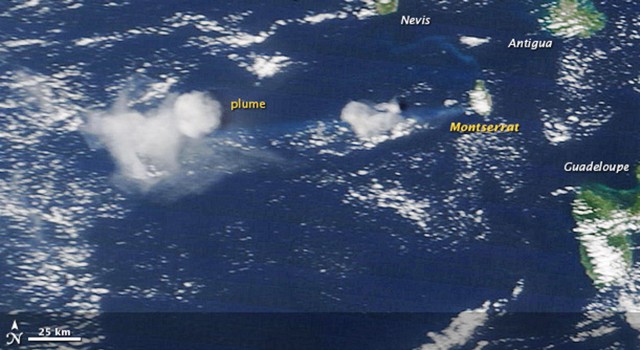 |
Figure 80. Earth Observatory natural-color satellite photo of Soufrière Hills acquired on 6 October 2009. The photo shows an ash plume extending W, a day after eruptive activity resumed on 5 October. According to the U.S. Air Force Weather Agency, ash rose to 3.6 km and extended 280 km. Courtesy NASA Earth Observatory (image by Jeff Schmaltz, MODIS Rapid Response, NASA Goddard Space Flight Center). |
By mid-October 2009, activity from the Soufrière Hills lava dome rose to a high level. A new lava dome, first reported on 9 October, continued to grow. The new lava dome summit was about 60 m above the old dome structure. Seismicity was high and cycles of low-level tremor occurred at regular intervals. Over 1,200 rockfalls were detected and pyroclastic flows traveled down every major drainage valley except the Tar River valley to the E, resulting in ash plumes (figure 81). Heavy rainfall caused a lahar in the Belham Valley to the NW on 14 October. On 16 October, several large pyroclastic flows descended the White River to the S and reached the sea. Moderate-sized pyroclastic flows traveled 3 km NE down Tuitts Ghaut and White Bottom Ghaut, and a few smaller pyroclastic flows descended Tyers Ghaut to the N. Extensive ash clouds rose to an altitude of 6 km and drifted WNW, resulting in multiple minor ashfall in inhabited areas. Venting on 6 October 2009 can be seen on the YouTube channel for the Government Information Unit of Montserrat (http://www.youtube.com/user/GIUGOV). Lahars traveled NW down the Belham valley.
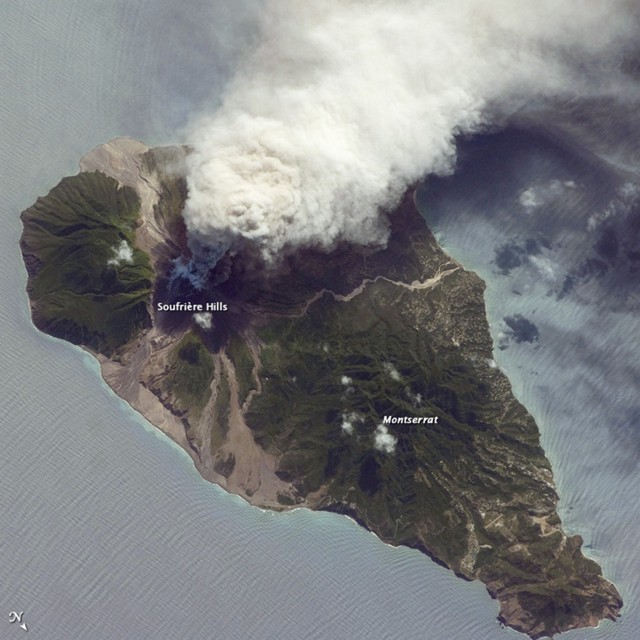 |
Figure 81. Photo of Soufrière Hills taken from the International Space Station on 11 October 2009. Photo shows ash and steam plume extending W. Gray deposits that include pyroclastic flows and lahars are visible extending from the volcano toward the coastline. Courtesy NASA Earth Observatory. |
During the last week of October 2009, seismicity decreased slightly. However, numerous pyroclastic flows, some of which produced ash plumes, occurred in most of the major drainage valleys. Rockfalls were concentrated in the S. Heavy rainfall continued to cause lahars in the Belham Valley. On 29 October, a 40-m-high spine was seen protruding from the summit. Changes in lava-dome morphology seen on 30 October, and occurrences of pyroclastic flows traveling NE, indicated that growth was concentrated in the central part of the lava dome.
By 30 October, activity was again at a high level. Hybrid earthquakes were recorded for the first time since the renewal of activity in early October. Numerous pyroclastic flows occurred in most of the major drainage valleys. The frequency of pyroclastic flows increased on 5 November and particularly vigorous flows occurred in Tuitt's Ghaut to the NE. Ash fell in inhabited areas on a few occasions. Lahars descended the Belham Valley several times. Good views of the lava dome on 9 and 10 November revealed that recent lava-dome growth was concentrated on the WSW side, immediately NE of Chances Peak; intense incandescence and rockfalls were noted at night. Ash fell across the Montserrat on 11 November, and about 6-8 km NW in Salem, Old Towne, Olveston, and Woodlands on 12 November. One pyroclastic flow nearly reached the sea at Kinsale village (WSW).
By mid-November, activity from the Soufrière Hills lava dome consisted of ash venting along with semi-continuous rockfalls and pyroclastic flows that were concentrated on the W flank. Ashfall occurred across many areas of the island. On 19 November, heavy ashfall occurred to the NW between Old Towne and Brades. Views of the lava dome on 16 November showed that the dome height had decreased because of collapses and that a deep channel had developed NE of Chances Peak. Pyroclastic flows in the Gages Valley (W) continued down Spring Ghaut and Aymer's Ghaut, and spread onto the alluvial fan below St. Georges Hill.
On 21 November 2009, activity returned to a high level. Periods of tremor were detected on 23 November. Lava extrusion during this period shifted from the W side of the lava dome to the summit region. As a result, abundant pyroclastic flows traveled NE down Tuitt's Ghaut on 23 November for the first time in several weeks. On 24 November there was a period of 120 minutes of continuous pyroclastic flow activity, followed by 90 minutes of semi-continuous activity. The pyroclastic flows traveled W down Gages Valley and into Spring Ghaut, and NE down Tuitt's Ghaut and Whites Bottom Ghaut reaching Tuitt's village. Associated ash plumes rose to an altitude of 6.1 km. On 26 November, a pyroclastic flow that descended the Tar River valley was caused by collapse of part of the old, pre-2009 lava dome. Ashfall occurred in Old Towne and parts of Olveston. Incandescent material seen in a photograph taken at night on 29 November traveled down the flanks of the lava dome in several areas.
High-level activity from the lava dome continued through the first half of December 2009. Dome growth was concentrated on the N side, which has led to approximately 100 m of lateral growth of the lava dome in a northward direction. This growth has increased the available material for the formation of pyroclastic flows. Pyroclastic flows down the N flank became more abundant and their runout distance steadily increased. Pyroclastic flows also occurred to the NE and W, and one reached within 200 m of the sea. Ash vented from the S part of the lava dome.
On 10 December 2009, a large pyroclastic flow traveled down Tyers Ghaut. This pyroclastic flow reached to below the west end of Lees village in the Dyers river, some 3.5 km from the lava dome. This event prompted MVO to raise the Hazard Level from 3 to 4. The higher Hazard Level signifies that larger pyroclastic flows moving down the Belham valley are a more likely possibility. According to MVO, larger pyroclastic flows could be formed by a partial dome collapse which could involve several million cubic meters of material. Helicopter observations have shown that the head of Tuitt's Ghaut down to the junction with Whites Bottom Ghaut is full of pyroclastic flow deposits such that there is now a continuous surface across from Farrell's plain. The head of Tyers Ghaut is also now nearly full. This means that future pyroclastic flows are likely to be less confined by topography and will spread more readily across the N flanks of the volcano.
Thermal anomalies. MODIS satellite imagery recorded many thermal anomalies during December 2008, a smaller number in January 2009, none in February 2009, one in March 2009, and none during April through 10 October 2009. Beginning on 11 October through 11 December 2009, MODIS recorded a large number of thermal anomalies.
Information Contacts: Montserrat Volcano Observatory (MVO), Fleming, Montserrat, West Indies (URL: http://www.mvo.ms/); Washington Volcanic Ash Advisory Center, Satellite Analysis Branch (SAB), NOAA/NESDIS E/SP23, NOAA Science Center Room 401, 5200 Auth Rd, Camp Springs, MD 20746, USA (URL: http://www.ospo.noaa.gov/Products/atmosphere/vaac/); NASA Earth Observatory (URL: http://earthobservatory.nasa.gov/); Hawai'i Institute of Geophysics and Planetology (HIGP) Thermal Alerts System, School of Ocean and Earth Science and Technology (SOEST), Univ. of Hawai'i, 2525 Correa Road, Honolulu, HI 96822, USA (URL: http://modis.higp.hawaii.edu/); U.S. Air Force Weather Agency (AFWA)/XOGM, Offutt Air Force Base, NE 68113, USA.
Lava dome growth continuing; pyroclastic flows reached the ocean
Montserrat Volcano Observatory (MVO) reported a strong increase in dome growth at Soufrière Hills (figure 82) and energetic explosive activity, including pyroclastic flows and substantial ash clouds, during the 6 months ending early April 2010 (the end of this reporting interval). Energetic extrusions were particularly noteworthy during January and February 2010 (table 69). From mid-December 2009 through early April 2010 there was continuing seismicity and gas emissions (table 70) as well as weekly ash emissions and pyroclsatic flows (table 71). Partial dome collapse on 11 February 2010 led to a plume that rose to ~15 km altitude.
 |
Figure 82. Map of Montserrat showing the pre-eruption topography of Soufrière Hills. The black circle shows the location of the MVO. The approximate outline of the Tar River delta in July 2004 is shown. Courtesy of Wadge and others (2005). |
Table 69. Key features of the five Vulcanian explosions that occurred at Soufriere Hills in January and February 2010. Units in valley columns are pyroclastic-f low runout distances in kilometers. From Cole and others (2010) with due credit to Washington Volcanic Ash Advisory Center (VAAC) for satellite and aviation-based plume altitude estimates.
| Date | Time (local) | Lapilli Fallout | Plume | White's Bottom Ghaut | Tar River Valley | Farrells Plain | Tyers Ghaut/Belham Valley | Gages | Gingoes Ghaut | White River |
| 08 Jan 2010 | 1449-1500 | No: Ash from PFs | 7.6 km (25,000 ft) | 4.7 | 2 | 2 | 5.8 | 4 | 2.6 | 1.5 |
| 10 Jan 2010 | 0128-0135 | Not known | 6.7 km (22,000 ft) | >2 | -- | 1.5 | 2.5 | 3 | -- | -- |
| 10 Jan 2010 | 2027-2031 | Yes: pumice | 5.5 km (18,000 ft) | 1.5 | 2 | -- | -- | -- | -- | -- |
| 05 Feb 2010 | 1349-1356 | Yes: non-pumiceous | 6.7 km (22,000 ft) | 1.5 | 2 | 1.5 | 2 | 4 | 1.5 | 1.5 |
| 08 Feb 2010 | 1957-2003 | Not known | 4.6 km (15,000 ft) | -- | -- | -- | -- | 3.5 | -- | -- |
Table 70. Soufrière Hills seismicity and gas measurements from weekly reports between 4 December 2009 and 19 March 2010. MVO seismicity terminology as follows: Rockfall signals (featureless, high-frequency events, which correlate to large rockfalls from the dome); Volcano-tectonic (high frequencies >5 Hz, often impulsive P-phases and usually clear S-phases); Long-period (generally phaseless events with predominant frequency ~1 Hz); Hybrid (repetitive transient events of intermediate frequency, 3-5 Hz, without discernible S-phases; initial high-frequency waveforms at some stations) (MVO, 1996). Numbers refer to the total over the period indicated. Hydrochloric acid/sulfur dioxide ratios (HCl/SO2) are derived from Fourier Transform Infrared (FTIR) gas measurements. Cycles of activity refer to rockfalls, ash venting, and pyroclastic flows. "--" indicates that data was not reported. Courtesy of MVO.
| Date | Rockfall signals | Long-period EQ's | Volcano-tectonic EQ's | Hybrid EQ's | Observations |
| 04 Dec-11 Dec 2009 | 957 | 207 | 3 | 6 | Activity (pyroclastic flow, ash venting, rock falls, etc.) continued in cycles more irregular in time in the last few days; 10 Dec-hazard level raised from 3 to 4. |
| 11 Dec-18 Dec 2009 | 977 | 134 | 3 | 58 | Cycles of activity continue, varying between 5 and 6 hours; intensity of cycles decreased slightly through the week, however an increase in intensity occurred after about 1600 on 17 Dec. |
| 18 Dec-24 Dec 2009 | 594 | 154 | 3 | 25 | Cycles of activity with periods between 6 and 7 hours; heavy ashfall NW Montserrat. |
| 24 Dec-31 Dec 2009 | 270 | 52 | -- | 6 | Cycles of activity with periods between 6 and 8 hours. |
| 31 Dec-08 Jan 2010 | 135 | 73 | 1 | 16 | Cycles of activity with periods between 8 and 10 hours; ashfall in Old Towns, Salem, Olveston, Woodlands. |
| 08 Jan-15 Jan 2010 | 68 | 25 | 2 | 10 | Three explosions occurred during the week (1449 on 8 Jan, and 0128 and 2027 on 10 Jan), each accompanied by seismic signals that lasted 11, 7, and 4 minutes, respectively; ash plumes reached altitudes of 7.6, 6.7, and 5.5 km, respectively. |
| 15 Jan-22 Jan 2010 | 196 | 38 | -- | 18 | Cycles of activity with 6-8-hour periods; several houses buried and set on fire in Kinsale; ash clouds associated with pyroclastic flows reached 3-km altitude. Hybrid swarm of seven larger quakes on 20 Jan. |
| 22 Jan-29 Jan 2010 | 565 | 113 | 2 | 18 | Cycles of activity with periods between 5 and 7 hours; 25 Jan-heavy rain caused vigorous steaming of hot pyroclastic flows. |
| 29 Jan-05 Feb 2010 | 552 | 87 | 6 | 64 | Cycles of activity with periods between 7 and 12 hours. On 5 Feb a 30-m-high pyramidal-shaped extrusion was first seen; although it temporarily put the summit elevation at 1,170 m, it was destroyed by an explosion at 1349 that day; resulting pyroclastic surges moved NW across the sea near Plymouth. |
| 05 Feb-12 Feb 2010 | 512 | 141 | 4 | 82 | Two explosions on 5 and 8 Feb; 11 Feb-partial dome collapse, plume rose to altitude of ~15.2 km. |
| 12 Feb-19 Feb 2010 | 53 | 34 | 1 | 4 | 17 Feb data consistent with quite slow extrusion of lava; MVO not yet able to make observations into the deep crater at the dome summit. HCl/SO2 = 0.76 (17 Feb). |
| 19 Feb-26 Feb 2010 | 11 | -- | -- | 6 | 23 Feb-hazard level lowered from 4 to 3. HCl/SO2 = 0.74 (19 Feb); 0.7 (22 Feb). |
| 26 Feb-05 Mar 2010 | 7 | 1 | -- | 9 | Swarm of 7 hybrids on 4 Mar. HCl/SO2 = 0.81 (1 Mar); 0.71 (2 Mar); 0.98 (4 Mar). |
| 05 Mar-12 Mar 2010 | 47 | 9 | 2 | 7 | Hybrid swarm of 6 on 11 Mar |
| 12 Mar-19 Mar 2010 | 41 | 3 | -- | 7 | 17 Mar- SO2 flux 2,315 tons/day. HCl/SO2 = 0.6 |
| 19 Mar-26 Mar 2010 | 28 | 3 | 1 | 3 | Avg. SO2 flux 342 tons/day |
| 26 Mar-02 Apr 2010 | 17 | -- | -- | 1 | Avg. SO2 flux 194 tons/day |
| 02 Apr-09 Apr 2010 | 9 | 1 | 3 | 3 | 3-day avg. SO2 flux 376 tons/day |
Table 71. Brief summary of dome emissions compiled from MVO reports, 4 December 2009-1 April 2010. Date entries indicated with a * are discussed in the text. Courtesy of MVO.
| Date | Dome Activity | Location of pyroclastic flows (PF) and rockfalls (RF) (runout distance from dome) |
| 11 Dec-31 Dec 2009 | Hottest and most active areas located on NW flank. | Whites Ghaut to Whites Bottom Ghaut to the sea (4 km); Tyres Ghaut (~1-2 km); Gages valley (~2 km); Tar River valley; Gingoes Ghaut; Farrells plain, Dyers village (~2.5 km), Spring Ghaut. |
| 31 Dec-08 Jan 2010 | Growth on N side; 2 January-40-m high, 150-m wide lobe of lava extruded onto dome. | Whites Ghaut, Farrells plain, Tyers Ghaut. |
| 08 Jan-15 Jan 2010 * | NE flank; 2 Jan-40-m high, 150-mwide lobe of lava extruded onto N summit of dome; 11 Jan-dome growth resumed on top, central part of dome. | 8 Jan-collapsing fountain of tephra generated PF down Whites Bottom Ghaut, Tuitts Ghaut (within several hundred meters of the sea), Tyers Ghaut, Belham valley, Tar River valley; 10 Jan-explosion produced PF down Whites Bottom and Tuitts Ghaut, Tyers Ghaut, Gages valley. |
| 15 Jan-22 Jan 2010 * | 18 Jan-partial dome collapse on W side of dome. | 18 Jan-PF reached sea down Aymers Ghaut (Gages valley to Spring Ghaut to Aymers Ghaut); houses inundated/burned in Kinsale. |
| 22 Jan-29 Jan 2010 | Dome growth on SE side of summit; NE side of summit has steep, vertical walls; NW part more rounded. | Increase in PF in Tar River valley (several reached sea); Whites Ghaut; heavy rain on 25 caused vigorous steaming of hot PF in Belham valley; some lahars formed. |
| 29 Jan-05 Feb 2010 | 5 Feb-central W part of lava dome grew to altitude of ~1,070 m. | Gages valley to Spring Ghaut (~2-3 km; head of Springs Ghaut neearly full of PF deposits), Whites Ghaut. |
| 05 Feb-12 Feb 2010 * | W side of dome; 9 Feb-activity shifted to N side of dome; 11 Feb-partial dome collapse, scar ~300 m wide on N flank of volcano (MVO-"largest event for volcano since May 2006"). | 5 Feb-volcanian explosion sent PF to Plymouth and into sea ~500 m, Tyers Ghaut (~2 km), Whites Ghaut, plume to ~8.4 km altitude; 8 Feb-small vulcanian explosion generated PF down Gages valley (over 2 km altitude), plume to ~5 km drifted E and ENE to Antigua; 11 Feb-PF reached on E side of island (coastline extended E ~650 meters at airport), Tyers Ghaut into Belham valley. |
| 12 Feb-19 Feb 2010 | Low activity, some incandescence on dome. | PF deposits ~15 m thick in Trant's region, PF razed many buildings in Harris and Streatham. |
| 19 Feb-26 Feb 2010 | Low activity. | -- |
| 26 Feb-05 Mar 2010 | 26 Feb-crater at summit of dome less than 100 m deep and ~200 m wide. | 4 Mar-Tar River valley. |
| 05 Mar-12 Mar 2010 * | Moderate activity. | 8-9 Mar-rainfall caused degradation of dome; Gages valley (~2 km). |
| 12 Mar-19 Mar 2010 * | Low activity; some incandescence on 14 Mar. | -- |
| 19 Mar-26 Mar 2010 | Low activity. | 25 Mar-Spring Ghaut (~2 km). |
| 26 Mar-02 Apr 2010 | Low activity. | -- |
| 02 Apr-09 Apr 2010 | Low activity; some incandescence on dome. | Lahars in Farm River and Trant's area. |
MVO issued a synthesis to the Scientific Advisory Committee (SAC) on volcanism between 15 August 2009 and 28 February 2010 (Cole and others, 2010). That report figures heavily in the following summary, but the included tables and comments also came from MVO reports, and there is a section on satellite thermal monitoring. Two similar earlier reports were published in 2009 (Robertson and others, 2009 and Stewart and others, 2009).
Since the dome remained active and at the same time represented the volcano's highest point, the summit elevation varied. The historical value of 915 m was a high point on the crater rim. Cole and others (2010) noted that the dome's summit was 1,050 m in September 2009, with the elevation being 1,130 m on 29 January 2010. Some taller heights involved blocky spines that did not last.
Extrusive Phase 5 activity. Extrusive Phase 4 finished on 3 January 2009 and was followed by 10 months of comparative inactivity with intermittent small pyroclastic flows and ash venting 5-7 October (BGVN 34:10). Phase 5 occurred from 4 October 2009 to 11 February 2010 (figure 83). Seismic records enabled MVO to subdivide this phase into three episodes of inferred dome growth as follows: 9 October-20 November 2009 (Episode 1); 20 November 2009-8 January 2010 (Episode 2); and 8 January-11 February 2010 (Episode 3). Cole and others (2010) noted that "A characteristic feature of Phase 5 dome growth has been the simultaneous occurrence of PFs in more than one direction, sometimes on the opposite side of the lava dome." Throughout Phase 5, ash often fell on inhabited areas.
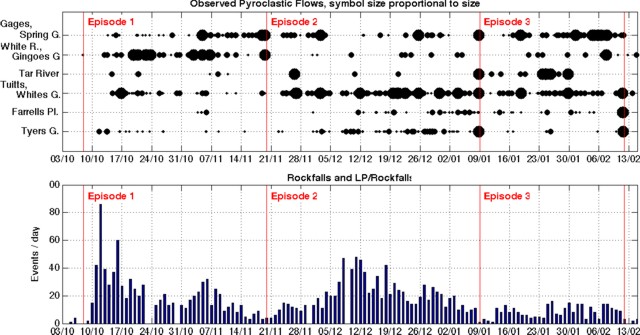 |
Figure 83. Rockfall and pyroclastic flow data from the Phase 5 interval (3 October 2009 to 14 February 2010) at Soufriere Hills. Pyroclastic flows were observed by MVO staff, mainly during work hours, with each assigned to one of six drainages (flow directions) and to one of three sizes (the symbol size is proportional to the PF's size). Daily counts of rockfalls and long-period earthquakes and rockfalls (LP/RF) were determined by inspection of seismic signals (from station MBFL located at MVO). From Cole and others (2010). |
Phase 5 began with a swarm of 24 volcano-tectonic (VT) earthquakes and ash venting. Gas fluxes had been low for two days prior to the onset of activity. The dome variously grew to the S, W, and N, and pyroclastic flows traveled in many directions. The eruptive style was described as "ash venting" rather than "explosions" due to the mild character of the associated seismic signals and the absence of ballistic fragments. Fallout deposits included comparatively coarse, well-sorted ash.
October dome growth mostly occurred on the S, with shed material filling the upper part of the SW flank's White River and covering what had stood as a protective wall for material traveling WSW. As a result, for the first time, substantial pyroclastic flows entered the WSW flank's Gingoes and Aymer's Ghauts, reaching the sea there with runout distances of over 4 km in those drainages.
Cyclic episodes of tremor occurred particularly during episode 2. On 23 November tremor occurred all day; it then waned and began to appear in cycles at 4-hour intervals, initially with signals of long-period and hybrid earthquakes. The tremor appeared associated with increased venting lasting 0.5-2 hours with plume heights to 5 km altitude. At 0640 on 10 December 2009, a large pyroclastic flow traveled down Tyers (Tyres) Ghaut and reached ~3.5 km from the lava dome.
Vigorous Vulcanian explosions occurred on five occasions during January-February 2010 (table 69), episode 3. All of these involved collapsing ash columns, producing fountain collapse pyroclastic flows that typically descended more than one ghaut. One explosion on 8 January, the largest by volume during January-February, sent a pyroclastic flow ~ 6 km down the Belham Valley. Two more Vulcanian explosions occurred during the night on 10 January.
Dome collapse of 11 February 2010. A large dome collapse took place in the early afternoon of 11 February, one day after a shift in dome-growth direction, and had several pulses. The collapse comprised 40-50 million cubic meters of material, and represented roughly 20% of the dome's total volume. A collapse scar ~ 300 m wide developed on the N flank of the dome. The collapse ended with vertically-directed explosions that created a new crater behind the collapsed part of the dome.
The collapse produced large pyroclastic flows and surges, mainly to the N and NE, that extended the E coastline (between Trants and Spanish Point), adding ~1 km2 of new land. Two smaller flows also traveled NW and entered the Belham Valley.
A large ash column resulted from the collapse that reached ~15 km altitude, causing extensive ashfall on Guadeloupe (~60 km SE) and other parts of the eastern Caribbean. After 11 February, both seismicity and surface activity quieted but deep deformation returned. Gas measurements also indicated that the system remained active.
Pyroclastic flows traveled N and NE toward the old airport. The extensive pyroclastic-flow deposits extended the coastline 300-400 m out to sea. The coastal area impacted extended from Whites Bottom Ghaut to Trants Bay, just N of the old Bramble airport (figures 84 and 85). The effects were clearly visible on the NE flanks. Some flows, ~ 15 m thick, reached the sea at Trant's Bay. These flows extended the island's coastline up to 650 m to the E.
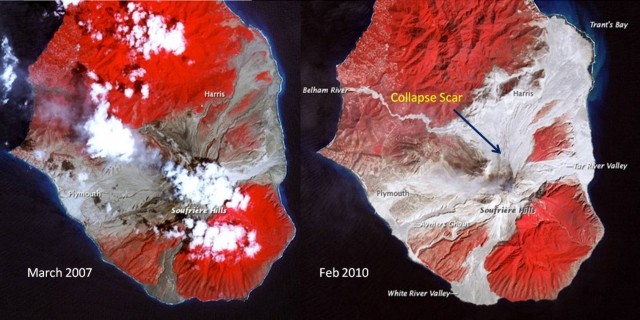 |
Figure 84. Two false-color satellite images, taken nearly 3 years apart at Soufriere Hills highlight the impact of the dome collapse of 11 February 2010. The image on the right is from 21 February 2010; the image on the left is from 17 March 2007. In colored versions of this image, red areas are vegetated, clouds are white, blue/black areas are ocean water, and gray areas are flow deposits. The large collapse scar on the N flank of the dome is visible (arrow). Several of the ghauts (valleys) on the SW side can be seen to have been nearly filled by pyroclastic flow deposits between October 2009 and February 2010. Images courtesy of NASA Earth Observatory. |
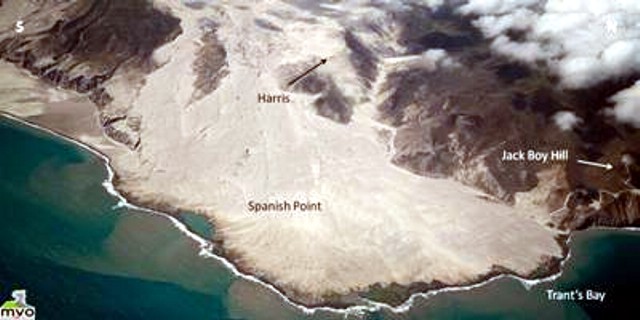 |
Figure 85. Taken one week after the events of 11 February 2010 at Soufrière Hills, this aerial photograph shows the new pyroclastic flows at Spanish Point. Courtesy of MVO. |
Towards the end of the collapse there was an energetic pyroclastic flow directed N over Streatham and Harris. This sent flows over the Harris Ridge into Bugby Hole and down the Farm River (~3.5 km from the dome) for the first time. The flows razed many buildings in both Harris and Streatham down to their foundations, and trees were felled by pyroclastic surges in the Gun Hill area and at the head of Farm River in Bugby Hole.
It was unclear whether there was any new dome growth within the crater during the week after the collapse. Night-time views of the dome revealed several small points of incandescence. Observations of the crater at the summit of the dome on 26 February found that it was then 50-100 m deep and ~200 m wide (figure 86). There was no newly extruded lava visible inside the crater.
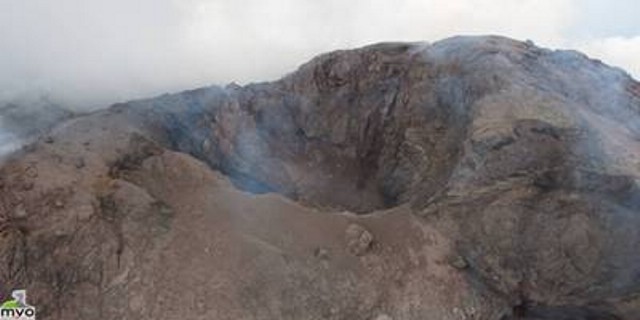 |
Figure 86. Views of the inside of the new crater at the summit of the Soufrière Hills dome taken on 26 February 2010. The dark material on the left is the deposit of a fresh rockfall that probably occurred a few days before the photograph was taken. Courtesy of MVO. |
Heavy rain on 8-9 March caused vigorous steaming of the hot 11 February deposits (figure 87). Strong geysering was visible at Trants near the old Bramble airport, with ash and steam fountaining occurring. In addition, lahars traveled down several drainages, including the Belham valley. Small spots of incandescence on the dome were visible again on 14 March. Occasional small pyroclastic flows and rockfalls were still occurring mainly from the western and southern parts of the dome.
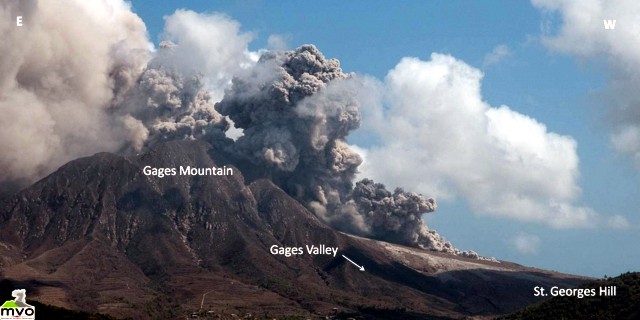 |
Figure 87. Heavy rainfall on 8 and 9 March 2010 triggered a series of small to moderate sized pyroclastic flows. These were derived from the old dome and collapse scar. Pyroclastic flows continued to form as small amounts of cooled lava were shed from the surface. Courtesy of MVO. |
MODVOLC Thermal Alerts. According to the Hawai'i Institute of Geophysics and Planetology (HIGP) Thermal Alerts System, no satellite thermal alerts were measured over Soufrière Hills between 29 March 2007 and 3 December 2008. Satellite thermal alerts were measured almost daily during 11 October 2009 through 15 February 2010. An isolated thermal alert was measured on 10 March 2010. Previously shorter periods of thermal alerts were measured during 11-29 March 2007 and 3 December 2008-3 January 2009.
References. Cole, P., Bass, V., Christopher, C., Fergus, M., Gunn, L., Odbert, H., Simpson, R., Stewart, R., Stinton, A., Stone, J., Syers, R., Robertson, R., Watts, R., and Williams, P., 2010, Report to the Scientific Advisory Committee on Montserrat Volcanic Activity, Report on Activity between 15 August 2009 and 28 February 2010, Open File Report OFR 10-01a, Prepared for SAC 14: 22-24 March 2010. Montserrat Volcano Observatory (MVO).
Robertson, R., Babal, L., Bass, V., Christopher, T., Chardot, L., Fergus, M., Fournier, N., Higgins, M., Joseph, E., Komorowski, J.-C., Odbert, H., Simpson, R., Smith, P., Stewart, R., Stone, J., Syers, R., Tsaines, B., and Williams, P., 2009, Report for the Scientific Advisory Committee on Montserrat Volcanic Activity, Prepared for SAC 13: 7-9 September 2009, MVO Open File Report 09/03.
Stewart, R., Bass, V., Chardot, L., Christopher, T., Dondin, F., Finizola, A., Fournier, N., Joseph, E., Komorowski, J.-C., Legendre, Y., Peltier, A., Robertson, R., Syers, R., and Williams, P., 2009, Report for the Scientific Advisory Committee on Montserrat Volcanic Activity, Prepared for SAC12: 9-11 March 2009, MVO Open File Report 09/01.
Wadge, G., Macfarlane, D.G., Robertson, D.A., Hale, A.J., Pinkerton, H., Burrell, R.V., Norton, G.E., and James, M.R., 2005, AVTIS: a novel millimetre-wave ground based instrument for volcano remote sensing: J. Volcanology and Geothermal Research, v. 146, no. 4, p. 307-318.
MVO, 1996, MVO/VSC Open Scientific Meeting, 27 November 1996, Seismicity of Montserrat Soufrière Hills Volcano Eruption, July 1995-November 1996 (URL: http://www.geo.mtu.edu/volcanoes/west.indies/soufriere/govt/meetings/nov1996/02.html).
Information Contacts: Montserrat Volcano Observatory (MVO), Fleming, Montserrat, West Indies (URL: http://www.mvo.ms/); Washington Volcanic Ash Advisory Center (VAAC), Satellite Analysis Branch (SAB), NOAA/NESDIS E/SP23, NOAA Science Center Room 401, 5200 Auth Rd, Camp Springs, MD 20746, USA (URL: http://www.ospo.noaa.gov/Products/atmosphere/vaac/); NASA Earth Observatory (URL: http://earthobservatory.nasa.gov/); Hawai'i Institute of Geophysics and Planetology (HIGP) Thermal Alerts System, School of Ocean and Earth Science and Technology (SOEST), Univ. of Hawai'i, 2525 Correa Road, Honolulu, HI 96822, USA (URL: http://modis.higp.hawaii.edu/).
Extrusive pause follows 11 February 2010 partial dome collapse
Our previous report on Soufrière Hills volcano, Montserrat, (BGVN 35:03), was published in the month following the 11 February 2010 partial dome collapse, which consisted of 40-50 x 106 m3 of material (~20% of the dome's pre-collapse volume) and left a collapse scar ~ 300 m wide on the N flank of the dome. The ash column from this event reached ~15 km altitude, and large pyroclastic flows extended the island's E shoreline, creating ~1 km2 of new land surface. This event marked the end of Extrusive Phase 5, the most recent phase of extrusive activity since the volcano's awakening in 1995 (figure 88). Since then, and as recently as 9 September 2011, Soufrière Hills experienced a low level of activity with pyroclastic flows and rockfalls, but no significant extrusion of lava; a behavior typical of pauses in extrusion at this volcano since 1995 (figure 88). The Hazard Level remained at 3 (on a scale from 1 to 5). Most of the data and information in this report is from Cole and others, 2010 and Cole and others, 2011. Information has also been contributed by the Montserrat Volcano Observatory (MVO).
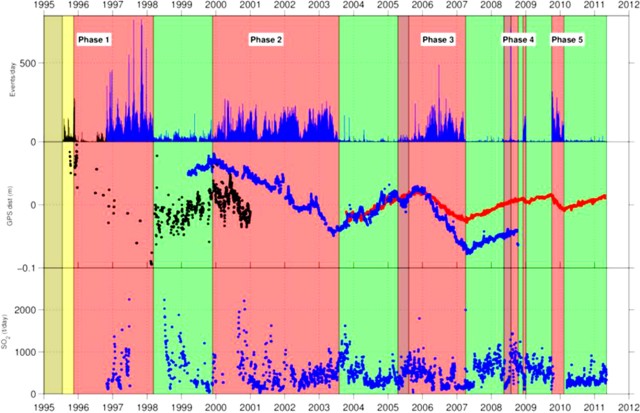 |
Figure 88. Extrusive phases (red areas) and pauses (green areas) of the Soufrière Hills eruption, Montserrat, from 1 January 1995 to 30 April 2011, based on seismic, GPS, and SO2 monitoring data. Top: number of seismic events detected. Middle: GPS data from three stations smoothed with a 7-day running mean filter. Bottom: Measured SO2 flux filtered with a 7-day running median filter. From Cole and others, 2011. |
Pyroclastic flows and rockfalls removed 3.65 x 10⁶ m3 (~ 1.9 % volume) of the dome from 12 February 2010 to 30 April 2011. Of these events, 54 were small pyroclastic flows (maximum runout of 1 km) and 31 were moderate-large pyroclastic flows (maximum runout of 2 km), generated mainly from three source regions:(1) above Gages Valley (W side); (2) N of the head of the 11 February 2010 collapse scar; and (3) at the head of the Tar River Valley (ESE side).
Undercutting of the dome face above Gages Valley (W side) by heavy summer rainfall in 2010 compromised dome stability and led to the largest pyroclastic flows. Pyroclastic flows occasionally generated small plumes and ashfall in inhabited areas of the island.
Lahars in the Belham Valley (on the volcano's W side) decreased from 40 measurable events (during late February-October 2010) to 10 measurable events (during November 2010-April 2011). The lahars were well correlated with peak rainfall events, and the 40 lahars occurring from 28 February to 31 October 2010 were attributed to especially heavy rainfall occurring in the months of April, late July, September, and October 2010. Figure 89 shows a house in Belham Valley partially covered by lahar deposits.
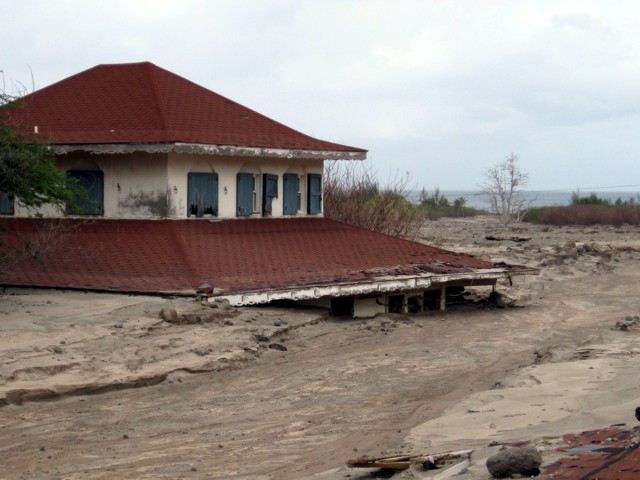 |
Figure 89. A house on the S side of the golf course that used to occupy the mouth of Belham Valley, Montserrat (Old Road Bay can be seen in the background). Photo by Robert Dennen (Global Volcanism Program) taken July 2010. |
As of 9 September 2011 the Washington Volcanic Ash Advisory Center (VAAC) reported eruptive plumes only a handful of times since 28 February 2010. Based on a METAR weather report and analyses of satellite imagery, on 10 August 2010 a narrow plume drifted 100 km WNW. According to the Washington VAAC, on 2 October 2010 the MVO reported that an ash plume rose to an altitude of 2.1 km altitude and drifted W. The next day an ash plume seen in satellite imagery drifted 55 km WNW and NW. A few hours later, an area of ash at an altitude of 2.1 km altitude was observed 140 km to the WNW. On 11 October a diffuse steam-and-gas plume drifted NNW.
Seismicity generally remained low, with low-frequency seismicity, long-period (LP), hybrid, and LP-rockfall events detected between 1 November 2010 and 9 September 2011 (figure 88). Short periods of volcano-tectonic (VT) earthquake activity on 25 June and 2 July 2010 were followed by ash venting; roaring could be heard N of the volcano. Another VT short swarm on 3 December 2010 was associated with an increase in gas emission and additional minor ash venting.
SO2 flux also remained low, with the daily average from 28 February 2010 to 30 April 2011 measured at 375 tons/day; low values typical of periods of pause. Elevated SO2 flux occurred in early May 2010 (up to 1,250 tons/day), November 2010, and March 2011 (figure 88).
During the reporting interval, mid-February 2010 to 9 September 2011, steady but weak inflation occurred, with only minor changes to the dome. The changes stemmed from mass wasting such as rockfalls and from pyroclastic flows.
Incandescence from various places on the lava dome was observed and analyzed (figure 90). The largest feature was a fumarolic gas vent on the floor of the 11 February collapse scar (see "Gas vent", figure 90 B, D). From the incandescent color, the temperature is estimated to be 500-600°C. Dome interior temperatures are considered likely nearly magmatic.
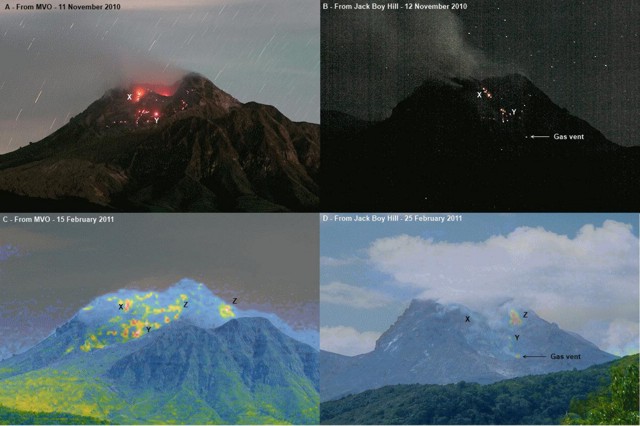 |
Figure 90. Four labeled images of Soufrière Hills calling attention to thermal features in the vent and dome area. The top two (A and B) represent night-time, long-exposure photographs. (A) An 11 November 2010 view from MVO (203 second exposure time). (B) A 12 November 2010 view from Jack Boy Hill (30 second exposure time). Features labeled X and Y are the most prominent incandescent/thermal features in the headwall of the 11 February 2010 collapse scar. (C and D) Photos with infrared enhancements indicated by colored zones (red representing hottest temperatures). (C) A 15 February 2011 view from MVO. (D) A 25 February 2011 view from Jack Boy Hill. Features labeled X and Y are as described above; those labeled Z were source areas for pyroclastic flows and rockfalls. From Cole and others, 2011. |
References. Cole, P., Bass, V., Christopher, T., Eligon, C., Murrell, C., Odbert, H., Smith, P., Stewart, R., Stinton, A., Syers, R., Robertson, R., and Williams, P., 2010, Report to the Scientific Advisory Committee on Volcanic Activity at Soufrière Hills Volcano Montserrat, Report on Activity between 28 February 2010 and 31 October 2010, Open File Report OFR 10-02a, Prepared for SAC 15: 15 ? 17 November 2010. Monsterrat Volcano Observatory (MVO).
Cole, P., Bass, V., Christopher, T., Murrell, C., Odbert, H., Smith, P., Stewart, R., Stinton, A., Syers, R., and Williams, P., 2011, MVO scientific report for volcanic activity between 1 November 2010 and 30 April 2011, Open File Report OFR 11-01. Monsterrat Volcano Observatory (MVO).
Information Contacts: Montserrat Volcano Observatory (MVO), Fleming, Montserrat, West Indies (URL: http://www.mvo.ms/); Washington Volcanic Ash Advisory Center (VAAC), Satellite Analysis Branch (SAB), NOAA/NESDIS E/SP23, NOAA Science Center Room 401, 5200 Auth Rd, Camp Springs, MD 20746, USA (URL: http://www.ospo.noaa.gov/Products/atmosphere/vaac/).
By March 2014, an over 50-month-long decline in extrusion (Pause 5)
A partial dome collapse took place at Soufrière Hills on 11 February 2010 (BGVN 35:03), an event followed by a lack of easily measured dome growth during an interval that continued into at least April 2014. Despite a lack of significant extrusion into the dome, pyroclastic flows continued, as did rockfalls and volcano-tectonic (VT) earthquakes. MVO describes intervals of this nature as extrusive pauses or more simply pauses. Pauses have been diagnosed as a prevalent behavior since they began following an extrusive phase starting in mid-1995. Our last issue (BGVN 36:08) covered part of the still-ongoing pause.
The various phases of activity at Soufrière Hills Volcano (SHV) during 1 January 1992 to 30 April 2013 are summarized in table 72. The table comes from a Montserrat Volcano Observatory (MVO) report providing a synthesis of activity during ~6 months ending in April 2013, and making authoritative and instructive comparisons to the overall eruption (table 72).
Table 72. Inventory of behavioral phases observed at SHV between 1 January 1992 and 30 April 2013. Pause 5 continued into at least April 2014. Taken from the MVO Scientific Report for Volcanic Activity between 13 October 2012 and 30 April 2013.
|
In brief, table 72 documents that an increase in seismicity occurred from 1992 to 1995, followed by a phreatic eruptive phase starting in mid-1995. That episode was followed by intervals of extrusion, transition, and pause. Extrusive phases included dome growth and frequent pyroclastic flows. During transition phases, dome growth slowed, but the risk to areas near the volcano continued.
As noted above, pauses are characterized by much slower dome growth (if at all), yet residual activity. The current pause is the longest yet recorded since the eruption began in 1995. Pause 5 began on 12 February 2010, and as of March 2014 was over 50 months long.
MVO established three criteria that indicate the potential for future activity. These criteria include low frequency seismic swarms and tremors, daily SO2 fluxes above 50 tons/day, and significant ground deformation. Most of the data reported in this Bulletin came from MVO Scientific Reports from 1 November 2011 to 30 April 2012, 1 May 2012 to 12 October 2012, and 13 October 2012 to 30 April 2013.
Short, intense swarms of VT earthquakes have occurred at Soufrière Hills since late 2007. The smaller swarms are often described by MVO as strings.
The most notable activity since September 2011 included intense Volcanic Tectonic (VT) earthquake swarms during 22-23 March 2012. Two small strings of VT events occurred in early August 2012, a brief VT string occurred on 24 December 2012, and a few VT strings of earthquakes took place during 4-6 February 2013.
The seismic events of 22-23 March 2012 and August 2012 were followed by ash venting. The venting in March resulted in the formation of two new craters. One developed inside the 11 February 2010 dome collapse scar; the other was outside the collapse scar to the (figure 91).
|
Figure 91. The craters at Soufrière Hills that formed following the intense VT earthquake swarms during 22-23 March 2012 are labeled in the above aerial photographs, taken by the Montserrat Volcano Observatory (MVO). The upper photo looks S into the 11 February 2010 collapse scar, and the lower photo looks E from above Gage's Mountain. Courtesy of MVO. |
On 20 November 2012, images of the S flank of the dome revealed a pervasively fractured area below the S rim of the explosion crater. That area was considered a potential source for large rockfalls or pyroclastic flows.
During the increased fumarole activity on 4-5 February 2013, a new crater was excavated around a gas vent on the floor of the 11 February 2010 collapse scar. This crater was 15 to 20 m across and 5 to 10 m deep.
The Hazard Level remained at 2, indicating daytime (0800 to 1600) access to Zone C and daytime-transit-only in maritime zone W (located W of the volcano; boats may sail through the zone but must not stop). A map of the zones on the island appeared in BGVN (22:05) and is found as figure 22 above.
Activity during 1 November 2011 to 30 April 2012. Throughout the entire reporting period, seismicity remained comparable to previous pauses in lava extrusion. Four strings of VT events, in this case referred to as "spasmodic bursts," occurred in the course of the interval 1 November 2011 to 30 April 2012. In early December 2011, 10 events were recorded in a 3 minute span; the largest in terms of local magnitude (ML, discussed further below) was 3.2. The 10 events were interpreted as a sequence of triggered events.
Two intense VT swarms occurred on 23 March 2012, with almost 50 VT earthquakes in each swarm. The largest VT earthquake ever recorded at Soufrière Hills, with ML of 3.9, was recorded during these swarms. The second more intense swarm was followed by mild ash venting, seven hybrid earthquakes, and three long-period (LP) earthquakes. Topics such as ML are discussed in a subsection below on seismicity.
On 30 March 2012, MVO detected unusually low-level VT seismicity sustained over several hours. This was atypical activity, as seismicity at Soufrière Hills is normally characterized by the occasional appearance of short bursts of VT strings.
November-December 2012. Seven lahars were seismically detected in the Belham Valley region during 1 November 2011 to 30 April 2012. Five took place during November-December 2011. They were associated with rainfall above 10 mm/hr.
A pyroclastic flow occurred in Gages Valley on 9 March 2012. The flow originated close to the summit of Chance's Peak and traveled 1.5 km down the W flank into Spring Ghaut. Although direct volume measurements couldn't be made, an empirical relationship between runout and flow volume suggested the pyroclastic flow deposit volume to be 104 m3.
A slight increase in rockfall activity occurred before the VT swarms of 23 March 2012. There were minor rockfalls on the steep N, E, SW and W sectors of the dome, averaging to less than one rockfall per day. The SW side of the dome above Gingoe's Ghaut was unstable with noticeable rockfall activity.
SO2 flux averaged 420 tons/day, a value below the multi-year eruption's average. Following the March VT swarms, a daily flux of 4,600 tons was observed, the third highest recorded by the optical spectrometer (DOAS) since its installation in 2002. After 2010, SO2 cycle fluctuations were dominated by variation with timescales on the order of weeks to months.
On 17 February 2012, a fumarole at the E base of the 2006-2007 dome was observed for the first time by MVO staff. An area with yellow and white sulfur deposits was also discovered on this cliff. Around January 2012, this site had temperatures near 60°C, but temperatures in February ranged from 90° to 275°C.
Ground deformation recorded by a GPS network continued to show a trend of ongoing inflation, a behavior similar to previous pauses.
Activity from 1 May 2012 to 12 October 2012. Among 21 bursts of small earthquakes, the most notable occurred on 11 September 2012. Over the course of 13 hours, a low amplitude VT swarm resulted in 17 events, with the maximum ML around 1.3. Eight rockfalls and two hybrid earthquakes were noted alongside typical seismic activity.
On 13 and 14 October 2012, tropical storm Rafael triggered eight seismically detected lahars in this region. The most noteworthy were those in the Belham Valley. Also, the SO2 flux was slightly decreased from the previous reporting period, with an average of 280 tons/day.
As of October 2012, the E and W flanks had been determined to be the most unstable areas of the edifice, based on the presence of fresh rockfall deposits and pyroclastic flows. A large pyroclastic flow from the W flank could travel into Plymouth, the former capital destroyed by previous pyroclastic flows.
On 29 August 2012, a large pyroclastic flow originated at the 2006-2007 dome. This has been the largest pyroclastic flow in Tar River since the end of Phase 5 extrusion. Another pyroclastic flow occurred on 19 September 2012 in Gage's Valley. It originated from the steep slope adjacent to Chance's Peak and traveled about 1 kilometer. The sources of these pyroclastic flows can be viewed in figure 92.
|
Figure 92. Two photographs showing features at Soufrière Hills. The photograph on the left shows the source of the 19 September 2012 pyroclastic flow. The photograph on the right shows the source and flow direction of the 29 August pyroclastic flow. Courtesy of MVO. |
A 10-minute exposure photo taken on 6 September 2012 determined no changes in location and number of incandescent areas on the N flank. However, the large fumarole in the floor of the 11 February 2010 collapse scar reached temperatures of ~300°C, and was the source of weak ash venting on 8 August 2012. Thermal IR camera imaging, showed the brightest point of incandescence, which reached temperatures over 400°C, originated from a hole in the rear of the collapse scar.
It should be noted that from August 2012 to November 2012, measurements at three local continuous GPS (cGPS) stations, AIRS, SPRI, and MVO1, had slight shortening of the radial distance between stations and vents, which may indicate short-term reversal of the long term inflation trend. Conclusions remain speculative without testing with more data.
Activity from 13 October 2012 to 30 April 2013. The largest of seven VT strings occurred on 30 November 2012. That swarm had a total of 23 earthquakes, with ML of 2.1 or less. As mentioned in the introduction, a brief VT swarm occurred on 24 December 2012, but the four swarms of main interest followed on 3-5 February 2013. The most intense, with a total of 36 events in 27 minutes, occurred on 4 February, with a maximum ML of 2.6. As a result, there was an increase in temperature of fumaroles residing on the 11 February 2010 collapse scar. This escalation continued until later in the evening, and at 1750 loud roaring sounds were heard, accompanied by minor ash venting. Activity and temperature returned to background levels the next day. This activity was noticeably similar to the events of 23 March 2012. Both were preceded by smaller VT strings, about 11 hours earlier, and the most intense phase had a 10-minute duration. There followed a VT string on 5 February associated with minor ash venting from the main gas vent in the floor of the 11 February 2010 collapse scar, as shown in figure 93.
|
Figure 93. Two thermal images, viewed from MVO and Jack Boy Hill, show the source of the ash venting on 5 February 2013, as well as a newly observed incandescence. Courtesy of MVO. |
The next prominent seismic activity occurred on 15 and 19 April 2013. The earthquakes had ML of 3.0 and 2.9, respectively, and neither were part of a VT string. The last time isolated VT earthquakes occurred was 28 June and 9 October 2011. Beside VT strings, 15 low-frequency earthquakes, which encompassed long-period and hybrid events, were observed during the October 2012 to April 2013 recording period. As of April 2013, 51 VT strings have occurred, and 13 have directly preceded surface activity.
Heavy rainfall on 28 and 30 March 2013 generated large lahars, lasting several hours, in various valleys around Soufrière Hills, including Belham Valley. The average daily SO2 flux, as of April 2013, was 511 metric tons/day, with a high of 2,381 tons on 6 February 2013. This was the highest value observed since the ash venting of 23 March 2012. The connection between SO2 flux and VT activity is still not thoroughly understood, but there seems to be an increase of SO2 a few days before seismic events at Soufrière Hills.
Pyroclastic flow activity had followed the trends of previous pauses. On 28 March 2013, a pyroclastic flow traveled 1.5 km E through Tar River Valley. This pyroclastic flow began at a peeled-away slab of lava on the near-vertical E face of the dome. This was one of the largest pyroclastic flows since the start of Pause 5, and it removed a large portion of the lava slab on the 2006-2007 dome. This flank became heavily fractured as a result of weather and erosion, continued cooling, and contraction of the E flank of the dome above Tar River. Consequently, the Tar River side of the dome will likely be the source of future pyroclastic flow activity. Rockfall activity has been at its lowest since 10 February 2010, consistent with the stabilization of the dome over the past three years.
After 5 February 2013, temperatures in the collapse scar were ~100°C higher than previously recorded. That increase may be due to MVO's use of a new more sensitive IR camera (a FLIR T650sc), replacing their old (Mikron) camera. The new camera records temperatures that are corrected for atmospheric conditions.
Figure 94 emphasizes the difference in sensitivity between the two cameras. However, the distance at which these images were captured, about 5.7 km from the dome, results in unreliable temperature readings. This is because infrared light is absorbed, scattered, and refracted by dust, air, and water (in solid, liquid, or gaseous states). Variables such as solar reflection, heat from direct sunlight, condensates, and high concentrations of SO2 in the atmosphere can also result in errors in image readings.
|
Figure 94. For Soufrière Hills, a juxtaposition of thermal images to highlight the difference in resolution and displays between the old infrared-detecting (IR) camera (left) and the more sensitive and accurate new one (right). Although there are temperature scales to the right of each image (22.4-32.4 on the scale at right), they are not applicable in this instance owing to multiple factors (see text). Even at this distance, IR images give scientists greater clarity on dome behavior. Despite the loss of the temperature scale, the images serve as an important tool for monitoring the state of the dome. Both IR photos taken during early 2013. Courtesy of MVO. |
According to Adam J. Stinton, a volcanologist at MVO, the new camera produces images twice the size of the older camera due to a larger internal sensor, and therefore the right-hand image was scaled down to a comparable size. Thermal imaging technology works by recording the intensity of radiation in the infrared part of the electromagnetic spectrum and converting it to a radiometric image, with every pixel in the image conveying a temperature measurement.
Using the FLIR camera, a strong fumarole on the summit of the 2006-2007 dome was recorded on 15 March 2013, the first time this fumarole was ever imaged. Its temperature was between 250 and 260°C. No other new thermal features or incandescence had been recorded during this period.
As of April 2013, the trend of long-term edifice inflation continued. This suggested that the magmatic system is still actively deforming surficial areas. MVO observed similar deformation signals during previous pauses in extrusion.
Activity during April 2013 to March 2014. On 14 January 2014, a helicopter assessment of several groups of fumaroles revealed temperatures of 140-340°C within the summit crater. These fumaroles were observed for the first time since 2011. Aside from this detection, there has been a low level of activity at Soufrière Hills, including occasional rockfalls and seismic activity.
Background on seismicity. According to Druitt and Kokelaar (2002), hybrid earthquakes are long-period earthquakes located at (shallow) depths of less than 2 km. LP earthquakes, on the other hand, are widely interpreted as earthquakes associated with the movement of pressurized fluids (eg., BGVN 20:08).
According to MVO, using ML offers possible advantages when calculating cumulative VT energy. The Gutenberg-Richter magnitude-energy relationship portrays an earthquake's size based on the amplitude of the resulting waves recorded on a seismogram. The concept is that the wave amplitude portrays the earthquake's size once the amplitudes are corrected for the decrease in magnitude with distance owing to geometric spreading and attenuation (Stein and Wysession, 2003). Local magnitude (often also termed Richter magnitude or the Richter scale). MVO employs the following (base 10) logarithmic equation, which associates ML to cumulative VT energy, E, as follows: Log E = 1.5 × ML + 11.8
MVO notes that this equation is a reliable calculation of cumulative energy, as opposed to amplitude measurements at a single station. Amplitude measurement data are easily affected by variables such as data gaps. As further background, magnitudes can be negative for very small displacements (eg. a small rockfall). Stein and Wysession (2003, p. 263) make the point that seismic magnitude scales are logarithmic, ". . . so an increase from magnitude "5" to "6," indicates a ten-fold increase in seismic wave amplitude. Measured displacements range more than 10 units because the displacements measured by seismometers span more than a factor of 1010." In practice, the amplitude is measured in microns of displacement after the effects of the seismometer are removed. Different magnitude scales (eg., ML, mb, Ms, Mw, etc.) yield different values (Stein and Wysession, 2003).
References: Cole, P., Bass, V., Christopher, T., Melander, S., Pascal, K., Smith, P., Stewart, R., Stinton, A., and Syers, R., undated, MVO Scientific Report for Volcanic Activity Between 1 May 2012 and 12 October 2012, Open File Report OFR 12-02; Montserrat Volcano Observatory, 47 pp. (URL: http://www.mvo.ms/pub/Open_File_Reports/MVO_OFR_12_02-MVO_Scientific_Report.pdf)
Cole, P., Bass, V., Christopher, Odhert, H., Smith, P., Stewart, R., Stinton, A., Syers, R., and Williams, P., undated, MVO Scientific Report for Volcanic Activity Between 1 November 2011 and 30 April 2012. Montserrat Volcano Observatory, (URL: http://www.mvo.ms/pub/Open_File_Reports/MVO_OFR_12_01-MVO_Scientific_Report.pdf)
Druitt, T. and Kokelaar, B., 2002, The Eruption of Soufriere Hills Volcano, Montserrat, form 1995 to 1999, Issue 21. Geological Society Memoir No. 21. UK: The Geological Society Publishing House, 2002.
Stein, S. and Wysession, M., 2003, An Introduction to Seismology, Earthquakes and Earth Structure, 2003, Blackwell Publishing, Oxford, 498 pp. [ISBN 0-86542- 078-5]
Stewart, R., Bass, V., Christopher, T., Cole, P., Dondin, F., Higgins, M., Joseph, E., Pascal, K., Smith, P., Stinton, A., Syers, R., and Williams, P., (27 May) 2013, MVO Scientific Report for Volcanic Activity Between 13 October 2012 and 30 April 2013, Open File Report, OFR 13-06. Montserrat Volcano Observatory. (URL: http://www.mvo.ms/pub/Open_File_Reports/MVO_OFR_13_06-Six_monthly_report.pdf )
Information Contacts: Montserrat Volcano Observatory (MVO), Fleming, Montserrat, West Indies (URL: http://www.mvo.ms/); Washington Volcanic Ash Advisory Center (VAAC); and Adam Stinton, MVO.
This compilation of synonyms and subsidiary features may not be comprehensive. Features are organized into four major categories: Cones, Craters, Domes, and Thermal Features. Synonyms of features appear indented below the primary name. In some cases additional feature type, elevation, or location details are provided.
Synonyms |
||||
| Chance's Mountain | ||||
Cones |
||||
| Feature Name | Feature Type | Elevation | Latitude | Longitude |
|
Garibaldi Hill
Caribald Hill |
Stratovolcano | 255 m | 16° 44' 0" N | 62° 14' 0" W |
| South Soufriere Hills | Stratovolcano | 756 m | 16° 41' 0" N | 62° 10' 0" W |
|
St. George's Hill
Saint George's Hill |
Stratovolcano | 361 m | 16° 43' 0" N | 62° 13' 0" W |
Craters |
||||
| Feature Name | Feature Type | Elevation | Latitude | Longitude |
| English's Crater | Crater | 915 m | 16° 43' 0" N | 62° 11' 0" W |
Domes |
||||
| Feature Name | Feature Type | Elevation | Latitude | Longitude |
| Castle Peak | Dome | 823 m | 16° 43' 0" N | 62° 11' 0" W |
| Chance's Peak | Dome | 915 m | 16° 42' 0" N | 62° 11' 0" W |
| Gage's Mountain | Dome | 780 m | 16° 43' 0" N | 62° 11' 0" W |
| Galway's Mountain | Dome | 850 m | 16° 42' 0" N | 62° 10' 0" W |
|
Perche's Mountain
Roche's Mountain |
Dome | 847 m | 16° 42' 0" N | 62° 10' 0" W |
| Rasberry Hills | Dome | 756 m | 16° 41' 0" N | 62° 10' 0" W |
| Roche's Bluff | Dome | 16° 42' 0" N | 62° 9' 0" W | |
Thermal |
||||
| Feature Name | Feature Type | Elevation | Latitude | Longitude |
| Gages Lower Soufriere | Fumarole | 305 m | 16° 43' 0" N | 62° 12' 0" W |
| Gages Upper Soufriere | Fumarole | 460 m | 16° 43' 0" N | 62° 11' 0" W |
| Galway's Soufriere | Fumarole | 460 m | 16° 42' 0" N | 62° 11' 0" W |
| Mulcares Soufriere | Fumarole | 16° 43' 0" N | 62° 9' 0" W | |
| Spring Ghaut Soufriere | Fumarole | 16° 42' 0" N | 62° 11' 0" W | |
|
Tar River Soufriere
Cow Hill Soufriere |
Fumarole | 230 m | 16° 43' 0" N | 62° 10' 0" W |
|
|
||||||||||||||||||||||||
There is data available for 9 confirmed Holocene eruptive periods.
2005 Apr 15 - 2013 Feb 5 Confirmed Eruption Max VEI: 3 (?)
| Episode 1 | Eruption Episode | ||||||||||||||||||||||||||||||||||||||||||||||||||||||||||||||||||||||||||||||||
|---|---|---|---|---|---|---|---|---|---|---|---|---|---|---|---|---|---|---|---|---|---|---|---|---|---|---|---|---|---|---|---|---|---|---|---|---|---|---|---|---|---|---|---|---|---|---|---|---|---|---|---|---|---|---|---|---|---|---|---|---|---|---|---|---|---|---|---|---|---|---|---|---|---|---|---|---|---|---|---|---|
| 2005 Apr 15 - 2013 Feb 5 | Evidence from Observations: Reported | |||||||||||||||||||||||||||||||||||||||||||||||||||||||||||||||||||||||||||||||
|
List of 14 Events for Episode 1
| ||||||||||||||||||||||||||||||||||||||||||||||||||||||||||||||||||||||||||||||||
2004 Mar 3 - 2004 May 2 Confirmed Eruption Max VEI: 3 (?)
| Episode 1 | Eruption Episode | |||||||||||||||||||||||||||||||||||||||||||||||||||||||
|---|---|---|---|---|---|---|---|---|---|---|---|---|---|---|---|---|---|---|---|---|---|---|---|---|---|---|---|---|---|---|---|---|---|---|---|---|---|---|---|---|---|---|---|---|---|---|---|---|---|---|---|---|---|---|---|
| 2004 Mar 3 - 2004 May 2 | Evidence from Observations: Reported | ||||||||||||||||||||||||||||||||||||||||||||||||||||||
|
List of 9 Events for Episode 1
| |||||||||||||||||||||||||||||||||||||||||||||||||||||||
1995 Jul 18 - 2003 Oct 8 Confirmed Eruption Max VEI: 3
| Episode 1 | Eruption Episode | |||||||||||||||||||||||||||||||||||||||||||||||||||||||||||||||||||||||||||||||||||||||||||||||||||||||||||||||||||
|---|---|---|---|---|---|---|---|---|---|---|---|---|---|---|---|---|---|---|---|---|---|---|---|---|---|---|---|---|---|---|---|---|---|---|---|---|---|---|---|---|---|---|---|---|---|---|---|---|---|---|---|---|---|---|---|---|---|---|---|---|---|---|---|---|---|---|---|---|---|---|---|---|---|---|---|---|---|---|---|---|---|---|---|---|---|---|---|---|---|---|---|---|---|---|---|---|---|---|---|---|---|---|---|---|---|---|---|---|---|---|---|---|---|---|---|
| 1995 Jul 18 - 2003 Oct 8 | Evidence from Observations: Reported | ||||||||||||||||||||||||||||||||||||||||||||||||||||||||||||||||||||||||||||||||||||||||||||||||||||||||||||||||||
|
List of 21 Events for Episode 1
| |||||||||||||||||||||||||||||||||||||||||||||||||||||||||||||||||||||||||||||||||||||||||||||||||||||||||||||||||||
1550 ± 50 years Confirmed Eruption
| Episode 1 | Eruption Episode | Castle Peak | ||||||||||||||||||||||||||||||||||
|---|---|---|---|---|---|---|---|---|---|---|---|---|---|---|---|---|---|---|---|---|---|---|---|---|---|---|---|---|---|---|---|---|---|---|---|
| 1550 ± 50 years - Unknown | Evidence from Isotopic: 14C (calibrated) | ||||||||||||||||||||||||||||||||||
|
List of 5 Events for Episode 1 at Castle Peak
| |||||||||||||||||||||||||||||||||||
1480 ± 50 years Confirmed Eruption
| Episode 1 | Eruption Episode | Castle Peak | ||||||||||||||||||||||||||||||||||
|---|---|---|---|---|---|---|---|---|---|---|---|---|---|---|---|---|---|---|---|---|---|---|---|---|---|---|---|---|---|---|---|---|---|---|---|
| 1480 ± 50 years - Unknown | Evidence from Isotopic: 14C (calibrated) | ||||||||||||||||||||||||||||||||||
|
List of 5 Events for Episode 1 at Castle Peak
| |||||||||||||||||||||||||||||||||||
1180 (?) Confirmed Eruption
| Episode 1 | Eruption Episode | |||||||||||||||||||||||||||||||||||
|---|---|---|---|---|---|---|---|---|---|---|---|---|---|---|---|---|---|---|---|---|---|---|---|---|---|---|---|---|---|---|---|---|---|---|---|
| 1180 (?) - Unknown | Evidence from Isotopic: 14C (uncalibrated) | ||||||||||||||||||||||||||||||||||
|
List of 5 Events for Episode 1
| |||||||||||||||||||||||||||||||||||
2460 BCE ± 70 years Confirmed Eruption
| Episode 1 | Eruption Episode | English's crater | |||||||||||||||||||||||||||||
|---|---|---|---|---|---|---|---|---|---|---|---|---|---|---|---|---|---|---|---|---|---|---|---|---|---|---|---|---|---|---|
| 2460 BCE ± 70 years - Unknown | Evidence from Isotopic: 14C (calibrated) | |||||||||||||||||||||||||||||
|
List of 4 Events for Episode 1 at English's crater
| ||||||||||||||||||||||||||||||
4050 BCE (?) Confirmed Eruption
| Episode 1 | Eruption Episode | |||||||||||||||||||||||||
|---|---|---|---|---|---|---|---|---|---|---|---|---|---|---|---|---|---|---|---|---|---|---|---|---|---|
| 4050 BCE (?) - Unknown | Evidence from Correlation: Tephrochronology | ||||||||||||||||||||||||
|
List of 3 Events for Episode 1
| |||||||||||||||||||||||||
8050 BCE ± 2000 years Confirmed Eruption
| Episode 1 | Eruption Episode | ||||||||||||||||||||||||||||||
|---|---|---|---|---|---|---|---|---|---|---|---|---|---|---|---|---|---|---|---|---|---|---|---|---|---|---|---|---|---|---|
| 8050 BCE ± 2000 years - Unknown | Evidence from Isotopic: 14C (calibrated) | |||||||||||||||||||||||||||||
|
List of 4 Events for Episode 1
| ||||||||||||||||||||||||||||||
There is data available for 5 deformation periods. Expand each entry for additional details.
| Start Date: 2000 Jun 02 | Stop Date: 2000 Jul 07 | Direction: Uplift | Method: InSAR |
| Magnitude: 4.000 cm | Spatial Extent: 1.00 km | Latitude: 17.000 | Longitude: -62.000 |
Remarks: Localized uplift north of the dome caused by shallow processes | |||
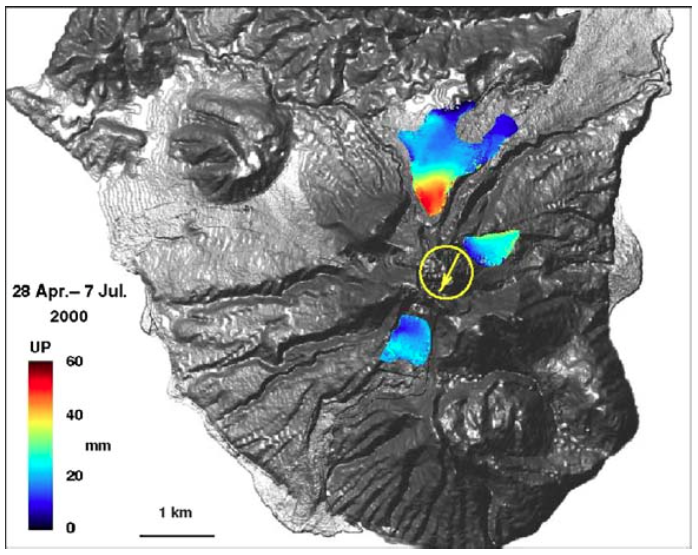 |
Unwrapped differential interferogram of the upper part of Soufrie`re Hills Volcano for 28 April to 7 July 2000 (26253?27255) showing localised uplift of the area north of the dome (yellow circle). The arrow indicates the change of the locus of dome growth that occurred between 10?17 July 2000. From: Wadge et al. 2006. |
||
Reference List: Wadge et al. 2006.
Full References:
Wadge, G., G. S. Mattionli, and R. A. Herd, 2006. Ground deformation at Soufriére Hills volcano, Montserrat during 1998-2000 measured by radar interferometry and GPS. J. Volcanol. Geotherm. Res., 152: 157-173. https://doi.org/10.1016/j.jvolgeores.2005.11.007
| Start Date: 2000 | Stop Date: 2000 | Direction: Subsidence | Method: InSAR |
| Magnitude: Unknown | Spatial Extent: Unknown | Latitude: Unknown | Longitude: Unknown |
Remarks: During period of lava extrusion. Caused by de-pressurization as surface effusion exceeds supply | |||
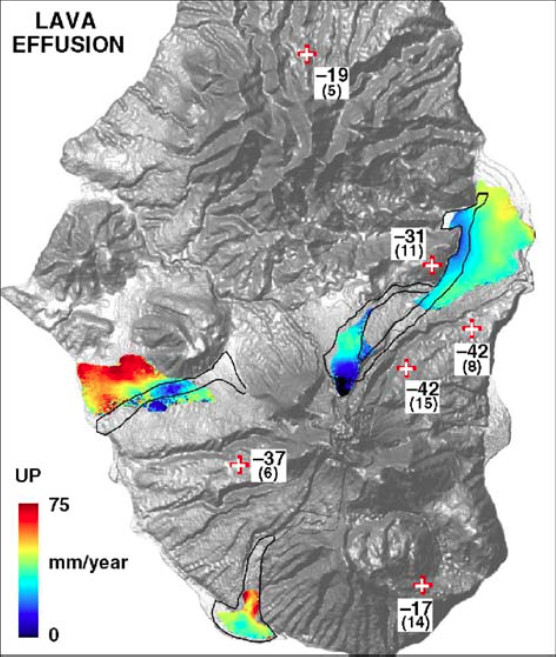 |
Averaged images of InSAR-measured line-of-sight annual displacement rates for part of the period of lava effusion (November 1999 to October 2000) resulting from stacking three corrected interferograms (23977-45153, 25752-26754, 26253-28758). The black lines outline the areas with more than 10 m depth of pyroclastic flow deposits from 1997. Also shown are the equivalent radar line-of-sight motion rates (mm/yr, one sigma uncertainties in brackets) measured by the six CGPS sites (white and red crosses) for the same periods. Note that although the GPS rates are calculated relative to a fixed geodetic reference frame, the InSAR motion rates are solely differential, have no such reference frame and there is no direct correspondence between the absolute values of the two sets of measurements. From: Wadge et al. 2006. |
||
Reference List: Wadge et al. 2006.
Full References:
Wadge, G., G. S. Mattionli, and R. A. Herd, 2006. Ground deformation at Soufriére Hills volcano, Montserrat during 1998-2000 measured by radar interferometry and GPS. J. Volcanol. Geotherm. Res., 152: 157-173. https://doi.org/10.1016/j.jvolgeores.2005.11.007
| Start Date: 1999 Jul 04 | Stop Date: 1999 Oct 17 | Direction: Uplift | Method: InSAR |
| Magnitude: 3.000 cm | Spatial Extent: Unknown | Latitude: Unknown | Longitude: Unknown |
Remarks: Localized uplift north of the dome caused by shallow processes | |||
Reference List: Wadge et al. 2006.
Full References:
Wadge, G., G. S. Mattionli, and R. A. Herd, 2006. Ground deformation at Soufriére Hills volcano, Montserrat during 1998-2000 measured by radar interferometry and GPS. J. Volcanol. Geotherm. Res., 152: 157-173. https://doi.org/10.1016/j.jvolgeores.2005.11.007
| Start Date: 1998 | Stop Date: 2000 | Direction: Subsidence | Method: InSAR |
| Magnitude: Unknown | Spatial Extent: Unknown | Latitude: Unknown | Longitude: Unknown |
Remarks: Contraction and settling of cooling pyroclastic flow deposits from 1997 eruption | |||
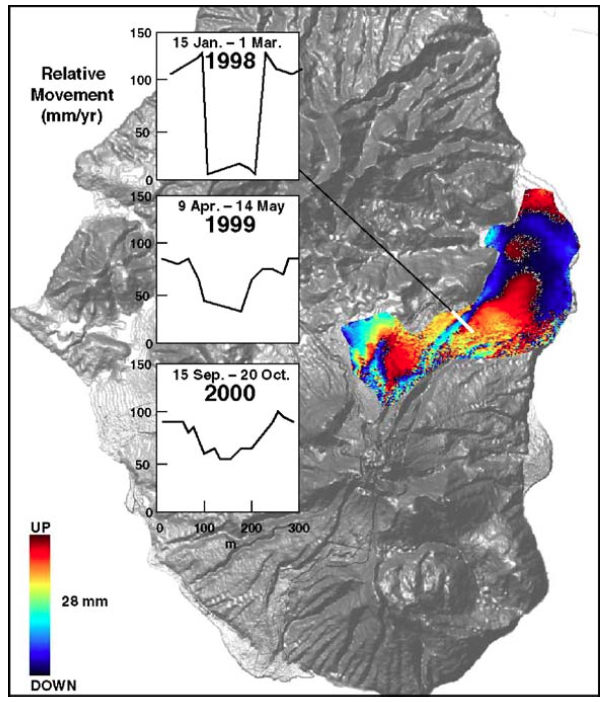 |
An example of InSAR evidence for local subsidence of the surface above valleys buried by deep pyroclastic flow deposits. The image shows an interferogram for the northeastern slopes of Soufrie`re Hills for the 35 day period 15 January to 1 March 1998. Note that the interferogram is wrapped modulo 2 k, so that the colour cycle repeats every 28 mm of displacement, with the sense of motion of the surface relative to the satellite shown by the bupQ and bdownQ. The inset plot shows a profile of relative movement extracted from the interferogram across Tuitt?s Ghaut (white bar in image). Equivalent profiles from interferograms one year (9 April?14 May 1999) and two years (15 September?20 October 2000) later show diminished rates of subsidence over this valley. The 1998 interferogram also shows more diffuse relative subsidence (blue areas) away from the valleys to the northeast where pyroclastic flow deposits had been emplaced a few months before. From: Wadge et al. 2006. |
||
Reference List: Wadge et al. 2006.
Full References:
Wadge, G., G. S. Mattionli, and R. A. Herd, 2006. Ground deformation at Soufriére Hills volcano, Montserrat during 1998-2000 measured by radar interferometry and GPS. J. Volcanol. Geotherm. Res., 152: 157-173. https://doi.org/10.1016/j.jvolgeores.2005.11.007
| Start Date: 1998 | Stop Date: 1999 | Direction: Uplift | Method: InSAR |
| Magnitude: Unknown | Spatial Extent: Unknown | Latitude: Unknown | Longitude: Unknown |
Remarks: During period of no lava extrusion. Caused by magma reservoir pressurization as new magma enters the reservoir | |||
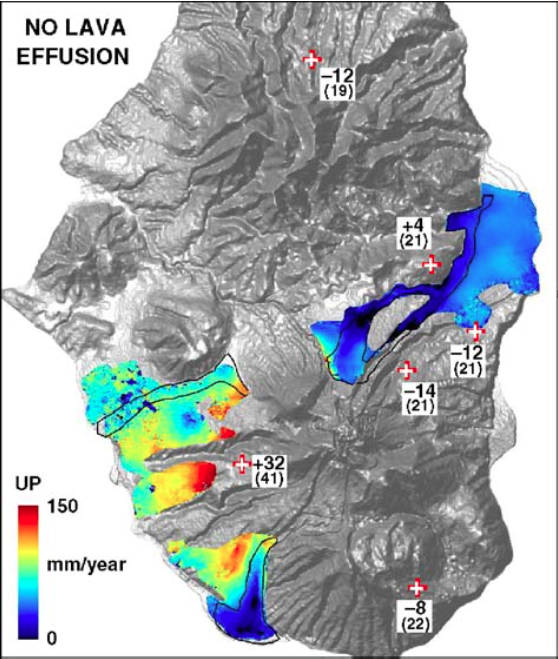 |
Averaged image of InSAR-measured line-of-sight annual displacement rates for part of the period of no lava effusion (March 1999 to November 1999) resulting from stacking three corrected interferograms (20241-21744, 21243-22245, 20971-23476). The black lines outline the areas with more than 10 m depth of pyroclastic flow deposits from 1997. Also shown are the equivalent radar line-of-sight motion rates (mm/yr, one sigma uncertainties in brackets) measured by the six CGPS sites (white and red crosses) for the same periods. Note that although the GPS rates are calculated relative to a fixed geodetic reference frame, the InSAR motion rates are solely differential, have no such reference frame and there is no direct correspondence between the absolute values of the two sets of measurements. From: Wadge et al. 2006. |
||
Reference List: Wadge et al. 2006.
Full References:
Wadge, G., G. S. Mattionli, and R. A. Herd, 2006. Ground deformation at Soufriére Hills volcano, Montserrat during 1998-2000 measured by radar interferometry and GPS. J. Volcanol. Geotherm. Res., 152: 157-173. https://doi.org/10.1016/j.jvolgeores.2005.11.007
There is data available for 15 emission periods. Expand each entry for additional details.
| Start Date: 2010 Feb 12 | Stop Date: 2010 Feb 12 | Method: Satellite (Aura OMI) |
| SO2 Altitude Min: 18 km | SO2 Altitude Max: 18 km | Total SO2 Mass: 30 kt |
Data Details
| Date Start | Date End | Assumed SO2 Altitude | SO2 Algorithm | SO2 Mass |
| 20100212 | 18.0 | 30.000 |
| Start Date: 2009 Jan 03 | Stop Date: 2009 Jan 03 | Method: Satellite (Aura OMI) |
| SO2 Altitude Min: 11 km | SO2 Altitude Max: 11 km | Total SO2 Mass: 8 kt |
Data Details
| Date Start | Date End | Assumed SO2 Altitude | SO2 Algorithm | SO2 Mass |
| 20090103 | 11.0 | 8.000 |
| Start Date: 2008 Jul 29 | Stop Date: 2008 Jul 29 | Method: Satellite (Aura OMI) |
| SO2 Altitude Min: 12 km | SO2 Altitude Max: 12 km | Total SO2 Mass: 3 kt |
Data Details
| Date Start | Date End | Assumed SO2 Altitude | SO2 Algorithm | SO2 Mass |
| 20080729 | 12.0 | 3.000 |
| Start Date: 2008 Dec 03 | Stop Date: 2008 Dec 03 | Method: Satellite (Aura OMI) |
| SO2 Altitude Min: 12 km | SO2 Altitude Max: 12 km | Total SO2 Mass: 5 kt |
Data Details
| Date Start | Date End | Assumed SO2 Altitude | SO2 Algorithm | SO2 Mass |
| 20081203 | 12.0 | 5.000 |
| Start Date: 2007 Jan 08 | Stop Date: 2007 Jan 08 | Method: Satellite (Aura OMI) |
| SO2 Altitude Min: 9 km | SO2 Altitude Max: 9 km | Total SO2 Mass: 1 kt |
Data Details
| Date Start | Date End | Assumed SO2 Altitude | SO2 Algorithm | SO2 Mass |
| 20070108 | 9.0 | 1.000 |
| Start Date: 2006 May 20 | Stop Date: 2006 May 20 | Method: Satellite (Aura OMI) |
| SO2 Altitude Min: 20 km | SO2 Altitude Max: 20 km | Total SO2 Mass: 200 kt |
Data Details
| Date Start | Date End | Assumed SO2 Altitude | SO2 Algorithm | SO2 Mass |
| 20060520 | 20.0 | 200.000 |
| Start Date: 2005 Jun 28 | Stop Date: 2005 Jul 18 | Method: Satellite (Aura OMI) |
| SO2 Altitude Min: 7 km | SO2 Altitude Max: 7 km | Total SO2 Mass: 8 kt |
Data Details
| Date Start | Date End | Assumed SO2 Altitude | SO2 Algorithm | SO2 Mass |
| 20050718 | 7.0 | 3.000 | ||
| 20050703 | 7.0 | 4.000 | ||
| 20050628 | 7.0 | 1.000 |
| Start Date: 2004 Mar 03 | Stop Date: 2004 Mar 03 | Method: Satellite (Earth Probe TOMS) |
| SO2 Altitude Min: 7 km | SO2 Altitude Max: 7 km | Total SO2 Mass: 5 kt |
Data Details
| Date Start | Date End | Assumed SO2 Altitude | SO2 Algorithm | SO2 Mass |
| 20040303 | 7.0 | 5.000 |
| Start Date: 2003 Jul 13 | Stop Date: 2003 Jul 13 | Method: Satellite (Earth Probe TOMS) |
| SO2 Altitude Min: 16 km | SO2 Altitude Max: 16 km | Total SO2 Mass: 100 kt |
Data Details
| Date Start | Date End | Assumed SO2 Altitude | SO2 Algorithm | SO2 Mass |
| 20030713 | 16.0 | 100.000 |
| Start Date: 2001 Jul 30 | Stop Date: 2001 Jul 30 | Method: Satellite (Earth Probe TOMS) |
| SO2 Altitude Min: 11 km | SO2 Altitude Max: 11 km | Total SO2 Mass: 33 kt |
Data Details
| Date Start | Date End | Assumed SO2 Altitude | SO2 Algorithm | SO2 Mass |
| 20010730 | 10.9 | 33.000 |
| Start Date: 2000 Mar 20 | Stop Date: 2000 Mar 20 | Method: Satellite (Earth Probe TOMS) |
| SO2 Altitude Min: 9 km | SO2 Altitude Max: 9 km | Total SO2 Mass: 3 kt |
Data Details
| Date Start | Date End | Assumed SO2 Altitude | SO2 Algorithm | SO2 Mass |
| 20000320 | 9.0 | 3.400 |
| Start Date: 1999 Jul 20 | Stop Date: 1999 Jul 20 | Method: Satellite (Earth Probe TOMS) |
| SO2 Altitude Min: 11 km | SO2 Altitude Max: 11 km | Total SO2 Mass: 16 kt |
Data Details
| Date Start | Date End | Assumed SO2 Altitude | SO2 Algorithm | SO2 Mass |
| 19990720 | 11.1 | 16.000 |
| Start Date: 1998 Nov 12 | Stop Date: 1998 Nov 12 | Method: Satellite (Earth Probe TOMS) |
| SO2 Altitude Min: 8 km | SO2 Altitude Max: 8 km | Total SO2 Mass: 9 kt |
Data Details
| Date Start | Date End | Assumed SO2 Altitude | SO2 Algorithm | SO2 Mass |
| 19981112 | 8.0 | 9.000 |
| Start Date: 1998 Jul 03 | Stop Date: 1998 Jul 03 | Method: Satellite (Earth Probe TOMS) |
| SO2 Altitude Min: 12 km | SO2 Altitude Max: 12 km | Total SO2 Mass: 2 kt |
Data Details
| Date Start | Date End | Assumed SO2 Altitude | SO2 Algorithm | SO2 Mass |
| 19980703 | 12.0 | 2.000 |
| Start Date: 1997 Dec 26 | Stop Date: 1997 Dec 26 | Method: Satellite (Earth Probe TOMS) |
| SO2 Altitude Min: 11 km | SO2 Altitude Max: 11 km | Total SO2 Mass: 31 kt |
Data Details
| Date Start | Date End | Assumed SO2 Altitude | SO2 Algorithm | SO2 Mass |
| 19971226 | 11.0 | 31.000 |
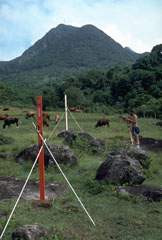 Scientists take precision leveling measurements on the west flank of Soufrière Hills volcano on Montserrat Island in 1985. These measurements, made prior to an eruption that began in 1995, provided baseline data essential for detecting deformation of the volcano associated with the eruption. The cattle in this pastoral scene are grazing on the boulder-littered surface of pyroclastic-flow deposits from earlier eruptions of Soufrière Hills. The hill in the background is Gage's lava dome, the NW-most of a series of lava domes in the summit region.
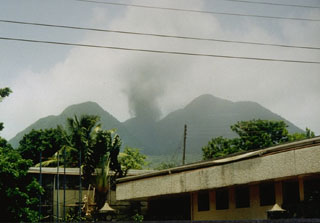 An ash plume rises above the summit of Soufrière Hills volcano on July 19, 1995, the day after the start of a major eruption that began in 1995. This view was taken from the center of Plymouth, the capital city of Montserrat, which is located along the west coast only 4 km from the summit. The eruption column is originating from a vent on the flank of a lava dome inside English's Crater.
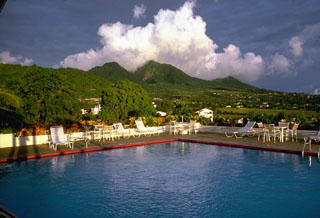 During more pleasant days, Soufrière Hills volcano rises above the outskirts of Plymouth (lower right), the capital city of Montserrat, known as the Emerald Isle. Two decades after the date of this 1977 photo, pyroclastic flows from a growing lava dome swept through the center of the evacuated city of Plymouth.
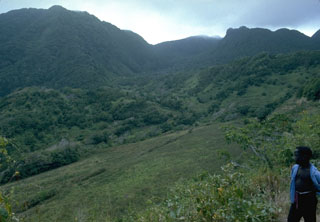 Castle Peak lava dome, on the right skyline, was formed about 350 years ago during the last eruption of Soufrière Hills volcano prior to the 20th century. Seen here in 1977 from the Tar River valley on the east side of the volcano, the Castle Peak dome was constructed within a 1-km-wide horseshoe-shaped crater, whose southern wall forms the left skyline. The high point at the left is Perche's Mountain lava dome.
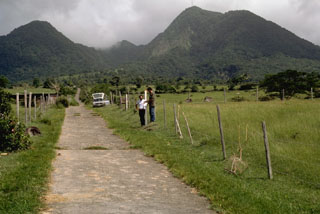 Gage's Mountain (left) and Chance's Mountain (right), seen here from the west in 1985, are the NW-most of a series of lava domes forming the summit of Soufrière Hills volcano. They are among the oldest of the summit domes, and were formed during the late Pleistocene. Pyroclastic flows that reached Plymouth in 1997 traveled down Gage's Ghaut, the valley between the two lava domes.
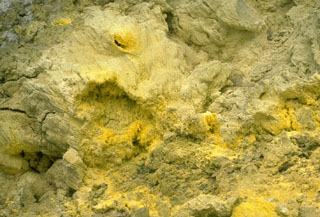 Sulfur crystals are deposited around fumarolic vents at Galway's Soufrière on the south flank of Soufrière Hills volcano. Pyroclastic flows from a growing lava dome spilled over the south rim of the summit crater down the White River Ghaut valley and buried this frequently visited fumarolic area in April 1997.
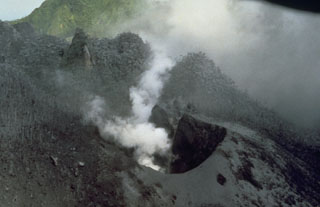 The first explosion of the eruption of Soufrière Hills that began in 1995 blasted a new crater on the NW side of Castle Peak lava dome in the center of English's Crater. Steam rises from the new crater in this August 4, 1995, view from the NW, and a coating of gray ash blankets vegetation around the vent. A second crater was formed on July 28 on the SW side of the dome. It was one of several that were created during phreatic eruptions that preceded growth of a new lava dome beginning in November 1995.
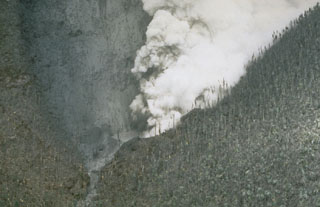 Steam pours from a vent blasted through the SW side of Castle Peak dome on July 28, 1995. This view from the east on August 5 shows trees that were defoliated by ashfall.
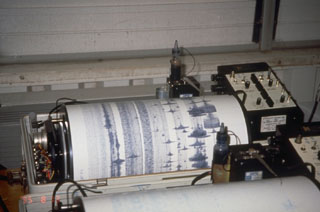 A seismogram at the Montserrat Volcano Observatory registers a volcano-tectonic earthquake swarm on August 12, 1995, several weeks after the start of a long-term eruption. Seismic monitoring is one of several tools used to help predict future eruptions and keep tabs on ongoing activity.
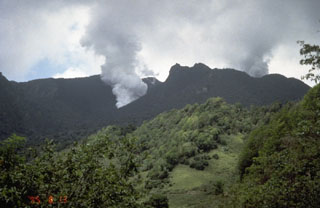 Steam rises from two vents formed in the early stages of an eruption of Soufrière Hills volcano that began on July 18, 1995. The plume from the July 18 vent rises above Castle Peak lava dome on the right skyline. The vigorous plume on the left is from a vent formed on July 28 in the moat between the dome and the south wall of English's Crater. Several more craters were formed prior to the onset of growth of a new lava dome in November 1995.
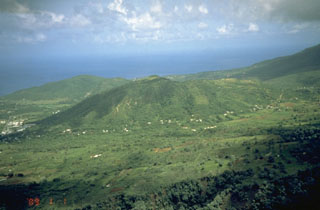 St. George's Hill (center) and Garibaldi Hill (along the coast to the left) are two Pleistocene lava domes on the NW flank of Soufrière Hills volcano. Pyroclastic flows from a lava dome growing in the summit crater flowed down the NW flank beginning in August 1997 and banked up against St. George's Hill before turning to the left and sweeping into the sea through the center of Plymouth, the capital city of the island of Montserrat. This aerial photo was taken in August 1995 from above the west flank of the volcano.
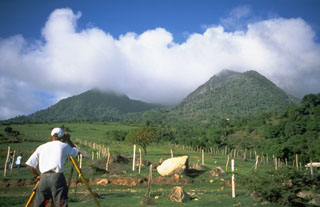 Volcanologist Richard Robertson of the Montserrat Volcano Observatory makes precision leveling measurements on the west flank of Soufrière Hills volcano on August 19, 1995. Measurements such as these enabled scientists to track the progress of the eruption. The boulders in the foreground are on the surface of pyroclastic-flow deposits from previous eruptions. Gage's Mountain lava dome forms the peak at the right.
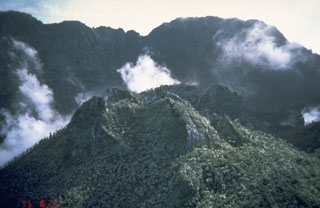 The rugged, partially forested hill in the foreground is Castle Peak lava dome, formed during an eruption of Soufrière Hills volcano about 350 years ago. The lava dome was emplaced inside the 1-km-wide, horseshoe-shaped English's Crater, whose rim forms the ridge in the background. This was the last known eruption of Soufrière Hills prior to the 1995 eruption. Castle Peak is seen here from the NE on August 20, 1995.
 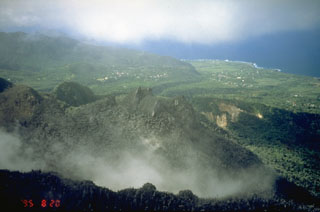 Castle Peak lava dome (center) was formed about 350 years ago during the last eruption of Soufrière Hills prior to 1995. The walls of horseshoe-shaped English's Crater are seen in front of and behind the dome. This August 20, 1995, photo from the SW shows a light covering of ash on Castle Peak from early stages of the eruption that began in 1995. The village of Harris, along the Paradise River in the center distance, was destroyed by pyroclastic flows in June 1997 that reached to within 500 m of the sea.
 The summit of Soufrière Hills volcano towers above the streets of Plymouth, the capital city of Montserrat Island. Plymouth is located only 4 km west of the volcano, on relatively flat pyroclastic-flow deposits from previous eruptions. This photo was taken in August 1995, shortly after the start of a long-term eruption that severely impacted the island. A lava dome that grew above the height of the crater rim produced pyroclastic flows that by August 1997 swept into the sea through the center of the evacuated city of Plymouth.
 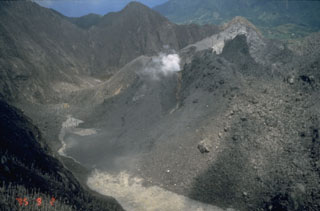 The south moat of English's Crater is seen here from the east on September 2, 1995. A blanket of ash covers Castle Peak lava dome (right) and the walls of English's Crater. Steam rises from a vent on the SW side of the lava dome that formed on July 28. A new lava dome began growing in November 1995. It eventually grew above the crater rim and filled in most of the moat of English's crater. Pyroclastic flows initially swept into the sea through the breached eastern end of English's Crater, but later overtopped its rim and flowed down the outer flanks.
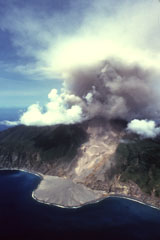 A diffuse ash column rises above the summit of Soufrière Hills volcano on April 2, 1997. The prominent delta seen in this aerial view from the NE was created by pyroclastic flows that descended to the eastern coast down the Tar River valley. The pyroclastic flows were produced by periodic collapse of a lava dome growing in the summit crater, which is breached to the east. The eruption began in July 1995; pyroclastic flows first reached the sea a year later.
 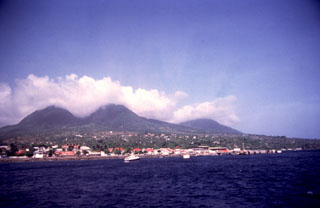 A boat offshore from the former capital city of Plymouth provides a tranquil view of the cloud-draped summit of Soufrière Hills volcano. The photo was taken in 1994, the year prior to the onset of a major eruption from Soufrière Hills that in 1997 destroyed the city of Plymouth. The broad low-lying area the city was built on, only 3-4 km from the summit of the volcano, was one of the few flat-lying areas on the small island of Montserrat and had been created by the products of earlier eruptions similar to those that later destroyed the city.
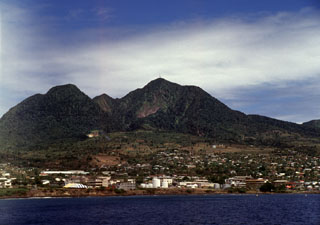 Soufrière Hills volcano towers above the peaceful city of Plymouth in 1994, the year prior to the onset of the devastating eruption that eventually destroyed the former capital city. Pyroclastic flows from a growing lava dome swept through the city to the sea in August 1997 through the low notch (center) in the western crater wall of the volcano. The city was located only 3 km from the crater rim on top of flat-lying pyroclastic-flow deposits from previous eruptions.
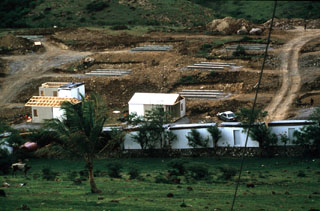 The Soufrière Hills eruption progressively impacted larger proportions of Montserrat. The eruption imposed severe hardships as more and more of the heavily populated southern half of the island became uninhabitable. Eventually more than half of the island's 11,000 residents left to other West Indies islands, or to England, but more than 4000 people elected to remain on Montserrat. These prefabricated houses were being constructed in September 1997 to house refugees at Davy Hill, on the northern side of the island.
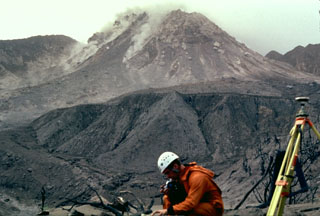 Scientists from the Montserrat Volcano Observatory make monitoring measurements in February 1997 as small rockfalls descend the flanks of the lava dome. Castle Peak lava dome, constructed during the previous eruption of Soufrière Hills during the 17th century, had collapsed three days before this photograph was taken from the Tar River Estate house, 2 km NE of the dome. Periodic collapse of the growing lava dome produced pyroclastic flows that in some cases reached the sea.
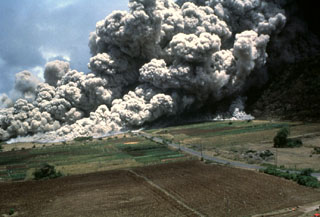 A devastating pyroclastic flow on 25 June 1997 sweeps across the lower NE flank of Soufrière Hills volcano on Montserrat. More than two dozen people within the officially evacuated zone were killed. This eruption sent an ash plume to ~10 km altitude and produced pyroclastic flows and surges that overran both vacated and partly inhabited NE-flank settlements, destroying 100-150 houses in eight villages within the restricted zone. The pyroclastic flow traveled 4.5 km and almost reached the sea.
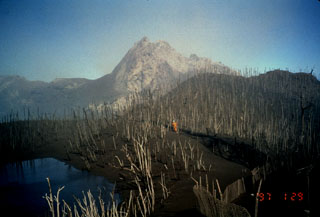 A Montserrat Volcano Observatory scientist observes the growing lava dome at Soufrière Hills on February 29, 1997. A lava spine, informally referred to as the whaleback spine, caps the dome and was one of many spines that grew and collapsed during the course of growth of the lava dome. Ejecta from explosive eruptions has denuded trees of leaves at Chances Peak in the foreground, west of the lava dome. Chances Pond (lower left), located along the western rim of the summit crater, existed prior to the 1995 eruption.
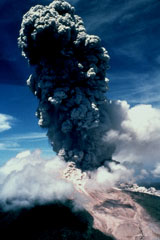 An ash cloud towers above Soufrière Hills in October 1997 as pyroclastic flows descend the volcano's flanks. This was one of a series of 61 explosive eruptions that occurred during a period of high activity between September 28 and October 21. Explosions occurred at an average interval of 8.5 hours. The largest explosions, October 20-21, produced eruption columns to heights of 9 km. Pyroclastic flows accompanying many of the explosions traveled down all sides of the volcano, but were preferentially directed to the north.
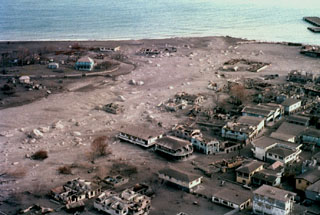 Pyroclastic flows and surges repeatedly swept through Plymouth, the former capital of Montserrat, beginning in August 1997. This December 1997 photo shows the deserted city mantled by ash, with buildings partially or totally destroyed by the high-temperature pyroclastic flows. Continued growth of the summit lava dome during 1997 had filled in the summit crater, which caused pyroclastic flows to spill over the western crater rim and travel down the Fort Ghaut valley into the evacuated city.
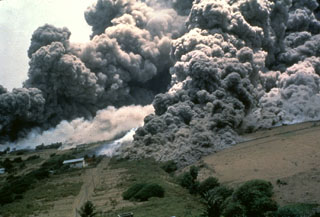 Pyroclastic flows sweep down the NE flank of Soufrière Hills volcano in December 1997 towards the abandoned airport. During 1997, pyroclastic flows reached the coast of the island on the NE, SW, and western sides. The former capital city of the island, Plymouth, and many other villages were overrun by these high-temperature pyroclastic flows.
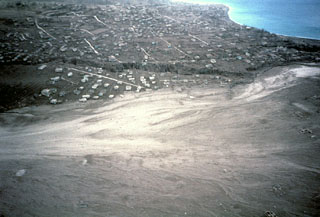 A broad plain of light-colored pyroclastic-flow deposits in the foreground partially buries the city of Plymouth, the former capital of Montserrat. This December 1997 aerial view from the north shows Fort Ghaut valley, completely filled by pyroclastic-flow deposits, cutting diagonally across the center photo. Sugar Bay lies at the upper right, just south of the port of Plymouth. Pyroclastic flows began entering Plymouth in August 1997.
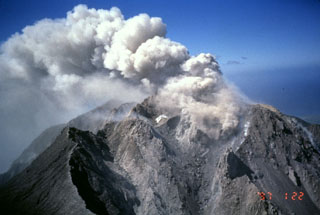 Three generations of lava-dome growth can be seen in this January 27, 1997 aerial photo of Soufrière Hills volcano. Ash is venting from a small dome that began growing in December 1996 within a scarp formed by collapse of an October 1996 lava dome. The October dome in turn was constructed within a scarp whose southern wall forms the cliff at the lower left. This outer scarp was formed by collapse of a pre-September 1996 lava dome.
 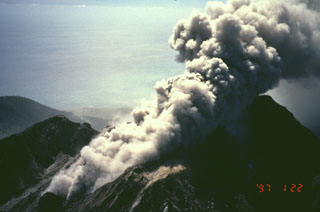 An ash column rises above Soufrière Hills volcano in January 1997. Intermittent phreatic eruptions began at Soufriere Hills on July 18, 1995. A new lava dome started growing in English Crater in September 1995 and eventually filled much of the crater. Pyroclastic flows accompanying dome growth initially were restricted to the eastern flanks, but eventually traveled in all directions, making the entire southern half of the island uninhabitable. In August 1997, pyroclastic flows destroyed much of Plymouth, the former capital of Montserrat.
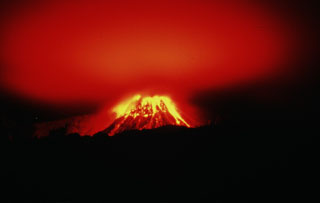 The incandescent lava dome of Soufrière Hills is reflected off the smoke-and-ash column above the volcano on the night of December 26, 1996. The dome is seen here from Long Ground/White's House on the NE flank, 2 km from the summit. This 40-second time exposure captures the paths of incandescent rockfalls and block-and-ash flows during a period characterized by one of the highest magma extrusion rates of the eruption.
 Volcanologist Richard Heard of the Montserrat Volcano Observatory observes the new lava dome in February 1997. The surface temperature of the lava dome at this time was 650-800 degrees centigrade. By this time the new dome had grown to a height above that of Chances Peak, the former summit of the volcano and the location of this photo. A steep-sided spine forms the northern side of the lava dome. Periodic spine extrusion and subsequent collapse occurred frequently during the eruption.
 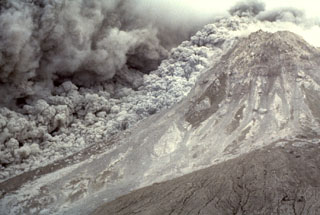 An ash plume expands above a pyroclastic flow sweeping down the E flank of the Soufrière Hills summit lava dome on 16 January 1997. The pyroclastic flow descended the Tar River valley to the sea, covering the new delta with new material that included blocks up to 5 m in diameter.
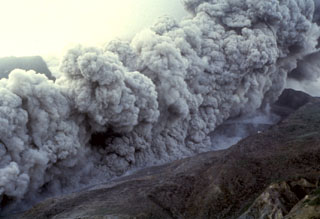 A pyroclastic flow sweeps down the floor of the Tar River valley on the eastern flank of Soufrière Hills volcano on January 16, 1997. The Tar River Estate house, which had been damaged by earlier eruptions, is the white dot on the ridge at right center. The January 16 pyroclastic flow was the largest to date during the eruption. The pyroclastic flow traveled about 3.5 km into the sea beyond the new delta formed at the mouth of the Tar River valley.
 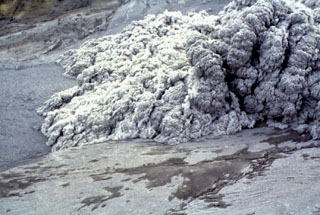 The roiling front of an advancing pyroclastic flow sweeps down the Tar River delta on January 16, 1997. The cauliflower-like clouds of hot gas and ash rise above a basal bedload of vesiculating blocks and pumice from the summit lava dome. This was one of many pyroclastic flows produced by multiple collapses of the oversteepened dome growing in the summit crater of Soufrière Hills volcano.
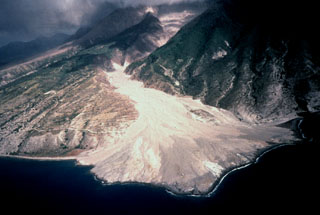 The second of two large deltas formed by the accumulation of pyroclastic-flow deposits is located at the mouth of the White River valley on the southern flank of Soufrière Hills volcano. The pyroclastic flows spilled over a notch on Galway's wall on the southern rim of the summit crater and traveled down the White River, diverging around the flank of the older South Soufriere Hills volcano (right). The accumulated pyroclastic-flow deposits buried Galway's Soufrière, a thermal area on the upper flank, and the evacuated town of O'Garra's on the coast.
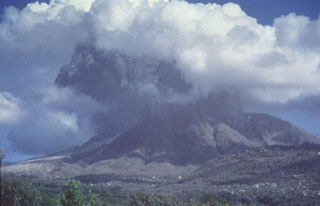 A dark ash column rises into light-colored weather clouds surrounding Soufrière Hills volcano. This photo was taken on October 20, 1997 from the old volcano observatory 7 km NW of the summit about a minute after the onset of the explosion. Partial collapse of the eruption column soon produced pyroclastic flows that descended the eastern and western flanks. During the course of the eruption that began in 1995 the volcano observatory had to be moved farther away from the volcano several times as the risk from eruptions increased.
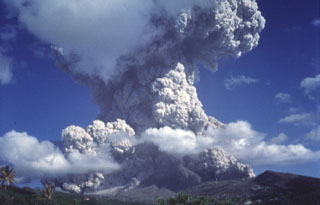 A towering ash cloud rises above the summit of Soufrière Hills volcano on October 20, 1997, as pyroclastic flows sweep down the flanks of the volcano. This photo was taken from the old volcano observatory 7 km NW of the volcano two minutes after the start of the explosion.
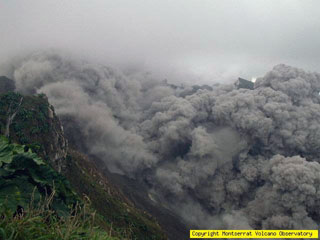 A pyroclastic flow descends the upper part of the Tar River valley on Soufrière Hills volcano as seen from the NE on November 22, 2005. During renewed activity beginning in April 2005, pyroclastic flows were first observed on June 28. Following period of rapid lava dome growth beginning on November 4, pyroclastic flows became more common. On November 4 a pyroclastic flow down the Tar River valley reached to within a kilometer of the sea.
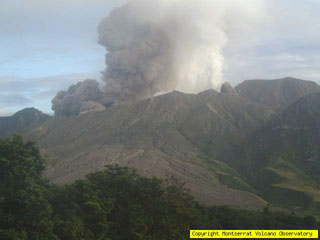 An ash cloud rises above the southeastern slopes of Soufrière Hills volcano on November 24, 2005. After a quiescent period of almost a year, ash eruptions had resumed at Soufrière Hills on April 15, 2005. Intermittent explosive eruptions continued, and pyroclastic flows were first reported on June 28. Renewed lava dome growth was first observed on August 6. Dome growth and explosive activity continued into the following year.
The maps shown below have been scanned from the GVP map archives and include the volcano on this page. Clicking on the small images will load the full 300 dpi map. Very small-scale maps (such as world maps) are not included. The maps database originated over 30 years ago, but was only recently updated and connected to our main database. We welcome users to tell us if they see incorrect information or other problems with the maps; please use the Contact GVP link at the bottom of the page to send us email.
There are no samples for Soufrière Hills in the Smithsonian's NMNH Department of Mineral Sciences Rock and Ore collection.
| Copernicus Browser | The Copernicus Browser replaced the Sentinel Hub Playground browser in 2023, to provide access to Earth observation archives from the Copernicus Data Space Ecosystem, the main distribution platform for data from the EU Copernicus missions. |
| MIROVA | Middle InfraRed Observation of Volcanic Activity (MIROVA) is a near real time volcanic hot-spot detection system based on the analysis of MODIS (Moderate Resolution Imaging Spectroradiometer) data. In particular, MIROVA uses the Middle InfraRed Radiation (MIR), measured over target volcanoes, in order to detect, locate and measure the heat radiation sourced from volcanic activity. |
| MODVOLC Thermal Alerts | Using infrared satellite Moderate Resolution Imaging Spectroradiometer (MODIS) data, scientists at the Hawai'i Institute of Geophysics and Planetology, University of Hawai'i, developed an automated system called MODVOLC to map thermal hot-spots in near real time. For each MODIS image, the algorithm automatically scans each 1 km pixel within it to check for high-temperature hot-spots. When one is found the date, time, location, and intensity are recorded. MODIS looks at every square km of the Earth every 48 hours, once during the day and once during the night, and the presence of two MODIS sensors in space allows at least four hot-spot observations every two days. Each day updated global maps are compiled to display the locations of all hot spots detected in the previous 24 hours. There is a drop-down list with volcano names which allow users to 'zoom-in' and examine the distribution of hot-spots at a variety of spatial scales. |
|
WOVOdat
Single Volcano View Temporal Evolution of Unrest Side by Side Volcanoes |
WOVOdat is a database of volcanic unrest; instrumentally and visually recorded changes in seismicity, ground deformation, gas emission, and other parameters from their normal baselines. It is sponsored by the World Organization of Volcano Observatories (WOVO) and presently hosted at the Earth Observatory of Singapore.
GVMID Data on Volcano Monitoring Infrastructure The Global Volcano Monitoring Infrastructure Database GVMID, is aimed at documenting and improving capabilities of volcano monitoring from the ground and space. GVMID should provide a snapshot and baseline view of the techniques and instrumentation that are in place at various volcanoes, which can be use by volcano observatories as reference to setup new monitoring system or improving networks at a specific volcano. These data will allow identification of what monitoring gaps exist, which can be then targeted by remote sensing infrastructure and future instrument deployments. |
| Volcanic Hazard Maps | The IAVCEI Commission on Volcanic Hazards and Risk has a Volcanic Hazard Maps database designed to serve as a resource for hazard mappers (or other interested parties) to explore how common issues in hazard map development have been addressed at different volcanoes, in different countries, for different hazards, and for different intended audiences. In addition to the comprehensive, searchable Volcanic Hazard Maps Database, this website contains information about diversity of volcanic hazard maps, illustrated using examples from the database. This site is for educational purposes related to volcanic hazard maps. Hazard maps found on this website should not be used for emergency purposes. For the most recent, official hazard map for a particular volcano, please seek out the proper institutional authorities on the matter. |
| IRIS seismic stations/networks | Incorporated Research Institutions for Seismology (IRIS) Data Services map showing the location of seismic stations from all available networks (permanent or temporary) within a radius of 0.18° (about 20 km at mid-latitudes) from the given location of Soufrière Hills. Users can customize a variety of filters and options in the left panel. Note that if there are no stations are known the map will default to show the entire world with a "No data matched request" error notice. |
| UNAVCO GPS/GNSS stations | Geodetic Data Services map from UNAVCO showing the location of GPS/GNSS stations from all available networks (permanent or temporary) within a radius of 20 km from the given location of Soufrière Hills. Users can customize the data search based on station or network names, location, and time window. Requires Adobe Flash Player. |
| DECADE Data | The DECADE portal, still in the developmental stage, serves as an example of the proposed interoperability between The Smithsonian Institution's Global Volcanism Program, the Mapping Gas Emissions (MaGa) Database, and the EarthChem Geochemical Portal. The Deep Earth Carbon Degassing (DECADE) initiative seeks to use new and established technologies to determine accurate global fluxes of volcanic CO2 to the atmosphere, but installing CO2 monitoring networks on 20 of the world's 150 most actively degassing volcanoes. The group uses related laboratory-based studies (direct gas sampling and analysis, melt inclusions) to provide new data for direct degassing of deep earth carbon to the atmosphere. |
| Large Eruptions of Soufrière Hills | Information about large Quaternary eruptions (VEI >= 4) is cataloged in the Large Magnitude Explosive Volcanic Eruptions (LaMEVE) database of the Volcano Global Risk Identification and Analysis Project (VOGRIPA). |
| EarthChem | EarthChem develops and maintains databases, software, and services that support the preservation, discovery, access and analysis of geochemical data, and facilitate their integration with the broad array of other available earth science parameters. EarthChem is operated by a joint team of disciplinary scientists, data scientists, data managers and information technology developers who are part of the NSF-funded data facility Integrated Earth Data Applications (IEDA). IEDA is a collaborative effort of EarthChem and the Marine Geoscience Data System (MGDS). |

